Small and Medium Business Improvement in the ASEAN Region: Financial Factors 9789814345828
The identification of small and medium businesses (SMBs) as a target for development policy is a comparatively recent ph
220 51 98MB
English Pages 281 [300] Year 2018
CONTENTS
LIST OF TABLES
LIST OF FIGURES
CONTRIBUTORS
ACKNOWLEDGEMENT
PREFACE
I. FINANCIAL FACTORS RELATED TO SMALL AND MEDIUM BUSINESS IMPROVEMENT: AN OVERVIEW
II. FINANCIAL FACTORS AFFECTING SMALL AND MEDIUM BUSINESSES IN INDONESIA
III. STUDY AND EVALUATION OF EXISTING FISCAL AND FINANCIAL POLICIES AND SUPPORT FOR SMALL AND MEDIUM BUSINESSES IN MALAYSIA
IV. FINANCIAL FACTORS AND SMALL AND MEDIUM ENTERPRISE DEVELOPMENT IN THE PHILIPPINES
V. FINANCING OF SMALL AND MEDIUM BUSINESSES IN SINGAPORE
VI. FINANCIAL FACTORS RELATING TO SMALL AND MEDIUM BUSINESS IMPROVEMENT IN THAILAND
Recommend Papers


![Software Process Improvement for Small and Medium Enterprises: Techniques and Case Studies [illustrated edition]
9781599049069, 1599049066](https://ebin.pub/img/200x200/software-process-improvement-for-small-and-medium-enterprises-techniques-and-case-studies-illustrated-edition-9781599049069-1599049066.jpg)


- Author / Uploaded
- Kenneth James (editor)
- Narongchai Akrasanee (editor)
File loading please wait...
Citation preview
I5EA5
INSTITUTE OF SOUTHEAST ASIAN STUDIES
The Institute of Southeast Asian Studies was established as an autonomous organization in May 1968. It is a regional research centre for scholars and other specialists concerned with modern Southeast Asia, particularly the multi-faceted problems of stability and security, economic development, and political and social change. The Institute is governed by a twenty-two-member Board of Trustees comprising nominees from the Singapore Government, the National University of Singapore, the various Chambers of Commerce, and professional and civic organizations. A ten-man Executive Committee oversees day-to-day operations; it is chaired by the Director, the Institute's chief academic and administrative officer. The ASEAN Economic Research Unit is an integral part of the Institute, coming under the overall supervision of the Director who is also the Chairman of its Management Committee. The Unit was formed in 1979 in response to the need to deepen understanding of economic change and political developments in ASEAN. The day-to-day operations of the Unit are the responsibility of the Co-ordinator. A Regional Advisory Committee, consisting of a senior economist from each of the ASEAN countries, guides the work of the Unit.
SMALL AND MEDIUM BUSINESS IMPROVEMENt IN THE ASEAN REGION
Financial Factors Edited by
KENNETH JAMES Institute of Southeast Asian Studies
and
NARONGCHAIAKRASANEE Industrial Management Cb. Ltd., Bangkok
Field Report Series No. 16 ASEAN ECONOMIC RESEARCH UNIT INSTITUTE OF SOUTHEAST ASIAN STUDIES
1986
Published by Institute of Southeast Asian Studies Heng Mui Keng Terrace Pasir Panjang Singapore 0511 All rights reserved . No part of this publication may be reproduced, stored in a retrieval system, or transmitted in any form or by any means, electronic, mechanical, photocopying, recording or otherwise, without the prior permission of the Institute of Southeast Asian Studies. © 1986 Institute of Southeast Asian Studies
The responsibility for facts and opinions expressed in this publication rests exclusively with the authors, and their interpretations do not necessarily reflect the views or the policy of the Institute or its supporters. Cataloguing in Publication Data Small and medium business improvement in the ASEAN region I edited by Kenneth J ames and Narongchai Akrasanee. (Field report series I Institute of Southeast Asian Studies; no. 16) 1. Small business -- ASEAN -- Finance. I. J~mes , Kenneth George. 11. Narongchai Akrasanee . Ill. Series. DS501 1594 no. 16 1986 ISBN 9971-98849-6 ISSN 0217-7099 Printed in Singapore by Chong Moh Offset Printing Private Limited
CONTENTS
List of Tables List of Figures Contributors Preface XJ
IV VlD
IX
I
Financial Factors Related to Small and Medium Business Improvement : An Overview 1 Narongchai Akrasanee
ll
Financial Factors Affecting Small and Medium Businesses 17 in Indonesia M. Dawam Rahardjo and Fachry Ali
lll
Study and Evaluation of Existing Fiscal and Financial Policies and Support for Small and Medium Businesses in Malaysia 57 Chee Peng Lim
IV
Financial Factors and Small and Medium Enterprise Development in the Philippines 105 Melito S. Sa/azar. Jr. er al.
V
Financing of Small and Medium Businesses in 160 Singapore Ch 'ng Hak Kee et al.
VI
Financial Factors Relating to Small and Medium Business Improvement in Thailand 221 Narongchai Akrasanee et al.
LIST OF TABLES
1.1
Types of Fiscal Incentives Offered by Each ASEAN Country
11
2.1
Small-Scale Industries and Household Craft, 1974-75
19
2.2
Comparison of Large-Scale and Medium-Scale Industries, Small-Scale Industries and Craftwork Industries 19 74-7 5 to 1979
21
2.3
The Sectoral Spread of Establishment Units in 1981
21
2.4
Estimate of Labour by Small-Scale Establishments in Indonesia, 1980
22
2.5
Number of Workers in the Industrial Sectors 1971-73
26
2.6
Small Enterprise Credit Schemes
33
2.7
Rates of Interest of Several Forms of Credits from Non-Bank Sources
37
2.8
The Use of Profit for Re-investment
39
2.9
The Spread of Savings of Funds at Bank and Non-Bank Financial Institutions
40
Leverage Ratio of Enterprises in the Industrial Trade and Service Sectors in Klaten (N = 223)
41
2.11
Average Cash Inflow and Outflow for Each Sector
44
2.A1
Distribution of Industrial Enterprises by Sub-District, Klaten Agency, 1970-78
51
2.10
2.A2 Number of lndustiies and Products in the Klaten Sub-District, 1982 IV
52
3.1
Economic Significance of SMBs in Malaysia, 1978
59
3.2
Number of Manufacturing Establishments by Employment Size Group, Malaysia, 1981
60
3.3
Bank Lending Under CGC Schemes, 1973-83
72
3.4
Peninsular Malaysia: Credit Assistance for SMBs, 1971 and 1980
79
3.5
Perceived Problem Area of Sample
81
3.6
Most Important Source of Initial Capital
82
3.7
Additional Amount of Working Capital Required
84
3.8
Person who Prepares Accounts
84
3.9
Source of Loan
85
3.10
Value of Bank Loans
86
3.11
Reasons for not Borrowing from a Bank
88
3.12
Reasons for Borrowing from Non-Bank Sources
90
3.13
Value of Bank Loan Required
90
3.14
Maximum Interest Rate Willing to Pay
91
3.15
Percentage on Credit
93
3.16
Percentage on Credit Sales
94
4.1
Targeted and Actual Respondents
106
4.2
Age of Firms
112
4.3
Initial and Present Employment of Respondent Firm
113
4.4
Sources of Financing
114
4.5
Industry and Profitability Ratios, 1983
117
V
4.6
Terms of Sales
118
4.7
Terms of Material Purchase
119
4.8
Number of Borrowers and Non-Borrowers by Regions and by Sources
121
4.9
Source of Additional Cash
123
4.10
Number and Amount of Loans Granted by Industry Classification, 1983 (P Million)
130
5.1
Small Enterprises in Singapore Manufacturing, 1982
164
5.2
Distribution of the Sample by Legal Status and by Industry
166
5.3
Trade Credits: Suppliers/Customers
172
5.4
Total Capital Investment of Sample Firms
173
5.5
Tax Incentive Projects Approved: January 1981 to December 1983
186
Type of SIFS Loans, Quantum Available and Maximum Duration
192
Summary of SIFS and ESIFS Facilities Approved, 1976-84
194
Changes in Government Fiscal and Financial Assistance to SMBs
203
List of Enterprises Interviewed
209
5.6 5.7 5.8 5.A1
5.A2 Government Fiscal and Financial Assistance to SMBs 6.1
Internal and External Sources of Funds for Start-up Capital of Different Firm Sizes
VI
212
227
6.2
Sources of Fund for Present --Capital of Size of Finns in 1976
228
6.3
Sources of Funds for Business Expansion in 1981
229
6.4
Structure of Assets and Liabilities of Small-Scale Industries (Average per Finn)
232
6.5
Financial Ratios of Selected Small-Scale Industries
234
6.6
Credit Extended by Financial Institutions
244
6.7
Small Industry Loans from SIFO and Krung Thai Bank
248
6.8
IFCf Loan Commitments by Loan Amount and Total Outstanding Loans for IFCT, 1980-83
250
6.A1
Estimation of Credit Extended by Commercial Banks for Manufacturing Sectors Classified by Scale of Industries in 1979, 1980, 1981
277
6.A2 Total Credit Requirement by Purposes and Size of Finns in 1981
VII
278
LIST OF FIGURES
1.1
Schematic Representation of SMB Activity
1.2
Financial Assistance by Fls and DFis
6.1
Study Areas in Thailand
2 12
223
Vlll
CONTRIBUTORS
Narongchai Akrasanee, Ph.D., is Managing Director of the Industrial Management Co. Ltd., Thailand, and Senior Vice President of the Industrial Finance Corporation of Thailand. Fachry Ali is Research Officer with Lembaga Penelitian, Pendidikan dan Penerangan Ekonomi dan Sosial (LP3ES). Viyada Avilasakul is Consultant to the Industrial Management Co. Ltd., Thailand. Chee Peng Lim, Ph.D., is Associate Professor at the Faculty of Economics and Administrati on, University of Malaya. Ch'ng Hak Kee is Senior Lecturer at the School of Management , National University of Singapore. Thitiraht Chudasring is Project Co-ordinator with the Industrial Management Co. Ltd., Thailand. Lim Hua Sing, Ph.D., is a Fellow at the Department of Japanese Studies, National University of Singapore. M. Dawam Rahardjo is Director (Special Programmes and Consultancy) , Lembaga Penelitian, Pendidikan dan Penerangan Ekonomi dan Sosial (LP3ES). At the time of the study, he was Director of LP3ES. Melito S. Salazar, Jr., Ph.D., is Director of the Institute of SmallScale Industries, University of the Philippines. Tan Loong-Hoe, Ph.D., is Senior Fellow and Co-ordinator , ASEAN Economic Research Unit, Institute of Southeast Asian Studies.
lX
ACKNOWLEDGEMENT
A11
three phases of the ASEAN Sma 11 and Med i urn Business
Improvement Project were supported by the United States Agency for International Development (USAID). The Institute of Southeast Asian Studies (ISEAS) would like to thank USAID for this most welcome and timely assistance. However, the conclusions of the accompanying study remain the responsibility of the authors and their views do not necessarily reflect those of USAID or ISEAS.
PREFACE
The identification of small and medium businesses (SMBs) as a target for development policy is a comparatively recent It is clearly linked to the realization in phenomenon. developing countries that large capital intensive industries which fonned the basis of earlier development policies had failed to provide the hoped-for engine of growth. Only in the 1970s, as planners realized the mis-match between Western large-scale technology and local factor endownments, and as urban unemployment became an increasingly pressing problem, did attention turn to smaller scale and more labour intensive enterprises to provide possible solutions. This is manifestly true to the countries in the ASEAN region. Development policies in these countries may be seen to reflect an increasing awareness of the significance of the less-than-large business enterprise in economic development. This in turn has led to official action, initially hesitant but now increasingly vigorous, to develop and support SMBs, financially and otherwise. The ASEAN Small and Medium Business Improvement project seeks to contribute to this awareness of the significance of SMBs at ground level, and the dissemination of findings for policy action. The project is the collaborative effort of research teams in each of the ASEAN countries (except Brunei; the project was formulated before that country joined ASEAN), co-ordinated centrally at the Institute of The general objectives of the Southeast Asi an Studies. project are:
xi i
Preface
(1)
to collect, develop and organize infonnation relat11ng to the role and potential of small and medium-scale enterprises in GNP formation, employment creation and industrial growth;
(2)
through overall analysis of problems involved, as determined through primary (field surveys and case studies) and secondary research, to identify and recommend economic policies and measures (institutional, educational and cOOillE!rci al ) geared to the improvement of the small business sector in ASEAN countries;
( 3)
to disseminate the findings and recommendations of the project in a readable and easily comprehensible form.
The first phase of the project focused on financial (including fiscal) factors affecting the improvement of ASEAN SMBs. In genera 1 , the research teams in each country obtained primary data from surveys they carried out, and supplemented this with secondary information on the effects of fiscal policies, and of government and financial institutions, on the finances of SMBs. Findings were then written up as country papers and presented at a workshop in March 1985. The workshop's participants included several experts in SMB financing from both pub 1 i c and private sectors in the participating countries . Valuable feedback from this interaction between academics and practitioners was incorporated into the revised papers, ensuring that recommendations were as realistic as they were innovative. This present volume is the distillation of the substantial body of work from that first phase. (Readers interested in the ori gi na l papers shou 1d contact the respective writers.) The country-by-country format has been retained, although where relevant and possible, material has been
Preface
xiii
The country papers are preceded by revised and updated. Narongchai Akrasanee's overview with a schematic framework to help place the present set of studies -- and future ones -- in perspective. It is hoped that this volume, and the ones following on Marketing Factors and Production Management, will contribute to an increased understanding of SMBs and their potentially powerful role in the economic development of the region.
Kenneth James Narongchai Akrasanee General Editors
I FINANCIAL FACTORS RELATED TO SMAll AND MEDIUM BUSINESS IMPROVEMENT: AN OVERVIEW
Narongchai Akrasanee
Introduction The five country studies which make up this volume have as their conwnon theme "Financial Factors Affecting the Improvement of Small and Medium-Sized Businesses (SMBs) in the ASEAN Region".
From the outset it has been recognized
that, while any regional study of this nature would seek to establish similarities in both the perception of problem areas and their selection, the unique characteristics of each participating country would also give rise to significant differences which should not be ignored. Flexibility,
in
research
design
as well
as
presen-
tation, has therefore been a hallmark of this project.
The
participating research teams had initially developed a common research outline, and in general this has been adhered to.
In addition, some have also looked at related aspects
seen as having a bearing in the principal theme. The essential elements of each paper may be identified : 0
•
a discussion of the characteristics of SMBs in that country and the significance of SMBs in the country's economy; in appraisal of government (and a critical particular, fiscal) policies, past and present as
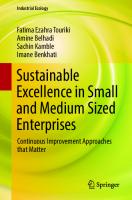
Figure 1.1:
Schematic Representation of SMB Activity Control & Promotional Activities
Firms' Activities
& Resource Requirements
~-
-
-
Regulation & Supporting Agencies (Examples)
Investment I-+- Board of Investments promotion Utilities and I~ Ministries of Industry, Trade lnfrastrusture Laws & I~ regulations
Loans, credIt guarantee, other flnancla I facilities
Commercia I banks I~
Industrial Finance CorporatIon Board of Trade
R& D
Universities, Technlca I Institute
Diffusion & extension
Department of Industrial Promotion
Education & tra lnlng Labour mob Ill zatlon
Mlnlstrly of Education, Dept. of Labour, NGO
Production
~-
1 L I I
L
Raw materia Is
~-
1
L I I
Raw materia I I~ Ministry of Agrl. development Programmes to co-op regulate flows ~ MOl, Dept. of Mines, of supply NGO Various government Laws & regula~ agencies tlon
I
Dl str I but Ion
Marketing InformatIon
L I I I L
~rket lnformatlon service
1------1
.__ _ _ _ _ -f
M!srketlng ......: network & sales forces
Sa I es. promotions
Dept. of Labour
-
I
---
Ministries, Trade assoc latl ons, 801, Programmes to 1-......:-- among others. support efficiency MarketIng sys. Trade fair Qua llty control scheme
I~
Overview 3
0
0
0
they have affected SMB development; an analysis of institutions involved in SMB financing, based on primary and secondary data sources; a first-hand analysis of financial factors from the viewpoint of the SMBs themselves, based on primary data from sample surveys; and policy discussions and conclusions arising from the above analysis.
SMBs in ASEAN Countries Schematic Representation It may be useful to first present a schematic analysis of small and medium business development. The present set of studies could then be more readily placed in context. The flow chart presented in Figure 1.1 gives a schematic picture of the elements involved when we discuss small and medium businesses, particularly in the area of industrial production. Admittedly, this particular framework is more relevant to SMBs in manufacturing rather than in trade and services. It is therefore directly relevant to four of the five country studies, which have concentrated on industrial SMBs; and to a 1esser extent the fifth -- Indonesia -- as well .1 The process of development of a particular ~nterpri se starts with investment, and goes from there to production. Following investment in plants and equipment, the enterprise goes into production and after production produces the outThis basic, if obvious, put and finally markets it. progression takes on operational significance when we superimpose institutional factors, including the role of the government. Certain issues then become apparent. The first The set of issues would involve investment incentives. first column in the diagram shows what is involved. The second column delineate£ .the factors involved. The institu-
4 Narongchai Akrasanee tional aspects manifest in the regulatory or supportive measures originating from outside the enterprise (third column). In the final column are the sources of such measures: government and/or private agencies. If we look at this schema we see that the focus of the present studies is basically the first group of issues involving investment promotion, law and regulations, credit and oth~r financial matters. The investment incentives measures would have a strong influence on the decision to invest and these would usually originate from agencies like the Ministry of Finance, the Board of Investment, the Ministry of Industry, and so on. Credit or financial matters involve several areas of a particular enterprise. Firstly, there is investment capital needed at the time of investment decision; then working capital, for production as well as for the distribution process. In essence, therefore, the scope of the following studies corresponds to the first two horizontal blocks in the diagram. The scheme shown indicates clearly that talking about financial factors and fiscal incentives does not imply that there are no other important aspects. Nor are the financial factors divorced from the production, marketing or other aspects as the studies clearly show. The Issues All the studies are unanimous in agreeing that small and medium businesses are very important in their respective countries, in terms of firms and in terms of employment. The proportions presented usually vary from 70 to 90 per cent depending on the definition of SMBs. For example, what is small in Indonesia may not be small in Thailand. The Indonesian paper defines small enterprises as those enterprises which have fewer than 10 workers, while in In Thailand these are referred to as cottage industry.
Overview
5
Thailand, to be classified as small the enterprise would In the Indonesian have to have between 10 to 50 workers. context, 10 to 50 workers would be con si de red to be medi urn enterprises. There is thus an obvious difficulty in comparing However, it is clear that as long as we define results. SMBs as those having 1ess than 50 workers, the number of small enterprises would reach almost 90 per cent in terms of registered factories or registered enterprises . If mediumsized enterprises are those with 50 to 100 workers, that number would rise above 90 per cent. A fair generalization would therefore be that small and medium enterprises represent about 90 per cent of all enterprises. About 50 to 70 per cent of these workers are employed in the manufacturing sector. Therefore, one can conclude that SMBs form a very important part in the ASEAN economy. It is useful to remember that, with the exception of Singapore, the countries under study have a very young Fifty per cent of the Thai population is 1 abour force . below the age of 20. The same is true of the Philippines, and to lesser or greater extent, Indonesia and Malaysia. In Thus in general the labour force is very young. Thailand, unemployment, particularly among graduates, is One way to support oneself reaching serious proportions. now is to set up one's own business no matter how small it is; and many are doing so. There is now a federation of unemployed graduates in Thailand, which claims a membership of 20,000 and these people are potential entrepreneurs. Should this pattern continue, small and medium businesses could become an extremely important political issue in the region. Faced with the difficulty involved in generalizing small and medium businesses because of their diversity, I feel it would be more meaningful to group them in three groups. . The first group would be the village-based SMBs.
6
Narongchai Akarasanee
Indonesia•s village-based enterprises, for example, l'r"e Wry much like those in Chiengmai, Thailand. The vilhge-baHd enterprises are very small with a very informal systelht Of operation. Sometimes they operate a:s an off-farm activity. Some workers, of course, would work in this particular area longer but others might spend only a few months working in such an enterprise. Straddling this group and the next is an industry found in both the village and the town. This is the handicraft industry which is prominent in Indonesia, the Philippines and Thailand in particular. The second group comprises of town-based enterpris-es. Here, "town-based" refers to those enterprises which oper..ate in small
towns, its
rather than cities (although again, each own
definition
of
"city"
and
"town").
country
has
Typical
town-based enterprises are those involved in food
processing, textiles and the biggest is in construction. In most of the countries studied these were, in fact, the industries where the largest number of SMBs could be found. A fourth typically SMB industry is machinery and metal products, where the SMB usually serves as a repair shop as well as a centre for fabricating or manufacturing simple machinery and equipment. country,
The
ranking varies from country to
but generally we find processed food to be the
industry with the most SMBs, followed by textiles, construction materials and machinery and metal products. The important characteristics of the town-based group is that they cater specially to the market in town or nearby areas. They usually cannot compete with the city-based products, the major portion of production being targeted for the local market. The third group is made up of the city-based enterprises, which are enterprises in Singapore, Bangkok, Manila, Jakarta, and in a number of major towns in Malaysia. Here the number of firms operating in different industries do not exactly follow the same pattern as town-based enterprises.
Overview 7 For example, there are thousands of machinery and metal product firms in the cities. It may not be fully accurate to refer to them as "industry" because they usually combine services with manufacturing, but they do more manufacturing, compared to repairing than town-based equivalents. Other city-based industries with larger concentrations of SMBs are textiles and food-processing, although the latter is not as dominated by SMBs as in the smaller towns. There are also a large number of printing shops, and firms producing plastic products. The operation of the city-based enterprises differs from the town-based ones. They might cater for the overseas market. Enterprises in Singapore, for example, are modern small enterprises and their major market is often overseas. In other cities the markets are both overseas as well as domestic, with increasing numbers selling their products overseas. Interestingly, in terms of exporting, very small firms have proved to be competitive. Having classified enterprises this way, we are able to discuss the major issues involved in these groupings of enterprises more intelligibly than if we were to lump all SMBs together. The first grouping, the village-based and handicraft, does not exist in Singapore, although for the remaining For this group, countries this is an important group. proper marketing and production arrangements would so 1ve many of their problems. The financial issue is usually secondary here. Raw materials are another important factor in the operation of village-based and handicraft enterprises, but it is not as crucial as the need for proper marketing and production arrangements, because if one can organize production and marketing the raw materials problem will usually solve itself. By similar reasoning, financial factors are second to marketing because if one can organize marketing and production one can usually organize the
8
Narongchai Akrasanee
financing as well. Therefore when we discuss fiscal incentives, these often have little to do with the village-based enterprises. Finance is important, but not as important as marketing and production arrangements. As for town-based enterprises, their major characteristic is that they rely on local or nearby markets. There is 1 i ttl e chance that they can compete with the city-based enterprises in the long run except for specialized products, and the specialized sector already. Malaysia, Indonesia for the town-based
products usually fit into the handicraft Based on the surveys carried out in and Thailand, the most important factor enterprises is finance.2 For instance,
from the Mal ay si an survey, 70 per cent of the respondents considered finance to be their biggest problem. Among townbased SMBs, techno 1ogy appears to be the most important constraint after finance. Other problems mentioned include lack of workers, and raw materials. The City-based enterprises are our final grouping. city-based SMB is more formal. Being closer to the centre of government, it is more difficult for the city-based SMB to stay away from the government. Therefore, for the citybased enterprises, fiscal policies have crucial consequenThe main complaints, according to the surveys, are ces. about taxes, the difficulty of getting investment promotion, Fiscal and permits for setting up business, and so on. incentives are therefore the number one issue fol 1owed by not (although constraints marketing and financial necessarily in that order). The Singapore situation could serve as a model for city-based small enterprises. The city-state has numerous schemes for helping businessmen in financial and production matters, so it is difficult to say whether marketing or finance is seen as the greater problem. For the other city centres, however, finance is probably a greater constraint Technology is not usually a major conthan marketing.
Overview
9
straint with city-based SMBs, although there are exceptions. As for skilled workers, these are relatively plentiful in the city and are therefore not a serious problem for the city-based enterprises. Exceptions are certain industries like the machinery industries. It is clear that the issues involved vary with each group. Finance, however, is an important issue for the town-based and city-based SMBs, while fiscal incentives are extremely important for the city-based enterprises. In considering financial aspects, two preliminary observations are pertinent. Firstly, all of the surveys have found that SMBs usually need short-term loans rather than long-term ones. Most of the enterprises have low leverage ratios; in other words they usually do not have much debt. For ex amp 1e, the survey of small firms on the outskirts of Bangkok, and the survey carried out by the Indonesian team, have similar findings, namely, that businessmen are usually not willing to borrow. SMBs thus tend to have very low debt to asset ratios, relative to large enterprises. For these reasons, the need is usually for short-term rather than 1ong-term 1oans. These short-term 1 oans, according to the survey, are to finance production and marketing. Secondly, with respect to sources of funds, the picture is again similar across countries. SMB enterprises tend to use their own funds for equity. When they do borrow, the kind of loan depends on whether the loan is for initial investment or for expansion. For initial investment SMBs take long-term loans from relatives or friends because it is easier to get the money, even though repayment may be costly. Financial institutions are a distant alternative. For short-term 1oans, SMBs usually borrow from fi nanci a 1 institutions, and from the informal sector. For expansion, however, they would approach financial institutions.
10
Narongchai Akrasanee
Fiscal Incentives Fiscal Incentives
and
Financial
Assistance
for
SMBs
In the five countries under study the general development policy is supportive of SMBs. However, the actual policy regime is found to be biased against SMBs, although Singapore may be considered to be an exception. With respect to fiscal incentives, it is found that these generally favour larger firms. Most countries have introduced special fiscal measures in favour of SMBs to neutralize the existing incentives regime. These measures, however, are usually not fully effective. Three types of fiscal incentives may be identified: tax privileges, sub-contracting, and government procurement. Tax privileges are usually in the form of lower corporate tax rates on profits.
Sub-contracting incentives are given
to encourage 1arge firms to procure parts/components from SMBs, while government procurement is a purchase procedure designed to favour SMBs. Among the countries studied, the Philippines has provided all three types of incentives to SMBs, but discontinued the tax privileges from 1984. Indonesia, Malaysia and the Philippines now have the subcontracting and government procurement policies in favour of SMBs. Singapore provides tax privileges, and also uses subcontracting to promote SMBs. Thailand, however, does not offer any of the fiscal incentives to SMBs. Table 1.1 summarizes the types of fi sea 1 incentives offerred to each ASEAN country. Financial Assistance Various forms of financial as si stance are provided to SMBs through financial institutions (Fis) and development financial institutions (DFis) as shown in Figure 1.2. The objective iS for SMBs to have better access to institutional credit and with better terms than what they would have otherwise.
Table 1.1:
Types of Fiscal Incentives Offered by Each ASEAN Country
Fiscal Incentives
s
p
I
M
Sub-contracting
I
I I ( unti 1 1984) I I I
Government Procurement
I
I
Tax privileges
Note:
I = Indonesia; M = Malaysia; P S = Singapore; T = Thailand.
Table 1.2:
T
I =
Philippines;
Various Forms of Financial Assistance Provided by the ASEAN Countries to SMBs I
M
p
s
T
I I
I I I I
I I
I I I
I
Cost Reduction Measures through DFI s
I
M
p
s
T
Tax pri vi 1eges Guarantee for loans and exchange risk Soft-term funds Domestic Foreign Grant for technical assistance
I
I
I
I
I I I I
I I I I
I I
I
I
I
I
Credit Assistance Measures through FI s Guidelines Requirement Credit guarantee scheme Interest subsi dy Collaterals
Note:
I S
= =
Indonesia; M = Malaysia; P Singapore; T = Thailand.
=
I
Philippines;
Figure 1.2:
Financial Assistance by Fls and DFis
@il-------
Credit Access Measures Collateral Guidelines Requirements Credit guarantee scheme Interest subsidy
Loans
SMBs
Cost Reduction Measures Tax privileges Guarantee for loans DFI and f-. and exchange risk co-opera t 1ves Soft-term funds (domestic and foreign)
Loan Equity Venture capital Techn1cal ass1stance
Overview 13 government may persuade Fls to assist SMBs by: Imposing guidelines or requirements that Fls lend to o SMBs a certain proportion of their portfolio on certain terms which may be concessionary; Setting up a credit guarantee scheme to help bear o part of the risk; Providing an interest subsidy. o In some countries the government assists SMBs by setting up DFis or co-operatives which promote SMBs. The government usually provides tax privileges to these institutions to help reduce the costs of operation so that they can help SMBs more fully. In addition the government may provide guarantees for loans and exchange risk, and even channel soft-term funds from foreign and domestic sources. In return DFis and co-operatives are expected to provide financial services to SMBs in the forms of low interest loans, equity funds, risk or venture capital, as well as technical assistance. Table 1.2 shows the various forms of financial as si stance provided by the ASEAN countries to SMBs. It is apparent that Malaysia offers the most elaborate facilities, followed by Indonesia and the Philippines. Thailand has recently begun to provide some faci 1i ties. Singapore does not have DFis, but the schemes offered through Fis have been found to be very effective. The
Policy Implications Strategies for SMB Improvement The country papers having described the fiscal and financial incentives offered, go on to discuss strategy for the promoDifferent strategies have been proposed tion of SMBs. ranging from all-out government assistance to just relying on the market forces but allowing credit to expand at higher The strategies may be categorized as than normal rate. follows:
14 Narongchai Akrasanee Strategy I:
All out government assistance. The reliance is on the public sector. Full fiscal incentives are provided. Strategy 11: Cost reduction through DFis. Promotion of SMBs is carried out through DFis, most of which are public or semi-public institutions. Strategy II is less public-sector oriented than Strategy I. Strategy Ill: Credit accessibility through Fls. The reliance is more on private Fls, with the government playing a cautionary role. Interest subsidy is not offered. Strategy Ill is more private sector oriented than Strategy I I. Strategy IV: Reliance on market forces, but allowing credit expansion at higher than normal rate. The justification is that SMBs often rely on the informal financial sector, which in turn depends on the level of liquidity of the financial system. SMBs have better access to funds when liquidity is high. The five country papers recommend different strategies. The Indonesian paper is the most public sector oriented (Strategies I and 11) while the Malaysian paper favours the private sector oriented approach (Strategy IV), and encouraging private Fls to assist SMBs without subsidized interest. The Singapore paper goes for Strategy Ill, while the Thai paper proposes Strategies II and Ill, that is, working through Fls and DFis. The Philippine paper is the most ambitious, recommending Strategies I, II and Ill. This means that all fiscal and financial incentives are to be provided, the latter through both Fls and DFis. In general, considering the financial contraints of the ASEAN governments and the efficiency of the private sector, Strategies II and u ·r should be the most viable. Strategy
Overview
15
I, to be effective, would draw too heavily on government revenue. Strategy IV, whi eh is tantamount to the government's non-involvement, would be politically undesirable. Strategies II and Ill suggest that the reliance would be more on financial incentives, through both DFis and Fls. In order for Strategies II and Ill to be effective a number of measures are necessary, some of which have already been implemented in some countries. These measures are discussed with respect to institutions as follows. (a) For Fls and DFis: They need to improve loan assessment capabi 1i ty in order to reduce credit risk, whi eh in turn would allow SMBs to borrow adequately. They must also improve operation efficiency to reduce cost. (b) For the government: The government could help reduce the cost of lending through Fls and DFis. In addition the government should increase the type of assets usable as collateral, and simplify registration procedures. (c) For the government, Fls and DFis. The three institutions should together help reduce operation risks of SMBs by providing technical assistance in management and operations. ASEAN Co-operation Three areas of possible co-operation have been mentioned. (a) Training for personnel of Fls and DFis. Since Fls and DFis are to be relied upon for the promotion of SMBs, it is necessary for these institutions to have properly qualified credit officers to operate credit faci 1i ties for SMBs. Co-operation in training is consistent with the ASEAN policy and programme for human resource development. This suggestion implies that the target areas in the training programme would be project evaluation and credit assessment. (b) Research . on the operations of DFis, Fls and SMBs. The
16 Narongchai Akrasanee research is intended to provide more knowledge and information on these institutions, which in turn will be used for training and policy formulation on the promotion of SMBs. (c) Financing of market promotion and research for SMBs products. This goes into the marketing aspect of SMBs, an aspect crucial to the development of SMBs. Cooperation in marketing should be helpful to SMBs, because. most SMBs would be too small to bear the full cost of marketing research. Towards the achievement of the above objectives, se vera 1 of the research teams have, in their ori gi na 1 submissions, recommended the establishment of a regional centre, jointly organized, funded and managed by the ASEAN member countries. This centre could provide an integrated focus on the common problems of ASEAN SMBs, and a concrete manifestation of ASEAN co-operation in this increasingly significant area of regional economic development. Financial assistance is required for the purpose, and the ASEAN governments may wish to consider financing this scheme.
Notes 1.
The Indonesian study has Included SMBs Involved In trade and services as well, but have nevertheless differentiated among these sub-sectors In most of the analysis.
2.
An interesting response from some businessmen was that taxes were not a prob I em; they know how to evade them. cannot be postponed forever.
Interest payments • however •
Thus, finance Is crucial.
II
FINANCIAL FACTORS AFFECTING SMALL. AND MEDIUM BUSINESSES IN INDONESIA
M. Dawam Rahardjo and Fachry Ali
Introduction Definitions and Methodology It should be recognized that, from a policy aspect, small and medium enterprises are viewed rather differently in Indonesia than they would be in the neighbouring countries. There is in Indonesia no clear definition of what is a medium- or a large-scale establishment. The official classification of industries, for instance, is as follows: o large-scale and medium-scale industries, small-scale industries, and o cottage industries. The situation is further complicated by the fact that even these categories would differ in defi ni ti on depending on whether the establishments are in the agriculture, industry, trade or service sectors. Given this diversity of defi ni ti ons, the study adopts the following convention as being closest in representativeness to the concept of "small and medi urn businesses" as understood in the other country studies: o in referring to secondary data, "small-scale industries" will be equated with SMBs. 0
o
for our own primary survey, SMBs will be primarily
18 M. Dawam Rahardjo and Fachry Ali industrial enterprises, although some trade and service enterprises will also be included for a more complete picture. Size of enterprise is defined by number of workers. Thus: a small-scale enterprise employs from 1 to 10 workers a medium-scale enterprise employs from 10 to 50 workers a large-scale enterprise employs from 50 workers or more. It was decided that the survey would take the form of a comprehensive study of one representative small industry township, that of Klaten regency in Central Java. Klaten, located between the cities of Yogyakarta and Surakarta, has It is presently a long tradition of small industry. experiencing a spurt in development, with its business population now consisting of about 74,000 predominantly smallscale business units. Klaten thus provides a cross-section of SMBs that may be considered representative of Java and Pertinent economic and demographic most of Indonesia. information on Klaten regency is presented in the appendix. 0
0
0
The Role of Small-Scale Industries in Indonesian Development General Development It was only in the 1970s that serious discussions of smallscale industries were initiated in Indonesia. Before that, small-scale industries were only referred to indirectly. Mohammad Hatta, the former First Vice President of the Republic of Indonesia and an economist, for example, only used the term industri rakyat (people 1 S industries) for wnat is nowadays called industri kecil (small-scale industries) (Rahardjo 1984~, p. 168). However, this did not mean that small-scale industries and household craft had not developed
Table 2.1:
No. Indus-try
Small-Scale lndus"trles and Household Craf-t, 1974-75
Items
Number of EnterprIses Thousand
311-12
Food
31182
(Palm sugar Indus-try)
31242
(Tahu-tempe (fermented soya be"nl production) (Other food)
Number of Art I sans* Thous.,nd
~n-Days
~n-Days
Annually
Million
of Artisans
Dally Wage per Worker (Rp,)
Added Value per day per Artisan** (Rp,)
426
34
1, 366
35
185
43
134
228
191
(241)
(20)
(730)
( 19)
( 110)
(26)
( 150)
(120)
(80)
(62)
( 5)
(240)
(5)
(29)
(7)
( 145)
( 171)
(221)
( 123)
(10)
(432)
( 11)
(44)
(10)
(102)
n.a.
n.a.
321
Textile
129
10
397
10
35
8
89
145
136
331
Wood, products tran wood
502
41
1,536
39
140
32
91
343
125
33130
Produc-ts tran bamboo and rattan
(447)
(39)
(1,451)
(37)
( 131)
(30)
(90)
( 132)
(90)
Other products
(25)
(2)
(2)
(2)
(9)
(2)
(106)
.21.
n.a.
Other br.,nches of actlvl"tles
177
14
601
15
69
16
118
276
349
1,234
100
3,900
too
429
100
110
255
192
Tot"l
n
*
Artls.,ns are those who participate In certain "ctlvltles that are not regulated by time or frequency. Workers are artls.,ns who receive wages tor their work. Fran the 3.9 million artisans only 177,000 (5 per cent) are workers.
**
Gross added value on market-price.
"·"· =
Source:
not avall.,ble, Publication of Central Bureau of Statistics, Census of Industries 1974-75.
20 M. Dawam Rahardjo and Fachry Ali in Indonesia. According to the Census of Industries of 1964 the first census of industries in Indonesia -- the number of small-scale and household industries was fairly large. The more so if it is considered from the point of 1abour power; this sector absorbed 84 per cent of the entire labour power of the industrial sector (Rahardjo 1984!, p. 92). This is proof that the small-scale industries in Indonesia play an important role in economy. This sector was, in the years 1974-75, capable of giving a living to 3.9 million artisans.! The numbers above are the combined numbers of smallscale industrial establishments and household industries. The division between small-scale industrial establishments and household industries is not clearly known. However, in the Census of Industries 1974-75, and in the results of the Survey of Industries 1979 (Urip 1982), one gets a picture of the distribution by small-scale and household industries as shown in Table 2.2. According to the Directorate of Small-Scale Industries in the Department of Industries,2 these small-scale industrial establishment units have substantial variety. They produce metalware, from kitchenware to the casting of spare parts for industrial equipment; several kinds of embroidery, batik and fabrics; several kinds of anyaman (straw products such as baskets and mats); woodwork and 1eatherwork; and the preparation of material for food and beverages. All these establishments are grouped as smallscale industries. This is similar to the figures given by SUSENAS (Survei Sosial Ekonomi Nasional) whose classification of industries is different from that of the Central Bureau of Statistics (BPS or Biro Pusat Statistik). The Department of Industries• statistics show that in 1981 the number of small-scale industrial establishments had reached 1,512,668 (Table 2.3). Tables 2.2 and 2·.3 show that the largest number of
Table 2.2: Comparison of Large-Scale and Medium-Scale Industries, Small-Scale Industries and Craftwork Industries 1974-75 to 1979
Groups of Industries Large- & Med lumScale Industries
Year
RegIon
1974-75*
Java
6,034
33,850
944,763
OutsIde Java
1,057
14,336
289,748
Indonesia
7,091
48,186
1,234,511
Java
6,681
71,014
965, 187
OutsIde Java
1,279
42,010
452,615
Indonesia
7,960
133,024
1,417,802
1979**
Sources:
SmallScale I ndustr les
Household Industries
*Census of Industries 1974-75, Central Bureau of Statistics. ** Survey of Large-Scale and Medium-Scale Industries, Survey of Small-Scale Industries, SUSENAS 1979, Central Bureau of Statistics.
Table 2.3:
The Sectoral Spread of Establishment Units In 1981 Sector
No.
Number of Est. Units
%
1.
Food preparation
314,753
20.81
2.
Clothes and leather
250,218
16.54
3.
Chemicals and fibre
9,135
0.61
4.
Metalware, transport means and service
92,040
6.08
5.
Building material and other materia I
846,522
55.96
Source:
SUSENAS (n.d.).
22
M. Dawam Rahardjo and Fachry Ali
small-scale establishments are the industries for building material and other material, making up 55.96 per cent of the whole or in absolute numbers reaching 846,522 of the 1,512,668 units. The food industry, with 20.81 per cent, is second largest, although considerably smaller than the industries for building material and other material. It is estimated that in 1979 there were in the industrial sector 2.79 million workers employed in smallscale and household industries out of a total labour force of 3.66 million in the industrial sector alone (Firdaus 1982). This means that about 76.4 per cent of the labour force worked in small-scale establishments while 4.23 million workers were in small-scale establishments of the trade sector. Table 2.4:
Estimate of Labour Force by Small-Scale Establishments in Indonesia, 1980
Labour Force in Small-Scale Number of Establishments Labour Force Establishment inAll Scales Proportion Number Sector of E~tablish( %) ( 'OOQ ment ('000 workers) workers 45.56 2 12,775.2 1. Agri culture 28,040.4 2.
Industry
4,360.7
3 ,331. 5
76.403
3.
Trade
6,611.4
4 ,231. 3
64.oo4
4.
Service
8,425.1
t. t.
t.t.
Note:
t.t.
Sources:
=
no data obtained yet.
Calculated from Bulletin of Indonesian Economic Studies 2 (July 1982), Census of Agr1cu1ture 1973, Jurnal EKUIN (12 July 1982), and SPI data Aprildan Departemen Perdagangan 1980, December Koperasi.
Indonesia 23 These small-seal e and medi urn-seal e establishments are almost everywhere, in advanced, moderate and underdeveloped regions, as well as urban and rural regions. The pattern in The most urban regions differs from the rural regions. conspicuous sectors in urban regions are the trade sector (45.9 per cent) and the service sector (22.8 per cent), whereas in the rural regions the most conspicuous sectors are the agricultural sector (68.2 per cent) and the trade sector (15.1 per cent), most of which are small-scale It is therefore imperative that these establishments. small-seal e establishment units be developed, because they are also significant for the income distribution programme. Government Policy Related to Small-Scale Industry General Industrial Policy As mentioned earlier, attention to small-scale industries in Indonesia is a comparatively recent development.3 Even up to 1969 before---the start of the first five-year plan, the problems of small-scale industries were not discussed seriously. In his paper, presented to the 4th Congress of the Ikatan Sarjana Ekonomi Indonesia ( ISEI), Barl i Hal im (1969) did not explicitly pay attention to the role of He, however, mentioned industri small-scale industries. kerajinan rakyat (peop l e's craft industries) as a series of i ndustri ri ngan (1i ght industries) for priority targets. It is this aspect that afterwards influenced the first fiveyear development plan (PELITA I) in developing small-scale industries from 1969-70 to 1973-74. This development progralTille still much emphasized the household industrial sector, as follows: establish processing centres for bamboo, wood, rattan, iron casting and the like. run pilot projects at Gunung Kidul (Central Java), Tengger and other places to improve hand-weaving industries, silk craft and so forth. 0
0
24 M. Dawam Rahardjo and Fachry Ali I ne rea se job opportunities by processing rubbish, improving craftwork industries for export and developing household industries. With this very limited programme, it is clear that the government in starting PELITA paid more attention to the development of large-scale industries. From that perspective the development programme of the government was indeed quite successful in the initial period of the New Order . As is known, the first economic decade in the era of the New Order was marked by important events for Indonesia's economy. The economy grew more rapidly and was more stable compared with previous years; shifts occurred in the economic structure and in the composition of national output (Booth and McCawl ey 1982). These great changes happened because in ea rryi ng out deve 1opment the government pursued the following policy: special emphasis was given on the production of food (rice in particular) and clothes, while for the time being foreign capital was prohibited, in particular in the industrial and mining sectors. What was reached by said policy was a very impressive growth of sectoral output . In the agricultural sector the average deve1opment rates between 1953 and 1977 i ne rea sed from 1.4 per cent to 3.8 per cent, further becoming 3.7 per cent for the period 1971-77. From 1977 the Indonesian economy experienced a significant structural change. In 1965 the GDP composition was not much different from its composition in the beginning of the 1950s. But in the decade after 1965, the share of the agricultural sector in GDP decreased from 52 per cent to 35 per cent, while the share of the mining sector leapt from 3.7 to 12 per cent. The construction sector also showed a large increase (Booth and McCawley 1982, p. 7). The establishments that made better progress because of this policy of the New Order was the modern sector, in particular the large-scale and the · medium-scale industries (McCawley 1983, 0
Indonesia 25 p. 82 ff.). Several incentives were offered. For instance, The foreign transactions were made freer and si mp 1er. result was that raw material or capital goods was easier to obtain. Also, a new policy was created to stimulate changes in the private sector together with the state sector. A third incentive was the promulgation of a new law on foreign capital investment in 1966 giving more attractive conditions compared with previous regulations. The result was that Indonesia opened opportunities for industries on a wider basis. In the late 1960s, the output of the main industries in the modern sector rapidly increased, and this centre of development continued throughout the 1970s. The result was that the share of the industrial sector in national product increased from 9 per cent in 1970 to 12 per cent in 1977. This development occurred at the same time as a decrease in the share of the agricultural sector in the GDP and the sharp increase of the oil price. However, the progress of these modern industries had a trade-off, in that no equivalent development occurred in the small-scale sector. This has its cause in the following (Arief 1979, pp. 26-7): Industrialization in Indonesia is strongly oriented to the development of import substitution industries aimed at the domestic market. Industries producing goods in the framework of import substitution industries in turn depended on inputs from abroad. The import substitution industries have preferred o technology that is relatively more capital intensive than existing alternatives, because imported capital goods as inputs, as the result of fiscal facilities and very attractive credit, become correspondingly cheaper. 0
0
o
A great part of these industries are 1ocated in
Jakarta
Ra~a
and its surroundings that has grown
26 M. Dawam Rahardjo and Fachry Ali into an "import enclave", depending on imports from abroad for its raw material for its industries and not having backward linkages. 4 Although facing such problems, the growth of industries in Indonesia is considered rapid by international standards. Between 1971-74 the real value of the output of the industrial sector grew annually by 15.5 per cent, and between 1974-77, 11.3 per cent. However, it is also clear that the rapid growth of the industrial sector as a whole for the greater part comes from seve ra 1 i ndus tri a1 projects supported by the government, such as steel, cement, fertilizer, paper industries and also chemical material industries for agriculture. However, the absorption of labour power in this modern sector has a tendency to decrease. Table 2.5 compares changes in the number of workers in the small-scale { mediumscale and large-scale industrial sectors in 1971-73. Though the number of workers in the sector of sma 11-sca1e industries has tended to decrease, it is apparent that this sector still absorbs far more labour power. Table 2.5:
Number of Workers in the Industrial Sectors, 1971-73 1971
1972
1973
Number Workers
Medium-scale & 1arge-scal e industries
1,001,000 1,001,000 1,049,000
+ 39,000
Small-scale industries
1,788,049 1,743,741 1,634,394
-153,700
Source:
Central Bureau of Statistics.
Indonesia
27
Fiscal Policy More serious attention by the government to small-scale industries became apparent from 1974-75, from within circles in the Department of Industries itself and, in particular, (Ditjen Aneka Industries the Directorate of Various By 1978 the government had developed a fairly Industri). comprehensive policy for small-scale industries, household industries and rural industries. It was also the first time that a policy document (Department of Information, Gari sGari s Besar Hal uan Negara 1983) explicitly mentioned industri kecil (small-scale industries), together with the terms, large-scale and medium-scale industries. Si nee then the government has openly pursued a policy of Berpi jak di at as dua kak i (standing on two feet), developing large-scale and medium-scale industries, as well as s~ll-scale
household
and
simultaneously
industries,
( Raha rdj o 1984E_) . This growing attention to small-scale industries seemed to be the government's response to criticism on the earlier strategy that was considered to have stressed economic development and industrializatio n at the expense of equitable Therefore, the deve 1opment of the d1 stri buti on of income. sull industry sector was considered a means for redi stributing 1ncome.5 The most significant step taken by the government was the creation of an unt>rella organization, Proyek Bimbingan dan Pengembangan lndustri Kecil (BIPIK, a project for developing and upgrading small-scale industries) in 1974-75. Its purpose was to give aid to the economically weak groups a.ong the small-scale entrepreneurs and artisans. Until the end of PELITA 11, the activities performed by BIPIK c011prised: • Surveys
of
marketing,
research
in
co11111odities,
designing a project profile of small-scale industry, and systematically enlisting the problems faced by
28 M. Dawam Rahardjo and Fachry Ali small-scale industry in the rural areas; Establishing Pusat Pengembangan Industri Kecil o (Centres for Developing Small Scale Industries), in several cities such as Yogyakarta, Surabaya, Jakarta with p1ans for more such centres in se vera 1 other cities. Establishing Pusat Pelayanan Teknis (Centres for Technical Aid) to help in technical industrial problems, in the creation of designs, in the introduction of machines and new equipment, and in providing for common facilities.6 Organizing education and training for entrepreneurs o Training is given on management, and artisans. marketing and co-operatives. Obtaining field information in centres of smallo scale industries through Tenaga Pembina Lapangan (Officials for Field Information). Giving aid in the form of machines and equipment o to entrepreneurs and artisans. Promotion and marketing of craftwork. 7 In 1980-81, the Directorate-General of Small-Scale Industries broadened the scope of its activities which are now divided into four main programmes, namely: (1) creating a favourable environment for establishments/industries; (2) aid and service; (3) support; (4) technical upgrading. These four programmes were to be executed simultaneously and in an integrated way (Departemen Perindustrian, 1982). There are in these programmes three essential activities to be carried out. The first activity is protection.8 The second activity is rationalizing regulations and procedures, providing guidelines in giving priority to the use of domestic products, No. 172/Kp 6/XII/ 1980, No. 813/M/Sk/12/1980, This has opened opportunities for No. 64/MENPAN/1980. entrepreneurs of small-scale industries, especially the economically weak group. ~arallel with this is the establish0
0
Indonesia
29
!lent of a Team Kerjasama Perbank.an (Team for Banking Cooperation), comprising representatives of the DirectorateGeneral of Small-Scale Industry, Bank. Indonesia, Bank. Negara Indonesia 1946, Bank. Rak.yat Indonesia Bank. Pembangunan The task. of this Indonesia and Bank. Pembangunan Daerah. team is to 1dentify projects and establishments of smallscale industries that deserve funding, and to try to solve their difficulties in channelling credit and monitoring the execution of credit disbursement. The third essential activity is the improvement of cooperation between small- and medium- operations, the bapak (foster-father)
angkat
In
system.
this
scheme a
large
enterprise "adopts" several small ones, providing assistance such as raw materials, technology and training, and Thus it is hoped that
purchasing the adopted SMBs' output.
the presence of small-scale industries will be acknowledged as a part of the national industrial and economic system. Up to the end of budget year 1980-81 there were fifteen state-owned and privately-owned enterprises that were officially bapak angkat of small-scale industries.
To complete
the bapak angkat system there has also been developed the This system has developed in the sub-contracting system. industries
producing
of
components
vehicles,
motor
and
electronic components among others. In addition to a 11 those progranmes, there is the LIK (Lingkungan
Industri
progranme
Kecil)
industrial estates for small-scale industries. LIK
is
a grouping of
developing
for
Essentially
small-scale industries where it is
hoped that the entrepreneurs form co-operatives.
LIKs are
provided with workshops, basic and subsidiary material, and also facilities for marketing. for
training,
education
and
There are also facilities developing
small-scale
industries. Until and including the budget year 1980-81, there were established twelve LIKs throughout Indonesia.
Unfortunately,
30
M. Dawam Rahardjo and Fachry Ali
this programme is considered a failure and has been disconOne of its causes was tinued since the middle of 1984. insufficient social preparation, so that many entrepreneurs of small-scale industries as well as artisans were averse to staying in the designated areas. Monetary Policy Parallel to the progress in fiscal policy vis-a-vis smallscale industries, the government's monetary policy has also This was apparent in the midtaken the same direction. 1970s whi eh saw rapid growth in the speci a1 programme for concessional credit to support the development of the indigenous small-scale establishments (Bolnick 1982, p. 65). (Kredit credit programmes, KIK The concessional Investasi Kecil or Small Investment Credit) and KMKP (Kredit Modal Kerja Permanent or Permanent Working Capital Credit), Until the middle of 1981 these came into being in 1973. credit programmes accounted for 12.6 per cent of the commercial banks' total deposit credit (Bolnick 1982). Although in the early 1980s Indonesia suffered from the effects of the world economic recession (Iskandar 1985) this policy has not changed much. In a circular, Bank Indonesia "high 9 "credits of less high priority".
categorized
credits
into
priority
credits"
and
Credits for small-scale
industries are considered high priority. The circular mentioned two kinds of credits of high priority, namely, creIncluded in dits for capital and credits for investment. credits for capital are Kredi t Bimbi ngan Massal (BIMAS or Mass Fostering Credits), KMKP, credits for the production, import and distribution of fertilizers and pesticides for BIMAS), Kredit kepada Perkebunan Swasta Nasi onal (PSN or Credits for National Private Plantations), credit for cooperatives and credit for export; while credits for investment are Kredit Midi, Kredit Investasi Kecil, Kredit Perkebunan untuk Pembi ayaan Perkebunan Inti Rakyat (PIR or
Indonesia 31 Plantation Credit for financing Essentially People's Plantations), Kredit Peremajaan, Rehibilitasi dan Perluasan Tanaman Ekspor (PRPTE or Credit for the Rejunevation, Rehabilitation and Enlargement of Plants for Export).10 From this it is clear the government in its monetary policy is beginning to pay attention to small-scale industries or economically weak entrepreneurs. It can even be said that the greater part of the credit policy is aimed at small-scale industries. This can be seen from the Bank Indonesia directive for said credits that are categorized as having high priority. These comprise 70 to 100 per cent of the tota 1 of all credits offered at an interest rate of 3 per cent per annum (Bank Indonesia 1984, p. 11). There are, inter alia, Bank Pasar (Market Bank), cooperatives and the like. At province and regency levels there are also some departments that give credits at 1ow interest rate to small-scale establishments in their respective regions, such as the Department of Social Affairs, the Department of Industry, and the National Family Planning Coordinating Board (BKKBN) gives credit in the form of money, especially to participants of Keluarga Berencana Lestari (Lestari Family Planning). Following KEPRES No. 10/1980, the government created a team · consisting of representatives of several government bodies, including the State Secretariat, the National Development Planning Board (BAPENAS), the Department of Finance and Industry, and the Minister of State Apparatus. This team has the task of re-evaluating the government's contracts with indigenous entrepreneurs which amount to Rp 500 million. Around the same time was created the The task of this Directorate for Regional Development. directorate is to help the village poor through credits, absorption of 1ab our force, industry and other programmes. From this developed the Badan Kredit Kecamatan (BKK or Subdistrict Credit BQdy) (BIES 1981). BKK is one of the insti-
32 M. Dawam Rahardjo and Fachry Ali tutions that can reach the village poor. It gives loans up to a maximum of Rp 100,000 to artisans and traders of small capital at an interest rate of 1.6 per cent per month. In addition to all those institutions, there are the official small credit programmes. There are three levels of credits for small-scale entrepreneurs, artisans and traders through Bank Rakyat Indonesia (BRI) and its branches, providing for BIMAS credits, KIK and KMKP, all these at regency level, while at the provincial level, credits are given through Bank Pembangunan Daerah.11 Of all those credits for economically weak and indigenous establishments, KIK and KMKP12 are the most conspicuous. There are five commercial state banks that handle KIK and KMKP, with more than 1,000 branches (Bolnick 1982, p. 66). From 1974 to 1980 credits given for KIK and KMKP amounted to Rp 213.8 bi 11 ion and Rp 312 bi 11 ion, respectively (Table 2.6). From the sectoral aspect, the provision of KIK credits was highest in the transportation sector and for KMKP the total credit was largest in the petty trade sector. The increasing amount of loans granted by KIK and KMKP, 13 is also followed by the increasing number of loan requests. In 1974 there were 42,000 requests for KIK loans. This increased to 57,000 (1979), 79,000 (1980), 125,000 (1981) and reached 228,000 on 31 March 1984, while the number of those requesting for KMKP was far higher. In 1978 the number of applicants reached 336,000 and increased dramatically in 1983, reaching 1,531,000 and on 31 March 1984 it was 1,621,000. From the data above it can be seen that there is an impressive growth in the number of those benefiting from KIK and KMKP. However, the number according to the 1atest data (31 March 1984) is still very small compared with the number of small-scale· establishment units that is far
Tab1e 2.6:
Small Enterprise Credit Schemes KIK
KM1 0
Note :
Source :
Industry
Trade
73 1 7 5 3
54 2 8 2 3
Serv i ce 57 1 3 2 2
The averag ratio for th e respecti ve sector is as follows : 0.17 Industry Trade = 0.16 Ser vi ce = 0.16 Result of field research in Kl a ten, 1984.
42 M. Dawam Rahardjo and Fachry Alf It turns out that for 82 per cent of the respondents ft is fairly good. Only 4 per cent have a ratio greater than 1, which means that the total of their debts is larger than the capital they possess. This will cause difficulties when the enterprise is liquidated. Entrepreneurs who do not borrow from official financia-l institutions are undoubtedly at a disadvantage. But this can be understood, considering that the establishments of the respondents are located in small towns, so that they a're not "bank-minded" yet. There are also some difficulties when they face official institutions. Twenty-three per cent of the respondents rep 1i ed that borrowing was in fact. unnecessary, giving as reasons that the enterprise is already running well without debts and that they are afraid they may not be able to keep up with repayments. This shows that the management of finance is not well arranged yet. Entrepreneurs from the i ndus tri a1 , trade as we 11 as service sectors experience many difficulties when they request credits from banks. These difficulties may be summarized as follows: not having a certificate of fixed assets; no business licence; the interest rate is too high; the period of the credit is not long enough, so that the capital invested does not have the opportunity to develop properly when the debt must be paid off; not knowing the procedure for requesting credit, in particular, from banks; having to "spend too much money for administration to comply with the conditions". Thirteen of the respondents experienced the most di ffi culti es because they had to provide a guarantee. This may be compared to borrowing from other institutions where the complaint is the excessively high rate of interest, but collateral is not a problem. This, for example, is charac0
0 0
0
0
0
Indonesia
43
teristic of money-lenders. As a matter of fact the interest rate of banks is low, but
much
obtaining
money
has
credit.
entrepreneurs
individuals,
be
This
borrowing from banks. why
to
makes
during
the
entrepreneurs
process
of
averse
to
This is among other things the reason
prefer
though
spent
to
of
borrow
course
from co-operatives or
the
available
credit
is
limited. The surplus of cash inflow over cash outflow is cash saldo (net return), which will be retained in the enterprise. The amount of cash sal do in an enterprise wi 11 from time to time experience changes because of sever a 1 factors.
Cash
saldo will increase when the inflow from c ash sales and from
-the
collection of
debt
is
more
than
the
outflow of
material, labour for c e, other cos t s and tax .
raw
The change in
the marketing policy , a de c i s ion in the field of production, a policy in the fi e ld of
purchase and o f personnel, will
have their effect on c ash flow. The f ollowing part analyse s c a s h flow by paying attention to element s existing in the inflow as well
as outtlow
in the small - and medium-s c ale e nterpri se sectors in Klaten. But
before dicu ss in g it , it sh ould be s tated that because
the e xist1ng primary data are in c om pl e te, many elements or inflow as we ll
a s of outflow c annot be presented.
This i s
not surprising as dl sc us se d in the previous chapter, ve ry few of the respondent s ~ e e p reco rd s .
24 per cent of th e data ca ul d be
In the s urvey, only
w o r· ~ed
out, by using t he
simplest approach . The aim of this LdStl flow an alys1 s i s to know whetne r the cash saldo is pos itiv e o r· negative,
a nd als o how it s
relation is to eff1cien cy in ac tneving pro tits .
From thi s
analysis one can then know how the profit is ach iev ed in comparison with investment.
44 M. Dawam Rahardjo and Fachry Ali Cash Flow Analysis a. Cash Inflow The amount of cash inflow of the respective respondents is divided according to the sectors of the enterprise and is then averaged for each month. b.
Cash Outflow The flow of funds goes out for routine needs or for needs of an incidental nature, assuming: a working month of 26 days; o a need for basic material and aid material for one o month; an interest rate of 12 per cent annually; o no tax because the greater part of the respondents o are not taxed. As in inflow, the outflow is divided according to the enterprises' sector, and is then averaged. The di fference between cash inflow and outflow can then be seen in the following table:
Table 2.11:
Average Cash Inflow and Outflow for Each Sector (Rp) Cash Flow
Sector 1.
Industry
2.
Trade
3. Service Source:
Inflow
Outflow
Sal do ( Inflow-Outflow)
772.476
569.251
203.225
+
1.771.477
1.404.929
306.548
+
340.995
342.372
(-1.477) -
Estimated from findings of field research, 1984.
Indonesia
45
From the calculations it is evident that the more profitable sectors are industry and trade, while this is not yet the case with the service sector which is just deveWith regard to the industrial sector where the enterprises are of long standing, it may be said that Klaten society is already oriented towards industry, as can be seen from the greater number of industrial sectors in the area loping.
and with better results.
The trade sector, although just
growing , can develop fairly well. Seen from the point of view of efficiency it is also evident that the industrial sector is more profitable than the trade sec tor : 1 inflow unit may produce 0.26 parts profit compared to 0.21 in the trading sector. Furthe r , the cash flow estimate can be very useful in determining in which months the enterprises need more Sixty-seven per cent of the respondents re plied that inc rea se in production occurs in the month bef or e and the month afte r the Lebaran holiday, the fir s t day a f t e r the fa s t i ng month (the month is, therefore, finan ce f or produc tion.
not con s tant ; it depend s on the day when the Lebaran takes Thi s is also the case after harvest. The im pact of i ntere s t rate on this analysis can be see n in that high intere s t rate will cause a high outflow, s o tha t the f.l r of i t r a te will be low. This is also the case
place) .
if there a re change s i n the economic policy especially monetary policy. Conclusions and Policy Recommendations From th e e xposition ab ove some conc lusions may be drawn regarding the finan c ial a spec ts of small- and medium-scale enterprises in Klaten.
These conc lusions can be divided
into general and specific conclusions. General Conc lusions The strategic position and the great economic potential con-
46 M. Dawam Rahardjo and Fachry Ali tained within the small- and medium-scale businesses have more or less succeeded in exerting influence on the economic policies, on trade and in particular on the fiscal policy of the Indonesian Government. The birth of several forms of official financial institutions created by the government, such as KIK, KMKP and several other official bodies is a manifestation of the willingness of the government to pursue speci a1 fi sea 1 po 1i ci es with regard to small- and medi urnscale businesses. However, these fiscal policies still cannot be entirely used to the advantage of small- and medium-scale businesses. This happens because the framework of the policies and the execution of these policies are still biased towards the Moreover, modern medium- and large-scale industries. several of these policies are not relevant to small- and medium-scale businesses, as is apparent in Klaten. Specific Conclusions (1) The lack of availability of capital is an important problem. However, capital is also a problem for smalland medium-scale enterprises in another sense, namely, the entrepreneurs still cannot efficiently use capital to make a profit. (2)
The fixed capital owned by the enterprises are mostly sufficient, but their working capital is small so that they meet with difficulties if there are orders without payment in advance, or purchases by credit.
(3) The need for short-term as well as for long-term funds is rarely financed by a proper source. In addition the very small number of respondents that maintain written records is a further drawback. Therefore, what often happens is that capital is used in a non-efficient way, because long-term funding that should be used for
Indonesia 47 investment is used for working capital instead; this makes capital financing for the short-term needlessly expensive. (4)
In meeting their need for funds, especially from official sources, the entrepreneurs are faced with several Such problems include a high rate of problems. interest and an excessive red tape, even though it is from official sources that the need for funds should be met, considering the fact that the rate of interest is quite 1ow so that entrepreneurs can make use of this opportunity. Thus, entrepreneurs use non-official sources such as suppliers, money-1 enders, and private i ndi vi dua 1s where the interest rate is high, but the procedure for obtaining credit is not difficult at all.
(5)
Most entrepreneurs do not use credit for fixed capital. The aversion to borrowing, especially by those having their domicile in the rural areas, is often caused by their ignorance of borrowing procedures, besides several difficulties in these procedures. It is also true that entrepreneurs often do not want to take the risk of defaulting on repayments.
(6)
Entrepreneurs of small-scale enterprises still do not apply any method of management, in particular financial management, to put their finances in good order. Most of them, for instance, still mix private money with business money, so that it is di ffi cult to know how much funds the enterprise has.
(6)
For most medium-scale traders, banking is considered a normal practice. For small-scale industries, institutions on whi eh they can rely upon for capital are cooperatives. This is because these industries are
48 M. Dawam Rahardjo and Fachry Alf usually organized in industr ial centres where operati ves provide capital and marketing produc ts.
co-
(8)
Difficu lties/O bstacle s a. Officia l sources : procedure is endless and very bureau cratic and much time is needed before funds are release d, the period for repayment is too short. b. Co-ope ratives: the amount that can be borrowed 1s 11 mited, management of some co-ope ratives is sometimes ineffic ient, the interes t rate is sometimes rather high. c. Other sources /indivi duals: the interes t rate is very high, the funds availab le are also limited .
(9)
Advantages a. Officia l sources : the interes t rate is low, loans may be large although there is. of course. a ceiling , they are financi ally more secure and the management is better trained . b. Co-ope ratives: borrowing procedure is easy, a guarant ee is often not needed. c. Other sources : the need for funds/c apita 1 can be met within a relativ ely short period, the procedure is not complic ated, for it is only based on trust, can be contact ed at any time and whenever needed.
Indonesia 49 (10) Pattern of Using Profits a. The pattern of using profits in order to invest further turns out to be rarely used by respondents. b. Some respondents save their profit in the form of land, rice-fields, houses, jewellery and so forth. This has a close relationship with the perception of society with regard to a successful entrepreneur, who should be able to physically be seen as ri eh, and this has a great influence on the 1Hestyle of the entrepreneur concerned. c. Most of the respondents finance their investment by taking credit, but not through shares. Rec011111endations (1)
Institutional Improvements a. Official sources/institutions should provide more infonmation for potential applicants. Entrepreneurs have in fact a great desire to borrow from official institutions, but are impeded by ignorance of the necessary procedures. b. The co-operatives are already active in the industrial sector, and should now expand to the trade sector, for it is this sector that is capable of rapidly circulating capital, with little risk.
2.
Education Improvements When giving guidance/information/education to entrepreneurs the importance and techniques of the management of finance should be stressed. This can be done by using a system of book-keeping that is simple but useful for entrepreneurs.
50 M. Dawam Rahardjo and Fachry Ali Appendix SMBs in Klaten Regency Klaten is a regency located between two big cities, In Yogyakarta and Surakarta in Central Java, Indonesia. this regency there are 23 sub-districts. Several kinds of small-scale industries have developed in this region, from food processing and agricultural products, to products of weaving industries, metal processing industries and several kinds of handicraft. Others, comprise metal casting furniture, wood ea rvi ng, smithies, painting and e~roi deri es, confectionery, weaving, bamboo, yarn, knitting, b~ti_ k, weaving, several sorts of metals, ceramic, horn, sulak (dusters made of chicken feathers) and building material. According to data obtained* between 1970 and 1978 there were 2,496 small-scale, medium-scale and large-scale The development of industries in industrial enterprises. this region during those years was indeed rapid. From only the registered kinds of industries in 1970, there were 624 industries which increased in 1971 to 723. In 1974, it was These 1,330 and in 1978 the number leapt to 2,496. industries were almost evenly spread in all sub-districts of the Klaten regency. The latest data obtained show that the growth and diversification of small-scale industrial enterprises in Klaten have developed rapidly in the kinds of industries/ commodities and the increase of the industrial units. Table A2 shows the change or development of the said industries. Industrial units increased from 2,496 units in 1978 to 6,429 units in 1982. While the different kinds of industries in 1978 was only 45 -- for all industries largeand small-scale -- and 42 for small-scale industries only, it increased in 1982 to 65.
* Office for Census and Statistics of the Klaten Regency, 1971, 1974 and 1978.
Table 2.A2:
Number of Industries and Products In the Klaten Sub-District, 1982
Sub-District
No. of Industry (KInds>
No. of Industries
Workers
1.
Kota Kla ten
18
265
4.14
762
3.10
2.
Kebon Arus
8
150
2.33
617
2.51
3.
Wed I
11
854
13.28
2,787
11.35
4.
Ketandan
18
408
6.35
2, 548
10.38
5.
Jogonalan
7
148
2.30
461
1.88
6.
Gantlwarno
3
40
0.62
41
0.61
7.
Prambanan
4
112
1. 74
267
0.09
a.
~n
4
26
0.40
37
o. 15
9.
Kema lang
4
43
0.69
84
0.34
10.
Karangnongko
4
19
0 .29
46
0.18
11.
Jatlanom
4
53
0 .82
134
0.55
12.
Karanganom
12
355
5.52
1,118
4.55
13.
Tu lung
5
34
0 .52
125
0.50
14.
Polanharjo
9
303
4.71
977
3.97
15.
Oelanggu
17
235
3.66
724
2.95
16.
Juwlrlng
16
346
5.38
1,143
4.66
17.
Wonosarl
14
338
5.26
669
2. 77
18.
Caper
21
589
9.30
5,018
20.44
19.
Pedan
15
301
4.68
I ,504
6.18
20.
Karangdowo
6
112
I. 74
128
0.57
21.
Cawas
10
850
13.22
2,530
10.36
22.
Trucuk
10
394
6.13
1,306
5.37
23.
Bay at
8
445
6.92
1,472
5.99
lsrenggo
Tota I
Notes:
Source:
I 2-23
6,429
100
24,548
100
Town oosed. Rural based.
Calculated trom the recapitulation ot the result ot the data gathered In Klaten, 1982.
Table 2.A1:
Distribution of Industrial Enterprises By Sub-District, Klaten Regency, 1970-78
Year SutH:llstrlct 1970*
1978
1974
1971*
1.
Kota Klaten
15
2.40
12
1.65
64
4.82
192
7.69
2.
Kebon Arus
20
3.21
18
2.49
19
1.43
60
2.40
3.
Wed I
13
2.08
9
1.20
9
0.68
211
8.45
4.
Ketendan
12
1.42
16
2.21
114
8.57
140
5.61
5.
Jogona Ian
0.14
17
1.28
91
3.65
6.
G!lntl werno
0.07
34
1.36
7.
Prambenen
15
1.13
60
2.40
a.
lo'enlsrenggo
4
0.30
44
1.76
9.
Kemaleng
5
0.20
7
0.28
0.16
2
0.32
3
0.41
0.14
10.
K!lrangnongko
11.
Jatlnom
12.
K!l ra nga nom
13.
Tu lung
14.
Polanharjo
19
3.24
12
15.
Delanggu
15
2.40
16.
Juwlrlng
95
17.
Wonosarl
18.
3
0.42
21
1.58
40
1.60
23
3.10
13
0.98
174
6.97
55
4.14
45
1.80
1.66
49
3.68
24
0.96
33
4.37
93
6.99
127
5.08
15.22
113
15.64
153
11.50
115
4.61
3
0.48
6
0.83
19
1.43
59
2.36
Ceper
59
9.45
115
15.91
134
10.07
235
9.42
19.
Pedan
195
31.25
197
27.25
201
15.11
206
8.25
20.
K!l ra ngdowo
6
0.96
31
4.29
50
3.76
52
2.08
21.
Cewas
37
5.92
32
4.30
145
10.90
349
13.98
22.
Trucuk
70
11.27
79
10.93
112
8.42
62
2.48
23.
Bayat
40
6.41
25
3.39
42
3.16
144
5. 77
3.24
= Town-besed
Note: 2-23
Source:
19
= Rurel-besed
Office for Census end Stetlstlcs of Kleten Regency.
Indonesia 53 Notes
1.
Md::awley
(1983),
p.
But
95.
from among
the
39 million
artisans
only 177,000 (5 per cent) were classified as workers. 2.
If often happens that the figures and the classification of industries given
by
the
Statistics
are
Department
of
industries
different.
ThIs
and
report
the Central
uses
the
Bureau
fIgures
industria I standards of the Centra I Bureau of Statistics.· the
figures
of
the Department of
Industries are also
and
of the
However,
Included
tor
InformatIon. 3.
There were indeed, around the 1950s and the 1960s, several discussions on small-scale
industries.
In
1956,
for
instance,
H!lrun Zain and
Wanda Mulia wrote Perkembangan Pelaksanaan Rencana Mekanisme lndustri Keel I
(Mechanization of Small
Kadariah
wrote
Hardjosuwignyo Java". 4.
on
Scale Industries).
Perkembangan
presented
See Rahardjo
a
''Report
(1984~
on
Batik
Teksti I
and
Industries
Bintarto
in Central
pp. 166-167.
it has been noted for example, that industries in Indonesia would have a
positive
Indonesia
economic
effect
on
150,000-200,000
grew cotton to meet the needs of
See Slydenstein (1972), p. 11. long
imported
cotton
peasants,
its textile
if
industries.
lt should also be mentioned here that·
Indonesia
has
Indonesia
Is not allowed to export textiles made of cotton
batik) to the United States. 5.
Perindustrian
In the same year
its cotton from the United States,
but
(except
See Donges et al. (1974) p. 85.
Developing small-scale industries is, therefore, considered Kelnginan Politik
wli ll.
The
government's industrialization programme for PELITAs 11 I and
IV con-
sists
of
Pemerintah
a
(the
programme of
government's
political
industry emphasizing
development and a programme of
the
level ing out of
industry emphasizing economic growth;
but the first is more emphasized now. 6.
These
centres
are
established
at
regency-level,
where
there
Is a
concentration of product I on act I v lty of certaIn kinds of commodIty, such as rattan, minyak astirl
(fragrant oi I) and bamboo among others.
Among well known PPTs are those at Tegalwangi (West Java) for rattan, others are in South Sulawesi, South Kailmantan, Jepara (Central Java), South Aceh to name some.
54 M. Dawam Rahardjo and Fachry Ali 1.
As
In trade
Marzukl
fairs
(TIM),
like the Jakarta Fair, or fairs
In Taman
In Gelangang Remaja Senen (Senen Youth Centre).
c I ose I y related
lsmall Also
Is the sub-contractIng between entrepreneurs and the
government or a prIvate enterprIse as buyer. large-scale, for example,
Is common among
Sub-contractIng on a
Iron casting entrepreneurs
at Ceper, K la ten, Centra Java. 8.
Including a reservation scheme tor
licences,
the provision of basic
material and equlpments, and the application of technology. 9.
Surat Edaran Bank Indonesia No. S.E. 16/1/UKU, 1 June 1983.
10.
There are a I so other forms of obtaInIng credIt, such as the PSN credit, credit for financing the construction of rice- fields,
Investment
credit with a maximum of Rp 75 million and Investment credit tor cooperative
patterns.
Others Include Kredlt Pemlllkan Rumah (KPR or
Credits Enabling One to Own a House), Kredlt Mahaslswa Indonesia (KMI or Credit for Indonesian Students) among others. 11.
One other credit allowed by the government Is Kredlt Candak Kulak, channelled
through
Co-operative>.
Koperasl
Unit
Desa
(KUD
or
VIllage
Unit
In 1980 there were 6.3 ml I lion borrowers and around Rp
50 billion were given In credit. 12.
The objective of these two programmes Is to provide small and medium amounts of credIt
for
Investment, and tor permanent workIng capIta I
for sma 11-sca le establishments
In a 11
economic sectors.
Establish-
ments that can be given credit are those whose capital excluding land and the building occupied by the establishment, do not exceed Rp 100 mll lion In the Industrial and contructlon fields, or Rp 40 mll lion In the other sectors. 13.
Untl I 31 March 1984, the total tor KIK has reached Rp 825 bl I lion and that of KM
.
Development" XVIII no. 2 (July 1981>. Departemen
1980/81. Donges,
Carunla
dl
Kecll
"lndustrl
Mulya.
J CB Mohr (Paul Slebeck), 1974.
Tueblngen:
Indonesia
Sebaglan
Suatu
Jurnal EKUIN, 12 July 1982.
Plllhan".
dan
Perlndustrlal
"Pembangunan,
Barll.
presented
Ill,
Industrial Development
Juergen B, Bern Stecher and Frank Mohr.
Flrdaus,
Pellta
Kedua
Tahun
Jakarta, 1982.
Policies for Indonesia.
Hallm,
Tahunan,
Laporan
Perlndustrlan.
to 4th Congress of
the
Stablllsasl".
lkatan Sarjana
Ekonomlc
Paper Indonesia
(I SEI), Jakarta, 1969. "Teknlk dan Manajemen dalam Penyedlaan Dana untuk
Zoelashar.
lskandar,
Pengembanga n I ndustr I".
Paper presented at Workshop on ASEAN Sma 11 Singapore 22-23
Financial Factors.
and Medium Business Improvement: March 1985. Peter.
McCawley,
11 Pertumbuhan
Sektor
edited by Booth and McCawley. M.
Rahardjo,
Pembangunan Pertanlan, Rahardjo.
"I ndustr I
Dawam. dan
Jakarta: Kec I I
Perkembangannya
lndustrlallsasl Jakarta:
lndustrl."
dl
In Ekonoml Orde Baru,
LP3ES, 1982. dan
Keraj I nan
Indonesia".
Rumah In
dan Kesempatan Kerja, edited
Universitas Indonesia Press
Tangga:
Transformasl by M. Dawam
(1984~.
"Peranan Golongan Ekonoml Lemah dan Keterkaitanya dengan kemungklnan Penerangan Slstem Bapak Angkat dan Trading House." Paper presented to Department of Commerce. Sudarsono.
October
(198~.
"Household and Handicraft Industry In Indonesia, Its Growth and
Problems:"
Yogyakarta.
Occasional
Paper,
Fakultas
Ekonoml
56 M. Dawam Rahardjo and Fachry Ali Universitas Gadjah Meda, 1984. Urlb, Sunaryo.
"lndustrl Pengelolaan dalam Perekonomlan Indonesia".
Statlstlk (June 1982).
~
Ill
STUDY AND EVALUATION OF EXISTING FISCAL AND FINANCIAL POLICIES AND SUPPORT FOR SMALL AND MEDIUM BUSINESSES IN MALAYSIA
Chee Peng Lim
Introduction Small and medium businesses (SMBs)l in Malaysia play a very important role in the economy of the country . Unfortunately the full potential of SMBs in Malaysia has not been realized because this vital sector faces a number of constraints. Among them are the discriminatory aspects (albeit unintentional) of various government policies and the inadequate More specifically fi seal access to bank credit for SMBs. incentives appear to favour large business while SMBs are often unfairly treated. At the same time the banking system seems to prefer to lend to large businesses while SMBs are given only a small proportion of bank loans. In view of the above it is not surprising that SMBs labour under a severe handicap in competition with their large counterparts . The present study is based on an examination of the literature and data available on the subject as well as extensive and intensive interviews with agency and government officials and other resource persons informed about fiscal and financial policies and support programmes in the In addition, a sample survey of 390 manufacturing country. SMBs was carried out to determine at first hand some of the problems which these enterprises faced in relation to the
58 Chee Peng Lim fiscal and financial support provided by the government. The sample was carefully stratified to include a signiThe objective ficant proportion of Malay establishments. was to reflect the government's priority in the promotion of Malay entrepreneurs, in line with the New Economic Policy.2 An attempt was also made to distribute the sample between establishments in the urban and rural areas and between different sizes of SMBs . Status of SMBs in Malaysia Number and Type of SMBs It is estimated that more than 125,000 establishments _were engaged in a wide variety of non-agricultural economic activities in the formal (or registered) sector in Peninsular Malaysia during 1978.3 Table 3.1 shows that an overwhelming majority of these establishments -- nearly 124,000 or about 98 per cent of them -- emp 1oy 1ess than 50 workers per establishment and may thus be regarded as SMBs. Collectively they shared 51 per cent of the total employment, 55 per cent of the gross output, 36 per cent of the value added and 31 per cent of the fixed assets in all the 127,000 establishments in 1978 (Table 3.1) . According to the Mid-Term Review of the Fourth Malaysia Plan, the majority of SMBs were concentrated in three sectors, namely, manufacturing, wholesale and retail trade and construction; and that about 74 per cent of the value added of all SMBs came from these three sectors (Mal ay si a 1984!, p. 271). The review also noted that small enterprises were responsible for almost one-third of all non-agricultural jobs and, therefore, played an important role in the generation of emp 1oyment and output in the economy, in the redressal of poverty and the restructuring of society. Within the manufacturing sector, Table 3.2 shows that in 1981, SMBs employing 1ess than 50 workers accounted for nearly 90 per cent of all manufacturing establishments in
Table }.1:
Economic Slgnlflc8nce of SMBs In Mel8ySI8, 1978
of Operetlon S~le
No. of Estebll shments No.
J
< 'OOOJ
Tot81 Employment No. ( '000)
J
V~ I ue Added
Fixed Assets
No. ( '000)
'
Million < SJ
Gross Output
'
Million (S)
'
< 5 persons
95. 0
74.9
202
19
863
7
594
6
7,709
12
5- 49 persons
28. 7
22 .6
~6
32
3,784
29
2,466
25
26,333
42
50-199 persons
2. 5
2. 0
232
22
4' 160
32
2,619
26
14,230
23
> 200 persons
0. 6
0.5
287
27
4,087
32
4,248
43
13,895
22
Source:
Departmen t of St8tlstlcs.
Table 3.2:
Number of Manufacturing Establishments by Employment Size Group, Malaysia, 1981
Total Employment Size Group
No. of Establishments
Below 5
8,816
43.2
5 - 9
4,140
20.3
10 - 19
2,770
13.5
6,910
33.8
20 - 29
1,350
6.6
30 - 49
1,202
5.9
2,552
12.5
1,065
5.2
615
3.0
1,680
8.2
200 - 499
306
1.5
500 - 999
107
0.5
51
0.3
464
2.3
20,429
100.0
Sub-total (5 - 19)
Sub-total (20 - 49) 50 - 99 100 - 199 Sub-total (50 - 199)
1,000 and above Sub-total (200 and above) Total Source:
Department of Statistics.
Malaysia
61
Malaysia. Furthermore, SMBs employed nearly 26 per cent of total paid manufact uring employees, while such firms accounted for 16. 4 per cent of the tot a 1 va 1 ue of fixed assets employed in the manufacturing sector.4 From the above figures, it is clear that although SMBs in Malaysia represent a large majority in the nonagricultural as well as in the manufacturing sector, its value added is relatively low, largely due to its low productivity. The SMB in Malaysia is usually organized as a family/sole proprietorshi p business, a reflection of the small-s cal e of operation of the enterprise. An analysis of the ownership of SMBs in Ma 1 ays i a shows that most of them However , an increasing are owned by Chi ne se (Chee 1975). number of SMBs are being set up by Mal ay entrepreneurs following the introduction of the New Ec onomic Policy (NEP). Malay SMBs are, however, largely concentrated in a small range of indu stries especially hand icrafts, batik, food processing and furniture. Unlike large f irms wh ich are usually located in large urban centres, SMBs appear to be more e venly spread out and are found not only in urban and rural area s but also in the developed and less developed states in Malaysia. Within the urban areas SMBs are found not only in the industrial but (For further details of the also in the residen tial zone. profile of SMBs see Chee 1985.) Government Policy towa rds SMBs Government involvemen t in SMBs in Malaysia began mainly after the adoption of the NEP in 1971. Generally , SMBs were neglected during Briti sh colonial rule as was the manufacWhen the country gained independence in turing sector. 1957, the prime objecti ve of the government was industrialization and that ofte n meant the establishment of large enterprises. 5 Thus not surprisingly, there wa s no mention
62
Chee Peng Lim
of SMBs in the country's first two five-year plans (Chee 1984a).
SMBs were given some recognition in the First Malaysia Plan (1966-70) 6 but this was only in relation to some of its problems. The government continued to give greater attention to 1arger enterprises. The ethnic violence of 1969 (the May 13 incident), however, showed clearly that economic policies and programmes geared mainly to increasing the growth of the economy would not meet the needs of the nation. The trauma of the incident led to a critical evaluation of past policies and approaches, out of which the NEP was formulated. The NEP committed the nation to reduce and eventually eradicate poverty by raising income levels and increasing employment opportunities for all Malaysians, irrespective of race ; and to accelerate the process of restructuring society so as to reduce and eventually eliminate ethnic identification of with economic function. In the 1i ght of the objectives of the NEP, the Mal aysi an Government recognized the potential si gni fi cance of SMBs. Thus in the Second Malaysia Plan (1971-75), a number of institutions were established to assist the deve1opment of small industry. The significant role of SMBs was confirmed in the Third Malaysia Plan (1976-80) which pledged the government to developing small industry "as an integral part of Malaysia's industrial development" (Malaysia 1976, p. 315). The plan also noted that the Advisory Counci 1 on Consultancy and Advisory Services for Small-Scale Industries and Businesses would be strengthened to become the Co-ordinating Counci 1 for the Development of Small-Scale Industries. The council would be responsible for co-ordinating and harmonizing programmes and policies of existing institutions over the whole range of services to small-scale industries. The focus of government policy during the Third
Malaysia
63
Malaysia Plan was on the training of small entrepreneurs. In line with this policy the Mid-Term Review of the Third Mal ays1 a Plan noted that the National Productivity Centre, MARA (Majlis Amanah Rakyat), the Ministry of Culture, Youth and Sports, in association with other relevant agencies such as the Malaysian Entrepreneur Development Centre (MEDEC) in the MARA Institute of Technology in association with the National
Entrepreneur
(NERDA),
a
private
entrepreneurial
Association
Development
Research
organization,
conducted
development progranrnes.
a
number
of
The objective was
In addition, to provide training for 17,500 participants. a research programme on entrepreneurs was undertaken to assist
the
government
in
fonnulating
effective entrepre-
neurial development programmes. The Fourth Malaysia Plan (1981-8S) emphasized the role which SMBs play "in the development of i~ortant entrepreneurship,
creation
of
employment,
mobilization
of
individual savings for investment, broadening the industrial base of bumiputera7 and providing inputs and supportive services for larger scale industries " (Malaysia 1981, p. 297) . The plan reaffirmed the government' s policy of providing assistance to SMB s and noted that M$318 million would be allocated to MARA, the Development Bank of Malaysia and the The plan Agricultural Bank for the development of SMBs. also
noted
the
establishment
of
the
Division
of
Small
Enterprises in the Ministry of Trade and Industry. To sum up, the above discussion shows a gradual change in the Malaysian Government' s poli cy toward s SMBs , from one of neglect to one of promoting SMB s in re c ognition of it s It important role in the overall e conomic development. should also be rement>ered that the government's major goal in promoting SMBs is to achieve the objectives of the NEP. (For other aspects of the government's policy and assistance for SMBs in Malaysia, see Chee 1985.)
64 Chee Peng Lim Fiscal Incentives Investment Incentives Malaysia's investment incentives are designed to provide total or partial relief from taxation for companies 8 investing in new enterprises or expanding existing ones. Basically there are seven major forms of tax incentives: pioneer status investment tax credit labour utilization relief export incentives increased capital allowance hotel incentives locational incentives Pioneer status incentives are given in the form of tota 1 exemption from income tax ranging from two to eight years depending on the level of fixed capital investment. The tax holiday period ranges from two years for capital investment of less than M$250,000, to five years for capital investment of more than M$1,000,000. Investment tax credit (ITC) can be granted to companies not enjoying pioneer status, labour utilization relief or locational incentive. The amount of tax credit will not be less than 25 per cent of the total capital expenditure incurred by the project. Labour utilization relief (LUR) is similar to pioneer status incentive except that the basis for exemption is the number of full-time paid employees engaged as shown below: 0
0
0
0
0
0
0
No. of Full-Time Paid Employees 51 101 201 301
-
100 200 300 400
Tax Exemption Period 2 years 3 years 4 years 5 years
Malaysia 65 Export allowances are designed for companies manufacturing mainly for export markets and include export allowances, accelerated depreciation allowances and deduction for promotion expenses overseas. Increased capital allowance is given to projects not qualifying for pioneer status, ITC or LUR. The allowance is applicable to qualifying building and plant expenditure for modernizing production techniques or the setting up of a modernized factory. Hotel incentives try to encourage the setting up of hotels/motels and tourist resort complexes. Locational incentives provide tax relief to projects established in certain designated areas in various parts of Malaysia. An approved company locating its factory in an area specified by the government as a "locational incentive area" may be granted tax relief up to a maximum of ten years. In addition to the incentives mentioned above, a number of other incentives are provided for the establishment, expansion and modernization of manufacturing and agricultural projects in Malaysia. These are: special incentives for approved agricultural industries; re-investment allowance; accelerated depredation allowance; tax incentives for restructuring; o plantation allowance; o export refinancing facility. 9 o Finally there are incentives for small industry which are as follows: Interest rate on unsecured loans of up to M$50,000 is at 7.5 per cent instead of 9.5 per cent. This is administered by the Credit Guarantee Corporation (CGC). The two per cent loss suffered by commercial banks on these loans will be reimbursed by the government through income tax rebates. The interest paid on the unsecured 1oans by the o 0
0
0
0
66 Chee Peng Lim small-scale businesses under the CGC scheme is eligible for double deduction. o Manufacturers with sales turnover of not more than M$100 ,000 per year or receiving 1abour charges not exceeding M$20,000 per year, are exempted from licensing under the Sales Tax Act. o All agreements for leases not exceeding M$2,400 per year are exempted from stamp duty. Rate of stamp duty on all agreements and documents related to loans not exceeding M$250,000 by qualified small-scale businesses is 0.1 per cent. An analysis of the major investment incentives described above indicates that most of them are biased in favour of large, capital intensive enterprises. The bias is shown in two ways. Firstly, only firms producing priority products are eligible for investment incentives. Since 1970, the list has been increasingly restricted to products which involve large-scale and capital-intensive firms. Many products suitable for SMB production which were included in the 1970 list have been deleted and replaced by more sophisticated export-oriented products. In a way this trend is justified in view of Malaysia's progressive development in manufacturing. At the same time one cannot deny that the selection process has a built-in bias against SMBs. Secondly, pioneer status (PS) is by far the most important incentive available to firms. More than one-third of the proposed capital investment of approved projects during 1974-79 were planned by PS firms (MIDA 1979). PS incentives, however, tend to favour large-scale and capitalintensive firms.10 This is because the PS incentive system attempts to link the value of incentives with the level of investment and thus provides greater benefits to larger enterprises (in terms of investment).11 Unfortunately PS is not the only incentive favouring large-scale firms. All the other incentives have the same, 0
Malaysia 67 if not an even greater bias. For example, since the LUR is only given to firms employing more than 50 workers, it favours large projects and by-passes SMBs completely. Incentives from tax holidays, the Malaysian Government also proa host of other incentives to attract investments. include tariff protection and concessions and various of facilities such as industrial estates, free trade and licensed manufacturing warehouses. In the absence of comprehensive and updated studies it is not easy to analyse the impact of tariff protection on SMBs in Malaysia. However, there are some indications that protection has generally favoured large enterprises. Firstly, data on employment in small and large industries by range of effective protection and sector indicate that with the exception of one sector, all the sectors receiving tariff protection are those which have a large proportion of employment in large industries (Edwards 1975). It is significant to note that the industry receiving the highest rate of tariff protection ("other electrical appliances") accounts for nearly 98 per cent of employment in large industry. Secondly, the "made-to-measure" tariff system has a built-in bias in favour of large firms for two reasons. (1) Because of information constraints, the Special Advisory Committee on Tariffs (SACT) often accepts information submitted by applicant firms at face value and grants tariffs on that basis. This provides an opportunity for multi national corporations (MNCs) to fix high transfer prices on their component exports to Mal ay si a, thereby en ab 1i ng them to request higher tariffs (Teh 1977). (2) The hearings by the SACT (the sole tariff-making institution excepting the Treasury), are held in camera. This confers considerable discretionary power on tariff officials and provides an incentive for businesses to engage in "rent-seeking"
Other Apart vi des These types zones
68 Chee Peng Lim activities 12 which involve real resource costs to the economy and offer scope for corruption. Large firms (often foreign), with more resources, including specialized skills, are usually better placed to engage in such activities. To sum up, it would appear that the fiscal incentive system in Malaysia generally favours large enterprises, and as a result, tilts the balance against SMBs in competition with their large counterparts. Taxation All businesses in Malaysia are subjected to company tax at a flat rate of 40 per cent and a development tax of 5 per cent. In addition, sales tax is levied on certain imported and locally manufactured goods. Although a number of SMBs are exempted from paying the sales tax, most SMBs are not exempted from paying the development tax.13 While the company tax and development tax impose the same burden on all firm regardless of size,14 there is one other tax which imposes a relatively heavy burden on small industry, and this is the estate duty, in particular death duties. The payment of death duties is largely confined to SMBs si nee these are generally unincorporated businesses. Although the rates of duty may not be very severe, in view of the limited financial resources of SMBs, the burden imposed is a very heavy one. Recent Changes The Mal aysi an Government is not unaware of the di scrimi natory nature which the incentive system showed towards SMBs. Thus in the 1981 and subsequent budget, the government tried to redress the i mba 1anee by producing a package of i ncenti ves for SMB in the 1981-83 budgets. Subsequent budgets tried to streamline the administrative procedures relating to the provision of fiscal incentives in order to make such incentives more accessible to the manufacturing sector.
Malaysia 69 The various fiscal changes introduced in the recent budgets have helped to place SMBs on a more equal footing with their large-scale counterparts but a lot more needs to be done so that all enterprises, regardless of size, benefit from the tax incentives provided by the government. Financial Assistance Programmes Ma1ays i a has more than twenty different types of fi nanci a1 institutions. These institutions perform a wide variety of functions ranging from commercial banking to insurance. During the post-war period, a substantial number of indigenous commercial banks were established, as well as special government financial institutions. Not all the financial institutions are directly relevant to the credit needs of SMBs. The more relevant institutions are the commercial banks, CGC, finance companies, industrial finance institutions and -- in the informal sector -- pawnshops and money1enders. In 1978, the Central Bank introduced its first guideline on bank loans to SMBs. The guideline was revised in 1981 when the Central Bank required each commercial bank to extend at least 12 per cent of its total loans outstanding at the end of 1980 to small-scale enterprises, of which five per cent must be provided under the Special Loan Scheme (SLS) of the CGC. This guideline was abolished in 1983, but the cotm1erci al banks were required to maintain throughout the year their respective levels of lending to this group as at the end of 1982. In addition, the banks were required to extend at least one-half of their SLS loans to bumiputera with the compliance date set at 31 December 1985. Apart from increasing access to bank loans for SMBs, a maximum lending rate has been imposed on loans to SMBs under CGC's loan schemes. In addition, the Central Bank has tried to hold the interest charged by other institutions including pawnshops at· a "reasonab1e" 1eve 1 •
70 Chee Peng Lim The major financial assistance programmes for SMBs are: o CGC General Guarantee and Special Loan Scheme; MARA's Loan Scheme; o Commercial Banks' Special Loan Schemes; o MIDF's Financial Assistance Programme; BPM's Term Loan Scheme . The first three financial assistance programmes are designed mainly to provide short-term 1oans while the 1ast two programmes cater for medium- and long-term loans. 0
0
CGC's General Guarantee and Special Loan Scheme The General Guarantee Scheme (GGS) and the Special Loan Scheme (SLS) are administered by CGC . GGS is available to locally-owned and operated SMBs with net assets, or in the case of limited companies, shareholders' funds of up to M$250,000 each. The ma ximum loan size that can be guaranteed is M$100,000 (M$200, 000 for bumiputera). Up to 30 March 1985, t he interest rate for l oan s under t he scheme was set at 8.5 per cent per annum. The commercial banks pay CGC an amount equivalent to one-half of 1 per cent on approved loans out standing as guarantee fee, for which CGC guarantees 60 per cent of the amoun t of loans in default. Under the initial gua ra ntee scheme introduced in 1973, the commercial banks were required to extend at least 10 per cent of their savings deposits as 1oans to sma 11 borrowers. Banks which failed to meet the guideline for lending to SMBs were required to place with the Central Bank deposits equal to their respective shortfalls. The funds would be placed for one year at a penalty interest rate of 5 per cent or a double penalty rate of 2 per cent if they failed again in a subsequent year. The Central Bank would then re-lend the funds at the same rate of interest for one year to those institutions which have performed well in complying with the guidelines. The arrangement was intended not only to penalize the delinquent banks but also to reward those which had
Malaysia 71 done well. The SLS was introduced by the CGC in January 1981. The maximum loan under SLS is M$50,000 for each borrower, which can form part of total borrowings up to a M$250,000 limit. The SLS guidelines also state that the SLS loans are to be without security, except if the 1oan is used to buy fixed However, the banks are not penalized for taking assets. additional security. Therefore, in practice, banks have in many cases taken additional security against their SLS loans. Under SLS the interest rate was fixed at 7.5 per cent per annum as compared to 8.5 per cent p.a. under CGC (up to 30 March 1985). Commercial banks were eligible for a tax rebate of 2 per cent per annum on loans extended unde~ the scheme. In addition, interest payments made by the borrower under the scheme were eligible for double reduction for income tax purposes. On the whole, a bumiputera SMB could borrow up to M$250,000 at an average weighted interest rate of 8.4 per cent per annum. Other SMBs pay an average weighted interest rate of 8.6 per cent per annum. (When SLS were introduced, the prime 1ending rate of the commercia 1 banks was between 8.5 per cent and 9.5 per cent per annum.) With the introduction of SLS, banks were required to extend at least 5 per cent of their total loans outstanding as at the end of 1980, to SMB under CGC's loan schemes. In addition, the banks were required to extend at 1east onehalf of their SLS loans to bumiputera. Performance of GGS and SLS CGC •s two guarantee schemes have been quite impressive in terms of total loan approvals. Table 3.3 shows that in 1973, the first full year of operation of the CGC, 2,292 loans for a total value of M$11.8 million were approved of which M$5.9 million were utilized. In 1984, the number of
Table 3.3:
Bank Lending Under CGC Schemes, 1973-83 GGS
Year
Va1ue ($m)
1873 1974 1975 1976 1977 1978 1979 1980 1981 1982 1983 1984
11.82 164 .34 125.76 89.3 89.1 ll5.1 142.5 124.3 25.8 9.7 7.2 4.02
Note: Source:
SLS started in 1981. CGC.
SLS No. 2,292 21.363 12,189 9,538 9,209 9,638 8,552 6,103 1,148 294 236 150
Value ($m)
-
-
Total No.
Value ($m)
No.
-
11.82 164.34 125.76 89.3 89.1 111.1 142.3 124.3 524.0 519.3 298.3 212.2
2,292 21,363 12,189 9,538 9,209 9,638 8.552 6,103 18,209 16,958 10,563 7,991
-
-
-
-
-
-
-
-
-
498.2 509.6 291.1 208.2
17,161 16,664 10,327 7,841
Malaysia 73 1oans approved by CGC totalled 7, 991 whi 1e its tota 1 va 1ue amounted to M$212.2 million (Table 3.3). Of this amount, M$208. 2 million were unde'r SLS whi 1e the remaining M$4 million were under GGS. Given its lower interest rate, it is not surprising that SLS loans accounted for 98 per cent of the total loans guaranteed by CGC. At the end of 1984, the cumulative total of GGS and SLS 1oans approved for guarantee amounted to M$2, 502.2 million for an aggregate of 135,277 loans. The sectoral breakdown of loans approved for guarantee indicated that SMBs in commerce and trade have received the lion's share of these loans since they were introduced in 1973. In 1984, SMBs in commerce and trade received a total of 6,425 loans or 80 per cent of the total valued at M$169.1 million (or 80 per cent of the total value). Also, .loans for commerce and trade and manufacturing have increased during the period 1973-84 while loans for agriculture show a downward trend. MARA's Loan Scheme MARA is a corporate body set up in 1966 under the Ministry of National and Rural Development. The objective of MARA is to motivate, guide, train and assist the Malays and other bumiputera, with emphasis on the rural population, to participate actively and progressively in commercial and industrial activities in line with the government's economic policy. MARA is financed by the Federal Government in the form of grants and loans. During the current Fifth Malaysia Plan (1986-90), MARA has been allocated a development expenditure for manufacturing and trade of M$380.9 million (Malaysia 1986). MARA's loans are aimed at providing credit to small bumiputera commercial and industrial enterprises. (Loans for agricultural purposes are provided by other agencies such as Bank Pertanian.) MARA's criteria for granting loans ar"e the soundness, viability and growth potential of
74 Chee Peng Lim the enterpri se. The Entrepre neurial Development Di~ision (EDD) provides three types of loans: ordinary loans for upgrading existing entrepre neurs; o loans for new entrepre neurs; and o special loans for petty traders and hawkers. The types of ordinary 1oans given and the terms of repayment are as follows: loans for working capital, loan for purchasing fixed assets, loans for purchasing vehicles for business use, loans for contract work and services , loans for setting up professio nal firms. For loans that are in excess of the amount paid by MARA, MARA will forward the applicati ons to the comnercial banks for finance. The rate of interest payable is as follows: o Loans of $5,000 and under - ~ per cent per annum. o Loans of more than M$5,000 - 7~ per cent per annum. Most of MARA's ordinary loans are given out to the trading sectors to which it allocated 59.3 per cent of its loans between 1976-80. The second largest number of loans went to the construc tion sector. In terms of size, more than 90 per cent of MARA's loans are of M$5,000 or less. Loans exceeding M$10,000 each formed less than 4 per cent of the allocatio n. Finally, nearly 60 per cent of MARA's loans are given without any security . The large number of small loans and the large percentage of loans given out without any security probably explains why MARA has problems supervising its loans and why a number of these loans cannot be recovered. Finally, MARA's special loan scheme introduced recently is meant for petty traders and hawkers who have a turnover of less than M$5,000 per month. No collatera l is required and the maximum value of a loan is M$2,000. Preferen ce is given to applican ts who have already started business . 0
0
0
0
0
0
Malaysia
75
Commercial Banks Special Loan Scheme Some of the major commercial banks in Malaysia have introduced special 1oan schemes for SMBs. Among these are Bank Bumiputra Malaysia, Malayan Banking and United Asian Bank. MIDF's Financial Assistance Programme MIDF provides the following types of financial assistance: (1) Medium and Long-term Loans These loans are for period up to 5 to 15 years. They are usually granted to assist in financing the purchase of fixed assets of a factory, including land, buildings, machinery and equipment. Under special circumstances, bumi putera ventures may qualify for additional finance in excess of the 50 per cent limit. (2) Factory Mortgage Finance MIDF assists in the purchase of factory buildings and 1and through a factory mortgage credit scheme. Up to 80 per cent of the cost may be granted under such loans. Repayment periods extend over 3-5 years. (3) Machinery Finance A machinery finance scheme assists in the financing of machinery and equipment. This is by and large a hirepurchase arrangement where the borrower is required to provide at least 25 per cent of the c.i.f. (cost, insurance, freight) price of the plant or machinery. MIDF undertakes to advance the remainder and arranges for the borrower to repay over a period of not more than four years. Like many other financial institutions in the past, MIDF loans generally went to large enterprises (Chee 1975, Since 1970, however, in line with the Central p. 293). Bank's monetary policy, MIDF has channelled a significant proportion of new loans to the priority sectors, namely, sma 11-sca1e i ndus tries, bumi putera enterprises and exportoriented industries. · Small loans, defined as loans not
76 Chee Peng Lim exceeding M$150,000 each, accounted for 52.4 per cent of the total number of loans extended in 1980, although they amounted to only 5.7 per cent (M$7.6 million) of the total value of loans approved (Bank Negara 1980). On a cumulative basis, small loans accounted for nearly three-quarters of the 3,268 loans approved and amounted to $206.7 million or 13.8 per cent of the tota 1 va 1 ue of 1oans approved as at March 1984 (MIDF 1983). Finally among the financial institutions, MIDF has the most sophisticated follow-up organization. MIDF's Follow-up Department visits borrowing firms once every three months and provides management and technical assistance. Follow-up is very important for small industry. BPM's Term Loans Bank Pembangu nan Ma1ays i a (BPM) or the Deve 1opment Bank of Malaysia is a fully-owned subsidiary of Bank Bumiputra Malaysia, a wholly government-owned commercial bank, and was incorporated on 28 November 1973. The primary objective of BPM is to develop, increase and accelerate the active participation of the bumiputera in the economic activities of the country . Towards this objective BPM provides term loans on fixed assets for a period up to fifteen years, the minilll.lm loan amount being M$50,000. Additionally, BPM can participate in a venture by subscribing up to 30 per cent of the shares, provide bank guarantees on the purchase of machinery and equipment and provide L.tnderwri ti ng services and management and advisory services. BPM's loans are restricted to bumiputera-controlled businesses. These are defined as companies which have at least 51 per cent of the share capital subscribed by bumi putera emp 1oyi ng majority bumi putera workers and managed actively by bumiputera. In order to provide a more comprehensive financial package, BPM introduced a working capital scheme (WCS) in
Malaysia
77
July 1979. This was made possible through a special deposit of M$28 m1111 on from the Central Bank. This faci 11 tates disbursement of tenn 1oans si nee clients need not approach another institution for working capital and hence helps to accelerate project implementation. The minilll.lm loan under the WCS is fixed at M$30,000. So far, response to the WCS has been overwhelming. In 1981 BPM initiated two financing programmes to further strengthen and expand its as si stance to bumf putera entrepreneurs. These were: (1) Entrepreneurial Development Programme (EDP) The thrust of this programme is the identification of potential entrepreneurs and arranging for provision of necessary training and other assistance inputs to encourage them to make the transition from traders, e.ployees, professionals, among others into owners and Nnagers of their own enterprise. It encompasses four identification of entrepreneurs, basic components: training inputs, pre-fnvestment consultancy, postThe investment extension services and financing. training input is provided in collaboration with other institutions like MARA, National Productivity Centre and Malaysian Entrepreneurial Development Centre (KOEC) through jointly organized courses in the classro~ and on-the-job. (2) Leasing and Plant Hire Scheme This programme falls under the jurisdiction of the Banking Division, and is carried in two categories. lease and operational lease, namely. financial (equipment hire). The number of applications for BPM's loans has increased steadily since its inception. At the end of 1983. the cumulative bank's total approval of loans reached M$674.5 million. of which 21 per cent was granted to small and medium size enterprises. BPM is
78 Chee Peng Lim now participating in a nursery factory scheme .. with the Small-Scale Industry Division in the Ministry of Trade and Industry to help SMBs venture into manufacturing with a unique package deal covering intensive management techniques and training at specific industrial complexes. 11
Conclusion Looking at the various financial assistance programmes described earlier it would appear that there is quite a wide variety of loans for SMBs. In addition, Table 3.4 shows that there has been an exponential growth in credit as_sitance for SMBs, from M$3.1 billion in 1971 to M$23.6 billion in 1980,, an increase of nearly eight-fold. The increase was most significant for Malay SMBs, nearly 28-fold compared to a 6.4-fold increase for other SMBs. However, Malay SMBs still accounted for less than a quarter of the total credit assistance for SMB in 1980 (Table 3.4). This gap should be considerably narrowed by 1985 with the pressure by the Central Bank to increase credit assistance to SMBs as well as the introduction of new loan schemes exclusively for Malay SMBs. One such scheme is the World Bank Loan Scheme (WBLS). The scheme was launched in October 1984 with funds totalling M$226 million of which M$150 million from the funds would be allocated to BPM, M$60 million to MIDF and M$16 million would be shared by the various government agencies connected with the scheme. The funds would help the selected agencies provide some 1,200 bumiputera SMBs an integrated package of financial, management and technical assistance. Four categories of industries would be given priority namely, food processing, wood-based industries, light engineering and building materials. The scheme would provide medium- and long-term loans of up to M$300,000, at an interest rate as 1ow as 9 per cent per annum with easy repayment terms (New
Table 3.4:
Peninsular Malaysia:
Credit Assistance for SMBs, 1971 and 1980 1980
1971 Institution
($m) Commercial banks and finance companies (Credit Guarantee Corporation)
149.3
15.1
MARA
0.4 1
UDA
13.1
MIDF
Other Malaysians
Mal ay %
($m)
%
($m)
%
-
-
-
-
8.3
-
15 . 0
0. 2
-
2.0
13.1
7. 3
56.9
0.4
95.1
50.3
0.2
-
39.7
0.8
100.0
129.3
2.6
17.3
0.3
-
0.4
-
-
2.3
0. 1
Petty traders programme
0.73
0.4
-
-
0.7
-
%
18,440.0 99.5 23,220.0 98.5
-
7. 4
1.3
($m)
(350.0)
1.0
-
%
(1.1)
50.3
0.5
($m)
Total
(200.0)
(3.0)
2. 32
Source:
%
(150.0)
BPMB
Notes:
($m)
82.8 2,851. 4 98.0 3,000.7 97.2 4,780.0
-
Other Malaysians
Mal ay
Total
(1. 5) 0. 2
7.4
0.5
139.7
0.6
-
129.3
O.b
17.3
0.1
1 Data refer to 1972 when UDA was formed. 2 Data refer to 1974 when Bank Pembangunan Malaysia Bhd. was formed. 3 Data refer to 1976 when the programme was started and include provision of business premises and sites. Malaysia 1981, p. 66 .
80
Chee Peng Lim
Sunday Times, 2 December 1984). The supply side, however, is only part of the equation in the issue concerning financial assistance- for SMBs.
Thus
in order to examine the issue adequately we will also have to look at the demand side of the equation. We will do this in the next section by presenting the findings from our financial survey of SMBs. SMBs' Need for Financial Assistance Financial Problems Among the many problems faced by SMBs in Malaysia, the problem of finance appears to be the most serious. _ _This. problem has been documented in several surveys of SMBs which show that SMBs complain of inadequate finance and lack o.f access to commercial bank credit (see for exa~le, Chee The same coq>laint still 1975 and Chee et al., 1979). persists as shown in the "Financial Survey of SMBs" carried out in conjunction with this study, where the problem of finance was cited by the largest number of respondents.
In
addition, most respondents regard it as their most difficult problem (Table 3.5). A cross-tabulation analysis of the survey data shows that the financial problem appears to be more acute among the smaller SMBs.
Also, Malay SMBs tend to have more finan-
cial problems compared with Chinese SMBs.
The most likely
explanation is that most of the Malay SMBs in the sample are relatively smaller in terms of eq>loyment size compared to the Chinese SMBs.
In terms of location, 55.6 per cent of
SMBs in the rural areas complain of financial problems while only 41.7 per cent of SMBs in the urban areas have a similar comp 1ai nt. This may be a reflection of the relative scarcity of financial institutions in the rural areas. Finally, more recently established firms have more problems with finance compared to firms established earlier. This ~ be explained by conservative· banking practices which tend to
Malaysia 81 Table 3.5:
Perceived Problem Area of Sample Problem
Problem Area
Finance Marketing Labour Land/building Government regulation Management Raw materials *N =
No.*
%
312 256 214 115 99 66 51
80.0 65.6 54.9 29.5 24.4 16.9 13.1
Most Difficult Problem No.* 180 74 50 37 24 8 16
%
46.2 19.0 12.8 9.5 6.2 2.1 4.1
390
favour 1oans to well established rather than newly established enterprises. Causes It is not difficult to understand why so many SMBs have problems with finance when we realize that SMBs are generally short of capital to begin with. Data from the survey indicate that only 184 or 47.2 per cent of the respondents own the 1and and/or the bui 1di ng on whi eh they operate. The 1ack of ea pi ta 1 may be seen in the type of land or building utilized. Generally, the size of the land and building is small. The building is often congested and in some cases it is even shared with another tenant. The 1ack of capita 1 is a1so evident in the number and type of machinery and equipment used. In many cases there is a proportion of machinery which is often used or out-dated. The major reason for the shortage of capital is that the majority of SMBs had to raise most of the initial capi-
82 Chee Peng Lim
Table 3.6: Most Important Source of Initial Capital Source
Own Family Relative Friend Money-1 ender Bank Finance company MARA Other *N
=
Most Important Source
Source Cited No.*
't
No.*
't
339 221 107 85 13 159 44 27 44
86.9 56.7 27.4 21.8 3.3 40.8 11.3 6.9 11.3
245 46 3 9 1 58 3
62.8 11.8 0.8 2.3 0.3 14.9 - o-.8
25
6.4
390
tal on their own. Table 3.6 shows that 339 or 86.9 per cent of the respondents cited "own capital" as one of their initial sources of capital. Other important sources of initial capital were the family, the commercial banks, relatives and friends. More si gni fi cantly, 63.1 per cent of the respondents said that their own capital was the most important source of capital. Since most SMBs had to raise the initial capital on their own, the amount which they could raise was quite limited. Consequently, they generally did not have enough capital to start with. A cross-tabulation analysis shows that a relatively large proportion of SMBs employing less than ten workers each had to rely mostly on their own capital initially compared with larger SMBs. Other SMBs which had to do likewise are Malay SMBs and those established before 1970. Even after their enterprises have been established, SMBs find it diffi cu 1t to borrow money to supp 1ement their
Malaysia 83 meagre capital. Thus in the survey, 293 or 75.1 per cent of the respondents said that they did not have enough working capital to run their enterprises. A cross-tabulation analysis shows that SMBs which were short of working capital were mainly those which employed less than ten workers each, owned by Malays, located in the rural areas and were established before 1970. Table 3.7 shows that the majority of SMBs respondents stated that they required an additional working capital of There is not much variation between M$10,000-$500,000. among establishments in terms of race, location and year of establishment except employment size of establishments. SMBs employing ten or more workers generally stated that they require more working capital than those employing less than ten workers. The shortage of working capital in SMBs may be explained by the low level of profit. At the same time, financial management may be lacking. Table 3.8 shows that only 18 or 4. 6 per cent of the respondents have their own full-time accountants. The majority either employ a book-keeper or accounts clerk, or in many other cases use an outside accountant or book-keeper. This arrangement is particularly conmon with the smaller SMBs, SMBs owned by Malays and CrossIndians and SMBs located in the rural areas. tabulation shows that more than 80 per cent of the accounts in SMBs el~Je)loying less than five workers each are prepared Also, a significantly by the entrepreneurs themselves. large proportion of Malay and Indian SMBs follow the same practice while in terms of location, 71.0 per cent of SMB entrepreneurs located in the rural areas prepare the accounts themselves compared with their counterparts in the urban areas. However, a more likely reason for the shortage of operating capital in SMBs is their inability to raise loans externally. Table 3.9 shows that 217 or 55.6 per cent of
Table 3.7: Amount
Additiona l Amount of Working Capital Required ( $)
Less than 1 '000 4,999 1,0009,999 5,000 ,999 49 10,000 50,000 - 99,999 100,000 - 499,999 500,000 - 999,999 1 million or more (Addition al capita 1 not required) Total
Table 3.8:
10 16 90 32 66 16 9 147
1.0 2.6 4.1 23 . 1 8.2 16.9 4. 1 2.3 37. 7
390
100.0
4
Per son Who Prepares Account s
Per so n Own full-time accountan t Own part-t i me acco untant Outside accoun t ant Own book-keepe r Own ac co unt s cl erk Outside book-keeper Outside account s clerk/boo k-keeper Self-prep ared account No accounts kept Total
No .
No. 18 38 48 46 34 10 18 173 5 390
4.6 9. 7 12.3 11.8 8. 7 2. 6 4.6 44.4 1.3 100.0
Malaysia 85 the respondents are able to borrow money from the commercial bank to supplement their operating capital. However, an almost equally large number of respondents said that they have to borrow from their families, relatives or friends for the same purpose. Significantly, nearly 25 per cent of the respondents have to borrow from a finance company. Considering the relatively high rate of interest charged by a finance company, it may be safe to assume that these respondents were unable to borrow from any bank. Among the non-i nsti tuti onal sources of finance whi eh many SMBs resort to, is tontine, an informal mutual credit arrangement among a group of people. Although tontine is a convenient means of raising money, it is operated on mutual trust and does not enjoy the protection of the law. Consequently, the organizers have often absconded with the money (Straits Times, 12 February 1971). Nevertheless, tontine remains a popular way to raise money among SMBs as shown in Table 3.9. Table 3.9:
Source of Loan
Source Colllllerci al bank Finance company MARA MIDF Money-1 ender Family/relative/friend Pawnshop Tontine Other
No.* 217 89 28 21 20 211 16 22 15
* Some respondents gave more than one source. N = 390
55.6 22.8 7.2 5.4 5.1 54.1 4.1 5.6 3.8
86
Chee Peng Lim
A cross-tabulation analysis shows that there is a direct relationship between employment size of SMBs and the The analysis proportion of 1oans from commercial banks. also shows an inverse relationship between employment size of SMBs and the proportion of loan from non-bank sources. For example, 47.3 per cent of SMBs employing less than five workers each said that they borrowed from relatives, families or friends while only 22.5 per cent of SMBs employing 20 or more workers had to borrow from that source. In terms of ethnic groups, Mal ay and Chinese SMBs had almost equal access to bank loans. Although Malay SMBs in the survey sample are generally smaller than their Chinese counterparts co11111ercial banks tend to favour Malay participants in line with the Centra 1 Bank •s 1ending guide-line (see section on financial assistance programmes above). Furthermore, wellestablished SMBs, especially those established between 1965-79, have relatively better access to bank loans compared to those established in more recent years. In terms of location, urban SMBs generally have better access to the organized money market with the exception of MARA loans. Table 3.10:
Value of Bank Loans (M$)
Value of Bank Loan ($)
No.
%
Less than 1,000 1,000 4,999 5,000 9,999 10,000 - 49,999 50,000 - 99,999 100,000 - 499,999 500,000 - 999,999 1,000,000 and above Nil/not stated
2 3 12 80 40 58 17 13 165
0.5 0.8 3.1 20.5 10.3 14.9 4.4 3.3 42.3
390
100.0
Total
Malaysia 87 Table 3.10 shows that most of the respondents who borrowed from a commercial bank generally borrowed between M$10,000 to M$500,000. Some 45.6 per cent of the respondents said that the va 1ue of their 1oans were within this range A cross-tabulation analysis shows that there is not much variation except that SMBs employing 20 or more workers each borrow more money from the banks than SMBs emp 1oyi ng In addition, there are more Chi nese-owned fewer workers. SMBs borrowing M$100,000-$499,999 from the banks compared to Malay-owned SMBs which generally had loans of between M$10,000-M$49,999. Thus although as seen earlier Malay and Chinese-owned SMBs had almost equal access to bank loans, the latter received more loans from the banks in terms of value. Only 15.1 per cent of the respondents said that they were able to borrow under the GGS while another 11.8 per cent said that their 1oans came under the SLS. Cl early, only a small proportion of respondents were able to obtain a bank 1oan at a concessionary rate of interest. A crosstabulation analysis shows that larger SMBs employing ten or more workers each have better access to concessionary loans compared to smaller SMB employing less than ten workers each. In terms of ethnic groups, Chinese-owned SMBs have a marginal edge over Malay-owned SMBs in getting GGS loans while the latter have a significant edge in getting SLS There is no si gni fi cant variation in the other 1oans. variables. The respondents who have no bank 1oan may be divided into two groups. The first group does not want to borrow from a bank for various reasons: their capital is adequate; they are not interested; a bank loan is too expensive. According to some respondents, a bank 1oan is not as cheap as it appears because some bank managers insist on the payment of an "under-the-counter" sum of money of around 5 per cent of the loan before approving the application.
88 Chee Peng Lim Another interesting reason given came from some conservative Muslim SMB entrepreneurs. They refuse to borrow from the banks because the payment of interest is prohibited under Islamic laws (riba). Other respondents complain that bank officers are very arrogant and tend to 1ook down on SMB entrepreneurs. Generally, however, most SMBs belong to the second group, who would like a bank loan as shown in Table 3.11. In fact, the majority of SMB respondents in the survey would like to borrow from a bank but have not tried or have tried and failed. The former did not try for various reasons: they think they would be unsuccessful; they do not know how to apply for a bank loan; they think that they need to know certain people if they want a bank loan. A larger group of respondents had tried to obtain a bank loan but failed because the banks required collateral, guarantors and a background paper, or at least one of the above requirements which they were unable to fulfil (Table 3.11). Table 3.11:
Reasons for not Borrowing from a Bank
Reasons Not interested Too expensive Cannot get a bank 1oan Don't know how to apply Don't know people No collateral No guarantor Background paper required Other
No.* 37 14 35 9 3 64 12 13 69
*Some respondents gave more than one answer. N = 390
%
9.5 3.6 9.5 2.3 0.8 16.4 3.1 3.3 17.7
89
Malaysia
A cross-tabulation analysis shows that the majority of SMBs who said that they did not require a bank 1 oan were mainly
employed less than five
located in an urban area;
workers each and were either established before 1957 or in Among those who would like a loan but had
1980 or later.
ignorance of the procedure in applying for a
not applied,
loan appeared to be the most common reason given by SMBs in the
rural
SMBs owned by Malays and SMBs employing
areas,
Among SMBs who had tried to
1ess than ten workers each.
apply but failed to get a bank loan, the lack of collateral or guarantor was frequently cited by Chi nese-owned SMBs or These SMBs were
SMBs e"lJloying less than ten workers each.
also the ones who generally complained that a bank loan was too expensive. Borrowing from Non-Bank Sources Respondents who borrowed from sources other than a bank were Table 3.12 shows
asked why they borrowed from such sources. that
the
borrow
from
it
found
majority
non-bank
ea s ier or more convenient
sources.
Others
said
that
to
it was
cheaper and faster to get a loan outside the banking system. They explained that no co llateral was required and the bank loan wa s inadequat e.
In the case of a loan from the family SMBs owned
or a relative, there wa s no interest involved.
by Mal ays preferred t o borrow from MARA or other government agencies (such a s the Mini s try of Youth, Culture and Sports) because the terms for the loan were easier. A cross-tabulation analy s i s did not reveal any signific ant
variation by
size
of
~ M B,
ethnic
location or
gr·oup,
year of establishment. When the
respondent s were
a sk ed how mu c h money
they
would like to borrow from the banks, the majority s aid that they (Table
needed 3.13).
a
loan
of
between
A cross-tabulation
distinct groups of SMBs.
M$10,000 analysis
to
M$500,000
reveals
two
The first group generally requires
Table 3.12:
Reasons for Borrowing from Non-Bank Sources No.*
Reasons Easier/convenient Cheaper Faster Cannot get a bank loan No collateral needed Bank 1oan too little Other
25.9 10.3 8.5 7.7 6.4 2.6 27.4
101 40 33 30 25 10 107
* Some respondents gave more than one answer. N = 390
Table 3.13:
Value of Bank Loan Required (M$)
Value of Loan Required Ni 1 Less than 1,000 4,999 1,000 9,999 5,000 10,000 - 49,999 50,000 - 99,999 100,000 - 499,999 500,000 - 999,999 1,000,000 or more No response Total
No. 37 1 8 16 101 82 92 17 23 13
9.5 0.3 2.1 4.1 25.9 21.0 23.6 4.4 5.9 3.3
390
100.0
Malaysia 91 a small bank 1oan of between M$10, 000-M$49, 999 each and comprise mainly SMBs employing less than ten workers each, Malay-owned SMBs and SMBs located in the rural areas. The second group requires a 1arger bank 1oan of between M$100,000-$499,999 each and comprise mainly SMBs eiJllloying 20 or more workers each, Chinese-owned SMBs and SMBs located in an urban area. Interest Rate Except for concessionary loans under the GGS or SLS, SMBs generally had to pay an interest rate of around 12-15 per cent per annum on their bank loans (about 2-5 per cent over Most respondents felt that the the base 1ending rate). interest rate was too high. When they were asked the maximum interest rate which they were willing to pay for a bank loan, most the respondents said they were only willing to pay a maximum interest rate of between 10 to 12 per cent per annum (Table 3.14).
Table 3.14:
Maximum Interest Rate Willing to Pay
Interest Rate p.a. (%)
No.*
Less than 5 6 7 8 9 10 - 12 13 - 15 16 and above No response
76 17 30 40 44 112 35 4
19.5 4.4 7.7 10.3 11.3 28.7 9.0 1.1
92 Chee Peng Lim A cross-tabulation analysis shows no significant variation in the maximum interest rate among SMBs in tenns of location and ethnic group. However, in terms of year of establishment and employment size, most SMBs established before 1957 and those employing less than five workers each stated that they were only prepared to pay a maxfmum interest rate of less than 6 per cent. Apparently the older established firms have still to get over the low interest rates of the 1960s while the smaller SMBs may not be able to afford to pay an interest of even 6 per cent per annum. Trade Credit In view of the shortage of capital and inadequate access to institutional credit, trade credit is an important source of working capital for many SMBs. For example, with credit from hardware shops and sawmills, a small furniture manufacturer can tender for a job worth M$10,000 even if his capital is on M$5,000. This is possible since wood and other inputs from the creditors form about 50 per cent of the total cost with labour as the main component. However, the credit obtained by an SMB for its purchases is to some extent offset by the credit it has to provide to its customers on goods sold. Nearly 87 per cent of SMBs in the sample survey rely on trade credit for their purchases. Many of these SMBs bought between M$1,000 - $24,999 worth of goods on credit every month. Table 3.15 shows that credit purchases accounting for more than 50 per cent of total purchases were made by more than half the sample respondents. A cross-tabulation analysis shows that SMBs which r~lied more on credit purchases were generally those which were established in 1974 or earlier, those located in the urban area and SMBs employing ten or more workers each. These SMBs generally bought 75 per cent or more of their purchases on credit. SMBs established in 1975 or later, SMBs located in the rural areas and
Mal ays 1a 93 SMBs e~loying less than five workers each bought ten per In terms of cent or less of their purchases on credit. ethnic group, Chinese-owned SMBs tended to make their purchases on credit compared to Malay-owned SMBs. Table 3.15:
Percentage on Credit (%)
Percentage
No.
Nil /no response Less than lOt, 10 - 24 25 - 49 50 - 74 75 - 99 100
62 61
Total
58 61 79 27
15.9 15.6 10.8 14.9 15.6 20.3 6.9
390
100.0
42
An almost equal number of SMBs which bought on credit also sold on credit, and the value of monthly sales on credit was similar to the value of monthly purchases on credit. Table 3.16 shows that credit sales accounting for more than 50 per cent of total sales were made by more than half the A cross-tabula tion analysis reveals a sa~le respondents. pattern similar to that for purchases on credit. As in the case of trade credit obtained, the length of credit provided is generally between 3 to 4 months. Despite the length of time granted on credit sales, actual payment often takes place after the stated time period. Thus the practice of credit sales not only impinges on the competitive ability of small producers by denying them capital
94 Chee Peng Lim resources with which to increase growth and productivity but also drains them of their scarce working resources. Table 3.16: Per cent
Percentage on Credit Sales
('t)
Nil Less than 10 10 - 24 25 - 49 50 - 74 75 - 99 lOO and over Total
No. 50 44 56 60 60 87 33
12.8 11.3 14.4 15.4 15.4 22.3 8.5
390
100.0
The effective cost of trade credit is difficult to estimate but could be anywhere between 20-35 per cent. The cost varies with industry and the length of credit provided. In the batik-making industry for exaflllle, the price of an item sold on credit is fixed at cost times one and a half on a two-month credit sale and at cost times two on a threemonth credit sale. Trade Debt A consequence of pro vi di ng credit is the accumulation of trade debt. Respondents were asked to estimate the amount of trade debt overdue and not yet repaid by their customers. More than 60 per cent of the samp 1e have trade debts whi eh are overdue by one year or more. In all cases, most of the The relatively debts range from M$5,000-$50,000 each.
Malaysia 95 1arge proportion of trade debt overdue may be a result of
the prolonged recession which has affected all enterprises particularly SMBs which are more vulnerable because of their inadequate operating capital. We asked the respondents who had trade debt overdue what action, if any, they had taken to recover their bad debts. A majority said that they did not take any action for various reasons. They preferred to regard trade debt as a normal part of business and maintain good relations with the debtors who after all, are also their customers. Hire Purchase and Leasing Hire purchase is an important means of enabling financially hard-pressed SMBs to purchase urgently needed machinery and equipment for their p1ants. Hi re purchase overcomes the collateral constraint. Hire purchase facility is quite widespread in Malaysia and the main providers of this facility are the finance companies and MIDF. However, the facility is generally restricted to certain types of new machinery and equipment. In addition to hire purchase, SMBs which are short of funds can also lease machinery and equipment from various leasing companies which were established in recent years. Leasing offers SMBs several advantages. The lessee does not have to offer any collateral and he can claim tax deduction from the rental. More than 55 per cent of the sample respondents bought their machinery on hi re-purchase. Transport equipment is another item commonly bought on hire purchase. The amount of machinery and equipment bought on hire purchase generally varies between M$10,000-$500,000. The same value applies to machinery and equipment on lease. Evaluation Inspite of a relatively well-developed financial system and
96
Chee Peng Lim
wide variety of financial assistance programmes it appears that SMBs in Malaysia still suffer from a shortage of working capita 1 • This finding is quite apparent from the discussion of the financial system and programmes as well as the survey results. There are three main reasons for the lack of working problems in obtaining loans and other types of capital: credit facilities from commercial banks and other financial i nsti tuti ons; pressure to extend credit to customers and problems of collecting trade debts; and the shortage of internal funds arising from a low level of profit. It is possible that chronic shortages of working capital may be symptomatic of poor production planning or other serious management deficiencies. Some experts on SMBs are not sure whether the shortfall In the in bank credit is a serious problem in Malaysia. absence of comprehensive data it is not easy to resolve this question. However, from the sample survey, it appears that the shortfall is quite significant. Several indicators may be used to support the survey findings. Firstly, consider the number of SMBs receiving bank 1oans compared to those with no access to such loans. Figures relating to the total number of SMBs receiving bank credit are not available. However, most of the loans to such firms in Malaysia are given out under CGCs Special Loan Scheme (SLS) or General Guarantee Scheme (GGS). In 1983, there were 10,563 borrowers under both schemes (CGC 1983, p. 5). The borrowers include When we consider that SMBs in the agricultural sector. there are more than 162,440 SMBs in the non-agricultural sector alone,15 it is clear that only a small fraction (less than 7 per cent) of SMBs have access to bank loans. The percentage is even smaller for the manufacturing sector because most of CGC loans go to the commercial and trading sector (80 per cent). Secondly, consider 'the value of bank 1oans given out
Malaysia 97 under the CGC schemes. In 1983, loans approved for guarantee by CGC amounted to only M$298.3 million. In the same year, total credit extended by commercial banks in Malaysia amounted to M$36,782 million (Bank Negara Malaysia, 1983). Thus CGC loans formed only 0.8 per cent of total bank loans. Next, consider the relative i~ortance of SMBs in the Malaysian economy. The small number of SMBs receiving bank loans and the low value of such loans received would not be surprising if SMBs constitutes only a small sector in the economy. But this is certainly not the case. As we have seen earlier, SMBs constitute around 98 per cent of all establishments in 1978 and contributed 36 per cent of total value added (Table 3.1). Even if we assume that only 10 per cent of SMBs need a bank 1oan and qualify for it, there should be at least 16,200 SMBs receiving a CGC loan. But as we have seen the number recorded by CGC in 1983 is only 10,563 or 65 per cent the required number. Similarly if we assume that the share of SMBs in the total value of bank loans should be proportional to their contribution to value added, SMBs should receive at least 36 per cent of the total value of bank However, as noted loans in 1983 or M$13,241.5 million. earlier, the share of SMBs amounted to only M$298.3 million or a shortfall of nearly M$13,000 million. Finally, if one is still not convinced that there is a shortfall in SMB financing, one only has to look at the alternative sources of finance which many SMBs have resorted to. These include finance companies, pawn shop_s , moneylenders, supplier credit and tontine. All these alternative sources of finance are more costly than bank credit so they would not normally be used unless access to bank credit were restricted (Chee 1975, chapter VII; Wells 1980). Unfortunately no data is available on the amount of credit However, we have some extende~ by the extra-bank market. In 1983, finance companies data from finance companies.
98
Chee Peng Lim
lent a total of M$1,420.5 million (or 19.1 per cent of total credH) to SMBs (Bank Negara Mal~sia, 1983). These loans were given out at an interest rate of at least 7 per cent above that charged on a CGC loan. Once again it would be reasonable to assume that SMBs would turn to finance companies only if they had been turned down by commercial banks. Suggestions Fiscal Incentives and Facilities SMBs play a critical role in the socio-economic development of Malaysia and have the potential for efficient growth. Unfortunately government policies in general and fiscal and financial policies in particular have not provided a neutral regime with respect to SMBs and their large-scale enterprise. As the section on fiscal incentives shows, fiscal and other incentives tend to benefit larger firms more than SMBs. There is a need to review the existing fiscal incentive system and various types of infrastructural facilities to ensure that the prevailing regime is neutral in its ifl1)act on SMBs. More specifically, consideration should be given to: 0
removing the lower limit (50 employees) under the labour utilization relief (LUR) or, if it is not possible then for reasons of neutrality the relief may be withdrawn from larger enterprises;
0
streamlining the administrative procedures for the application of the death duties on small, individually owned businesses;
0
exploring the possibilities of graduated company tax for SMBs; and
0
allocating a minirrum amount of space in industrial estates for SMBs.
Malaysia 99 Financial Assistance With respect to financial policy and assistance, there is no doubt that the government has made a determined effort to help SMBs by introducing various loan programmes such as the SLS. Nevertheless, SMBs are still unable to enjoy adequate access to institutional, and particularly, bank credit. Several suggestions have been made for improving access to bank credit. One suggestion made by some local bankers is for commercial banks in Malaysia to set up a new lending institution to cater exclusively to the needs of SMBs. The advantage is that such an institution would be able to develop a corps of bank officers specializing in the field of SMBs. A corps of SMB loan officers in the commercial banks can also play a key liaison role between SMBs and agencies We propose that, providing non-financial assistance. instead of establishing a new institution it might be better to expand the role of the CGC. A new lending institution is not necessary because commercial banks are the most effective channels for providing financial assistance to SMBs. These banks have the branch network, the local contacts and information, the continuing relationship with clients and the concern for financial discipline tempered by the potential for flexibility that SMBs need in the crucial stages. On this premise we would like to make the following suggestions. Firstly, the Central Bank should give commercial banks an incentive to lend to SMBs. This could be done through changes in interest rates, in service charges, in tax incentives or even subsidies. At the same time, the Central Bank should encourage commercial banks to be more developmentoriented and give less emphasis to conventional collateral and more to project merits and potentia 1 cash flow. Banks should be encouraged to ensure that credit is available to at least 20 per cent of all SMBs in the manufacturing secFurthe-rmore, in order to ensure equity, the quota tor.
lOO
Chee Peng Lim
should be distributed in proportion to the number of SMBs. Secondly, an alternative would be to encourage a small but select number of financial
institutions to develop a
1ong-term interest in SMB 1ending and derive benefits from economies of scale.
At the moment some banks are moving
ahead rapidly in this area, and the experience of Malayan Banking Berhad and Bank
Bumi putra
should be studied for
guidelines. Thirdly, interest rate discount now offered to small borrowers
should
not
be
further widened,
and
general move up or down as market rates do.
should in The "cheap
loans for SMBs" policy which the Central Bank had adopted has many disadvantages:
(a)
discounted 1 oans attract not
only the desired beneficiaries,
but also borrowers whose
businesses are already viable on market terms, and borrowers who remain continuously dependent on the loan subsidies. Reducing interest rates further will increase excess demand for credit but have 1i ttl e effect in moving SMBs towards co11111ercial viability; (b) cheap loans discourage SMBs from mobilizing other sources of capital, including their own; (c)
a cheap loan policy makes it difficult for marginal
lenders, like pawnshops to remain in operation.
A reduction
in the number of pawnshops will mean reduced accessibility to outside financing for SMBs since pawnshops constitute an important source of non-bank credit for many small enterprises, especially the smaller ones. Fourthly,
apart
problem of collateral
from
unrealistic
interest rates
the
is another factor which reduces the
accessibility of SMBs to institutional credit.
According to
several small firms, the obstacles to the accessibility of bank credit were document and paper requirements, and collateral deficiency. Thus many small firms which applied for bank loans mentioned diffi cu lti es in obtaining such 1oans because of these factors . Si nee collateral
remains a problem some arrangements
Malaysia 101 should be made to allow machinery to be used as collateral, as is the case in Thailand. Finally, the government should allow certain designated financial institutions to take on the role of "venture capitalists".16 A venture capital or an equity-related investment made by a designated financial institution in a growth-oriented SMB would enable the investor to accomplish its corporate objectives in return for a minority shareholding in the small firm. If the conceptual basis for such a scheme is acceptable, then the details could be worked out, including relevant amendments to the Banking Act. The acceptance of the venture capita 1 scheme wi 11 enhance the development function of financial i nsti tuti ons. This is because the extension of credit is essential but not crucial to the success of SMBs. More important is management expertise. An advisory role by financial institutions would not have the commitment to a small firm as one that had invested in the venture.
Notes 1.
There Is no formal definition of SMBs In Malaysia and each government agency
has
Generally,
formulated however,
Jt
Its
own
Is agreed
definition that an
for
Its
SMB employs
own
purpose.
less than 50
workers and has fixed assets valued at less than M$500,000.
This Is
the definition adopted In this paper. The
dollar
refers
US$0.43, or US$1.00 2.
to
the
MB Jayslan
rlngglt
end
Is
epproxlmately
= M$2.30.
For further details of the New Economic Policy, see MBiaysle (1971), pp. 3-6.
3.
These are the latest date available.
4.
Date from the 1973 Census of Manufacturing Industries gives a breakdown of manufacturing SMBs by Industry.
Similar data from more recent
censuses are not evallable. 5.
For detells of tlie lndustrallzatlon policy see Chee (198~.
102 Chee Peng Lim 6.
Previous to the First l'elaysla Plan (1966-70) there were two other five-year plans known as the First l'elaya· Plan (1956-60) and Second l'elaya Plan (1961-65).
7.
Bumlputera are the Indigenous ethnic groups of l'elaysla and Include l'elays, Kadazans, lbans, among others.
a.
Normally companies In l'elaysla are subject to 40 per cent company tax, 5 per cent development tax and 5 per cent excess profits tax.
9.
For details of these and, eerller mentioned Incentives see Melaysla ( 1984).
10.
These are the latest published data available.
Thus In 1974 (the
latest year tor which data on pioneer status firms Is available) only 27 per cent of the tota I number of esta b 11 shments had gross annua I sales exceeding MSI mll lion while 76 per cent of pioneer status groups were
In that size group.
eMployment size. 11.
The same tendency Is seen In terms of
See Chee (1975), pp. 58-62.
Thus, comparison of pioneer status versus all other firms shows that pioneer status Incentives go mainly to large firms, whether In terms of Investment size, gross sales, or employment.
12.
Rent seeking activities Include lobbying tor Import licences and tor tariff protection adjustments, or exemptions.
13.
SMBs having annual sales turnover not exceeding MSIOO,OOO or receiving workmanship charges not exceeding M$20,000 per year are exempted from the sales tax.
14.
However, some economists would argue that direct taxation of profits affects SMBs more severely than large because SMBs, particularly new ones without a profit record, have only limited access to the capital market and must therefore rely mainly on retained earnings as a source of development capital.
15.
This Is an estimate of the present number of SMBs In l'elaysla based on an average growth rate of 8 per cent between 1978-83.
16.
This suggestion was made by the Chairman of the Association of Banks In l'elaysla, Tan Sri Kamarul Arlttln (l'elay Mall, 26 August 1981).
Malaysia 103 References Benk
Annual Report.
Neg~r~ Mel~ysl~.
Benk Pembangunan
(BPM).
Mel~ysl~
Lumpur
Ku~l~
Report.
Annu~l
Issues>.
(v~rlous Kuel~
Lumpur (verlous
Issues>. "The Role of Smell
Ghee Peng Llm.
Ph.D. dlssertetlon, University of
Industry In the Mel~ye,
Economy".
Mel~yslen
1975.
"Changes In the Me leyslen Economy end Trede Trends end Prospects". Peper presented et lnternetlonel Conference on the Global Implications
Smell
•
Industry
by
1984 •
Problems end Policies.
Berlte Publlcetlons, 1985.
Lumpur:
Kuel~
Lumpur,
Kual~
Profile,
Meleysle:
In
organized
Asle,
Southeest
Reseerch,
Economic
of
Bureeu
Netlonal
end
Eest
of
Patterns
Trede
the
of
et. el. (1979), A Study of Smel I Entrepreneurs In
Development Programmes
University of
Lumpur:
Kuale
Maleysta.
Entrepreneurlel
~nd
Maleya Press, 1979. Annuel Report.
Credit Guerantee Corporetlon. "Protection,
C.B.
Edwards,
In
lndustrlellzetlon
Profits
end
Kuale Lumpur, 1983. Analysts
An
Policy:
University of
Ph.D. dlssertetlon,
Melaysle".
of
Eest Anglle, 1975. First
Meleysle.
Mel~yste
Plen,
1966-1970.
Kuel~
Lumpur:
Government
1971-1975.
Kue I e
Lumpur:
Government
PrInter, 1966. Second
•
Maleysle
Pl~n,
Printer, 1971 • •
Third Meleysle
Pl~n,
1976-1980.
Kuel~
Government Printer,
Lumpur:
1976. 1981-1985.
Mid-Term Review of the Fourth Meleyste Plen,
•
Lumpur:
Government Printer,
198~.
Economic Report 1984/1985.
•
Kuale
Ministry of Finance,
Kuale Lumpur:
1984.£_• •
Fifth Maleysle
Pl~n,
1986-1990.
Kuele Lumpur:
Government Printer,
1986. Meleyslen lndustrlel Development Authority (MIDA>.
Annuel Report.
Kuel~
Lumpur, 1979. Ma leyslen Ku~
lndustrle I
Development Flnence Berhad
le Lumpur·, 1983.
(MIDF>.
An nu~ I Report.
Chee Peng Lim
104
Teh Kok Pang. Malaysia
"Protection, Fiscal since
1957",
Incentives and Industrialization In West
Faculty
of
Economics
and
Administration,
University o f Malaya, 1977. Wells,
R.J.G.
Paper No.
"The 1.
Informal
Rural
Credit Market
Mlmeographed , Faculty o f
University of Malaya, 1980 .
In
Malaysia".
Working
Economi c s and Administration.,
IV FINANCIAL FACTORS AND SMALL AND MEDIUM ENTERPRISE DEVELOPMENT IN THE PHILIPPINES*
Melito S. Sa lazar, Jr. et al.
Introduction Scope and Limitations of the Study This study presents a profile of 230 small and medium enterprises which fall within the employment size of 5 to 99 workers. These are classified according to the Philippines Standard Classification Code (PSC C) of the National Census and Statistics Office (NCSO) on a two-digit level: Code 31 32 33 34 35 36 38
•
Industry Classification Food processing Wearing apparel Wood and wood products Paper and paper products, printing and publishing Chemicals Non-metallic minerals Fabri cated metals
ThIs study was prep& red by o t811m composed o t lola I I to SI! I o zor, Jr ., Project Director and Consultant ; Blenvenld o Aragon , Projec t C on~ ultant; Jalme S. Ulrdlze>bai-Oad o and Noeml ~Mger ; Edltha Reyes, Project Guangzon, Jr., Project Associates; Ttleo dosla Vlnueza, Lerma LapullloCanlas and Esmeralda Baustlsta, Project Assistant s; and Pas O le> z , edit o r.
106 Melito S. Salazar Jr. et al.
The study is limited to the small and medium enterprise sector of four regions in the Philippines: the National Capital Region (NCR), Central Luzon (Region III), Southern Luzon (Region IV) and Central Visayas (Region VII). The experiences of the entrepreneurs surveyed will be limited to these regions. There is also a limitation as to the number of financial institutions surveyed: the fifteen chosen institutions were the most accessible and the ones still offering financial packages to SMEs at the time of the survey (May to October 1984). Methodo1ogy (1) The Population and the Sample Under Study Based on 1978 NCSO data, the projection of the total population of SMEs in the Philippines in 1982 is 31,126 units (UP-ISSI 1983, p. 14). These units were found to be preponderant in four regions: the National Capital Region (NCR), and Regions Ill, IV, and VII, with about 64 per cent of the entire population of SME s in these regions; hence, the sample population was drawn only from these regions. (2)
Data Gathering a. Primary Data Questionnaire-guided interviews were used for primary data gathering. The sample of SMEs gave primary data on: profi 1e of the firm; firm's sources of financing; business loan data; management of working capital; incentives availment by the firms; views and comments on fiscal incentives; and financial assistance packages. As for the financial institutions, primary data collected were on the start of: SME lending operations; source of funds; pre-loan assistance; service offered; project selection · criteria; loan amount; current
Table 4.1:
Targeted and Actual Respondents
Industry Classification Food processing Wearing apparel Wood and wood products Paper and paper products, printing and publishing Chemicals Non-metallic minerals Fabricated metals Total
Ill
IV
NCR
VII
Total
Target Actual
Target Actual
Target Actual
Target Actual
Target Actual
6 34 3
18 33 15
16 24 20
7
7
8
8
7
7
-
8 15
7
2
2
11
21 8
22 8
6 36 3
-
-
-
4 4
3 4
2 2 3
1 5
-
-
29
44
44
52
49
118
7
-
7
-
36
38 98 33
88
9 13 5 41 230
-
-
24
1 8
1 8
10 17 9 44
102
33
33
249
38
108 Melito S. Sal azar, Jr. et al.
interest rate; collateral requirements; lead time from loan application to approval; lead time from loan approval to release; mode of loan releases; status of loan application rejected; reasons for rejection; post 1oan acti vi ties; sunmary of views and conments on SME financing. b. Secondary Data Secondary data was gathered from statistics supplied by the Central Bank, the National Census and Statistics Office (NCSO), Bureau of Small and . Medium Industries (BSMI), Development Bank of the Philippines (DBP), provincial and municipal development offices, Private Development Corporation of the Phi 1i ppi nes (PDCP) and the Center for Research and Communication Economic Forecasting Unit. In cases where 1984 stati sties were not available, 1982-83 figures were used. Reference materials provided a profi 1e of small and medium enterprises; factors affecting the growth opportunities of SMEs; review of fiscal incentives and financing schemes or progranmes for the SME sector; analysis of past 1oan avai 1ments; and the economy's performance in 1985 vis-a-vis SMEs. (3)
Treatments Used The 1i near regression method was used to project the SME sector's financing requirements for the future. Figures were computed from historical data (1974 to 1984) on the actual number of loan availments and proportionate distribution of actual loan availments of SMEs surveyed.
Definition of Terms (1) Types of Industries "(UP-ISSI, 1983, p. 1)
Philippines a.
Small-Scale
Industries
(SSI)
-
109
are manufacturin g
and/or industrial service enterprises in which the owner-manage rs are not actively engaged in production but perform the varied range of tasks involved in guidance and leadership without the help of speEach of these enterprises has cialized staff. total assets of P250,000 but not exceeding P2.5 million and has an employment size ranging from 5 to 99 workers. b.
Medium-Sc ale
(MSI)
are
manufacturin g
and / or
servi ce enterprises whi ch usually have specialized staff in their line management organizational structure, make products with a higher
industrial
degree of ma chi ne technology as compared to smallscale i ndu stries, and are subjec t to factory or Each of such plant organization and co ntrol. enterprises has total assets of P2.5 million but not exceeding P10 million and employs from 100 to 199 workers. (2)
Sources of Borrowed Fund s a. Formal source s - refers
to
institutions or cor-
porate bodies wh ich provide financial and / or nonfinancial services in accordan ce with fixed rules and procedures.
The se can be government or private
bodies. b.
to private individuals that provide finan ci al as s istance not according to the fixed rules and proce dures of formal sources. Informal sources usually transact deals on a c ase Informal
source s -
refers
to case basis and have fewer requirements . (3)
Financial Institutions For purposes of the study, this will refer to financial
110 Melito
s.
Salazar, Jr. et al.
institutions which offer financing assftance to SMEs. (4)
SME Financing Programme It involves financial (loans) and non-financial (marketing, technical, management supervision) assistance.
(5)
Duration of Loans a. Short term: refers to loans payable in one year or less. b. Long term: refers to loans payable over more than a year.
(6)
Type of Projects a. Existing Operations - refers to enterprises which manufacture existing products or offer existing services to an existing market. b. Expansion/Diversification - refers to enterprises whi eh manufacture an exi sting product or offer an existing service to an existing market but which intend to develop new products for an existing market or offer exist i ng products to a new market. c. New projects - for an existing operation, the enterprise intends to deve 1op ano the r product for an existing or new market that is entirely different in terms of industry classficati on from the existing product. New projects also refer to enterprises that will be set up by a potential or new entrepreneur.
Abbreviation BOI CB CSMI DBP IBRD
and Acronyms Board of Investments Central Bank Commission on Small and Medium Industries Development Bank of the Philippines Industrial Bank for Rural Development
Philippines 111 IGLF MOF MTI NACIDA SMEs
sss
TUSS TRC USAID WB IGF EIMP
- Industrial Guarantee Loan Fund - Ministry of Finance - Ministry of Trade and Industry - National Cottage Industry and Development Authority - Small and Medium Enterprises - Social Security System - Technological Utilization Support System - Technology Resource Centre - United States Agency for International Development - World Bank - Industrial Guarantee Fund - Export Industry Modernization Programme
Small and Medium Enterprise Sector Overview A large segment of the population of the Philippines, about 70 per cent (NEDA 1981), live in the rural areas and still do not sufficiently enjoy the basic needs of life such as food, clothing and shelter despite the country •s economic achievements in the past years. Compounding this predicament is the marked shortage of employment opportunities for the annual 750,000 labour entrants all over the county (ILO 1974, p. 7). In organ1z1ng economic activities for the above targets, the most gainful grouping of resources has been found to be at the 1evel of sma 11 and medi urn enterprises. By its very unique characteristics this sector of the economy can achieve the mobilization of the rural labour force, the dispersal of industries in the regions, and the utilization of indigenous raw materials . These accomplishments are considered essential to economic development in a country like the Philippines. The Ranis Mission sent to the Philippines in 1972 under
s.
112
Melito
the
auspices
Salazar, Jr. et al. of
the
International
Labour
Organization
recognized the tremendous potential of small and medium sector in the country's pursuit of economic self-sufficiency. The years following the Ranis Mission saw the Philippine Government taking more organized steps in deve 1opi ng and assisting the SME sector. In 1974, a co-ordinating and policy-making body was mandated to develop and execute a comprehensive national prograrrme for SME assistance. This was the Co1T1Tlission on Small and Medium Industries (CSMI) which originally had twelve members, one of which was the Institute
of
Philippines
Small-Scale (UP-ISSI).
Industries, Between
1974
University and
1978,
of
the
~ction
progra1T1Tles, especi a 11 y a 1ong fi nanci a1 1i nes, were put at the service of SMEs. In the same period, the private sector began recognizing the market of SME borrowers and as a result, organized loan assistance schemes for this sector became available from more sources . As the Ministry of Trade and Industry (MTI) grew i n f unction and scope, most of the original responsibilities of the CSMI were transferred to the MTI.
In 1981, the CSMI was dissolved and the co-
ordinating and policy-making functions for SME development were taken over by the MT I. At present, the SME sector is being assisted mainly by the Central Bank -- Industrial Guarantee Loan Fund (CB-IGLF), the DBP,
and
private
lending sources
for its financial
needs; technical and marketing assistance is provided by the MTI through specific bureaus and action programmes . The SME Sector at Present The growth of the sector is des cri bed in detai 1 in the UP-ISSI monograph Small and Medium Industries in the Philippines: An Overview which was published in 1980 and revised in 1983. From the 1975 count of 18,597 establishments the sector grew to 31,126 es tab 1i shments in 1982, approximately 98.1 per cent of the organized manufacturing
Philippines 113 sector then. The sector employed 49.9 per cent (410,261) of the total number of workers in the manufacturing sector and contributed a total of P20.092 million in value added or 28.8 per cent of the total organized industry sector of the country. The need for more investment and financing continues to be expressed by the SME sector. SMEs still consider financial problems their main difficulty in keeping their enterprises going. Scarcity of capital and other investment needs are mentioned as their greatest preoccupation. However, the lending sector shows an abundant source of credit for SMEs. Although facilities, at present, seem to be on a decline, the CB-IGLF alone claims the existence of P1.953 billion for SME sector lending. Profile of the SME (1) Age of Firms Fifty-six per 1975 to 1984. to 29 years existence for Table 4.2:
Sector Studied cent of the sample was established within The other 37 per cent was set up from 10 ago, while the last 7 per cent was in the past 30 years or more.
Age of Firms
IV
Ill No.
s
4
a.o
10-29 years
16
36.0
9 years or less
24
55.0
Age Range 50 years or more
Tota I
44 100.0
Total
VII
1-CR
s
No.
s
No.
s
No.
s
2.0
6
6.0
5
15
16
7.0
13
25.0
45
44.0
11
33.0
85
37 .o
37
73.0
51
so.o
17
52.0
129
56.0
102 100.0
33
100.0
No.
51 100.0
230 100.0
114 Melito
s.
Salazar, Jr. et al.
(2) Asset Size The combined tot a1 assets of the samp 1e group during the initial stage of operation amounted to P48.398 mi 11 ion. As of 1983, these combined assets increased approximately more than sixteen times to P805.466 million. The average asset size as of 1983 increased to P3.502 million. The increase in asset size is understandable since the businesses began to flourish after the initial problems were overcome. (3) Employment Size Existing enterprises started off with employment size ranging from one to nine as indicated by 68.7 per cent There were between 10 to 99 of the respondents. workers among 29.1 per cent while lOO workers and more were reported by 12.2 per cent of the units surveyed. At the time of the study, 62.2 per cent had 10-99 workers while 10.9 per cent had 1-9 workers, and only 6.9 per cent had 100 or more workers. A decrease was found in the 1-9 workers category while an increase occurred in the 10-99 workers group. The increase in number of workers is attributed to growth and expansion, a widening of target markets and the general earning power of the industry. Table 4.3:
Initial and Present Employment of Respondent Firms
No. of Emp 1oyees
Initial
1-9 10-99 100 or more
158 67 5
68.7 29.1 2.2
70 144 16
30.4 62.6 7.0
230
100.0
230
100.0
Total
Present
Philippines 115 (4) Sources of Initial Investments From multiple response data, 89.6 per cent of SMEs claimed that their own savings was the source of initial investments. Inheritance from parents was indicated by 16.5 per cent. Formal sources like banks and lending institutions were used by 9.5 per cent, informal lending sources by 12.6 per cent and profits gained from other business undertakings by 1.3 per cent. It is still the tradition to start a small enterprise on one's own savings because of a surplus in one's earnings. Formal sources like banks are generally approached for subsequent investments after the business has been set up.
Table 4.4:
Sources of Financing Subsequent
Sources of Investment/Year* Own Investment Own savings Inheritance Profit re-investment Others Borrowings Formal Sources Informal Sources
*Multiple response
No.
% to
total (230)
Initial No.
% to
total (230)
165 29 203 5
71.2 12.6 98.2 2.1
206 38 3
89.6 16.5 1.3
90 52
39.1 22.6
22 29
9.5 12.6
116
Melito S. Sal azar, Jr. et al.
(5)
Sources of Subsequent Investments Most of the entrepreneurs interviewed still relied on their savings and profits as their sources of finance for their ventures although there was an increase in loan availment from formal and informal sources. From multi p1e response data, 71.2 per cent of tota 1 respondents still relied on their personal savings. Again, 98.2 per cent of the total group used profit reinvestments for present business function. Borrowings from formal and informal sources were used by 61.7 per cent of the SMEs interviewed. Subsequent investments generally occurred within -the past ten years during which financial schemes for SMEs were encouraged and promoted. More SME s at this time have become increasingly aware of various other sources of financing than when they initially invested in their ventures around ten years ago.
(6)
Markets The domestic market was the target of 78 per cent of the firms surveyed. A group of respondents (9 per cent of the total l directed production solely for export. The rest (13 per cent) divided their selling efforts between domestic and export markets at varying degrees.
( 7)
Total Sales Food processing and garment manufacturing units registed the biggest sales contribution with shares equivalent to 31.3 per cent and 21.8 per cent respectively. Fabricated metals garnered 20.3 per cent of sales. Compared to its asset size, the paper and paper products, printing and publishing group had 1ow total sales, 7.1 per cent of all groups being studied. Wood and wood products also registered low sales (12.6 per
Phi 11 ppi nes cent) compared group. (8)
to
the
asset
117
size build-up of the
Industry Profitabilit y The greatest turnover was registered by the food processing group with a turnover ratio of 4.2 coupled by The fabricated an earning power of 168.8 per cent. metals group followed with 1.53 turnover ratio and an The gross profit earning power of 68.85 per cent. rates of food processing and fabricated metals were 40 per cent and 45 per cent respectively . However, wood and wood products and paper and paper products, printing and publishing had negative gross profit rates of -17 per cent and -13 per cent respectively. Their earning power was also negative, -21.5 per cent and -.52 per cent respectively , with a turnover ratio of 1.25 and 0.04 respectively . non-metallic and chemicals apparel, Wearing nti neral s registered gross profit rates of 49 per cent, 38 per cent and and 41 per cent respectively . Wearing apparels had a turnover ratio of 1.24 coupled with an earning power of 60.7 per cent. Chemicals had a turnover ratio of 0.89 with an earning power of 33.82 per cent while non-metallic minerals had a turnover ratio of 0.26 and an earning power of 11.44 per cent.
(9)
Sales Terms A combination of cash and credit terms was employed by 55.2 per cent of the entrepreneur s surveyed, while 20.8 per cent utilized purely cash basis; 15.6 per cent provided credit and 3.2 per cent adopted letters of credit for export terms. Those entrepreneur s who provided credit gave terms equivalent from one week to more than two months. Fifteen days to one month's credit terms were the most
Table 4.5:
Industry Profitability Ratios, 1983 Assets (I 000)
(I 000)
Sales
Cost of Sales 000)
Gross Profit Rate ('.t)
Turnover Ratio
Earning Power*
(
1
('.t)
Food processing Wearing apparel Wood and wood products Paper and paper products, printing and publishing Chemicals Non-metallic minerals Fabricated metals
23,072 54,769 31,291
97,346 67,844 39,174
57,966 34,646 45,924
60 49 (17)
4. 22 1. 24 1.25
168.80 60 . 7 (21. 25)
628,890 23,249 3,081 41' 114
22,118 20,744 810 62,988
24,951 12,807 455 34,963
(13) 38 44 45
0.04 0.89 0.26 1. 53
(00. 52) 33.82 11.44 68.8
Total
805,466
311,024
222,712
*Based on gross profit
Table 4.6: Terms of Sales
Regions Terms
No.
Cash
II
8
18.1
Letter of Credit
-
-
-
Cash/Credit
20
45.4
33
Cash/Credit/ LC
2
4.7
1
100
13
39.4
48
20.8
17.6
18
17.6
1
3.1
36
15.6
-
1
1.2
6
18.2
7
3.2
64.7
63
61.7
11
33.3
127
55.2
2.1
7
6.8
2
6.0
12
5.2
9
Credit
44
12.7
15.6
31.8
51
Total '.t No.
13
8
14
VII
No.
No.
No.
NCR
'.t
'.t
'.t
Total
IV
100
102
100
33
'.t
100
230
100
Table 4.7:
Terms of Raw Material Purchase 1983
1984 Terms*/Year Cash
Ill
IV
NCR
VII
Total
201
37
34
77
25
173
6 1 7
5 1 8 3
3
4 10 39
2 1
-
18 18 50 3
14 16 75 15
3
7
III
IV
NCR
VII
Total
42
35
96
28
1
2 5 16
-
9 12 24 2
1
3
Credit One Two One Two
week weeks month months
-
3 1
Other terms Cash advance * Multiple response.
-
4
19 1
9
9
2
Philippines
121
prevalent. The number of those who could extend credit terms beyond two months was negligible. More entrepreneurs sold their products on cash basis at the time of the stu~ because they claimed the need for constantly having cash on hand for work in progress. (10) Raw Materials Purchase Raw materials were purchased on cash basis by more entrepreneurs in 1984 than in 1983. In fact, a number ( 7) were required to put up cash advances prior to delivery in 1984, something that did not happen in 1983. Also fewer entrepreneurs (89) could purchase raw materials through credit as compared to 120 entrepreneurs who could use credit in 1983. The signs of the time include the unwillingness of suppliers to allow entrepreneurs to buy raw materials on credit. The entrepreneurs however, may have to sell on credit in order to be competitive in the market. They may end up not being able to keep afloat financially because of this. The Financial Management Practices of the SMEs Surveyed The discussions on the financial management practices of the entrepreneurs wi 11 1ead the stu~ to detect whether their financial problems are due to lack of funds or due to other factors like inefficiency of fund and operations management, the lack of appropriate controls or the inappropriate sourcing of funds. The most common financial management practices are the following: (1) Forecasting Cash Requirements Sixty-seven per cent of the SMEs interviewed said that they planned their cash requirements. The rest did not have advance plans for their cash requirements during
122 Melito
2)
(3)
s.
Salazar, Jr. et al.
the year. However, the adequacy of the plans which the SMEs made cannot be determined without relating to the other fi nanci a1 management practices of the entrepreneurs. Maintaining Cash on Hand and in Banks Using multiple re~~onse data, it was learned that 93.5 per cent of the entrepreneurs surveyed maintained cash on hand. When questioned regarding keeping cash in bank accounts, 85.2 per cent answered in the affi rmati ve. In effect, 65 per cent of the firms, had cash that could maintain current operations for less than a month. This implies that firms need constant _£ash replenishments for their daily needs. Sourcing of Funds Majority ( 63.5 per cent) of the entrepreneurs sought funding from formal and informal sources as well as the combination of both sources in addition to their own savings in order to finance their investments. The rest ( 36.5 per cent) did not consider borrowing from any source. There were a number of reasons given by the nonborrowers. The major one claimed by 54.3 per cent of those interviewed was that they had sufficient capital to support the business venture. The next highest reason given by 45.2 per cent was the need for avoidance of debt burden. Almost equivalent percentages (14.3 per cent for each reason) said that their collateral was insufficient and that they were unaware of credit facilities for SMEs. Those that sought funding for short-term loans mainly availed from informal sources (52 per cent) like relatives, money-lenders or friends. The rest of the short-term borrowers availed of loans from formal sources. Private commercial banks were used as a major
b.
Phi 1 f ppi nes
133
competition, high cost and scarcity of material s, and tight credit from suppliers
raw
Low Turn-Out of Projects Lending institutions note that the low turn-out is caused by the high cost of funds or the interest rate structure and numerou s pre-loan requirements prospective qualified even discourage wh ich borrowers. Anothe r rea so n cou ld be the poor promotion of SME finan ci ng especia ll y in the rural areas.
c.
Risk s Invol ved in SME Financing Th possibility of business fai lure among small ntrepr n urs , especi ally those with inadequate knowl dg of the busines s or those engage in new projects, i s relatively high.
d.
Hi gh Admi nistrative Cost s The suppor t services and paper work required in handli ng a 1arg nurro r of small borrowers over a wi d geographical area entai l s high administrative costs in relation to the amount of lending involved. There is also a need for manpower to adequately p rfo rm loan e valuation and projec t sup er vi s ion. with Ba nk R qui rements Institut i on s en ounter problems on non- compliance r uir menu, such as collateral, financial wit re ord and other doc ume nts. Some entrepreneurs do Non- omplian
adequate financial records whil th r s are rel uc tant to give information to th ban about th e business especially once the granted . l a h b n t
ma i nta i
or have
Philippines 123 Table 4.8:
Number of Borrowers 8nd Non-Borrowers by Regions 8nd by Sources
Sources Region
Ill No.
%
IV
No.
%
1'-CR
VII
%
No.
%
No.
Total No. %
Borrowers Forma I
16
36.4
22
I nforma I
8
18.2
11
Combination
4
9.1
Non-Borrowers
16
36.3
Tot81
44 100.0
17
43.1
35
34.3
21.5
17
2.1
9
33.3
41
51 100.0
15
45.5
88
38.3
16.6
6
18.2
42
18.2
8.6
2
6.0
16
6.9
40.6
10
30.3
84
36.5
102 100.0
33 100.0
230 100.0
source of short-term funds. This group was followed by rural banks, government commercial banks, financing companies, the Philippine Export and Foreign Loan Guarantee (PEFLG) and the Cottage Industry Guarantee Loan Fund (CIGLF). Informal sources mainly relatives and friends accounted only for 18 per cent as source of funds of long-term borrowers. Money-lenders were used as sources of 1ong-term funds. Majority of 1ong-term 1oans, 82 per cent were borrowed from formal sources. The DBP, private commercial banks, IGLF and government commercial banks were among the major sources. The others were private development banks, rural banks, financing companies and savings banks. (4) Amounts Applied For Thirty-eight per cent of the short-term 1oans in the P100,00Q and below bracket came from formal sources
124 Melito S. Salazar, Jr. et al. while 62 per cent came from informal sources like friends, relatives or money-lenders. The reverse is true for loans from P100.001 to P2 million of which 82 per cent were borrowed from formal sources. Informal sources were not used at all for that bracket. More long-term loans (76 per cent) in the PlOO,OOO and below bracket were borrowed from informal sources. Again, the reverse was true for the P100,001 to P2 million bracket which was mainly borrowed (90 per cent) from formal sources. Only 10 per cent of this bracket came from informal sources. In P2 million and above bracket, formal sources provided 83 per cent of the loans while informal sources lent only 17 per cent of the long-term loans. (5) Allocation of Borrowed Funds Seventy-three per cent of the short-term loans were used for working capital while 27 per cent was allocated to finance fixed assets. Meanwhile, 44 per cent of the long-term loans went to working capital while 54 per cent was used for fixed assets. The short-term 1oans for fixed assets indicates that some entrepreneurs would have difficulty in raising more funds to pay for the loans which were tied up in 1ong-term uses. Funds used for long-term uses will be recovered over a long period of time. If the loans are rolled over by the entrepreneur for more than a year, he will be spending too much on high interest rates and heavy repayments. (6)
Controls for Daily Operations Funds required for daily operations were obtained through internally generated funds and borrowing. In cases when entrepreneurs were short of cash, they commonly tightened credit (52.3 per cent), maintained
Philippines
125
inventories at a minimum (41 per cent), and delayed payments to supp 1 i ers ( 38.9 per cent). In addition, they raised funds through the use of down payments demanded from customers or assigned their collections to firms which acted as collecting agents. Although accounts receivable can be regarded as additional sources of cash, entrepreneurs did not rely on these because of the time it takes to collect them. Other practices used by entrepreneurs were reducing backlog (21 per cent) and giving discounts or bargain sales (12.3 per cent). However, without careful p1 anni ng, these practices may 1ack co-ordination with the other acti vi ties and may not be effective in the 1 ong run. Another measure used by 21 per cent of the Table 4.9:
Source of Additional Cash
Sources*/ Regions
Ill No. %
No.
Borrowing from banks
5
15.6
5
14.7
19
22.6
3
29.6
37
20.9
Borrowing from relatives
11
34.4
13
33.2
43
51.1
6 20.6
73
41.2
3.1
4
11.7
33
39.2
3
11. 1
41
17.5
2.9
6
7.1
3.7
16
9.0
55.8
41
48.8
19
70.3
91
51.4
12
14.2
2
7.4
14
7.9
Borrowing from friends Borrowing from money-lenders Customer advances
8
25.0
12
37.5
Assignment of rece I va b Ies
* Multiple response.
IV
19
%
i'CR No. %
V11
No.
%
Total No. %
126 Melito S. Salazar, Jr. et al. entrepreneurs is careful monitoring of their bank accounts to ensure that cash will be available daily. Data on controls employed by SMEs were taken from a study on capital ratios and financial ratios of 347 small and medium industries sponsored by IGLF in 1982. The study showed that 43 per cent of the entrepreneurs kept a complete set of accounting books, 18 per cent kept a cash book and a record of accounts receivables and 28 per cent kept either a cash book or a record of accounts receivable. Fiscal Incentives and Financial Assistance for SMEs For the development of the SME sector, a number of policy pronouncements, fi sea 1 incentives and financial as si stance schemes were activated and/ or 1aunched from 1974 onwards. Because of their basic financial requirements, the SMEs were given attention by policy-makers since then. Fiscal incentives were promulgated by law in various forms. Institutional finance was given full support to accelerate the sector's growth. Economic Development Policy Relevant to SMEs The revised 1983-87 plan emphasizes, among other goals, the need to increase employment, to stimulate export-oriented industries in utilizing, indigenous raw materials, and to encourage industrial dispersal to different regions. Under this plan, the promotion of small and medium enterprises is considered a priority for being directly 1inked with the upliftment of the depressed and lagging regions in the country. Fiscal Incentives for SMEs Investment incentives are legislated by government in order to further the policies that aim to strengthen the position of small and medi urn eriterpri ses in the country's economy.
Philippines 127 Through the years, several laws were enacted, promulgating investment incentives. The major ones were the Investment Incentives Act (RA 5186) of 1970. These may be considered as two of the most important steps taken to induce investments in industry. It is important to note, however, that small and medium industries were not given preferential treatment under these laws. Categories of eligible enterprises in these incentive acts are on type (for example, export or domestic producer) rather than scale. Consequently, most of those who availed of the incentives were large enterprises.! However, the smaller than small-scale, or cottage, industries have been enjoying more incentives than the SSis. Cottage industries have for the past ten years been enjoying fiscal incentives through exemption from all taxes, except specific and income taxes by registering with NACIDA. While large industries could readily avail of fiscal incentives from the BO I and the cottage industries from NACIDA incentives, the small and medium industries had to find ways to fit into these two incentive schemes because of the absence of a set of incentives specifically for the sector. Many small enterprises made use of the incentives for cottage industries at the time of the survey. However, effective 15 October 1984, Revenue Circular No. 25-84 withdrew the incentives extended to cottage industries. In January 1981, the Omnibus Investments Code (PD 1989) was passed consolidating the provisions of RA 6135 and PD 1159 as well as the Foreign Business Regulation Act (RS 5455). The code was enacted to integrate the amendments to these laws and to clarify and harmonize their provisions not only for the proper guidance of domestic and foreign investors but also for the efficient and effective implementation of the incentives. This was further amended in April 1983 by the Investment Incentives Policy Act of 1983 (UP 391) .2
128 Melito S. Sal azar, Jr. et al. Financial Assistance Schemes for SMEs (1) Evolution of Formal Sources Government Sources a. During the early 1970s financing schemes formed the bulk of government programmes to promote small and medium industries in the Philippines. Four government loan funds, namely, the Social Security System Fund (SSS), the Development Bank of the Philippines Fund (DBP), the Philippine National Bank Fund (PNB) and the Industrial Guarantee and Loan Fund (IGLF), were made exclusively available for credit to SMEs. In 1970, the Social Security Commission designated the UP-ISSI to assist the SSS in its SME financing programmes under a supervised credit scheme. A special feature of the Supervised Credit Programme was the supervision aspects provided by UP-ISSI to the financed The programme was discontinued in the first firm. quarter of 1973, and the remaining cash was transferred to the DBP. The DBP granted loans to private industrial firms and co-operatives engaged in manufacturing. Loans were also made subject to the supervised credit scheme. The PNB programme for SME began in the first quarter of 1973. The bank also used the Supervised Credit Scheme which was administered with the assistance of UP-ISSI. The IGLF began operations in July 1952, and in 1973, was reoriented to cater exclusively to the financing requirements of the small industries. Funds for the programme are drawn through foreign assistance in the form of loans from IBRD and USAID and through Philippine counterpart funds. A wide range of financial institutions participated as conduits for IGLF. b. Private Sources At about the same period, three private financial organizations had special departments and programmes for
Philippines 129 promoting SMEs. These were the First National City Bank Financing Companies, Private Development Corporation of the Philippines and Rizal Commercial Bank Corporation. (2)
Present Sources of Financing Formal government schemes are led by the CB-IGLF and the DBP's Small and Medium Industries Lending (SMILE) programme. In the private sector, there are at present three programmes that are popular : the Venture Capital Corporation (VCCs), Ventures in Industry and Business Enterprises, Inc. (VIBES) and the Philippine Business Informal sources are for Social Progress (PBSP). usually friends, relatives or private money-lenders that do not maintain formal lending procedures.
A Survey of Selected Financial Assistance Programmes for SMEs Fifteen financing institutions were studied from August to October 1984 to determine the extent of their participation and their experiences in SME financing. (1) Sources of Funds The most common source of funds for SME financing was the Industrial Guarantee Loan Fund (IGLF). Deposits and Central rediscounting were the next biggest sources especially for private commercial banks. Other sources were CB-IBRD, WB-IBRD and DBP funds. (2) Services Offered Of the fifteen financial i nsti tuti ons surveyed, fourteen offered long-term loans. Ten out of the fifteen, Two investment in turn, offered short-term loans. hous~s and three private commercial banks extended long-term loans only. Meanwhile, only the private
130 Melito S. Sal azar, Jr. et al. commercial banks supplied short-term loans alone. (3)
Project Selection Given a scale of 1 to 10 of increasing importance, the financing i nsti tuti ons ranked good credit standing as the highest (average of 9.4) criterion in project selection. Closely following were quality of management and project vi abi 1 i ty (9. 3 each). Adequacy of collaterals (8.5) was also looked into by lending institutions while almost equally important was the availability of raw materials (8.3). The lesser criteria included good record-keeping systems (6.3), new project (4.8), and form of business organization. Most would rather lend to existing projects, under the present economic condition.
(4)
Reasons for Rejection The most prevalent reasons for rejecting loan applications were poor business prospects and inadequate collateral. Ot her reasons of similar frequency were non-availability of raw materials, poor credit standing, non-conformity to government priorities and size of loan. For some institutions, the amount of loan applied for were simply reduced if considered too 1arge. The 1east prevalent reasons for rejection were poor recording system and location outside territorial 1i mi ts.
(5)
Number and Amount of Loans by Industry Classification Textile, wearing apparel and leather industries had the biggest number of 1oan approva 1s in 1983 followed by the manufacture of fabricated metal products, machinery and equipment. However, the manufacture of wood and wood products received the highest 1oan amount approved.
Ph;l;pp;nes 131 ( 6)
Arrearages Based on a UP-ISSI survey ;n 1983, f;nancial ;nstHut;ons exper;enced low rates of arrearages. Commerc;al banks had the lowest arrearages reg; stered mostly at less than 20 per cent. Non-bank f;nanc;al ;ntermed;ary and venture cap;tal corporat;on respondents had s;m;lar low rate of arrearages. For IGLF, the total arrears to loans outstand; ng between part;c;pat;ng ;nst;tut;ons and end-users as of 30 September 1984 and was 6.1 per cent. By ;nstHut;on, rural banks reg;stered the h;ghest percentage of arrears to loans outstand;ng, wh;ch was 145.9 per cent. Non-bank f;nanc;al ;nst;tut;ons, however, recorded the lowest percentage of 3.2 per cent. More than half (59 per cent) of the total arrears were over one year. Data for SME 1oans from DBP as of 31 March 1984 revealed that for small ;ndustry loans, total arrears as percentage of outstand;ng portfolio was 28.9 per cent. The f; gure was 1ower for med; urn ; ndustry 1oans recorded at 25 per cent.
(7)
Reject;on Rate A UP-ISSI survey conducted ;n 1983 revealed that reject;on rate d;d not exceed 30 per cent of total loan Major reasons for reject;on ;n desappl;cat;ons. cend; ng order of frequency were poor or bad cred; t stand;ng exper;ences, ;nsuff;c;ent/unacceptable collateral and non-v;ab;l;ty of project.
(8)
Problems of SME Lend;ng Inst;tut;ons a. Arrea rages Arrearages problems or non-payment of due amort;zat;on are attr;buted pr;nc;pally to the borrowers• cash shortages result;ng from h;gh product;on costs, slow turnover of rece;vables, st;ff
Table 4.10:
Number and Amount of Loans Granted by Industry Classification 1983 (P Million)
Industry Classflcatlon (ManufacturIng)
IGLF Amt.
No.
SMILE Amt.
No.
Food, beverage and tobacco 15
19.2
12
3.4
Textile, wearing apparel and leather Industries
37
43.2
20
11.7
Wood and wood products, Including furniture and fixtures
19
22.2
19
12.8
Paper and paper products; printing and publishing
18
24.5
6
2.0
Chemicals and chemical petroleum, coal, rubber and plastic products
11
16.3
Non-metal lie products except products of petroleum and coal
15
15.8
EIMP Amt.
No. 2
7
10.1
29
32.7
5.8
58
60.7
34.4
45
69.4
3. 1
25
29.6
3.0
12
19.8
28
20.2
13
2.6
2.6
Basle metal Industries Fabricated metal products , machinery and equipment 32
37.3
22
22.7
Other manufacturing Industries
18
24.4
16
7.3
Total
165* 202.9
108
64.3
5.8
14
64.8
*Adjusted figures which Include manufacturing only. Sources:
Total Amt.
No.
Department of Loans and Credit, Central Bank, SMILE Department, Development Bank of the Phi llpplnes, Accounting Department and DBP.
54
60.0
35
37.5
287 332.5
b.
Philippines
133
competition, high cost and scarcity of materials, and tight credit from suppliers
raw
Low Turn-Out of Projects Lending institutions note that the low turn-out is caused by the high cost of funds or the interest rate structure and numerous pre-1 oan requirements which discourage even qualified prospective borrowers. Another reason could be the poor promotion of SME financing especially in the rural areas.
c. Risks Involved in SME Financing The possibility of business failure among small entrepreneurs, especially those with inadequate knowledge of the business or those engage in new projects, is relatively high. d.
High Administrative Costs The support services and paper work required in handling a 1arge number of small borrowers over a wide geographical area entails high administrative costs in relation to the amount of lending involved. There is also a need for manpower to adequately perform loan evaluation and project supervision.
e.
Non-Compliance with Bank Requirements Institutions encounter problems on non-compliance with requirements such as collateral, financial records and other documents. Some entrepreneurs do not maintain or have adequate financial records while others are reluctant to give information to the bank about the business especially once the loan has been granted.
134 Melito S. Salazar, Jr. et al. f.
Lack of Adequately Trained Personnel This is more conmonly observed in small provincial banks where there is insufficient or inadequately trained staff to service the needs of the surrounding community.
g.
Other Reasons Some financial institutions surveyed claimed minimal participation specifically in IGLF because of the following reasons: recessionary problems; selective IGLF lending to borrowers with established bank relations and those with a track record of performance; priorities in dealing with traditional lines of packages or banks' conservative approach to lending; branch managers' lack of proper orientation about the financing scheme; voluminous document requirements; evaluation and monitoring decentrali zed activities ; inadequate supervision of projects; and lack of trained staff on project evaluation. 0
0
0
0
0
0
0
0
Experience of SME Borrowers Having a number of fiscal incentives and financial progranmes is one thing, how the intended sector is able to avail and make use of offered assistance is another. The study therefore must focus on the SMEs' experiences in availing of these programmes. Fiscal Incentives Availment (1) Awareness of Incentives The majority (61 per cent) of the respondents were
Philippines
135
aware of fiscal incentives being offered by the government to cottage, small and medi urn industries. This means that one-third was still unaware of these incentives at the time of the survey. However, only 50 per cent of those who were aware applied for or availed of the NACIDA or BOI incentives. (2)
Sources of Information on Incentives Government agencies offering the fiscal incentives were themselves the sources of information for most of the registered enterprises. Other sources identified were friends of respondents and the print and broadcast media each contributing 24 per cent of the information source. Conventions and trade fairs turned out to be the source contributing least to the promotional efforts of these agencies. NACIDA offices figured highly in the dissemination of information regarding NACIDA incentives. Likewise, friends of respondents served as one of the major sources of information. BOI information, however, were disseminated through the print and broadcast media as well as through industry associations. These did not prove effective since fewer entrepreneurs (18 per cent) availed of BOI incentives.
(3)
Availment of Incentives Only 70 or 30 per cent of the 230 respondents availed of government incentives. NACIDA dominated firm incentive availments at 81 per cent while BOI only yielded a low 19 per cent membership. Considering that BOI incentives were recently aligned to favour small and medium enterprises, BOI availment may be considered as very low compared with the ·NACIDA availments.
136
Melito S. Salazar, Jr. et al. Among the NACIDA-registered enterprises, 55 per cent were sma 11 ; 40 per cent cottage, and 5 per cent It is interesting to note that while medium-sized. NACIDA incentives are directed towards cottage i ndustries, small and medium enterprises registered for access to these incentives. In case of the SMEs surveyed, those firms that are avail i ng of NACIDA i ncentives may have registered when they were starting out and were still classified as cottage industries. Another reason may be that some of the NACIDA-registered small industries under-valued their assets to qualify for NACIDA registraion.
(4)
Expenses Incurred in the Availment of Incentives Entrepreneurs incurred expenses at an average of Pl,883 when they applied for NACIDA or BOI incentives. The figure seems high because the maximum amount charged as NACIDA registration fee is P300 only. Expenses incurred for project study preparation made up the bulk of total average expenditure.
(5)
Usefulness of Incentives Overall, the respondents' op1n1on expressed usefulness of both NACIDA and BOI incentives.
(6)
Willingness to Avail of Incentives in the Future The majority (59 per cent) gave positive responses but these were dependent on the following conditions, namely, if: red tape in applying for incentives is eliminated; o o
respondents
will
learn
of
the
promulgation
of
o
useful incentives; incentives will assure them of market prospects; incentives will serve agro-industries;
o
incentives will provide real cost reduction in the
0
137
Philippin es the firm's operation s. (7)
Reasons for Refusal to Avail of Incentive s in the Future Forty-one per cent expressed refusal to avail of incentives for the following reasons: . they do not want to get involved with governmen t this
because
agencies
more
entails
than
cost
benefits; availment would require too much red tape; governmen t i~ not capable of helping the SMEs considering its present predicame nt.
0
(8)
Suggested Incentive s bulk
The
of
responden ts
suggpc,tpd dealt
with
incentive s the
from
gathered
financing
area.
the
These
included extension of financing assistanc e in the form of capital, lower· intPrest rates, and higher CIGLF loan ceiling. Assistanc e in the continuou s supply of raw materials Provision of at controlle d price ~ would be welcomed. COfii'OOn market facilitie s as additiona l incentive s to Other incentive s proposed SKs was also suggested . were:
•
extension of tax
•
tax
rebates
another
for
sought
exe~tion
from 5-12 years;
labour-in tensive for
free
i ndus tries
while
of machi-
transport ation
neries for exporting finms;
• cutting down on red tape; • technical for assistanc e
specific
industrie s,
particula rly the wearing apparel industry;
• • •
skills training; better infonnati on diseminat ion on incentive s; a healthY political and economic environm ent.
138
Melito S. Sal azar, Jr. et al.
Financial Assistance Availment (1)
Financial Assistance Most Frequently Used Out of the 230 firms interviewed, 146 or 65 per cent availed of financial
assistance from both formal
and
Firms that borrowed funds used for-
informal sources.
sources more often (73 per cent) than infonnal However, short-term 1 oan borsources ( 36 per cent).
mal
rowers approached more informal sources (52 per cent) than formal
sources
Financial assis-
(48 per cent).
tance for short-term loans was almost as easily available from formal as well as informal sources. (2)
Frequency of Availments More than half (55 per cent) of short-term borrowers from formal only.
sources avai 1 ed of short-term funds once
Those that could no 1 onger recall
the exact
number of times they borrowed due to high frequency of availments made up of 16 per cent of the respondents. A high percentage of firms (83 per cent), made longterm loans only once with only 10 per cent obtaining a second loan since the start of operations.
Only 7 per
cent obtained more than three long-term loans.
There
was no marked difference of preference in second availments between formal and informal sources.
Sixteen per
cent of the respondents could no longer recall. (3)
Loan Terms and Conditions a.
Collateral Requirements The most common types of collaterals required of the SME borrowers were real estate (61 per cent), deposits
or
post-dated checks
(32
per cent)
and
chattel mortgage or other assets (7 per cent). (i) teral
Short-term loans.
The full
value of colla-
was accepted by 45 per cent of the formal
sources of short-term loans.
Thirty-four per cent
Philippines
139
of these sources va 1 ued the borrowers • coll atera 1 at less than 100 per cent of their real value. Those that valued collateral at more than 100 per cent made up 11 per cent of the formal sources. Finally, the last 11 per cent of the formal sources, As for informal did not require any collateral. sources, 83 per cent or 34 out of the 41 1enders did not ask for any collateral. The collateral requirements of formal sources were rated by 84 per cent of the borrowers as 11 fai r" and as "unreasonable" by 14 per cent and "very unreasonable" by 3 per cent. Twenty-eight per cent of ( i i ) Long-term 1oans. the formal sources of long-term loans valued collateral at 100 per cent of their market value. Those that valued collateral at less than 100 per cent made up 43 per cent of formal sources of long-term There were 23 per cent that valued their loans. collateral at more than 100 per cent of their real value while 5 per cent (four formal sources) did not require collateral on long-term loans. All of the informal sources (friends and relatives only) did not require collateral from the borrowers. There were no informal money-lenders that lent out on long-term loans. Borrowers• ratings of long-term formal sources were divided between "fair" ( 48 per cent) and 11 Unreasonable" (43 per cent). The rest (9 per cent) 11 A11 the rated these sources "very unreasonabl e • informal sources were rated "fair" by the borrowers. b.
Interest Rates Interest rates of shortShort-term 1oans. ( i) term 1oans were generally from 18 per cent to 21 per cent per annum as charged by 45 per cent of
140 Melito S. Salazar, Jr. et al.
of formal sources; less than 18 per cent per annum by 29 per cent and 22 per cent to 40 per cent per annum by 26 per cent of the formal sources interviewed. As for informal sources, 44 per cent did not charge any interest while 32 per cent charged more than 40 per cent interest. Informal money lenders (11) charged the highest interest rates while relatives (12) did not charge any. In rating the interest charged by formal sources, 84 per cent were rated "fair", 11 per cent were "unreasonable" and 5 per cent were "very unreasonable". Of the informal sources, 36 per cent were rated "fair", 27 per cent were "unreasonab 1e" and 37 per cent were "very unreasonable". (ii) Long-term loans. The majority of the formal sources (60 per cent) charged less than 18 per cent per annum, 23 per cent charged from 18 per cent to 21 per cent while 17 per cent charged from 22 per cent to 40 per cent per annum. Informal sources were only friends and relatives, 76 per cent of whom did not charge any interest. Another 18 per cent charged less than 18 per cent while only 6 per cent charged 18 per cent to 21 per cent per annum. The borrowers generally rated formal sources as "fair" (77 per cent); 21 per cent rated them "unreasonable" while only 2 per cent said they were "very unreasonable". The borrowers from friends and relatives unanimously rated their interest payments as "fair". c.
Repayment Period (i) Short-term loans. About half (53 per cent) of the formal sources of short term loans stipulated a repayment period from six months to one year. The next biggest percentage (34 per cent) asked for a
Philippines
141
repayment period of from one to three months. The repayment period of infonnal sources was more spread out, with 36 per cent allowing borrowers to pay whenever they are ab 1e to do so. Twenty-two per cent had a repayment period from six months to one year, 20 per cent had one month or less 15 per ce nt allowed one to 3 months and 7 per cent , 3 to 6 month s repayment period . (if) Long-term loans. Most of the long-term loans ( 60 per cent) were given from 3 to 5 years repayment period by formal sources. More than 5 years were allowed by 27 per cent whi 1e one to 3 years were required by 13 per cent of the formal sources. As for informal sources, repayment period from 3 to 5 years was scheduled by 35 per cent and from 1 to 3 years by 18 per ce nt of the friends and relatives that extended long-term loan s. The rest had no requirements ; borrowers could pay when they were able to do so. Only friends and were
relative s 1 nfonNl
for
approached
money-lender s
did
not
l ong-term lend
loans;
long-term
1oans. When a ssessed by borrowers, 89 per cent of the for"WWtl sources were rated "fair" and 100 per cent of the d.
fnfo~l
recei ved a similar rating.
A.ortization (i)
Short-term loans .
Fifty-five per cent of
sources were amortized anytime repayment period of short-term loans.
loans fr011 fomal wf thin the
The majority of informal sources also had informal amortization requirements ; for example, 30 per ce nt required borrowers to amortize anyti me within the repay~nent
period and 32 per cent required them to
pay when ab 1e.
142 Melito S. Salazar, Jr. et al. ( i i)
Long-term 1oans. Quarterly amortizations were required by 58 per cent of the formal sources of long-term loans. Semi-annual amortizations were required by 21 per cent, monthly amortizations by 17 per cent and annual amortizations by 4 per cent of formal sources. Forty-one per cent of the informal sources (relatives and friends) allowed their borrowers to "pay when ab 1e" while 18 per cent required them to amortize annually. e.
(4)
Length of Loan Processing Time ( i ) Short-term 1oans. The most usua 1 1ead time required for processing by formal sources of shortterm 1oans was one month ( 45 per cent). Twentyfour per cent, however, took up only one day to process short-term loans. Almost half (46 per cent) of the informal sources needed only one day for processing loans. Thirty-four per cent required one month as 1ead time. ( i i) Long-term 1oans. It took five months to one year for 44 per cent of formal sources to process 1ong-term 1oans. The next 1arges t percentage ( 29 per cent) took one month, whi 1e 19 per cent took two months to process long-term loans. As for i nforma 1 sources, 53 per cent had one month lead time to process long-term loans while 18 per cent needed only one day. The rest took from two months to one year to process loans.
Loan Approval and Release The total amount approved and released is generally smaller than the amount originally applied for. The total amount applied for by short-term loan borrowers was P8,937 ,000 but the amount approved was P8,811 ,000
Philippines
143
or a one per cent difference from the amount requested. Among formal sources, the variations occured due to deductions of service fees, interest, documentation, and other expenses incurred during application stage. In the long-term category, the total approved was P40,018,000 which varied by 7 per cent from the original amount requested. The big gap in terms of amount released was noted from formal sources such as DBP, IGLF and CIGLF. (5)
Sufficiency of Amount Released There were 85 per cent of short-term borrowers who claimed that the amounts eventually released to them were enough for their expressed needs. Of those who borrowed from informal sources, 98 per cent found the released amount sufficient while of those who borrowed from formal sources, 71 per cent found the released loan amounts sufficient for their expressed needs. Inspite of the insufficiently funded loans, however, 75 per cent were able to achieve the purpose of the loans borrowed from formal sources. As for 1ong-term borrowers, 69 per cent claimed that the amount released to them were enough to attain Fifty-five per cent of the insuftheir purposes. ficiently funded loans from formal sources were still able to achieve the loan purpose while 44 per cent were able to achieve only part of the purpose.
(6)
Paper Requirements Eighty-six per cent of the short-term borrowers rated the paper requirements of both sources as "fair". The formal sources were "fair" by 84 per cent while the informal sources were rated by 100 per cent of the The SMEs understandably gave "fair" respondents. ratings to the informal sources of short-term loans
144
Melito S. Salazar, Jr. et al. because these do not or rarely do ask for any papers when
lending funds .
Long-term formal
sources were -
rated "unreasonable" by one-third of the borrowers. It appears that as 1oans are formalized, more documents are required and more borrowers have cause for claiming that these requirements are "u nreasonable ". (7)
Difficulties Experienced in Obtaining Loans Borrowing was des cri bed as a "very easy" task for 68 per cent of short-term borrowers from both formal and informal sources.
Another 27 per cent cl aimed that it
was a "fairly easy" activity while a minimal 5 per __cent considered obtaining a loan
"not so easy" to "very
difficult". There were 45 per cent of 1ong-term borrowers who felt that borrowing was a "fairly easy" task while 33 per cent commented that it was a "very easy" activity. The remaining 22 per cent described the activity as being "not so easy", "fairly difficult" or "very difficult".
None
of
the
long-term
borrowers
from
informal sources encountered difficulties in borrowing. Difficulties experienced by borrowers from formal sources were:
too many paper requirements experienced
by 35 per cent, strict collateral requirements, by 29 per cent; and excessive red tape, by 23 per cent.
Only
13 per cent claimed that their difficulty was in the preparation of a project study or cash flow. (8)
Ratings on the Attitudes of Bank Personnel/Financiers In general, short-term borrowers rated the attitude of bank personnel and other lenders as "fair", with 95 per cent saying formal sources are fair, and 97 per cent saying the same thing of informal sources. The "fair" rating, however, becomes questionable when the borrowers further enumerated the difficulties
Philippines 145 they encountered in applying for loans especially from formal sources. (9)
Improvements Suggested by Borrowers Borrowers of formal sources suggested some improvements on the services of financial institutions. There were five main suggestions: lower current interest rates; lesser paper requirements; speed up the processing of loans; give more meaning to the support of SMEs; decrease/eliminate collateral requirement. 0
0
0
0
0
Projected Financial Requirements of SMEs The future requirements of SMEs for funds can be gathered from two sources: what the SMEs surveyed claimed they would need as prospective borrowers and what the projections foretell based on past avai 1ments and 1oan disbursements of financing institutions. Together, these will be the bases of the demand of SMEs for financing. Future Demands Disclosed by SMEs Interviews (1) Composition of Prospective Borrowers The survey revealed that 55 per cent of the firms interviewed had plans of borrowing in the future. However, around 45 per cent of the firms had no intentions of borrowing funds. The three main reasons given were economic crisis, sufficient investment/earnings and fear of incurring debts. Other reasons were difficulty experienced in 1oan app 1i cation; being presently in debt; having collateral tied up in the previous loans and not be qualified under the priorities chosen for assistance.
s.
Salaza r, Jr. et al.
146
Melito
(2)
Type of Loans to be Obtaine d and their Sourcin g The type of loans which the SMEs intervi ewed planned to obtain in the future were mainly 1ong-ter m loans (74 per cent). Those that planned on borrow ing short-t erm loans are 25 per cent while those that planned on a combin ation of short- and 1ong-ter m 1oans compri sed Compared to past only 17 per cent of the group. availm ents, in 1983, for exampl e, long-te rm loans were borrowe d by 54 per cent, short-t erm 1oans by 36 per cent, and a corrbi nation of 1ong- and short-t erm 1oans
by 10 per cent of the borrow ers intervi ewed. Borrow ers seem to be p1anni ng on borrow ing more 1 ong-ter m 1 oans because 1ong-ter m sources 1 i k.e those from governm ent progranTiles are more availab le at preintendi ng to avai 1 of short-t erm loans prefer informa l sources (58 per cent) over finanMajori ty of future cial institu tions (42 per cent) . borrow ers ( 74 per cent) plan to avai 1 of 1ong-ter m sent.
Those firms
loans mostly for additio nal perman ent working capita l. (3)
Accepta nce of Future Terms Si xty-eig ht of the 146 former borrow ers who were also p 1anni ng to borrow in the f uture were wi 11 i ng to pay higher intere st rates.
(4)
Project ed Amount of Loans Require d by SMEs (Based on SMEs Own Projec tions) Fifty-f ive per cent of the units intervi ewed had plans to bor r ow in the future (at least for the next three Their perceiv ed require ments for both 1ongyears) . term
and
s hort-te rm
loans
amount
to
an
average
borrow ing rate of P568,00 0 per unit. Using the above finding s, the total loan require ments of the whole SME sector, which compri ses approx imately 31,126 enterp rises, for the next three years is
Philippines 147 P7.571 billion.3 Long-term loan requirements will be in the amount of P5.821 billion while short-term will be P1.750 billion. Projected Demand Based on SMEs (1) Actual Long-Term Availments- Basis for Projection The basis for projecting the financing requirements for long-term loans will be the past loan availments from DBP. IGLF and IGF. Historical data from private financing i nsti tuti ons and informal sources for 1ongterm loans were not available. In this regard. the actua 1 amount of 1ong-term avai 1ments as claimed by respondents in the period 1978 to 1984 were used. (2)
Projections of Long-term Financing Requirements of SMEs from Government Lending Schemes The projection that follows gives the long-term financing requirements of SMEs for 1985 to 1989 based on actual loan availments by SMEs from IFLG. DBP and EIMP:
Year
No. of Potentia I Borrowers 1
1985 1986 1987 1988 1989
588 499 410 321 232
2
Borrowing Rate 2
I
1marketing I
• • • •
Export Incentive (EDB) Redlscountlng Scheme (MAS) Export Promotion Schemes Protection offered (Indirect subsidy)
~~ ....______. ""Biased by: IGMS subsidy to "critical support Industries" • POAS grants
tax
a
• Annual NWC Increments
(warehousing)
""'~ b
(capital subsidy)
I Build lngs 11 Machinery I • SIFS/ESIFS
• SI FS/ES IFS • IGMS (capIta I subsIdy)
fiscal assistance
• SDF 4% levy on all earnings less than S750 p.m.
Pioneer Status (PS> Export Incentive (El) \ Investment Allowance (lA)
• SDF training release scheme (subsidy) • SDF training grant scheme -- In conjunction with NPB, VITB and other training Institutes • • SDF development consultancy scheme • SITAS
a suspended as from 1 April 1985 b reduced to 2% from 1 April 1985, and to 1% March 1986
213
Singapore Notes 1.
Also see speech by Mr. Hon Sui
See Ch 1 ng Hak Kee (1985), pp. 7-18. tor
Minister
Sen,
Conference
Industries
Small
"The Role of
on
Opening of Consulasla 1 s
at the Official
Finance,
In
National
the ASEAN
Economies", 20 November 1978, Singapore. 2.
See Staley and Morse (1965) pp. 5-8.
3.
See Ch 1 ng (1982) especially Chapter 8.
4.
Se vera I
not
dId
wh I eh
t I rms
other
One managing direc-
quota allocation from TDB lodged some complaints. tor of a small garment firm said:
"Due to limited size, I cannot get
EBC quota, that Is, the Certificate of Origin. the Department of Trade small
export
In obtaInIng any
succeed
But back In 1978 under Now
firms were able to obtain quotas.
under the TDB, quota Is not easy to get." This complaint may sound a bl t
exaggerated
In the sense that a 11
that have some
factors
other
bearing on the allocation of export quota had not been discussed
In
the IntervIew. 5
The government's responsiveness to grant relief to business during the Is demonstrated
difficult times
present cessions
In
Introduced after the Parliamentary budget session
1985; see sub-section on Overall
con-
fiscal
In the various
~rch
Evaluation of Government Fiscal and
Financial Assistance to SMBs. 6.
See
El ghtl es",
for Health.
Speech
Budget
Mr Goh Chok Tong, then MInIster tor Trade and
for
Plan
Development
HIgher AchIevement",
"Towards
In
Economic
Singapore's
of
"Highlight
1981
the by
Industry and MInIster
Information Division, Ministry of Culture,
Singapore:
For a useful discussion of the early experience of Singapore's
1981.
"Planning for Industrialization", see Lee Soo Ann (1973), especially Chapters 2, 3 and 8. 7.
Speech by Mr Chua Soo Tlan, Dl vIs Iona I Director (Industry l, EconomIc Development Schemes
and
Board
at
the
Joint
DBS-EBD-SMA
IncentIves
Government
tor
Seminar
Sma I I
and
on
"Financing
MedIum-S I zed
I ndustrles" on 10 October 1984. 9.
For general
discussions
on
tax
Incentives
In developing
countries,
see Lent (1975), Chapter 28; Prest (1963), Chapter 4. 10.
For
useful
and
more
detailed
discussions
on
this
subject
see
for
214 Ch'ng Hak Kee et al. Tan and Ow (1982); Chla