Singapore and Free Trade Agreements : Economic Relations with Japan and the United States 9812301445
339 29 3MB
English Pages [110] Year 2001
Recommend Papers


- Author / Uploaded
- Ramkishen S. Rajan
- Rahul Sen
- Reza Y. Siregar
File loading please wait...
Citation preview
Singapore and Free Trade Agreements
The Institute of Southeast Asian Studies (ISEAS) was established as an autonomous organization in 1968. It is a regional research centre for scholars and other specialists concerned with modern Southeast Asia, particularly the many-faceted problems of stability and security , economic development, and political and social change. The Institute’s research programmes are the Regional Economic Studies (RES, including ASEAN and APEC), Regional Strategic and Political Studies (RSPS), and Regional Social and Cultural Studies (RSCS). The Institute is governed by a twenty-two-member Board ofTrustees comprising nominees from the Singapore Government, the National University of Singapore, the various Chambers of Commerce, and professional and civic organizations. An Executive Committee oversees day-to-day operations; it is chaired by the Director , the Institute’s chief academic and administrative officer.
© 2001 Institute of Southeast Asian Studies, Singapore
Singapore and Free Trade Agreements Economic Relations with Japan and the United States Ramkishen S. Rajan Rahul Sen Reza Siregar
INSTITUTE OF SOUTHEAST ASIAN STUDIES Singapore
Published by Institute of Southeast Asian Studies 30 Heng Mui Keng Terrace Pasir Panjang Singapore 119614 Internet e-mail: [email protected] World Wide Web: http://www.iseas.edu.sg/pub.html All rights reserved. No part of this publication may be reproduced, stored in a retrieval system, or transmitted in any form or by any means, electronic, mechanical, photocopying, recording or otherwise, without the prior permission of the Institute of Southeast Asian Studies. © 2001 Institute of Southeast Asian Studies, Singapore. The responsibility for facts and opinions in this publication rests exclusively with the authors and their interpretations do not necessarily reflect the views or the policy of the Institute or its supporters. ISEAS Library Cataloguing-in-Publication Data Rajan, Ramkishen S. Singapore and free trade agreements: economic relations with Japan and the United States / by Ramkishen S. Rajan, Rahul Sen and Reza Siregar. 1. Free trade—Singapore. 2. Singapore—Commercial policy. 3. Singapore—Foreign economic relations—Japan. 4. Japan—Foreign economic relations—Singapore. 5. Singapore—Foreign economic relations—United States. 6. United States—Foreign economic relations—Singapore. I. Sen, Rahul, 1965– II. Siregar, Reza III. Title. HF1595 R16 2001 sls2001017419 ISBN 981-230-144-5 ISSN 0218-2114 Printed in Singapore by Seng Lee Press Pte Ltd.
© 2001 Institute of Southeast Asian Studies, Singapore
Contents
List of Tables List of Figures About the Authors
vii viii ix
1 INTRODUCTION
1
2 REASONS BEHIND SINGAPORE’S ATTRACTION TO FTAs Importance of Singapore’s FTA proposals with Japan and the United States
11
3 MERCHANDISE TRADE LINKAGES Trade Flows Trade Balances Trade Intensity Indices Commodity Composition of Merchandise Trade Intra-Industry Trade (IIT)
13 13 19 21 22 29
4
5
IMPACT OF CHANGES IN FOREIGN DEMAND ON THE SINGAPORE ECONOMY Export Demand Functions Significance of Foreign Exports to Aggregate Demand in Singapore TRADE IN SERVICES AND DIRECT INVESTMENT Strategies to Develop Singapore into an International Services Hub Singapore–United States Co-operation in Services Singapore–Japan Co-operation in Services Singapore’s Investment Linkages with the United States and Japan v
© 2001 Institute of Southeast Asian Studies, Singapore
7
45 45 52 55 55 57 60 61
vi
Singapore and Free Trade Agreements
6
SINGAPORE AND THE NEW REGIONALISM: CAUTIONARY NOTES
69
7
CONCLUSION
75
APPENDIX 1: TRADE INTENSITY INDICES
79
APPENDIX 2: MEASURES OF INTRA-INDUSTRY TRADE (IIT)
83
Notes
85
References
95
Index
© 2001 Institute of Southeast Asian Studies, Singapore
103
List of Tables 1.1 Singapore: Major Macroeconomic Indicators 1970–99 1.2 Growth Performance of Singapore and Other East Asian Economies 3.1 Singapore’s Domestic Exports to the United States and Japan, 1984–99 3.2 Singapore’s Leading Product Groups of Exports to the World, the United States, and Japan in 1999 3.3 Singapore’s Leading Product Groups of Imports from the World, the United States, and Japan in 1999 3.4 Singapore’s Intra-Industry Trade with the United States and Japan: 1995–99 (Computed with Total Export Values) 3.5 Singapore’s Intra-Industry Trade with the United States and Japan: 1995–99 (Computed with Domestic Export Values) 4.1 Variable Description 4.2 ADF Unit-Root Test 4.3 Export Function Model (For Singapore – the United States) 4.4 Export Function Model (For Singapore – Japan) 4.5 Co-integration Test 4.6 OLS Test on the Error Correction Model 5.1 Singapore: Inward Stock of Foreign Direct Equity Investment by Country 5.2 Singapore’s Investment Commitments in Manufacturing by the United States and Japan 5.3 Singapore: Stock of Foreign Direct Equity Investment Abroad by Country vii © 2001 Institute of Southeast Asian Studies, Singapore
2 3 18 26 27 31 37 47 48 51 51 53 54 63 64 66
List of Figures 3.1 Singapore’s Merchandise Trade with the United States 3.2 Singapore’s Merchandise Trade with the Japan 3.3 Singapore’s Merchandise Exports to the United States and Japan 3.4 Singapore’s Merchandise Imports from the United States and Japan 3.5 Singapore’s Merchandise Trade Intensities with the United States and Japan 3.6 United States’ and Japan’s Merchandise Trade Intensities with Singapore 5.1 Services Investment Commitments by Region (1999) 5.2 Services Investment Commitments by Cluster (1999)
viii © 2001 Institute of Southeast Asian Studies, Singapore
14 15 17 20 23 24 65 65
About the Authors Ramkishen S. Rajan is a Lecturer at the School of Economics and a Research Associate at the Centre for International Economic Studies, Adelaide University, Australia. He is also a Visiting Research Fellow at the Institute of Southeast Asian Studies, Singapore. Rahul Sen is a Research Scholar pursuing his Ph.D. at the Department of Economics, National University of Singapore. Reza Sir egar is an Assistant Professor at the Department of Economics, National University of Singapore. Previously, he was an Economist at the Asian Development Bank in Manila. His research interests are in the areas of macroeconomics, international economics, development economics, and applied econometrics.
ix
© 2001 Institute of Southeast Asian Studies, Singapore
Introduction
1
1 Introduction
Singapore’s economic growth experience is of particular importance for at least two reasons. First, it has enjoyed one of the highest rates of growth in the world over the past three decades, with its gross domestic product (GDP) appreciating at an annual average rate of about 8 per cent during the period 1970–2000 (Tables 1.1 and 1.2). Second, this growth has been highly durable, the city-state having suf fered only one year of outright economic contraction in the past three decades (in 1985–86). The durability of the Singapore economy is further highlighted by the fact that it was one of the few economies in East Asia to have emer ged relatively unscathed from the regional financial crisis of 1997–98. Thus, while most of the other East Asian economies faced severe recessionary conditions, with real output declining by between 3 and 15 per cent in 1998 (Table 1.2), Singapore managed to register marginally positive growth despite having extensive trade, investment, and financial linkages with the rest of the region (Rajan and Sen 2000). An essential ingredient of the city-state’s growth strategy has been its outward orientation, particularly its openness to trade and investment flows. Despite a residential population of just over three million, Singapore is the world’s sixteenth largest merchandise trading nation and services exporter, and [email protected]
1 © 2001 Institute of Southeast Asian Studies, Singapore
14.6 0.32 20.70 1.7
9.7 9.0 8.7 33.98 9.29 13.70 33.90 13.36 12.74 8.5 3.5 1.7 5.4 5.73 7.57 0.0 8.0 14.1 12.9 3.7 9.4 23.2 22.2 6.7
7.6 11.4 10.7 2.9
8.7 11.7 10.6 2.7
5.9 5.8 4.1 1.0
1999 1970–99 1970–80 1980–90 1990–95 1995–99
Source: The World Bank, World Development Indicators CD-Rom.
Real GDP growth Exports growth Imports growth Inflation rate
1970 1980 1990 1995
TABLE 1.1 Singapore: Major Macroeconomic Indicators 1970–99 (in percentages)
2 Singapore and Free Trade Agreements
© 2001 Institute of Southeast Asian Studies, Singapore
Introduction
3
TABLE 1.2 Growth Performance of Singapore and Other East Asian Economies (GDP growth [% per annum]) Average Average 1981–90 1991–95 1996 Singapore Malaysia Thailand Indonesia Korea Japan
7.3 6.0 7.9 5.4 9.1 4.0
8.7 8.7 8.4 7.8 7.5 1.4
7.5 8.6 5.5 8.0 7.1 5.0
1997 1998 1999 2000 8.0 7.7 –0.4 4.6 5.5 1.4
1.5 5.5 –6.8 4.9 –8.0 4.2 –13.7 –0.1 –5.5 9.2 –2.8 n.a.
6.0 5.2 5.0 3.8 6.5 n.a.
Sources: International Monetary Fund,World Economic Outlook and The Economist (January 2000).
the world’s largest transhipment point. With a trade-to-GDP ratio of over 250 per cent in 1999, Krugman (1995) places the country in the league of “super -trading” nations. Accordingly, it should come as no surprise that Singapore has been a major proponent of global trade liberalization and the free flow of goods and services across international borders. Nevertheless, recognizing that it has limited influence in the multilateral arena, where recent progress on many important issues relating to trade and investment liberalization is perceived to have been disappointingly slow and negotiations protracted and cumbersome (Sager 1997), Singapore has concomitantly pursued a second track to liberalization via the regional route. Regionalism has involved both the SoutheastAsian region via the ten-memberASEAN grouping and the larger Asia and Pacific region via the twenty-one-member APEC grouping.1 However, the recent financial crisis has held up the pace if
© 2001 Institute of Southeast Asian Studies, Singapore
4
Singapore and Free Trade Agreements
not commitment by some of the ASEAN members to trade liberalization and appears to have depleted its collective economic strength; 2 while APEC has become lar ge and unwieldy and appears ill-equipped to handle substantive trade and investment liberalization issues effectively.3 Accordingly, Singapore policy-makers have underscored the need to consciously and aggressively explore alternative liberalization paths (i.e. “fallback positions”). Free Trade Agreements (FTAs) have thus become an integral part of Singapore’ s trade policy. To be sure, an FT A is an agreement between two or more trading partners to abolish their respective tarif fs and other trade barriers and provide preferential and reciprocal market access to contracting members. Signatories to the FT A are free to pursue independent trade policies with respect to non-members. In other words, an FT A, by definition, discriminates against non-members.4 This book examines the shift in Singapore trade policy towards FTAs in general, with particular focus on the city-state’s bilateral trade relations and its proposed trade pacts FT As with Japan and the United States. This book is or ganized as follows. The next chapter discusses additional reasons for Singapore’s attraction to the “new regionalism” in general, bilateral FT As in particular.5 Singapore has already established a bilateral FTA with New Zealand, and is in the process of negotiating ones with Japan and the United States. At the time of writing, FT As with Australia, Chile, Mexico, and the European Free Trade Area (EFTA) (consisting of Iceland, Liechtenstein, Norway , and Switzerland) are also being considered, and ones with several other economies have been proposed. From Singapore’ s perspective, the possibility of instituting FTAs with the two world’s economic superpowers, the United States and Japan, is undoubtedly of foremost significance. These two
© 2001 Institute of Southeast Asian Studies, Singapore
Introduction
5
economies, along with neighbouring Malaysia, are Singapore’s top trading partners, together constituting nearly one-half of Singapore’ s global trade in 1999. Accordingly, Chapters 3 and 4 examine various aspects of the city-state’s merchandise trade linkages with the two economic superpowers in some detail. Recognizing that trade agreements (both regional and global ones) are multifaceted, also encompassing services trade and issues relating to investment (principles of national treatment and the right of establishment), Chapter 5 discusses bilateral services trade and investment linkages between Singapore and the two economic superpowers. Popular discussion of FTAs gives one the appearance that such a trade policy is entirely benign. The penultimate chapter sounds a cautionary note, highlighting some reasons to be concerned with Singapore’s recent embracement of the “new regionalism”. The final chapter concludes the book with a brief summary.
© 2001 Institute of Southeast Asian Studies, Singapore
Reasons behind Singapore’s Attraction to FTAs
7
2 Reasons Behind Singapore’s Attraction to FTAs
Singapore’s recent moves to bolster its integration with the global economy via the Free Trade Agreement (FTA) route find a parallel with that of the United States in the early 1990s. The United States, when faced with opposition from the European Union (EU) and some developing economies during the Tokyo Round of GeneralAgreement on Tariffs and Trade (GATT) negotiations, decided to liberalize via the preferential trading route rather than the most favoured nation (MFN) or multilateral route via GATT. This was the start of the era of the wave of the so-called “new regionalism”. 6 The United States under trade representative William Brock at that time appeared willing to negotiate FTAs with any and all interested parties (including ASEAN) as a means of maintaining forward momentum towards trade and investment liberalization, failing which it was feared that there might be a lapse into protectionism, i.e. the so-called “bicycle theory” (Ber gsten 1998). FTAs appear to be increasingly regarded by policy-makers as effective and expeditious instruments for achieving trade liberalization among “like-minded” trading partners (Schif f et al. 2000). Formation of bilateral FTAs among such partners 7 © 2001 Institute of Southeast Asian Studies, Singapore
8
Singapore and Free Trade Agreements
is also seen as a way to overcome the so-called “convoy problem”, whereby the pace of trade integration is held back by the “least willing member” — or, as it is sometimes said, “those who can run faster should run faster and ought not to be held back by those who choose not to run or do so at a snail’s pace”. While the ar gument that negotiating regional trade pacts are easier to conclude and can be done at a faster pace than global negotiations may not hold true as a general rule (Baldwin 1997; Bhagwati 1995), it does seem appropriate in the case of Singapore which sets strict deadlines for completion of discussions (though this may lead to its own problems; see Chapter 6). As noted, since trade agreements nowadays go well beyond trade in goods to encompass an increasing number of areas and issues, FTAs could act as a “testing ground or pilot project for exploring complex trade issues” and may help establish some sort of precedent or benchmark for trade negotiations involving a larger number of countries, including one at the multilateral level (Sager 1997, p. 242). The surge of recent FTA initiatives by Singapore may also be a means of building political momentum for other ASEAN/APEC member economies to hasten the process of regional and unilateral liberalization. 7 Simultaneously, to the extent that contracting parties to an FT A agree to move beyond their respective WTO commitments, there may be a demonstration effect that motivates future rounds of broader multilateral negotiations under the auspices of the WTO. Singapore’s embrace of the FTA option is clearly aimed at it being “WT O-plus” rather than a “WT O-substitute”. It has therefore taken pains to reaf firm the primacy of the multilateral trading system. For instance, Singapore Prime Minister Goh Chok Tong, has reportedly noted:
© 2001 Institute of Southeast Asian Studies, Singapore
Reasons behind Singapore’s Attraction to FTAs
9
FTAs should not be pursued at the expense of the multilateral trading system. We must continue to invest efforts towards the launch of a New Round (of multilateral trade negotiations), to ensure that the gap between FT As and the WTO does not grow so wide that it becomes irreconcilable. (Business Times (Singapore), 5 December 2000)8
As will be made apparent in the following chapters, Singapore’s interests in freer trade with Japan and the United States reflect its de facto close trade and investment linkages with and dependence on the two markets. Entering into broadranging trade pacts with these two economic superpowers is not only seen as a means of gaining greater market access (with Japan in particular), but also as a way of avoiding the imposition of possible protectionist measures in the future (with regard to the United States in particular) and managing future trade tensions (including establishing orderly dispute settlement mechanisms). Being among the first few countries to establish a number of FT As with these two and other economically significant economies also ensures that Singapore is not discriminated ex post in the event that its “competitors” form FTAs with third countries.9 Another “first-mover advantage” in forming FTAs with a large number of different countries early on takes the shape of a “hub” of overlapping arrangements (Wonnacott and Lutz 1989). Producers in the hub have cost advantages vis-à-vis producers in the “spokes”, being able to obtain more of their intermediate goods at lower prices. Further , since exports originating from Singapore are granted preferential access to a number of other markets (with which Singapore has trade pacts), this may encourage the transhipment of goods through Singapore ports, hence fortifying its already dominant role
© 2001 Institute of Southeast Asian Studies, Singapore
10
Singapore and Free Trade Agreements
as an entrepôt point. Of course, it is for this very reason that FTAs have special provisions or rules of origin (ROOs) which are meant to prevent goods being re-exported from the lower tariff country to the higher tarif f country one (i.e. trade deflection). However, this in turn may lead to a shift of export platforms from other regional developing economies to Singapore in order to benefit from duty-free market access; though care must be taken to ensure that ROOs are not manipulated in such a way that partners gain de facto protection for their goods in the Singapore market. There are genuine concerns that Southeast Asia has lost the dynamism and momentum towards liberalization that it had pre-crisis, and is seen by extraregional foreign investors as the “less attractive cousin” of Northeast Asia (Business Times (Singapore), 1 1 December 2000). It is important for Singapore that investors not perceive it as being in the same boat as the rest of the region, i.e. Singapore needs to remain on the radar screen of world investors even if SoutheastAsia as a whole may not be. It has also become apparent that Singapore needs to diversify its economic linkages. Conversely, it is plausible that Singapore could act as the “flagbearer” for the region in that its trade initiatives could help maintain global interest and draw investments from the United States and elsewhere into Singapore and the SoutheastAsian region as a whole as the crisis-hit economies gradually rebuild their financial and economic structures. After all, Singapore accounts for more than half of total foreign direct investment (FDI) to Southeast Asia from the United States and Japan, while Singapore in turn is Southeast Asia’s lar gest intraregional investor.10
© 2001 Institute of Southeast Asian Studies, Singapore
Reasons behind Singapore’s Attraction to FTAs
11
Importance of Singapore’s FTA proposals with Japan and the United States Why are Singapore’s bilateral trade initiatives with the United States and Japan of particular significance?While the United States has signed a series of bilateral FT As with Canada, Israel, Mexico, and Jordan, most recently, the announcement of the Singapore–United States FT A is considered especially significant as it is the first such agreement that the United States may sign with an Asian economy. It has also been suggested that Singapore’s bilateral trade pacts with the United States and New Zealand, along with anticipated ones with Australia and Chile, may lead to a Pacific-5 or P-5 FT A, which itself could be a precursor to an APEC-wide FTA.11 The announcement of a Singapore–Japan FT A is of significance as Japan and Hong Kong have been the only two economies that have hitherto not participated in any FTAs. A possible Singapore–Japan FTA is interpreted by some as an important signal of Japan’ s weakening adherence to nondiscriminatory multilateralism, not unlike the shift in the trade policy stance by the United States in the 1980s, which led to the proliferation of regional blocs.The importance of Japan’s recent support of FT As ought not to be understated. Just a few years ago, in response to NAFT A and the possible formation of a Free Trade Agreement of the Americas (FTAAs), Jagdish Bhagwati (1995, pp. 15–16) noted: (The United States) is currently wedded to the wrongheaded approach supporting free trade agreements … I believe that Japan and the Far Eastern superperformers could use ... (the) ... opportunity to play a leadership role in halting the U.S. slide towards its obsessive fixation on free trade agreements and in restoring a principal focus on multilateralism at the WTO … Japan and theAsian nations
© 2001 Institute of Southeast Asian Studies, Singapore
12
Singapore and Free Trade Agreements
have much to of fer that is dif ferent from and wiser than what the United States seeks.
In addition, rightly or wrongly, the Singapore–Japan FTA has been viewed as a precursor to the formation of an East Asiawide FTA between countries in Southeast Asia plus Japan, Korea, and China (ASEAN plus Three or APT).12
© 2001 Institute of Southeast Asian Studies, Singapore
Merchandise Trade Linkages
13
3 Merchandise Trade Linkages
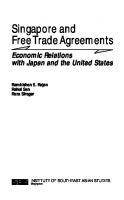
Despite the potential significance of the Singapore–Japan and Singapore–United States FreeTrade Agreements (FTAs), there have been relatively few studies that have investigated trends, patterns, and general characteristics of Singapore’s trade and investment linkages with these two partners, a void that this book aims to fill.13 Indeed, it is imperative that pre-FTA trade patterns are carefully documented, so as to be able to investigate the changes attributable to Singapore’s FTAs with the United States and Japan in the future.This being said, the intention here is not to systematically evaluate the welfare consequences for Singapore of these bilateral FT As in the conventional sense (i.e. trade creation versus trade diversion). Indeed, Singapore already has one of the most liberal trade and investment regimes in the world, and the near zero tariff rates on most goods (and limited non-tariff barriers) implies that the scope for trade diversion (i.e. replacement of lower cost suppliers from non-member countries) from Singapore’s vantage point is fairly small.14 Trade Flows Figures 3.1 and 3.2 exhibit trends in Singapore’ s total merchandise trade with the United States and Japan
L: [email protected]
13
© 2001 Institute of Southeast Asian Studies, Singapore
© 2001 Institute of Southeast Asian Studies, Singapore
1980
1982
Total trade
1984 1986 Exports
1988
1992
Imports
1990
Source: IMF, Direction of Trade Statistics Yearbook, various issues.
-10
0
10
20
30
40
50
1996 Trade balance
1994
FIGURE 3.1 Singapore’s Merchandise Trade with the United States
1998 Year
14 Singapore and Free Trade Agreements
© 2001 Institute of Southeast Asian Studies, Singapore
1980
1984
Total trade
1982 1986 Exports
1988
1990
Imports
1992
1994
1998 Trade balance
1996
Source: Calculated from IMF, Direction of Trade Statistics Yearbook, various issues.
-20
-10
0
10
20
30
40
FIGURE 3.2 Singapore’s Merchandise Trade with Japan
Year
Merchandise Trade Linkages 15
16
Singapore and Free Trade Agreements
respectively over the period 1980–99. Together they constituted one-third of Singapore’s total merchandise trade (the United States, 18 per cent and Japan, 12 per cent).While the share of Japan in Singapore’s overall trade has not varied by much over the entire period under consideration, that with the United States increased by over 8 per cent in the early 1990s, declined slightly thereafter, but increased again from 1995 onwards. In contrast, trade with Singapore constituted a mere 2 per cent of the United States’ global trade in 1999 and 3 per cent in the case of Japan. Nevertheless, despite the city-state’s microscopic physical size, it was the United States’ tenth largest export market and the twelfth largest source of imports in 1998. Singapore was the sixth largest export market for Japanese goods and Japan’ s thirteenth lar gest source of imports in 1999 (IMF 2000b). While growth of Singapore’ s exports to Japan has outpaced that to the United States as well as Singapore’ s global trade as a whole, given the relatively lower base, exports to Japan as a share of Singapore’s world exports actually declined from 11 per cent in 1982 tonearly 8 per cent by 1999 (Figure 3.3). In contrast, the share of exports to the United States increased sharply from 13 per cent to nearly 20 per cent of Singapore’s global exports by 1999. Since Singapore is an entrepôt economy, it is necessary to disaggregate Singapore exports into its two component parts, viz., domestic exports and re-exports (i.e. little or no value-added/transformation in Singapore) (Table 3.1). 15 Nearly a quarter of Singapore’ s exports to the United States included entrepôt component, this figure being about a third in the case of Singapore’ s exports to Japan. On an average, Japan and the United States respectively constituted about 20 and 15 per cent of Singapore’ s total imports. Averages fail to capture the entire picture. For
© 2001 Institute of Southeast Asian Studies, Singapore
© 2001 Institute of Southeast Asian Studies, Singapore
1980
1982
1984 1988 1990
1992
1994
Share of Japan in Singapore exports
Share of US in Singapore exports
1986
1996
Source: Calculated from IMF, Direction of Trade Statistics Yearbook, various issues.
0
5
10
15
20
25
30
1998
FIGURE 3.3 Singapore’s Merchandise Exports to the United States and Japan
Year
Merchandise Trade Linkages 17
© 2001 Institute of Southeast Asian Studies, Singapore
15517 14807 14707 18517 24654 28334 34671 38222 40723 46661 57962 69476 73465 72424 63287 68628
Total Domestic Exports to the World (DWx)
–4.6 –0.7 25.9 33.1 14.9 22.4 10.2 6.5 14.6 24.2 19.9 5.7 –1.4 –12.6 8.4
Annual Growth Rate (%)
3718 3709 4356 5801 7769 8479 9212 9525 10787 11907 14225 17083 18219 18082 16598 16858
Total Domestic Exports to the U.S. (DUx) –0.3 17.4 33.2 33.9 9.1 8.6 3.4 13.2 10.4 19.5 20.1 6.6 –0.7 –8.2 1.6
Annual Growth Rate (%) 1862 1755 1515 1966 2426 2851 3431 3493 3135 3591 4556 6386 6942 5358 4151 5303
Total Domestic Exports to Japan (DJx) –5.7 –13.6 29.8 23.4 17.5 20.4 1.8 –10.3 14.5 26.9 40.2 8.7 –22.8 –22.5 27.8
Annual Growth Rate (%) 24.0 25.0 29.6 31.3 31.5 29.9 26.6 24.9 26.5 25.5 24.5 24.6 24.8 25.0 26.2 24.6
Share of total DUx in in Total Singapore Domestic exports 12.0 11.8 10.3 10.6 9.8 10.1 9.9 9.1 7.7 7.7 7.9 9.2 9.4 7.4 6.6 7.7
Share of total DJx in in Total Singapore Domestic exports
Source: Computed from Singapore Trade Development Board, Singapore Trade Statistics; and IMF, Direction of Trade Statistics Yearbook, various issues.
1984 1985 1986 1987 1988 1989 1990 1991 1992 1993 1994 1995 1996 1997 1998 1999
Year
TABLE 3.1 Singapore’s Domestic Exports to the United States and Japan, 1984–99 18 Singapore and Free Trade Agreements
Merchandise Trade Linkages
19
instance, imports from the United States have appreciated from 15 per cent in 1995 to almost 20 per cent in 1998, while those from Japan declined from 21 per cent to 17 per cent over the same period (Figure 3.4). Trade Balances Singapore has recorded a persistent and growing bilateral trade balance with the United States since the mid-1980s, peaking at slightly over US$3 billion in 1998–99 (Figure 3.1). These surpluses are a relatively low share of overall Singapore– United States trade, averaging about 9 per cent. In contrast, Singapore has been running persistent bilateral deficits with Japan which have been increasing both in magnitude as well as in terms of Singapore’s total trade with Japan, especially during the period 1985–94. The deficit was around US$10 billion in 1999, constituting about 45 per cent of Singapore’s bilateral trade with Japan (Figure 3.2). Persistent trade deficits with Japan might at least partly be a reflection of the inability of foreign (including Singapore) exporters to penetrate the Japanese market due to the maintenance of both official and (especially) unofficial nontariff barriers (NTBs) (Lawrence 1987). Indeed, these barriers have in turn often led to the accusation that Japan “imports too little” from its trading partners (T akeuchi 1989), with a survey of Singapore exporters in the late 1980s revealing them to be “generally overawed by the Japanese ‘closed market’ image” (Lim 1988, p. 100). In the context of a Singapore– Japan FTA, this factor could be of potential importance, as a bilateral FTA ought to provide Singapore preferential access to the Japanese market. 16 Conversely, given continued aggregate trade deficits faced by the United States, protectionist pressures in case of an economic slowdown may
© 2001 Institute of Southeast Asian Studies, Singapore
© 2001 Institute of Southeast Asian Studies, Singapore
1980
1984
1986 1988
Share of US in Singapore imports
1982 1990
1994
1996
1998
Year Share of Japan in Singapore imports
1992
Source: Calculated from IMF, Direction of Trade Statistics Yearbook, various issues.
0
5
10
15
20
25
FIGURE 3.4 Singapore’s Merchandise Imports from the United States and Japan
20 Singapore and Free Trade Agreements
Merchandise Trade Linkages
21
emerge in that country. Thus, a Singapore–United States FTA might serve as an “insurance policy” against the future imposition of U.S. unilateral trade barriers.17 The assemble-and-export strategy , whereby Japanese multinationals in East Asia import intermediate products and capital goods from Japan, assemble them locally and re-export the finished goods to the United States and other third countries, is a further reason for Japan’ s persistent bilateral trade surplus with Singapore as well as the rest of EastAsia.18 On the other hand, U.S. subsidiaries abroad have contributed to the U.S. trade deficit with East Asian economies as they exported relatively more back to the United States (i.e. “reverse imports”) than they sourced from it (Encarnation 1992). This phenomenon appears to be especially true in the case of Singapore, with early studies suggesting that between 4 and 60 per cent of output by U.S. multinationals in Singapore has been exported back to the United States, while the corresponding figure in the case of Japan is estimated at only around 5 per cent (Hill and John 1985). 19 We discuss investment linkages issues in more detail in Chapter 4. Trade Intensity Indices While certainly informative, trade shares are an inadequate indicator of the intensity of bilateral trade relations, as they do not take into account a country’s trade exposure with the rest of the world. The degree of bilateral orientation of Singapore’s trade with the two partner countries is, therefore, more appropriately examined with the aid of bilateral trade intensity indices. These indices aim to capture the extent to which the home country (Singapore) regards its trading partners (the United States and Japan) as being important in relation to the former’s trade with the rest of the world (ROW).
© 2001 Institute of Southeast Asian Studies, Singapore
22
Singapore and Free Trade Agreements
An index value above unity indicates that the trading partner is relatively “over-represented” in the home country’s trade (Appendix 1). Singapore’s trade (exports plus imports) intensity indices with the United States and Japan over the period 1980–99 are plotted in Figure 3.5. As can be seen, on an average, all the index values are above unity , indicating an “over representation” of both the United States and Japan as markets for Singapore’ s exports as well as sources of imports. Singapore’s average trade intensity with Japan (1.9) is higher than that with the United States (1.3). This is largely due to Singapore’s higher average import intensity with the former (2.8 versus 1.3). The difference between the export intensities of Singapore with these countries is much lower and has been declining since the mid-1990s. From the perspective of the trade partners, Japan’ s average export intensity with Singapore is fairly high at 2.4 compared with 1.2 in the case of the United States (Figure 3.6). Japan’s import intensity with Singapore is less than 1, implying that Singapore is under-represented as an import source for Japan. Overall, the intensity of Japan’ s total trade with Singapore (1.7) exceeded that of the United States (1.1). However , the extent of trade intensities of both the United States and Japan with Singapore is lower than Singapore’s trade with the two partners. Commodity Composition of Merchandise Trade The preceding analysis focuses only on broad trends in aggregate trade relations. An examination of the commodity composition of trade is necessary to obtain a fuller understanding of Singapore’s trade linkages with Japan and the United States.
© 2001 Institute of Southeast Asian Studies, Singapore
© 2001 Institute of Southeast Asian Studies, Singapore
1980
1982
1992
1994
Export intensity with Japan
1990
Export intensity with US
1988
Trade intensity with Japan
1986
Trade intensity with US
1984
1996
Source: Calculated from IMF, Direction of Trade Statistics Yearbook, various issues.
0.00
0.50
1.00
1.50
2.00
2.50
1998 Year
FIGURE 3.5 Singapore’s Merchandise Trade Intensities with the United States and Japan
Merchandise Trade Linkages 23
© 2001 Institute of Southeast Asian Studies, Singapore
1980
1982
1992
1994
1996
Japan's Export intensity with Singapore
1990
US's Export intensity with Singapore
1988
Japan's Trade intensity with Singapore
1986
US's Trade intensity with Singapore
1984
Source: Calculated from IMF, Direction of Trade Statistics Yearbook, various issues.
0.00
0.50
1.00
1.50
2.00
2.50
3.00
3.50
1998 Year
FIGURE 3.6 United States’ and Japan’s Merchandise Trade Intensities with Singapore
24 Singapore and Free Trade Agreements
Merchandise Trade Linkages
25
Table 3.2 compares the composition of Singapore’s overall exports with exports to the United States and Japan specifically by commodity groups at the SITC 3-digit level in 1999. Singapore’s global exports are concentrated in five product categories, viz., electronics and refined petroleum products (SITC 776, 752, 759, 334, and 764), which constituted nearly 60 per cent of Singapore’ s total world exports. 20 Electronic valves (SITC 776) itself accounted for about 20 per cent of Singapore’s global exports as well as exports to the United States and Japan specifically , making it the second most important Singapore export to both markets. Data processing machines (SITC 752) is the second most important Singapore export globally, but was the most important one to both the United States and Japan. This product accounted for nearly 20 per cent of Singapore’s exports to Japan and 40 per cent of Singapore’s exports to the United States.The top five product categories of Singapore’ s overall exports noted above are among the highest categories of Singapore’ s exports to the United States and Japan, accounting for almost three-quarters and one-half of the city-state’ s total exports to both trading partners, respectively. In fact, seven of the top ten exports from Singapore to both the United States and Japan overlap, indicating a high degree of similarity in commodity composition of Singapore’ s exports to both countries. 21 Of these, petroleum products are of relatively lower importance in Singapore’s exports to the United States compared with the former ’s exports to Japan. This is true even if focus is limited to Singapore’s domestic exports to these countries. Table 3.3 documents the commodity composition of Singapore’s imports from the United States and Japan in 1999. While electronic valves (SITC 776) remains the top-ranked product in Singapore’ s overall imports, constituting nearly one-fifth of the total, the import shares of other electronic
© 2001 Institute of Southeast Asian Studies, Singapore
26
Singapore and Free Trade Agreements
TABLE 3.2 Singapore’s Leading Product Groups of Exports to the World, the United States, and Japan in 1999 (SITC 3-digit level)
Rank
Product Code
1 2 3 4 5 6 7 8 9 10
776 752 759 334 764 772 778 898 515 931
Rank
Product Code
1 2 3 4 5 6 7 8 9 10
752 776 759 764 772 515 334 845 931 874
Exports to the World Share (%)
Product Description Electronic Valves Data Processing Machines Parts for Office and D/P Machines Petroleum Products Refined Telecommunications Equipment Electrical Circuit Apparatus Electrical Machinery Musical Instrument and Parts Organo-inorganic Compounds Special Transactions
Product Description
Exports to United States Share (%)
Data Processing Machines Electronic Valves Parts for Office and D/P Machines Telecommunications Equipment Electrical Circuit Apparatus Organo-inorganic Compounds Petroleum Products Refined Apparel Articles of Textile Special Transactions Measuring Instruments
© 2001 Institute of Southeast Asian Studies, Singapore
20.1 17.3 8.8 7.5 4.5 2.5 2.1 1.7 1.4 1.1
39.3 20.0 12.7 3.5 1.8 1.7 1.5 1.5 1.2 1.1
Merchandise Trade Linkages
27
TABLE 3.2 (continued)
Rank
Product Code
1 2 3 4 5 6 7 8 9 10
752 776 898 759 334 764 931 112 772 716
Exports to Japan Share (%)
Product Description Data Processing Machines Electronic Valves Musical Instrument and Parts Parts for Office and D/P Machines Petroleum Products Refined Telecommunications Equipment Special Transactions Alcoholic Beverages Electrical Circuit Apparatus Electric Plant and Parts
20.8 16.1 10.3 7.7 5.2 2.6 2.4 2.3 1.5 1.4
Source: Singapore Trade Development Board, Singapore Trade Statistics, December 1999.
TABLE 3.3 Singapore’s Leading Product Groups of Imports from the World, the United States, and Japan in 1999 (SITC 3-digit level) Imports from the World Share (%)
Rank
Product Code
Product Description
1 2 3 4 5 6 7 8 9 10
776 759 333 752 334 764 772 778 792 874
Electronic Valves Parts For Office & D/P Machines Petroleum Crude Data Processing Machines Petroleum Products Refined Telecommunications Equipment Electrical Circuit Apparatus Electrical Machinery Aircraft Measuring Instruments
© 2001 Institute of Southeast Asian Studies, Singapore
19.9 7.9 4.8 4.7 4.2 3.9 3.0 2.5 2.0 1.9
28
Singapore and Free Trade Agreements
TABLE 3.3 (continued) Product Rank Code 1 2 3 4 5 6 7 8 9 10
776 792 759 874 898 752 723 728 931 772
Rank
Product Code
1 2 3 4 5 6 7 8 9 10
776 764 759 778 772 728 752 793 874 882
Product Description
Imports from United States Share (%)
Electronic Valves 18.2 Aircraft 8.9 Parts for Office and D/p Machines 6.7 Measuring Instruments 5.5 Musical Instrument and Parts 4.8 Data Processing Machines 4.6 Civil Engineering Equipment and Parts 4.5 Specialized Machinery 3.3 Special Transactions 3.0 Electrical Circuit Apparatus 2.7
Product Description Electronic Valves Telecommunications Equipment Parts for Office and D/P Machines Electrical Machinery Electrical Circuit Apparatus Specialized Machinery Data Processing Machines Ships and Boats Measuring Instruments Photographic Supplies
Imports from Japan Share (%) 21.8 5.3 5.1 4.9 4.6 4.3 4.2 2.8 2.5 1.9
Source: Singapore Trade Development Board, Singapore Trade Statistics, December 1999.
© 2001 Institute of Southeast Asian Studies, Singapore
Merchandise Trade Linkages
29
products and refined petroleum products are much smaller compared with their corresponding export shares. For instance, SITC 752 (data processing machines), which have constituted nearly 40 and 20 per cent of Singapore’s exports to the United States and Japan, respectively, are only 4.6 per cent of Singapore’s imports from the United States and 4.2 per cent from Japan. Refined petroleum products do not figure at all in the top ten items of imports from either country to Singapore. Seven commodity groups, six of them in the categories of electrical and electronic goods and equipment, are also among the top ten commodities of both Singapore’ s overall exports and imports. Four out of these seven product groups overlap in Singapore’s exports to and imports from the United States (SITC 776, 759, 752, and 772), and five in the case of Singapore’s trade with Japan (SITC 334 and 778, being the exceptions). In 1999, these seven commodity groups (i.e. SITC 776, 759, 752, 334, 764, 772, and 778) accounted for 63 per cent of Singapore’s total exports and 46 per cent of its total imports, respectively. All this suggests a priori a high presence of intra-industry trade (IIT). Intra-Industry Trade (IIT) Broadly, IIT refers to the simultaneous import and export of products within the same product category.The most common measure of IIT is the Grubel-Lloyd (G-L) index, which computes the ratio of net exports in a product category to its total trade in an index that takes values from 0 to 100. It is, therefore, a measure of the degree of trade overlap between exports and imports in a given product category or industry. The G-L index takes on a value of 0 if there are no exports or imports of a particular product group, i.e. no IIT . If exports
© 2001 Institute of Southeast Asian Studies, Singapore
30
Singapore and Free Trade Agreements
exactly match imports, both being positive, the G-L index value equals 100 (Appendix 2). The index can be computed at the aggregate trade level as well as a weighted average of IIT in all industries.The weights are based on the share of the industry’s trade in the country’ s total trade. Despite the widespread use of the G-L index, it is not without its problems. For instance, since the G-L index is unable to account for aggregate trade imbalances, it tends to bias downwards the actual intensity of IIT with countries with which bilateral trade is unbalanced (see Rajan 1996 and references cited within). Accordingly, we also provide data on the actual amount/value of IIT as well as make use of data on both total exports as well as only domestic exports (Rajan 1996b). Estimates of the G-L index and the actual level of IIT in Singapore’s trade with the United States and Japan over 1995– 99 using total and domestic exports are presented in Tables 3.4 and 3.5, respectively . Since the preceding section has emphasized that the Singapore’s bilateral trade with the two countries is concentrated in the SITC 3-8 commodity groups, we focus on these categories at the 3-digit disaggregated level. (a) Total Exports The G-L index for trade between Singapore and the United States, using total exports, has remained unchanged over 1995–99, recording a value of about 44, while that for Singapore–Japan trade has increased from 31 in 1995 to 40 by 1999 (Table 3.4). However , except for SITC 776 in the case of Singapore–United States IIT and SITC 759 in the case of Singapore–Japan IIT, each of the other product categories were among the top ten index values, accounting for at most 1 to 3 per cent of total trade (nine product categories accounted for only 7 per cent of total bilateral trade with United States
© 2001 Institute of Southeast Asian Studies, Singapore
96.4 98.7 81.3 65.0 79.0 86.3 93.3 95.0 79.8 38.4 43.4
892 771 871 731 821 884 541 776 746 542 Overall
892 771 871 731 821 884 541 776 746 542 Overall
0.5 0.5 0.2 0.1 0.2 0.1 0.1 17.3 0.2 0.1 100
Index Value
SITC Code
Share in SITC Index Total Code Value Trade
99.1 97.4 97.0 96.0 95.2 93.9 93.1 92.7 87.1 86.0 43.7
1996
1995
0.5 0.4 0.1 0.1 0.2 0.2 0.1 17.7 0.2 0.1 100
Share in Total Trade 892 771 871 731 821 884 541 776 746 542 Overall
SITC Code 85.4 99.0 84.3 73.4 70.7 74.4 95.2 95.8 76.4 34.4 44.8
Index Value
1997
0.5 0.4 0.1 0.1 0.2 0.4 0.1 18.4 0.2 0.1 100
Share in Total Trade 553 892 771 881 776 058 931 764 895 541 Overall
SITC Code 98.6 98.1 95.5 95.2 92.7 92.5 92.3 89.0 88.9 83.1 44.2
Index Value
1998
0.4 0.5 0.4 0.2 18.5 0.1 2.0 2.2 0.1 0.2 100
553 892 771 881 776 058 931 764 895 541 Overall
Share in Total SITC Trade Code
85.6 99.8 96.8 66.5 87.8 98.1 64.9 71.4 71.4 43.8 43.8
0.4 0.6 0.4 0.1 19.2 0.1 2.0 2.9 0.1 0.4 100
Share in Index Total Value Trade
1999
Product Groups with Ten Highest G-L index Values of IIT between Singapore and the U.S.
TABLE 3.4 Singapore’s Intra-Industry Trade with the United States and Japan: 1995–99 (computed with total export values)
Merchandise Trade Linkages 31
© 2001 Institute of Southeast Asian Studies, Singapore
Share in Total Trade
SITC Code
Amount (S$ million)
1996
Share in Amount Total SITC (S$ Trade Code million
1997 Share in Total Trade
1999
Share Share Amount in Amount in SITC (S$ Total SITC (S$ Total Code million) Trade Code million) Trade
1998
776 9126.1 17.3 776 10559.3 17.7 776 11844.4 18.4 776 11622.0 18.5 776 11662.3 19.2 759 4641.6 13.0 759 5114.9 11.7 759 5256.1 10.8 759 4473.7 9.6 759 4315.5 9.9 752 3155.7 23.9 752 3048.9 25.4 752 3301.3 24.9 752 3208.6 25.9 752 2955.1 23.3 764 1216.4 3.0 764 1435.0 2.6 764 1502.2 2.4 764 1320.1 2.2 764 1432.3 2.9 772 651.2 1.7 772 668.4 1.4 772 724.3 1.5 931 1222.4 2.0 931 912.4 2.0 778 412.1 1.6 778 441.3 1.4 778 556.0 1.5 772 956.9 1.9 772 1352.9 2.2 334 385.8 1.0 334 516.9 1.0 334 533.5 0.9 874 698.3 2.4 874 814.3 3.1 931 359.0 1.2 931 411.9 1.3 931 801.5 1.7 778 664.3 1.6 778 701.9 1.7 741 349.0 0.7 741 340.5 0.7 741 388.7 0.7 792 441.7 4.7 792 389.3 4.4 872 326.4 0.8 872 368.7 0.7 872 400.9 0.7 334 408.9 0.8 334 780.4 1.4 Overall 52940.66 100 Overall 60512.61 100 Overall 66034.438 100 Overall 62506.64 100 Overall 64088.4 100
Amount SITC (S$ Code million)
1995
TABLE 3.4 (continued) Product Groups with Ten Highest Levels of IIT between Singapore and the United States
32 Singapore and Free Trade Agreements
© 2001 Institute of Southeast Asian Studies, Singapore
892 771 871 731 821 884 541 776 746 542 Overall
SITC Code
892 771 871 731 821 884 541 776 746 542 Overall
96.5 98.7 84.3 74.1 82.7 87.9 93.7 95.2 83.2 61.9 63.3
0.5 0.4 0.1 0.1 0.2 0.2 0.1 17.7 0.2 0.1 100
Share in Index Total Value Trade
Share in Index Total SITC Value Trade Code
99.1 0.5 97.5 0.5 97.1 0.2 96.2 0.1 95.4 0.2 94.2 0.1 93.5 0.1 93.2 17.3 88.6 0.2 87.7 0.1 62.0 100
1996
1995
892 771 871 731 821 884 541 776 746 542 Overall
SITC Code 87.2 99.0 86.4 79.0 77.4 79.6 95.4 96.0 80.9 60.4 64.2
Index Value
1997
0.5 0.4 0.1 0.1 0.2 0.4 0.1 18.4 0.2 0.1 100
Share in Total Trade 553 98.6 0.4 892 98.1 0.5 771 95.7 0.4 881 95.4 0.2 776 93.2 18.5 058 93.0 0.1 931 92.9 2.0 764 90.1 2.2 895 90.0 0.1 541 85.5 0.2 Overall 63.8 100
SITC Code
Share in Index Total Value Trade
1998
553 892 771 881 776 058 931 764 895 541 Overall
SITC Code
87.4 0.4 99.8 0.6 96.9 0.4 74.9 0.1 89.1 19.2 98.1 0.1 74.0 2.0 77.7 2.9 77.8 0.1 64.0 0.4 63.3 100
Share in Index Total Value Trade
1999
TABLE 3.4 (continued) Product Groups with Ten Highest Degrees of IIT between Singapore and the United States
Merchandise Trade Linkages 33
© 2001 Institute of Southeast Asian Studies, Singapore
Index Value
97.9 91.8 85.4 79.3 77.6 77.1 75.2 73.3 70.6 69.2 31.1
SITC Code
894 761 885 931 553 762 792 893 872 515 Overall
1995
0.5 0.8 0.5 1.0 0.2 0.8 0.1 0.4 0.4 0.3 100
Share in Total Trade
894 792 885 893 553 762 761 931 773 872 Overall
SITC Code
99.3 96.6 94.7 94.0 86.3 85.2 81.0 79.7 75.1 70.9 36.1
0.6 0.1 0.7 0.4 0.2 0.7 0.8 1.0 0.6 0.5 100
Share in Index Total Value Trade
1996
893 931 773 553 761 885 762 892 516 775 Overall
SITC Code 99.4 98.3 96.4 96.1 88.9 85.8 82.7 80.6 80.2 69.1 36.2
Index Value
1997
0.5 1.2 0.5 0.2 0.5 0.9 0.5 0.3 0.1 0.2 100
Share in Total Trade 892 759 893 516 931 899 792 894 885 541 Overall
SITC Code 96.8 87.6 85.5 83.6 83.0 80.6 77.4 77.2 74.8 72.4 40.8 0.2 6.0 0.5 0.1 1.7 0.1 0.3 0.3 1.0 0.1 100
Share in Index Total Value Trade
1998
885 516 792 893 931 761 541 884 759 892 Overall
SITC Code
96.1 93.9 91.5 86.3 85.9 84.7 84.4 84.0 81.9 81.2 39.8
0.7 0.1 0.3 0.4 1.3 0.5 0.1 0.3 5.9 0.3 100
Share in Index Total Value Trade
1999
TABLE 3.4 (continued) Product Groups with Ten Highest G-L Index Values of IIT between Singapore and Japan
34 Singapore and Free Trade Agreements
© 2001 Institute of Southeast Asian Studies, Singapore
776 4482.9 21.7 776 752 2901.0 9.6 752 764 1044.5 6.2 759 759 962.1 3.1 764 763 568.9 1.9 931 931 406.0 1.0 772 761 359.5 0.8 771 772 330.3 3.5 761 771 323.9 1.1 763 762 310.5 0.8 885 Overall 26132 100 Overall
SITC Code
Share Amount in (S$ Total SITC million) Trade Code
1995
5218.2 2938.8 1442.0 869.4 366.9 351.0 350.6 325.4 307.0 303.5 28909
19.9 776 10.4 752 4.2 759 5.0 764 1.0 931 3.3 898 1.1 772 0.8 716 1.2 885 0.7 771 100 Overall
Share Amount in (S$ Total SITC million) Trade Code
1996
4550.6 3175.3 1627.0 919.9 540.4 521.0 399.6 368.5 361.4 349.5 26249 18.2 9.9 4.9 4.7 1.2 2.2 3.4 1.5 0.9 1.2 100
Share Amount in (S$ Total million Trade
1997
776 752 759 764 898 931 716 772 885 771 Overall
SITC Code 4099.8 2926.0 2128.7 782.5 683.9 587.4 421.6 382.6 316.2 291.7 24179
19.1 10.5 6.0 4.8 2.4 1.7 1.7 3.6 1.0 1.2 100
Share Amount in (S$ Total million) Trade
1998
776 752 759 898 764 931 772 716 771 885 Overall
4645.7 20.0 2648.3 9.5 2207.8 5.9 1132.7 4.5 757.7 4.4 522.0 1.3 422.8 3.6 393.6 1.4 325.0 1.2 321.7 0.7 28841 100
Share Amount in SITC (S$ Total Code million) Trade
1999
TABLE 3.4 (continued) Product Groups with Ten Highest Levels of IIT between Singapore and Japan
Merchandise Trade Linkages 35
© 2001 Institute of Southeast Asian Studies, Singapore
© 2001 Institute of Southeast Asian Studies, Singapore
97.9 92.4 87.3 82.8 81.7 81.3 80.2 78.9 77.3 76.5 67.5
894 761 885 931 553 762 792 893 872 515 Overall
0.5 0.8 0.5 1.0 0.2 0.8 0.1 0.4 0.4 0.3 100
Share in Total Trade
894 792 885 893 553 762 761 931 773 872 Overall
SITC Code
99.3 96.7 95.0 94.4 88.0 87.1 84.1 83.2 80.0 77.5 71.5
0.6 0.1 0.7 0.4 0.2 0.7 0.8 1.0 0.6 0.5 100
Share in Index Total Value Trade
1996
893 931 773 553 761 885 762 892 516 775 Overall
SITC Code 99.4 98.4 96.5 96.3 90.0 87.6 85.2 83.8 83.5 76.4 69.0
Index Value
1997
0.5 1.2 0.5 0.2 0.5 0.9 0.5 0.3 0.1 0.2 100
Share in Total Trade 892 759 893 516 931 899 792 894 885 541 Overall
SITC Code
Source: Singapore Trade Development Board, Singapore Trade Statistics, various issues.
Index Value
SITC Code
1995
96.9 89.0 87.3 85.9 85.5 83.7 81.6 81.4 79.9 78.4 71.3 0.2 6.0 0.5 0.1 1.7 0.1 0.3 0.3 1.0 0.1 100
Share in Index Total Value Trade
1998
885 516 792 893 931 761 541 884 759 892 Overall
SITC Code
96.3 94.3 92.2 87.9 87.6 86.8 86.5 86.2 84.7 84.2 73.0
0.7 0.1 0.3 0.4 1.3 0.5 0.1 0.3 5.9 0.3 100
Share in Index Total Value Trade
1999
TABLE 3.4 (continued) Product Groups with Ten Highest Degrees of IIT between Singapore and Japan
36 Singapore and Free Trade Agreements
892 731 541 764 746 821 884 542 776 642 Overall
94.6 64.7 90.9 77.1 81.8 72.6 70.0 32.8 77.5 56.0 36.8
98.4 0.6 97.6 0.1 97.4 0.1 91.9 2.6 89.8 0.3 88.2 0.2 86.3 0.1 82.9 0.1 82.1 15.3 75.7 0.2 39.4 100
SITC Code
892 731 541 764 746 821 884 542 776 642 Overall
Index Value
Share in Index Total Value Trade
SITC Code
1996
1995
0.6 0.2 0.1 2.1 0.2 0.2 0.2 0.1 15.4 0.2 100
Share in Total Trade 892 731 541 764 746 821 884 542 776 642 Overall
SITC Code 84.5 70.6 96.5 56.0 80.9 64.9 67.9 30.7 81.9 45.1 38.3
Index Value
1997
0.6 0.1 0.1 2.0 0.2 0.2 0.2 0.1 16.7 0.2 100
Share in Total Trade 892 541 776 629 759 334 771 764 884 872 Overall
SITC Code 97.0 84.4 83.1 75.4 74.8 73.2 71.2 70.0 67.3 66.7 37.9
Index Value
1998
0.6 0.2 16.8 0.1 10.1 0.9 0.4 1.7 0.3 1.0 100
Share in Total Trade
892 541 776 629 759 334 771 764 884 872 Overall
SITC Code
98.1 44.1 86.8 81.1 68.1 83.0 69.1 96.3 61.1 72.5 39.9
0.6 0.5 17.0 0.1 10.5 1.6 0.3 2.3 0.4 0.9 100
Share in Index Total Value Trade
1999
Product Groups with Ten Highest G-L index Values of IIT between Singapore and the U.S.
TABLE 3.5 Singapore’s Intra-Industry Trade with the United States and Japan: 1995–99 (computed with domestic export values)
Merchandise Trade Linkages 37
© 2001 Institute of Southeast Asian Studies, Singapore
Share Amount in (S$ Total SITC million) Trade Code
1996 Share Amount in (S$ Total million) Trade
1998
SITC Code
Share Amount in (S$ Total million) Trade
1999
16.7 776 8268.4 16.8 776 8939.8 17.0 11.2 759 4473.7 10.1 759 4315.5 10.5 26.2 752 3208.6 27.6 752 2955.1 24.9 2.0 772 778.7 2.1 772 1133.6 2.3 1.5 764 710.6 1.7 764 1329.8 2.3 1.0 874 638.9 2.7 874 743.1 3.5 0.7 334 408.9 0.9 334 780.4 1.6 0.6 872 386.7 1.0 872 404.6 0.9 0.8 892 349.0 0.6 892 368.9 0.6 2.2 792 346.9 5.3 792 269.7 4.9 100 Overall 55556.8 100 Overall 57147.6 100
Share Amount in (S$ Total SITC million Trade Code
1997
776 6358.4 15.3 776 6677.3 15.4 776 8210.2 759 4641.6 13.8 759 5114.9 12.3 759 5256.1 752 3155.7 25.0 752 3048.9 26.8 752 3301.3 764 1216.4 2.6 764 900.8 2.1 764 670.1 772 491.1 1.7 772 537.5 1.4 772 584.2 334 371.8 1.1 334 516.9 1.1 334 511.8 872 326.4 0.9 872 368.7 0.8 872 400.9 892 301.9 0.6 892 302.7 0.6 892 296.2 741 271.9 0.8 741 277.6 0.7 741 313.1 898 265.5 2.4 898 165.4 2.8 898 191.6 Overall 48426.06 100 Overall 51378.27 100 Overall 53698.64
SITC Code
Share Amount in (S$ Total SITC million) Trade Code
1995
TABLE 3.5 (continued) Product Groups with Ten Highest Levels of IIT between Singapore and the United States
38 Singapore and Free Trade Agreements
© 2001 Institute of Southeast Asian Studies, Singapore
892 731 541 764 746 821 884 542 776 642 Overall
SITC Code
98.4 97.7 97.5 92.5 90.7 89.4 88.0 85.4 84.8 80.5 60.0
0.6 892 0.1 731 0.1 541 2.6 764 0.3 746 0.2 821 0.1 884 0.1 542 15.3 776 0.2 642 100 Overall
94.9 73.9 91.7 81.4 84.6 78.5 76.9 59.8 81.6 69.4 59.7
Index Value
Share in Index Total Value Trade
SITC Code
1996
1995
0.6 0.2 0.1 2.1 0.2 0.2 0.2 0.1 15.4 0.2 100
Share in Total Trade 892 731 541 764 746 821 884 542 776 642 Overall
SITC Code 86.6 77.3 96.6 69.4 83.9 74.0 75.7 59.1 84.7 64.5 60.6
Index Value
1997
0.6 0.1 0.1 2.0 0.2 0.2 0.2 0.1 16.7 0.2 100
Share in Total Trade 892 541 776 629 759 334 771 764 884 872 Overall
SITC Code 97.1 86.5 85.6 80.2 79.9 78.9 77.6 76.9 75.4 75.0 60.8
0.6 0.2 16.8 0.1 10.1 0.9 0.4 1.7 0.3 1.0 100
Share in Index Total Value Trade
1998
892 541 776 629 759 334 771 764 884 872 Overall
SITC Code
98.2 64.1 88.3 84.1 75.8 85.5 76.4 96.4 72.0 78.4 62.3
0.6 0.5 17.0 0.1 10.5 1.6 0.3 2.3 0.4 0.9 100
Share in Index Total Value Trade
1999
TABLE 3.5 (continued) Product Groups with Ten Highest Degrees of IIT between Singapore and the U.S.
Merchandise Trade Linkages 39
© 2001 Institute of Southeast Asian Studies, Singapore
87.7 82.3 81.5 76.0 75.6 69.9 67.0 65.2 60.2 57.4 26.7
761 821 872 893 515 752 098 762 892 512 Overall
893 761 821 872 762 892 752 515 098 597 Overall
88.8 83.1 75.8 69.9 69.3 65.5 63.9 63.0 60.3 56.4 23.8
SITC Code
0.8 0.1 0.4 0.4 0.4 9.6 0.3 0.8 0.4 0.1 100
Index Value
Share in Index Total Value Trade
SITC Code
1996
1995
0.4 0.9 0.1 0.5 0.7 0.3 10.1 0.4 0.3 0.2 100
Share in Total Trade 761 752 892 893 516 515 762 098 872 821 Overall
SITC Code 89.4 86.1 85.3 80.9 79.2 69.8 68.6 66.7 66.4 66.0 26.6
Index Value
1997
0.6 8.7 0.3 0.4 0.1 0.4 0.5 0.3 0.5 0.1 100
Share in Total Trade 892 752 762 515 516 759 899 898 893 512 Overall
SITC Code 97.9 92.3 84.3 76.5 72.2 71.2 69.4 68.8 67.1 59.2 30.5 0.2 9.0 0.3 0.3 0.1 6.0 0.1 2.7 0.5 0.1 100
Share in Index Total Value Trade
1998
516 762 892 761 752 513 893 541 759 872 Overall
SITC Code
94.8 93.6 84.3 84.3 83.4 75.8 75.7 73.0 71.1 69.0 30.1
0.1 0.3 0.3 0.6 7.9 0.4 0.4 0.1 6.1 0.6 100
Share in Index Total Value Trade
1999
TABLE 3.5 (continued) Product Groups with Ten Highest G-L Index Values of IIT between Singapore and Japan
40 Singapore and Free Trade Agreements
© 2001 Institute of Southeast Asian Studies, Singapore
752 2901.0 776 2776.7 759 722.6 764 660.8 761 338.7 772 266.0 763 257.0 898 230.2 762 227.7 334 206.2 Overall 18101.14
SITC Code
Share Amount in (S$ Total SITC million) Trade Code
1996 Share Amount in (S$ Total SITC million Trade Code
1997
9.6 776 3146.6 19.6 752 3175.3 8.7 752 21.7 752 2938.8 10.1 776 2370.5 17.9 776 3.1 759 945.5 4.1 759 1095.5 4.9 759 6.4 764 565.8 5.1 764 574.0 4.9 898 0.8 761 325.4 0.9 898 492.6 2.5 764 3.8 772 282.3 3.6 772 309.8 3.7 772 1.7 898 265.5 2.3 716 263.7 1.6 716 1.8 762 225.5 0.7 761 226.8 0.6 931 0.8 334 187.4 3.8 778 179.3 3.5 778 2.8 716 183.9 1.7 893 146.7 0.4 874 100 Overall 19578.28 100 Overall 15911.43 100 Overall
Share Amount in (S$ Total SITC million) Trade Code
1995
SITC Code
Share Amount in (S$ Total million) Trade
1999
2926.0 9.0 752 2648.3 7.9 2081.2 19.0 776 2436.3 20.0 1509.3 6.0 759 1755.8 6.1 667.6 2.7 898 1132.7 5.1 528.0 5.1 764 420.1 4.6 270.3 3.9 772 262.4 3.9 250.7 1.7 761 210.2 0.6 148.6 1.0 872 171.4 0.6 135.4 3.8 334 166.5 2.1 121.8 1.6 931 158.4 0.8 13894.17 100 Overall 17977.4 100
Share Amount in (S$ Total million) Trade
1998
TABLE 3.5 (continued) Product Groups with Ten Highest Levels of IIT between Singapore and Japan
Merchandise Trade Linkages 41
© 2001 Institute of Southeast Asian Studies, Singapore
© 2001 Institute of Southeast Asian Studies, Singapore
0.4 0.9 0.1 0.5 0.7 0.3 10.1 0.4 0.3 0.2 100
Share in Total Trade 761 752 892 893 516 515 762 098 872 821 Overall
SITC Code 90.4 87.8 87.2 84.0 82.8 76.8 76.1 75.0 74.9 74.6 61.5
Index Value
1997
0.6 8.7 0.3 0.4 0.1 0.4 0.5 0.3 0.5 0.1 100
Share in Total Trade 892 752 762 515 516 759 899 898 893 512 Overall
SITC Code
Source: Singapore Trade Development Board, Singapore Trade Statistics, various issues.
89.0 85.0 84.4 80.6 80.4 76.9 75.2 74.2 71.5 70.1 64.6
761 821 872 893 515 752 098 762 892 512 Overall
893 761 821 872 762 892 752 515 098 597 Overall
90.0 85.6 80.5 76.9 76.5 74.3 73.5 73.0 71.6 69.6 62.1
SITC Code
0.8 0.1 0.4 0.4 0.4 9.6 0.3 0.8 0.4 0.1 100
Index Value
Share in Index Total Value Trade
SITC Code
1996
1995
97.9 92.8 86.4 81.0 78.3 77.6 76.6 76.2 75.2 71.0 62.2 0.2 9.0 0.3 0.3 0.1 6.0 0.1 2.7 0.5 0.1 100
Share in Index Total Value Trade
1998
516 762 892 761 752 513 893 541 759 872 Overall
SITC Code
95.0 94.0 86.4 86.4 85.7 80.5 80.5 78.7 77.6 76.3 64.3
0.1 0.3 0.3 0.6 7.9 0.4 0.4 0.1 6.1 0.6 100
Share in Index Total Value Trade
1999
TABLE 3.5 (continued) Product Groups with Ten Highest Degrees of IIT between Singapore and Japan
42 Singapore and Free Trade Agreements
Merchandise Trade Linkages
43
and only 4 per cent of bilateral trade with Japan). This highlights the need to carefully dif ferentiate between levels or volumes and degree of IIT. The G-L index is a measure of the latter. It is therefore important to consider the actual level of IIT (Rajan 1996). Singapore–United States IIT has increased (by US$6 billion to US$7 billion) over the period 1995–99 (nearly 90 per cent of increase in total Singapore–United States trade over 1995–99), in spite of a decline of US$2 billion to US$3 billion in one year (i.e. over 1997–98) as a result of the East Asian crisis. The total value of Singapore–United States IIT thus stood at US$38 billion in 1999, while Singapore–Japan IIT was less than half that volume (US$17 billion). In the case of Singapore’s IIT with both the United States and Japan, the top four products that have experienced the highest levels of IIT, i.e. SITC 776, 752, 759, and 764, are similar . These constitute nearly one-half of Singapore’ s total value of IIT with the United States and about two-fifths of that with Japan. As analysed earlier, these products also happen to be the topranked products in Singapore’s exports to both these countries. Over the period, notwithstanding the crisis years of 1997–98, most of the products maintained their rankings with respect to the level of IIT. Focusing on the top ten product categories of IIT, in 1998, two products, viz., SITC 741 and 872 were displaced by SITC 874 and 792 in the case of Singapore– United States IIT . In 1997 in the case of Singapore–Japan IIT, SITC 761 and 763 products were displaced by SITC 716 and 898 (Table 3.4). (b) Domestic Exports Does exclusion of the entrepôt component of Singapore’ s trade with these countries lead to any significant alteration in the
© 2001 Institute of Southeast Asian Studies, Singapore
44
Singapore and Free Trade Agreements
above conclusions? The G-L index values using domestic exports are lower for IIT with both countries, particularly with regard to trade with Japan (declining from 40 to 30 in 1999), compared with that for the United States (declining from 44 to 40 in the same period) (T ables 3.4 and 3.5). This is a reflection of the higher proportion of Singapore exports to Japan being entrepôt-related as previously noted. In terms of the level of IIT using domestic exports, there has been an increase of almost S$9 billion in the case of Singapore’s IIT with the United States over 1995–99.There was no change in the case of IIT with Japan over the same period (Table 3.5). Thus, the observed increase in Singapore–Japan IIT when using total exports has been entirely due to increasing trade with other countries in the region, with Singapore being used as a transhipment point. In contrast, the increase in the case of Singapore–United States IIT is more due to intensified IIT with goods that have under gone significant transformation (value-added) in Singapore per se. The product composition of Singapore’s IIT with the two countries is largely unaffected by the exclusion of re-exports.
© 2001 Institute of Southeast Asian Studies, Singapore
Impact of Changes in Foreign Demand on Singapore Economy
45
4 Impact of Changes in Foreign Demand on the Singapore Economy
Having examined the various bilateral linkages between the city-state and the two economic superpowers, this chapter undertakes a formal empirical examination of the importance of demand changes in the United States and Japan on Singapore’s exports. This chapter is divided into two parts. Given the importance of merchandise trade in Singapore’ s external linkages on the one hand, and the paucity of data on trade in services and foreign direct investment (FDI), we initially limit focus to the impact of changes in foreign demand on Singapore’s merchandise exports. This requires us to construct and estimate a set of merchandise export demand functions. We then turn our attention to the more general question of how important fluctuations in the aggregate income levels of the two trading partners are on the Singapore economy via Singapore’s exports. Export Demand Functions There are two primary determinants of export demand (Dornbusch 1988; Hooper and Marquez 1993). First, is the
[email protected]
45 © 2001 Institute of Southeast Asian Studies, Singapore
46
Singapore and Free Trade Agreements
foreign income variable (Yus and Yjpn). Second, is the relative price variable, proxied by domestic price level vis-à-vis the U.S. price level (Psgus) and the domestic price level relative to the Japanese price level ( Psgjpn). In addition, sharp gyrations in the foreign exchange markets in the last decade (Bird and Rajan 2001) necessitate that we explicitly take into account exchange rate volatility as another explanatory variable in the export demand function (Chowdhury 1993; Chou 2000; Daly 1998; McKenzie 1998). We do so by constructing a real exchange rate volatility index ( Vus and Vjpn). The index is constructed by the moving sample standard deviation of the growth rate of the real exchange rate (Kenen and Rodrik 1986; Koray and Lastrapes 1989; Chowdhury 1993): m
Vt = [(1/m) Σ (log Qt + i – 1 – Qt + i – 2)2]1/2 i =1
where: Q is the real exchange rate and m = 8 quarters. Following Chowdhury (1993) and Daly (1998), we also include a lag variable of change in exports ( ∆Xsgust – i and ∆Xsgjpnt – i). The inclusion of this variable is meant to capture the impact of past export growth on current exports, i.e. a socalled “adjustment factor” à la Goldstein and Khan (1976). Descriptions of the variables and sources of the data are presented in Table 4.1. Before constructing an empirical model, it is necessary to examine the basic unit-root properties of the relevant variables.22 Based on theADF-statistics, we conclude that all the variables are integrated of order 1 or are I(1) (i.e. their means and variances do not fluctuate around a constant), with the exception of the volatility index of the real exchange rate which is I(0) (Table 4.2). Since the variables Xsgus, Xsgjpn, Yus, Yjpn, Psgus, Psgjpn are integrated of order 1, while the variables Vus and Vjpn are stationary (constant mean and
© 2001 Institute of Southeast Asian Studies, Singapore
Impact of Changes in Foreign Demand on Singapore Economy
47
TABLE 4.1 Variable Description Variable
Descriptions
Source
Ysg
Gross Domestic Product of Singapore
IFS CD-Rom
Gross Domestic Product of the U.S.
IFS CD-Rom
Xsgus Yus Psgus
Xsgjpn Yjpn
Export of Singapore to the U.S. market
Terms of Trade of Singapore’s products against the U.S. products.
Export of Singapore to the Japanese market Gross Domestic Product of Japan
Psgjpn
Terms of Trade of Singapore’s products against Japanese products.
Vus
Real Exchange Rate Volatility Index of the Singapore dollar against the U.S. dollar.
Vjpn
Real Exchange Rate Volatility Index of the Singapore dollar against the Japanese Yen.
© 2001 Institute of Southeast Asian Studies, Singapore
IMF, Direction of Trade Statistics
Authors’ own calculations. The primary data to construct the index are from IFS CD-Rom. IMF, Direction of Trade Statistics IFS CD-Rom Authors’ own calculations. The primary data to construct the index are from IFS CD-Rom. Authors’ own calculations.
Authors’ own calculations.
48
Singapore and Free Trade Agreements
TABLE 4.2 ADF Unit-Root Test k
∆Xt = δ1 + δ2 t + δ3 Xt – 1 Variablea
ADF-statistics (Xt)
Ysg c Xsgusc Yusc Psgusc Xsgjpnc Yjpnc Psgjpnc Vusd Vjpnd
–1.1124 (lags = 2)b –1.2475 (lags = 2) –2.9938 (lags = 2) –1.5363 (lags = 4) –2.7714 (lags = 1) –2.5202 (lags = 2) –2.2834 (lags = 4) –3.9965 (lags = 1) –4.1253 (lags = 2)
Σ β + ∆X
i =1
i
t–i
+ εt
ADF-statistics (Xt – Xt – 1) –5.2012 (lags = 2) –6.2064 (lags = 2) –3.7485 (lags = 2) –5.1177 (lags = 4) –7.3959 (lags = 1) –3.7049 (lags = 2) –3.9561 (lags = 4) not relevant not relevant
Notes: a All variables are in the log-forms. b The number of lags is determined byAkaike Information Criterion (AIC). c These variables are found to be an integrated of order 1 series (I(1)) at 5% critical value. d These variables are found to be an integrated of order 0 series ((I(0)) at 5% critical value.
variance), the results of the regressions of these variables in levels may represent a totally spurious relationship. The Rsquare may be high, but more often than not, we will find the Durbin-Watson to be very low (indicating the presence of serial correlations). To address this problem (i.e. to discount the possibility of the regressions capturing spurious movements in the variables), we construct the export demand functions: ∆Xsgust = α1+ β11∆Yust – i + β12∆Psgust – i + β13∆Vust – i + β14∆Xsgust – i + β15Du + ε1 (1)
© 2001 Institute of Southeast Asian Studies, Singapore
Impact of Changes in Foreign Demand on Singapore Economy
49
∆Xsgjpnt = α2+ β21∆Yjpnt – i + β22∆Psgjpnt – i + β23∆Vjpnt – i+ β24∆Xsgjpnt – i + β25Du + ε2t (2) ∆ denotes the first difference of the log forms of the variables. For instance: ∆Xsgjpnt = log(Xsgjpnt) – log(Xsgjpnt – 1). An important caveat should be noted. The Monetary Authority of Singapore (MAS) switched to a policy of a steady appreciation of the local currency against its key trading partners’ currencies in the early 1980s, culminating with the recession in 1985–86 (Rajan and Siregar 2000).Accordingly, we include a Dummy variable (Du) to capture the impacts of the shift in this exchange rate policy and the 1985–86 recession. This variable is equal to 0 from quarter 1, 1981 to quarter 4, 1986; otherwise it is equal to 1. ε1t and ε2t are error terms, while α1 and α2 are constant terms. (a)
Theoretical Preliminaries
A priori, we expect the coefficient estimates for β11 and β21 to be positive, as rising aggregate demand (income) in Japan and the United States ought to stimulate Singapore’s exports to the respective markets. As for the coefficient estimates for β12 and β22, the signs are expected to be negative. The rise in the price of the domestic good relative to the foreign good worsens the competitiveness of, and therefore the demand for the local (Singapore) good in the foreign markets (Japan and the United States). The coefficient of the volatility index (β13 and β23) can either be positive or negative (Bailey 1987; Daly 1998; Giovannini 1988). If firms are risk-averse, exchange rate volatility acts as a negative shock, causing the export price to rise and the export volume to fall. On the other hand, risk-neutral firm with export prices invoiced in domestic currency may cut prices in response to exchange rate volatility ,
© 2001 Institute of Southeast Asian Studies, Singapore
50
Singapore and Free Trade Agreements
hence causing the export demand (volume) to rise. The coefficient estimates for β14 and β24 are expected to be negative as high growth in export demands during the period (t – i) will, in all likelihood, lead to weaker export demand at period (t). Our observation period covers the time prior to the breakout of the 1997–98 EastAsian crisis (quarter 1, 1980 to quarter 2, 1997). We conduct the standard OLS tests on both equations. Following the commonly used process of generalto-specific methodology (see Hendry 1974, 1977), we include four-quarter lags (t – 4) of the key explanatory variables in the first stage of the OLS test. On the next sequential stages, we drop all the insignificant lags and only consider the 23 significant ones for the final stage of the estimating equation. (b)
Results
The main results of the regressions are as follows (Tables 4.3 and 4.4). The coef ficient estimates for income, price, and volatility index variables (for the case of Japan) are statistically significant and theoretically consistent. We dropped the Dummy variable due to low t-statistics. The F-statistics and the R-square confirm the overall soundness of the model, in the sense that all the explanatory variables in each equation contribute significantly in explaining the variations in the export demands of Singapore to Japan and the United States. In addition, we are able to reject any presence of serial correlation problems in both regressions on the bases of the Durbin-Watson and the Arch-LM test statistics (equations 1 and 2). The roles of both the U.S. and Japanese aggregate demands (incomes) are statistically significant explanatory variables in the performance of the Singapore’ s exports to the respective markets. For each export function, the estimated
© 2001 Institute of Southeast Asian Studies, Singapore
Impact of Changes in Foreign Demand on Singapore Economy
TABLE 4.3 Export Function Model (For Singapore – the U.S.) Dependent Variable: ∆Xsgust Sample Period: Quarter 1, 1980 – Quarter 2, 1997 Variable
Coefficient
t-statistics
∆Xsgust –1 ∆Yust – 2 ∆Psgust –1 ∆Vust – 2 Constant
–0.321 1.508 –0.556 –0.036 0.033
–2.8317a 1.6274b –1.8865b –1.2826c 2.7902
Notes: R-squared = 0.2051; F-statistics = 4.2574; Durbin-Watson = 2.0834; ARCH-LM = 0.7605 (Probability of no serial correlation = 0.3832). a significant at 5% critical value. b significant at 10% critical value. c not significant at 10% critical value.
TABLE 4.4 Export Function Model (For Singapore – Japan) Dependent Variable: ∆Xsgjpnt Sample Period: Quarter 1, 1980 – Quarter 2, 1997 Variable
Coefficient
t-statistics
∆Xsgjpnt – 1 ∆Yjpnt – 2 ∆Psgjpnt – 2 ∆Vjpnt – 4 Constant
–0.348 2.222 –0.731 –0.112 –0.003
–3.1347a 1.8592b –1.7075b –1.7107b –0.1576
Notes: R-squared = 0.2242; F-statistics = 4.696; Durbin-Watson = 1.8049; ARCH-LM = 0.0628 (Probability of no serial correlation = 0.8021). a significant at 5% critical value. b significant at 10% critical value.
© 2001 Institute of Southeast Asian Studies, Singapore
51
52
Singapore and Free Trade Agreements
coefficient for the foreign income variable is found to be the largest among all the explanatory variables.The relative price factors also play an important role in Singapore’s exports to both Japan and to the United States. In addition, we find a rise in the volatility of the real exchange rate impedes exports of Singapore to Japan and the United States. However, based on the t-statistics of the coefficient estimates, we find that the volatility index is more significant in the case of Singapore’s exports to Japan than in the case of Singapore’ s exports to the 24 U.S. market. Significance of Foreign Exports to Aggregate Demand in Singapore Having formally confirmed the significance of the United States and the Japanese incomes in explaining the performance of Singapore’s merchandise exports to both key markets, we focus on the more general question of if and how changes in Singapore’s merchandise exports to the United States and Japan affects the city-state’s aggregate demand. For the purposes at hand, we use a general empirical model:25 Ysgt= F(Xsgust and Xsgjpnt)
(3)
where: F(.) represents a general functional form; Ysgt is Singapore’s aggregate demand as proxied by domestic GDP; and Xsgust and Xsgjpnt are as described earlier. (a) Long-Run Relationships Since all the relevant variables in equation (3) are integrated of order 1 or I(1), we proceed to test the possible existence of long-run or co-integrating relationship between the three
© 2001 Institute of Southeast Asian Studies, Singapore
Impact of Changes in Foreign Demand on Singapore Economy
53
variables in question (using log forms). The Johansen Maximum Likelihood test results are summarized in Table 4.5. We can conclude that there exists one co-integrating relationship between these three variables. From the normalized coefficient estimates, we can further confirm that the variables (Xsgus and Xsgjpn) contribute significantly and positively to the overall fluctuations of Singapore’s aggregate demand/output during the period of quarter 2, 1982 to quarter 2, 1997. For this specific period, we find that a 1 per cent rise in the aggregate demands of Japan and the United States respectively, trigger an increase of around 0.5 per cent and 0.4 per cent in Singapore’s aggregate demand in the long run. (b) Error Correction Model: Short-Run Scenario We proceed to examine the case of the short run.To understand the short-run impact of Xsgus and Xsgjpn on Singapore’ s TABLE 4.5 Co-integration Test Sample Period: Quarter 1, 1982 – Quarter 2, 1997 Eigen value
Likelihood Ratio
5 Per Cent Critical Value
0.2792 0.1612 0.0004
31.05a 10.69 0.316
29.68 15.41 3.76
Notes: a Likelihood Ratio test indicates 1 co-integrating equation at 5% significance level. Normalized Co-integrating Coefficients: Yt = 6.219 + 0.4936 Xsgjpnt + 0.4138 Xsgust (0.1885) (0.1763) ( ) represents the standard errors.
© 2001 Institute of Southeast Asian Studies, Singapore
54
Singapore and Free Trade Agreements
TABLE 4.6 OLS Test on the Error Correction Model Dependent Variable: DYt (GDP of Singapore) Sample Period: Quarter 2, 1982 – Quarter 2, 1997 Variable
Coefficient
t-Statistics
∆Xsgjpnt ∆Xsgust ECMt – 1 Constant
0.0461 0.0986 –0.0307 0.0139
2.4436a 3.2558a –2.1038a 4.6695
Notes: R-squared = 0.2240; F-statistics = 5.4849; Durbin-Watson statistics = 2.0546; ARCH-LM = 1.0762 Probability (of no serial correlations) = 0.5838). a significant at 5% critical value.
output, we test the following error correction model (ECM): ∆Ysgt = δ11 ∆Xsgust – i + δ12∆Xsgjpnt – i + δ13Du + δ14 ECMt – 1 + δ1t (4) The definitions of the variables have all been fully described earlier. Du is the same dummy variable used in equations 1 and 2. The variable ECMt-1 represents a long-run relationship ) (Ysg(t – 1) – Y sg(t – 1)).26 As in the case of the export function tests (equations 1 and 2), we begin with four-quarter lags (t – 4) and drop all the insignificant variables. 27 The OLS test results are posted in Table 4.6. Consistent with the previous results reported for the two export demand functions, we find that both Xsgus and Xsgjpn contribute positively and significantly to the changes in the aggregate demand variable (Ysg) even in the short run. The negative coefficient for δ14 ensures the convergence of the aggregate demand of Singapore (Ysg) to its long-run equilibrium level.28
© 2001 Institute of Southeast Asian Studies, Singapore
Trade in Services and Direct Investment
55
5 Trade in Services and Direct Investment
Trade in services is inherently more complex than merchandise trade and its regulation and liberalization is particularly challenging. Data problems in services trade are especially acute; available data are not comprehensive, detailed, timely, or internationally comparable. Nonetheless, it is indisputable that the revolutions brought about by the introduction of innovations in information technology and telecommunications that has been a vital factor in increasing the importance of service transactions in the global economy . Thus, in many countries, including Singapore, Japan, and the United States, the services sector has become the lar gest contributor to GDP (between 60 and 70 per cent) (W orld Bank 2000). Strategies to Develop Singapore into an International Services Hub Singapore aims to strengthen and consolidate its position as a regional and global services hub, particularly in trade logistics, financial services, media and entertainment, and educational and training services. It plans to achieve this goal while simultaneously moving to higher value-added
[email protected]
55 © 2001 Institute of Southeast Asian Studies, Singapore
56
Singapore and Free Trade Agreements
manufacturing. In particular , the strategies pursued by the Economic Development Board of Singapore (EDB) in developing the services hub of Singapore relate to its objectives set out in the Industry 21 (I21) plan launched in January 1999. These broadly include: boosting manpower and skills in knowledge-based industries (viz., information technology and media, e-commerce, supply chain management); encouraging overseas companies to set up their headquarters in Singapore under the Overseas Headquarters/ Regional Headquarters (OHQ/RHQ) scheme to gain from new business opportunities; facilitating the promotion of innovation and R&D in the production process for local companies using IT -related applications, and identifying opportunities for investments overseas in emerging and fastgrowing markets such as India and China (Singapore EDB 2000). The EDB has been particularly active in developing the OHQ/RHQ schemes as part of its International Business Hub 2000 (IBH2000) strategy . OHQs/RHQs may be broadly defined as intermediaries between corporate headquarters and country branches located across a region (Avenell 1996). Their primary roles are to co-ordinate, control, and plan business functions. The IBH2000 strategy was based on the fact that key economic activities involved in the services sector, viz., transportation, finance, telecommunications, and information technology functions, are concentrated in a few strategic centres in the world, and that Singapore could possibly secure a first-mover advantage in this area by planning ahead and investing in human capital and infrastructure to have a competitive edge (Chia 1998). Of the twenty-seven companies that established their HQs (both RHQs and OHQs) in Singapore in 1999, fifteen were from the United States and
© 2001 Institute of Southeast Asian Studies, Singapore
Trade in Services and Direct Investment
57
six each were from Europe and Asia.29 The HQs cut across diverse industries, including chemicals, electronics, engineering, life sciences, logistics/supply chain management, hospitality, information and communication technology (ICT), and media services. Eight HQs were subsidiaries of Fortune Global 500 companies, including Cisco Systems, Unilever , Lucent Technologies, Chevron, and Honeywell ( Singapore Investment News, 30 April 2000). Singapore–United States Co-operation in Services With regard to strengthening of Singapore–United States bilateral services trade relations more specifically , an important institutional development has been the establishment of the Singapore–United States Business Council (SUBC) in August 1996. The council comprises ten business leaders from Singapore and the U.S. industries. Its principal objective has been to enhance the overall level of bilateral co-operation between the two countries through intensified trade and investment flows, primarily in the information and communication technology spheres, both at the state and regional levels. The members of this council have been providing useful contacts and relevant business information to key U.S. economic and trade agencies, helping them understand the structure of the economy and investment opportunities that may be available to them.As part of SUBC’s efforts, for example, JP Mor gan hosted part of the Asia Society’s visit; Exxon and Texas Instruments jointly hosted the visit of the Greater Dallas Chamber of Commerce; and Bank of America facilitated the visit of the Greater Seattle Inter-City Mission which fifty U.S. companies participated. SUBC’s also launched a “Singapore-inc.com” website jointly
© 2001 Institute of Southeast Asian Studies, Singapore
58
Singapore and Free Trade Agreements
with Singapore and the United States in March 1997 to serve as an interactive information source for investment opportunities in Singapore. Singapore has also established formal economic alliances with Boston City and California. Singapore and Boston signed a Memorandum of Understanding (MOU) in May 1997 to launch the Singapore-Boston BusinessAlliance. The alliance focuses on co-operation in technology , education, tourism, and trade. The MOU signed between Singapore-based and California-based economic and trade agencies in March 1998 was aimed specifically at promoting technology collaboration. Singapore has been particularly interested in California since it is a centre for high technology development in electronics and information technology, being home to the SiliconValley. In 1998, Singapore was California’ s sixth lar gest export market, absorbing US$4.7 billion worth of exports. California continued to maintain its position as the lar gest exporter to Singapore among all the U.S. states, accounting for 30 per cent of all U.S. exports to Singapore (Singapore EDB 1999). A Singapore Consulate in San Francisco was recently set up to further promote the bilateral economic and cultural links between Singapore and Silicon Valley. Another important recent institutional development has been the establishment of an of fice in the United States by Singapore called “Connect@sg” which houses the National Science and Technology Board (NSTB) together with Infocommunications and Development Authority Singapore, Contact Singapore, and the Singapore American Business Association (SABA). American companies that plan on entering the Singapore market are being actively courted as potential customers. The of fice is also aimed at providing space for research institutes and centres or other government agencies in Singapore that intend to set up of fices in the United
© 2001 Institute of Southeast Asian Studies, Singapore
Trade in Services and Direct Investment
59
States. The Kent Ridge Digital Lab (KRDL), one of Singapore’s leading IT and communications research institutes, will be the first research institute to set up its of fice called the “Cradle Factory” in this of fice. In this way , U.S. companies will be able to access and leverage on the technological capabilities available in Singapore’ s research institutions. Among other recent developments in Singapore–United States collaborations in the services sector has been the launch of a high-speed broadband link across the Pacific connecting the research and education communities of Singapore and the United States, paving the way for closer collaboration between top universities and research institutions in the two countries. This connection between Singapore Internet Next Generation Advanced Research and Education Network (SINGAREN)30 and the very high performance Backbone Network Service (vBNS)31 of the United States was launched on 7 November 2000 and is the first trans-Pacific link for vBNS outside the United States. Several major research collaborations between the two communities were sealed during the launch, including tele-immersive virtual reality , tele-manufacturing, bioinformatics, tele-medicine, teleeducation and tele-architecture. Besides the ICT, media, and headquarters sector , health and education services have also been seen as another areaof potential co-operation between Singapore and the United States. Two important recent developments in this context have been Singapore’ s collaboration with Johns Hopkins Medicine of the United States in the area of research, medical education and clinical trials,32 and the collaboration between Singapore Management University (SMU) and the Wharton School, University of Pennsylvania to set up a research centre in finance, management, economics, and entrepreneurship.
© 2001 Institute of Southeast Asian Studies, Singapore
60
Singapore and Free Trade Agreements
The preceding discussion reveals that Singapore and the United States have already begun exploring opportunities in the services sector spanning diverse areas. Important institutional frameworks are already in place to facilitate bilateral trade in services. The proposed FT A between Singapore and the United States would be expected to further enhance such collaborations in these and other sectors. Singapore–Japan Co-operation in Services Singapore and Japan have also been involved in trade co-operation in a number of service sectors, the scope of which has been studied by the Joint Study group under the Japan– Singapore Economic Partnership Agreement (JSEPA). The major area of bilateral co-operation that JSEPA has identified is the ICT sector, given the high rates of usage of e-commerce and Internet penetration in both countries. The focus of cooperation has been on the promotion of the use of e-commerce and the Internet and on the creation of an effective legal and regulatory framework to enhance the security and confidentiality of on-line transactions. The establishment of Japan–Singapore Advanced Multimedia Co-operation Committee (JSAMCC) in 1998 to increase co-operation in advanced multimedia and related R&D projects has been an important institutional development in this sector. Other areas in this sector identified for possible co-operation has been that of Interactive Broadband Multimedia (IBBMM) and e-governance. Since both countries have developed highcapacity broadband networks, they can collaborate to establish a network of physical broadband linkage to capitalize on the demand for high-bandwidth Internet content, with Japan using Singapore as a gateway to distribute its multimedia contents in local languages to English- and Chinese-speaking markets
© 2001 Institute of Southeast Asian Studies, Singapore
Trade in Services and Direct Investment
61
(JSG 2000). Media and broadcasting have also been identified as areas of potential bilateral co-operation. For instance, Singapore could be used as a testing place for new digital products and services from Japan, besides being used as a regional manufacturing and marketing base for new broadcast technologies, viz., Digital Audio Broadcasting (DAB) and Digital Television (DTV). Tourism development has also been identified as another major area of co-operation in the services sector. Singapore’s Investment Linkages with the United States and Japan All in all, there appear to be enormous opportunities for trade co-operation in the services sector and proposed FTAs ought to facilitate in a fuller and more rapid exploitation of these opportunities effectively. Some specific issues pertaining to liberalization of services sector are particularly important, viz., those relating to government procurement, intellectual property, and competition policy . These issues have been discussed in some detail by the JSEP A report in the context of a Singapore–Japan FTA. We instead note that foreign direct investment (FDI) in the services sector play a major role in the area of services trade co-operation, and therefore briefly turn to this issue below. Singapore’s ability to attract substantial FDI flows has transformed it into an important manufacturing base for foreign multinationals and a major international financial, logistics, trading and transportation hub. The stock of Singapore’s direct inward equity investment increased more than fivefold from US$14 billion in 1987 to US$76 billion by 1997. Among the major countries that invested in Singapore, the United States, Japan, and the European Union
© 2001 Institute of Southeast Asian Studies, Singapore
62
Singapore and Free Trade Agreements
(EU) together accounted for over half of total inward direct investment in 1997 (Table 5.1). Among the major contributors of FDI in Singapore, the United States was the largest single foreign investor in terms of investment commitments in both Singapore’s manufacturing and services sectors. Focusing on latest available data, in 1999, manufacturing investments from the United States were US$2 billion or nearly 45 per cent of total manufacturing commitments for the year (T able 5.2). In the services sector , the investment commitments from the United States in 1999 were US$320 million, over one-third of total services commitments (Figure 5.1). Japan is the second lar gest investor in Singapore’ s manufacturing sector . In 1999, Japanese investments amounted to US$700 million, constituting nearly 15 per cent of total investment commitments in that sector , and almost one-fifth of the total foreign investment inflows in the sector (Table 5.2). Japan’s investments in the services sector were only about US$47 million in the same year, or 5 per cent of the total investment commitments in this sector (Figure 5.1). In terms of overall composition of FDI into Singapore, in 1999, FDI inflows in the manufacturing sector accounted for almost 80 per cent of total direct investment inflows (Singapore EDB 2000). The majority of the investments in the manufacturing sector in 1999 were directed at the electronics industry that accounted for 42 per cent of total investment commitments, followed by chemicals (33 per cent) and engineering (17 per cent) (Singapore EDB 2000). In the services sector, headquarters services accounted for 36 per cent of total investment, followed by the ICT and media sectors (32 per cent) and logistics/supply chain management related services (21 per cent) (Figure 5.2). On the other hand, the United States was the sixth largest host country of Singapore’ s direct investment abroad.
© 2001 Institute of Southeast Asian Studies, Singapore
© 2001 Institute of Southeast Asian Studies, Singapore
5.9 8.0 8.1 1.9
34.8
3.8 3.0 2.2 0.8
14.2
59.3
10.0 12.2 12.0 4.0 75.8
14.0 15.4 13.7 4.6 26.6 20.8 15.3 5.4 17.0 23.1 23.3 5.4 16.9 20.6 20.1 6.7 18.4 20.3 18.1 6.0
19.6
9.4 22.1 30.1 19.5
19.5
19.2 15.1 13.9 28.9
C.A.G.R
13.0
18.0 12.0 7.0 6.9
1995 1997 1987–92 1992–95 1995–97
Shares in total (%)
1995 1997 1987 1992
Amount
1992
Note: C.A.G.R: Compound Annual Growth rates. Source: Calculated from Yearbook of Statistics, Singapore, various issues.
United States European Union Japan ASEAN Total Direct equity investment
1987
TABLE 5.1 Singapore: Inward Stock of Foreign Direct Equity Investment by Country (in US$ billion)
Trade in Services and Direct Investment 63
2.0 2.4
1.7 2.1
© 2001 Institute of Southeast Asian Studies, Singapore
2.8 3.8
1.6 (56.66) 0.6 (21.12)
1994
3.4 4.8
1.5 (42.78) 0.8 (23.75)
1995
4.1 5.7
1.7 (40.33) 1.4 (33.88)
1996
4.0 5.7
1.6 (40.62) 1.4 (34.07)
1997
Note: Figures in parentheses indicates shares in total Foreign Direct Investment (FDI). Source: Calculated from Singapore International Chamber of Commerce, Annual Report 1999-2000.
Total Foreign Direct Investment Total Direct Investment
Japan
0.9 (45.71) 0.5 (24.53)
0.7 (43.96) 0.5 (31.39)
United States
1993
1992
Country
1999
3.1 4.7
3.7 4.7
1.4 2.1 (43.98) (57.32) 1.1 0.7 (34.95) (18.86)
1998
TABLE 5.2 Singapore’s Investment Commitments in Manufacturing by the United States and Japan (in US$ billion)
64 Singapore and Free Trade Agreements
Trade in Services and Direct Investment
65
FIGURE 5.1 Services Investment Commitments by Region (1999)
5% 3% 34% 26%
32% USA
Singapore
Europe
Japan
Others
FIGURE 5.2 Services Investment Commitments by Cluster (1999)
11% 32%
36%
21% Education & Healthcare Headquaters services Logistics/Supply Chain Mangement Information & Media
© 2001 Institute of Southeast Asian Studies, Singapore
66
Singapore and Free Trade Agreements
Singapore companies invested a total of US$1.8 billion in the United States in 1997 or about 5 per cent of Singapore’s total direct investment overseas that year . The majority of Singapore companies’ investment activities in the United States were in the financial, commerce, real estate, and manufacturing sectors. Singapore’s investments in Japan have been relatively low at about US$300 million during this period, less than 1 per cent of the total outward investments from Singapore (Table 5.3). This is more a reflection of the relatively less open nature of the Japanese market to FDI. The preceding indicates that Singapore’ s investment linkages with the United States have been stronger than that with Japan. As previously noted, both manufacturing and trade, particularly between Singapore and the United States TABLE 5.3 Singapore: Stock of Foreign Direct Equity Investment Abroad by Country (in US$ billion) 1992
1995
1997
1992
Amount United States 1.0 1.5 1.8 EU 0.9 2.7 5.0 Japan 0.0 0.3 0.3 Hong Kong 1.9 3.8 3.8 Malaysia 2.4 5.4 4.2 ASEAN 3.0 9.2 9.0 Total Direct Equity Investment 10.9 27.6 36.2 Nominal Exchange Rate (S$/US$) 1.63 1.42 1.48
1995
1997
Shares in total 9.0 8.3 0.4 17.2 22.1 27.6
5.3 9.9 1.0 13.8 19.7 33.2
4.9 13.9 0.9 10.5 11.7 24.8
Source: Calculated from Yearbook of Statistics, Singapore, various issues.
© 2001 Institute of Southeast Asian Studies, Singapore
Trade in Services and Direct Investment
67
have been FDI-driven. Therefore, bilateral trade pacts ought also to focus on steps to ease existing barriers to investment flows, especially in view of the fact that little progress has been made on the investment liberalization front in the multilateral arena.
© 2001 Institute of Southeast Asian Studies, Singapore
Singapore and the New Regionalism: Cautionary Notes
69
6 Singapore and the New Regionalism Cautionary Notes
The preceding chapters have emphasized the significant dependence by Singapore on the other two large economies, and the concomitant desire by the city-state to fortify these linkages by negotiating wide-ranging bilateral trade pacts with them. As noted, despite the fact that Singapore already has low tariffs and other barriers implies that a number of negative conventional welfare effects may be of limited relevance to Singapore, it would certainly be a leap of faith to conclude that there are no ill effects whatsoever. What are some potential concerns of Singapore’s recent eagerness to form Free Trade Agreements (FTAs)? While we have noted that trade diversion may be expected to be minimal from Singapore’s standpoint given its low tariffs (and ignoring the issue of rules of origin [ROOs]), conversely , the gains from discriminatory liberalization vary inversely with the preunion tarif f levels (Panagariya 1998). 33 The proliferation of a number of overlapping FT As also raises many technical problems with respect to the implementation of ROOs. Krueger (1997b, p. 22) has warned that:
[email protected]
69 © 2001 Institute of Southeast Asian Studies, Singapore
70
Singapore and Free Trade Agreements
(i)t is difficult to imagine that a series of overlapping FT As, with dif ferent ROOs attendant for dif ferent countries’ access, the need for individual producers to know and keep records for a variety of ROO requirements, and the complications associated with negotiations for accession of additional members, will lead to theWTO-plus world.… The problems of proliferating overlapping FT As deserve considerably more critical attention than they have so far received.
Even with a single FT A, a concern is that ROOs with a particular country, say the United States, may be sufficiently prohibitive so as to induce Singapore exporters to source their inputs from the United States than some other developing country in Asia (such as Korea, for instance). In other words, the United States exports its external tariffs to Singapore. This appears to have been the case with the North American Free Trade Agreement (NAFTA), where the United States negotiated an ROO on Mexican assemblers of automobiles.34 ROOs also give rise to significant costs due to the need for administrative surveillance and implementation. 35 In practice, ROOs are particularly complex — they are almost two hundred pages in case of NAFT A and eighty pages of small print in the case of the EU’ s agreement with Poland (Schiff et al. 2000) — as they have to take into account tarif fs on imported intermediate goods used in products produced within the FTA. The bookkeeping and related costs rise sharply as production gets more integrated internationally. Bhagwati (1995, pp. 3–4) stresses the preceding point when he notes that: (s)uch sphagetti-bowl proliferation of preferential trading arrangements clutters up trade with discrimination depending on the “nationality” of a good, with inevitable costs that trade experts have long noted.… (I)t is
© 2001 Institute of Southeast Asian Studies, Singapore
Singapore and the New Regionalism: Cautionary Notes
71
increasingly arbitrary and nonsensical to operate trade policy of all kinds on the assumption that one can identify which product is whose. With the phenomenal globalization of investment and production, aWho’s Whose in defining trade policy is an increasing anomaly; it ties up trade policy in knots and absurdities and facilitates protectionist capture.… Indeed, as the world economy increasingly muddies up the idealized picture of Japanese, American, British, Indian, and Mexican goods that drives much of trade policy, including particularly the pursuit of free trade areas, the more we trade economists can see the wisdom of the great trade theorists of the past…who were strongly wedded to nondiscrimination and hence to mostfavored-nation status and multilateralism.36
Apart from the issue of ROOs, a lar ge number of FTAs may leave investors confused as to which rules, obligations, and incentives correspond to which partner. Worse still, there is the possibility that membership in multiple trade pacts may create “obligations made in one that contradict those made by others” (Schiff et al. 2000). Bergsten (2000, p. 5) highlights this point in the context of compatibility of subregional agreements with the APEC’s goals of region-wide trade liberalization (i.e. the Bogor declaration of free and open trade by 2010/2020). As he notes of the blueprint on the Singapore– Japan proposed FTA: it states that Japan is unwilling to liberalize agricultural trade, even in a deal with Singapore where there is no agricultural trade. In other words, they do not accept the principle. They can argue, as this blueprint does, that it is perfectly compatible with the WTO. The WTO says you must substantially cover all trade. If there is no agricultural trade, you do not have to include it to meet the WTO test. But the APEC test, which was hammered out after much
© 2001 Institute of Southeast Asian Studies, Singapore
72
Singapore and Free Trade Agreements
debate in both Bogor and Osaka, states that trade liberalization must be comprehensive — no sectors can be excluded. APEC was consciously being WTO+ and the Japan–Singapore agreement, if that study result becomes the actual outcome, would violate its precepts.… Moreover, the report says nothing about completion by 2010. That deadline is a commitment for countries in the APEC context.… Japan and Singapore should be asked how their new agreement is compatible with APEC.
Time and efforts spent on negotiating and implementing a series of bilateral and trilateral FT As may divert scarce resources from the multilateral rounds. Potentially more important than the direct impact of this “scarce negotiator resources argument” to Singapore is the fact that, by being involved in a number of FTAs, Singapore must accept at least partial responsibility for diverting attention of trade partners away from multilateral negotiations. For instance, the U.S. Trade Representative (USTR) paying more attention to a number of bilateral FTAs will mean that much less attention at the margin being paid to the WTO or APEC. Singapore appears to be willing and able to negotiate FT As fairly quickly. However, this rapid pace apparently hinges on Singapore’s readiness to accept a number of conditions in the context of the bilateral pacts set forth by the larger partners, such as labour and environmental standards, in the case of the FTA with the United States (said to be modelled after the United States–Jordan agreement), or exclusion of agriculture in the case of the FTA proposals with Japan (as noted above).37 While acceptance of these conditions may not be problematic in the case of Singapore (given its high environmental standards and negligible agricultural sector), if they are eventually included in the agreements, Singapore may be doing a disservice to developing economy interests in
© 2001 Institute of Southeast Asian Studies, Singapore
Singapore and the New Regionalism: Cautionary Notes
73
multilateral negotiations at large. Bhagwati’s (1995, pp. 12– 13) discussion of the U.S. FT A strategy during NAFT A negotiations is prescient: NAFTA’s passage ... was subject to Mexico’ s acceptance of supplemental agreements on environmental and labor standards.... (W)hy should such agreements be a precondition for freer trade?... (The) United States was a superpower bargaining one-on-one with a vastly inferior power. In turn, those supplemental agreements have encouraged the environmental and labor lobbies to ar gue that because NAFTA required them, so must the WTO.... In short, NAFT A has made the WTO’s business more complex, not less.... (T)he United States can first force Mexico to buckle under to those demands and then tell Chile and others, “This is how NAFT A is, so you must accept these ‘nontrade’ terms and conditions if you wish to come on board.”… (T)hat “T ake-them-one-by-one’ strategy works so much better than trying to impose extraneous, indeed harmful, conditions through multilateral trade negotiations where all countries facing such demands negotiate together and have more bargaining power.
More narrowly, such supplemental agreements may not be as readily acceptable to other ASEAN members. Accordingly, Singapore-based FTAs may not necessarily be an appropriate model for future agreements by other Asian nations, and could make these FTAs de facto exclusionary to other ASEAN members despite “assurances” by Singapore policy-makers that the FTAs would be left open for others to join (Chua 2000).38 Further, by Singapore unilaterally signing on to such terms and conditions (such as linking trade with labour standards), that might precludeASEAN from taking a common and credible stand on these and other issues (since ASEAN follows a policy of consensus).39
© 2001 Institute of Southeast Asian Studies, Singapore
Conclusion
75
7 Conclusion
This book has emphasized the existence of pronounced trade and investment linkages between Singapore and the two largest economies in the world: Japan and the United States. In some ways, the proposed bilateral trade pacts by Singapore with these two economies are a formalization of the de facto extensive and deep linkages that already exist. In other words, it might be argued that such Free Trade Agreements (FTAs) are essentially “market-driven”. The reasons for Singapore’s recent turn to the FT A route have been discussed in some detail in the earlier chapters. To recap, among the most important reasons are the continued economic weaknesses in the neighbouring SoutheastAsian economies, and Singapore’s consequent need to diversify its economic linkages. Nevertheless, it would be a mistake to assume that this wholehearted embracement of regionalism by the city-state comes without any costs. Uppermost among these economic costs is the compatibility of these bilateral pacts with other regional commitments (AFTA, APEC). While the analysis in this book has been solely on economic issues, Singapore’s drive towards FTAs is not just economic by any means. FTAs could also serve as a vehicle by which Singapore draws attention to itself and enhances the city-state’s political recognition and profile with the 75 © 2001 Institute of Southeast Asian Studies, Singapore
76
Singapore and Free Trade Agreements
integrating partners. This is particularly true in the case of the Singapore–United States FTA proposal where Singapore appears keen on establishing and cementing a “special bilateral relationship” with the United States. In other words, FT As could serve a diplomatic/security purpose (Schiff and Winters 1998). This point was most clearly and forcefully put by Singapore’s Ambassador-at-Large, Tommy Koh (2000): Singapore views the U.S. presence as vital to the security and stability of the region. This remains relevant in spite of the end of the ColdWar.... We want the United States to continue to stay engaged and to play the role of balancer .... Singapore has been helpful to the United States in defence and security.... The United States is the lar gest source of Singapore’s military procurements. The Singapore Air Force has stationed detachments of men and aircraft for training at bases in Arizona, New Mexico, Texas, and Kansas.
It appears, therefore, that Singapore policy-makers view the formation of FT As with these and other non-Southeast Asian economies as an important component of the city-state’ s foreign policy. However , in relation to this, there is the important question of how Singapore’ s decision to embark on a separate series of trade initiatives to bolster its trading, investment, and strategic position without the consent of ASEAN are perceived by other Southeast Asian economies, and what it means for initiatives towards the implementation of a ASEAN-wide trade liberalization, i.e. an ASEAN Free Trade Area (AFTA). There are indications that some regional members of ASEAN are concerned that Singapore’ s unilateralism may undercut the value of AFTA as well as diminish ASEAN as a “community”, and would have much rather that ASEAN as a whole negotiate with third parties
© 2001 Institute of Southeast Asian Studies, Singapore
Conclusion
77
(Ariff 1989; Choong 2001). 40 For instance, in response to Singapore’s actions, the Malaysian Foreign Minister , Syed Hamid Albar, has been quoted as saying ofASEAN members: (w)hen we do something outside theASEAN context which could weaken the or ganization, we must think twice.... Singapore may not have done anything wrong in legal terms but morally, the Republic’ s action showed that it had undermined friendship inASEAN (quoted in Baruah 2000 and Chua 2000).
Such adverse feelings might strengthen if there is a sense that investments and trade are being diverted from the other members of ASEAN to Singapore because of preferential access to Singapore goods and services to third markets (for instance, see Choong, 2001). 41 The possibility of some sort of defensive reactions by regional members that feel concerned or even threatened by Singapore’ s “go-it-alone” strategy cannot be entirely discounted. Singapore policymakers need to be fully aware of and sensitive to these potential risks and take appropriate steps to effectively counter them as the city-state continues along the FTA path.
© 2001 Institute of Southeast Asian Studies, Singapore
Appendix 1: Trade Intensities Indices
79
Appendix 1 Trade Intensity Indices
(a) Total Trade Intensity The bilateral trade intensity index for total trade is as follows: Tij = [(Xij + Mij)/(Xi + Mi)]/{[Xwj + Mwj) – (Xij + Mij)]/[(Xw + Mw) – (Xi + Mi)]} where: T ij = Total trade intensity index of country i with country j; X ij = Exports of country i to j; M ij = Imports of country i from j; X i = Total exports of country i; M i = Total imports of country i; X wj = Total world exports to country j; Mwj = Total world imports from country j; and X w = Total world exports; Mw = Total world imports. This index is interpreted as a relative measure of two ratios. The numerator represents the share of bilateral trade between country i and j as a percentage of total trade of country i. This forms the numerator of the total trade intensity index. The second ratio in the denominator represents the total trade of country j with the world excluding country i as a share of total world trade excluding country i. This forms the denominator of the total trade intensity index. If the numerator exceeds the denominator, i.e. if the value ofTij > 1, it implies that the bilateral trade intensity for country i with country j is
[email protected]
79 © 2001 Institute of Southeast Asian Studies, Singapore
80
Singapore and Free Trade Agreements
greater than in comparison to country i’ s trade with the rest of the world (ROW). Thus for instance, if Singapore is regarded as country i and country j is represented by its trading partners (United States/Japan), a value of Tij > 1 implies that Singapore prefers to trade more intensely with them than trading with the rest of the world. (b) Export Intensity Index The bilateral export intensity index among country i and country j may be stated as: Xija = [Xij/Xi]/[( Mj – Mji)/( Mw – Mi)] where: in addition to the notations in the bilateral trade intensity index, M j = Total imports of country j and M ji = Imports of country j from country i. A value of this index above unity implies that country i’s relative share of exports to country j exceeds country j’ s share of imports from the ROW. This implies an over -representation of country j in country i’s export market. From country i’s point of view, the value of greater than one indicates that country i has relatively more intense preference for exporting to country j as compared with country j’s imports from the ROW. (c) Import Intensity Index The import intensity index may be stated as follows: Mija = [Mij/Mi]/[(Xj – Xji)/( Xw – Xi)] where: in addition to the notations in the bilateral trade intensity index, X j = Total exports of country j; and X ji = Exports of country j to country i.A value of this index above unity implies that country i’ s relative share of imports to
© 2001 Institute of Southeast Asian Studies, Singapore
Appendix 1: Trade Intensities Indices
81
country j exceeds country j’ s share of exports to the ROW . This implies an over -representation of country j in country i’s import market. From country i’s point of view, the value of greater than one indicates that country i has relatively more intense preference for importing from country j as compared with country j’s exports to the ROW.
© 2001 Institute of Southeast Asian Studies, Singapore
Appendix 2: Measures of Intra-Industry Trade (IIT)
83
Appendix 2 Measures of Intra-Industry Trade (IIT)
The Grubel-Lloyd (G-L) index is the most common measure of IIT. It measures the ratio of net exports in a product category to its total trade in an index that takes values from 0 to 100. It thus calculates IIT as a part of balanced trade (overlap between exports and imports) in the total trade in a given industry k: GLk =
-MAIL: [email protected]
Xk + Mk – |Xk-Mk| |X – Mk| =1– k Xk + Mk Xk + Mk
Alternatively, the index may be formulated as follows: G-Lk = [2* min (Xk, Mk)/(Xk + Mk)]*100
It takes on a value of 0 if either X k or Mk equals 0, implying no IIT. If X k = M k, it implies a value of 100 and signifies complete IIT in that industry. The G-L index can be calculated at the aggregate level as a weighted average of IIT in all industries, these weights based on the share of the industry-specific trade in the country’ s total trade. The aggregate G-L index can be stated as follows: n
G-Lagg = Σ [G-Lk [(Xk + Mk)/(X + M)]*100] k=1
83 © 2001 Institute of Southeast Asian Studies, Singapore
84
Singapore and Free Trade Agreements
where: X=
∫
X k=1 k n
M=
∫
n k=1
Mk
and k = 1…n for n industries in the economy.
© 2001 Institute of Southeast Asian Studies, Singapore
Notes
85
Notes
1. ASEAN refers to the Association of Southeast Asian Nations and APEC refers to Asia Pacific Economic Co-operation. Chang and Rajan (1999) highlight the responses of ASEAN and APEC to crisis-hit member economies. 2. As reportedly noted by Singapore Deputy Prime Minister Lee Hsien Loong: the crisis caused someASEAN countries to hold back from pushing ahead with the ASEAN Free Trade Area (AFTA) and the ASEAN Investment Area (AIA), to give struggling domestic industries some breathing space.... ASEAN members who were doing relatively better — such as Thailand, Malaysia, Singapore and Brunei — should take the lead and work to put ASEAN co-operation on track again (Business Times (Singapore), 1 December 2000).
Also see Kraft (2000) and Ruland (2000), they discuss the impact and implications of the financial crisis of 1997–98 for regionalism in Southeast Asia. 3. Thus, Fred Ber gsten (2000), an ardent supporter of APEC, has noted:
we have to candidly observe now thatAPEC has indeed been eroding. In the last three or four years, the leaders’ meetings have been unable to continue the pace of active liberalization on the trade front and to deal with the big issues in the region like the financial crisis.
Ravenhill’s (2000, pp. 320–21) analysis of APEC is also instructive:
APEC’s achievements ... (have been) ... confined primarily to matters of process. Substantive outcomes from its activities have been far
AIL: [email protected]
85
© 2001 Institute of Southeast Asian Studies, Singapore
86
Singapore and Free Trade Agreements less obvious. The grouping accordingly has been vulnerable to accusations that it is little more than a talking shop — ‘A Perfect Excuse to Chat’ as some have interpreted the acronym.... APEC’s problems stem from three principal weaknesses: a lack of consensus among members over its objectives and how these might best be realized; the absence of a body that has the capacity to be a dynamo for the grouping; and a failure to engage with civil society.
4. Given the definition of FT As, Jagdish Bhagwati notes that term “preferential trade areas” (PTAs) is a more apt description. As he declares of such trade agreements (Bhagwati 1995, p. 2), they are: two-faced: they embody both free trade and protection. Economists interested in the quality of public policy discourse should perhaps take a pledge henceforth to rename free trade areas as “preferential” trade areas.
Panagariya (1999, p. 478) too reminds us that: (i)n policy documents and debates, the acronym FTA is often used to refer to a FreeTrade Agreement or Free Trade Arrangement rather than a Free Trade Area. This usage of the term gives the misleading impression that an FTA is equivalent to non-discriminatory free trade. The term PTA, whether used to stand for Preferential Trade Area, Preferential Trade Agreement or Preferential Trade Arrangement, avoids this confusion by making explicit the discriminatory nature of the arrangement.
5. The term “regionalism” is not meant to have any geographic connotation, referring to any trade initiatives that are not multilateral in nature. Rather than “new regionalism”, some prefer to use the term “second regionalism” in contrast to the “first regionalism” of the 1950s and 1960s which involved mainly South-South economic integration, i.e. FT As among developing economies as part of import substitution development strategies (Rajan, 1995). As Lal (1993, p. 353) notes, “historically, FTAs have been the economic policy of the uncompetitive and the foreign policy of the weak”.
© 2001 Institute of Southeast Asian Studies, Singapore
Notes
87
6. However, Baldwin (1997) forcefully ar gues against the commonly held belief that the resur gence in regionalism the (so-called “second wave”) was prompted by the conversion of the United States from “devoted multilateralist to ardent regionalist”. As he further notes, the “United States was not multileralism’s white-knight before frustration with the GATTprocess in 1982 led it to embrace the Dark side (regionalism). The United States has long been open to regional deals.” (p. 883). 7. Referred to as “competitive liberalization” whereby modest liberalization induces broader liberalization (Ber gsten 1998, 2000). 8. Article XXIV of the GATT three principle restrictions on FTA. It must: (i) not “on the whole” raise protection against non-members; (ii) reduce internal tarif fs to zero and remove “other restrictive regulations of commerce” other than those justified by other GATT articles; (iii) cover “substantially all trade”. Schiff et al. (2000) evaluate the practical implications of the Article and its provisions and make recommendations for altering the provisions to render them more ef fective. There exists an “Enabling Clause” introduced in 1979 that relaxes the above provisions. Of the 162 trade pacts notified to the GATT/WTO by August 1998, 143 were FT As and 19 were Customs Unions (CUs). 9. Analysis of trade patterns generally reveals that Taiwan, in particular, but also Malaysia, Korea, and Hong Kong are among Singapore’s closest export competitors. 10. Singapore accounted for nearly 57 per cent of U.S. and 18 per cent of Japanese investment in ASEAN in 1998 (U.S. Census Bureau and International Bureau, Ministry of Finance, 1999). 11. However, if this is the intention, this, along with APEC’s moratorium on new members, is clear evidence that APEC
© 2001 Institute of Southeast Asian Studies, Singapore
88
12.
13. 14.
15. 16. 17.
18.
Singapore and Free Trade Agreements
has forsaken its much-touted but vague principle of “open regionalism” (Bhagwati and Panagariya 1996; Panagariya 1999; Schiff et al. 2000; Srinivasan 1998). Ber gsten (2000) refers to this as the fourth track or approach to APEC-wide regionalism. In a recent meeting in Singapore, it was agreed that the APT would explore the possibility of holding an EastAsian summit as well as consider the establishment of an APT FTA and investment area ( Business Times (Singapore), 25 November 2000). The APT has taken some concrete steps toward enhancing monetary and financial co-operation (Chang and Rajan 2001). An exception in Rajan (1996) who concentrated on merchandise trade relations between 1970 and 1992. Assuming of course that the rules of origin (ROOs) are not prohibitive. ROOs are discussed in more detail in Chapter 6. Ninety-nine per cent of Singapore’s imports are not dutiable. Tariffs are only imposed on alcoholic beverage imports, while excise duties are imposed on tobacco products, automobiles, and gasoline. During the Uruguay Round, Singapore agreed to bind 70 per cent of its tariff lines. Sen (2000) stresses the need to analyse the entrepôt function separately to avoid possible discrepancies in reporting of bilateral trade data by Singapore’s trading partners. Since the focus of this book is on Singapore, the potential welfare effects of possible trade diversion in the case of Japan (or the United States) are not tackled here. Insofar as the bulk of Singapore’s exports to the United States have been concentrated in the SITC 76 and 84 categories (Singapore TDB 1992), and most of U.S. import restrictions have generally fallen on those categories (DeRosa 1986, p. 180), Singapore may be especially vulnerable to protectionist measures that might be imposed by the United States. It is this phenomenon that is thought to have contributed to an increase in Singapore’s imports from Japan particularly after
© 2001 Institute of Southeast Asian Studies, Singapore
Notes
19. 20. 21. 22.
23.
24.
25.
89
1987-88, with Singapore being one of the largest recipients of Japanese FDI due to various push factors in Japan (Rajan 1996). Julius (1990, p. 75) has suggested that about 50 per cent of the U.S. imports from Singapore and Malaysia were from U.S. affiliates in Singapore. This trend is observed to be almost similar over 1995–99, indicating that the crisis of 1997–98 has not had any discernible adverse effect on the commodity composition of exports. This result remains unaltered even if earlier periods before the crisis in 1997–98 are considered. Two basic unit-root properties of a series that are important to understand: (1) non-stationary; and (2) stationary.A stationary series is one that does not contain trend, that is, fluctuates around a constant mean. Failing to have information on the unit-root properties may lead to bias test results. We tried to go beyond four -quarter lags, but none of those extra lags is found to be significant.This process of “generalto-specific” methodology was introduced by Hendry (1974, 1977) and has since become commonplace (for instance, see Chowdhury 1993 and Daly 1998). One possible explanation is the “soft dollar peg” adopted by Singapore resulting in the Singapore dollar being relatively more volatile vis-à-vis the Japanese yen. Higher volatilities of the Singapore dollar against the Japanese yen in turn may have contributed to the high t-statistics for the volatility index coefficient in the case of Singapore’s exports to Japan. Figures on the volatility indices for both the Singapore dollar against the U.S. dollar and the Japanese yen are available from the authors upon request. From the standard textbook construction of the aggregate demand (income) of an open economy , we can express the aggregate demand function from the expenditure approach: Y = C + I + G + (X – M)
© 2001 Institute of Southeast Asian Studies, Singapore
90
26. 27.
28. 29. 30.
31.
32.
Singapore and Free Trade Agreements
where: Y is the aggregate demand; C is the household’ s consumption; I is the investment variable; G is the government expenditure; X is total exports; and M is total imports. Since our main interest is to estimate the role of export in explaining the performance of the aggregate demand, our general empirical model can be simplified as in equation 3. ) Y sg is an estimated level of aggregate demand. It is derived using the coefficient estimates reported in Table 4.5. In addition, the significance of coef ficient δ14 confirms the presence of a long-run relationship between the three variables (Xsgus, Xsgjpn, and Ysg). As in the case of export functions, we do not find more than four -quarter lags variables to be significant. The dummy variable is found to be an insignificant explanatory variable in explaining the performance of Singapore’ s GDP and was dropped in the final estimating equilibrium. Although the exact number is not known, it can be safely assumed from past trends that most of the Asian companies establishing HQs were from Japan. SINGAREN, set up by the NSTB and Telecommunication Authority of Singapore (T AS) as a research and education network over the Singapore ONE high-speedATM backbone, contributes to an environment that supports widespread experimentation on broadband networking and applications. vBNS is part of the domestic R&D infrastructure in the United States, and connects some 100 selected research institutions in that country. It plays a major role in supporting nationalscale projects in the applications and technologies of advanced networks. The collaboration with Johns Hopkins is aimed at boosting Singapore’s development as a regional medical centre. The focus of the research centre is to be on the clinical development of new drugs and other treatments for diseases prevalent in Southeast Asia such as cancers of the nasopharynx and liver, and rheumatic heart disease.
© 2001 Institute of Southeast Asian Studies, Singapore
Notes
91
33. In addition, in the case of its FT A with Japan, some EastAsian economies may actually be worse off. This is so as Japan has provided extensive trade preferences to a number of EastAsian economies on a GSP (Generalized System of Preferences) basis, and with an FTA, these benefits may be revoked along with a lowering of tariffs (Panagariya 1998). 34. See Krueger (1995, 1997 a, b), Lloyd (1993), Schif f et al. (2000) and Wonnacott (1996 a, b), and Wonnacott and Wonnacott (1996). Accordingly, Krueger strongly favours a Customs Union or CU (with members having common external tariffs) over FTAs. Note that without ROOs, an FT A is a de facto CU with a common external tariff equivalent to that of the lowest tariff prevailing in any of the member countries. If unconstrained, this reduces the effective tariff of every member to that of the lowest plus the transportation cost involved in indirect importing (real resource cost).With prohibitive ROOs, an FTA becomes a CU where an external tariff is the highest that prevails among members. A major disadvantage of CUs is that they require greater degree of policy co-ordination and collective decision-making and budgetary mechanisms to distribute the tarif f revenue between members. Schif f et al. (2000), who argue that a “central issue for countries planning to integrate their trade is whether to choose and FTA or CU” discuss the issues in some detail. Wonnacott and Wonnacott (1996) have suggested a hybrid scheme, i.e. an FT A but without ROOs in two sets of products: one where the members agree upon CETs, and the other where all members have low tariffs. Schiff et al. (2000) discuss these and other proposals. 35. Herin (1986) estimated these costs to be between 3 and 5 per cent of f.o.b. prices for European FT A (EFTA) — European Community trade. 36. Globalization of production has been facilitated by multinational corporations (MNCs). In the first serious attempt to quantify intraproduct trade,Yeats (1997) has suggested that it accounted for close to 30 per cent of world trade in
© 2001 Institute of Southeast Asian Studies, Singapore
92
37. 38.
39. 40.
Singapore and Free Trade Agreements
manufactures in the 1990s. This issue has been formally explored by a number of authors (Arndt 2001; Arndt and Kierzkowski (eds.) 2001). The economics of these multiple and overlapping trade agreements remains unclear . Paul Wonnacott has been at the forefront of clarifying the economics of hub-and-spoke arrangements (see Wonnacott 1996 a, b; Wonnacott and Lutz 1989; and Wonnacott and Wonnacott 1996). See Perroni and Whalley (1994) who formally show how large countries have dominated negotiations with FTAs with smaller countries (i.e. the former has the bargaining power in FTAs). Paradoxically, as noted, while it may be in Singapore’ s best interest to remain as a hub with a number of other spokes it may be in the best interests for other countries not to join an existing Singapore-based FTA. Wonnacott (1996) cautions that while spokes are certainly worse off in a hub-and-spoke regime compared with a “full” or complete FT A, it is unclear as to whether hubs are better or worse off. This is so, as the collective incomes of a hub-and-spoke arrangement tends to be smaller (given the inef ficiencies caused by overlapping FT As), the share of benefits accruing to the hub is larger than a full FTA. ASEAN as a group has hitherto steadfastly rejected demands by Europe and the United States to link trade with human rights, labour, or environmental standards. A 1988 Steering Committee, a joint effort of U.S. andASEAN governments, suggested a United States–ASEAN FTA as an ultimate goal. From a conventional trade perspective, Panagariya (1998) argues persuasively against AFTA, calling it a “wrong turn” as the gains are very unevenly distributed. Singapore and Malaysia benefit the most as they have relatively low tarif fs and cannot of fer much by way of reciprocal concessions to tarif f reductions by Thailand, Indonesia, and the Philippines. As he notes, it is therefore not surprising that Indonesia and the Philippines have hitherto preferred to liberalize on a most favoured nation (MFN) basis than via
© 2001 Institute of Southeast Asian Studies, Singapore
Notes
93
AFTA. However, from an investment perspective,Athukorala and Menon (1997) have argued that AFTA could be beneficial to the labour-intensive, less developed regional economies as they attract FDI intensive in the use of their abundant resource. The authors emphasize the benefits of AFTA in terms of creating a regional vertically integrated production network. 41. For instance, McCleery (1993) has ar gued that investment rather than trade diversion has been the most important adverse impact of NAFTA on Asia. Anecdotal evidence of investment diversion from East Asia to Mexico abounds (for instance, see Financial Times (United Kingdom), 31 March 1999). FDI to Mexico doubled in the year following the launch of NAFT A, as Japan and other countries redirected investments into the country (Schiff et al. 2000).
© 2001 Institute of Southeast Asian Studies, Singapore
References
95
References
Arndt, S. “Production Networks in an Economically Integrated Region”, ASEAN Economic Bulletin 18, no. 1 (2001): 24–34. Arndt, S. and H. Kierzkowski, eds. Fragmentation: New Production Patterns in the World Economy. New York: Oxford University Press, 2001. Athukorala, P. and J. Menon. “AFT A and the Investment-T rade Nexus in ASEAN”. World Economy 20 (1997): 159–74. Avenell, S. “The Competition for Corporate Regional Headquarters”. Working Paper No. 67, Asia Research Centre, Murdoch University, Western Australia, November 1996. Bailey, M. “The Impact of Exchange Rate Volatility on Export Growth: Some Theoretical Considerations and Empirical Results”. Journal of Policy Modeling 9 (1987): 225–43. Baruah, A. “Malaysia CautionsASEAN on Trade Pacts”. The Hindu (Chennai, India), 23 November 2000. Baldwin, R. “The Causes of Regionalism”. World Economy 20 (1997): 865–88. Bergsten, F. “Fifth Years of the GA TT/WTO: Lessons from the Past for Strategies for the Future”. Working Paper No. 98-3, Institute for International Economics, 1998. ——. “‘Back to the Future’ APEC Looks at Subregional Trade Agreements to Achieve Free Trade Goals”. Speech given at the Pacific Basin Economic Council luncheon, Washington, D.C., 31 October 2000. Bhagwati, J. “Regionalism and Multilateralism:An Overview”. In New Dimensions in Regional Integration, edited by J. De Melo and A. Panagariya. London: CEPR, 1993.
[email protected]
95 © 2001 Institute of Southeast Asian Studies, Singapore
96
Singapore and Free Trade Agreements
——. “U.S. Trade Policy: The Infatuation with Free Trade Areas”. In The Dangerous Drift to Preferential Trade Agreements. Washington, D.C.: AEI Press, 1995. Bhagwati, J. and A. Panagariya. “Preferential Trading Areas and Multilateralism: Strangers, Friends, or Foes?”. In The Economics of Preferential Trade Agreements, pp. 1–78. Washington, D.C.: The AEI Press, 1996. Bird, G. and R. Rajan. “International Currency Taxation and Currency Stabilisation in Developing Countries”. Journal of Development Studies 37 (2001): 21–38. Chang L. L. and R. Rajan. “East Asian Co-operation in Light of the Regional Crises: A Case of Self-Help or No-Help?”. Australian Journal of International Affairs 53 (1999): 261–81. ——. “Examining the Case for anAsian Monetary Fund”, ASEAN Economic Bulletin, forthcoming. Charemza, W. and D. Deadman. New Directions in Econometric Practice. U.K.: Edward Elgar Publishing Limited, 1997. Chia S. Y. “Singapore: Advanced Production Base and Smart hub of the Electronics industry”. In Multinationals and East Asian Integration, edited by W. Dobson and Chia S.Y . Singapore: Institute of South East Asian Studies, 1998. Choong, W. “Singapore’s Proposed FT As do not Undermine AFTA”. Straits Times (Singapore), 3 May 2001. Chou, W. “Exchange RateVariability and China’s Exports”. Journal of Comparative Economics 28 (2000): 61–79. Chowdhury, A. “Does Exchange Rate Volatility Depress Trade Flows? Evidence from Error-Correction Models”. The Review of Economics and Statistics 75 (1993): 700–6. Chua, L. “Third Parties Can Join Bilateral Free-Trade Pacts”. Straits Times (Singapore), 24 November 2000. Daly, K. “Does Exchange Rate Volatility Impede the Volume of Japan’s Bilateral Trade?”. Japan and the World Economy 10, (1998): 333–48. Department of Statistics, Singapore,Yearbook of Statistics, various issues.
© 2001 Institute of Southeast Asian Studies, Singapore
References
97
DeRosa, D. “ASEAN-US Trade Relations”. ASEAN Economic Bulletin 3, no. 2 (1986): 169–88. Dornbusch, R. Exchange Rates and Inflation. Cambridge: MIT Press, 1988. Encarnation, D. Rivals Beyond Trade: America versus Japan in Global Competition. Ithaca, N.Y.: Cornell University Press, 1992. Ghosh, B. Gains from Global Linkages: Trade in Services and movement of Persons. Geneva, Switzerland: International Organisation for Migration, 1997. Giovannini, A. “Exchange Rates andTraded Goods Prices”. Journal of International Economics 24 (1988): 45–68. Goldstein, M. and M. Khan. “Large versus Small Prices Changes in the Demand for Imports”. International Monetary Fund Staf f Paper 23, 1976, pp. 200–25. Gordon, H., S. Rimmer, and S.Arrowsmith. “The Economic Impact of the EU Regime on Public Procurement”. World Economy 21 (1998):159–88. Hendry, D. “Stochastic Specification in an Aggregate Demand Model of the United Kingdom”. Econometrica 42 (1974): 559–78. ——. “On Time Series Approach to Econometric Model Building”. In New Methods in Business Cycle Research, edited by C. Sims. Minneapolis: Federal Reserve Bank of Minneapolis, 1977. Herein, J. “Rules of Origin and Differences Between Tariff Levels in EFTA and the EC”. Occasional Paper No.13, European Free Trade Association Secretariat, Geneva,1986. Hill, H. and B. John. “The Role of Foreign Direct Investment in Developing East Asian Countries”. ASEAN-Australia Working Papers No. 8,ASEAN-Australia Joint Research Project, Kuala Lumpur, Malaysia, 1985. Hoekman, B., and P . Mavroidis, eds. Law and Policy in Public Purchasing: The WTO Agreement on Government Procurement. Ann Arbor: University of Michigan Press, 1997.
© 2001 Institute of Southeast Asian Studies, Singapore
98
Singapore and Free Trade Agreements
Hooper, P. and J. Marquez. “Exchange Rates, Prices, and External Adjustment in the United States and Japan”. InUnderstanding Interdependence: The Macroeconomics of the Open Economy, edited by P. Kenen. Princeton, N.J.: Princeton University Press, 1995. International Monetary Fund. International Financial Statistics, various issues, 2000a. ——. Direction of Trade Statistics Yearbook, various issues, 2000b. Joint Study Group (JSG). “Report on Japan-Singapore Economic Agreement for a New Age Partnership”. JSEP A, September 2000. Julius, D. Global Companies and Public Policy: The Growing Challenge of Foreign Direct Investment. London: Pinter Publishers, 1990. Kenen, P. and D. Rodrik. “Measuring andAnalysing the Effects of Short-Term Volatility in Real Exchange Rates”.The Review of Economics and Statistics 68 (1986): 311–15. Koh, T. “U.S.–S’pore FTA: It’s Good for MoreThan Just the Two”. Straits Times (Singapore), 7 December 2000. Koray, F. and W. Lastrapes. “Real Exchange Rate Volatility and U.S. Bilateral Trade: A VAR Approach”. The Review of Economics and Statistics 71 (1989): 708–12. Kraft, H. “ASEAN and Intra-ASEAN Relations: Weathering the Storm?”. The Pacific Review 13 (2000): 453–72. Krueger, A. “NAFTA: Strengthening orWeakening the International Trading System?”. In The Dangerous Drift to Preferential Trade Agreements. Washington, D.C.: The AEI Press, 1995. ——. “Free Trade Agreements versus Customs Unions”. Journal of Development Economics 54 (1997a): 169–87. ——. “Problems with Overlapping Free Trade Area”. In Regionalism versus Multilateral Trade Arrangements, edited by T. Ito and A. Krueger. Chicago: The University of Chicago Press, 1997b. Krugman, P. “Growing World Trade: Causes and Consequences”. Brookings Papers on Economic Activity 1 (1995): 327–62.
© 2001 Institute of Southeast Asian Studies, Singapore
References
99
Lawrence, R. “Imports in Japan: Closed Markets or Minds?”. Brookings Papers on Economic Activity 2 (1987): 517–58. Lal, D. “T rade Blocs and Multilateral Free Trade”. Journal of Common Market Studies 31 (1993): 349–58. Lim, H. “Singapore-Japan Trade Frictions”. In ASEAN-Japan Relationship Towards the 21st Century, pp. 91–121. Singapore: Japanese University GraduatesAssociation of Singapore, 1988. Lloyd, P. “A Tariff Substitute for Rules of Origin in Free Trade Areas”. World Economy 16 (1993): 699–712. McCleery, R. “Modeling NAFT A: Macroeconomic Ef fects”. In Regional Integration and its Impact on Developing Countries, edited by K. Ohno.Tokyo: Institute of Developing Economies, 1993. McKenzie, M. “The Impact of Exchange Rate Volatility on Australian Trade Flows”. Journal of International Financial Markets, Institutions and Money 8 (1998): 21–38. National Science and Technology Board. “ High-Speed link boosts Singapore-US collaborations”. S&T News, Synergy Newsletter, December/January 1998a. ——. “Singapore seals partnership with Johns Hopkins”. S&T News, Synergy Newsletter, February/March 1998b. ——. “The U.S-Singapore Partnership: Strengthening the Connection”. Speech by Tony Tan Keng Yam, Deputy Prime Minister and chairman of Technopreneurship 21 committee, Singapore. Press Releases and Speeches, San Francisco, 9 March 2000. Panagariya, A. “East Asia and the New Regionalism”. World Economy 17 (1998): 817–39. ——. “The Regionalism Debate: An Overview”. World Economy 22 (1999): 477–512. ——. “The Millenium Round and Developing Countries: Negotiating Strategies andAreas of Benefits”. G-24 Discussion Paper Series No.1, UNCTAD, 2000. Perroni, C. and J. Whalley. “The New Regionalism: Trade Liberalization or Insurance?”. Working Paper No. 4626,
© 2001 Institute of Southeast Asian Studies, Singapore
100
Singapore and Free Trade Agreements
NBER, 1994. Rajan, R. “Regional Economic Co-operation Involving Developing Countries in the Post-Cold War World: Lessons from the Asia Pacific”. Development and International Cooperation 10 (1995): 383–404. ——. “Singapore’s Merchandise Trade Linkages with Japan and the United States: Trends, Patterns and Comparisons”. Asian Economic Journal 10 (1996a): 133–63. ——. “Measures of Intra-Industry Trade Reconsidered with Reference to Singapore’s Bilateral Trade with Japan and the United States”. Weltwirtschaftliches Archiv 132 (1996b): 378– 89. Rajan, R. and R. Sen. “Hong Kong, Singapore and the East Asian Crisis: How Important were Trade Spillovers?”. Discussion Paper No. 00/43, Centre for International Economic Studies, University of Adelaide, 2000. Rajan, R. and R. Siregar. “The Vanishing Intermediate Regime and the Tale of Two Cities: Singapore versus Hong Kong”. Discussion Paper No. 00/31, Centre for International Economic Studies, University of Adelaide, 2000. Ravenhill, J. “APEC Adrift: Implications for Econoimic Regionalism in Asia and the Pacific”. The Pacific Review 13 (2000): 319–33. Ruland, J. “ASEAN and theAsian Crisis: Theoretical Implications and Practical Consequences for SoutheastAsian Regionalism”. Pacific Review 13 (2000): 421–51. Sager, M. “Regional Trade Agreements: Their Role and the Economic Impact on Trade Flows”. World Economy 20 (1997): 239–52. Saxonhouse, G. “Regionalism and U.S. Trade Policy in Asia”. In The Economics of Preferential Trade Agreements, pp.108–35. Washington, D.C.: The AEI Press, 1996. Schiff, M. and A. Winters. “Regional Integration, Security , and Welfare”. In Regionalism and Development, European Commission Studies Series No. 1, Washington, D.C.: World
© 2001 Institute of Southeast Asian Studies, Singapore
References
101
Bank, 1998. Schiff et al. Trade Blocs. Washington, D.C.: World Bank, 2000. Schott, J. “More Free Trade Areas”. in Free Trade Areas and US Trade Policy, edited by J. Schott. Washington, D.C.: Institute for International Economics, 1989. Sen, R. “Analysing International Trade Data in a Small Open Economy: The Case of Singapore”.ASEAN Economic Bulletin, 17, no. 1 (2000): 23–35. Singapore Economic Development Board (EDB). “Regional Headquarters Sector Continues to Grow at a Steady Pace”.EDB Press Releases and Speeches, 7 January 1997. ——. “SUBC Makes More Inroads into Asia-Pacific”. Singapore Investment News, 1 July 1998a. ——. “Singapore-US Business Council Kicks off Second Meeting in Singapore and China”. EDB Press Releases and Speeches, 23 May 1998b. ——. “Singapore as a base for US companies in Asia”. Keynote Address by Singapore Deputy Prime Minister Tony Tan Keng Yam at the Asia-Pacific Council of American Chamber of Commerce (APCAC) Annual Conference. EDB Press Releases and Speeches, 9 April 1999. ——. “Promoting Singapore as the Premier HQ Location”. Singapore Investment News, 30 April 2000a. ——. Annual Report 1999/2000b. Singapore Trade Development Board (TDB). Singapore Trade Statistics, various issues. Srinivasan, T. “Regionalism and the WTO: Is Nondiscrimination Passe?”. In The WTO as an International Organization, edited by A. Krueger. Chicago: The University of Chicago Press, 1998. Takeuchi, K. “Does Japan Import Less than it Should?: A Review of the Econometric Literature”. Asian Economic Journal 3 (1989): 138–70. Whalley, J. “Why do Countries Seek RegionalTrade Agreements?”. In The Regionalization of the World Economy, edited by J. Frankel. Chicago: The University of Chicago Press, 1998.
© 2001 Institute of Southeast Asian Studies, Singapore
102
Singapore and Free Trade Agreements
Wonnacott, P. “Beyond NAFT A: The Design of a Free Trade Agreement of theAmericas”. In The Economics of Preferential Trade Agreements. Washington, D.C.: The AEI Press, 1996. Wonnacott, P. and Wonnacott, R. “Liberalization in the Western Hemisphere: New Challenges in the Design of a Free-T rade Agreement”. The North American Journal of Economics and Finance (1996). Wonnacott, R. “Free-T rade Agreements: For Better or Worse?”. American Economic Review 86 (1996a): 62–66. ——. “Trade and Investment in a Hub-and-Spoke SystemVersus a Free Trade Area”. World Economy 19 (1996b): 237–52. Wonnacott, R. and M. Lutz. “Is there a Case for FreeTrade Areas?”. In Free Trade Areas and US Trade Policy, edited by J. Schott. Washington, D.C.: Institute for International Economics, 1989. World Bank. World Development Report 1999/2000, Washington D.C., 2000. Yeats, A. “Just How Big is Global Production Sharing?”. Policy Research Working Paper No. 1871, World Bank, 1997.
© 2001 Institute of Southeast Asian Studies, Singapore
Index
103
Index
A
ADF Unit-Root Test 48 Arch-LM test 50 ASEAN 3, 73, 85 ASEAN Free Trade Area (AFTA) 75, 76, 85 ASEAN Investment Area (AIA) 85 ASEAN plus Three (APT) 12, 88 Asia-Pacific Economic Co-operation (APEC) 4, 71, 72, 75, 85, 87 assemble-and-export strategy 21
B
Backbone Network Service (vBNS) 59 “bicycle theory” 7 bioinformatics 59
C
chemical industry 57, 62 co-integration test 53 commodity composition 22 competition policy 61 Connect@sg 58 Contact Singapore 58 cost advantages 9 Customs Union (CU) 91
[email protected]
D
data processing machines 25, 29 Digital Audio Broadcasting 61 Digital Television 61 domestic exports 43 to Japan 18 to United States 18 Durbin-Watson test 50
E
e-commerce 60 e-governance 60 Economic Development Board (EDB) 56 education services 59 electronic products 25 electronic valves 25 electronics industry 25, 57, 62 engineering 57, 62 Error Correction Model 54 European Free Trade Area (EFTA) 4, 91 European Union (EU) 7, 61 export demand functions 45 export function model 51 export intensity index 80 exports leading product groups 26 to Japan 16 to United States 16 103
© 2002 Institute of Southeast Asian Studies, Singapore
104
Singapore and Free Trade Agreements
F
foreign demand impact of change 45 foreign direct equity investment 62, 66 foreign direct investment 10, 61 foreign exports significance to aggregate demand 52 foreign income variable 46 Free Trade Agreement of the Americas (FTAAs) 11
G
General Agreement on Tariffs and Trade (GATT) 7, 87 Generalized System of Preferences (GSP) 91 government procurement 61 gross domestic product 1 growth performance 3 Grubel-Lloyd (G-L) index 29, 44, 83
H
headquarters services 62 health services 59 hospitality services 57
I
import intensity index 80 importance of FTAs 11 imports leading product groups 27 Industry 21 (I21) plan 56 Info-communications and Development Authority (IDA) 58
information and communication technology 57 intellectual property 61 Interactive Broadband Multimedia (IBBMM) 60 International Business Hub 2000 56 international services hub 55 Internet 60 intra-industry trade (IIT) 29 domestic export values with Japan 40 with United States 37 measures of 83 total export values with Japan 34 with United States 30 investment linkages 61, 66
K
Japan–Singapore Advanced Multimedia Co-operation (JSAMCC) 60 Japan–Singapore Economic Partnership Agreement (JSEPA) 60 Johansen Maximum Likelihood test 53 Johns Hopkins Medicine 59, 90
K
Kent Ridge Digital Lab (KRDL) 59
L
leading product groups exports 26 imports 27
© 2002 Institute of Southeast Asian Studies, Singapore
Index Lee Hsien Loong 85 life sciences 57 logistics/supply chain management 57, 62
M
macroeconomic indicators 2 manufacturing investments 62 manufacturing sector 62 investment commitments 64 media services 57, 62 merchandise exports to Japan 17 to United States 17 merchandise imports from Japan 20 from United States. 20 merchandise trade with Japan 15 with United States. 14 merchandise trade intensities Japan with Singapore 24 Singapore with Japan 23 Singapore with United States 23 United States with Singapore 24 merchandise trade linkages 13 Monetary Authority of Singapore (MAS) 49 multinational corporations (MNCs) 91
N
National Science and Technology Board (NSTB) 58, 90 new regionalism 4, 7, 86 cautionary notes 69
105 North American Free Trade Agreement (NAFTA) 70
O
OLS test 50, 54 on-line transactions 60 Overseas Headquarters/Regional Headquarters scheme 56
P
Pacific-5 FTA 11
R
refined petroleum products 25, 29 regionalism 3 relative price variable 46 reverse imports 21 rules of origin (ROOs) 10, 69, 88
S
services sector 55 co-operation with Japan 60 co-operation with United States. 57 contribution to GDP 55 investment commitments 65 liberalization 61 Silicon Valley 58 Singapore American Business Association (SABA) 58 Singapore Management University (SMU) 59 Singapore ONE 90 Singapore–Japan FTA 11, 13, 19 Singapore–Japan IIT 30, 43 Singapore–New Zealand FTA 4 Singapore–United States Business
© 2002 Institute of Southeast Asian Studies, Singapore
106
Singapore and Free Trade Agreements
Council (SUBC) 57 Singapore–United States FTA 13, 21 Singapore–United States IIT 30, 43 Singapore-Boston Business Alliance 58 Singapore-inc.com 57 SINGAREN 59, 90 SITC 3-digit level 25
trade balances 19 trade creation 13 trade deficits 19 trade deflection 10 trade diversion 13 trade flows 13 trade intensity indices 21, 79 trade linkages 22 transhipment point 3
T
United States–ASEAN FTA 92
tele-architecture 59 tele-education 59 tele-immersive virtual reality 59 tele-manufacturing 59 tele-medicine 59 Telecommunication Authority of Singapore (TAS) 90 Tommy Koh 76 tourism development 61
U V
vBNS 59, 90 volatility index 49
W
Wharton School 59 World Trade Organization (WTO) 8, 71, 72, 87
© 2002 Institute of Southeast Asian Studies, Singapore