Senior Citizens of India: Emerging Challenges and Concerns [1st ed.] 9789811577390, 9789811577406
This book provides an overview of multiple facets of ageing and its evolving dynamics in various Indian states. It elabo
254 6 3MB
English Pages IX, 267 [271] Year 2020
Front Matter ....Pages i-ix
Prologue to Ageing Research (S. Irudaya Rajan, Udaya S. Mishra)....Pages 1-15
The Demographics of Ageing (S. Irudaya Rajan, Udaya S. Mishra)....Pages 17-118
Economic Dependence and Physical Disability: Supporting Mechanisms and Coping Strategies (S. Irudaya Rajan, Udaya S. Mishra)....Pages 119-171
Morbidity, Health Care and Health Interventions (S. Irudaya Rajan, Udaya S. Mishra)....Pages 173-219
Policy, Programmes and Welfare Schemes (S. Irudaya Rajan, Udaya S. Mishra)....Pages 221-244
Unexplored Facets of the Elderly: Kerala Ageing Surveys—A Longitudinal Enquiry (S. Irudaya Rajan, Udaya S. Mishra)....Pages 245-261
Recommendations: New Emerging Areas and Unexplored Avenues (S. Irudaya Rajan, Udaya S. Mishra)....Pages 263-267
Recommend Papers
![Senior Citizens Behind Bars : Challenges for the Criminal Justice System [1 ed.]
9781626374928, 9781626370425](https://ebin.pub/img/200x200/senior-citizens-behind-bars-challenges-for-the-criminal-justice-system-1nbsped-9781626374928-9781626370425.jpg)


![Mobile Citizenship: Spatial Privilege and the Transnational Lifestyles of Senior Citizens [1° ed.]
1138606405, 9781138606401](https://ebin.pub/img/200x200/mobile-citizenship-spatial-privilege-and-the-transnational-lifestyles-of-senior-citizens-1nbsped-1138606405-9781138606401.jpg)
![The Financial Landscape of Emerging Economies: Current State, Challenges and Solutions [1st ed.]
9783030600075, 9783030600082](https://ebin.pub/img/200x200/the-financial-landscape-of-emerging-economies-current-state-challenges-and-solutions-1st-ed-9783030600075-9783030600082.jpg)

![Anticipating and Preparing for Emerging Skills and Jobs: Key Issues, Concerns, and Prospects [1st ed.]
9789811570179, 9789811570186](https://ebin.pub/img/200x200/anticipating-and-preparing-for-emerging-skills-and-jobs-key-issues-concerns-and-prospects-1st-ed-9789811570179-9789811570186.jpg)

![Microplastics in Terrestrial Environments: Emerging Contaminants and Major Challenges [1st ed.]
9783030562700, 9783030562717](https://ebin.pub/img/200x200/microplastics-in-terrestrial-environments-emerging-contaminants-and-major-challenges-1st-ed-9783030562700-9783030562717.jpg)
![Senior Citizens of India: Emerging Challenges and Concerns [1st ed.]
9789811577390, 9789811577406](https://ebin.pub/img/200x200/senior-citizens-of-india-emerging-challenges-and-concerns-1st-ed-9789811577390-9789811577406.jpg)
- Author / Uploaded
- S. Irudaya Rajan
- Udaya S. Mishra
File loading please wait...
Citation preview
S. Irudaya Rajan Udaya S. Mishra
Senior Citizens of India Emerging Challenges and Concerns
Senior Citizens of India
S. Irudaya Rajan Udaya S. Mishra •
Senior Citizens of India Emerging Challenges and Concerns
123
S. Irudaya Rajan Centre for Development Studies Ulloor, Medical College P.O. Thiruvananthapuram, Kerala, India
Udaya S. Mishra Centre for Development Studies Ulloor, Medical College P.O. Thiruvananthapuram, Kerala, India
ISBN 978-981-15-7739-0 ISBN 978-981-15-7740-6 https://doi.org/10.1007/978-981-15-7740-6
(eBook)
© Springer Nature Singapore Pte Ltd. 2020 This work is subject to copyright. All rights are reserved by the Publisher, whether the whole or part of the material is concerned, specifically the rights of translation, reprinting, reuse of illustrations, recitation, broadcasting, reproduction on microfilms or in any other physical way, and transmission or information storage and retrieval, electronic adaptation, computer software, or by similar or dissimilar methodology now known or hereafter developed. The use of general descriptive names, registered names, trademarks, service marks, etc. in this publication does not imply, even in the absence of a specific statement, that such names are exempt from the relevant protective laws and regulations and therefore free for general use. The publisher, the authors and the editors are safe to assume that the advice and information in this book are believed to be true and accurate at the date of publication. Neither the publisher nor the authors or the editors give a warranty, expressed or implied, with respect to the material contained herein or for any errors or omissions that may have been made. The publisher remains neutral with regard to jurisdictional claims in published maps and institutional affiliations. This Springer imprint is published by the registered company Springer Nature Singapore Pte Ltd. The registered company address is: 152 Beach Road, #21-01/04 Gateway East, Singapore 189721, Singapore
Contents
. . . . . . . .
1 1 2 3 4 4 5 5
...
6
...
6
...
7
... ...
8 8
...
9
1 Prologue to Ageing Research . . . . . . . . . . . . . . . . . . . . . . . . . . . 1.1 Introduction . . . . . . . . . . . . . . . . . . . . . . . . . . . . . . . . . . . . . 1.2 The State of Affairs . . . . . . . . . . . . . . . . . . . . . . . . . . . . . . . 1.3 The Knowledge Pool . . . . . . . . . . . . . . . . . . . . . . . . . . . . . . 1.3.1 The National Sample Survey, Round 60, 2004 . . . . . 1.3.2 The National Sample Survey, Round 71, 2014 . . . . . 1.3.3 The LASI Pilot Survey 2010 . . . . . . . . . . . . . . . . . . 1.3.4 The LASI Survey 2016 . . . . . . . . . . . . . . . . . . . . . . 1.3.5 The Indian Human Development Surveys, I (2004) and II (2011–12) . . . . . . . . . . . . . . . . . . . . . 1.3.6 SAGE Waves 0(2002–2004), 1(2007–2010), 2(2014–15), and 3(2018–19) . . . . . . . . . . . . . . . . . . . 1.3.7 The Longitudinal Kerala Ageing Survey I (6 Waves)—2004, 2007, 2010, 2013, 2016 and 2019 . 1.3.8 The Longitudinal Kerala Ageing Survey II (3 Waves)—2013, 2016 and 2019 . . . . . . . . . . . . . . . 1.3.9 Kerala Institutional Ageing Survey (KIAS) 2006 . . . . 1.3.10 Building a Knowledge Base on Population Ageing in India (BKPAI) . . . . . . . . . . . . . . . . . . . . . . . . . . . 1.3.11 The National Family Health Surveys I (1992–93), II (1998–99), III (2005–06) and IV (2015–16) . . . . . . 1.4 Organization of the Book . . . . . . . . . . . . . . . . . . . . . . . . . . . 1.5 Summing up . . . . . . . . . . . . . . . . . . . . . . . . . . . . . . . . . . . . References . . . . . . . . . . . . . . . . . . . . . . . . . . . . . . . . . . . . . . . . . .
. . . .
. . . .
. . . .
9 10 11 12
2 The Demographics of Ageing . . . . . . . . . . . . . . 2.1 Introduction . . . . . . . . . . . . . . . . . . . . . . . . 2.2 The Magnitude . . . . . . . . . . . . . . . . . . . . . . 2.2.1 Persons Aged 60 Years and Above . 2.2.2 Nonagenarians and Centenarians . . .
. . . . .
. . . . .
. . . . .
17 17 24 24 32
. . . . .
. . . . .
. . . . .
. . . . .
. . . . .
. . . . .
. . . . .
. . . . .
. . . . .
. . . . .
. . . . .
. . . . .
. . . . .
. . . . . . . .
. . . . . . . .
v
vi
Contents
2.3 Differentials . . . . . . . . . . . . . . . . 2.3.1 Age Differentials . . . . . . 2.3.2 Sex Differentials . . . . . . 2.3.3 Sex Ratio . . . . . . . . . . . 2.3.4 Rural–Urban Distribution 2.4 Measures of the Ageing Process . 2.4.1 Broad Age Structure . . . . 2.4.2 Median Age . . . . . . . . . . 2.4.3 The Index of Ageing . . . 2.4.4 Dependency Ratios . . . . 2.5 Social and Economic Dimensions 2.5.1 Literacy . . . . . . . . . . . . . 2.5.2 Marital Status . . . . . . . . 2.5.3 Economic Conditions . . . 2.5.4 Living Arrangements . . . 2.6 Conclusion . . . . . . . . . . . . . . . . . References . . . . . . . . . . . . . . . . . . . . .
. . . . . . . . . . . . . . . . .
. . . . . . . . . . . . . . . . .
. . . . . . . . . . . . . . . . .
. . . . . . . . . . . . . . . . .
. . . . . . . . . . . . . . . . .
. . . . . . . . . . . . . . . . .
. . . . . . . . . . . . . . . . .
. . . . . . . . . . . . . . . . .
. . . . . . . . . . . . . . . . .
. . . . . . . . . . . . . . . . .
. . . . . . . . . . . . . . . . .
. . . . . . . . . . . . . . . . .
. . . . . . . . . . . . . . . . .
. . . . . . . . . . . . . . . . .
. . . . . . . . . . . . . . . . .
. . . . . . . . . . . . . . . . .
. . . . . . . . . . . . . . . . .
. . . . . . . . . . . . . . . . .
. . . . . . . . . . . . . . . . .
. . . . . . . . . . . . . . . . .
. . . . . . . . . . . . . . . . .
. . . . . . . . . . . . . . . . .
. . . . . . . . . . . . . . . . .
. 32 . 32 . 45 . 45 . 45 . 55 . 55 . 65 . 65 . 68 . 68 . 72 . 73 . 78 . 99 . 115 . 116
3 Economic Dependence and Physical Disability: Supporting Mechanisms and Coping Strategies . . . . . . . . . . . . . . . . . . . 3.1 Introduction . . . . . . . . . . . . . . . . . . . . . . . . . . . . . . . . . 3.2 Conceptual Framework . . . . . . . . . . . . . . . . . . . . . . . . . 3.3 Economic Dependency . . . . . . . . . . . . . . . . . . . . . . . . . 3.4 Disability of the Elderly . . . . . . . . . . . . . . . . . . . . . . . . 3.5 The Double Burden: The Co-existence of Economic Dependency and Disability . . . . . . . . . . . . . . . . . . . . . . 3.6 Supporting Mechanisms and Coping Strategies . . . . . . . . 3.6.1 Public and Private Health Interventions . . . . . . . 3.6.2 Family-Level Intervention . . . . . . . . . . . . . . . . . 3.6.3 Self-efforts . . . . . . . . . . . . . . . . . . . . . . . . . . . . 3.7 Conclusion . . . . . . . . . . . . . . . . . . . . . . . . . . . . . . . . . . References . . . . . . . . . . . . . . . . . . . . . . . . . . . . . . . . . . . . . .
. . . . .
. . . . .
. . . . .
. . . . .
. . . . .
. . . . .
. . . . .
119 119 120 122 130
. . . . . . .
. . . . . . .
. . . . . . .
. . . . . . .
. . . . . . .
. . . . . . .
. . . . . . .
148 150 153 163 166 169 170
4 Morbidity, Health Care and Health Interventions 4.1 Introduction . . . . . . . . . . . . . . . . . . . . . . . . . . 4.2 Conceptual Framework . . . . . . . . . . . . . . . . . . 4.3 Morbidity Conditions . . . . . . . . . . . . . . . . . . . 4.3.1 Chronic Morbidity . . . . . . . . . . . . . . . 4.4 Health Care and Utilization . . . . . . . . . . . . . . . 4.5 Health Interventions . . . . . . . . . . . . . . . . . . . . 4.6 Recommendations and Insights . . . . . . . . . . . . 4.6.1 Summing up . . . . . . . . . . . . . . . . . . . References . . . . . . . . . . . . . . . . . . . . . . . . . . . . . . .
. . . . . . . . . .
. . . . . . . . . .
. . . . . . . . . .
. . . . . . . . . .
. . . . . . . . . .
. . . . . . . . . .
. . . . . . . . . .
173 173 174 175 180 186 193 211 217 218
. . . . . . . . . .
. . . . . . . . . .
. . . . . . . . . .
. . . . . . . . . .
. . . . . . . . . .
. . . . . . . . . .
. . . . . . . . . .
Contents
5 Policy, Programmes and Welfare Schemes . . . . 5.1 Introduction . . . . . . . . . . . . . . . . . . . . . . . . 5.2 The National Policy for Senior Citizens . . . . 5.2.1 Areas of Intervention . . . . . . . . . . . 5.3 Welfare Schemes/Programmes . . . . . . . . . . . 5.4 Schemes in Banking and Tax Department . . 5.5 Employees’ State Insurance (ESI) Act 1948 . 5.6 Establishments . . . . . . . . . . . . . . . . . . . . . . 5.7 Summing up . . . . . . . . . . . . . . . . . . . . . . . References . . . . . . . . . . . . . . . . . . . . . . . . . . . . .
vii
. . . . . . . . . .
. . . . . . . . . .
. . . . . . . . . .
. . . . . . . . . .
. . . . . . . . . .
. . . . . . . . . .
. . . . . . . . . .
. . . . . . . . . .
. . . . . . . . . .
. . . . . . . . . .
. . . . . . . . . .
. . . . . . . . . .
. . . . . . . . . .
. . . . . . . . . .
. . . . . . . . . .
. . . . . . . . . .
221 221 223 224 237 239 240 241 242 243
6 Unexplored Facets of the Elderly: Kerala Ageing Surveys—A Longitudinal Enquiry . . . . . . . . . . . . . . . . . . . . . . . 6.1 Introduction . . . . . . . . . . . . . . . . . . . . . . . . . . . . . . . . . . . . . 6.2 Kerala Ageing Survey I . . . . . . . . . . . . . . . . . . . . . . . . . . . . 6.3 Kerala Ageing Survey II [W1 (2013), W2 (2016) and W3 (2019)] . . . . . . . . . . . . . . . . . . . . . . . . . . . . . . . . . . 6.4 An Exploration of the Kerala Ageing Survey First Set . . . . . . 6.4.1 Diseases Among the Elderly and Household Patterns . 6.4.2 Falls Among the Elderly . . . . . . . . . . . . . . . . . . . . . . 6.4.3 Falls in 2004: Alive or Dead . . . . . . . . . . . . . . . . . . 6.4.4 Subjective Well-Being Inventory (SUBI) . . . . . . . . . . 6.4.5 Panel Data Analysis of Subjective Well-Being . . . . . . 6.4.6 General Health Questionnaire (GHQ) . . . . . . . . . . . . 6.4.7 Causes of Death Among the Elderly in 2004 Survey . 6.5 Exploration of the Kerala Ageing Survey Second Set . . . . . . . 6.5.1 Handgrip Measurements Among the Elderly . . . . . . . 6.6 Conclusion . . . . . . . . . . . . . . . . . . . . . . . . . . . . . . . . . . . . . . References . . . . . . . . . . . . . . . . . . . . . . . . . . . . . . . . . . . . . . . . . .
. . . . . . . . . . . . .
. . . . . . . . . . . . .
. . . . . . . . . . . . .
248 249 250 251 252 252 253 254 255 256 256 258 259
7 Recommendations: New Emerging Areas and Unexplored Avenues . . . . . . . . . . . . . . . . . . . . . . . . . . . . . . . . . . . . . . 7.1 Introduction . . . . . . . . . . . . . . . . . . . . . . . . . . . . . . . . 7.2 Major Concerns . . . . . . . . . . . . . . . . . . . . . . . . . . . . . 7.3 Strategic Insights . . . . . . . . . . . . . . . . . . . . . . . . . . . . 7.4 Unexplored Areas . . . . . . . . . . . . . . . . . . . . . . . . . . . . 7.5 Summing up . . . . . . . . . . . . . . . . . . . . . . . . . . . . . . . References . . . . . . . . . . . . . . . . . . . . . . . . . . . . . . . . . . . . .
. . . . . . .
. . . . . . .
. . . . . . .
263 263 264 266 266 267 267
. . . . . . .
. . . . . . .
. . . . . . .
. . . . . . .
. . . . . . .
. . . 245 . . . 245 . . . 246
About the Authors
Prof. S. Irudaya Rajan is Professor at the Centre for Development Studies, Thiruvananthapuram, Kerala, India. He was the President of the Association of Gerontology (AGI, India) as well as Kerala Economic Association (KEA). He has close to four decades of research experience and has published extensively in national and international journals on social, economic, health and demographic facets of population ageing. He is the lead author of the book India’s Elderly: Burden or Challenge? (1999) and has edited the books Social Security for the Elderly: Experiences from South Asia (2008); India’s Aged: Needs and Vulnerability (2017); Elderly Care in India: Societal and State Responses (Springer, 2017) and Abuse and Neglect of the Elderly in India (Springer, 2018). Professor Rajan has been involved in several projects on ageing funded by the United Nations (UN), United Nations Fund for Population Activities (UNFPA), World Bank (WB), International Labour Organization (ILO), HelpAge International, South Asian Network of Economic Institutes, Indo-Dutch Program on Alternatives in Development (IDPAD), Shastri Indo-Canadian Institute and International Development Research Centre. He has also undertaken considerable research on international migration and is the Editor of two series – India Migration Report and South Asia Migration Report. He is the Founder Editor-in-Chief of the international journal Migration and Development. Prof. Udaya S. Mishra is a Statistician/Demographer serving as a Professor at the Centre for Development Studies, Thiruvananthapuram, Kerala, India. He is engaged in research and teaching on population and development issues and has a number of national and international publications to his credit. He has served in various capacities of guiding scientific research in social sciences. During his two and a half decades of teaching and research experience, he has contributed in the areas of ageing, health, nutrition as well as population policy and programme evaluation. His research interests include measurement issues in health and equity focus in evaluation of outcomes.
ix
Chapter 1
Prologue to Ageing Research
Abstract The dimensions of ageing research and the challenges senior citizens in India face form the rationale behind both the present study and the significance of this book in the contemporary world, particularly in the midst of the vast knowledge of geriatric research. Specifically, the awareness of the plight of senior citizens and the major data sources available in the country regarding this segment of the population are the two aspects explored in this chapter. The gaps in the present knowledge pool and the ways to plug some of these loopholes using the information available are also discussed. Finally, a brief description of the contents of the book is enclosed to convey a comprehensive idea of the work.
1.1
Introduction
According to the population projections made by the authors of this work, India has around 136 million people who crossed the age of 60 in 2020. They constitute nearly 10% of the total population (Rajan and Sunitha 2015). This book is about the status of older individuals, the analysis of which exposes multiple facets of the phenomenon of ageing and its evolving dynamics in various states in India. A demographic account of the elderly populace serves to elaborate on aspects such as health, dependence and disability as well as the living arrangements. The demographic transition that caused the shift from a younger population to an elderly one presents wide-ranging and complex health, social and economic challenges that will intensify in the future (Kavita 2018; Kumudini 1996; Rajan et al. 1999; Liebig and Rajan 2003a, b; Sahoo et al. 2009; Johnson and Rajan 2010; Mishra and Rajan 2017; World Bank 1994, 2011; James 2011; Gridhar et al. 2014). The structural changes in demography, if not perceived and acted upon, can have far-reaching effects on the future planning and perspectives of any nation (Bose and Shankardass 2004; Rajan 1989; Rajan and Zachariah 1998; Lamb 2000; Cohen 1998; Raju 2017). The massive challenges of a growing burden of non-communicable diseases with their inherent differential features, along with the needs and vulnerabilities of an increasing female older population and income © Springer Nature Singapore Pte Ltd. 2020 S. Irudaya Rajan and U. S. Mishra, Senior Citizens of India, https://doi.org/10.1007/978-981-15-7740-6_1
1
2
1 Prologue to Ageing Research
insecurity, can pose serious threats to economic and social well-being (Rajan et al. 1995, 1996, 2000, 2001, 2003; Rajan 2008; Bhat 1992). While such an account of emerging concerns regarding the rising magnitude of the elderly population is not rare, this book may be different on numerous counts. Here, the elderly population is accounted for beyond the individual domain to that of the household and much of the analysis is done in a dynamic manner to accommodate a life course perspective of the ageing process. Obvious conditions, including the deterioration in health, disability and dependent status of the elderly, are not left out (Prasad 2007, 2010; Sreerupa et al. 2018; Rajan 2004, 2006, 2007, 2010; Alam 2006; Lamb 2000). However, the scrutiny differentiates these elements under varied aspects such as household conditioning, gender dynamics and region, all of which provide a better understanding of the patterns of demographic trends. The information set obtained from periodic National Sample Surveys (NSS) and the decadal census has been put to use to offer a wider and enriched appreciation of the demographic reality evolving in India. This exercise that manifests a truly Indian experience has its own share of implications for countries in the developing regions of the world as well. The developed nations have been confronted with the issue of population ageing. The strategies and policies of the governments concerned to that effect have been in keeping with the pace of ageing that is slow and gradual. Nevertheless, the similar process is rather rapid in developing countries like India which lacks adequate recognition and preparedness in terms of policies and programmes (Rajan and Kumar 2003; Rajan and Mishra 2014). This study aims to provide an insight into this phenomenon, which has simply been described as alarming without taking into consideration the inevitable reality with optimism.
1.2
The State of Affairs
In India, the declining fertility, reduction in mortality and augmented life expectancy significantly contribute to population ageing. This scenario has significantly changed the age structure of the populace in a manner that is highly favourable to elderly groups. When compared with the younger cohort, the rising hump in the number of older individuals can be seen in the country’s age pyramids. Meanwhile, the increase in the old age dependency ratio raises the concern that the nation is moving into a growing scarcity of resources regarding public intervention programmes, including old age pensions and health care. Many issues crop up in the conceptualization and execution of ageing research in India. The basic definition of ageing in the country is in itself debatable (Rajan and Mishra 1995). Is the concept of ageing on the basis of retirement from a job really a viable option for planning and building strategies for senior citizens? The question is crucial in the context of the high unemployment rates and lack of adequate social security measures that has prevailed at this time, irrespective of non-working or working people in the unorganized sectors in India. Meanwhile, a considerable section of older persons work in the informal sector without retirement and are
1.2 The State of Affairs
3
mostly underpaid. So, the situation is complex and requires analysis at multiple levels in order to give a comprehensive picture. It is a fact that technically, young India will turn into an aged society very soon if the present definition of ageing continues to be accepted. However, there will be a sizable number of older persons who are economically active and with healthy life expectancy prospects. The universal welfare strategies designed for the elderly would not be beneficial for them. The unmet needs of older persons must be assessed periodically to ensure that the policies are relevant. Such an exercise must take care of the present socioeconomic and demographic background. Both policymakers and researchers in the social sciences agree that India urgently needs strong, uniform, social security measures for all its people, which take into consideration the health and livelihood of the beneficiaries (Government of India 2017). The country needs to implement steps that encourage caregivers— including relatives or children—by giving them incentives in terms of tax relaxation and job preferences. It is possible to establish a regular supervision mechanism on the part of local self-governments at regular intervals. This book primarily examines such pertinent issues, particularly the physical and financial disabilities among senior citizens in the present demographic and economic dynamics of the country. A critical evaluation of the existing policies and programmes for senior citizens and various traditional and the modern institutional mechanisms are also explored. Before moving into these aspects, however, the researchers briefly discuss the diverse surveys carried out in the country, which provide staunch evidence to plan strategies and to formulate policies and welfare programmes for the benefit of senior citizens in the Indian context.
1.3
The Knowledge Pool
In the process of empirical research, social scientists and demographers are quite concerned about generating reliable information to frame policies and programmes for the welfare of senior citizens. The county has ample databases to explore various dimensions of ageing in India over a period of time. The National Sample Surveys, the Longitudinal Ageing Study in India (LASI), the Study on Global AGEing and Adult Health (SAGE), Building a Knowledge Base on Population Ageing in India (BKPAI), the National Family Health Surveys (NFHS), the India Human Development Survey (IHDS) and the Longitudinal Kerala Ageing Surveys are widely used by researchers both in India and abroad. This work briefly discusses these surveys to give an idea of the senior citizen’s survey research in India.
4
1.3.1
1 Prologue to Ageing Research
The National Sample Survey, Round 60, 2004
The 60th Round NSS, titled ‘Morbidity, Health Care and the Condition of the Aged’, was conducted during January–June 2004 (NSSO 2004). The survey used a two-stage stratified design with census villages and urban blocks as the first stage units for rural and urban areas, respectively. The second stage unit of the survey focused on the households. The number of villages and the urban blocks surveyed as the central sample was 47,755 and 2668, respectively. This survey collected information on the general healthcare system in India, the public and private sector services outreach and usage, the household expenditure on healthcare services and the problems faced by aged persons. The NSSO covers all Indian states and union territories except some places in the interior areas of Nagaland and Andaman & Nicobar Islands, and Ladakh and Kargil districts of Jammu & Kashmir. In this survey, the elderly were asked whether they had any ailment during the 15 days prior to the date of the survey. Information regarding their hospitalization, particularly in the fortnight prior to the date of the survey, was also collected. In addition, the participants were asked whether they were hospitalized during the 365 days prior to the date of survey (for articles based on the NSS data, see Sreerupa and Rajan 2010; Rajan et al. 1999; Rajan 2004, 2006, 2007, 2010; Prasad 2007, 2010; Srivastava and Mohanty 2012).
1.3.2
The National Sample Survey, Round 71, 2014
The 71st Round of the NSSO survey, titled ‘Social Consumption: Health’, was conducted during January–June 2014 (NSSO 2014). It covered 65,932 households to ascertain the circumstances of older persons, particularly their health status, economic independence and living conditions. This survey served to understand the role of alternative therapy and the cost of treatment for different ailments. In the earlier NSSO Rounds, disability was considered an ailment. In this survey, pre-existing disabilities were regarded as chronic diseases, provided the individuals concerned were under treatment for a month or more during the reference period. Otherwise, the condition was not seen as an illness. Another important aspect was that, unlike in the previous NSSO Rounds, self-medication and the use of drugs without the advice or prescription of a physician were also acknowledged as medical treatment. In the earlier NSSO Rounds, older persons were asked about three major ailments they had been afflicted with on the date of survey and the nature of treatment adopted, in addition to the information on any illnesses suffered during the 15 days prior to the date of survey. Such data was not collected in this Round (Sreerupa et al. 2018) (for additional information, see articles based on the NSS data: Kalosona and Singh 2017; Kutty et al. 2018; Srinivasan et al. 2017; Cramm et al. 2015; Mohanty et al. 2014).
1.3 The Knowledge Pool
1.3.3
5
The LASI Pilot Survey 2010
This Longitudinal Ageing Study in India (LASI) survey was conducted in four states—Kerala, Karnataka, Punjab and Rajasthan—in 2010, with an objective to capture the demographic, economic, health and cultural diversity of the country (Arokiasamy et al. 2012; Lee et al. 2015). Punjab is an economically developed state while Rajasthan is an economically backward state. Kerala and Karnataka are both demographically more advanced states. Kerala is well known for its social development and healthcare infrastructure (for articles based on LASI 2010, see Lee et al. 2015; Cramm and Lee 2014; Lee and Smith 2014; Arokiasamy and Uttamacharya 2013; Longitudinal Ageing Study in India 2011). This survey was conducted by the International Institute of Population Sciences in collaboration with the Harvard School of Public Health and the University of Southern California. It used multistage, area probability sampling design. The study collected bio-mark information from 1683 individuals (734 males and 949 females) aged 45+ and their spouses, irrespective of their age, through face-to-face interviews. In this survey, the respondents were asked to rate their health on a five-point scale—very good, good, moderate, bad and very bad. Information on chronic illnesses such as cancer, lung disease, hypertension, diabetics and heart problems was also collected. The details of the diagnosis, the system of treatment adopted and functional limitations in performing daily activities were also looked into.
1.3.4
The LASI Survey 2016
This longitudinal survey focused on health, and the economic and social well-being of older persons in India, and its first wave was launched in 2016. It is conceptually comparable to the Health and Retirement Study (HRS) in the USA, the Chinese Health and Retirement Longitudinal Study (CHARLS), and the Korean Longitudinal Study of Ageing (KLOSA). LASI provided information on demographics, household economic status, health and biomarkers, health insurance and healthcare utilization, family and social networks, social welfare schemes, work and employment, retirement and pension, life satisfaction and expectation. The survey instruments consisted of three schedules—household schedule, individual schedule and community schedule. The household schedule was administered as per the LASI-selected eligible household. The aspects covered comprised the demographic composition of the household by means of the Roster and identified key informants for various modules in the schedule. The other aspects collected through the household schedule were housing and environment (the physical dwelling of the house, residential history, and physical and social characteristics of the neighbourhood), consumption (market-purchased and home-produced consumption at the household level), assets, debts, income and health insurance.
6
1 Prologue to Ageing Research
The individual schedules were administered to each respondent aged 45 years and their spouses. The schedule comprised a demographic section (date of birth, sex, religion, caste, language, marital status, literacy, education and a few questions for illiterates), family and social networks (questions about immediate family members—including parents, children, and siblings, both alive and dead—social activities and psychosocial measures of life satisfaction, emotional proximity, social status, etc.), social welfare schemes (awareness and utilization of various social security programmes in India), health (overall health, diseases, functional health, family medical history, mental health, health behaviour and food security), healthcare access and utilization, work, retirement and pension, employment history and biomarkers—height, weight, waist circumference, hip circumference, blood pressure, pulse rate, lung function test, vision test, grip strength, timed walk, balance test, dried blood spot, c-reactive protein, Epstein–Barr virus (EBV), glycosylated haemoglobin(diabetes) and haemoglobin (anaemia). The community survey schedule was administered among the local leaders about community demographics, infrastructure resources and health policy. In the rural areas, the key informants were the Sarpanch/Pradhan/Up-pradhan/Panchayat Chairperson/village officer or village secretary. In urban areas, the elected ward member or officer/engineer/secretary/chief medical officer who had intimate knowledge of the ward area for at least two years was the key informants of this survey. The first report is expected to be released in the second half of 2020.
1.3.5
The Indian Human Development Surveys, I (2004) and II (2011–12)
These surveys are the collaborative research effort of the National Council of Applied Economic Research and the University of Maryland. The study covered 41,554 households in 1503 villages and 971 urban regions from the 33 states and union territories. The panel data comprised two rounds. The first round was conducted in 2004, and the second was held during the period 2011–12. The questionnaires used in both the rounds were income and social capital questionnaire, education and health questionnaire, learning tests, tracking sheet, primary school questionnaire, medical facility questionnaire and village questionnaire(Parmar and Saikia 2018; Desai et al. 2008, 2015).
1.3.6
SAGE Waves 0(2002–2004), 1(2007–2010), 2(2014–15), and 3(2018–19)
The Study on Global AGEing and Adult Health (SAGE) was developed by the WHO Evidence, Measurement and Analysis Unit. This longitudinal multicountry
1.3 The Knowledge Pool
7
study gives micro and metadata at the household and individual levels, along with survey materials (Paul et al. 2012; Biritwum et al. 2016; William et al. 2015a, b; Peltzer et al. 2014). The baseline cohort survey was carried out during the 2002–04 period in the six SAGE countries—China, Ghana, India, Mexico, Russia and South Africa. Face-to-face interviews were used to collect the data from 9994 adults aged 18 and older. The major aspects covered in the household survey questionnaire were a Roster of all the individuals in the household, household health intervention coverage, health insurance, health expenditure, indicators of permanent income and health occupations. The individual questionnaire comprised the sociodemographics, health state description, health status valuation, risk factors, mortality, coverage of health interventions, health system goals and social capital, and interviewer observations. The SAGE Wave 1 was conducted in six countries—China, Ghana, India, Mexico, Russian Federation and South Africa—during 2007–2010 and was supported by the US National Institute on Ageing (NIA) Division of Behavioural and Social Research through Interagency Agreements with the World Health Organization (WHO). This survey focused on two target populations—persons aged 50 and those of 18–49 years. The sample size for India was 11,230, which included a large number of women aged 18–49. This survey has instruments with five parts—household questionnaire, individual questionnaire, proxy questionnaire, verbal autopsy questionnaire and appendices, including showcards. The SAGE Wave 2 was conducted during 2014–15, and the sample size for India was 9093 adults aged 18 and above. The latest round SAGE 3 was underway during 2018–19, and the results are not officially published yet (Boateng et al. 2017; Williams et al. 2017).
1.3.7
The Longitudinal Kerala Ageing Survey I (6 Waves)—2004, 2007, 2010, 2013, 2016 and 2019
The Longitudinal Kerala Ageing Survey I was conducted by the Centre for Development Studies (CDS), Thiruvananthapuram, under the leadership of the senior author of this book. The 6th Wave of the survey was completed in 2019. This survey started in 2004 and covered 10,000 households selected from the Kerala Migration Survey (KMS) 2003, conducted by the CDS (for more details about KMS 2003, see Zachariah and Rajan 2009). The respondents were 4940 senior persons, who were followed in the subsequent Waves of KAS, held every three years. The major aspects covered in the 2004 Wave were age, sex, education, marital status, occupation of all members in the elderly households, owner of the individual households, migration history, details of the children, perspectives on old age support systems, attitudes and beliefs, subjective well-being, general health, social interaction and activities, ownership and transfer of assets, marriage of
8
1 Prologue to Ageing Research
children, labour force participation, decision making, social security, and outlook on advanced life and children. The next round in 2007, in addition to the assimilation of data on socioeconomic characteristics of the family members, collected details of diseases, hospitalization, treatment systems, routine activities and instrumental activities of daily living. In the 2010 survey, information regarding the socioeconomic conditions of family members, children (particularly their education, occupation and marital status), grandchildren (their place of residence, the frequency of meeting and communicating with family members), taking care of grandchildren, the general health of older persons, healthcare utilization, behavioural factors and daily activities was collected. The same schedule was used in the 2013 survey (Rajan and Sunitha 2017; Rajan et al. 2016). The 5th Wave was conducted in 2016 and accessed information on socioeconomic characteristics of the family, children, taking care of grandchildren, subjective well-being and general health conditions in the few weeks prior to the survey, common and chronic illnesses, healthcare utilization, recent medical records, medical checkups, behavioural factors, daily routine and instrumental activities. The field activity of the 6th Wave is over, and the report is expected soon. The details of the survey are given in Chap. 6.
1.3.8
The Longitudinal Kerala Ageing Survey II (3 Waves)—2013, 2016 and 2019
Another longitudinal ageing survey—conducted by the CDS and funded by the Government of Kerala—began in 2013, with the aim to contribute towards new policies. The study mainly focused on psychological condition of the elderly by employing a mini-mental state exam, asked a few questions to measure depression and mood, incorporated a self-assessment of health, added recent medical records, enquired into behavioural factors, activities in daily living, instrumental activities and religiosity, and collected biometrics data (Rajan et al. 2017).The total number of older people covered in the 2013 survey was 7768, of which 491 persons died and 1666 remained untraced in the 2016 survey. The details are given in Chap. 6.
1.3.9
Kerala Institutional Ageing Survey (KIAS) 2006
This survey was conducted in 2006, and it covered 4865 elderly persons living in various government and private institutions all over Kerala. The purpose of KIAS was to examine the determinants of several social, economic and health issues, healthy ageing and utilization of health services by the elderly in different old age homes in Kerala (Rajan 2002).
1.3 The Knowledge Pool
9
1.3.10 Building a Knowledge Base on Population Ageing in India (BKPAI) In this study, a survey was conducted in seven states of India—Kerala, Tamil Nadu, Maharashtra, Himachal Pradesh, Punjab, Odisha and West Bengal. This project was coordinated by the Population Research Centre at the Institute for Social and Economic Change, Bangalore. The study used four types of interview schedules: 1. 2. 3. 4.
Household schedule, Individual elderly schedule for household respondents, Institutional schedule and Individual elderly schedule for institutional residents.
The number of households covered was 8960, of which each state had a fixed sample of 1280. The household schedule covered basic information regarding the residents in the homes selected. The kind of amenities, religion, caste, ownership of household land, death of aged persons and causes of death were some of the major aspects examined in the survey. The individual schedule was administered among persons aged 60 or more. This schedule had six sections that covered the socio-demographic profile, marriage, education, migration, current and previous work status, reasons for current work, income and assets, kinds of benefits received from the work, living arrangements, family relationships, subjective health, health-seeking behaviour, disability, morbidity, hospitalization, type of treatment, economic burden of treatment, social security awareness and coverage. The survey also added functional status measurement with caregiver assistance (Ugargol et al. 2016). Quantitative and qualitative information on the functioning of old age homes related to management, human resources, capacity, facilities and finances from both public and private institutions was collected with the help of the institutional schedule. The fourth schedule, named the Individual Elderly Schedule for Institutional Residents, was similar to the individual schedule for household members, with additional questions. The reasons for opting to stay in an old age home and the resident level of satisfaction were among the major points of enquiry. The study has several implications for policy reforms (Tannistha 2014; Alam and Karan 2011).
1.3.11 The National Family Health Surveys I (1992–93), II (1998–99), III (2005–06) and IV (2015–16) The National Family Health Survey (NFHS) is a large-scale, multiround survey conducted among selected households in India, and it gives some indications about older persons in the country. Four rounds of survey were held during the years
10
1 Prologue to Ageing Research
1992–93, 1998–99, 2005–06 and 2015–16. The fifth round of NFHS commenced in 2018 and is currently underway. The Ministry of Health and Family Welfare, Government of India, has designated the International Institute for Population Sciences (IIPS) as the nodal agency to coordinate the procedures and to offer technical guidance for the surveys. The NFHS-1 completed its coverage of 88,562 households from 24 states and Delhi. Data collection was conducted in three phases from April 1992 to September 1993. The funding for the survey was provided by the United States Agency for International Development (USAID), New Delhi. In the NFHS 1, elderly persons were questioned regarding the possibility of blindness, tuberculosis, leprosy, malaria and physical impairment in the three months prior to the survey. This survey collected data regarding employment, education and other demographics of the respondents and their household members (see Visaria and Rajan 1999). NFHS-2 was conducted during 1998–99 in 26 states. The quality of health, family planning services, domestic violence, reproductive health, anaemia, nutrition of women and the status of women were some of the additional features in comparison with the previous round (see Rajan and James 2004). NFHS-3 was conducted during 2005–06 in 29 states of India by 18 research organizations, including five Population Research Centres. The funding was provided by USAID, DFID, the Bill and Melinda Gates Foundation, UNICEF, UNFPA, and MOHFW. NFHS-3 interviewed women aged 15–49 and men aged 15–54. Information on nutritional status, including the prevalence of anaemia, is provided in NFHS-3 for women aged 15–49, men aged 15–54 and children (Rajan and James 2008). NFHS-4 was distinct from the previous rounds. For the first time, the survey provided district-level estimates and the sample size was nearly six times when compared with NFHS-3. The new information was related to malaria prevention, migration in the context of HIV, abortion, violence during pregnancy and the ownership of assets by women and provided more awareness related to biomarkers (Ram et al. 2017; Rajan 2020).
1.4
Organization of the Book
This book is organized into seven chapters. In this opening chapter, the researchers have explained the rationale behind the work, given a brief overview of this book and mentioned the multifarious data available in the field of ageing research. In Chap. 2, the authors examine the demographics of ageing in India using the Census of India and other sample surveys. The composition of the aged population, old age dependency, median age, literacy rate, marital status, economic conditions and living arrangements is discussed from a historical perspective. The prediction for these indicators for 2021 and possible challenges in future are other significant features of this unit.
1.4 Organization of the Book
11
In Chap. 3, the economic dependence and disability of old people are discussed in terms of gender and regional characteristics. The chapter argues that the states with relatively higher economic dependency and disability have more burden than those without these constraints. Rajasthan and Orissa are more disadvantaged states with the double burden of physical disability and financial disability. The socially and demographically more advanced South Indian states also have relatively higher levels of elderly with complete economic dependence in the household as in the case of Rajasthan and Orissa, even though the former show lower disability rate in old age. Various support mechanisms and coping strategies of the elderly are discussed in detail. Chapter 4 deals with the health of older persons in India measured in terms of the morbidity condition. The health care and intervention programmes for the elderly are explored along with commendation for a paradigm shift in the health policy. The current health policy places little emphasis on the well-being of old people. A proposal to implement a long-term and short-term policy designed from a life course perspective is suggested at the end. Chapter 5 gives a description of the welfare schemes and programmes for older persons in India. It also gives a historical background of the programmes. The unexplored areas of ageing research are elucidated in Chap. 6. It gives some insights from the two longitudinal ageing surveys conducted by the Centre for Development Studies in Thiruvananthapuram, Kerala. Chapter 7 outlines the policies and recommendations for the welfare of the elderly. It gives information on emerging areas in ageing research. A few unexplored avenues are also listed for those who are keen on further research in this field.
1.5
Summing up
In this chapter, the authors have explained the rationale behind the work. In fact, though a large pool of data set is available in ageing research, the available information has not been properly and scientifically explored from regional and policy perspectives. Again, the economic and physical dependency of older persons is one of the most neglected areas that need special attention. The researchers made substantial enquiry into these aspects and have put forward the major findings in the subsequent chapters. The aspects most widely discussed among gerontologists and policymakers would be morbidity in old age. This study delineates morbidity conditions along with the healthcare interventions provided by the public and private sectors in the country. The strategies that could be implemented in the care of the elderly would be a prime concern of the work.
12
1 Prologue to Ageing Research
References Alam, M. (2006). Ageing in India: Socio-economic and health conditions. New Delhi: Academic Foundation. Alam, M., & Karan, A. (2011). Elderly health in India: Dimension, differentials and determinants, BKPAI, Working Paper No. 3, United Nations Population Fund (UNFPA), New Delhi. Arokiasamy, P., Bloom, D., Feeney, K., & Ozolins, M. (2012). Longitudinal aging study in India: Vision, design, implementation, and preliminary findings. In J. P. Smith & M. Malay Majmundar (Eds.), Aging in Asia: Findings from new and emerging data initiatives (pp. 36–74). Washington DC: National Research Council: The National Academies Press. Arokiasamy, P., & Uttamacharya, U. (2013). Multiple chronic diseases and co-morbidities among older adults in India: New insights from Lasi Pilot, 2010. Social Science Research. Bhat, P. N. M. (1992). Changing demography of elderly in India. Current Science, 63(8), 440– 448. Biritwum, R. B., Minicuci, N., Yawson, A. E., Theou, O., Mensah, G. P., Naidoo, N., Wu, F., et al. (2016). Prevalence of and factors associated with frailty and disability in older adults from China, Ghana, India, Mexico, Russia and South Africa. Maturitas, 91(9), 8–18. Boateng, G. O., Adams, E. A., Odei Boateng, M., Luginaah, I. N., & Taabazuing, M.-M. (2017). Obesity and the burden of health risks among the elderly in Ghana: A population study. PLoS ONE, 12(11), e0186947. https://doi.org/10.1371/journal.pone.0186947. Bose, A., & Shankardass, M. K. (2004). Growing old in India: Voices reveal, statistics speak. New Delhi: B R Publishing Corporation. Cohen, L. (1998). No aging in India: Alzheimer’s, the bad family and other modern things. Berkeley: University of California Press. Cramm, J. M., Bornscheuer, L., Selivanova, A., & Lee, J. (2015). The health of India’s elderly population: A comparative assessment using subjective and objective health outcomes. Population Ageing, 8, 245–259. Cramm, J. M., & Lee, J. (2014). Smoking, physical activity and healthy aging in India. BMC Public Health, 14(4), 526–533. Desai, S., Vanneman, R., & National Council of Applied Economic Research (2008). India human development survey (IHDS), 2005. ICPSR22626-v12, Inter-university Consortium for Political and Social Research [distributor], Ann Arbor. https://doi.org/10.3886/icpsr22626.v12 Desai, S., Vanneman, R., & National Council of Applied Economic Research (2015). India human development survey-II (IHDS-II), 2011–12. ICPSR36151-v6, Inter-university Consortium for Political and Social Research [distributor], Ann Arbor. https://doi.org/10.3886/icpsr36151.v6 Government of India. (2017). Universal basic income: A conversation with and within the Mahatma (Chap. 9). In Economic survey 2016–17 (pp. 172021). New Delhi: Government of India. Gridhar, G., Sathyanaryana, K. M., Kumar, S., & James, K. S. (Eds.). (2014). Population ageing in India. New Delhi: Cambridge University Press. James, K. S. (2011). India’s demographic change: Opportunities and challenges. Science, 333 (6402), 576–580. Johnson, S., Irudaya Rajan, S. I. (Eds.). (2010). Population aging and health in India. Rawat Publications. Kalosona, P., & Singh, J. (2017). Emerging trends and patterns of self-reported morbidity in India: Evidence from three rounds of national sample survey. Journal of Health, Population and Nutrition, 36, 32. Published online Aug 9, 2017. https://doi.org/10.1186/s41043-017-0109-x Kavita, S. (2018). As the world ages: Rethinking a demographic crisis. Cambridge: Harvard University Press. Kumudini, D. (1996). The elderly in India. New Delhi: Sage.
References
13
Kutty, V. R, Dilip, T. R., Archana, A. R., Gopinathan, S., & Ramanathan, M. (2018). Shifting pattern of diabetes among the elderly in India: Evidence from the national sample survey organization’s data, 2004–2014. International Journal of Non-communicable Diseases, 3(2), 67–74. Lamb, S. (2000). White saris and sweet mangoes: Ageing, gender and body in North India. Berkeley: University of California Press. Lee, J., McGovern, M. E., Bloom, D. E., Arokiasamy, P., Risbud, A., O’Brien, J., et al. (2015). Education, gender, and state-level disparities in the health of older Indians: Evidence from biomarker data. Economics & Human Biology [Internet]., 19, 145–156. Lee, J., Smith, J. P. (2014). Regional disparities in adult height, educational attainment, and late-life cognition: Findings from the longitudinal aging study in india (LASI). The Journal of the Economics of Aging, 4(4), 26–34. Liebig, P. S., Rajan, S. I. (Eds.).(2003a). An aging India: Perspectives, prospects, and policies. The Haworth Press. Liebig, P. S, & Rajan, S. I. (2003b). An aging India: Perspectives, prospects and policies. Journal of Aging and Social Policy. 15(2 and 3), 1–10. Longitudinal Aging Study in India, Pilot Wave. Harvard School of Public Health, International Institute of Population Sciences, Mumbai, India, and RAND Corporation. (2011). Available: https://mmicdata.rand.org/megametadata/?section=study&studyid=36 Mishra, U. S., & Rajan, S. I. (Eds.). (2017). India’s aged: Needs and vulnerabilities. Orient Blackswan. Mohanty, S. K., Chauhan, R. K., Mazumdar, S., & Srivastava, A. (2014). Out of pocket expenditure on health care among elderly and non-elderly households in India. Social Indicators Research, 115(2), 1137–1157. National Sample Survey Organisation. (2004). Morbidty, health care and the condition of the aged. Ministry of Statistics and Programme Implementation, Government of India. National Sample Survey Organisation. (2014). Social consumption: Health (71st round). Ministry of Statistics and Programme Implementation, Government of India. Parmar, M. C., & Saikia, N. (2018). Chronic morbidity and reported disability among older persons from the India Human Development Survey. BMC Geriatrics, 18(1), 299. https://doi. org/10.1186/s12877-018-0979-9 Paul, K., Chatterji, S., Naidoo, N., Richard Biritwum, W., Fan, R. L., Ridaura, T. M., et al. (2012). Data resource profile: The world health organization study on global ageing and adult health (SAGE). International Journal of Epidemiology, 41(6), 1639–1649. Peltzer, K., Hewlett, S., Yawson, A. E., Moynihan, P., Preet, R., Wu, F., Guo, G., et al. (2014). Prevalence of loss and all teeth (Edentulism) and associated factors in older adults in China, Ghana, India, Mexico, Russia and South Africa. International Journal of Environmental Research and Public Health, 11(11), 11308–11324. Prasad, S. (2007). Does hospitalization make elderly Households poor? An examination of the case of Kerala, India. Oxford Journal Social Policy and Administration, 41(4), 355–371. Prasad, S. (2010). Poverty and deprivation among Indian elderly (Doctoral Dissertation Submitted to Jawaharlal Nehru University, New Delhi). Rajan, S. I. (1989). Aging in Kerala: One more population problem? Asia-Pacific Population Journal, 4(2), 19–48. Rajan, S. I. (2002). Home away from home: A survey of oldage homes and inmates from Kerala, India. Journal of Housing for the Elderly, 16(1 and 2), 125–150. Rajan, S.I. 2004.Chronic Poverty among the Elderly.Working Paper 17, Chronic Poverty Research Centre, India Institute of Public Administration, Delhi. Rajan, S. I. (2006). Population ageing and health in India. Mumbai: The Centre for Enquiry into Health and Allied Themes (CEHAT). Rajan, S. I. (2007). Population ageing, health and social security in India. Centre for Research on Economic Inequality. Discussion Paper Series No. 3. Japan: Osaka City University. Rajan, S. I. (Ed.). (2008). Social policies for the elderly: Experiences from South Asia. Routledge.
14
1 Prologue to Ageing Research
Rajan, S. I. (2010). Demographic ageing and employment in India. Regional Office for Asia and the Pacific. ILO Asia-Pacific Working Paper Series. International Labour Organization. Rajan, S. I. (2020). Twenty five years of the NFHS: Lessons for the future. Economic and Political Weekly, 55(6), 36–39. Rajan, S. I., Devi, A., Samanta, T., & Sunitha, S. (2016). Antecedents of subjective wellbeing among older adults in Kerala, India (Sect. ‘Health & Well Being’ Chap. 7). In T. Samanta (Ed.), Cross-cultural and cross-disciplinary perspectives in social gerontology. Singapore: Springer. Rajan, S. I., & James, K. S. (2004). Second national family health survey: Emerging issues. Economic and Political Weekly, XXXIX (7), 647–651. Rajan, S. I., & James, K. S. (2008). Third national family health survey in India: Issues, problems and prospects. Economic and Political Weekly, 43(48), 33–38 (2008, November 29–December 5). Rajan, S. I., & Kumar, S. (2003). Living arrangements among the Indian elderly: New evidence from the national family health survey. Economic and Political Weekly, XXXVIII(1), 75–80. Rajan, S. I., & Mishra, U. S. (1995). Defining old age: An Indian assessment. Bold, Journal of United Nations Institute on Ageing, 5(4), 31–35. Rajan, S. I., & Mishra, U. S. (2014). The national policy for older persons: Critical issues in implementation (Chap. 65) In G. Giridhat et al. (Eds.), (2015). Population ageing in India (pp. 135–54). Cambridge University Press. Rajan, S. I., Mishra, U. S., & Sarma, P. S. (1995). Living arrangements among the Indian elderly. Hongkong Journal of Gerontology, 9(2), 20–28. Rajan, S. I., Mishra, U. S., & Sarma, P. S. (1996). INDIA: National aging trends (pp. 79–104). In: Life long preparation for old age in Asia and the Pacific. United Nations, New York. ST/ ESCAP/1684. Rajan, S. I., Mishra, U. S., & Sarma, P. S. (1999). India’s elderly: Burden or challenge? Sage. Rajan, S. I., Mishra, U. S., & Sarma, P. S. (2000). Ageing in India: Restrospect and Prospect. Indian Social Science Review, 2(1), 1–47. Rajan, S. I., Mishra, U. S., & Sarma, P. S. (2001). Health concerns among the India’s elderly. International Journal of Aging and Human Development, 53(3), 191–204. Rajan, S. I, Sarma, P. S., & Mishra, U. S. (2003). Demography of Indian aging, 2001–-2015. Journal of Aging and Social Policy, 15(2 and 3), 1–10. Rajan, S. I., & Sunitha, S. (2015). Demography of ageing in India. 2011–2101. Helpage India Research and Development Journal, 21(2), 13–22. Rajan, S. I., & Sunitha, S. (2017). Life satisfaction among the Elderly in Kerala—A longitudinal analysis (Chap. 9). In S. I. Rajan, & U. S. Mishra (Ed.), India’s aged: Needs and vulnerabilities. Hyderabad: Orient Blackswan. Rajan, S. I., Sunitha, S., & Arya, U. R. (2017). Elder care and living arrangement in Kerala. In S. I. Rajan, & G. Balagopal (Eds.), Elderly care in India: societal and state responses. Singapore: Springer. Rajan, S. I., Zachariah, K. C. (1998). Long term implications of low fertility in Kerala. Asia Pacific Population Journal, 13(3), 41–66. Raju, S. S. (Ed.). (2017). Corporate social responsibility in India: Some empirical evidence. Singapore: Springer. Ram, F., Paswan, B., Singh, S. K., Lhungdim, H., Sekhar, C., Singh, A., et al. (2017). National family health survey—4 (2015–16). Economic and Political Weekly, LII(16), 66–70. Sahoo, A. K., Andrews, G. J., & Rajan, S. I. (Ed.).(2009). Sociology of aging: A reader. Rawat Publications. Sreerupa, & Rajan, S. I. (2010). Gender and widowhood: Disparity in health status and health care utilization among the aged in India. Journal of Ethnicand Cultural Diversity in Social Work, 19 (4), 287–304. Sreerupa, R. S. I., Shweta, A., Saito, Y., & Malhotra, R. (2018). Living longer: For better or worse. Changes in life expectancy with and without mobility limitation among older persons in India between 1995–96 and 2004. International Journal of Population Studies, 4(2), 23–34.
References
15
Srinivasan, T. N., Muraleedharan, V. R., & Pratap, B. (2017). Morbidity in India since 1944. Indian Economic Review, 52, 3–35. Srivastava, A., & Mohanty, S. K. (2012). Poverty among elderly in India. Social Indicators Research, 109(2), 493–514. Tannistha, S. (2014). Household context, social capital and wellbeing of older adults in India. BKPAI Working Paper Series II No. 2. New Delhi: United Nations Population Fund (UNFPA). Ugargol, A. P., Hutter, I., James, K. S., & Bailey, A. (2016). Care needs and caregivers: Associations and effects of living arrangements on caregiving to older adults in India. Ageing International, 41, 193–213. Visaria, P., & Rajan, S. I. (1999). National family health survey: A landmark in Indian surveys. Economic and Political Weekly, 34(42–43), 3002–07. William, J. S., Kowal, P., Hestekin, H., O’Driscoll, T., Peltzer, K., Yawson, A., Biritwum, R. et al. (2015a). Prevalence, risk factors and disability associated with fall-related injury in older adults in low and middle income countries: Results from the WHO study on global ageing and adult health (SAGE). BMC Medicine, 13(1), 147–63. William, J. S., Ng, N., Peltzer, K., Yawson, A., Biritwum, R., Maximova, T., Wu, F. et al. (2015b). Risk factors and disability associated with low back pain in older adults in low and middle income countries: Results from the WHO study on global ageing and adult health (SAGE). Plus one, 10(6), 1–21. Williams, J. S., Norström, F., & Ng, N. (2017). Disability and ageing in China and India— decomposing the effects of gender and residence. Results from the WHO study on global ageing and adult health (SAGE). BMCGeriatr 17, 197. World Bank. (1994). Averting the old age crisis: Policies to protect the old and promote growth. Washington: World Bank. World Bank. (2011). Social protection for a changing India. Washington: World Bank. Zachariah, K. C., & Rajan, S. I. (2009). Migration and development: The Kerala experience. New Delhi: Daanish Publishers.
Chapter 2
The Demographics of Ageing
Abstract The transition in the demographics of ageing in India is unique and occurs as a consequence of the changes in fertility and mortality. Predictions regarding the future demographic structure and the composition of the ageing population serve to prepare more viable strategies for the welfare of senior citizens. As in the case of many developed countries, India’s transformation in the ageing process may be viewed in different phases. However, the pace of the ageing process in accordance with the stages of demographic transition is not the same across the nation. Nevertheless, the available evidence shows that the magnitude of the aged population has been increasing very fast and will continue to hike at an exponential rate in future. The demographic shift that contributed to the ageing process, the structural changes in the ageing population, gender dimensions, the measures of the ageing process and the possible demographic consequences are the major aspects discussed in this chapter.
2.1
Introduction
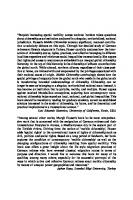
In India, the demographics of ageing are usually examined in terms of the absolute number and proportion of the aged population. In this chapter, apart from these kinds of exploration, the authors have made an attempt to predict the future trends in the demographics of ageing in the country. Again, a detailed examination of the socioeconomic and demographic characteristics of the ageing population with the help of the evidence obtained from official statistics in the Census of India and the Sample Registration System would be useful to understand the present challenges and threats faced by senior persons. The present demographics of ageing in India can be easily explained with the help of the demographic transition theory, which identifies four stages of transition as given in Fig. 2.1. The characteristics of each period are as follows.
© Springer Nature Singapore Pte Ltd. 2020 S. Irudaya Rajan and U. S. Mishra, Senior Citizens of India, https://doi.org/10.1007/978-981-15-7740-6_2
17
18
2 The Demographics of Ageing
Fig. 2.1 Four stages of the demographic transition model. Source: UN publication on world population ageing. https://papp.iussp.org/sessions/papp101_s01/PAPP101_s01_090_010.html
1. Pre-transition stage: This phase is characterized by high birth rates and heavily fluctuating death rates. The consequent balance results in a slow population growth. This trend can be attributed to the pre-modern times, especially the eighteenth century. 2. Early transition stage: High birth rates and a sharp decline in the death rates happen in this period. The improvement in agriculture and public health leads to this trend. This tendency was seen in the late nineteenth century and early twentieth century. Moreover, a shift occurred in the age structure, in which the population majorly consisted of youth. 3. Late transition stage: The birth rate starts to decline and the rate of population growth decelerates. 4. Post-transition stage: Characterized by low birth rates and low death rates, this stage leads to an increasing number of elderly persons in the population. Urbanization and the heightened awareness of health factors are the highlights of this stage. The majority of the states, particularly in the south of India, are currently in the last stage of demographic transition, and other regions are also moving from the third to the fourth phase. In India, the demographic transition has significantly contributed to the ageing process. When compared with mortality, fertility played a predominant role in inducing the ageing process. India has seen a substantial improvement in mortality than fertility since 1950. For instance, the crude birth rate (CBR) per 1000 persons in India declined from 47.3 during 1951–61 to 30.3 in 1993 (Bhat et al. 1984, 1995; Bhat and Rajan 1990). On the other hand, there has been a phenomenal decline in
2.1 Introduction
19
the crude death rate (CDR) per 1000 persons from 28.5–10 during the same period (Bhat and Rajan 1997). As of 2019, the CBR for India stands at 17.6, whereas the reported CDR is 7.3 per thousand population (for more details, see Guilmoto and Rajan 1998, 2001, 2002, 2005, 2013; Rajan et al. 1998; Zachariah et al. 1994; Zachariah and Rajan 1997). The country is expected to have a faster decline in fertility in the future because mortality is already at a low level. The transition from high to low fertility is expected to narrow the age structure at its base and broaden the same aspect at the top. The improvement in life expectancy would further intensify the ageing process. It is essential to obtain a better understanding of the demographic transition and the fluctuations in fertility in the states and union territories of India. Table 2.1 shows the total fertility rate in India per state. Here, the total fertility rate (TFR) is defined as the average expected number of children to be borne by a woman during her entire reproductive span under a given age schedule of fertility. The TFR for India was around 6 in 1971; it declined to 4.8 in 1981, went further down to 3.6 in 1991 and was at 3.2 as of 2001. It is projected to reduce to 2.6 in 2021. That which immediately emerges from Table 2.1 is the vast variation in TFR among states and union territories. The highest TFR was in Arunachal Pradesh (5.2), Meghalaya had 4.9, Uttar Pradesh showed 4.8 and the lowest was 1.7 in Kerala (for more details, see Bhat 1996; Guilmoto and Rajan 2002, 2013). It should, however, be noted that all the states and union territories with higher fertility are expected to reduce their fertility in the near future. During the projection period, only nine states and union territories are expected to have a TFR above 3 by 2021. In fact, 12 states are expected to reach replacement levels of fertility by 2021. It is a well-established fact that TFR and life expectancy at birth are related (see Fig. 2.2). The decline in TFR will facilitate a space for building better health care and child survival, thereby resulting in a healthy population. The best way to comprehend the mortality transition in India is to understand the changes in life expectancy at birth. Table 2.2 shows the life expectancy at birth by sex for the states and union territories in India for the period 1971–2011. Significant improvements occurred in female life expectancy in this time frame. The female life expectancy had gone up by 16.8 years between 1971 and 2001 and the level was 66.1 in 2001. The projections indicate an increase of around six years so as to reach 72.3 years by 2021 (for more details, see Rajan and Mohanachandran Nair 1998). Inter-state disparity exists for this indicator too but faster improvements are expected in states and union territories with lower levels of life expectancy. In particular, the longevity of people in Kerala, Tamil Nadu and Punjab could surpass 75 years in the coming decades. Other states and union territories expect a surge in life expectancy in the future; a few might reach the present level of Kerala by 2021. The life expectancy among males is lower when compared with that of females. A similar difference is expected in the future as well, with the difference slightly widening in the coming decades. Male life expectancy has increased by 14.9 years during the period 1971–2001 and is expected to rise by six years in the next two decades. On the whole, as seen so far, women live longer than men in extreme old age and seem to have an advantage in life expectancy.
20
2 The Demographics of Ageing
Table 2.1 Trends in total fertility rate for India, its states and union territories, 1971–2011 State Andhra Pradesh Arunachal Pradesh Assam Bihar Goa Gujarat Haryana Himachal Pradesh Jammu & Kashmir Karnataka Kerala Madhya Pradesh Maharashtra Manipur Meghalaya Mizoram Nagaland Odisha Punjab Rajasthan Sikkim Tamil Nadu Tripura Uttar Pradesh West Bengal Uttarakhand Jharkhand Chhattisgarh Union Territory Andaman & Nicobar Islands Chandigarh Dadra & Nagar Haveli Daman and Diu Delhi Lakshadweep Pondicherry All India Source: NITI Aayog—SRS
1971
1976
1981
1991
2001
2011
4.6 NA NA NA NA 5.6 6.7 NA NA 4.4 4.1 5.9 4.5 NA NA NA NA 4.7 5.2 6.3 NA 4.0 NA 6.2 NA NA NA NA
4.4 NA NA NA NA 5.1 5.1 NA NA 3.8 3.4 5.8 3.9 NA NA NA NA 4.7 4.8 4.9 NA 3.8 NA 5.9 NA NA NA NA
3.9 NA NA 5.7 NA 4.3 5.0 NA 4.7 3.6 2.8 5.2 3.6 NA NA NA NA 4.3 4.0 5.3 NA 3.4 NA 5.8 4.2 NA NA NA
2.9 5.5 3.5 4.7 1.8 3.3 3.9 3.1 4.3 3.0 1.8 4.5 3.0 3.3 5.2 4.0 4.1 3.2 3.2 4.6 4.2 2.3 4.0 5.3 3.0 NA NA NA
2.7 5.2 3.0 4.3 1.8 2.9 3.4 2.9 3.8 2.7 1.7 4.1 2.7 3.0 4.9 3.6 3.8 2.8 2.8 4.2 3.9 2.1 3.7 4.8 2.6 3.6 4.1 3.6
1.8 3.3 2.4 3.6 1.4 2.4 2.3 1.8 1.9 1.9 1.8 3.1 1.8 1.5 2.8 1.6 1.7 2.2 1.8 3.0 1.6 1.7 1.4 3.4 1.7 2.1 2.9 2.7
NA NA NA NA NA NA NA 6.0
NA NA NA NA NA NA NA 5.3
NA NA NA NA NA NA NA 4.8
2.9 2.2 4.5 2.6 3.6 3.2 2.5 3.6
2.7 2.1 4.2 2.5 3.3 2.9 2.3 3.2
0.7 1.6 2.8 2.0 1.8 1.6 1.7 2.4
2.1 Introduction
21
Fig. 2.2 TFR and life expectancy at birth, the world, 1950–2050. Source: UN publication on world population ageing
Consequent to the fertility and mortality transition, the elderly population in the country has increased substantially. Table 2.3 shows the decadal growth in elderly populace vis-à-vis that of the general population. From the period 1951–61 to 2001–2011, the elderly population rose from 23.9– 35.5%, thereby showing the demographic transition of population ageing and the increasing elderly populace. The initial stages of the demographic transition period have a high younger population. As a result of higher life expectancy, lower mortality rates and lower birth rates, the balancing effect is reduced; the youngsters grew older, which led to a higher proportion of elderly people in the society. Thus, changes in the fertility and mortality have significantly contributed to the current situation of ageing in the country. In such a context, this chapter tries to explore the magnitude of the aged population, the structural change in the ageing population, growth rates, ageing differentials, measures of the ageing process and the socioeconomic characteristics of the aged population. Again, special emphasis is given to ascertain the spatial and gender dimensions.
State Andhra Pradesh Arunachal Pradesh Assam Bihar Chhattisgarh Goa Gujarat Haryana Himachal Pradesh Jammu & Kashmir Jharkhand Karnataka Kerala Madhya Pradesh Maharashtra Manipur Meghalaya Mizoram Nagaland Odisha Punjab Rajasthan
48.3 NA NA NA NA NA 47.3 66.3 NA NA NA 51.9 NA 55.4 54.2 NA NA NA NA 48.2 63.5 47.9
1971 Males 52.2 NA NA NA NA NA 46.5 61.7 NA NA NA 54.8 NA 47.6 55.3 NA NA NA NA 46.6 59.3 45.9
Females 54.6 NA NA 50.5 NA NA 56.1 56.7 NA 58.0 NA 59.7 66.2 47.0 60.7 NA NA NA NA 51.9 62.8 49.7
1981 Males 57.2 NA NA 47.4 NA NA 56.3 57.0 NA 58.0 NA 60.2 70.7 49.3 59.7 NA NA NA NA 49.8 68.5 49.5
Females 60.3 56.0 57.2 59.5 NA 65.0 59.6 64.3 58.0 60.7 NA 63.2 67.4 57.7 63.0 65.0 58.0 61.0 64.0 58.6 66.1 59.2
1991 Males 63.4 59.0 56.9 58.6 NA 70.0 62.1 63.1 59.0 61.0 NA 64.3 73.1 56.4 64.4 66.0 59.0 64.0 63.0 56.8 65.9 60.0
Females
Table 2.2 Trends in life expectancy at birth (in years) for India, its states and union territories, 1971–2011
63.4 60.0 59.6 65.6 58.5 67.3 64.1 67.6 60.7 63.3 64.0 66.8 70.4 62.0 66.5 67.3 60.0 64.0 65.3 63.5 69.1 62.8
2001 Males 67.9 62.3 61.8 64.7 62.0 72.0 64.9 68.3 72.1 64.5 62.0 69.6 76.0 61.3 69.8 68.7 62.3 66.7 66.0 62.3 70.4 67.2
Females 65.5 64.0 61.9 67.3 63.0 69.7 66.0 65.8 69.0 70.6 67.5 66.4 71.8 62.3 69.4 69.7 62.0 67.0 66.7 63.8 69.1 65.4
2011 Males
67.9 62.3 61.8 64.7 62.0 72.0 64.9 68.3 72.1 64.5 62.0 69.6 76.0 61.3 69.8 68.7 62.3 66.7 66.0 62.3 70.4 67.2 (continued)
Females
22 2 The Demographics of Ageing
Sikkim Tamil Nadu Tripura Uttarakhand Uttar Pradesh West Bengal Union Territory Andaman & Nicobar Islands Chandigarh Dadra & Nagar Haveli Daman and Diu Delhi Lakshadweep Pondicherry All India Source: Same as Table 2.1
Table 2.2 (continued)
NA 51.9 NA NA 40.5 NA NA NA NA NA NA NA NA 49.3
NA NA NA NA NA NA NA 48.9
Females
NA 50.5 NA NA 44.8 NA
1971 Males
NA NA NA NA NA NA NA 53.4
NA 53.9 NA NA 48.7 56.5
1981 Males
NA NA NA NA NA NA NA 53.2
NA 54.5 NA NA 46.5 58.4
Females
64.0 65.0 59.0 61.0 64.0 54.0 64.0 59.4
62.0 61.6 56 NA 55.6 61.0
1991 Males
65.0 68.0 64.0 63.0 65.0 59.0 68.0 60.4
63.0 62.0 60.0 NA 51.2 60.7
Females
66.3 67.3 62.0 64.0 66.7 57.3 66.7 63.8
64.7 65.5 60.0 62.0 58.6 64.7
2001 Males
67.7 70.3 66.7 66.0 70.6 62.3 70.3 66.1
66.0 65.5 63.3 66.0 57.2 69.4
Females
68.7 69.7 68.0 67.0 69.3 60.7 69.3 65.8
67.3 68.2 64.0 66.0 62.5 68.5
2011 Males
67.7 70.3 66.7 66.0 70.6 62.3 70.3 66.1
66.0 65.5 63.3 66.0 57.2 69.4
Females
2.1 Introduction 23
24
2 The Demographics of Ageing
Table 2.3 Decadal growth in elderly population vis-à-vis that of the general population Period
In general population (percent change)
In elderly population (percent change)
1951–61 21.6 23.9 1961–71 24.8 33.7 24.7 33.0 1971–81a 23.9 29.7 1981a–91b 21.5 25.2 1991a–2001c 17.7 35.5 2001c–2011c Source: Population census data a The 1981 census could not be held in Assam owing to disturbed conditions. The population figures for 1981 of Assam were worked out by ‘interpolation’ b The 1991 census was not held in Jammu & Kashmir. The population figures for 1991 of Jammu & Kashmir were worked out by ‘interpolation’ c The figures include the estimated population of Mao Maram, Paomata and Purul subdivisions of Senapati district of Manipur
2.2
The Magnitude
The magnitude of the aged population in India can be examined in absolute numbers and its proportion in general population. The absolute number shows the real magnitude and the proportion gives the intensity of the distribution of the elderly in the area concerned. To obtain a better understanding of the issue, the age differentials are to be explored in detail. Operationally, the aged population is examined in five sections—60+, 70+, 80+, 90+ and 100+.
2.2.1
Persons Aged 60 Years and Above
According to the Indian census figures, the proportion of elderly persons has risen steadily from 5.6% in 1961 to 8.6% in 2011. It can be seen from Table 2.4 that the rate of growth in the proportion of the elderly has increased at a relatively slow pace during the period 1961–2011. Based on the projections by the authors, the elderly could see a rapid hike in number in the coming decades, with the proportion expected to increase to 17.5% in 2051. At the state level, as of 2011, Kerala has the highest proportion of elderly people (12.6%), followed by Goa (11.2%) and Tamil Nadu (10.4%). The lowest proportions are to be found in Dadra & Nagar Haveli (4%), followed by the north-eastern states of Arunachal Pradesh (4.6%) and Meghalaya (4.7%). Demographically backward states such as Bihar (7.4%), Rajasthan (7.5%), Uttar Pradesh (7.7%) and Madhya Pradesh (7.9%) report similar percentages.
2.2 The Magnitude
25
Table 2.4 Trends in the share of the aged (60 years and above) in India, its states and union territories (in percentages), 1961–2051 State Andhra Pradesh Arunachal Pradesh Assam Bihar Chhattisgarh Goa Gujarat Haryana Himachal Pradesh Jammu & Kashmir Jharkhand Karnataka Kerala Madhya Pradesh Maharashtra Manipur Meghalaya Mizoram Nagaland Odisha Punjab Rajasthan Sikkim Tamil Nadu Tripura Uttarakhand Uttar Pradesh West Bengal Union Territory Andaman & Nicobar Islands Chandigarh Dadra & Nagar Haveli
1961
1971
1981
1991
2001
2011
2021
2031
2041
2051
6.2 NA
6.4 4.7
6.4 4.8
6.5 4.2
7.2 5.1
9.8 4.6
11.5 6.4
14.4 9.8
19.0 10.7
23.5 12.6
4.3 5.7 NA 8.1 4.9 n.a 7.4 5.1
4.7 5.9 NA 6.6 5.3 5.8 7.2 5.6
NA 6.3 NA 6.8 5.6 6.4 7.5 5.8
5.3 6.1 NA 6.3 6.2 7.5 7.8 5.8
5.2 5.5 7.2 8.2 6.7 7.0 8.8 6.2
6.7 7.4 7.9 11.2 7.9 8.7 10.2 7.4
7.8 7.6 8.3 15.2 10.2 9.8 12.9 9.5
10.2 8.5 10.2 20.5 13.3 12.3 16.5 12.8
12.8 9.1 16.6 26.8 16.9 15.4 16.4 14.5
15.1 10.8 21.3 30.3 20.3 20.0 20.2 19.2
NA 5.7 5.8 5.2 5.3 5.6 NA NA 6.8 5.7 6.6 5.1 4.9 5.6 5.4 NA 6.3 5.0
NA 6.1 6.2 5.8 5.7 6.1 4.6 NA 6.7 6.0 7.5 5.5 3.3 5.7 6.6 NA 6.8 5.3
NA 6.3 7.6 6.0 6.3 5.9 4.4 4.6 5.9 6.3 7.7 5.4 4.4 6.5 7.1 NA 6.5 5.4
NA 6.8 8.8 6.4 6.9 5.9 4.6 4.9 5.4 7.0 7.6 6.1 4.6 7.3 7.0 NA 6.6 6.0
5.9 7.4 10.7 6.2 8.3 6.6 4.7 5.5 5.6 7.8 8.7 6.0 5.3 9.0 6.2 7.7 6.1 6.6
7.2 7.7 12.6 7.9 9.9 7.0 4.7 6.3 5.2 9.5 10.3 7.5 6.3 10.4 7.9 8.9 7.7 8.5
8.1 11.1 16.4 8.1 11.8 9.6 5.9 9.0 7.1 11.0 12.5 8.4 9.2 13.3 10.7 10.5 7.7 11.0
9.5 14.2 20.7 9.9 15.0 13.2 8.1 12.2 10.7 13.6 16.2 10.3 13.0 17.4 15.2 12.8 8.6 14.9
10.4 19.0 28.2 11.3 17.7 16.6 8.9 13.0 12.5 15.8 16.7 13.7 14.4 24.1 16.6 10.8 8.7 16.7
12.5 23.8 34.3 13.4 21.6 20.7 11.4 15.7 17.3 18.9 20.9 18.1 18.7 29.0 21.4 13.4 10.4 20.0
2.8
2.6
2.9
3.6
6.7
8.4
10.6
15.0
20.0
23.5
NA 4.0
3.7 4.1
4.0 4.0
4.5 4.4
6.2 5.4
7.8 4.0
10.5 7.1
14.7 10.2
19.7 14.4
22.1 14.2
(continued)
26
2 The Demographics of Ageing
Table 2.4 (continued) 1961
1971
Daman and Diu NA NA Delhi 4.1 4.3 Lakshadweep NA 5.1 Pondicherry 6.9 6.3 All India 5.6 6.0 Source: Census of India 1961–2011 projection made by the authors
1981
1991
NA 6.3 4.5 4.7 4.9 5.2 6.7 6.9 6.3 6.6 and figures for
2001
2011
2021
7.1 4.7 8.5 5.1 6.8 9.7 6.9 8.2 13.0 7.8 9.7 13.2 6.9 8.6 9.9 the period 2021–2051
2031
2041
2051
13.5 23.7 25.6 14.2 17.9 20.9 17.5 23.5 32.2 18.6 24.6 29.2 12.1 14.0 16.6 is based on population
The projected rapid increase in the proportion of the elderly at the national level is also reflected in the states. Kerala alone had a proportion of the elderly exceeding 10% in 2001; all the other states are expected to have more than 10% elderly by 2051. Based on these projections, during the interim period 2011–2051, the states of Tamil Nadu, Tripura and Goa could witness sharper surges in the proportion of the elderly relative to the other states. In contrast, Bihar, Madhya Pradesh and Uttar Pradesh may see a relatively slower pace of increase. It is evident from Table 2.4 that there are distinct differences in the prevalent and expected proportions of the elderly across various states in India. This tendency reflects the disparate nature of the demographic transition across the states. Kerala and Tamil Nadu are far ahead in the transition process—as seen in the high proportions of the elderly—compared with the demographically backward states, which are at lower levels of demographic development—as is evident from the low proportions of the elderly populace. The absolute number of the elderly presented in Table 2.5 gives another perspective of the intensity of the situation. When compared with the proportions, the absolute numbers of the elderly provide a more convincing variable of study as it shows the real numbers more than the comparative figures in proportion. States such as Uttar Pradesh (46 million elderly), Maharashtra (27 million elderly) and West Bengal (22 million elderly) are expected to have the highest absolute numbers of the elderly in India by 2051. It should be evident that while the proportion of the elderly is seen to be the lowest in the demographically backward states, the absolute number of the aged in these regions is at a much higher level when compared with that in other states due to the higher population size. For India as a whole, the total number of elderly persons is projected to be around 298 million by 2051, from the present figure of 104 million in 2011. Tables 2.6 and 2.7 depict the proportion and absolute numbers of old-old persons in the states and union territories for the period from 1961–2051, which are similar to the patterns noted for the elderly in the previous analysis. The proportion of old-old persons is expected to rise from 3.13% in 2011 to 7.3% in 2051. The highest concentration of the old-old would be seen in Kerala at 5.3%, whereas the lowest would be seen in the north-eastern regions and the demographically backward states. The absolute numbers for 2051 are projected to be the highest in Uttar
180,612
NA
1,350,805
984,082
1,670,508
2,081,086
43,545
NA
NA
25,093
994,811
Jharkhand
Karnataka
Kerala
Madhya Pradesh
Maharashtra
Manipur
Meghalaya
Mizoram
Nagaland
Odisha
1,019,095
Gujarat
Jammu & Kashmir
50,566
Goa
NA
NA
Chhattisgarh
99,527
2,605,509
Bihar
Himachal Pradesh
509,165
Assam
Haryana
2,241,534
NA
Arunachal Pradesh
1961
Andhra Pradesh
State
1,320,643
34,509
NA
46,889
65,328
2,879,324
2,410,103
1,329,053
1,784,582
NA
256,287
247,921
581,724
1,404,283
56,823
NA
3,326,249
705,650
21,726
2,762,364
1971
1,655,950
46,022
22,833
59,170
83,466
3,979,185
3,158,989
1,937,408
2,324,973
NA
344,565
321,142
834,059
1,916,643
73,742
NA
4,378,711
NA
30,093
3,399,483
1981
2,210,270
65,267
34,006
82,000
109,184
5,452,916
4,253,882
2,548,861
3,040,666
NA
432,255
402,719
1,299,808
2,539,992
74,343
NA
5,227,275
1,186,304
36,592
4,306,320
1991
3,044,221
90,538
49,066
105,871
145,774
8,464,894
4,292,243
3,338,427
4,065,985
1,578,662
678,383
548,889
1,590,118
3,502,295
112,859
1,504,383
5,513,118
1,562,060
49,967
5,798,171
2001
3,984,448
102,726
68,628
138,902
200,020
11,106,935
5,713,316
4,193,393
5,791,032
2,356,678
922,656
703,009
2,193,755
4,786,559
163,495
2,003,909
7,707,145
2,078,544
63,639
8,278,241
2011
5,036,689
155,094
107,721
203,443
294,453
14,305,189
6,939,247
5,847,895
7,389,760
3,115,868
1,306,844
956,333
2,787,278
6,935,955
231,158
2,446,348
9,566,826
2,746,120
100,009
10,407,040
2021
6,693,119
253,537
158,072
325,904
428,341
19,199,712
9,655,583
7,614,994
9,868,234
4,222,723
1,922,512
1,287,240
3,808,966
9,873,754
315,136
3,416,257
12,713,827
3,925,294
168,826
13,708,043
2031
Table 2.5 Trends in absolute number of elderly (60 years and above) in India, its states and union territories, 1961–2051
83,45,066
4,43,766
2,08,355
4,77,232
5,16,936
2,23,65,851
1,28,37,888
1,01,75,360
1,33,94,199
55,87,107
21,88,179
14,01,336
46,93,569
1,18,96,812
3,83,742
44,58,298
1,63,41,515
59,90,320
2,33,366
1,91,35,627
2041
(continued)
10,294,541
655,314
269,944
684,934
654,690
27,608,836
17,004,819
11,741,970
16,652,731
7,498,246
3,050,484
1,755,879
6,237,138
14,493,401
405,495
5,771,766
22,419,259
7,676,211
314,156
23,393,452
2051
2.2 The Magnitude 27
NA
2328
NA
109,977
NA
25,316
24,699,125
Chandigarh
Dadra & Nagar Haveli
Daman and Diu
Delhi
Lakshadweep
Pondicherry
All India
Source: Same as Table 2.4
1756
Andaman & Nicobar Islands
Union Territory
1,749,513
West Bengal
61,887
Tripura
NA
1,883,504
Tamil Nadu
4,638,665
7885
Sikkim
Uttar Pradesh
1,036,179
Rajasthan
Uttarakhand
1,326,447
Punjab
1961
Table 2.5 (continued)
32,680,995
29,914
1615
174,338
NA
3011
9406
3031
2,347,918
5,974,126
NA
102,462
2,361,204
6966
1,418,548
1,014,998
1971
41,537,602
40,576
1963
278,862
NA
4147
18,156
5439
2,952,030
7,244,311
NA
144,730
3,124,000
13,880
1,846,371
1,296,703
1981
55,605,593
55,730
2699
443,541
6424
6097
29,019
9957
4,087,110
9,250,336
NA
191,936
4,072,681
18,658
2,666,337
1,532,408
1991
76,827,338
72,841
4153
720,744
8249
9768
45,156
17,953
5,708,012
11,701,370
654,356
232,896
5,545,499
29,145
3,829,788
2,200,154
2001
2011
103,851,051
120,436
5270
1,147,445
11,361
13,892
67,078
25,424
7,742,382
15,439,904
900,809
289,544
7,509,758
40,752
5,112,138
2,865,817
134,547,973
142,947
6730
1,801,398
15,479
18,324
82,021
33,679
10,806,545
18,344,354
1,181,077
418,693
10,166,757
62,334
6,830,580
3,757,785
2021
182,815,679
196,165
9030
2,817,227
36,060
40,074
113,433
64,348
15,396,818
24,098,948
1,570,170
620,511
13,596,878
94,724
9,623,640
5,079,579
2031
23,32,62,583
2,73,125
17,927
35,09,655
50,653
62,673
2,41,702
93,710
1,86,89,919
3,28,03,683
17,63,858
7,31,431
1,66,29,772
1,26,437
1,15,99,990
55,93,524
2041
298,167,494
305,047
23,913
4,137,015
54,451
69,685
270,093
108,910
22,841,535
46,407,739
2,462,950
956,808
18,917,028
170,459
15,821,437
7,035,107
2051
28 2 The Demographics of Ageing
2.2 The Magnitude
29
Table 2.6 Trends in the share of the aged (70 years and above) in India, its states and union territories (in percentages), 1961–2051 1961
1971
1981
1991
2001
2011
2021
2031
2041
2051
Andhra Pradesh
2.2
2.2
2.2
2.1
2.7
3.4
5.4
6.2
8.6
10.9
Arunachal Pradesh
NA
1.6
1.6
1.4
1.7
1.7
2.3
3.4
4.7
5.2
Assam
1.5
1.9
NA
2.0
2.3
2.6
3.1
3.7
5.6
6.6
Bihar
1.9
2.0
2.2
2.1
2.5
2.5
3.4
3.4
4.1
4.4
Chhattisgarh
NA
NA
NA
NA
2.6
2.8
3.3
3.5
7.6
9.1
Goa
3.0
2.2
2.4
2.3
3.1
4.2
6.9
9.3
11.8
16.4
Gujarat
1.9
1.8
2.0
2.3
2.6
3.1
4.2
5.5
7.5
9.3
Haryana
NA
2.1
2.5
3.2
3.1
3.3
4.7
5.3
6.5
8.5
Himachal Pradesh
3.0
2.7
3.1
3.2
4.0
4.6
5.8
7.6
7.0
9.8
Jammu & Kashmir
2.0
2.2
2.3
2.2
2.7
3.1
4.4
5.6
6.4
9.1
Jharkhand
NA
NA
NA
NA
2.1
2.3
3.4
3.8
4.7
5.2
Karnataka
2.1
2.3
2.4
2.6
3.1
3.6
5.0
5.9
8.6
11.0
State
Kerala
2.1
2.3
3.0
3.5
4.4
5.3
7.3
9.8
14.2
18.9
Madhya Pradesh
1.8
2.0
2.4
2.4
2.7
3.2
3.4
3.6
5.0
5.7
Maharashtra
1.8
1.9
2.3
2.5
3.2
3.9
5.4
6.5
7.8
9.7
Manipur
2.1
2.4
2.3
2.2
2.8
2.9
3.7
5.3
6.8
9.3
Meghalaya
NA
1.7
1.6
1.6
1.7
1.8
2.3
2.9
3.7
4.5
Mizoram
NA
NA
1.9
1.8
2.3
2.6
3.6
5.3
5.1
6.9
Nagaland
3.2
3.2
2.7
2.3
1.9
2.1
2.8
4.0
4.8
6.8
Odisha
1.9
2.0
2.3
2.5
3.2
3.7
4.9
5.6
7.1
8.5
Punjab
2.6
3.1
3.2
3.1
3.9
4.1
6.1
7.5
7.3
9.3
Rajasthan
1.7
3.3
1.8
2.1
2.6
3.0
3.7
4.3
6.0
7.5
Sikkim
1.6
0.9
1.5
1.5
2.0
2.7
3.7
5.4
5.8
7.9
Tamil Nadu
1.8
3.1
2.2
2.5
3.4
4.0
5.7
7.4
11.1
14.5
Tripura
2.0
2.7
3.2
3.2
3.3
3.3
4.5
6.3
7.4
9.1
Uttarakhand
NA
NA
NA
NA
3.0
3.5
5.1
6.0
4.7
5.4
Uttar Pradesh
2.3
4.6
2.5
2.5
2.7
3.0
3.5
3.5
3.8
4.1
West Bengal
1.7
3.6
2.0
2.2
2.8
3.3
4.4
5.9
7.5
9.0
Andaman & Nicobar Islands
0.9
1.0
1.1
1.2
1.5
2.3
3.6
5.8
8.3
11.4
Chandigarh
NA
1.3
1.6
1.7
2.0
3.1
3.6
5.7
8.0
11.2
Dadra & Nagar Haveli
1.2
1.0
1.1
1.2
1.8
1.3
2.5
3.6
5.3
7.6
Daman and Diu
NA
NA
NA
2.4
2.7
1.8
3.2
4.6
7.9
14.5
Delhi
1.4
1.6
1.6
1.6
1.9
2.4
4.1
5.8
7.6
10.0
Lakshadweep
1.7
1.6
1.6
1.7
2.2
2.8
5.6
7.9
11.1
15.7
Pondicherry
2.2
2.1
2.3
2.6
3.1
3.9
5.3
7.5
11.1
15.0
All India
2.0
2.1
2.3
2.4
2.9
3.1
4.4
5.0
6.3
7.3
Union Territory
Source: Same as Table 2.4
341,520
2588
Sikkim
NA
Mizoram
528,463
NA
Meghalaya
Rajasthan
16,516
Manipur
Punjab
716,279
Maharashtra
11,938
586,538
Madhya Pradesh
337,087
362,124
Kerala
Odisha
480,980
Karnataka
Nagaland
NA
Jharkhand
380,769
Gujarat
69,348
18,768
Goa
Jammu & Kashmir
NA
Chhattisgarh
NA
892,231
Bihar
39,899
179,769
Assam
Himachal Pradesh
NA
Haryana
779,651
Arunachal Pradesh
1961
Andhra Pradesh
State
1954
424,137
126,234
428,646
16,292
NA
17,401
25,764
957,780
830,052
497,151
667,326
NA
100,681
93,029
208,076
475,707
18,689
NA
1,124,779
277,131
7469
953,936
1971
4001
618,340
542,871
610,415
20,539
9319
21,191
24,367
1,435,424
1,235,928
772,266
905,587
NA
134,973
124,359
322,140
688,158
25,865
NA
1,517,266
NA
10,627
1,183,512
1981
6120
917,462
625,387
794,261
27,968
12,242
29,186
40,195
1,933,577
1,582,634
1,005,868
1,149,308
NA
162,916
164,214
528,165
965,573
26,546
NA
1,802,812
448,133
12,300
1,424,625
1991
11,018
1,473,636
939,860
1,168,791
37,708
20,109
39,791
61,568
3,094,956
1,609,752
1,402,678
1,611,495
553,160
274,603
245,120
656,182
1,310,502
41,928
533,365
2,046,843
601,855
18,064
2,082,435
2001
16,719
2,081,623
1,149,639
1,530,862
41,964
27,978
52,420
81,475
4,386,103
2,298,845
1,776,588
2,210,861
407,108
395,965
313,030
844,967
1,888,735
61,372
373,000
2,609,358
799,204
23,221
2,910,550
2011
25,185
3,032,356
1,839,209
2,245,926
61,033
42,683
78,204
114,499
6,616,882
2,932,784
2,602,285
3,289,742
1,315,131
598,361
433,736
1,330,549
2,867,814
105,092
978,027
4,333,465
1,081,920
36,166
4,904,992
2021
39,081
4,036,938
2,342,504
2,773,176
94,736
68,240
116,081
172,800
8,279,232
3,567,781
3,600,921
4,085,697
1,665,999
840,593
591,172
1,639,630
4,130,331
143,300
1,183,542
5,054,987
1,445,295
57,799
5,898,051
2031
Table 2.7 Trends in absolute number of elderly (70 years and above) in India, its states and union territories, 1961–2051
51,270
50,43,559
24,54,193
37,53,603
1,69,620
81,966
2,00,106
2,12,136
99,29,866
56,56,278
51,27,070
60,52,351
25,39,296
9,59,613
5,96,350
19,96,434
52,83,206
1,69,233
20,48,606
74,12,537
26,18,791
1,03,549
86,14,437
2041
(continued)
72,043
64,99,930
31,21,012
46,16,119
2,56,704
1,19,432
2,69,425
2,93,880
1,24,22,603
71,69,646
64,63,060
76,69,667
30,85,318
1,219,155
7,87,584
26,41,581
66,25,750
2,19,219
24,55,697
90,38,694
33,41,504
1,29,175
1,08,90,927
2051
30 2 The Demographics of Ageing
22,963
NA
1,623,267
578,040
Tripura
Uttarakhand
Uttar Pradesh
West Bengal
399
8123
8,605,408
Lakshadweep
Pondicherry
All India
Source: Same as Table 2.4
NA
38,136
674
Dadra & Nagar Haveli
Delhi
NA
Chandigarh
Daman and Diu
584
Andaman & Nicobar Islands
Union Territory
588,754
1961
Tamil Nadu
Table 2.7 (continued)
1971
11,329,929
9705
501
64,957
NA
750
3456
1105
821,033
2,101,318
NA
42,181
732,139
1981
15,299,938
14,167
649
101,080
NA
1092
7060
1978
1,081,053
2,745,667
NA
65,181
1,073,393
1991
20,252,219
20,569
868
153,918
2466
1717
11,079
3314
1,500,156
3,403,389
NA
87,459
1,407,792
2001
29,377,262
28,931
1312
269,146
3172
3272
14,766
5148
2,275,598
4,470,315
257,974
106,607
2,097,100
2011
39,020,302
48,625
1823
402,974
4300
4345
25,438
8822
3,013,935
5,894,744
352,994
121,935
2,858,780
2021
59,715,569
71,361
3136
757,496
7468
8958
44,621
21,564
4,361,655
8,462,766
570,574
176,343
4,363,586
2031
75,932,292
104,567
6234
1,158,621
10,543
14,236
70,294
29,642
6,105,287
9,824,129
732,192
257,563
5,791,098
2041
10,44,37,368
1,22,552
8,494
14,86,333
16,817
23,248
98,789
38,862
84,14,142
1,44,21,468
7,60,824
3,28,746
76,43,023
2051
13,1,305,066
1,57,007
11,623
19,72,468
30,827
37,285
1,36,849
52,819
1,03,29,188
1,83,15,321
9,89,797
4,04,504
94,59,253
2.2 The Magnitude 31
32
2 The Demographics of Ageing
Pradesh (18 million) and Maharashtra (12 million). In India, the expected number of old-old persons is 131 million, augmented from 37 million in 2011. The proportion and absolute number of both the 60+ and the 70+ age groups gives a snapshot of the imminent ageing of the Indian population. The rapid ageing makes this enquiry highly pertinent.
2.2.2
Nonagenarians and Centenarians
The elderly between the ages of 90 and 99 are known as nonagenarians and the elderly beyond that age (100+) are called centenarians. Tables 2.8, 2.9, 2.10, 2.11, 2.12 and 2.13 give the aged population of 90+ and 100+ in absolute numbers and in proportion. It also gives the male, female, rural and urban breakup. The sex ratio expressed in terms of the number of females per 100 males is given in Table 2.6. The sex ratio of the 90+ group in 1991 was 97 in the country. It rose to 117 in 2011, which implies higher chances for female survival in old age. An interesting aspect of ageing research is to enquire into the number of people who survive up to 100 years. The sex ratio of 100+ years shows that females are more likely to survive than males as the sex ratio was 110 in 1991 and 109 in 2011. Though a marginal decline of one point is observed, females continue to be outnumbered in the country. However, the sex ratio at the state level indicates that in places such as Gujarat and Haryana, the sex ratio at 100+ years is significantly favourable to males.
2.3 2.3.1
Differentials Age Differentials
The structural changes among elderly persons can be seen by dividing the elderly into those belonging to the young-old (60–69 years) and old-old (70–79 years) category. Table 2.14 shows the composition of old persons in India from 1961 in the states and union territories. In 2011, out of 100 persons, 61.7 were young-old and 27.3 belonged to the 70–79 age group. This composition is expected to change slightly to 55.9 and 30.5 by 2051. The shift can be attributed to the rising life expectancy at birth, which increases the proportion of the elderly aged over 80 years. Similarly, dramatic changes are not expected to take place in the composition of the elderly within the states in the coming years. During the period 2011–2051, most of the states, barring Meghalaya, Haryana, Andhra Pradesh, Arunachal Pradesh, Bihar, Goa, Tamil Nadu and Uttar Pradesh are, in fact, projected to see a gradual decline in the share of elderly people in the older 70–79 age
2.3 Differentials
33
Table 2.8 Trends in the proportion aged (90+ and 100+) in India, its states and union territories, 1991–2011 1991 90+ State Andhra Pradesh 0.095 Arunachal Pradesh 0.100 Assam 0.146 Bihar 0.138 Chhattisgarh NA Goa 0.091 Gujarat 0.170 Haryana 0.155 Himachal Pradesh 0.232 Jammu & Kashmir NA Jharkhand NA Karnataka 0.164 Kerala 0.128 Madhya Pradesh 0.184 Maharashtra 0.130 Manipur 0.107 Meghalaya 0.089 Mizoram 0.124 Nagaland 0.193 Odisha 0.134 Punjab 0.237 Rajasthan 0.099 Sikkim 0.057 Tamil Nadu 0.104 Tripura 0.276 Uttarakhand NA Uttar Pradesh 0.185 West Bengal 0.150 Union Territory Andaman & Nicobar Islands 0.084 Chandigarh 0.118 Dadra & Nagar Haveli 0.040 Daman and Diu 0.191 Delhi 0.094 Lakshadweep 0.108 Pondicherry 0.445 All India 0.148 Source: Census of India 1991–2011
100+
2001 90+
100+
2011 90+
100+
0.007 0.016 0.007 0.019 NA 0.010 0.014 0.016 0.032 NA NA 0.022 0.006 0.015 0.019 0.021 0.010 0.031 0.029 0.013 0.038 0.009 0.006 0.009 0.050 NA 0.031 0.017
0.112 0.115 0.155 0.175 0.133 0.117 0.174 0.179 0.308 0.188 0.155 0.168 0.171 0.163 0.186 0.156 0.111 0.110 0.195 0.167 0.306 0.135 0.073 0.150 0.276 0.161 0.184 0.276
0.005 0.010 0.013 0.013 0.012 0.006 0.021 0.012 0.022 0.018 0.010 0.015 0.007 0.014 0.019 0.007 0.010 0.008 0.011 0.011 0.028 0.015 0.007 0.007 0.025 0.013 0.016 0.011
0.186 0.156 0.197 0.174 0.173 0.181 0.232 0.243 0.348 0.253 0.136 0.212 0.225 0.229 0.264 0.177 0.135 0.116 0.176 0.190 0.331 0.176 0.158 0.150 0.292 0.240 0.274 0.264
0.033 0.036 0.036 0.037 0.027 0.027 0.045 0.042 0.051 0.076 0.027 0.037 0.016 0.044 0.052 0.036 0.021 0.011 0.018 0.039 0.069 0.030 0.016 0.018 0.051 0.061 0.100 0.065
0.016 0.033 0.004 0.107 0.016 0.021 0.419 0.018
0.103 0.128 0.055 0.100 0.101 0.117 0.109 0.176
0.012 0.006 0.005 0.008 0.007 0.008 0.004 0.014
0.145 0.144 0.086 0.015 0.143 0.188 0.160 0.222
0.027 0.024 0.020 0.023 0.023 0.022 0.014 0.050
State Andhra Pradesh Arunachal Pradesh Assam Bihar Chhattisgarh Goa Gujarat Haryana Himachal Pradesh Jammu & Kashmir Jharkhand Karnataka Kerala Madhya Pradesh Maharashtra Manipur Meghalaya Mizoram Nagaland Odisha Punjab Rajasthan
401,172 4101 147,641 607,649 NA 7459 318,117 143,587 57,943 NA NA 370,420 288,847 558,588 566,255 11,879 8092 3735 10,753 234,136 224,444 266,346
1991 80+
63,336 867 32,675 118,768 NA 1060 70,166 25,533 12,015 NA NA 44,977,201 29,098,518 66,181,170 78,921,135 1,837,149 1,774,778 689,756 1,209,546 31,659,736 20,281,969 44,005,990
90+ 4831 137 1486 16,372 NA 118 5856 2666 1653 NA NA 73,869 37,273 121,637 102,531 1957 1574 853 2338 42,433 48,103 43,500
100+ 504,310 5649 169,639 565,647 135,305 10,912 374,237 183,885 80,956 82,043 147,960 457,199 389,013 435,768 779,098 17,175 11,243 5308 13,611 293,273 297,954 392,196
2001 80+ 85,184 1264 41,266 145,035 27,706 27,706 87,981 37,811 18,740 19,065 41,802 88,602 54,479 98,413 179,744 3380 2584 974 3875 61,335 74,655 76,239
90+ 4188 110 3441 10,505 2441 2441 10,478 2473 1348 1853 2685 7783 2164 8431 18,638 162 240 75 218 3900 6712 8610
100+ 754,203 7,439 229,575 679,348 186,779 15,781 549,062 274,589 106,737 126,870 188,737 625,310 541,849 668,069 1,180,194 25,794 15,877 8,174 13,806 397,992 379,501 587,053
2011 80+
Table 2.9 Trends in absolute number of elderly (80+, 90+ and 100+) in India, its states and union territories, 1991—2011
23,863 91,935 1515 24,257 23,988 180,786 967 2161 3483 5053 1269 10,736 3997 240,713 44,995 79,727 44,207 166,408 140,155 295 157,353 129,548
90+
3519 19,041 253 6170 3938 38,643 95 493 348 1016 118 1868 623 59,186 8864 16,289 7005 32,172 27,101 69 27,985 22,757 (continued)
100+
34 2 The Demographics of Ageing
Sikkim Tamil Nadu Tripura Uttarakhand Uttar Pradesh West Bengal Union Territory Andaman & Nicobar Islands Chandigarh Dadra & Nagar Haveli Daman and Diu Delhi Lakshadweep Pondicherry All India Source: Same as Table 2.8
Table 2.9 (continued)
406,457 55,858,946 2,757,205 NA 139,112,287 68,077,965
280,661
642,015 138,477 101,586 9,420,644 51,707 807,785 838,567,936
1056
3442 372 654 45,233 256 5189 6,374,511
90+
1643 384,792 34,171 NA 1,188,411 478,128
1991 80+
760 56 194 8831 56 3591 1,239,696
237
232 57,845 7623 NA 257,714 102,094
100+
5208 611 811 70,822 381 8216 8,038,718
1665
2706 553,204 35,244 70,184 1,267,401 669,884
2001 80+
1155 121 158 13,993 71 1061 1,811,225
368
396 93,352 8817 13,696 305,309 221,021
90+
50 12 13 993 5 35 139,472
42
38 4326 790 1095 26,685 8852
100+
7631 1078 1130 113,031 481 13,315 11,289,005
2473
4,642 742,010 39,525 104,905 1,812,484 883,561
2011 80+
61,699 120,771 547,357 256 61,519 296,149 2,685,609
31,676
2642 121 75,151 1994 108,313 550
90+
10,530 20,619 199,598 57 11,222 57,950 605,778
9482
394 14 5431 172 12,654 102
100+
2.3 Differentials 35
State Andhra Pradesh Arunachal Pradesh Assam Bihar Chhattisgarh Goa Gujarat Haryana Himachal Pradesh Jammu & Kashmir Jharkhand Karnataka Kerala Madhya Pradesh Maharashtra Manipur Meghalaya Mizoram
0.112 0.105
0.133 0.117 NA 0.115 0.195 0.158 0.239
NA
NA 0.185 0.144 0.184 0.149 0.108 0.086 0.128
0.157 0.156 NA 0.067 0.147 0.152 0.226
NA
NA 0.144 0.112 0.184 0.112 0.105 0.091 0.119
Females
0.079 0.097
1991 90+ Males
NA 0.015 0.006 0.014 0.013 0.025 0.008 0.045
NA
0.007 0.021 NA 0.007 0.010 0.012 0.030
0.006 0.012
100+ Males
NA 0.028 0.006 0.016 0.024 0.016 0.012 0.016
NA
0.006 0.017 NA 0.014 0.018 0.021 0.033
0.009 0.021
Females
0.159 0.133 0.132 0.140 0.147 0.142 0.106 0.085
0.197
0.148 0.182 0.122 0.091 0.123 0.169 0.279
0.094 0.113
2001 90+ Males
0.151 0.203 0.208 0.188 0.228 0.170 0.117 0.136
0.178
0.162 0.167 0.144 0.144 0.228 0.191 0.339
0.130 0.118
Females
0.009 0.007 0.004 0.008 0.010 0.005 0.008 0.006
0.018
0.008 0.012 0.009 0.005 0.010 0.009 0.013
0.003 0.008
100+ Males
0.011 0.023 0.009 0.020 0.029 0.010 0.012 0.011
0.019
0.018 0.013 0.014 0.008 0.032 0.015 0.032
0.008 0.012
Females
0.101 0.241 0.120 0.229 0.133 0.186 0.160 0.200
0.167
0.124 0.217 0.127 0.172 0.168 0.160 0.190
0.301 0.295
2011 90+ Males
Table 2.10 Trends in the proportion aged (90+ and 100+) by sex in India, its states and union territories, 1991–2011
0.130 0.346 0.150 0.300 0.140 0.194 0.186 0.260
0.187
0.168 0.265 0.162 0.176 0.147 0.153 0.161
0.396 0.372
Females
0.009 0.042 0.020 0.060 0.027 0.037 0.026 0.040
0.036
0.020 0.058 0.021 0.036 0.018 0.041 0.019
0.044 0.058
100+ Males
0.013 0.060 0.022 0.070 0.027 0.040 0.029 0.049 (continued)
0.035
0.028 0.064 0.027 0.038 0.013 0.030 0.016
0.059 0.080
Females
36 2 The Demographics of Ageing
Nagaland 0.226 Odisha 0.136 Punjab 0.243 Rajasthan 0.078 Sikkim 0.052 Tamil Nadu 0.102 Tripura 0.252 Uttarakhand NA Uttar Pradesh 0.197 West Bengal 0.139 Union Territory Andaman & 0.073 Nicobar Islands Chandigarh 0.110 Dadra & Nagar 0.028 Haveli Daman and Diu 0.109 Delhi 0.077 Lakshadweep 0.116 Pondicherry 0.420 All India 0.144 Source: Same as Table 2.8
1991 90+ Males
Table 2.10 (continued)
0.029 0.012 0.040 0.008 0.004 0.009 0.042 NA 0.032 0.011
0.019
0.036 0.006
0.060 0.010 0.019 0.394 0.017
0.157 0.131 0.230 0.121 0.063 0.105 0.303 NA 0.172 0.162
0.099
0.129 0.053
0.276 0.114 0.100 0.470 0.151
Females
100+ Males
0.156 0.023 0.024 0.445 0.020
0.030 0.003
0.012
0.030 0.014 0.035 0.009 0.009 0.009 0.059 NA 0.030 0.022
Females
0.054 0.087 0.093 0.094 0.160
0.114 0.044
0.092
0.208 0.166 0.286 0.105 0.073 0.139 0.224 0.150 0.186 0.253
2001 90+ Males
0.164 0.118 0.142 0.124 0.194
0.146 0.069
0.116
0.180 0.168 0.330 0.168 0.074 0.161 0.330 0.173 0.181 0.300
Females
0.001 0.005 0.000 0.001 0.009
0.004 0.005
0.010
0.010 0.008 0.020 0.010 0.008 0.005 0.012 0.011 0.015 0.005
100+ Males
0.018 0.010 0.017 0.006 0.018
0.008 0.006
0.013
0.012 0.014 0.037 0.021 0.006 0.008 0.039 0.015 0.017 0.018
Females
0.265 0.084 0.188 0.228 0.198
0.219 0.139
0.252
0.183 0.070 0.157 0.173 0.141 0.169 0.162 0.138 0.128 0.130
2011 90+ Males
0.283 0.139 0.207 0.301 0.247
0.272 0.216
0.253
0.285 0.107 0.215 0.252 0.223 0.207 0.283 0.181 0.173 0.161
Females
0.097 0.021 0.034 0.046 0.046
0.037 0.025
0.076
0.036 0.015 0.030 0.030 0.025 0.018 0.014 0.012 0.016 0.021
100+ Males
0.103 0.028 0.038 0.058 0.054
0.047 0.035
0.075
0.054 0.027 0.036 0.044 0.029 0.026 0.019 0.015 0.019 0.034
Females
2.3 Differentials 37
38
2 The Demographics of Ageing
Table 2.11 Sex ratio (number of females per 100 males) among the elderly (90+ and 100+) in India, its states and union territories, 1991–2011
State Andhra Pradesh Arunachal Pradesh Assam Bihar Chhattisgarh Goa Gujarat Haryana Himachal Pradesh Jammu & Kashmir Jharkhand Karnataka Kerala Madhya Pradesh Maharashtra Manipur Meghalaya Mizoram Nagaland Odisha Punjab Rajasthan Sikkim Tamil Nadu Tripura Uttarakhand Uttar Pradesh West Bengal Union Territory Andaman & Nicobar Islands Chandigarh Dadra & Nagar Haveli Daman and Diu Delhi Lakshadweep Pondicherry All India Source: Same as Table 2.8
1991 90+
100+
2001 90+
100+
2011 90+
100+
137 93 78 68 NA 166 124 90 103 NA NA 124 133 93 125 99 91 99 61 94 83 141 105 100 114 NA 77 107
138 149 79 76 NA 203 162 143 107 NA NA 177 116 111 169 61 143 33 92 113 78 112 225 101 131 NA 83 180
135 94 102 84 117 153 170 97 118 81 89 147 168 123 143 117 106 148 78 99 101 148 89 114 140 111 88 111
243 124 199 103 156 161 281 150 233 94 124 324 214 216 269 200 145 188 102 176 163 192 73 153 316 126 106 336
128 113 111 117 111 94 78 90 79 111 126 138 124 124 100 102 115 121 144 119 136 142 154 116 190 136 134 109
132 123 114 106 113 98 64 68 75 97 141 139 113 112 97 106 109 115 137 138 122 141 115 133 148 129 124 143
112 92 180 246 122 81 110 97
50 66 50 252 188 120 111 110
107 99 128 216 112 145 131 113
110 178 100 1200 149 0 400 178
89 109 144 97 102 105 123 117
87 112 128 97 84 109 118 109
State Andhra Pradesh Arunachal Pradesh Assam Bihar Chhattisgarh Goa Gujarat Haryana Himachal Pradesh Jammu & Kashmir Jharkhand Karnataka Kerala Madhya Pradesh Maharashtra Manipur Meghalaya Mizoram Nagaland Odisha Punjab
0.099 0.105 0.149 0.138 NA 0.103 0.183 0.161 0.243 NA NA 0.176 0.138 0.185 0.148 0.099 0.091 0.126 0.208 0.135 0.270
1991 90+ Rural
0.085 0.066 0.117 0.134 NA 0.073 0.144 0.137 0.122 NA NA 0.137 0.100 0.180 0.101 0.127 0.079 0.120 0.121 0.129 0.159
Urban 0.006 0.016 0.006 0.019 NA 0.013 0.014 0.017 0.033 NA NA 0.022 0.005 0.015 0.021 0.015 0.010 0.037 0.032 0.013 0.040
100+ Rural 0.009 0.014 0.010 0.019 NA 0.006 0.015 0.013 0.022 NA NA 0.022 0.007 0.014 0.014 0.037 0.008 0.025 0.014 0.011 0.033
Urban 0.113 0.132 0.159 0.175 0.140 0.125 0.194 0.189 0.324 0.204 0.155 0.186 0.181 0.166 0.223 0.147 0.114 0.120 0.208 0.165 0.354
2001 90+ Rural 0.108 0.052 0.129 0.172 0.105 0.108 0.139 0.153 0.166 0.139 0.157 0.132 0.142 0.154 0.134 0.181 0.102 0.100 0.129 0.174 0.214
Urban 0.006 0.011 0.014 0.012 0.012 0.007 0.025 0.013 0.024 0.020 0.010 0.018 0.008 0.014 0.024 0.007 0.011 0.010 0.011 0.011 0.034
100+ Rural 0.005 0.007 0.008 0.014 0.009 0.005 0.014 0.009 0.008 0.012 0.011 0.009 0.005 0.013 0.012 0.009 0.007 0.007 0.010 0.009 0.015
Urban 0.364 0.391 0.093 0.244 0.180 0.173 0.168 0.167 0.195 0.162 0.116 0.302 0.134 0.233 0.135 0.190 0.179 0.229 0.239 0.064 0.183
2011 90+ Rural 0.197 0.232 0.145 0.233 0.142 0.178 0.131 0.121 0.129 0.214 0.115 0.266 0.138 0.329 0.141 0.191 0.154 0.229 0.222 0.110 0.191
Urban
Table 2.12 Trends in the proportion of aged (90+ and 100+) in urban and rural areas in India, its union territories, 1991–2011
0.053 0.078 0.024 0.057 0.025 0.037 0.016 0.035 0.020 0.040 0.011 0.054 0.023 0.053 0.026 0.038 0.028 0.042 0.046 0.015 0.027
100+ Rural
0.033 0.054 0.024 0.071 0.023 0.042 0.013 0.037 0.011 0.025 0.010 0.041 0.014 0.089 0.028 0.045 0.027 0.049 0.044 0.026 0.045 (continued)
Urban
2.3 Differentials 39
Rajasthan Sikkim Tamil Nadu Tripura Uttarakhand Uttar Pradesh West Bengal Union Territory Andaman & Nicobar Islands Chandigarh Dadra & Nagar Haveli Daman and Diu Delhi Lakshadweep Pondicherry All India Source: Same as Table 2.8
Table 2.12 (continued)
0.095 0.046 0.093 0.218 NA 0.193 0.154
0.033 0.120 0.085 0.143 0.096 0.120 0.655 0.132
0.103 0.101 0.036 0.233 0.074 0.093 0.071 0.153
Urban
0.100 0.058 0.109 0.287 NA 0.183 0.149
1991 90+ Rural
0.018 0.026 0.003 0.159 0.007 0.018 0.009 0.017
0.008 0.006 0.010 0.055 NA 0.022 0.017
100+ Rural
0.011 0.034 0.017 0.048 0.017 0.024 0.650 0.022
0.009 0.008 0.006 0.022 NA 0.065 0.017
Urban
0.129 0.118 0.052 0.071 0.102 0.098 0.102 0.184
0.137 0.075 0.150 0.280 0.167 0.191 0.255
2001 90+ Rural
0.050 0.129 0.065 0.150 0.101 0.141 0.112 0.156
0.127 0.058 0.150 0.252 0.144 0.156 0.328
Urban
0.017 0.007 0.005 0.008 0.007 0.006 0.002 0.015
0.016 0.008 0.008 0.026 0.013 0.017 0.012
100+ Rural
0.002 0.005 0.006 0.009 0.007 0.011 0.004 0.010
0.011 0.000 0.006 0.017 0.011 0.013 0.009
Urban
0.264 0.266 0.174 0.272 0.088 0.200 0.291 0.225
0.228 0.190 0.177 0.248 0.168 0.154 0.176
2011 90+ Rural
0.221 0.201 0.182 0.281 0.111 0.182 0.230 0.214
0.187 0.176 0.191 0.200 0.156 0.145 0.093
Urban
0.075 0.041 0.027 0.091 0.022 0.037 0.056 0.049
0.038 0.028 0.021 0.018 0.019 0.018 0.032
100+ Rural
0.077 0.043 0.038 0.131 0.024 0.029 0.047 0.053
0.037 0.026 0.022 0.014 0.011 0.017 0.019
Urban
40 2 The Demographics of Ageing
State Andhra Pradesh Arunachal Pradesh Assam Bihar Chhattisgarh Goa Gujarat Haryana Himachal Pradesh Jammu & Kashmir Jharkhand Karnataka Kerala Madhya Pradesh Maharashtra Manipur Meghalaya Mizoram Nagaland Odisha Punjab
76.1 91.6 91.1 87.2 NA 67.1 70.7 78.2 95.4 NA NA 74.2 79.3 77.3 69.9 67.1 83.4 55.1 89.3 87.1 80.2
1991 90+ Rural
23.9 8.4 8.9 12.8 NA 32.9 29.3 21.8 4.6 NA NA 25.8 20.7 22.7 30.1 32.9 16.6 44.9 10.7 12.9 19.8
Urban 65.3 89.1 83.9 86.6 NA 76.3 62.7 79.7 94.1 NA NA 68.6 67.5 77.6 70.7 51.7 85.1 63.3 91.7 88.2 74.5
100+ Rural 34.7 10.9 16.1 13.4 NA 23.7 37.3 20.3 5.9 NA NA 31.4 32.5 22.4 29.3 48.3 14.9 36.7 8.3 11.8 25.5
Urban 73.7 90.6 89.2 89.7 84.2 53.9 70.0 75.2 94.7 81.6 77.6 73.3 78.5 75.0 69.3 69.2 82.2 54.9 88.6 84.3 76.3
2001 90+ Rural 26.3 9.4 10.8 10.3 15.8 46.1 30.0 24.8 5.3 18.4 22.4 26.7 21.5 25.0 30.7 30.8 17.8 45.1 11.4 15.7 23.7
Urban 73.8 86.4 91.8 88.0 84.8 58.0 75.5 77.5 96.7 84.3 75.9 78.5 82.1 75.2 73.0 69.8 87.5 58.7 84.9 87.5 81.1
100+ Rural 26.2 13.6 8.2 12.0 15.2 42.0 24.5 22.5 3.3 15.7 24.1 21.5 17.9 24.8 27.0 30.2 12.5 41.3 15.1 12.5 18.9
Urban 65.7 82.2 87.0 88.4 79.4 39.6 59.2 71.3 94.3 76.0 75.2 65.9 57.7 72.4 60.6 64.8 79.5 48.1 78.9 83.2 73.8
2011 90+ Rural 34.3 17.8 13.0 11.6 20.6 60.4 40.8 28.7 5.7 24.0 24.8 34.1 42.3 27.6 39.4 35.2 20.5 51.9 21.1 16.8 26.2
Urban 54.8 75.9 88.6 87.3 77.4 39.3 58.6 64.2 93.5 72.3 74.8 61.8 57.5 69.4 59.1 79.6 86.7 50.8 81.9 80.8 70.7
100+ Rural
45.2 24.1 11.4 12.7 22.6 60.7 41.4 35.8 6.5 27.7 25.2 38.2 42.5 30.6 40.9 20.4 13.3 49.2 18.1 19.2 29.3 (continued)
Urban
Table 2.13 Trends in the percentage distribution of aged (90+ and 100+) in urban and rural areas in India, its states and union territories, 1991–2011
2.3 Differentials 41
Rajasthan Sikkim Tamil Nadu Tripura Uttarakhand Uttar Pradesh West Bengal Union Territory Andaman & Nicobar Islands Chandigarh Dadra & Nagar Haveli Daman and Diu Delhi Lakshadweep Pondicherry All India Source: Same as Table 2.8
Table 2.13 (continued)
22.1 7.3 30.6 12.1 NA 20.7 28.1
10.5 91.2 17.9 35.1 92.1 62.5 94.3 23.0
89.5 8.8 82.1 64.9 7.9 37.5 5.7 77.0
Urban
77.9 92.7 69.4 87.9 NA 79.3 71.9
1991 90+ Rural
82.2 8.0 66.7 78.9 4.2 36.4 0.8 68.3
75.5 88.5 76.7 93.3 NA 58.4 72.3
100+ Rural
17.8 92.0 33.3 21.1 95.8 63.6 99.2 31.7
24.5 11.5 23.3 6.7 NA 41.6 27.7
Urban
84.2 9.4 72.7 45.6 6.9 46.5 31.3 75.4
78.0 91.2 55.9 84.4 77.1 82.3 66.7
2001 90+ Rural
15.8 90.6 27.3 54.4 93.1 53.5 68.7 24.6
22.0 8.8 44.1 15.6 22.9 17.7 33.3
Urban
95.2 12.0 75.0 61.5 6.7 40.0 20.0 79.0
82.6 100.0 60.8 88.0 77.5 83.4 76.0
100+ Rural
4.8 88.0 25.0 38.5 93.3 60.0 80.0 21.0
17.4 0.0 39.2 12.0 22.5 16.6 24.0
Urban
75.8 1.8 40.0 20.7 3.1 20.7 33.2 69.9
74.3 79.2 53.1 76.2 70.6 77.1 60.3
2011 90+ Rural
24.2 98.2 60.0 79.3 96.9 79.3 66.8 30.1
25.7 20.8 46.9 23.8 29.4 22.9 39.7
Urban
73.5 2.8 39.1 22.8 2.6 21.4 43.0 67.3
68.6 78.9 53.0 79.0 64.8 70.7 56.0
100+ Rural
26.5 97.2 60.9 77.2 97.4 78.6 57.0 32.7
31.4 21.1 47.0 21.0 35.2 29.3 44.0
Urban
42 2 The Demographics of Ageing
59.8
61.6
NA
64.4
63.2
64.9
65.5
62.1
NA
NA
52.4
66.0
Jharkhand
Karnataka
Kerala
Madhya Pradesh
Maharashtra
Manipur
Meghalaya
Mizoram
Nagaland
Odisha
NA
Haryana
Jammu & Kashmir
62.5
Gujarat
Himachal Pradesh
NA
65.8
Bihar
62.9
64.7
Assam
Goa
NA
Arunachal Pradesh
Chhattisgarh
65.2
Andhra Pradesh
State
34.0
47.6
NA
NA
37.9
34.5
35.1
36.8
35.6
NA
38.4
40.2
NA
37.5
37.1
NA
34.2
35.3
NA
34.8
67.7
52.8
NA
62.9
60.6
66.9
65.7
62.7
62.7
NA
60.7
62.5
64.3
66.2
67.1
NA
66.2
60.7
65.6
65.5
1971
60– 69
60– 69
70– 79
1961
32.3
47.2
NA
37.1
39.4
33.1
34.3
37.3
37.3
NA
39.3
37.5
35.7
33.8
32.9
NA
33.8
39.3
34.4
34.5
70– 79
63.1
55.4
59.2
64.2
60.0
63.9
60.8
60.1
61.0
NA
60.8
59.2
61.6
64.2
64.9
NA
65.3
NA
65.7
65.6
60– 69
1981
36.9
44.6
40.8
35.8
40.0
36.1
39.2
39.9
39.0
NA
39.2
40.8
38.5
35.8
35.1
NA
34.7
NA
34.3
34.4
70– 79
64.1
57.1
64.0
64.4
63.2
64.5
62.8
60.5
62.2
NA
62.3
59.2
57.1
62.0
64.3
NA
65.5
62.2
66.4
66.9
60– 69
1991
35.9
42.9
36.0
35.5
36.8
35.5
37.2
39.5
37.8
NA
37.7
40.8
43.0
38.0
35.7
NA
34.5
37.8
33.6
33.1
70– 79
61.6
58.4
59.0
62.4
57.8
63.4
62.5
58.0
60.4
65.0
59.5
55.3
58.7
62.6
62.9
64.5
62.9
61.5
63.9
64.1
60– 69
2001
28.7
26.6
30.2
27.0
30.4
27.4
27.3
30.4
28.4
25.7
28.3
29.9
29.7
26.7
27.4
26.5
26.8
27.7
24.8
27.2
70– 79
61.6
59.1
59.2
62.3
59.3
60.5
59.8
57.6
61.8
67.6
57.1
55.5
61.5
60.5
62.5
63.8
66.1
61.5
63.5
64.8
60– 69
2011
28.4
27.4
28.9
26.3
27.8
28.9
28.5
29.4
27.4
24.4
29.2
29.3
26.0
28.0
27.9
26.9
25.0
27.4
24.8
26.0
70– 79
55.4
60.7
60.4
61.6
61.1
53.7
57.7
55.5
55.5
57.8
54.2
54.6
52.3
58.7
54.5
60.0
54.7
60.6
63.5
52.9
60– 69
2021
32.3
27.7
27.1
28.2
28.0
33.2
30.9
30.7
33.0
32.9
29.8
29.5
34.0
29.5
33.1
31.7
35.5
29.0
27.0
34.7
70– 79
58.6
62.6
56.8
64.4
59.7
56.9
63.1
52.7
58.6
60.5
56.3
54.1
57.0
58.2
54.5
65.4
60.2
63.8
65.8
57.0
60– 69
2031
27.8
26.6
29.8
25.9
29.5
28.6
26.4
31.6
28.6
27.5
27.3
29.5
26.8
29.2
29.8
26.4
27.5
26.2
25.5
27.1
70– 79
55.0
61.8
60.7
58.1
59.0
55.6
55.9
49.6
54.8
54.6
56.1
57.4
57.5
55.6
55.9
54.0
54.6
56.3
55.6
55.0
60– 69
2041
32.8
27.8
28.7
31.5
30.0
32.4
32.7
34.2
32.0
33.1
31.9
30.5
31.5
32.4
31.7
33.7
33.0
32.8
33.2
32.2
70– 79
30.9
29.3
32.7
28.1
32.5
31.2
29.3
35.8
31.7
28.2
31.9
30.9
30.1
31.8
37.6
28.9
27.7
30.4
28.5
32.1
70– 79
(continued)
55.2
60.8
55.8
60.7
55.1
55.0
57.8
45.0
53.9
58.9
55.1
54.1
57.6
54.3
45.9
57.5
59.7
56.5
58.9
53.4
60– 69
2051
Table 2.14 Composition of young -old (60–69 years of age) and old-old (70–79 years of age) among elderly (60–80 years of age) in India, its states and union territories (percent), 1961–2051
2.3 Differentials 43
66.9
67.2
68.7
61.3
NA
65.0
67.0
Rajasthan
Sikkim
Tamil Nadu
Tripura
Uttarakhand
Uttar Pradesh
West Bengal
66.7
46.0
65.2
Lakshadweep
Pondicherry
All India
Source: Same as Table 2.4
NA
65.3
71.1
Dadra & Nagar Haveli
Delhi
NA
Chandigarh
Daman and Diu
66.7
Andaman & Nicobar Islands
Union Territory
60.1
Punjab
34.8
54.0
33.3
34.7
NA
29.0
NA
33.3
33.0
35.0
NA
38.7
31.3
32.8
33.1
39.9
65.3
67.6
69.0
62.7
NA
75.0
63.3
63.5
65.1
64.9
NA
58.8
69.1
72.0
70.2
58.0
1971
60– 69
60– 69
70– 79
1961
Table 2.14 (continued)
34.7
32.4
31.0
37.3
NA
24.9
36.7
36.5
34.9
35.1
NA
41.2
30.9
28.1
29.8
42.0
70– 79
1981
63.2
65.1
66.9
63.8
NA
73.7
61.1
63.6
63.4
62.1
NA
55.0
65.7
65.6
66.5
58.0
60– 69
36.8
34.9
33.1
36.3
NA
26.3
38.9
36.4
36.6
37.9
NA
45.0
34.3
34.4
33.5
42.0
70– 79
1991
63.6
63.1
67.8
65.3
61.6
71.8
61.8
66.7
63.3
63.2
NA
54.4
65.4
67.2
65.6
59.2
60– 69
36.4
36.9
32.2
34.7
38.4
28.2
38.2
33.3
36.7
36.8
NA
45.6
34.6
32.8
34.4
40.8
70– 79
2001
61.8
60.3
68.4
62.7
61.6
66.5
67.3
71.3
60.1
61.8
60.6
54.2
62.2
62.2
61.5
57.3
60– 69
27.2
39.7
31.6
27.5
38.5
33.5
32.7
28.7
28.1
27.3
28.7
30.6
27.8
28.5
28.2
29.1
70– 79
2011
61.7
59.6
65.4
64.9
62.2
68.7
62.1
65.3
61.1
61.8
60.8
57.9
61.9
59.0
59.3
59.8
60– 69
27.3
29.3
25.5
25.3
27.9
23.5
26.5
25.0
27.5
26.4
27.5
28.5
28.2
29.6
29.2
26.9
70– 79
2021
55.6
59.8
57.3
58.0
61.7
64.8
66.1
65.9
59.6
53.9
51.7
57.9
57.1
59.6
55.6
51.1
60– 69
32.4
28.0
31.5
31.0
27.5
26.2
26.6
26.5
29.6
34.0
32.6
28.9
31.4
28.4
30.8
33.6
70– 79
2031
58.6
59.5
55.1
58.9
65.8
65.2
61
61.6
60.4
59.2
53.4
58.5
57.4
58.7
58.1
53.9
60– 69
28.4
29.6
31.5
27.7
25.5
26.7
30.2
29.7
28.6
27.2
27.4
28.5
29.4
29.2
27.8
28.0
70– 79
2041
55.2
55.1
52.6
57.7
66.8
62.9
59.1
58.5
55.0
56.0
56.9
55.1
54.0
59.5
56.5
56.1
60– 69
32.4
32.5
32.9
31.8
25.7
28.5
30.1
30.8
33.1
32.0
30.8
33.6
32.2
30.2
31.9
31.6
70– 79
2051
55.9
51.5
48.5
51.4
52.3
43.4
46.5
49.3
54.8
60.5
59.8
57.7
50.0
57.7
58.9
55.6
60– 69
30.5
34.9
35.4
32.8
33.8
44.0
40.0
36.7
31.1
27.6
28.5
29.1
34.1
30.7
28.8
31.1
70– 79
44 2 The Demographics of Ageing
2.3 Differentials
45
group. The trend indicates that the major proportion of the elderly is expected to be in the young-old group even in 2051.
2.3.2
Sex Differentials
Table 2.15 furnishes the data on the proportion of aged men and women in the states and union territories of India. In most of the states, the proportion of the male elderly is lower than that of the female elderly as of 2011. The tendency is expected to continue in 2051. As of 2011, in all the states except Arunachal Pradesh, Bihar and Nagaland, the difference in the proportions of the male and female elderly is the highest in the case of females. Of interest is the fact that by 2051, these variations could grow in favour of women in all the states. This phenomenon will also be reflected at the national level wherein this divergence in the proportion of the male and female elderly is expected to shrink to 0.5% by 2051.
2.3.3
Sex Ratio
Before analyzing the trends in the sex ratios, it is important to note that the phenomenon of age exaggeration could cloud the findings of this study, and hence, the discussion here may not reflect the true picture (for more details, see Bhat 1992). The fact that population ageing is not a gender-neutral demographic process is reflected in Table 2.16 (Mirkin and Weinberger 2001). In advanced age, the sex ratio turns in favour of females as female life expectancy is higher than that of males. This evidence marks a distinct shift because in the Indian scenario up to 1991, the sex ratio of the elderly (both for 60+ and 70+) had favoured males. In 2001, there was a shift in the sex ratio of the elderly (60+) in favour of females; however, for the 70+ age group, the sex ratio in 2001 is still slightly lower than 100. The projected figures also favour females. Hence, it can be said that the natural demographic process wherein women tend to be greater in number than men in the older age groups has started operating in India. This worrying aspect could further point towards an increase in widowhood. This phenomenon is yet to manifest in states such as Uttar Pradesh and Bihar.
2.3.4
Rural–Urban Distribution
Table 2.17 provides a picture of the proportion of the aged in the rural and urban areas of the country for the period 1961–2011. As of 2011, 8.1% of the urban population was aged, whereas this figure stood at 8.7% in the countryside. There
State Andhra Pradesh Arunachal Pradesh Assam Bihar Chhattisgarh Goa Gujarat Haryana Himachal Pradesh Jammu & Kashmir Jharkhand Karnataka Kerala Madhya Pradesh Maharashtra Manipur Meghalaya Mizoram Nagaland Odisha Punjab Rajasthan Sikkim Tamil Nadu Tripura
6.1 NA 4.6 5.1 NA 6.8 4.5 NA 8.1 5.6 NA 5.6 5.6 4.6 5.0 5.3 NA NA 7.0 5.2 7.3 5.0 4.7 5.6 5. 7
1961 Males 6.4 NA 3.9 6.1 NA 9.3 5.4 NA 6.5 4.5 NA 5.8 6.0 5.8 5.6 5.8 NA NA 6.5 6.2 5.7 5.3 5.1 5.6 5.2
Females 6.3 4.4 5.1 5.8 NA 5.6 4.9 6.5 8.1 6.2 NA 6.1 5.9 5.5 5.5 6.1 4.9 NA 7.1 5.8 8.2 5.5 3.4 5.8 6.9
1971 Males 6.4 4.9 4.3 6.1 NA 7.7 5.6 4.9 6.2 4.8 NA 6.1 6.5 6.2 5.9 6.1 4.3 NA 6.2 6.3 6.6 5.5 3.3 5.7 6.3
Females 6.3 4.8 NA 6.3 NA 5.8 5.4 6.9 8.3 6.4 NA 6.2 7.2 5.5 6.1 5.9 4.7 4.4 6.2 6.0 8.2 5.3 4.4 6.6 7.1
1981 Males 6.4 4.7 NA 6.2 NA 7.8 5.9 5.8 6.7 5.0 NA 6.3 7.9 6.6 6.6 5.9 4.1 4.9 5.7 6.5 7.1 5.5 4.4 6.3 6.9
Females 6.3 4.3 5.6 6.3 NA 5.4 5.7 7.2 8.1 6.3 NA 6.6 8.3 6.3 6.6 6.2 4.9 4.8 5.9 6.9 7.8 5.8 4.9 7.5 6.9
1991 Males 6.6 4.2 4.9 5.8 NA 7.3 6.6 7.7 7.4 5.3 NA 6.9 9.2 6.6 7.2 5.7 4.3 5.0 4. 8 7.1 7.3 6.3 4.2 7.1 7.1
Females 7.2 4.6 5.8 6.8 6.6 7.3 6.2 7.0 8.8 6.9 5.7 7.2 9.6 6.7 7.8 6.7 4.6 5.4 4.9 8.1 8.6 6.2 5.7 8.8 6.9
2001 Males 8.1 4.5 5.9 6.5 7.9 9.5 7.7 8.1 9.3 6.5 6.1 8.2 11.3 7.6 9.7 6.8 4.5 5.6 4.2 8.5 9.5 7.4 5.0 9.0 7.7
Females
(continued)
Table 2.15 Trends in the share of the aged (60 years and above) for males and females in India, its states and union territories, 1961–2051
46 2 The Demographics of Ageing
State Andhra Pradesh Arunachal Pradesh Assam Bihar Chhattisgarh Goa Gujarat Haryana Himachal Pradesh Jammu & Kashmir Jharkhand
Uttarakhand Uttar Pradesh West Bengal Union Territory Andaman & Nicobar Islands Chandigarh Dadra & Nagar Haveli Daman and Diu Delhi Lakshadweep Pondicherry All India
Table 2.15 (continued)
9.2 4.6 6.6 7.6 7.2 10.0 7.1 8.0 9.8 7.3 7.0
2.6 NA 3.9 NA 4.2 NA 6.9 5.5 2011 Males
1961 Males NA 6.3 4.6
10.4 4.5 6.7 7.2 8.5 12.4 8.8 9.3 10.7 7.5 7.3
Females
2.9 NA 4.1 NA 4.1 NA 6.8 5.8
Females NA 6.3 5.4
10.6 6.8 7.7 7.6 7.5 13.6 9.4 8.9 12.0 9.3 7.9
2.6 3.7 3.7 NA 4.3 5.3 6.6 5.9 2021 Males
1971 Males NA 6.9 5.0
12.3 6.0 7.9 7.6 9.1 16.8 11.1 10.7 13.7 9.8 8.3
Females
2.7 3.6 4.4 NA 4.3 4.9 6.1 5.9
Females NA 6.5 5.6
13.6 10.2 9.9 8.5 9.3 18.5 12.3 11.3 15.2 12.6 9.4
2.9 3. 9 3.7 NA 4.4 4.9 6.7 6.2 2031 Males
1981 Males NA 6.7 5.2
15.3 9.3 10.4 8.5 11.0 22.4 14.3 13.4 17.8 13.2 9.6
Females
2.8 4.2 4.3 NA 4.6 4.8 6.8 6.4
Females NA 6.3 5.6
18.1 10.7 12.4 8.6 15.8 26.3 16.6 15.2 15.6 14.7 10.0
3.8 4.4 3.9 4.9 4.6 5.3 6.6 6.6 2041 Males
1991 Males NA 6.9 5.9
20.0 10.6 13.3 9.6 17.3 27.3 17.3 15.6 17.2 14.3 10.9
Females
3.2 4.6 4.9 7.7 4.8 5.1 7.3 6.6
Females NA 6.3 6.1
22.7 12.4 14.6 10.8 20.7 29.6 20.1 20.3 19.5 18.6 12.4
6.3 6.4 4.9 5.9 4.8 6.9 7.3 7.1 2051 Males
2001 Males 7.6 7.1 6.7
(continued)
24.3 12.9 15.5 10.8 22.0 31.0 20.5 19.8 20.9 18.9 12.7
Females
4.2 5.9 5.8 8.2 5.7 7.0 8.3 7.9
Females 7.9 7.0 7.5
2.3 Differentials 47
Karnataka Kerala Madhya Pradesh Maharashtra Manipur Meghalaya Mizoram Nagaland Odisha Punjab Rajasthan Sikkim Tamil Nadu Tripura Uttarakhand Uttar Pradesh West Bengal Union Territory Andaman & Nicobar Islands Chandigarh Dadra & Nagar Haveli Daman and Diu Delhi Lakshadweep Pondicherry All India Source: Same as Table 2.4
Table 2.15 (continued) Females 10.1 13.3 8.4 10.8 7.7 4.9 6.3 5.0 9.6 10.8 8.1 7.8 10.7 8.2 9.3 7.8 8.7 6.3 6.8 5.0 7.0 7.3 8.3 10.5 9.0
2011 Males 8.9 11.7 7.4 9.0 6.9 4.5 6.2 5.3 9.4 9.9 6.8 7.0 10.1 7.6 8.6 7.7 8.2
7.0 6.0 3.3 7.8 6.4 8.1 8.7 8.2
11.5 10.8 6.8 7.4 9.4 13.1 13.0 9.3
2021 Males 10.4 15.3 7.6 11.0 9.2 5.7 8.6 7.1 10.7 11.9 7.7 9.3 12.8 10.3 9.7 7.3 11.0 9.6 10.2 7.4 9.8 10.0 12.9 13.3 10.4
Females 11.9 17.5 8.7 12.6 10.1 6.0 9.4 7.2 11.2 13.2 9.2 9.1 13.8 11.1 11.3 8.1 11.0 15.7 15.0 10.5 13.5 13.9 17.1 18.3 11.4
2031 Males 13.4 18.4 9.2 14.2 12.3 7.8 11.4 10.3 13.3 15.2 9.3 12.8 16.6 14.4 11.7 8.1 14.9 14.3 14.3 9.8 13.5 14.5 17.9 18.8 12.8
Females 15.0 22.7 10.5 15.8 14.2 8.3 13.1 11.2 13.9 17.3 11.3 13.1 18.3 16.1 13.9 9.2 15.0 20.5 20.6 16.0 27.4 18.4 22.5 23.5 13.5
2041 Males 18.2 25.9 11.0 17.4 15.9 8.4 13.0 12.4 15.2 16.4 13.3 14.8 22.7 16.0 10.1 8.5 16.2 19.5 18.6 12.6 19.2 17.2 24.6 25.8 14.5
Females 19.8 30.4 11.6 18.0 17.4 9.4 13.1 12.7 16.4 17.2 14.2 13.9 25.4 17.1 11.5 9.0 17.2 23.7 23.3 15.3 29.1 21.7 31.2 27.9 16.3
2051 Males 23.2 32.1 13.4 21.6 19.9 10.8 15.3 17.1 18.1 20.9 18.0 18.5 27.7 20.8 12.9 10.5 19.6 23.3 20.8 13.1 21.8 20.2 33.3 30.5 16.8
Females 24.5 36.4 13.4 21.6 21.6 11.9 16.1 17.4 19.7 20.9 18.2 18.8 30.3 22.1 13.8 10.3 20.4
48 2 The Demographics of Ageing
2.3 Differentials
49
Table 2.16 Sex ratio (number of females per 100 males) of the elderly of different age groups in India, its states and union territories, 1961–2051 1961
1971
1981
1991
2001
2011
2021
2031
2041
2051
100
98
93
100
108
115
101
101
106
101
65–69
95
99
101
101
121
110
123
106
119
101
60+
102
99
99
102
110
92
116
113
111
108
State Andhra Pradesh
Arunachal Pradesh
Assam
Bihar
Chhattisgarh
Goa
Gujarat
Haryana
Himachal Pradesh
Jammu & Kashmir
60–64
70+
109
101
104
106
105
110
124
127
110
118
60–64
NA
93
81
78
87
89
77
89
99
103
65–69
NA
107
89
84
92
96
79
87
105
100
60+
NA
97
85
83
89
78
84
87
97
102
70+
NA
96
88
90
89
93
97
87
90
104
60–64
77
76
NA
84
100
97
92
98
106
100
65–69
72
69
NA
84
100
98
93
98
114
99
60+
76
75
NA
81
95
97
99
102
106
105
70+
78
76
NA
76
88
97
111
110
101
113
60–64
112
100
91
91
88
93
85
90
104
91
65–69
116
100
95
86
98
89
112
97
112
85
60+
118
101
93
85
88
88
93
94
109
98
70+
127
103
93
78
83
81
90
95
110
114
60–64
NA
NA
NA
NA
116
113
102
107
108
102
65–69
NA
NA
NA
NA
122
118
113
105
109
100
60+
NA
NA
NA
NA
118
116
120
117
110
107
70+
NA
NA
NA
NA
118
117
145
140
112
115
60–64
152
131
127
122
112
110
104
105
94
104
65–69
136
132
126
133
125
116
115
112
94
103
60+
147
136
131
131
126
120
122
112
94
106
70+
148
145
138
141
142
134
139
141
94
108
60–64
109
100
101
102
107
103
97
102
96
94
65–69
106
97
100
106
113
113
105
104
101
96
60+
112
105
101
107
115
113
110
110
101
100
70+
119
117
103
113
124
124
126
121
105
105
60–64
NA
NA
NA
102
113
104
95
101
87
93
65–69
NA
NA
NA
103
105
98
109
102
97
84
60+
NA
NA
NA
93
99
102
108
109
96
93
70+
NA
NA
NA
81
86
101
116
121
103
99
60–64
72
78
83
92
100
86
104
108
103
102
65–69
66
76
75
88
110
89
106
112
109
101
60+
74
73
78
89
102
106
112
117
109
107
70+
79
67
76
87
100
113
120
125
114
113
60–64
69
68
69
77
77
86
85
87
92
102
65–69
65
64
71
79
102
99
100
94
93
101
(continued)
50
2 The Demographics of Ageing
Table 2.16 (continued)
60+ Jharkhand
Karnataka
Kerala
Madhya Pradesh
Maharashtra
Manipur
Meghalaya
Mizoram
Nagaland
1961
1971
1981
1991
2001
2011
2021
2031
2041
2051
70
68
70
77
85
91
95
96
94
107 113
70+
72
69
70
75
82
92
101
105
96
60–64
NA
NA
NA
NA
101
102
92
94
103
97
65–69
NA
NA
NA
NA
109
100
104
94
108
92
60+
NA
NA
NA
NA
101
99
100
98
107
102
70+
NA
NA
NA
NA
95
96
104
103
108
112
60–64
98
94
91
97
106
107
101
102
98
102
65–69
93
92
93
102
116
110
110
106
116
98
60+
99
96
97
101
111
111
112
110
108
106
70+
104
101
105
105
114
115
121
120
111
114
60–64
107
106
106
110
115
106
114
127
113
102
65–69
106
111
112
114
126
118
112
128
124
110
60+
109
110
115
115
125
123
124
134
123
118
70+
113
114
123
121
132
140
140
142
128
130
60–64
108
100
109
96
102
101
92
101
97
94
65–69
116
103
126
99
111
110
109
105
105
87
60+
119
107
114
98
105
106
108
108
102
98
70+
137
116
112
100
103
109
121
119
105
107
60–64
99
98
96
98
127
112
95
99
90
97
65–69
101
95
102
101
114
114
102
101
103
89
60+
104
100
101
101
115
111
108
105
100
98
70+
112
106
106
105
106
109
121
112
105
103
60–64
105
98
92
87
98
97
107
111
107
102
65–69
106
91
92
83
100
101
107
115
112
110
60+
111
99
98
88
99
100
110
117
109
110
70+
121
104
97
92
99
104
116
125
109
115
60–64
NA
77
79
81
92
99
98
104
113
104
65–69
NA
82
86
82
96
105
100
102
120
105
60+
NA
82
83
83
96
108
103
105
111
110
70+
NA
88
88
86
99
118
112
107
104
119
60–64
NA
NA
92
90
95
98
101
102
100
103
65–69
NA
NA
98
93
95
99
100
108
98
106
60+
NA
NA
103
96
98
100
109
115
99
105
70+
NA
NA
117
105
102
102
123
130
99
105
60–64
84
78
80
73
76
86
89
101
96
98
65–69
84
77
81
74
80
89
93
99
104
98
60+
87
77
79
71
78
88
98
107
99
100
70+
89
75
78
69
79
88
110
119
100
104
(continued)
2.3 Differentials
51
Table 2.16 (continued) Odisha
Punjab
Rajasthan
Sikkim
Tamil Nadu
Tripura
Uttarakhand
Uttar Pradesh
West Bengal
60–64
1961
1971
1981
1991
2001
2011
2021
2031
2041
2051
113
105
99
98
103
100
97
100
105
103
65–69
111
104
109
100
111
101
103
99
113
109
60+
120
108
106
99
102
100
103
103
108
109
70+
137
115
110
98
96
99
106
108
108
114
60–64
69
70
81
90
107
107
93
105
91
92
65–69
62
74
75
82
105
93
104
104
99
91
60+
68
70
77
83
97
99
102
106
99
96
70+
69
67
74
78
86
95
106
107
106
103
60–64
93
91
88
96
101
100
93
103
98
94
65–69
89
84
94
96
115
114
112
109
105
91
60+
96
91
94
98
108
110
113
115
103
99
70+
102
97
102
103
111
117
131
131
107
108
60–64
92
93
84
72
80
74
85
89
92
103
65–69
100
92
76
75
79
72
85
95
97
103
60+
98
84
83
75
77
81
90
97
92
100
70+
108
65
86
78
73
77
98
105
88
97
60–64
99
95
93
94
101
102
102
107
108
102
65–69
95
95
94
93
107
108
107
109
119
107
60+
99
96
94
92
101
105
109
112
114
112
70+
102
100
95
90
98
106
115
118
114
120
60–64
80
86
91
93
101
96
94
102
109
102
65–69
77
82
91
98
106
101
97
106
112
103
60+
85
54
92
97
106
104
106
111
106
107
70+
93
87
93
100
110
113
123
122
100
113
60–64
NA
NA
NA
NA
102
102
103
108
105
99
65–69
NA
NA
NA
NA
107
102
119
110
115
99
60+
NA
NA
NA
NA
100
104
113
116
111
106
70+
NA
NA
NA
NA
95
107
116
125
114
116
60–64
88
81
86
85
90
92
90
98
96
92
65–69
88
82
84
80
98
96
118
105
104
86
60+
91
82
80
81
89
96
103
107
103
96
70+
96
83
83
77
82
90
106
116
108
107
60–64
99
94
89
94
103
95
87
96
104
101
65–69
97
95
96
98
109
100
90
95
110
95
60+
103
99
97
96
105
101
96
98
104
104
70+
113
109
106
96
103
107
109
101
101
110
(continued)
52
2 The Demographics of Ageing
Table 2.16 (continued) 1961
1971
1981
1991
2001
2011
2021
2031
2041
2051
Union Territory Andaman & Nicobar Islands
Chandigarh
Dadra & Nagar Haveli
Daman and Diu
Delhi
Lakshadweep
Pondicherry
All India
60–64
67
63
64
58
53
79
79
84
88
101
65–69
59
61
74
71
52
82
77
94
96
93
60+
70
68
73
67
57
79
75
85
91
96
70+
83
78
82
78
70
78
70
80
90
96
60–64
NA
73
77
79
67
91
80
81
75
90
65–69
NA
71
90
81
76
92
81
86
82
76
60+
NA
73
83
83
76
93
80
83
82
84
70+
NA
74
85
87
90
95
78
84
88
85
60–64
110
111
113
111
98
109
86
77
66
99
65–69
91
105
104
122
112
112
90
82
68
85
60+
99
118
114
122
113
118
95
85
74
83
70+
90
152
126
140
135
140
111
97
88
76
60–64
NA
NA
NA
134
113
118
81
66
44
98
65–69
NA
NA
NA
147
130
133
104
79
59
66
60+
NA
NA
NA
150
133
133
103
81
59
67
70+
NA
NA
NA
168
160
151
127
103
81
59
60–64
76
78
78
86
97
98
86
92
79
93
65–69
72
83
86
85
101
95
94
92
89
82
60+
77
80
84
85
96
99
95
94
87
89
70+
81
81
90
86
93
102
104
98
91
90
60–64
111
101
96
91
92
94
92
99
109
97
65–69
133
97
95
91
101
88
102
109
107
103
60+
108
91
94
92
99
97
96
103
109
107 116
70+
90
82
91
93
105
108
96
102
110
60–64
100
92
103
109
102
114
91
102
110
103
65–69
97
92
102
113
108
130
99
105
119
107
60+
101
93
100
108
112
125
102
104
112
112
70+
105
95
94
105
123
134
115
104
109
119
60–64
77
92
94
94
102
101
95
101
99
97
65–69
96
92
96
94
109
104
108
104
109
94
60+
100
94
96
94
103
103
106
108
105
102
70+
106
97
98
93
99
105
115
116
108
111
Source: Same as Table 2.4
State Andhra Pradesh Arunachal Pradesh Assam Bihar Chhattisgarh Goa Gujarat Haryana Himachal Pradesh Jammu & Kashmir Jharkhand Karnataka Kerala Madhya Pradesh Maharashtra Manipur Meghalaya Mizoram Nagaland Odisha Punjab Rajasthan
6.5 NA 4.4 5.7 NA 8.3 5.1 NA 7.5 5.4 NA 6.0 5.9 5.2 5.7 5.5 NA NA 7.1 5.7 6.9 5.2
1961 Rural
5.0 NA 3.4 4.6 NA 6.8 4.6 NA 5.1 3.7 NA 4.9 5.6 4.7 4.3 6.0 NA NA 2.0 4.7 5.2 5.1
Urban 6.7 4.8 4.8 6.0 NA 7.1 5.5 5.9 7.4 5.9 NA 6.4 6.3 5.9 6.3 6.1 4.8 NA 7.3 6.2 8.0 5.6
1971 Rural 4.9 1.2 4.1 4.7 NA 5.2 4.8 5.4 4.3 4.0 NA 5.1 6.0 5.0 4.5 6.4 3.7 NA 1.3 4.6 5.7 5.2
Urban 7.1 5.0 NA 7.1 NA 7.2 6.3 6.6 7.7 6.1 NA 7.0 7.6 6.8 7.1 5.8 4.5 4.9 6.7 6.6 8.5 6.3
1981 Rural 5.1 1.3 NA 5.0 NA 5.8 5.2 5.6 5.0 4.5 NA 5.7 7.1 5.1 5.1 6.0 4.0 3.9 1.7 4.4 6.1 5.0
Urban 7.4 4.8 5.4 6.5 NA 7.7 6.9 8.2 8.4 NA NA 7.5 9.0 NA 7.9 5.9 4.6 5.2 6.0 7.6 8.5 6.6
1991 Rural 5.3 1.5 5.0 5.0 NA 6.2 5.5 6.4 5.5 NA NA 5.8 8.6 NA 5.6 6.6 4.0 4.5 2.1 5.2 6.3 5.3
Urban 8.1 5.3 5.9 6.7 7.6 9.1 7.3 7.9 9.3 6.8 6.1 8.3 10.5 7.4 10.2 6.4 4.6 5.7 4.9 8.6 9.8 7.0
2001 Rural 6.2 1.7 5.8 6.2 5.6 7.6 6.2 6.4 6.3 6.4 5.1 6.5 10.4 6.4 6.7 7.5 4.4 5.3 2.6 6.4 7.4 6.0
Urban 10.8 5.3 6.5 7.4 8.2 11.9 8.3 9.2 10.5 7.2 7.3 10.4 12.6 8.0 11.3 6.5 4.6 6.2 5.8 9.8 11.3 7.6
2011 Rural
Table 2.17 Trends in the share of the aged (in percent) among urban and rural residents in India, its states and union territories, 1961–2011
7.7 2.3 7.5 7.1 6.8 10.8 7.4 7.7 7.8 7.9 6.6 8.0 12.5 7.6 8.1 8.2 4.9 6.3 3.8 7.8 8.7 7.0 (continued)
Urban
2.3 Differentials 53
1961 Rural
Sikkim 5.0 Tamil Nadu 5.9 Tripura 5.5 Uttarakhand NA Uttar Pradesh 6.4 West Bengal 5.2 Union Territory Andaman & Nicobar Islands 3.0 Chandigarh NA Dadra & Nagar Haveli NA Daman and Diu 4.0 Delhi 5.1 Lakshadweep NA Pondicherry 6.7 All India 5.8 Source: Census of India, 1961–2011
Table 2.17 (continued)
3.4 6.0 6.6 NA 7.0 5.4 3.0 5.6 4.1 NA 4.9 5.1 6.3 6.2
2.0 NA NA NA 4.0 NA 7.3 4.7
1971 Rural
2.5 4.8 4.9 NA 5.2 4.4
Urban
1.6 3.5 NA NA 4.2 NA 6.4 5.0
4.0 5.2 6.1 NA 5.5 5.0
Urban
3.2 4.9 4.0 NA 5.2 4.4 6.6 7.2
4.7 6.7 7.1 NA 7.2 5.5
1981 Rural
1.9 4.0 3.7 NA 4.4 5.4 6.8 5.4
2.9 5.8 6.6 NA 5.4 5.7
Urban
3.7 3.2 4.4 5.3 4.0 4.6 6.9 7.2
4.8 7.8 7.0 NA 7.3 5,89
1991 Rural
2.6 4.6 3.6 7.3 4.8 5.5 7.4 5.8
3.1 6.9 7.0 NA 5.4 6.6
Urban
5.5 3.2 4.3 3.7 4.5 5.7 8.3 7.7
5.6 9.2 7.2 8.3 7.3 6.6
2001 Rural
3.6 5.2 3.0 7.5 5.2 6.8 8.4 6.7
3.9 8.3 7.7 6.0 5.9 8.4
Urban
7.6 3.8 4.7 5.9 6.5 7.8 9.2 8.7
7.3 10.8 7.6 9.6 8.0 7.9
2011 Rural
5.2 6.4 3.3 4.3 6.8 8.3 9.8 8.1
4.9 10.0 8.7 7.4 6.7 9.8
Urban
54 2 The Demographics of Ageing
2.3 Differentials
55
has been a boost in the proportion of the elderly in both urban and rural areas over the last few decades with the gap between the urban and rural proportions starting to converge. This trend indicates that an increasing proportion of the aged is now living in urban India. Similar changes in the rural–urban distribution of the aged are also seen in the states and union territories, with sharp surges in the proportion of the elderly in the urban areas of many states. The breakup of elderly persons in terms of rural and urban residence is presented in Table 2.18 and a further breakup by sex is given in Table 2.19. The figures also provide additional evidence of a rising share of the elderly living in urban areas over the last few decades, although a major chunk of senior people still reside in rural regions. A similar pattern was observed for most of the states and union territories in India, although sharp differences remain in the rural–urban distribution of the elderly at the state level. For example, in Goa, Tamil Nadu and Mizoram, more than 40% of the aged live in urban areas. On the other hand, in states such as Arunachal Pradesh, Himachal Pradesh and Bihar, there is a preponderance of the aged in the rural areas.
2.4
Measures of the Ageing Process
The ageing process can be measured in many ways but the authors have restricted this discussion to the indices mentioned below. 1. 2. 3. 4.
Broad age structure Median age Index of age ing Dependency ratio.
2.4.1
Broad Age Structure
The broad age structure in any population reflects the changing composition of children (0–14), adults of working ages (15–59) and elderly persons (60+). Table 2.20 reveals that the child proportion declined by 10.1 units during the period 1961–2011 and is expected to go down further by another 10.1 units in the next 50 years. The 10.1 units decline seen among children was shared between adults (6.9 points) and the elderly (3.2 points) to increase their respective shares. With the projected fall in the share of children over the next 50 years, the share of adults and elderly is bound to augment further. The 10.1 units reduction to be seen in the next 50 years among children is to be shared between adults (1.2 points) and the elderly (8.9 points), thereby increasing the respective shares of the two age groups. Goa, Kerala and Tamil Nadu have the lowest proportion of children in their age structure relative to the other states. This trend is expected to continue, with more states
State Andhra Pradesh Arunachal Pradesh Assam Bihar Chhattisgarh Goa Gujarat Haryana Himachal Pradesh Jammu & Kashmir Jharkhand Karnataka Kerala Madhya Pradesh Maharashtra Manipur Meghalaya Mizoram Nagaland Odisha Punjab Rajasthan
86.1 NA 93.8 93.1 NA 86.5 76.2 NA 96.7 87.9 NA 80.8 85.6 87.1 77.2 90.7 NA NA 98.5 94.7 84.0 84.6
1961 Rural
13.9 NA 6.2 6.9 NA 13.5 23.8 NA 3.3 12.1 NA 19.2 14.4 15.9 22.8 9.3 NA NA 1.5 5.3 16.0 15.4
Urban 85.1 99.1 92.3 92.1 NA 79.2 74.5 83.7 95.8 86.6 NA 79.8 84.4 85.9 75.3 86.3 88.2 NA 98.0 93.6 81.8 83.4
1971 Rural 14.9 0.9 7.7 7.9 NA 20.8 25.5 16.3 4.2 13.4 NA 20.2 15.6 14.1 24.7 13.7 11.8 NA 2.0 6.4 18.2 16.6
Urban 82.0 98.2 NA 90.9 NA 72.2 72.8 80.7 94.9 83.5 NA 75.1 82.2 84.1 72.1 72.9 83.7 79.2 95.6 91.9 78.2 81.9
1981 Rural 18.0 1.8 NA 9.1 NA 27.8 27.2 19.3 5.1 16.5 NA 24.9 17.8 15.9 27.9 27.1 16.3 20.8 4.4 8.1 21.8 18.1
Urban 79.1 95.6 89.6 89.7 NA 63.9 70.2 79.7 94.2 NA NA 74.2 74.4 81.3 69.3 70.5 83.7 57.1 93.4 90.5 76.4 80.8
1991 Rural 20.9 4.4 10.4 10.3 NA 36.1 29.8 20.3 5.8 NA NA 25.8 25.6 18.7 30.7 29.5 16.3 42.9 6.6 9.5 23.6 19.2
Urban 77.8 92.1 87.2 90.3 84.5 54.8 66.3 75.2 93.2 76.3 80.8 71.1 74.3 76.3 67.5 70.2 81.1 52.4 90.0 88.3 72.1 79.4
2001 Rural 22.2 7.9 12.8 9.7 15.5 45.2 33.7 24.8 6.8 23.7 19.2 28.9 25.7 23.7 32.5 29.8 18.9 47.6 10.0 11.7 27.9 20.6
Urban 73.8 88.6 84.1 89.1 79.8 40.2 60.3 69.0 92.4 70.7 77.8 67.3 52.4 73.4 62.7 65.8 78.8 47.4 79.1 86.3 68.3 76.8
2011 Rural
26.2 11.4 15.9 10.9 20.2 59.8 39.7 31.0 7.6 29.3 22.2 32.7 47.6 26.6 37.3 34.2 21.2 52.6 20.9 13.7 31.7 23.2 (continued)
Urban
Table 2.18 Trends in the composition of the aged (60 years and above) in urban and rural areas in India, its states and union territories, 1961–2011
56 2 The Demographics of Ageing
Sikkim Tamil Nadu Tripura Uttarakhand Uttar Pradesh West Bengal Union Territory Andaman & Nicobar Islands Chandigarh Dadra & Nagar Haveli Daman and Diu Delhi Lakshadweep Pondicherry All India Source: Same as Table 2.17
Table 2.18 (continued)
2.2 22.7 8.2 NA 10.7 18.8
16.2 NA 0.0 NA 86.2 0.0 25.7 15.1
83.8 NA 100 NA 13.8 100 74.3 84.9
Urban
97.8 77.3 91.8 NA 89.3 81.2
1961 Rural
86.6 14.4 100 NA 11.8 100 57.7 83.4
91.6 72.9 90.3 NA 88.7 76.7
1971 Rural
13.4 85.6 0.0 NA 88.2 0.0 42.3 16.6
8.4 27.1 9.7 NA 11.3 23.3
Urban
82.6 7.8 93.8 NA 8.4 48.8 46.7 81.3
89.3 70.2 89.7 NA 85.8 73.0
1981 Rural
17.4 92.2 6.2 NA 91.6 51.2 53.3 18.7
10.7 29.8 10.3 NA 14.2 27.0
Urban
80.1 7.4 92.9 45.0 8.5 39.7 34.3 78.1
94.0 68.7 84.8 NA 84.5 70.3
1991 Rural
19.9 92.6 7.1 55.0 91.5 60.3 65.7 21.9
6.0 31.3 15.2 NA 15.5 29.7
Urban
75.8 6.6 82.7 46.9 6.0 51.0 33.2 75.0
91.9 58.5 81.9 79.9 82.6 66.8
2001 Rural
24.2 93.4 17.3 53.1 94.0 49.0 66.8 25.0
8.1 41.5 18.1 20.1 17.4 33.2
Urban
70.6 1.6 62.2 31.5 2.4 20.9 30.3 70.6
81.5 53.7 71.1 75.0 80.6 63.2
2011 Rural
29.4 98.4 37.8 68.5 97.6 79.1 69.7 29.4
18.5 46.3 28.9 25.0 19.4 36.8
Urban
2.4 Measures of the Ageing Process 57
Jharkhand
Jammu & Kashmir
Himachal Pradesh
Haryana
Gujarat
Goa
Chhattisgarh
Bihar
Assam
Arunachal Pradesh
Andhra Pradesh
State
NA
NA
Rural
Urban
5.9
4.0
Rural
Urban
8.3
5.4
Rural
Urban
NA
NA
Rural
Urban
4.7
4.0
Rural
Urban
7.0
5.7
Rural
Urban
NA
NA
Rural
Urban
5.3
4.1
Rural
Urban
4.7
3.2
Rural
NA
Urban
Urban
NA
4.6
Rural
6.4
Urban
NA
NA
3.3
4.7
4.8
6.6
NA
NA
5.2
5.4
7.8
9.6
NA
NA
5.8
6.2
3.8
4.0
NA
NA
5.4
6.6
NA
NA
4.3
6.7
4.5
8.4
5.7
6.7
4.3
5.2
4.5
6.0
NA
NA
4.4
5.9
4.0
5.2
1.0
4.6
4.5
6.7
1971 Males
Females
1961
Males
Rural
Rural/Urban
NA
NA
3.6
5.0
3.9
6.4
5.0
5.0
5.3
5.7
6.1
8.2
NA
NA
5.0
6.2
4.2
4.3
1.7
5.0
5.3
6.7
Females
NA
NA
4.9
6.8
5.2
8.6
5.6
7.2
4.6
5.9
5.0
6.3
NA
NA
4.7
7.1
NA
NA
1.2
5.1
4.7
7.0
Males
1981
NA
NA
4.1
5.3
4.9
6.8
5.5
5.8
5.8
6.7
6.8
8.2
NA
NA
5.3
7.0
NA
NA
1.5
4.9
5.6
7.2
Females
NA
NA
NA
NA
5.4
8.9
5.9
7.9
5.1
6.5
5.3
6.5
NA
NA
5.1
6.9
5.0
5.8
1.6
4.9
4.9
7.3
Males
1991
NA
NA
NA
NA
5.6
8.0
6.9
8.4
6.0
7.3
7.2
8.8
NA
NA
4.9
6.2
5.0
5.0
1.5
4.6
5.7
7.4
Females
4.9
5.9
6.2
7.1
5.9
9.1
5.9
7.5
5.5
6.6
6.7
7.8
5.2
7.0
6.1
6.8
5.7
5.8
1.7
5.3
5.7
7.7
Males
2001
5.2
6.3
6.6
6.4
6.8
9.5
7.1
8.5
7.0
8.1
8.6
10.4
6.0
8.3
6.3
6.5
5.9
5.9
1.7
5.2
6.6
8.6
Females
6.7
7.1
7.51
7.2
7.39
10.1
7.3
8.5
6.7
7.5
9.8
10.6
6.3
7.5
7.2
7.6
7.5
6.5
2.4
5.3
7.3
10.2
6.5
7.6
8.3
7.1
8.3
11.0
8.2
9.9
8.2
9.2
11.8
13.3
7.3
8.8
7.0
7.3
7.5
6.6
2.2
5.2
8.1
11.5
Females
(continued)
Males
2011
Table 2.19 Trends in the share of elderly by sex and place of residence (rural/urban) in India, its states and union territories (in percentage), 1961–2011
58 2 The Demographics of Ageing
Rajasthan
Punjab
Odisha
Nagaland
Mizoram
Meghalaya
Manipur
Maharashtra
Madhya Pradesh
Kerala
Karnataka
Table 2.19 (continued)
5.1
4.7
Rural
Urban
7.8
5.5
Rural
4.0
Urban
Urban
5.2
1.8
Rural
Urban
NA
7.4
Urban
Rural
NA
Rural
NA
NA
Rural
Urban
5.3
5.2
Rural
Urban
5.5
3.9
Rural
Urban
4.7
4.3
Rural
Urban
5.8
5.1
Rural
Urban
6.0
4.6
Rural
5.6
5.2
4.9
5.9
5.6
6.2
2.4
6.7
NA
NA
NA
NA
6.8
5.7
4.7
5.8
5.2
5.8
6.0
6.0
5.3
6.0
4.9
5.7
6.1
8.9
4.2
5.9
1.2
7.9
NA
NA
3.6
5.2
5.6
6.1
4.2
6.2
4.6
5.6
5.4
6.1
4.8
6.5
1971 Males
Females
1961
Males
Urban
Rural/Urban
5.6
5.5
5.3
7.0
5.1
6.4
1.7
6.6
NA
NA
3.9
4.4
7.1
6.0
4.9
6.4
5.5
6.3
6.6
6.5
5.3
6.4
Females
4.8
6.1
6.3
9.1
3.6
6.4
1.7
7.1
3.4
4.7
3.9
4.9
5.6
5.9
4.7
6.9
4.7
6.5
6.4
7.3
5.3
6.9
Males
1981
5.7
6.5
6.0
7.8
5.2
6.8
1.7
6.3
4.4
5.0
4.1
4.1
6.4
5.7
5.5
7.3
5.5
7.2
7.9
7.8
6.1
7.1
Females
1991
5.0
6.5
6.4
8.8
5.0
7.6
2.3
6.7
4.4
5.2
3.9
5.1
6.7
6.3
5.2
7.0
5.3
7.7
7.8
8.6
5.6
7.4
Males
5.7
6.8
6.2
8.2
5.3
7.5
1.7
5.3
4.7
5.2
4.1
4.1
6.4
5.6
5.6
7.2
5.9
8.2
9.4
9.3
6.2
7.7
Females
2001
5.4
6.5
6.9
9.5
6.2
8.4
2.9
5.3
5.1
5.7
4.1
4.7
7.3
6.5
6.0
9.2
5.9
7.0
9.3
9.7
6.1
7.7
Males
6.6
7.5
8.0
10.2
6.7
8.8
2.3
4.6
5.5
5.8
4.7
4.5
7.8
6.4
7.5
11.3
6.9
7.8
11.4
11.3
7
8.9
Females
6.5
7.0
8.3
10.8
7.7
9.7
3.9
5.9
6.1
6.2
4.4
4.5
8.0
6.5
7.5
10.3
7.1
7.5
11.7
11.8
7.6
9.7
7.5
8.3
9.2
11.8
7.8
9.9
3.6
5.6
6.5
6.1
5.5
4.7
8.4
6.5
8.8
12.4
8.1
8.5
13.3
13.3
8.4
11.1
Females
(continued)
Males
2011
2.4 Measures of the Ageing Process 59
Delhi
Daman and Diu
Dadra & Nagar Haveli
Chandigarh
Andaman & Nicobar Islands
Union Territory
West Bengal
Uttar Pradesh
Uttarakhand
Tripura
Tamil Nadu
Sikkim
Table 2.19 (continued)
5.8
4.0
Rural
Urban
NA
NA
Rural
NA
Urban
Urban
NA
NA
Urban
Rural
NA
Rural
2.8
2.1
Rural
Urban
4.9
3.8
Rural
Urban
6.5
5.3
Rural
Urban
NA
NA
Rural
Urban
5.8
4.7
Rural
Urban
6.0
4.6
Rural
Urban
4.8
2.2
Rural
4.1
4.3
NA
NA
NA
NA
NA
NA
2.0
3.3
5.3
5.5
5.1
6.4
NA
NA
5.2
5.2
5.0
5.8
2.9
5.2
4.2
5.3
NA
NA
NA
3.7
3.4
6.3
1.6
2.9
4.6
5.2
5.6
7.2
NA
NA
6.1
7.0
4.9
6.2
3.0
3.4
1971 Males
Females
1961
Males
Urban
Rural/Urban
4.3
4.4
NA
NA
NA
4.4
3.5
4.5
1.4
3.1
5.5
5.6
5.3
6.7
NA
NA
6.2
6.3
5.3
5.9
3.0
3.3
Females
4.3
5.4
NA
NA
3.7
3.7
3.8
5.2
2.0
3.3
5.4
5.3
5.5
7.4
NA
NA
6.2
7.3
5.6
7.0
2.8
4.8
Males
1981
4.6
4.9
NA
NA
3.8
4.4
4.2
4.6
1.8
3.1
6.0
5.7
5.3
6.9
NA
NA
7.1
6.9
6.0
6.5
3.1
4.6
Females
1991
4.7
4.0
5.8
4.2
3.2
3.9
4.5
3.1
2.7
4.1
6.5
5.8
5.6
7.7
NA
NA
6.3
7.0
6.8
8.2
3.1
5.2
Males
4.9
4.0
8.9
6.4
4.1
4.8
4.7
3.3
2.3
3.3
6.7
6
5.2
6.8
NA
NA
7.6
7.0
7.0
7.4
3.0
4.3
Females
2001
4.9
4.2
5.9
2.6
2.5
3.4
4.9
3.0
3.7
5.8
8.2
6.1
5.7
7.4
5.8
8.2
7.1
6.8
8.1
9.2
3.9
5.9
Males
5.7
4.9
9.1
5.8
3.7
5.3
5.6
3.6
3.6
5.1
8.7
7.1
6.1
7.2
6.3
8.4
8.4
7.6
8.6
9.2
3.9
5.1
Females
6.4
5.9
2.9
4.5
2.7
3.8
6.1
3.6
5.5
7.9
9.8
7.5
6.6
8.0
7.2
9.3
8.3
7.3
9.7
10.6
5.0
7.6
7.3
7.1
6.7
7.6
4.1
5.8
6.9
4.1
4.9
7.2
9.8
8.3
6.8
8.0
7.6
10.0
9.1
7.9
10.3
11.1
4.9
6.9
Females
(continued)
Males
2011
60 2 The Demographics of Ageing
Source: same as Table 2.17
All India
Pondicherry
Lakshadweep
Table 2.19 (continued)
5.7
4.4
Rural
Urban
6.9
7.0
Rural
Urban
NA
NA
Rural
5.1
6.0
7.7
6.6
NA
NA
4.7
6.3
6.3
6.7
NA
5.3
1971 Males
Females
1961
Males
Urban
Rural/Urban
5.3
6.2
6.5
5.9
NA
4.9
Females
5.1
7.6
6.5
6.8
5.4
4.6
Males
1981
5.7
6.9
7.1
6.3
5.4
4.3
Females
1991
5.6
7.2
6.9
7.0
5.7
4.6
Males
6.0
7.0
8.0
6.9
5.3
4.7
Females
2001
6.3
7.4
7.4
7.8
6.8
5.5
Males
7.2
8.1
9.3
8.8
6.8
5.8
Females
7.71
8.4
8.9
8.3
8.1
8.1
Males
2011
8.5
9.2
10.8
10.1
8.5
7.5
Females
2.4 Measures of the Ageing Process 61
62
2 The Demographics of Ageing
Table 2.20 Composition of population by broad age groups of India, its states and union territories (in percentages), 1961–2051 Age group
1961
1971
1981
1991
2001
2011
2021
2031
2041
2051
State Andhra Pradesh Arunachal Pradesh Assam
Bihar
Chhattisgarh
Goa
Gujarat
Haryana
Himachal Pradesh
0–14
39.5
40.7
38.7
35.7
32.1
26.0
21.8
19.9
17.9
16.6
15–59
54.3
52.9
54.9
57.8
60.3
64.1
66.8
65.7
63.1
59.9
60+
6.2
6.4
6.4
6.5
7.6
9.9
11.4
14.4
19.0
23.5
0–14
NA
38.3
39.4
39.8
40.4
35.7
24.9
22.9
28.8
28.0
15–59
NA
57.0
55.8
56
55.0
59.7
68.7
67.3
60.5
59.4
60+
NA
4.7
4.8
4.2
4.6
4.6
6.4
9.8
10.7
12.6
0–14
44.8
46.9
NA
38.9
37.4
32.9
26.9
25.2
26.0
25.2
15–59
50.9
48.4
NA
55.8
56.7
60.5
65.3
64.6
61.2
59.8
60+
4.3
4.7
NA
5.3
5.9
6.7
7.8
10.2
12.8
15.1
0–14
42.3
42.7
42.2
41.2
42.1
40.2
32.5
31.5
30.8
28.5
15–59
52.1
51.4
51.6
52.8
51.3
52.3
59.9
60.0
60.1
60.7
60+
5.6
5.9
6.2
6.0
6.6
7.4
7.6
8.5
9.1
10.8
0–14
NA
NA
NA
NA
37.0
32.1
28.8
28.2
18.4
17.9
15–59
NA
NA
NA
NA
55.8
60.1
62.9
61.6
65.1
60.8
60+
NA
NA
NA
NA
7.2
7.9
8.3
10.2
16.6
21.3
0–14
37.3
38.1
35.2
34.3
24.7
21.8
17.4
14.8
14.6
13.8
15–59
54.7
55.3
58.0
59.3
66.9
66.9
67.4
64.8
58.6
55.9
60+
8.0
6.6
6.8
6.4
8.4
11.2
15.2
20.4
26.8
30.3
0–14
42.9
43.4
39.5
36.9
32.8
29.0
25.2
23.4
20.6
19.6
15–59
52.2
51.3
54.9
57.0
60.3
63.1
64.6
63.4
62.4
60.1
60+
4.9
5.3
5.6
6.1
6.9
8.0
10.2
13.2
16.9
20.3
0–14
NA
46.7
41.8
40.1
36.0
29.7
25.4
22.8
20.5
19.0
15–59
NA
47.5
51.8
52.4
56.5
61.6
64.8
64.9
64.1
61.0
60+
NA
5.8
6.4
7.5
7.5
8.7
9.8
12.3
15.4
20.0
0–14
40.9
41.2
39.6
37.1
31.1
29.7
21.3
19.0
21.1
19.1
15–59
51.5
51.6
52.9
55.1
59.9
61.6
65.8
64.5
62.5
60.7
60+
7.6
7.2
7.5
7.8
9.0
8.7
12.9
16.5
16.4
20.2
Jammu & Kashmir
0–14
40.6
42.8
41.0
36.1
35.8
33.9
23.6
20.1
20.9
18.1
15–59
54.3
51.6
53.3
58.1
57.5
58.8
66.9
67.1
64.6
59.7
60+
5.1
5.6
5.7
5.8
6.7
7.4
9.5
12.8
14.5
22.2
Jharkhand
0–14
NA
NA
NA
NA
39.8
36.2
29.2
28.7
28.5
26.4
Karnataka
15–59
NA
NA
NA
NA
54.3
56.7
62.7
61.8
61.0
61.0
60+
NA
NA
NA
NA
5.9
7.2
8.1
9.5
10.4
12.5
0–14
42.2
42.4
40.1
35.9
31.9
26.2
22.6
19.8
18.0
16.6
15–59
52.1
51.5
53.6
57.3
60.4
64.3
66.3
66.0
63.0
59.6
60+
5.7
6.1
6.3
6.8
7.7
9.5
11.1
14.2
19.0
23.8
(continued)
2.4 Measures of the Ageing Process
63
Table 2.20 (continued) Age group Kerala
Madhya Pradesh Maharashtra
Manipur
Meghalaya
Mizoram
Nagaland
Odisha
Punjab
Rajasthan
Sikkim
Tamil Nadu
Tripura
1961
1971
1981
1991
2001
2011
2021
2031
2041
2051
0–14
42.9
40.8
35.8
30.3
26.1
23.5
20.2
18.6
13.3
11.2
15–59
51.3
53
56.6
60.9
63.4
64.0
63.4
60.7
58.4
54.5
60+
5.8
6.2
7.6
8.8
10.5
12.6
16.4
20.7
28.2
34.3
0–14
40.5
44.0
41.6
39.7
38.6
33.5
29.8
28.8
28.0
26.9
15–59
54.3
50.2
52.4
53.9
54.3
58.6
62.1
61.3
60.7
59.7
60+
5.2
5.8
6.0
6.4
7.1
7.9
8.1
9.9
11.3
13.4
0–14
40.6
41.7
37.6
35.2
32.2
26.7
22.0
19.5
19.9
19.1
15–59
54.1
52.6
56.1
57.9
59.1
63.4
66.2
65.5
62.5
59.3
60+
5.3
5.7
6.3
6.9
8.7
9.9
11.8
15.0
17.7
21.6
0–14
43.1
42.5
39.3
36.3
32.7
30.3
20.9
18.7
20.7
19.2
15–59
51.3
51.4
54.8
57.8
60.6
62.7
69.5
68.1
62.7
60.1
60+
5.6
6.1
5.9
5.9
6.7
7.0
9.6
13.2
16.6
20.7
0–14
NA
43.6
42.4
38.9
42.4
39.8
30.6
27.7
30.1
26.8
15–59
NA
51.8
53.2
56.5
53.0
55.5
63.5
64.2
61.0
61.8
60+
NA
4.6
4.4
4.6
4.6
4.7
5.9
8.1
8.9
11.4
0–14
NA
NA
39.6
37.0
35.3
32.5
23.2
19.4
25.8
23.6
15–59
NA
NA
55.8
58.1
59.1
61.3
67.8
68.4
61.2
60.7
60+
NA
NA
4.6
4.9
5.6
6.3
9.0
12.2
13.0
15.7
0–14
38.7
37.9
36.9
35.6
36.7
34.3
22.3
20.1
24.7
23.1
15–59
54.5
55.4
57.2
59.0
58.8
60.5
70.5
69.2
62.8
59.6
60+
6.8
6.7
5.9
5.4
4.5
5.2
7.2
10.7
12.5
17.3
0–14
38.7
42.6
40.2
36.4
33.2
28.9
23.9
22.4
21.3
20.2
15–59
55.6
51.4
53.5
56.6
58.5
61.6
65.1
64.0
62.9
60.9
60+
5.7
6.0
6.3
7.0
8.3
9.5
11.0
13.6
15.8
18.9
0–14
43.8
41.7
37.3
35.6
31.4
25.6
21.2
18.8
20.6
18.9
15–59
49.6
50.8
55
56.8
59.6
64.1
66.3
65.0
62.7
60.3
60+
6.6
7.5
7.7
7.6
9.0
10.3
12.5
16.2
16.7
20.9
0–14
42.5
44.3
43.1
40.8
40.1
34.7
29.6
28.1
20.8
19.4
15–59
52.4
50.2
51.5
53.2
53.1
57.8
62.0
61.6
65.5
62.4
60+
5.1
5.5
5.4
6.0
6.8
7.5
8.4
10.3
13.7
18.1
0–14
39.5
38.5
39.6
38.4
35.1
27.2
20.7
19.5
22.6
20.6
15–59
55.6
58.2
56.0
57.0
59.5
66.1
70.1
67.5
63.0
60.7
60+
4.9
3.3
4.4
4.6
5.4
6.7
9.2
13.0
14.4
18.7
0–14
37.6
38.1
35.2
31.5
27.0
23.6
20.0
17.4
14.5
13.3
15–59
56.8
56.2
58.3
61.2
64.2
66.0
66.7
65.2
61.5
57.6
60+
5.6
5.7
6.5
7.3
8.8
10.4
13.3
17.4
24.1
29
0–14
43.8
44.2
39.4
37.0
33.7
27.7
20.0
16.5
20.0
19.0
15–59
49.0
49.2
53.6
56.0
59.0
64.4
69.3
68.2
63.5
59.6
(continued)
64
2 The Demographics of Ageing
Table 2.20 (continued) Age group
Uttarakhand
Uttar Pradesh
West Bengal
1961
1971
1981
1991
2001
2011
2021
2031
2041
2051 21.4
60+
7.2
6.6
7.4
7.0
7.3
7.9
10.7
15.3
16.6
0–14
NA
NA
NA
NA
36.4
31.1
24.4
22.3
29
27.8
15–59
NA
NA
NA
NA
55.8
60.0
65.1
64.9
60.2
58.8
60+
NA
NA
NA
NA
7.8
8.9
10.5
12.8
10.8
13.4
0–14
40.4
41.8
42.6
40.6
41.1
36.0
31.1
30.5
32.8
31.8
15–59
53.4
51.4
50.9
52.8
51.9
56.2
61.2
60.9
58.4
57.8
60+
6.2
6.8
6.5
6.6
7.0
7.8
7.7
8.6
8.7
10.4
0–14
40.7
43.4
39.2
36.2
33.3
27.1
21.0
18.6
20.7
19.9
15–59
54.3
51.3
55.4
57.8
59.6
64.4
68.0
66.5
62.6
60.1
60+
5.0
5.3
5.4
6.0
7.1
8.5
11.0
14.9
16.7
20.0
Union Territory Andaman & Nicobar Islands Chandigarh
Dadra & Nagar Haveli Daman and Diu Delhi
Lakshadweep
Pondicherry
All India
0–14
36.2
38.0
39.7
33.6
30.0
24.4
23.4
20.4
19.2
18.1
15–59
61,0
59.4
57.5
62.8
64.7
68.9
66.0
64.6
60.8
58.4
60+
2.8
2.6
2.8
3.6
5.3
6.7
10.6
15.0
20.0
23.5
0–14
NA
34.8
33.4
29.6
25.3
25.3
23.9
20.7
20.1
18.4
15–59
NA
61.6
62.6
65.9
68.5
68.4
65.6
64.6
60.2
59.5
60+
NA
3.6
4.0
4.5
6.2
6.4
10.5
14.7
19.7
22.1
0–14
43.7
45.5
42.5
36.5
38.1
31.4
30.7
29.9
28.4
27.1
15–59
52.3
50.4
53.5
59.1
56.5
64.6
62.2
59.9
57.2
58.7
60+
4.0
4.1
4.0
4.4
5.4
4.0
7.1
10.2
14.4
14.2
0–14
NA
NA
NA
33.5
28.2
22.6
21.7
19.8
18.9
18.1
15–59
NA
NA
NA
60.2
64.7
72.7
69.8
66.7
57.4
56.3
60+
NA
NA
NA
6.3
7.1
4.7
8.5
13.5
23.7
25.6
0–14
40.5
38.6
35.5
33.5
32.5
27.2
21.7
19.1
20.4
18.7
15–59
55.4
57.1
60.0
61.8
62.3
65.9
68.6
66.7
61.8
60.4
60+
4.1
4.3
4.5
4.7
5.2
6.8
9.7
14.2
17.9
20.9
0–14
40.9
40.8
41.4
37.0
31.8
25.6
18.9
17.0
13.6
11.6
15–59
54.1
54.1
53.8
57.8
61.3
66.2
68.1
65.5
62.9
56.2
60+
5.0
5.1
4.8
5.2
6.9
8.2
13.0
17.5
23.5
32.2
0–14
36.6
39.5
36.5
34.0
29.5
23.9
19.3
16.3
14.6
13.3
15–59
56.5
54.2
56.8
59.1
62.7
66.4
67.5
65.1
60.8
57.5
60+
6.9
6.3
6.7
6.9
7.8
9.7
13.2
18.6
24.6
29.2
0–14
40.9
42.2
39.8
37.5
35.4
30.9
25.8
24.6
24.8
24.0
15–59
53.4
51.8
54.0
56.0
57.1
60.5
64.3
63.2
61.2
59.4
60+
5.7
6.0
6.2
6.5
7.5
8.6
9.9
12.2
14.0
16.6
Source: Same as Table 2.4
2.4 Measures of the Ageing Process
65
projected to have 20–30% share of children in the next five decades. With the shift in the age structure favouring the working age groups, the burgeoning demographic dividend is quite evident in the projections.
2.4.2
Median Age
The median age is defined as the age that divides the population into two equal halves. It can, therefore, reflect the phenomenon of ageing as it determines whether a given population is young or old. The median age is computed and presented in Table 2.21. The median age increases faster with the fertility transition, which reduces the number of children. For India, the median age was computed as 20 years in 1981 and it reached 23.9 years by 2011. Not much difference in this age is noticed between the sexes during the period under investigation (the median age by sex is not presented in this table for this reason). Among the states, the median varies substantially, with the index ranging from as high as 30.8 in Kerala to as low as 18.6 in Meghalaya. The state with a higher median age relatively moves faster towards the ageing process when compared with one that has a lower median age. Thus, south Indian states are far ahead in the ageing process in the country.
2.4.3
The Index of Ageing
Table 2.22 shows the index of ageing for India in the states and union territories. The index of ageing is defined as the ratio of population above 60 years of age to the population in the age group 0–14. It is interpreted as the number of persons above age 60 per 100 children aged 14 years in a particular period. As per the index, the ageing process was much slower in India during 1961–91 but has picked up over the decade 1991–2011 and is expected to grow faster in the near future, thereby resulting in an index value of 84.7 in 2051. Goa and Tripura, which are far ahead in the process of demographic transition, will show a high index value by 2051, with the index at 261.3 and 221.5, respectively. Thus, the index of ageing confirms that the Indian ageing process has a rapid increase in future. Though the projected proportion of the aged in India is expected to be around 17.5% by 2051, the highest number of elderly persons will be in south India due to the slowing down of the overall population growth rate. Moreover, the ageing process is intensified owing to the higher survival rate of individuals beyond the age of 60 and 70. Table 2.23 provides ample evidence to this effect. As can be seen from Table 2.23, males are expected to live 17 years beyond the age of 60 and 10 years beyond the age of 70. The corresponding years for females are even higher at 18 and 11, respectively, by 2021.
66
2 The Demographics of Ageing
Table 2.21 Trends in the median age of the population in India, its states and union territories, 1961–2051 1961
1971
1981
1991
2001
2011
2021
2031
2041
2051
Andhra Pradesh
21.3
20.7
21.2
22.6
24.2
26.1
31.0
34.8
38.7
40.7
Arunachal Pradesh
NA
24.2
23.5
20.6
19.4
20.3
26.0
30.8
35.7
39.1
Assam
19.6
17.9
NA
20.4
21.3
22.8
26.5
29.7
32.7
34.3
Bihar
20.0
19.7
19.1
19.9
19.1
19.3
22.1
25.4
27.3
27.7
Chhattisgarh
NA
NA
NA
NA
22.0
23.0
25.9
28.2
29.6
30.8
Goa
25.5
24.7
26.5
22.6
27.6
30,0
36.0
40.8
44.6
47.3
Gujarat
19.2
18.6
20.0
21.6
23.6
24.8
28.8
32.0
34.8
36.2
Haryana
NA
16.9
18.6
19.8
21.7
23.8
28.1
30.0
34.6
37.1
Himachal Pradesh
26.8
22.7
23.9
21.2
24.4
27.0
31.7
35.8
39.5
42.3
Jammu & Kashmir
22.8
21.2
19.3
21.1
21.6
22.2
27.9
32.4
37.2
41.4
Jharkhand
NA
NA
NA
NA
20.2
21.1
24.3
27.4
29.6
31.1
Karnataka
19.8
19.1
20.0
22.2
24.1
25.9
30.8
34.7
38.0
40.3
State
Kerala
19.3
19.4
21.8
24.4
28.1
30.8
34.5
37.3
40.1
41.9
Madhya Pradesh
20.7
19.1
19.5
20.6
20.7
22.1
24.9
27.6
28.8
27.6
Maharashtra
20.7
20.1
21.3
22.9
24.2
25.9
31.0
34.9
38.8
41.4
Manipur
21.0
21.6
23.8
21.5
23.8
23.9
29.6
34.3
39.1
43.0
Meghalaya
NA
20.6
21.4
20.3
20.1
18.6
23.3
27.1
30.8
32.6
Mizoram
NA
NA
23.4
20.8
22.7
22.6
28.5
33.2
37.9
43.1
Nagaland
24.3
24.8
25.3
21.1
23.0
21.0
27.2
32.6
37.9
42.1
Orissa
21.6
19.7
20.2
22.2
23.9
25.2
29.3
32.4
35.8
37.9
Punjab
18.6
19.1
21.1
22.1
24.2
26.1
31.3
35.9
40.0
42.6
Rajasthan
19.5
18.4
18.5
19.8
19.9
21.1
24.7
28.0
30.6
32.4
Sikkim
23.5
23.9
23.4
20.1
22.1
24.3
30.2
35.3
40.5
43.9
Tamil Nadu
22.2
22.0
22.7
24.5
27.2
28.8
33.6
37.5
40.9
43.0
Tripura
21.6
20.3
23.9
21.6
22.5
25.0
31.3
36.5
41.5
45.6
Uttarakhand
NA
NA
NA
NA
21.5
22.9
27.6
32.0
36.4
39.3
Uttar Pradesh
20.9
19.2
19.1
19.9
20.5
19.9
23.5
26.5
29.0
31.4
West Bengal
20.5
18.8
20.1
22.2
23.8
25.6
30.8
35.3
39.7
42.7
Andaman & Nicobar Islands
25.1
24.1
23.1
22.6
25.9
27.2
28.1
32.5
33.4
35.6
Chandigarh
NA
26.1
27.0
24.6
29.2
25.4
26.3
29.8
31.6
33.4
Dadra & Nagar Haveli
20.4
19.0
21.3
21.7
21.9
22.4
22.9
26.5
28.7
31.6
Daman and Diu
NA
NA
NA
22.1
26.1
24.2
25.7
27.9
29.5
30.4
Delhi
22.7
24.0
25.9
23.0
23.4
24.9
30.8
35.5
39.8
42.8
Lakshadweep
22.6
22.6
22.2
21.3
24.2
27.5
29.5
30.2
31.5
32.8
Pondicherry
25.6
23.7
25.7
22.8
26.2
28.8
29.8
30.8
32.4
34.9
All India
20.5
19.6
20.2
21.6
22.5
23.9
27.6
30.8
33.8
35.5
Union Territory
Source: Same as Table 2.4
2.4 Measures of the Ageing Process
67
Table 2.22 Trends in the index of ageing for India, its states and union territories, 1961–2051 1961
1971
1981
1991
2001
2011
2021
2031
2041
2051
State Andhra Pradesh
15.8
15.6
16.3
18.1
23.7
38.0
52.6
72.5
108.3
140.2
Arunachal Pradesh
NA
12.1
12.1
10.7
11.3
12.9
25.8
42.8
68.4
103.7
Assam
9.6
10.1
NA
13.6
15.7
20.3
28.9
40.3
57.2
75.2
Bihar
13.2
13.8
14.9
14.7
15.8
18.5
23.3
27.0
36.0
40.3
Chhattisgarh
NA
NA
NA
NA
19.6
24.5
28.7
36.1
47.3
54.7
Goa
21.7
17.4
19.3
18.5
33.9
51.4
87.1
138.8
198.9
261.3
Gujarat
11.4
12.0
14.1
16.7
21.0
27.4
40.4
56.8
78.5
96.2
Haryana
NA
12.2
15.0
18.6
20.9
29.1
38.5
53.9
77.1
100.0
Himachal Pradesh
19.3
17.4
19.0
21.0
29.1
39.6
60.3
86.5
126.0
162.6
Jammu & Kashmir
12.5
12.9
14.0
16.0
18.7
21.8
40.3
63.8
90.3
135.6
Jharkhand
NA
NA
NA
NA
14.7
19.8
27.9
33.2
44.4
56.1
Karnataka
13.5
14.3
15.4
18.8
24.1
36.1
49.3
71.6
102.7
137.3
Kerala
13.5
14.8
20.8
28.9
40.2
53.5
81.3
110.9
141.9
164.3
Madhya Pradesh
12.5
13.2
12.9
16.2
18.4
23.5
27.2
34.2
45.1
40.3
Maharashtra
12.9
13.5
17.0
19.6
27.2
37.1
53.5
76.7
111.8
149.2
Manipur
13.0
14.3
14.9
16.4
20.6
23.2
46.1
70.9
103.7
157.2
Meghalaya
NA
10.6
10.4
11.9
10.8
11.8
19.2
29.2
40.8
59.5
Mizoram
NA
NA
11.7
13.3
15.6
19.3
38.7
63.2
95.1
148.5
Nagaland
17.6
17.6
16.1
15.2
12.4
15.1
32.0
53.4
83.0
131.5
Odisha
14.5
14.1
15.3
19.2
24.9
33.0
45.8
60.7
83.7
110.0
Punjab
14.8
17.8
20.7
21.2
28.8
40.4
59.0
86.2
124.8
162.3
Rajasthan
12.1
12.5
12.3
14.9
16.9
21.5
28.5
36.6
52.5
64.5
Sikkim
12.3
8.6
11.1
11.9
15.4
24.6
44.4
66.5
116.3
171.4
Tamil Nadu
13.9
14.9
17.9
23.2
33.0
44.2
66.4
100.0
139.2
175.6
Tripura
12.6
12.8
17.9
18.8
21.6
28.4
53.4
92.1
145.8
221.5
Uttarakhand
NA
NA
NA
NA
21.2
28.8
42.9
57.6
85.7
117.3
Uttar Pradesh
15.4
16.3
15.3
16.4
17.2
21.7
24.6
28.3
45.2
53.1
West Bengal
12.2
12.3
13.6
16.6
21.4
31.3
52.0
80.3
118.3
158
7.6
6.9
7.3
10.6
17.8
27.4
38.4
48.2
95.9
77.1
Union Territory Andaman & Nicobar Islands Chandigarh
NA
10.5
12.1
15.3
24.5
25.2
35.9
47.5
102.3
83.0
Dadra & Nagar Haveli
9.2
13.2
9.4
12.1
14.2
12.9
22.8
39.4
198.0
190.4
Daman and Diu
NA
NA
NA
18.9
25.1
20.7
30.9
47.6
79.9
70.5
Delhi
10.2
11.1
12.6
14.1
16.0
25.1
44.6
74.2
119.2
89.5
Lakshadweep
12.2
5.1
11.8
14.1
21.8
32.0
40.5
59.4
57.6
36.0
Pondicherry
18.7
16.1
18.4
20.3
26.5
40.4
51.6
56.8
59.3
45.4
All India
13.7
14.0
15.0
17.6
21.1
27.9
38.3
49.2
68.0
84.7
Source: Same as Table 2.4
68
2 The Demographics of Ageing
Table 2.23 Expectation of life at ages 60 and 70 in India (in years)
Year
Males e60
e70
1971 13.80 8.57 1981 14.25 8.83 1991 15.01 9.27 2001 15.74 9.70 2011 16.92 10.91 2021 16.75 10.32 Source: Same as Table 2.4
2.4.4
Females e60
e70
14.75 15.31 16.23 17.05 19.00 18.18
9.10 9.42 9.97 10.45 12.33 11.14
Dependency Ratios
The dependency ratio refers to the ratio of the population below 14 and above 60 years of age to the population in the working age category (15–59 years). This ratio also exhibits the changing age structure of the population in relation to the young and old dependency ratios. Table 2.24 reveals that both the young and the total dependency ratios show a consistent decline up to 2051, whereas the old dependency ratios exhibit an increase in the same period. For instance, the old dependency ratio for India was hovering around 14 for the period 1961–2011 and it is expected to reach 28 by 2051. The opposite trend is seen in the young dependency ratio—51 in 2011 and 27.9 in 2051. The pattern holds true in the states. The dependency ratio is measured in a highly tractable continuous time overlapping generations (OLG) model in which the population is divided into three groups—young dependents, workers and elderly dependents (Hock and Weil 2012). Young dependents induce a lower saving rate in the economy, but with the changing trends in demographic composition they have come down in number, mainly due to the gradual decline in fertility rates. Owing to the longer life expectancy and sustained lower fertility rates, the old age-dependency ratios have gone up. This changing perspective throws light on the fact that even though the young dependency ratio is supposed to come down on account of lower fertility rates, it is not the case. This contrasting finding can be attributed to the cultural and societal changes wherein the population that comprises 0–14 years was considered a dependent age group, which has now become 0–30 years. This drastic shift in scenario has redefined the young dependency ratio and the age stratification.
2.5
Social and Economic Dimensions
Besides the demographic assessment, an enquiry into the social and economic characteristics of the elderly in India is relevant. The discussions include the following criteria.
2.5 Social and Economic Dimensions
69
Table 2.24 Trends in dependency ratios (in percentage) for India, its states and union territories, 1961–2051 1961
1971
1981
1991
2001
2011
2021
2031
2041
2051
Young
72.6
76.9
70.6
61.8
53.2
40.5
32.6
30.4
28.3
27.8
Old
11.5
12.0
11.5
11.2
12.6
15.4
17.2
22.0
30.1
39.2
Total
84.1
88.9
82.1
73.0
65.8
55.9
49.8
52.4
58.4
67.0
Young
NA
67.1
70.6
71.0
73.3
59.8
36.2
34.0
47.6
47.1
Old
NA
8.1
8.5
7.6
8.3
7.7
9.4
14.6
17.6
21.3
Total
NA
75.2
79.1
78.6
81.6
67.5
45.6
48.6
65.3
68.4
Young
88.1
96.8
NA
69.7
66.0
54.3
41.1
39.1
42.5
42.1
Old
8.4
9.7
NA
9.5
10.3
11.0
11.9
15.8
21.0
25.2
Total
96.5
106.5
NA
79.2
76.3
65.3
53.0
54.9
63.5
67.3
Young
81.2
82.9
81.6
78.0
82.2
76.9
76.9
54.3
51.2
46.9
Old
10.7
11.4
12.2
11.5
13.0
14.2
14.2
12.7
15.1
17.9
Total
91.9
94.3
93.8
89.5
95.2
91.1
91.1
67.0
66.3
64.8
Young
NA
NA
NA
NA
66.3
53.4
45.8
45.8
28.3
29.4
Old
NA
NA
NA
NA
13.0
13.1
13.2
16.5
25.4
35.1
Total
NA
NA
NA
NA
79.3
66.5
58.9
62.3
53.7
64.5
Young
68.1
68.9
66.6
57.8
36.9
32.6
25.8
22.8
24.9
24.7
Old
14.8
12.0
11.7
10.7
12.5
16.8
22.5
31.6
45.7
54.3
Total
82.9
80.9
78.3
68.5
49.4
49.4
48.3
54.4
70.7
79.0
Young
82.1
84.5
71.8
64.5
54.5
45.9
39.0
36.8
33.0
32.5
Old
9.4
10.2
10.1
10.8
11.5
12.6
15.8
20.9
27.1
33.7
Total
91.5
94.7
81.9
75.3
66.0
58.5
54.8
57.8
60.2
66.3
Young
NA
98.1
80.4
76.7
63.7
48.3
39.1
35.1
32.0
31.2
Old
NA
12.1
12.1
14.3
13.3
14.1
15.1
18.9
24.0
32.9
Total
NA
110.2
92.5
91.0
77.0
62.4
54.2
54.0
56.0
64.1
Young
69.8
79.3
89.0
67.4
51.9
40.6
32.4
29.5
33.8
31.5
Old
13.5
13.9
13.9
14.1
15.1
16.1
19.6
25.6
26.2
33.3
Total
83.3
93.2
102.9
81.5
67.0
56.7
52.0
55.1
60.0
64.9
Young
74.8
83.2
77.0
62.2
62.3
57.6
35.2
30.0
32.4
32.1
Old
9.3
10.8
10.8
10.0
11.6
12.5
14.2
19.2
22.5
32.5
Total
84.1
94.0
87.8
72.2
73.9
70.1
49.2
49.2
54.8
64.5
Young
NA
NA
NA
NA
73.2
63.8
46.5
46.5
46.7
43.3
Old
NA
NA
NA
NA
10.8
12.7
13.0
15.4
17.1
20.5
Total
NA
NA
NA
NA
84.0
76.5
59.5
61.9
63.8
63.8
Young
80.7
83.4
74.7
62.6
52.8
40.8
34.1
30.0
28.5
27.8
Old
10.9
11.8
11.6
11.8
12.7
14.8
16.8
21.5
30.2
40.0
Total
91.6
95.2
86.3
74.4
65.5
55.6
50.9
51.5
58.7
67.8
Young
83.5
76.6
63.0
49.9
41.1
36.7
31.9
30.7
22.8
20.6
Old
11.3
11.4
13.2
14.4
16.5
19.6
25.2
34.0
48.3
63.0
Total
94.8
88.0
76.2
64.3
57.6
56.3
57.8
64.7
71.1
83.6
State Andhra Pradesh
Arunachal Pradesh
Assam
Bihar
Chhattisgarh
Goa
Gujarat
Haryana
Himachal Pradesh
Jammu & Kashmir
Jharkhand
Karnataka
Kerala
(continued)
70
2 The Demographics of Ageing
Table 2.24 (continued) Madhya Pradesh
Maharashtra
Manipur
Meghalaya
Mizoram
Nagaland
Odisha
Punjab
Rajasthan
Sikkim
Tamil Nadu
Tripura
Uttarakhand
Uttar Pradesh
1961
1971
1981
1991
2001
2011
2021
2031
2041
2051
Young
74.5
87.5
78.8
73.7
71.2
57.1
48.1
47.1
46.1
45.1
Old
9.4
11.5
11.1
11.9
13.1
13.4
13.1
16.1
18.7
22.5
Total
83.9
99.0
89.9
85.6
84.3
70.5
61.2
63.2
64.8
67.5
Young
74.9
79.2
67.3
60.7
54.4
42.2
33.2
29.8
31.8
32.2
Old
9.6
10.7
11.5
11.9
14.8
15.7
17.7
22.8
28.3
36.4
Total
84.5
89.9
78.8
72.7
69.1
57.8
50.9
52.7
60.1
68.6
Young
84.1
82.7
71.8
62.8
53.9
48.2
30.1
27.4
33.0
31.9
Old
10.9
11.9
10.7
10.3
11.1
11.2
13.9
19.4
26.5
34.5
Total
95.0
94.6
82.5
73.1
65.0
59.4
43.9
46.8
59.5
66.4
Young
NA
84.1
79.8
68.8
79.8
71.6
48.2
43.1
49.4
43.3
Old
NA
9.0
8.3
8.2
8.6
8.4
9.2
12.6
14.6
18.4
Total
NA
93.1
88.1
77.0
88.4
80.0
57.4
55.6
64.0
61.7
Young
NA
NA
89.5
63.7
59.8
53.0
34.3
28.3
42.2
38.9
Old
NA
NA
10.5
8.5
9.3
10.2
13.3
17.9
21.3
25.9
Total
NA
NA
100.0
72.2
69.1
63.2
47.5
46.2
63.5
64.7
Young
71.0
68.3
74.8
60.3
62.4
56.8
31.6
29.0
39.3
38.8
Old
12.5
12.1
10.4
9.1
7.7
8.6
10.1
15.5
20.0
29.0
Total
83.5
80.4
85.2
69.4
70.1
65.4
41.8
44.5
59.3
67.7
Young
69.7
83.0
74.5
64.4
56.8
46.8
36.7
35.0
33.8
33.2
Old
10.2
11.7
11.5
12.3
14.1
15.4
16.8
21.2
25.1
31.1
Total
79.9
94.7
86.0
76.7
70.9
62.2
53.6
56.2
58.9
64.3
Young
88.3
82.0
67.8
62.7
52.7
39.9
32.0
28.9
32.8
31.3
Old
13.3
14.7
14.0
13.3
15.2
16.1
18.9
24.9
26.7
34.6
Total
101.6
96.7
81.8
76.0
67.9
56.0
50.9
53.8
59.5
65.9
Young
81.2
88.3
83.5
76.7
75.5
60.2
47.7
45.7
31.8
31.1
Old
9.8
11.1
10.3
11.4
12.8
13.0
13.6
16.7
21.0
29.0
Total
91.0
99.4
93.8
88.1
88.3
73.2
61.3
62.4
52.8
60.2
Young
71.1
66.2
70.7
67.5
58.9
41.2
29.5
28.9
36.0
34.0
Old
8.7
5.7
7.8
8.1
9.0
10.1
13.1
19.2
22.8
30.7
Total
79.8
71.9
78.5
75.6
67.9
51.3
42.6
48.1
58.8
64.7
Young
66.1
67.7
60.3
51.4
42.0
35.8
30.0
26.7
23.6
23.1
Old
9.9
10.1
10.9
11.9
13.9
15.8
19.9
26.7
39.1
50.3
Total
76
77.8
71.2
63.3
55.9
51.6
50.0
53.5
62.7
73.5
Young
82.9
89.8
73.4
66.0
57.0
43.0
28.9
24.3
31.5
31.9
Old
10.5
13.4
13.2
12.4
12.3
12.2
15.4
22.4
26.1
36.0
Total
93.4
103.2
86.6
78.4
69.3
55.2
44.3
46.6
57.6
67.8
Young
NA
NA
NA
NA
65.3
51.8
37.6
34.3
48.1
47.4
Old
NA
NA
NA
NA
13.8
14.9
16.1
19.7
18.0
22.7
Total
NA
NA
NA
NA
79.1
66.7
53.7
54.0
66.1
70.1
Young
75.6
81.3
83.5
76.8
79.1
64.0
50.8
50.1
56.2
55.1
Old
11.7
13.3
12.8
12.6
13.6
13.9
12.5
14.2
14.9
18.0
Total
87.3
94.6
96.3
89.4
92.7
77.9
63.4
64.3
71.1
73.1
(continued)
2.5 Social and Economic Dimensions
71
Table 2.24 (continued) 1961
1971
1981
1991
2001
2011
2021
2031
2041
2051
Young
75.0
84.3
70.7
62.5
55.8
42.2
31.0
28.0
33.0
33.0
Old
9.2
10.4
9.7
10.4
11.9
13.2
16.1
22.5
26.7
33.2
Total
84.2
94.7
80.4
72.9
67.7
55.4
47.1
50.4
59.7
66.3
Andaman & Nicobar Islands
Young
59.5
63.9
69.1
53.5
46.4
35.4
35.5
31.6
31.6
31.0
Old
4.5
4.4
5.0
5.7
8.3
9.7
16.0
23.3
33.0
40.3
Total
64.0
68.3
74.1
59.2
54.7
45.1
51.5
54.9
64.6
71.3
Chandigarh
Young
NA
56.5
53.3
44.9
36.9
36.9
36.4
32.0
33.5
30.8
Old
NA
5.9
6.4
6.9
9.0
9.3
16.0
22.7
32.7
37.1
Total
NA
62.4
59.7
51.8
45.9
46.2
52.4
54.7
66.2
68.0
Young
83.5
90.2
79.3
61.7
67.4
48.6
49.3
49.9
49.7
46.2
Old
7.7
8.1
7.5
7.5
9.6
6.3
11.4
17.0
25.1
24.3
West Bengal
Union Territory
Dadra & Nagar Haveli
Daman and Diu
Delhi
Lakshadweep
Pondicherry
All India
Total
91.2
98.3
86.8
69.2
77.0
54.9
60.7
66.9
74.8
70.5
Young
NA
NA
NA
55.6
43.5
31.1
31.1
29.6
32.9
32.1
Old
NA
NA
NA
10.5
10.9
6.4
12.1
20.2
41.2
45.5
Total
NA
NA
NA
66.1
54.4
37.5
43.2
49.8
74.1
77.5
Young
73.1
67.7
59.3
54.2
52.1
41.3
31.7
28.7
33.0
31.0
Old
7.5
7.5
7.5
7.6
8.4
10.4
14.1
21.3
28.9
34.7
Total
80.6
75.2
66.8
61.8
60.5
51.7
45.8
49.9
61.9
65.7
Young
75.6
75.4
76.9
64.0
51.8
38.6
27.8
26.0
21.5
20.7
Old
9.2
9.4
9.1
9.0
11.3
12.4
19.1
26.7
37.4
57.4
Total
84.8
84.8
86.0
73.0
63.1
51.0
46.9
52.7
58.9
78.1
Young
64.9
72.9
64.4
57.4
47.1
36.0
28.6
25.1
24.0
23.1
Old
12.1
11.7
11.8
11.7
12.5
14.5
19.5
28.5
40.6
50.8
Total
77.0
84.6
76.2
69.1
59.6
50.5
48.1
53.6
64.6
73.9
Young
76.6
81.6
74.0
67.0
62.1
51.0
40.0
39.0
40.4
40.3
Old
10.5
11.5
11.6
11.8
13.1
14.2
15.3
19.2
22.8
27.9
Total
87.1
93.1
85.6
78.8
75.2
65.2
65.2
55.4
63.2
68.2
Source: Same as Table 2.4
1. 2. 3. 4.
Literacy Marital status Economic situation Living arrangements.
The analysis will enlighten policymakers on the needs of the elderly and the remedial measures that can be adopted to make senior persons feel useful, rather than be considered as a major liability in the family and the community. The discussion on literacy will throw light on the extent to which the aged can be rights conscious enough to demand their due from the society. Further, the marital status composition will reveal their way of life in case of the absence of the spouse due to
72
2 The Demographics of Ageing
either singlehood or widowhood. The nature of the economic dependence of old people can be viewed from the extent of their involvement in paid work. Lastly, their living arrangement would also highlight the support systems available to the elderly in India. One should, therefore, take note of these aspects before formulating policies for the elderly.
2.5.1
Literacy
Education improves the well-being of the elderly. Longevity also has a strong association as literacy levels and life expectancy at birth are highly correlated (Granahan 1972). Education, apart from providing economic stability, enables smoother adaptability towards the rapid socioeconomic transition seen in society today. It empowers the elderly to make informed choices and crucial decisions such as those regarding healthcare. However, many educated and well-to-do elderly refuse to make use of the benefits of technological advancement. According to the Indian census, a literate person is defined as an individual who has the ability to read and write with understanding in any language. Table 2.25 gives us an idea of the disparity between the literacy levels in the general population and the aged for India by sex and place of residence during the period 1961–2011. Given that the cohorts currently forming the elderly category lived much of their lives in an era with low socioeconomic development, it is not surprising that their Table 2.25 Percentage literate among general population and aged (60 years and above) by sex and place of residence, 1961–2011 Place of residence
Sex
Census 1961
General population Rural Males 34.3 Females 10.1 Total 22.5 Urban Males 66.0 Females 40.5 Total 54.4 60+ Population Rural Males 19.5 Females 2.0 Total 10.7 Urban Males 31.8 Females 12.2 Total 22.1 Source: Census of India 1961–2011,
Census 1971
Census 1981
Census 1991
Census 2001
Census 2011
48.6 15.5 27.9 69.8 48.8 60.2
49.6 21.7 36.0 76.7 56.3 67.2
56.9 30.2 36.0 81.1 64.1 67.2
71.4 46.7 59.4 86.7 73.2 80.3
78.6 58.8 67.8 89.7 79.9 84.1
45.5 13.0 29.1 75.0 41.8 58.1
50.5 18.4 34.2 79.6 52.7 66.0
24.4 28.7 33.7 2.3 4.4 7.5 13.4 16.9 21.1 55.9 60 66.6 15.8 21.8 30.8 35.8 41.1 48.7 Office of Registrar General, India
2.5 Social and Economic Dimensions
73
literacy levels are lower than that of the general population, despite the improvements in this regard in the period under consideration. The rural–urban differentials in literacy seem to have aided in the widening of the literacy differentials between the elderly segment and the general population. The rural elderly seem to be more at a disadvantage in this context as the quantity and quality of educational facilities in rural areas were quite inferior to those in the urban areas in the past and still remain more or less so. It is disheartening to note the wide gender differentials in literacy levels wherein even as of 2011, only 52.7% of elderly women in urban India were literate, and in rural areas, this number was even lower at 18%. Similar data for the states and union territories of India for the period 1961–2011 is presented in Table 2.26. The picture that immediately emerges is the sharp improvement in the literacy levels of the elderly across all the states. However, literacy differentials between the general population and the elderly continue to exist in all the states. Interestingly, as of 2011, these differentials were the lowest in the states with high levels of literacy such as West Bengal and Kerala and also in those with low levels of literacy such as Bihar, Andhra Pradesh and Arunachal Pradesh. As far as the literacy levels of elderly females in particular are concerned, only Kerala and Mizoram have a literacy rate that exceeds 70%, with the next best being Goa at 56%. Given the literacy indicators of the elderly, which have shown vast improvements (albeit from a low base), planners and policymakers would have to be prepared for an increase in demand for better social services. The rise in literacy will manifest itself in the form of a greater awareness of the rights of the elderly, thereby leading to further claims for quality social amenities and services.
2.5.2
Marital Status
Females are in excess of males in old age because of the higher life expectancy at birth and also due to the recent trends in mortality, which favour females, as noted earlier. An analysis of the marital status of the elderly gains prominence from the consensus that the married fare better than the single on a number of dimensions— economic, social, emotional and personal care given during the progression through older life (Myers 1986). A major concern in this regard is the increasing proportion of widowhood. A significantly lower proportion of men are widowed when compared with women in extreme old age. Two prominent reasons cited for such a great gender disparity in widowhood are the longevity of women when compared with men and the universal tendency of women to marry men older than themselves. Moreover, widowed men are much more likely to remarry and overcome their solitary status. Although the relationship between elderly well-being and marital status cannot be spelt out promptly, any change in the marital status composition of the elderly needs special attention in future. The data clearly reflects the prominence of widowhood among the elderly in India.
NA
24.0
Nagaland
Karnataka
Mizoram
36.2
Jharkhand
NA
NA
Jammu & Kashmir
Meghalaya
NA
Himachal Pradesh
45.1
27.2
Haryana
42.0
NA
Gujarat
Manipur
41.1
Goa
Maharashtra
39.0
Chhattisgarh
54.2
NA
Bihar
27.0
29.8
Assam
Madhya Pradesh
37.3
Arunachal Pradesh
Kerala
30.2
NA
Andhra Pradesh
State
11.3
NA
NA
15.9
16.8
6.7
38.9
14.2
NA
NA
6.3
NA
19.1
23.0
NA
6.9
16.0
NA
12.0
6.1
NA
NA
28.2
31.0
22.7
52.7
30.8
NA
NA
15.0
NA
35.9
40.2
NA
26.6
30.1
NA
22.7
1.5
NA
NA
1.4
4.5
1.9
16.0
4.0
NA
NA
1.1
NA
5.9
13.6
NA
2.2
7.9
NA
3.4
50.1
64.5
37.9
53.3
58.8
39.5
75.3
48.8
NA
36.3
53.2
48.2
54.4
65.6
NA
38.1
NA
28.9
39.3
Male
Male
Females
Males
All ages Females
1981 All ages
Elderly (60+)
1971
33.9
54.9
30.1
29.1
34.8
19.5
65.7
27.7
NA
15.9
31.5
22.3
32.3
47.6
NA
13.6
NA
11.3
20.4
Females
Table 2.26 Trends in literacy rate (in percentage) among all ages and elderly persons in India and states, 1971–2011
15.8
65.1
30.4
26.3
42.7
26.6
66.1
39.8
NA
17.1
23.1
23.1
41.6
53.7
NA
29.1
NA
5.6
28.2
4.8
23.3
12.4
2.1
9.1
3.6
32.9
8.4
NA
1.8
3.8
3.8
11.8
20.5
NA
3.9
NA
1.1
6.2
Females
(continued)
Elderly (60+) Males
74 2 The Demographics of Ageing
33.0
23.7
19.6
44.5
29.6
NA
27.3
40.1
Punjab
Rajasthan
Sikkim
Tamil Nadu
Tripura
Uttarakhand
Uttar Pradesh
West Bengal
Andhra Pradesh
State
34.5
All India
Females
12.9
12.6 29.2
51.7
25.2
46.1
27.3
30.9
8.8
Females
70.9
Males
All ages
50.4
Pondicherry
10.9
54.0
NA
Elderly (60+)
35.8
Lakshadweep
42.6
NA
Males
60.8
Delhi
10.2
Males
NA
Daman and Diu
4.1
NA
35.8
All Ages
14.7
Dadra & Nagar Haveli
NA
19.4
45.7
21.3
NA
33.6
40.4
20.5
19.2
22.5
36.3
2001
NA
Chandigarh
17.0
7.0
NA
10.2
18.2
4.3
5.8
14.1
8.7
1991
42.4
Andaman & Nicobar Islands
Union Territory
34.7
51.2
Females
4.3
11.0
2.6
18.8
NA
1.2
NA
6.4
9.4
2.4
NA
3.6
5.7
1.4
1.8
2.9
2.2
43.0
Males
24.8
45.7
44.7
53.1
NA
16.8
40.7
42.1
30.3
14.0
NA
32.0
35.0
22.2
11.4
33.7
21.1
16.0
75.6
Males
All ages
2011
Females
Females
Elderly (60+)
46.9
65.8
65.2
68.4
NA
36.3
69.0
58.7
50.7
38.8
NA
51.7
58.3
44
36.3
47.2
47.1
Male
Male
Females
Males
All ages Females
1981 All ages
Elderly (60+)
1971
Odisha
Table 2.26 (continued)
59.7
Females
34.8
57.9
54.4
62.6
NA
16.7
66.4
42.5
51.8
24.0
NA
47.3
47.9
28.4
21.7
23.9
44.4
7.9
18.2
5.9
27.6
NA
3.8
32.8
9.9
12.8
3.5
NA
10.6
10.9
2.5
2.8
4.6
4.7
Females
45.1
Males
(continued)
20.6
Females
Elderly (60+)
Elderly (60+) Males
2.5 Social and Economic Dimensions 75
41.3
49.9
41.9
NA
73.8
60.9
56.1
62.9
NA
NA
56.1
80.8
46.9
63.6
59.8
41.5
70.1
56.6
52.4
54.9
43.9
54.2
63.8
Assam
Bihar
Chhattisgarh
Goa
Gujarat
Haryana
Himachal Pradesh
Jammu & Kashmir
Jharkhand
Karnataka
Kerala
Madhya Pradesh
Maharashtra
Manipur
Meghalaya
Mizoram
Nagaland
Odisha
Punjab
Rajasthan
Sikkim
Tamil Nadu
44.6
37.7
16.3
42.2
28.8
44.8
63.6
34.7
39.6
43.3
23.1
75.4
36.9
NA
NA
43.8
32.7
40.6
59.2
NA
18.1
34.3
22.9
49.9
29.9
24.8
29.4
47.7
30.5
77.1
34.2
37.9
48.6
32.2
78.2
44.9
NA
NA
29.9
27.5
44.9
60.5
NA
32.1
43.3
11.3
16.1
5.1
4.2
7.8
8.1
12.8
42.6
16.7
7.1
13.9
6.3
52.3
12.7
NA
NA
5.0
5.8
12.7
26.0
NA
5.9
11.7
2.6
82.3
76.7
76.5
75.6
75.9
71.8
90.7
66.1
77.9
86.3
76.8
94.2
76.3
67.9
65.8
86.0
79.3
80.5
88.9
77.9
60.3
71.9
64.1
Males
Males
Females
Males
All Ages
Females
2001 All ages
Elderly (60+)
1991
Arunachal Pradesh
Table 2.26 (continued)
64.6
61.5
44.3
63.6
50.9
61.9
86.1
60.4
59.7
67.5
50.3
87.9
57.5
39.4
41.8
68.1
56.3
58.6
75.5
52.4
33.6
56.0
44.2
Females
61.0
40.0
41.0
43
60.0
40.0
87.0
50.0
55.0
61.0
49.0
81.0
54.0
47.0
32.0
48.0
42.0
57.0
70.0
49.0
45.0
59.0
20.0
Males
26.0
8.0
10.0
19.0
16.0
19.0
64.0
28.0
12.0
23.0
14.0
58.0
20.0
13.0
11.0
13.0
13.0
24.0
37.0
11.0
12.0
21.0
5.0
Females
Elderly (60+)
2011
86.8
87.3
80.5
81.5
82.4
83.3
93.7
77.2
86.5
89.8
80.5
96.0
82.8
78.4
78.3
90.8
85.4
87.2
92.8
81.4
73.4
78.8
73.7
Males
All ages
73.9
76.4
52.7
71.3
64.4
76.7
89.4
73.8
73.2
75.5
60.0
92.0
68.1
56.2
58.0
76.6
66.8
70.7
81.8
60.6
53.3
67.3
59.6
Females
65.8
52.2
45.6
52.6
63.1
58.9
90.0
57.3
64.5
70.0
52.7
88.4
59.4
52.5
40.4
62.7
54.6
66.4
80.7
53.4
51.0
63.2
28.3
Males
(continued)
34.6
19.6
13.6
29.1
24.3
34.5
78.1
38.5
25.3
38.4
19.1
71.8
29.3
17.8
13.7
23.2
21.3
35.6
56.7
16.0
18.0
30.8
9.6
Females
Elderly (60+)
76 2 The Demographics of Ageing
NA
44.7
56.6
Uttarakhand
Uttar Pradesh
West Bengal
42.9
69.8
68.7
73.7
72.2
52.8
Chandigarh
Dadra & Nagar Haveli
Daman and Diu
Delhi
Lakshadweep
Pondicherry
All India
Source: same as Table 2.17
66.9
70.5
Andaman & Nicobar Islands
Union Territory
58
32.2
56.7
59.6
54.9
50.2
21.3
60.8
53.6
38.4
20.0
NA
40.6
40.6
60.8
62.5
68.9
61.9
19.9
72.1
50.6
59.6
30.7
NA
50.6
12.7
25.4
16.2
36.7
14.3
5.5
42.6
16.1
20.3
6.2
NA
15.3
75.9
88.9
93.2
87.4
88.4
73.3
85.7
86.1
77.6
70.2
84
81.5
Males
Males
Females
Males
All Ages
Females
2001 All ages
Elderly (60+)
1991
Tripura
Table 2.26 (continued)
54.2
74.1
81.6
75.0
70.4
42.9
76.7
75.3
60.2
42.9
60.3
65.4
Females
53.0
70.0
69.0
78.0
66.0
29.0
80.0
62.0
69.0
43.0
62.0
62.0
Males
20.0
33.0
21.0
48.0
22.0
8.0
56.0
25.0
30.0
13.0
15.0
27.0
Females
Elderly (60+)
2011
82.1
92.1
96.1
91.0
91.5
86.5
90.5
90.1
82.7
79.2
88.3
92.2
Males
All ages
65.5
81.2
88.2
80.9
79.6
65.9
81.4
81.8
71.2
59.3
70.7
83.1
Females
59.1
75.7
82.9
82.8
76.3
45.1
84.3
68.4
70.0
51.7
69.6
77.2
Males
28.5
43.1
41.1
55.1
37.3
18.4
64.2
36.9
37.1
18.8
24.0
48.1
Females
Elderly (60+)
2.5 Social and Economic Dimensions 77
78
2 The Demographics of Ageing
Further, the statistics presented earlier also highlights the gender disparity in widowhood in future (Tables 2.27 and 2.28). For instance, as of 2011, among those aged 60+, married males accounted for 82.1% against 49.6% females. On the other hand, 47.8% elderly females were widows, whereas for elderly males the figure stood at a mere 14.6%. However, the proportion of widows among elderly women has shown a decline over the years. It was 75 in 1961, and by 2011 this figure declined to 47.8%. Similar trends hold true even for those aged 70+ (Table 2.29). It should be highlighted here that if one analyzes the marital status among the elderly, most of these people would either be currently married or widows/widowers. A negligible proportion was reported to be single, divorced or separated.
2.5.3
Economic Conditions
Previous studies have noted the economic implications of the phenomenon of ageing by means of the conventional dependency ratios (Rajan 1989, 1992). Though a basic understanding of economic dependence could be made in terms of demographic measures such as age-dependency ratios, the exact extent of economic dependence can be more accurately assessed with the help of survey-based information (Kodoth and Rajan 2008; Sudha et al. 2006). The question of economic independence was inquired into with the help of work status, property ownership and rentier pensioner status. Sample surveys conducted in rural India in general reflect a greater degree of financial insecurity among the aged. Inadequate financial resources were indicated as one of the major problems of the elderly. This issue is further amplified in the case of elderly females (Dak and Sharma 1987; Nandal et al. 1987; Rajan et al. 2008; Rajan and Balagopal 2018; Shankardass and Rajan 2018). A significant observation made by Kaur et al. (1987) concerned the deterioration of economic independence with age. In many situations, the rural elderly continue to work, though the number of working hours comes down with advancing age (Singh et al. 1987a, b). While examining economic sufficiency in another context, Singh et al. (1987a, b) established that financial problems were more common among widows and the elderly in nuclear families. The researchers (Singh et al. 1987a, b) also indicated economic insecurity as having a certain bearing on the social strata of class and caste. Another observation made in this regard by Punia and Sharma (1987) suggests economic insecurity to be the sole concern of the elderly in the barely sustainable households of rural India. Social stress is seen among the elderly in nuclear families or those living alone as these people worry about their predicament in case of sickness or disability. In view of the evidence cited with respect to economic dependence as well as financial insecurity, it is worthwhile to dwell upon certain characteristics of the Indian elderly. In this regard, an analysis of the labour force participation among the elderly is important from the point of view of their economic dependence, given that prevalent social security arrangements for the aged in the country are inadequate (Rajan et al. 2005; Rajan 1999, 2002, 2008, b). The predominantly rural
State Andhra Pradesh Arunachal Pradesh Assam Bihar Chhattisgarh Goa Gujarat Haryana Himachal Pradesh Jammu & Kashmir Jharkhand Karnataka Kerala Madhya Pradesh Maharashtra Manipur Meghalaya Mizoram Nagaland Odisha Punjab
74.0 NA 77.8 68.4 NA 74.3 68.0 NA 64.0 62.5 NA 72.3 79.4 68.4 73.1 81.0 NA NA 79.7 76.1 59.2
1961 Males CM 24.0 NA 20.7 28.7 NA 20.3 29.4 NA 29.7 33.5 NA 25.2 17.6 28.4 24.7 16.4 NA NA 13.5 21.9 33.0
W 16.5 NA 43.6 26.1 NA 21.1 24.7 NA 22.4 24.9 NA 17.2 23.2 20.8 18.1 31.7 NA NA 58.5 23.1 35.9
82.7 NA 55.0 73.2 NA 73.0 75.0 NA 75.8 73.9 NA 81.3 74.1 78.1 81.0 62.9 NA NA 37.6 76.0 63.7
Females CM W 77.6 NA 81.1 74.5 NA 78.1 75.3 NA 68.2 68.5 NA 79.0 84.2 79.6 79 85.9 82.1 NA 87.2 79.5 67.1
1971 Males CM 20.5 NA 17.2 23.6 NA 16.6 22.2 NA 26.9 28.3 NA 19.1 12.9 18.3 19.1 12.1 13.1 NA 9.7 18.6 24.9
W 20.4 NA 29.9 33.0 NA 18.6 30.6 NA 27.8 31.9 NA 22.6 27.3 25.7 22.6 44.9 40.5 NA 61.9 32.4 49.2
Females CM 78.7 NA 68.6 66.8 NA 76.3 68.9 NA 69.8 67.4 NA 76.4 69.8 73.5 76.4 52.3 54.0 NA 33.4 66.6 50.4
W 81.6 80.4 NA 78.7 NA 80.1 78.9 73.7 74.5 72.3 NA 82.0 85.3 76.7 82.4 85.9 82.0 74.7 88.6 79.5 71.7
1981 Males CM
Table 2.27 Trends in marital status composition of the elderly (aged 60 years and above) in India and its states, 1961–2011
16.8 16.1 NA 20.0 NA 14.6 19.2 22.8 21.5 25.0 NA 15.9 11.5 21 16.1 11.8 12.5 19.9 8.6 19.5 21.9
W
26.8 72.5 44.4 53.3 NA NA 40.4 59.3 NA NA 25.0 71.0 37.4 62.0 49.2 50.6 34.7 64.3 35.6 63.8 NA NA 27.5 71.8 30.0 66.1 34.6 64.6 31.5 67.7 48.9 48.4 39.2 55.1 40.1 53.1 68.1 29.1 29.8 69.7 52.5 47.1 (continued)
Females CM W
2.5 Social and Economic Dimensions 79
State Andhra Pradesh
Rajasthan Sikkim Tamil Nadu Tripura Uttarakhand Uttar Pradesh West Bengal Union Territory Andaman & Nicobar Islands Chandigarh Dadra & Nagar Haveli Daman and Diu Delhi Lakshadweep Pondicherry All India
Table 2.27 (continued)
12.7
Females CM W
W
85.2
NA 29.5 NA 31.3 24.9 14.2 23.7
NA 23.6 NA 28.1 26.4 24.1 27.5
35.7
63.1
NA 69.9 NA 68.3 68.7 84.1 75.4
78.6
NA 74.6 NA 68.6 68.6 73.6 69.1 1991 Males CM
19.5
26.0
75.5 43.0 79.9 80.2 NA 68.9 80.2
66.1
23.9 53.9 19.0 19.3 NA 30.5 18.8
31.0 12.6 23.9 20.3 NA 33.7 23.1
W
Females CM W
64.2 82.7 74.1 78.6 NA 60.9 74.8
1961 Males CM
86.4
77.9 78.9 NA 74.2 79.3 77.9 74.7 2001 Males CM
81.1
72.1 59.1 77.6 83.4 NA 67.3 78.3
1971 Males CM
12.0
W
16.7 19.6 NA 23.0 17.3 20.0 22.4
16.1
24.0 27.4 20.6 15.6 NA 28.2 19.4
W
47.6 69.1 NA 60.5 65.4 79.9 69.2
70.1
69.3 31.1 76.4 67.6 NA 60.0 74.4
W
41.6
56.8
Females CM W
51.7 30.1 NA 39.1 28.5 18.5 30.0
29.1
30.5 61.8 22.5 31.9 NA 39.6 24.6
Females CM
85.4
82.0 83.0 NA 79.3 78.8 80.1 78.2 2011 Males CM
82.9
76.2 69.6 80.2 85.1 NA 71.5 84.0
1981 Males CM
12.4
W
14.6 16.0 NA 18.3 17.3 17.6 19.4
13.7
20.9 25.4 18.4 13.5 NA 25.2 13.5
W
44.3 62.3 NA 56.0 68.3 73.7 64.3
60.4
64.6 48.9 71.8 65.9 NA 54.9 72.8
43.6 54.2 (continued)
Females CM W
54.9 36.6 NA 43.4 28.2 24.2 34.9
38.1
35.2 47.8 27.1 33.5 NA 44.7 26.5
Females CM W
80 2 The Demographics of Ageing
Arunachal Pradesh Assam Bihar Chhattisgarh Goa Gujarat Haryana Himachal Pradesh Jammu & Kashmir Jharkhand Karnataka Kerala Madhya Pradesh Maharashtra Manipur Meghalaya Mizoram Nagaland Odisha Punjab Rajasthan Sikkim
Table 2.27 (continued)
87.9 85.1 80.2 NA 81.2 80.1 79.4 79.4 NA NA 85.1 84.7 78.0 80.2 86.3 83.5 77.3 87.2 76.4 79.8 60.9 78.8
1991 Males CM
9.1 12.3 15.9 NA 13.1 15.7 17.2 16.8 NA NA 12.5 12.9 17.2 16.7 10.9 10.5 16.5 7.2 18.1 17.5 38.0 14.9
W 47.9 42.9 52.7 NA 29.5 45.5 62.8 42.9 NA NA 35.6 40.8 43.8 39.1 56.6 50.8 53.6 72.2 60.0 44.0 82.0 63.5
49.1 55.7 45.4 NA 65.9 52.7 36.5 56.0 NA NA 63.2 58.0 54.0 59.5 40.9 43.7 38.7 24.5 39.5 55.5 36.8 32.1
Females CM W 78.7 85.2 80.0 81.0 84.1 81.6 78.7 80.5 80.9 80.5 86.1 87.4 79.8 86.5 84.2 81.3 76.0 86.2 84.2 77.5 81.4 71.8
2001 Males CM 15.6 12.6 17.8 17.3 11.4 16.2 17.4 15.5 15.1 17.1 11.8 9.7 17.2 11.7 13.1 11.3 14.1 8.5 14.1 17.1 15.8 19.7
W 47.0 40.8 55.5 44.1 33.1 47.4 59.5 46.3 57.4 46.0 39.6 36.6 49.7 47.9 49.5 40.6 45.4 64.7 45.0 60.0 49.6 51.6
48.9 56.9 43.0 54.2 62.4 51.2 39.4 52.1 39.7 51.7 58.4 58.7 49.1 50.4 46.4 50.8 41.8 29.2 53.4 38.4 49.5 42.1
Females CM W 77.5 84.7 80.7 83.7 86.1 81.3 80.6 81.4 79.5 81.5 86.8 88.9 79.4 85.0 84.2 79.1 76.5 82.7 82.9 77.5 81.8 72.5
2011 Males CM 14.9 12.4 16.3 13.2 9.7 15.5 15.8 15.1 16.6 15.8 10.9 8.8 16.6 11.9 12.3 12.3 13.9 10.4 15.2 17.7 15.1 18.4
W
49.7 44.5 39.5 57.5 60.2 37.5 57.8 40.1 41.9 53.8 51.0 46.6 58.9 39.5 46.5 51.6 55.3 41.8 50.2 46.9 43.3 54.2 37.8 57.6 52.8 44.8 51.5 45.4 54.5 40.9 39.4 52.2 48.5 40.7 53.5 38.6 49.1 48.8 58.9 39.2 53.0 45.6 51.6 40.0 (continued)
Females CM W
2.5 Social and Economic Dimensions 81
Tamil Nadu Tripura Uttarakhand Uttar Pradesh West Bengal Union Territory Andaman & Nicobar Islands Chandigarh Dadra & Nagar Haveli Daman and Diu Delhi Lakshadweep Pondicherry All India Source: same as Table 2.17
Table 2.27 (continued)
20.5 11.4 NA 11.0 12.3
9.1
10.3 14.1 13.7 14.0 10.7 15.4 15.5
87.9
86.1 84.1 84.2 83.5 82.4 81.8 80.7
W
74.2 86.5 NA 83.4 85.1
1991 Males CM
63.3 43.8 32.0 54.5 34.2 30.1 44.2
47.9
55.0 38.8 NA 32.6 42.9
35.2 55.1 66.6 44.6 60.3 67.7 54.0
49.1
42.8 60.4 NA 65.1 55.7
Females CM W
83.8 84.3 85.2 81.6 82.7 88.1 82.1
85.0
83.5 86.6 79.9 75.8 85.7
2001 Males CM
12.7 13.3 12.3 15.9 13.8 9.3 15.0
11.2
14.1 11.2 17.0 20.0 10.1
W
57.4 45.2 35.4 51.6 31.7 40.8 47.3
47.7
41.8 39.1 45.8 56.8 37.5
40.4 52.5 62.1 46.6 62.7 55.9 50.7
50.1
55.3 59.0 52.6 41.3 59.8
Females CM W
79.6 83.2 85.2 81.5 86.3 85.3 82.1
83.1
84.6 85.1 80.2 75.8 85.7
2011 Males CM
17.8 13.4 10.8 15.5 11.3 12.1 14.6
12.4
13.7 12.7 15.5 19.2 10.8
W
45.8 46.1 39.1 52.7 38.5 36.9 49.6
45.2
42.0 37.4 46.2 57.7 39.9
51.6 50.8 57.4 44.9 56.5 59.8 47.8
51.9
55.6 60.5 51.4 39.4 57.2
Females CM W
82 2 The Demographics of Ageing
State Andhra Pradesh Arunachal Pradesh Assam Bihar Chhattisgarh Goa Gujarat Haryana Himachal Pradesh Jammu & Kashmir Jharkhand Karnataka Kerala Madhya Pradesh Maharashtra Manipur Meghalaya Mizoram Nagaland Odisha Punjab
67.2 NA 73.5 59.5 NA 67.4 57.5 NA 55.9 54.2 NA 64.9 70.3 59.2 64.7 73.6 NA NA 78.1 68.4 49.9
1961 Males CM 30.9 NA 25.1 37.7 NA 27.1 39.9 NA 38.4 42.1 NA 32.7 26.9 37.7 33.2 23.1 NA NA 16.4 29.4 42.7
W 8.2 NA 38.2 17.4 NA 13.3 15.1 NA 11.7 16.2 NA 9.8 11.8 13.4 10.2 22.9 NA NA 54.5 16.4 22.6
91.2 NA 60.4 82.1 NA 81.2 84.6 NA 87.1 82.6 NA 88.8 86.3 85.7 89.1 70.5 NA NA 42.0 82.8 77.1
Females CM W 70.9 55.9 75.8 66.6 NA 70.6 64.6 NA 60.8 60.0 NA 71.5 76.4 66.7 71.9 81.0 76.3 NA 84.0 71.6 57.7
1971 Males CM 27.2 38.8 22.5 31.4 NA 24.0 32.9 NA 35.0 37.2 NA 26.6 20.8 31.0 25.8 16.9 19.0 NA 12.7 26.6 34.3
W 10.0 31.0 19.5 22.1 NA 9.0 17.5 NA 16.0 20.3 NA 13.5 14.9 17.3 15.0 34.5 29.2 NA 54.1 20.6 33.4
Females CM
Table 2.28 Trends in marital status composition of elderly (70+) in India and states, 1961–2011
89.3 66.5 79.9 77.6 NA 85.7 82.1 NA 82.3 79.1 NA 85.7 83.2 82.4 84.3 62.9 66.5 NA 41.0 78.6 66.4
W 75.6 83 NA 70.6 NA 70.1 70.5 63.9 88.5 64.3 NA 75.1 77.9 69.4 75.4 80.2 77.7 65.6 85.3 71.8 62.8
1981 Males CM 22.8 12.6 NA 28.0 NA 21.0 27.6 32.8 29.3 33.2 NA 22.1 19.1 28.5 23.1 17.0 16.9 29.0 11.8 27.4 30.9
W
19.7 84.7 32.9 63.7 NA NA 26.9 72.7 NA NA 14.3 80.3 22.6 76.9 31.2 68.5 20.1 79.1 24.6 74.9 NA NA 16.0 83.3 16.7 80.7 21.5 77.7 18.5 80.8 36.8 60.0 28.7 66.4 27.1 67.3 60.5 37.0 18.4 81.2 36.6 62.9 (continued)
Females CM W
2.5 Social and Economic Dimensions 83
State Andhra Pradesh
Rajasthan Sikkim Tamil Nadu Tripura Uttarakhand Uttar Pradesh West Bengal Union Territory Andaman & Nicobar Islands Chandigarh Dadra & Nagar Haveli Daman and Diu Delhi Lakshadweep Pondicherry All India
Table 2.28 (continued)
17.7
Females CM W
W
79.7
NA 21.3 NA 20.2 15.3 4.9 14.8
NA 30.8 NA 39.0 41.4 33.0 36.1
21.8
76.8
NA 78.1 NA 79.5 80.4 93.6 84.4
87.1
NA 67.5 NA 57.7 51.0 65.1 60.5 1991 Males CM
10.6
39.7
84.9 55.2 89.2 87.2 NA 79.7 88.0
51.3
14.5 42.6 9.8 12.4 NA 19.7 11.1
40.9 16.9 32.4 27.7 NA 42.7 30.7
W
Females CM W
54.3 78.1 65.7 71.1 NA 52.0 67.3
1961 Males CM
86.4
68.9 68.8 NA 64.0 69.1 69.5 66.6 2001 Males CM
73.1
62.3 51.0 69.3 77.4 NA 58.8 71.6
1971 Males CM
12.0
W
25.3 30.5 NA 33.4 26.9 28.9 30.4
24.5
33.7 35.4 28.9 21.6 NA 36.7 26.3
W
60.4 84.5 NA 74.9 78.8 90.0 80.3
77.7
80.7 48.9 87.0 76.1 NA 72.6 81.3
W
41.6
56.8
Females CM W
39.2 15.0 NA 24.7 17.3 8.6 19.0
21.9
19.0 40.4 12.1 23.5 NA 27.0 17.8
Females CM
78.8
74.2 73.1 NA 68.9 70.6 72.9 70.5 2011 Males CM
78.0
67.7 59.7 72.4 80.4 NA 63.2 78.2
1981 Males CM
18.4
W
22.7 25.5 NA 28.6 25.6 25.1 27.2
19.5
29.5 35.8 26.4 18.1 NA 33.6 19.5
W
58.4 76.5 NA 71.1 82.9 85.2 77.6
71.3
79.2 61.2 84.4 77.0 NA 69.6 80.9
28.5 69.3 (continued)
Females CM W
41.0 22.5 NA 28.4 13.9 12.8 21.7
26.9
20.6 36.0 14.7 22.5 NA 30.0 18.5
Females CM W
84 2 The Demographics of Ageing
Arunachal Pradesh Assam Bihar Chhattisgarh Goa Gujarat Haryana Himachal Pradesh Jammu & Kashmir Jharkhand Karnataka Kerala Madhya Pradesh Maharashtra Manipur Meghalaya Mizoram Nagaland Odisha Punjab Rajasthan Sikkim
Table 2.28 (continued)
76.4 80.5 72.1 NA 73.5 70.3 72.2 72.4 NA NA 78.4 74.7 69.1 71.4 80.1 78.0 67.8 82.3 68.1 71.5 50.9 70.7
1991 Males CM 76.2 15.9 20.7 NA 19.7 22.4 24.0 23.9 NA NA 18.0 14.3 23.0 23.7 15.9 14.9 24.6 10.1 26.1 25.3 24.5 21.6
W 41.1 31.8 39.8 NA 18.8 30.1 43.1 27.5 NA NA 23.0 31.3 29.2 24.9 43.0 40.9 38.5 64.2 44.0 27.1 74.7 52.0
55.3 66.3 56.2 NA 75.3 66.8 55.9 71.2 NA NA 75.3 60.5 67.1 72.8 54.2 53.9 54.7 31.5 55.4 72.1 45.8 42.8
Females CM W 78.7 85.2 80.0 81.0 84.1 81.6 78.7 73.1 73.2 80.5 86.1 87.4 79.8 86.5 84.2 81.3 76.0 86.2 84.2 69.0 81.4 71.8
2001 Males CM 15.6 12.6 17.8 17.3 11.4 16.2 17.4 22.2 21.3 17.1 11.8 9.7 17.2 11.7 13.1 11.3 14.1 8.5 14.1 24.4 15.8 19.7
W 47.0 40.8 55.5 44.1 33.1 47.4 59.5 32.0 43.0 46.0 39.6 36.6 49.7 47.9 49.5 40.6 45.4 64.7 45.0 44.1 49.6 51.6
48.9 56.9 43.0 54.2 62.4 51.2 39.4 66.1 52.8 51.7 58.4 58.7 49.1 50.4 46.4 50.8 41.8 29.2 53.4 53.6 49.5 42.1
Females CM W 69.9 78.4 71.1 70.5 79.0 72.6 70.0 72.9 70.6 72.5 80.2 81.6 71.2 78.0 75.7 72.8 67.2 77.8 74.3 66.9 74.0 64.6
2011 Males CM 21.4 18.0 25.1 26.4 16.0 23.8 26.1 23.4 24.8 24.1 17.1 15.9 24.1 18.2 20.1 18.3 22.7 16.2 23.3 27.6 22.6 27.7
W
40.4 53.0 27 69.8 42.3 54.6 30.8 66.6 27.2 68.1 35.6 61.9 40.6 57.8 30.4 67.9 39.1 57.3 34.8 61.9 28.3 69.3 22.2 73.7 37.5 59.8 35.6 61.1 40.7 54.6 28.6 63.9 34.9 54.9 42.5 50.6 32.7 65.1 41.4 56.4 36.2 62.0 39.1 53.8 (continued)
Females CM W
2.5 Social and Economic Dimensions 85
Tamil Nadu Tripura Uttarakhand Uttar Pradesh West Bengal Union Territory Andaman & Nicobar Islands Chandigarh Dadra & Nagar Haveli Daman and Diu Delhi Lakshadweep Pondicherry All India Source: Same as Table 2.17
Table 2.28 (continued)
26.6 15.6 NA 14.9 15.9 11.9 16.9 21.1 21.6 22.0 19.2 21.4 21.4
80.1 78.5 76.2 75.9 74.7 70.4 75.5 72.2
W
65.3 81.4 NA 75.6 80.5
1991 Males CM
33.1 49.5 31.3 18.7 38.0 22.1 17.0 29.9
40.2 27.2 NA 20.7 31.8 61.0 48.3 67.0 80.0 60.5 72.7 80.4 67.2
55.0 71.9 NA 75.3 66.3
Females CM W
85.0 83.8 84.3 85.2 81.6 82.7 83.0 74.8
83.5 86.6 79.9 75.8 85.7
2001 Males CM
11.2 12.7 13.3 12.3 15.9 13.8 13.8 21.4
14.1 11.2 17.0 20.0 10.1
W
47.7 57.4 45.2 35.4 51.6 31.7 32.3 32.6
41.8 39.1 45.8 56.8 37.5 50.1 40.4 52.5 62.1 46.6 62.7 64.3 64.9
55.3 59.0 52.6 41.3 59.8
Females CM W
76.4 74.2 73.6 78.0 70.8 76.5 77.0 73.8
76.8 77.5 71.5 66.0 78.3
2011 Males CM
19.2 22.6 21.7 16.7 26.0 20.5 20.1 22.1
21.2 19.6 24.0 27.4 16.7
W
28.9 42.8 29.5 26.7 35.6 23.2 22.4 33.9
27.3 23.4 30.0 42.4 26.0
68.7 55.1 67.1 70.2 62.1 72.0 74.3 63.8
70.2 74.5 67.6 53.7 70.8
Females CM W
86 2 The Demographics of Ageing
73.7
NA
72.5
68.1
NA
74.5
67.6
NA
64.1
62.2
NA
71.8
79.4
68.5
73.4
81.0
NA
NA
79.7
76.2
58.2
Arunachal Pradesh
Assam
Bihar
Chhattisgarh
Goa
Gujarat
Haryana
Himachal Pradesh
Jammu & Kashmir
Jharkhand
Karnataka
Kerala
Madhya Pradesh
Maharashtra
Manipur
Meghalaya
Mizoram
Nagaland
Odisha
Punjab
33.4
22.0
13.5
NA
NA
16.3
24.9
28.3
17.7
25.7
NA
33.9
29.6
NA
30.0
20.4
NA
29.0
26.2
NA
24.3
36.9
23.3
59.1
NA
NA
33.0
18.1
21.1
24.0
17.0
NA
25.6
22.5
NA
26.1
20.9
NA
26.1
37.5
NA
16.9
62.8
75.9
37.0
NA
NA
62.1
81.3
77.8
73.4
81.9
NA
73.3
75.7
NA
73.6
73.4
NA
73.2
61.1
NA
82.4
49.3
68.4
78.2
NA
NA
74.0
65.2
59.3
70.3
64.5
NA
54.2
56.0
NA
57.3
67.9
NA
59.0
72.5
NA
67.1
CM
42.8
29.4
16.4
NA
NA
22.7
33.1
37.5
26.9
33.1
NA
42.2
38.2
NA
40.2
27.1
NA
38.0
26.2
NA
31.0
W
CM
CM
W
Males
Males
W
70+ (Rural) Females
60+ (Rural)
Andhra Pradesh
State
A. The 1961 census
23.4
16.5
55.0
NA
NA
24.0
10.2
13.7
12.3
9.7
NA
16.8
11.7
NA
16.4
13.2
NA
17.4
37.5
NA
8.4
CM
Females
76.2
82.7
41.4
NA
NA
70.4
89.3
85.3
85.9
89.3
NA
82.2
87.0
NA
83.3
81.3
NA
82.1
61.1
NA
91.0
W
64.3
74.2
77.1
NA
NA
80.3
72.3
68.3
79.4
74.6
NA
64.6
62.8
NA
69.3
73.0
NA
73.2
89.0
NA
75.9
CM
Males
30.7
20.5
14.8
NA
NA
17.43
24.0
28.9
17.2
23.2
NA
30.1
32.4
NA
27.4
19.4
NA
24.8
6.8
NA
22.3
W
60+ (Urban)
31.1
19.6
18.9
NA
NA
20.2
18.2
18.8
19.0
18.1
NA
19.8
20.5
NA
20.4
22.8
NA
25.5
47.0
NA
14.2
CM
Females
68.5
78.9
80.0
NA
NA
70.6
80.2
80.6
78.1
79.0
NA
78.3
78.5
NA
79.0
70.5
NA
73.4
50.5
NA
85.0
W
53.6
67.4
71.8
NA
NA
69.0
62.8
58.6
70.5
66.5
NA
54.4
52.8
NA
58.2
64.8
NA
64.7
89.0
NA
68.0
CM
Males
41.8
29.3
18.3
NA
NA
28.3
33.6
38.7
26.5
31.1
NA
40.9
43.3
NA
38.5
27.4
NA
33.2
6.8
NA
30.2
W
70+ (Urban)
81.7
85.2
85.5
NA
NA
71.9
88.2
88.4
88.9
87.0
NA
86.4
88.6
NA
88.7
80.1
NA
81.8
50.5
NA
92.3
W
(continued)
17.9
13.8
11.6
NA
NA
11.4
10.2
11.1
8.9
9.9
NA
10.8
10.6
NA
10.8
13.7
NA
17.3
47.0
NA
7.0
CM
Females
Table 2.29 Trends in composition of currently married and widowed by sex and place of residence among elderly in India, its states and union territories
2.5 Social and Economic Dimensions 87
83.0
74.0
78.6
NA
60.2
74.2
Sikkim
Tamil Nadu
Tripura
Uttarakhand
Uttar Pradesh
West Bengal
Andhra Pradesh
State
24.0
27.9
14.6 24.0
W
75.2
84.2
68.7
63.7
60.1
65.7
51.0
47.7
36.4
32.7
41.4
47.6
NA
77.3
20.8
W 20.9
78.2
70.8
CM
27.4
W
CM
All India
24.9
36.1
NA
30.8
NA
CM
74.2
68.6
Pondicherry
26.4
36.3
NA
67.5
NA
37.5
31.5
43.2
NA
27.7
32.0
16.7
41.3
Males
68.6
Lakshadweep
NA
69.9
NA
54.9
66.8
51.4
NA
71.1
66.1
78.5
53.7
70+ (Rural)
59.1
Delhi
NA
29.5
NA
77.1
82.6
69.1
NA
79.9
79.2
42.4
75.7
Females
NA
Daman and Diu
23.6
NA
20.7
16.6
30.3
NA
19.6
19.7
54.5
23.7
Males
74.6
Dadra & Nagar Haveli
24.4
23.9
34.2
NA
20.3
24.0
12.4
31.4
W
60+ (Rural)
NA
Chandigarh
B. The 1971 Census
68.2
Andaman & Nicobar Islands
Union Territory
63.6
CM
CM
CM
W
Males
Males
W
70+ (Rural) Females
60+ (Rural)
Rajasthan
A. The 1961 census
Table 2.29 (continued)
10.3
CM
Females
15.1
5.0
15.3
21.4
NA
21.3
NA
11.5
10.0
19.5
NA
12.4
10.4
43.1
14.5
CM
Females
89.1
W
84.2
94.2
80.4
78.3
NA
78.1
NA
85.8
89.3
79.9
NA
87.3
88.6
54.7
84.8
W
25.1
24.3
NA
26.7
NA
NA
NA
33.3
20.1
30.3
NA
19.8
23.6
22.1
28.8
W
79.3
CM
Males
18.7
W
60+ (Urban)
71.7
72.0
NA
70.3
NA
NA
NA
56.3
77.1
65.6
NA
79.0
74.3
69.8
67.8
CM
Males
60+ (Urban)
17.8
CM
Females
22.2
13.1
NA
30.6
NA
NA
NA
11.9
26.9
31.9
NA
16.0
16.6
24.7
25.0
CM
Females
81.4
W
76.5
83.9
NA
69.0
NA
NA
NA
88.1
71.4
67.3
NA
83.3
82.2
69.4
74.5
W
34.5
34.1
NA
37.5
NA
NA
NA
50.0
27.5
39.0
NA
28.0
33.7
33.3
38.8
W
71.9
CM
Males
26.0
W
70+ (Urban)
62.4
63.2
NA
59.3
NA
NA
NA
33.9
69.8
56.7
NA
70.7
64.3
55.6
57.7
CM
Males
70+ (Urban) Females
90.6
W
85.7
92.2
NA
79.6
NA
NA
NA
94.7
82.7
77.8
NA
86.1
91.3
85.7
85
W
(continued)
8.7
CM
Females
13.1
4.9
NA
20.0
NA
NA
NA
5.3
16.1
21.4
NA
13.0
7.7
14.3
14.6
CM
88 2 The Demographics of Ageing
87.1
65.8
71.6
57.8
77.1
Punjab
Rajasthan
Sikkim
Tamil Nadu
NA
Mizoram
79.3
82.0
Meghalaya
Odisha
86.3
Manipur
Nagaland
74.1
79.5
84.1
Kerala
Maharashtra
78.6
Madhya Pradesh
NA
NA
Haryana
Karnataka
74.6
Gujarat
Jharkhand
77.9
Goa
68.1
NA
Chhattisgarh
68.1
74.0
Bihar
Jammu & Kashmir
80.9
Assam
Himachal Pradesh
71.6
21.2
28.2
24.4
25.4
18.8
9.8
NA
13.3
11.9
18.6
23.5
13.1
19.6
NA
28.8
27.1
NA
23.0
16.9
NA
24.0
17.5
24.2
23.1
63.6
30.8
50.4
32.7
62.1
NA
41.0
47.4
26.0
28.9
28.1
22.5
NA
32.7
27.5
NA
32.5
18.3
NA
32.9
30.1
38.4
75.9
29.0
69.1
49.3
66.4
33.3
NA
53.8
50.1
73.4
70.6
69.1
76.6
NA
66.6
70.0
NA
67.1
76.7
NA
66.8
68.4
58.9
69.2
49.0
61.8
56.7
71.3
84.0
NA
76.0
81.6
72.2
66.8
76.2
71.1
NA
60.0
60.8
55.2
63.8
70.3
NA
66.1
75.7
55.9
CM
29.1
36.7
34.1
34.6
26.9
12.8
NA
19.4
16.5
25.8
30.9
21.1
27.0
NA
37.3
35.0
40.1
33.8
24.1
NA
31.8
22.7
38.7
W
CM
CM
W
Males
Males
W
70+ (Rural) Females
60+ (Rural)
Arunachal Pradesh
B. The 1971 Census
Table 2.29 (continued)
12.5
41.4
19.4
34.4
20.6
54
NA
29.3
36.8
15.4
17.6
15.5
13.4
NA
21.1
15.8
25.2
18.9
8.8
NA
22.0
19.5
30.9
CM
Females
86.6
47.5
80.4
65.4
78.5
41.4
NA
66.7
60.8
84.1
82.0
82.7
85.9
NA
78.4
82.5
74.7
80.8
86.0
NA
77.7
78.9
66.6
W
79.1
72.8
75.0
73.2
82.1
88.5
NA
82.3
83.4
79.6
74.7
84.4
80.4
NA
71.3
70.7
NA
77.4
78.8
NA
79.2
83.3
62.0
CM
Males
19.0
19.1
21.8
22.7
16.1
5.3
NA
55.9
13.8
17.6
23.0
11.7
17.4
NA
25.0
22.6
NA
19.7
15.6
NA
19.5
13.7
30.1
W
60+ (Urban)
21.0
39.4
29.2
44.4
28.6
54.2
NA
37.3
31.2
25.0
26.3
22.8
23.3
NA
26.6
33.8
NA
25.4
20.1
NA
33.9
27.9
50.0
CM
Females
77.8
57.7
70.4
55.4
70.8
37.7
NA
55.0
64.4
73.6
73.3
73.6
75.6
NA
72.6
39.4
NA
73.9
74.5
NA
65.8
70.8
44.4
W
69.7
72.6
64.7
63.4
74.6
85.6
NA
79.2
76.5
71.1
66.0
77.7
72.9
NA
60.0
61.3
63.1
66.8
72.0
NA
71.3
77.3
50.0
CM
Males
28.4
20.0
31.6
32.5
23.2
5.9
NA
15.2
19.9
26.0
31.5
18.9
25.0
NA
36.4
33.0
33.5
30.2
23.4
NA
27.2
20.2
47.1
W
70+ (Urban)
87.8
65.6
81.9
71.1
80.2
34.6
NA
65.6
74.7
85.1
84.6
85.4
84.9
NA
84.7
80.0
75.7
85.4
84.7
NA
75.8
79.6
50.0
W
(continued)
11.1
29.5
17.5
26.8
19.3
57.9
NA
28.4
21.3
13.7
15.0
12.1
14.1
NA
14.4
19.6
24.1
13.9
9.9
NA
24.0
19.6
43.3
CM
Females
2.5 Social and Economic Dimensions 89
NA
66.7
77.1
Uttarakhand
Uttar Pradesh
West Bengal
81.1
80.3
NA
Andhra Pradesh
Arunachal Pradesh
Assam
State
NA
16.2
17.3
NA
44.3
27.3 NA
53.4
72.1 NA
74.0
75.2
CM
NA
22.5
23.2
W
CM
W
CM
30.9
29.8
17.3
40.6
NA
30.5
26.8
24.0
28.6
36.7
NA
22.1
Males
66.1
69.2
79.3
56.2
NA
68.8
61.2
73.9
69.8
58.4
NA
77.0
70+ (Rural) W
68.7
79.6
65.4
50.3
NA
69.1
45.8
70.5
75.9
59.9
NA
66.9
Females
30.5
19.0
28.5
49.3
NA
30.1
53.9
28.7
23.3
39.7
NA
32.7
Males
23.0
20.7
17.3
29.4
NA
19.6
20.8
16.1
21.3
28.5
NA
16.0
W
60+ (Rural)
74.1
C. The 1981 census
All India
67.2
Delhi
79.3
NA
Daman and Diu
77.8
78.9
Dadra & Nagar Haveli
Pondicherry
65.9
Chandigarh
Lakshadweep
81.1
Andaman & Nicobar Islands
Union Territory
83.1
CM
CM
CM
W
Males
Males
W
70+ (Rural) Females
60+ (Rural)
Tripura
B. The 1971 Census
Table 2.29 (continued)
NA
34.0
14.6
CM
Females
19.5
9.5
28.5
35.3
NA
15.0
39.9
21.9
17.3
27.2
NA
24.4
CM
79.9
89.1
65.4
64.3
NA
84.5
60.1
77.9
82.1
72.3
NA
75.2
W
NA
64.2
84.8
W
Females
19.4
19.0
NA
22.0
NA
NA
15.8
15.9
13.4
25.6
NA
11.7
W
NA
83.9
83.6
CM
Males
NA
9.2
14.8
W
60+ (Urban)
77.8
78.0
NA
75.2
NA
NA
80.3
81.2
82.3
71.4
NA
86.3
CM
Males
60+ (Urban)
NA
48.9
25.1
CM
Females
27.6
17.7
NA
29.1
NA
NA
51.4
32.3
29.1
38.7
NA
25.3
CM
71.4
80.2
NA
61.7
NA
NA
47.9
66.9
69.4
60.9
NA
74.2
W
NA
48.5
74.1
W
Females
27.9
27.5
NA
32.3
NA
NA
24.9
27.6
19.1
34.9
NA
16.4
W
NA
75.2
77.5
CM
Males
NA
17.1
20.8
W
70+ (Urban)
69.3
69.9
NA
65.2
NA
NA
70.9
67.1
77.0
62.4
NA
82.2
CM
Males
70+ (Urban)
NA
58.5
84.3
W
82.4
91.1
NA
76.0
NA
NA
60.4
75.6
78.6
74.5
NA
84.8
W
(continued)
NA
37.8
15.0
CM
Females
16.7
7.5
NA
23.5
NA
NA
39.0
22.2
19.7
25.1
NA
14.5
CM
Females
90 2 The Demographics of Ageing
72.6
74.5
71.7
NA
Haryana
Himachal Pradesh
Jammu & Kashmir
Jharkhand
76.4
81.9
85.9
82.2
74.7
88.4
79.5
70.3
75.7
69.1
79.5
85.1
Madhya Pradesh
Maharashtra
Manipur
Meghalaya
Mizoram
Nagaland
Odisha
Punjab
Rajasthan
Sikkim
Tamil Nadu
Tripura
81.9
78.1
Gujarat
85.5
79.5
Goa
Kerala
NA
Chhattisgargh
Karnataka
78.4
13.5
19.2
26.0
21.4
22.5
19.5
8.8
20.0
12.5
11.8
16.9
21.3
11.6
16.6
NA
25.6
21.5
23.5
20.2
15.4
NA
20.3
34.4
27.9
48.1
35.4
53.7
29.8
68.3
41.3
39.7
48.9
31.7
35.1
31.3
27.3
NA
39.2
34.7
50.3
39.2
23.6
NA
40.5
65.0
71.2
48.5
64.4
45.9
69.7
29.0
52.5
54.9
48.4
67.7
64.1
65.1
72.1
NA
60.1
64.3
49.5
60.3
71.9
NA
59.2
80.5
71.9
59.4
67.2
61.7
71.9
85.2
65.7
78.2
80.2
75.2
69.4
78.0
75.7
NA
64.0
67.2
62.8
69.6
72.4
NA
70.2
CM
18.1
26.9
36.2
30.0
31.4
27.3
12.0
28.8
16.6
17.0
23.6
28.5
19.2
22.8
NA
33.6
29.3
33.7
28.7
21.9
NA
28.4
W
CM
CM
W
Males
Males
W
70+ (Rural)
Females
60+ (Rural)
Bihar
C. The 1981 census
Table 2.29 (continued)
23.3
15.1
36.1
20.4
85.0
18.4
60.4
27.6
28.9
36.8
18.5
22.1
17.7
15.6
NA
25.0
20.1
32.0
23.8
13.9
NA
27.1
CM
Females
76.1
84.1
61.3
79.3
14.0
81.2
37.0
67.1
66.4
59.6
81.1
77.2
80.0
83.9
NA
74.4
79.1
67.7
75.8
81.1
NA
72.6
W
84.7
81.9
73.4
78.9
76.9
79.4
91.8
75.0
81.0
84.3
83.5
78.1
84.7
82.3
NA
75.4
65.9
78.3
81.2
81.7
NA
82.1
CM
Males
12.7
16.5
20.3
18.6
19.8
19.8
5.1
19.2
12.1
13.0
14.0
19.8
10.8
13.9
NA
21.3
17.8
19.6
16.4
12.5
NA
16.7
W
60+ (Urban)
26.3
25.5
44.7
34.3
48.2
20.9
65.5
36.1
36.7
38.9
31.0
31.7
24.7
28.0
NA
35.6
37.0
44.8
32.8
25.7
NA
39.2
CM
Females
73.2
73.1
52.2
65.3
51.3
69.7
28.3
55.3
56.1
57.1
67.7
67.7
70.6
70.9
NA
63.8
61.5
54.7
66.5
68.5
NA
60.3
W
79.3
73.6
61.9
69.8
67.1
71.7
89.4
64.9
74.6
77.2
75.7
699.6
77.2
73.2
NA
66.0
68.2
69.0
72.9
74.8
NA
74.4
CM
Males
18.7
25.0
32.0
27.4
29.2
27.5
6.9
29.9
18.7
19.5
21.7
28.2
18.6
19.8
NA
31.0
26.6
29.0
24.5
18.9
NA
24.3
W
70+ (Urban) Females
84.4
84.9
61.5
78.6
66.6
81.3
37.1
68.1
66.4
70.2
80.4
80.4
83.8
81.7
NA
77.4
75.1
71.3
79.7
78.2
NA
73.6
W
(continued)
15.1
13.9
35.5
21.0
32.8
18.4
60.6
25.1
27.6
26.1
18.4
19.0
12.6
17.2
NA
21.8
23.7
28.2
19.6
15.3
NA
25.9
CM
2.5 Social and Economic Dimensions 91
70.8
83.4
Uttar Pradesh
West Bengal
84.8
83.2
84.8
80
NA
Andhra Pradesh
Arunachal Pradesh
Assam
Bihar
Chhattisgargh
State
20.2
35.5
24.0
W
63.8
74.6
71.8
49.1
69.9
72.4
70.1
61.8
NA
16.1
12.7
12.0
13.2
W
NA
52.9
43.1
52.4
35.9
NA
45.3
55.6
44.9
62.9
NA
72.0
80.4
76.5
79.4
CM
27.8
26.3
7.8
34.7
NA
25.6
23.9
20.8
20.9
34.2
NA
W
NA
21.0
16.3
16.5
18.2
W
CM
77.5
All India
18.5
24.5
50.5
NA
CM
79.9
Pondicherry
16.5
23.4
NA
73.0
63.0
Males
78.7
Lakshadweep
NA
62.5
40.2
77.0
77.2
62.5
NA
70+ (Rural)
73.3
Delhi
NA
36.6
68.4
61.5
73.9
54.6
NA
Females
NA
Daman and Diu
16.2
18.0
37
25.5
45.1
NA
Males
82.7
Dadra & Nagar Haveli
14.6
14.8
25.9
NA
60+ (Rural)
69.2
Chandigarh
D. The 1991 census
82.3
Andaman & Nicobar Islands
Union Territory
NA
CM
CM
CM
W
Males
Males
W
70+ (Rural)
Females
60+ (Rural)
Uttarakhand
C. The 1981 census
Table 2.29 (continued)
NA
40.1
31.9
41.0
21.2
CM
Females
22.2
11.7
26.4
33.6
NA
23.3
45.4
25.0
18.6
30.3
NA
CM
77.2
86.9
88.0
66.1
NA
75.9
53.7
72.6
80.9
69.3
NA
W
NA
56.0
66.2
55.5
77.4
W
Females
16.3
16.8
18.1
17.8
NA
13.3
14.3
10.0
10.4
21.4
NA
W
NA
81.8
87.2
85.3
86.6
CM
Males
NA
13.3
9.0
6.9
11.0
W
60+ (Urban)
81.2
80.3
78.8
79.9
NA
85.9
83.3
85.8
85.7
75.7
NA
CM
Males
60+ (Urban)
NA
50.9
41.8
52.5
34.9
CM
NA
46.6
56.5
44.5
63.6
W
66.5
73.0
64.8
56.6
NA
59.0
44.6
54.8
69.7
56.9
NA
W
Females
32.4
24.3
31.5
42.8
NA
36.1
54.6
43.7
29.4
42.5
NA
CM
Females
24.2
24.0
24.9
28.0
NA
23.3
25.5
12.6
15.9
29.9
NA
W
NA
72.4
81.9
74.9
80.7
CM
Males
NA
18.0
13.0
9.0
15.8
W
70+ (Urban)
73.3
73.3
71.1
69.6
NA
74.4
73.1
83.0
80.6
67.0
NA
CM
Males
70+ (Urban) Females
NA
57.2
67.5
51.5
74.5
W
79.0
83.9
78.4
71.5
NA
86.5
76.5
63.7
81.2
71.0
NA
W
(continued)
NA
37.6
30.6
43.1
23.9
CM
Females
20.0
13.7
19.2
28.0
NA
10.8
22.5
32.9
18.1
28.3
NA
CM
92 2 The Demographics of Ageing
77.7
84.9
86.7
83.0
77.9
87.7
80.1
74.8
79.4
Madhya Pradesh
Maharashtra
Manipur
Meghalaya
Mizoram
Nagaland
Odisha
Punjab
Rajasthan
86.5
NA
73.7
82.8
Tripura
Uttarakhand
Uttar Pradesh
West Bengal
78.3
87.5
Kerala
61.0
84.9
Karnataka
Tamil Nadu
NA
Jharkhand
Sikkim
79.3
NA
78.5
Haryana
Jammu & Kashmir
79
Gujarat
Himachal Pradesh
80.4
11.8
21.0
NA
11.5
38.3
15.5
17.8
18.9
16.9
7.5
16.6
11.2
10.4
13.3
17.6
8.9
13.0
NA
NA
17.0
17.9
17.0
14.2
30.8
35.3
NA
40.5
81.3
63.2
43.9
60.2
39.2
72.7
54.9
50.3
58.0
40.7
44.2
39.5
35.1
NA
NA
42.8
64.3
45.8
28.4
66.9
42.6
NA
58.6
36.8
32.4
55.5
39.4
59.4
24.4
38.7
44.5
39.7
58.5
53.6
56.3
63.9
NA
NA
56.1
35.1
52.5
67.1
74.4
64.9
NA
81.5
51.3
70.2
71.3
66.7
71.2
83.4
69.6
77.7
81.0
77.0
69.1
80.5
78.5
NA
NA
72.4
71.4
69.2
72.6
CM
15.7
27.1
NA
15.7
24.5
22.4
25.6
26.9
25.0
10.4
24.4
15.7
15.1
15.0
23.4
14.9
18.3
NA
NA
24.0
24.7
23.7
21.0
W
CM
CM
W
Males
Males
W
70+ (Rural)
Females
60+ (Rural)
Goa
D. The 1991 census
Table 2.29 (continued)
19.1
40.4
NA
28.8
74.0
51.2
26.5
43.8
24.9
64.8
38.9
40.2
43.2
31.6
29.5
25.3
22.5
NA
NA
27.4
43.8
29.8
17.4
CM
Females
76.6
55.0
NA
70.3
45.3
43.9
72.5
55.7
72.9
31.7
54.9
55.0
54.0
62.8
67.0
70.6
76.0
NA
NA
71.4
55.3
67.1
76.7
W
84.7
77.5
NA
86.4
60.7
86.7
81.6
81.9
81.6
81.4
76.4
85.8
85.3
84.4
79.1
87.7
85.7
NA
NA
81.4
83.1
82.7
82.7
CM
Males
9.0
17.6
NA
10.7
37.4
5.5
15.9
15.3
14.4
3.8
16.3
6.7
11.9
12.1
15.3
7.8
11.2
NA
NA
13.8
14.5
12.8
11.3
W
60+ (Urban)
37.2
53.4
NA
29.8
83.7
68.2
44.0
59.5
37.8
63.5
51.9
53.2
53.7
41.1
42.0
33.8
36.8
NA
NA
44.0
57.5
44.9
31.5
CM
Females
60.4
43.9
NA
69.2
37.0
26.3
55.2
39.8
60.0
25.6
38.8
40.0
43.4
56.9
55.5
60.8
61.4
NA
NA
54.4
41.6
53.0
63.6
W
78.3
68.0
NA
81.1
50.2
81.0
72.4
73.3
73.1
68.4
65.2
80.0
77.9
70.0
68.9
80.8
78.3
NA
NA
72.5
75.9
73.0
75.0
CM
Males
13.1
23.9
NA
15.4
24.4
7.6
24.2
23.4
20.3
5.3
24.8
10.3
17.9
12.9
21.1
13.4
17.1
NA
NA
22.1
20.9
19.1
17.5
W
70+ (Urban) Females
72.4
55.4
NA
80.0
46.8
27.2
70.9
54.4
71.5
27.6
54.3
49.0
54.6
55.5
67.7
74.4
73.0
NA
NA
68.7
58.2
65.9
72.8
W
(continued)
24.1
39.0
NA
18.9
76.2
63.6
27.9
44.7
25.0
54.6
37.8
44.3
42.6
30.8
27.7
20.4
24.7
NA
NA
29.3
40.5
30.7
21.2
CM
2.5 Social and Economic Dimensions 93
77.4
84.0
85.6
80
83.5
82.0
80.1
Chandigarh
Dadra & Nagar Haveli
Daman and Diu
Delhi
Lakshadweep
Pondicherry
All India
W
85.9
86.0
86.3
71.0
NA
82.4
84.8
79.7
Arunachal Pradesh
Assam
Bihar
Chhattisgarh
Goa
Gujarat
Haryana
17.9
12.5
13.6
NA
20.4
10.6
8.8
12.3
53.4
37.6
29.8
NA
51.6
36.3
65.8
39.4
45.3
60.2
64.5
NA
42.2
61.5
28.2
59.0
69.8
72.6
75.0
72.8
71.6
79.9
70.7
81.0
CM
25.4
25.0
20.0
25.2
25.0
17.6
22.6
17.1
W
CM
CM
W
Males
22.0
23.4
21.0
21.5
20.0
21.5
20.5
12.6
70+ (Rural)
72.2
74.8
69.2
71.0
77.9
76.0
70.5
78.7
Females
53.7
69.3
64.7
42.3
62.1
55.7
38.9
50.0
Males
44.6
29.7
29.0
57.1
37.0
43.3
60.8
46.7
W
60+ (Rural)
16.2
16.4
9.7
17.4
12.9
14.3
13.1
10.0
Andhra Pradesh
State
E. 2001 census
84.7
CM
CM
CM
W
Males
Males
W
70+ (Rural)
Females
60+ (Rural)
Andaman & Nicobar Islands
Union Territory
D. The 1991 census
Table 2.29 (continued)
44.2
32.2
18.7
30.7
42.0
29.8
36.5
27.1
CM
54.5
66.4
76.4
67.6
55.5
67.6
58.5
71.3
W
67.0
83.3
78.9
67.7
76.9
67.7
46.7
62.6
W
Females
30.2
15.4
15.4
30.9
22.6
30.9
53.1
30.4
CM
Females
13.0
14.9
11.2
13.7
14.4
12.2
10.1
5.5
W
80.9
82.8
85.0
NA
81.5
88.0
84.8
87.8
CM
Males
15.9
14.6
9.8
NA
16.2
9.0
9.8
10.1
W
60+ (Urban)
83.0
81.6
81.6
83.9
83.0
85.4
86.9
90.5
CM
Males
60+ (Urban)
54.6
45.6
35.3
NA
51.5
39.6
41.7
41.7
CM
43.8
52.2
59.4
NA
46.8
57.7
52.1
56.0
W
55.3
66.9
57.3
44.8
70.0
46.8
35.0
45.4
W
Females
42.5
30.3
37.9
54.2
28.1
50.5
63.5
53.2
CM
Females
19.0
20.3
18.3
16.9
22.7
16.9
16.5
8.5
W
71.7
73.6
76.9
73.7
72.1
82.3
78.1
81.3
CM
Males
23.8
23.0
16.4
22.4
23.9
13.9
13.5
15.1
W
70+ (Urban)
74.8
75.9
70.9
78.5
74.4
78.5
79.3
86.3
CM
Males
70+ (Urban) Females
59.9
68.5
71.6
68.8
61.3
69.7
60.4
67.2
(continued)
37.7
29.0
22.3
28.4
35.7
27.2
33.0
29.7
CM
W
68.0
79.2
69.0
58.3
81.9
58.3
48.4
54.5
W
Females
28.8
17.7
26.1
36.1
16.3
36.1
49.3
44.1
CM
94 2 The Demographics of Ageing
80.4
79.7
NA
83.3
83.1
81.0
86.0
74.7
84.8
86.2
84.8
80.5
76.6
81.0
78.2
82.6
81.2
NA
75.3
80.0
Jammu & Kashmir
Jharkhand
Karnataka
Kerala
Madhya Pradesh
Maharashtra
Manipur
Meghalaya
Mizoram
Nagaland
Odisha
Punjab
Rajasthan
Sikkim
Tamil Nadu
Tripura
Uttarakhand
Uttar Pradesh
West Bengal
17.8
20.5
NA
11.4
15.3
16.1
16.2
17.3
17.9
12.3
11.8
13.1
14.9
12.5
17.0
14.7
12.7
NA
16.4
15.7
45.8
57.8
NA
41.2
33.2
47.5
49.7
61.4
44.3
52.3
40.2
41.0
46.8
41.6
48.2
41.6
31.4
NA
57.2
46.2
52.0
40.5
NA
50.1
65.1
48.6
49.5
37.2
54.2
43.6
57.9
56.8
40.3
57.1
50.6
55.9
64.7
NA
39.8
52.3
80.5
67.5
72.3
81.0
76.3
62.0
73.7
68.6
77.3
79.7
63.9
75.5
77.9
81.1
72.1
80.4
79.6
72.7
72.2
73.1
CM
14.8
27.5
24.7
16.6
20.7
28.1
22.9
24.5
20.5
13.1
22.9
16.0
18.4
17.1
24.4
16.6
17.9
23.7
22.6
22.4
W
CM
CM
W
Males
Males
W
70+ (Rural) Females
60+ (Rural)
Himachal Pradesh
E. 2001 census
Table 2.29 (continued)
25.6
43.4
30.6
27.8
28.6
38.3
33.0
45.3
30.4
57.3
31.9
30.8
37.6
29.8
35.2
23.6
25.9
35.1
42.9
32.0
CM
Females
71.4
54.0
67.7
70.1
68.3
55.8
65.9
52.7
67.8
35.2
53.8
60.5
57.7
68.6
63.4
72.5
72.2
61.6
53.0
66.2
W
84.5
78.5
NA
88.6
84.1
81.7
83.1
79.9
86.0
87.9
77.5
81.9
82.7
85.6
81.9
87.5
86.5
NA
85.0
81.8
CM
Males
9.3
17.4
NA
8.9
13.2
12.1
14.2
16.4
11.3
5.7
13.2
10.7
15.0
11.8
15.3
9.1
10.8
NA
10.9
12.5
W
60+ (Urban)
40.2
52.1
NA
34.4
42.3
51.5
49.1
56.6
44.3
53.4
44.0
38.0
43.2
43.7
46.6
33.2
40.0
NA
57.9
47.9
CM
Females
56.0
45.1
NA
63.6
54.4
41.5
49.3
41.4
53.3
38.3
43.4
53.6
52.6
53.9
51.7
61.1
57.2
NA
39.2
49.0
W
78.2
69.3
70.2
83.4
76.2
73.7
74.4
70.3
79.0
82.0
67.1
75.0
74.3
77.7
73.5
80.1
78.8
72.5
76.6
71.9
CM
Males
13.4
24.9
23.8
13.4
19.7
18.2
21.6
24.1
17.0
8.2
21.5
16.0
22.7
18.8
22.8
15.9
17.2
22.0
16.4
19.9
W
70+ (Urban)
67.2
58.3
64.3
77.5
66.1
49.5
65.4
56.0
66.3
47.3
56.2
63.6
68.0
69.6
67.4
75.3
69.6
61.8
52.1
63.7
W
(continued)
28.2
37.5
32.5
20.8
29.9
41.2
32.3
40.9
30.5
40.7
30.8
27.9
28.0
27.6
30.5
19.3
27.0
33.8
43.0
32.1
CM
Females
2.5 Social and Economic Dimensions 95
85.1
77.3
84.3
80.6
79.0
85.2
80.7
79.9
Andhra Pradesh
Arunachal Pradesh
Assam
Bihar
Chhattisgargh
Goa
Gujarat
Haryana
State
W
50.1
74.6
75.4 21.9
21.7
21.8
26.5
16.4
16.6
11.0
18.6
16.5
13.0
15.5
13.0
W
59.6
51.0
38.7
46.1
60.7
39.6
50.3
43.4
39.1
47.2
57.6
51.6
37.1
57.5
44.5
54.8
69.3
72.4
77.9
70.1
71.0
78.1
69.9
78.8
CM
26.6
24.6
17.6
27.2
25.3
18.5
22.3
19.0
W
CM
48.2
49.2
71.5
70.1
20.8 21.0
CM
15.6
48.8
57.8
42.5
76.1 73.7
16.5 17.5
Males
All India
12.0
37.8
55.9
48.8 53.5
79.2 69.4
70+ (Rural)
81.6
Pondicherry
9.9
17.9
49.9 44.0
49.2 38.0
Females
83.8
Lakshadweep
11.6
14.0
48.8 60.3
Males
87.4
Delhi
12.0
12.3
W
60+ (Rural)
79.8
Daman and Diu
F. 2011 census
87.0
83.6
Dadra & Nagar Haveli
83.8
78.1
Chandigarh
CM
CM
CM
W
Males
Males
W
70+ (Rural) Females
60+ (Rural)
Andaman & Nicobar Islands
Union Territory
E. 2001 census
Table 2.29 (continued)
41.2
35.6
24.2
31.1
42.8
27.3
40.7
27.1
CM
Females
33.4
20.4
15.3
37.3
24.7
29.1
51.2
33.1
CM
Females
57.5
62.6
71.8
66.6
54.2
69.5
53.4
71.1
W
64.4
78.0
78.6
60.9
72.8
67.1
46.3
64.3
W
13.1
13.0
14.0
15.8
12.1
10.2
12.7
8.5
W
82.2
82.2
86.8
81.7
81.5
86.9
79.5
86.2
CM
Males
14.7
14.1
8.9
14.8
15.1
9.5
10.1
10.7
W
60+ (Urban)
83.7
83.2
82.9
81.7
85.5
87.0
84.2
88.6
CM
Males
60+ (Urban)
57.5
51.0
44.2
44.8
56.1
38.9
44.5
44.1
CM
Females
44.8
31.9
33.8
51.5
33.5
51.2
57.3
44.7
CM
Females
40.4
45.7
51.1
51.5
40.7
57.6
44.7
52.7
W
52.4
63.9
60.8
46.7
63.7
46.7
40.6
52.8
W
19.8
20.3
24.4
24.6
21.4
16.8
19.6
14.5
W
71.5
72.9
79.7
72.1
71.4
80.5
70.2
78.8
CM
Males
24.9
22.5
14.9
23.6
24.1
15.2
14.1
16.8
W
70+ (Urban)
75.5
75.0
72.2
72.0
75.5
78.0
75.6
82.2
CM
Males
70+ (Urban)
58.3
60.8
65.5
66.6
57.0
71.4
49.3
64.4
W
66.2
76.6
74.9
62.3
77.6
59.0
54.0
65.7
W
(continued)
39.3
35.7
29.2
29.8
38.8
25.3
37.6
32.0
CM
Females
30.3
19
20.7
35.4
19.8
38.8
42.9
31.6
CM
Females
96 2 The Demographics of Ageing
84.7
78.9
74.7
82.4
82.6
76.4
81.3
71.4
83.7
84.1
80.1
75.2
86.5
Manipur
Meghalaya
Mizoram
Nagaland
Odisha
Punjab
Rajasthan
Sikkim
Tamil Nadu
Tripura
Uttarakhand
Uttar Pradesh
West Bengal
88.4
Kerala
78.7
86.9
Karnataka
85.5
81.3
Jharkhand
Maharashtra
78.1
Jammu & Kashmir
Madhya Pradesh
81.2
10.9
19.9
16.1
13.7
14.7
19.4
15.5
18.1
15.6
11.1
14.7
12.5
11.7
12.0
17.4
9.4
11.3
16.2
18.0
15.3
38.7
58.5
45.1
39.2
40.8
52.6
52.8
60.0
49.2
55.1
49.9
41.1
57.3
52.8
53.7
39.1
42.4
50.0
55.1
46.2
59.0
38.9
52.8
58.8
57.1
39.1
46.0
38.3
48.8
37.14
39.7
50.9
38.2
44.7
44.2
56.7
55.6
47.3
42.0
52.0
79.0
65.7
71.7
76.8
76.2
63.7
73.9
66.2
74.0
77.5
64.6
72.7
76.5
79.1
70.9
80.9
80.4
72.6
69.1
72.8
CM
17.0
28.2
24.5
20.4
22.0
28.5
22.7
27.7
23.8
16.8
23.6
18.4
19.0
17.8
24.6
16.7
17.4
24.3
26.4
23.6
W
CM
CM
W
Males
Males
W
70+ (Rural) Females
60+ (Rural)
Himachal Pradesh
F. 2011 census
Table 2.29 (continued)
24.7
42.8
29.0
25.5
25.9
39.7
36.3
42.2
32.7
44.2
35.6
30.4
44.0
35.9
38.4
24.0
26.5
34.9
39
30.1
CM
Females
72.7
53.8
69.1
72.4
72.0
53.3
62.4
55.8
65.3
49.4
54.4
62.3
51.2
61.4
59.3
72.4
71.7
62.2
57.6
68.2
W
84.3
78.1
80.4
87.5
85.5
77.5
83.3
79.8
84.5
84.1
78.3
80.3
83.3
84.2
81.2
89.5
86.8
82.3
83.0
83.3
CM
Males
10.6
16.2
13.9
10.1
12.5
14.2
13.8
16.9
12.9
8.0
13.1
11.3
13.4
11.7
14.6
8.1
10.1
14.3
13.1
12.2
W
60+ (Urban)
42.1
54.4
49.8
33.0
43.3
47.5
53.5
56.5
48.3
47.6
47.4
33.4
49.3
49.3
50.4
36.3
45.2
51.0
55.6
50.2
CM
Females
54.0
41.4
46.7
64.6
53.8
43.8
44.4
41.3
48.8
43.0
41.6
56.8
45.8
46.7
46.3
58.7
51.2
45.4
41.5
46.4
W
77.2
67.4
70.8
79.6
77.5
69.5
74.1
68.6
75.8
79.3
69.5
73.1
74.2
76.0
72.0
82.4
79.7
72.0
74.5
74.4
CM
Males
16.2
24.0
22.4
17.3
20.2
23.1
22.1
27.3
20.8
13.3
21.9
17.9
22.4
18.8
22.5
14.9
16.5
23.4
20.5
20.4
W
70+ (Urban) Females
67.6
53.6
62.9
79.5
68.4
55.7
60.7
57.7
63.9
56
55.3
68.9
60.3
60.6
61.3
75.2
64.2
61.2
56.8
63.1
W
(continued)
28.3
40.5
33.3
18.6
28.7
36.6
37.0
39.6
33.0
35.3
34.4
23.1
35.1
35.1
34.9
20.2
32.2
34.6
39.5
33.9
CM
2.5 Social and Economic Dimensions 97
76.9
82.6
84.4
79.5
83.6
84.7
81.5
Chandigarh
Dadra & Nagar Haveli
Daman and Diu
Delhi
Lakshadweep
Pondicherry
All India
Source: Same as Table 2.17
81.4
15.4
13.4
14.4
16.6
13.1
13.8
15.1
13.6
50.4
35.5
37.5
54.6
37.8
44.1
53.2
45.2
47.7
62.5
60.1
43.4
59.7
52.7
45.8
52.0
73.4
77.3
72.1
67.5
76.2
74.0
67.5
74.9
CM
22.9
20.5
24.6
28.8
21.8
21.5
23.7
20.7
W
CM
CM
W
Males
Males
W
70+ (Rural) Females
60+ (Rural)
Andaman & Nicobar Islands
Union Territory
F. 2011 census
Table 2.29 (continued)
34.3
21.4
21.5
36.3
23.4
26.8
35.1
27.9
CM
Females
63.2
76.6
76.2
61.9
74.3
70
63.1
70.0
W
83.6
85.5
87.0
81.5
85.6
84.0
83.8
87.0
CM
Males
12.7
11.6
10.4
15.5
9.8
13.0
13.2
9.5
W
60+ (Urban)
47.7
37.5
38.7
52.6
39.7
49.7
57.8
45.1
CM
Females
48.8
58.6
55.7
45.0
56.3
47.3
40.0
51.8
W
75.0
76.8
77.6
70.9
78.8
73.2
74.3
80.5
CM
Males
20.3
19.9
19.4
26.0
14.6
22.0
22.6
15.0
W
70+ (Urban) Females
32.7
22.8
23.6
35.6
28.3
33.7
42.9
31.3
CM
63.4
73.3
71.1
62.1
68.3
62.5
55.0
65.5
W
98 2 The Demographics of Ageing
2.5 Social and Economic Dimensions
99
character, accompanied by minimal participation in wage and salaried employment that mandates compulsory retirement age, allow the elderly in India to work for as long as they are able to, albeit at a reduced pace. Table 2.30 gives the work participation rate among the elderly in India by sex and the state of residence from 1961–2011. The analysis of the work participation rates among senior persons showed a gradual decline over the period 1961–1991. However, there was a marginal improvement in the overall work participation rates during the decade 1991–2001. But during 2001–2011, a notable decline occurred in the total work participation rates. In fact, the work participation rates among the elderly in 2011 were higher than those in 1991. There was a hike in the work participation rates of both males and females; however, the rise was more for the female elderly. Further, the increase in work participation rates took place both in the rural and urban areas. It is highly plausible that such augmentation in the work participation rates of the elderly as seen in the period 1991–2001 could, to a certain extent, be distress-driven in the agricultural sector (Abraham 2009; Gulati and Rajan 1999). It should be noted here that while it is evident that more elderly men participate in economic activities, definitional problems in the census related to women’s work underestimate the true participation rates seen among women (Gulati and Rajan 1997).
2.5.4
Living Arrangements
The traditional Indian family structure provided the environment required for the comfortable life of the elderly. The joint family usually consisted of two generations wherein the elderly used to have a well-respected status that differentiated them from other members of the household. However, with the rising prominence of nuclear families, the elderly have been deprived of a familial support structure (Rajan and Kumar 2003). In these circumstances, the present living arrangements of the elderly have to be examined. Tables 2.31, 2.32, and 2.33 give the household composition of the elderly in India in rural, urban and total contexts, respectively. Tables 2.34 and 2.35 depict the distribution of elderly households in India according to state, residence and sex. The living arrangement is generally understood in terms of the family type in which the elderly live, whether senior persons are treated as household heads, the place of residence (rural or urban) and the people with whom they stay, the kind of relationships they keep with their kith and kin, and on the whole, the extent to which they adjust to the changing family structure (Bengtson 2001; Cherlin and Furstenberg 1986; Henwood 1993; Ibrahim et al. 2013; Jendrek 1994). Various survey findings emphasize the deteriorating status of the elderly in the prevalent Indian family structure. D’Souza (1989) observes that alterations in living arrangements, family structure and sudden retirement adversely affect people and that the elderly are in increasing proportions losing the status and security which they enjoyed in the traditional Indian family. With regard to the transformation in the Indian family system, Drèze (1990) sees a considerable overlap between the
Gujarat
Goa
Chhattisgarh
Bihar
Assam
Arunachal Pradesh
Andhra Pradesh
State
66.3
17.1
Males
Females
32.2
Females
40.3
72.1
Males
Total
48.3
NA
Females
Total
NA
NA
Total
23.1
Females
Males
82.3
Males
21.5
Females
50.3
74.9
Males
Total
51.8
NA
Females
Total
NA
Males
31.3
Females
NA
77.8
Males
Total
54.2
Total
20.0
70.9
44.3
33.8
73.4
49.8
NA
NA
NA
23.8
83.4
51.0
22.4
75.8
52.7
NA
NA
NA
33.3
80.4
56.7
7.9
50.9
27.6
21.0
64.0
39.0
NA
NA
NA
12.7
67.7
39.9
8.5
61.5
37.9
NA
NA
NA
18.1
6.3
38.6
7.8
68.2
37.3
12.0
51.9
26.0
NA
NA
NA
8.7
82.2
45.3
3.4
71.8
42.5
41.9
68.5
55.5
18.9
73.2
45.9
1971 Total
Urban
Total
Rural
1961
8.8
73.8
40.8
13.1
53.5
29.9
NA
NA
NA
9.0
83.8
46.1
3.5
73.0
43.3
42.3
68.5
55.2
20.4
75.9
48.1
Rural
4.8
51.3
27
7.7
46.6
25.3
NA
NA
NA
5.4
65.0
36.6
2.7
56.8
32.8
5.6
68.1
40.4
11.0
57.4
32.9
Urban
11.4
56.4
32.9
14.1
44.7
27.4
NA
NA
NA
10.1
70.8
41.2
NA
NA
NA
48.4
74.9
62.7
24.7
68.5
46.3
Total
1981
14.0
61.2
36.7
15.5
46.3
28.7
NA
NA
NA
10.6
72.4
42.2
NA
NA
NA
49.1
75.3
63.2
28.1
71.8
49.9
Rural
4.7
43.3
22.8
10.5
40.6
23.9
NA
NA
NA
5.0
55.0
30.8
NA
NA
NA
8.6
57.9
36.9
10.4
52.1
29.9
Urban
14.3
49.6
31.4
10.8
41.4
24.0
NA
NA
NA
12.1
67.6
42.4
14.2
64.1
41.7
46.5
74.9
62.0
24.2
62.1
43.4
Total
1991
18.6
55.5
36.4
12.6
43.5
25.8
NA
NA
NA
12.9
69.4
43.7
15.5
65.8
43.3
48.2
75.6
63.2
28.4
67.5
48.0
Rural
4.1
35.9
19.5
7.5
37.7
20.8
NA
NA
NA
4.7
51.5
30.4
3.1
48.5
28.0
7.2
59.4
37.4
9.6
44.5
26.0
Urban
Table 2.30 Work participation rate (in percentage) among elderly by sex and place of residence 1961–2011
17.2
51.2
33.0
12.9
40.0
24.9
33.2
65.2
47.9
18.6
70.9
46.3
16.3
66.3
41.9
46.1
73.4
60.6
24.0
59.0
40.7
Total
2001
22.7
57.4
38.7
16.2
43.1
27.8
36.9
69.5
51.7
19.8
72.6
47.9
17.5
68.0
43.4
48.9
74.4
62.4
27.9
62.6
44.5
Rural
6.2
39.3
21.8
8.7
36.4
21.3
12.5
43.4
27.4
7.6
54.5
32.2
7.6
54.5
32.2
12.1
61.9
39.3
10.5
46.2
27.3
Urban
23.3
57.1
41.0
21.9
56.8
39.6
39.7
55.6
47.7
19.1
46.5
33.4
22.5
53.6
38.4
32.4
49.1
42.5
36.2
57.0
46.6
Total
2011
11.4
57.2
35.7
21.5
57.5
39.9
17.4
53.1
35.5
10.4
44.9
28.6
14.9
56.8
36.4
21.3
50.9
37.0
19.1
54.1
36.7
Urban
(continued)
32.0
57.1
44.9
22.6
55.5
39.1
46.3
56.4
51.3
20.2
46.7
34.0
23.7
53.1
38.7
39.5
48.5
44.1
44.6
58.4
51.5
Rural
100 2 The Demographics of Ageing
Maharashtra
Madhya Pradesh
Kerala
Karnataka
Jharkhand
Jammu & Kashmir
Himachal Pradesh
Haryana
49.1
72.8
26.3
Males
Females
36.0
Females
Total
80.5
Males
14.8
56.3
Females
Total
39.1
65.6
24.7
Females
Total
76.4
Males
Males
50.6
NA
Females
Total
NA
Males
17.8
Females
NA
73.8
Males
Total
50.7
40.9
Females
Total
82.5
Males
NA
Females
64.9
NA
Males
Total
NA
29.8
77.5
53.0
38.7
83.2
58.8
15.5
67.8
40.7
27.1
80.0
53.8
NA
NA
NA
19.4
75.6
52.5
41.8
83.1
65.5
NA
NA
NA
13.7
57.7
36.0
16.8
63.7
39.8
10.4
52.1
29.5
15.0
60.8
37.5
NA
NA
NA
5.9
60.3
37.6
14.5
66.3
45.8
NA
NA
NA
14.8
69.6
42.2
19.4
78.4
48.0
7.7
60.1
32.7
11.6
71.7
42.3
NA
NA
NA
2.8
70.0
43.0
15.6
79.8
52.6
2.0
68.5
42.0
1971 Total
Urban
Total
Rural
1961
Total
Table 2.30 (continued)
17.0
75.3
46.0
21.0
81.4
50.3
8.1
62.5
34.2
12.3
75.8
44.9
NA
NA
NA
3.1
72.5
44.7
16.0
80.6
53.2
1.8
70.6
43.6
Rural
7.7
52.7
30.7
9.5
60.5
34.3
5.8
46.5
24.2
8.7
55.0
31.8
NA
NA
NA
1.6
53.5
31.7
16.5
61.7
39.9
2.8
57.2
33.8
Urban
20.5
59.7
39.7
24.7
70.3
46.9
10.0
49.1
28.4
15.6
59.9
37.6
NA
NA
NA
23.5
67.3
49.3
22.1
70.1
49.0
4.5
58.3
35.7
Total
1981
25.2
66.0
45.0
27.5
73.6
49.9
11.8
51.5
30.1
17.1
65.0
41.6
NA
NA
NA
27.3
70.4
52.8
22.9
70.9
49.8
5.0
59.8
37.2
Rural
7.8
44.0
26.0
9.9
53.1
31.2
6.6
37.2
20.1
8.2
44.1
25.6
NA
NA
NA
5.2
51.1
31.6
6.7
56.7
35.1
2.5
51.5
29.2
Urban
23.8
54.4
39.0
26.2
65.5
46.1
9.6
45.7
26.3
18.1
56.7
37.3
NA
NA
NA
NA
NA
NA
27.8
65.1
47.5
6.6
53.8
31.0
Total
1991
30.8
61.8
46.1
29.9
69.7
50.1
10.4
48.7
28.4
21.8
62.4
42
NA
NA
NA
NA
NA
NA
29.0
66.1
48.6
7.7
55.8
32.8
Rural
7.5
38.1
22.9
9.7
47.3
28.9
7.4
36.2
20.3
7.7
40.0
23.7
NA
NA
NA
NA
NA
NA
7.9
48.2
29.5
2.6
45.6
23.9
Urban
27.7
55.1
40.4
28.4
64.0
45.8
8.8
40.5
22.9
22.0
58.0
39.1
22.1
60.9
41.4
18.7
64.0
43.3
38.2
63.1
50.5
18.2
48.8
33.6
Total
2001
36.7
64.8
49.6
33.6
69.4
51.2
9.5
43.1
24.5
26.7
64.2
44.4
25.8
66.0
45.6
22.8
67.5
47.2
40.3
64.9
52.4
22.3
51.0
36.8
Rural
8.5
35.7
21.4
11.6
46.2
28.4
7.0
32.8
18.3
10.2
43.1
26.0
5.7
40.6
23.9
5.9
52.6
30.7
7.9
40.8
25.0
6.3
41.8
23.8
Urban
31.1
56.0
47.0
32.6
53.6
43.5
18.2
52.7
34.8
31.9
59.0
45.6
29.1
49.8
39.7
19.1
48.1
34.5
4.8
58.7
51.8
17.8
50.4
35.2
Total
2011 Rural
Urban
16.8
55.2
36.9
15.1
51.7
34.2
16.0
51.8
33.1
20.8
57.8
39.7
10.1
46.7
29.3
14.5
52.7
35.2
19.9
55.7
39.2
12.1
51.2
32.9
(continued)
42.5
56.7
49.8
39.3
54.3
47.0
20.2
53.6
36.3
38.8
59.8
49.4
35.0
50.8
43.0
20.8
46.3
34.2
47.4
59.0
53.3
20.8
50.1
36.4
2.5 Social and Economic Dimensions 101
Sikkim
Rajasthan
Punjab
Odisha
Nagaland
Mizoram
Meghalaya
Manipur
81.2
65.0
Males
Females
23.4
Females
73.2
72.0
Males
Total
48.2
10.5
Females
Total
46.4
70.9
19.4
Females
Total
78.8
Males
Males
46.3
72.0
Females
Total
85.3
Males
NA
Females
79.1
NA
Males
Total
NA
NA
Females
Total
NA
Males
44.0
Females
NA
73.9
Males
Total
58.2
66.3
81.5
73.9
26.3
74.6
51.2
11.5
72.9
48.2
19.8
79.8
47.0
72.8
85.5
79.6
NA
NA
NA
NA
NA
NA
43.8
76.1
59.3
5.9
68.6
37.4
9.6
57.2
32.7
5.3
59.9
36.9
11.3
61.9
34.9
25.0
67.1
47.7
NA
NA
NA
NA
NA
NA
45.6
49.8
47.5
36.9
69.0
54.3
6.2
70.1
39.6
1.0
68.3
40.7
6.8
75.8
40.0
72.1
89.9
82.1
NA
NA
NA
41.1
81.4
63.3
24.0
72.5
48.4
1971 Total
Urban
Total
Rural
1961
Total
Table 2.30 (continued)
38.9
69.1
55.2
6.5
72.9
41.6
0.8
70.6
42.1
6.7
76.9
40.4
73.1
90.2
82.8
NA
NA
NA
45.0
85.0
67.1
25.7
74.5
50.7
Rural
12.0
67.3
44.5
4.6
55.6
30.1
2.0
57.9
34.1
7.5
60.3
33.4
16.9
72.0
49.1
NA
NA
NA
14.3
52.5
34.1
14.6
58.3
34.1
Urban
34.6
74.0
56.2
10.6
58.2
34.4
3.7
57.8
34.3
12.6
66.8
38.8
75.7
88.5
82.9
18.1
52.3
35.0
40.4
78.6
61.2
40.3
72.4
56.5
Total
1981
37.5
75.7
58.3
11.9
60.1
36.2
4.1
59.2
35.5
12.9
68.2
39.7
78.3
89.8
84.7
19.7
61.1
36.8
45.7
83.0
66.3
44.6
76.3
61.0
Rural
8.4
60.7
38
4.6
49.1
26.3
2.3
52.6
29.9
8.8
52.6
29.9
14.1
64.3
44.1
12.5
46.0
28.0
15.5
54.3
35.3
29.4
61.1
44.5
Urban
31.8
73.0
55.4
16.3
56.0
36.4
2.5
53.7
30.5
12.6
61.1
37.1
69.5
82.8
77.3
38.8
66.9
53.2
41.4
77.1
61.0
44.9
70.2
58.5
Total
1991
33.2
73.6
56.4
19.0
58.6
39.1
2.6
55.3
31.5
13.3
62.4
38.2
72.6
84.6
79.6
41.1
68.9
55.6
46.8
81.5
66.2
50.7
74.6
63.7
Rural
9.5
63.4
40.6
5.0
44.7
24.7
2.0
48.6
27.3
6.4
46.0
27.0
17.4
60.0
45.2
35.9
64.2
50.1
16.1
51.9
34.4
31.8
59.2
46.0
Urban
38.2
70.6
56.5
23.1
56.1
38.9
14.1
56.0
35.3
17.9
61.8
39.6
61.4
77.8
70.6
48.3
70.1
59.4
44.6
77.1
61.2
42.7
69.2
56.1
Total
2001
40.6
71.7
58.2
27.3
59.7
42.8
16.9
57.9
37.8
19.1
64.2
41.3
65.7
79.3
73.2
55.1
75.7
65.8
50.6
81.8
66.8
46.0
72.3
59.5
Rural
12.4
57.5
36.9
6.8
42.5
24.0
6.8
50.9
28.9
8.7
44.8
27.1
18.5
65.0
46.5
41.3
63.7
52.3
21.6
54.7
37.1
35.5
61.5
48.0
Urban
39.6
60.2
50.5
35.1
51.5
43.6
13.9
55.1
35.7
27.2
56.1
41.79
44.7
53.4
49.2
36.2
52.3
44.4
32.7
47.2
40.0
38.6
51.6
45.1
Total
2011 Rural
Urban
24.8
57.5
41.9
12.0
50.7
32.3
13.2
55.5
35.7
14.1
54.1
34.8
25.9
47.9
37.4
31.1
50.9
41.0
23.6
47.7
35.6
33.2
49.9
41.4
(continued)
44.6
61.0
53.3
42.7
51.7
47.3
14.3
54.9
35.6
29.7
56.5
43.2
52.3
55.7
54.0
41.9
53.9
48.0
35.0
47.0
41.0
41.2
52.4
46.9
102 2 The Demographics of Ageing
Dadra & Nagar Haveli
Chandigarh
Andaman & Nicobar Islands
Union Territory
West Bengal
Uttar Pradesh
Uttarakhand
Tripura
Tamil Nadu
80.1
Males
NA
66.7
Females
Total
NA
Males
16.0
Females
NA
73.4
Total
49.7
7.9
Females
Males
67.9
Males
Total
37.5
19.8
Females
Total
85.5
Males
NA
Females
54.3
NA
Males
Total
NA
12.6
Females
Total
75.1
Males
25.8
Females
46.4
73.4
Males
Total
49.7
NA
NA
NA
NA
NA
16.5
76.1
50.9
8.8
73.7
40.5
20.9
88.1
55.8
NA
NA
NA
13.4
77.0
48.0
29.6
78.4
54.3
NA
NA
NA
NA
NA
12.9
60.7
43.7
4.7
47.8
26.5
9.4
65.9
41.1
NA
NA
NA
4.8
52.1
28.7
13.2
55.7
33.9
82.5
52.1
2.1
45.5
27.2
5.9
73.3
45.4
3.9
65.7
34.9
8.3
81.2
48.4
NA
NA
NA
3.7
73.6
41.4
13.3
70.2
42.3
1971 Total
Urban
Total
Rural
1961
Total
Table 2.30 (continued)
82.5
52.1
1.1
67.1
45.4
5.9
76.5
47.1
4.0
72.3
37.8
8.6
83.3
49.5
NA
NA
NA
3.8
76.3
43.1
15.5
76.8
47.1
Rural
68.6
46.8
2.2
41.2
24.1
5.4
55.4
39.4
3.3
45.5
25.5
5.1
65.8
39.4
NA
NA
NA
2.6
47.1
25.4
7.5
51.8
29.3
Urban
73.5
51.0
2.5
38.0
21.9
7.9
67.1
42.2
4.9
57.4
31.3
7.9
75.6
44.9
NA
NA
NA
8.3
66.5
38.6
19.4
61.8
41.2
Total
1981
74.1
51.5
0.9
59.5
37.3
8.6
42.1
45.7
5.2
63.5
34.1
8.6
78.4
46.7
NA
NA
NA
8.9
69.0
40.5
24.6
68.6
47.6
Rural
65.9
43.6
2.6
35.9
20.6
4.5
40.1
25.7
3.9
41.9
23.7
3.9
58.5
33.9
NA
NA
NA
3.6
42.2
22.1
7.8
29.3
26.2
Urban
66.2
49.6
2.7
33.2
19.4
10.7
60.4
40.4
6.5
54.0
30.8
NA
NA
NA
NA
NA
NA
NA
NA
NA
21.3
57.1
39.9
Total
1991
68.2
51.6
4.2
60.3
37.8
12.3
66.0
44.3
7.7
62.0
35.0
NA
NA
NA
NA
NA
NA
NA
NA
NA
28.1
64.8
47.5
Rural
41.5
23.5
2.6
30.8
18.0
3.8
38.3
24.6
3.3
36.4
20.9
NA
NA
NA
NA
NA
NA
NA
NA
NA
7.1
39.4
23.3
Urban
63.4
45.7
6.3
36.1
22.1
13.4
50.6
34.5
11.2
53.7
32.0
18.8
71.1
46.5
27.9
58.7
43.3
17.1
64.0
39.8
26.1
60.3
43.1
Total
2001
67.0
49.1
9.5
50.6
33.1
16.2
56.6
39.2
13.1
60.5
35.7
21.2
74.5
49.6
33.1
62.7
47.7
19.6
68.5
43.5
34.6
68.2
51.5
Rural
48.5
29.2
6.1
35.0
21.3
5.1
31.5
19.8
7.3
41.1
24.6
7.7
54.6
31.9
6.3
43.4
25.5
6.3
42.9
23.4
14.3
48.9
31.3
Urban
61.6
45.7
16.0
56.5
38.3
17.8
59.6
40.1
18.1
57.1
38.1
16.7
47.7
32.9
26.7
49.7
38.4
23.6
55.8
40.0
31.8
59.3
45.6
Total
2011 Rural
Urban
66.5
45.3
16.0
56.3
38.2
17.7
60.3
40.5
15.4
56.8
36.7
11.3
48.9
31.2
11.3
51.0
32.4
16.0
57.0
36.8
21.8
58.5
40.2
(continued)
56.8
45.9
14.2
62.2
42.6
17.9
59.1
39.8
19.4
57.2
38.7
18.3
47.4
33.4
32.9
49.1
41.0
26.3
55.3
41.1
41.2
60.0
50.7
2.5 Social and Economic Dimensions 103
76.6
22.4
Males
Females
17.7
Females
49.5
65.7
Males
Total
41.6
27.7
Females
Total
40.3
54.0
Total
5.2
Females
Males
54.7
Males
NA
Females
33.2
NA
Males
Total
NA
53.1
24.3
79.9
52.0
19.6
71.3
46.0
NA
NA
NA
14.6
72.3
50.0
NA
NA
NA
NA
11.4
58.4
35.2
12.6
48.1
29
NA
NA
NA
3.9
51.6
30.5
NA
NA
NA
NA
10.5
73.8
43.2
9.4
60.7
36.0
5.7
34.0
20.6
3.2
51.9
30.2
NA
NA
NA
26.4
1971 Total
Urban
Total
Rural
1961
Total
Females
Source: Same as Table 2.17
All India
Pondicherry
Lakshadweep
Delhi
Daman and Diu
Table 2.30 (continued)
11.3
77.4
45.5
12.4
72.1
44.4
5.7
34.0
20.6
3.2
51.9
30.2
NA
NA
NA
26.4
Rural
6.4
55.4
31.5
5.7
43.9
24.6
NA
NA
NA
3.2
50.0
28.9
NA
NA
NA
26.4
Urban
14.0
65.1
40.1
9.9
49.9
29.9
1.9
33.1
18.0
3.5
45.8
26.4
NA
NA
NA
31.3
Total
1981
15.9
69.1
43.1
12.8
61.1
38.1
2.8
37.2
20.7
4.8
32.3
34.4
NA
NA
NA
32.1
Rural
6.5
48.3
27.5
7.6
39.1
22.8
1.0
25.1
15.4
3.4
44.7
25.7
NA
NA
NA
18.9
Urban
16.1
60.5
39.1
9.5
43.3
25.8
NA
NA
NA
3.6
39.0
22.7
15.9
50.6
29.8
35.6
Total
1991
19.0
65.4
43.1
16.4
60.9
39.0
NA
NA
NA
4.1
43.7
26.0
21.4
64.0
39.2
37.7
Rural
6.3
42.9
24.3
6.2
33.3
18.9
NA
NA
NA
3.6
38.6
22.4
11.7
38.7
22.2
6.5
Urban
20.9
60.3
40.3
11.3
39.8
24.1
2.3
32.8
17.7
5.5
37.4
21.8
14.2
47.6
28.0
31.7
Total
2001
24.9
65.6
45.0
17.9
53.5
34.7
1.7
32.7
17.0
8.2
39.4
24.2
16.5
57.7
34.3
35.7
Rural
9.0
44.1
26.2
8.2
32.5
18.9
3.1
32.9
18.5
5.3
37.3
21.6
12.3
37.9
22.4
10.4
Urban
25.5
53.3
39.8
17.6
54.4
35.7
10.9
46.2
30.0
10.6
53.0
33.3
14.9
71.5
49.9
25.2
Total
2011
30.0
53.0
41.8
21.1
54.2
37.4
12.6
52.3
32.9
9.7
49.3
31.1
15.9
58.2
38.6
33.4
Rural
15.4
53.8
35.31
16.1
54.4
34.8
10.5
44.6
28.0
10.6
53.1
33.3
14.5
75.1
53.6
14.7
Urban
104 2 The Demographics of Ageing
2.5 Social and Economic Dimensions
105
Table 2.31 Distribution of Indian households according to the number of elderly, census 2001 and 2011 (Rural) Number of aged persons (60+ years) in the household
2001 Total None 1 2 3 4+ 2011 Total None 1 2 3 4+ Source: Census of India 2001 and
Total Number of households
Number of aged persons 60 years and above Males Females
1374,95,260 940,35,577 303,17,317 125,01,423 5,74,151 66,792
282,95,544 0 148,65,873 124,62,198 8,21,332 1,46,141
290,29,984 0 154,51,444 125,40,648 9,01,121 1,36,771
168,271,634 113,593,183 37,158,328 16,683,180 752,750 84,193 2011
35,921,940 0 18,037,639 16,628,262 1,072,404 183,635
37,218,591 0 19,120,689 16,738,098 1,185,846 173,958
Table 2.32 Distribution of Indian households according to the number of elderly, census 2001 and 2011 (Urban) Number of aged persons (60+ years) in the household
2001 Total None 1 2 3 4+ 2011 Total None 1 2 3 4+ Source: Same as Table 2.31
Total Number of households
Number of aged persons 60 years and above Males Females
556,24,100 408,16,889 107,99,718 37,92,601 1,88,908 25,984
93,43,522 0 52,64,998 37,54,290 2,64,437 59,797
97,22,820 0 55,34,720 38,30,912 3,02,287 54,901
80,586,647 57,338,610 16,502,620 6,389,350 315,154 40,913
14,996,568 0 8,141,371 6,323,786 439,854 91,557
15,409,808 0 8,361,249 6,454,914 505,608 88,037
106
2 The Demographics of Ageing
Table 2.33 Distribution of Indian households according to the number of elderly, census 2001 and 2011 (Total) Number of aged persons (60+ years) in the household
2001 Total None 1 2 3 4+ 2011 Total None 1 2 3 4+ Source: Same as Table 2.31
Total Number of households
Number of aged persons 60 years and above Males Females
1931,19,360 1348,52,466 411,17,035 162,94,024 7,63,059 92,776
376,39,066 0 201,30,871 162,16,488 10,85,769 2,05,938
387,52,804 0 209,86,164 163,71,560 12,03,408 1,91,672
248,858,281 170,931,793 53,660,948 23,072,530 1,067,904 125,106
50,918,508 0 26,179,010 22,952,048 1,512,258 275,192
52,628,399 0 27,481,938 23,193,012 1,691,454 261,995
problems of widowhood and old age in rural India. For an economically independent elderly couple, the decision on co-residence with the children (sons in particular) is based on the situations and preferences of the older as well as the younger generations. Moreover, there seems to be a differential situation between the elderly with and without surviving offspring, no matter whether the parents live with the surviving offspring or not. In addition, the currently married status reduces the probability of the co-residence of the elderly with children although the condition of having more children increases the chances of co-residence (Martin 1992; Rajan et al. 1995a, b, c). Dak and Sharma (1987) noted that the headship in the households used to get transferred to the next eldest member once the oldest individual had attained a certain age. With regard to the emotional consequences of staying in nuclear families, Nandal et al. (1987) find that the elderly in nuclear households experience a feeling of helplessness. The aged are looked upon as a burden in poor households in which each and every member contributes to the family income. Household support for the elderly is therefore very difficult to ensure in poverty-ridden circumstances. An examination of intra-family relations of the urban elderly by Shah (1993) finds that satisfactory intra-family relations are relatively higher among widows than widowers and lower among those living in joint families when
2.5 Social and Economic Dimensions
107
Table 2.34 Distribution of households according to number of elderly in India by states and place of residence, 2011 No. of elderly in HH State Andhra Pradesh
Arunachal Pradesh
Assam
Bihar
Chhattisgarh
Goa
Gujarat
0 1 2 3 4+ 0 1 2 3 4+ 0 1 2 3 4+ 0 1 2 3 4+ 0 1 2 3 4+ 0 1 2 3 4+ 0 1 2 3 4+
HH with elderly Total Rural 69.2 22.6 7.9 0.3 0.0 81.2 14.3 4.2 0.3 0.0 73.3 21.2 5.3 0.2 0.0 70.4 19.0 10.0 0.5 0.1 73.0 18.8 7.9 0.3 0.0 63.2 27.0 9.3 0.4 0.1 71.2 19.0 9.4 0.4 0.0
66.7 24.2 8.8 0.3 0.0 77.8 16.6 5.3 0.3 0.0 73.4 21.1 5.3 0.2 0.0 70.5 18.9 10.1 0.4 0.1 72.3 19.2 8.3 0.2 0.0 59.6 30.3 9.5 0.5 0.1 68.9 20.0 10.7 0.4 0.0
Urban 74.5 19.4 5.8 0.3 0.0 91 7.8 1.1 0.1 0.0 72.5 21.8 5.4 0.3 0.0 69.7 20.4 9.3 0.5 0.1 75.6 17.6 6.5 0.3 0.0 65.3 25.0 9.2 0.4 0.1 74.1 17.6 7.9 0.4 0.0 (continued)
108
2 The Demographics of Ageing
Table 2.34 (continued)
Haryana
Himachal Pradesh
Jammu & Kashmir
Jharkhand
Karnataka
Kerala
Madhya Pradesh
Maharashtra
No. of elderly in HH
HH with elderly Total Rural
0 1 2 3 4+ 0 1 2 3 4+ 0 1 2 3 4+ 0 1 2 3 4+ 0 1 2 3 4+ 0 1 2 3 4+ 0 1 2 3 4+ 0 1 2 3 4+
68.2 19.2 12.1 0.4 0.1 64.4 24.5 10.6 0.5 0.0 67.9 21.2 10.3 0.5 0.1 71.4 19.9 8.4 0.3 0.0 66.2 24.8 8.6 0.4 0.0 58.9 29.6 11.0 0.5 0.0 72.1 18.4 9.1 0.4 0.0 66.6 22.0 10.7 0.6 0.1
65.4 20.3 13.6 0.6 0.1 62.8 25.5 11.1 0.6 0.0 68.9 20.7 9.8 0.5 0.1 70.7 20.3 8.7 0.3 0.0 62.0 27.7 9.8 0.5 0.0 59.4 28.9 11.2 0.5 0.0 72.3 18.0 9.3 0.4 0.0 62.1 24.1 13.2 0.7 0.1
Urban 72.8 17.3 9.5 0.4 0.0 76.3 16.4 7.0 0.3 0.0 65.1 22.7 11.4 0.7 0.1 73.7 18.6 7.3 0.4 0.0 72.4 20.7 6.5 0.4 0.0 58.3 30.4 10.8 0.5 0.0 71.7 19.4 8.5 0.4 0.0 72 19.7 7.9 0.5 0.1 (continued)
2.5 Social and Economic Dimensions
109
Table 2.34 (continued)
Manipur
Meghalaya
Mizoram
Nagaland
Orissa
Punjab
Rajasthan
Sikkim
No. of elderly in HH
HH with elderly Total Rural
0 1 2 3 4+ 0 1 2 3 4+ 0 1 2 3 4+ 0 1 2 3 4+ 0 1 2 3 4+ 0 1 2 3 4+ 0 1 2 3 4+ 0 1 2 3 4+
73.1 18.3 8.3 0.3 0.0 79.3 16.4 4.3 0.2 0.0 76.3 16.8 6.7 0.2 0.0 80.1 14.0 5.7 0.2 0.0 68.2 22.6 9.0 0.3 0.0 63.5 22 13.6 0.8 0.1 70.6 18.9 10.1 0.4 0.0 75.4 18.1 6.1 0.4 0.0
74.5 17.1 8.1 0.3 0.0 79.1 16.5 4.2 0.2 0.0 76.4 16.8 6.6 0.2 0.0 77.9 15.2 6.7 0.2 0.0 67.3 23.1 9.3 0.2 0.0 59.8 23.4 15.7 1.0 0.1 69.9 19.4 10.3 0.4 0.0 72.5 20.0 7.1 0.4 0.0
Urban 69.9 20.9 8.8 0.4 0.0 79.7 16 4.0 0.3 0.0 76.3 16.8 6.6 0.3 0.0 85.4 11.2 3.3 0.1 0.0 72.6 19.9 7.1 0.3 0.0 69.3 19.8 10.5 0.4 0.0 72.9 17.7 9.0 0.4 0.0 83.0 13.2 3.6 0.2 0.0 (continued)
110
2 The Demographics of Ageing
Table 2.34 (continued)
Tamil Nadu
Tripura
Uttarakhand
Uttar Pradesh
West Bengal
Union Territory Andaman & Nicobar Islands
Chandigarh
Dadra & Nagar Haveli
No. of elderly in HH
HH with elderly Total Rural
Urban
0 1 2 3 4+ 0 1 2 3 4+ 0 1 2 3 4+ 0 1 2 3 4+ 0 1 2 3 4+
67.9 24.0 7.8 0.3 0.0 72.4 21.4 6.0 0.2 0.0 66.7 23.3 9.5 0.5 0.0 66.7 21.4 11.1 0.7 0.1 69.6 23.3 6.8 0.3 0.0
66.3 25.5 8.0 0.2 0.0 73.0 20.8 6.1 0.1 0.0 63.9 25.3 10.2 0.5 0.1 65.3 22.0 11.9 0.7 0.1 71.2 22.4 6.2 0.2 0.0
69.7 22.4 7.6 0.3 0.0 71.0 23.1 5.7 0.2 0.0 73.2 18.7 7.7 0.4 0.0 71.4 19.4 8.6 0.5 0.1 66.1 25.4 7.9 0.5 0.1
0 1 2 3 4+ 0 1 2 3 4+ 0 1 2 3 4+
78.1 17.0 4.7 0.2 0.0 79.8 13.0 6.9 0.3 0.0 86.0 10.0 3.9 0.1 0.0
75.4 18.8 5.6 0.2 0.0 86.3 9.2 4.3 0.2 0.0 81.7 12.7 5.4 0.1 0.0
82.7 13.9 3.3 0.1 0.0 79.5 13.2 7.0 0.3 0.0 89.8 7.5 2.6 0.1 0.0 (continued)
2.5 Social and Economic Dimensions
111
Table 2.34 (continued)
Daman and Diu
Delhi
Lakshadweep
Pondicherry
All India
No. of elderly in HH
HH with elderly Total Rural
Urban
0 1 2 3 4+ 0 1 2 3 4+ 0 1 2 3 4+ 0 1 2 3 4+ 0 1 2 3 4+ Total Elderly HH
85.3 10.9 3.6 0.2 0.0 75.5 16.2 7.9 0.4 0.0 64.7 26.2 8.1 0.8 0.2 68.7 23.4 7.5 0.4 0.0 68.7 21.6 9.2 0.4 0.1 100.0
87.3 9.5 3.1 0.1 0.0 75.5 17.3 6.8 0.4 0.0 64.0 26.4 8.5 0.9 0.2 68.5 23.3 7.8 0.4 0.0 71.2 20.5 7.8 0.4 0.1 100.0
78.0 16.2 5.6 0.2 0.0 75.4 15.6 8.7 0.3 0.0 67.0 25.7 6.9 0.4 0.0 69.2 23.6 6.9 0.3 0.0 67.5 22.1 9.9 0.4 0.1 100.0
Source: Census of India 2011
compared with those in nuclear families. Further, those senior persons without substantial assets and are economically dependent find the attitude and behaviour of their family members unsatisfactory. This situation persists even among those who have a fairly good source of income in old age.
112
2 The Demographics of Ageing
Table 2.35 Percent distribution of elderly by household size, 2011 Total
Rural
Urban
Males
Females
Total
Males
Females
Total
Males
Females
Total
1
56.3
58.5
57.4
54.9
57.5
56.3
60.1
61.1
60.7
2
41.4
38.7
40.0
42.9
39.7
41.2
37.4
35.8
36.5
3
2.1
2.6
2.4
2.0
2.5
2.3
2.2
2.8
2.5
4+
0.2
0.2
0.2
0.2
0.3
0.2
0.3
0.3
0.3
1
62.4
58.7
60.7
60.3
56.9
58.7
78.3
73.6
76.2
2
34.3
37.5
35.8
36.3
39.1
37.6
19.5
24.6
21.8
3
2.7
3.3
30
2.9
3.5
3.2
1.2
1.7
1.4
4+
0.6
0.5
0.5
0.5
0.5
0.5
1.0
0.1
0.6
1
66.0
64.5
65.2
66.1
64.6
65.3
66.1
63.5
64.8
2
32.2
33.5
32.9
32.4
33.5
33.0
31.0
33.4
32.2
3
1.6
1.8
1.7
1.4
1.7
1.6
2.3
2.6
2.5
4+
0.2
0.2
0.2
0.1
0.2
0.1
0.6
0.5
0.5
1
49.6
43.4
46.7
49.2
43.1
46.3
52.8
46.6
49.9
2
46.5
52.3
49.2
46.9
52.7
49.6
43.2
49.0
45.8
3
3.2
3.6
3.4
3.2
3.5
3.4
3.2
3.7
3.5
4+
0.7
0.7
0.7
0.7
0.7
0.7
0.8
0.7
0.8
1
50.1
55.5
53.0
49.0
55.1
52.2
54.4
57.2
55.9
2
47.5
41.8
44.5
48.7
42.3
45.3
42.8
39.7
41.2
3
2.2
2.5
2.3
2.1
2.4
2.3
2.4
2.7
2.5
4+
0.2
0.2
0.2
0.2
0.2
0.2
0.4
0.4
0.4
1
54.1
59.2
56.9
55.5
62.3
59.3
53.2
57.0
55.2
2
42.0
36.9
39.2
41.1
34.5
37.4
42.7
38.7
40.5
3
3.1
3.0
3.0
2.8
2.6
2.7
3.2
3.3
3.3
4+
0.8
0.9
0.8
0.6
0.6
0.6
0.9
1.0
1.0
1
45.6
51.1
48.5
43.0
50.5
47.0
49.4
51.9
50.7
2
51.1
45.5
48.1
53.7
46.3
49.7
47.2
44.4
45.8
3
2.9
3.0
3.0
2.9
2.9
2.9
2.9
3.2
3.0
4+
0.4
0.4
0.4
0.4
0.3
0.4
0.5
0.5
0.5
1
41.6
43.3
42.5
39.3
42.4
40.8
46.4
45.6
46.0
2
54.3
52.7
53.5
56.2
53.5
54.8
50.4
51
50.7
3
3.6
3.5
3.5
3.9
3.6
3.8
2.8
3.0
2.9
4+
0.5
0.5
0.5
0.6
0.5
0.6
0.4
0.4
0.4
1
50.4
52.8
51.6
50.1
52.9
51.6
53.1
51
52
2
46.0
43.3
44.6
46.2
43.2
44.6
43.5
45.2
44.3
3
3.2
3.5
3.4
3.3
3.5
3.4
2.9
3.3
3.2
4+
0.4
0.4
0.4
0.4
0.4
0.4
0.5
0.5
0.5
1
50.5
46.8
48.6
51.4
47.1
49.3
48.2
45.8
47.0
2
45.3
48.7
47.0
45.0
48.9
46.9
46.1
48.4
47.2
3
3.4
3.8
3.6
3.0
3.4
3.2
4.5
4.7
4.6
4+
0.8
0.7
0.8
0.6
0.6
0.6
1.2
1.1
State Andhra Pradesh
Arunachal Pradesh
Assam
Bihar
Chhattisgarh
Goa
Gujarat
Haryana
Himachal Pradesh
Jammu & Kashmir
1.2
(continued)
2.5 Social and Economic Dimensions
113
Table 2.35 (continued) Total
Jharkhand
Karnataka
Kerala
Madhya Pradesh
Maharashtra
Manipur
Meghalaya
Mizoram
Nagaland
Orissa
Rural
Urban
Males
Females
Total
Males
Females
Total
Males
Females
1
53.1
52.3
52.7
52.0
52.4
52.2
56.7
51.7
Total 54.4
2
44.1
44.6
44.3
45.3
44.5
44.9
40.2
44.7
42.3
3
2.5
2.8
2.7
2.4
2.8
2.6
2.6
3.1
2.8
4+
0.3
0.3
0.3
0.3
0.3
0.3
0.5
0.5
0.5
1
56.4
58.1
57.2
55.0
57.6
56.4
59.1
58.9
59.0
2
40.3
38.2
39.2
41.7
38.7
40.1
37.7
37.2
37.4
3
2.9
3.2
3.1
2.9
3.3
3.1
2.8
3.4
3.1
4+
0.4
0.5
0.5
0.4
0.4
0.4
0.4
0.5
0.5
1
52.9
57.8
55.6
51.8
57.4
54.9
54.1
58.4
56.5
2
44.5
39.1
41.5
45.6
39.8
42.4
43.1
38.2
40.4
3
2.4
2.8
2.6
2.4
2.6
2.5
2.5
3.0
2.8
4+
0.2
0.3
0.3
0.2
0.2
0.2
0.3
0.4
0.3
1
47.1
49.8
48.5
45.9
49.0
47.5
50.3
52.1
51.2
2
49.8
46.8
48.3
51.1
47.8
49.4
46.1
44
45
3
2.8
3.1
2.9
2.7
2.9
2.8
3.1
3.4
3.3
4+
0.3
0.3
0.3
0.3
0.3
0.3
0.5
0.5
0.5
1
46.6
50.1
48.4
42.6
47.8
45.4
53.0
53.9
53.4
2
49.3
45.3
47.2
53.1
47.3
50.0
43.2
42.0
42.6
3
3.5
4.0
3.8
3.7
4.3
4.0
3.2
3.6
3.4
4+
0.6
0.6
0.6
0.6
0.6
0.6
0.6
0.5
0.6
1
51.6
50.3
51.0
51.4
48.7
50.1
52.0
53.2
52.6
2
45.8
46.5
46.0
46.1
48.2
47.1
45.0
43.2
44.1
3
2.2
2.9
2.6
2.1
2.7
2.4
2.8
3.3
3.0
4+
0.4
0.3
0.4
0.4
0.4
0.4
0.4
0.3
0.3
1
63.4
65.8
64.6
63.8
65.6
64.7
61.3
66.4
64.2
2
34.1
31.8
33.0
33.9
32.5
33.3
34.9
29.9
32.1
3
2.3
2.1
2.2
2.1
1.8
1.9
3.3
3.0
3.1
4+
0.2
0.3
0.2
0.2
0.1
0.1
0.5
0.7
0.6
1
55,0
54.0
54.5
56.2
52.9
54.6
53.9
54.9
54.4
2
42.5
43.3
42.9
41.6
44.5
43
43.4
42.2
42.9
3
2.3
2.5
2.4
2.0
2.4
2.2
2.6
2.7
2.6
4+
0.2
0.2
0.2
0.2
0.2
0.2
0.1
0.2
0.1
1
56.7
50.5
53.8
54.5
48.6
51.8
64.8
58.1
61.7
2
41.0
46.7
43.7
43.2
48.6
45.7
33.1
39.3
35.9
3
2.1
2.5
2.3
2.1
2.5
2.3
1.9
2.4
2.2
4+
0.2
0.3
0.2
0.2
0.3
0.2
0.2
0.2
0.2
1
55.0
54.1
54.6
54.5
54.0
54.2
58.1
55.1
56.7
2
43.1
43.6
43.4
43.7
43.9
43.9
39.0
41.7
40.3
3
1.7
2.1
1.8
1.6
1.9
1.7
2.3
2.7
2.5
4+
0.2
0.2
0.2
0.2
0.2
0.2
0.6
0.5
0.5
(continued)
114
2 The Demographics of Ageing
Table 2.35 (continued) Total
Punjab
Rajasthan
Sikkim
Tamil Nadu
Tripura
Uttarakhand
Uttar Pradesh
West Bengal
Rural
Urban
Males
Females
Total
Males
Females
Total
Males
Females
1
42.0
42.6
42.3
39.5
40.9
40.1
47.5
46.5
Total 47.0
2
52.7
52.5
52.6
54.4
53.6
54.0
49.1
49.9
49.5
3
4.5
4.2
4.3
5.1
4.7
5.0
2.9
3.1
3.0
4+
0.8
0.7
0.8
1.0
0.8
0.9
0.5
0.5
0.5
1
44.7
49.3
47.1
44.0
49.5
46.9
46.9
48.8
47.9
2
52.2
47.5
49.8
53.0
47.4
50
49.8
47.6
48.7
3
2.8
2.9
2.8
2.7
2.8
2.8
2.9
3.2
3.0
4+
0.3
0.3
0.3
0.3
0.3
0.3
0.4
0.4
0.4
1
60.5
53.2
57.2
59.8
51.4
56.1
64.0
60.6
62.4
2
36.0
42.6
38.9
36.6
44.1
40
32.8
36
34.3
3
3.2
3.8
3.5
3.2
4.0
3.5
2.9
3.2
3.0
4+
0.3
0.4
0.4
0.4
0.5
0.4
0.3
0.2
0.3
1
59.3
59.0
59.2
60.4
60.1
60.3
58.0
57.8
57.9
2
38.7
38.5
38.6
38.0
37.9
37.9
39.6
39.2
39.4
3
1.8
2.3
2.0
1.5
1.9
1.7
2.1
2.7
2.4
4+
0.2
0.2
0.2
0.1
0.1
0.1
0.3
0.3
0.3
1
63.0
63.4
63.2
61.9
62.2
62.1
65.7
66.3
66.0
2
35.6
34.9
35.1
36.8
36.2
36.5
32.5
31.6
32.1
3
1.3
1.6
1.4
1.2
1.5
1.3
1.5
1.8
1.6
4+
0.1
0.1
0.1
0.1
0.1
0.1
0.3
0.3
0.3
1
52.6
54.1
53.3
52.1
54.9
53.6
54.1
51.2
52.7
2
43.9
42.3
43.1
44.3
41.5
42.8
42.5
44.9
43.7
3
3.0
3.2
3.1
3.1
3.2
3.1
2.9
3.5
3.1
4+
0.5
0.4
0.5
0.5
0.4
0.5
0.5
0.4
0.5
1
47.6
44.9
46.3
46.6
44.0
45.4
51.8
48.7
50.3
2
46.8
49.6
48.2
47.7
50.3
49.0
43.1
46.2
44.6
3
4.4
4.4
4.4
4.6
4.5
4.5
3.9
4.1
4.0
4+
1.2
1.1
1.1
1.1
1.1
1.1
1.2
1.0
1.1
1
61.5
61.4
61.4
62.8
63.5
63.1
59.6
57.5
58.6
2
35.5
35.6
35.6
35.4
34.5
35
35.6
37.7
36.6
3
2.4
2.5
2.4
1.6
1.8
1.7
3.6
3.7
3.6
4+
0.6
0.5
0.6
0.2
0.2
0.2
1.2
1.1
1.2
1
66.6
58.4
63.0
65.0
56.7
61.3
70.4
62.6
66.9
2
31.7
39.2
35.0
33.2
40.8
36.5
28.1
35.3
31.3
3
1.6
2.2
1.8
1.7
2.3
2.0
1.4
1.9
1.6
4+
0.1
0.2
0.2
0.1
0.2
0.2
0.1
0.2
0.2
1
48.8
44.9
46.9
55.7
50.3
53.3
48.7
44.8
46.8
2
47.7
51.1
49.4
40.3
45.6
42.6
47.8
51.2
49.5
3
3.0
3.5
3.2
2.9
3.1
3.0
3.0
3.5
3.2
4+
0.5
0.5
0.5
1.1
1.0
1.1
0.5
0.5
Union Territory Andaman & Nicobar Islands
Chandigarh
0.5
(continued)
2.6 Conclusion
115
Table 2.35 (continued) Total
Dadra & Nagar Haveli
Daman and Diu
Delhi
Lakshadweep
Pondicherry
All India
Rural
Urban
Males
Females
Total
Males
Females
Total
Males
Females
Total
1
51.6
57.4
54.7
47.3
57.6
53.2
58.0
57
57.5
2
46.2
40.3
43.0
50.9
40.3
44.9
39.3
40.0
39.7
3
2.1
2.2
2.2
1.8
2.0
1.9
2.5
2.8
2.6
4+
0.1
0.1
0.1
0.0
0.1
0.0
0.2
0.2
0.2
1
53.4
62.5
58.6
49.2
63.2
57.5
55.2
62.2
59.2
2
43.7
34.8
38.6
48.4
34.5
40.2
41.7
34.9
37.8
3
2.6
2.5
2.5
2.4
2.3
2.3
2.7
2.5
2.6
4+
0.3
0.2
0.3
0.0
0.0
0.0
0.4
0.4
0.4
1
48.7
47.9
48.3
45.7
46.8
46.3
48.8
47.9
48.4
2
47.9
48.4
48.2
50.4
49.4
49.9
47.9
48.4
48.1
3
2.8
3.2
3.0
3.4
3.2
3.3
2.8
3.2
3.0
4+
0.6
0.5
0.5
0.5
0.4
0.5
0.5
0.5
0.5
1
57.5
57.2
57.4
63.8
62.6
63.2
55.8
55.9
55.9
2
35.1
36.3
35.7
33.0
35.2
34.0
35.7
36.5
36.1
3
5.7
4.7
5.1
3.2
2.2
2.8
6.3
5.3
5.8
4+
1.7
1.8
1.8
0.0
0.0
0.0
2.2
2.3
2.2
1
56.1
61.4
59
58.2
64.1
61.6
55.1
60.2
58.0
2
40.9
35.3
37.8
39.6
33.4
36.1
41.6
36.1
38.4
3
2.7
2.9
2.8
2.1
2.3
2.2
2.9
3.2
3.1
4+
0.3
0.4
0.4
0.1
0.2
0.1
0.4
0.5
0.5
1
51.4
52.2
51.8
50.2
51.4
50.8
54.3
54.3
54.3
2
45.1
44.1
44.6
46.3
45.0
45.6
42.2
41.9
42
3
3.0
3.2
3.1
3.0
3.1
3.1
2.9
3.3
3.1
4+
0.5
0.5
0.5
0.5
0.5
0.5
0.6
0.5
0.6
Total
100.0
100.0
100.0
100.0
100.0
100.0
100.0
100.0
100.0
Source: Same as Table 2.34
2.6
Conclusion
This chapter delineates the demographics of ageing in India and its differentials across states. The states are in different stages of demographic transition as well as in ageing process. The southern states, which are far ahead in the process of ageing, are more likely to face the consequences. The social security measures, coupled with a strengthened health sector, would be necessary to minimize the ill effects of population ageing. The National Ageing Policy 2011 should be revised by understanding the dynamics of ageing in India and the uniqueness of each state in contributing to the overall situation, which are explored in detail in the subsequent chapters of this book.
116
2 The Demographics of Ageing
References Abraham, V. (2009). Employment growth in rural India: Distress-driven? Economic & Political Weekly, 44(16), 97–104. Bengtson, V. (2001). Beyond the nuclear family: The increasing importance of multigenerational bonds. Journal of Marriage and Family, 63, 1–16. Bhat, P. N. (1992). Changing demography of elderly in India. Current Science, 63(8), 440–448. Bhat, P. N. (1996). Contours of fertility decline in India: A district level study based on the 1991 census. In K. Srinivasan (Ed.), Population policy and reproductive health (pp. 96–177). New Delhi: Hindustan Publishing Corporation. Bhat, P. N. M., & Rajan, S. I. (1990). Demographic transition in Kerala revisited. Economic and Political Weekly, 25(35–36), 1957–1990. Bhat, P. N. M., & Rajan, S. I. (1997). Demographic transition since independence. In K. C. Zachariah & S. I. Rajan (Eds), Kerala’s demographic transition: Determinants and consequences (pp. 33–78). New Delhi: Sage Publications. Bhat, P. N. M., Preston, S., & Dyson, T. (1984). Vital rates in India, 1961–1981. Washington, D. C.: National Academy Press (Report no. 24, Committee on Population and Demography). Bhat, P. N., Navaneetham, K., & Rajan, S. I. (1995). Maternal mortality in India: Estimates from a regression model. Studies in Family Planning, 26(4), 217–232. Cherlin, A., & Furstenberg, F. F. (1986). The new American grandparent: A place in the family, a life apart. New York: Basic Books. D’Souza, V. S. (1989). Changing social scene and its implication for the aged. In K. G. Desai (Ed.), Aging in India. New Delhi: Ashish Publishing House. Dak, T. M., & Sharma, M. L. (1987). Changing status of the aged in North Indian villages. In M. L. Sharma, & T. M. Dak (Eds.), Aging in India (pp. 43–55). New Delhi: Ajanta Publications. Drèze, J. (1990). Widows in rural India. Mimeograph. The Development Economic Research Programme, Paper No. 26, London School of Economics. Granahan, D. V. (1972). Contents and measurements of socioeconomic development. New York: United Nations Research Institute for Social Development. Guilmoto, C. Z., & Rajan, S. I. (1998). Regional heterogeneity and fertility behaviour in India. Centre for Development Studies (Thiruvananthapuram), Working Paper No. 290. Guilmoto, C. Z., & Rajan, S. I. (2001). Spatial patterns of fertility transition in Indian districts. Population and Development Review, 27(4), 713–738. Guilmoto, C. Z., & Rajan, S. I. (2002). District level estimates of fertility from India’s 2001 census. Economic and Political Weekly, XXXVII(7) 665–672. Guilmoto, C. Z., & Rajan, S. I. (Eds.). (2005). Fertility change in South India. New Delhi/ Thousand Oaks/London: Sage Publications. Guilmoto, C. Z., & Rajan, S. I. (2013). Fertility at the district level in India: Lessons from the 2011 census. Economic and Political Weekly, XLVIII (23), 59–70. Gulati, L., & Rajan, S. I. (1997). Women and work in Kerala: A comparison of the 1981 and 1991 censuses. Indian Journal of Gender Studies, 4(2), 231–252. Gulati, L., & Rajan, S. I. (1999). The added years: Elderly in India and Kerala. Economic and Political Weekly, XXXIV(44), WS-46–51. Henwood, K. L. (1993). Women and later life: The discursive construction of identities within family relationships. Journal of Aging Studies, 7, 303. Hock, H., & Weil, D. N. (2012). On the dynamics of the age structure, dependency, and consumption. Journal of Population Economics, 25(3), 1019–1043. Ibrahim, R., Abolfathi Momtaz, Y., & Hamid, T. A. (2013). Social isolation in older Malaysians: Prevalence and risk factors. Psychogeriatrics: The Official Journal of the Japanese Psychogeriatric Society, 13(2), 71–79. Jendrek, M. P. (1994). Grandparents who parent their grandchildren: Circumstances and decisions. The Gerontologist, 34(2), 206–216. https://doi.org/10.1093/geront/34.2.206.
References
117
Kaur, M., Grover, R. P., & Aggarwal, K. (1987) Socio-economic profile of the rural aged. In M. L. Sharma & T. M. Dak (Eds.), Aging in India (pp. 67–75). New Delhi: Ajanta Publications. Kodoth, P., & Rajan, S. I. (2008). Property and assets as economic security (Chap. 5). In S. I. Rajan, C. Risseeuw, & M. Perera (Eds.), Institutional provisions and care for the aged: Perspectives from Asia and Europe (, pp. 83–114). London/NewYork/Delhi: Anthem Press. Martin, B. T. (1992). Social policies for the elderly in the third world. Westport, CT: Greenwood Press. Mirkin, B., & Weinberger, M.B. (2001). The demography of population ageing. United Nations Population Bulletin (Special Issue Nos. 42/43), 41–48. Myers, G. C. (1986). Cross-national patterns and trends in marital status among the elderly. Paper presented to the Conference on Aged Populations and the Gray Revolution, Universite Catholique de Louvain, Belgium, October. Nandal, D. S., Khatri, R. S., & Kadian, R. S. (1987) Aging problems in the structural context. In M. L. Sharma & T. M. Dak (Eds.), Aging in India (pp. 106–116). New Delhi: Ajanta Publications. Punia, D., & Sharma, M. L. (1987). Family life of rural aged women. In M. L. Sharma & T. M. Dak (Eds), Aging in India (pp. 145–151). New Delhi: Ajanta Publications. Rajan, S. I. (1989). Ageing in Kerala: One more population problem? Asia-Pacific Population Journal, 4(2), 19–48. Rajan, S. I. (1992). Growing old gracefully. In K. R. Nair (Ed.), Geriatric neurology (pp. 4–26). Trivandrum: Trivandrum Association of Neurology. Rajan, S. I. (1999). Aging and social security (Chap. 3). In B. A. Prakash (Ed.), Kerala’s economic development: Issues and problems (pp. 49–71). New Delhi: Sage Publications. Rajan, S. I. (2002). Social security for the unorganized sector in South Asia. International Social Security Review, 55(4), 143–156. Rajan, S. I. (Ed.). (2008a). Social policies for the elderly: Experiences from South Asia. Routledge. Rajan, S. I. (2008b). Aging, pension and social security in South Asia (Chap. 1). In S. I. Rajan (Ed.), Social security for the elderly: Experiences from South Asia (pp. 1–38). London/New York/New Delhi: Routledge Taylor Francis Group. Rajan, S. I., & Balagopal, G. (Eds). (2018). Elderly care in India: Societal and state responses. Springer. Rajan, S. I., & Kumar, S. (2003). Living arrangements among the Indian elderly: New evidence from the national family health survey. Economic and Political Weekly, XXXVIII (1), pp. 75–80 (January 4, 2003). Rajan, S. I., & Mohanachandran Nair, P. (1998). Infant and child mortality estimates. Economic and Political Weekly, XXXIII(19), May 9–15, 1998. Rajan, S. I., Mishra, U. S., & Sarma, P. S. (1995a). An agenda for national policies on aging in India. Research and Development Journal (Journal of Helpage India), 1(2), 38–53. Rajan, S. I., Mishra, U. S., & Sarma, P. S. (1995b). The elderly speak. In S. Vijayakumar (Ed.), Challenges before the elderly: An Indian scenario (pp. 179–213). New Delhi: M.D Publishing Pvt Limited. Rajan, S. I., Mishra, U. S., & Sarma, P. S. (1995c). Living arrangements among the Indian elderly. Hongkong Journal of Gerentology, 9(2), 20–28. Rajan, S. I., Mari Bhat, P. N., & Dyson, T. (1998). Mortality and fertility transition in Kerala: A historical investigation. New Delhi: Hindustan Publishing Corporation. Rajan, S. I., Perera, M,, & Begum, S. (2005). The economics of pensions and social security in South Asia (Chap. 5). In M. Khan (Ed.), Economic development in South Asia (Pp. 196–257). New Delhi: Tata McGraw Hill. Rajan, S. I., Risseeuw, C., & Perera, M. (Eds.) (2008). Institutional provisions and care for the aged: Perspectives from Asia and Europe. Anthem Press. Shah, V. P. (1993). The elderly in Gujarat. Ahmedabad: Mimeograph, Department of Sociology, Gujarat University. Shankardass, M. K., & Rajan, S. I. (Eds.) (2018). Abuse and neglect of the elderly in India. Springer.
118
2 The Demographics of Ageing
Singh, A. K. P. J, Dak, T. M., & Sharma, M. L. (1987a). Work and leisure in India among the aged males. In M. L Sharma & T. M. Dak (Eds.), Aging in India (pp. 82–93). New Delhi: Ajanta Publications. Singh, K., Singh, R., & Sharma, M. L. (1987b). Problems of aged women in Haryana. In M. L. Sharma & T. M. Dak (Eds.), Aging in India (pp. 134–144). New Delhi: Ajanta Publications. Sudha, S., Suchindran, C., Mutran, E. J., & Rajan, S. I. (2006). Marital status, family ties and selfrated health among elderly men and women in South India. Journal of Cross-Cultural Gerontology, 21(3–4), 103–120. Zachariah, K. C., & Rajan, S. I. (Eds.). (1997). Kerala’ demographic transition: Determinants and consequences. New Delhi: Sage Publications. Zachariah, K. C., & Rajan, S. I., Sarma, P. S., Navaneetham, K., Gopinathan Nair, P. S., Mishra, U. S. (1994). Demographic transition in Kerala in the 1980s. Centre for Development Studies Monograph Series.
Chapter 3
Economic Dependence and Physical Disability: Supporting Mechanisms and Coping Strategies
Abstract This chapter discusses the economic dependence and disability of aged persons in India in connection with socioeconomic and demographic characteristics. The states with relatively higher economic dependency and disability rate have more burden than others. Rajasthan and Orissa are the most disadvantaged, with relatively higher levels of physical and financial disabilities. South Indian states that are socially and demographically better off also have relatively high levels of the elderly with complete economic dependence in households as in the case of Rajasthan and Orissa, even though the latter show lower disability rates among old people. Unfortunately, financial resources are now allocated in India on the basis of size of the population, without considering the socioeconomic and demographic characteristics of the people in the state. The gender dimension of economic dependency and disabilities of old age is crucial in socioeconomic development; however, this feature does not seem to be properly addressed so far. The socioeconomic costs of the state in accommodating disabled persons are not adequately discussed in the country. India needs novel strategic measures to cope with the regional volatility of population disadvantages and the unequal well-being of the aged.
3.1
Introduction
The physical dependence and economic dependence of old people are among the most unexplored areas in human development in India. A few studies that tried to unearth the disabilities of the aged in India using census and micro-level studies could not delineate the link between physical dependence and economic dependence in old age (Menon et al. 2011, 2014; Saikia et al. 2016; Rajan and Sunitha 2015). As per the Census of India 2011, India had 104 million elderly persons. Senior persons are vulnerable in many aspects. Their health and well-being are predominantly an outcome that occurs in the absence of economic dependence and physical disability. Unfortunately, the social security systems for the aged in the country are © Springer Nature Singapore Pte Ltd. 2020 S. Irudaya Rajan and U. S. Mishra, Senior Citizens of India, https://doi.org/10.1007/978-981-15-7740-6_3
119
120
3 Economic Dependence and Physical Disability …
insufficient and almost nil for the majority of the population. Health costs keep mounting, and the poor are finding it increasingly difficult to access quality health care. In such situations, the intricacies of physical and financial dependency of old people invite a scrutiny for the formulation of policy strategies. As a federal system, India operates most of its welfare measures through the states. The latter are in different stages of demographic and epidemiological transition, which necessitates stringent disaggregate measures at the state level rather than the country as a whole. A clear understanding of the socioeconomic and demographic characteristics of the people is inevitable to implement strategic measures to cope with the disadvantages of the elderly. Against this backdrop, this chapter examines the economic dependency and physical disability of the aged in India in terms of the state and gender. The economic dependency of old people is explored using the NSSO 60th Round data, which was collected during the period 2004–05 (NSSO 2006) and the 71st Round data of 2014. The disability of the elderly is studied using the Census of India 2011 (Registrar General of India (RGI) 2011). An attempt is also made to understand the association between economic dependency and disability conditions of senior citizens at the state level.
3.2
Conceptual Framework
The authors conceptualize that economic dependency and disability form a burden for the aged. Physical disability in old age makes people more vulnerable to insecurities such as financial dependency. In this conceptual framework, the researchers visualize that socioeconomic characteristics, particularly the gender and regional (state) influences, operate in the differentials of economic dependency and disability (see Fig. 3.1). Economic dependency and disability cause extreme vulnerability in old age in terms of illness, poverty and death. In order to reduce the susceptibility, public and private social interventions in the form of pension, insurance, subsidized food, old age home, etc., have a significant impact on the well-being of the elderly. At the same time, the individual’s education, occupation, social networking and ownership of land and house play a crucial role in lowering the vulnerability conditions. Those who are educated are more likely to have better social capital and more chances to overcome this scenario. The family structure has a vital impact on the ability to deal with the vulnerability conditions. Old people in the joint family structure are more likely to resolve their problems than those in nuclear families. However, the scope of this chapter is limited to the differentials of the economic dependency and disability among the aged in terms of socioeconomic and demographic characteristics, particularly regarding the region and gender. In this study, the region is considered at three levels::
3.2 Conceptual Framework
121 Region and Gender Dimensions
Economic Dependency (Partial and Full)
Disability (Physical and Mental)
Vulnerability Illness, Disease, Death, Poverty
Micro-level factors Education Occupation Own land Own house Social Capital
Public and Private IntervenƟons Old age home, Pension, Insurance, Subsidised ration, Health Services etc.
Fig. 3.1 Conceptual framework used to understand the dependence and disabilities of the aged in India. Source: Own formulation
1. place of residence, classified as either rural or urban, 2. states and union territories and 3. six territories based on the geographical location. The operational definition of the key terms used in this chapter is as follows. An elderly person is one aged 60 years or above, as demarcated by the Government of India in the preparation of policy documents, including the National Policy on Older Persons (NPOP) in January 1999. In some other countries, the term refers to those who are nearing or have surpassed the average life span of their community— people aged 65 or 70 years. In this chapter, a person is considered economically dependent if he or she requires financial help from others in order to live a normal life. A person is regarded as disabled if he or she has restrictions or an inability to perform an activity in the manner of or within the range regarded as normal for human beings.
3 Economic Dependence and Physical Disability …
122
3.3
Economic Dependency
The economic dependency of old people in the country deserves due consideration in the context of the absence of adequate social security measures and the relatively high unemployment rates among the youth. Around 52.6% of the old persons in the country were fully dependent on others for their day-to-day survival in 2004 (NSSO 2004). In addition, nearly 13.4% of the aged was partially dependent on others for their livelihood in the same period. In 2014, the percentage of senior persons in full dependence was 51.7 and that in partial dependence was 20 (see Table 3.4). People who are financially dependent on others in old age are highly vulnerable. Often they do not get food and medical support on time. An examination of the state-wise information on dependency reveals a striking feature—the share of people who are fully reliant on others significantly varies across states, in both 2004 and 2014 (see Tables 3.1a, 3.1b, 3.2a, 3.2b, 3.3a, and 3.3b). In 2004, it ranges from 15.6 to 63.7%, and in 2014, from 16.3 to 65. Aged people in Gujarat, Rajasthan, Punjab, Kerala, Bihar and Madhya Pradesh, in particular, are highly dependent on others for financial matters when compared with their counterparts in other states. Gender differentials in economic dependency clearly show that when compared with males, females are highly dependent on others for their day-to-day needs. For instance, in 2004, around 31.6% of men were financially totally dependent on others, while in the case of women, it was around 72.1% at the country level. In this regard, differentials can be seen across states and union territories. Among men, senior persons who were fully dependent on others vary from 3.7–41% (see Fig. 3.2). In the case of women, this range is relatively higher—from 35.2 to 81.6% across the states. Unfortunately, these state–gender differentials of old age dependency have often been neglected in the planning of social security measures for the elderly. The states that report high levels of old age financial dependency need special attention when designing social security measures. At the same time, the states which show the male–female discrepancy in financial dependency require gender intervention strategies along with social security measures. Figure 3.2 shows the percentage of aged males and females in the various states of India who are completely dependent on others. The male/female discrepancy in economic dependency is more evident in Uttar Pradesh, West Bengal, Orissa, Rajasthan and Bihar. These states account for a significant share of population in the country. Gender discrepancy is also seen in the southern states that are well known for social achievements such as female literacy rate and women participation rate. This fact implies that the underlying causes that impinge on this gender disparity should be scientifically studied. Only a marginal difference exists between rural and urban India in the percentage of economic dependency in old age (Table 3.4). In rural India, around 52.7% of the elderly were fully dependent on others, while in urban India, it was around 52.2%. However, at the state level, major differences exist between rural and urban areas in the percentage of economic dependency. In rural areas, the highest
3.3 Economic Dependency
123
Table 3.1a Distribution of aged persons by type of economic dependence and sex, rural India, 2004–05 State 1 2 3 4 5 6 7 8 9 10 11 12 13 14 15 16 17 18 19 20 21 22 23 24 25 26 27 28 29 30 31 32 33 34 35
Male NO PD
FD
Female NO PD
FD
Total NO PD
FD
Andaman & Nicobar 84.4 3.4 12.2 54.8 11.6 33.5 74.9 6.0 19.1 Andhra Pradesh 49.1 11.2 39.8 15.0 11.4 73.7 31.5 11.3 57.3 Arunachal Pradesh 42.2 49.8 8.0 12.6 46.8 40.6 27.6 48.3 24.0 Assam 46.0 25.1 28.9 8.6 5.5 85.9 30.7 17.1 52.2 Bihar 59.1 15.8 25.2 17.1 12.0 71.0 40.3 14.1 45.6 Chandigarh 97.9 2.1 0.0 25.3 14.6 60.1 59.1 8.8 32.1 Chhattisgarh 55.6 10.4 34.0 26.8 10.9 62.3 38.5 10.7 50.8 Dadra & Nagar Haveli 16.6 53.7 29.7 12.2 32.7 55.0 15.1 46.8 38.1 Daman & Diu 74.4 25.6 0.0 25.4 0.0 74.6 36.8 6.0 57.2 Delhi 40.5 25.5 34.0 0.0 28.7 71.3 20.7 27.1 52.2 Goa 83.4 9.0 7.6 26.0 12.2 61.8 51.9 10.8 37.3 Gujarat 49.6 14.7 35.6 12.9 9.8 77.3 31.3 12.3 56.4 Haryana 37.6 38.0 24.4 12.7 43.0 44.4 25.2 40.5 34.3 Himachal Pradesh 59.0 18.4 22.6 18.9 15.5 65.5 38.5 16.9 44.6 Jammu & Kashmir 66.9 12.1 21.0 10.8 12.7 76.5 43.7 12.4 43.9 Jharkhand 55.8 16.8 27.4 17.0 11.0 72 40.0 14.4 45.6 Karnataka 54.2 13.7 32.1 15.0 11.3 73.8 35.3 12.5 52.2 Kerala 36.2 20.5 43.3 10.4 18.6 71.0 21.8 19.4 58.8 Lakshadweep 30.0 13.6 56.4 18.4 0.0 81.6 23.6 6.0 70.4 Madhya Pradesh 58.9 10.7 30.4 15.7 12.6 71.8 37.3 11.6 51.1 Maharashtra 49.1 16.7 34.2 18.4 13.0 68.6 33.5 14.8 51.7 Manipur 34.4 37.0 28.6 10.3 33.8 55.9 24.0 35.6 40.4 Meghalaya 58.5 19.4 22.1 18.6 24.2 57.2 39.7 21.7 38.6 Mizoram 61.9 22.5 15.6 14.6 23.0 62.4 44.3 22.7 33.0 Nagaland 50.3 33.0 16.7 23.0 44.4 32.6 42.9 36.0 21.0 Orissa 45.7 21.1 33.2 7.7 12.7 79.6 27.7 17.1 55.2 Puducherry 69.7 4.9 25.4 43.9 32.1 24.0 57.3 17.9 24.7 Punjab 46.1 17.0 36.8 10.1 18.9 71.0 28.4 18.0 53.6 Rajasthan 47.3 14.8 38.0 9.5 12.7 77.9 27.7 13.7 58.6 Sikkim 61.4 20.6 18.0 12.1 21.0 66.9 38.4 20.8 40.8 Tamil Nadu 48.7 15.9 35.5 19.3 16.5 64.2 33.9 16.2 49.9 Tripura 46.7 17.3 36.0 9.4 7.8 82.8 30.9 13.3 55.8 Uttar Pradesh 61.2 10.3 28.6 13.0 8.1 78.9 37.6 9.2 53.3 Uttaranchal 65.4 5.2 29.4 35.4 4.7 59.9 51.5 5.0 43.5 West Bengal 47.4 18.6 34.0 6.6 8.5 84.9 26.9 13.5 59.6 India 52.0 15.5 32.5 14.1 12.6 73.2 33.2 14.1 52.7 Note: NO Not dependent on others; PD partially dependent on others; FD fully depended on others Source: NSSO, 60th Round, 2004–05
3 Economic Dependence and Physical Disability …
124
Table 3.1b Distribution of aged persons by type of economic dependence and sex, rural India, 2014 State 1
Male NO PD
FD
Female NO PD
FD
Total NO PD
FD
Andaman & Nicobar 71.3 6.9 21.8 46.0 8.3 45.7 62.3 7.4 30.3 Islands 2 Andhra Pradesh 43.0 15.7 41.4 11.8 14.5 73.7 26.8 15.1 58.1 3 Arunachal Pradesh 42.3 30.1 27.6 1.8 38.7 59.5 27.8 33.2 39.1 4 Assam 35.2 29.8 35.0 4.4 15.7 79.9 20.5 23.1 56.4 5 Bihar 49.3 31.3 19.4 14.6 15.3 70.1 34.4 24.5 41.1 6 Chandigarh 31.0 30.3 38.7 0.0 0.0 100.0 14.4 14.1 71.6 7 Chhattisgarh 63.8 21.3 14.8 45.7 19.9 34.4 55.9 20.7 23.4 8 Dadra & Nagar Haveli 5.0 12.1 82.9 0.0 30.3 69.7 2.0 23.0 75.0 9 Daman & Diu 1.0 7.2 91.7 0.0 3.1 96.9 0.3 4.3 95.4 10 Delhi 6.7 51.9 41.4 0.0 0.0 100.0 4.7 36.5 58.9 11 Goa 57.6 7.8 34.6 7.8 23.4 68.8 44.6 11.9 43.6 12 Gujarat 35.8 12.3 51.9 4.3 14.5 81.3 18.0 13.5 68.4 13 Haryana 46.8 30.4 22.8 7.9 33.4 58.7 27.8 31.9 40.3 14 Himachal Pradesh 58.9 27.2 13.9 22.5 22.1 55.4 39.5 24.5 36.0 15 Jammu & Kashmir 27.8 25.3 46.8 2.2 14.5 83.3 16.3 20.4 63.3 16 Jharkhand 15.7 52.6 31.7 6.4 32.8 60.8 11.0 42.6 46.4 17 Karnataka 42.5 19.6 37.9 11.0 14.6 74.3 26.4 17.1 56.5 18 Kerala 43.2 21.9 34.9 13.3 20.2 66.5 27.1 21.0 51.9 19 Lakshadweep 30.8 31.7 37.5 1.6 32.0 66.4 19.6 31.8 48.5 20 Madhya Pradesh 53.7 23.0 23.3 10.5 17.5 72.0 30.1 20.0 49.9 21 Maharashtra 42.3 24.1 33.7 14.1 22.5 63.5 27.0 23.2 49.8 22 Manipur 24.0 55.2 20.8 9.3 34.0 56.8 16.7 44.8 38.5 23 Meghalaya 34.6 38.1 27.3 11.6 42.6 45.8 24.9 40.0 35.0 24 Mizoram 67.2 24.0 8.9 20.3 40.3 39.4 45.0 31.7 23.3 25 Nagaland 69.7 25.8 4.5 13.3 64.0 22.7 45.9 41.9 12.2 26 Orissa 33.8 30.1 36.1 9.4 20.8 69.8 22.7 25.9 51.4 27 Puducherry 61.8 19.1 19.1 73.5 12.7 13.8 69.4 14.9 15.7 28 Punjab 46.9 10.4 42.6 2.2 9.6 88.1 24.5 10.0 65.5 29 Rajasthan 42.3 21.9 35.8 5.7 27.9 66.4 22.0 25.2 52.8 30 Sikkim 74.5 16.9 8.6 34.8 32.2 32.9 55.8 24.1 20.0 31 Tamil Nadu 36.6 32.0 31.4 12.4 31.7 55.9 24.0 31.9 44.1 32 Telangana 50.5 24.8 24.7 20.3 20.9 58.8 30.9 22.3 46.8 33 Tripura 39.7 21.4 38.9 11.4 16.9 71.7 23.5 18.8 57.7 34 Uttar Pradesh 42.6 17.1 40.3 10.6 14.5 74.9 27.1 15.8 57.1 35 Uttaranchal 28.1 25.5 46.4 0.2 14.3 85.5 10.8 18.6 70.6 36 West Bengal 45.9 21.7 32.4 10.2 8.2 81.5 28.4 15.1 56.6 Total 42.6 23.9 33.5 11.2 19.1 69.6 26.6 21.5 51.9 Note: NO Not dependent on others; PD partially dependent on others; FD fully depended on others Source: NSSO, 71st Round, 2014
3.3 Economic Dependency
125
Table 3.2a Distribution of aged persons by type of economic dependency and sex, urban India, 2004–05 State
Male NO PD
FD
Female NO PD
FD
Total NO PD
FD
Andaman & Nicobar Islands 88.2 0.0 11.8 18.5 4.9 76.5 55.9 2.3 41.8 Andhra Pradesh 56.9 10.4 32.8 25.0 9.4 65.6 39.9 9.9 50.3 Arunachal Pradesh 34.6 35.2 30.2 14.9 15.5 69.7 26.2 26.9 46.9 Assam 56.3 15.1 28.6 24.6 3.1 72.4 42.5 9.9 47.6 Bihar 46.7 13.1 40.2 16.4 7.3 76.3 33.7 10.6 55.8 Chandigarh 88.3 7.9 3.8 40.7 2.4 56.9 68.1 5.6 26.3 Chhattisgarh 58.7 16.9 24.3 23.3 10.4 66.3 39.5 13.4 47.1 Dadra & Nagar Haveli 34.5 23.2 42.4 0.0 13.6 86.4 18.2 18.6 63.1 Daman & Diu 27.0 35.8 37.2 5.8 2.9 91.3 14.2 15.8 70.0 Delhi 62.1 7.9 29.9 17.5 8.5 73.9 40.2 8.2 51.5 Goa 37.6 35.0 27.4 3.6 35.0 61.4 19.7 35.0 45.4 Gujarat 52.5 11.4 36.2 11.8 9.2 79.0 31.1 10.2 58.6 Haryana 49.0 20.3 30.7 17.9 30.2 51.9 31.6 25.9 42.6 Himachal Pradesh 72.4 7.7 20.0 30.5 14.5 55.0 50.4 11.2 38.4 Jammu & Kashmir 62.9 8.5 28.7 10.7 5.1 84.2 39.4 7.0 53.7 Jharkhand 50.1 21.9 28.0 12.7 6.7 80.6 32.2 14.6 53.2 Karnataka 55.0 9.8 35.2 13.9 7.2 78.9 34.3 8.5 57.3 Kerala 47.0 18.4 34.6 19.2 15.8 65.0 32.1 17.0 51.0 Lakshadweep 9.1 63.4 27.5 7.2 38.9 53.9 8.1 49.7 42.2 Madhya Pradesh 64.8 7.1 28.1 18.7 12.1 69.2 41.0 9.7 49.3 Maharashtra 50.1 20.3 29.5 18.7 6.7 74.6 33.9 13.3 52.8 Manipur 42.4 38.8 18.7 9.5 18.6 71.9 26.8 29.3 43.9 Meghalaya 90.9 4.6 4.5 23.6 12.4 64.0 55.4 8.7 35.9 Mizoram 58.6 25.0 16.4 19.9 17.8 62.3 41.8 21.9 36.3 Nagaland 73.0 25.6 1.4 40.9 11.1 47.9 69.7 24.2 6.1 Orissa 50.8 15.5 33.7 6.5 10.2 83.3 31.9 13.2 54.8 Puducherry 45.5 13.4 41.1 10.3 17.3 72.4 23.4 15.8 60.8 Punjab 50.9 14.6 34.5 12.3 6.4 81.4 32.3 10.7 57.1 Rajasthan 55.3 13.7 31.0 12.9 8.2 78.9 33.8 10.9 55.2 Sikkim 76.1 9.0 14.9 35.9 26.3 37.9 60.0 15.9 24.1 Tamil Nadu 54.3 13.9 31.8 19.3 11.9 68.8 35.7 12.8 51.4 Tripura 52.6 17.9 29.5 24.3 6.9 68.8 38.1 12.3 49.6 Uttar Pradesh 61.0 9.7 29.3 13.9 8.3 77.8 36.9 9.0 54.1 Uttaranchal 82.7 5.9 11.4 19.3 7.2 73.5 48.1 6.6 45.3 West Bengal 66.8 10.2 23.0 18.5 8.5 73.0 43.2 9.4 47.4 India 56.1 13.5 30.4 17.3 9.7 73.1 36.3 11.5 52.2 Note: NO Not dependent on others; PD partially dependent on others; FD fully depended on others Source: NSSO, 60th round, 2004–05
3 Economic Dependence and Physical Disability …
126
Table 3.2b Distribution of aged persons by type of economic dependency and sex, urban India, 2014 State
Male NO PD
FD
Female NO PD
FD
Total NO PD
FD
Andaman & Nicobar Islands 37.9 31.0 31.1 6.7 26.5 66.7 22.5 28.8 48.8 Andhra Pradesh 52.9 16.5 30.6 22.5 6.3 71.3 37.6 11.4 51.0 Arunachal Pradesh 38.1 25.9 36.0 0.0 4.0 96.0 26.9 19.4 53.7 Assam 39.6 27.1 33.3 7.6 15.5 76.9 20.5 20.2 59.3 Bihar 47.8 13.4 38.8 11.9 7.8 80.3 32.6 11.0 56.4 Chandigarh 84.0 10.9 5.1 53.4 6.7 40.0 64.5 8.2 27.3 Chhattisgarh 56.6 16.1 27.3 25.9 13.0 61.1 43.8 14.8 41.4 Dadra & Nagar Haveli 2.8 69.3 27.8 0.0 4.2 95.8 1.7 43.3 55.0 Daman & Diu 61.6 37.5 0.9 0.0 10.6 89.4 32.6 24.8 42.6 Delhi 50.3 16.3 33.3 11.7 10.0 78.3 28.7 12.8 58.5 Goa 45.9 39.6 14.5 12.9 5.3 81.8 32.4 25.6 42.0 Gujarat 35.4 20.5 44.1 6.0 15.3 78.7 21.4 18.0 60.6 Haryana 62.0 9.4 28.6 7.7 22.5 69.8 36.1 15.6 48.3 Himachal Pradesh 53.3 46.1 0.6 10.7 38.5 50.8 30.8 42.1 27.1 Jammu & Kashmir 66.1 6.0 27.9 3.8 4.4 91.8 35.6 5.2 59.2 Jharkhand 56.5 15.1 28.4 1.3 13.1 85.6 31.1 14.2 54.7 Karnataka 50.7 28.2 21.1 13.5 17.2 69.3 31.9 22.6 45.5 Kerala 49.0 19.2 31.7 17.8 24.6 57.6 31.3 22.3 46.4 Lakshadweep 56.0 8.8 35.1 4.5 1.9 93.6 37.0 6.2 56.8 Madhya Pradesh 54.3 22.2 23.5 15.8 11.8 72.5 33.3 16.5 50.1 Maharashtra 46.1 10.6 43.3 6.8 7.9 85.3 25.4 9.2 65.4 Manipur 35.1 43.4 21.5 8.5 27.4 64.1 20.4 34.5 45.1 Meghalaya 88.1 2.5 9.4 43.2 2.9 53.9 66.8 2.7 30.5 Mizoram 61.5 20.2 18.3 24.5 41.9 33.5 41.1 32.2 26.7 Nagaland 78.0 9.9 12.1 0.0 6.6 93.4 56.5 9.0 34.5 Orissa 42.4 31.5 26.1 8.9 5.5 85.6 25.1 18 56.9 Puducherry 53.1 27.7 19.2 17.2 40.2 42.6 32.8 34.8 32.4 Punjab 55.6 14.9 29.5 12.6 10.6 76.8 31.7 12.5 55.8 Rajasthan 53.6 15.4 31.0 15.2 14.0 70.8 34.9 14.7 50.4 Sikkim 71.8 1.3 26.9 1.8 0.0 98.2 46.5 0.8 52.7 Tamil Nadu 44.6 30.5 24.9 11.0 24.4 64.5 27.7 27.4 44.9 Telangana 49.6 22.6 27.7 14.5 24.1 61.4 34.2 23.3 42.5 Tripura 64.8 16.7 18.5 23.6 15.9 60.4 49.0 16.4 34.7 Uttar Pradesh 66.6 7.9 25.5 16.5 6.5 77.0 41.6 7.2 51.1 Uttaranchal 67.9 2.1 30.1 48.2 3.0 48.7 56.9 2.6 40.5 West Bengal 62.0 13.3 24.7 14.6 19.9 65.5 38.9 16.5 44.6 Total 51.5 18.5 30.0 12.9 15.3 71.8 31.9 16.9 51.2 Note: NO Not dependent on others; PD partially dependent on others; FD fully depended on others Source: NSSO, 71st round, 2014
3.3 Economic Dependency
127
Table 3.3a Distribution of aged persons by type of economic dependency and sex, India, 2004–05 State
Male NO PD
FD
Female NO PD
FD
Total NO PD
FD
Andaman & Nicobar Islands 85.1 2.8 12.1 44.3 9.7 46.1 70.6 5.2 24.1 Andhra Pradesh 50.8 11.0 38.2 17.3 10.9 71.8 33.4 10.9 55.7 Arunachal Pradesh 41.9 49.1 9.1 12.7 45.7 41.6 27.6 47.4 25.0 Assam 47.0 24.1 28.9 10.3 5.2 84.5 32 16.3 51.7 Bihar 57.7 15.5 26.8 17.0 11.5 71.5 39.6 13.7 46.7 Chandigarh 88.6 7.7 3.7 39.8 3.1 57.1 67.7 5.7 26.6 Chhattisgarh 56.0 11.2 32.8 26.4 10.9 62.7 38.6 11.0 50.4 Dadra & Nagar Haveli 17.4 52.3 30.3 11.2 31.2 57.6 15.3 45.1 39.6 Daman & Diu 40.9 32.8 26.3 15.0 1.5 83.4 23.5 11.8 64.7 Delhi 59.2 10.3 30.5 15.2 11.2 73.6 37.6 10.7 51.6 Goa 69.1 17.1 13.8 19.4 18.9 61.7 42.1 18.1 39.7 Gujarat 50.5 13.7 35.8 12.5 9.6 77.9 31.2 11.6 57.1 Haryana 39.8 34.7 25.6 13.9 40.0 46.1 26.6 37.4 36.0 Himachal Pradesh 59.7 17.8 22.5 19.6 15.5 64.9 39.2 16.6 44.2 Jammu & Kashmir 66.3 11.6 22.2 10.8 11.4 77.9 43.0 11.5 45.5 Jharkhand 54.8 17.7 27.5 16.0 10.0 74.0 38.5 14.5 47.1 Karnataka 54.4 12.7 32.9 14.7 10.1 75.2 35.0 11.5 53.5 Kerala 39.0 19.9 41.1 12.5 17.9 69.6 24.3 18.8 56.9 Lakshadweep 18.8 40.3 40.9 12.4 20.9 66.7 15.2 29.5 55.3 Madhya Pradesh 60.2 9.9 29.9 16.4 12.5 71.2 38.1 11.2 50.7 Maharashtra 49.5 18.0 32.6 18.5 10.7 70.8 33.6 14.2 52.1 Manipur 37.2 37.6 25.2 10.0 27.9 62.1 25.1 33.3 41.7 Meghalaya 61.3 18.2 20.6 19.1 23.0 57.9 41.2 20.5 38.4 Mizoram 60.6 23.5 15.9 17.1 20.6 62.3 43.2 22.4 34.4 Nagaland 59.2 30.1 10.7 26.0 38.9 35.2 52.2 31.9 15.9 Orissa 46.3 20.5 33.2 7.6 12.5 79.9 28.1 16.7 55.2 Puducherry 55.8 9.8 34.5 20.0 21.5 58.5 35.1 16.6 48.3 Punjab 47.4 16.4 36.2 10.6 15.6 73.7 29.5 16.0 54.5 Rajasthan 48.9 14.5 36.6 10.1 11.8 78.1 28.9 13.1 58.0 Sikkim 62.7 19.6 17.7 13.6 21.4 65.0 40.0 20.4 39.6 Tamil Nadu 50.5 15.2 34.3 19.3 14.9 65.8 34.5 15.1 50.4 Tripura 47.4 17.4 35.2 11.9 7.7 80.4 32.0 13.2 54.9 Uttar Pradesh 61.1 10.2 28.7 13.2 8.1 78.7 37.4 9.2 53.4 Uttaranchal 68.5 5.4 26.1 31.6 5.3 63.1 50.8 5.3 43.9 West Bengal 53.7 15.9 30.4 10.4 8.5 81.1 32.1 12.2 55.7 India 53.0 15.0 32.0 14.9 11.9 73.2 34.0 13.4 52.6 Note: NO Not dependent on others; PD partially dependent on others; FD fully depended on others Source: NSSO, 60th round, 2004–05
3 Economic Dependence and Physical Disability …
128
Table 3.3b Distribution of aged persons by type of economic dependency and sex, India, 2014 State
Male NO PD
FD
Female NO PD
FD
Total NO PD
FD
Andaman & Nicobar Islands 69.8 7.9 22.2 43 9.7 47.3 60.1 8.6 31.3 Andhra Pradesh 45.8 15.9 38.3 14.7 12.2 73.1 29.8 14.0 56.1 Arunachal Pradesh 42.1 29.9 28.0 1.8 37.2 61.0 27.7 32.5 39.8 Assam 35.7 29.5 34.8 4.9 15.6 79.5 20.5 22.7 56.8 Bihar 49.1 29.1 21.8 14.3 14.4 71.3 34.2 22.8 43.0 Chandigarh 83.3 11.1 5.5 52.9 6.6 40.5 64.0 8.2 27.8 Chhattisgarh 62.0 20.0 18.0 41.0 18.3 40.7 52.9 19.3 27.8 Dadra & Nagar Haveli 3.7 47.7 48.7 0.0 19.2 80.8 1.9 33.6 64.5 Daman & Diu 50.1 31.7 18.2 0.0 7.6 92.4 22.9 18.7 58.4 Delhi 47.6 18.5 33.8 11.4 9.8 78.8 27.7 13.8 58.5 Goa 50.6 26.8 22.6 11.6 9.9 78.5 36.7 20.8 42.5 Gujarat 35.6 16.5 47.9 5.0 14.8 80.2 19.6 15.6 64.8 Haryana 50.5 25.3 24.2 7.9 30.9 61.3 29.8 28.0 42.2 Himachal Pradesh 58.5 28.6 12.9 21.6 23.3 55.1 38.9 25.8 35.3 Jammu & Kashmir 39.2 19.6 41.2 2.7 11.2 86.1 22.3 15.7 62.0 Jharkhand 23.9 45.1 31.1 5.5 29.4 65.1 14.8 37.3 47.9 Karnataka 45.5 22.8 31.7 11.9 15.6 72.5 28.4 19.1 52.5 Kerala 45.7 20.8 33.5 15.4 22.2 62.4 29.0 21.6 49.4 Lakshadweep 50.1 14.2 35.7 3.8 9.3 86.9 32.8 12.4 54.8 Madhya Pradesh 53.9 22.8 23.4 12.0 15.9 72.1 31.0 19.0 49.9 Maharashtra 43.9 18.5 37.6 11.2 16.7 72.1 26.4 17.5 56.1 Manipur 27.9 51.0 21.1 8.9 31.2 59.8 18.1 40.8 41.0 Meghalaya 43.4 32.2 24.3 17.9 34.7 47.4 32.5 33.3 34.2 Mizoram 64.5 22.2 13.3 22.6 41.2 36.2 43.0 31.9 25.0 Nagaland 71.5 22.3 6.1 11.6 56.8 31.6 47.8 36.0 16.3 Orissa 34.8 30.3 34.9 9.3 18.5 72.2 23 24.8 52.1 Puducherry 55.4 25.4 19.2 36.0 31.0 33.0 44.0 28.7 27.3 Punjab 49.6 11.8 38.6 5.9 10.0 84.1 26.9 10.9 62.3 Rajasthan 45.7 20.0 34.4 8.1 24.5 67.5 25.5 22.4 52.1 Sikkim 74.0 14.1 11.9 30.7 28.2 41.1 54.4 20.5 25.1 Tamil Nadu 40.5 31.3 28.2 11.7 28.3 60 25.8 29.7 44.5 Telangana 50.2 24.0 25.8 19.1 21.6 59.3 31.8 22.6 45.6 Tripura 48.4 19.7 31.8 13.8 16.7 69.5 30.4 18.2 51.5 Uttar Pradesh 47.3 15.3 37.4 11.8 12.8 75.4 30.0 14.1 55.9 Uttaranchal 36.4 20.6 43.0 8.3 12.4 79.3 19.4 15.6 65.0 West Bengal 52.2 18.4 29.4 11.9 12.7 75.4 32.4 15.6 51.9 Total 45.4 22.2 32.4 11.8 17.9 70.3 28.3 20.0 51.7 Note: NO Not dependent on others; PD partially dependent on others; FD fully depended on others Source: NSSO, 71st round, 2014
3.3 Economic Dependency
129
Fig. 3.2 Percentages of elderly males and females who are fully dependent on others in the states of India, 2004–05. Source of data: NSSO, 60th Round
Table 3.4 Percentage distribution of old persons with economic dependency in India by the place of residence, 2004 and 2014 Sex
Rural NO
PD
FD
Urban NO
PD
FD
Total NO
PD
FD
2004 Male 52.0 15.5 32.5 56.1 13.5 30.4 53.0 15.0 32.0 Female 14.1 12.6 73.2 17.3 9.7 73.1 14.9 11.9 73.2 Total 33.2 14.1 52.7 36.3 11.5 52.2 34.0 13.4 52.6 2014 Male 42.6 23.9 33.5 51.5 18.5 30.0 45.4 22.2 32.4 Female 11.2 19.1 69.6 12.9 15.3 71.8 11.8 17.9 70.3 Total 26.6 21.5 51.9 31.9 16.9 51.2 28.3 20.0 51.7 Note: NO Not dependent on others; PD partially dependent on others; FD fully depended on others Source of Data: NSSO 60th and 71st Rounds
130
3 Economic Dependence and Physical Disability …
level of economic dependency was observed in West Bengal (59.6%), followed by Kerala (58.8%), Rajasthan (58.6%) and Andhra Pradesh (57.3%). The lowest level of old age economic dependency among the states was in Nagaland (21%), followed by Arunachal Pradesh (24%), Mizoram (33%) and Haryana (34.3%). In the case of urban areas, the highest level of old age economic dependency was found in the states of Gujarat (58.6%), Karnataka (57.3%), Punjab (57.1%), Bihar (55.8%), Rajasthan (55.2%), Orissa (54.8%) and Uttar Pradesh (54.1%). The lowest level of urban old age economic dependency was observed in Nagaland (6.1%), followed by Sikkim (24.1%), Chandigarh (26.3%), Meghalaya (35.9%) and Mizoram (36.3%). In general, the aged in South India have relatively higher levels of economic dependency when compared with their counterparts in other regions. In South India, around 53.9% of old persons were fully dependent on others, while another 14% was partially dependent on others for their day-to-day activities. As far as complete economic dependency is concerned, the lowest rate was noticed in the North-east (49.1%). It is worth mentioning here that this region has the highest level of partial economic dependency (18.3%) as well. Almost similar patterns can be also observed in the rural areas. However, the highest level of economic dependency in urban areas was observed in Western India, whereas the lowest level was seen in the north-eastern parts of the nation. As age accumulates, the likelihood of being an economic dependent increases in general (Tables 3.5a, 3.5b, 3.6a and 3.6b). This relationship is found to be true in all the states and union territories except Chandigarh, Haryana, Delhi, Arunachal Pradesh, Mizoram and Andaman & Nicobar Islands. However, as the states and union territories are aggregated into six geographical regions, the association between age and economic dependency is found to be strong (Tables 3.7a and 3.7b). As age increases, the share of old people who become completely dependent on others rises substantially. For instance, a spatial analysis of the complete dependence of old people in 2004 clearly shows that in the age group of 60– 69 years, nearly four in every ten persons become dependent on others. Those who are totally dependent on others range from 43.6% in the north-eastern parts of India to 46.8% in the western regions of India. Similarly, the range of the percentage of complete old age dependency for the age groups of 70–79, 80–89 and 90+ in the same year are 57.8–64, 67.6–84 and 73.1–91, respectively.
3.4
Disability of the Elderly
Disability is an attribute that has the propensity to rise with advancing age. Perhaps, the elderly are the most vulnerable to disability and its repercussions in daily life (Rajan et al. 2001; Rajan 2006). As per the Census of India 2011, the disabled population among 60+ years age in India is around 53 million. Of this segment, 27 million are males and the remaining 26 million are females (Table 3.8). Regarding the disability share, the elderly account for one-fifth of the disabled population. This
3.4 Disability of the Elderly
131
Table 3.5a Age-wise distribution of old aged people by economic dependence in the states of India, 2004–05 Age group
Extent of dependence Not dependent
Jammu & Kashmir 60–69 49.6 70–79 36.7 80–89 21.5 90+ 0.9 Total 43.0 Himachal Pradesh 60–69 47.9 70–79 29.2 80–89 25.8 90+ 13.0 Total 39.2 Punjab 60–69 33.4 70–79 24.2 80–89 17.6 90+ 7.4 Total 29.5 Chandigarh 60–69 73.5 70–79 62.5 80–89 37.5 90+ 88.5 Total 67.7 Uttaranchal 60–69 62.0 70–79 35.5 80–89 20.9 90+ 9.8 Total 50.8 Haryana 60–69 31.7 70–79 22.9 80–89 10.2 90+ 13.8 Total 26.6 Delhi 60–69 40.0
Partially dependent
Fully dependent
14.9 5.3 3.1 12.8 11.5
35.5 57.9 75.5 86.4 45.5
16.3 18.8 16.2 0.0 16.6
35.9 51.9 58.0 87.0 44.2
16.8 14.5 17.2 0.0 16.0
49.8 61.3 65.2 92.6 54.5
4.1 7.5 12.9 0.0 5.7
22.4 30.0 49.6 11.5 26.6
3.8 10.8 0.9 0.0 5.3
34.1 53.7 78.2 90.2 43.9
31.4 42.8 53.0 58.7 37.4
36.9 34.3 36.8 27.5 36.0
12.5
47.5 (continued)
3 Economic Dependence and Physical Disability …
132 Table 3.5a (continued) Age group
Extent of dependence Not dependent
70–79 34.8 80–89 23.4 90+ 81.5 Total 37.6 Rajasthan 60–69 36.1 70–79 21.6 80–89 9.6 90+ 5.9 Total 28.9 Uttar Pradesh 60–69 42.9 70–79 30.4 80–89 21.6 90+ 9.6 Total 37.4 Bihar 60–69 47.1 70–79 24.4 80–89 16.4 90+ 10.1 Total 39.6 Sikkim 60–69 46.2 70–79 36.8 80–89 12.9 90+ 0.0 Total 40 Arunachal Pradesh 60–69 28.9 70–79 25.7 80–89 26.9 90+ 10.9 Total 27.6 Nagaland 60–69 60.0 70–79 5.3 80–89 0.0 Total 52.2
Partially dependent
Fully dependent
8.6 2.8 0.0 10.7
56.6 73.8 18.5 51.6
15.7 9.9 8.7 4.3 13.1
48.2 68.6 81.7 89.8 58.0
9.5 8.6 6.5 12.9 9.2
47.5 61.0 71.9 77.6 53.4
14.2 15.2 5.4 0.8 13.7
38.7 60.4 78.2 89.0 46.7
26.5 14.7 0.0 0.0 20.4
27.2 48.5 87.1 100.0 39.6
49.6 35.8 47.9 51.5 47.4
21.5 38.5 25.1 37.5 25.0
35.3 16.5 5.6 31.9
4.8 78.1 94.4 15.9 (continued)
3.4 Disability of the Elderly
133
Table 3.5a (continued) Age group Manipur 60–69 70–79 80–89 90+ Total Mizoram 60–69 70–79 80–89 90+ Total Tripura 60–69 70–79 80–89 90+ Total Meghalaya 60–69 70–79 80–89 90+ Total Assam 60–69 70–79 80–89 90+ Total West Bengal 60–69 70–79 80–89 90+ Total Jharkhand 60–69 70–79
Extent of dependence Not dependent
Partially dependent
Fully dependent
30.4 17.1 5.8 0.0 25.1
34.6 34.7 12.6 0.0 33.3
34.9 48.2 81.6 100.0 41.7
47.0 34.1 23.9 68.8 43.2
26.8 11.0 13.1 0.0 22.4
26.3 54.9 63.0 31.2 34.4
39.2 27.6 5.1 1.5 32.0
15.4 10.6 11.0 0.0 13.2
45.4 61.8 83.9 98.5 54.9
42.2 42.4 15.0 30.2 41.2
24.0 6.3 3.9 0.0 20.5
33.8 51.3 81.0 69.8 38.4
35.1 24.9 7.9 0.0 32.0
17.9 12.2 4.6 9.0 16.3
47.1 62.9 87.5 91.0 51.7
36.4 24.5 27.4 11.9 32.1
12.6 13.2 6.8 0.0 12.2
51.0 62.2 65.8 88.1 55.7
44.1 30.4
15.7 13.5
40.2 56.1 (continued)
3 Economic Dependence and Physical Disability …
134 Table 3.5a (continued) Age group
Extent of dependence Not dependent
80–89 7.7 90+ 14.3 Total 38.5 Orissa 60–69 34.0 70–79 15.4 80–89 8.5 90+ 1.6 Total 28.1 Chhattisgarh 60–69 39.2 70–79 38.7 80–89 31.3 90+ 0.0 Total 38.6 Madhya Pradesh 60–69 45.0 70–79 25.1 80–89 16.2 90+ 4.8 Total 38.1 Gujarat 60–69 36.4 70–79 27.3 80–89 3.5 90+ 0.0 Total 31.2 Daman & Diu 60–69 21.6 70–79 41.9 80–89 0.0 Total 23.5 Dadra & Nagar Haveli 60–69 20.3 70–79 4.7 80–89 0.0 90+ 0.0 Total 15.3
Partially dependent
Fully dependent
9.7 1.5 14.5
82.6 84.2 47.1
18.7 14.3 4.5 0.0 16.7
47.4 70.3 86.9 98.4 55.2
12.3 6.2 10.8 0.0 11.0
48.5 55.1 57.9 100.0 50.4
12.3 9.7 6.4 1.7 11.2
42.7 65.2 77.4 93.5 50.7
13.5 8.4 7.7 4.0 11.6
50.1 64.3 88.8 96.0 57.1
12.9 2.4 22.4 11.8
65.5 55.7 77.6 64.7
50.2 37.8 0.0 0.0 45.1
29.5 57.5 100.0 100.0 39.6 (continued)
3.4 Disability of the Elderly
135
Table 3.5a (continued) Age group Maharashtra 60–69 70–79 80–89 90+ Total Andhra Pradesh 60–69 70–79 80–89 90+ Total Karnataka 60–69 70–79 80–89 90+ Total Goa 60–69 70–79 80–89 90+ Total Lakshadweep 60–69 70–79 80–89 90+ Total Kerala 60–69 70–79 80–89 90+ Total Tamil Nadu 60–69 70–79 80–89
Extent of dependence Not dependent
Partially dependent
Fully dependent
38.5 25.7 26.0 3.5 33.6
15.9 13.0 5.6 5.6 14.2
45.6 61.3 68.4 91.0 52.1
40.1 23.1 11.6 15.6 33.4
11.2 11.4 8.4 0.0 10.9
48.7 65.5 80.0 84.4 55.7
41.3 22.8 12.9 0.0 35.0
12.2 9.9 9.2 6.1 11.5
46.5 67.3 77.9 93.9 53.5
47.8 27.2 26.1 80.8 42.1
13.7 24.3 36.3 0.0 18.1
38.5 48.5 37.6 19.2 39.7
18.6 8.6 23.5 0.0 15.2
33.0 32.6 8.0 0.0 29.5
48.4 58.8 68.5 100.0 55.3
31.1 18.6 11.4 1.1 24.3
20.0 17.5 17.3 17.8 18.8
48.9 63.9 71.3 81.1 56.9
40.7 24.4 18.1
16.3 14.2 8.0
43.0 61.5 73.9 (continued)
3 Economic Dependence and Physical Disability …
136 Table 3.5a (continued) Age group
Extent of dependence Not dependent
90+ 12.0 Total 34.5 Pondicherry 60–69 35.4 70–79 41.8 80–89 10.5 90+ 0.0 Total 35.1 Andaman & Nicobar Islands 60–69 70.9 70–79 74.5 80–89 51.7 90+ 94.4 Total 70.6 India 60–69 39.8 70–79 25.3 80–89 17.2 90+ 8.1 Total 34.0 Source of data: NSSO, 60th round
Partially dependent
Fully dependent
2.2 15.1
85.8 50.4
13.1 18.0 35.4 0.0 16.6
51.5 40.3 54.1 100.0 48.3
5.9 6.4 0.0 0.0 5.2
23.1 19.1 48.3 5.6 24.1
14.3 12.7 9.9 6.9 13.4
45.9 62.0 72.9 85.0 52.6
share varies across the states, in a range of the lowest 14% in Bihar to 35.7% in Rajasthan. In nearly ten states, the share of the aged in the disabled population is greater than that of the country (see Fig. 3.3). On these disability shares, Rajasthan has the highest level (35.7%), followed by Himachal Pradesh (31.4%), Kerala (29.5%) and Chhattisgarh (28%). The share of the aged disabled population to the total disabled population, classified in terms of the place of residence and gender, is given in Table 3.9. Irrespective of gender, the proportions of the aged disabled population are more in rural India than in urban India. In all states and union territories except Chandigarh, Tripura, Daman & Diu and Puducherry, rural areas have relatively higher proportions of the aged disabled population. The share of the disabled being greater than their population share indicates the extent of vulnerability to disability in old age. This phenomenon is consistently higher for elderly males when compared with their female counterparts. The substantial share of the disability among the elderly population raises multiple concerns regarding its burden and implications. The gender aspect of the share of the aged disabled population across states is shown in Fig. 3.4. When compared with aged disabled men, the proportion of aged
3.4 Disability of the Elderly
137
Table 3.5b Age-wise distribution of old aged people by economic dependence in the states of India, 2014 Age group
State of economic independence Not dependent Partially dependent
Jammu & Kashmir 60–69 29.3 70–79 14.2 80–89 6.7 90+ 0.0 Total 22.3 Himachal Pradesh 60–69 42.9 70–79 38.9 80–89 20.5 90+ 6.6 Total 38.9 Punjab 60–69 35.8 70–79 17.2 80–89 6.0 90+ 1.6 Total 26.9 Chandigarh 60–69 76.7 70–79 90.2 80–89 5.1 90+ 100.0 Total 64.0 Uttaranchal 60–69 25.5 70–79 12.4 80–89 1.2 90+ 100.0 Total 19.4 Haryana 60–69 37.5 70–79 11.6 80–89 30.8 90+ 8.1 Total 29.8 Delhi 60–69 31.5
Fully dependent
20.6 8.6 4.8 9.7 15.7
50.1 77.2 88.5 90.3 62.0
28.1 22.4 29.6 0.0 25.8
28.9 38.6 49.9 93.4 35.3
11.4 14.6 2.4 1.3 10.9
52.9 68.2 91.7 97.1 62.3
12.9 3.1 3.4 0.0 8.2
10.4 6.7 91.5 0.0 27.8
21.7 8.4 0.4 0.0 15.6
52.8 79.1 98.3 0.0 65.0
24.4 38.6 22.8 3.9 28.0
38.2 49.8 46.4 88.0 42.2
14.6
53.9 (continued)
3 Economic Dependence and Physical Disability …
138 Table 3.5b (continued) Age group
State of economic independence Not dependent Partially dependent
70–79 15.4 80–89 46.8 90+ 0.0 Total 27.7 Rajasthan 60–69 31.2 70–79 21.9 80–89 10.3 90+ 1.5 Total 25.5 Uttar Pradesh 60–69 37.5 70–79 16.1 80–89 12.0 90+ 28.2 Total 30.0 Bihar 60–69 36.3 70–79 30.6 80–89 13.7 90+ 0.6 Total 34.2 Sikkim 60–69 65.7 70–79 15.5 80–89 57.6 90+ 0.0 Total 54.4 Arunachal Pradesh 60–69 29.1 70–79 28.8 80–89 0.0 Total 27.7 Nagaland 60–69 46.5 70–79 57.2 80–89 23.5 90+ 0.0 Total 47.8
Fully dependent
11.1 17.8 0.0 13.8
73.5 35.4 100.0 58.5
29.5 16.7 4.1 3.8 22.4
39.3 61.3 85.6 94.7 52.1
15.9 11.8 7.3 2.4 14.1
46.5 72.1 80.7 69.4 55.9
25.8 12.0 3.2 41.8 22.8
37.8 57.4 83.0 57.6 43.0
14.5 44.5 2.2 0.0 20.5
19.8 40.1 40.1 100.0 25.2
36 29.6 9.6 32.5
34.9 41.6 90.4 39.8
40.1 8.3 43.8 0.0 36.0
13.4 34.5 32.7 100.0 16.3 (continued)
3.4 Disability of the Elderly
139
Table 3.5b (continued) Age group Manipur 60–69 70–79 80–89 Total Mizoram 60–69 70–79 80–89 90+ Total Tripura 60–69 70–79 80–89 90+ Total Meghalaya 60–69 70–79 80–89 90+ Total Assam 60–69 70–79 80–89 90+ Total West Bengal 60–69 70–79 80–89 90+ Total Jharkhand 60–69 70–79 80–89
State of economic independence Not dependent Partially dependent
Fully dependent
21.1 12.8 0.0 18.1
48.4 20.9 48.6 40.8
30.5 66.3 51.4 41.0
52.9 34.7 1.1 8.3 43
25.7 43.1 37.5 0.0 31.9
21.4 22.2 61.4 91.7 25.0
38.8 19.3 7.8 0.6 30.4
20.3 18.9 4.8 1.2 18.2
40.8 61.8 87.4 98.2 51.5
45.2 6.2 1.4 0.0 32.5
33.7 30.7 51.6 1.9 33.3
21.1 63.1 47.0 98.1 34.2
20.2 25.7 0.5 0.0 20.5
32.0 10.8 9.3 0.0 22.7
47.8 63.5 90.2 100.0 56.8
36.8 27.2 23.2 1.2 32.4
19.5 9.9 10.2 6.3 15.6
43.7 62.8 66.6 92.6 51.9
15.7 11.9 12.1
41.0 30.7 3.2
43.3 57.4 84.7 (continued)
3 Economic Dependence and Physical Disability …
140 Table 3.5b (continued) Age group
State of economic independence Not dependent Partially dependent
90+ 27.3 Total 14.8 Orissa 60–69 30.2 70–79 13.2 80–89 4.6 90+ 1.7 Total 23.0 Chhattisgarh 60–69 54.9 70–79 50.9 80–89 18.8 90+ 33.8 Total 52.9 Madhya Pradesh 60–69 33.4 70–79 28.7 80–89 26.8 90+ 4.9 Total 31.0 Gujarat 60–69 27.1 70–79 10.7 80–89 2.6 90+ 0.0 Total 19.6 Daman & Diu 60–69 0.2 70–79 39.6 80–89 0.0 90+ 0.0 Total 22.9 Dadra & Nagar Haveli 60–69 2.5 70–79 0.0 90+ 0.0 Total 1.9 Maharashtra 60–69 30.1
Fully dependent
0.0 37.3
72.7 47.9
27.0 22.3 22.3 0.4 24.8
42.9 64.5 73.1 98.0 52.1
21.7 6.4 30.2 22.6 19.3
23.4 42.6 51.0 43.6 27.8
20.9 13.1 19.0 37.5 19.0
45.8 58.2 54.1 57.6 49.9
15.1 20.2 3.3 0.0 15.6
57.8 69.0 94.1 100.0 64.8
44.1 0.5 0.0 0.0 18.7
55.6 59.9 100.0 100.0 58.4
32.8 37.3 0.0 33.6
64.7 62.7 100.0 64.5
20.4
49.4 (continued)
3.4 Disability of the Elderly
141
Table 3.5b (continued) Age group
State of economic independence Not dependent Partially dependent
Fully dependent
70–79 80–89 90+ Total Andhra Pradesh 60–69 70–79 80–89 90+ Total Karnataka 60–69 70–79 80–89 90+ Total Goa 60–69 70–79 80–89 90+ Total Lakshadweep 60–69 70–79 80–89 Total Kerala 60–69 70–79 80–89 90+ Total Tamil Nadu 60–69 70–79 80–89 90+ Total
24.6 2.2 1.6 26.4
12.2 15.0 2.5 17.5
63.3 82.9 95.8 56.1
34.4 17.3 27.8 1.5 29.8
16.8 7.0 8.0 0.0 14.0
48.8 75.7 64.1 98.5 56.1
31.3 24.7 21.4 0.0 28.4
20.8 19.3 5.1 1.0 19.1
47.9 56.0 73.5 99.0 52.5
44.0 10.6 0.0 0.0 36.7
18.1 36.5 8.3 0.0 20.8
38.0 53.0 91.7 100.0 42.5
50.2 24.9 0.0 32.8
14.5 29.8 0.0 12.4
35.3 45.3 100.0 54.8
33.3 25.7 12.3 18.2 29.0
19.4 25.7 23.6 20.4 21.6
47.3 48.6 64.1 61.4 49.4
30.1 18.5 15.8 12.6 25.8
26.9 36.7 25.6 44.8 29.7
42.9 44.8 58.6 42.6 44.5 (continued)
3 Economic Dependence and Physical Disability …
142 Table 3.5b (continued) Age group
State of economic independence Not dependent Partially dependent
Puducherry 60–69 46.0 70–79 43.7 80–89 0.0 90+ 0.0 Total 44.0 Andaman & Nicobar Islands 60–69 69.9 70–79 63.3 80–89 24.5 90+ 76.9 Total 60.1 Telangana 60–69 32.7 70–79 41.2 80–89 1.0 90+ 1.1 Total 31.8 India 60–69 33.0 70–79 22.1 80–89 12.7 90+ 7.3 Total 28.3 Source of data: NSSO, 71st round
Fully dependent
31.6 23.9 28.8 0.0 28.7
22.4 32.5 71.2 100.0 27.3
10.0 9.8 2.7 0.0 8.6
20.2 27 72.8 23.1 31.3
24.1 20.7 20.7 2.1 22.6
43.2 38.1 78.2 96.8 45.6
22.0 17.7 13.0 10.7 20.0
45.0 60.2 74.3 82.0 51.7
disabled women is relatively high in Gujarat, Punjab, Madhya Pradesh, Haryana, Kerala, Himachal Pradesh, Chhattisgarh and Rajasthan. The male–female differentials are relatively less in Bihar, Karnataka, Tamil Nadu, West Bengal, Maharashtra and Sikkim. The progression rate of the aged disabled population is given in Table 3.10. The first progression rate (S1) gives an idea of the proportion of the disabled population aged 70 to that aged 60. The second progression rate (S2) is the proportion of the disabled population aged 80 to the disabled population of 70 years of age. And the third progression rate (S3) is the proportion of the disabled population aged 90 to the disabled population aged 80. The progression rates of men are relatively lower than those of women in India. In other words, disabled women are less likely to survive than their male counterparts in old age. Another noteworthy aspect is that irrespective of whether they are males or females, the progression rates significantly vary across states. The rates are higher in Himachal Pradesh and Rajasthan (S1
3.4 Disability of the Elderly
143
Table 3.6a Percentage distribution of old aged persons with economic dependence by regions India, 2004–05 Regions of India
Extent of economic dependence on others Not dependent Partially dependent
Fully dependent
Rural North 30.9 18.9 50.2 Central 37.6 9.9 52.5 East 32.7 14.7 52.6 North-east 31.4 18.8 49.8 West 33.1 14.0 52.9 South 30.9 14.7 54.5 Total 33.2 14.1 52.7 Urban North 36.3 12.0 51.7 Central 38.2 9.4 52.4 East 39.4 10.5 50.1 North-east 41.0 14.7 44.3 West 33.0 12.8 54.3 South 35.7 12.1 52.2 Total 36.3 11.5 52.2 Total (Rural + Urban) North 32.2 17.2 50.6 Central 37.7 9.8 52.5 East 34.1 13.8 52.1 North-east 32.6 18.3 49.1 West 33.1 13.6 53.4 South 32.2 14.0 53.9 Total 34.0 13.4 52.6 Note: North = Chandigarh, Delhi, Haryana, Himachal Pradesh, Jammu & Kashmir, Punjab, Rajasthan, Uttarakhand; Central = Chhattisgarh, Madhya Pradesh, Uttar Pradesh; East = Bihar, Jharkhand, Odisha, West Bengal; North-east = Arunachal Pradesh, Assam, Manipur, Meghalaya, Mizoram, Nagaland, Sikkim, Tripura; West = Dadra & Nagar Haveli, Daman & Diu, Goa, Gujarat, Maharashtra; South = Andaman & Nicobar Islands, Andhra Pradesh, Karnataka, Kerala, Lakshadweep, Puducherry, Tamil Nadu, Telangana Source of data: NSSO, 60th round
greater than 0.60). The lowest progression rates are in Bihar, Jharkhand, Andhra Pradesh and Tamil Nadu (S1 value less than 0.45). The facts discussed so far are the distributional aspects of the disabled elderly, using the information obtained from the Census of India 2011. The magnitude of disability among senior persons across states is vividly clear in the disability rates. The disability rates of the aged in terms of gender, place of residence and state are given in Table 3.11. The disability rate is the number of disabled elderly persons per 100 elderly. The disability rate of the elderly in India is 5.18. In other words,
144
3 Economic Dependence and Physical Disability …
Table 3.6b Percentage distribution of old aged persons with economic dependence by regions India, 2014 Regions of India
State of economic independence Not dependent Partially dependent
Fully dependent
Rural North 24.1 22.8 53.0 Central 29.8 17.2 53.0 East 26.7 24.3 49.0 North-east 22.4 25.2 52.4 West 24.6 20.4 55.0 South 26.7 22.0 51.3 Total 26.6 21.5 51.9 Urban North 34.2 13.5 52.3 Central 39.1 10.8 50.1 East 35.5 15.6 48.9 North-east 29.1 20.5 50.4 West 24.2 12.5 63.2 South 31.0 23.2 45.8 Total 31.9 16.9 51.2 Total (Rural + Urban) North 27.1 20.1 52.8 Central 31.9 15.7 52.4 East 28.7 22.3 49.0 North-east 23.5 24.4 52.1 West 24.5 17.0 58.5 South 28.4 22.4 49.1 Total 28.3 20.0 51.7 Note: North = Chandigarh, Delhi, Haryana, Himachal Pradesh, Jammu & Kashmir, Punjab, Rajasthan, Uttarakhand; Central = Chhattisgarh, Madhya Pradesh, Uttar Pradesh; East = Bihar, Jharkhand, Odisha, West Bengal; North-east = Arunachal Pradesh, Assam, Manipur, Meghalaya, Mizoram, Nagaland, Sikkim, Tripura; West = Dadra & Nagar Haveli, Daman & Diu, Goa, Gujarat, Maharashtra; South = Andaman & Nicobar Islands, Andhra Pradesh, Karnataka, Kerala, Lakshadweep, Puducherry, Tamil Nadu, Telangana Source of data: NSSO, 71st round
for every 100 old persons, five are disabled. Around 14 states in India show a disability rate that is higher than that of the country. The highest disability rates were reported in Sikkim (11.1%), followed by Rajasthan (10.9%), Jammu & Kashmir (9.1%), Chhattisgarh (8.7%), Odisha (8.24%) and Arunachal Pradesh (7.6%). Among the states, the lowest disability rate was reported in Tamil Nadu (2.5%), followed by Karnataka (3.8%), Meghalaya (3.9%), Gujarat (4%), Mizoram (4.2%), Punjab (4.24%), Bihar (4.25%) and Uttar Pradesh (4.3%).
3.4 Disability of the Elderly
145
Table 3.7a Age-wise distribution of old aged persons with economic dependence by regions India, 2004–05 (%) Regions
Age group
Extent of economic dependence on others Not dependent Partially dependent Fully dependent
60–69 38.5 17.3 44.2 70–79 25.1 17.1 57.8 80–89 14.7 17.7 67.6 90+ 10.4 12.5 77.1 Total 32.2 17.2 50.6 Central 60–69 43.1 10.5 46.4 70–79 29.7 8.7 61.5 80–89 21.0 6.7 72.3 90+ 8.1 9.6 82.4 Total 37.7 9.8 52.5 East 60–69 39.9 14.7 45.4 70–79 23.2 14.0 62.8 80–89 19.5 6.3 74.2 90+ 10.4 0.5 89.1 Total 34.1 13.8 52.1 North-east 60–69 36.3 20.1 43.6 70–79 25.9 14.2 59.9 80–89 8.2 7.8 84.0 90+ 2.0 7.8 90.2 Total 32.6 18.3 49.1 West 60–69 38.0 15.2 46.8 70–79 26.2 11.8 62.0 80–89 19.9 7.0 73.1 90+ 4.0 5.0 91.0 Total 33.1 13.6 53.4 South 60–69 38.9 14.6 46.5 70–79 22.5 13.5 64.0 80–89 13.6 11.5 75.0 90+ 8.4 7.5 84.1 Total 32.2 14.0 53.9 Total 60–69 39.8 14.3 45.9 70–79 25.3 12.7 62.0 80–89 17.2 9.9 72.9 90+ 8.1 6.9 85.0 Total 34.0 13.4 52.6 Note: North = Chandigarh, Delhi, Haryana, Himachal Pradesh, Jammu & Kashmir, Punjab, Rajasthan, Uttarakhand; Central = Chhattisgarh, Madhya Pradesh, Uttar Pradesh; East = Bihar, Jharkhand, Odisha, West Bengal; North-east = Arunachal Pradesh, Assam, Manipur, Meghalaya, Mizoram, Nagaland, Sikkim, Tripura; West = Dadra & Nagar Haveli, Daman & Diu, Goa, Gujarat, Maharashtra; South = Andaman & Nicobar Islands, Andhra Pradesh, Karnataka, Kerala, Lakshadweep, Puducherry, Tamil Nadu, Telangana Source of data: NSSO, 60th round North
3 Economic Dependence and Physical Disability …
146
Table 3.7b Age-wise distribution of old aged persons with economic dependence by regions India, 2014 (%) Region
Age group
State of economic independence Not dependent Partially dependent
Fully dependent
60–69 33.7 23.1 43.2 70–79 20.1 19.1 60.8 80–89 13.3 8.4 78.3 90+ 2.1 3.3 94.6 Total 27.1 20.1 52.8 Central 60–69 37.9 17.7 44.4 70–79 21.1 11.9 67.0 80–89 16.4 11.5 72.1 90+ 19.3 16.5 64.2 Total 31.9 15.7 52.4 East 60–69 32.4 26.0 41.5 70–79 23.4 15.0 61.6 80–89 14.5 12.5 73.0 90+ 1.5 12.9 85.5 Total 28.7 22.3 49.0 North-east 60–69 25.6 32.1 42.3 70–79 24.9 13.6 61.6 80–89 1.5 12.4 86.0 90+ 0.2 0.5 99.3 Total 23.5 24.4 52.1 West 60–69 29.5 18.9 51.6 70–79 20.0 15.0 65.0 80–89 2.3 11.2 86.5 90+ 0.9 1.4 97.6 Total 24.5 17.0 58.5 South 60–69 32.1 22.1 45.8 70–79 23.6 24.6 51.7 80–89 15.4 18.4 66.2 90+ 8.2 15.6 76.2 Total 28.4 22.4 49.1 India 60–69 33.0 22.0 45.0 70–79 22.1 17.7 60.2 80–89 12.7 13.0 74.3 90+ 7.3 10.7 82.0 Total 28.3 20.0 51.7 Note: North = Chandigarh, Delhi, Haryana, Himachal Pradesh, Jammu & Kashmir, Punjab, Rajasthan, Uttarakhand; Central = Chhattisgarh, Madhya Pradesh, Uttar Pradesh; East = Bihar, Jharkhand, Odisha, West Bengal; North-east = Arunachal Pradesh, Assam, Manipur, Meghalaya, Mizoram, Nagaland, Sikkim, Tripura; West = Dadra & Nagar Haveli, Daman & Diu, Goa, Gujarat, Maharashtra; South = Andaman & Nicobar Islands, Andhra Pradesh, Karnataka, Kerala, Lakshadweep, Puducherry, Tamil Nadu, Telangana Source of data: NSSO, 71st round North
1,224,459 257,385 1,343,100 334,093 612,804 315,533 86,321 426,876 726,521 394,706 888,751 1,692,285 379,551 848,287 9779 657,418 2,364,171 102,787 1,127,181 14,986,202
1,042,148 222,680 987,909 290,844 479,498 230,841 68,995 343,104 597,684 367,137 663,180 1,271,107 274,512 715,407 8408 522,545 1,793,343 82,485 890,225 11,824,355
Total number of disabled persons Total Males Females
Andhra Pradesh 2,266,607 Assam 480,065 Bihar 2,331,009 Chhattisgarh 624,937 Gujarat 1,092,302 Haryana 546,374 Himachal Pradesh 155,316 Jharkhand 769,980 Karnataka 1,324,205 Kerala 761,843 Madhya Pradesh 1,551,931 Maharashtra 2,963,392 Punjab 654,063 Rajasthan 1,563,694 Sikkim 18,187 Tamil Nadu 1,179,963 Uttar Pradesh 4,157,514 Uttarakhand 185,272 West Bengal 2,017,406 India 26,810,557 Source of data: Census of India 2011
Major states 491,816 107,682 327,172 174,926 191,513 124,185 48,776 147,684 219,668 224,855 333,712 513,756 121,552 558,192 4527 190,254 660,245 44,373 365,892 5,376,205
247,027 51,868 187,924 79,991 91,616 62,735 24,148 75,865 111,087 101,198 165,753 271,468 66,229 244,632 2475 103,840 351,486 21,409 187,136 2,713,757
244,789 55,814 139,248 94,935 99,897 61,450 24,628 71,819 108,581 123,657 167,959 242,288 55,323 313,560 2052 86,414 308,759 22,964 178,756 2,662,448
60+ years disabled population Total Males Females
Table 3.8 Proportion of aged 60+ disabled population in the major states of India by sex, 2011
21.7 22.4 14.0 28.0 17.5 22.7 31.4 19.2 16.6 29.5 21.5 17.3 18.6 35.7 24.9 16.1 15.9 24.0 18.1 20.1
20.2 20.2 14.0 23.9 15.0 19.9 28.0 17.8 15.3 25.6 18.7 16.0 17.4 28.8 25.3 15.8 14.9 20.8 16.6 18.1
23.5 25.1 14.1 32.6 20.8 26.6 35.7 20.9 18.2 33.7 25.3 19.1 20.2 43.8 24.4 16.5 17.2 27.8 20.1 22.5
Share of 60+ aged disabled Total Males Females
3.4 Disability of the Elderly 147
3 Economic Dependence and Physical Disability …
148
INDIA Bihar UƩar Pradesh Tamil Nadu Karnataka Maharashtra Gujarat West Bengal Punjab Jharkhand Madhya Pradesh Andhra Pradesh Assam Haryana UƩarakhand Sikkim Chhaƫsgarh Kerala Himachal Pradesh Rajasthan
20.1 14.0 15.9 16.1 16.6 17.3 17.5 18.1 18.6 19.2 21.5 21.7 22.4 22.7 24.0 24.9
0.0
5.0
10.0
15.0
20.0
25.0
28.0 29.5 31.4
30.0
35.0
35.7 40.0
Share of old aged disabled populaƟon Fig. 3.3 Share of the aged disabled population by state, 2011. Note: Share is calculated as the ratio of disabled population aged 60+ years to total disabled population expressed in percentage Source of data: Census of India 2011
The disability rates of aged males and females in the country are 5.31 and 5.04, respectively. Irrespective of rural or urban areas, the disability rates have been higher among men than women. Among the various kinds of disabilities, issues related to sight, hearing and movement were found to be relatively predominant among old people (Table 3.12). Generally, the proportion of the elderly with such infirmities increases with age, irrespective of the place of residence, gender or state (Table 3.13).
3.5
The Double Burden: The Co-existence of Economic Dependency and Disability
Economic dependency and disability are highly associated as one would lead to the other, thereby making the person more vulnerable to poverty and disease. In old age, disabled people are more likely to rely on others for financial aid, which enhances the chances of vulnerability. On the other hand, those elderly who are financially dependent on others are less likely to seek health care and consequently become prone to illness and life-threatening conditions. Figure 3.5 shows the association between disability and economic dependency of the elderly at the state level. Elevated levels of economic dependency and disability among the elderly make for a less elderly well-being state.
3.5 The Double Burden: The Co-existence of Economic Dependency and Disability
149
Table 3.9 Proportion of disabled 60+ population to the total disabled in India, 2011 State Andaman & Nicobar Islands Andhra Pradesh Arunachal Pradesh Assam Bihar Chandigarh Chhattisgarh Dadra & Nagar Haveli Daman & Diu Goa Gujarat Haryana Himachal Pradesh Jammu & Kashmir Jharkhand Karnataka Kerala Lakshadweep Madhya Pradesh Maharashtra Manipur Meghalaya Mizoram Nagaland NCT of Delhi Odisha Puducherry Punjab Rajasthan Sikkim Tamil Nadu Tripura Uttar Pradesh Uttarakhand West Bengal India Source: Same as Table 3.8
Persons Rural
Urban
Males Rural
Urban
Females Rural Urban
26.1 25.7 20.5 23.0 14.3 11.0 30.0 16.1 18.0 30.1 19.9 24.8 32.5 24.0 20.7 19.5 30.0 26.3 23.9 20.7 15.9 12.5 20.5 26.1 23.6 27.7 21.4 20.5 39.4 26.0 17.6 20.5 16.9 27.3 18.5 22.0
11.5 13.6 6.4 18.8 11.9 16.4 20.1 8.7 18.3 26.3 14.9 18.7 19.0 20.9 13.9 12.2 28.9 17.6 15.6 13.0 15.9 11.4 16.9 16.5 21.3 18.6 22.0 14.8 22.5 17.4 14.5 21.2 12.7 15.1 17.3 15.6
26.7 23.8 19.2 20.7 14.3 11.3 25.7 12.6 14.6 26.1 16.5 21.5 29.0 22.6 19.1 17.7 26.3 28.2 20.5 18.9 15.8 11.7 19.6 25.0 19.7 25.8 19.9 19.1 31.8 26.4 17.2 17.8 15.7 23.6 16.8 19.8
12.3 12.9 6.0 16.7 12.0 14.5 17.4 8.5 12.4 22.8 13.2 16.8 16.9 18.3 13.4 11.6 24.9 15.4 14.2 12.3 15.5 10.2 16.1 15.6 18.0 17.2 19.3 14.2 18.7 17.8 14.3 18.1 12.0 13.9 16.3 14.4
25.3 27.9 21.9 25.7 14.4 10.4 34.8 20.5 22.7 34.2 24.4 29.5 36.8 25.8 22.7 21.8 34.1 24.5 28.4 23.0 15.9 13.3 21.5 27.3 29.4 29.9 23.2 22.6 48.2 25.5 18.1 23.8 18.3 31.8 20.8 24.8
10.5 14.4 6.9 21.3 11.6 19 23.5 8.9 27.2 30.1 17.0 21.3 21.9 24.4 14.6 12.8 33.2 20.0 17.6 14.0 16.4 12.9 18.0 17.7 25.9 20.4 25.2 15.6 27.4 17.0 14.8 25.1 13.7 16.7 18.6 17.2
150
3 Economic Dependence and Physical Disability …
Fig. 3.4 Classification of major states by proportion of 60+ aged disabled population, 2011. Source of data: Census of India 2011
Among the states, Rajasthan, Orissa, Sikkim and Jammu & Kashmir are the most disadvantaged since these areas have relatively higher levels of disability and financial dependence. The socially and demographically advanced southern states show higher levels of economic dependence even though they have relatively lower levels of disability rates among the elderly. It has been noticed from the disability share that the populace in these states shows more disability in old age when compared with the other stages of life, thereby implying the better health condition of the people.
3.6
Supporting Mechanisms and Coping Strategies
The possible ways to reduce the vulnerability of the elderly may be a great concern for any social policy regime in India. Many programmes are available in both the public and private sectors to reduce the susceptibility of old people. These facilities include old age homes, insurance and free food or ration of food items. The extent to which these measures reach the elderly and disabled people is an area of concern. The quality and affordability of these services in many parts of the country also need to be scrutinized.
3.6 Supporting Mechanisms and Coping Strategies
151
Table 3.10 Progression rate of 60+ disabled populations, 2011 State
Persons S1 S2
S3
Andaman & Nicobar Islands 0.53 0.36 0.26 Andhra Pradesh 0.44 0.30 0.20 Arunachal Pradesh 0.49 0.35 0.24 Assam 0.54 0.38 0.29 Bihar 0.42 0.30 0.26 Chandigarh 0.52 0.42 0.22 Chhattisgarh 0.51 0.32 0.23 Dadra & Nagar Haveli 0.45 0.25 0.17 Daman & Diu 0.54 0.37 0.24 Goa 0.52 0.36 0.18 Gujarat 0.52 0.37 0.27 Haryana 0.54 0.42 0.26 Himachal Pradesh 0.62 0.46 0.28 Jammu & Kashmir 0.56 0.38 0.26 Jharkhand 0.44 0.30 0.23 Karnataka 0.48 0.35 0.23 Kerala 0.56 0.40 0.18 Lakshadweep 0.46 0.37 0.21 Madhya Pradesh 0.54 0.36 0.25 Maharashtra 0.48 0.31 0.25 Manipur 0.52 0.39 0.19 Meghalaya 0.46 0.35 0.27 Mizoram 0.52 0.37 0.17 Nagaland 0.60 0.44 0.28 NCT Of Delhi 0.51 0.39 0.20 Odisha 0.52 0.32 0.20 Puducherry 0.49 0.32 0.16 Punjab 0.50 0.41 0.28 Rajasthan 0.62 0.38 0.21 Sikkim 0.57 0.37 0.17 Tamil Nadu 0.44 0.31 0.17 Tripura 0.57 0.42 0.31 Uttar Pradesh 0.49 0.36 0.28 Uttarakhand 0.56 0.39 0.23 West Bengal 0.47 0.33 0.25 India 0.51 0.35 0.24 Note: S1 = pop70+/pop 60+; S2 = pop80+/pop70+; Source: Same as Table 3.8
Males S1 S2
S3
0.54 0.32 0.21 0.43 0.26 0.18 0.49 0.35 0.23 0.53 0.37 0.29 0.41 0.28 0.25 0.49 0.40 0.18 0.50 0.31 0.22 0.39 0.25 0.2 0.43 0.23 0.18 0.47 0.32 0.16 0.48 0.34 0.24 0.51 0.40 0.24 0.60 0.45 0.26 0.56 0.38 0.27 0.44 0.30 0.22 0.45 0.31 0.21 0.51 0.37 0.16 0.44 0.34 0.09 0.52 0.35 0.24 0.47 0.29 0.23 0.50 0.38 0.18 0.43 0.33 0.25 0.50 0.38 0.14 0.60 0.46 0.29 0.47 0.36 0.19 0.52 0.33 0.19 0.46 0.31 0.14 0.49 0.38 0.26 0.60 0.36 0.19 0.58 0.36 0.13 0.43 0.29 0.16 0.53 0.39 0.27 0.48 0.35 0.28 0.54 0.37 0.22 0.45 0.31 0.23 0.49 0.33 0.22 S3 = pop90+/pop80+
Females S1 S2
S3
0.51 0.45 0.49 0.56 0.42 0.55 0.52 0.50 0.61 0.56 0.56 0.56 0.65 0.57 0.45 0.51 0.60 0.47 0.57 0.49 0.53 0.48 0.54 0.60 0.55 0.52 0.52 0.52 0.64 0.55 0.46 0.60 0.51 0.59 0.50 0.53
0.32 0.21 0.25 0.29 0.27 0.25 0.23 0.14 0.25 0.18 0.29 0.27 0.29 0.25 0.23 0.25 0.19 0.30 0.26 0.26 0.20 0.29 0.19 0.27 0.21 0.21 0.17 0.30 0.23 0.22 0.19 0.34 0.29 0.25 0.27 0.25
0.43 0.33 0.36 0.39 0.32 0.44 0.32 0.25 0.45 0.38 0.4 0.44 0.48 0.38 0.30 0.38 0.43 0.39 0.38 0.34 0.40 0.37 0.37 0.42 0.40 0.31 0.34 0.44 0.39 0.39 0.34 0.45 0.37 0.41 0.35 0.37
3 Economic Dependence and Physical Disability …
152
Table 3.11 Disability rate among aged (60+ years) in India, 2011 (%) Union Territory
Total Total
Males
Andaman & 5.82 6.23 Nicobar Islands Andhra Pradesh 5.94 6.32 Arunachal 7.61 7.26 Pradesh Assam 5.18 4.92 Bihar 4.25 4.58 Chandigarh 3.58 3.63 Chhattisgarh 8.73 8.62 Dadra & Nagar 3.10 3.24 Haveli Daman & Diu 3.52 3.51 Goa 5.65 5.56 Gujarat 4.00 4.08 Haryana 5.66 5.76 Himachal 6.94 7.08 Pradesh Jammu & 9.09 9.13 Kashmir Jharkhand 6.27 6.42 Karnataka 3.79 4.04 Kerala 5.36 5.37 Lakshadweep 6.03 5.72 Madhya Pradesh 5.84 5.98 Maharashtra 4.63 5.17 Manipur 4.30 4.54 Meghalaya 3.93 3.99 Mizoram 4.19 4.31 Nagaland 6.96 6.79 NCT of Delhi 4.36 4.34 Odisha 8.24 8.31 Puducherry 5.47 5.99 Punjab 4.24 4.59 Rajasthan 10.92 10.06 Sikkim 11.11 11.01 Tamil Nadu 2.53 2.84 Tripura 4.60 4.47 Uttar Pradesh 4.28 4.37 Uttarakhand 4.93 4.84 West Bengal 4.73 4.86 India 5.18 5.31 Source: Same as Table 3.8
Females
Rural Total
Males
Females
Urban Total Males
5.30
7.11
7.57
Females
6.52
2.74
3.01
2.39
5.60 8.01
6.38 8.10
6.75 7.74
6.05 8.48
4.72 3.89
5.15 3.71
4.32 4.10
5.45 3.87 3.54 8.83 2.97
5.47 4.27 3.46 9.35 3.64
5.20 4.60 3.93 9.21 3.68
5.74 3.89 2.87 9.47 3.60
3.67 4.03 3.58 6.29 2.21
3.43 4.35 3.62 6.37 2.61
3.93 3.66 3.55 6.21 1.81
3.53 5.72 3.93 5.56 6.80
3.91 6.68 3.94 5.87 7.14
4.51 6.72 4.01 6.02 7.31
3.49 6.65 3.89 5.73 6.99
3.34 4.95 4.09 5.20 4.47
3.08 4.81 4.19 5.21 4.52
3.55 5.07 4.00 5.18 4.41
9.05
10.07
10.20
9.93
6.73
6.52
6.96
6.11 3.57 5.35 6.36 5.71 4.14 4.06 3.87 4.07 7.14 4.39 8.18 5.05 3.89 11.70 11.23 2.25 4.73 4.17 5.00 4.59 5.04
6.75 3.97 5.67 9.46 6.30 4.95 4.35 4.28 5.45 7.55 5.32 8.59 6.21 4.52 12.25 12.42 2.71 4.48 4.29 5.42 5.18 5.59
6.94 4.23 5.72 9.06 6.37 5.56 4.57 4.25 5.36 7.41 5.38 8.68 7.21 4.87 11.26 12.21 3.01 4.32 4.38 5.32 5.39 5.71
6.57 3.74 5.62 9.92 6.22 4.41 4.12 4.31 5.54 7.72 5.26 8.50 5.40 4.16 13.14 12.67 2.42 4.63 4.19 5.52 4.98 5.48
4.57 3.42 5.03 5.13 4.58 4.09 4.21 2.62 3.06 4.69 4.34 6.03 5.15 3.65 6.53 5.36 2.33 4.90 4.22 3.43 3.94 4.18
4.74 3.66 4.98 4.79 4.92 4.53 4.47 2.92 3.31 4.52 4.31 6.01 5.46 3.97 6.23 5.48 2.63 4.83 4.33 3.52 3.99 4.36
4.38 3.19 5.06 5.48 4.27 3.66 3.96 2.38 2.83 4.89 4.37 6.05 4.90 3.31 6.81 5.23 2.05 4.96 4.10 3.32 3.89 4.01
3.6 Supporting Mechanisms and Coping Strategies
153
Table 3.12 Distribution of disabled population by type of disability, gender and place of residence, India 2011 Age group
Type of disability SE HE
SP
MOV
MR
MI
AO
MD
India 60–69 25.2 18.5 4.7 25.6 2.2 2.1 13.6 8.1 70–79 26.3 19.4 3.2 25.6 1.3 1.4 9.9 13.0 80–89 24.5 20.0 2.3 24.5 1.0 1.1 7.9 18.8 90+ 21.1 19.2 2.6 21.5 1.3 1.0 8.7 24.6 Males 60–69 22.9 17.6 5.0 28.6 2.2 2.0 14.1 7.6 70–79 24.7 19.4 3.5 27.5 1.3 1.3 10.6 11.8 80–89 23.6 20.8 2.5 25.3 1.0 1.0 8.5 17.2 90+ 20.8 20.4 3.1 21.7 1.5 1.0 9.7 21.7 Females 60–69 27.7 19.5 4.4 22.4 2.1 2.2 13 8.6 70–79 28.0 19.4 2.8 23.7 1.3 1.5 9.3 14.2 80–89 25.2 19.2 2.0 23.7 1.0 1.2 7.4 20.3 90+ 21.3 18.2 2.2 21.4 1.1 1.0 8.0 26.8 Rural India 60–69 26.1 18.4 4.1 26.0 2.0 2.0 12.8 8.6 70–79 27.3 18.9 2.7 25.6 1.2 1.3 9.2 13.8 80–89 25.4 19.1 1.9 24.5 0.8 0.9 7.3 20.0 90+ 21.6 18.2 2.1 21.9 1.1 0.9 7.8 26.3 Urban India 60–69 22.4 18.9 6.5 24.6 2.5 2.6 15.8 6.6 70–79 22.8 20.9 4.8 25.4 1.7 2.0 12.4 10.1 80–89 21.2 22.8 3.5 24.2 1.4 1.6 10.1 15.0 90+ 19.4 22.4 4.3 20.1 1.9 1.3 11.9 18.7 Note: SE in seeing, HE hearing, SP in speech, MOV movement, MR mental retardation, MI mental illness, AO any other, MD multiple disability Source: Same as Table 3.8
The supporting mechanisms for the elderly can be generally classified into two —public and private interventions, and family intervention. The coping strategies are self-efforts taken by the aged.
3.6.1
Public and Private Health Interventions
The Government of India has come up with many interventions to cope with financial dependency and disability among senior citizens. For instance, at the
3 Economic Dependence and Physical Disability …
154
Table 3.13 Distribution of disabled population by type of disability in India, 2011
India
Jammu & Kashmir
Himachal Pradesh
Punjab
Chandigarh
Uttarakhand
Haryana
NCT of Delhi
Rajasthan
Uttar Pradesh
Age group
Type of disability SE HE SP
MOV
MR
MI
AO
60–69 70–79 80–89 90+ 60–69 70–79 80–89 90+ 60–69 70–79 80–89 90+ 60–69 70–79 80–89 90+ 60–69 70–79 80–89 90+ 60–69 70–79 80–89 90+ 60–69 70–79 80–89 90+ 60–69 70–79 80–89 90+ 60–69 70–79 80–89 90+ 60–69 70–79 80–89 90+
25.2 26.3 24.5 21.1 23.6 25.6 26.4 24.4 22.5 25.8 25.0 19.7 19.1 22.4 22.8 20.4 17.6 16.8 12.2 12.3 25.6 28.3 25.4 20.2 25.8 28.1 26.2 20.0 18.7 16.3 12.7 12.6 27.1 24.9 20.5 15.3 26.2 26.7 25.1 21.6
25.6 25.6 24.5 21.5 19.2 17.9 15.9 14.8 25.7 23.2 20.7 19.3 22.8 22.5 21.8 19.4 34.5 36.8 31.9 24.6 22.3 20.5 18.2 17.1 23.9 22.8 21.1 19.5 39.1 39.8 38.0 32.0 31.4 32.2 31.0 27.8 19.5 21.6 22.4 19.8
2.2 1.3 1.0 1.3 2.3 1.6 1.2 0.9 2.1 1.1 0.7 0.6 3.4 2.2 1.7 1.8 2.2 0.8 0.2 0.9 2.4 1.1 0.8 1.1 2.2 1.3 0.9 1.0 2.0 1.2 0.8 1.3 1.5 0.7 0.4 0.4 2.0 1.3 1.0 1.6
2.1 1.4 1.1 1.0 3.5 2.3 1.6 1.3 2.3 1.3 0.8 1.0 3.7 3.2 2.6 2.9 3.4 3.2 2.4 0.9 2.3 1.5 1.0 0.8 2.2 1.2 0.9 0.7 2.8 1.7 1.3 1.3 1.5 0.6 0.4 0.2 1.2 0.9 0.6 0.8
13.6 8.1 9.9 13.0 7.9 18.8 8.7 24.6 15.5 13.8 11.5 19.1 8.6 24.7 7.4 31.2 13.1 10.8 8.1 14.9 5.6 21.5 4.6 30.9 22.9 5.1 17.8 7.4 13.5 10.4 11.6 16.6 15.0 8.1 9.8 11.1 8.0 16.3 7.0 23.7 12.2 9.9 8.1 14.2 5.9 21.2 5.8 29.2 16.3 8.6 11.1 13.3 7.8 19.7 6.6 28.9 10.8 9.9 7.7 14.5 4.9 21.4 5.8 29.0 7.8 14.1 4.9 21.7 3.5 30.6 3.5 40.7 18.1 6.0 13.7 10.4 11.2 15.4 12.7 18.9 (continued)
18.5 19.4 20.0 19.2 19.5 20.3 20.2 18.9 19.9 23.0 24.0 22.7 20.2 22.0 25.2 25.5 14.7 18.6 25.8 28.1 20.8 23.5 26.0 24.2 18.6 20.3 22.3 22.1 13.5 16.3 19.3 16.5 14.7 14.0 13.0 11.4 22.4 22.1 21.6 21.6
4.7 3.2 2.3 2.6 2.7 1.7 1.3 1.1 3.7 2.6 1.6 1.3 2.7 2.4 2.0 1.8 4.5 2.9 3.2 2.6 4.4 2.7 1.6 1.5 2.4 1.8 1.1 1.2 3.3 2.5 1.6 1.5 1.9 1.0 0.6 0.6 4.5 3.3 2.6 3.0
MD
3.6 Supporting Mechanisms and Coping Strategies
155
Table 3.13 (continued)
Bihar
Sikkim
Arunachal Pradesh
Nagaland
Manipur
Mizoram
Tripura
Meghalaya
Assam
West Bengal
Age group
Type of disability SE HE SP
MOV
MR
MI
AO
60–69 70–79 80–89 90+ 60–69 70–79 80–89 90+ 60–69 70–79 80–89 90+ 60–69 70–79 80–89 90+ 60–69 70–79 80–89 90+ 60–69 70–79 80–89 90+ 60–69 70–79 80–89 90+ 60–69 70–79 80–89 90+ 60–69 70–79 80–89 90+ 60–69 70–79 80–89 90+
26.3 26.8 25.8 24.2 21.8 21.6 24.2 17.1 27.4 27.2 30.3 27.6 18.8 17.9 18.5 15.5 28.2 27.7 20.9 18.4 15.2 15.9 18.2 11.8 26.1 28.8 28.5 23.8 25.6 26.4 26.1 22.9 23.8 23.0 20.4 16.1 27.8 28.3 25.9 23.6
22.2 24.9 25.2 21.7 14.9 13.1 13.9 11.0 14.8 17.1 14.3 14.3 14.7 15.7 13.4 13.4 15.5 16.6 15.6 16.1 14.9 13.5 12.9 4.3 21.9 21.4 20.9 19.9 13.8 14.3 13.0 11.7 20 20.9 22.0 21.6 21.1 20.5 20.1 16.9
2.2 1.6 1.5 1.8 1.4 0.7 0.8 2.4 1.8 1.5 0.8 1.5 2.6 1.6 0.6 0.6 5.6 4.2 2.9 1.2 6.6 4.2 3.0 1.1 4.4 1.3 1.3 1.1 2.6 1.6 1.6 0.8 2.8 1.7 1.3 1.3 3.6 2.4 1.9 2.4
1.3 1.0 0.8 1.0 1.6 1.3 0.9 0.0 2.0 1.4 1.6 1.0 2.1 1.3 1.1 0.2 2.9 2.1 1.8 0.9 4.6 2.7 1.5 1.1 3.7 2.7 2.4 2.4 3.4 2.4 1.4 2.1 3.2 2.6 2.2 2.3 2.9 2.3 2.2 1.9
15.4 5.4 12.4 8.2 10.9 11.3 12.4 13.4 10.8 14.1 11.6 17.4 10.8 18.1 8.5 25.0 7.7 12.2 7.1 14.6 6.4 19.6 3.9 27.1 10.1 11.7 7.7 15.8 5.6 18.8 4.0 26.7 10.3 8.4 9.8 10.7 10.0 15.0 8.6 23.3 8.2 14.2 8.7 14.4 5.2 14.8 4.3 24.7 12 8.7 8.9 14.2 6.5 20.4 5.4 27.8 15.2 8.6 10.6 12.0 9.0 15.8 12.1 18.3 12.4 11.3 10.1 16.4 8.4 23.0 8.4 30.1 13.9 10.2 10.8 15.3 9.1 21.1 10.5 25.1 (continued)
22.1 21.4 21.2 21.2 31.1 31.6 29.5 33.5 30.9 29.0 25.8 24.1 35.0 37.6 40.9 39.1 25.3 26.2 31.2 30.8 30.5 37.3 42.3 52.7 20 20.8 19.0 18.2 28.2 30.3 31.9 29.6 22.8 22.9 21.2 18.9 16.6 17.5 17.4 16.6
5.1 3.8 3.3 4.4 4.3 2.7 1.8 2.4 3.1 2.1 1.4 0.5 5.0 2.5 1.1 0.6 3.8 2.7 2.5 0.6 5.7 3.4 2.1 0.0 3.4 1.9 1.1 1.3 2.6 2.4 1.3 2.5 3.7 2.3 1.4 1.4 3.9 2.9 2.2 2.9
MD
3 Economic Dependence and Physical Disability …
156 Table 3.13 (continued)
Jharkhand
Odisha
Chhattisgarh
Madhya Pradesh
Gujarat
Daman & Diu
Dadra & Nagar Haveli
Maharashtra
Andhra Pradesh
Karnataka
Age group
Type of disability SE HE SP
MOV
MR
MI
AO
60–69 70–79 80–89 90+ 60–69 70–79 80–89 90+ 60–69 70–79 80–89 90+ 60–69 70–79 80–89 90+ 60–69 70–79 80–89 90+ 60–69 70–79 80–89 90+ 60–69 70–79 80–89 90+ 60–69 70–79 80–89 90+ 60–69 70–79 80–89 90+ 60–69 70–79 80–89 90+
24.7 24.0 21.5 19.2 27.0 26.2 23.5 20.0 25.4 23.9 20.0 15.5 24.2 25.8 24.1 20.8 25.9 26.7 25.5 22.3 27.4 14.9 13.1 10.5 19 22.8 20.0 37.5 23.1 26.2 26.1 24.4 27.3 30.3 29.6 25.0 27.7 33.2 34.9 31.7
27.7 29.6 30.6 28.1 26.8 27.2 27.1 26.2 32.5 30.9 31.0 29.0 30.8 29.8 28.5 25.5 24.7 22.5 19.5 16.5 37.1 41.0 29.5 15.8 29.5 21.4 17.5 0.0 25.2 24.1 22.5 18.6 29.1 27.2 24.7 20.7 24.3 21.1 17.5 16.6
2.0 1.2 0.9 1.0 2.1 1.1 0.8 0.9 1.3 0.7 0.5 0.7 2.0 1.1 0.7 1.0 1.8 1.1 0.8 1.0 0.5 1.5 0.0 0.0 2.1 0.0 0.0 12.5 1.6 1.1 0.9 1.6 1.9 1.2 1.1 1.6 2.9 1.8 1.4 1.7
1.6 1.0 0.7 0.8 2.2 1.3 0.8 0.8 1.5 0.7 0.5 0.7 1.5 0.8 0.5 0.4 3.1 2.0 1.5 1.5 4.8 2.2 1.6 0.0 3.0 2.8 0.0 0.0 1.8 1.3 1.0 1.1 1.2 0.8 0.6 0.7 1.5 0.9 0.7 0.7
10.7 9.2 7.7 14.3 6.0 19.5 5.8 25.7 9.3 10.5 6.7 16.4 5.6 22.7 5.5 29.2 7.8 11.6 5.0 18.4 4.2 24.6 4.7 32.1 13.3 8.8 9.1 14.0 7.0 20.2 7.2 27 13.4 6.0 9.6 8.9 7.7 13.9 8.6 20.3 7.5 7.0 3.0 11.9 1.6 13.1 0.0 36.8 6.8 11.8 6.2 6.9 5.0 12.5 0.0 25.0 13.2 4.9 10.3 7.4 8.9 10.8 10.8 13.9 12.9 7.1 10.1 10.5 8.6 14.9 12.2 19.1 15.8 6.2 12.8 8.8 10.8 12.8 10.3 17.9 (continued)
21.2 20.1 18.9 17.8 19.4 19.4 18.4 16.4 18.1 19.2 18.3 16.4 17.0 17.7 17.7 16.7 21.7 26.7 29.5 27.8 12.9 23.1 41.0 36.8 25.7 39.3 42.5 25.0 16.9 20.1 22.1 20.2 14.8 15.9 17.3 16.9 17.6 18.6 19.8 19.4
2.8 2.1 1.8 1.5 2.7 1.7 1.1 1.0 1.9 1.1 0.9 0.9 2.5 1.6 1.3 1.3 3.4 2.5 1.7 2.0 2.7 2.2 0.0 0.0 2.1 0.7 2.5 0.0 13.4 9.5 7.6 9.5 5.6 4.0 3.1 3.7 4.0 2.8 2.0 1.8
MD
3.6 Supporting Mechanisms and Coping Strategies
157
Table 3.13 (continued) Age group
Type of disability SE HE SP
MOV
MR
MI
AO
MD
Goa
60–69 20.3 16.9 11.6 23.8 1.9 4.0 13.9 7.4 70–79 20.6 19.6 6.3 27.4 1.7 2.7 11.7 10.1 80–89 15.8 22.0 3.8 30.7 0.8 2.8 10.3 13.9 90+ 17.2 19.9 5.6 29.8 0.7 1.3 6.0 19.5 Lakshadweep 60–69 29.5 11.6 3.5 32.9 1.2 6.4 5.8 9.2 70–79 31.5 14.1 1.1 26.1 1.1 1.1 10.9 14.1 80–89 28.6 21.4 0.0 35.7 0.0 0.0 0.0 14.3 90+ 9.1 9.1 0.0 27.3 0.0 0.0 0.0 54.5 Kerala 60–69 22.9 13.4 3.7 28.2 2.3 8.6 11.5 9.5 70–79 26.0 18.0 2.6 24.3 1.2 5.3 9.6 13.0 80–89 24.0 22.9 1.7 21.0 0.9 3.3 7.6 18.6 90+ 19.3 23.0 1.0 18.7 0.7 2.1 6.4 28.8 Tamil Nadu 60–69 15.7 21.9 4.5 30 2.4 2.5 17.7 5.4 70–79 19.2 26.0 3.2 26.7 1.6 2.0 15.2 6.1 80–89 21.1 28.2 2.7 24.4 1.3 1.6 12.6 8.1 90+ 21.3 25.2 2.4 23.7 1.6 1.5 11.5 12.9 Puducherry 60–69 17.4 24.6 3.4 34.4 2.3 2.1 10.3 5.5 70–79 17.8 30.3 2.2 33.0 1.4 1.4 7.9 5.9 80–89 19.1 31.7 1.8 29.6 0.9 0.9 6.3 9.7 90+ 18.9 29.3 2.4 20.7 0.6 0.6 6.1 21.3 Andaman & Nicobar 60–69 25.5 22.7 3.6 26.8 2.0 2.7 7.5 9.2 Islands 70–79 27.9 21.6 2.6 26.9 0.6 1.6 3.8 15.0 80–89 21.9 22.4 1.0 23.8 0.5 2.4 3.8 24.3 90+ 13.5 24.3 4.1 18.9 0.0 2.7 2.7 33.8 Note: SE in seeing, HE hearing, SP in speech, MOV movement, MR mental retardation, MI mental illness, AO any other, MD multiple disability Source: Same as Table 3.8
policy level, regulations such as the Mental Health Act 1987, The Persons with Disabilities (Equal Opportunities, Protection of Rights and Full Participation) Act 1995 and the Rehabilitation Council of India Act 1992 may be regarded as crucial policy interventions. Meanwhile, state governments also have their own acts and rules that complement the initiatives of the central government. The Government of India announced the National Policy for Older Persons (NPOP) in 1991 in response to the efforts of the United Nations. Subsequently, the Ministry of Social Justice and Empowerment formulated a legislation named the Maintenance and Welfare of Parents and Senior Citizens Act, 2007. The National Policy for Senior Citizens 2011 is another landmark in the history of public intervention for aged persons. The areas of intervention mentioned in this policy are income security in old age, the Indira Gandhi National Old Age Pension
3 Economic Dependence and Physical Disability …
158
Table 3.14a Percentage distribution of financially dependent old aged persons by the financially supporting persons, rural India, 2004–05 State
Males
Females
Persons
S
OC
GC
O
S
OC
GC
O
S
OC
GC
Andhra Pradesh
10.2
83.5
1.9
4.5
8.2
80.1
2.5
9.2
8.9
81.3
2.3
O 7.5
Arunachal Pradesh
4.8
86.5
0.3
8.4
3.4
87.1
0.2
9.3
4.0
86.9
0.2
8.9
Assam
1.3
94.8
2.3
1.6
6.3
87.2
1.9
4.6
4.0
90.7
2.1
3.2
Bihar
8.5
85.3
2.4
3.8
23.0
70.7
2.3
4.0
17.5
76.3
2.3
3.9
Chhattisgarh
10.6
71.3
3.5
14.7
13.1
68.0
3.7
15.3
12.3
68.9
3.6
15.1
Delhi
5.0
80.8
0.6
13.6
28.2
58.0
5.3
8.5
19.3
66.7
3.5
10.5
Goa
0.0
100
0.0
0.0
41.2
58.8
0.0
0.0
34.8
65.2
0.0
0.0
Gujarat
1.5
93.1
1.9
3.6
14.4
78.5
3.4
3.7
9.6
83.8
2.9
3.7
Haryana
1.4
92.0
0.0
6.6
16.9
76.5
0.9
5.7
10.4
83.0
0.5
6.1
Himachal Pradesh
3.4
85.7
1.8
9.1
18.2
75.0
2.7
4.1
13.4
78.5
2.4
5.7
Jammu & Kashmir
1.9
85.2
3.3
9.6
23.3
72.8
2.9
1.1
15.9
77.1
3.0
4.0
Jharkhand
5.9
85.5
5.4
3.3
15.1
76.6
6.5
1.9
11.0
80.5
6.0
2.5
Karnataka
12.5
78.8
2.6
6.1
8.9
79.5
3.6
8.0
10.2
79.2
3.3
7.3
Kerala
7.9
85.6
0.8
5.6
8.8
83.1
2.6
5.5
8.5
84.0
2.0
5.5
Madhya Pradesh
5.1
82.9
5.7
6.2
21.6
67.5
3.3
7.6
16.2
72.6
4.1
7.1
Maharashtra
9.1
85.7
1.4
3.7
13.8
74.5
2.1
9.7
12.0
78.7
1.8
7.4
Manipur
15.3
75.2
6.7
2.9
8.2
77.9
4.6
9.2
11.7
76.6
5.6
6.1
Meghalaya
3.8
96.2
0.0
0.0
2.1
88.9
0.0
9.0
2.7
91.5
0.0
5.7
Mizoram
21.8
78.2
0.0
0.0
29.3
66.5
0.0
4.2
26.1
71.5
0.0
2.4
Nagaland
7.3
82.7
10.1
0.0
15.3
84.7
0.0
0.0
10.2
83.4
6.4
0.0
Orissa
13.1
78.5
2.5
5.9
15.2
74.9
4.3
5.5
14.4
76.3
3.6
5.7
Punjab
8.6
85.6
2.8
3.1
25.6
70.2
4.0
0.2
19.0
76.1
3.5
1.3
Rajasthan
2.9
85.5
3.4
8.2
19.5
72.8
4.6
3.1
13.6
77.3
4.2
4.9
Sikkim
2.5
88.9
4.0
4.5
33.0
53.6
7.2
6.2
22.8
65.4
6.1
5.6
Tamil Nadu
9.9
86.7
1.2
2.2
10.9
78.8
3.0
7.2
10.5
81.9
2.3
5.3
Tripura
2.2
91.3
2.1
4.4
9.6
79.6
7.3
3.5
6.3
84.8
5.0
3.9
Uttaranchal
9.9
83.8
4.4
1.9
20.5
75.4
2.7
1.4
16.4
78.6
3.4
1.6
Uttar Pradesh
3.2
83.8
1.4
11.6
23.6
67.2
2.6
6.6
17.2
72.4
2.2
8.2
West Bengal
6.6
86.9
2.5
4.0
11.2
78.7
4.8
5.3
9.5
81.6
4.0
4.9
Andaman & Nicobar Islands
35.7
61.9
0.0
2.4
29.9
60.1
6.4
3.7
32.3
60.9
3.7
3.1
Chandigarh
100.0
0.0
0.0
0.0
28.4
27.6
0.0
44
30.0
27.0
0.0
43
Dadra
0.0
85.4
0.0
14.6
0.0
100
0.0
0.0
0.0
90.4
0.0
9.6
Daman
66.0
34.0
0.0
0.0
15.5
72.8
0.0
11.7
20.3
69.2
0.0
10.6
Lakshadweep
0.0
77.2
0.0
22.8
2.4
75.1
8.5
14
1.4
75.9
5.1
17.6
Pondicherry
0.0
100.0
0.0
0.0
0.0
90.2
0.0
9.8
0.0
93.8
0.0
6.2
All-India
7.0
85.0
2.2
5.7
15.9
74.6
3.1
6.3
12.7
78.4
2.8
6.1
Note: S spouse, OC own children, GC grand children, O others Source of data: NSSO, 60th round
3.6 Supporting Mechanisms and Coping Strategies
159
Table 3.14b Percentage distribution of financially dependent old aged persons by the financially supporting persons, rural India, 2014 State
Male
Female
Total
S
OC
GC
O
S
OC
GC
O
S
OC
GC
O
Jammu & Kashmir
12.9
84.3
0.5
2.4
17.9
81.3
0.5
0.4
15.5
82.7
0.5
1.3
Himachal Pradesh
3.5
92.4
1.0
3.0
34.4
57.3
5.1
3.3
24.6
68.5
3.8
3.2
Punjab
0.0
96.3
1.2
2.4
23.6
69.7
4.4
2.3
15.3
79.0
3.3
2.3
Chandigarh
0.0
100.0
0.0
0.0
0.0
100.0
0.0
0.0
0.0
100.0
0.0
0.0
Uttaranchal
0.0
100.0
0.0
0.0
7.5
74.4
9.3
8.8
5.2
82.3
6.4
6.1
Haryana
0.0
93.7
0.3
6.1
10.8
86.5
0.3
2.4
6.7
89.2
0.3
3.8
Delhi
0.0
100.0
0.0
0.0
3.4
90.0
6.5
0.0
1.1
96.9
2.0
Rajasthan
2.0
92.8
1.5
3.7
14.1
78.9
2.8
4.2
10.1
83.5
2.3
4.1
Uttar Pradesh
3.8
91.4
1.3
3.5
17.5
75.5
2.8
4.1
12.0
82.0
2.2
3.9
Bihar
1.6
92.7
4.1
1.6
21.5
77.4
0.5
0.7
12.7
84.1
2.1
1.1
Sikkim
0.0
93.7
0.0
6.3
23.3
75.9
0.0
0.8
16.2
81.4
0.0
2.5
Arunachal Pradesh
7.8
89.9
0.0
2.3
14.2
72.2
0.0
13.7
10.9
81.2
0.0
7.9
Nagaland
0.6
65.5
0.0
33.8
25.9
74.0
0.0
0.1
17.7
71.3
0.0
11
Manipur
9.9
89.8
0.0
0.3
4.7
89.8
0.2
5.3
7.1
89.8
0.1
3.0
Mizoram
0.0
99.8
0.0
0.2
26.9
70.9
2.2
0.0
18.4
80.0
1.5
0.1
0.0
Tripura
0.0
98.1
1.9
0.0
0.9
84.5
13.4
1.3
0.6
89.1
9.5
0.8
Meghalaya
0.6
80.4
17.6
1.3
0.8
78.6
20.6
0.0
0.7
79.5
19.1
0.7
Assam
4.1
87.4
2.6
6.0
28.6
67.1
1.8
2.6
18.1
75.7
2.1
4.0
West Bengal
11.5
85.6
0.1
2.7
13.1
80.7
0.6
5.6
12.5
82.6
0.4
4.5
Jharkhand
0.0
97.9
1.8
0.3
15.8
71.5
1.6
11.1
8.4
83.9
1.7
6.0
Orissa
4.7
90.0
1.2
4.1
17.6
74.9
2.3
5.2
11.6
82.0
1.8
4.7
Chhattisgarh
1.0
82.9
11.5
4.6
6.4
68.2
5.0
20.5
3.9
75.0
8.0
13.1
Madhya Pradesh
0.0
96.8
2.3
0.8
19.4
72.6
3.2
4.8
13.5
79.9
3.0
3.6
Gujarat
0.7
90.1
7.1
2.0
13.3
75.7
4.8
6.2
9.0
80.6
5.6
4.8
Daman & Diu
0.0
100.0
0.0
0.0
0.4
99.6
0.0
0.0
0.3
99.7
0.0
0.0
Dadra & Nagar Haveli
0.0
100.0
0.0
0.0
2.7
94.9
2.4
0.0
1.7
96.9
1.4
0.0
Maharashtra
5.5
92.0
1.2
1.2
16.2
78.8
1.2
3.8
12.4
83.6
1.2
2.9
Andhra Pradesh
2.8
90.8
2.9
3.4
4.7
76.8
3.8
14.6
4.0
82.1
3.5
10.4
Karnataka
5.6
91.4
1.5
1.5
12.9
75.5
4.2
7.4
10.1
81.6
3.2
5.1
Goa
4.7
89.2
0.0
6.1
15.9
76.3
0.0
7.8
9.6
83.6
0.0
6.8
Lakshadweep
0.0
52.3
0.0
47.7
0.0
91.9
6.5
1.7
0.0
70.9
3.0
26.1
Kerala
4.2
91.6
0.0
4.1
13.3
78.6
1.7
6.3
10.1
83.3
1.1
5.5
Tamil Nadu
6.6
91.4
0.4
1.5
14
77.5
1.1
7.4
11.1
83.1
0.8
5.0
Puducherry
0.0
100.0
0.0
0.0
0.0
100.0
0.0
0.0
0.0
100.0
0.0
0.0
Andaman & Nicobar Islands
0.0
79.8
0.0
20.2
25.7
69.6
0.0
4.7
13.1
74.6
0.0
12.3
Telangana
0.3
97.2
0.7
1.9
8.4
74.0
8.0
9.7
6.3
79.8
6.2
7.7
Total
3.9
91.6
1.8
2.7
15.6
76.1
2.7
5.6
11.1
82.1
2.3
4.5
Note: S spouse, OC own children, GC grand children, O others Source of data: NSSO, 71st round
3 Economic Dependence and Physical Disability …
160
Table 3.15a Percentage distribution of financially dependent old aged persons by the financially supporting persons, urban India, 2004–05 State
Males S
Females OC
GC
O
S
OC
Persons GC
O
S
OC
GC
O
Andhra Pradesh
5.1
88.0
1.5
5.4
17.5
74.8
2.1
5.6
13.4
79.2
1.9
5.5
Arunachal Pradesh
0.0
85.5
0.0
14.5
1.1
78.0
4.5
16.3
0.6
81.8
2.2
15.4
Assam
14.7
82.7
0.0
2.6
15.2
83.3
0.0
1.5
15.0
83.0
0.0
2.0
Bihar
5.3
91.1
0.1
3.5
30.9
66.4
0.8
1.8
19.2
77.7
0.5
2.6
Chhattisgarh Delhi
21.6
72.4
6.0
0.0
23.3
65.9
4.8
6.0
22.7
67.9
5.2
4.2
7.7
83.8
8.2
0.3
28.7
56.4
11.4
3.4
21.9
65.3
10.4
2.4
Goa
8.5
65.9
0.0
25.5
11.7
76.6
0.5
11.2
10.6
72.7
0.3
16.4
Gujarat
5.1
89.5
3.6
1.8
19.4
74.8
2.0
3.7
14.7
79.6
2.5
3.1
Haryana
8.8
88.2
1.2
1.8
15.4
78.3
0.8
5.4
13.2
81.6
1.0
4.2
Himachal Pradesh
0.0
94.3
0.0
5.7
23.3
72.7
2.0
2.0
17.1
78.5
1.4
3.0
Jammu & Kashmir
0.0
92.9
0.0
7.1
23.1
74.6
0.0
2.3
15.3
80.7
0.0
3.9
Jharkhand
4.4
95.1
0.0
0.5
21.3
72.2
1.8
4.7
14.8
81.0
1.1
3.1
Karnataka
6.7
84.7
2.5
6.0
13.2
76.0
4.1
6.6
11.0
79.0
3.6
6.4
Kerala
7.4
81.0
0.0
11.6
10.1
76.5
1.8
11.7
9.1
78.1
1.1
11.6
Madhya Pradesh
4.2
85.1
2.4
8.3
24.6
65.9
2.9
6.5
18.7
71.5
2.8
7.0
Maharashtra
1.9
93.2
1.1
3.9
15.3
75.1
2.1
7.4
10.4
81.7
1.7
6.1
Manipur
29.2
70.5
0.2
0.0
17.2
73.2
0.6
9.0
22.2
72.1
0.4
5.3
Meghalaya
10.7
89.3
0.0
0.0
8.7
88.1
0.0
3.2
8.9
88.2
0.0
2.9
Mizoram
3.6
87.8
0.0
8.6
16.6
80.1
0.7
2.5
11.4
83.2
0.4
5.0
Nagaland
0.0
100.0
0.0
0.0
62.2
37.8
0.0
0.0
12.3
87.7
0.0
0.0
Orissa
6.9
80.8
4.4
7.9
13.9
79.6
1.2
5.3
11.0
80.1
2.5
6.4
Punjab
17.2
77.1
1.9
3.8
28.5
65.6
3.4
2.4
24.3
69.9
2.9
2.9
Rajasthan
2.8
92.6
2.2
2.4
19.4
73.0
2.3
5.3
13.9
79.5
2.3
4.3
Sikkim
0.0
100.0
0.0
0.0
31.8
68.2
0.0
0.0
20.4
79.6
0.0
0.0
Tamil Nadu
5.1
85.6
2.5
6.8
15.2
73.8
3.1
7.9
11.8
77.7
2.9
7.5
Tripura
4.0
96.0
0.0
0.0
3.0
87.9
1.6
7.5
3.4
90.9
1.0
4.7
Uttaranchal
0.0
92.8
0.0
7.2
41.0
52.1
6.9
0.0
34.8
58.2
5.9
1.1
Uttar Pradesh
7.5
82.4
1.9
8.2
24.3
63.6
4.6
7.5
19.2
69.3
3.8
7.7
West Bengal
9.1
81.1
0.5
9.3
22.4
65.2
2.8
9.6
18.4
70.0
2.1
9.5
Andaman & Nicobar Islands
0.0
0.0
0.0
52
29.9
0.0
18.2
44.6
39.9
0.0
15.6
100
Chandigarh
0.0
94.3
5.7
0.0
44.2
46.2
0.0
9.6
34.9
56.4
1.2
7.5
Dadra
0.0
100.0
0.0
0.0
22.3
65.9
2.9
8.9
12.9
80.4
1.7
5.1
Daman
12.8
78.0
0.0
9.2
5.6
94.4
0.0
0.0
8.0
88.9
0.0
3.1
0.0
88.5
0.0
11.5
3.3
80.9
0.0
15.8
1.9
84.2
0.0
14.0
Lakshadweep Pondicherry
5.8
84.4
0.0
9.8
6.2
79.5
3.6
10.7
6.1
80.8
2.7
10.5
All-India
6.0
86.5
1.8
5.7
19.2
71.0
3.0
6.8
14.8
76.2
2.6
6.4
Note: S spouse, OC own children, GC grand children, O others Source of data: NSSO, 60th round
3.6 Supporting Mechanisms and Coping Strategies
161
Table 3.15b Percentage distribution of financially dependent old aged persons by the financially supporting persons, urban India, 2014 State
Male
Female
Total
S
OC
GC
O
S
OC
GC
O
S
OC
GC
O
Jammu & Kashmir
0.0
93.4
0.3
6.2
44.1
55.3
0.1
0.4
32.3
65.5
0.2
2.0
Himachal Pradesh
0.0
100.0
0.0
0.0
22.2
61.1
0.0
16.7
15.1
73.5
0.0
11.4
Punjab
14.7
83.9
0.2
1.1
17.8
78.5
0.7
2.9
16.9
80.1
0.6
2.4
Chandigarh
7.1
92.9
0.0
0.0
9.3
88.1
2.6
0.0
8.9
88.9
2.2
0.0
Uttaranchal
15.7
84.3
0.0
0.0
9.8
75.6
5.2
9.3
11.8
78.5
3.5
6.3
Haryana
1.3
98.2
0.5
0.0
25.0
67.9
0.8
6.3
17.6
77.3
0.7
4.3
Delhi
4.1
92.9
0.3
2.6
24.2
74.3
0.5
0.9
18.1
80.0
0.4
1.4
Rajasthan
2.7
94.3
0.0
2.9
37.4
58.6
0.9
3.2
24.8
71.6
0.6
3.1
Uttar Pradesh
3.2
92.6
0.7
3.5
23.7
73.0
0.5
2.8
17.8
78.7
0.5
3.0
Bihar
0.0
91.8
7.9
0.3
14
82.7
1.3
1.9
7.8
86.8
4.2
1.2
Sikkim
0.0
100.0
0.0
0.0
44.4
55.6
0.0
0.0
29.5
70.5
0.0
0.0
Arunachal Pradesh
0.0
100.0
0.0
0.0
0.0
100.0
0.0
0.0
0.0
100.0
0.0
0.0
Nagaland
0.0
95.2
0.0
4.8
64
35.3
0.7
0.0
40.6
57.2
0.5
1.7
Manipur
0.0
91.1
0.0
8.9
10.9
84.0
0.0
5.1
6.9
86.6
0.0
6.5
Mizoram
0.0
97.9
2.1
0.0
26.7
73.3
0.0
0.0
18.9
80.5
0.6
0.0
Tripura
0.3
88.1
2.9
8.7
12.1
73.5
13
1.4
7.1
79.7
8.7
4.5
Meghalaya
0.0
92.3
0.0
7.7
1.0
88.4
5.0
5.6
0.8
89.1
4.1
6.0
Assam
0.0
89.6
0.1
10.3
8.6
90.0
0.0
1.4
6.0
89.9
0.0
4.1
West Bengal
8.6
87.0
1.6
2.8
18.6
70.9
1.8
8.7
15.4
76.1
1.7
6.8
Jharkhand
0.0
98.1
1.0
0.9
25.3
73.6
0.7
0.4
16.7
82.0
0.8
0.6
Orissa
10.5
82.3
0.2
7.0
9.3
88.9
0.5
1.3
9.7
86.5
0.4
3.4
Chhattisgarh
1.0
76.9
3.4
18.7
29.7
46.3
0.0
24
16.8
60.1
1.5
21.6
Madhya Pradesh
1.8
92.4
3.7
2.1
21.3
75.7
1.4
1.5
15.2
81.0
2.2
1.7
Gujarat
0.9
92.4
6.1
0.6
17.9
78.1
0.6
3.4
10.6
84.2
2.9
2.2
Daman & Diu
0.0
100
0.0
0.0
0.0
100.0
0.0
0.0
0.0
100
0.0
0.0
Dadra & Nagar Haveli
61.8
38.2
0.0
0.0
4.3
95.7
0.0
0.0
38.4
61.6
0.0
0.0
Maharashtra
4.0
95.1
0.3
0.6
19.3
75.2
0.8
4.7
14.1
82
0.6
3.3
Andhra Pradesh
2.1
93.1
0.5
4.3
25.4
71.4
1.4
1.8
16.6
79.6
1.1
2.8
Karnataka
1.0
94.9
0.6
3.4
20.8
75.6
2.1
1.5
13.7
82.5
1.6
2.2
Goa
18.2
81.4
0.0
0.4
34.7
65.3
0.0
0.0
26.9
73.0
0.0
0.2
Lakshadweep
0.0
100.0
0.0
0.0
12.8
87.2
0.0
0.0
7.2
92.8
0.0
0.0
Kerala
8.0
87.9
0.1
4.0
12.5
80.7
0.9
6.0
11.0
83.0
0.6
5.3
Tamil Nadu
11.8
87.0
0.1
1.1
20.4
74.8
1.3
3.5
17.1
79.5
0.8
2.6
Puducherry
5.0
55.5
0.0
39.5
9.5
78.8
0.0
11.7
8.2
71.7
0.0
20.1
Andaman & Nicobar Islands
0.0
100.0
0.0
0.0
10.3
80.8
8.8
0.0
6.2
88.6
5.3
0.0
Telangana
1.8
97.7
0.0
0.5
12.2
83.6
3.6
0.5
7.8
89.6
2.1
0.5
Total
5.3
91
1.3
2.4
20.2
74.7
1.1
3.9
15.0
80.4
1.2
3.4
Note: S spouse, OC own children, GC grand children, O others Source of data: NSSO, 71st round
162
3 Economic Dependence and Physical Disability …
Fig. 3.5 Association of economic dependency and disability among the elderly in the states of India. Source of data: The percentage of fully dependent on others (NSSO 60th Round 2004–05) and Percentage of disabled persons (60+ years) taken from Census of India 2011
Scheme (IGNOAPS), public distribution system, income tax, micro-finance, health care, safety and security, housing, productive ageing, welfare funds, multigenerational bonding, media and emergencies. As part of the policy implementation, the central and the state governments have to strive for • the establishment of the department of senior citizens under the Ministry of Social Justice and Empowerment, the Directorate of Senior Citizens in the states and union territories, the National/State Commission for Senior Citizens and the National Council for Senior Citizens, • an outline of the state responsibility for implementation and • a definition of the role of block development officers, Panchayat Raj institutions and tribal councils/gram sabhas. However, the extent to which the existing laws can improve the living conditions of old people in the country perhaps needs to be scientifically explored in the context of the present health and economic conditions of this segment of the population.
3.6 Supporting Mechanisms and Coping Strategies
163
The country has a number of old age homes, most of which function in urban areas. Many of these facilities are run by private agencies that include religious and caste organizations. A notable number of the aged lives in these institutions. The inmates are mostly women. The process by which old people enter these institutions and the inside story are quite relevant aspects to be explored for a better understanding of the quality of public and private intervention strategies in this organized sector. Universal old age pension is still a dream for the country even though Bihar has implemented it. State governments are responsible for providing old age pension to the needy. Unfortunately, the aged are not politically well-organized to raise this demand. Moreover, political parties are the least bothered to create an agenda for the purpose. State governments come up with many excuses to hide their inability to provide pension even for completely economically dependent aged persons. One of the issues put forward by these local governments would be the difficulty to find the funds required. The below poverty line (BPL) and above poverty line (APL) classification made by the state governments is useless since it fails to reflect the paucity within the households. The poverty classification was made with limited socioeconomic indicators that face severe criticism. The money allocated by the state governments in their budget for the care of the aged is a matter of concern. Not many studies have looked into the pension issue and fund allocation from a welfare perspective. Mishra and Rajan (2017) hold that the state-led social protection is rather weak than at the national level.
3.6.2
Family-Level Intervention
The NSSO 60th Round collected information on the persons who provided economic support to the elderly in their households. Among the economically dependent aged, the majority (about 77.9%) depended on their children and a sizable proportion (13.2%) relied on their spouses for economic support. Only 3% were looked after by their grandchildren and the rest (6%) had to seek help from ‘others’, including non-relations (Table 3.16a). Similar patterns can be seen in the 71st Round of the NSSO data (Table 3.16b). Between the years 1995–96 and 2004, the distribution of the aged who were economically dependent changed in respect of the category of persons who supported them. The patterns of change are not similar for males and females but are so for the elderly living in the rural and urban areas. In the inter-survey periods, the proportion of the aged males and females who depend on their children for economic support has increased in both rural and urban areas, and more so in the former (Tables 3.14a, 3.14b, 3.15a and 3.15b). On the other hand, the proportion of those depending on their spouse decreased in general among men but marginally increased among women in the urban areas. The proportion in this category, however, did not show any change between the periods in the rural areas.
3 Economic Dependence and Physical Disability …
164
Table 3.16a Percentage distribution of financially dependent old aged persons by the financially supporting persons, India, 2004–05 State
Males
Females
Persons
S
OC
GC
O
S
OC
GC
O
S
OC
GC
O
Andhra Pradesh
9.2
84.4
1.8
4.6
10.2
79.0
2.4
8.4
9.8
80.9
2.2
7.1
Arunachal Pradesh
4.6
86.4
0.3
8.7
3.3
86.8
0.3
9.6
3.8
86.6
0.3
9.2
Assam
2.4
93.8
2.1
1.7
7.1
86.8
1.7
4.3
4.9
90.1
1.9
3.1
Bihar
8.1
86.1
2.1
3.8
23.8
70.3
2.1
3.8
17.7
76.4
2.1
3.8
Chhattisgarh
11.9
71.4
3.8
12.9
14.2
67.8
3.8
14.3
13.5
68.8
3.8
13.9
Delhi
7.2
83.2
6.7
2.9
28.6
56.7
10.5
4.2
21.5
65.5
9.2
3.8
Goa
5.4
78.6
0.0
16.1
30.9
65.0
0.2
3.9
24.6
68.3
0.1
6.9
Gujarat
2.5
92.0
2.4
3.0
16.0
77.3
3.0
3.7
11.3
82.5
2.8
3.5
Haryana
2.6
91.4
0.2
5.8
16.6
76.9
0.9
5.6
11.0
82.7
0.6
5.7
Himachal Pradesh
3.2
86.0
1.7
9.0
18.5
74.9
2.6
4.0
13.5
78.5
2.3
5.6
Jammu & Kashmir
1.6
86.5
2.7
9.2
23.3
73.1
2.4
1.3
15.8
77.7
2.5
4.0
Jharkhand
5.6
87.3
4.3
2.8
16.5
75.6
5.4
2.5
11.9
80.6
4.9
2.6
Karnataka
11.0
80.3
2.6
6.1
10.1
78.5
3.8
7.6
10.4
79.2
3.3
7.1
Kerala
7.8
84.6
0.6
7.0
9.1
81.6
2.4
6.8
8.6
82.7
1.8
6.9
Madhya Pradesh
5.0
83.4
5.1
6.6
22.3
67.2
3.2
7.3
16.7
72.4
3.8
7.1
Maharashtra
6.6
88.3
1.3
3.8
14.3
74.7
2.1
8.9
11.4
79.8
1.8
7.0
Manipur
19.7
73.7
4.6
2.0
11.7
76.1
3.1
9.1
15.4
75.0
3.8
5.8
Meghalaya
4.0
96.0
0.0
0.0
2.8
88.8
0.0
8.4
3.2
91.3
0.0
5.5
Mizoram
14.1
82.3
0.0
3.6
23.6
72.6
0.3
3.4
19.7
76.6
0.2
3.5
Nagaland
5.4
87.2
7.4
0.0
21.5
78.5
0.0
0.0
10.6
84.3
5.0
0.0
Orissa
12.5
78.7
2.7
6.1
15.1
75.4
4.1
5.5
14.0
76.7
3.5
5.7
Punjab
10.8
83.4
2.6
3.3
26.3
69.0
3.9
0.8
20.4
74.5
3.4
1.7
Rajasthan
2.9
86.7
3.2
7.2
19.5
72.9
4.2
3.5
13.7
77.7
3.8
4.8
Sikkim
2.4
89.6
3.8
4.3
33.0
54.3
6.9
5.9
22.7
66.1
5.8
5.3
Tamil Nadu
8.5
86.4
1.6
3.5
12.4
77.1
3.1
7.5
11.0
80.5
2.5
6.0
Tripura
2.4
91.8
1.8
3.9
8.6
80.8
6.5
4.1
5.9
85.6
4.4
4.0
Uttaranchal
8.9
84.7
4.0
2.4
26.2
68.9
3.9
1.0
20.5
74.1
3.9
1.5
Uttar Pradesh
4.0
83.6
1.5
11.0
23.7
66.5
3.0
6.8
17.5
71.8
2.5
8.1
West Bengal
7.2
85.5
2.0
5.2
14.4
74.8
4.2
6.6
11.9
78.5
3.5
6.1
Andaman & Nicobar Islands
30.5
67.5
0.0
2.0
39.3
47.2
3.6
9.8
36.4
53.8
2.5
7.3
Chandigarh
0.6
93.7
5.7
0.0
43.1
45.0
0.0
11.9
34.6
54.8
1.1
9.5
Dadra
0.0
85.9
0.0
14.1
2.0
96.9
0.3
0.8
0.7
89.8
0.1
9.4
Daman
19.6
72.4
0.0
8.0
9.7
85.5
0.0
4.8
12.2
82.2
0.0
5.6
Lakshadweep
0.0
84
0.0
16
2.9
78.4
3.7
15.1
1.7
80.7
2.1
15.5
Pondicherry
4.1
88.9
0.0
7.0
4.9
81.7
2.9
10.5
4.7
83.8
2.1
9.5
All-India
6.8
85.4
2.1
5.7
16.7
73.7
3.1
6.5
13.2
77.9
2.7
6.2
Note: S spouse, OC own children, GC grand children, O others Source of data: NSSO, 60th round
3.6 Supporting Mechanisms and Coping Strategies
165
Table 3.16b Percentage distribution of financially dependent old aged persons by the financially supporting persons, India, 2014 State
Male S
Female OC
GC
O
Total
S
OC
GC
O
S
OC
GC
O
Jammu & Kashmir
10.8
85.8
0.4
3.0
26.5
72.8
0.4
0.4
19.9
78.3
0.4
1.5
Himachal Pradesh
3.2
93.1
0.9
2.8
33.3
57.6
4.6
4.4
23.8
68.9
3.5
3.9
Punjab
4.0
93
1.0
2.0
21.7
72.6
3.2
2.5
15.8
79.3
2.5
2.4
Chandigarh
6.8
93.2
0.0
0.0
9.1
88.3
2.6
0.0
8.7
89.1
2.2
0.0
Uttaranchal
1.7
98.3
0.0
7.7
74.5
8.9
8.9
5.8
81.9
6.1
6.1
Haryana
0.2
94.5
0.3
4.9
14.1
82.2
0.4
3.3
9.1
86.6
0.4
3.9
Delhi
3.7
93.7
0.3
2.3
23.7
74.7
0.7
0.9
17.2
80.9
0.5
1.4
Rajasthan
2.2
93.2
1.1
3.5
19.4
74.3
2.3
4.0
13.6
80.7
1.9
3.8
Uttar Pradesh
3.7
91.5
1.2
3.5
18.7
75.1
2.4
3.8
13.0
81.4
1.9
3.7
Bihar
1.4
92.6
4.6
1.4
20.5
78.0
0.6
0.9
12.1
84.5
2.3
1.1
Sikkim
0.0
94.9
0.0
5.1
27
72.3
0.0
0.6
18.6
79.4
0.0
2.0
Arunachal Pradesh
7.3
90.5
0.0
2.2
13.6
73.3
0.0
13.1
10.4
82.2
0.0
7.5
Nagaland
0.5
70.5
0.0
29.0
31.3
68.5
0.1
0.1
21.2
69.1
0.1
9.6
Manipur
6.7
90.2
0.0
3.1
7.3
87.4
0.1
5.2
7.0
88.6
0.1
4.3
Mizoram
0.0
98.8
1.1
0.1
26.8
72.2
1.0
0.0
18.6
80.3
1.0
0.0
Tripura
0.1
95.7
2.2
2.1
2.8
82.5
13.3
1.3
1.9
87.2
9.4
1.6
Meghalaya
0.6
80.8
17.0
1.6
0.8
79.9
18.5
0.8
0.7
80.4
17.7
1.1
Assam
3.7
87.6
2.3
6.4
25.5
70.7
1.5
2.4
16.5
77.6
1.8
4.0
West Bengal
0.0
10.6
86.0
0.6
2.7
15.2
77.1
1.0
6.7
13.5
80.3
0.9
5.3
Jharkhand
0.0
97.9
1.7
0.4
17.5
71.9
1.5
9.2
9.6
83.6
1.6
5.2
Orissa
5.3
89.2
1.0
4.4
16.3
77
2.0
4.6
11.3
82.5
1.6
4.5
Chhattisgarh
1.0
81.2
9.2
8.6
13.3
61.7
3.5
21.6
7.6
70.6
6.1
15.6
Madhya Pradesh
0.5
95.6
2.7
1.2
19.9
73.4
2.8
3.9
14.0
80.2
2.7
3.1
Gujarat
0.8
91.3
6.6
1.3
15.3
76.7
3.0
5.0
9.7
82.3
4.4
3.6
Daman & Diu
0.0
100.0
0.0
0.0
0.2
99.8
0.0
0.0
0.1
99.9
0.0
0.0
Dadra & Nagar Haveli
38.7
61.3
0.0
0.0
3.4
95.2
1.4
0.0
21.0
78.3
0.7
0.0 3.0
Maharashtra
4.9
93.2
0.9
1.0
17.5
77.3
1.0
4.2
13.1
82.9
1.0
Andhra Pradesh
2.6
91.4
2.3
3.7
9.9
75.5
3.2
11.4
7.1
81.5
2.9
8.5
Karnataka
4.1
92.6
1.2
2.1
15.7
75.5
3.5
5.3
11.4
81.9
2.6
4.1 2.2
Goa
13.5
84.1
0.0
2.3
29.6
68.3
0.0
2.1
21.6
76.2
0.0
Lakshadweep
0.0
84.4
0.0
15.6
9.6
88.4
1.6
0.4
5.1
86.5
0.9
7.5
Kerala
5.7
90.1
0.1
4.1
12.9
79.6
1.3
6.2
10.5
83.2
0.9
5.5
Tamil Nadu
9.0
89.4
Puducherry
3.9
65.5
Andaman & Nicobar Islands
0.0
81.6
0.3 0.0 0.0
1.3
17.1
76.2
1.2
5.5
13.9
81.4
0.8
3.9
30.6
8.2
81.7
0.0
10.1
6.8
76.5
0.0
16.7
18.4
23.8
71
1.1
4.1
12.3
76.1
0.6
11.0
Telangana
0.9
97.4
0.4
1.4
Total
4.3
91.4
1.6
2.6
9.2 17
76.1
7.1
7.7
6.7
82.4
5.1
5.8
75.7
2.2
5.1
12.2
81.6
2.0
4.2
Note: S spouse, OC own children, GC grand children, O others Source of data: NSSO, 71st round
3 Economic Dependence and Physical Disability …
166
The age-wise distribution of economically dependent old people by their supporting persons in India shows that irrespective of the region, as age increases the dependency on the spouse decreases and the dependency on grandchildren increases (Tables 3.17a and 3.17b). Family-level interventions are very important for the elderly. A study conducted in Kerala found that nearly one-fifth of the elderly who stayed with their partner felt that they were physically fit when compared with others. It also determined that living arrangements decided the caregiver in times of need (Rajan et al. 2017). Another recent study (Joe 2017) established that the family, particularly the spouse, has considerable influence in matters of healthcare utilization among the elderly.
3.6.3
Self-efforts
Previous studies show that among the elderly, 60% of the females and 30% of the males lack valuable assets. Again, around 10% of the rural aged are unable to access food, clothing and medicine due to their financial constraints (Rajan 2008). In this context, a considerable proportion of senior persons in India go for work despite health problems to avoid economic dependency. The work participation among old people aged 60 and above is around 39% (Dilip 2017). However, the employment rate of aged persons with disability is very low with great variations across gender, place of residence and state. Using the information derived from the National Sample Survey of 2002, Mitra and Sambamoorthi (2006) found that employment among persons with disability is influenced more by individual and household characteristics than the human capital. The elderly are more vulnerable to both communicable and non-communicable diseases. However, non-communicable diseases are predominant in old age (Navaneetham et al. 2009). A large share of non-communicable diseases is chronic in nature, which often leads to some form of disability. The incidence of chronic disease and disability is observed to rise with age. A few non-governmental organizations offer free check-up and medicines for the aged who are economically distressed. But the reach of these organizations is limited. In such situations, old people require self-effort to meet the challenges of ill health. One of the options for the economically backward aged dependent on others would be to resort to alternative systems of medicine and indigenous therapeutic modes for health care. They may consider the options for supporting mechanisms from the modern system of medicine only for emergencies. Another aspect worth mentioning here would be that the association of ageing with disability is partly biological, but it can be influenced by the lack of economic resources that limit access to healthcare services. As human beings grow older, the functioning and adaptability of the tissues and organs decline, thereby resulting in physical limitations. The use of modern assistive and enabling technology such as automated wheel chairs, cochlear implant, gesture to voice technology, fall detectors, magnifiers, digital hand-held, incontinence products, absorbent, etc., to
3.6 Supporting Mechanisms and Coping Strategies
167
Table 3.17a Region and age-wise distribution of economically dependent old aged persons by the supporting persons in India, 2004–05 Regions North
Age group
Spouse
Own children
Grand children
Others
60–69 20.9 73.8 1.8 3.6 70–79 9.2 81.9 4.4 4.5 80–89 8.7 80.1 6.8 4.4 90+ 5.6 75.4 8.8 10.1 Total 15.6 77.1 3.3 4.1 Central 60–69 23.4 67.3 2.1 7.3 70–79 8.6 78.5 3.8 9.1 80–89 3.8 81 4.0 11.2 90+ 1.7 73.5 9.2 15.6 Total 17.0 71.7 2.9 8.3 East 60–69 17.0 75.2 2.8 5.0 70–79 10.2 81.7 2.9 5.3 80–89 5.7 84.2 4.5 5.6 90+ 4.4 74.3 20.1 1.1 Total 13.9 77.7 3.3 5.1 North-east 60–69 6.8 87.2 1.7 4.3 70–79 5.2 90.6 2.5 1.7 80–89 2.6 88.3 5.5 3.6 90+ 2.9 88.3 7.3 1.5 Total 6.1 88.0 2.2 3.7 West 60–69 15.1 78.4 1.5 5.1 70–79 8.0 83.0 1.4 7.5 80–89 1.1 86.6 5.4 6.9 90+ 2.5 78.5 14.2 4.8 Total 11.5 80.5 2.1 5.9 South 60–69 12.9 80.6 1.4 5.0 70–79 7.0 81.3 3.0 8.7 80–89 2.9 81.4 5.5 10.2 90+ 3.5 80.2 8.0 8.3 Total 10.0 80.9 2.4 6.7 Total 60–69 17.2 75.5 1.9 5.3 70–79 8.4 81.3 3.1 7.3 80–89 4.3 82.5 5.3 7.9 90+ 3.1 76.4 11.8 8.7 Total 13.2 77.9 2.7 6.2 Note: North = Chandigarh, Delhi, Haryana, Himachal Pradesh, Jammu & Kashmir, Punjab, Rajasthan, Uttarakhand; Central = Chhattisgarh, Madhya Pradesh, Uttar Pradesh; East = Bihar, Jharkhand, Odisha, West Bengal; North-east = Arunachal Pradesh, Assam, Manipur, Meghalaya, Mizoram, Nagaland, Sikkim, Tripura; West = Dadra & Nagar Haveli, Daman & Diu, Goa, Gujarat, Maharashtra; South = Andaman & Nicobar Islands, Andhra Pradesh, Karnataka, Kerala, Lakshadweep, Puducherry, Tamil Nadu Source of data: NSSO, 60th round
3 Economic Dependence and Physical Disability …
168
Table 3.17b Region and age-wise distribution of economically dependent old aged persons by the supporting persons in India, 2014 Region North
Age group
Spouse
Own children
Grand children
Others
60–69 19.9 77.1 0.4 2.6 70–79 8.8 85.9 1.9 3.4 80–89 3.7 84.2 4.4 7.6 90+ 7.0 74.1 17.9 0.9 Total 14.2 80.5 1.9 3.4 Central 60–69 16.7 77.5 1.7 4.1 70–79 8.1 84.5 2.8 4.7 80–89 5.3 88 3.3 3.4 90+ 2.9 85.7 11.3 0.2 Total 13.0 80.6 2.3 4.1 East 60–69 15.4 79.8 0.9 3.9 70–79 6.6 88.1 1.6 3.6 80–89 5.0 85.3 2.2 7.5 90+ 0.0 74.8 24.6 0.6 Total 12.1 82.4 1.5 4.0 North-east 60–69 7.5 89.0 0.5 3.0 70–79 28.2 64.0 1.3 6.4 80–89 12.6 72.3 14.0 1.0 90+ 0.0 37 62.9 0.2 Total 14.4 78.9 2.8 3.9 West 60–69 16.7 80.6 0.4 2.2 70–79 6.5 85.9 3.1 4.5 80–89 3.4 85.5 6.1 5.1 90+ 0.0 78.5 19.5 2.0 Total 12.1 82.7 2.0 3.2 South 60–69 13.7 81.6 1.0 3.7 70–79 7.5 81.7 2.0 8.8 80–89 2.1 85.1 8.1 4.6 90+ 1.0 85.7 11.0 2.3 Total 10.8 82.0 2.0 5.2 Total 60–69 15.7 80.0 0.9 3.4 70–79 8.2 84.1 2.2 5.5 80–89 4.0 85.1 5.4 5.4 90+ 2.5 79.0 17.3 1.2 Total 12.2 81.6 2.0 4.2 Note: North = Chandigarh, Delhi, Haryana, Himachal Pradesh, Jammu & Kashmir, Punjab, Rajasthan, Uttarakhand; Central = Chhattisgarh, Madhya Pradesh, Uttar Pradesh; East = Bihar, Jharkhand, Odisha, West Bengal; North-east = Arunachal Pradesh, Assam, Manipur, Meghalaya, Mizoram, Nagaland, Sikkim, Tripura; West = Dadra & Nagar Haveli, Daman & Diu, Goa, Gujarat, Maharashtra; South = Andaman & Nicobar Islands, Andhra Pradesh, Karnataka, Kerala, Lakshadweep, Puducherry, Tamil Nadu, Telangana Source of data: NSSO, 71st round
3.6 Supporting Mechanisms and Coping Strategies
169
overcome disability may be considered if the government can implement effective strategies from the welfare funds. Using the NSSO 60th Round data, Prasad (2017) found that deprivation at both individual and group levels is a crucial determinant of old age vulnerability. In fact, relative deprivation at the individual level is a much stronger predictor of dependency among the elderly than relative deprivation at the group level. Thus, policies should target the elderly at the individual level and not at the group level (Prasad 2017).
3.7
Conclusion
In this chapter, an attempt was made to examine the economic dependency and disability of the elderly in India in terms of the socioeconomic and demographic characteristics. This investigation proceeded on the premises that these two conditions act as prominent catalysts for the vulnerability of a considerable proportion of the aged in the country. Old people who are exposed to both disability and economic dependency are more prone to poverty, illness, disease and death. The disability conditions of the elderly discussed in this chapter are based on the information available in the Census of India 2011. This data does not account for the temporary disability conditions of senior persons. Therefore, the disability estimates may be interpreted with due consideration for this aspect. This study noticed that Rajasthan and Orissa are the most disadvantaged states with double burden since they have relatively higher economic dependency and disability among the elderly. The socially and demographically privileged South Indian states also have relatively higher levels of full economic dependence in old age as in the case of Rajasthan and Orissa, even though the latter show lower rates in disability. In the light of the exploration, the authors would like to propose a few ideas to reduce the vulnerability of the elderly to economic dependence and disability. (i) All welfare programmes must consider the state-level conditions of the disabled and economically dependent elderly. In other words, all programmes must be disabled-friendly and old-age friendly. The policymakers must keep in mind that anyone can be prone to these two problems in life. (ii) The country needs multistage strategic planning for the welfare of old people. Effective planning requires up-to-date information on the elderly, including their needs and aspirations. Unfortunately, many states lack crucial data on the aged, particularly their preferences, and socioeconomic and health conditions. (iii) All states need a disability policy based on the conditions and resources available. Studies note that the economic resources of the state and the provision of services for the disabled have no correlation (Menon et al. Menon et al. 2011). Chhattisgarh is cited as the best example for this
3 Economic Dependence and Physical Disability …
170
(iv)
(v)
(vi)
(vii)
argument as this new state is poor; nevertheless, it has formulated a wellthought out state-level disability policy that can be emulated by the rest of the country. The risk arising from disability could be minimized if the elderly were able to make use of modern technologies and access social interventions. Unfortunately, social interventions that focus on building disabled-friendly public infrastructure are minimal and are mostly concentrated in the urban areas. Even disabled-friendly sanitation facilities are not available in most of the public spaces such as healthcare institutions, transportation ports, which the elderly frequently visit. Disabled people require greater medical expenditure. Subsequently, these individuals become a burden on their own family, which may lead to many psychological and social issues. Living longer but with economic dependency and disability is not enjoyable. Therefore, the well-being of the elderly can be achieved only if proper mitigation measures to address these issues are in place. Unless the community takes concrete and effective steps to reduce the vulnerability conditions of the aged, the issue will not be resolved. Theoretically, unlike disability, the issue of the economic dependency of the elderly can be completely solved by proper planning. Currently, public and private interventions are available to tackle this issue. However, more rigorous studies are required in various parts of the country because of the high diversity of population in terms of social norms, culture, beliefs and customs. Many private interventions are operational in the country as part of the Corporate Social Responsibility (CSR) segment of multinational corporations. In addition, non-governmental organizations and their voluntary efforts contribute to this scenario. However, there is no coordination between these organizations. Moreover, the priorities of their activity depend on their own awareness and are not based on the scientific evidence gathered from the community concerned. Often the utility of these interventions is limited to a few people, and to a small segment of the population or the region concerned. Proper documentation of interventions is essential to overcome these drawbacks. With adequate and focused study, the government can launch programmes to motivate and enrich the provision of services for senior citizens all over the nation.
References Dilip, T. R. (2017). Changing economic dependence of the Indian elderly: Evidences from NSSO surveys in 1983 and 2009–10. In U. S. Mishra & S. I. Rajan (Eds.), India’s aged: Needs and vulnerabilities (pp. 21–38). Hyderabad: Orient BlackSwan. Joe, W. (2017). Health care utilisation among the elderly in India: Does family matter? India’s aged: Needs and vulnerabilities (pp. 84–113). Hyderabad: Orient BlackSwan.
References
171
Menon, N., Parish, S. L., & Rose, R. A. (2011). The Economic and Demographic Well-Being of the Disabled: Evidences of State-Level Variability from India. IZA Discussion Paper, no. 6218. Menon, N., Parish, Susan L., & Rose, Roderick A. (2014). The ‘State’ of Persons with Disabilities in India. Journal of Human Development and Capabilities, 15(4), 391–412. Mishra, Udaya S., & Rajan, S. I. (2017). Ageing: A Global Reality and a Development Concern. India’s Aged: Needs and Vulnerabilities (pp. 1–20). Hyderabad: Orient BlackSwan. Mitra, S., & Sambamoorthi, U. (2006). Employment of persons with disabilities. Economic and Political Weekly, 41(3), 199–203. Navaneetham, K., Kabir, M., & Krishnakumar, C. S. (2009). Morbidity Patterns in Kerala: Levels and Determinants. CDS Working Paper 411, pp. 1–50. National Sample Survey Organisation (NSSO). (2004). India - Survey on Morbidity and Health Care: NSS 60th Round, Schedule 25, January 2004–June 2005. National Sample Survey Organisation (NSSO). (2006). Morbidity, health care and the condition of aged. New Delhi: Government of India. Prasad, S. (2017). Dependency in the elderly in India. In U. S. Mishra & S. I. Rajan (Eds.), India’s aged: Needs and vulnerabilities (pp. 39–58). Hyderabad: Orient BlackSwan. Rajan, S. I., Mishra, U. S., & Sarma, P. S. (2001). Health concerns among India’s elderly. The International Journal of Aging and Human Development., 53(3), 181–94. Rajan, S. I. (2006). Population ageing and health in India. Mumbai: The Centre for Enquiry into Health and Allied Themes (CEHAT). Rajan, S. I. (2008). Implications of population ageing with special focus on social protection for elderly persons in South Asia. Indian Journal of Human Development, 2(1), 203–22. Rajan, S. I., & Sunitha, S. (2015). Demography of ageing in India, 2011–2101. Helpage India Research and Development Journal, 21(2):13–22. Rajan, S. I., Sunitha, S., & Arya, U. R. (2017). Elder care and living arrangement in Kerala. In Elderly care in India: Societal and state responses. Springer. Registrar General of India (RGI). (2011). Census of India 2011. Government of India, New Delhi. Saikia, N., Bora, J. K., Jasilionis, D., & Shkolnikov, V. M. (2016). Disability divides in India: Evidence from the 2011 census. PLoS ONE, 11(8), e0159809. https://doi.org/10.1371/journal. pone.0159809.
Chapter 4
Morbidity, Health Care and Health Interventions
Abstract The burden of diseases is perhaps a situation that cannot be completely avoided in old age, but it can be controlled and managed with suitable amenities and care. Proper planning and action are required at various levels to reduce the ill effects of disorders on senior citizens and for them to gain a sense of well-being. In this chapter, the demographic and spatial dimensions of morbidity conditions of older persons in India are examined using the NSSO 71st Round data. The authors study the prevalence of morbidity and chronic ailments among the elderly in India in relation to sex, place of residence, education, employment, religion, caste and region. There exists a significant difference between males and females in the morbidity patterns. The rural and urban differentials in morbidity would also be a reflection of the availability and accessibility of health care infrastructure in the country. The researchers briefly discuss the health care services and their utilization to obtain a thorough understanding of the existing facilities for older persons in both the public and private sectors in India. It is hoped that the latest health care schemes would have a proactive impact on the lives of older persons in India.
4.1
Introduction
As age increases, people are generally more exposed to various illnesses and disorders. Older persons have both chronic and infectious diseases and relatively higher levels of morbidity and mortality. In fact, irrespective of the socioeconomic characteristics, the aged population is generally more vulnerable to chronic morbidity than infectious diseases (Baker et al. 2000; Marengoni et al. 2008; Penninx et al. 1996; Molarius and Janson 2002). A few studies have examined the morbidity condition of older persons (Agrawal and Arokiasamy 2010; Kumar 2003; Dsouza et al. 2014; Arokiasamy et al. 2012; Joshi et al. 2003; Purty et al. 2006; Bharati et al. 2011; Nandi et al. 1997; Sharma et al. 2013; Reddy et al. 2012; Seby et al. 2011; Singh et al. 1997; Tiwari et al. 2014; Karmakar et al. 2014; Datta et al. 2013). Many of these studies found that old people have multiple diseases. A study conducted by Joshi et al. (2003) found that the mean number of morbidity is 6.1 © Springer Nature Singapore Pte Ltd. 2020 S. Irudaya Rajan and U. S. Mishra, Senior Citizens of India, https://doi.org/10.1007/978-981-15-7740-6_4
173
174
4 Morbidity, Health Care and Health Interventions
with a standard deviation of 2.9. The elderly with higher morbidity had advanced levels of disability and distress. Age, sex and occupation were found to be important determinants of morbidity (Joshi et al. 2003; Rajan 2006, 2007, 2008). Many previous studies regarding old age were based on small samples and covered limited areas. Nevertheless, the literature gives certain indications in the diseases patterns of the elderly across the country at different points in time. It is not possible to compare diverse studies because of the differences in the sampling procedures and the divergent concepts employed in the investigations. In such a situation, it is necessary to use the national representative sample surveys, which are solely designed to understand the morbidity patterns of senior persons in India. In this chapter, the authors take into account the morbidity profile of the aged in India, their health care utilization and government health interventions by using various secondary sources of information. Specifically, this chapter has the following objectives: • to understand the present health condition of older persons in terms of the prevalence rate of morbidity and chronic ailments in India • to explore the spatial and gender dimensions of the health status of older persons • to decipher the health care services and their utilization among the elderly • to ascertain the health intervention strategies for older persons in both public and private sectors in India and • to suggest a few health care strategies for the welfare of aged people in India. This chapter is organized into five sections. In Sect. 4.2, the conceptual framework used for the study is explained in detail. It is followed by an exploration of morbidity and chronic ailments of the elderly in Sect. 4.3. The health care services and utilization of older persons are given in Section 4.4, and Section 4.5 discusses the health interventions in both the public and private sectors from a policy perspective. Section 4.6 is a discussion on the basis of the evidence presented in the previous sections, which winds up with a brief conclusion.
4.2
Conceptual Framework
The conceptual framework used in this research is given in Fig. 4.1. This study measures the health conditions of the elderly in terms of the reported prevalence of ailments, including chronic diseases. Again, the health conditions are assessed in connection with the socio-demographic and spatial dimensions of the aged. From an institutional perspective, it is necessary to understand the health care services of senior citizens, particularly the extent to which people make use of health care institutions, and the money being spent for personal well-being. Health-seeking behaviours have a vital impact on controlling or managing the morbidity condition of old persons. It is quite interesting to understand the individual perception of the aged about their health since awareness always determines the reported level of
4.2 Conceptual Framework
Characteristics Spatial Place of Residence State Region Demographic Age Sex Socio-Economic Education Employment Religion Caste
175 Region and Gender Dimension
Health Condition Ailment Chronic Diseases
Health Care Utilization Health Expenditure
Interventions Health Policy Health Insurance Family Support Pensions Demand Side Financing Food Security
Fig. 4.1 Conceptual framework used to study health and health care utilization of the elderly in India. Source: Own formulation
morbidity and the chances of seeking medical care. These aspects consequently determine the outcome of any health care programme designed for senior citizens. This study examines the health status of the elderly in two ways. At first, the general morbidity condition of the aged population in India was ascertained in relation to a few selected characteristics. Among the crucial aspects in the lives of the elderly, the place of residence, state and region were chosen to gauge the spatial dimensions of health. Age and sex are two pertinent demographic indicators in the morbidity study since the morbidity rates significantly vary in accordance with these two elements in all populations. The level of morbidity is prominently associated with the availability of health care facilities and health care utilization. Affordability and accessibility are two important factors that determine health care utilization. Those cultures with quality health care utilization are more likely to enjoy better well-being when compared with others. Previous studies have found that health care utilization significantly varies according to the place of residence, state, region and demographic features such as age and sex. Many health interventions are available for the welfare of old people. The National Health Policy 2011, Health Insurance, Family Support and Care, Pensions, Demand Side Financing (DSF) and Nutritious Food are specific aspects explored in this study to understand the institutional facilities accorded to the elderly in the country.
4.3
Morbidity Conditions
As indicated earlier, old people suffer from many diseases (Table 4.1). An understanding of the levels and patterns of morbidity among the elderly is essential to implement effective strategies in health management. The National Sample Survey
176
4 Morbidity, Health Care and Health Interventions
Fig. 4.2 Health financing flows in India. Source: World Health Organization, Regional Office for South-East Asia (2017)
71st Round, which was conducted in 2014, gives a vivid picture of the morbidity conditions of the elderly in India. In this survey, each individual in the households concerned was asked whether they had any ailment during the 14 days prior to the date of the survey. The information gave a rough estimate of the morbidity conditions or the health status of the people in the house. The morbidity condition of the elderly was examined in relation to age, sex, place of residence and state. Previous studies have found that the prevalence of morbidity is higher among the elderly when compared with those in other stages of life such as childhood, adolescence and adulthood (Navaneetham et al. 2009). There is a significant difference between rural and urban areas in the level of morbidity; moreover, females are more vulnerable to various diseases than males in the population under survey (Table 4.1). Here, an attempt was made to examine this proposition using the evidence of the National Sample Survey data. Again, from a health policy perspective, it is quite interesting to probe the differentials in morbidity levels across the country. The age-specific prevalence of the morbidity rate among the elderly in India in terms of the place of residence and sex is given in Table 4.2. Here, morbidity rate is defined as the number of persons who reported an ailment during the 15 days prior to the date of the survey to the number of people exposed to the risk of ailment
4.3 Morbidity Conditions Table 4.1
177
Overall scenario of morbidity among elderly from different sources of India
Cataract Tuberculosis High BP Heart disease Diabetes Cancer Paralysis Mental illness Any difficulty in performing ADL Unable to perform ADL Source: Based on IHDS 2004–12
2004–05 Rural Urban
Total
2011–12 Rural Urban
Total
4.4 0.9 5.0 1.1 3.1 0.2 0.8 0.2 10.6 4.2
4.4 0.8 6.6 1.9 4.0 0.2 0.9 0.2 10.6 3.9
8.1 1.2 8.5 2.1 4.4 0.2 1.8 0.7 29.9 11.8
7.9 1.1 11.5 2.9 6.7 0.3 2.0 0.6 29.5 11.4
4.2 0.6 11.6 4.4 7.1 0.3 1.0 0.1 10.3 3.1
7.3 0.9 18.9 4.7 12.3 0.4 2.5 0.5 28.5 10.5
Table 4.2 Age-specific prevalence of morbidity rate among elderly in India by place of residence and sex, 2014 (%) Age group
Rural
Urban
Total
Male
60–69 24.7 33.1 27.3 70–79 32.0 36.9 33.5 80–89 35.8 39.6 36.9 90+ 31.4 42.4 35.1 Total 27.6 34.7 29.8 Female 60–69 27 37.9 30.4 70–79 27.2 35.8 29.7 80–89 34.2 40.1 36.3 90+ 28.6 42.9 32.1 Total 27.5 37.6 30.7 Total 60–69 25.9 35.5 28.9 70–79 29.6 36.4 31.7 80–89 35.0 39.9 36.6 90+ 29.6 42.7 33.3 Total 27.6 36.2 30.2 Note: Morbidity is defined as experiencing any ailment during the last 15 days prior to the date of survey Source of data: National sample survey (2014)
expressed in terms of percentage. It is worth mentioning here that the morbidity levels discussed in the section are reported by the respondents in the cross-sectional survey, and thus, the information might reflect the cultural and social dimensions of health, health care awareness and health-seeking behaviours of the individuals concerned. Those who have more exposure to health care facilities are more likely
178
4 Morbidity, Health Care and Health Interventions
to report their illness. Conversely, there are chances of people underreporting their ailments in certain regions of the country. Underreporting occurs when a large number of patients visit private health care providers who are under no obligation to report cases to the public health authorities and when record-keeping and case-finding are done by poorly monitored employees who may receive incentives for underreporting to demonstrate the success of a programme (Government of India 2005). Many arguments consider reported morbidity as a measure of health. People with better education and exposure to health care facilities are more likely to report a higher level of morbidity rate. For instance, a few micro-level research studies put forward the argument that the higher level of morbidity in Kerala is the result of better perception of illness and good health in the society (Kannan et al. 1991; Gumber and Berman 1997; Michael and Singh 2003). Perhaps the reported morbidity in Kerala is overestimated since people are excessively conscious about their health and diseases. On the other hand, a few researchers argue that the morbidity level in Kerala is real and not an exaggerated figure (Kumar 1993; Panikar and Soman 1984). Almost all of them agree that health care services would increase the health consciousness, and consequently, the level of reported morbidity (Kumar 1993; Dilip 2002). Thus, it is possible that the reported morbidity of the elderly as discussed in this chapter is affected by the health awareness of aged people across regions. As a whole, around 30% of the elderly in India have morbidity during the reference period—15 days prior to the date of the survey. These people would have either chronic or infectious diseases, or both. As expected, the statistics showed that irrespective of sex, the level of morbidity is higher in urban areas than in the rural regions. Around 27.6% of the elderly in rural areas are morbid, whereas in the urban areas, the percentage of the morbidity is around 36.2. The discrepancy between the rural and urban areas of the country regarding the morbidity level is noteworthy from a policy point of view. At the aggregate level, both males and females showed more or less similar levels of morbidity rate. Men have a prevalence rate of 29.8%, while for women, it is around 30.7%. Perhaps, the striking features would be age differentials of morbidity across the sexes. In the age group of 60–69 years, the morbidity rate is more among women than men. However, in all other higher age groups, women have a relatively lower level of morbidity. Another striking feature would be that unlike in urban areas, the level of morbidity among 90+ years in the rural areas is less than that of the previous age group of 80–89 years. Usually, as age increases, the level of morbidity increases. In the rural areas, those who survive beyond 90 years are relatively healthy and free of lifestyle diseases. Those who live in the rural areas are physically more active than their urban counterparts. These activities reflect well in the health condition, thereby making the morbidity level low. On the other hand, people in urban areas are found to be more secluded and often remain idle, with relatively lower mobility. The data clearly shows that significant discrepancies exist between men and women in the
4.3 Morbidity Conditions
179
level of morbidity, as shown in the rural and urban differentials. Age is a significant factor in predicting the morbidity levels in both rural and urban areas. India is a country with a diverse culture in health care and health-seeking mechanisms, which reflects in the health care outcome. The health condition of the elderly varies significantly across regions. Table 4.3 shows the age-specific prevalence of morbidity rate among the elderly by region and sex in 2014. Senior persons living in South India report the highest level of morbidity in the nation. Around 47% of the elderly had an ailment during the 15 days prior to the date of the survey. The second highest level was around 30%, reported from East India, followed by 22.8% in the West Indian region. The relative position of males and females in the level of morbidity in different regions is not alike; this divergence clearly shows the gender dimensions in the health status of the elderly.
Table 4.3 2014 (%) Age group
Age-specific prevalence of morbidity rate among elderly in India by region and sex, Region North
Total Central
East
North-east
West
South
Male 60–69 15.1 20.2 24.7 4.5 18.2 47.6 27.3 70–79 24.5 23.9 39.8 7.0 27.4 46 33.5 80–89 29.4 27.0 41.2 5.8 35.5 52.4 36.9 90+ 19.2 50.5 13.9 1.1 76.5 30.6 35.1 Combined 19.2 22.1 29.2 5.3 22.7 47.2 29.8 Female 60–69 25.9 17.0 29.0 10.2 21.8 47.6 30.4 70–79 25.0 18.7 35.7 6.1 25.1 41.7 29.7 80–89 28.9 25.7 34.3 22.2 22.6 54.9 36.3 90+ 25.3 23.9 23.8 39.9 31.6 53.6 32.1 Combined 25.9 18.0 31.0 10.2 22.9 46.8 30.7 Total 60–69 20.7 18.6 26.7 7.2 20.2 47.6 28.9 70–79 24.8 21.4 37.8 6.6 26.2 44.0 31.7 80–89 29.2 26.4 38.0 15.5 28.4 53.9 36.6 90+ 24.2 36.1 18.2 17.7 49.7 42.8 33.3 Combined 22.7 20.1 30 7.7 22.8 47.0 30.2 Note: Morbidity is defined as experiencing any ailment during the last 15 days prior to the date of survey States were classified into six regions: North = Chandigarh, Delhi, Haryana, Himachal Pradesh, Jammu & Kashmir, Punjab, Rajasthan, Uttarakhand; Central = Chhattisgarh, Madhya Pradesh, Uttar Pradesh; East = Bihar, Jharkhand, Odisha, West Bengal; North-east = Arunachal Pradesh, Assam, Manipur, Meghalaya, Mizoram, Nagaland, Sikkim, Tripura; West = Dadra & Nagar Haveli, Daman & Diu, Goa, Gujarat, Maharashtra; South = Andaman & Nicobar Islands, Andhra Pradesh, Karnataka, Kerala, Lakshadweep, Puducherry, Tamil Nadu, Telangana Source of Data: National sample survey (2014)
180
4 Morbidity, Health Care and Health Interventions
In parts of South and Central India, the morbidity levels are relatively higher among males than among females. In all other regions, women have relatively higher levels of morbidity than men. Table 4.4 shows the age-specific prevalence of the morbidity rate among the elderly in India by education and sex. Table 4.5 gives the age-specific prevalence rate among the elderly by marital status and sex. Table 4.6 indicates the age-specific morbidity rate among the aged in India based on their religion. Table 4.7 reveals the age-specific morbidity rate among elderly by caste. These four tables clearly demonstrate that background characteristics have a crucial impact on the level of morbidity among old people in India. As per the latest figures available from 2014 and as shown in Table 4.8, the top four most frequently reported ailments for the elderly population are noncommunicable diseases—hypertension (20.9%), diabetes (16.5%), joint and bone diseases (13.6%) and bronchial asthma (6.5%). The outpatient care rate shows that morbidity is highest among the richest in society (see Table 4.9). However, the untreated morbidity rate is higher among the poorest people. The reasons for the lack of medical care will be discussed later in this work.
4.3.1
Chronic Morbidity
Previous studies found that chronic morbidity among the aged is high (see Table 4.10). In the NSSO 71st Round, a question was asked to determine whether old people were suffering from any chronic ailments. In the survey, the condition of chronic ailment was based on the symptoms of ill health that persisted among the elderly for more than one month up to the date of the survey. It is worth mentioning here that the survey excluded minor skin problems, headache, body ache, minor gastric discomforts—even those of a longstanding nature, unless the person insisted that the condition restricted his/her activity in any way—and disability such as congenital blindness from the list of chronic ailments. Table 4.11 shows the age-specific prevalence of chronic ailments among the elderly in India in terms of the place of residence and sex in 2014. As per the latest NSSO data on health, around 23.7% of the elderly in India have chronic ailments (NSSO 71st Round 2014). Both males and females have more or less equal prevalence of chronic ailments in the country. Around 23.9% of elderly females reported that they had chronic ailments, whereas the percentage of males who suffered from similar conditions was around 23.6. The elderly population that lives in urban areas has higher levels of the prevalence of chronic ailments when compared with those in the rural areas. In the cities and towns, the prevalence of chronic morbidity among the aged was 30.9%, whereas it was around 20.4% in the countryside. The difference between males and females in the level of morbidity is remarkable; in fact, gender discrepancy is more in urban areas than in rural areas.
4.3 Morbidity Conditions
181
Table 4.4 Age-specific prevalence of morbidity rate among elderly in India by education and sex, 2014 (%) General education
Region North
Male
Female
Total Central
East
North-east
West
South
Not literate
17.8
21.8
27.5
6.7
23.6
40.2
26.9
Literate without any schooling
10.1
28.7
27.9
4.7
18.9
31.8
24.5
Literate without formal schooling: through NFEC
0.0
0.0
0.0
0.0
100.0
21.6
6.1
Literate through TLC/AEC
0.0
0.0
100.0
100.0
0.0
60.6
52.7
Others
0.0
21.7
12.8
18.7
0.0
82.0
13.3
Literate with formal schooling: below primary
9.0
31.3
22.6
6.6
26.7
55.8
33.1
Primary
28.7
23.0
28.1
5.1
23.3
50.7
32.2
Upper Primary/Middle
35.6
11.9
29.4
1.0
22.4
44.1
29.9
Secondary
17.3
27.2
22.0
2.0
22.7
52.0
30.7
Higher secondary
21.5
22.6
57.7
3.5
12.8
57.0
31.4
Diploma/certificate course (up to secondary)
17.2
1.7.0
60.6
0.0
28.8
33.8
31
Diploma/certificate course (higher secondary)
98.1
14.5
35.8
0.0
17.6
90.0
57.9
Diploma/certificate course (graduation and above)
29.4
24.5
32.6
0.0
32.6
59.0
37.5
Graduate
13.5
22.7
48.6
1.3
17.7
52.3
33.1
Postgraduate and above
18.8
19.7
73.1
43.0
27.4
72.9
36.1
Total
19.2
22.1
29.2
5.3
22.7
47.2
29.8
Not literate
23.2
17.5
28.0
13.9
22.7
38.9
26.8
Literate without any schooling
55.1
19.8
16.7
4.6
9.5
62.6
26.4
Literate without formal schooling: through NFEC
0.0
100.0
38.0
0.0
22.1
100.0
94.6
Literate through TLC/AEC
46.5
0.0
9.6
0.0
0.0
23.1
23.3
Others
2.6
33.6
71.4
36.8
0.0
5.9
20.2
Literate with formal schooling: below primary
32.8
14.5
49.0
3.7
23.6
63.9
42.6
Primary
49.1
22.2
37.5
3.1
29.9
61.8
43.5
Upper primary/middle
23.7
12.0
16.1
7.9
24
63.8
36.7
Secondary
40.7
17.0
39.4
0.6
26.3
63.9
43
Higher secondary
46.9
19.1
35.1
0.4
7.8
45.2
30.2
Diploma/certificate course (up to secondary)
12.8
3.8
100.0
0.0
0.3
96.5
42.9
Diploma/certificate course (higher secondary)
16.8
0.0
0.0
0.0
5.8
29.9
17.4
Diploma/certificate course (graduation and above)
0.0
0.0
100.0
0.0
100.0
70.7
82.7
Graduate
16.0
32.9
57.7
0.0
13.9
68.6
40.2
Postgraduate and above
11.4
43.1
93.1
100.0
11.7
43.6
42.2
Total
25.9
18.0
31.0
10.2
22.9
46.8
30.7
(continued)
182
4 Morbidity, Health Care and Health Interventions
Table 4.4 (continued) General education
Region North
Total
Total Central
East
North-east
West
South
Not literate
21.3
19.1
27.8
10.7
22.9
39.3
26.8
Literate without any schooling
35.3
27.3
24.5
4.7
14.1
43.7
25.1
Literate without formal schooling: through NFEC
0.0
80.0
1.6
0.0
56.2
66.9
30.3
Literate through TLC/AEC
46.5
0.0
96.9
57.0
0.0
24.1
39.7
Others
0.4
24.7
46.6
28.5
0.0
20.0
16.6
Literate with formal schooling: below primary
19.5
25.0
31.1
5.0
25.2
59.7
37.1
Primary
38.8
22.8
30.8
4.1
26.0
55.9
36.6
Upper primary/middle
32.7
11.9
25.4
3.8
23.0
51.3
32.1
Secondary
22.4
25.8
24.7
1.8
23.7
55.1
33.5
Higher secondary
28.1
22.1
51.4
2.7
11.8
53.9
31.2
Diploma/certificate course (up to secondary)
14.4
2.3
60.8
0.0
20.4
49.7
34.4
Diploma/certificate course (higher secondary)
89.7
14.5
33.3
0.0
13.9
78.1
50.2
Diploma/certificate course (graduation and above)
22.2
24.5
47.6
0.0
33.5
62.2
44.8
Graduate
14.1
24.8
50.5
1.1
16.7
56.4
34.8
Postgraduate and above
17.8
26.6
78.1
43.1
25.1
65.4
37.4
Total
22.7
20.1
30.0
7.7
22.8
47.0
30.2
Note: Morbidity is defined as experiencing any ailment during the last 15 days prior to the date of survey States were classified into six regions: North = Chandigarh, Delhi, Haryana, Himachal Pradesh, Jammu & Kashmir, Punjab, Rajasthan, Uttarakhand; Central = Chhattisgarh, Madhya Pradesh, Uttar Pradesh; East = Bihar, Jharkhand, Odisha, West Bengal; North-east = Arunachal Pradesh, Assam, Manipur, Meghalaya, Mizoram, Nagaland, Sikkim, Tripura; West = Dadra & Nagar Haveli, Daman & Diu, Goa, Gujarat, Maharashtra; South = Andaman & Nicobar Islands, Andhra Pradesh, Karnataka, Kerala, Lakshadweep, Puducherry, Tamil Nadu, Telangana Source of data: National sample survey (2014)
Table 4.12 shows the state-wise prevalence of chronic ailments among the elderly in India based on the place of residence and sex in 2014. The highest chronic prevalence rate was observed in Kerala (58.1%) followed by Andhra Pradesh (52.1%). The lowest prevalence rate was reported in Tripura (0.1%), followed by Meghalaya (2.4%). Around ten states in India have a chronic prevalence higher than that of the national level. The states with better social development and health infrastructure have reported higher levels of chronic ailments when compared with others. The southern parts of India had reported the highest level of chronic morbidity in the country (Table 4.13). The north-eastern region showed the lowest prevalence rate. Perhaps this finding implies that health awareness and health care infrastructure facilities have some impact on the prevalence rate and reported morbidity.
4.3 Morbidity Conditions
183
Table 4.5 Age-specific prevalence of morbidity rate among elderly in India by marital status and sex, 2014 (%) Marital status
Region North
Total Central
East
North-east
West
South
Male Never married 1.7 22.2 56.5 0.5 17.7 33.0 20.9 Currently married 18.5 22.4 28.8 4.5 21.0 47.1 29.6 Widowed 24.9 21.5 31.5 11.8 32.9 47.7 31.6 Divorced/separated 37.7 2.8 0.8 2.1 71.7 70.9 26.1 Combined 19.2 22.1 29.2 5.3 22.7 47.2 29.8 Female Never married 38.6 73.1 75.7 0.3 15.6 38.9 53.5 Currently married 25.0 18.8 29.6 4.5 20.7 44.6 28.4 Widowed 26.8 17.1 31.3 15.2 25.0 48.2 32.3 Divorced/separated 80.2 1.4 16.4 0.0 16.2 51.4 39.0 Combined 25.9 18.0 31.0 10.2 22.9 46.8 30.7 Total Never married 2.9 31.2 70.5 0.3 16.7 36.1 33.4 Currently married 21.1 21.0 29.1 4.5 20.9 46.3 29.1 Widowed 26.4 18.3 31.4 14.5 26.5 48.1 32.1 Divorced/separated 50.9 2.3 3.0 2.0 24.5 54.6 34.6 Combined 22.7 20.1 30 7.7 22.8 47.0 30.2 Note: Morbidity is defined as experiencing any ailment during the last 15 days prior to the date of survey States were classified into six regions: North = Chandigarh, Delhi, Haryana, Himachal Pradesh, Jammu & Kashmir, Punjab, Rajasthan, Uttarakhand; Central = Chhattisgarh, Madhya Pradesh, Uttar Pradesh; East = Bihar, Jharkhand, Odisha, West Bengal; North-east = Arunachal Pradesh, Assam, Manipur, Meghalaya, Mizoram, Nagaland, Sikkim, Tripura; West = Dadra & Nagar Haveli, Daman & Diu, Goa, Gujarat, Maharashtra; South = Andaman & Nicobar Islands, Andhra Pradesh, Karnataka, Kerala, Lakshadweep, Puducherry, Tamil Nadu, Telangana Source of data: National sample survey (2014)
Generally, education has no association with the level of chronic ailment (see Table 4.14). However, the level of chronic ailment differs by marital status. Chronic ailments were reported more among the divorced or the separated elderly (29.7%) followed by widowed (24.8%) and unmarried persons (23.1%). Table 4.15 shows the age-specific prevalence of chronic ailments among the elderly in India according to region and marital status. Irrespective of the marital status, South India has the highest level of chronic morbidity, and north-east India has the lowest. The religion and caste differentials in morbidity can also be found across regions (Tables 4.16 and 4.17).
184 Table 4.6 (%)
4 Morbidity, Health Care and Health Interventions Age-specific prevalence of morbidity rate among elderly in India by religion, 2014
Religion Hinduism
Islam
Christianity
Sikhism
Jainism
Buddhism
Zoroastrianism
Others
Age group
North
Central
Region East
North-east
West
South
Total
60–69 70–79 80–89 90+ Total 60–69 70–79 80–89 90+ Total 60–69 70–79 80–89 90+ Total 60–69 70–79 80–89 90+ Total 60–69 70–79 80–89 90+ Total 60–69 70–79 80–89 Total 60–69 70–79 80–89 Total 60–69 70–79 90+ Total
16.2 22.1 29.1 16.6 19.2 20.3 28.0 39.7 7.9 23.2 8.5 68.8 0.0 0.0 12.4 39.6 36.8 27.2 43.2 37.7 71.5 0.0 48.4 100.0 69.2 0.7 5.2 0.0 2.2 0.0 0.0 0.0 0.0 7.3 93.1 0.0 13.6
17.8 21.5 27.6 36.9 19.7 26.0 22.9 19.5 17.3 24.9 2.6 0.0 0.0 0.0 1.7 0.0 21.5 0.3 0.0 10.8 62.4 32.7 0.0 0.0 33.1 0.0 0.0 0.0 0.0 0.0 0.0 100.0 100.0 0.0 0.0 0.0 0.0
26.4 38.8 37.4 18.1 30.3 30.0 28.2 56.3 32.5 30.8 15.7 28.3 0.0 0.0 18.0 0.0 0.0 0.0 0.0 0.0 0.0 0.0 0.0 0.0 0.0 0.0 0.0 0.0 0.0 0.0 0.0 0.0 0.0 24.1 48.9 0.0 27.3
7.8 5.3 3.4 7.3 6.7 3.8 4.6 39.9 2.2 6.5 8.1 16.5 12.7 88.2 11.0 0.0 100.0 0.0 0.0 44.7 0.0 0.0 0.0 0.0 0.0 32.7 39.6 0.0 31.7 0.0 0.0 0.0 0.0 18.1 36.1 100.0 24.5
20.1 26.9 31.1 31.4 23.0 21.4 16.7 14.4 93.2 22.8 34.3 14.3 27.3 0.0 26.9 19.4 0.0 0.0 0.0 9.3 24.6 79.3 6.8 0.0 32.9 8.1 16.6 10.5 9.8 5.0 33.3 0.0 6.4 100.0 100.0 0.0 100.0
44.3 40.0 53.2 42.0 43.6 66.9 59.8 50.1 59.8 63.8 65.4 71.9 63.7 45.9 66.9 0.0 0.0 0.0 0.0 0.0 31.8 100.0 100.0 100.0 60.0 0.0 0.0 0.0 0.0 0.0 0.0 0.0 0.0 0.0 0.0 0.0 0.0
27.4 30.9 36.7 30.3 29 34.8 30.3 37.9 53.4 34.0 46.0 51.8 48.5 53.5 47.9 38.8 34.9 24.7 43.2 36.3 39.3 77.4 17.4 41.7 42.6 9.2 15.9 10 10.4 5.0 33.3 83.2 13.9 25.7 45.7 100.0 29.8
(continued)
4.3 Morbidity Conditions
185
Table 4.6 (continued) Religion Total
Table 4.7
Scheduled tribes
Scheduled castes
Other backward classes
Total
North
Central
Region East
North-east
West
South
Total
60–69 70–79 80–89 90+ Total
20.7 24.8 29.2 24.2 22.7
18.6 21.4 26.4 36.1 20.1
26.7 37.8 38.0 18.2 30.0
7.2 6.6 15.5 17.7 7.7
20.2 26.2 28.4 49.7 22.8
47.6 44.0 53.9 42.8 47.0
28.9 31.7 36.6 33.3 30.2
Age-specific prevalence of morbidity rate among elderly in India by caste, 2014 (%)
Social group
Others
Age group
Age group
Region North Central
East
North-east
West
South
Total
60–69 70–79 80–89 90+ Total 60–69 70–79 80–89 90+ Total 60–69 70–79 80–89 90+ Total 60–69 70–79 80–89 90+ Total 60–69 70–79 80–89 90+ Total
4.6 18.7 4.0 0.0 9.3 20.8 30.5 36.6 1.2 23.4 19.0 19.8 22.6 25.8 19.7 24.2 27.5 33.8 42.5 26.6 20.7 24.8 29.2 24.2 22.7
18.3 17.1 30.4 53.8 19.2 27.0 46.5 26.5 7.2 32.3 22.8 27.7 47.1 5.3 24.9 34.1 44.0 37.5 19.5 37.2 26.7 37.8 38.0 18.2 30
7.0 15.7 7.2 72.9 9.2 3.1 10.0 8.9 0.0 6.5 12.6 7.1 6.5 7.2 10.6 4.9 4.0 21.6 6.7 5.9 7.2 6.6 15.5 17.7 7.7
24.2 37.1 24.4 0.0 28.8 15.2 15.0 19.9 80.5 16.0 18.7 16.0 28.5 67.8 19.2 22.0 32.1 32.1 38.1 26.2 20.2 26.2 28.4 49.7 22.8
22.6 36.0 66.0 6.4 27.5 44.2 39.9 23.6 75.4 42.2 47.6 44.1 54.2 33.4 46.9 54.1 46.8 62.7 49.6 52.7 47.6 44.0 53.9 42.8 47.0
15.6 20.8 25.2 34.1 17.6 25.8 35.1 22.8 29.3 27.9 31 29.9 40.0 31.6 31.3 30.9 34.4 40.5 36.8 32.8 28.9 31.7 36.6 33.3 30.2
8.7 4.4 12.4 5.9 7.6 14.6 28.5 6.0 62 18.7 21.1 18.3 30.7 34.8 21.2 19.9 27.3 37.3 18.7 22.9 18.6 21.4 26.4 36.1 20.1
186
4 Morbidity, Health Care and Health Interventions
Table 4.8 Profile of the incidence and neglect of top ten self-reported morbidities in 15 days reference period for the elderly in India, 2014 No
Disease
Most frequently reported morbidity 1 Hypertension 2 Diabetes 3 Joint and bone diseases 4 Bronchial asthma 5 All fevers 6 Heart disease 7 Back and body aches 8 Gastric/peptic ulcer 9 Symptoms not fitting into any categories 10 Acute upper respiratory infection Most frequently reported morbidity that remained untreated 1 Joint and bone disease 2 All fevers 3 Back or body aches 4 Gastric/peptic ulcer 5 Hypertension 6 Acute upper respiratory infections 7 Diabetes 8 Bronchial asthma 9 Diarrhoea/dysentery 10 Skin infection and other skin diseases Source: Pandey et al. (2017)
4.4
Rate 20.9 16.5 13.6 6.5 5.5 5.5 4.0 3.8 2.6 2.5 19.0 15.6 9.3 6.6 6.0 5.3 5.0 4.3 3.6 2.9
Health Care and Utilization
Access to health care and its financial burden are vital aspects in the life of the elderly. In India, the question of whether the elderly are able to access good health care facilities is relevant in the context of a lower share of public spending and the widespread highly competitive private hospitals that operate for profit. The private sector plays a crucial role in the health care industry in both urban and rural areas. The quality of services provided by these institutions and the health care infrastructure are two aspects that determine the choice of a health institution. In the case of the elderly, the person who takes the decision to avail health care and the selection of a particular institution or service are relevant in the health outcome for the aged person. The available health statistics clearly shows that health care utilization among the elderly is low. The reasons are many and vary across the states. The proportion of the hospitalized elderly during the 365 days prior to the date of the survey as per
4.4 Health Care and Utilization
187
Table 4.9 Outpatient care, untreated morbidity and the use of public facilities for outpatient care for the elderly by MPCE quintile in India, 1995–96 and 2014 MPCE quintile
Year 1995–96
Outpatient care rate per 1000 Poorest 115.1 (96.3, 133.9) Poor 110.3 (94.5, 126.1) Middle 118.6 (103.7, 133.5) Rich 156.2 (141.3, 171.2) Richest 159 (146.2, 171.8) HI (95% CI) 0.085 (0.066, 0.103) Untreated morbidity rate per 1000 Poorest 60.7 (49.9, 71.6) Poor 56.7 (46.1, 67.4) Middle 39.3 (29.9, 48.7) Rich 27.2 (22, 32.4) Richest 14.5 (10.6, 18.4) HI (95% CI) −0.268 (−0.312, −0.223) Outpatient care rate in public facility per 1000 Poorest 26.1 (19.0, 33.1) Poor 19.2 (14.4, 24.1) Middle 25.9 (18.6, 33.1) Rich 30.5 (23, 38) Richest 27.1 (20.7, 33.6) HI (95% CI) −0.065 (−0.129, −0.001) Source: Pandey et al. (2017) Note: Parenthesis gives the confidence interval
2014 176.5 223.7 269.3 323.8 434.7 0.027
(151.5, (192.7, (235.6, (289.5, (401.5, (0.015,
201.6) 254.7) 302.9) 358.1) 467.9) 0.039)
56.9 (40.8, 72.9) 38.4 (24.2, 52.7) 40.9 (28.3, 53.6) 25.2 (16.4, 34) 20.5 (12.7, 28.2) −0.320 (−0.391, −0.249) 78.9 (62.1, 95.6) 81.3 (61.3, 101.3) 64.8 (50.2, 79.3) 88.1 (70.9, 105.3) 74.8 (61.3, 88.3) −0.189 (−0.234, −0.145)
the status of their chronic ailment by the background characteristics is given in Tables 4.18, 4.19, 4.20, and 4.21. Around 7.2% of the elderly in rural India and 9.8% of their counterparts in urban areas were hospitalized in the reference period in 2014. These hospitalization rates are relatively higher when compared with those in the previous Rounds of the NSSO data—the figures of the 52nd and 60th Rounds (NSSO 2014). Regardless of whether they belong to rural or urban areas, the hospitalization rate is more among men than women, especially regarding the prevalence of heart failure (Vaartjes et al. 2010). Around 15.1% of the elderly in rural areas, who suffered from chronic ailments, was hospitalized. Senior persons who were hospitalized for reasons other than chronic ailments comprised only 5.2%. In urban India, the hospitalization rate for the older persons with chronic ailments was around 16.1% and that for those devoid of chronic ailments was only 6.9%. This statistics shows that chronic ailment and hospitalization rates are highly correlated in old age. As age increases, the hospitalization rate also shoots up in rural India.
188 Table 4.10
4 Morbidity, Health Care and Health Interventions Prevalence rate (per 1000) of major chronic diseases in India
Chronic ailments
Rural Male Female
Arthritis 261 357 Hypertension 169 228 Cataract 125 136 Diabetes 89 87 Asthma 94 68 Heart diseases 60 50 Osteoporosis 21 31 Skin disease 32 23 Renal diseases 32 19 Paralysis 21 19 Liver diseases 19 16 Chronic lung 20 13 diseases Depression 15 15 Alzheimer’s 14 18 disease Cerebral stroke 10 8 Dementia 9 10 Cancer 4 3 No chronic 370 316 ailments One or more 630 684 chronic ailments Average number 1.2 1.3 of chronic ailments per elderly person Number of elderly 2453 2685 Source: BKPAI report, p. 135 Note: There are missing cases in each
Total
Urban Male Female
Total
Total Male
Female
Total
311 200 131 88 80 55 26 27 25 20 18 16
194 204 110 142 73 82 17 25 27 14 13 18
285 269 134 135 66 56 30 16 20 13 17 11
243 240 123 138 69 68 24 20 23 13 15 14
243 178 122 103 89 65 20 30 31 19 18 19
338 239 135 100 67 52 31 21 20 17 17 13
293 210 129 101 77 58 26 25 25 18 17 16
15 16
14 6
20 9
17 8
15 12
16 15
15 14
9 10 3 342
13 8 4 413
11 8 4 351
12 8 4 379
11 9 4 381
9 9 3 326
10 9 4 352
658
587
649
621
619
674
648
1.2
1.1
1.3
1.2
1.1
1.3
1.2
5138
2219
2495
4714
4672
5180
9852
of the categories
The affordability of health care is a big issue for those people who live in poverty. For the poor, government hospitals are the only resort. Many studies have examined the public health expenditure of the state and central governments in India. Jain et al. (2015) found that the expenditure on health care by both the state and union governments has increased by more than four times in nominal terms. Nevertheless, the share of patient load for hospitalized care in government facilities has remained practically static in rural areas, while it steadily declined in the urban areas in 2004–2014 as per the 60th and 71st Rounds of the NSSO surveys (see Table 4.18).
4.4 Health Care and Utilization Table 4.11 Age-specific prevalence of chronic ailment among elderly in India by place of residence and sex, 2014 (%)
Place of residence Age
189 2014 Male
Female
Total
Rural 60–69 18.1 19.4 18.8 70–79 24.8 19.5 22.2 80–89 30.0 25.5 27.7 90+ 28.4 26.7 27.3 Total (60+) 20.9 20 20.4 Urban 60–69 28.0 32.5 30.3 70–79 31.6 30.9 31.3 80–89 33.7 36.0 35.0 90+ 27.8 33.0 30.5 Total (60+) 29.4 32.4 30.9 Combined 60–69 21.2 23.5 22.4 70–79 26.9 22.9 25 80–89 31.1 29.3 30.1 90+ 28.2 28.2 28.2 Total (60+) 23.6 23.9 23.7 Note: Prevalence of chronic ailment is defined as the number of old aged persons with chronic ailment per 100 elderly Source of data: National sample survey (2014)
Another important aspect related to health care in old age is the individual perception of the elderly regarding their health. Personal perception of health is a crucial factor in determining health-seeking behaviour and is a good indicator of overall well-being. The percentage distribution of aged persons with chronic ailments based on their discernment regarding the changes in the state of health in comparison with the previous year by background characteristics is given in Tables 4.22, 4.23, 4.24, 4.25, and 4.26. Among the senior citizens who suffer from chronic ailments, around 14.9% in the rural areas and 16.8% in urban areas felt that they were in a better state of health than in the previous year. This statement implies that these people could control or manage their diseases well. For instance, an aged person with diabetes, which is under control, may enjoy a sense of well-being in the survey. Nearly 42.4% felt worse in rural areas, while the corresponding figure for urban areas was 30.7%. Morbid elderly persons who do not go in for treatment are a problem. Table 4.9 shows the untreated morbidity rate per 1000 elderly by the monthly per-capita consumer expenditure (MPCE) quintile. The poorer sections of society are less likely to treat their morbidity. The untreated morbidity rate among the richest segments of the population is 20.5 per thousand, whereas among the poorest people, it is 56.9%. The outpatient care rate among the richest morbid elderly is
190
4 Morbidity, Health Care and Health Interventions
Table 4.12 State-wise prevalence of chronic ailment among elderly in India by place of residence and sex, 2014 (%)
State Andhra Pradesh Arunachal Pradesh Assam Bihar Chhattisgarh Goa Gujarat Haryana Himachal Pradesh Jammu & Kashmir Jharkhand Karnataka Kerala Madhya Pradesh Maharashtra Manipur Meghalaya Mizoram Orissa Punjab Rajasthan Sikkim Tamil Nadu Telangana Tripura Uttar Pradesh Uttaranchal West Bengal Union Territories Andaman & Nicobar Islands Chandigarh Dadra & Nagar Haveli
Rural Male Female
Total
Urban Male Female
Total
Total Male
Female
Total
51.3 13.3
41.4 0.7
46.2 8.8
64.3 3.6
70.2 0.0
67.3 2.5
55 12.8
49.3 0.7
52.1 8.4
1.9 7.6 11.1 15.2 28.0 12.3 5.5 25.6
3.9 12.0 7.2 54.6 26.1 13.2 32.8 17.7
2.8 9.5 9.4 25.6 26.9 12.7 20.0 22.1
3.7 17.7 6.0 50.9 26.6 11.1 21.4 10.6
3.9 6.6 11.2 58.3 23.5 25.2 21.7 9.1
3.8 13.0 8.2 53.9 25.1 17.8 21.6 9.8
2.1 8.9 9.8 36.6 27.3 12.0 6.7 21.2
3.9 11.4 8.2 57.3 25.0 16.0 32.0 14.9
3.0 9.9 9.1 44.0 26.1 14.0 20.1 18.2
2.2 24.0 57.9 16.4 11.7 8.2 1.0 2.6 18.0 25.8 10.6 1.8 33.7 23.4 0.1 15.8 3.0 35.7
5.7 27.8 52.5 4.8 15.3 9.6 5.8 0.0 10.3 38.8 10.3 7.3 25.8 25.0 0.0 8.4 11.4 40.4
4.0 25.9 55.0 10.1 13.7 8.9 2.9 1.4 14.5 32.3 10.4 4.4 29.6 24.5 0.0 12.2 8.2 38.0
20.8 31.0 56.5 11.2 14.0 0.6 0.3 7.2 24.4 11.7 18.8 49.2 48.3 35.9 0.2 15.9 4.9 35.2
26.7 33.8 66.0 13.2 11.4 1.5 0.0 3.6 12.9 39.4 22.8 76.2 48.9 41.0 0.8 18.4 65.2 39.1
23.6 32.4 61.9 12.3 12.6 1.1 0.2 5.2 18.4 27.1 20.8 59.0 48.6 38.1 0.4 17.2 38.5 37.1
5.9 26.6 57.3 15.0 12.7 5.5 0.9 4.8 18.8 21.4 13.0 10.4 40.8 28.1 0.1 15.8 3.4 35.5
9.3 30.0 58.7 7.1 13.7 6.2 4.4 2.0 10.7 39.0 13.3 15.9 36.8 28.3 0.2 10.5 20.6 39.9
7.6 28.3 58.1 10.7 13.2 5.9 2.4 3.3 15.0 30.6 13.2 12.9 38.8 28.3 0.1 13.2 13.8 37.7
13.6
58.4
29.4
67.4
67.8
67.6
15.9
59.1
31.6
61.7 0.0
48.2 17.5
54.4 10.5
41.9 94.1
47.5 78.8
45.4 88.0
42.1 58.5
47.5 43.5
45.5 51.1 (continued)
4.4 Health Care and Utilization
191
Table 4.12 (continued)
Daman & Diu Delhi Lakshadweep Puducherry Total
Rural Male Female
Total
Urban Male Female
Total
Total Male
Female
Total
0.0 1.0 62.7 7.4 20.9
4.1 2.6 45.5 28.5 20.4
4.3 8.2 29.6 46.2 29.4
26.2 5.9 34.6 46.6 30.9
3.5 7.7 37.4 36.0 23.6
33.3 4.2 36.9 44.6 23.9
19.6 5.8 37.2 41.1 23.7
5.9 6.5 18.0 40.1 20.0
50.8 4.1 43.1 46.9 32.4
Table 4.13 Age-specific prevalence of chronic ailment among elderly in India by region and sex, 2014 (%) Age group
Region North
Total Central
East
North-east
West
South
Male 60–69 10.9 13.8 15.3 1.4 13.5 42.7 21.2 70–79 17.8 15.4 31.7 4.7 21.7 40.7 26.9 80–89 24.3 20.2 32.8 0.7 33.2 46.9 31.1 90+ 16.5 45.0 13.4 0.8 46.6 24.5 28.2 Combined 14.2 15.1 20.3 2.4 17.6 42.1 23.6 Female 60–69 20.3 8.5 20.3 5.3 17.3 41.2 23.5 70–79 17.9 10.0 27.0 1.0 17.1 38.1 22.9 80–89 24.6 13.2 23.9 1.7 22.3 48.6 29.3 90+ 24.4 20.4 23.8 12.7 13.5 52.1 28.2 Combined 20.2 9.4 22.3 3.6 17.6 41.2 23.9 Total 60–69 15.7 11.1 17.6 3.2 15.5 41.9 22.4 70–79 17.9 12.8 29.4 2.9 19.4 39.5 25.0 80–89 24.5 17.0 28.6 1.3 27.2 47.9 30.1 90+ 23.1 31.6 17.9 5.9 26.9 39.1 28.2 Combined 17.3 12.3 21.2 3.0 17.6 41.6 23.7 Note: Chronic Morbidity is defined as the number of elderly experiencing any chronic ailment to the total elderly in the aged group expressed in percentage States were classified into six regions: North = Chandigarh, Delhi, Haryana, Himachal Pradesh, Jammu & Kashmir, Punjab, Rajasthan, Uttarakhand; Central = Chhattisgarh, Madhya Pradesh, Uttar Pradesh; East = Bihar, Jharkhand, Odisha, West Bengal; North-east = Arunachal Pradesh, Assam, Manipur, Meghalaya, Mizoram, Nagaland, Sikkim, Tripura; West = Dadra & Nagar Haveli, Daman & Diu, Goa, Gujarat, Maharashtra; South = Andaman & Nicobar Islands, Andhra Pradesh, Karnataka, Kerala, Lakshadweep, Puducherry, Tamil Nadu, Telangana Source of data: National sample survey (2014)
192
4 Morbidity, Health Care and Health Interventions
Table 4.14 Sex-wise prevalence of chronic ailment among elderly in India by place of residence and education, 2014 (%) General education Not literate Literate without any schooling Literate without formal schooling: through NFEC Literate through TLC/AEC Others Literate with formal schooling: below primary Primary Upper primary/ middle Secondary Higher secondary Diploma/ certificate course (up to secondary) Diploma/ certificate course (higher secondary) Diploma/ certificate course (graduation and above) Graduate Postgraduate and above Total
Rural Male Female
Total
Urban Male
Female
Total
Total Male
Female
Total
19.2 14.1
17.7 42.9
18.3 19.4
20.7 14.3
26.6 8.9
24.9 11.5
19.4 14.2
19.5 20.6
19.5 16.2
4.9
100.0
5.9
38
80.5
76.7
6.1
81.1
26.6
52.1
18.1
37
100.0
0.0
89.2
52.7
18
37.4
18.2 22.3
37.7 32.8
25.7 26.2
2.2 34.0
4.1 43.7
3.3 39.2
13.2 25.3
19.8 37.2
16.3 30.4
24.5 20.0
28.9 28.5
25.9 21.9
33.1 28.1
42.8 33.7
38.0 30.5
27.3 23.2
35.8 31.8
30.6 25.9
20.0 30.5 36.4
39.7 61.9 58.4
21.5 32.8 41.5
34.5 24.1 22.9
37.7 24.9 34.0
35.6 24.3 26.3
27.2 26.8 28.2
38.0 29.2 41.4
29.6 27.3 31.9
77.3
100.0
77.4
48
13.1
39.8
55.2
13.7
47.3
11.4
0.0
11.4
26.7
82.7
38.5
22.4
82.7
32.2
25.3 23.8
9.0 37.5
23.6 24.1
32.5 33.1
37.5 32.6
33.9 33
30.6 31.5
34.9 32.7
31.6 31.7
20.9
20.0
20.4
29.4
32.4
30.9
23.6
23.9
23.7
434.7 per 1000, whereas among the poor, it is 176.5 per 1000 as per the 71st Round NSSO data. The reasons for not seeking treatment or medical advice and for not using public facilities for outpatient care by the non-poor and poor elderly segments of the Indian population in 2014 are shown in Table 4.27. Irrespective of the fact that they are poor or non-poor, the most important reason for the elderly not seeking medical treatment is that the personal perception of the ailment is not serious. The lack of medical facility in the neighbourhood is also a problem for one in every ten elderly. This issue was reported more among the poor (12%) than in the non-poor populace (7.1%).
4.5 Health Interventions
193
Table 4.15 Age-specific prevalence of chronic ailment among elderly in India by region and marital status, 2014 (%) Marital status
Region North
Total Central
East
North-east
West
South
Male Never married 1.7 0.4 55 0.5 17.7 28.1 11.3 Currently married 13.9 14.8 19.8 2.0 17.1 42.3 23.5 Widowed 17.2 17.7 23.0 5.6 20.2 41.7 24.6 Divorced/separated 37.7 2.8 0.8 2.1 71.7 18.7 13.0 All 14.2 15.1 20.3 2.4 17.6 42.1 23.6 Female Never married 38.6 0.0 75.7 0.3 15.6 38 43.2 Currently married 20.3 9.3 20.3 2.6 17.3 40.3 22.2 Widowed 20.1 9.5 22.9 4.7 17.8 41.6 24.9 Divorced/separated 80.2 1.4 16.4 0.0 16.2 50.5 38.4 All 20.2 9.4 22.3 3.6 17.6 41.2 23.9 Total Never married 2.9 0.3 70.1 0.3 16.7 33.4 23.5 Currently Married 16.4 12.7 20 2.2 17.2 41.6 23.1 Widowed 19.4 11.8 22.9 4.8 18.3 41.6 24.8 Divorced/separated 50.9 2.3 3.0 2.0 24.5 45.2 29.7 All 17.3 12.3 21.2 3.0 17.6 41.6 23.7 Note: Chronic morbidity is defined as the number of elderly experiencing any chronic ailment to the total elderly in the aged group expressed in percentage States were classified into six regions: North = Chandigarh, Delhi, Haryana, Himachal Pradesh, Jammu & Kashmir, Punjab, Rajasthan, Uttarakhand; Central = Chhattisgarh, Madhya Pradesh, Uttar Pradesh; East = Bihar, Jharkhand, Odisha, West Bengal; North-east = Arunachal Pradesh, Assam, Manipur, Meghalaya, Mizoram, Nagaland, Sikkim, Tripura; West = Dadra & Nagar Haveli, Daman & Diu, Goa, Gujarat, Maharashtra; South = Andaman & Nicobar Islands, Andhra Pradesh, Karnataka, Kerala, Lakshadweep, Puducherry, Tamil Nadu, Telangana Source of data: National sample survey (2014)
4.5
Health Interventions
Since the independence, India has implemented three national health policies. The first National health Policy of 1983, the National Population Policy of 2002 and the National Health Policy of 2017 do not specifically discuss health conditions in old age. Rather, these policies emphasize child health, adolescent health and maternal health more. However, there is adequate focus on the policy action concerned in diverse sectors and the strategies to expand quality preventive, promotive, curative, palliative and rehabilitative services in the public sector. The latest national health policy contains only a mild reference to the consequences of malnutrition and micro-nutrient deficiencies among the aged. In fact, the evidence discussed in the
194
4 Morbidity, Health Care and Health Interventions
Table 4.16 Age-specific prevalence of chronic ailment among elderly in India by region and religion, 2014 (%) Region North Male
Central
East
North-east
West
South
Total
Hinduism 11.5 15.3 20.4 2.0 16.8 39.1 22.5 Islam 13.2 14.2 22 2.4 20 53.9 25.4 Christianity 0.0 0.0 12.6 1.3 29.7 58.8 42.3 Sikhism 26.7 10.1 0.0 0.0 25.4 0.0 26.1 Jainism 56.9 34.6 0.0 0.0 46.9 87.2 48.4 Buddhism 4.4 0.0 0.0 8.1 11.0 0.0 10.3 Zoroastrianism 0.0 0.0 0.0 0.0 3.4 0.0 3.4 Others 7.3 0.0 12.4 21.0 100.0 0.0 17.9 Total 14.2 15.1 20.3 2.4 17.6 42.1 23.6 Female Hinduism 18.2 9.4 21.6 4.2 17.7 37.9 22.7 Islam 12.9 10.2 30.4 2.6 18.8 61.1 28.3 Christianity 28.2 1.1 8.9 2.5 24.1 61.5 40.5 Sikhism 30.6 11.5 0.0 44.7 8.4 0.0 29.4 Jainism 84.6 31.2 0.0 0.0 13.9 18.1 31.2 Buddhism 0.6 0.0 0.0 0.6 4.4 0.0 3.9 Zoroastrianism 0.0 0.0 0.0 0.0 9.5 0.0 8.1 Others 100.0 0.0 12.7 0.5 100.0 0.0 17.2 Total 20.2 9.4 22.3 3.6 17.6 41.2 23.9 Total Hinduism 15.0 12.3 21.0 3.2 17.3 38.5 22.6 Islam 13.1 12.2 26.2 2.5 19.3 57.5 26.9 Christianity 4.7 0.7 10.4 1.8 26.6 60.0 41.5 Sikhism 28.8 10.8 0.0 44.7 9.3 0.0 27.9 Jainism 68.6 33.2 0.0 0.0 31.9 47.3 40.8 Buddhism 2.2 0.0 0.0 5.7 7.2 0.0 6.7 Zoroastrianism 0.0 0.0 0.0 0.0 6.4 0.0 5.9 Others 13.6 0.0 12.5 12.9 100.0 0.0 17.6 Total 17.3 12.3 21.2 3.0 17.6 41.6 23.7 Note: Chronic morbidity is defined as the number of elderly experiencing any chronic ailment to the total elderly in the aged group expressed in percentage States were classified into six regions: North = Chandigarh, Delhi, Haryana, Himachal Pradesh, Jammu & Kashmir, Punjab, Rajasthan, Uttarakhand; Central = Chhattisgarh, Madhya Pradesh, Uttar Pradesh; East = Bihar, Jharkhand, Odisha, West Bengal; North-east = Arunachal Pradesh, Assam, Manipur, Meghalaya, Mizoram, Nagaland, Sikkim, Tripura; West = Dadra & Nagar Haveli, Daman & Diu, Goa, Gujarat, Maharashtra; South = Andaman & Nicobar Islands, Andhra Pradesh, Karnataka, Kerala, Lakshadweep, Puducherry, Tamil Nadu, Telangana Source of data: National sample survey (2014)
4.5 Health Interventions
195
Table 4.17 Age-specific prevalence of chronic ailment among elderly in India by region and caste, 2014 (%) Region North Central
East
North-east
West
South
Total
Male
Scheduled tribes 1.3 4.8 8.8 2.7 23.6 27.1 11.3 Scheduled castes 11.7 16.7 19.7 1.3 8.7 37.9 20.7 Other backward 12.3 16.2 10.9 1.5 14.5 41.0 23.6 classes Others 18.6 14.9 33.5 2.7 20.7 48.7 27.5 Total 14.2 15.1 20.3 2.4 17.6 42.1 23.6 Female Scheduled tribes 3.6 6.1 10.3 2.3 17.3 15.9 10.1 Scheduled castes 19.4 6.9 23.1 0.2 13.1 33.2 19.6 Other backward 17.2 8.7 16.3 7.8 14.1 41.0 24.7 classes Others 25.1 13.6 31.2 2.9 21.8 49.8 28 Total 20.2 9.4 22.3 3.6 17.6 41.2 23.9 Total Scheduled tribes 2.4 5.5 9.6 2.6 20.1 21.6 10.7 Scheduled castes 15.9 11.6 21.2 0.6 11.1 35.4 20.1 Other backward 14.9 12.6 13.4 4.5 14.3 41.0 24.2 classes Others 22.0 14.2 32.4 2.8 21.3 49.3 27.8 Total 17.3 12.3 21.2 3.0 17.6 41.6 23.7 Note: Chronic morbidity is defined as the number of elderly experiencing any chronic ailment to the total elderly in the aged group expressed in percentage States were classified into six regions: North = Chandigarh, Delhi, Haryana, Himachal Pradesh, Jammu & Kashmir, Punjab, Rajasthan, Uttarakhand; Central = Chhattisgarh, Madhya Pradesh, Uttar Pradesh; East = Bihar, Jharkhand, Odisha, West Bengal; North-east = Arunachal Pradesh, Assam, Manipur, Meghalaya, Mizoram, Nagaland, Sikkim, Tripura; West = Dadra & Nagar Haveli, Daman & Diu, Goa, Gujarat, Maharashtra; South = Andaman & Nicobar Islands, Andhra Pradesh, Karnataka, Kerala, Lakshadweep, Puducherry, Tamil Nadu, Telangana Source of data: National sample survey (2014)
previous sections suggests that the health care of old people urgently requires special attention and consideration in the national health policy. As per the Constitution of India, public health and health care are the responsibility of state governments, even though the central government spends considerable amounts for maternal, child and adolescent health. However, the public spending on health in the country is less than 1% of the Gross Domestic Product and is lower than many of the African countries (Teltumbde 2018). On the other hand, the current health expenditure as a percentage of the GDP of the country is around 3.9, which indicates the significant role of the private health sector in India (Table 4.28). It is widely accepted that relatively low public health expenditure seriously affects the health care and health outcomes of the poor people in many parts of the country (Table 4.29). The Goods and Services Tax (GST) implemented by the central government has eased to generate substantial revenue for both the
196
4 Morbidity, Health Care and Health Interventions
Table 4.18 Sex-wise proportion of hospitalized elderly population by chronic ailment, place of residence and age, India 2014 Age group
Rural 60–69 70–79 80–89 90+ Total Urban 60–69 70–79 80–89 90+ Total Total 60–69 70–79 80–89 90+ Total
Suffering from any chronic ailment Yes No Sex Sex Male Female Total Male Female 13.5 18.5 19.3 31.1 16.0
13.7 14.0 16.6 17.8 14.1
13.6 16.6 18.0 23.0 15.1
4.4 5.7 8.0 8.2 5.0
14.8 23.8 26.2 23.5 18.4
11.4 18.3 23.5 10.6 14.1
12.9 21.2 24.6 16.3 16.1
14.0 20.4 21.5 28.6 16.9
12.7 15.7 19.7 15.7 14.1
13.3 18.3 20.5 21.0 15.5
Total
Total Sex Male
Female
Total
4.8 6.3 6.0 4.3 5.3
4.6 6.0 7.0 5.8 5.2
6.1 8.9 11.4 14.8 7.3
6.6 7.8 8.7 7.9 7.1
6.3 8.3 10 10.5 7.2
5.5 7.1 15.3 6.8 6.5
6.8 8.4 7.5 12.5 7.3
6.1 7.7 10.8 9.6 6.9
8.1 12.4 19.0 11.4 10.0
8.3 11.4 13.3 11.9 9.5
8.2 11.9 15.6 11.7 9.8
4.7 6.1 10.0 7.8 5.4
5.4 6.8 6.5 6.2 5.8
5.0 6.5 8.1 6.8 5.6
6.7 10.0 13.6 13.6 8.2
7.1 8.9 10.4 8.9 7.8
6.9 9.4 11.9 10.8 8.0
state and central governments. States such as Kerala are getting more tax money than they had received earlier. So, they must make use a considerable proportion of the additional funds gained through GST for the welfare of the nation. There are many programmes that directly or indirectly make an impact on the health of the old people in the country. The most remarkable recent programmes such as the Swachh Bharat Abhiyan (SBA) and the Rashtriya Swasthya Bima Yojana (RSBY) received worldwide attention as appropriate initiatives that ensured the well-being of the people. The Swachh Bharat Abhiyan (The Clean India Mission) was launched in India on 2 October 2014 and has significant effect on sanitation facilities. Hygiene may improve the general health of the people, particularly the elderly and children in both rural and urban areas. The objectives of the Swachh Bharat Mission are 1. 2. 3. 4.
the elimination of open defecation, the eradication of manual scavenging, modern and scientific municipal solid waste management, behavioural changes regarding healthy sanitation practices,
4.5 Health Interventions
197
Table 4.19 Sex-wise proportion of hospitalized elderly population by chronic ailment, place of residence and marital status, India 2014 Sector
Rural
Urban
Total
Marital status
Never married Currently married Widowed Divorced/ separated Total Never married Currently married Widowed Divorced/ separated Total Never married Currently married Widowed Divorced/ separated Total
Whether suffering from Yes Sex Male Female Total
any chronic ailment No Sex Male Female Total
Total Sex Male
Female
Total
39
4.7
9.2
2.6
0.0
2.2
3.7
2.6
3.4
16.3
13.4
15.3
5.2
5.1
5.1
7.5
6.6
7.2
14.3 50.8
13.3 96.1
13.6 88.6
4.2 5.7
5.5 11.0
5.2 8.1
6.5 13.5
7.1 58.3
6.9 40.9
16.0 40.9
14.1 27.0
15.1 33.0
5.0 7.2
5.3 2.7
5.2 4.7
7.3 18.7
7.1 11.2
7.2 14.4
17.1
12.6
15.5
6.4
6.4
6.4
9.5
8.2
9.1
25.8 45.3
14.9 25.4
16.7 27.5
7.2 1.6
8.3 5.2
8.0 4.0
12.9 4.3
10.6 9.4
11.0 7.9
18.4 40.6
14.1 14.9
16.1 22.5
6.5 3.5
7.3 1.7
6.9 3.0
10.0 7.7
9.5 7.4
9.8 7.6
16.6
13.1
15.4
5.6
5.4
5.5
8.2
7.1
7.8
18.0 49.8
14.0 77.1
14.8 73.0
4.9 4.0
6.2 7.4
5.9 5.9
8.1 9.9
8.1 34.2
8.1 25.8
16.9
14.1
15.5
5.4
5.8
5.6
8.2
7.8
8.0
5. an awareness of sanitation and its association with public health, 6. capacity augmentation for urban local bodies and 7. an environment for private sector participation in Capex (capital expenditure) and Opex (operation and maintenance). Under this programme, rural sanitation coverage went up from 38.7–96.8% during the period 2014–2018 (see Fig. 4.3). The public awareness of the need for sanitation and health also improved through mass media communication. Now, around 35 states have reported a sanitary coverage of 70% or above (see Fig. 4.4). It is widely believed that the mission would reduce the health costs of the people by reducing diarrhoea and other diseases that are connected to poor sanitation. However, more scientific studies are required to understand the impact of Swachh Bharat Abhiyan on public health, especially that of old people (Fig. 4.2).
198
4 Morbidity, Health Care and Health Interventions
Table 4.20 Sex-wise proportion of hospitalized elderly population by chronic ailment, place of residence and education, India 2014 Sector
General education
Suffering from any chronic ailment Yes
Rural
Urban
Total
No
Male
Female
Total
Male
Female
Total
Male
Female
Not literate
12.9
13.1
13
4.3
5.2
4.9
6.0
6.6
Total 6.3
Literate without any schooling
12.5
1.3
8.0
6.8
14.7
7.9
7.6
8.9
7.9
Literate without formal schooling: through NFEC
100.0
100.0
100.0
5.1
0.0
5.1
9.7
100.0
10.7
Literate through TLC/AEC
0.0
69.9
15.2
6.2
0.0
2.6
3
12.6
7.3
Others
68.4
0.0
29.9
5.7
24.9
11.8
17.1
15.5
16.5
Literate with formal schooling: below primary
21.6
14.9
18.4
5.9
6.6
6.1
9.4
9.3
9.4
Primary
16.3
17.8
16.8
5.8
4.7
5.5
8.4
8.5
8.4
Upper primary/ middle
18.5
26.2
20.7
6.2
5.2
6.0
8.6
11.2
9.2
Secondary
27.8
11.7
25.6
5.6
7.0
5.7
10.1
8.9
10.0
Higher secondary
11.6
12.0
11.6
4.4
18.4
5.0
6.6
14.4
7.1
Diploma/certificate course (up to secondary)
14.5
45.3
24.5
2.4
9.7
3.7
6.8
30.5
12.3
Diploma/certificate course (higher secondary)
0.1
0.0
0.1
36.8
0.0
36.8
8.5
0.0
8.4
Diploma/certificate course (graduation and above)
25.7
0.0
25.7
1.2
0.0
1.2
4.0
0.0
4.0
Graduate
7.9
0.0
7.6
6.0
0.6
5.4
6.5
0.5
5.9
Postgraduate and above
16.0
100.0
19.1
5.7
0.0
5.5
8.1
37.5
8.8 7.2
Total
16.0
14.1
15.1
5.0
5.3
5.2
7.3
7.1
Not literate
21.9
15.3
16.8
5.7
7.6
7.1
9.1
9.6
9.5
Literate without any schooling
39.8
40.4
40
4.1
7.7
6
9.2
10.6
9.9
Literate without formal schooling: through NFEC
0.0
1.3
1.3
28.3
28.5
28.5
17.6
6.6
7.6
Literate through TLC/AEC
0.0
0.0
0.0
0.0
100.0
100.0
0.0
100.0
10.8
Others
44.8
57.9
54.5
4.0
4.1
4.1
4.9
6.3
5.7
Literate with formal schooling: below primary
24.7
16.5
19.8
6.9
8.5
7.7
12.9
12.0
12.4
(continued)
4.5 Health Interventions
199
Table 4.20 (continued) Sector
General education
Suffering from any chronic ailment Yes
Total
Total
No
Male
Female
Total
Male
Female
Total
Male
Female
Primary
17.8
11.2
14.1
6.9
8.1
7.5
10.5
9.5
Total 10.0
Upper primary/ middle
15.7
16.1
15.9
4.2
7.3
5.5
7.5
10.2
8.6
Secondary
14.9
13.3
14.3
9.4
5.9
8.3
11.3
8.7
10.4
Higher secondary
16.2
5.4
12.9
5.4
4.1
5.0
8.0
4.4
6.9
Diploma/certificate course (up to secondary)
17.8
11.8
15.4
6.0
5.8
6.0
8.7
7.8
8.4
Diploma/certificate course (higher secondary)
11.0
12.7
11.1
10.4
0.2
6.9
10.7
1.9
8.6
Diploma/certificate course (graduation and above)
14.8
0.3
8.2
1.3
21.9
2.5
4.9
4.0
4.7
Graduate
19.9
8.0
16.2
7.0
6.2
6.8
11.2
6.9
10.0
Postgraduate and above
17.1
25.7
19.2
6.7
4.7
6.2
10.1
11.6
10.5
Total
18.4
14.1
16.1
6.5
7.3
6.9
10.0
9.5
9.8
Not literate
14.3
13.7
13.9
4.5
5.6
5.2
6.4
7.2
6.9
Literate without any schooling
20.3
12.5
17.1
6.1
9.4
7.1
8.1
10.0
8.7
Literate without formal schooling: through NFEC
77.3
4.9
16.9
5.6
28.5
7.3
10.0
9.3
9.8
Literate through TLC/AEC
0.0
69.9
14.9
6.2
0.2
2.7
2.9
12.8
7.3
Others
67.1
6.4
32.0
5.1
11.6
8.1
13.3
10.6
12.0
Literate with formal schooling: below primary
22.6
15.7
19
6.1
7.3
6.6
10.3
10.4
10.3
Primary
16.9
13.9
15.5
6.1
6.3
6.2
9.0
9.0
9.0
Upper primary/ middle
17.1
19.5
18.1
5.5
6.5
5.8
8.2
10.6
8.9
Secondary
19.7.0
13.1
17.8
7.3
6.1
7.1
10.7
8.7
10.2
Higher secondary
14
7.0
12.4
5.0
5.0
5.0
7.4
5.6
7.0
Diploma/certificate course (up to secondary)
16.1
26.1
19.8
4.8
6.6
5.2
8.0
14.7
9.9
Diploma/certificate course (higher secondary)
7.3
12
7.5
13.7
0.2
9.5
10.1
1.8
8.6
(continued)
200
4 Morbidity, Health Care and Health Interventions
Table 4.20 (continued) Sector
General education
Suffering from any chronic ailment Yes
Diploma/certificate course (graduation and above)
Total
No
Male
Female
Total
Male
Female
Total
Male
Female
Total
16.3
0.3
9.6
1.3
21.9
2.1
4.6
4.0
4.5
Graduate
17.3
7.8
14.8
6.7
5.5
6.4
10
6.3
9.1
Postgraduate and above
17.0
27.0
19.2
6.5
4.7
6.1
9.8
12.0
10.3
Total
16.9
14.1
15.5
5.4
5.8
5.6
8.2
7.8
8.0
Table 4.21 Sex-wise proportion of hospitalized elderly population by chronic ailment, place of residence and caste, India 2014 Sector
Social group
Suffering from any chronic ailment Yes No Male Female Total Male Female
Total
Male
Female
Total
Rural
Scheduled tribes Scheduled castes Other backward classes Others Total Scheduled tribes Scheduled castes Other backward classes Others Total Scheduled tribes Scheduled castes Other backward classes Others Total
12.5
10.4
11.5
2.8
4.0
3.4
3.9
4.7
4.3
13.1
11.9
12.5
3.9
5.5
4.7
5.7
6.7
6.2
19.6
16.3
18.0
5.3
5.5
5.4
8.2
7.6
7.9
13.3 16.0 4.1
12.9 14.1 6.2
13.1 15.1 5.0
6.2 5.0 4.3
5.3 5.3 4.3
5.7 5.2 4.3
8.1 7.3 4.2
7.2 7.1 4.5
7.6 7.2 4.4
13.7
15.8
14.8
6.4
7.0
6.7
8.2
9.0
8.7
18.4
14.4
16.2
7.0
8.9
8.0
10.6
11.0
10.8
19.8 18.4 11.5
13.6 14.1 10.0
16.6 16.1 10.8
6.2 6.5 3.0
6.2 7.3 4.1
6.2 6.9 3.5
10.2 10.0 3.9
8.5 9.5 4.7
9.4 9.8 4.3
13.3
13.0
13.2
4.4
5.8
5.1
6.2
7.2
6.7
19.1
15.5
17.2
5.8
6.4
6.1
8.9
8.6
8.8
16.3 16.9
13.2 14.1
14.8 15.5
6.2 5.4
5.7 5.8
5.9 5.6
9.0 8.2
7.8 7.8
8.4 8.0
Urban
Total
Total
4.5 Health Interventions Table 4.22 Percentage distribution of aged persons with chronic ailments by perception about change in state of health: gender and place of residence, India
Table 4.23 Percentage distribution of aged persons with chronic ailments by perception about change in state of health: gender and marital status, India 2014
201 Sex
Own perception—change in state of health Better Nearly the same Worse
Rural
Male 15.4 40.1 Female 14.4 45.4 Total 14.9 42.7 Urban Male 19.8 50.5 Female 14.2 54.2 Total 16.8 52.5 Total Male 17.1 44.1 Female 14.3 49.1 Total 15.7 46.7 Source of data: Computed from NSS, 71st round
Marital status
Never married
Sex
44.5 40.2 42.4 29.8 31.6 30.7 38.8 36.6 37.6
Own perception—change in state of health Better Nearly the Worse same
Male 30.7 21.9 Female 4.3 84.0 Total 12.2 65.6 Currently Male 17.9 43.9 married Female 14.4 47.5 Total 16.7 45.1 Widowed Male 12.5 45.6 Female 13.9 49.9 Total 13.6 49.0 Divorced/ Male 8.4 42.5 separated Female 46.9 46.7 Total 41.1 46.1 Total Male 17.1 44.1 Female 14.3 49.1 Total 15.7 46.7 Source of data: Computed from NSS, 71st round
47.3 11.6 22.2 38.1 38.2 38.1 41.9 36.2 37.4 49.1 6.4 12.8 38.8 36.6 37.6
Another useful programme for the elderly is the Rashtriya Swasthya Bima Yojana, which was launched on 1 April 2008 by the Ministry of Labour and Employment, Government of India. It was later administered and implemented by the Ministry of Health and Family Welfare from 2015. The aim of the programme is to provide health insurance coverage for below poverty line (BPL) families. The scheme provided a total insurance cover of Rs. 30,000 per family per annum with cashless attendance to all covered ailments and transportation cost within an overall
202
4 Morbidity, Health Care and Health Interventions
Table 4.24 Percentage distribution of aged persons with chronic ailments by perception about change in state of health: gender and caste, India 2014 Social group
Sex
Own perception—change in state of health Better Nearly the same Worse
Scheduled tribes
Male 15.0 Female 16.3 Total 15.6 Scheduled castes Male 20.3 Female 13.2 Total 16.8 Other backward classes Male 15.2 Female 14.9 Total 15.1 Others Male 18.2 Female 13.7 Total 16.0 Total Male 17.1 Female 14.3 Total 15.7 Source of data: Computed from NSS, 71st round
27.1 24.0 25.6 40.8 44.7 42.8 44.4 50.9 47.8 46.6 50.6 48.6 44.1 49.1 46.7
57.9 59.7 58.8 38.9 42.1 40.5 40.4 34.1 37.1 35.2 35.7 35.5 38.8 36.6 37.6
Table 4.25 Percentage distribution of aged persons with chronic ailments by perception about change in state of health: gender and religion, India 2014 Religion
Sex
Own perception—change in state of health Better Nearly the same Worse
Hinduism
Male Female Total Male Female Total Male Female Total Male Female Total Male Female Total
18.1 15.7 16.8 13.5 8.9 11.0 7.6 7.2 7.4 28.8 12.5 19.3 3.7 9.3 5.6
Islam
Christianity
Sikhism
Jainism
45.6 49.0 47.4 39.8 50.4 45.4 35.0 52.0 43.0 38.7 41.9 40.6 35.6 17.7 29.6
36.3 35.3 35.8 46.8 40.7 43.6 57.3 40.8 49.6 32.6 45.6 40.2 60.7 73.0 64.8 (continued)
4.5 Health Interventions
203
Table 4.25 (continued) Religion Buddhism
Sex
Own perception—change in state of health Better Nearly the same Worse
Male 37.3 Female 21.9 Total 32.3 Zoroastrianism Male 0.0 Female 0.0 Total 0.0 Others Male 0.0 Female 0.0 Total 0.0 Total Male 17.1 Female 14.3 Total 15.7 Source of data: Computed from NSS, 71st Round
49.8 20.5 40.2 0.0 100.0 72.9 47.5 99.7 70.1 44.1 49.1 46.7
12.9 57.5 27.6 100.0 0.0 27.1 52.5 0.3 29.9 38.8 36.6 37.6
limit of Rs. 1000 (Teltumbde 2018). The cost for insurance has since then been borne by the state and central governments in the ratio of 25:75. Table 4.30 shows the state and central government expenditure on the RSBY from 2008–2015. Over the years, the highest amount was spent in the year 2012–13. The latest health scheme, Ayushman Bharat (National Health Protection Scheme [NHPS]), targets 100 million families with an insurance cover of Rs. 5,00,000 each. The share contribution of the state and central governments regarding the funds would be 60:40. The NHPS has immense relevance since the proportion of the elderly covered in the scheme is up to 20% (Table 4.31). Only 16.1% of the elderly avail of government-funded insurance schemes. Around 1% of the elderly enjoy employer-supported health protection. The use of health insurance schemes significantly differs with the socioeconomic conditions of old people (see Tables 4.32, 4.33, 4.34, and 4.35). The Government of India has introduced a few schemes for the elderly poor to ensure nutritious food that would enrich their health. The Annapurna Scheme launched on 1 April 2000 is one such initiative. The aim is to provide food security to the poor aged 65 years and above. The criterion to select the beneficiaries is that the applicant must be a destitute with little or no regular means of sustenance of their own or from others. The applicant should not be in receipt of a pension under the National Old Age Pension Scheme (NOAPS) or the state pension scheme. All beneficiaries are given 10 kg of food grains per month free of cost. Prominent schemes implemented by the Ministry of Social Justice and Empowerment, Government of India for those aged 65 years are the Antyodaya Anna Yojna (AAY) and the National Old Age Pension Scheme.
204
4 Morbidity, Health Care and Health Interventions
Table 4.26 Percentage distribution of aged persons with chronic ailments by perception about change in state of health: gender and education, India 2014 General education
Sex
Own perception—change in state of health Better Nearly the Worse same
Not literate
Male Female Total Male Female Total Male Female Total Male Female Total Male Female Total Male Female Total Male Female Total Male Female Total Male Female Total Male Female Total Male Female Total Male Female Total
15.9 13.5 14.3 14.7 49.8 28.9 0.0 0.0 0.0 0.0 5.9 1.2 2.0 0.0 0.8 22.0 9.8 15.6 11.9 24.2 17.6 13.8 10.5 12.5 22.7 15.7 20.7 18.9 2.8 15.1 23.2 26.8 24.5 31.1 57.9 32.6
Literate without any schooling
Literate without formal schooling: through NFEC Literate through TLC/AEC
Others
Literate with formal schooling: below primary
Primary
Upper primary/middle
Secondary
Higher secondary
Diploma/certificate course (up to secondary)
Diploma/certificate course (higher secondary)
37.3 47.4 43.8 17.3 17.6 17.4 22.7 96.4 84.2 0.0 0.0 0.0 4.9 10.6 8.2 39.6 49.7 44.9 51.4 41.8 47.0 38.8 65.1 49.1 50.6 63.4 54.3 55.7 42.7 52.6 51.8 34.2 45.4 48.7 19.5 47.1
46.8 39.1 41.9 68.0 32.7 53.7 77.3 3.6 15.8 100.0 94.1 98.8 93.1 89.4 91.0 38.3 40.5 39.5 36.6 34.0 35.4 47.4 24.4 38.4 26.8 20.9 25.1 25.4 54.5 32.2 25.0 39.0 30.1 20.2 22.6 20.3 (continued)
4.5 Health Interventions
205
Table 4.26 (continued) General education
Sex
Own perception—change in state of health Better Nearly the Worse same
Diploma/certificate course (graduation and above)
Male Female Total Male Female Total Male Female Total Male Female Total
56.1 3.1 34.0 11.4 23.5 14.6 25.6 9.1 21.9 17.1 14.3 15.7
Graduate
Postgraduate and above
Total
36.6 96.9 61.7 56.9 57.3 57.0 59.2 67.5 61.1 44.1 49.1 46.7
7.2 0.0 4.2 31.7 19.1 28.3 15.2 23.4 17.0 38.8 36.6 37.6
Source of data: Computed from NSS, 71st round
Table 4.27 Reasons for not seeking treatment on medical advice and not using public facilities for outpatient care by the non-poor and the poor elderly population in India, 2014 Reasons Reasons for not seeking treatment on medical advice No medical facilities available in the neighbourhood Facility of satisfactory quality not available Facility of satisfactory quality too expensive Facility of satisfactory quality involves long waiting Ailment not considered serious Others Reasons for not using public facilities for outpatient care Required specific service not available Facility available but quality not satisfactory Quality satisfactory but facility too far Facility of satisfactory quality but involves long waiting Financial constraint Others Source: Pandey et al. (2017)
Wealth condition Non-poor Poor
Total
7.1 9.3 5.9 4.6 45.8 27.3
12.0 3.6 15.8 1.5 42.3 24.7
10.8 5.0 13.3 2.3 43.2 25.4
6.3 45.6 6.7 33.8 0.1 7.5
10.3 45.2 13.1 26.1 1.0 4.4
8.4 45.4 10.0 29.8 0.6 5.9
206 Table 4.28
4 Morbidity, Health Care and Health Interventions Current health expenditure as a percentage of GDP for selected countries, 2015
Country
%
India America Germany France Japan Canada Afghanistan Norway UK Brazil South Africa Nepal Mexico Russia China Ethiopia Sri Lanka Pakistan World Source: Compiled from World Bank (2018)
Table 4.29 Year
3.89 16.84 11.15 11.07 10.90 10.44 10.30 9.98 9.88 8.91 8.20 6.15 5.89 5.56 5.32 4.05 2.97 2.69 9.90
Government expenditure on health care (in Rs. crore) Total expenditure
Central expenditure
State expenditure
2005–06 34,769 11,640 23,129 2006–07 40,071 13,342 26,729 2007–08 47,788 17,252 30,536 2008–09 57,718 21,372 36,346 2009–10 71,895 27,147 44,748 2010–11 81,953 30,041 51,913 2011–12 92,711 33,307 59,404 2012–13 112,582 35,331 77,251 2013–14 123,908 36,656 87,252 2014–15 149,538 44,238 105,300 Source: Union budget data (for central expenditure) and RBI annual publications (for state expenditure) taken from Jain et al. (2015)
4.5 Health Interventions
207
Coverage % Overall Coverage %
100.00
96.77
75.00 50.00
50.35
64.35
83.62
38.70
25.00 0.00 2nd Oct, 2014
2015-2016
2016-2017
2017-2018
2018-2019
Financial Year Fig. 4.3 Swachh Bharat Mission, trend in coverage status of individual household latrines (IHHL), 2014–2019. Source: Ministry of Drinking Water and Sanitation, http://sbm.gov.in/ sbmreport/home.aspx accessed on December 3, 2018
Fig. 4.4 State’s coverage status of individual household latrines (IHHL), 2018. Source: Ministry of Drinking Water and Sanitation, http://sbm.gov.in/sbmreport/home.aspx accessed on 3 December 2018
Apart from these schemes, many state-launched efforts exist to ensure the food security of the elderly. In state-sponsored programmes, food grains are usually released through the ration shops. The state departments of food and civil supplies have tie-ups with the Food Corporation of India (FCI) for the successful implementation of such schemes. Food grains are made available in ration shops at much less than the market rates for all families and at very low cost for BPL families.
208
4 Morbidity, Health Care and Health Interventions
Table 4.30 Year
Government expenditure on Rashtriya Swasthya Bima Yojana (in Rs. Crore) Total expenditure
Central expenditure
State expenditure
2008–09 133.3 99.9 33.3 2009–10 350.0 262.5 87.5 2010–11 678.9 509.2 169.7 2011–12 1230.6 923.0 307.7 2012–13 1409.1 1056.8 352.3 2013–14 1181.2 885.9 295.3 2014–15 725.9 544.4 181.5 Notes: State shares have been estimated on the basis of 75:25 union and state contributions. Though for north-eastern states and J&K, the sharing pattern is 90:10; since total numbers enrolled in these states are low, the overall estimates are not very wide off the mark Source: Ministry of labour and employment reports; taken from Jain et al. (2015)
Table 4.31 Proportion of elderly people covered by any health insurance scheme for health expenditure support in India, by place of residence, sex and condition of chronic ailment Sector
Whether suffering from any chronic ailment Yes No Male Female Total Male Female
Total Total
Male
Female
Government-funded insurance scheme (ESIS, RSBY, Arogyasri, CGHS) Rural 31.1 30.1 30.6 12.3 14.0 13.2 16.3 17.2 Urban 20.8 23.2 22.1 12.7 10.6 11.6 15.1 14.7 Total 27.1 27.2 27.1 12.4 13.0 12.7 15.9 16.4 Employer-supported health protection (other than government) Rural 0.7 0.9 0.8 0.5 0.4 0.4 0.5 0.5 Urban 3.1 2.6 2.8 1.5 1.7 1.6 2.0 2.0 Total 1.6 1.6 1.6 0.8 0.7 0.8 1.0 0.9 Arranged by household with insurance companies Rural 0.3 0.2 0.3 0.3 0.3 0.3 0.3 0.3 Urban 5.5 4.3 4.9 4.8 5.2 5.0 5.0 4.9 Total 2.3 2.0 2.1 1.6 1.6 1.6 1.8 1.7 Others Rural 0.0 0.1 0.1 0.1 0.0 0.1 0.1 0.0 Urban 0.2 0.4 0.3 0.3 0.3 0.3 0.3 0.3 Total 0.1 0.2 0.2 0.2 0.1 0.1 0.2 0.1 Not covered Rural 67.9 68.7 68.3 86.7 85.4 86.0 82.8 82.0 Urban 70.3 69.5 69.9 80.7 82.3 81.5 77.7 78.1 Total 68.8 69.0 68.9 85.0 84.5 84.7 81.2 80.8
Total 16.7 14.9 16.1 0.5 2.0 1.0 0.3 4.9 1.7 0.1 0.3 0.1 82.4 77.9 81.0
4.5 Health Interventions
209
Table 4.32 Proportion of elderly people covered by any health insurance scheme for health expenditure support in India, by sex, marital status and condition of chronic ailment Yes Male
Female
Total
No Male
Female
Total
Total Male
Government-funded insurance scheme (e.g. RSBY, Arogyasri, CG) Never married 19.5 0.0 5.8 1.2 7.0 2.8 3.2 Currently married 28.1 27.9 28.1 12.5 11.8 12.3 16.2 Widowed 21.9 27.3 26.2 12.6 14.1 13.8 14.9 Divorced/ 12.3 5.6 6.6 11.2 3.8 6.9 11.4 separated Total 27.1 27.2 27.1 12.4 13.0 12.7 15.9 Employer-supported health protection (other than government) Never married 12.7 0.0 3.8 0.0 0.9 0.2 1.4 Currently married 1.9 1.5 1.8 0.7 0.5 0.7 1.0 Widowed 0.3 1.7 1.4 1.3 0.9 1.0 1.0 Divorced/ 0.0 0.0 0.0 0.0 0.6 0.3 0.0 separated Total 1.6 1.6 1.6 0.8 0.7 0.8 1.0 Arranged by household with insurance companies Never married 4.0 13.3 10.5 0.1 4.1 1.3 0.6 Currently married 2.2 2.2 2.2 1.8 2.4 2.0 1.9 Widowed 2.7 1.7 1.9 1.0 0.9 0.9 1.4 Divorced/separated 0.0 0.0 0.0 7.2 4.1 0.0 Total 2.3 2.0 2.1 1.6 1.6 1.6 1.8 Others Currently married 0.1 0.5 0.3 0.1 0.1 0.1 0.1 Widowed 0.0 0.1 0.1 0.5 0.1 0.2 0.4 Total 0.1 0.2 0.2 0.2 0.1 0.1 0.2 Not covered Never married 63.8 86.7 79.9 98.7 88.0 95.7 94.7 Currently married 67.6 67.9 67.7 84.9 85.2 85.0 80.8 Widowed 75.1 69.2 70.5 84.7 83.9 84.1 82.3 Divorced/ 87.7 94.4 93.4 88.8 88.5 88.6 88.6 separated Total 68.8 69.0 68.9 85.0 84.5 84.7 81.2
Female
Total
4.0 15.4 17.4 4.5
3.5 15.9 16.9 6.8
16.4
16.1
0.5 0.8 1.1 0.4
1.1 0.9 1.1 0.2
0.9
1.0
8.1 2.3 1.1 4.4 1.7
3.4 2.0 1.2 2.9 1.7
0.2 0.1 0.1
0.1 0.2 0.1
87.5 81.3 80.3 90.8
92.0 81.0 80.7 90.0
80.8
81.0
Non-governmental organizations such as Help Age India are actively involved in many parts of the country for the well-being of elderly people. Help Age India has the Grain Bank initiative for the destitute elderly in urban cities along with endeavours such as ‘Adopt a Gran’ and ‘Sponsor a Gran’ programmes and Mobile Health care Units (MHUs).
210
4 Morbidity, Health Care and Health Interventions
Table 4.33 Proportion of elderly people covered by any health insurance scheme for health expenditure support in India, by sex, religion and condition of chronic ailment Religion
Suffering from any chronic ailment Yes No Male Female Total Male Female
Total Total
Male
Government-funded insurance scheme (e.g. RSBY, Arogyasri, CG) Hinduism 26.0 28.4 27.3 12.9 13.5 13.2 15.8 Islam 28.8 27.2 27.9 8.4 10.7 9.5 13.6 Christianity 51.4 26.7 39.8 18.4 16.1 17.3 32.4 Sikhism 4.6 1.3 2.7 6.3 1.3 3.6 5.9 Jainism 0.0 0.5 0.2 53.2 35.2 44.0 27.5 Buddhism 2.6 0.0 1.7 8.9 7.2 7.9 8.2 Others 0.2 0.3 0.2 0.4 13.3 6.1 0.3 Total 27.1 27.2 27.1 12.4 13.0 12.7 15.9 Employer-supported health protection (other than government) Hinduism 1.6 1.6 1.6 0.8 0.7 0.8 1.0 Islam 0.7 0.7 0.7 0.2 0.1 0.2 0.3 Christianity 2.0 1.9 2.0 1.6 2.1 1.9 1.8 Sikhism 0.2 0.0 0.1 1.3 3.7 2.6 1.0 Jainism 27.6 54.6 36.7 0.0 0.0 0.0 13.3 Buddhism 0.0 0.0 0.0 0.0 0.7 0.4 0.0 Zoroastrianism 0.0 0.0 0.0 3.5 0.0 1.7 3.4 Others 0.0 0.0 0.0 0.0 0.0 0.0 0.0 Total 1.6 1.6 1.6 0.8 0.7 0.8 1.0 Arranged by household with insurance companies Hinduism 2.7 2.2 2.4 1.7 1.7 1.7 1.9 Islam 0.2 0.0 0.1 0.5 0.6 0.6 0.4 Christianity 0.6 2.0 1.3 2.0 2.5 2.3 1.4 Sikhism 0.0 0.0 0.0 1.5 2.2 1.9 1.1 Jainism 0.0 0.0 0.0 1.2 4.4 2.8 0.6 Buddhism 3.7 0.0 2.5 0.3 0.2 0.3 0.7 Zoroastrianism 100.0 37.1 54.1 90.5 83.7 87.0 90.8 Others 32 42 36.3 0.0 0.0 0.0 5.7 Total 2.3 2.0 2.1 1.6 1.6 1.6 1.8 Others Hinduism 0.1 0.3 0.2 0.2 0.1 0.2 0.2 Islam 0.0 0.0 0.0 0.0 0.0 0.0 0.0 Christianity 0.1 0.0 0.1 0.1 0.0 0.1 0.1 Jainism 0.4 5.5 2.1 0.0 0.0 0.0 0.2 Others 0.0 0.0 0.0 0.0 0.0 0.0 0.0 Total 0.1 0.2 0.2 0.2 0.1 0.1 0.2
Female
Total
16.9 15.4 20.4 1.3 24.3 6.9 11.1 16.4
16.4 14.5 26.6 3.4 26.1 7.5 5.1 16.1
0.9 0.3 2.0 2.6 17 0.7 0.0 0.0 0.9
0.9 0.3 1.9 1.9 15.0 0.4 1.6 0.0 1.0
1.8 0.5 2.3 1.5 3.0 0.2 80.0 7.2 1.7
1.9 0.5 1.9 1.3 1.7 0.4 85 6.4 1.7
0.1 0.0 0.0 1.7 0.0 0.1
0.2 0.0 0.1 0.9 0.0 0.1 (continued)
4.6 Recommendations and Insights
211
Table 4.33 (continued) Religion
Not covered Hinduism Islam Christianity Sikhism Jainism Buddhism Zoroastrianism Others Total
4.6
Suffering from any chronic ailment Yes No Male Female Total Male Female
Total
Male
Female
Total
69.5 70.3 45.9 95.2 72.0 93.8 0.0 67.8 68.8
84.2 89.7 78.5 91.9 53.2 91.4 11.3 93.9 84.7
81.0 85.6 64.3 92.0 58.4 91.1 5.8 93.9 81.2
80.3 83.8 75.2 94.5 53.9 92.2 20.0 81.7 80.8
80.6 84.7 69.5 93.4 56.4 91.7 13.4 88.5 81.0
67.5 72.1 69.3 98.6 39.4 100.0 62.9 57.7 69.0
68.5 71.2 56.9 97.2 61.0 95.8 45.9 63.4 68.9
84.4 90.9 77.8 90.9 45.6 90.8 6.0 99.6 85.0
84.0 88.5 79.2 92.8 60.4 91.8 16.3 86.7 84.5
Total
Recommendations and Insights
The National Health Policy 2017 does not give priority to elderly persons, as it emphasises child health, adolescence and maternal health. In the light of the morbidity conditions, it is possible to argue that the elderly need special attention and care in all government health programmes and policies as well. India needs a paradigm shift in the health policy, which gives more consideration to its aged population. The rationale behind this argument is rooted in the transformation of family structures and the subsequent socio-demographic dynamics across the country. Specifically, India is now a greying nation as per the United Nations criteria—the proportion of people over 60 years exceeds 7% of the total population. Moreover, the morbidity conditions of the elderly are higher than those of children, adolescents and adults. Senior citizens have relatively higher levels of prevalence in both chronic and degenerative illnesses in spite of the greater exposure to infectious diseases. In addition, the economic dependency of old people is high, and it has increased over the decades. The vision of India’s health policy is only to increase the life expectancy at birth from 67.5–70 by 2025 and to monitor the disability adjusted life years as a measure of the burden of disease. In such circumstances, a shift in health policy is proposed for the well-being of people in the country. The health policy should be focused on the elderly and must have long-term and short-term strategies. The short-term strategy of the policy must tackle the urgent health crises that arise in the population. The long-term health strategic policy ought to address the concerns of the older segment of the population, as every child born in the country should be able to survive up to advanced age without serious ill health. The researchers visualize that health in old age is a cumulative outcome of the experience of well-being in infancy, childhood, adolescence and adulthood. Such a perspective envisages the maternal and child health
212
4 Morbidity, Health Care and Health Interventions
Table 4.34 Proportion of elderly people covered by any health insurance scheme for health expenditure support in India, by sex, caste and condition of chronic ailment Social group
Suffering from any chronic ailment Yes No Male Female Total Male Female
Total Total
Male
Government-funded insurance scheme (e.g. RSBY, Arogyasri, CG) Scheduled tribes 20.1 27.6 23.7 15.8 12.7 14.2 16.3 Scheduled 33.3 23.0 28.1 12.5 14.8 13.7 16.8 castes Other backward 29.6 31.1 30.4 13.0 13.7 13.4 16.9 classes Others 22.8 23.9 23.3 10.7 11.2 11.0 14.1 Total 27.1 27.2 27.1 12.4 13.0 12.7 15.9 Employer-supported health protection (other than government) Scheduled tribes 0.2 0.5 0.3 0.7 0.2 0.5 0.7 Scheduled 1.3 1.5 1.4 1.1 0.2 0.6 1.1 castes Other backward 1.1 1.0 1.0 0.5 0.7 0.6 0.7 classes Others 2.5 2.5 2.5 1.0 1.2 1.1 1.4 Total 1.6 1.6 1.6 0.8 0.7 0.8 1.0 Arranged by household with insurance companies Scheduled tribes 0.0 0.0 0.0 0.0 0.2 0.1 0.0 Scheduled 0.4 0.0 0.2 0.0 0.0 0.0 0.1 castes Other backward 0.4 1.7 1.1 0.7 0.4 0.5 0.6 classes Others 5.3 3.2 4.2 4.1 4.7 4.4 4.4 Total 2.3 2.0 2.1 1.6 1.6 1.6 1.8 Others Scheduled tribes 0.0 0.0 0.2 0.1 0.2 0.1 Scheduled 0.2 0.1 0.1 0.0 0.3 0.1 0.0 castes Other backward 0.1 0.1 0.1 0.1 0.0 0.0 0.1 classes Others 0.2 0.4 0.3 0.4 0.1 0.3 0.4 Total 0.1 0.2 0.2 0.2 0.1 0.1 0.2 Not covered Scheduled tribes 79.7 71.9 75.9 83.3 86.8 85.1 82.8 Scheduled 64.8 75.4 70.1 86.4 84.8 85.5 81.9 castes Other backward 68.9 66.2 67.5 85.7 85.2 85.4 81.8 classes Others 69.2 70.0 69.6 83.7 82.8 83.2 79.7 Total 68.8 69.0 68.9 85.0 84.5 84.7 81.2
Female
Total
14.2 16.4
15.2 16.6
18.0
17.5
14.7 16.4
14.4 16.1
0.3 0.4
0.5 0.8
0.8
0.7
1.6 0.9
1.5 1.0
0.1 0.0
0.1 0.1
0.7
0.7
4.3 1.7
4.4 1.7
0.1 0.2
0.1 0.1
0.1
0.1
0.2 0.1
0.3 0.1
85.3 82.9
84.1 82.4
80.5
81.1
79.2 80.8
79.5 81.0
4.6 Recommendations and Insights
213
Table 4.35 Proportion of elderly people covered by any health insurance scheme for health expenditure support in India, by sex, education and condition of chronic ailment General education
Suffering from any chronic ailment Yes No Male Female Total Male Female
Total Total
Male
Government-funded insurance scheme (e.g. RSBY, Arogyasri, CG) Not literate 37.2 27.4 30.9 12.9 13.0 12.9 17.6 Literate without 20.2 16.0 18.5 14.9 8.8 13.1 15.6 any schooling Literate without 0.0 3.6 3.0 11.8 0.0 11.0 11.1 formal schooling: through NFEC Literate through 87.5 94.1 88.9 1.7 2.7 2.2 46.9 TLC/AEC Others 32.0 5.0 16.4 13.0 15.1 14.0 15.5 Literate with 31.6 30.5 31.1 13.0 16.3 14.3 17.7 formal schooling: below primary Primary 22.9 21.8 22.4 12.5 13.3 12.8 15.3 Upper primary/ 18.3 27.1 21.8 12.6 9.8 11.8 14.0 middle Secondary 19.8 29.5 22.6 11.4 7.6 10.6 13.7 Higher secondary 21.2 20.8 21.1 7.1 13.2 8.4 10.9 Diploma/ 1.8 1.8 1.8 6.0 19.8 9.3 4.8 certificate course (up to secondary) Diploma/ 13.8 20.3 14.2 23.4 8.0 18.6 18.1 certificate course (higher secondary) Diploma/ 5.1 3.1 4.3 11.5 95.8 15.0 10.1 certificate course (graduation and above) Graduate 15.5 38.5 21.6 10.8 16.7 12.2 12.2 Postgraduate and 14.3 20.1 15.6 18.4 13.3 17.3 17.1 above Total 27.1 27.2 27.1 12.4 13.0 12.7 15.9 Employer-supported health protection (other than government) Not literate 1.0 1.1 1.1 0.6 0.7 0.6 0.7 Literate without 0.0 0.0 0.0 0.1 0.0 0.1 0.1 any schooling Others 0.0 0.0 0.0 0.0 0.5 0.2 0.0 Literate with 0.5 1.8 1.2 0.2 0.3 0.2 0.3 formal schooling: below primary
Female
Total
15.8 10.3
16.4 13.9
2.9
8.9
19.1
34.6
13.1 21.6
14.4 19.4
16.3 15.3
15.7 14.4
15.9 15.4 12.3
14.2 11.9 6.9
9.7
16.5
19.1
11.5
24.3 15.5
15.1 16.8
16.4
16.1
0.7 0.0
0.7 0.1
0.4 0.9
0.2 0.5
(continued)
214
4 Morbidity, Health Care and Health Interventions
Table 4.35 (continued) General education
Suffering from any chronic ailment Yes No Male Female Total Male Female
Primary 0.3 2.9 1.5 0.7 0.3 Upper primary/ 1.3 1.4 1.4 0.4 2.9 middle Secondary 0.8 2.9 1.4 1.8 0.4 Higher secondary 5.4 11.3 6.8 0.2 0.1 Diploma/ 5.5 0.0 3.5 0.7 2.0 certificate course (up to secondary) Diploma/ 22.3 0.0 21.1 2.0 1.0 certificate course (higher secondary) Diploma/ 0.0 0.0 0.0 16.3 0.0 certificate course (graduation and above) Graduate 4.5 1.0 3.6 2.0 4.8 Postgraduate and 3.1 0.6 2.5 0.7 1.2 above Total 1.6 1.6 1.6 0.8 0.7 Arranged by household with insurance companies Not literate 0.2 0.2 0.2 0.2 0.3 Literate without 0.0 0.5 0.2 0.0 0.0 any schooling Literate without 0.0 0.0 0.0 0.0 9.2 formal schooling: through NFEC Literate with 0.9 1.5 1.2 0.1 1.9 formal schooling: below primary Primary 0.5 1.5 1.0 1.4 2.7 Upper primary/ 0.7 8.5 3.7 1.5 2.6 middle Secondary 1.7 4.4 2.5 3.6 12.0 Higher secondary 0.7 1.3 0.9 3.6 16.2 Diploma/ 1.5 21.8 8.9 0.8 38.3 certificate course (up to secondary) Diploma/ 2.2 0.0 2.0 29.2 15.4 certificate course (higher secondary)
Total Total
Male
Female
Total
0.5 1.1
0.6 0.6
1.2 2.4
0.8 1.2
1.5 0.1 1.0
1.5 1.6 2.0
1.3 3.3 1.2
1.5 2.0 1.8
1.7
13.2
0.8
10.9
15.7
12.7
0.0
10.6
2.6 0.8
2.8 1.4
3.5 1.0
2.9 1.3
0.8
1.0
0.9
1.0
0.3 0.0
0.2 0.0
0.3 0.1
0.2 0.0
0.6
0.0
1.7
0.5
0.8
0.3
1.8
0.9
1.9 1.8
1.1 1.3
2.3 4.5
1.6 2.3
5.2 6.3 9.8
3.1 2.8 1.0
9.1 11.9 31.5
4.4 4.8 9.5
24.9
14.2
13.3
14.1
(continued)
4.6 Recommendations and Insights
215
Table 4.35 (continued) General education
Suffering from any chronic ailment Yes No Male Female Total Male Female
Total Total
Male
Female
Total
Diploma/ certificate course (graduation and above) Graduate Postgraduate and above Total Others Not literate Literate without any schooling Literate with formal schooling: Below primary Primary Upper primary/ middle Secondary Higher secondary Diploma/ certificate course (graduation and above) Graduate Postgraduate and above Total Not covered Not literate Literate without any schooling Literate without formal schooling: through NFEC Literate through TLC/AEC Others Literate with formal schooling: below primary
41.0
57.6
47.9
7.7
0.0
7.4
15.2
47.6
20.4
14.9 17.0
14.9 18.8
14.9 17.4
6.4 15.9
25.7 14.9
10.8 15.7
9.0 16.3
21.9 16.2
12.1 16.3
2.3
2.0
2.1
1.6
1.6
1.6
1.8
1.7
1.7
0.0 0.0
0.0 0.0
0.0 0.0
0.1 0.0
0.1 0.0
0.1 0.0
0.1 0.0
0.1 0.0
0.1 0.0
0.2
0.5
0.4
0.2
0.0
0.1
0.2
0.2
0.2
0.2 0.0
0.1 0.2
0.1 0.1
0.1 0.1
0.2 0.2
0.1 0.1
0.1 0.1
0.2 0.2
0.1 0.1
0.2 0.1 0.0
0.0 0.0 0.0
0.1 0.1 0.0
0.4 0.7 0.7
0.1 0.0 0.0
0.3 0.6 0.6
0.4 0.6 0.5
0.0 0.0 0.0
0.3 0.4 0.4
0.6 0.0
0.3 15.4
0.5 3.4
0.1 0.0
0.3 0.0
0.1 0.0
0.2 0.0
0.3 5.0
0.2 1.1
0.1
0.2
0.2
0.2
0.1
0.1
0.2
0.1
0.1
61.5 79.8
71.2 83.5
67.8 81.3
86.1 85.0
86.0 91.2
86.1 86.8
81.3 84.2
83.1 89.6
82.5 85.9
100
96.4
97.0
88.2
90.8
88.4
88.9
95.4
90.7
12.5
5.9
11.1
98.3
97.3
97.8
53.1
80.9
65.4
68.0 66.8
95.0 65.6
83.6 66.2
87.0 86.6
84.4 81.5
85.8 84.6
84.5 81.6
86.5 75.6
85.5 79.0
(continued)
216
4 Morbidity, Health Care and Health Interventions
Table 4.35 (continued) General education
Suffering from any chronic ailment Yes No Male Female Total Male Female
Total Total
Male
Female
Total
Primary Upper primary/ middle Secondary Higher secondary Diploma/ certificate course (up to secondary) Diploma/ certificate course (higher secondary) Diploma/ certificate course (graduation and above) Graduate Postgraduate and above Total
76.2 79.7
73.7 62.7
75.0 73.1
85.4 85.3
83.5 84.5
84.7 85.1
82.9 84.0
80.0 77.6
81.7 82.0
77.5 72.6 91.2
63.2 66.6 76.5
73.4 71.2 85.9
82.8 88.4 92.6
80.1 70.5 39.9
82.3 84.6 79.9
81.4 84.2 92.2
73.6 69.3 55.1
79.6 80.9 81.8
61.7
79.7
62.7
45.4
75.6
54.8
54.4
76.2
58.5
53.9
39.4
47.9
63.8
4.2
61.3
61.6
33.3
57.0
64.4 65.6
45.3 45.1
59.4 61.0
80.7 65.0
52.5 70.6
74.3 66.2
75.7 65.2
50.0 62.2
69.6 64.5
68.8
69.0
68.9
85.0
84.5
84.7
81.2
80.8
81.0
programmes currently operational as a part of the long-term strategy of the proposed health policy. The short-term measures of the policy shall be managed by the funds of the state government, while long-term initiatives shall be taken care of by the central government funds. Since the independence, the Government of India has already passed several laws and policies for the welfare of old people. Among these policies, three remarkable endeavours are the Hindu Adoption Law of 1956, the National Policy of Elderly of 1999 and the National Policy for Elderly, 2011. In addition to these measures, many legislations and welfare schemes exist at the state level. Many states have their own programmes for their elderly. The flow of health financing in the country is quite complex (see Fig. 4.2). Often, there is a lack of proper monitoring mechanisms for many of these health programmes at the micro-level. This drawback makes the public health sector more complex and causes fund wastage. The country needs a uniform public health strategy which is simple and easy to implement and monitor. The authors put forward this idea because many health strategies planned in the country are not affordable for most of the states. For instance, the Ayushman Bharat launched by the central government with great enthusiasm and vision is not yet implemented in many states, including Kerala, because of poor financial conditions. In Kerala, the
4.6 Recommendations and Insights
217
bulk of the central government funds is being utilized for salary and pension purposes. Only a small share of the resources is used for public welfare and health care. In such a situation, demanding a state share of 40% for a scheme is only a daydream. Therefore, it is better to make a uniform health care strategy with full funding from the centre. The programme designed should be easily implemented and monitored well. Moreover, it must be subjected to social auditing at appropriate levels to make sure that the true beneficiaries receive the benefits. There should be demand side financing schemes for the caregivers of bedridden aged patients in the country. Programmes such as the Aswasakiranam scheme implemented by the Government of Kerala should be extended to the entire country. The caregivers are usually family members or relatives of bedridden patients. These individuals are often unable to go for work, which would seriously affect the family income and the food security of the household. In order to avoid this pathetic condition, the government should provide a monthly financial assistance for caregivers of poor, bedridden and aged patients.
4.6.1
Summing up
In this chapter, an attempt was made to study the health conditions of the elderly in India. The study found that the morbidity rate among the elderly was high, irrespective of the spatial and demographic dimensions, and that chronic ailments accounted for a major chunk of the prevalence rate among the aged. Perhaps, the higher levels of chronic illness among many of the elderly may be an outcome of their past unhealthy lifestyle coupled with poor food habits. It is possible that many of the elderly with chronic diseases have gone through unhealthy conditions during their infancy, childhood, adolescence or adulthood (WHO 2002). In the light of health evidences, more scientific studies are needed to explore the lives of the elderly from different perspectives. Integrating diverse systems of medicine and reducing the health costs may be another option urgently to be considered at the policy level. The previous chapter stated that the elderly in India are highly dependent on others to meet their day-to-day expenses. Lowering the health costs of the elderly must be a top priority for the government. In many parts of the country, indigenous systems of medicine offer cost-effective therapy, particularly in the treatment of chronic and degenerative diseases. Preserving such native health care traditions to help the vulnerable sections of the population would be relevant in such contexts. The country needs a paradigm shift in its health policy in the socioeconomic context of the elderly and by the evidence of morbidity condition, health care utilization, health expenditure and intervention strategies. It is high time to view the parameters of health from a life course perspective, with adequate focus on a healthy life expectancy and by envisaging the health concerns of the elderly as an outcome of their past health experience coupled with current health risks.
218
4 Morbidity, Health Care and Health Interventions
References Agrawal, G., & Arokiasamy, P. (2010). Morbidity prevalence and health care utilization among older adults in India. Journal of Applied Gerontology, 29(2), 155–179. Arokiasamy, P., Uttamacharya, & Jain, K. (2012). Multi-morbidity, functional limitations, and self-rated health among older adults in India: Cross-sectional analysis of LASI pilot survey, 2010. Sage Open, 5(1), 1–10. https://doi.org/10.1177/2158244015571640. Baker, D. W., Gazmararian, J. A., Sudano, J., & Patterson, M. (2000). The association between age and health literacy among elderly persons. The Journals of Gerontology Series B: Psychological Sciences and Social Sciences, 55(6), S368–S374. Bharati, D. R., Ranabir Pal, R., Rekha, T. V., Yamuna, S. K., & Radjou, A. N. (2011). Ageing in Puducherry, South India: An overview of morbidity profile. Journal of Pharmacy & Bioallied Sciences, 3(4), 537. Datta, P. P., Gangopadhyay, N., & Sengupta, B. (2013). Association of psychological morbidity with socio-demographic characteristics among elderly: A cross-sectional study from Eastern India. International Journal of Medicine and Public Health, 3(2), 94–99. Dilip, T. R. (2002). Understanding levels of morbidity and hospitalisation in Kerala, India. Bulletin of World Health Organisation, 80(9), 746–751. Dsouza, S. A., Rajashekar, B., Dsouza, H. S., & Kumar, K. B. (2014). Falls in Indian older adults: A barrier to active ageing. Asian Journal of Gerontology & Geriatrics, 9(1), 33–40. Government of India. (2005). NCMH background papers burden of disease in India. National Commission on Macroeconomics and Health, Ministry of Health & Family Welfare. https:// www.who.int/macrohealth/action/NCMH_Burden%20of%20disease_(29%20Sep%202005).pdf Gumber, A., & Berman, P. (1997). Measurement and pattern of morbidity and utilisation of health services: Some emerging issues from recent health surveys in India. Journal of Health and Population in Developing Countries, 1(1), 16–43. Jain, N., Kumar, A., Nandraj, S., & Furtado, K. M. (2015). NSSO 71st round: Same data, multiple interpretations. Economic and Political Weekly, 1(46 & 47), 84–87. Joshi, K., Kumar, R., & Avasthi, A. (2003). Morbidity profile and its relationship with disability and psychological distress among elderly people in Northern India. International Journal of Epidemiology, 32(6), 978–987. Kannan, K. P., Thankappan, K. R., Raman Kutty, V., & Aravindan, K. P. (1991). Health and development in rural Kerala: A study of linkages between socio-economic status and health status. Thiruvananthapuram: Kerala Shastra Sahithya Parishad. Karmakar, P. R., Chattopadhyay, A., & Sarkar, G. N. (2014). A study on morbidity pattern and care seeking behaviour of elderly in a rural area of West Bengal (India). Indian Journal of Gerontology, 28(2), 190–200. Kumar, B. G. (1993). Low mortality and high morbidity in Kerala reconsidered. Population and Development Review, 19(1), 103–121. Kumar, V. (2003). Health status and health care services among older persons in India. Journal of Aging & Social Policy, 15(2–3), 67–83. Marengoni, A., Winblad, B., Karp, A., & Fratiglioni, L. (2008). Prevalence of chronic diseases and multimorbidity among the elderly population in Sweden. American Journal of Public Health, 98(7), 1198–1200. Michael, E. J., & Singh, B. (2003). Mixed signals from Kerala’s improving health. The Journal of Royal Society for Promotion of Health, 123(1), 33–38. Molarius, A., & Janson, S. (2002). Self-Rated health, chronic diseases, and symptoms among middle-aged and elderly men and women. Journal of Clinical Epidemiology, 55(4), 364–370. Nandi, P. S., Banerjee, G., Mukherjee, S. P., Nandi, S., & Nandi, D. N. (1997). A study of psychiatric morbidity of the elderly population of a rural community in West Bengal. Indian Journal of Psychiatry, 39(2), 122. Navaneetham, K, Kabir, M., & Krishnakumar, C. S. (2009). Morbidity Patterns in Kerala: Levels and Determinants. CDS Working Paper 411, no. April, pp. 1–50.
References
219
Pandey, A., Ploubidis, G. B., Clarke, L., & Dandona, L. (2017). Horizontal inequity in outpatient care use and untreated morbidity: Evidence from nationwide surveys in India between 1995 and 2014. Health Policy and Planning, 32, 969–979. https://doi.org/10.1093/heapol/czx016. Panikar, P. G. K., & Soman, C. R. (1984). Health status of Kerala, the paradox of economic backwardness and health development. Thiruvananthapuram: Centre for Development Studies. Penninx, B. W., Beekman, A. T., Ormel, J., Kriegsman, D. M., Joan, A., Boeke, P., et al. (1996). Psychological status among elderly people with chronic diseases: Does type of disease play a part? Journal of Psychosomatic Research, 40(5), 521–534. Purty, A. J., Bazroy, J., Kar, M., Vasudevan, K., Zacharia, P., & Panda, P. (2006). Morbidity pattern among the elderly population in the rural area of Tamil Nadu, India. Turkish Journal of Medical Sciences, 36(1), 45–50. Rajan, S. I. (2006). Population ageing and health in India. Mumbai: The Centre for Enquiry into Health and Allied Themes (CEHAT). Rajan, S. I. (2007). Population Ageing, Health and Social Security in India. Centre for Research on Economic Inequality. Discussion Paper Series No.3. Japan: Osaka City University. Rajan, S. I. (Ed.). (2008), Social policies for the elderly: Experiences from South Asia. Routledge. Reddy, N. B., Pallavi, M., Nagarjuna Reddy, N., Sainarasimha Reddy, C., Rajiv Kumar, S., & Pirabu, R. A. (2012). Psychological morbidity status among the rural geriatric population of Tamil Nadu, India: A cross-sectional study. Indian Journal of Psychological Medicine, 34(3), 227. Seby, K., Chaudhury, S., & Chakraborty, R. (2011). Prevalence of psychiatric and physical morbidity in an urban geriatric population. Indian Journal of Psychiatry, 53(2), 121. Sharma, D., Mazta, S. R., & Parashar, A. (2013). Morbidity pattern and health-seeking behavior of aged population residing in Shimla Hills of North India: A cross-sectional study. Journal of Family Medicine and Primary Care, 2(2), 188. Singh, M., Meghachandra, G. V., Murthy, R., Venkatraman Rao, S. P., & Nayar, S. (1997). A study of ocular morbidity among elderly population in a rural area of Central India. Indian Journal of Ophthalmology, 45(1), 61. Teltumbde, A. (2018). Dissecting ‘Modicare’. Economic and Political Weekly LIII, 42, 12–13. Tiwari, S. C., Tripathi, R. K., Aditya Kumar, A. M., Kar, R. S., Kohli, V. K., & Agarwal, G. G. (2014). Prevalence of psychiatric morbidity among urban elderlies: Lucknow elderly study. Indian Journal of Psychiatry, 56(2), 154. Vaartjes, I., Hoes, A. W., Reitsma, J. B., de Bruin, A., Grobbee, D. E., Mosterd, A., & Bots, M. L. (2010). Age- and gender-specific risk of death after first hospitalization for heart failure. BMC Public Health, 10, 637. https://doi.org/10.1186/1471-2458-10-637. World Bank. (2018). World Health Organization Global Health Expenditure Database. World Health Organization Global Health Expenditure Database (blog). 2018. https://data.worldbank. org/indicator/SH.XPD.CHEX.GD.ZS?locations=IN World Health Organization, Regional Office for South-East Asia. (2017). Health Financing Profile 2017: India. World Health Organization, Regional Office for South-East Asia. http://www.who. int/iris/handle/10665/259642. License: CC BY-NC-SA 3.0 IGO. World Health Organization. (2002). Programming of Chronic Disease by Impaired Fetal Nutrition: Evidence and Implications for Policy and Intervention Strategies. Geneva, (documents WHO/ NHD/02.3 and WHO/NPH/02.1).
Chapter 5
Policy, Programmes and Welfare Schemes
Abstract This chapter critically examines the National Policy for Senior Citizens, 2011 in the context of the welfare programmes and schemes implemented for the well-being of senior citizens in India. Although family support and care of the elderly are unlikely to disappear in the near future, the scenario is projected to decline as the nation develops economically and modernizes in other respects. The measures for dealing with ageing should not be targeted at the elderly alone. The aged are not an isolated group but are a useful and valuable human resource for the entire society. Therefore, comprehensive, systematic policies aimed at the development of the community as a whole would be desirable. Social security and old age pension schemes are intended for the protection of the vulnerable sections of the population against unforeseen contingencies. These measures provide succour to the elderly, who have limited options in life. The chapter enlists multifarious programmes aimed at the betterment of the elderly people in India against the backdrop of the critical evaluation of the National Policy for Senior Citizens, 2011. Again, various establishments completely devoted to the welfare of the aged are briefly described. The researchers argue that all senior citizens must be covered by social protection schemes irrespective of their socioeconomic conditions. The health insurance policy must be unconditionally extended to them without limiting the services to hospitalisation alone. The initiatives must consider day-to-day discomforts and ailments, which really form the major chunk of healthcare expenditure. Moreover, the government should take steps to reduce the prices of essential drugs for senior citizens.
5.1
Introduction
In this chapter, an attempt is made to evaluate the National Policy for Senior Citizens 2011, various social welfare schemes and programmes for the elderly in India. The assessment is done in the context of the physical and economic dependency of the aged population, along with vulnerabilities in the health and social capital that has been discussed extensively and exclusively in the previous © Springer Nature Singapore Pte Ltd. 2020 S. Irudaya Rajan and U. S. Mishra, Senior Citizens of India, https://doi.org/10.1007/978-981-15-7740-6_5
221
222
5
Policy, Programmes and Welfare Schemes
chapters. The high level of economic dependency, lack of adequate medical facilities, increasing healthcare expenditure and the absence of proactive social networking are major aspects that render a large segment of older persons vulnerable in the country. The issues aggregate when proper support mechanisms are not present in the society. The burgeoning financial constraints in the public health and social sector would perhaps push the government to explore options in private sector interventions. Senior citizens in India are not a homogeneous group (Jamuna 2000; James 1994; Krishnaswamy et al. 2008). Their needs and problems are graded according to their social and economic conditions and the extent of disability and vulnerability. Older persons belonging to the poor and poorest categories have different needs and problems when compared with their more privileged counterparts. The problems of rural elderly people differ from the urban segment. Ageing will become a major social challenge in the future when vast resources of the government are directed towards the support, care and treatment of senior citizens. Its impact is not limited to the society, but will also reflect at the individual level. The changing family structure deeply affects the living arrangements, support systems and individual well-being. An evaluation of the existing programmes and policies and schemes become quite worthy in such contexts. Many operational definitions are available for the term ‘evaluation’. In this chapter, Wholey’s definition (1970), as an ‘assessment of the overall effectiveness of a national programme in meeting its objectives, or an assessment of the relative effectiveness of two or more programs in meeting common objectives’ is accepted. This study carries out the evaluation of programmes and schemes for senior citizens at three levels. Initially, the researchers evaluate the process of the programmes and schemes; secondly, the impact of each programme is assessed in terms of its access, coverage and costs. Finally, the outcome of the programme in terms of its usefulness, needs, etc., is gauged. In the process evaluation, the investigation basically examines whether the programmes were carried out as planned. Based on the aims of the programme, a few indicators to measure the strengths and weaknesses of each scheme and the scope for improvement are listed. The impact assessment basically examines whether the particular programme has brought about a change in the life of senior persons in India. The outcome evaluation ascertains whether each programme was successful and in the ways in which it was pertinent. Choosing the right evaluation method is tough in this case. Nevertheless, the study has given equal importance to qualitative and quantitative research. The qualitative method comprises a detailed, verbal description of characteristics and an exploration of the reasons underlying the divergent social behavioural patterns of older persons. It is basically an examination of the rationale behind the viability of the idea in the Indian context. In the quantitative method, the economic evaluation of the programme has prime importance since it demonstrates the value for money and the possible savings for the government. This economic evaluation is based on the comparisons of cost of the programme, and the consequences are usually
5.1 Introduction
223
measured in terms of the outcome of the value. In case of cost, economic evaluation comprises many aspects. For instance, the resources that are used to run the programme in terms of equipment, staff, consumables, etc., are usually called direct cost. On the other hand, the cost incurred by aged persons in accessing the services or the benefits of the programme is very important in the cost analysis. This study considers the cost-effectiveness analysis as the most suitable method for many of the programmes and schemes for the elderly. This chapter is organized into seven sections. Section 6.2 critically examines the National Policy for Senior Citizens, 2011. Section 6.3 outlines the old age welfare schemes and programmes available in the country. Various establishments for the senior citizens are discussed in Sect. 6.4. Section 6.5 highlights a few hitherto unaddressed aspects, particularly the control of the prices of essential drugs and commodities essential for aged persons in India.
5.2
The National Policy for Senior Citizens
The well-being of senior persons in the country is mandated by Article 41 of the Constitution of India. The latest policy for the old people in the country is known as the National Policy for Senior Citizens 2011, which replaced the National Policy for Older Persons, 1999. According to this policy, senior citizens are those persons aged 60 years and above. The policy addresses the issues concerning the elderly and the special needs of the oldest-old, especially women. India had the National Policy on Older Persons, 1999 in pursuance of the UN General Assembly Resolution 47/5 to observe 1999 as the International Year of Older Persons. However, its relevance is almost gone, and most of the states have implemented the National Policy for Senior Citizens, 2011. Accordingly, the country must be an age-integrated society and the community must attempt to strengthen the amalgamation of generations, facilitate interaction between the old and the young, and fortify bonds between different age groups. It emphasises the development of both formal and informal support systems. This latest policy focuses on ten points. The mainstreaming of senior citizens, especially old women, is a prime concern and the policy brings the cause of senior citizens into the national development debate with priority. The new policy promotes the concept of ‘ageing in place’ or ageing in one’s own home. The thrust of the policy is prevention rather than cure. The dignity in old age, maintained by ensuring income security, home-care services, old age pension and health insurance schemes, is another key thrust of the policy. The new policy envisages that institutional care is the last resort and that the care of senior citizens has to remain vested in the family, which would partner the community and both the public and private sectors. The new policy will work towards an inclusive, barrier-free and age-friendly society. The policy visualizes that the states will extend their support to senior citizens below the poverty line and ensures their social security, health care, shelter and welfare.
224
5.2.1
5
Policy, Programmes and Welfare Schemes
Areas of Intervention
The new policy for senior citizens notified certain areas for intervention. The first priority is for income security, in which the major thrust would be on old age pension schemes, the public distribution system, income tax and micro finance (Rajan and Aliyar 2004; Ghuman and Mehta 2007; Goli et al. 2019; Lloyd-Sherlock 2000). Old Age Pension: The states have their own mechanism for old age pension schemes. Under the Indira Gandhi National Old Age Pension Scheme (IGNOAPS), the central government gives assistance to all states to effectively implement pensions for the eligible elderly. Currently, the central contribution to old age pension per person is Rs. 200. However, the amount given by the states varies considerably because of the differentials in the state contribution to the pension schemes (see Table 5.1). Another important aspect to be mentioned here is the divergence in the minimum age of eligibility for the pension. For instance, in Madhya Pradesh, the minimum age of eligibility for males and females is 60 and 50 years, respectively, whereas, in Kerala, for both men and women, it is 65 years. In Sikkim, the eligible age is 74 years for males and 65 years for females. The National Policy on Senior Citizens, 2011 recommended old age pension coverage for all senior citizens who live below the poverty line (Asher 2009; Kumar and Anand 2006; Kumar 2001; Rajan 2004). All states should raise the monthly pension to Rs. 1000 per person and must revise the rate at intervals to prevent deflation due to the rising cost of living. The oldest-old would be covered under the IGNOAPS and would be provided additional pension in case of disability, loss of adult children and concomitant responsibility for children and women. This additional pension should be reviewed every five years. Public Distribution System, Income Tax and Microfinance: Other areas of intervention under the income security of old aged persons are related to the public distribution system, income tax and micro finance. However, the recommendations given in the policy for these aspects are not fully operational at the ground level, except for income tax. Senior citizens receive substantial income tax exceptions, for an income of up to Rs. 5 lakhs per year. It is envisaged in the policy that loans for business at reasonable rates of interest would be given through suitable guidelines issued by the Reserve Bank of India. The number of senior citizens that availed of this facility would be a question of concern and need to be explored at the state level. The inefficiency and lack of dedication on the part of the state governments in implementing the scheme ought to be mentioned in this connection. With regard to the public distribution system, a current notable programme is the Annapurna Scheme. In fact, this scheme was announced by the government on 19 March 1999 for senior destitute men and women. The eligible person will get 10 kg of food grains (wheat or rice) per month free of cost through the public distribution system. This programme is implemented by the Ministry of Rural Development with the assistance of the Ministry of Food and Civil Supplies. The coverage of beneficiaries under the scheme from 2002–2012 is given in Table 5.2. The progress of this scheme was very slow in the first year of its implementation. Therefore, the
Year of introduction*
1960
1988
1983
1970
State/UT
Andhra Pradesh
Arunachal Pradesh
Assam
Bihar
200 500
200
200 500
200
NSAP pension per month (Rs.)
200
200
1300 1300
2050
State pension per month (Rs.)
60–79 80+
60+
60–79 80+
60+
Age eligibility criteria (years)
Universal pension
BPL
Old aged persons, both male and female, who are 60 years of age or above and are destitute (with little or no means of subsistence and no family or relative to depend upon Belong to a recognized scheduled tribe
Other eligibility criteria
Table 5.1 Social security pensions in various states and union territories in India: An Overview
(continued)
Submit the application with the documents to the nearest office of the District Nodal Officer, i.e Deputy Director(ICDS)/CDPO (ICDS) for verification/scrutinization and onward submission of the same to the Directorate of Social Justice & empowerment and tribal affairs, Deptt. Govt. of Arunachal Pradesh 1. Income certificate 2. Aadhaar no 3. Bank account no. with IFSC code 4. Photograph 2 copies (Passport size) 5. Mobile no Any applicant fulfilling the criteria may approach Gaon Panchayat/VCDC/VDC or block office NA
Below poverty line (BPL)
Verification documents/process of application
5.2 The National Policy for Senior Citizens 225
1978
1969
Gujarat
Haryana
200 500
2000 2000
550 550
1800 1800
150 150
State pension per month (Rs.)
60–79 80+
60–79 80+
60+–79 80+
60–79 80+
Age eligibility criteria (years)
Old age Samman Allowance 60 years or above; Domicile of Haryana; His/her income from all sources together with that of his/her spouse should not exceed 2,00,000/- p.a.
Per capita income of the applicant was less than the amount of financial assistance under the scheme. The applicant was not in receipt of financial assistance from any other source Member of family in 0–20 score of BPL list
BPL
Other eligibility criteria
1. Age certificate 2. BPL certificate Give application to Mamlatdar Office, Janseva Kendra of respective district collector offices For State Pension: In rural areas the bodies involved in the process at various levels are: • Sarpanch/MLA • Gram Sabha • Gram Panchayat • Child development project officer • Panchayat samiti • District social security (continued)
The urban bodies/village panchayats will forward the application to the respective ULBs/Janpad Panchayats with their recommendation. The respective urban bodies/Janpad Panchayats have the right to accept/reject the same Implemented through Goa State Co-op. Bank (GSCB), as disbursing bank
Verification documents/process of application
5
200 500
200 500
1983
Goa
NSAP pension per month (Rs.)
200 500
Year of introduction*
Chhattisgarh
State/UT
Table 5.1 (continued)
226 Policy, Programmes and Welfare Schemes
200 500
1965
Karnataka
1976
Jammu & Kashmir
200 500 200 500
200 500
1968
Himachal Pradesh
NSAP pension per month (Rs.)
Jharkhand
Year of introduction*
State/UT
Table 5.1 (continued)
800 800
400 400
550 550 800 800
State pension per month (Rs.)
65–79 80+
60–79 80+
60–79 80+ 60–79 80+
Age eligibility criteria (years)
Sandhya Suraksha Pension scheme Combined annual income of the applicant and the applicant’s spouse should not exceed Rs. 20,000. Apart from that, the
BPL persons or persons having annual income of less than Rs. 7995 (in Rural area) & Rs, 9974 (in Urban area)
BPL persons (excluding BPL widows and BPL persons with severe or multiple disabilities)
BPL card holder
Other eligibility criteria
(continued)
List of necessary documents for IGNOAPS:1. UID 2. Age proof (Date of birth certificate) 3. Income certificate 4. Coloured Photograph Process of Application: 1. Go to the Khidmat centre 2. Carry all the necessary documents mentioned above 3. Take the help of Khidmat Centre operator in registering to e-forms site Aadhaar card copy Ration card copy (if available) Voter id copy (if available) Mukhia/ward approval for application Photograph Bank account first page copy Age proof Residence proof Bank account details
1. Age proof 2. BPL Card
Verification documents/process of application
5.2 The National Policy for Senior Citizens 227
Year of introduction*
1960
State/UT
Kerala
Table 5.1 (continued)
200 500
NSAP pension per month (Rs.)
1000 1000
State pension per month (Rs.)
65–74 75+
Age eligibility criteria (years) bank account of the applicant should not have more than Rs. 10,000 as savings, to be eligible for the scheme 1. Applicant must be a BPL/destitute 2. No person shall be eligible for the pension, if he/she is in receipt of any other social welfare pensions 3. No one of them to look after him/her 4. No person shall be eligible if he/she resorts to habitual begging 5. No person shall be eligible for the pension, if he/she is admitted to a poor home 6. Age of 60 years or higher 7. Having a family annual income of or less than Rs. 100,000/8. Residing within the Kerala state for a continuous period of not less than three years 9. Applied at the local body where the person is residing
Other eligibility criteria
1. BPL/ration card 2. Voters Id card 3. Income certificate
(continued)
Verification documents/process of application
228 5 Policy, Programmes and Welfare Schemes
Year of introduction*
1980
1970
1981
1980
1979
State/UT
Maharashtra
Madhya Pradesh
Manipur
Meghalaya
Nagaland
Table 5.1 (continued)
200 500
0 0
300 300
0
500
200 500
0
100 100
400 400
State pension per month (Rs.)
200
200 500
200 500
NSAP pension per month (Rs.)
60–79 80+
60–79 (men) 55–79 (women) 80+ 60–79 80+
60–69 80+
65–69 80+
Age eligibility criteria (years)
BPL
BPL
BPL
The applicant’s age must be 60 years and above. The applicant must be a permanent resident of Madhya Pradesh This pension scheme is only for the destitute old age people. The applicant should be under the category of below poverty line
Old aged person of 65 years & above belonging to BPL Family are eligible under this Scheme under Shravanbal Seva Rajya Nivruttivetan Yojana
Other eligibility criteria
1. 2. 3. 1. 2. 3.
Age proof Income certificate Photograph Age proof Income certificate Photograph (continued)
1. Proof of age 2. Income proof from village accountant 3. Destitute certificate 4. Residence proof Application is submitted to Collector Office/Tahsildar/Talathi 1. Aadhaar card 2. BPL ration card of the applicant 3. Residence proof (residence certificate) 4. Birth certificate or identity proof with the date of birth 5. Bank passbook and savings or deposit details 6. Applicant passport size photograph 1. Age proof 2. Income certificate 3. Photograph
Verification documents/process of application
5.2 The National Policy for Senior Citizens 229
Year of introduction*
1975
1968
1962
1957
State/UT
Odisha
Punjab
Tamil Nadu
Uttar Pradesh
Table 5.1 (continued)
200 200
800 800
250 250
300 300
State pension per month (Rs.)
60–79 80+
60–79 80+
60–79 80+
60–79 80+
Age eligibility criteria (years)
Incapacitated to earn Destitute Below poverty line Without any income or source of income owning fixed assets valuing less than Rs. 50,000/- who have no relative of 18 years of age and over of the following category son, son’s son and other related persons who normally live together Poor and destitute The annual income from all sources should not exceed Rs. 46,080 in rural areas and Rs. 56,460 in urban Not getting any other kind of pension
BPL
BPL
Other eligibility criteria
Age proof Income proof Attested copies of photographs Scanned copy of proof of age Scanned copy of proof of BPL/SECC Self-declaration Age Proof Income proof Attested copies of photographs
1. Birth/age certificate 2. Identity proof (Voter id/Aadhaar card/ raashan card) 3. Bank passbook 4. Income certificate from competent authority (continued)
1. 2. 3. 1. 2. 3. 1. 2. 3.
Verification documents/process of application
5
200 500
200 500
200 500
200 500
NSAP pension per month (Rs.)
230 Policy, Programmes and Welfare Schemes
Year of introduction*
1964
1969
1968
State/UT
West Bengal
Chandigarh
Delhi
Table 5.1 (continued)
200 500
200 500
200 500
NSAP pension per month (Rs.)
2000 500 2000
800 800
550 550
State pension per month (Rs.)
60–69 SC/ST 70+
60–79 80+
60–79 80+
Age eligibility criteria (years)
1. Residence of min. 5 years in Delhi before the date of application 2. Annual family income of less than Rs. 1,00,000 from all sources (including rent, interest/dividends on savings & investments, earnings from farm, property sale proceeds etc.) of the applicant. Here, ‘Family’ means ‘wife/husband, minor children, disabled children, unmarried, or divorced/separated daughters/sisters, parents who are solely dependent on the applicant’. Applicant will need to give a self-declaration regarding income in the appropriate column provided in the application form
The income of the eligible person should not exceed Rs. 1000/- per month and the person should not receive any other government pension. Residing in the state for not less than ten years Monthly family income of the applicant should not exceed Rs. 1.50 lakhs annually. Resident of UT, Chandigarh for more than 3 years
Other eligibility criteria
1. Two passport size photographs 2. Residence proof of three years (voter card, ration card, electricity bill etc) 3. Aadhaar card 4. Mobile number (a) Application to be made online on e-District portal www.edistrict.delhigovt. nic.in (b) Aadhaar number is mandatory for filling up the application- without Aadhaar, application portal will not work (c) For applying, self-attested documentary proof for following needs to be scanned and uploaded 1. Age proof 2. Residence proof 3. Bank a/c number (Single a/c) 4. In case of SC/ST applicants in the age bracket 60–69 years, caste certificate in the name of the applicant issued by (continued)
1. Age proof 2. Income proof 3. Residence proof
Verification documents/process of application
5.2 The National Policy for Senior Citizens 231
200
500
1975
2019
1964
Mizoram
Rajasthan
550 500
750
1000
500
750
50 50
55–75 (Female) 58–75 (Male) 75+ (Female) 75+ (Male) 60–75 75+
Age eligibility criteria (years)
Competent Authority has to be submitted. In case of Minority applicants within 60– 69 years, self-declaration of the religion of the applicant duly verified from the religious institution has to be submitted 5. One passport size photo of the applicant 6. Income self-declaration in the format given on the portal itself
3. The applicant should have an Aadhaar number 4. The applicant should have a ‘singly-operated’ account in any Bank in National Capital Territory of Delhi only for receiving the payment through Public Financial M5 5. Must not be receiving any pension/ financial assistance from Central Govt/ State Govt/ other governmental local bodies or any other source for this purpose
National old age pension scheme BPL
1. Age proof 2. Income certificate (continued)
1. Age proof 2. Income certificate 3. Photograph 1. Valid Aadhaar card and voter ID cards at the time of registration. A domicile certificate issued by the authorities along with birth certificate
Verification documents/process of application
Other eligibility criteria
Chief minister old age Samman Pension Scheme A domicile certification from the state of Rajasthan and should not have any other source of income. The beneficiary under the scheme should not have household income that exceeds more than Rs 48,000 yearly
BPL
State pension per month (Rs.)
60–79 80+
NSAP pension per month (Rs.)
5
200 500
Year of introduction*
State/UT
Table 5.1 (continued)
232 Policy, Programmes and Welfare Schemes
2019
1978
Telangana
Tripura
Uttarakhand
1981
Sikkim
Table 5.1 (continued)
200 500 300
200 500
100 100 700
200 200 1000
60–79 80+ 60+
65–79 80+ 65+
Monthly income is less than Rs. 4000 (including his own or his son’s/grandson’s) and has less than 2.5 ha land in his/her name
Aasara Pension Scheme The age should be 65 years and above. The applicant must belong to primitive and vulnerable tribal groups Only one pension in a family, preferably women, is eligible Landless agriculture labourers, rural artisans/ craftsmen slum dwellers, persons earning their livelihood on daily basis in the informal sector like porters, coolies, rickshaw pullers, hand cart pullers, fruit/flower sellers, snake charmers, rag pickers, cobblers, destitute and other similar categories irrespective of rural or urban areas are also eligible Homeless, houseless households residing in temporary informal establishments or huts especially in urban areas are eligible Households headed by widows or terminally ill persons/disabled persons/persons aged 65 years or more with no assured means of subsistence or societal support are also eligible BPL
BPL
1. Age proof 2. Income certificate
1. Age proof 2. Income certificate
(continued)
1. Aadhaar card 2. Address proof 3. Income certificate 4. Proof of age 5. Death certificate in case of a widow 6. Xerox copy of registration in the Cooperative society of Toddy Tappers 7. Weavers should submit a Xerox copy of registration in the Cooperatives society of weavers 8. SADAREM Certificate in the case of persons with disabilities 40% or above and 51% in respect to the hearing impaired 9. Bank account passbook 10. Post-office saving account 11. IFSC code 12. Photograph 13. Mobile number
1. Age proof 2. Income certificate
5.2 The National Policy for Senior Citizens 233
1987
Pondicherry
800 800 0 0
0 0
300 300
60–79 80+ 60–79 80+
60–79 80+
60–79 80+
Natives of Lakshadweep by birth and citizens of India Should not be in receipt of any other monetary assistance BPL
All eligible old age
BPL
BPL
1. Age proof 2. Residence certificate
1. Domicile certificate of Dadra & Nagar Haveli issued by Mamlatdar 2. Annual income certificate (below Rs. 1 lakh) 3. EPIC card 4. Passport size photo Age proof
1. Age proof 2. Income certificate
200 1800 60–79 1. Age proof 2. Residence certificate 500 1500 80+ Sources: Official Websites of NSAP by states; and also Rajan (2001, 2004); Economic Survey report of various states
1975
Lakshadweep
200 500 200 500
200 500
1974
1983
200 500
1981
Daman & Diu
Andaman & Nicobar Islands Dadra Nagar Haveli
Table 5.1 (continued)
234 5 Policy, Programmes and Welfare Schemes
5.2 The National Policy for Senior Citizens
235
Planning Commission, in consultation with the Ministry of Rural Development, decided to transfer Annapurna to the State Plan from the year 2002–03. The scheme provides food security to poor senior citizens who are not covered under the National Old Age Pension Scheme. Box 5.1: Performance of the social assistance programmes for the financial year 2018–19 No of persons (a) Total data digitized 32,144,785 (b) Old age pensioners 24,105,611 (c) Disabled pensioners 1,030,337 (d) Widow pensioners 6,996,847 As on: 05.09.2019 Source: http://ruraldiksha.nic.in/RuralDashboard/NSAP_NEW.aspx, accessed on September 5, 2019
Health Care: The National Policy for Senior Citizens gives detailed and very elaborate intervention areas in the healthcare services for aged persons. It points out around 16 major areas of interventions to cope with health-related problems (Rajan et al. 2001; Chatterji et al. 2008; Vaidyanathan 2006; Verma and Khanna 2013).
Table 5.2 Physical progress reported by the states/union territories Year
Coverage of beneficiaries IGNOAPS
Annapurna
2002–03 7,471,509 796,682 2003–04 6,534,000 958,669 2004–05 8,079,386 850,768 2005–06 8,002,561 857,079 2006–07 8,645,371 750,319 2007–08 11,514,026 1,076,210 2008–09 15,483,836 883,232 2009–10 16,333,578 1,015,655 2010–11 17,059,756 968,419 2011–12 21,384,404 778,682 2012–13 22,712,043 838,914 2013–14 22,331,089 780,795 2014–15 22,981,127 928,333 2018–19 21,409,030 831,722 Source: India’s ministry of statistics and programme implementation. 2017. ‘Rural and Urban Development: Statistical Year Book India 2017’. MOSPI Website. http://www.mospi.gov.in/ statistical-year-book-india/2017/204. Accessed on 2 March 2019. http://nsap.nic.in/nsap/NSAP-% 20About%20us.pdfand; https://rural.nic.in/sites/default/files/Overview%20of%20NSAP.pdf
236
5
Policy, Programmes and Welfare Schemes
Affordable health services, heavy subsidies for the poor, health insurance, financial assistance, concessions and regulations of providers are some of the important aspects. The policy recommended creating a national-level geriatric healthcare programme with special focus on outpatient day care, palliative care, rehabilitation care and respite care. Every year, two special screenings of the 80+ population at the local level from the perspective of geriatric and palliative health care in both rural and urban areas with the help of a primary health centre nurse or Accredited Social Health Activist (ASHA) workers would be able to identify the health issues of senior citizens. The Rashtriya Swasthya Bima Yojana (RSBY) must be promoted in all districts as a part of the nationwide application of health insurance. Special programmes for those with dementia and Alzheimer’s disease are equally important as those for the control of co-morbid conditions. The use of updated technology for well-being and safety, public–private partnership for health care, mobile health clinics, the promotion of NGOs working for the welfare of the aged and the gender perspective are some other aspects that require interventions. Safety and Security: Abuse is another area of concern that requires serious attention. The policy recommends stringent punishment, community awareness and policing, and protective services by means of helplines to curb the issue. Housing and Productive Ageing: The policy recommends the allotment of 10% of the housing schemes for poor senior citizens in urban and rural areas. Barrier-free access to transportation services, healthcare institutions, recreation centres and other public places is essential. Loans for the purchase as well as the maintenance of a house with easy repayment schedules are an option offered in the policy. The age of retirement should be reviewed by the ministry so as to ensure continuity in employment; the creation of avenues for post-retirement opportunities is also desirable. Welfare, Multigenerational Bonding and Media: The policy recommends setting up a welfare fund for senior citizens through a social security cess. All senior citizens are eligible for all the welfare schemes of the government. Budgetary allocation for those elderly people living below the poverty line, irrespective of rural or urban areas, is also noteworthy. The school curriculum must incorporate family values regarding the care for parents and efforts should be taken to strength generational bonding in the community. The policy considers the role of media in highlighting the changing conditions of senior citizens in order to identify issues and probable areas of action. In the implementation of schemes and programmes, the use of modern technology gets priority. The establishment of a department of senior citizens under the ministry of social justice and empowerment, a directorate of senior citizens in the states and union territories, and a national council for senior citizens, and a clear delineation of the responsibilities of the various ministries of the government, block panchayat offices, Panchayat Raj institutions and Tribal Councils/Gramasabhas play a key role in the implementation of the policy.
5.3 Welfare Schemes/Programmes
5.3
237
Welfare Schemes/Programmes
This section outlines the major welfare schemes and programmes that exist in the public and private sectors for the benefit of senior citizens in the country. The awareness would be useful in the context of geriatric research. The Rashtriya Swasthya BimaYojana [RSBY] The Ministry of Labour and Employment launched this health insurance programme on1 April 2008 for unorganized sector workers and their families of up to five members each, who belong to the BPL category. The central government will give 75% of the premium and the state government will contribute the rest of the funds required. The beneficiary would pay Rs. 30 per annum as registration or renewal fee and will have a smart card for identification purposes. The total insurance would be Rs. 30,000 per family per annum for a family of five on a floater basis. It covers hospitalization expenses and transportation (actual cost with a maximum limit of Rs. 100 per visit and within an overall limit of Rs. 1000). Rashtriya Vayoshri Yojana (RVY) The Department of Social Justice and Empowerment launched this scheme on 1 April 2017. The objective of the scheme is to provide senior citizens belonging to the BPL category and suffering from age-related disabilities/infirmities physical aids and assisted living devices such as walking sticks, elbow crutches, walkers/ crutches, tripods/quad-pods, hearing aids, wheelchairs, artificial dentures and spectacles free of cost. The scheme is entirely funded from the Senior Citizen’s Welfare Fund (SCWF). Varishtha Mediclaim This policy covers hospitalization and domiciliary hospitalization expenses. At an extra premium, it covers the treatment of critical conditions such as coronary artery surgery, cancer, renal failure, stroke, multiple sclerosis, major organ transplants, paralysis and blindness. The hospitalization cover sum insured is Rs. 100,000, and the critical illness cover sum insured is Rs. 200,000. The age limit for the scheme is 60–80 years. It is possible to extent the age limit for renewal to 90 years. The policy is offered by the National Insurance Company Ltd. Health of Privileged Elders (HOPE) This policy was launched by the Oriental Insurance Company Ltd. for citizens aged above 60. It covers hospitalization due to 10 specified diseases and accident; the sum of insurance would be Rs. 1 lakh to 5 lakhs. Group Medical Insurance Scheme The New India Assurance Company Ltd. offers a collective Mediclaim policy to any group, association, institution or cooperative body of more than 100 persons with a central administration point. The policy covers the reimbursement of hospitalization and domiciliary hospitalization expenses for illness or injuries for persons in the age group of 5–80 years. The sum insured would be Rs. 15,000–Rs.
238
5
Policy, Programmes and Welfare Schemes
500,000, and the premium ranges from Rs. 175–Rs. 12,450 per person per annum depending on the slabs of sum insured and the age of the person. The Jan Arogya Bima Policy This policy is for individuals and family members aged up to 70. The limit for cover per person is Rs. 5000 per annum. The reimbursement of medical expenses incurred by an individual towards hospitalization or domiciliary hospitalization for any injury or diseases contracted or sustained during the period of insurance is a strong feature. Service tax is not applicable to the policy, but tax benefits under section 80D of income tax act are available, for a premium of up to Rs. 10,000. Senior Citizen Mediclaim Policy This policy covers hospitalization expenses incurred for the treatment of illness or injury, pre- and post-hospitalization expenses up to 30 and 60 days, respectively, ambulance charges, and limited cover for treatment with the Indian systems of medicine. However, the proposers must undergo a prescribed pre-acceptance health checkup at their own cost to identify pre-existing diseases. Pre-existing conditions such as diabetes mellitus and its complications are covered after 18 months of continuous insurance but only on payment of additional premium. This policy has income tax benefit under section 80D of the IT Act. LIC Jeevan Akshay This immediate annuity plan is a type of pension plan in which annuity begins immediately. There is no accumulation phase. It can be purchased by paying a lump sum amount. The plan provides for annuity payments of a stated amount throughout the lifetime of the annuitant. Various options are available for the type and mode of payment of annuities. The salient features of the policy are that the premium is to be paid in a lump sum, and the minimum purchase price is Rs. 100,000 for all distribution channels except online ones. For online channels, the minimum purchase price is Rs. 150,000. No medical examination is required to avail of the plan. The age limit ranges from 30–85 years. This immediate annuity plan is a type of pension plan in which annuity begins immediately. There is no accumulation phase. It can be purchased by paying a lump sum amount. The plan provides for annuity payments of a stated amount throughout the lifetime of the annuitant. Various options are available for the type and mode of payment of annuities. The salient features of the policy are that the premium is to be paid in a lump sum, and the minimum purchase price is Rs. 100,000 for all distribution channels except online ones. For online channels, the minimum purchase price is Rs. 150,000. No medical examination is required to avail of the plan. The age limit ranges from 30–85 years. ICICI Lombard Overseas Travel Insurance This insurance plan is for those aged 71–85. The policy covers unexpected and unplanned medical and non-medical expenses when the person is abroad. It covers pre-existing disease in life-threatening situations. ICICI Lombard has partnered with the UnitedHealth Group to provide access to United Healthcare network of
5.3 Welfare Schemes/Programmes
239
hospitals and physicians when the beneficiary is in the US. No medical test is required to avail of the insurance scheme. Cashless medical services across the world cover for 180 days and the original plan can be extended to another 180 days. ING Golden Years Retirement Policy This policy is a Regular Payment Deferred Variable Annuity Plan. It is a Non-linked Plan from the ING Life Insurance Company. This plan offers Loyalty Benefit for total premiums of Rs. 480,000 or more. In addition to Regular Premiums, the policyholder can choose to pay Top Up Premiums except in the last two policy years. Smart Invest Pension Plan Max NewYork Life Insurance Smart Invest Pension Plan (unit-linked individual pension plan) gives an option to let premiums automatically increase at a fixed rate, helps combat inflation and effectively preserves the objective of a secure retirement (age between 50 and 70). The minimum ATP regular pay is Rs. 10,000, and the deferment period is 10–52 years, subject to a minimum age on vesting of 50 years. Aviva New Pension Elite The entry age of the scheme is 18–70 years, and the maturity age is 40–80 years. The premium payment term is equal to the policy term. The minimum amount of annual premium is Rs. 50,000, and there is no maximum limit for the annual premium. The premium frequency is yearly or half-yearly or quarterly or monthly. New Jeevan Dhara-I This is a deferred annuity plan that allows the policyholder to make the provision for a regular income after the selected term. Premiums are payable yearly, half-yearly, quarterly, monthly or through salary deduction, as opted, throughout the term of the policy or till earlier death. Alternatively, the premium may be paid as a lump sum (single premium). Tax relief under section 80ccc is available on premiums paid under New Jeevan Suraksha I. Premiums paid under New Jeevan Dhara I qualify for tax relief under section 88. These are with-profit plans and participate in the profits of the LIC’s annuity/pension business. Policies get a share of the profits in the form of bonuses. Simple Reversionary Bonuses (SRB) are declared per thousand Sum Assured annually at the end of each financial year. Once declared, they form part of the guaranteed benefits of the plan.
5.4
Schemes in Banking and Tax Department
Many banks offer an additional interest rate (in most cases, 0.5% per annum) for the senior citizens fixed deposit. Most banks give free ATM cards. Some such as Citibank offer free transactions at ATMs of all banks, discount at leading hospitals,
240
5
Policy, Programmes and Welfare Schemes
spa, free consultation with ayurvedic experts, tailor-made tour packages to religious or exotic destinations and regular assistance on travel booking. They also offer loan against property and facilities against investment in equity shares and mutual funds. Free collection of cheques, concession of remittance and immediate credit of outstation cheques up to 15,000 are offered by the Punjab National Bank (PNB). Free SMS alert facility is offered in the ICICI Bank’s Life Plus senior citizen’s saving account. The debit card is free and has unlimited cash transactions. IDBI Bank provides zero balance account, free statement by e-mail, online options to pay bills and tax, 25% discount on locker charges, higher ATM cash withdrawal limits (up to Rs. 50,000/- per day) and ten free transactions at the ATMs of other banks. Banks in India also have reverse mortgage for senior citizens. For instance, the Bank of Baroda has ‘Asray’, a plan to supplement the cash flow of senior citizens in order to address their financial needs. Married couples are eligible as joint borrowers of the scheme, provided one of them is aged above 60 and the age of the spouse is not below 55 at the time of application. The applicant should be the owner of a residential property (house or flat) located in India in his/her own name. The loan is restricted to Rs. 1 Crore, subject to the value of the property. The IDBI Bank has a reverse mortgage loan up to Rs. 2 Crores, subject to the market value of the residential property as assessed by the bank, the age of the applicant and the prevalent interest rate. The maximum loan tenure for senior citizens is up to 20 years. The Union Bank of India has reverse mortgage up to Rs. 1 Crore. The tenure of the loan ranges from 15–20 years. Residential property is required to take a loan.
5.5
Employees’ State Insurance (ESI) Act 1948
This act envisaged an integrated, need-based, social insurance scheme that protects the interest of workers in contingencies such as sickness, maternity, temporary or permanent physical disablement and death due to employment injury, which result in the loss of wages or earning capacity. The act also guarantees reasonably good medical care for workers and their immediate dependents. The act is now applicable to non-seasonal-power-using factories that employ 10 or more persons and non-seasonal-non-power-using factories with 20 or more workers. The scheme has been extended to shops, hotels, restaurants, cinemas including preview theatres, road motor transport undertakings and newspaper establishments with 20 or more employees. The existing wage limit for coverage under the act is Rs. 10,000/- per month (with effect from 1.10.2006). The scheme is applicable in all states except Nagaland, Manipur, Tripura, Sikkim, Arunachal Pradesh and Mizoram. It is also valid in the union territories of Delhi, Chandigarh and Puducherry. It provides six social security benefits—medical, sickness, maternity, temporary disablement, permanent disablement, dependent benefit and funeral expenses.
5.5 Employees’ State Insurance (ESI) Act 1948
241
The contributions to ESI are related to the paying capacity as a fixed percentage of the workers’ wages, whereas the latter are provided social security benefits according to individual requirements without distinction. The scheme provides need-based benefits such as rehabilitation allowance, vocational rehabilitation and unemployment allowance (Under the Rajiv Gandhi Shramik Kalyan Yojana) to insured workers.
5.6
Establishments
This section examines various establishments that operate for the welfare of old people in India. Among these institutions, the most important would be the Department of Senior Citizens under the Ministry of Social Justice and Empowerment, Government of India. In addition, all states and union territories have directorates of senior citizens. The National Council for Senior Citizens and the National Council for Older Persons are other important agencies that function under the central government. Moreover, multifarious government departments and directorates within the Ministry of Human Resource Development, the Ministry of Women and Child Development, the Ministry of Rural Development, and the Ministry of Labour deal with specific programmes for the aged. This study critically evaluates the extent to which the programmes and schemes implemented through these establishments are successful in India and ascertains the measures to be adopted to improve the existing situation. First, the researchers examine various schemes implemented by these establishments. The Ministry of Railways: Separate ticket counters for the elderly, provision of lower berth quota (A/C and Sleeper Classes), 30% discount for all mails, wheelchairs at train stations and 75% concession to senior citizens who undergo major surgery are some of the schemes. The Ministry of Health and Family Welfare: Central government employees get medicines for chronic ailments up to three months at a stretch. The provision of separate queues for the elderly in government hospitals is a welcome initiative. The ministry established two national institutes on ageing in Delhi and Chennai and started geriatric clinics in government hospitals in many places. The Ministry of Finance: The ministry gives exemptions from income tax once a person crosses the age of 60. A deduction of Rs. 20,000 is possible under section 80D for individuals who pay medical insurance premium for their elderly parents.
242
5.7
5
Policy, Programmes and Welfare Schemes
Summing up
This chapter critically evaluates the current policies and programmes for senior citizens in India (Sivaraju 2004; Sarmistha 2006). As in the case of any other policy, the present old age policy in the country has both positive and negative aspects. The reforms of this policy, schemes and programmes must be reviewed from the existing socioeconomic and demographic conditions of senior citizens in the states and union territories. Discrepancies exist nationwide in the issues of old age as in other sectors. The National Policy for Senior Citizens, 2011 is a bold step taken by the Government of India for the welfare of old people, irrespective of their socioeconomic conditions. It considers aspects of income security, health care, safety, housing, multigenerational bonding and productive ageing. The researchers argue that all senior citizens, despite their socioeconomic conditions, must be included in the social security programmes and health insurance schemes. Better socioeconomic status does not always ensure that these citizens can avail of the necessary services. The authors strongly believe that the health interventions envisaged in the National Policy for Senior Citizens, 2011 must incorporate the National Health Policy (NHP) 2017 perspectives. The National Health Policy, from its inception, recognizes health as a human right. The healthcare services must include or combine preventive, curative and rehabilitative measures and facilities. Old age health care ought to be aware of certain dimensions. The quality of care is the foremost aspect. Ensuring equity across multiple dimensions in terms of gender, region, etc., is crucial as the insurances of the financial risk protection. Accountability, viability and sustainability of the different programmes implemented for senior citizens are another area of concern for those initiatives launched with the help of the state and central governments through the local bodies at the grassroots level. The economic revamping of the 1990s and the subsequent health reforms in the country improved private healthcare facilities. Subsequently, the healthcare system sawa shift from the service sector to the profit-making sector. Private hospitals invest huge amounts for monetary gain. Poor people are forced to make use of these facilities without any option, which causes severe financial burden, including the absence of basic necessities. Perhaps, such economic reforms are not helpful to improve the health access to the poor, aged segments of society. Unless the public healthcare institutions are strengthened, impoverished old people will be seriously deprived of quality care. A universal health insurance scheme for the aged is the need of the hour. The insurance schemes should cover the cost of outpatient care, drugs and laboratory diagnosis. The promotion of the Ayushman Bharat scheme implemented by the central government is a welcome step in this direction.
5.7 Summing up
243
The highest corruption is in the procurement of drugs. Preventive and correctional mechanisms should be in place to avoid the malpractices in this field. Another aspect to consider would be the coverage, quality and cost of drugs distributed in the public and private healthcare institutions. There is no systematic consolidation of these statistics at the state or national level. The money spent by the government to procure essential medicines for senior citizens who are unable to pay for the drugs is not evident. The states are unable to allocate their revenue for this purpose. In such a scenario, healthcare services, finance, governance or regulations are the pertinent aspects to be considered for a systematic evaluation, and such exercises must be carried out at regular intervals, considering the challenges that surface from time to time.
References Asher, M. (2009). Pension plans, provident fund schemes and retirement policies: India’s social security reform imperative. ASCI` Journal of Management, 39(1), 1–18. Chatterji, S., Kowal, P., Mathers, C., Naidoo, N., Verdes, E., Smith, J. P., et al. (2008). The health of aging populations in China and India. Health Affairs, 27(4), 1052–1063. Ghuman, B. S., & Mehta, A. (2007). Policy transfer and citizen charter: The Indian experience. Indian Journal of Public Administration, 53(4), 774–787. Goli, S., Bheemeshwar Reddy, A., James, K. S., & Venkatesh Srinivasan. (2019). Economic dependence and social security among elderly. Economic and Politcal Weekly, 54(39), 32–41. James, K. S. (1994). Indian elderly: Asset or liability. Economic and Political weekly, 2335–2339. Jamuna, D. (2000). Ageing in India: Some key issues. Ageing International, 25(4), 16–31. Krishnaswamy, B., Sein, U. T., Munodawafa, D., Varghese, C., Venkataraman, K., & Anand, L. (2008). Ageing in India. Ageing International, 32(4), 258–268. Kumar, A., & Anand, N. (2006). Poverty target programs for the elderly in India- with special reference to national old age pension scheme, 1995. Background Paper for the Chronic Poverty Report, 2008–09. Kumar, S. V. (2001). Social security for the elderly in India. Social Change, 31(4), 21–45. Lloyd-Sherlock, P. (2000). Old age and poverty in developing countries: New policy challenges. World Development, 28(12), 2157–2168. Rajan, S. I. (2001). Social assistance for poor elderly: How effective? Economic and Political Weekly, 613–617. Rajan, S. I., Mishra, U. S., & Sarma, P. S. (2001). Health concerns among India’s elderly. The International Journal of Aging and Human Development, 53(3), 181–194. Rajan, S. I., & Aliyar, S. (2004). Gender, ageing and social security. Samyuktha: A Journal of Women’s Studies, IV(2), 68–87. Rajan, S. I. (2004). Chronic poverty among Indian elderly. Working Paper 17, Chronic Poverty Research Centre and Indian Institute of Public Administration (IIPA), New Delhi. Sarmistha, P. (2006). Household demographic composition and old age poverty in the Indian States. Brunel University. Sivaraju. (2004). Economic issues of elderly in India. Harmony Magazine, Mumbai. Vaidyanathan, K. E. (2006). Social and health aspects of ageing in India: Implications for the national policy on older persons. Paper Presented in International Conference on Emerging Population Issues in the Asia-Pacific Region; Challenges for the 21st Century, 2006.
244
5
Policy, Programmes and Welfare Schemes
Verma, R., & Khanna, P. (2013). National program of health-care for the elderly in India: A hope for healthy ageing. International Journal of Preventive Medicine, 4(10), 1103. Wholey, J. S., John, W. S., Hugh, G. D., James, S. F., & Leona, M. V. (1970). Federal evaluation policy. Washington D.C.: The Urban Institute.
Chapter 6
Unexplored Facets of the Elderly: Kerala Ageing Surveys—A Longitudinal Enquiry
Abstract This chapter explains the various dimensions of the ageing process and the life of the elderly in Kerala based on the Kerala Ageing Surveys (KAS) conducted by the Centre for Development Studies, Thiruvananthapuram. The survey was the first of its kind in India when it began in 2004. A second set of the KAS was initiated in 2013. Both rounds were co-ordinated by and carried out under the leadership of the senior author of this book. The first round of KAS completed its 6th wave in 2019, and the second round finished its 3rd wave in 2019. The first KAS commenced with a sample of 4940 elderly individuals, but the number depleted over the years and the process ended with 1006 senior persons in 2019. On the other hand, the second KAS started with the sample of 7768 persons and ended with 4800 in 2019.
6.1
Introduction
This chapter exclusively aims to explore the conditions of older persons in Kerala, the state that occupies the top position in the proportion of the elderly populace in India (Rajan 1989). Kerala attained the distinction of more than 7% of its total population being aged (60 years and above) as early as in 1981. The state is in its last stage of demographic transition and has been experiencing low or nearly equal birth and death rates, which has triggered a structural transition in the population (Bhat and Rajan 1990; Rajan and Sunitha 2018). However, no systematic exposition of the phenomenon of ageing and its implications in Kerala was made until the Centre for Development Studies (CDS) took the initiative in 1987 to study population ageing, and the findings were published by the United Nations (Rajan 1989; Gulati and Rajan 1995). This effort was followed by many studies that examined the changing age structural transition, based on the census and other official secondary data sets (Rajan 1989, 1994, 2000, 2001, 2002; Rajan et al. 1995, 1999a, b, 2001, 2003; Gulati and Rajan 1999; Rajan and Kumar 2003; Liebig and Rajan 2003). After more than a decade of research related to this topic, the CDS initiated its first Kerala Ageing Survey in 2004 in all the fourteen districts of the state. The © Springer Nature Singapore Pte Ltd. 2020 S. Irudaya Rajan and U. S. Mishra, Senior Citizens of India, https://doi.org/10.1007/978-981-15-7740-6_6
245
246
6 Unexplored Facets of the Elderly: Kerala Ageing Surveys
study was funded by the Canadian Institutes of Health Research (CIHR) and the Indian Council of Social Science Research–Indo Dutch Programme on Alternatives in Development (ICSSR-IDPAD) (Johnson and Rajan 2010; Rajan et al. 2008). This unit gives a condensed version of the Kerala Ageing Surveys without any profound statistical analysis; however, it attempts a bivariate analysis of selected variables to ascertain the reliability of the data. For the purposes of analysis, older persons are categorized into three age groups—60–69 (young-old), 70–79 (old-old) and 80+ (oldest-old).
6.2
Kerala Ageing Survey I
The motivation behind the first Kerala Ageing Survey was based on the observations made regarding the changing household structure in Kerala during the inter-survey periods of the Kerala Migration Survey 1998–2003, which was conducted by the CDS (Zahcariah et al. 2001a, b; 2003; Zachariah and Rajan 2005, 2009). The term ‘elderly household’ was defined in terms of a household with at least one elderly member. On analysing these survey data sets, it was observed that such households had apparently increased in number during the inter-survey period. About 34% of the households accommodated one elderly person who was either a widow or a widower. At the same time, half the households did not have an elderly person in 2003. Further, the composition of the households indicated a rise in the share of homes with two elderly individuals—from 11% in 1998 to 14% in 2003. Similarly, 4.9% of the elderly households had the senior person living alone, as against 13.1% of homes with two aged individuals who lived without any other adult. This pattern was not uncommon as the survey found households with up to three elderly people and in the absence of another adult. About 66% of the six-member households had three senior members. Kerala Ageing Survey I: wave (w1) (2004), w2 (2007), w3 (2010), w4 (2013) w5 (2016) and w6 (2019) Given this background, the CDS took the initiative to carry out a study on the aged population in Kerala and samples were taken from the Kerala Migration Survey 2003 (Zachariah and Rajan 2004, 2007, 2009; Rajan 2004; Rajan and Mishra 2014). The survey covered 10,000 households across Kerala and enumerated 47,830 members. It was decided to incorporate all the elderly people in the 10,000 households that constituted the Kerala Ageing Survey in 2004. Thus, a total of 4940 elderly persons were enumerated under the aegis of the Kerala Ageing Survey 2004, which comprised 2272 male and 2668 female elderly persons. The survey completed six waves every three years. The total number of elderly people alive in the sixth wave was 1006 (KAS 2004, 2007, 2010, 2013, 2016, 2019)—about 20% of the original KAS 2004. This first ageing survey collected information on a range of indicators, which was a maiden attempt when compared with other surveys in India. The information included subjective well-being inventory, general health questionnaire, social
6.2 Kerala Ageing Survey I
247
interaction and activities, property, land, house ownership, labour force participation, Mini Nutritional Assessment (MNA), eating behaviour, behavioural factors, falls among the elderly, recent medical records, outlook about older life and children, perspective on old age support systems, activities of daily living and instrumental activities of daily living rather than the socioeconomic and demographic characteristics at individual and household levels. The follow-up surveys continued to assess the health perspectives of the aged, their recent medical records and health care utilization, behavioural factors, details of children who reside with or do not reside with the senior persons, and the changes in their household structure. The CDS started this survey as a longitudinal ageing survey repeated every three years. Box 6.1, given below, makes an exposition of the depletion of the elderly sample in each wave. Over the years, these senior persons might have changed their place of residence, moved with their children or otherwise been relegated to the category of untraced or dead people. The purpose of this initiative was to delineate the socioeconomic, demographic and health characteristics of the elderly and to explore the determinants of healthy ageing and social security (Rajan and Prasad 2008). Box 6.1: Depletion of older people in the sample from 2004 to 2019 2004
2007
2010
2013
Total elderly 4940 Alive 3697 Died 578 Untraced 665 Alive 3008 Died 614 Untraced 75 Alive 2030 Died 336 Untraced 642 Alive Died Untraced Alive Died Untraced Source: Compiled from the Kerala Ageing Survey 2004–2019
2016
2019
1441 308 281 1006 264 171
As age increases, the sex ratio favourable to females also rises (Table 6.1). Of the total elderly population, only 16.8% of males and 21.7% of females are still alive at age 75 or more. Obviously, each wave shows a drastic decline in the male sample.
248
6 Unexplored Facets of the Elderly: Kerala Ageing Surveys
Table 6.1 Sex ratio of the elderly and their depletion in each wave of the survey 2004–2019
Age
Sex ratio Alive
2004 60+ 1174 2007 63+ 1234 2010 66+ 1342 2013 69+ 1372 2016 72+ 1321 2019 75+ 1517 Source: Calculated from Kerala
6.3
Dead
Depletion in each year Alive Male Female
–
– – 773 72.8 76.6 777 56.5 64.6 1024 38.9 45.5 1124 28.2 31.8 916 16.8 21.7 Ageing Survey 2004–2019
Kerala Ageing Survey II [W1 (2013), W2 (2016) and W3 (2019)]
In addition to the first set of the Kerala Ageing Survey, the CDS embarked on a second set of longitudinal ageing survey in 2013 with a subsample of the Kerala Migration Survey 2011, which was funded by the Government of Kerala in order to revise the old age policy of the state (Government of Kerala 2009; Zachariah and Rajan 2014). The main objective of the study was to identify the socioeconomic, psychological and demographic profile of the elderly in Kerala and to assess their living arrangements. This initiative had the added intention to ascertain the health status of senior persons and their need for palliative care, and to identify the current status of all the existing services for the elderly offered by various providers, including social assistance (service and welfare pensions), insurance (Rashtriya Swasthya Bima Yojana (RSBY), Life Insurance Corporation (LIC), Employees’ Status Insurance (ESI), and Comprehensive Health Insurance Scheme (CHIS) and legal aid. Such details served to put forward suggestions aimed towards facilitating better services envisaged in the old age policy in the identified domains—financial security, family support, the differences in the way sons and daughters take care of their elderly parents, healthcare services and the responsibility of local self-governments. The samples were selected from 15,000 households in 300 localities in all the 14 districts of Kerala. From each of the 300 localities originally selected for the Kerala Migration Survey (KMS), a total count of the elderly people in each household has been obtained. Through this process, by discounting the dead elderly as well as those who were not traceable, the survey ended up with 7768 elderly living in 5712 households. After three years, by revisiting all the elderly households surveyed in 2013, a total of 5611 elderly persons were found alive. It meant that 491 persons had died during the three years since the 2013 survey. In other words, 72.2% of the elderly had survived in the past three years, a tendency that indicates the extended lifespan of the people in Kerala. The remaining 1666 elderly persons could not be traced during the survey period (see Box 6.2). They could not be identified because some of them left home to live with their children or relatives while others were not willing to respond.
6.3 Kerala Ageing Survey II [W1 (2013), W2 (2016) and W3 (2019)]
249
Box 6.2: Depletion of older people in the Sample from 2013 to 2019 2013 Total elderly 7768 Alive Died Untraced Alive Died Untraced Source: Kerala Ageing Survey 2013–2019
2016
2019
5611 491 1666 4039 691 881
KAS 2013 schedules explored many aspects, including socio-demographic information and current family and co-residential status, reproductive history, current health status, activities of daily living scale, employment history and economic autonomy, opinions, values and attitudes and perspective on old age, social welfare programmes and social interaction, religiosity and anthropometric measurements such as waist–hip ratio, height, weight and hand grip. The questionnaire for KAS 2016 was divided into eight sections that mainly concentrated on the mental and physical health status, medical records, cognition assessment, the falls among the elderly, behavioural factors, activities of daily living, religiosity and the anthropometric measurements mentioned here.
6.4
An Exploration of the Kerala Ageing Survey First Set
The Kerala Ageing Survey is the first of its kind that addressed the determinants and consequences of population ageing in Kerala. The two sets of surveys discussed earlier serve as a primary source on the life of elderly people in the state. This chapter considers a few selective dimensions from the first round of the Kerala Ageing Surveys that began in 2004, such as the falls among the elderly, Subjective Well-Being Inventory (SUBI) and General Health Questionnaire (GHQ) for discussion, which have not received attention in other surveys or studies in Kerala. Every three years, the researchers compare the changing circumstances during the inter-survey period 2004 and 2013 and explore the reasons behind negative and positive changes in the life of the aged. There was a visible increase in the number of elderly persons living with more than five members in the household. About 11% of the female elderly persons shifted their living arrangements from living with the spouse in 2004 to living alone in 2007, while this percentage was only 6.4 for senior males. One out of ten elderly females lost their spouse and lived alone in 2013. On the other hand, those who
250
6 Unexplored Facets of the Elderly: Kerala Ageing Surveys
lived alone in 2004 were found to be staying with others (non-relatives, friends) in 2013. Only 5.4% of the elderly who had lived alone in 2004 still continued to do so; conversely, 2.7% of those who had lived with more than six persons in 2004 were living alone in 2013. Table 6.2 explains the joint distribution of household change between 2004 and 2013. The transition in the family structure during this phase is quite impressive in terms of its distributional aspect. The higher share of transformation could be seen in the household with 2–5 persons in 2004, a greater quantum of which moved to be with their children in 2013.
6.4.1
Diseases Among the Elderly and Household Patterns
The risk of illness and morbidity is higher among the elderly on account of the positive association between age and morbidity (Duraisamy 2001; Rajan and Sreerupa 2008). The caregivers at home play an important role to cater to the needs of those who become depressed due to illness (Rajan and Sunitha 2018). The elderly in the sample survey belonged to a household size of one to more than seven persons. Nearly 2.8% of the elderly lived alone, while about 23% had more than six people in the family. The changes over the years in the status of the elderly who have chronic disease can be correlated with their household size. For example, about 1.4% elderly persons had cancer in 2004. Of these, 3.8% lived alone, but 64% lived with 2–5 persons. Among the elderly who had cancer in 2004, 43% were alive in 2013, but 57% died during the intermittent period between 2004 and 2013. The aged individuals who lived alone or with another person and had cancer died during the inter-survey period, but others who lived with family members survived longer. This data manifests the vulnerability of the ailing elderly in terms of their lifespan, which is conditioned by the co-residence pattern. The co-residence pattern ensures the kind of care needed at this stage of a person’s life cycle, particularly for those suffering from chronic ailments. This enquiry offers substantial evidence to suggest that deterioration or death of the ailing elderly is more likely in the absence of co-residence.
Table 6.2 Change in the household structure between 2004 and 2013 2013
2004 Alone
With 1 person
2–5 persons
Alone 0.002 0.006 0.025 With 1 person 0.006 0.013 0.099 2–5 persons 0.019 0.065 0.393 More than 6 persons 0.006 0.025 0.111 Source: Calculated from Kerala Ageing Survey 2004 and 2013 Note: As a joint distribution
More than 6 persons 0.006 0.036 0.142 0.046
6.4 An Exploration of the Kerala Ageing Survey First Set
6.4.2
251
Falls Among the Elderly
Falls are common among the elderly, who either do not recognize the limitation of their physical imbalance or negotiate their daily routine in a residential environment that is not conducive or risk-free. A fall can often be life-changing in terms of disabling the elderly to become physically dependent. The prevalence of falls augments with age. Older persons are categorized into three age groups—60–69 (young-old), 70–79 (old-old) and 80+ (oldest-old). This sample study indicates a higher incidence of falls among elderly females and the oldest-old when compared with their young-old and old-old counterparts. One among four elderly persons had a fall during the three years prior to 2004. Among these individuals, 32% had a fall more than once, 32% had fracture and 34% had not recovered fully from the consequences. These statistics sketch the story of the elderly populace in Kerala in 2004 but over the years, the incidence of recovery related to falls is disappointingly low and depends upon their age and physical fitness. Falls among the elderly are caused by several risk factors linked to the physical condition and disease. One among ten elderly persons had a fall in 2007. Age is an obvious risk factor for falls. A higher percentage of the elderly in the oldest-old category had a fall within a three-year period prior to the survey compared with the young-old category. Elderly females are more prone to falls when compared with males of a similar age group. One among five elderly individuals had a fall in the three years prior to the 2010 survey. In this sample size, females outnumbered the males. Across the age categories of the elderly, the old-old category (70–79 years) had the highest prevalence of falls compared with the young-old and the oldest-old members. More than one-fourth of the elderly had a fall during the period 2010–2013. Among the female elderly, 29.3% had a fall in the three years prior to the survey. Among the oldest-old category, this percentage was 30.8 (Table not shown). However, among the elderly people who exceeded 69 years, 27% had experienced a fall. Hence, the risk for falls is seen to systematically rise with age, an aspect that turns this menace to be reasonably higher at a very old age of 80+. In this context, it would be pertinent to ascertain the segment of the elderly populace that appears more prone to falls. Among the aged who had an experience of falls in 2004, around 86% suffered from visual impairment. The studies proved that poor visual acuity, reduced visual field and cataract were strongly associated with falls among the elderly (Savita et al. 2015; Krishnaswamy and Shanthi 2005; Masud and Morris 2001; Patil et al. 2015). While analysing the history of the elderly who had experienced a fall in 2013, it was found that 17.8% had diabetes in 2004, 30.1% had hypertension or high blood pressure, 66.4% had vision problems and 23.4% had dizziness. The mean age of these elderly in 2013 was 76.7, and the scale ranged from 70.5 to 82.9 years. Among the elderly who had normal ADL (Activities of Daily Living) score in the first survey, 11% had a fall in 2013. The highest proportion of falls was experienced among those with a low ADL score. In addition, the data suggested an increased vulnerability of falls among senior persons living alone.
252
6.4.3
6 Unexplored Facets of the Elderly: Kerala Ageing Surveys
Falls in 2004: Alive or Dead
Falls are one of the leading causes of death among the elderly (Sirohi et al. 2017). The aged who had experienced falls during the year prior to the 2004 survey went through a range of limitations in the intermittent period. Some of them lived on with considerable constraints while others failed to survive. Here, it is potentially relevant to elaborate on the circumstances behind each fall and the propensity of falls with advancing age. Falls occurred more among those of 60–69 years. As age increases, the intensity decreases, perhaps because of reduced mobility. Most of the elderly who died in the three years prior to the second survey were in the 70– 79 years category. The majority of individuals who were alive had one or more chronic illnesses, a condition that most manifests among those of 70–79 years. Disabilities among the elderly peak in the 80+ age group. Physical disabilities associated with vision (82%), hearing (22%) and walking (32%) play a crucial role in the lives of these people. By 2013, nearly half of the elderly people who had experienced falls in 2004 were no more. Most of the falls among senior persons may not have serious consequences. However, the vulnerability to falls among the elderly is undoubtedly conditioned by their age, disease patterns, living arrangements and physical movements. Multiple drugs for the illnesses could also result in dizziness, blackouts and falls.
6.4.4
Subjective Well-Being Inventory (SUBI)
Subjective Well-Being Inventory (SUBI) is used to measure mental health status (Rajan and Sunitha 2017). It comprises nine variables to depict the perception of well-being of the individual. It evaluates elderly life in terms of overall life satisfaction as well as an experience of pleasant and unpleasant emotions, a method developed by Nagpal and Sell (1985). The aspects covered are: • life—interesting and in comparison with the past, • activities that the elderly person has occupied himself or herself with in the recent years, • fulfilment of expectations—standard of living, • achievement of success and efforts, • accomplishment of desires, • confidence in managing unexpected situations and • hopes of coping with the future. An index was constructed on the basis of Scale Reliability Coefficient (Cronbach’s Alpha) by adding the nine variables where higher values indicate better levels of subjective well-being. A reliability coefficient of 0.70 or more is considered acceptable in social science research, which is here 0.95. The mean of
6.4 An Exploration of the Kerala Ageing Survey First Set
253
the index was calculated at 9.5 accordingly, with a standard deviation of 3.7, which ranges between 1 and 18 (Table not shown). According to the base survey in 2004, elderly males reported high levels of well-being in contrast with their female counterparts. Among the elderly, the oldest-old is the most vulnerable cluster with the lowest level of well-being when compared with other age groups (see Table 6.3). In 2010, the SUBI index explained that 37% of the elderly had low levels of well-being while 17.9% had high levels of well-being. Nearly one-fourth of the elderly reported that they were satisfied with their life. Elderly females and those in the old-old and the oldest-old categories had a lower level of happiness when compared with their male counterparts. High levels of well-being can be seen more among the young-old when compared with other categories and among men rather than women. In 2013, about 61% of the elderly had a high level of well-being. Among the oldest-old members, 18.9% had a low level of happiness while among the elderly females, this percentage was 18.2. Among the male elderly, 67.5% reported a high level of happiness. This 2004 study was the first of its kind conducted in Kerala, and every three years it is being validated as the structure of well-being judgements.
6.4.5
Panel Data Analysis of Subjective Well-Being
Most of the elderly enjoyed a medium level of life satisfaction in 2004. However, those who struggled with mobility had a low level of life satisfaction. Considering the death toll among these people between 2004 and 2007, it may be safe to conclude that many of them had low levels of life satisfaction. Those who are independent in their routine activities experienced a higher level of life satisfaction. In 2004, one out of five individuals who struggled with their day-to-day activities had a low level of happiness. Such low levels of happiness were associated with the presence of chronic diseases as 70% of the elderly population with relatively lower levels of happiness suffered from more than one such illness. The happiness index of the 2004 survey reveals that the elderly in the high-level well-being category experience greater happiness when compared with those with lower levels of well-being. This state of happiness is further conditioned by the
Table 6.3 Subjective well-being of the elderly by sex, 2004
Male
Female
Low 68.4 76.1 Medium 15.8 15.2 High 15.7 8.7 Total 100.0 100.0 Source: Same as Table 6.1
Total
60–69
70–79
80+
72.6 15.5 11.9 100.0
69.7 16.8 13.4 100.0
74.2 14.9 10.9 100.0
79.8 11.6 8.6 100.0
254
6 Unexplored Facets of the Elderly: Kerala Ageing Surveys
rising vulnerability to chronic diseases over the years. Though the extent of dependency regarding day-to-day activities among senior persons is on the rise, those with a low level of well-being are more reliant on others than their counterparts with better levels of well-being. In associating levels of satisfaction with various disabilities such as sight, hearing and walking, it is observed that vision problem is more responsive to high levels of satisfaction. On the contrary, issues concerning hearing and walking coexist with low levels of satisfaction. This pattern is consistent in all the rounds of surveys.
6.4.6
General Health Questionnaire (GHQ)
As in the case of the index of subjective well-being, an assessment of the general health condition of the elderly is attempted here. This component is restricted to senior people with a problematic medical condition and the way the individual’s health was adversely affected in the few weeks prior to the survey. Three different factors—psychological distress, social and emotional dysfunction and cognitive disorder—were taken into consideration. Major questions pertaining to the ability to concentrate, sleep, feelings regarding their role in the family, decision-making capability, strain, personal difficulties, ability to enjoy day-to-day activities, the capacity to face problems, sense of unhappiness and depression, loss of confidence, sense of worthlessness and reasonable levels of happiness in spite of the constraints were considered. The reliability coefficient, Cronbach’s Alpha, is 0.96 for 12 items of GHQs. The mean of the index was 22 with a standard deviation of 7.8. Good health conditions lead to higher values of the index. It is better to know the overall picture of the general health of the elderly than examine it separately. The proportion of low levels of health index was high among elderly females, while that of medium and high levels weighed up for elderly males. The majority of people aged 60–69 had high levels of health index. However, the oldest–old category had a significant proportion of low levels of index. The general health condition is better among the young-old and the male elderly population (see Table 6.4).
Table 6.4 Assessing the general health condition of the elderly by sex and age, 2004
Male
Female
Low 30.9 40.3 Medium 63.5 55.8 High 5.5 3.9 Total 100.0 100.0 Source: Same as Table 6.1
Total
60–69
70–79
80+
36.0 59.4 4.6 100.0
31.1 63.8 5.1 100.0
38.6 57.5 3.9 100.0
49.0 46.6 4.5 100.0
6.4 An Exploration of the Kerala Ageing Survey First Set
6.4.7
255
Causes of Death Among the Elderly in 2004 Survey
Of the elderly populace surveyed in 2004, 11.7% were dead in the second wave of 2007, followed by 12.4% more in 2010 and 6.7% in 2013. This experience of death over the four waves of the survey was quite different between the two sexes as most of the males died aged 70–79, whereas most of the females passed away at the age of 80 or more. Of the 578 elderly dead, 56.4% was men. An inquiry into the cause of death is pertinent in analysing the disease patterns among the elderly. Such an investigation showed that 60% of the people died of conditions related to old age. Age-related deaths are often rationalized by the existence of an associated decline in health. The second most frequent cause of death happens to be cardiovascular diseases. Cardiovascular disease was a common health concern and about 13.8% males subsequently died. It is important to note that about 8.6% male elderly died of cancer as against 7.1% of females. About 4% of the deaths among men were due to cerebral vascular diseases. Therefore, as regards the cause of death among the elderly in 2010, the majority were victims of cardiovascular diseases followed by cancer, cerebral vascular diseases, kidney problems and diabetes. Apart from a differential in the pattern of the cause of death, there seems to be an advantage in survival among elderly females when compared with their male counterparts. However, in the follow-up of 2013, the proportion of the male elderly who died due to cardiovascular disease was reasonably higher when compared with a similar fatality among elderly females. Moreover, lifestyle diseases dominated the cause of fatality among elderly men when compared with women. While analysing the cause of fatality, the 2007 survey found that 9.7% of deaths occurred without a serious deterioration in the health condition and were mainly sudden demises. There are no reported ailments. Hidden chronic ailments may cause sudden death. The elderly males contributed to 11.7% of such deaths as against 7.1% in the case of females. In contrast, about 12.6% of senior persons were bedridden for six months or more prior to their death, irrespective of gender. Elderly females suffered more by being confined to bed than their male counterparts. The main caregiver was either the spouse or a child’s spouse. Most of the aged in Kerala still live with their sons. Generally, the caregivers will be their wives, given that male members are often the breadwinners of the household. In this connection, it was observed that about 29% of the male elderly received terminal care from their wives as against 56% who were looked after by the son and his wife. Most of the main caregivers had no job at that time. Some of them supported the elderly, while they were employed and this situation required taking a few days off paid work to look after the sick.
256
6.5
6 Unexplored Facets of the Elderly: Kerala Ageing Surveys
Exploration of the Kerala Ageing Survey Second Set
During this follow-up survey of the same set of elderly people over the four waves, fresh additions were made as regards the assessment of age-related decline in physical functioning. An innovative idea of exploring the hand grip measurements and its relation with other functional reliability of the elderly was gathered in the second set of Kerala Ageing Survey. The grip strength values of India Population are relatively lower when compared with those of people in other parts of the world, which implies a function of physical structure, gender and age. Such differential in grip strength has generally been associated with a lifestyle that shapes both body composition as well as muscular strength (Lohmann et al. 1988). This study elaborates on the observations regarding the hand grip measurements among the elderly. To test the hand grip strength, the query began by figuring out the hand used normally or dominantly. The measurements were then obtained for the left and right hand separately in their convenient position—standing, sitting or lying down. The investigator ensured that the arm to be tested was held by the side and that the elbow was at a 90° angle. The respondent was asked to squeeze the hand as hard as possible for a few seconds. The measurement was repeated after a recovery period of five minutes in order to test the reliability. The measurement of hand grip strength is a useful proxy to determine physical fitness and physical well-being among elderly people, and is increasingly accepted as an indicator of overall muscle strength and function (Sayer et al. 2006; Cesari et al. 2012), expressed in kilograms (kg). The loss of muscle strength enhances the risk of fatal falls (Rantanen et al. 1999; Leveille et al. 2002). High grip strength is strongly associated with preserved mobility (Sallinen et al. Sallinen et al. 2010), higher activities of daily living (Taekema et al. 2010; Kozakai 2017) and decreased disability (Frederiksen et al. 2002; Dato et al. 2012).
6.5.1
Handgrip Measurements Among the Elderly
Grip strength was measured in a face-to-face assessment, with the participant in three positions—standing, sitting and lying down. The mean hand grip strength for male elderly persons was 20.8 ± 6.6 kg and that for females was 13.8 ± 4.9 kg, irrespective of their position. The study showed that right-hand handgrip values of the elderly were higher than the left-hand handgrip values, irrespective of gender and age as the right hand is dominant in most people. Low grip strength is related to poor mobility of the elderly (Lauretani et al. 2003). As shown in Table 6.5, hand grip strength decreases with deteriorating health condition and mobility. The healthy elderly took their handgrip by standing, those with medium health took it sitting and others who were not able to sit or stand took the hand grip lying down (Table 6.6). In the next survey period, the same elderly persons demonstrated reduced handgrip strength in three positions in the
6.5 Exploration of the Kerala Ageing Survey Second Set
257
Table 6.5 Hand grip measurements among the elderly by position and gender, 2013 and 2016 Year
Position
Mean (SD) (Kg) Left hand Male Female
2013
Mean S.D Standing 20.6 6.4 Sitting 20.0 6.7 Lying 10.7 6.4 2016 Standing 17.0 7.2 Sitting 16.6 7.2 Lying 7.8 5.4 Source: Kerala Ageing Survey 2013 and
Mean 13.3 13.6 7.0 12.2 10.9 6.9 2016
S.D 4.6 5.3 5.4 5.3 5.3 6.5
Right hand Male
Female
Mean 21.7 21.2 10.9 18.9 18.2 7.7
Mean 14.1 14.3 6.6 13.7 11.8 6.4
S.D 6.5 6.9 5.4 7.4 7.8 5.1
S.D 4.8 5.3 4.5 7.6 5.7 5.0
Table 6.6 Hand grip measurements among the elderly by position, age and gender, 2013 Position
Mean (SD) (Kg) Male 60–69 70–79 Mean SD Mean SD
Standing 22.8 6.0 19.8 5.7 Sitting 22.5 6.2 19.9 6.1 Lying 0.0 0.0 14.0 7.3 Source: Kerala Ageing Survey 2013
80+ Mean 16.5 15.8 9.1
SD
Female 60–69 Mean SD
70–79 Mean SD
80+ Mean
SD
5.1 5.4 5.2
14.7 15.7 7.8
12.8 13.3 11.3
10.8 10.2 1.9
4.1 4.2 0.9
4.2 4.9 4.5
4.3 4.4 4.4
case of both males and females. Age and sex have a systematic bearing on the measured handgrip strength. As per Table 6.7, elderly males of 60–69 years were stronger than that of females in the same age group. Males in their 80s have better handgrip strength than females of 60–69 years. Grip strength is also related to the quality of life in old age and is an indicator of the physical functioning of the elderly. This assessment was repeated over all the rounds of the surveys in order to obtain a longitudinal assessment of changes in the state of physical functioning over the years. However, the handgrip strength is influenced by sex, hand dominance and age (Bohannon et al. 2006) as well as nutritional status (Flood et al. 2014). The data is open to all researchers interested in investigating the topic in its different dimensions. Generally, those elderly persons who are engaged in occupations that are less physically demanding have a low score of grip strength. An overall analysis proved that diminishing physical activity may increase the loss of function and demonstrate a low score of grip strength.
258
6 Unexplored Facets of the Elderly: Kerala Ageing Surveys
Table 6.7 Hand grip measurements among the elderly by position, activities of daily living (ADL) and gender, 2013 Position
Mean (SD) (Kg) Left hand Male Mean SD
Normal ADL Standing 21.0 6.2 Sitting 20.5 6.4 Lying 16.9 9.4 Partial assistance Standing 16.9 6.7 Sitting 15.8 5.1 Full assistance Standing 15.2 5.4 Sitting 12.1 5.9 Lying 8.6 4.8 Source: Same as Table 6.6
6.6
SD
Right hand Male Mean SD
Female Mean
SD
13.5 14.2 12.8
4.4 5.0 1.0
22.0 21.9 16.0
6.2 6.6 7.8
14.4 14.9 9.7
4.5 5.0 1.9
11.4 11.2
4.6 5.0
17.9 16.7
6.8 5.5
11.9 11.9
4.9 4.9
10.0 8.5 4.1
5.0 4.1 4.0
14.8 13.6 9.3
6.7 5.7 4.2
9.9 9.1 4.5
5.0 4.6 4.4
Female Mean
Conclusion
This chapter offers a brief exposition on the unique aspects of elderly life beyond the conventional picture obtained in the Kerala Ageing Surveys. Such a primary elucidation of newer dimensions of the quality of life in advanced age may not have been explained in detail and that can be the engagement for future researchers. This chapter has merely sought to introduce a few areas that were surveyed in both sets of the Kerala Ageing Surveys, and that which is not explained here may be explored in future. Nonetheless, these unexplored facets of elderly life obtained from a panel of participants in a survey of periodic waves provide an understanding of the transition with age and circumstantial transformation that evolves in the course of a person’s existence. This unique survey initiative in Kerala serves as a model to be replicated in other settings to gain an intensive understanding of the changing life course in human beings and its concurrent implications on the functional well-being of this vulnerable segment of the population. Unless until a panel investigation is conducted, the realities of the transition will never be captured and the correlates thereof cannot be considered clear.
References
259
References Bhat, P. N. M., & Rajan, S. I. (1990). Demographic transition in Kerala revisited. Economic and Political Weekly, XXV(35 & 36), 1957–1980 (1990, September 1–8). Bohannon, R. W., Peolsson, A., Massy-Westropp, N., Desrosiers, J., & Bear-Lehman, J. (2006). Reference values for adult grip strength measured with a Jamar dynamometer: A descriptive meta-analysis. Physiotherapy, 92, 11. Cesari, M., Fielding, R. A., Pahor, M., Goodpaster, B., Hellerstein, M., van Kan, G. A., et al. (2012). Vellas, biomarkers of sarcopenia in clinical trials-recommendation from the international working group on sarcopenia. Journal of Cachexia, Sarcopenia and Muscle, 3, 181–190. Dato, S., Soerensen, M., Montesanto, A., Lagani, V., Passarino, G., Christensen, K., et al. (2012). UCP3 polymorphisms, hand grip performance and survival at old age: Association analysis in two Danish middle aged and elderly cohorts. Mechanisms of Ageing and Development, 133, 530–537. Duraisamy, P. (2001). Health status and curative health care in rural India. Working Paper Series No. 78, National Council of Applied Economic Research. Flood, A., Chung, A., Parker, H., Kearns, V., & O’Sullivan, T. A. (2014). The use of hand grip strength as a predictor of nutrition status in hospital patients. Clinical Nutrition, 33, 106. Frederiksen, H., Gaist, D., Petersen, H. C., Hjelmborg, J., McGue, M., Vaupel, J. W., et al. (2002). Hand grip strength: A phenotype suitable for identifying genetic variants affecting mid- and late-life physical functioning. Genetic Epidemiology, 23, 110–122. Govt. of Kerala. (2009). Growing old in Kerala. In UNDP/planning commission project on strengthening state plans for human development, Thematic Study Series, vol 6. Gulati, L., & Irudaya Rajan, S. (1999). The added years: Elderly in India and Kerala. Economic and Political Weekly, 34(44), 46–51. Johnson, S., & Rajan, S. I. (2010) (Eds.). Population aging and health in India. New Delhi: Rawat Publications. Kerala Aging Survey. (2004). Kerala aging survey report. Thiruvananthapuram: Centre for Development Studies. Kerala Aging Survey. (2007). Kerala aging survey report. Thiruvananthapuram: Centre for Development Studies. Kerala Aging Survey. (2010). Kerala aging survey report. Thiruvananthapuram: Centre for Development Studies. Kerala Aging Survey. (2013). Kerala aging survey report. Thiruvananthapuram: Centre for Development Studies. Kerala Aging Survey. (2016). Kerala aging survey report. Thiruvananthapuram: Centre for Development Studies. Kerala Aging Survey. (2019). Kerala aging survey report. Thiruvananthapuram: Centre for Development Studies. Kozakai, R. (2017). Grip strength and healthy aging. The Journal of Physical Fitness and Sports Medicine, 6, 145–149. Krishnaswamy, B., & Shanthi, G. S. (2005). Risk factors for falls in elderly. Journal of Indian Academy of Geriatrics, 1, 57–60. Lauretani, F., Russo, C. R., Bandinelli, S., Bartali, B., Cavazzini, C., Di Iorio, A., et al. (2003). Age-associated changes in skeletal muscles and their effect on mobility: An operational diagnosis of sarcopenia. Journal of Applied Physiology, 95(5), 1851–1860. Leveille, S. G., Bean, J., Bandeen-Roche, K., Jones, R., Hochberg, M., & Guralnik, J. M. (2002). Musculoskeletal pain and risk for falls in older disabled women living in the community. Journal of the American Geriatrics Society, 50, 671–678. Liebig, S. P., & Rajan, S. I. (2003). An aging India: Perspectives, prospects and policies. Journal of Aging and Social Policy, 15(2), 1–10.
260
6 Unexplored Facets of the Elderly: Kerala Ageing Surveys
Lohmann, T. G., Roche, A. F., & Martorell, R. (1988). Anthropometric standardization reference manual. IL: Human Kinetics Books Champaign. Masud, T., & Morris, R. O. (2001). Epidemiology of falls. Age and ageing, 30(Suppl 4), 3–7. Nagpal, R., & Sell, H. (1985). Subjective well-being (SEARO Regional Health Paper No. 7). New Delhi: World Health Organization Regional Office for South East Asia. Patil, S. S., Suryanarayana, S. P., Dinesh, R., Shivraj, N. S., & Murthy, N. S. (2015). Risk factors for falls among elderly: A community-based study. International Journal of Health & Allied Sciences, 4, 135. Rantanen, T., Guralnik, J. M., & Foley, D. (1999). Midlife hand grip strength as a predictor of old age disability. JAMA, 2981, 558–560. Rajan, S. I. (1989). Aging in Kerala: One more population problem? Asia-Pacific Population Journal, 4(2), 19–48. Rajan, S. I., Mishra, U. S., & Sarma, P. S. (1995). Living arrangements among indian elderly. Hongkong Journal of Gerontology, 9(2), 20–28. Rajan, S. I., Mishra, U. S., & Sarma, P. S. (1999a). Indian elderly: Some views of the populace. Indian Journal of Social Work, 60(4), 487–607. Rajan, S. I., Mishra, U. S., & Sarma, P. S. (1999b). India’s Elderly: Burden or Challenge?. New Delhi: Sage Publications. Rajan, S. I. (2000). Social security and safety nets for unorgainzed sector in India. Paper Presented at the Workshop on Reforming Pension System in South Asia Organized by the Asian Development Bank Institute, held at The Oberoi Hotel, New Delhi, 2000, 23 November–2 December. Rajan, S. I., Mishra, U. S., & Sarma, P. S. (2001). Health concerns among the India’s elderly. International Journal of Aging and Human Development, 53(3), 191–204. Rajan, S. I. (2001). Social assistance for poor elderly: How effective? Economic and Political Weekly, 36(8), 613–617, 2001, 24 February. Rajan, S. I. (2002). Home away from home: A survey of old age homes and inmates from Kerala. India. Journal of Housing for the Elderly, 16(1 and 2), 125–150. Rajan, S. I., Sarma, P. S., & Mishra, U. S. (2003). Demography of Indian aging, 2001–2051. Journal of Aging and Social Policy, 15(2 & 3), 11–30. Rajan, S. I., & Kumar, S. (2003). Living arrangements among Indian elderly; evidence from national family health survey. Economic and Political Weekly, 38(1), 75–80. Rajan, S. I. (2004). From Kerala to the Gulf: Impacts of labour migration. Asia Pacific Migration Journal, 13(4), 497–510. Rajan, S. I., Risseeuw, C., &Perera, M. (2008). (Eds.). Institutional provisions and care for the aged: Perspectives from Asia and Europe. New Delhi: Anthem Press. Rajan, S. I.,& Sreerupa. (2008). Disease, disability and healthcare utilization among the aged (Chap. 3). In S. I. Rajan, C. Risseeuw, & M. Perera (Eds.), Institutional provisions and care for the aged. Anthem South Asian Studies. Rajan, S. I., & Prasad, S. (2008). Pensions and social security in India (Chap. 6). In S. I. Rajan, C. Risseeuw, M. Perera (Eds.), Institutional provisions and care for the aged. Anthem South Asian Studies. Rajan, S. I., & Mishra, U. S. (2014). Kerala ageing survey (2013). Report submitted to the Government of Kerala, Centre for Development Studies, Thiruvananthapuram. Rajan, S. I., & Sunitha, S. (2017). Life satisfaction among the elderly in Kerala—A longitudinal analysis (Chap. 10). In S. I. Rajan, & U. S. Mishra (Eds.), India’s aged: Needs and vulnerabilities. Hyderabad: Orient Blackswan. Rajan, S. I., & Sunitha, S. (2018). Empowering the elderly by giving dignity (Chap. 3). In Geriatrics Health HülyaÇakmur, IntechOpen. Available from: https://www.intechopen.com/ books/geriatrics-health/empowering-the-elderly-by-giving-dignity Sallinen, J., Stenhom, S., Rantanen, T., Heliövaara, M., Sainio, P., & Koskinen, S. (2010). Hand-grip strength cut-points to screen older people at risk for mobility limitation. Journal of the American Geriatrics Society, 58, 1721–1726.
References
261
Savita, S. P., Suryanarayana, S. P. , Dinesh, R., Shivraj, N. S., & Murthy, N. S. (2015). Risk factors for falls among elderly: A community-based study. International Journal of Health & Allied Sciences. Published by Wolters Kluwer, Medknow. Sayer, A. A., Syddall, H. E., Martin, H. J., Dennison, E. M., Roberts, H. C., & Copper, C. (2006). Is grip strength associated with health related quality of life? Findings from the Hertfordshire cohort Study. Age and Ageing, 35, 409–415. Sirohi, A., Kaur, R., Goswami, A. K., Mani, K., Nongkynrih, B., & Gupta, S. K. (2017). A study of falls among elderly persons in a rural area of Haryana. Indian Journal of Public Health, 61, 99–104. Taekema, D. G., Gussekloo, J., Maier, A. B., Westendorp, R. G. J., & De Craen, A. J. M. (2010). Handgrip strength as a predictor of functional, psychological and social health. A prospective population based study among the oldest old. Age and Ageing, 39, 331–337. Zachariah, K. C, & Rajan, S. I. (2004). Gulf Revisited: Economic Consequences of Emigration from Kerala: Emigration and Unemployment. Centre for Development Studies (Thiruvananthapuram). Working Paper No. 363. Zachariah, K. C., & Rajan, S. I. (2007). Economic and Social Dynamics of Migration in Kerala, 1999–2004: Analysis of Panel Data. Centre for Development Studies (Thiruvananthapuram). Working Paper No. 384. Zachariah, K. C., & Rajan, S. I. (2009). Migration and development: The Kerala experience. New Delhi: Daanish Publishers. Zachariah, K. C., & Rajan, S. I. (2014). Researching international migration: Lessons from the Kerala experience. New Delhi: Routledge. Zachariah, K. C., Mathew, E. T., & Rajan, S. I. (2001a). Impact of migration on Kerala’s economy and society. International Migration, 39(1),63–88. Zachariah, K. C., Mathew, E. T., & Rajan, S. I. (2001b). Social, economic and demographic consequences of migration in Kerala. International Migration, 39(2), 43–72. Zachariah, K. C., Mathew, E. T., & Rajan, S. I. (2003). Dynamics of migration in Kerala: Determinants, differentials and consequences. New Delhi: OrientLongman Private Limited.
Chapter 7
Recommendations: New Emerging Areas and Unexplored Avenues
7.1
Introduction
Over the last five decades, the population of senior citizens in India has increased substantially. The country has a population of 104 million people who crossed the age of 60 in 2011, a figure that is projected to rise approximately to 140 million by 2021 on an average of 3.6% added every year. The surge in the proportion of old age population is a reflection of the improvement in life expectancy over the last few years, partially because of the progress in food availability and advancement in the fields of medicine and technology. However, the aged population in India faces many challenges. Irrespective of males or females, senior citizens are relatively more vulnerable to financial and health disadvantages. A shift from the joint family system to a nuclear family system augments the sense of old age insecurity as most of the elderly are forced to live alone on limited resources. As age advances, many men and women experience marginalization, isolation and insecurity within the family and society. The much-discussed generation gap is a reality for both youngsters and old persons, specifically in terms of technological revolution. On account of the lack of social security and financial freedom, senior citizens suffering from chronic diseases are forced to work even in incompatible environments in both rural and urban areas. The increasing share of chronic functional disabilities among senior citizens invites state support for personal assistance in their routine. Often, this situation is not a matter of personal choice but a forced decision as the elderly populace would not want to become a burden on their children. Earlier, aged persons were not a problem for the family and the society. The country had a value-based joint family system that was basically respectful of and supportive to senior citizens. Now, the situation is slowly changing because of globalization, urbanization and shifts in the collective social ethos. In this context, this book examines the inherent economic and physical disability of old age and addresses the needs of the elderly against the backdrop of the multifarious welfare © Springer Nature Singapore Pte Ltd. 2020 S. Irudaya Rajan and U. S. Mishra, Senior Citizens of India, https://doi.org/10.1007/978-981-15-7740-6_7
263
264
7 Recommendations: New Emerging Areas and Unexplored Avenues
schemes and programmes implemented for senior citizens. It also delineates a few unexplored facets of the older population by incorporating the evidence from a longitudinal Kerala Ageing Survey. In continuity, the authors discuss some of the key issues that have surfaced in the course of the present study, which have been outlined in the previous chapters. The aim is to arrive at a rationale for the policy suggestions that the researchers put forward to the government and agencies that work for the welfare of senior citizens in the country. The chapter is organized into four sections. Section 7.2 discusses the major findings that are relevant for policy formation. The policy recommendations are given in Sect. 7.3. The areas unexplored in this field of study so far are indicated in Sect. 7.4, and the summing up is done in Sect. 7.5.
7.2
Major Concerns
The most important problem that senior citizens of India face is economic insecurity, followed by health-related issues. The lack of sufficient income in old age restricts them from getting proper health care and nutritious food. Perhaps it is one of the major reasons that these people experience countenance degradation in their social status and sense of security. In this study, prior to examining the magnitude of this condition, the authors explored the size of the senior citizens in the population and their socio-demographic characteristics. The most visible aspect that emerged from the analysis is that the numbers of the greying populace are rapidly rising in the various states of India. The pace of the shift from middle age into a grey population is differentiated by the spatial and socioeconomic characteristics. The demographically more advanced states demonstrate greater momentum in this growth, which is accelerated by lower fertility rates. In this process, the researchers noticed a gender dimension, particularly in the case of the sex ratio. Unlike the general population, the sex ratio of senior citizens is more disadvantageous to males than females because of the lesser longevity among the former. The second important issue in old age is related to morbidity and health care. The researchers have explored the issue in detail by looking at the levels and patterns of general ailments, chronic ailments, health care utilization and health expenditure in relation to the spatial and demographic characteristics of senior citizens. One in every four aged persons in India has chronic ailments. The various interventions—particularly the health policy, health insurance, family support, pensions, demand side financing and food security measures—were critically examined to ascertain policies that can make a drastic difference to ensure the well-being of senior citizens. The authors argue that the current health policy must be oriented towards senior citizens, with both short-term and long-term implications. The short-term policy should focus on the critical health issues of the general population and give special care to senior citizens. The long-term policy must focus on a healthy life expectancy and give adequate space to special care for children to survive for 100 years without any diseases. The health issues should be addressed
7.2 Major Concerns
265
from a life course perspective that begins from childhood and extends to old age. Right now, the Government of India has taken measures for the welfare of senior citizens by introducing schemes such as old age pension, Rashtriya Swasthya Bima Yojana (RSBY) and Ayushman Bharat, to name a few. This study has conducted an evaluation of the existing programmes and policies exclusively designed for senior citizens in India and has come to the conclusion that the current schemes and facilities are not enough to cater to the needs of the elderly. The nation needs more evaluation studies and innovative strategies for better results. Apart from these aspects, the substantial share of the disability in the elderly population raises multiple concerns related to the burden and its implications. In India, five in every 100 aged persons are disabled. The extent of disability in old age is consistently higher or vulnerable for elderly men when compared with their female counterparts. A considerable proportion of senior citizens has the double burden of economic dependency and physical dependency. The coexistence of economic dependency and disability makes older persons more vulnerable. The current supporting mechanisms are limited and insufficient to meet the requirements of needy persons. This study noted that visual impairment and vision loss increase dramatically with age. The issues are usually more complicated among the economically dependent persons than in others. Proactive steps are required to overcome the intricacies of old age disabilities, particularly for those who are financially unfit and lack family or social support. Another great concern in old age is the abuse on the part of dear ones. Physical and verbal abuses are common in the absence of proper care (Shankardass and Rajan 2018). Depression is one of the most common illnesses in the elderly population. Among elderly people, chronic diseases, restricted mobility, bereavement, elderly abuse, isolation and loss of income are major risk factors for depression, in addition to the common risk factors in all age groups (Fiske et al. 2009). Apart from the problems stated above, major degenerative diseases such as Alzheimer’s, Parkinson’s and cancer are not addressed adequately even in the socially and demographically more advanced states in the country. Even though Kerala has started to discuss these issues on public platforms, proper planning and institutional arrangements for the benefit of the poor are yet to materialize. Coping with disability, double burden, illnesses and support systems is the key to survival in old age. A grave cause for concern is the bleak reality that family structures are dwindling fast in the country. In the process of shifting from the joint family system to the nuclear one, the support mechanisms for older persons eroded considerably. Youth migration in small-sized families creates many hurdles for senior members (Rajan and Sivakumar 2018). Unfortunately, adequate formal institutions have not been formed to replace the traditional family structure across the country. The existing old age homes do not cater to economically dependent senior citizens (Rajan 2008).
266
7.3
7 Recommendations: New Emerging Areas and Unexplored Avenues
Strategic Insights
In the light of the major issues discussed in the previous section and the information provided in the previous chapters, the authors would like to put forward some suggestions that would be useful for further research and policy formation. One of the major recommendations is to set up a separate department for the welfare of senior citizens in India. Many countries such as China have already made such a provision for the elderly. The prime objective of the proposed senior citizens department would be to conduct action research, which maybe effusively devoted to solve the problems of economically dependent senior citizens, thereby helping them to cope with the threat of externalities that arise from the social and familial domains. The cutting edge of the research domain of the department should be related to geriatric ailments such as Alzheimer’s disease, dementia, psychiatric, respiratory and cardiovascular disorders and physical disability, among others. The health and social care of senior citizens should form a major chunk of the Indian welfare policy along with the other care concerns. The coordination of institutions that currently operate for social welfare and those that deal with health care is essential for better results. The assistive technologies for senior citizens should be appropriate and affordable and must take into consideration their culture, gender, age and care needs. Functional disability in old age is a big problem, and interventions are required to reduce the severity of the condition, particularly in the presence of secondary impairments that contribute to cognitive decline.
7.4
Unexplored Areas
The double burden of financial and physical disability among senior citizens and the viable coping strategies are important unexplored research areas that are relevant in the socioeconomic and political contexts in India. The significance of this aspect relies on multifaceted social research. Perhaps, the magnitude of all other problems, including health concerns, is relatively meagre if this issue is considered at the grassroots level. In other words, if the financial disability can be removed, it is possible that old persons can access better health care services and consume nutritious food for their well-being. The familiarity of senior citizens with updated digital technology and devices is yet another relevant topic that is unexplored in the discipline. Similarly, the way the labour migration affects the senior citizen’s life is worth an enquiry. Perhaps, the society requires regional institutions fully devoted to gauge the issues of ageing at the grassroots level and to find effective solutions for the problems. Another unexplored area would be the impact of migration on the living arrangement of the elderly in India. Irrespective of the state, the streams of migration augment day by day. The youths are moving in search of better opportunities and gaining skills. As youngsters settle down abroad, their parents lead
7.4 Unexplored Areas
267
lonely lives back home in postmodern India. There is an urgent need to study the impact of internal and international migration among educated persons in the country on the replacement of internal labour migration and its consequences to the old persons left behind to take care of themselves (Rajan 2013).
7.5
Summing up
Based on recent evidence as well as historical facts, this study delineates some of the concerns of old age and offers insights into the lives of senior citizens in India. The issues pointed out in this book are perhaps only the tip of the iceberg. The country needs scientific studies and community-based surveys to make meaningful interventions for the welfare of its elderly population. However, the socioeconomic and demographic dimensions of old age, the disadvantages incurred consequent to the dearth of desirable physical and financial conditions and the strategic policy interventions explored in detail are noteworthy. The unexplored areas of geriatric research were pointed out for the attention of policymakers and social researchers. In a globalized world, policy interventions that look beyond the existing situation and take account of the possible technological innovations of the future as well as the transformation in the institutional living arrangements must be considered. The authorities should visualize and plan the interventions to incorporate the evidence from India and also adapt to the changes that happen in other parts of the world.
References Fiske, A., Wetherell, J. L., & Gatz, M. (2009). Depression in older adults. Annual Review of Clinical Psychology, 5, 363–389. Rajan, S. I. (Ed.). (2008). Social policies for the elderly: Experiences from South Asia. New Delhi: Routledge. Rajan, S. I. (Ed.). (2013). India migration report 2013: Social costs of migration. New Delhi: Routledge. Rajan, S. I., & Sivakumar, P. (Eds.). (2018). Youth migration in emerging India. New Delhi: Orient Blackswan. Shankardass, M. K., & Rajan, S. I. (Eds.). (2018). Abuse and neglect of the elderly in India. Springer.