Public Health: Cholera to the Coalition 9781447366850
The first digital-only ebook taster of Unequal health: The scandal of our times by Danny Dorling. Competitively priced,
211 27 8MB
English Pages [52] Year 2013
Recommend Papers
![Contemporary Public Health [12]](https://ebin.pub/img/200x200/contemporary-public-health-12.jpg)


![Introduction to Public Health [6 ed.]
9781284197648](https://ebin.pub/img/200x200/introduction-to-public-health-6nbsped-9781284197648.jpg)


- Author / Uploaded
- Danny Dorling
File loading please wait...
Citation preview
policy press
Public Health: Cholera to the coalition
First published in Great Britain in 2013 by The Policy Press University of Bristol Fourth Floor Beacon House Queen’s Road Bristol BS8 1QU UK Tel +44 (0)117 331 4054 Fax +44 (0)117 331 4093 e-mail [email protected] www.policypress.co.uk North American office: The Policy Press c/o The University of Chicago Press 1427 East 60th Street Chicago, IL 60637, USA t: +1 773 702 7700 f: +1 773-702-9756 e:[email protected] www.press.uchicago.edu © The Policy Press 2013 British Library Cataloguing in Publication Data A catalogue record for this book is available from the British Library. Library of Congress Cataloging-in-Publication Data A catalog record for this book has been requested. ISBN 978 1 44731 112 6 [Mobi] ISBN 978 1 44731 110 2 [epub] The right of Danny Dorling to be identified as author of this work has been asserted by him in accordance with the 1988 Copyright, Designs and Patents Act. All rights reserved: no part of this publication may be reproduced, stored in a retrieval system, or transmitted in any form or by any means, electronic, mechanical, photocopying, recording, or otherwise without the prior permission of The Policy Press. The statements and opinions contained within this publication are solely those of the author and not of The University of Bristol or The Policy Press. The University of Bristol and The Policy Press disclaim responsibility for any injury to persons or property resulting from any material published in this publication. The Policy Press works to counter discrimination on grounds of gender, race, disability, age and sexuality. Cover design by The Policy Press Reader’s Guide This book has been optimised for PDA. Tables may have been presented to accommodate this devices’ limitations. Image presentation is limited by this device’s limitations.
Introduction Public health: Cholera to the Coalition This is the first of three short ‘Policy Press bytes’, writing taken from a much longer work on health inequalities and public health (Dorling, 2013). Here it is argued that in order to better understand the causes and consequences of our current public health crisis, and how it might in future be alleviated, it can help to look to the past. When cholera struck Britain the causes were partly nineteenth-century globalisation aiding the spread of a disease from abroad, and the creation at home of concentrations of newly impoverished people living in circumstances that would maximise its local impact. When the Coalition and its cuts came to Britain the causes were partly twentyfirst-century globalisation aiding the spread of financial chicanery to (and from) abroad.The creation of a newly emasculated people at home, living in circumstances where they were increasing reliant on the financial performance and crumbs from the profits of a few very large multinational corporations also reduced self-sufficiency and maximised the local impact of the crisis when it came. Unequal health outcomes are the key scandal of our times.They also reflect public health scandals of the past. However, just as much better conditions eventually emerged out of past scandals, so too great good could come if we were to begin to rectify the causes of growing health inequalities today. In hindsight we know that the measures taken in the past to prevent the spread of cholera were not all necessary to control the disease, but they ushered in an age where the provision of decent housing, good light and good air to all was seen as necessary: not just for the benefit of those living in poverty but if those at the very top of society were also to live without fear of a painful death from a contagious disease. Today the greatest threat to people once they leave young adulthood is to suffer from poor mental health, from a rational realisation of the precarity of their circumstances and the often near futility of believing that all will be well. And, just as cholera was containable, social precarity and poor mental health can also be contained when we change the circumstances that we live in. In those affluent societies where economic inequalities are tolerated less and where precarity is lower, rates of mental illness are recorded to be much lower again. Even a basic health measure such as life expectancy is higher when economic inequalities are reduced, as shown in Figure 1.1. There may well be many reasons for this outcome. It may not just be the direct effects of more equitable economic circumstances. One example of the indirect benefits of living in a more equal affluent society is given in Figure 1.2, which shows how we can expect people trained in medicine to be more likely to live nearer people who are ill where there is less of an economic gap between rich and poor.The figure implies that this might even apply to those trained in medicine but no longer working as medics. Health inequalities fall when we mix in neighbourhoods rather than continue to polarise economically.
More and more research evidence is being released suggesting that cooperation helps us all – those who at any one time are stronger as well as those who may appear weaker – yet despite this, there is currently a programme under way to privatise the NHS in England (see Figure 1.3). This short publication includes many diagrams, arguing that we need to see better how researchers have stumbled from drawing squares and dots on maps showing where people die young of cholera (Figures 2.1 and 2.2), to taking the handles off water pumps and proclaiming an epidemic to have ended (Figure 2.3), to drawing diagrams of whole cities to understand the spread of disease (Figure 2.4), to mocking the few who are most greedy to shame selfish people into behaving better (Figure 2.5), while remembering the many who suffer when we do not act in cooperation together (Figure 2.6), and looking again at the past anew to better understand today (Figure 2.7) in the hope of a fairer tomorrow. During 2012 and into 2013 the way in which health care is delivered in England is being completely overhauled. Areas where people suffer worse health because they are poorer will no longer receive that little bit of extra funding (Ramesh, 2012b). The old geographies are changing (Figure 3.1). This is happening even as austerity bites and circumstances are re-created in which a planned service is most efficient. The market is being set to tear apart the (once national) health service with a vengeance. In January 2013 the chair of the British Medical Association’s GP committee explained that private providers now allowed access to NHS patients would ‘start to advertise to attract and retain patients, and that NHS organisations would have to follow suit in order to remain viable. [This was] the government’s opportunity to fragment care and finally do away with any notion that there is a national health service’ (Campbell, 2013). Ministers and even the Prime Minister roll up their shirt sleeves and parade through NHS hospitals as if they actually expect to use these facilities in their older years (Figure 3.2), despite their personal wealth putting almost all Cabinet members in the bracket of affluence where people most often avoid using the NHS (and go private instead), if not currently then later in life. If you see the world from that standpoint, managing the NHS is like running a charity that you never intend relying on yourself. Globally, too, with worldwide recession there are signs of retrenchment. Infectious diseases that can be easily controlled at a modest cost may again be on the rise: However, after a rapid expansion between 2004 and 2009, global funding for malaria prevention and control leveled off between 2010 and 2012, and progress in the delivery of some life-saving commodities has slowed. According to the World Malaria Report 2012, these developments are signs of a slowdown that could threaten to reverse the remarkable recent gains in the fight against one of the world’s leading infectious killers. (WHO, 2012) We have yet to see cholera returning outside of disaster zones, and in a few other quite rare instances, but – if those whose thinking underpins much of current ‘Coalition Britain’ have their way – free-market liberalism could, if further promoted worldwide, usher in a period where once again many are allow to languish purely
so that a few can grew rich while claiming that their own enrichment is a price worth paying to help their compatriots win the global economic race. However, I don’t think we’ll be so stupid as to believe them. I think we know what happens when the lessons of the past are ignored.
1 Unequal health: why a scandal, and why now? Inequalities in the health status of social groups have been observable for at least two millennia. For example, during the Roman occupation of Britain, variations in diet between the Romans and those they ruled resulted in the skeletons of poorer groups being stunted. And it was not just that the poor ate less well – the amount of labour demanded of different social groups varied, which contributed to the skeletons of those deemed to be inferior being further stunted. Living under the tyranny of an occupation not only reduces the number of both necessities and luxuries people have in life, it also damages self-resolve and self-respect, although these are hard to measure, especially in archaeological records. Poorer people, for example, could be identified as those with fewer grave furnishings. And examination of dental remains has revealed that those with fewer possessions at the time of death suffered more from disease during life (Griffin et al, 2011). From this you may conclude that great health inequality has always been with us, but that is simply not true – the extent of inequalities has varied greatly over time. The archaeological remains discussed here came from a Roman cemetery discovered in 1925 in Baldock, Hertfordshire (in Roman times Baldock was a settlement on the Icknield Way). Today Baldock is a tiny market town, sandwiched between the Great North Road and the A1 motorway. Among its claims to fame is that from 1936 onwards, the writer George Orwell lived nearby. Orwell wrote widely on issues that often touched on self-resolve and self-respect. He lived in Baldock because the rent was cheap; it was cheap because of the state of the housing there at the time – Orwell regularly had to fix a leaking cesspit. But just a decade ago the very home that Orwell had rented (with the cesspit long gone) was on the market for £395,000, and many young locals have recently had to leave the area because house prices have become so high (Clark, 2003). During the 1930s, before moving to Baldock, Orwell travelled through northern England. He collected stories that were subsequently published in his 1937 book, The road to Wigan Pier, stories about the scandal of the inequalities he saw, of how dire the situation in many northern towns was and how bleak appeared the outlook. We later learned that during the years Orwell was travelling, inequalities in health across Britain had been falling through to the late 1930s and then through the 1950s, all the way to the 1970s. Orwell may well have had a less bleak outlook had he known what was to come, but he might not have written so well had he been more complacent and not so shocked by what he was living through. During the 1970s, when falls in inequalities in health between different areas of Britain came to an end, it was possibly a sign that complacency had risen.1 In hindsight we can see that it was partly because of what people like Orwell wrote in the 1930s and 1940s that the outlook had brightened, with acts of great selfishness more often curtailed between the 1930s and late 1970s than before or after. Lessons from the past are often lost, however, and it is when warnings are forgotten that
inequalities are allowed to rise again, often in very similar form in similar places. Some features of British society today remain eerily reminiscent of Orwell’s descriptions of the 1930s: Nevertheless, in spite of the frightful extent of unemployment, it is a fact that poverty – extreme poverty – is less in evidence in the industrial North than it is in London. Everything is poorer and shabbier, there are fewer motor-cars and fewer well-dressed people; but also there are fewer people who are obviously destitute. Even in a town the size of Liverpool or Manchester you are struck by the fewness of the beggars. London is a sort of whirlpool which draws derelict people towards it, and it is so vast that life there is solitary and anonymous. (Orwell, 1937 [1986], p 73) Today, as cars are now much more a necessity than a luxury, there are many times more of them, even in the poorest of areas of the North, although outside of London lack of access to a car still differentiates the very worst-off places from those just badly off. In contrast, to be ‘well-dressed’ has for centuries been a necessity to securing basic respect and self-esteem.
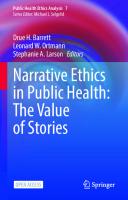
Seeing past scandals in the present The writer Stephen Armstrong recently retraced Orwell’s steps on the 75th anniversary of his journey north. He set out from London, aware that within London the ‘sort of whirlpool’ still exists, although many living in the richest parts of the capital are still often almost oblivious to it.2 The affluent today, as in the 1930s, are similarly far too often unaware of how many people have had no work for many years, but unlike in the 1930s, it is now the young who are being hit the hardest: August 2011 figures from the Office for National Statistics showed more than 20 per cent of 16–24 year olds were unemployed and 100,000 had been on the dole for two years or more. Earlier in the year, the first full comparison of numbers from local authorities showed that men and women in Manchester, Liverpool and Blackburn die ten years younger than men and women living in Kensington and Chelsea. (Armstrong, 2012, pp 9-10) Inequalities in income both create inequalities in wealth and reduce the overall level of health and the quality of life of the population as a whole. Figure 1.1(a) and (b) demonstrate this using the latest data for every country for which comparable figures on the income share of the top 1 per cent have been published. Each circle in the graph represents a country, with the circle area drawn in proportion to the country’s population. Any population that has suffered more insults, both physical and mental, will record poorer health and, ultimately, more premature mortality. And living in a regime of great income inequality is just one of many factors contributing to such insults that can reduce life expectancy. The more the richest 1 per cent take as their share of total
income, the less there is for the rest. However, many insults contribute to national life expectancy averages, not simply the adverse effects of income inequality. One of the simplest to measure the effects now of is smoking. Even in quite equitable countries, if, for example, people smoked more than average in the past, such as in Denmark, life expectancy today would be lower. As smoking rates among younger Danes are much lower, we should expect to see life expectancy rise there more rapidly than in places where a different kind of redistribution than simply less smoking is required. Other harder to quantify insults, such as the physiological harms that come from suffering racism, are similarly known to have independent adverse effects on health. Although all these separate insults matter, in affluent countries one appears to matter the most – inequality in income, which often correlates highly with the other insults. For example, the poor smoke more, and poorer members of minority ethnic groups are easier targets for racists. Figure 1.1 is split into two halves, differentiating richer and poorer countries. In richer countries today life expectancy is above 75 years, while it is generally below that in poorer nations. However, where income inequalities are very high, individual income is reduced further for the great majority (99 per cent) of the population. During the 1930s the countries in the top half of Figure 1.1(a) experienced life expectancy rates more like those in the bottom half of Figure 1.1(b) because, in general, the populations were poorer, and also because fewer treatments for disease existed, particularly for its prevention through vaccination. One great change between the 1930s and the 2010s is that while people today in an affluent area such as Kensington and Chelsea mostly live long lives and rarely experience poverty, they should now find it harder to avoid learning that they are part of the problem of inequality, as far more information on inequality and its harms is now available. During the 1930s many still believed that premature mortality, especially of infants, was an act of god rather than a tragedy that was almost entirely preventable, although others had begun to think differently. Now in rich countries we most often count the costs of health inequalities in terms of years lost at the end of life rather than lives lost at their very start. Later on in his revision of Orwell’s The road to Wigan Pier, Armstrong quotes figures from Michael Marmot’s 2010 official independent review of health inequalities (Marmot, 2010), which claimed: ‘… if everyone in England had the same death rates as the most advantaged, people who are currently dying young thanks to health inequalities would, in total, have enjoyed between 1.3 and 2.5 million extra years of life.They would, in addition, have had a further 2.8 million years free of limiting illness or disability’ (Armstrong, 2012, p 214).
Figure 1.1: LIfe expectancy (2009) of all people versus income share of the best-off 1% (latest year), all countries with recent ‘top income’ data
(a) Life expectancy ≥ 75
84 83
Japan Australia Italy Switzerland Spain Norway Netherlands France Sweden NZ
82
Life expectancy
81 80
Finland
79
Ireland
Singapore Canada UK
Germany Portugal
Denmark
USA
78 77 76 75 74
Argentina
0
2
4
6
8
12
10
14
16
18
20
% of national income taken by the best-off 1%
(b) Life expectancy < 75
80
China
75
Mauritius
Life expectancy
70
Indonesia
65
India
60
55
50
South Africa
0
2
4
6
8
10
12
14
16
18
20
% of national income taken by the best-off 1% Note: Circle area is proportional to the population in 2010. The inequality data used is from the Paris School’s World Top Income database: http://g-mond.parisschool ofeconomics.eu/topincomes/ (excluding Tanzania, where only data to 1970 were included). Source: Life expectancy and population figures from WHO data: http://apps.who.int/ghodata?vid= 710#income (Australian statisticians dispute the WHO figure for life expectancy shown here).
Within Britain the scandal of our times is not that inequalities in health are now wider than they were in the 1920s or 1930s;3 it is that we allowed them to become this wide knowing all we know today that was not known in the 1930s. Today almost everyone lives longer, on average, but the gaps between the expected length of life, according to where you live and your access to wealth, have grown to be the greatest recorded for a century, and the quality of life of those living shorter lives is now deteriorating as living standards fall in both absolute and relative terms. Meanwhile, income and wealth inequalities are continuing to rise, again uniquely today, given the depth of the 2008 economic crash this is found no matter whether those economic inequalities are measured in absolute or relative terms. The outbreaks of mass poverty in the 1920s and 1930s were not planned. Neither was the beginning of reparation particularly well planned. In the decades before the Second World War in the UK (and not until that war in the US) inequalities in income, wealth and health began to fall greatly. In contrast, since the late 1970s, inequalities in income, health and wealth have all been rising as measured between different parts of Britain, and these rises are no longer the shock reaction to recent economic turmoil. Between 1979 and 2010 not enough work was done in any year to curtail the rise of inequality. By 2012 the situation had become so dire that Liam Donaldson, former Chief Medical Officer for England, directly accused the new Coalition government of 2010 of showing disregard for people’s lives in comparison with the New Labour government that had come before. In short, the Coalition government, in the decisions it took, may have ‘… contributed to a rise in deaths in the year after the flu pandemic, according to the former chief medical officer Sir Liam Donaldson. In a new paper, Donaldson, who led the fight against the flu pandemic in 2009 but stepped down when the coalition took power in May 2010, says the change of government response was the key difference between the two years and criticizes the “laissez-faire” attitude of Andrew Lansley’s Department of Health’ (Boseley, 2012).
The scandal of our times During the two years from May 2010 to May 2012 it was often suggested that Andrew Lansley had become the most hated Secretary of State for Health that Britain had ever had. Even a normally Conservative-biased newspaper ran the following headline on Lansley’s attempts to privatise the NHS: ‘The firm that hijacked the NHS: MoS [Mail on Sunday] investigation reveals extraordinary extent of international management consultant’s role in Lansley’s health reforms’ (Mail on Sunday, 13 February 2012). David Cameron sacked him as Secretary of State in September 2012. It is not impossible that we will soon be recording actual rises in mortality rates for particular groups in particular parts of Britain if the trends both to privatise healthcare and to allow inequality and poverty to rise continue (Pollock et al, 2012). The last time actual rises in mortality occurred was against the general background of social improvement experienced between the two world wars, at a time when unemployment rates were historically high and rising and in the aftermath of a global financial crash (Davey Smith and Marmot, 1991).
The position of the UK shown in Table 1.1 (the table of statistics that are plotted in Figure 1.1) is poor. The table is sorted by life expectancy and includes every country for which comparable income inequality data on the top 1 per cent are available.There are often reasons why the relationship between inequality and early mortality is not neater. In Denmark people live shorter lives because smoking rates in the 1980s were higher than in the UK, although those rates have since plummeted. In Singapore people live longer, on average, despite higher inequality, because of a system of deporting some of the poorest people and because some of those in the poorest groups of guest workers abort their babies to avoid the threat of deportation.4 If such reasons are accounted for, then the correlation between tolerating extreme inequality within a country and poorer overall health becomes even stronger. As income and wealth inequalities rise, so too do health inequalities. By May 2010 it had become apparent that men and women had a combined average life expectancy of 74.3 years in Glasgow compared to 88.7 in the Royal Borough of Kensington and Chelsea (2007–09 data; see Figure 41.3, on p 60 of Dorling, 2013). Therefore the gap between an affluent enclave of London and economically runTable 1.1: Income inequality and life expectancy, all countries with data, 2009 Country
Japan Switzerland Australia Spain Italy Singapore Netherlands Sweden Norway New Zealand France Canada Finland Ireland Germany United Kingdom Denmark Portugal United States Argentina China Mauritius Indonesia India South Africa
Year of latest available income inequality data
2005 1995 2008 2008 2009 2009 1999 2009 2008 2009 2006 2007 2002 2000 1998 2007 2005 2005 2008 2004 2003 2008 2004 1999 2007
Top 1% richest people’s share of all income (%)
9.20 7.76 8.59 8.61 9.38 13.7 5.38 6.72 7.94 8.22 8.94 13.78 7.86 10.30 10.88 15.45 4.29 9.77 17.67 16.75 5.87 7.20 8.46 8.95 16.25
Life expectancy in years 2009
83 82 82 82 82 82 81 81 81 81 81 81 80 80 80 80 79 79 79 75 74 73 68 65 54
Population estimate 2010 (millions)
126.6 7.6 22.3 46.1 60.6 5.1 16.6 9.4 4.9 4.4 62.8 34.0 5.4 4.5 82.3 62.0 5.6 10.7 310.4 40.4 1348.9 1.3 239.9 1224.6 50.1
Note: Table is sorted by life expectancy. The inequality data used is from the Paris School’s World Top Income database: http://g-mond.parisschool ofeconomics.eu/topincomes/ (excluding Tanzania, where only data to 1970 were included). Source: Life expectancy and population figures from WHO data: http://apps.who.int/ghodata?vid= 710#income (Australian statisticians dispute the WHO figure for life expectancy shown here).
down Glasgow exceeded 14 years, a 19 per cent difference. It is necessary to go back to the recession of the 1880s to find a greater gap between areas. At that time life expectancy was 46 years in Bristol compared to 36 years in Liverpool, a 10-year absolute, and (then) 28 per cent relative difference between the two ports (Szreter and Mooney, 1998, table 1). By May 2012, as recorded in Dorling (2013) in Chapter 41, that gap between areas had widened yet again, but inequalities between social classes as measured by children’s survival chances had suddenly narrowed.5 Sometimes it can feel as though the geography of inequality in Britain is stuck in a kind of rut, but we must remember just how much worse off in absolute terms people were when the great-great-grandparents of today’s students were children. Szreter and Mooney show that in the registration district of Liverpool (as opposed to the whole city), life expectancy in the 1880s was only 29 years, some 19 years lower than the 48 years recorded then in the affluent Clifton district of Bristol. Similarly, in Glasgow in earlier years life expectancies as low as in Liverpool were recorded, only 27 years around 1840. Infant mortality was key to determining these low overall ages, dragging average life expectancies down as so many died in the first year of life. Manchester’s life expectancy for 1801 to 1850 was possibly the lowest ever recorded in a large city that was not wiped out as a result; it was calculated at 25.3 years, which affected a population of 235,000 people in 1841. Inequalities in health in Britain are the scandal of our times today because you have to travel back to these Victorian statistics to last find life expectancy gaps between places greater than today, even though the overall levels of health were then much worse. But what of the time before the Victorians? The higher social status of groups in an area has not always been reflected in better health there. More than a century before Manchester first recorded such low life expectancies, in the decades running up to 1700, ‘major and minor aristocracy experienced similar life expectancy and infant mortality to the overall population.… As Johansson (1999) has suggested, it took knowledge to convert wealth into health’ (Davey Smith, 2007, p 221, relying in turn on Johansson, 1999). This apparent equality of health was hypothesised to be due to the higher number of people the wealthy came into contact with, and the fact that at that time they knew much less about the causes of ill health. The scandal then was not inequality but ignorance.
Why economic inequality harms health The general explanation that living under conditions of high social inequality is detrimental to health (Wilkinson, 1999) is not yet easily supported by a simple biological model, but this does not make it a bad explanation, just a relatively new one. Critics of the theory that inequality ‘of itself ’ is detrimental to health relied on older and hence possibly less reliable data than that used here (Davey Smith, 2007, figure 7, relying in turn on Lynch et al, 2001). In 2012 a biological model was proposed for why rank inequality might have an effect on health in primates (Tung et al, 2012). However, within the same month a review was then published which suggested no evidence among primates that
rank was adversely related to increased risk of coronary artery disease (Petticrew and Davey Smith, 2012). And then, at almost exactly the same time again, an article was published suggesting that stress caused by increased rank differentiation was the probable explanation for rising obesity in particular societies (Pickett and Wilkinson, 2012). A biological explanation for why income inequality harms health could be summarised as ‘stress causes raised steroid levels which cause weight gain’. A social explanation might be ‘in more unequal countries advertisers are less curtailed from advertising fatty foods’. The argument over precisely how high inequality causes poorer health will continue for some time. In relatively poorer areas people die earlier, and countries with higher inequality are home to more people who are relatively poor. But there is much more to why inequality ‘of itself ’ is harmful to good health than simply increasing poverty. One way in which high economic inequality harms health is that it pushes medical practitioners away from those most in need. Figure 1.2 shows a rough inverse relation between the proportion of the population who have health needs in different parts of the country and the proportion who are qualified working-age medical doctors but who are not working in medicine. Medical doctors are more likely to be found in areas of better health, not because it is there that they make more people better, but because it is there that more prefer to live and work. This is in preference to living and working where people’s health is worse and the areas are poorer. (Dorling, 2013, Chapter 5 includes figures that show this is the case for all those doctors working in medicine.) The exceptions to the rule, Gwent, Carmarthenshire and Torfaen, are places where relatively high numbers of doctors moved to, working at something but not as practising medical doctors. Only 0.06 per cent of Torfaen’s population are qualified medical doctors working in medicine, which is less than the numbers of the working-age population who were qualified but not working as medical doctors in that district! In more equitable countries there are fewer inequalities in health between areas, and doctors tend not to avoid serving areas with greater health problems simply because there are fewer such obviously needy areas. In more unequal countries physicians tend to live and work further away from those who are in need of their care.6 What may be less well appreciated is that more qualified physicians in more unequal countries may be choosing not to actually work as physicians. In more unequal countries do more young people choose to study medicine because of the high incomes doctors receive rather than because they actually want to help people get better? What Figure 1.2 shows is that the proportion of qualified medical practitioners who are in employment but who are not working as doctors is inversely related to the proportion of the population reporting health needs. In general the more people who are ill in a city or county within Britain, the smaller the proportion of doctors who will be working there, but even smaller is the proportion of qualified doctors not working in medicine but still living and working there.
Figure 1.2: Qualified physicians not working in medicine versus health needs, 2001, Britain 0.20
Qualified medics not working in medicine (%)
Gwent
North Somerset Camarthenshire
0.15
Torfaen Swindon
0.10
West Berkshire
0.05
Workington
Isle of Anglesey
Tyne & Wear
Merthyr Tydfil
Buckinghamshire
0.00
Bridgend
0
5
10
15
20
People in the population with health needs (%) Note: Each circle is an area of Britain, county or major city. Areas in the South of England are coloured darker and the area of each circle is drawn in proportion to its population. Selected circles are named. Source: Same data as used in Shaw, M. and Dorling, D. (2004) ‘Who cares in England and Wales? The Positive Care Law: cross-sectional study’, Journal of General Practice, vol 54, pp 899-903 www.dannydorling.org/?page_id=1475
When health inequalities are high and there are large variations between areas, doctors appear not to want to live in areas with high health needs.This is even more the case for groups labelled ‘other health professionals’ (not including doctors, nurses and dentists). Most other health professionals, such as osteopaths and psychologists, work in private practice and so tend to gravitate to where people have more money and are less sick. When it comes to keeping away from the sick, dentists tend to live even further away from those in greatest need. In fact, nurses are the only group of health professionals to be found in slightly higher numbers in areas where there are greater health needs (Shaw and Dorling, 2004). More dentists in poorer areas would not help prevent many premature deaths, but they could relieve a great deal of suffering instead of, for example, carrying out cosmetic whitening in richer areas. However, despite the natural tendency of health researchers to concentrate on what is worse at any one time, there are always pointers to how things might be improved, and sometimes signs of hope.
Why cooperation helps us all As the draft of this chapter was being finished a study was released that strengthened the case for greater equality improving performance and well-being. The study suggested that an argument could be made, even among people at the most highly paid end of the income structure, for how greater equality brings greater benefits (Bucciol and Piovesan, 2012). And this information reached me via a bank! The Economic Research Division of the Federal Reserve Bank of St Louis disseminated the paper through their support of the Research Papers in Economics website.The blog TrackBack (2012) has neatly summarised the findings of the paper, which was a study of footballers: Pay dispersion has an overall negative impact on team performance … doubling pay dispersion [as measured by the Theil index] decreases by 6% the probability of winning a match.This is a big effect.The authors estimate that if a team changes from everyone being paid the same wage of €600k pa (the average in their sample) to a superstar earning €1.5m pa and everyone else in the team getting €510k, the chances of the team winning a game falls by 20 percentage points. That’s almost as big an effect as having to play every game away from home. This adverse effect comes because pay dispersion worsens individuals’ performance…. This quote about Italian Series A football league clubs was then followed by page after page of further analysis, not by the authors, but by apparently statistically addicted football fans adding comments online.7 Fun though such musings are, and also potentially informative, the problems of most people are not how best to maximise the number of goals 11 very cosseted young men might score depending on how much they are paid. The problems of most people in Britain and similar places are how to live healthily and happily in a society that is becoming more and more financially and socially divided with each year that passes, as our health service is increasingly privatised (see Figure 1.3) and our media are slow to appreciate what we are in great danger of returning to. Figure 1.3: An example of airbrushing and what non-misleading advertising would look like
Source: http://www.mydavidcameron.com/posters/cam-nhs1
Notes 1
See Table 10.2 on p 134 in Chapter 10 of Dorling, 2013, which shows the trend in geographical inequalities in premature mortality falling from around 1921 to 1950, falling again from around 1963 to 1973, and then rising. 2 Chapter 39 of Dorling 2013 records the whirlpool effect of migration in and out of London; this is the damping of mortality figures there among the poor, as so many are spun out before dying early elsewhere, although even poorer Londoners tend to be healthier due to migration selection. 3 See Chapter 25 of Dorling, 2013 and the text around Figure 48.2, p 452, in Chapter 48 of the same volume, for data, discussion and illustration of the effects of the recent trends that have led to inequalities becoming wider. 4 See Chapter 36 of Dorling, 2013 for the estimates of the number of people directly and indirectly affected. 5 See Figure 41.3 on p 381 of Chapter 41 in Dorling, 2013, for trends by area, and Figure 44.1 on p 432 of Chapter 44, same volume, for trends by social class. Note that it is possible that, in very recent years, just prior to publication, geographical inequalities in health by area may have narrowed in a similar way to those seen by class in Figure 44.1 of Dorling, 2013.The 2011 Census reveals that there were fewer people living in Kensington and Chelsea than had been thought to live there, so life expectancy in this very affluent borough will not be as high as was believed to be the case prior to summer 2012. 6 Chapter 5 of Dorling, 2013 shows that qualified physicians working as practising physicians tend to be found in greatest numbers where people are least ill (see Figure 5.3, p 75, that volume). 7 The authors of the paper were two Italians, one a Professor of Econometrics with a degree partly in statistics who works at the University of Verona, the other now an Economics Research Fellow at Harvard Business School in the US.
2 The long view: from 1817 to 2012 And he that was never yet connected with his poorer neighbour, by deeds of charity or love, may one day find, when it is too late, that he is connected with him by a bond which may bring them both, at once, to a common grave. (Budd, 1931) When you take the long view, the recent past looks so much better than the distant past. For example, maps of disease in the 19th century concentrated, above all else, on cholera (Hamlin, 2009). There were so many outbreaks and so many of them were mapped that, if you have lived much of your life in Britain or similar places, you could, if morbidly inclined, chart your own personal biography through the plotting of some of the most painful and tragic epidemics that caused so many premature deaths in the not too distant past. Cholera arrived in Britain in 1831, and about 30,000 people died during 1832. It had been endemic in India and was reported, from an outbreak there in Bengal (in 1817), to be spreading outwards and northwards through Russia and west across Europe (Davey Smith, 2002). The arrival of cholera occurred within a few years of the doubling of the numbers of warehouses in cities such as Manchester, cities that were exporting goods to places like India. Cholera slowly came back with the ships, from port to port, country to country, and first broke out in Britain about 14 years after its initial 1817 identification as a potential pandemic disease. Approximately 1,325 people were known to have contracted cholera in Manchester in 1832. Just over half of them died. Whenever and wherever it hit, the shock of dealing with the immediate tragedy and its aftermath led local physicians to try to explain what was occurring. In Manchester in 1833 Dr Henry Gaulter mapped the progress of cholera through the city. He followed cartographic conventions first set down in Germany (Koch, 2011). Germany, being nearer Russia, was the first more affluent nation to be struck by the disease. On street plans of Manchester Dr Gaulter drew black dots at addresses where victims had died. This would become a common way of mapping death in Britain in later epidemics (see Busteed and Hindle, 2010). But he also mapped each street, dwelling by dwelling, both within Manchester and out to nearby Warrington (see Figure 2.1). He suggested theory after theory as to what might be causing and spreading cholera. Later on in his book he suggested that: The truth is that in the greater part of Manchester there are no sewers at all, and that where they do exist they are so small and badly constructed that instead of contributing to the purification of the town, they become themselves nuisances of the worst description.… The contrast between the localities which the rich and poor inhabit, exhibits perhaps the most striking example of the substantial advantages, as far as health is concerned, which
affluence can bestow…. (Gaulter, 1833, pp 118-19; see Figure 2.8 in the annex at the end of this chapter for the full quotation) Dr Gaulter went on to suggest that it was the very poorest who suffered most from cholera, people who had just arrived in the city and who were living in the most crowded of lodging houses or those who had recently lost or had failed to gain factory employment: Of the whole number of Manchester cases very few indeed were employed by the factories at all [due to] the general comfort and cleanliness of these establishments. (Gaulter, 1833, pp 119-20) Unlike in later decades, securing a factory job in the 1830s was a great achievement, a step up for the desperate. However, the extent to which cholera was most constrained to those who were so desperate is now more contested than the consensus reached during the Victorian era. It is possible that cholera deaths were more constrained to a particular group of people because it was more dangerous to that group and it was not such a risk to those who were better off, but fear of cholera helped in speeding up general social improvement as the better-off were led to believe they were at even greater risk than they actually were. Disease at the population level and the structure of human society are always closely linked. It might not be so foolish to claim that cholera was turned into a pandemic disease by the colonisation of the subcontinent that under British rule came to be called India. It was not that there was a utopian order to society in the Indian subcontinent prior to British rule – there was no harmonious pre-existing Indian social structure. However, what there was, in the form of established customs, systems of agriculture, industry and services, came to be so severely disrupted by colonisation as to heap further poverty most forcibly on those who were already the poorest and most marginalised. Local elites were often co-opted by the colonisers. All this was a precursor to pandemic. Once local elites began to work for foreign masters, those who were already poor in India became further impoverished through those actions necessary to sustain colonisation. Local textile industries were decimated to create a market for British cotton goods. It was partly as a result of this that social stability in India was reduced under British rule. Before the British came there had been despotism, suffering and hunger, but only one major famine recorded every century or so.
Figure 2.1: The localities of cholera, Manchester, 1832
PLAN
OF
No1. ALLENS COURT
No3. PLAN
No 4. Hinds Hamlet
OF
PLAN
OF
No2. FALKNER’S COURT
BACK HART STREET
No 5. Cholera in Warrington
Source: Gaulter, 1833, frontispiece. http://www.archive.org/stream/originandprogre00gaulgoog#page/n10/mode/2up
From Medinipur to Manchester1 Under British rule there was famine in 1770 in Bengal, in 1783 in Bihar, Bengal and Punjab, followed by famines in 1787, 1790, 1803 and 1813 (Davies, 2000). Famines continued throughout the 19th century and up until independence. But those early 18th-century famines, and the more general trials of living under occupation, were possibly enough to harass the population sufficiently to provide a ready pool of weakened victims and a fall in general living standards that made the people ripe for the harbouring, mutation, strengthening and spreading of diseases already present but as yet uncommon. Colonisation also meant more travel between the lands of the colonisers and the colonised, and that in turn meant more scope to spread disease. The colonisation of India and the destruction of its textile industry provided a much increased market for US-grown cotton, much of which was spun in Manchester and thereabouts. In the short term it brought profit to Manchester, and the first factories were clean. In the medium term competition between producers meant that conditions in the factories deteriorated, and trade to India in the end brought back the cholera its colonial initiation had helped to stoke. The number of cotton mills peaked in Manchester in 1853 at 108 (Manchester City Council, 2012). At around that peak, and partly because of the peaking, one of the most deadly outbreaks of cholera engulfed Britain. Today we hardly ever think of what a major disease outbreak is like, how it alters much more than the lives of those who are infected and killed, how it changes people’s views on the world, how it can elicit great despair but also galvanise others to act, to graph, to map and to measure – and to advocate things they had always wished for, practices which might not necessarily immediately alleviate suffering from (and lessen the risk of) cholera, but policies which might improve underlying social conditions and be less opposed due to the fear of cholera – turning a crisis into an opportunity. To begin to see this story and to try to get a feel for times past, you could look back at what happened just a few generations ago where you live. I grew up in Oxford. If I search for old maps of Oxford what I often find are maps of cholera. Oxford suffered outbreaks of cholera in 1832, 1849 and 1854. In the first half of the 19th century it was almost impossible to know why. Almost every conceivable theory had been proposed. In Oxford another doctor called Henry, this time Henry Wentworth Acland, plotted cases of cholera on city maps. He also noted that the number of times the sound of thunder supposedly unaccompanied by lightning was heard in the city in the three outbreak years was 2, 8 and 4 respectively (Acland, 1856, p 62). He contrasted that with the figures for many other years.Thunder occurring without lightning was then seen as just another of many hundreds of possible causes of the cholera outbreaks. It is hard to imagine the diligence with which people recorded every conceivable cause in the search for an understanding of terrifying diseases such as cholera, a disease which was as terrifying to the rich as it was to the poor. In Russia an earlier epidemic had killed over 100 nobles. And an outbreak could easily result in rioting
and panic. A menacing, fleeing and simultaneously very poor population does not make a good workforce, or, necessarily, a particularly loyal body of subjects. So the rich feared cholera for many reasons, in addition to their fear of contracting the disease itself. More useful than tabulating lightning and thunder were Dr Acland’s actual maps of cholera spreading through Oxford. These plotted contours for altitude and showed, in 1854, that the higher up people lived, the less likely they were to die of the disease. Maps can be very useful, but it is also very easy to see patterns in maps, patterns that may be more imagined than real.
Under the High Level Bridge When I was 18 I moved to Newcastle upon Tyne and stayed there for 10 years. When the 1854 cholera outbreak struck that city the cases were most densely clustered just north of the Tyne. South of the Tyne in the town of Gateshead they were a little more spread out. In Gateshead, if you look at the map in Figure 2.2, you might imagine a cluster to be found just to the west of the High Level Bridge. Look down to your left next time you travel north on the East Coast main line as you begin to cross the Tyne. If you could actually see 28 dots below you – to your left from the train window, or on the 1854 map – having seen the apparent cluster of cases, you might have been tempted to search for a possible cause.You could, for example, have found the source of water drunk by people there and have claimed that that was the reason. Had it been from the pump of a well you could even have removed the pump handle. Alternatively you could have stepped back a little and looked at the physical and social contours of Gateshead. Physically this is what you might find: That the town of Gateshead, separated from that of Newcastle by the river Tyne only, is mainly situated on a steep slope ascending from that river, in some places with great abruptness, and at the southern extremity of the borough reaching a height of 500 feet; that the great bulk of the town lies at a very considerable elevation, the lowest thoroughfares, those immediately along the verge of the river, being from 4 to 5 feet above spring tide high water. (Royal Commission, 1854, part 4, introduction) When the Royal Commission carried out their thorough study of Newcastle, Tynemouth and Gateshead, rather than produce a huge plethora of possibilities, including thunder without lightning, or identify a particular pump (or well) as the problem, they came to a much broader conclusion. It was announced that it was the sanitary conditions of the population at large that were amiss: That the poorer classes of Gateshead are not only exceedingly ill lodged, but also much overcrowded in their lodgings; that it is an habitual thing for an entire family to live, sleep, cook, eat and wash, &c.; in a single room; the corners of single rooms thus occupied being occasionally further sub-let to other families or lodgers. (Royal Commission, 1854, part 114)
Figure 2.2: Cholera in Gateshead in 1845 (cases)
Source: www.genuki.org.uk/big/eng/NBL/Cholera/Mp2.html
The notion of cholera coming from the poorer classes, often seen as the ‘dangerous classes’ – and therefore alleviation being required to prevent its spread to the better-off – grew in importance with respect to the implementation of preventative initiatives as the 19th century progressed. Cholera may actually not have been particularly
strongly socially patterned (Davey Smith, 2012), but the perception that it was, was important for social reform as the ‘dangerous classes’ became seen as the sink for sustaining the disease, and so it was felt that improving their living conditions would improve the general good. Scientific ‘truth’ may thus have been constructed on a potential misunderstanding, but a socially useful one (Young, 1977). The upper classes were drawn to live in cities (country life could be tedious and not especially profitable). The affluent often did not have separate water supplies, and came into close contact with their servants and others in crowded streets and homes. Cholera may well not have been a disease of poverty other than that the poor were housed more often in low-lying land where water was frequently stagnant and where sewage accumulated and the disease could be most easily transmitted. What was highlighted during the 19th century, through the scare stories and then a particular subset of them, and what caused the high-profile stories, was what came to fit best into the consolidating narrative.‘Unsanitary surroundings’ fitted best partly because it served wider social goals in an age of great social change and led to policy changes that were more widely beneficial: ‘British sanitary systems became the universal mark of adequate public provision for health’ (Hamlin, 1998, p 2). As we move forward in time, and move from place to place, we often realise that what we thought was once true in one place may not have been so straightforward. I moved from Newcastle to Bristol in 1996 and for a short time lived at Richmond Terrace, in Clifton. It is not that I am cursed (or necessarily obsessed) by my personal geographic history; the point I am trying to make here is that wherever you are in Britain and any other country rich enough to have records, if you take a little care to look, you will find that there will have been disease outbreaks all around you, especially a century-and-a-half ago. Epidemic outbreaks were particularly acute during industrialisation and colonisation, at those times before we had learned to control disease a little, which in a circular way may well have been by sharing out resources a ‘tad’ more fairly, to improve sanitary conditions. Later would come more personalised treatment, vaccines and antibiotics, for other diseases. Before that came better public health, but often the public health improvement required a simple story to first be told. Here is part of the story of Dr William Budd, who settled in Bristol in 1842: In 1847, as a general practitioner, he visited a patient with fever in Richmond Terrace, Clifton, a suburb of the city. He diagnosed the fever as typhoid and soon realized that there was a minor epidemic among the homes of Richmond Terrace; of 34 households, 13 experienced at least one case of fever.The only thing the 13 houses had in common was the use of a well; the 21 without fever had different water supplies. He hypothesized that the disease was being spread by water; and in 1849, when he became responsible for the water supplies in Bristol, he concluded that cholera was spread from person to person in similar fashion. In consequence the Bristol water supplies were improved. (Moorhead, 2002, p 562)
Epidemiological imaginations This story of the use of just one infected well is contagious. Dr Budd was far from the first to use it, and similar stories have been played out innumerable times since. It is a nice simple story, and it can – for a short time – circumvent questions of jerry-built homes, poverty wages and nasty social attitudes, to replace these with the tale of the heroic physician who removed the handle from the pump and saved the day. This is not to say that the jerry-building and people living in cellars (in their own and others’ sewage) provide the answer to why cholera spread, as neither is simply the passage of the disease from India. What it is fair to say is that given all the confusion over a new disease, simple stories of a single infected water source are especially alluring. In fact, even in the most famous case of all (of which more below), the 1854 Broad Street outbreak in Soho, London, investigated by Dr Snow, the pump in question may well not have been the source and, even if it were, its handle was removed too late to have had any great effect (see Figure 2.3). Dr Snow was the London-based Yorkshire doctor now viewed as one of the founding fathers of epidemiology for his work on the cholera epidemic of 1854, which convinced the authorities to remove the handle of a water pump on Broad Street:2 There is no doubt that the mortality was much diminished, as I said before, by the flight of the population, which commenced soon after the outbreak; but the attacks had so far diminished before the use of the water was stopped, that it is impossible to decide whether the well still contained the cholera poison in an active state, or whether, from some cause, the water had become free from it. The pump-well has been opened, and I was informed by Mr Farrell, the superintendent of the works, that there was no hole or crevice in the brickwork of the well, by which any impurity might enter; consequently in this respect the contamination of the water is not made out by the kind of physical evidence detailed in some of the instances previously related. I understand that the well is from twenty-eight to thirty feet in depth, and goes through the gravel to the surface of the clay beneath. (Snow, 1855) We will, in all probability, never really know whether the well and its pump in Broad Street was the cause of the Soho outbreak, as all we have to go on are contemporary accounts, such as that from Reverend Henry Whitehead, a strong critic of Dr Snow at the time, who ‘felt that an intensive inquiry would reveal the falsity of the Snow’s hypothesis regarding the Broad Street pump’, and he undertook such an inquiry.Then ‘Slowly and I may add reluctantly [the conclusion was reached] that the use of water [from the Broad Street pump] was connected with the continuation of the outburst’ (Whitehead, 1855). Of course, failing to falsify a hypothesis does not mean it has been confirmed. The fact that the outbreak declined long before the pump handle was removed casts doubt on Dr Snow’s hypothesis. But the myth of how sure people then were that the cause was the pump in Broad Street is simply too strong a myth to kill. Look up the definition of ‘human geography’ in Wikipedia and, at least as of February
Deaths
Figure 2.3: Cholera outbreak in Golden Square, Broad Street, London, 1854 150 140 130 120 110 100 90 80 70 60 50 40 30 20 10 0
Pump closed
Onset of fatal cases
Aug Sept 2nd 3rd 31st 1st
4th
5th
6th
7th
8th
9th 10th 11th 12th 13th 14th
(668 deaths: onset date unknown) Source: Davey Smith (2002, Figure 4)
2012, you are greeted with Dr Snow’s dot map of cholera in London in 1854, but no mention is made of the fact that no microscopic dirt was found in the well, nor that many cases of cholera found further away from the well were not drawn on the map, nor that it was a fishing exercise as simple as that you have just been encouraged to engage in above by looking at the map of Gateshead (see Figure 2.2). In fact: As the tale of the Broad Street pump has been transformed into an anecdote resembling an urban legend, a recurring theme represents Snow as a clear-eyed modern thinker who saw the facts, and was opposed by defenders of ancient preconceived theories. But it misrepresents history, and does Snow an injustice, to imagine that he was not guided every bit as much by his own theory as his opponents were by theirs. (Brody et al, 2000, p 68) There is a chance that the myth of the medical map as a scientific tool of discovery will not simply be replaced by its being recognised as partly sustaining a self-promoting fraud, but that the earlier and other work on mapping cholera will come to be seen as key to changing hearts and minds in favour of public expenditure on public health for the common good, and on looking in general at how human beings are connected, not just within a city, but from as far as Bengal is from Manchester and as 1817 is from today. As the biographer of Dr Budd ended his short history of the doctor, he claimed Budd had added another task to the work of such general practitioners: For the thinking general practitioner he added a fifth task – to study the interaction of human beings with themselves, with living organisms and within their shared environments.This is the task of human ecology. (Moorhead, 2002, p 564)
Of course no one person adds a task on their own. More than a dozen years before Dr Budd knocked on that (later my?) door in Richmond Terrace, Clifton, Bristol, and more than 20 years before the Royal Commissioners in the North East of England suggested that it was the living conditions of the poor that were to blame, Dr Robert Baker, in The Report to the Leeds Board of Health, publishing quickly after those first large outbreaks in January 1833, wrote that: We are of the opinion that the streets in which malignant cholera prevailed most severely, were those in which the drainage was most imperfect; and that the state of the general health of the inhabitants would be greatly improved, and the probability of a future visitation from such malignant epidemics diminished, by a general and efficient system of drainage, sewerage and paving, and the enforcement of better regulations as to the cleanliness of the streets. (British Library, 2012) An extract from Robert Baker’s map is reproduced as Figure 2.4. In fact, it is not at all obvious from the map that cases of cholera were most concentrated in the poorest areas; in the fields just by the area labelled ‘Little London’ that lies on the northern edge of the map, then not a very poor area,3 is the area where the buildings of the University of Leeds were later erected. The School of Geography at the University of Leeds is now sited there and it overlooks a large cemetery. The cemetery land has been considerably raised up due to the volume of bodies from pandemics such as that shown in Figure 2.4. I mention this detail as I moved from being a lecturer in Bristol to next work as a professor right by that cemetery in the University of Leeds. Almost wherever you go in Britain you are never that far from previous sites of epidemic and pandemic concentration (the darkened homes in Figure 2.4).
The ghosts of past times At the time I moved to Leeds, in 2000, colleagues and I had published ‘The ghost of Christmas past’ (Dorling et al, 2000). It has subsequently been recycled more than once, but it does show that geographical patterns are also recycled, even when very different populations move into an area and many of the old population leave. The paper suggested that the impact of inequalities, particularly of health, could span generations despite great population turnover. It drew on maps of London produced at the end of the 19th century and contrasted them with ones drawn on a very similar basis but taken from the census of 100 years later, in 1991. The area of Little London (just north of Woodhouse Lane in Leeds) is today relatively poor, but 100 years ago it was almost certainly a little more affluent, and cholera was not that discriminatory. Public works did result in the worst of the slums being demolished and rebuilt with back-to-backs.These were then demolished and the area was rebuilt with modern council housing, which was in turn again, often shortly afterwards, demolished.All the time the housing of the affluent was improved, or newly built further out (to the north and west in Leeds), as also happened in many other British cities.
Figure 2.4: Cholera in Leeds in 1832 (section of map)
Source: http://www.bl.uk/learning/images/makeanimpact/publichealth/ large12727.html
Despite huge improvements in public health, places that were poor in the past have often continued to be so, while affluent areas have similarly tended to stay affluent or have reverted to being affluent again because of the geographical advantages of their location. Overall health as measured in absolute terms may improve, but as infectious disease has been reduced, and as the rich come again to believe they could be immune to many of the troubles of the poor, relative gaps grow. Popular government discourse often appears to allege that inequalities in health and income have decreased over time as a consequence of policies and initiatives that politicians have put in place; although in average absolute terms, there has been great improvement, most of this recent improvement has been associated with the diminishing popularity of smoking from the 1950s to the 1970s as both knowledge and life chances in general improved. The claim that government today has been narrowing gaps stands contrary to the general lack of progress in narrowing made over recent times and contrasts sharply with the public health achievements that
began to be made within Britain towards the end of the 19th century and that came to full fruition in the first 70 years of the 20th century. In Britain, to next find health inequalities as great as those suffered at the end of the time of cholera we have to jump from Victorian times to the neo-Victorian era of Margaret Thatcher (1979 to 2012 onwards). Although gains have been made in public health since the 1970s, the benefits have been disproportionately felt by the affluent who, in turn, continue to marginalise the poor, so when governments talk about the strides made in diminishing health inequalities, they are largely speaking about an exclusive portion of the population, and perpetuating a discourse that is consistently separated from the life experiences of average people, of the majority of citizens, and especially of the most disadvantaged people within society. We need to remember public health advocacy in the distant past to draw hope for the future, and to learn again from when, over a century ago, we were last confronted by rising inequality. Both economic and health inequalities have expanded over the last three decades. Despite increasing life expectancy overall, inequalities in life expectancy between the poorest and richest groups in society have widened. Furthermore, rising inequalities in life expectancy between areas are concurrent with rising economic inequalities that have emerged between different parts of Britain. As yet, nowhere in Britain has seen a fall in life expectancy or an absolute increase in mortality rates for any group (the last recorded absolute falls were for people aged 25 and over between 1921 and 1940; see Davey Smith and Marmot, 1991, table 1). Infant mortality rates (IMRs) remain highest today in areas in which they were highest a century ago. This is despite a recent dramatic reduction in overall IMRs that has corresponded with the increasing concentration of higher IMRs in the poorest regions. It is also important not to forget that in recent decades inequalities in health for adults have continuously risen despite all the government rhetoric and subsequent initiatives aimed at reducing health inequalities.The rhetoric began with Margaret Thatcher’s commitment to reduce health inequalities by 25 per cent by the year 2000, a promise made in 1985; they increased by more than that target. Both Conservative and New Labour government policy has largely been symbolic and has failed to tackle the disparities in income and wealth that drive rising health inequalities as measured across society. Instead, more potent and redistributive policies are needed to initiate change and greater equality. Although there often appear to be strong grounds for pessimism, there are, nonetheless, good reasons for optimism too. Unlike in the US, where in certain states and for certain groups living standards as reflected by life expectancy have fallen in absolute terms, there is as yet no such trend anywhere in the UK. In the US in some states infant mortality among the babies of black parents has been rising since 2007 (Census Bureau, 2012). Nowhere in the UK has infant mortality yet risen. Moreover, greater equality can be convincingly claimed to be beneficial for the health of wealthy and poorer people, and hence, the whole of society. The drink and drug intake of wealthy North Americans is partly so high, it is argued, because they live in such an unequal society. But when all poor health can be ascribed to apparent individual weakness and without such obvious motivators as cholera epidemics to
bring the rich to their senses, it may be harder to sell redistributive policies today. A general and widespread rise in disgust with the rich (rather than envy) might be what we need next to help us most, both in the UK and the US (see Figure 2.5). Figure 2.5: If pounds were pixels – one of many hundreds of images of dissent in 2012
Note: Image created by Duncan Rickelton. Source: http://zoom.it/yE58
The beginnings and the ends Birth and death are unifying in that when giving birth you have more in common with others giving birth than anyone else (regardless of class). The same is true of death. The New Labour record on reducing health inequalities needs to be placed in the context of rising geographical inequalities in health over the last century.Two core New Labour targets were to reduce the gap in infant mortality across social groups and to raise life expectancy within the most disadvantaged areas. The first target may be close to being attained, but the second is not. Detailed analysis of trends in area-based life expectancy show that life expectancy in the richest areas continued to rise faster than anywhere else in the UK as measured up to 2009 and beyond. Just like the men and pigs in George Orwell’s animal farm, it has become hard to tell Conservatives and New Labour apart in the 21st century because of the effect of Thatcherism on both. Although people are no longer the kinds of chattels they were in the 19th century and all, on average, live much longer, some live much longer than others. A note of
caution has to be woven into the story of declining infant mortality over the 20th century. While it reduced dramatically over the period, and became more rare, its association with poverty, rather than chance, has been increasing, and this reflects the overall health divide. However, its association with poverty as indicated by social class has reduced in recent years.4 As far as we know, to date, the tactics of the 2000s for raising the living standards of the poorest people in Britain have failed to cut down health inequalities. It is possible that there may still be a delayed effect, and inequalities are now increasing largely because of harm done in the 1980s.Time will tell. Intriguingly, in the historical record, reductions in infant mortality have been coincident not with moments of rapidly rising income levels, but when GNP (gross national product) per capita has risen most slowly (in the late 1940s and early 1950s). Infant mortality should react much more quickly to current events, although it is also influenced by parents’ past environments, especially the mother’s (Subramanian et al, 2012). Health inequalities in the last hundred years were lowest when the lives of the rich and the poor were less different. This leads to calls for a ‘stronger dose’ of redistribution of wealth. The ghost of Christmas past still looms large over Britain. Images of Victorian squalor (and vice) are readily brought to mind through the vivid works of Dickens, the author of that ghost. The 200th anniversary of Charles Dickens’ birth was celebrated in early 2012, but how many policy makers would associate patterns of poverty from the Victorian era with the health outcomes of today? For diseases related to deprivation in early life, contemporary mortality is better predicted by the distribution of poverty in 1896 than in 1991. A great deal of the findings reported in the first section of Dorling (2013) raise issues around the stability of ‘poor places’ over time and, again, sharpen the evidence for less miserly, more redistributive, fairer, policies, which, a cynic might suggest, includes motherhood and apple pie; but what is the alternative? Is it to suggest that if a person looks after him or herself, ensures that his or her water source and air is clean, then ‘… it is to his complete protection from their influence that the rich man is indebted for his immunity from cholera quite as much if not more, than to any remarkable freedom from the agency of the predisposing causes, which his wealth confers.The contrast between the localities which the rich and poor inhabit, exhibits perhaps the most striking example of the substantial advantages, as far as health is concerned, which affluence can bestow …’ (Gaulter, 1833, p 118). (See Figure 2.8 in the annex to this chapter.)
Conclusion Monuments were erected around Britain to remember those who died of cholera in the 19th century and to serve as a warning for what might return if we do not continue to learn the lessons of the past (see Figure 2.6). The cholera epidemics were brought under significant control long before Robert Koch’s theses on germ theory were published in 1876. It is not medical science that could most improve health and well-being today but, as before, a better understanding of how we all influence each other. Another
way of looking at arguments for the redistribution of income and wealth is that currently the surplus monies that are allowed to the best-off 1 per cent – over 15 per cent of all income in Britain, and over 20 per cent in the US – are largely wasted. The surplus could be used more efficiently if a larger part of it was redistributed. In unequal countries the very rich squander and waste far more monies than any government, other than a dictatorship, ever could. In recent years not only have the ‘worst inequalities of all’, health inequalities, widened in many affluent countries including the UK and the US, but they have also become so entrenched that poverty is no longer a thing of the past but instead a ghost that has returned. For many postwar decades it was rapidly receding. Living standards are currently falling by both absolute and relative measures in the UK. Not only is it clear that improving living standards and hence the income share in the most disadvantaged areas is still necessary to alleviate health inequalities, but also that the living standards of those who remain stuck need to be raised - which did not happen in recent years because they were not enough of a priority for the New Labour government (Shaw et al, 2005a). Since New Labour lost power the situation has changed from bad to worse. But we should still conclude by counting our blessings. At least in 2010 a chalk artist can draw a picture of opened-up sewers on the floor of a train station in Manchester (see Figure 2.7; BBC, 2010) and his work be reported with no sense of irony – but perhaps that also shows how little we remember of our recent past?
Figure 2.6: Sheffield cholera monument
THE CHOLERA MONUMENT. Source: http://public-art.shu.ac.uk/sheffield/unk126im.html
Figure 2.7: Picture drawn in chalk by Joe Hill, Manchester Piccadilly
Source: (BBC 2010), Temporary drawing made on the concourse floor. ‘United Utilities say that Mancunians flush away thousands of incorrect items, such as make up wipes and ear buds, a year, causing sewers to block and toilets and drains to flood.’ http://news.bbc.co.uk/local/manchester/hi/people_and_places/newsid_9135000/9135707.stm
Notes 1
Medinipur is in Bengal; it was also the centre of revolts and dissent long before Manchester took the role of being the place that first inspired modern communism. 2 See Chapter 40 of Dorling, 2013, for more on the world’s most famous pump handle remover, and a reproduction of Dr Snow’s map (Figure 40.2, p 367 that volume) and further discussion of medical cartography. 3 It is poorer now, but not the poorest part of Leeds; see Nick Davies (1998) for details. 4 See Dorling, 2013, Figure 44.1 and footnote 2 on p 432 in Chapter 44 for declines in class inequalities in infant mortality recorded in 2009 and 2010. The falls are coincident with the increased numbers of children being taken into care following the death of ‘Baby P’ on 3 August 2007 and the subsequent investigation into his death.
Figure 2.8: Two pages from Gaulter’s work on th
Annex
Figure 2.8: Two pages from Gaulter’s work on the 1832 Manchester cholera outbreak
Source: www.archive.org/stream/originandprogre00gaulgoog#page/n128/mode/2up
Figure 2.8: Two pages from Gaulter’s work on the 1832 Manchester cholera outbreak
Source: www.archive.org/stream/originandprogre00gaulgoog#page/n128/mode/2up
iginandprogre00gaulgoog#page/n128/mode/2up
3 Paving the way for ‘any willing provider’ to privatise the NHS Privatisation of the NHS began under the 1979–90 Thatcher government, with fiddling at what were thought to be the edges. First came contracting out the cleaning. This initial round of privatisation was a means of saving money as firms employed cleaners with poorer contracts than those that they had when working for the NHS. During the mid-1980s older children attending my secondary school regularly worked at weekends as cleaners on both hospital wards and in operating theatres as a result of these first privatisations.Those who employed them gave them more and more to clean in a shorter and shorter amount of time. Infections within hospitals became more common. The second Blair and Brown period of privatisation was dressed up as a series of short-term plans aimed at achieving laudable goals such as reducing hospital waiting list times. Specialist providers were brought in but, like the private finance initiative (PFI), these measures proved uneconomic in the medium term (let alone in the long term). The not-so-prudent Gordon Brown may have thought he was increasing efficiency by increasing apparent competition, but private companies will only take on work for the NHS if it profits them; they are not charities. Their ‘efficiency savings’ profit the shareholder, not the NHS, and healthcare is not like other goods and services. Much of the training of doctors and nurses occurs within the NHS, and by avoiding these training costs, private companies can easily undercut the NHS. Another way in which healthcare differs is that in many other forms of consumption you can pick up most goods at bargain prices, expecting that a mistake in your ‘choice’ would just affect your pocket.With health, if the quality is low, you might die. I argue that health, education and some aspects of housing are far better provided through cooperation than competition. We are now in a third round of privatisation. Is it different again? Some think it is a plan to use NHS monies to profit private companies and their shareholders. This would provide value for money to a particular group of people with whom the current government (often accused of being out of touch with most people) are very much and very closely in touch. Of course they have not said this, but it is an interesting coincidence, one that is worth thinking about. Just how in touch so many British Conservative politicians are with ‘private providers’ is demonstrated by listing at the end of this chapter some of the private health connections of many Conservative members of the House of Lords. The Coalition government says it needs to save a lot of money in the short term. Cutting services does that, but major restructuring of an organisation is most unlikely to save money in the short term. So why do it, especially if it is not in your manifesto, and when you end up in coalition with a party, the Liberal Democrats, who say they do not want to do it (but a party that backed the privatisation nevertheless)?
The Health and Social Care Bill was said by the Coalition government, using New Labour-style rhetoric, ‘… to restructure the health service in the hope of reducing costs, improving quality and cutting bureaucracy’. Among these plans the founding principle of the NHS had been forgotten, that principle being to provide free healthcare of a national quality at the point of delivery to the whole population. As the Bill became an Act, passed into law on 20 March 2012, the way healthcare services were to be commissioned became set to undergo major restructuring. The clinical commissioning groups (CCGs) created by the Act were not simply metamorphosed primary care trusts (PCTs). Instead, they now hold the powers once held by the Secretary of State for Health.1 From 2012 onwards CCGs act in place of the Secretary of State rather than on behalf of him or her. This means the government’s current legal duty to secure comprehensive healthcare is passed to the local commissioners and providers of care. It is a step back in time to an era before the NHS was established, to a time when what you received depended far more on the vagaries of what local charity boards and hospitals might provide.Those vagaries in turn depended on how affluent an area you lived in and on how miserly or how kind was the local disposition. Furthermore, unlike PCTs, CCGs are not responsible for all children and adults in contiguous geographical areas. Instead, patient populations are selected from general practitioners’ (GPs’) lists, and CCGs will have to provide care for this selected population rather than a pre-determined geographical area. In other words, not everyone need be included any more. To an extent it was possible not to be on a patient list before the 2012 Act was passed, and refugees not recognised as asylum-seekers were often officially excluded. However, in practice many clinicians chose to follow the Hippocratic oath and provided treatment. Officially, all patients needed to be on a GP’s list to receive treatment. In practice, however, if you turned up at A&E (Accident and Emergency) or a drop-in centre you were treated, and there was an obligation on local GPs to take patients allocated by an over-arching PCT whose job it was to ensure that every person living in their area could be assigned to a GP. Using a map on which PCT boundaries are shown and where population density has been made even, Figure 3.1 shows how evenly spread PCTs were over the population of the country. Some PCTs served larger populations; some smaller ones, depending on local circumstances. Some worked in cooperation with other parts of government and their boundaries. Figure 3.1 shows what the geography of a planned healthcare system looks like. The new system changes the ethos. It leaves the CCGs to decide what services are provided and how. The loss of clearly defined area responsibilities means that those most in need may well not have services allocated for them. Furthermore, some current NHS services will cease to be free and much of the delivery will become privatised. Under the new Act, up to 49 per cent of an NHS hospital’s beds can become full private beds. It was a great concern of many of the commentators on the Bill’s passing that this reorganisation would increase the inequality of service access and provision. And, as they stated as an additional objection, all this would
do nothing to tackle the ongoing health inequalities faced by Britain’s population (Pollock et al, 2012). Figure 3.1: Primary care trusts as they existed in 2011 drawn on an equal population projection (these areas were abolished in 2012)
Note: Each area is a primary care trust. The size of the area is drawn in proportion to the number of patients served. Here only the south eastern group are shown.
Origins of the Coalition government’s Health and Social Care Bill The 2012 Bill to further privatise the NHS had its roots firmly planted by the previous (New Labour) government that in turn had built on Margaret Thatcher’s privatising legacy. On 13 May 2009 the New Labour government announced that the then new Care Quality Commission (CQC, not to be confused with CCGs) would ‘do a bit of a number’ on the ‘worst performing providers’ (Health Service Journal, 2009). Other sources suggested that NHS Chief Executive David Nicholson had held a meeting for all chief executives in the NHS on 12 May 2009 to announce the need for cost savings and that, from that point until the 2010 General Election, all trusts
were required to produce QIPP (quality, innovation, productivity and prevention) plans. This has continued to be a requirement under the Coalition government. Furthermore, under the new government it was claimed that NHS ‘productivity’ had been falling (Grice, 2012), although the validity of such claims has been hotly disputed by independent academic research (Black, 2012). Before the May 2010 General Election, one of the then Opposition leader David Cameron’s key election promises was ‘I’ll cut the deficit, not the NHS’. Some believed him then and also later when, as Prime Minister, he said that the NHS budget was to be ring-fenced ... it turned out it was in a way – the costs of direct patient care were ring-fenced, but that ring-fencing did not take account of the increasing cost of drugs and other treatments.The Coalition’s first NHS White Paper was published in July 2010. At a superficial level privatisation can appear positive. It should mean that GPs are able to buy the services they want from whoever they want, provided that the provider meets the quality criteria set down by the government. Why would you want to wait for an operation at an NHS hospital when you can have it at the local private one next week? One answer might be that many other people would have to each wait longer if you were to jump the queue. It is also often claimed that NHS hospitals waste lots of money and are inefficient, and that better care may be available outside the NHS. However, other than the known huge proportion of US GDP spent on private medicine both by the state and by millions of individuals in the US, estimates are rarely published of the true cost of private care. Specialist private services tend to only be used by very rich people because of their very high costs.These high costs are despite competition in the private sector and the claim that competition reduces costs. In Britain the high cost of private health care also continues despite the NHS having previously trained many of their staff, and the NHS continuing to provide the necessary back-up, such as intensive care beds, when private health care has insufficient resources. The private sector gets both the training and the medical back-up for free. The privatisation theory suggests that if part of the NHS sees its business going elsewhere it will drive up efficiency and drive down costs in order to win back business, and that, in theory, patients have more choice of where they can be treated. However, without private health care providers having to pay for the benefits they get for free from the NHS, it is not a level playing-field. Private care providers were allowed to enter the NHS ‘family’ under the 1997–2010 New Labour administration – just as New Labour introduced student fees, which the Coalition then tripled to £9,000. Private health ‘competition’ introduced by New Labour has, later, been more than tripled in future costs to patients by the new Bill. But there was a point at which this could have been avoided. As Chapter 7 of Dorling, 2013, on income inequalities, concludes: ‘… if there were the political will, the reduction in income inequalities seen for 2002–03 could signal a turning point in this vitally important trend’. The political will was not there; in its place was the will to privatise.
Reasons not to privatise There are numerous reasons put forward not to privatise.They include the fact that most GPs do not have the time or the skills needed for clinical commissioning. It is also widely recognised that patients do not always want choice; most just want to be told what is wrong and how to get better, and to have any necessary treatment, locally, if possibly.The arguments against privatisation made at the time of the 2012 Bill also included: • We should be looking at all hospitals being great, not pushing competition. • It means yet another major restructure for the NHS, which is costing billions already (NHS, 2012). • None of the major professional groups think it is a good idea, including nurses and the General Medical Council and even the Royal College of General Practitioners who would get much of the power and profit! • NHS staff are fed up with being reorganised and do not see this as an improvement in any way, even the ‘Conservative Home’ website argued against the idea in February 2012 – not on principle (which it agreed on), but over how many votes might be lost. But the Bill got passed. And part of the reason it got passed was that the previous New Labour government had not shown that another route was possible. Health inequalities had continued to increase under its authority and throughout its period in office (they had fallen under all previous Labour governments). As Dorling 2013 argues, many of the Labour Members of Parliament (MPs) whose constituents had suffered most due to the failure to narrow inequalities had the power to change policy back in 2005, 2006 and 2007 when it became clear that policy was failing Perhaps because Labour MPs knew it was partly their fault that privatisation was spreading there was far more concerted opposition from the media than from Her Majesty’s Official Opposition in Parliament (Guardian, 2012). Journalist Polly Toynbee’s response to Secretary of State Andrew Lansley’s determination to force the Bill through was: ‘he’s running into such deep trouble … every single part of the NHS is up for sale’. And, she continued, ‘The market ideology of the Health and Social Care Bill shows that the pragmatic prime minister is on another planet.’ She went on, her story illustrated by the photograph in Figure 3.2, to explain that: Andrew Lansley’s last refuge is his most disreputable argument so far: his Health and Social Care Bill must pass as so much has already been implemented without waiting for Royal Assent. None can recall such flagrant flouting of Parliament. All but abolished are 151 primary care trusts – replaced by 279 clinical commissioning groups – while strategic health authorities are to become four hubs.The new national commissioning board already has a chief executive and finance director with seven board members recruited on salaries of up to £170,000 before the bill is passed. Brass plate shifting has squandered £2bn, while the NHS suffers cuts of £20bn. McKinsey and KPMG already have fat contracts to take over much commissioning supposed to be done by GPs. Which sector
will they instinctively favour for contracts? Yet none of it has yet passed into law. The health economist Professor Kieran Walshe says £1bn could still be saved by stopping it now. “Too late,” the health secretary says with grim glee, and Lansley’s alarmed party believes it’s so. (Toynbee, 2012b) A week earlier Toynbee had explained that: … this should make your hair stand on end: only 6% of public service cuts have happened yet. Another 94% are still to come, with cascades more public servants sacked. In benefits, 88% of cuts are still to come. But Tory and Lib Dem MPs voted through an £18bn benefit cut for the ‘squeezed’bottom half with few qualms, taking £1,400 from disabled children and £94 a week from the sick who don’t die or recover within a year.The IFS [Institute for Fiscal Studies] says these cuts are ‘almost without historical or international precedent’.‘How deliverable these will prove remains to be seen,’ it adds. The answer is blindingly obvious. Cuts of these dimensions are impossible. Austerity will not be politically tolerable in a rich country in peacetime where boardrooms pay themselves 49% rises. The Attlee government was toppled by peacetime austerity that voters no longer trusted. The government reassures itself that the country is muddling along, coping with cuts, getting by. But the frightening truth is that it’s hardly begun … The aim of cuts is to ‘incentivise’ people out of ‘dependence’. Presumably the way kicking away crutches incentivises the lame to walk. (Toynbee, 2012a) Figure 3.2: David Cameron and his health secretary, Andrew Lansley, meet nurses during a visit to the Royal Salford Hospital in Manchester on 6 January 2012.
Source: Photograph: John Giles/PA, 2012.
A day later the Daily Mail wrote up another version of the story – appearing to be moving even further to the left than The Guardian. It concerned McKinsey & Company, a global management consulting firm, ‘the trusted advisor to the world’s leading businesses, governments, and institutions’. Here is what Mail journalists described:
A Mail on Sunday investigation, based on hundreds of official documents disclosed under the Freedom of Information Act, has revealed the full extent of McKinsey’s myriad links to the controversial reforms. Many of the Bill’s proposals were drawn up by McKinsey and included in the legislation wholesale. One document says the firm has used its privileged access to ‘share information’ with its corporate clients – which include the world’s biggest private hospital firms – who are now set to bid for health service work. McKinsey’s involvement in the Bill is so great that its executives attend the meetings of the ‘Extraordinary NHS Management Board’ convened to implement it. Sometimes McKinsey even hosts these meetings at its UK headquarters in Jermyn Street, Central London. The company is already benefiting from contracts worth undisclosed millions with GPs arising from the Bill. It has earned at least £13.8million from Government health policy since the Coalition took office – and the Bill opens up most of the current £106 billion NHS budget to the private sector, with much of it likely to go to McKinsey clients. (Rose, 2012) Or, as the medical correspondent of the magazine, Private Eye, put it, If Lansley had wanted evolution, rather than revolution, he would simply have slimmed down the existing Primary Care Trusts, put clinical staff on the board alongside the best of the NHS managers and let them figure out how best to spend the money and focus on the quality and safety of care. By throwing all the cards up in the air, he’s created chaos, uncertainty and the perfect storm for another Mid Staffordshire scandal. The fact that even the more moderate health unions – the Royal College of Nurses and the Royal College of Midwives – now oppose the Bill outright and are calling for its withdrawal should make the Government reconsider. But it won’t. (Hammond, 2012) Two months later, Health Secretary Andrew Lansley, speaking at a meeting of 150 (clinical commissioning) leaders in London on 24 April 2012, explained how the funding formula for CCGs would change with a greater emphasis on the population’s age rather than deprivation (Durham, 2012).The deprivation indexes used in health care traditionally include a factor for the proportion of elderly in the population. It is probably the only deprivation factor that is likely to disproportionately benefit Conservative voters, who, on average, will have greater life expectancy than the rest of the population
Conclusion and collusion It is hardly surprising that the NHS ‘reforms’ have met such hostility given that their aims were to increase choice and competition. I can remember when the NHS was
a 24/7 healthcare system, when GPs would visit you in your bed if you were ill, any day or night of the week. By May 2012, on one night, two thirds of the county of Cornwall was covered by only a single GP ‘in a car west of Bodmin’ working for a private profit-making company undertaking work now contracted out of the NHS (Lawrence, 2012a). A UK citizen is currently most likely to die under the care of the NHS at the weekend, purely as a direct lack of resources. Ironically, given Lansley’s apparent concerns, this particularly impacts on older people who need a more comprehensive social care system, which the 2012 Health and Social Care Bill seemed largely to neglect. More must be done to create greater cohesion between the healthcare service and the social care sector. It has already been shown how the privatisation of sheltered accommodation and care homes for older people has left individuals in unaffordable, substandard conditions. This should not be allowed to happen to the NHS. The privatisation of health services is likely to further stoke the increase in health inequalities that exist in UK society. Much political endeavour has been employed to implement various policies over the last century to reduce health inequalities but, although overall health has generally improved, inequality in health both remains and grows, and this Bill is not the least interested in such inequalities. A GP who had been ‘… one of the most prominent supporters of Andrew Lansley…’ turned out to have been de-registering elderly and disabled patents from his list because they were more time-consuming to treat; this is a taste of privatisation to come (Ramesh, 2012a). Many revelations came out after the Bill was passed, not just revealing the acts of the selfish, but also the failures of New Labour. Inequalities in health between areas had not been falling before 2010. Given this and 13 years of New Labour rule it was possible to suggest that a change in direction would be beneficial. A similar duplicity was seen earlier in the 2006 Mental Health Bill, described in Chapter 9 of Dorling, 2013, introduced to the House of Lords by the then Minster of Health, Lord Warner. But when duplicity becomes normal, how can one political party effectively complain about the other? The New Labour government’s targets were symbolic, rather than addressing the issue of rising health inequalities which were increasing alongside income and wealth inequalities.2 And monetary inequalities matter greatly because they have an effect on health. Chapter 10 of Dorling, 2013 charts how geographical health inequalities rose during the later New Labour years. That government’s failure to reduce inequalities in health set the scene for the events that followed. On Monday, 20 February 2012, the columnist Jackie Ashley wrote: ‘In the real world of individual NHS hospitals, if they are able to gain up to 49% of their income from private health, we will see a growing health apartheid with those who have cash or insurance policies walking up the corridors past those who haven’t.’ (Ashley, 2012). Following this, and exactly a week after the Bill was passed, the ‘risk register’ concerning it was leaked. It stated that there was a risk of ‘Greater costs if new GP-led consortiums make greater use of the private sector. One example of an area where the system could be more costly is if GP consortia makes use of private sector organisations/staff which adds costs to the overall system’ (Watt and Ramesh, 2012). At the same time it was revealed that ‘… in 22 of
the new clinical commissioning groups (CCGs), at least half and sometimes all of the GPs that dominate their boards have a personal financial interest in a private or other non-NHS provider’ (Campbell, 2012a). Partly because of the time commitments involved, most of these GPs will actually only be part-time healthcare providers, and part-time financiers. Just a fortnight earlier, details of 62 Conservative peers in the House of Lords who had officially declared interests in companies involved in the private healthcare industry had been listed on the web, alongside details of how loyally they had voted the Bill through (Social Investigation, 2012). Here are a few details. BUPA, possibly Britain’s largest health insurance, private hospital and care group, was closely connected to many members of the House of Lords, including Baroness Bottomley of Nettlestone, better known when she was the former Conservative Health Secretary Virginia Bottomley, a director of BUPA since May 2007. She voted on key amendments of the Health and Social Care Bill, despite normally having a below average vote turnout in the Lords, turning up for less than a quarter of most other votes. On the Bill she said: ‘I give this Bill an unequivocal and extraordinarily warm welcome.’ There are many other Lords, Baronesses and Barons with an interest in BUPA, and many probably use BUPA in preference to the NHS, but they do not have to list that in their financial interest statements. The other Conservative Lords’ declared interests in private healthcare ranged from having shares in companies set to benefit from the Bill to being chair of (or adviser to) healthcare companies. Some worked as advisers for investment companies that invested heavily in companies that would benefit from the Bill. Others were directors of companies in direct competition to the NHS.The list includes the former Conservative Party Treasurer Lord Ashcroft, and Lords Ashton, Bell, Blackwell, Brittan, Chadlington, Coe, Feldman, Fink, Forsyth, Freeman, Garel-Jones, Griffiths, Hamilton, Howard, Lang, Lawson, Lloyd-Webber, Macfarlane, McColl, Magan, Maple, Marland, Naseby, Newton, Patten, Popat, Ribeiro, Saatchi, Selborne, Sheikh and Tugendhat, Baroness Cumberlege, Baron Higgins and Viscount Goschen. Many who voted for the Bill had previously shown little enthusiasm for voting in the House of Lords, but without their support, it would have been very difficult for the government to get the Bill through Parliament. By contrast, if you are an elected councillor in local government, you are expected to not take part in a debate, or to vote on matters in which you, or your partners, have a financial interest. None of those who at the last hurdle helped secure the privatisation of the NHS were even voted into power, and no rules prevented them from voting in their own self-interest. Internationally, for selecting members to the upper house, only 15 countries predominantly use appointments instead of being democratically elected, countries such as Jordan, Belize and Burkina Faso. The very detailed list referred to above only covers Conservative peers; no doubt there were also some Labour, Liberal Democrats and so-called cross-benchers with similar personal financial interests, interests that could be construed as likely to improve were the Bill to be passed. So how did they vote? If you are worried about the NHS in the future, remember that the Secretary of State for Health is no longer directly responsible for its provision. It is no longer
national. It is often more a business than a service. And all this has very little to do with improving health. To conclude I repeat the story of the one GP working west of Bodmin in Cornwall, for a private service that had tendered for a dramatic cut in funding to win the bid, and whose ‘… profit-making ethos has left the service beset by serious problems and have made it unsafe. Staff say they have been pressurised to downgrade their assessment of the urgency of calls.’ (Lawrence, 2012b). An ill woman had to wait six hours in great pain for the GP to arrive. She died later within a few weeks of that delayed visit. The thousands of stories of the other patients who no longer get seen, the people who have stopped trying to use the service and of the mistakes made when people hurry so that their bosses are able to profit, all remain to be told. Shortly after the infamous privatisation Bill was passed into law, a study reported that it was so badly drafted that ‘It would seem that the recently enacted Health and Social Services Bill has some very serious ‘real world’ flaws in that it is not possible to do in the real world what the bill purports to achieve’ (Jones, 2012). However, the accuracy of such a view depends on what the Bill’s real purpose was. In September 2012 it was revealed that private firms were already bidding for £20 billion of NHS ‘business’ (Campbell, 2012b). Notes 1
Strangely the opposite appeared to be occurring in education where the Secretary of State, Michael Gove, was taking on more and more powers for himself. Possibly as an incentive for the future further privatisation of schools, the only way to avoid being directly answerable to Gove or his successors would be to privatise a school completely.There appeared to be no single, coherent, well-thought-out but devious plan across all of government. 2 Inequality in health between areas is best measured by the Slope Index of Inequality, which tends to be about half as wide as the range between the worst-off and best-off district. It takes into account all areas and not just the extremes. For England by local authority district, this index of inequality rose from 3.65 years of life expectancy between the hypothetical poorest and richest place in 1992–94, to 3.77 in 1995–97, to 3.83 in 1998–2000, and then reached 3.98 by 2001–03, when the measure was last updated (Shaw et al, 2005b). There was improvement in the trend following the 1997 General Election. See Chapter 10 of Dorling 2013, for recent figures. During 2012 there have been reports of mortality rates falling more quickly in some of the poorer areas of England than elsewhere.These falls appear to date from around 2008 and may be due to lower rates of out-migration from these areas. Most affected are Blackburn with Darwen, Liverpool, Trafford, the Wirral, Hatton and St Helens, Blackpool and Wigan – all thought to have seen increasing life expectancy (personal communication, Tom Hennell, 2012).
References Acland, H.W. (1856) Memoir on the cholera at Oxford, in the year 1854, with considerations suggested by the epidemic, London: John Churchill (http://books.google.co.uk/ ebooks/reader?id=aHEFAAAAQAAJ). Armstrong, S. (2012) The road to Wigan Pier revisited, London: Constable. Ashley, J. (2012) ‘Only fear of losing face keeps this mad NHS gamble going’, The Guardian, 19 February (www.guardian.co.uk/commentisfree/2012/feb/19/nhsgamble).
BBC (2010) ‘In pics: artistic sewer opens at Manchester Piccadilly’, 28 October (http://news.bbc.co.uk/local/manchester/hi/people_and_places/ newsid_9135000/9135707.stm). Black, N. (2012) Letter to The Guardian, 19 February (www.guardian.co.uk/ theguardian/2012/feb/19/jb-priestley-was-a-northerner). Boseley, S. (2012) ‘Government laxity on flu led to more deaths, says report’, The Guardian, 16 April (www.guardian.co.uk/society/2012/apr/16/flu-deathsgovernment-failure). British Library (2012) Quotation and map made available of the 1832 cholera outbreak in Leeds (www.bl.uk/learning/histcitizen/21cc/publichealth/sources/ source5/mapofleeds.html). Brody, M., Russell Rip, M.,Vinten-Johansen, P., Paneth, N. and Rachman, S. (2000) ‘Map-making and myth-making in Broad Street: the London cholera epidemic, 1854’, The Lancet, vol 356, pp 64-8 (www.casa.ucl.ac.uk/martin/msc_gis/map_ making_myth_making.pdf). Bucciol, A. and Piovesan, M. (2012) Pay dispersion and work performance, Harvard Business School Working Paper 12-075, Boston, MA: Harvard Business School (www.hbs.edu/research/pdf/12-075.pdf). Budd, W. (1931 [1874 originally]) Typhoid fever, its nature, mode of spreading and prevention, NewYork:American Public Health Association. [An excerpt can be found at www.ncbi.nlm.nih.gov/pmc/articles/PMC1556726/pdf/amjphnation006160128a.pdf] Busteed, M. and Hindle, P. (2010) ‘Angel Meadow: the Irish and cholera in Manchester, exploring Greater Manchester’, Online pamphlet of the Manchester Geographical Society (www.mangeogsoc.org.uk/egm/3_2.pdf). Campbell, D. (2012a) ‘GPs’ shares in private healthcare firms prompt conflict of interest fears’, The Guardian, 27 March (www.guardian.co.uk/society/2012/ mar/27/gps-private-health-firm-shares). Campbell, D. (2012b) ‘Health firms told to get set for £20bn bonanza’, The Guardian, 17 September (www.guardian.co.uk/business/2012/Sept/16/health-firms-nhs). Campbell, D. (2013) NHS being ‘atomised’ by expansion of private sector’s role, say doctors, Over 100 healthcare firms to be allowed to provide basic care, prompting fears local hospital services may go out of business, The Guardian, 6th January, http:// www.guardian.co.uk/society/2013/jan/06/nhs-services-private-sector-doctors Census Bureau (2012) The 2012 statistical abstract of the United States (www.census. gov/compendia/statab/). Clark, R. (2003) ‘At the gates of Animal Farm’, Daily Telegraph, 24 September (www. netcharles.com/orwell/articles/col-afgates.htm). Davies, M. (2000) Late Victorian holocausts: El Niño, famines and the making of the Third World, London:Verso. [See famine timeline for India and review and summary at www.indicstudies.us/Demographics%20and%20Geopolitics/Famine.html] Davies, N. (1998) Dark heart:The shocking truth about hidden Britain, London:Vintage.
Davey Smith, G. (2002) ‘Commentary: Behind the Broad Street pump: aetiology, epidemiology and prevention of cholera in mid-19th century Britain’, International Journal of Epidemiology, vol 31, no 5, pp 920-32 (http://ije.oxfordjournals.org/ content/31/5/920.full). Davey Smith, G. (2007) ‘Boyd Orr lecture: Life-course approaches to inequalities in adult chronic disease risk’, Proceedings of the Nutrition Society, vol 66, pp 216-36. Davey Smith, G. (2012) Personal communication, referring in turn to articles published in the Socialism and Health journal dating from the 1970s. Davey Smith, G. and Marmot, M. (1991) ‘Trends in mortality in Britain 1920-1986’, Annals of Nutrition and Metabolism, vol 25 (supplement 1), pp 53-63. Dorling, D. (2006) ‘Infant mortality and social progress in Britain, 1905-2005’, in E. Garrett, C. Galley, N. Shelton and R. Woods (eds) Infant mortality: A continuing social problem, Aldershot and Burlington: Ashgate Publishing, pp 213-28 (www. dannydorling.org/?page_id=2442) [reproduced as Chapter 4, in Dorling 2013]. Dorling, D. (2013) Unequal health:The scandal of our times, Bristol: The Policy Press. Dorling, D. and Thomas, B. (2009) ‘Geographical inequalities in health over the last century’, in H. Graham (ed) Understanding health inequalities (2nd edn), Buckingham: Open University Press, pp 66-83 (www.dannydorling.org/?page_id=2904) [reproduced as Chapter 5, in Dorling 2013]. Dorling, D., Mitchell, R., Shaw, M., Orford, S. and Davey Smith. G. (2000) ‘The ghost of Christmas past: health effects of poverty in London in 1896 and 1991’, British Medical Journal, issue no 7276, vol 321, December, pp 1547-51 (www.bmj. com/content/321/7276/1547.full) [reproduced as Chapter 3, in Dorling 2013]. Dorling, D., Mitchell, R., Orford, S., Shaw, M. and Davey Smith, G. (2005) ‘Inequalities and Christmas yet to come’, British Medical Journal, vol 331, no 7529, p 1409 (www.dannydorling.org/?page_id=448) [reproduced as an annex to Chapter 3, in Dorling 2013]. Durham, N. (2012) ‘Lansley promises CCGs autonomy in return for results and financial responsibility’, GP News, 25 April (www.gponline.com/News/ article/1128559/lansley-promises-ccgs-autonomy-return-results-financialresponsibility/). Gaulter, H. (1833) The origin and process of malignant cholera in Manchester, Considered chiefly in their bearing on the contagiousness and the secondary causes of the disease, London: Longman (et al) (www.archive.org/details/originandprogre00gaulgoog). Grice, J. (2012) Letter to The Guardian, 17 February (www.guardian.co.uk/ theguardian/2012/feb/17/military-camp-healthcare-work-schemes). Griffin, R., Pitts, M., Smith, R. and Brook, A. (2011) ‘Inequality at late Roman Baldock, UK: the impact of social factors upon health and diet’, Journal of Anthropological Research, vol 67, no 4, pp 533-56. Guardian, The (2012) ‘Politics Weekly podcast: the future of the NHS’, 9 February (www.guardian.co.uk/politics/audio/2012/feb/09/politics-weekly-podcast-nhs). Hamlin, C. (1998) Public health and social justice in the age of Chadwick: Britain, 1800– 1854, Cambridge: Cambridge University Press. Hamlin, C. (2009) Cholera:The biography, Oxford: Oxford University Press.
Hammond, P. (2012) ‘Medicine balls’, Private Eye, issue 1306, 26 January (http:// drphilhammond.com/blog/2012/01/26/private-eye/medicine-balls-private-eyeissue-1306/). Health Service Journal (2009) ‘NHS and Health Management News Blog’, 13 May (www.hsj.co.uk/comment/blogs/hsj-news/nhs-and-health-management-newsblog/5001072.bloglead). Johansson, S.R. (1999) Death and the doctors: Medicine and elite mortality in Britain from 1500 to 1800,Working Paper Series No 7, Cambridge: Cambridge Group for the History of Population and Social Structure. Jones, R. (2012) ‘End of life and financial risk in GP commissioning’, British Journal of Healthcare Management, vol 18, no 7, pp 374-81. Koch, T. (2011) Disease maps: Epidemics on the ground, Chicago, IL: University of Chicago Press. Lawrence, F. (2012a) ‘Cornwall out-of-hours case study: Eve Tonkin’, The Guardian, 25 May (www.guardian.co.uk/society/2012/may/25/cornwall-case-study-evetonkin). Lawrence, F. (2012b) ‘Cornish complaints raise questions over national drive to outsource NHS care’, The Guardian, 25 May (www.guardian.co.uk/society/2012/ may/25/questions-outsource-nhs-care). Lynch, J., Davey Smith, G., Hillemeier, M., Shaw, M., Raghunathan,T. and Kaplan, G. (2001) ‘Income inequality, the psychosocial environment, and health: comparisons of wealthy nations’, The Lancet, vol 358, pp 194-200. Manchester City Council (2012) ‘Manchester and the city centre: Cottonopolis’, Information leaflet (www.spinningtheweb.org.uk/m_display.php?irn=5&sub=co ttonopolis&theme=places&crumb=City+Centre). Marmot, M. (2010) Fair society, healthy lives:The Marmot review, London:The Marmot Review. Moorhead, R. (2002) ‘William Budd and typhoid fever’, Journal of the Royal Society of Medicine, vol 95, no 11, pp 561-4 (www.ncbi.nlm.nih.gov/pmc/articles/ PMC1279260/). NHS (2012) Calderdale NHS (www.calderdale.nhs.uk/get-involved/boardmeetings/). Orwell, G. (1937 [1986]) The road to Wigan Pier, London: Penguin. [Also freely available to read at http://gutenberg.net.au/ebooks02/0200391.txt] Petticrew, M. and Davey Smith, G. (2012) ‘The monkey puzzle: a systematic review of studies of stress, social hierarchies, and heart disease in monkeys’, PLOS One, vol 7, no 3: e27939, doi:10.1371/journal.pone.0027939. Pickett, K. and Wilkinson, R. (2012) ‘Income inequality and psychosocial pathways to obesity’, Proceedings of the British Academy, vol 174, chapter 10. Pollock,. M., Price, D. et al (2012)‘How the Health and Social Care Bill 2011 would end entitlement to comprehensive health care in England’, The Lancet, vol 379, no 9814, pp 387-9.
Ramesh, R. (2012a) ‘GP practice “offloaded vulnerable patients to save money”, practice run by supporter of Andrew Lansley’s health reforms let go of 48 patients who needed high levels of care’, The Guardian, 31 May (www.guardian.co.uk/ society/2012/may/31/gp-health-reform-cost-cut). Ramesh, R. (2012b) ‘NHS to drop poverty as yardstick for local funding’, The Guardian, 18 December, www.guardian.co.uk/society/2012/dec/18/nhs-dropspoverty-yardstick-for-funding Rose, D. (2012) ‘The firm that hijacked the NHS: MoS investigation reveals extraordinary extent of international management consultant’s role in Lansley’s health reforms’, The Daily Mail, 13 February (www.dailymail.co.uk/news/ article-2099940/NHS-health-reforms-Extent-McKinsey--Companys-roleAndrew-Lansleys-proposals.html). Royal Commission (1854) Health: Report from the Royal Commission on Cholera in Newcastle-upon-Tyne, Gateshead and Tynemouth, etc v.2 (British Parliamentary Papers), Dublin: Irish University Press (www.genuki.org.uk/big/eng/NBL/Cholera/index. html). [New issue of 1852-54 edition published in December 1970.] Shaw, M. and Dorling, D. (2004) ‘Who cares in England and Wales? The Positive Care Law: cross-sectional study’, Journal of General Practice, vol 54, pp 899-903 Shaw, M., Davey Smith, G. and Dorling, D. (2005a) ‘Health inequalities and New Labour: how the promises compare with real progress’, British Medical Journal, vol 330, no 7498, pp 1016-21 (www.dannydorling.org/?page_id=457). Shaw, M., Davey Smith, G. and Dorling, D. (2005b) ‘Health inequalities under New Labour: author’s reply’, British Medical Journal, vol 330, pp 1507-8. Snow, J. (1855) On the mode of communication of cholera, London: John Churchill, New Burlington Street (www.ph.ucla.edu/epi/snow/snowbook_a2.html). Social Investigation (2012) ‘Conservative Lords and their financial links to companies involved in private healthcare’ (http://socialinvestigations.blogspot.co.uk/2012/03/ conservative-lords-and-their-financial.html). Subramanian, S.V., Ackerson, L.K. et al (2012) ‘Association of maternal height with child mortality, anthropometric failure, and anaemia in India’, Journal of the American Medical Association, vol 301, no 16, pp 1691-701. Szreter, S. and Mooney, G. (1998) ‘Urbanization, mortality, and the standard of living debate: new estimates of the expectation of life at birth in nineteenth-century British cities’, Economic History Review, vol 51, no 1, pp 84-112. Toynbee, P. (2012a) ‘The welfare reform bill will incentivise people to turn on David Cameron’, The Guardian, 2 February (www.guardian.co.uk/commentisfree/2012/ feb/02/welfare-reform-bill-cameron-frightening). Toynbee, P. (2012b) ‘The NHS bill could finish the health service – and David Cameron’, The Guardian, 6 February (www.guardian.co.uk/commentisfree/2012/ feb/06/nhs-bill-finish-cameron-ideology). TrackBack (2012) ‘Robin Van Persie and the cost of inequality’, Stumbling and Mumbling blog, 15 March (http://stumblingandmumbling.typepad.com/ stumbling_and_mumbling/2012/03/robin-van-persie-the-cost-of-inequality. html).
Tung, J., Barreiroa, L.B., Johnson, Z.P., Hansen, K.D., Michopoulos,V., Toufexis, D., Michelini, K., Wilson, M.E. and Gilad,Y. (2012) ‘Social environment is associated with gene regulatory variation in the rhesus macaque immune system’, PNAS Early Edition (www.pnas.org/lookup/suppl/doi:10.1073/pnas.1202734109/-/ DCSupplementl), pp 1-6. Watt, N. and Ramesh, R. (2012) ‘Reforms could damage NHS, warns draft risk register’, The Guardian, 27 March (www.guardian.co.uk/politics/2012/mar/27/ health-reforms-damage-nhs-risk-register?newsfeed=true). Whitehead, H. (1855) Special investigation of Broad Street (Report note available at www.ph.ucla.edu/epi/snow/whitehead.html). WHO (World Health Organization) (2010) ‘New report signals slowdown in the fight against malaria’, press release, Geneva:World Health Organization, www.who. int/mediacentre/news/releases/2012/malaria_20121217/en/index.html Wilkinson, G. (1999) ‘Health, hierarchy, and social anxiety’, Annals of the New York Academy of Sciences, vol 896, pp 48–63. Young, B. (1977) ‘Science is social relations’, Radical Science Journal, pp 65-129. Acknowledgements Figure 1.3 from http://socialinvestigations.blogspot.co.uk Figure 2.5 from Duncan Rickelton; Figure 2.7 from www.bbc.co.uk Figure 3.2 from a photograph by John Giles/Press Association. This Policy Press Byte is, in effect, taken from an edited collection Unequal health: The scandal of our times (The Policy Press, 2013), which itself is a follow-up to an earlier edited collection, Fair play: A reader on social justice (The Policy Press, 2011). Alison Shaw at The Policy Press oversaw the project and was very encouraging and engaged in the work at all stages. Alongside her I am grateful to Jo Morton who saw the book through production, to Dawn Rushen for patient copyediting, to Laura Vickers and Rebecca Tomlinson who checked all the copyright clearances, and to Dave Worth who typeset the complex text. Paul Coles again patiently redrew all the figures and set all the tables ready for typesetting. Bronwen and David Dorling again read through all the material early on and again wondered what they had done so wrong that their son could produce so many simple errors in such a small number of words. I had a little more help this time because so much of the material here is new. George Davey Smith provided extremely useful criticism of an earlier version of some of this new writing; Sebastian Kraemer commented and added his usual very kind and constructive suggestions. I am also grateful for a great many suggestions from the students undertaking the Master’s course in Social and Spatial Inequalities in Sheffield in spring 2012 who got to read and comment on all the early drafts: Eleanor Carter, Anika Forde, Thomas Fowler, Alice Gaskell, Nicholas Hood, Katie James, Katherine Littlewood, Christina Mak, Laura Simpkins, Amy Sweet, William
Titmuss and Amber Wilson. I am also grateful to Peter Pearson for the George Orwell quote used in Chapter 1. Finally, thanks to my wife Alison Dorling, for tolerating my obsession with getting everything down on paper in multiple formats before my time is up (so much to write, so few years in a lifetime) and to our children, Robbie, Izzy and Sol, for tempering the obsession. All the suggestions and errors made remain my sole responsibility, although if I can find a way of blaming them on someone else….