PCB decoupling capacitor performance for optimum EMC design
The optimum design of decoupling capacitors on a printed circuit (PC) board has been the subject of debate and opinion f
337 29 514KB
English Pages 40
Recommend Papers

![High-Performance Oracle: Proven Methods for Achieving Optimum Performance and Availability [1 ed.]
9780471224365, 0471224367](https://ebin.pub/img/200x200/high-performance-oracle-proven-methods-for-achieving-optimum-performance-and-availability-1nbsped-9780471224365-0471224367.jpg)

![Complete PCB Design Using OrCAD Capture and PCB Editor [2 ed.]
0128176849, 9780128176849](https://ebin.pub/img/200x200/complete-pcb-design-using-orcad-capture-and-pcb-editor-2nbsped-0128176849-9780128176849-j-5436374.jpg)
![Complete PCB Design Using OrCAD Capture and PCB Editor [2 ed.]
0128176849, 9780128176849](https://ebin.pub/img/200x200/complete-pcb-design-using-orcad-capture-and-pcb-editor-2nbsped-0128176849-9780128176849.jpg)
![Optimum performance training for the health and fitness professional [2nd ed.]
9780971028623, 0971028621](https://ebin.pub/img/200x200/optimum-performance-training-for-the-health-and-fitness-professional-2ndnbsped-9780971028623-0971028621.jpg)


![Introduction to optimum design [2nd ed]
0120641550, 9780120641550, 0071001239, 9780071001236](https://ebin.pub/img/200x200/introduction-to-optimum-design-2nd-ed-0120641550-9780120641550-0071001239-9780071001236.jpg)
File loading please wait...
Citation preview
Technical Report Printed Circuit Board Decoupling Capacitor Performance For Optimum EMC Design
Bruce Archambeault, Ph.D. Doug White Personal Systems Group Electromagnetic Compatibility Center of Competency January 1999
1
Abstract The optimum design of decoupling capacitors on a printed circuit (PC) board has been the subject of debate and opinion for many years. Cause and effect have been difficult to separate from all the other effects occuring on a normal active PC board. This work used a specially designed PC board to allow the measruement and characterization of the effects of various decoupling capacitor strageties. Many common opinions and myths are investigated, and the optimum design stragety recommended based upon the measured data in this report.
ITIRC Keywords: Decoupling EMI/EMC Power Plane
2
Table of Contents Introduction ……………………………………………………………………………. 4 Decoupling Capacitor Performance Measurement Process …………………………. 4 Test Board Description …………………………………………………………. 4 Decoupling Capacitor Configuration Measurement Results …………………………. 6 PC Board Impedance …………………………………………………………… 7 Source vs. Distributed Decoupling ………………………………………….…… 7 Quanity of Distributed Decoupling Capacitors (.01 uF only) …………………… 12 Quanity of Distributed Decoupling Capacitors (.01 uF and 10 pF) ……………… 12 Quanity of Distributed Decoupling Capacitors (.01 uF and 22 pF) ……………… 13 Quanity of Distributed Decoupling Capacitors (.01 uF and 330 pF) …………….. 32 Decoupling Around Board Edge Only …………………………………………… 32 Resistive Decoupling Around Board Edge ………………………………………. 32 Emissions Around Board Edge …………………………………………………………. 32 Conclusions and Recommendations …………………………………………………… 32
3
Technical Report Printed Circuit Board Decoupling Capacitor Performance For Optimum EMC Design Bruce Archambeault, Ph.D. Doug White Personal Systems Group Electromagnetic Compatibility Center of Competency January 1999
INTRODUCTION Decoupling capacitors are used to provide a local source of charge for ICs requiring a significant amount of supply current in response to internal switching. If sufficient decoupling capacitors are not used, the required supply current is not available, and the device does not operate properly, and signal integrity data errors can result. In addition to the signal integrity requirement, decoupling capacitors serve as EMC filters to prevent high frequency RF signals from propagating throughout the PC board. This requires them to provide a low impedance across the frequencies of interest. The proper number of decoupling capacitors, and the proper value of those decoupling capacitors is always a topic of debate between EMC engineers and design engineers. Some typical rules-ofthumb require a decoupling capacitor for each power pin on an IC. Other rules-of-thumb require at least one decoupling capacitor per side of physically large ICs. Still other rules-of-thumb require decoupling capacitors spread evenly over every square inch of the board. Very little real information about the optimum approach is available in the technical literature. Traditionally, the values of the decoupling capacitors are largely based upon habit and the experience of the EMC engineer. Values of .10 uf are typically used. Often smaller capacitors are used in parallel with the main decoupling capacitor to provide a high frequency and a low frequency filtering effect. However, potential cross resonances can have a negative effect when using multiple capacitors in close proximity. The overall result is that the design of the power plane decoupling (between a power plane and a ground reference plane) has been historically difficult to properly design or analyze. With onboard clock speeds of 400 – 800 MHz becoming common, a more rational approach must be taken to optimize the design of decoupling capacitors on the printed circuit (PC) board.
DECOUPLING CAPACITOR PERFORMANCE MEASUREMENT PROCESS Since a ‘real’ PC board is quite complex, it is difficult to isolate the various EMC effects to know that a particular change to the board has produced an effect that is directly traceable to that original change. Therefore, a special PC board was created to help analyze the effects of a variety of decoupling capacitor configurations. Test Board Description This investigation focused upon a 4-layer PC board, with the external dimensions of 10 x 12 inches. This was considered to be a typical board used in current products. Since the frequency range under investigation extended from 30 MHz to over 1 GHz, a repeatable and well controlled connection method to the test board was required. A set of 15 SMA connectors were installed across the board as shown in Figure 1. Each of the SMA connectors was surrounded by four locations for SMT decoupling capacitors. Figure 2 shows the detail of each location. 4
12” 11”
1
10” 9”
3
2
6
7
11
12
8
4
5
9
10
14
15
5” 13
1”
1” 3” 6” 9”
Figure 1 Test Board SMA Connector Configuration
Decoupling Caps
SMA Connector Area Figure 2 Test Board SMA Connector Area Detail
5
In addition to the SMA connectors, and the surrounding decoupling capacitor sites, locations for additional SMT decouping capacitors were located every inch on the PC board. Figure 3 shows a
Possible Cap Location
Figure 3 Additional Decoupling Capacitor Locations on Test Board diagram of the additional decoupling capacitor locations. All measurements were taken with a Network/Impedance analyzer. Both one-port and two-port measurements were used. One port measurements were impedance measurements, while the two port measurements were S211. Examples of each result will be provided in the following section. Initial measurements were impedance measurements. Observing the impedance across the frequency range of 30 – 1800 MHz allowed a better understanding of the effectiveness of the natural interplane capacitance, the effects of decoupling capacitors, and board resonances. However, impedance at a given location on a PC board is not the primary concern for EMC engineers. A more important parameter for EMC engineers is the amount of ‘noise’2 at a remote location due to some IC source location. The remote location might be the edge of the PC board (where it was located near a seam in the metal shielded enclosure), or near a via for an I/O signal trace, which was then connected to an external connector. Therefore, the S21 parameter is a better indication of the decoupling configuration’s performance for EMC considerations. The goal is to have as low as possible S21 between a potential source, and a remote location of concern.
Decoupling Capacitor Configuration Measurement Results There was a number of different types of configurations measured, as well as the capacitor value being varied. Initial measurements focused on impedance of the board at various locations, and with different configurations of capacitors. The difference between local source decoupling, and distributed decoupling was then investigated. Finally, the number of capacitors, and various values of capacitance (both single and multiple values) were investigated.
1
S21 is a measure of the voltage at a remote location due to a source voltage. The noise in this case is due to the switching within the IC, and the current drawn from the power/ground plane structure to support the sudden switching.
2
6
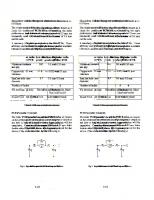
PC Board Impedance The impedance of the PC board with no capacitors was measured using the impedance analyzer, at various locations across the board. The results are shown in Figure 4. The natural inter-plane capacitance is dominant at low frequencies (below 70 MHz), as shown by the impedance decreasing as frequency increases. The measured impedance values match very closely the impedance calculated using a simple parallel plate capacitor formula at low frequencies. At about 70 MHz, the self resonance of the board capacitance and inductance has become dominant, and the impedance begins to rise (inductive component) with frequency. Above 200 MHz, resonances due to the board dimensions become the dominant factor. Depending upon which location on the PC board was used for the impedance measurement, a particular resonant frequency might be excited, or might not be excited. However, from an EMC point of view, it is not possible to control where a component might be placed so to ensure a particular resonance mode would not be excited, so all modes must be assumed present. For this set of experiments, the corner port was used so that most of the resonant modes would be excited over the frequency range of interest (< 2 GHz). Further experiments with various capacitor values at various locations showed that while a particular resonant frequency would shift to another frequency (as capacitors were added and/or moved about the board), the general shape and level of impedance of the resonant peaks did not change. This indicates that the entire resonant frequency range must be considered resonant. That is, since the frequency of resonance shift with any changes, then all frequencies must be assumed to be resonant, and the overall envelop of the impedance (or S21) lowered. Source vs Distributed Decoupling As mentioned earlier, a common question amongst EMC and design engineers is whether to place decoupling capacitors close to the source of the ‘noise’ (that is, near the power and/or ground pins of the ICs), or to simply distribute them across the entire board. To help determine the proposed design approach, the impedance and the S21 of the test PC board were measured with no capacitors, and then with capacitors only around the source SMA connector, and then with capacitors distributed across the entire board. As a further test, the source-only configuration was tested with one, two, three, and four capacitors placed around the SMA connector. Figure 5 shows the impedance results for no capacitors and source-only capacitors. The capacitors did not tend to significantly lower the overall impedance envelop, in fact, some configurations increased the impedance at certain resonant frequencies. Further testing was performed to compare the effects of having .01uf capacitors distributed across the entire board, and only at the source location. Figure 6 shows the S21 results between ports 8 and 10 on the test PC board. (Note that the scales have been changed to better display the S21 data, and that a log (dB) scale is now used for S21 amplitude.)3 The results in Figure 6 show that very little improvement4 was observed at frequencies above 200 MHz. However, the impedance of the .01uf capacitor SMT capacitor is greatly affected by it’s internal inductance (and the inductance of the pads and vias on the board). Figure 7 shows a typical SMT .01uf
3
If S21 is equal to one, or zero dB, that would indicate that all the source voltage was present at the remote observation point. 4 From an EMC point of view, a lower S21 result is a ‘better’ result.
7
Figure 4
8
Figure 5
9
Figure 6
10
Figure 7
11
capacitor’s impedance. Note that the self resonant frequency is about 60 MHz. Also note that the capacitor’s impedance is quite high above 200 MHz, which explains why there is so little effect on the test PC board above 200 MHz. However, in the frequency range where the capacitor is a low impedance, the S21 results in Figure 6 show a definite improvement with the distributed capacitance configuration. The S21 parameter is significantly lower in the below 200 MHz frequency range. This indicates a definite improvement using the distributed capacitance configuration.
While a distributed decoupling strategy appears to be best for an EMC design, signal integrity design considerations still require a decoupling capacitor near a high speed IC to provide the necessary supply current with as low series inductance as possible. A combination of decoupling strategies will meet both EMC and signal integrity requirements. Quantity of Distributed Decoupling Capacitors (.01uf Only) The investigation into the number of decoupling capacitors distributed across the board used only .01uf SMT capacitors. The S21 ‘transfer function’ was measured for a variety of different port combinations, and with a variety of capacitors distributed across the board. Every effort was made to distribute the capacitors evenly across the board for all quantities of capacitors. Table 1 shows the figure number for the various S21 transfer function ports.
Table 1 S21 Port to Figure Definitions (.01uf Caps Only) S21 Ports Figure Number 1-to-8 2-to-8 3-to8 5-to-8 6-to-8 7-to-8
Figure 8 Figure 9 Figure 10 Figure 11 Figure 12 Figure 13
As can be seen in Figures 8 through 13, the more capacitors, the lower the S21 transfer function in the lower frequency ranges (below 200 – 400 MHz). Also, at higher frequencies, the overall envelop for the S21 transfer function decreased slightly (even though the resonant frequency shifted) as more capacitors were added. The maximum number of capacitors was 99 distributed capacitors, representing one capacitor every square inch across the PC test board. Figure 14 shows a summary of all the various transfer function ports with the full (99) number of capacitors. Quantity of Distributed Decoupling Capacitors (.01uf and 10pf) Since the .01uf capacitors had a limited effective frequency range, a 10 pf capacitor was placed in parallel with the original .01uf capacitors to determine the improvement at high frequencies. For this set of experiments, the test PC board was populated with .01 uf and 10 pF capacitors. The 10 pF capacitors were placed in piggy-back fashion on top of the .01 uF capacitors. This resulted in a low-as-possible inductance between the two different values of capacitor.5 This set of experiments was again repeated for a number of different port-to-port combinations, and with a number of different configurations with varying amounts of capacitor combinations. Table 2 shows the index of test result figures to port-to-port configurations.
5
It is understood that this piggy-back arrangement is not practical from a manufacturing point of view. However, it does serve to demonstrate the best possible performance due to the least possible inductance.
Table 2 S21 Port to Figure Definitions (.01uf and 10 pF Caps) S21 Ports Figure Number 1-to-8 2-to-8 3-to8 6-to-8 7-to-8 2-to-15
Figure 15 Figure 16 Figure 17 Figure 18 Figure 19 Figure 20
The results show that at low frequencies, the S21 behavior is very similar to the case with only .01 uF capacitors. However, in the frequency range of 1000 to 1200 MHz, the increasing number of 10 pF capacitors had a significant effect and lowered the S21 parameter as more capacitors were added. There seemed to be little improvement after 33 capacitors were added, indicating that all 99 positions were not necessary.
Quantity of Distributed Decoupling Capacitors (.01uf and 22pf) The 10 pF capacitors were then replaced with 22 pF capacitors to determine the effect on the high frequency performance of S21. For this set of experiments, the test PC board was completely populated with .01 uf capacitors (all 99 locations had a .01 uF capacitor, regardless of the presence of a 22 pF capacitor or not). The 22 pF capacitors were again placed in piggy-back fashion on top of the .01 uF capacitors. This resulted in a low-as-possible inductance between the two different values of capacitor.6 This set of experiments was again repeated for a number of different port-to-port combinations, and with a number of different configurations with varying amounts of capacitor combinations. Table 3 shows the index of test result figures to port-to-port configurations.
Table 3 S21 Port to Figure Definitions (.01uf and 22 pF Caps) S21 Ports Figure Number 1-to-8 2-to-8 3-to8 6-to-8 7-to-8
Figure 21 Figure 22 Figure 23 Figure 24 Figure 25
The results show that at low frequencies, the S21 behavior is very similar to the case with only .01 uF capacitors. Some small effect was observed in the 1000+ MHz frequency range, and at a lower frequency than the similar effect with 10 pF capacitors (as expected since the capacitance value increased), but the effect was not as significant as the 10 pF case. Note that the case with only .01 uF capacitors is plotted (again) on these figures as a reference in a heavy line-type.
6
It is understood that this piggy-back arrangement is not practical from a manufacturing point of view. However, it does serve to demonstrate the best possible performance due to the least possible inductance.
13
Figure 8
14
Figure 9
15
Figure 10
16
Figure 11
17
Figure 12
18
Figure 13
19
Figure 14
20
Figure 15
21
Figure 16
22
Figure 17
23
Figure 18
24
Figure 19
25
Figure 20
26
Figure 21
27
Figure 22
28
Figure 23
29
Figure 24
30
Figure 25
31
Quantity of Distributed Decoupling Capacitors (.01uf and 330pf) The 22 pF capacitors were then replaced with 330 pF capacitors to determine the effect on the high frequency performance of S21. For this set of experiments, the test PC board was completely populated with alternating .01 uf and 330 pF capacitors (all 99 locations had a .01 uF capacitor or a 330 pF capacitor, but not both values). This set of experiments was again repeated for a number of different port-to-port combinations. Figure 26 shows the test result of various port-to-port configurations. The results show that at low frequencies, the S21 behavior is very similar to the case with only .01 uF capacitors. However, the improved low frequency performance is increased to a higher frequency with the addition of the second value of capacitor (330 pF). Decoupling Around Board Edge Only A set of experiments were conducted with the decoupling capacitors only around the outer edge of the test board. Figure 27 shows the various S21 port-to-port measurements for the case with only .01 uF capacitors, and Figure 28 shows the results when 10 pF capacitors are added. Only the outer edge locations were populated with capacitors. There was no clear improvement with this configuration, and in fact, the fully populated board results were better, especially at low frequencies (below 400 MHz). Resistive Decoupling Around Board Edge A set of experiments were conducted with a resistor-capacitor combination placed around the outer edge of the test board. Figures 29 through 31 show the various port-to-port S21 measurement results for the case with only a 470 pF capacitor, a 470 pF capacitor and 20 ohm resistor, and a 470 pF capacitor and 2.2 ohm resistor. The plain .01uf capacitor case was also reploted on Figure 29 for reference. There was some improvement in the S21 at higher frequencies with the R-C decoupling combination. However, lower frequencies were significantly better with the fully distributed capacitor configuration.
EMISSIONS AROUND THE EDGE OF THE BOARD It was determined that the primary emissions from the test board was around the edge of the board, rather than off the top or bottom plane. Figure 32a and 32b shows the field scan from EMSCAN for a particular frequency. Each color indicates a 10 dB change in amplitude. A standing wave mode is clearly visible along the edge plot (Figure 32a),and the peak fields are much higher than the bottom plot (Figure 32b). A set of tests at a variety of frequencies (both resonant and non-resonant) confirmed this analysis.
CONCLUSIONS AND RECOMMENDATIONS A number of conclusions can be drawn from these results. The main conclusion is that decoupling capacitors should be distributed across the entire board to help reduce the board resonances. These board resonances are the main decoupling problem at high frequencies (above about 20 MHz). The actual resonant frequency will change as the number, or location, or value of decoupling capacitors is changed. Predicting the exact resonant frequencies is impossible (given the number of variables), and so it must be expected that any harmonic noise will be at a frequency where a resonance occurs (worst case). Therefore, the individual S21 peaks are not as important as the overall envelope of the S21 measurements.
32
Traditional values of capacitance (for example, .01 uF) make a significant improvement in the S21 at frequencies below about 200 MHz, but make only a little change at higher frequencies. This is mostly due to the self resonance of the capacitor, and the inductive nature of the capacitor above its natural resonant frequency. Therefore, high frequency capacitors should also be distributed across the board. The value of these capacitors will determine the frequency range over which they are effective. The majority of emissions from a two-plane structure is along the edge of the board. Care should be taken to ensure that no large openings in the shielded enclosure exist near the edge of the board. The testing of these various configurations is very time consuming. Now that a good base of test data is available, this data should be used to validate a modeling technique, and then the models used to simulate the performance of various other decoupling configurations. One potential configuration that shows promise is to combine the resistor-capacitor edge termination with ‘regular’ distributed decoupling capacitors. It is quite possible that this combined approach will allow the distributed capacitor approach to use less capacitors and thus same cost and space on the board.
33
Figure 26
34
Figure 27
35
Figure 28
36
Figure 29
37
Figure 30
38
Figure 31
39
Figure 31A
Figure 31B
40