Noble Metals 978-953-307-898-4
283 44 21MB
English Pages 426 Year 2011
00 preface_Noble Metals......Page 1
Part 1_Principles......Page 11
01 Dielectric Screening Properties and Many Body Effects in Molten Salts......Page 13
Part 2_Resource......Page 43
02 Pb Isotope Signatures of Polymetallic (Au-Cu-Zn) Deposits of the SW Amazonian Craton and Their Relation to Crustal Evolution......Page 45
03 Distribution of Precious Metals During the Reducing Pyrometallurgical Processes of Complex Copper Materials......Page 57
04 New Technology for Recovery of Gold and Silver by Pressure Cyanidation Leaching and Electrocoagulation......Page 81
Part 3_Novel Fabrication and Application......Page 105
05 Nanolithography in the Evanescent Field of Noble Metals......Page 107
06 Synthesis and Characterization of Noble Metal Nanowires......Page 123
07 Organic–Inorganic Mesoporous Silica Nanotube Hybrid Anodic Alumina Membranes for Ultrafine Filtration of Noble Metal Nanoparticles......Page 139
08 Atomic Layer Deposition of Noble Metals – New Developments in Nanostructured Catalysts......Page 169
09 New Technology for the Synthesis of New Materials Based on Cellulose and Sorption of Noble Metals......Page 189
10 Precise Temperature Measurement Using Noble Metal Thermocouples......Page 217
Part 4_Advance Catalyst......Page 233
11 Nano/Micro-Patterning of Semiconductors by Site Selective Chemical Etching Using Noble Metals as Catalyst......Page 235
12 Organic Molecules on Noble Metal Surfaces: The Role of the Interface......Page 259
13 The Effect of Addition of ppm-Order-Pd to Fe-K Catalyst on Dehydrogenation of Ethylbenzene......Page 297
14 Role of Precious Metal Catalysts......Page 311
15 Organic Aqua Regia: Discovery, Fundamentals, and Potential Applications......Page 345
16 Alloying Effect in Low Loaded Rh Catalysts Supported on High Surface Area Alumina on Their Activity in CH4 and NO Decomposition......Page 363
17 Electrooxidation as a Pretreatment Process Before Cyanidation......Page 379
Part 5_Application in Biosystem......Page 399
18 Green Synthesis of Noble Metal (Au, Ag, Pt) Nanoparticles, Assisted by Plant-Extracts......Page 401
19 Nobel Metal Nanoparticles in Bio-LED......Page 419
Blank Page......Page 10
Blank Page......Page 9
Recommend Papers


![Man and Metals [2]](https://ebin.pub/img/200x200/man-and-metals-2.jpg)


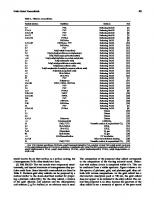
![The Metals Red Book, Volume 2: Nonferrous Metals (Metals Data Book Series) [1st ed.]
0969642814, 9780969642817](https://ebin.pub/img/200x200/the-metals-red-book-volume-2-nonferrous-metals-metals-data-book-series-1stnbsped-0969642814-9780969642817.jpg)

File loading please wait...
Citation preview
NOBLE METALS Edited by Yen-Hsun Su
Noble Metals Edited by Yen-Hsun Su
Published by InTech Janeza Trdine 9, 51000 Rijeka, Croatia Copyright © 2011 InTech All chapters are Open Access distributed under the Creative Commons Attribution 3.0 license, which allows users to download, copy and build upon published articles even for commercial purposes, as long as the author and publisher are properly credited, which ensures maximum dissemination and a wider impact of our publications. After this work has been published by InTech, authors have the right to republish it, in whole or part, in any publication of which they are the author, and to make other personal use of the work. Any republication, referencing or personal use of the work must explicitly identify the original source. As for readers, this license allows users to download, copy and build upon published chapters even for commercial purposes, as long as the author and publisher are properly credited, which ensures maximum dissemination and a wider impact of our publications. Notice Statements and opinions expressed in the chapters are these of the individual contributors and not necessarily those of the editors or publisher. No responsibility is accepted for the accuracy of information contained in the published chapters. The publisher assumes no responsibility for any damage or injury to persons or property arising out of the use of any materials, instructions, methods or ideas contained in the book. Publishing Process Manager Alida Lesnjakovic Technical Editor Teodora Smiljanic Cover Designer InTech Design Team First published February, 2012 Printed in Croatia A free online edition of this book is available at www.intechopen.com Additional hard copies can be obtained from [email protected]
Noble Metals, Edited by Yen-Hsun Su p. cm. ISBN 978-953-307-898-4
Contents Preface IX Part 1 Chapter 1
Part 2
Principles
1
Dielectric Screening Properties and Many Body Effects in Molten Salts 3 Shigeki Matsunaga, Takahiro Koishi, Masatoshi Saito and Shigeru Tamaki Resource 33
Chapter 2
Pb Isotope Signatures of Polymetallic (Au-Cu-Zn) Deposits of the SW Amazonian Craton and Their Relation to Crustal Evolution 35 Mauro C. Geraldes
Chapter 3
Distribution of Precious Metals During the Reducing Pyrometallurgical Processes of Complex Copper Materials 47 Leandro A. Voisin
Chapter 4
New Technology for Recovery of Gold and Silver by Pressure Cyanidation Leaching and Electrocoagulation 71 José R. Parga, Jesús L. Valenzuela and José A. Díaz
Part 3
Novel Fabrication and Application 95
Chapter 5
Nanolithography in the Evanescent Field of Noble Metals 97 Yong Yang, Guanxiao Cheng, Shaolin Zhou, Lixin Zhao and Song Hu
Chapter 6
Synthesis and Characterization of Noble Metal Nanowires 113 Dragos-Pinzaru Oana-Georgiana, Dumitru-Daniel Herea and Horia Chiriac
VI
Contents
Chapter 7
Organic–Inorganic Mesoporous Silica Nanotube Hybrid Anodic Alumina Membranes for Ultrafine Filtration of Noble Metal Nanoparticles 129 Sherif A. El–Safty and Nguyen Duc Hoa
Chapter 8
Atomic Layer Deposition of Noble Metals – New Developments in Nanostructured Catalysts Junling Lu, Yu Lei and Jeffrey W. Elam
Chapter 9
Chapter 10
Part 4
159
New Technology for the Synthesis of New Materials Based on Cellulose and Sorption of Noble Metals 179 Vaso Bojanić and Miomir Pavlović Precise Temperature Measurement Using Noble Metal Thermocouples 207 Yasser A. Abdelaziz Advance Catalyst
223
Chapter 11
Nano/Micro-Patterning of Semiconductors by Site Selective Chemical Etching Using Noble Metals as Catalyst 225 Sachiko Ono and Hidetaka Asoh
Chapter 12
Organic Molecules on Noble Metal Surfaces: The Role of the Interface 249 Maddalena Pedio, Cinzia Cepek and Roberto Felici
Chapter 13
The Effect of Addition of ppm-Order-Pd to Fe-K Catalyst on Dehydrogenation of Ethylbenzene 287 Ryo Watanabe, Yasushi Sekine, Masahiko Matsukata and Eiichi Kikuchi
Chapter 14
Role of Precious Metal Catalysts 301 Takashiro Muroi
Chapter 15
Organic Aqua Regia: Discovery, Fundamentals, and Potential Applications 335 Wei Lin
Chapter 16
Alloying Effect in Low Loaded Rh Catalysts Supported on High Surface Area Alumina on Their Activity in CH4 and NO Decomposition 353 Patrick Da Costa, Jarosław Dutkiewicz, Valerio Choque, Narcis Homs, Paweł Kornelak, Mieczysława Najbar, Agnieszka Pietraszek, Pilar Ramirez de la Piscina and Janusz Sobczak
Contents
Chapter 17
Part 5
Electrooxidation as a Pretreatment Process Before Cyanidation 369 Fatma Arslan Application in Biosystem
389
Chapter 18
Green Synthesis of Noble Metal (Au, Ag, Pt) Nanoparticles, Assisted by Plant-Extracts 391 Victor Sanchez-Mendieta and Alfredo Rafael Vilchis-Nestor
Chapter 19
Nobel Metal Nanoparticles in Bio-LED 409 Yen-Hsun Su, Sheng-Lung Tu and Wei-Min Zhang
VII
Preface This book introduces a new concept around the organization and development of noble metal. Noble metals are popularly used across the world. This book contains 19 contributions on the subject. The first chapter contributed by Professor Matsunaga deals with the principles of noble metals, the dielectric screening properties and many body effects of noble metal. The second chapter written by Dr. Geraldes deals with noble metal as a resource and its polymetallic deposition. Then the distribution of precious metals is reviewed by Professor Aravena. The new technology for recovery is written by Professor Valenzuela. There is discussion of the novel fabrication and application of noble metals. Dr. Yang presents the nanolithography of noble metals in the evanescent field. Dr. DragosPinzaru, reviews the electrodeposition and characteristics of gold nanowires and silver nanowires. Professor El-Safty reports on noble metal-organic mesoporous silica nanotubes. Dr. Elam reviews the atomic layer deposition of noble metals. Dr. Bojanic discusses the new technology for the synthesis of noble metals. Then the precise measurement of temperature used with noble metal is described by Dr. Abdelaziz. The advanced catalyst of noble metal is also dealt with in this book. Professor Ono reviews the nano and micro patterning by using noble metals. The organic molecules on the noble metals’ surface are presented by Dr. Pedio. Dehydrogenation of ethylbenzene by adding the ppm-order-noble metal is described by Dr. Watanabe. The role of precious metal catalysts is reported by Mr. Muroi. The discovery, fundamentals and principles of aqua regia are reviewed by Mr. Lin. The alloying effect in low loaded Rh catalysts is reviewed by Professor Najbar. Electrooxidation as a pre-treatment process is reported by Professor Arslan. The final subject covered in the book is the noble metal in biosystem. Green synthesis of Ag and Au nanoparticles is presented by Dr. Sanchez-Mendieta. Professor Su reports noble metals in Bio-LED. Many thanks to my contributors for finding the time and energy to write their respective chapters. Thank you again. Yen-Hsun Su Department of Material Sciences and Engineering at National Dong Hwa University Taiwan
X
Preface
Part 1 Principles
1 Dielectric Screening Properties and Many Body Effects in Molten Salts Shigeki Matsunaga1, Takahiro Koishi2, Masatoshi Saito3 and Shigeru Tamaki3 1Nagaoka 2University
National College of Technology of Fukui Graduate School of Engineering 3Niigata University Japan
1. Introduction The dielectric screening properties in molten salts have been a matter of particular interest. There is a close relation between the dielectric screening and the charge fluctuation of the constituents of the substances. The charge-charge structure factor, or SZZ(q) (Hansen & McDonald, 1986), indicates the charge fluctuation in a molten salt, which can be easily obtained by the linear transformation from their partial structure factors. The dielectric screening function, or (q), of a mono-valent molten salt has been represented by SZZ(q) as follows, 1 / q 1 {4e 2 n S ZZ q / q 2 }
(1)
where =1/kBT and n is the number density of constituent ions (Hansen & McDonald, 1986). On the other hand, the partial structure factors of various molten salts have been experimentally obtained by applying a combination of different diffraction methods, e.g. X-ray and neutron diffraction, to the same molten salts. Therefore, SZZ(q) of molten salts are obtainable by experiment from their partial structure factors (Saito et al, 1999). Several attempts have been made at deriving the dielectric screening functions from the experimental structure factors and Eq. (1). However, the obtained results indicate a negative sign in the small q region. This fact shows the difficulty in the appropriate explanation of the results, because (q) should be positive in the meaning of the potential screening. In this situation, we have proposed the new equation of (q) and SZZ(q) in molten salts which formula is different from Eq.(1). In order to test the new theory, we have applied it to molten alkali-halides (Koishi et al, 2007) and noble metal halides and their mixtures (Matsunaga et al, 2007, 2008, 2011). In this book chapter, firstly, we summarize the re-examination of the theory, and the derivation of the alternative expression of the dielectric function. Then, we wish to show the application of the theory to the molten salts; alkali halides NaCl, RbBr, noble metal halides AgBr, CuBr, and mixture AgBr-AgI. AgBr-CuBr system will be treated in the
4
Noble Metals
context of the many body effect. The extension of the theory to the polarizable ion model will also been discussed with the application to CuI and CsAu melt.
2. Theoretical background of dielectric screening The theory of the dielectric screening effect in molten salt has been re-examined in relation with the charge-charge structure factor in our previous work (Koishi et al, 2007; Matsunaga et al, 2007, 2008, 2011). In this chapter, for the readers’ benefit, we summarize the theoretical back ground of the charge-charge structure factor firstly, then the derivation of the new expression of the dielectric function in relation with the dielectric screening. 2.1 Charge-charge structure factors in molten salts
We consider a typical binary molten salt system AB. NandNstand for the number of ion species + and -. With the total number of particles N, the concentration of species is expressed as xν = N/N = 0.5. The densities of particles are n = n = n0 = n/2 and n = N/V, where V is the volume of the system. The effective charges of ions are |z = |z= z. The charge-charge structure factor, SZZ(q), defined by Hansen-McDonald is useful representation for charged fluid, which is written as follows (Hansen & McDonald, 1986), S ZZ q q Zq Z /N z z S q
(2)
where S(q) is a partial structure factor, i.e. the Fourier transformation of the pair distribution function of ion around ion in r-space, g(r). S(q) is defined as, Sv (q ) x v
nx v x (sinqr / qr ){(ɡ v r 1)} 4r 2 dr
v
(3)
0
S(q) and ɡ(r) directly reflect the ionic configuration and are easily obtainable from neutron diffraction experiment or molecular dynamics simulation. Using ɡ μ(r) ( ,μ= +,-), Szz(q) is given by,
S zz (q) 1 (n / 2)(sinqr / qr){(
(r) 1) (
(r) 1) 2(
(r) 1)} 4 r 2 dr
(4)
0
On the other hand, the concentration-concentration fluctuation in r-space ɡcc(r) defined by Bhatia-Thornton representation is written as follow (Bhatia & Thornton, 1970),
ɡ cc r x 2 x 2 [(ɡ r 1) (ɡ r 1) 2(ɡ r 1)] 1 / 16 ɡ r 1 ɡ r 1 2 ɡ r 1
(5)
Corresponding to ɡcc(r), the concentration-concentration structure factor Scc(q) is defined as follows, Scc (q) x x n (sinqr / qr)ɡ cc (r) 4 r 2dr
1 / 4 n (sinqr / qr)ɡ cc (r) 4 r dr
0
2
0
(6)
5
Dielectric Screening Properties and Many Body Effects in Molten Salts
Inserting (5) into (6) and using (4), we have,
S zz q 4 S cc q
(7)
Using the formulae obtained in this section, the dielectric screening functions in terms of Szz(q) will be shown in the next section. 2.2 Dielectric screening function expressed in terms of Szz(q) In order to derive the dielectric screening function, we will consider the same molten salt system considered in the preceding section. If a charge eρext(r) were introduced from outside into this system at the position r, then there occurs an induced charge eρind(r) at its position. Therefore we have the following Poisson equations in the electrostatic unit, divD r 4e ext r
(8)
divE r 4e ext r ind r
(9)
where D (r) and E(r) the electric displacement and the electric field, respectively. The electric potential (r) due to this external charge density is given by E r grad r
(10)
Using ( 9 ) we have
2 r 4eext r /
4e ext r ind r 4eext r 1 {ind r / ext r }
(11) (12)
where ε is the dielectric constant, but it may be extended to an isotropic r-dependent term written as ε(r). In their text book, Hansen and McDonald took partly ε(r) = 1 for the dielectric function in molten salts and obtained the formula expressed as shown in Eq. ( 1 ). Now we can express each quantity ε(r), Fourier representations,
(r) and ρext(r) in this equation as the following
r q q e iq . r , r q q e iq . r , ext r q ext q e iq . r
and
ind r q ind q eiq . r
(13)
Putting some of these into equation (11) and taking r = 0, we have
q 2 q q 4eext q
where A(q) = {Ax(q), Ay(q), Az(q)}. And we assume that expressed as ε(q).
(14) (q) is isotropic, which is
6
Noble Metals
Since eρind(r) is a charge fluctuation by the insertion of the external charge eρext(r), it might be expressed in the following form, by using the linear charge response function zz(q), ind q zz q e q
Based on the fluctuation dissipation theorem, follows,
(15)
zz(q)
is expressed in terms of Szz(q) as
zz q nS zz q
(16)
Compare equations (11) and (12), the inverse dielectric function 1/ (q) is expressed as follows,
1 / q FT divE r /FT divD r {q· E q } /{q· D q } 1 {ind q / ext q } (17)
where FT means the Fourier component. Putting (14) and (15) into (17), and using (16), we have
1 / q 1 4e 2 zz q / q q 2 1 4e 2nS zz q / q q 2
or
1 / q 1 / 1 s 2 / q 2 S zz q
(18)
(19-a)
where
s 2 4e 2n
(19-b)
Equation (19-a) is resulted from an isotropic configuration of surrounded ions, which condition can be satisfied by a symmetric configuration in the short range region in the molten salt that consists of almost perfectly ionized ions such as in molten NaCl and CsCl. If the ions’ configuration deviates extremely from an isotropic one, which can be, for instance, seen in molten CuI in which the oscillation of ɡ Cu-I(r) for the distance r coincides basically with that of ɡ Cu-Cu(r) (Waseda et al.,2000), then the dielectric screening may include some anisotropic effect and the application of equation (19-a) becomes insufficient. We will discuss this point in the later section. A rather simplified revision for such a case is the insertion of a parameter δ into equation (19-a) defined as,
1 / q 1 / 1 s 2 / q 2 S zz q
(20)
Magnitude of δ may be in the range of 0 10A-1, we have usually Szz(q) ≃ 1 and then
1 / q 1 / 1 s 2 / q 2
(21)
Dielectric Screening Properties and Many Body Effects in Molten Salts
7
On the other hand, the inverse dielectric function in the long wavelength limit is already well known by the theory of classical one component plasma (Hansen & McDonald, 1986; March & Tosi, 1976). Starting from the continuity equation relating to the charge and taking Fourier transforms under the condition of long wavelength limit, the relation between ρind(q) and ρext(q) is expressed as follows,
ind q ext q / 1 q 2 / s 2
where
s 2 4e 2 n 2 T
(22)
(23)
here T being the isothermal compressibility and n = 2n0 = n+ + n-. If an external point charge ze is put at the position r, then we have the well-known Thomas-Fermi type screening potential by using equation (22), which indicates that the inverse dielectric function near the long wavelength limit is written as follows,
1 / q 1 / 1 s2 / q 2
(24)
It is interesting that the inverse dielectric function 1/ε(q) in its higher q-region and very lower q-region is expressed by a similar form as shown in equations (21) and (24), although their screening constants are quite different. In the intermediate region, 1/ε(q) exhibits an oscillating behavior due to the effect of Szz(q), as a logical consequence. Using (6) and (7), Szz(q) is given by
Szz (q) v zv z Sv q 1 8n
sin qr ɡ cc (r )4 r 2 dr qr 0
(25)
where we took that the ionic charges are equal to the ionic valences as z+ =- z- = z = 1. Therefore 1/ε(q) is converted to 1 (q )
1 / q {1 8n (sin qr / qr ) ɡ cc (r )4 r 2 dr }
2 s
1
(26)
2
0
Under the assumption of δ= 1, equation (19) is useful for deriving the inverse dielectric function, 1/ε(q), from experimental results for the partial structure factors and also equation (25) is applicable for deriving 1/ε(q) by a computer simulation.
It is apparent that equation (24) is equal to zero at q=0. And therefore, the inverse dielectric function 1/ε(q) has the following relation for any positive values of Szz(q), 0 1 / q 1
(27)
At this point, it should be stressed that the validity of Eq.(20) and Eq.(21) is also confirmed by this fact in the meaning of screening; 1/ε(q) remains positive for all positive q value. It is therefore possible to derive the inverse dielectric function 1/ε(q) if Szz(q) or
8
Noble Metals
ɡcc r) are known by either the experimental method or computer simulation under the assumption of δ= 1. In the following sections we will show several results for 1/ε(q) by using experimental Szz(q) and simulated ɡcc r). 2.3 Screening for Coulomb potential in a molten salt
In a molten salt having the charges of z+ =- z- = 1, the screened potential between a cation and an anion, +-sc(r), may be divided into two parts as follows, sc r sc rep r sc at r
(28)
Here +-sc rep(r) is the repulsive potential influenced by a small amount of screening effect in the short range distance between cation and anion, and +-sc at(r) is the attractive screened potential in the long range. The utilization of equation (19-a) for the repulsive potential seems not to be a good and enough approximation as the screening effect, because the application of linear response theory for a highly nonlinear functional form cannot give any good approximation. Therefore, equation (16) is a poor approximation for the repulsive potential because of its highly nonlinear functional form, and therefore the screening effect for the direct repulsive potential should be treated in a different way. A simple consideration for the screening effect for the repulsive potential is the introduction of parametric multiplier, hereafter taken as α, which can be multiplied to the well-known formula of the repulsive potential as a multiplicand. Then the screened repulsive potential may be written as follows, sc rep r rep r
(29)
where +-rep(r) is the bare repulsive potential. On the other hand, the attractive screened potential +-sc at(r) is effectively screened by the existence of other ions, although its barepotential may be mainly ascribed to the form of Coulomb interacting potential. Let put an ion of positive point charge at the origin. Then another ion of negative point charge in the region of attractive Coulomb potential at r feels the following potential, at r e 2 / r
(30)
Therefore, the screened attractive potential in q-space is written as follows, sc at q 4e 2 / q q 2
(31)
The numerical result for +-sc at(r) is given by the inverse Fourier transformation FT{ +- sc at (q)}. The repulsive potential +-rep(r) which is often approximated by either the Born-Mayer type potential or the inverse function of rn ( n ≤ 12 ). That is, rep r A·exp br
or
rep r B / r n
(n≤12)
(32)
where A, b, B and n are constants. Equation (28) is therefore converted to sc r A exp br FT sc at q
(33-a)
9
Dielectric Screening Properties and Many Body Effects in Molten Salts
or
sc r B /r n FT sc at q
In the region of Szz(q)~1, equation (21) is applicable. If =1, then we have,
sc at q 4e 2 / q 2 q 2 / q 2 s 2 4e 2 / q 2 s 2
(33-b)
(34)
This equation is easily converted to the r-dependent expression as
sc at r e2 /r exp sr
(35)
The screening parameter s is exactly equal to the inverse of the Debye screening length. Using (32) and (35), the effective potential of mean force between cation and anion in the region of Szz(q)~1 is then expressed as, sc r A·exp br e 2 / r exp s r
or
(36-a)
sc r B /r n e 2 /r exp sr
(36-b)
It is emphasized that the inverse dielectric function 1/ (q) as the screening effect can be multiplied onto the bare attractive inter-ionic potential between two ions in the q-space, and the screening parameter α is also multiplied onto the repulsive potential in r-space, in order to obtain the effective screened potential 2.4 Equivalency between the screened pair potential and the potential of mean force
We have obtained an asymptotic form for the screened attractive potential, as shown in Eq. (35). The factor exp(-sr) is familiar in the elementary Debye-Hückel theory and the corresponding pair distribution function ɡ +-(r) is given by, ) = exp {
exp − )}
(37)
In this section, we will prove that this asymptotic form of the screened attractive potential +- sc at (r) and the potential of mean force U+-(r) defined by the formula of
r exp U r / k T
(37-a)
B
are equal to each other at the long distance of r, by using the Ornstein-Zernike equation. Putting a cation 1 at the origin and an anion 2 at the position r, and furthermore the third ion 3 at the position r’, then we have an approximate Ornstein-Zernike equation as follows, −
)=−
)+
| −
|)ℎ
′)
(38)
where c+-(r) is the direct correlation function between cation and anion, and h- -(r’) is equal to (ɡ - -(r’) - 1). Hence we have inferred that the third ion represented by 3 is mainly another neighboring anion located around the cation at the origin, because the ion 3 is located at a
10
Noble Metals
closer position to the origin, which means that its sign is negative. By Fourier transformation, Eq.(38) is converted to the following form, )
)=
)
−
)
)
(39)
On the other hand, it is well known that the direct correlation function c+-(r) has a approximate form for large r, as follows, )≅−
)
(40)
The Fourier transformation of Eq.(40) is immediately written as,
Putting (41) into (39), we have )≅
)≅−
)
){ + ℎ
(41)
)
)} =
)
(42)
Apart from a quantitative disagreement with either the experimental result or simulated one, S--(q) may be analogically expressed as follows, by using the random phase approximation (March and Tosi, 1976),
)=
)
Here the pair potential between anions in its Fourier transformation approximately expressed as 4e /q , and then we have,
And finally we have,
)=− )=−
exp − )
(43) --(q)
is also
(44)
(45)
Therefore, +-sc at (r) described in Eq. (35) and the potential mean force U+-(r) are equal to each other at the long distance of r. The expression of +-sc at(r) is certainly not rigorous, and therefore there is inevitably a minor discrepancy between +-sc at (r) and U+-(r) in the numerical agreement. However, in an approximate sense, both functions are equivalent. In fact, the screened potential between the centered cation 1 and neighboring anion 2 locating at an appropriate distance, is expressed in terms of the form of direct interacting potential multiplied by the inverse dielectric function 1/(q). The factor 1/(q) is evidently given by the force acting on the centered cation from all other neighboring ions represented by 3. Therefore, the screened potential is physically equivalent to the potential of mean force. 2.5 Deviation from Nernst-Einstein relation
In this section, we wish to deal with a practical application of the potential of mean force U+(r) in molten salts. The deviation, Δ, from the Nernst-Einstein relation in nomovalent molten salts is defined as follows,
Dielectric Screening Properties and Many Body Effects in Molten Salts
ne 2 /k B T D D 1
11
(46)
The partial conductivities for cation and anion, σ+ and σ-, and the diffusion constants D+ and D- were already derived before (Koishi & Tamaki, 2005). Taking these results, we have
1 1 – BR 2 / 0 / 1 / 1 /
where
0 n 2 / r 2 2 /r / r ɡ r 4r 2dr
0
n / 2 [ 2 / r 2 2 / r / r ɡ r
2 / r 2 / r / r ɡ r ]4r dr
2
0
2
2 2 / r 2 2 / r / r ɡ r ]4r 2 dr
and
0
(48)
(49)
2
n / 2 [ 2 / r 2 2 / r / r ɡ r
(47)
BR 4n / 3k B T r / r ɡ r r 3dr
(50)
(51)
d
where ij(r) is an effective inter-ionic potential between ions i and j. ɡij(r) is the partial pair distribution function between ions i and j as defined in the previous section. In this equation, we can approximate that d is equal to the hard-core contact distance between cation and anion, if both ionic sizes are rigid. However, this assumption may not be always valid for the heavier atoms. Here, we will use the first maximum position of ɡ+-(r) as the distance of ionic contact. The quantity ΔBR is essentially caused by an asymmetric distribution of the surrounded ions around the centered ion under an applied external field; it was obtained by Berne and Rice (Berne & Rice, 1964), and recently certified by the present authors in a different way (Koishi & Tamaki, 2005). Since it was found that values of α0, α+ and α- are numerically close to one another, we can take Δ~ΔBR as the deviation from Nernst-Eistein relation in a molten salt. The effective potential +-(r) shown in Eq.(48) is equal to the potential of mean force acting on the ion at the origin from other ion of opposite sign located at the distance r, and therefore it is possible to use the potential of mean force U +-(r), instead of +-(r). Therefore, equation Eq.(51) is converted to,
BR 4n / 3k B T U r / r ɡ r r 3dr 4n / 3 ( ɡ r / r) r 3dr
d
d
(52)
12
Noble Metals
We can basically calculate the deviation from Nernst-Einstein relation, by using Eq.(52), if ɡ+-(r) is experimentally obtained. However, because of the presence of the r term in the integrand, convergence at large r is slow and full information on the approach of ɡ+-(r) to unity is necessary. At the present stage, ɡ+-(r)’s in molten salts being satisfactory this requirement seem to be rare.
3. Application of the theory to the real systems In this section, the new theory of the dielectric screening is applied to the real systems to test the validity of the theory utilizing the structure factors obtained by simulation or experiment. The theory is applied to molten alkali-halides (Koishi et al., 2007), and noble metal halides (Matsunaga et al, 2007, 2008, 2011). We summarize the results in the following subsections. Application to molten AuCs is also mentioned. 3.1 Inverse dielectric function in molten NaCl obtained by computer simulation
It is not necessary to apply the dielectric function for the computer simulation, because the simulation procedure itself involves automatically the screening behaviors and only the utilization of appropriate bare inter-ionic potentials is required, although the ion’s charges are not always equal to their valence ones. In fact, the effective charge z* used in computer simulation is sometimes smaller than the ion’s valence number because of a partly covalent character of the constituents. In the cases of MD or Monte-Carlo simulations, the effective charge in molten CuI is taken to be 0.6 (Waseda et al., 2000). In this section, we derive the charge-charge correlation function Szz(q) and the inverse dielectric function 1/(q) of molten NaCl by using MD simulation. The well-known Tosi-Fumi potentials are used as the bare inter-ionic potentials. The simulated ɡ++(r), ɡ--(r) and ɡ+-(r) in the range of r < 8Å agreed with the experimental results (Edwards et al., 1975) and indicate a good isotropic configuration suggesting = 1 and these quantities were inserted into Eq.(4). The obtained Szz(q) of molten NaCl is shown in Fig.1, which agreed with that shown in the literature (Hansen & McDomald,1986). Putting this Szz(q) into (19-a), we have 1/(q) in molten NaCl as shown in Fig.1. Using the obtained 1/(q) and taking α=0.5 as a trial screening factor for the repulsive potential and (33-a), the estimated screened potential between cation and anion is shown in Fig.2. So far the obtained screened potential is, more or less, close to the mean force U+-(r). A difference between +-sc(r) and U+-(r), which are shown in Fig.2, may be caused by several reasons. One of them is that the inverse dielectric function is only applicable for a gradual slope of attractive potential and the screening for the repulsive part is restricted to a qualitative way as multiplying the parameter α. This treatment may diminish more or less, the exactness of the result. The other reason is that we have used Tosi-Fumi potential for MD simulation in order to obtain ɡ+-(r). Even though the obtained ɡ+-(r) by this simulation is close to the experimental one in the range r < 8Å, we are not sure of the possibility of the agreement in the range of the distance beyond 8Å, because the decaying tendency of ɡ+-(r) obtained by simulation is slow, indicating a remarkable oscillation up to r = 15Å. Usually it is hard to obtain any visible oscilation in the experimental ɡ+-(r) beyond the distance of r ~ 10Å. It is known that a Monte-Carlo simulation using the deformed dipole model ( Gartrell-mills & McGreevy, 1989), which makes it possible to have a more rapid decaying for ɡ+-(r), gives better agreement for the experimental results of molten CsCl ( Locke et al., 1985). These
13
Dielectric Screening Properties and Many Body Effects in Molten Salts
facts suggest that the second and third peaks of U+-(r) obtained from simulated ɡ+-(r) should be diminished to some extent in the range of r > 10 Å. At the present stage, the obtained +-sc (r) is inevitably somewhat numerically different from U+-(r). By inserting the calculated +-sc (r) instead of U+-(r), however, the obtained ɡ+-(r) is semi-quantitatively close to the simulated one, as shown in Fig.2.
Fig. 1. SZZ(q) of molten NaCl obtained by MD (left), 1/(q) of molten NaCl (right),
Fig. 2.
+-sc(r)
and U+-(r) (left), ɡ+- r) and exp(-
+-sc (r)/kBT) (right)
of molten NaCl.
3.2 Inverse dielectric function for molten RbBr obtained from experimental S(q)
In this section we will show 1/ε(q) of molten RbBr, using the experimental partial structure factors. The experimental data for S μ(q) are adopted from the articles observed by Saito et al.(1999). In Fig.3, the experimentally obtained Szz(q) and the corresponding
14
Noble Metals
1/ε(q) are shown. As seen in these figures, the larger Szz(q) rather than unity yields a relatively small 1/ε(q). This fact is physically plausible, because a large charge fluctuation at the position of r around a centered ion located at the origin indicates a larger distribution of ions of opposite sign at r, which naturally causes a large screening in comparison with that of an averaged distribution of ions. Using available repulsive potential for molten RbBr ( Saito et al., 1999), we have calculated the screened potential by putting the appropriate 1/ε(q) into equation (33-a). The results are shown in Fig.4 under the condition of α=1. As seen in Fig.4, the screened inter-ionic potential between Rb+ and Br- ions, +-sc (r) has deeper minimum in comparison with the potential of mean force, U+-(r), contrasting with the tendency of molten NaCl starting from the partial structure factors obtained by MD simulation. The most likely reason for this discrepancy seems to be an experimental uncertainty for partial structure factors in their small-q regions. This uncertainty gives, in due course, a numerical error in the inverse dielectric function 1/ε(q) in the very small-q region, even though its magnitude is relatively small. On Fourier transformation, such a small uncertainty gives a remarkably large change in the screened inter-ionic potential. In fact, an artificial modification for the curve of 1/ε(q) in only the small-q region makes it possible to obtain a result similar to U+-(r).
Fig. 3. Experimental Szz(q) (left), and 1/ε(q) (right) of molten RbBr. 3.3 Dielectric screening properties in molten noble metal halide and their mixtures
In this subsection, we focuse on molten noble-metal halides, AgBr and CuBr (Matsunaga et al., 2008), and mixture AgI-AgBr system (Matsunaga et al., 2007). It is well known that the noble metal halides are the typical example of the superionic conductors, which is a group of substances that exhibits high values of ionic conductivity, while they are still in solid phase. The mechanism of high ionic conductivity in the superionic conductors has been widely investigated because of their novel physical behaviour and technological importance, e.g. solid state batteries, fuel cells, optical devices (see for example, Chandra, 1981). CuBr shows superionic conduction in its alpha phase, where copper ions statistically
Dielectric Screening Properties and Many Body Effects in Molten Salts
15
distribute around the bromine bcc cubic, and copper ions can move one site to another. However, AgBr has a rock salt structure in its solid state and does not exhibit superionic conduction until its melting temperature, though AgBr is also one of the noble metal halides. We have investigated the structural and transport properties of noble metal halide mixtures by molecular dynamics simulations (Matsunaga, 2003; Matsunaga & Madden, 2004; Matsunaga, 2005). In this subsection, we apply the new theory to molten AgBr, CuBr , and AgI-AgBr to examine the dielectric screening effect, because the screened potentials are the fundamental subject for the transport properties.
Fig. 4.
+-sc(r)
and U+-(r) (left), ɡ+-(r) and exp(-
+-sc (r)/kBT)
(right) of molten RbBr.
Fig. 5. SZZ(q) (left), and 1/ε(q) with 1/(1+(s2/q2)) for AgBr and CuBr (right).
16
Noble Metals
As mentioned before, Eq.(19-a) or Eq.(20) is useful to derive 1/ε(q) from the experimental partial structure factors. Eq.(3) is applicable to deriving 1/ε(q) from ɡ+- r) by computer simulation. For examples of 1/ε(q) for binary ionic melts, we will show the results of 1/ε(q) using experimental SZZ(q) for AgBr and CuBr (Saito et al., 1997; Saito et.al., 1999). As mentioned previously, SZZ(q) is related to structure factors and pair distribution functions by Eq.(2). In this case, the summation in Eq.(2) is taken for ion species Ag or Cu and Br. The obtained SZZ(q) for molten AgBr at 753K and CuBr at 810K are shown in Fig.5. We can see the significant first peaks in SZZ(q) at about 1.8Å-1 and 2.0 Å-1 for molten AgBr and CuBr, respectively. These peaks correspond to the oscillations of partial structure factors (Saito et al., 1997; Saito et.al., 1999). By substituting these SZZ(q) into Eq.(20), we can obtain the inverse dielectric function 1/ε(q). The calculated results are shown in Fig.5 with the calculated curve by Eq.(21) for comparison. It is clearly recognized that 1/ε(q) satisfies the condition 0 1/ε(q) 1. We can find the oscillatory features and the significant minimum at around 1.8 Å-1 and 2.0 Å-1 for AgBr and CuBr, respectively. These features are yielded by the form of SZZ(q)’s which have large maximum and oscillation. These results should be attributed to the effect that an ion in molten salts is estimated to be surrounded by ions of opposite sign, which yields the large charge fluctuation and screening effect.
Fig. 6. Screened potential for Ag-Br (left) and Cu-Br (right) with original one (bottom). Screened potentials are also shown with different scale to show their oscillatory feature (top). From above consideration, it seems interesting to obtain the screened potential between anion and cation, Ag+ or Cu+ and Br- in molten AgBr and CuBr. Besides, the experimental pair distribution functions between cation and anion, i.e. ɡBrAg(r) and ɡBrCu(r) are obviously different (Saito et al., 1997; Saito et.al., 1999). We adopt the potential by Rahman, Vashishta and Parrinello (RVP) (Parrinello et al., 1983), as bare inter-ionic interaction. The RVP type potential sets for i and j ions are written as, Vij r H ij / r nij z i z j e 2 / r – Pij / r 4
(53)
Dielectric Screening Properties and Many Body Effects in Molten Salts
17
where the third term is charge-dipole interactions. The adopted parameters are taken from literature (Tasseven et al., 1997; Stafford et al., 1990). The screened potentials of molten AgBr and CuBr are obtained by the procedure described in the previous sections. The results are shown in Fig.6. In the calculation, we adopt the value of as 0.50 and 0.40, and the value of as 0.1 and 0.05 for AgBr and CuBr, respectively. The reduction of the depth of potential by screening effect is obviously recognized in Fig.6. The characteristic oscillations are found in the screened potentials especially in molten CuBr, which may be caused by the charge fluctuation in the distribution of ions.
Fig. 7. ij(r) for AgBr (left) and CuBr (right) calculated using screened potential with that by experiment and by MD. To confirm the results of screened potentials between cations and anions, we calculate the pair distribution function ɡ+-(r) by the potential of mean force U+-(r), which is defined by Eq.(37-a), where we can take the screened potential +-sc(r) as U+-(r), because Eq.(37-a) is originally suggested by weak interacting materials. In the previous section, we have proved that +-sc(r) and U+-(r) are mathematically equivalent, being our argument based on the Ornstein-Zernike equation (Koishi et al., 2007). ɡ+-(r) are obtained by inserting the calculated +-sc(r) instead of U +-(r) into Eq.(37-a). They are shown in Fig.7, together with ɡ+-(r)’s obtained by experiment and molecular dynamics (MD) simulation. The first peaks of ɡ+-(r) almost agree well, though the oscillations in larger r region are not satisfactory reproduced. This fact may suggest that the screening effect is considerable especially in the small r region, i.e. about the distance to the first nearest neighbors. In other words, the first nearest neighbor ions have the main contribution to the screening effects in molten salts. Next, we apply the theory to molten AgI-AgBr as an example of a pseudo-binary system, in which ions are thought to be in considerable order. It is well known that silver iodide is one of the superionic conductors in its alpha phase, i.e. -AgI, in which silver ions statistically distribute around the iodine bcc cubic. On the other hand, AgBr has a rock salt structure in its solid state and dose not exhibit high conduction. We have investigated the
18
Noble Metals
effect of dissolution of AgBr into AgI on the structural and transport properties in superionic and molten phases by molecular dynamics simulations (Matsunaga, 2005). Accordingly it is interesting to discuss the dielectric screening effects in this system. We wish to show the result for 1/ε(q) by using SZZ(q) obtained by simulation. Though the consideration to this point is for the equi-charged binary salts, the theory is easily extendable to the equi-charged pseudo binary molten salts, e.g. AgI-AgBr, and Eq.(19-a) is also applicable to them. As mentioned in the previous section, SZZ(q) is related to structure factors and pair distribution functions as Eq.(2), SZZ q) = zzS q), where summation is taken for species Ag, Br and I. We derive 1/ε(q) from the structure factors obtained by molecular dynamics simulation. The procedure of the simulation is essentially same as the previous work (Matsunaga, 2005). The RVP type pair potential sets are used, which parameters are listed in the same reference. The I-Br interaction is estimated by the appropriate combination rule. The MD calculations are performed for Ag(BrxI1-x) (x=0.20) at 903K.
Fig. 8. SZZ(q) (left), 1/ε(q) and 1/{1+s2/q2} (right) for Ag(BrxI1-x) (x=0.20) at 903K.
Fig. 9. The screened potential between Ag and Br with original one (left bottom). The screened potential is also shown in different scale (left top). ij(r) calculated using screened potential with that obtained by MD (right).
Dielectric Screening Properties and Many Body Effects in Molten Salts
19
The obtained SZZ(q) at 903K is shown in Fig.8. We can see a significant peak in SZZ(q) at about 1.7Å-1 and a plateau around 4.0Å-1 corresponding to the oscillations of partial structure factors (Matsunaga, 2005). We have the inverse dielectric function 1/ε(q) by putting obtained SZZ(q) into Eq.(19-a), which is shown in Fg.8 with that calculated by Eq.(21) for =1 for comparison. It is clearly recognized that 1/ε(q) satisfies the condition Eq.(27). We can see the significant minimum at around 1.7Å-1 corresponding the large maximum of SZZ(q), which shows the large charge fluctuation. This fact may be attributed to the effect that an ion at the origin is supposed to be surrounded by ions of opposite sign at position r, which may yield the large charge fluctuation and screening effect. The discrepancy in the larger r region between ɡ+-(r)’s are attributed to the difference between +-sc(r) and U+-(r), which may be caused by several reasons, in addition to a margin of calculation error in Fourier transformation. One reason is that only the Coulomb attractive potential is used to derive +-sc(r) instead the attractive part of RVP type potential – Pij/r4 which is used for simulation. Another possible reason is that the non-symmetric structure in solid phase remains in molten phase, which may obstruct the screening effect in molten phase. In spite of above facts, however, it may be recognized that the calculated result for +-sc(r) so as to carry on the above treatment is physically significant, and the obtained results are obviously affected by screening effect. 3.4 Cation-cation interaction in noble metal halide mixtures
In the superionic phase of noble metal halides, the distributions of cations have been studied in detail. These studies have been executed mainly in the systems with one kind of cation, i.e. Cu+ or Ag+, that is supposed to be distributed mainly around the tetrahedral 12(d) site of halogen bcc lattice. However, according to the recent experimental study by NMR and X-ray diffraction, cations Cu+ and Ag+ are distributed mainly around the octahedral 6(b) site in the superionic phase of (AgxCu1-x)I, which is contradictory to the generally accepted view (Endo et al., 1999). Besides the interest on the basis of physical chemistry, there would be an advantage of practical application, because the pseudo-binary superionic conductor may lower the transition temperature to the superionic phase. These facts prompt us to investigate the superionic phase of noble metal halide mixture with two kinds of mobile cations. In the previous study (Matsunaga, 2009), we have carried out the molecular dynamics (MD) simulation to examine the structural properties of (AgxCu1-x)Br for x < 0.5 in its superionic phase as an example of the superionic conductor with two kinds of cations, Cu+ and Ag+. The MD results were quite noteworthy; the different distributions between Ag+ and Cu+ ions in superionic phase were detected. For xAg = 0.10, Cu ions are mainly distributed around the tetrahedral 12(d) site. On the other hand, the significant distribution of Ag ions around the octahedral 6(b) site can be seen. For xAg = 0.40, however, Cu ions are mainly distributed around the octahedral 6(b) site. Ag ions are also distributed around the octahedral 6(b) site, moreover their distribution is more enhanced than those in xAg = 0.10 (Matsunaga, 2009a). These results suggest that there is a concentration dependence in cation distribution for (AgxCu1-x)Br, which may affect the dynamical and thermodynamic properties of this system. In this subchapter, considering the circumstances mentioned above, as a continuous work (Matsunaga, 2011), we investigate the dynamical and thermodynamic properties of the superionic and molten phases of (AgxCu1-x)Br for x < 0.5 by MD. The essential procedure of MD simulations is same as our previous works (Matsunaga, 2009a, 2009b; Matsunaga &
20
Noble Metals
Tamaki, 2008a, 2008b). RVP type pair potentials are used. The used potential parameters are taken from literature (Stafford et al.,1990; Tasseven et al., 1997) The interactions between cations are obtained using the adequate combination rule. The used potential parameter sets are listed in the Table 1 in the previous paper (Matsunaga, 2009a). The concentration-concentration (C-C) structure factor is quite effective to clarify the structural features of the molten binary system, which have been obtained by the experiments (Bhatia & Thornton, 1970; Matsunaga et al., 1983). The C-C structure factor has also been extended to the multi component systems (Bhatia & Ratti,1977). In this subsection, the C-C structure factors will be evaluated to examine how the structural features in the superionic phase of the system (Ag1-xCu0x)Br will be observed in the molten phase. The procedure to obtain the multi component C-C structure factor is briefly summarized as follows. The partial structure factor defined by Faber and Ziman is expressed as, )=
+
ɡ
)−
)
)+
∙
(54)
where ɡij(r) is the pair distribution function, and i and j stand for the species of ions. The multi component C-C structure factor, Scicj(q), is defined as, )
=
∗
)
∗
)
(55)
Scicj(q) is related to the Faber-Ziman type structure factor aij(q) as,
Sci c j q ci c j a ij q - c a i q a j q c c a q ci i , j ci c j 1 ,ζ 1
(56)
where and also stand for the species of ions. is the number of the species. In the case of the ‘ideal’ mixture, Scicj(q)’s for the long wave length limit, q 0, are expressed as, ) =
− ),
) = −
≠
(57)
The obtained normalized Scicj(q)’s divided by | Sidcicj(0)| in the molten phase 76K above the liquidus are shown in Fig.10. The difference between ScAgcAg(q) and ScCucCu(q) can be seen in both figures. In Fig.10 for (Ag0.1Cu0.9)Br, the profile ScAgcAg(q)≃1 shows the weak interaction between Ag ions, thought the interaction between Cu ions and between Cu and Ag ions seems to be significant in ScCucCu(q) and ScAgcCu(q). The peaks in ScAgcAg(q) can be seen at about 3.6 and 1.8Å-1; in ScCucCu(q) at 4.9 and 1.8 Å-1; in ScAgcCu(q) at 3.6 and 1.8 Å-1 corresponding to the first and the second nearest neighbors, respectively. In Fig.10 for (Ag0.4Cu0.6)Br, the interaction between Ag ions seems to be somewhat enhanced in ScAgcAg(q), though the interaction between Cu ions is decreased. The interaction between Ag and Cu ions is still significant in ScAgcCu(q). The peaks in ScAgcAg(q) can be seen at about 3.7 and 1.8 Å-1; in ScCucCu(q) at 5.0 and 1.9 Å-1; in ScAgcCu(q) at 3.8 and 1.9 Å-1 corresponding to the first and the second nearest neighbors, respectively. The expression of Scicj(q) for the long wave length limit, q 0, is related to the correlation between the fluctuations ∆ci and ∆cj as follows: Sc i c j 0 N c i c j
(58)
21
Dielectric Screening Properties and Many Body Effects in Molten Salts
which has a physical meaning of an order parameter in the molten state (Bhatia & Ratti, 1977; Bhatia & Thornton, 1970). Scicj(0) is related to the thermodynamic quantities. In a ternary system, e.g. Sc1c2(0) is expressed as )=−
+
)
/
(59)
where D is the function of ωij. ωij’s are the pairwise interchange energies which are related to the excess free energy GE as follows: =
∑ ∑∝
(60)
Fig. 10. Scicj(q)/|Scicjid(0)| for (Ag1-xCux)Br, xCu=0.9 at 800K (left), xCu=0.60 at 765K (right). Though GE for molten (AgxCu1-x)Br is not available as far as we know, the expected values from the MD result in the superionic phase are |ScAgcCu(0)| > |SidcAgcCu(0)| for xCu =0.90, |ScAgcCu(0)| |SidcAgcCu(0)| for xCu =0.60. In other words, the phase separation tendency of Ag and Cu ions for xCu =0.90 , and the ordering tendency for xCu =0.60. This fact suggests that there is the concentration dependence of the interaction between ions, ωij, in molten phase. As stated so far, there is a concentration dependence in the dynamical and thermodynamic properties as well as the structural feature in the superionic and molten phases for (AgxCu1-x)Br, which suggests the many body effects and the short range interaction in the molten ternary system.
4. Polarizable ion model and dielectric screening effect To understand qualitatively and quantitatively the properties of molten salts such as the static and dynamical behaviour, theoretical and molecular dynamics simulation studies are indispensable. For this purpose, the main problem is how to define the appropriate pair-
22
Noble Metals
potentials for the system of one’s study. Needless to say, the properties of molten salts are, more or less, related with those of the solid phase. There are various ionic crystals; alkalihalides with rock salt structure which has ionic bond; zinc-blend (ZnS) type in which covalent and ionic bond coexist; superionic conductor of which a typical representative is AgI; etc. The constant efforts have been made for about 80 years to study the inter ionic potentials for these ionic crystals of various ionisation (Matsunaga & Tamaki, 2011). In this study, we will show how the theory of screened potentials is modified in connection with the recent development. The new theory will be applied to copper iodide for example. The numerical results will be discussed in comparison with those of experiment and molecular dynamics (MD) simulation. 4.1 Polarizable ion model
In recent years, studies have been developed on the viewpoint of the charge distribution change in a certain ion caused by approaching of surrounding ions. In 1996, Wilson et al. succeeded to perform MD to reproduce the experimental results of molten AgCl structure using new potentials introducing ion polarization. In 2006, Bitrián and Trullàs proposed the similar polarizable ion model to perform MD simulation in molten AgBr. In this case, Vashishta-Rahman (VR) type potential is adopted as the rigid ion model potential (Vashishta and Rahman, 1978), which is familiar in the study of super ionic conductor, expressed as follows, ij r
zi z j e 2 r
Pij H C ij Pij 6 4 0ij r 4 n r r r r
(61)
where, n=7 power term is adopted for the repulsive potential in the second term on the right hand side. The dipole-quadrupole interaction term is neglected, because it is smaller than the last two terms in Eq.(61). The feature of the polarizable ion model is that the chargedipole interaction or the last term in Eq.(61), Pij/r4, is expressed as a function of r, which may be the origin of its name ‘polarizable’. In the polarizable ion model, introducing the dumping function fab(r) which varies from 0 to 1, the dipole of ion a by the surrounding ion b is expressed as follows,
pa a 1 fab r z b e / r 2 2 b z a e / r 5 /{1 – (4 a b / r 6 )}
(62)
which means pa(r) diverges at rc6 = (4ab), where i is the polarizability of ion i. This singular point is called the polarization catastrophe distance. This divergence is ascribed to the fact that the iteration has been done disregarding that rij is required much longer than the distance between the positive and negative dipole charges. Therefore, strictly speaking, the equations of polarizable model are valid only in the case when the polarizability of the ion a or b is almost zero. In the molten state of Ag or Cu halide including super ionic conductor, e.g. AgI, AgBr, Ag2Se, Ag2Te, CuBr etc., the dipole moments of cations are considerably smaller than those of anions, hence rc6 ~ 0 (see, e.g. tables in Kittel,1996). Consequently, the condition + ~ 0 would be strictly applicable to the pair potentials +-(r) and ++(r). From the considerations based on these facts, the polarizable ion model has been applied to AgBr and AgCl (Bitrián and Trullàs, 2006 ; Wilson et al., 1996).
Dielectric Screening Properties and Many Body Effects in Molten Salts
23
4.2 Evaluation of polarizable ion model in the previous section
The theory that Bitrián and Trullàs (2006) have developed is effective to revise the rigid ion model to some extent. However, as we have pointed out in the previous section, such dispersion called the polarization catastrophe is ascribed to the fact that the iteration has been done disregarding that the inter ionic distance rij is required to be much longer than the distance between the positive and negative dipole charges. In fact, for example, the polarization catastrophe distance in molten NaCl estimated from the electron polarizabilities of Na and Cl ions is 0.93A. Of course the actual negative increasing of potential to the catastrophe would be relaxed to some extent, as the short range damping factor fab(r) rapidly approaches to 1. In spite of these facts, it is quite doubtful whether that is the effective theoretical value when r approaches to the nearest ionic distance. Because the fab(r) is used as a parameter, the following a prior expression seems to be more preferable, as,
ab r ab 0 r Pab / r 4 ab 0 r 1 / 2 1 fab r ( a z b 2 e 2 b za 2 e 2 ) / r 4 2
(63)
Though fab(r) in Eq.(63) is different from those Wilson et al. (1996), or Bitrián and Trullàs (2006) have defined, the function which satisfies the following condition will be appropriate; when r approaches to 0, then fab(r) approaches to 1; when r increases (about twice of the inter ionic distance), fab(r) approaches to 0. In any case, by setting fab(r) as Eq.(63), the repulsive part of the potential will be more relaxed by taking into account the last term in Eq.(63), the charge dipole interaction, in the range where the repulsive potential is effective. 4.3 Polarization and dielectric constant
To discuss the screened inter ionic potential by the dielectric function, we will briefly summarize the relation between the polarization and the dielectric constant. Suppose that the local electric field at the position of the ion is Eloc, the contribution to the polarizability is ordinary classified to the following three types; (a) the electron distribution change of the atomic core which occurs inside the ion. It has been discussed in the previous sections; (b) the contribution from ions, which occurs from the relative configuration of other neighbouring ions; (c) if the ion has the permanent electric dipole, its contribution should be considered, especially in the case that the ion consists of plural atoms. However, it is unnecessary to be taken into account in the case of molten alkali chloride or molten carbonate. In the solid phase, if the frequency analysis is applied to the local electric field Eloc, (c) vanishes at about the micro wave length; next (b) disappears at the infrared region; (a) lasts to the end. In this discussion, we pay attention to (a) and (b). According to the linear response theory, the relation between the electron polarizability discussed in the previous sections and the dielectric constant corresponding to it is expressed as, 1 (1 / q ) 4p q
(64)
24
Noble Metals
Therefore, it is possible to obtain the effective inter ionic potentials in molten salts by the calculation of the term (a) and (b) using the polarization or the dielectric constant. 4.4 Our final form of inter-ionic potentials in molten salts
The dielectric function of the attractive part of the inter ionic potential of molten salts have been derived (Koishi et al., 2007; Matsunaga et al. 2007, 2008), and the theory have been extended to the polarizable model (Matsunaga and Tamaki, 2011). We briefly describe the procedure as follows. The Fourier component of the Coulomb potential in ij0(r), i.e. FT[zizje2/r]=4zizje2/q2 is screened by the dielectric function, as, {the FT result of the screened Coulomb term in ij 0 r } 4z i z j e 2 / q 2 q
(65)
As will be described in the next section, (q) is related to the charge-charge structure factor Szz(q). In other words, (q) is introduced to the pair potential as, so to say, a factor of the many body effect, or the environmental factor. Adding the repulsive term (Hij/rn) and the dipole-dipole interaction term (-Cij/r6) in ij0(r) with the simplified reduction constants and to (65), the promise inter-ionic potentials in a-b binary molten salt screened by the many-body force are expressed as, ij r Inv.FT[4z i z je 2 / q 2 e q ] Hij / r n 1 / 2 {1 fij r } 2 ( i z je 2 jz i e 2 ) / /r 4 C ij / r 6
i, j a, b
(66)
where Inv.FT means the inverse Fourier transformation. The repulsive term in (66) can be replaced by the exponentially decaying functions. Provided that the following function Eq.(67) is adopted as the decaying factor fab(r), the desirable condition will be satisfied; as r approaches to 0, then fab(r) approaches to 1; as r increases, then fab(r) approaches to 0.
fab r 2 /exp k abr exp k abr
(67)
where kab is a variable parameter, e.g. if f+-(r) ~ 0.2 is required when the inter ionic distance is about 3 A, the estimated value is k+- ~ 0.77 A-1. Regarding (q), the detailed discussion can been found in our previous works (Koishi et al., 2007; Matsunaga et al. 2007, 2008). As we have stated so far, the polarizable ion model in the short-range distance has been adopted in Eq.(66) where the repulsive potential (in both case 1/rn function form and the exponentially decaying function) is dominant. On the other hand, the screening contribution is adopted in the long-range distance where the Coulomb attractive potential is dominant. Thus the plausible inter ionic potential can be obtained, as it was, the polarized and screened interionic potentials model (PSIPM). We will demonstrate the example in the next section. 4.5 Application to molten CuI
In this section, we will show the example of application of the new theory to molten CuI. In molten CuI, the anomaly approach in Cu-Cu distribution is known, which is not reproduced by the classical MD (Waseda et al., 2000). Firstly, the outline of the theory of
Dielectric Screening Properties and Many Body Effects in Molten Salts
25
the dielectric screening that we have developed in the previous section is briefly described as follows for the readers’ benefit (Koishi et al., 2007; Matsunaga et al. 2007, 2008). As stated before, the Coulomb potential is screened by the dielectric constant 1/(q). (q) is expressed using the charge-charge structure factor, SZZ(q), which is defined as follows (Hansen and McDonald, 1986), S ZZ q rq Z r q Z /N i j z i z j S ij q
(68)
where zi and zj are the effective charge of ions. Sij(q) is the partial structure factor, i.e. the Fourier transformation of the pair distribution function of ion i and j, ɡij r), which is expressed as follows, )=
+
sin
⁄
)ɡ
The relation between 1/(q) and SZZ(q) is expressed as,
)−
(69)
1 1 ( q ) 1 2 q 2 SZZ q
(70)
1 1 i (q ) 1 2 q 2
(71)
where s2 = 4e2n, = 1/kBT, and n is the number density of constituent ions. The parameter is introduced to reduce the screening effect by the structure anisotropy as seen in molten noble metal halide. The value of is supposed to be in the range of 0 < 1. The condition = 1 may occur in a well-symmetric configuration like molten alkali halide. In the region of high values of q > 10A-1, SZZ(q) 1 is valid, hence Eq.(70) will be written as,
As we have describes in the previous section, the screened potentials can be obtained using (q). In our previous work, to confirm the validity of the obtained potential, we have calculated the pair distribution function by the potential mean force (Hansen and McDonald, 1986), which is expressed as, )=
−
)/
(72)
However, the screened potential ij(r) with the small reduction parameters multiplied on the repulsive term was used for Uij(r), and the calculation was restricted to the cation and anion pair. On this stage, we try to make a slight modification of the interpretation of the theory. We consider two types of screened potentials; the first one, ijS(r), is the screened potential that we have discussed in the previous section, which is affected by the structure through SZZ(q); the second one, ijI(r), is so to say, the ‘ideal’ screened potential with i(q) in Eq.(71), which expresses the effect from the uniform back ground. The potentials are written as,
ij S r Inv.FT[4 z i z je 2 / q 2 q ] S Hij / r n 1 / 2 {1 fij r } 2 ( i z je 2 jz i e 2 ) / /r 4 S C ij / r 6
i, j
a, b
(73)
26
ij I r Inv.FT[4 z i z je 2 / q 2 i q ] I Hij / r n 1 / 2 ( i z je 2 jz i e 2 ) / /r 4 I C ij / r 6
Noble Metals
(i, j a, b)
Fig. 11. 1/(q) of molten CuI with 1/(1+(s2/q2)).
Fig. 12. CuI(r) (left) and CuCu(r) (right) calculated using the screened potential with that obtained by experiment and by MD.
(74)
27
Dielectric Screening Properties and Many Body Effects in Molten Salts
We take Uij(r) for the potential of mean force in Eq.(72) as the deviation from the ideal screening, as, U ij r ij r |ij S r ij I r |
(75)
This interpretation seems to be appropriate because the effective mean force is originally defined for the weak interaction between particles, which corresponds to ∆ ij(r) in this case. In the numerical calculation, we adopt the value of in Eq.(70) and Eq.(71) as 0.4, ∆=|S I|= 0.12. CCuCu and CCuI are 0 in Eq.(73) and Eq.(74). The obtained +-(r) and ++(r) are shown in Fig.12 with ij(r) obtained by experiment (Waseda et al., 2000), and MD using the original VR type potentials (Stafford et al., 1990). The first peak of +-(r) and the phase of oscillations almost agree well, though the second peak height is not satisfactory reproduced. The first peak position of ++(r) obtained by the experiment suggests the anomalous closer distribution of Cu ions, which has been reproduced by the screened potentials and the effective mean force to some extent, except their peak heights and the oscillation phase of the third peak. On the other hand, the first peak of ++(r) obtained by MD obviously disagrees with the experiment. The discrepancy between ij(r) by the experiment and that obtained by the screened potential may be caused by several reasons, besides a margin of error in the Fourier transformation. One of the expected reasons is that the non-symmetric structure in solid phase remains in molten phase, which may obstruct the screening effect in molten phase. Despite these facts, however, it may be suggested that the treatment described so far is physically significant, and the screening effect has the obvious contribution to the obtained results.
Fig. 13. 1/(q) of molten CsAu with 1/(1+(s2/q2)) (left). potential with that obtained by MD and QMD.
+-(r)
calucaed using the screened
28
Noble Metals
4.6 Application to molten CsAu
Finally, we wish to show the application to molten CsAu system. Molten CsAu is a typical example which exibits a transition from a metallic to non-metallic state around a stoichiometric composition in molten phase, though both components are metallic conductors. Molten CsAu at the equiatomic composition exhibits a very low conductivity like molten salts (Schmutzler et al., 1976). These characteristics have been interpreted that a chemical short range order in the molten state are formed, in other words the molten CsAu alloy is composed of Cs+ and Au-. Structural measurements for molten CsAu systems using the neutron diffraction were performed (Marchin et al., 1980). Molten CsAu alloys have some structural characteristics of the short range order indicating a typical ionic compound. But partial structure factors have not yet been obtained experimentally. Many attempts have been made to investigate the three dimensional configurations of the molten CsAu alloys by considering the partial structure factors and the pair distribution functions. The charged hard sphere model with the mean spherical approximation is mainly used for this purpose (Evans & Telo da Gama,1980; Holzhey et al., 1982). Hoshino indicated that the partial structure factors and the entropy of mixing depend strongly on the amount of charge transfer (K. Hoshino, 1984). Both of their consequences showed that the partial structure factors and the pair distribution functions of molten CsAu alloy have the same characteristics as those observed in molten alkali halides. However, the pair distribution functions obtained by the Monte Carlo simulation are very different from those obtained by the charged hard sphere model; Au- - Au- distance indicates the most closest approach (Costa Cabral et al., 1992). In this situation, we performed molecular dynamics simulation using the Tosi-Fumi type potentials to examine the structural and transport properties in molten CsAu (Matsunaga, 2000, 2001). The obtained structure of molten CsAu shows the similar characteristics to CsCl structure. On the other hand, the recent ab initio calculation in molten CsAu shows the good agreement in the pair distribution function of Cs-Au, CsAu(r), with the molecular dynamics result, however there are discrepancies in AuAu(r) and CsCs(r) (Charpentier and Clérouin, 2008). This result may suggest the existence of the anomalous inter-ionic interactions in molten CsAu like molten CuI. This fact prompts us to examine the dielectric screening effect in molten AuCs. The calculation procedure is similar to that described before. The obtained calculation results are shown in Fig.13. It can be seen in Fig.13 that CsAu(r)s obtained by three different methods agrees well to some extent.
5. Conclusion In this book chapter, we have re-examined the theory of the dielectric screening, and summarized the derivation of the new expression of the dielectric function. The extension of the theory to the potential mean force, and the deviation from the Nernst-Einstein relation has also been discussed. Then, we have reviewed the application studies of the new theory to the binary and ternary molten salts, i.e. alkali halides NaCl, RbBr, noble metal halides AgBr, CuBr, and AgBr-AgI mixture. The concentration-concentration fluctuation for the multi-component systems SCiCj(q) (Bhatia & Ratti, 1977) has also been discussed in relation with the many body effect and the short range order. We have applied the theory to the poralizable ion model. The new expression of the potential
Dielectric Screening Properties and Many Body Effects in Molten Salts
29
which enables to avoide the polarization catastrophe has been proposed. The model has been applied to molten CuI and CsAu systems.
6. Acknowledgment One of the authors (SM) is grateful to the Ministry of Education, Science and Culture for Financial support of Grant-in-Aid for Science Research. One of the authors (ST) expresses his thanks to Professors S. Takeno and M. Kusakabe of Niigata Institute of Technology for their helpful instruction for a mathematical treatment. He also wishes to express his cordial thanks to Professor W. H. Young for fruitful comments on this subject.
7. References Berne, B. & Rice, S. A. (1964). On the Kinetic Theory of Dense Fluids. XVI. The Ideal Ionic Melt. Journal of Chemical Physics.,Vol. 40, Issue 5, (March 1964), pp. 1347-1362; DOI:10.1063/1.1725318 Bhatia, A. B. & Ratti, V. K. (1977). Number-Concentration structure factors and their long wavelength limit in multicomponent fluid mixtures. Physics and Chemistry of Liquids, Vol.6, Issue 3, (1977), pp.201-213, DOI:10.1080/00319107708084140 Bhatia, A. B. & Thornton, D. E. (1970). Structural Aspect of the Electrical Resistivity of Binary Alloys. Physical Review B, Vol.2, (October 1970), pp.3004-3012, DOI:10.1103/PhysRevB.2.3004 Bitrián, V. & Trullàs, J. (2006). Molecular Dynamics Study of Polarizable Ion Models for Molten AgBr. Journal of Physical Chemistry, Vol.110, Issue 14 (2006) pp.7490–7499, DOI: 10.1021/jp056818u Chandra, S. (1981). Superionic Solids: Principles and Applications, Elsevier Science Ltd, ISBN: 0444860398, Amsterdam Charpentier, N. & Clérouin, J. (2008). Ab initio simulations of the liquid alloy Au-Cs. Physical Review B, Vol.78, Issue 10, (September 2008), pp.100202-1-100202-2, DOI:10.1103/PhysRevB.78.100202 Costa Cabral, B. J.; Natalia, M.; Cordeiro, D. S. & Telo da Gama, M. M. (1991). The structure of molten CsAu: ab initio and Monte Carlo study. Journal of Physics: Condensed Matter, Vol.3, No.29, (July 1991), pp.5615-5620, DOI:10.1088/09538984/3/29/014 Edwards, F. G.; Enderby, J. E.; Howe, R. A. & Page, D. I. (1975). The structure of molten sodium chloride. Journal of Physics C: Solid State Physic, Vol.8, No.21, (November 1975), pp.3483-3490, DOI:10.1088/0022-3719/8/21/018 Endo, K.; Ida, T.; Kimura, J.; Mizuno, M.; Suhara, M. & Kihara, K. (1999). Structural analysis of AgxCu1−xI (0.75⩽x E1-Evac promotes a photon above the Evac, leaving a hole in the state E1. In Inverse Photoemission an impinging electron makes a transition from the energy level above the Evac and an empty state E* inducing the emission of a photon, in absorption an impinging photon is absorbed leaving a core hole in the level E1 and the recombination produces either a fluorescence decay or an Auger electron. 2.3.1 NEXAFS X-ray Absorption Spectroscopy (XAS) combined with synchrotron radiation is a wellestablished technique that provides information on the electronic, structural and magnetic properties of matter. In X-ray absorption, a photon is absorbed by the atom, leading to the transition of an electron from a core state to an empty state above the Fermi level. The absorption cross-section is proportional to the absorption coefficient and depends on the energy and on the measured element. To excite an electron in a given core-level, the photon energy has to be equal or higher than the binding energy of this core-level. This gives rise to the opening of a new absorption channel when the photon energy is scanned from below to above this core-level energy. The energies of the absorption edges therefore correspond to the transition from the core-level energies to the empty states and are characteristic for each element, making X-ray absorption an element-selective technique. The fine structure above the x-ray absorption edge of a core level can be separated into a near-edge region (Near Edge X-ray Absorption Fine Structure, NEXAFS, Another acronym used in the literature is XANES) (Stöhr1992), which is located within ≈ 30 eV above the edge, and an extended region at higher photon energies (Extended X-ray Absorption Fine Structure, EXAFS). Due to the small inelastic mean free path of the photoelectrons in the respective energy range, NEXAFS is dominated by multiple scattering, in contrast to EXAFS, where the photoelectron interacts with the surrounding atoms by single scattering events. On the other hand the near edge provides information of the cross section of the element selective density of final empty states, which for molecules are the directional antibonding molecular states. An example is reported in figure 4 right. The photon absorption is
256
Noble Metals
controlled by dipole selection rules, which lead to general relations for the angledependence of the resonance intensities [Stohr, 1992]. 1
E-EFermi(eV) 3 4
2
5
7
resonances
8
Multilayer C60 LUMO+1
resonances
C=0°
C K-edge NEXAFS 283
284
285
1 Ml C22H14/Ag(111)
C=90°
IPS LUMO
6
absorption coefficient a. u.
0
286 287 288 Photon Energy (eV)
289
290
291
285
290
295
300
305
310
Photon Energy (eV)
Fig. 4. Left: C Kedge NEXAFS of C60 multilayer compared with Inverse Photoemission (Felici 2009). Right: Example of C Kedge NEXAFS of the linear molecule Pentacene (C22H14) deposited (1ML) onto Ag(111) measured varying Electric field vector of the incident synchrotron light (Pedio 2007). Making use of the polarized nature of the synchrotron radiation the orientation, relative to the surface of the molecular orbitals of an adsorbed molecule , can be determined. For this reason NEXAFS is mostly used to determine molecular orientations by observing the polarization dependence of the resonance intensity, which is mainly controlled by wellestablished symmetry selection rules. Figure 5 left) shows an example of the C kedge of C60 molecular films. The signals in the NEXAFS region can be divided into π and σ resonances. The lower energy π resonances are assigned to transitions from the core level into an unoccupied molecular orbital of (local) symmetry that lies below the vacuum level, while the lie above. Thus, the NEXAFS spectroscopy probes empty levels below the ionization threshold, similarly to IPS (see next paragraph), but due to the absorption process, the final system has an electron less (N-1) and a hole in the core level. Note the differences of the energy separation of the peaks in the two spectra in Figure 4 left, due to the presence of the C1s core hole in the absorption process. Specifically Density Functional Theory (DFT) can reproduce the NEXAFS spectrum of the excited state (presence of the core hole) of molecules, either in the gas phase or in solid thin films, providing the oscillator strengths and the intensities (Triguero 1998, ). The ground state is nicely reproduced by ground state DFT calculation (absence of the hole). For more details see (Brühweilr2002, Felici, 2009). 2.3.2 Photoemission Photoemission spectroscopy (PES) is based on the photoelectric effect, which is the process of extracting an electron by means of an impinging photon with energy greater than the electron binding energy. PES measures, in its simpler version, the kinetic energy distribution of photoelectrons, which are emitted from a sample, when it is irradiated with monochromatic light. The energy of the photoelectrons leaving the sample is determined using an analyser that selects the kinetic energies of the photoelectrons and measures their intensity. This gives a spectrum with a series of photoelectron peaks. Within a single particle picture, the kinetic energy distribution of the detected electrons mimics the distribution in energy of the occupied
Organic Molecules on Noble Metal Surfaces: The Role of the Interface
257
electron states in the ground state (see Fig.5 left). In this case, the kinetic energy Ek of the photoelectron coming out from the sample is approximately given from the following relation: Ek = h - Eb - A
(4)
where Eb is the binding energy of the photoelectron relative to the Fermi level, h the used photon energy and A is the work function of the electron analyzer.
Fig. 5. Left: Level diagram of PES process in a metal. S indicates the sample, A the electron analyzer, EF the common Fermi level. Right: Electron inelastic mean free path in different materials as a function of their kinetic energy.
Even if the photons penetrate into a solid for several m, photoemission is a surface sensitive technique. The sampling depth in the photoemission process is determined by the mean free path of the photoelectrons in the solid. This quantity follows the so-called universal curve Shown in Fig. 5 right, and it changes as a function of the electron kinetic energy from about 4Å to about 50Å (Weber, NIST database). Detecting electrons, XPS must be carried out in Ultra High Vacuum (UHV) conditions. The intensities of the photoemission structures reflect the density of states and depend furthermore on the cross sections of the photoemission processes involving electrons of different energy levels. XPS sources in campus are normally anode emission of Al Kalpha (1486.6eV) or Mg Kalpha (1253.6eV); synchrotron radiation provide photon energies from approximately 10 eV up to the soft-X ray and hard X ray region. The binding energies of the peaks are characteristic of each element. A measured XPS spectrum of Au(111) sample is shown in Figure 6a. It is characterized by sharp peaks, superimposed to a mostly featureless background, which exhibits a huge peak (not shown) in the low kinetic energy region (≈5-10eV). This background is ascribed to the almost continuum distribution of the secondary electrons which are produced after inelastic scattering within the solid, thus having lost memory of their primary energy. The excitation of most core levels requires at least soft X-rays, which explains the more usual acronym of the technique. Because of the discreteness of the core levels energies, each core level distribution is a fingerprint of a specific chemical element, thereby making XPS an atom-specific technique.
258
Noble Metals
The peak areas can be used (with appropriate sensitivity factors) to determine the composition of the materials surface. The width of a photoemission core level depends on many different factors: mean lifetime of the photo-hole, electronic excitations, phonon coupling, instrumental broadening. A core level binding energy can shift, depending on the chemical bonds and local environment of a specific atomic site. That implies that the shape of each peak and the binding energy can be slightly altered by the chemical state of the emitting atom. Therefore the analysis of the core level lineshape (taken at high resolution, i.e. resolving power E/E~10-4) provides key information on the chemical bond. Thereby the identification of the chemical state of an atom in an unknown solid system is made possible, consistently with the energy resolution and the actual size of the core level shift. XPS is not sensitive to hydrogen or helium, but can detect all other elements. Kinetic Energy (eV) 54
100x10
clean Au(111) hv=1253.6 eV
3
58
E =h-E - k
Secondary electrons Intensity (counts/sec.)
56
b
60
62
64
Au 4f
7/2
A
80
Bulk
Surface
60
Au 4f
Au 4f 5/2
40
Au 4d Au 4s
Au 4p
20
VB 1000
800
600 Binding Energy (eV)
400
200
0
-90
-88
-86
-84
-82
Binding Energy (eV)
(a)
(b)
Fig. 6. a) Example of a photoemission spectrum from a Au(111) single crystal (h=1253.6eV). Core levels and Valence Band emission are indicated; b) high resolution of the Au 4f core level of the Au(111) taken in surface sensitive conditions. The Au 4f emission is a doublet due to the spin orbit splitting of the 4f 7/2 and 4f 5/2. The components ascribed to bulk gold atom and surface atoms are labeled B and S, respectively. In the photoemission spectra also other structures are visible, typically Auger peaks, shake up losses and correlation satellites due to relaxation processes, i.e. excitation and deexcitation of the system after the creation of the hole left by the photoelectron. 2.3.3 Valence band photoemission and inverse photoemission The broad structure labeled VB at the low binding energies of the photoemission spectrum in Fig. 6a corresponds to the energy distribution of the valence band states. The typical feature of these shallow states is their delocalized character, compared to the local nature of core levels. They are thus expected to markedly change their distribution in energy as the chemical bonds are changed. Direct and inverse photoemissions permit a direct measurement of the band structure. With the measurement of photon and Ekin, PES can determine the occupied state energy. If the
259
Organic Molecules on Noble Metal Surfaces: The Role of the Interface
sample is a monocrystal and the electron detector has a finite acceptance angle, one can also use momentum conservation law. Angle Resolved UPS (ARUPS) measures the angular distribution of the photoelectrons as a function of the impinging light angle, i.e. the momentum k dependence of the filled electronic states. ARUPS is used to determine the band structure of the material under investigation. As we have seen PES measurement is a mapping of the occupied states of a solid as a function of the binding energy. Once the electron is removed (it is sent above the vacuum level Evac ), the solid remains in some excited state for a while, with a hole somewhere in the valence states. If the solid used to contain N electrons before the absorption of the photon, it only contains N − 1 of them at the end of the process. UPS can also be used to identify molecular species on surfaces by identifying characteristic the electron energies associated with the bonding orbital of the molecules. An inverse photoemission experiment is simply the opposite process. This allows a mapping of the empty states as a function of the energy and of the k-point of the solid. Here an extra electron is injected with energy Ekin into the solid initially in the ground state. It goes down the surface potential barrier φ and arrives in some electronic empty state (eigenstate) of the solid, with emission of a photon of energy h. The system of electrons ends in an N + 1 particle excited state. As in the direct case, the energy conservation law permits to evaluate the energy of the empty states. Finally, direct and inverse photoemission experiments are the most direct experimental way to measure the band structure of crystals. A variation of the angle of incidence of the electron beams leads to angle resolved measurements and thus the momentum dependence of the bands. In the isochromat mode, the incident electron energy is ramped and the emitted photons are detected at a fixed energy that is determined by the photon detector. The cross section of the IPS process is five orders of magnitude weaker than photoelectric effect, implying the use of highly efficient photon detectors (Dose, 1985, Luth, 1982). Figure 7 shows the PES –IPS spectra of a metal (Au(111)) and a thin Ni-octaethyl porphyrin (NiOEP) film. In case of metal surface there is emission at the Fermi level (EF), while in the case of semiconductor there is a gap (transport gap, Et) between the peaks identified as the
IPS Intensity (arb. units)
Au 5d S1
Au(111)
S
NiOEP ET
UPS -6
HOMO
-4
-2
LUMO
0
2
4
6
E-EF(eV)
Fig. 7. UPS-IPS spectra of the Au(111) surface (upper red curves) and the multilayer NiOEP (lower black curves). The S and S1 labels indicate the surface filled and empty states, respectively. ET is the transport measured gap.
260
Noble Metals
Highest Occupied Molecular Level (HOMO) and the Lowest Unoccupied Molecular Level (LUMO). In electronic the transport gap, Et, is the energy necessary to create a separated electron–hole pair. The charge injection processes requires promotion of an electron or a hole from the electrodes into one of the charge transport (HOMO or LUMO) states of the organic film. It exceeds the optical gap, Eopt, by 1 eV. (for details see Zahn2006). 2.4 Summary and comparison among the techniques In section 4 we will discuss our results on organic molecules deposited onto noble metal surfaces, obtained by the described experimental techniques. Table 1 reports the list of typical applications. Method/Name
Probe/ Signal
Detection limits Typical applications
Surface analysis and composition, Photons/Photoelectrons Elemental sensitivity, N-1 final system Chemical shifts, stoichiometry DOS filled states UPS surface Photoemission/Valence Photons/Photoelectrons Energy alignments Band UPS N-1 final system sensitive Transport Gap Elecrtrons/photons DOS empty states Inverse Radiative decay Surface sensitive Energy alignments Photoemission/IPS N+1 final system Transport Gap Photons/hole Structure Molecular recombination orientation Near edge X ray Surface sensitive Absorption Fine TOGETHER with Transitions form core to for adsorbates structure/NEXAFS empty states, N-1 final elemental local density system of empty states. Surface structure Sub- single Low Energy Electron Elastic back scattering of adsorbate structure. Diffraction low energy electrons monolayer Long range order From submonolayer to Atomic structure of bulk, depending surface and interfaces Elastic scattering of Hard Surface XRD on the incidence atoms and adsorbates X-ray photons X-ray angle and Long range order experimental geometry Atomic Topography of the Scanning microscopy / Tunneling current resolution in STM surface UHV Atomic Local Density Of Scanning microscopy / Tunneling current versus resolution in States, absorption gap STS bias voltage with atomic resolution UHV Photoemission/X-ray Photoelectron Spectroscopy XPS
0.01-1 at% Surface-bulk sensitive
Table 1. Research methods and the typical applications to measure surfaces composition, electronic properties and structures.
Organic Molecules on Noble Metal Surfaces: The Role of the Interface
261
3. Main topics of surfaces of noble metal surfaces Flat surfaces of single crystal samples correspond to a single Miller Index plane and, as we have seen, each individual surface has a well-defined atomic structure. Low index Miller flat surfaces (Ashcroft & Mermin 1976) are used in most surface science investigations. Depending upon how a single crystal is cleaved or cut, flat surfaces of macroscopic dimensions are obtained. As many of the technologically most important metals, noble metals exhibit a face centered cubic (fcc) structure. The single crystal surfaces (100), (110) and (111) represent the most frequently studied surface planes of the fcc system (BALSAC web site) - however, they are also the most commonly occurring surfaces on such metals. The knowledge gained from studies on this limited selection of surfaces contributes in propagating the development of our understanding of the surface chemistry of these metals. By splitting the metal crystal along a specific crystallographic plane, the number of nearest neighbour atoms (coordination number, CN1) is reduced. This implies that the energy of the surface atoms is higher than that of an atom inside the bulk. These bulk terminated surfaces rearrange the atoms in order to minimize the surface energy. This produces either relaxation, i.e. vertical rearrangement of surface layers (as for example in fcc (111) surfaces), or reconstruction namely the lateral rearrangement of surface atoms (as in fcc (110)). The minimization of the free energy has the tendency to reduce the surface area, altering the geometry of the surface atoms. In particular relaxation takes place because the surface has a high surface tension and the electrons near the surface tend to smooth their surface electronic charge.
Fig. 8. Illustrations of the Smoluchowski smoothing model due to the redistribution of the charge density at the surface when the density relaxes. a) smooth, closely packed, and b) corrugated loosely packed surface. The lines are related to the contour of the electron density at the surfaces. The dashed lines show the contours after the redistribution of the electron charge density. The electronic structure of noble metals is due to the simultaneous presence of s and d states in the valence band. The s electrons are essentially free and localized at the Fermi level, while the d states are spatially localized and yield to complex hybridization both in the bulk and at the metal surface. This complexity defines the electronic properties of the surface: the work functions, the surface energies, the reconstructions and the reactivities under molecular absorption. One of the physical observables more used to evaluate the electronic
1 The Coordination Number of atoms in the bulk of the fcc structure is 12. To calculate the CN of a surface we should subtract to the bulk CN (12) those atoms which have been removed from above in forming the surface plane.
262
Noble Metals
properties of surfaces and interfaces is the work function, (Figure 5 left, section 2.3.2) i.e. the energy that is necessary to promote an electron from the Fermi level to the vacuum. The work function (WF) depends on the element and on the structure of the surface. The interplay between the ionic potential (made by the atomic structure) and the electronic charge (filled electron valence states) determines the macroscopic properties of the surface and has strong relevance on technologic applications. Accurate work functions have now been measured in ultrahigh vacuum for most common metals in various crystallographic orientations. The dependence of the WF on the surface orientation (WF anisotropy) in noble metals has an increasing trend from (110)(100)(111). For WF anisotropy the simpler model is the Smoluchowski (Figure 8). This effect (Smoluchowski,1941) consists in the redistribution of the electron cloud on a metal surface with a strong corrugation. Consider a closed packed and an “open” surface of some material. On the open surface we find the Smoluchowski effect of charge smoothing. This smoothing leads to a dipole moment which opposes the dipole created by the flow-out of the electrons. Hence, the work function of a closed packed surface will be higher than that of an open surface. The closed packed (111) surface has the highest workfunction. Recently (Fall2000, Singh-Miller 2009) ab initio calculations by more accurate microscopic models improved the comprehension of the interrelation between structure and electron density at surfaces. Theoretical simulations provide trends on the main surface properties. The literature, even recent, is quite rich. For example the evaluation of defect formation, surface relaxation, adhesion at surface, surface energy have been performed for surface atomic scale by effective medium theory (Stoltze 1994) and density functional theory (Vitos et al., 1998, Singh-Miller et al. 2009). Experimental values and example of theoretical results are reported in table 2. The low values of Adatom/vacancy formation of the Au low Miller index surfaces (Table 2) reflect the high mobility of Gold surfaces (surface energy, Ead/Vacancy) for which it is relatively easy to induce structural changes. The most stable surfaces present high surface atom density and surface atoms with high coordination number fcc(111)>fcc(100)>fcc(110). The physical definition of a noble metal requires that the d-bands of the electronic structure are filled. Taking this into account, only copper, silver and gold are noble metals, as all dlike band are filled and don't cross the Fermi level (EF, fig. 5) that is the highest energy level that is occupied by the electrons in the metal. Other catalytically important precious metals (Pt, Rh, Pd) shows a more complicated configuration: for platinum two d-bands cross the Fermi level, changing its chemical behaviour. Note the reduced 6s-5d separation of ≈ 2 eV in gold as compared to ≈ 3.5 eV for the 5s-4d separation in the silver atom. This suggests the higher reactivity of silver. The structure has a strong influence on the electronic properties and reactivity of the surfaces. Reactivity variations to different gases and deposited molecules on the surface even of the same metal are commonly measured. Reactivity strongly depends on the electronic properties, and hence on the crystallographic orientation of the surface (Hammer, 2006). The Hammer-Nørskov d-band model correlates changes in the energy center of the valence d-band density of states at the surface sites with their ability to form chemisorption bonds. A reactivity change is characterized as an electronic structure effect. In this way the
263
Organic Molecules on Noble Metal Surfaces: The Role of the Interface
model can explain the reactivity change from flat Au surfaces, over Au thin films to Au edges. The different reactivity can easily be seen while preparing clean metal surfaces in ultra high vacuum; surfaces of "physical defined" noble metals (e.g., gold) are easy to clean and stay clean for a long time, while those of platinum or palladium, for example, are covered by carbon monoxide very quickly.
Area unit cell Surface a0 /Å a 2D /Å2
2DBrillouin zone
Theory Surface WF (eV) Surface Adatom/ density/ Fall,2000/ Energy vacancy Singh(at/cm2)/ (J/m2) Energy (eV) CN Miller 2009 Vitos 98 Stoltze 1994
Cu(111) 3,61
√3/4a02
hexagonal
1.78·1015 /6
4.95
Cu(100)
1/2a02
Square
1.09·1015 /4
4.6
0.984
Cu(110)
√2/2a02
Rectangular P 1.53·1015 /2
4.45
0.466
Ag(111) 4.09
√3/4a02
hexagonal
1.38·1015 /6
Ag(100)
1/2a02
Square
8.45 1014 /4
0.694
Ag(110)
√2/2a2
Rectangular P 1.20·1015 /2
0.327
Ag poly
4.74
1.79
1.246
1.329
1.027
4.26
Au(111) 4.08
√3/4a02
hexagonal
1.39·1015 /6
5.3
Au(100)
1/2a02
Square
8.45 1014 /4
5.22
0.556
Au(110)
√2/2a02
Rectangular P 1.20·1015 /2
5.2
0.273
Au poly
4.08
Pt(111)
3.92
1.5
1.009
5.1 √3/4a02
hexagonal
1.51·1015 /6
6.08
Pt(100)
1/2a02
Square
9.20 10 14 /4
5.82
0.818
Pt(110)
√2/2a02
Rectangular P 1.30·1015 /2
5.35
0.370
2.49
1.429
Table 2. Comparisons of low index metals surfaces of Cu, Ag, Au and Pt: structural symmetries, surface density, experimental work function, calculated surface energies and vacancy-adatom energy formations.
264
Noble Metals
3.1 Two extremes: Comparison between (111) and (110) surfaces In case of the [111] planes noble metal (Cu, Ag, Au and Pt) have a close packed structure, while the surfaces having [110] orientation are more “open” and a (2x1) reconstruction can take place at RT.
Fig. 9. Left: Structure bulk terminated fcc (111) 2. Right: side view of the Au(111) herringbone reconstruction The (111) surface is obtained by cutting the fcc metal in such a way that the surface plane intersects the x-, y- and z- axes at the same value - this exposes a surface with an atomic arrangement of 3-fold (apparently 6-fold, hexagonal) symmetry. This layer of surface atoms actually corresponds to one of the close-packed layers on which the fcc structure is based. This is the most efficient way of packing atoms within a single layer. In a fcc (111) surface all surface atoms are equivalent and have a relatively high CN and the surface is almost smooth at the atomic scale. The surface offers the following adsorption sites: On-top sites, Bridging sites, between two atoms, Hollow sites, between three atoms. The effect of surface formation induces relaxation of the topmost metal layer. For example the clean Pt(111) surface does not show any reconstruction, however a S-XRD analysis of its CTRs (see section 2.1) shows that the surface top layer is slightly relaxed with respect to the nominal bulk termination and their fitting allows to determine an expansion of 4.5 ± 0.5 pm (+2.0%) with respect to the ideal bulk termination (Felici&Pedio 2009). Au(111) clean surface shows a Au (111) 22 √3 “herringbone” reconstructed surface (van Hove 1881, Sandy 1991), that involves a great number of surface atoms (Fig. 9 left , Herringbone side view, STM image Fig. 1 right). The (110) surface is obtained by cutting the fcc unit cell in a manner that intersects the x and y axes but not the z-axis - this exposes a surface with an atomic arrangement of 2-fold symmetry i.e. a rectangular symmetry of the surface layer atoms. In one direction (along the rows) the atoms are in contact i.e. the distance between atoms is equal to twice the metallic(atomic) radius, but in the orthogonal direction there is a substantial gap between 2 The pictures of figure 10 left and 11 left have been made from NIST SSD output and processed with BALSAC by K. Hermann. http://www.fhi-berlin.mpg.de/~hermann/Balsac/SSDpictures.html SSD is the NIST Standard Reference Database no. 42 by P. R. Watson, M. A. Van Hove, and K. Hermann
Organic Molecules on Noble Metal Surfaces: The Role of the Interface
265
the rows. This means that the atoms in the underlying second layer are also, to some extent, exposed at the surface. Normally the bulk terminated (110) plane is energetically not favourable. The (110) surfaces of Ag and Au metals are characterized by the strong surface diffusion anisotropy energies. Typically this surface can be unstable and shows reconstructions ranging from the 1x2 to the 1x5 unit cell. The clean Au(110) presents the missing row 1x2 reconstruction, while Cu(110) remains unreconstructed (Africh, 2010) as shown in Figure 10.
a) Cu(110)b)
Au(110) (2x1) Missing row
Fig. 10. a) bulk terminated fcc (110) picture and STM image of Cu(110) surface (C. Africh). B) (110) missing row 2x1 reconstruction picture and topographical image of Au(110) 2x1 reconstruction ref. http://www.redespm. org.br/grupo10.html The (110) substrates have higher mobility and reactivity. They offer a wide variety of possible adsorption sites, including : On-top sites, Short bridging sites between two atoms in a single row, Long bridging sites between two atoms in adjacent rows. Moreover higher coordination sites are possible (in the troughs that are facets with (111) orientation). The Au(110)-(1×2) surface shows an order-disorder transition with critical temperatures, Tc, between 650 K and 695 K depending on finite-size effects (Clark, 1986). A large number of experimental and theoretical works have been envisaged to single out the basic aspects of molecules interacting with noble metal. In particular, the Au(111) surface is widely used as support of SAM providing an almost uniform reserve of electron charge. Differently from the (111) case, in a (110) 2x1 reconstructed fcc surface, the surface is atomically rough, and highly anisotropic. The surface atoms on a more open ("rougher") surface have a lower CN - this has important implications when it comes to the chemical reactivity of surfaces, as we discuss in the next section.
4. Survey of ordered molecular layers: From weak interaction to anchoring Organic molecules can provide complex functionalities at a metal surface. The engineering of the functionalities of organic-inorganic interfaces has important technological applications, as cathalysis, sensors, optoelectronics, molecular spintronics, photovoltaic and so on. The development in these fields implies a deep understanding of the bonding and the lateral interactions that govern the organization of the molecular thin films and ultimately the design for the optimization of their functionalities. In order to accomplish this goal a rigorous surface science approach is necessary: dosing of known molecular fluxes on defined surfaces under ultra high vacuum conditions and fine characterization of these systems, including sophisticated data analysis, theoretical modelling and simulation.
266
Noble Metals
The molecular ordening onto surfaces strongly depends on the delicate balance of the molecule-molecule and molecule-surface interactions (see discussions in ref. Rosei et al. 2003). This is reflected in the complexity of the phase diagrams of these systems. Small differences in the properties of the noble metal substrates (discussed previously) can lead to marked differences in the molecular deposited layers. Depending on their structure the molecular semiconductor ordered films have important properties for microelectronics: integrability with inorganic semiconductor, low cost, large area bulk processing, tailoring for specific electronic and optical properties, systems more tolerant of defects (no electronically active), no dangling bonds that leads to great flexibility on the choice of substrates, charged carrier mobility increases with increasing pz-pz orbital, anisottropic mobility (for axample Pentacene µ~1 cm2/Vs direction in-plane, µ ~10-4 cm2/Vs stacking). The disadvantages concern mainly the fact that a high degree of molecular ordering is necessary, to avoid the problems related to low carrier mobility. The growth procedures are relevant in the bond, ordening and structure of the monolayer of organic semiconductors. All the cases discussed in the following are related to vapor deposition in UHV conditions. We compare different single organic layers deposited onto ordered noble metal surfaces. The interest and the strong effort in the characterization of the first MONOLAYER3 of organic molecules on single crystal surfaces adsorption is due to the general accepted result that structural and chemical properties of the monolayer are keys for controlled multilayer growth. The nucleation, growth, structure and interaction molecules strongly depend on the substrate nature and on the particular experimental protocol used during the deposition. The geometry of the first organic layer is exploited to drive the orientation of the next growing layers. From the electronic point of view, the first layer acts as a buffer layer, enabling the following layers to be exploited for the intrinsic electronic properties of the free molecule. Case studies of molecules that differ in size, symmetry and morphology, deposited on different low index noble metal substrates are here presented, on the basis of structural and electronic properties determined by the above techniques ( section 2). Figure 11 shows the structural formulae of the molecules discussed in the following. Due to the extension of the literature on SAM deposited onto noble metal surfaces, the list of systems treated in this chapter cannot be complete. We focus our attention on our results obtained on ordered molecular layers mainly deposited onto Au(111) and Au(110) substrates, considering gold as the prototypical noble metals. Other specific systems involving other metal surfaces will be taken into account and discussed. The large dimension of these molecules (scale 10 Å) with respect to the unit cell of metal surfaces (Table 2), implies that the local molecule-substrate interaction involves several unit cells of the substrate. The properties of these low dimensional systems depend, for example, on the nature of the chemical bond (ionic versus covalent versus Van der Waals), on the partial filling of the lowest unoccupied molecular orbital (LUMO) as a result of a charge 3 For example 1 ML on Au(111) is defined as the packing density compared to the Au(111) plane, 1.39·1015 atoms/cm2, which is equivalent to an effective thickness of 2.35 A ˚ at the density of bulk gold.
Organic Molecules on Noble Metal Surfaces: The Role of the Interface
267
transfer from the substrate and/or from dopant atoms (influenced by the substrate work function, the molecule-substrate interaction and possible screening effects), on the geometry of the molecular film which depends on the substrate surface chosen and on the thermal history of the film) , on possible adlayer-induced substrate reconstruction and on defects. In the next section we will describe the research methods with some detail.
C22H14 Fig. 11. Structures of different molecules. Left: Fullerene C60, Center: Pentacene C22H14, Right: Ni Octaethylporphyrin NiOEP. 4.1 C60 on noble metals Fullerenes (C60) can be considered as model systems of large molecules. This kind of soccerball shaped molecule with its three dimensional character along with the strong modulation of the valence charge distribution over the molecular cage. This unique electronic structure leads to several possible interaction mechanisms with the host surface. The geometrical constraints imposed by the three dimensional cage allow only a few carbon atoms per molecule to be in contact with the substrate. The distribution of electronic charge (interface region) and the electronic properties of the first C60 ML can be tuned. When deposited on a single crystal surface, fullerene molecules are proving useful to encapsulate surface reconstructions and/or are functioning as templates for the formation of novel structures. They are widely used to create complex architectures on surfaces for their stability, electronic properties (doping), functionalization, and capability of forming reconstructed surfaces (Rudolf 1996 as cited in Gavioli &Cepek, 2008). Monolayer (ML) and sub-monolayer films based on fullerene molecules deposited on top of metal or semiconductor surfaces, therefore, form a class of systems that could exhibit a wide range of physical behaviours. An increasing number of works is aimed at studying the interaction of single layers of C60 with nobel metal surfaces. Due to its large work function (7.6 eV) and electron affinity (2.7 eV), C60 has the propensity to accept electrons from many metallic surfaces. However, charge transfer from the metallic substrate to C60 is not always observed and the character of the interaction depends mainly on the metal, almost independently of its work function. Thin films of C60 adsorbed on crystalline substrates usually tend to form hexagonal or quasi-hexagonal ordered structures with a large variety of the substrate-adsorbate interactions, ranging from covalent to ionic character. An important issue is the investigation of the consequences of the C60 adsorption on the underlying substrate structure. According Maxwell et al. (Maxwell 1994) the bonding interaction of C60 in direct contact with a metal surface can be divided in three categories:
268
Noble Metals
strong predominantly covalent bonding, intermediate predominantly covalent bonding and intermediate predominantly ionic bonding. Strong predominantly covalent bonding has been observed for a single layer of C60 on Ni(110), Pt(111), Rh(111) and Ta(110) where the strength of the interaction is able to catalyze the fullerene cage decomposition prior to the desorption of the monolayer. Interaction of intermediate strength with bonds of mixed ionic character has been observed for the C60 monolayer on Au(110), Au(111), Ag(110), Ag(111) and polycrystalline Ag Cu(110) and Cu(111),. Charge transfer has also been observed for C60 monolayers deposited on polycrystalline Au and Cu samples, but the stability of the C60 monolayer and the strength of the interaction onto these surfaces was not investigated in detail. The trend of these bond strengths reflects the Hammer- Nørskov model (par. 3). A particular case has been observed on Ag(100). By using the appropriate sample preparation conditions, this system shows the reversible opening of a gap at the Fermi level at temperatures 25 ≤ T< 300K (see Fig. 12), whose origin is still under debate (Cepek et al. 2001, Goldoni et al., 1998).
Fig. 12. Fermi Level photoemission spectra of the C60/Ag(100) system at varying the temperature. The C60 layer may not present long-range order, but in any case the quasi-hexagonal geometry is locally preserved. The C60 molecules adsorbed on Ag(100) follow this general trend. The growth mode and morphology of the C60 molecules adsorbed on Ag(100) at room temperature (RT) or above has been widely studied (Goldoni, 1998, Giudice,1998), Cepek,2000a), Lu, 2003). It has been observed that the C60 molecules form a strong bond on the Ag(100) surface at any growing temperature investigated (for STM, ranging from 100K to ≈670K). When deposited at room temperature or below, and by using an evaporation rate of ≈0.2ML/min.), the growth mode is not layer by layer, but the second layer start to grow before the first is completed (Fig. 13, a, b) (Cepek, 2000 a). When the C60 molecules are deposited at a temperature higher than the C60 sublimation temperature, or by annealing a C60 multilayer film, only one single layer of molecules are left on the surface. When the annealing or growing temperature is higher that ≈600K the molecules form a well ordered overlayer, characterized by long range order and by a sharp quasi-hexagonal LEED pattern, where the C60 - C60 distance is ≈10.4Å (see Fig. 13 c).
Organic Molecules on Noble Metal Surfaces: The Role of the Interface
269
The most direct experimental technique, giving detailed information regarding interaction between the fullerene molecules and the substrate, is PES valence band (VB). Fig. 14 left compares the VB spectrum of the ordered monolayer with the clean substrate and the C60 multilayer. The spectra were measured at room temperature (RT) (Cepek, 2000 a). The C60 multilayer spectrum is the typical molecular-like spectrum of this compound. The fivefold degenerate highest occupied molecular orbital (HOMO) derived band lies at energy of ≈2.2eV, while the HOMO-1 derived band has energy of ≈3.6eV. The clean Ag(100) spectrum does not show any features in the HOMO and HOMO-1 energy range, so all the structures observed in the ML spectrum in this region are only due to the C60 adsorbed. We note that the ML spectrum shows an extra emission at the Fermi level compared to the multilayer spectrum, indicating a metallic behaviour. We want to remark that this extra emission cannot be due to the metallic Ag substrate, if the strong attenuation by the C60 layer is considered. So it results that the presence of the peak at the Fermi level is the typical fingerprint of a partially filling of the C60 lowest unoccupied molecular orbital (LUMO) derived band and it means that charge transfer from the Ag substrate to the C60 molecules takes place. By K doping, it has have found that the molecules adsorbed on the monolayer are in a charge state ≈-2 (Cepek, 2000 b)). Finally we want to note that the bond is activated by temperature.
(Cepek et al., 2000 a)
Fig. 13. STM images of different C60 coverages deposited on Ag(100). See text for discussion. Fig. 14, right shows the VB photoemission spectra of 0.7 ML of C60 adsorbed on Ag(001) at 150 K and subsequently annealed to different temperatures (RT and 600 K for ≈ 5 minutes, compared to a thick C60 multilayer (Cepek, 2000 a). The 150 K spectrum has been measured at 150 K, all the others at RT. The deposition of the same quantity of C60 molecules at RT produces a photoemission spectrum (not shown) identical to that of the 150 K deposited film annealed at RT. The same is true for the spectrum of a 600K deposited or annealed film. Also in this case, the adsorption of C60 induces an increase of the photoemission intensity at the FL with respect to the clean surface thereby indicating that in all samples the bond is characterized by charge transfer from silver atoms to C60 molecules. The 150 K and RT VB photoemission spectra show that the HOMO and HOMO-1 derived bands consist of two components: one centered at the same BE of the multilayer spectrum, the other at the BE of one ordered C60 ML. This, combined with the STM images of Fig. 13 a, allows us to attribute
270
Noble Metals
the former component to C60 cages in the second layer and the latter to C60 molecules in direct contact with the substrate. Data fittings (continuous line of Fig. 14, right. See Cepek2000 a, b for more detail) confirms this hypothesis, showing that the percent of the molecules of the second layer is x 24% for the 150K spectrum and x 20% for the RT spectrum. The very good agreement of these results with the value of 17% obtained by STM, confirms that the molecules in direct contact with the substrate present the same bond at 150 K, RT, and 600 K while the second layer molecules do not interact with the substrate, as already observed for different systems (Cepek et al., 2000a). Taking into account that core level spectra indicate that no C60 molecules desorbs passing from 150 K to RT, this indicates that the increased thermal energy enables a fraction of the second layer molecules to descend the step edge and to incorporate in the first layer islands. From a careful inspection of the fittings in Fig. 14 right) (continuous line), one can notice that the 150 K deposited film spectrum is slightly sharper than the simulation result. This is due to the specific phonon broadening of the experimental data (measured at 150 K), which is lower than that used in the simulation, performed using spectra measured at RT. However it presents also lower photoemission intensity at the Fermi level with respect to the simulation, which can not be due to the different temperatures and may indicate a lower C60 charge state, or a higher disorder. In spite of these minor differences, passing from 150 K to RT, there is no evidence for the appearance of two different electronic states corresponding to the two different kinds of molecules (bright and dim) observed in STM images, which may be easily explained with the occurrence of the two molecular orientation revealed by the high resolution STM images (Lu, 2003) and by XPD.
Fig. 14. Left: Valence Band spectra of C60 deposited onto Ag(100) . Clean Ag(100) and C60 Multilayer are compared. Right: Valence Band spectra for different Temperatures. See text for details.
271
Organic Molecules on Noble Metal Surfaces: The Role of the Interface
We discuss two cases systems: the “covalent” C60/Pt(111) (Felici, 2005) with the partially “ionic” C60/Au(110) (Pedio et al., 2000, Hinterstein et el., 2008) systems. Fig. 15 shows the phase diagram of the C60 deposited onto Pt(111) surface. The C60 deposited on Pt(111) at room temperature weakly interacts with the substrate atoms and molecular features measured by electron spectroscopies are similar in intensity and energy separation to the isolated molecule or to C60 multilayer. After annealing the fullerene bond with Pt(111) substrate become strongly covalent. The deposition of one monolayer of C60 on the Pt(111) surface at T < 580°C leads to an ordered double domain hexagonal reconstruction, that is present also for coverages exceeding 1 ML (Pedio et al., 1999, Felici et al., 2005]. a)
d)
Fig. 15. a) Phase diagram of the C60/Pt(111) systems obtained with C60 flux of 0.05 ML/min and slow temperature variations (1 K/min). The peaks belong to the two hexagonal domains separated of 27.8°, b) LEED pattern of the single layer of √13 √ 13R13.9° , c) LEED pattern of the hexagonal 3-domain reconstruction. d) Azimuthal scan of the x-ray scattered intensity for an exchanged vector modulus corresponding to the first order of the √13 √ 13R13.9° reconstruction. The long range molecular ordening formation is a kinetically controlled process. The double hexagonal pattern was observed even for 1 ML adsorbed at 100 K and annealed above 770 K (Cepek et al., 1996). When the sample is heated above 800 K or if less than a complete monolayer is adsorbed at T>670 K, a third domain becomes visible in the LEED pattern. About 10 MLs of C60 were deposited at room temperature. Then the system was slowly annealed while monitoring with the x-rays the appearance of the √13 √ 13R13.9° reconstruction. At about 420 K sharps peaks corresponding to this reconstruction appear. This temperature is much lower than the multilayer desorption of the fullerenes and, in fact, x-ray reflectivity scans show the presence of a well ordered C60 multilayer. In Fig.15 d) we show an azimuthal plot of the intensity of the fist order reconstruction. The two P6 domains separated of 27.8° with a practical equal intensity are clearly observable. Further annealing at 650 K removes the multilayer and leaves only one layer bonded to the surface. The analysis of the CTRs provides the following information: a) the vertical expansion of the topmost substrate layer reduces to 1.1 +/- 0.4 pm, b) the increase in surface roughness is compatible with the presence of one vacancy per reconstruction unit cell in the substrate surface.
272
Noble Metals
From the x-ray diffraction analysis this vacancy helps enormously the structural solution of the system. In our case the vacancy can be considered as a heavy atom with a negative number of electrons and the Patterson must then be interpreted by looking at the negative peaks (Fig.16). The dashed rhombus in the figure shows the surface unit cell of the Pt(111) substrate while the large continuous line rhombus is the surface unit cell of the √13 √13R13.9° reconstruction. The dashed contour lines represent the negative values of the map and the deepest minima are localized around the vacancies and at the Pt surface atom positions. A fitting of the data, assuming only 13 structural parameters, leads to a very simple solution of this complicated system. The surface Pt atoms displace slightly from their bulk terminated positions while the C60 lies on top of the vacancies pointing to the substrate surface with one of its hexagonal surfaces. The fullerene enters as much as possible in the vacancy trying to maximize the number of bonds which are formed with the Pt atoms and about 12 Carbon atoms form directs bonds with the Pt substrate. The C60 lies with one of its hexagonal faces on top of the vacancies at a height slightly larger than in the case of the Pt substrate. Similar results have been also observed in the case of the C60 adsorbed onto the Ag(111) (Li etal. 2009) and the Au(111) surface. Also in these cases the dominant effect is the formation of vacancies at the substrate surface which stabilize the position of the fullerene molecules. In case of Au(111) substrate the number of C-Au bonds is 6, and the herringbone substrate reconstruction is disappeared indicating the release of the stress of the topmost layer, induced by the C60 monolayer.
Fig. 16. a) the Patterson map of the √13 √13R13.9° reconstruction. Because the pattern is dominated by the signal due to a vacancy in the surface unit cell this map has an inverted sign usual. The negative peaks (dashed lines) correspond to the positions of atoms participating in the reconstruction. The dashed rhombus is the Pt(111) surface unit cell. In (b) we show a top view of the best model fit and in (c) a detail on the C atoms forming bonds with the substrate. Figure 17 shows the spectroscopy results of C60 monolayers deposited onto different noble metal surfaces. On the left the photoemission of the C1s core levels of the ordered monolayers (Maxwell et al 1994, Pedio et al. 1999 private communication) are compared (bottom curve) with that relative to the pristine C60. Note that the bulk C60 is a molecular solid tìwith the fullerene that interact by weak, Van der Waals interactions and the spectra are comparable (even though broader) with those obtained on the free molecule in gas
Organic Molecules on Noble Metal Surfaces: The Role of the Interface
273
phase. The experimental width in all monolayers is about 1 eV, a value sensibly higher than that of C60 pristine. This implies that the C atoms in the single layer have different chemical configurations (C-metal bonds) with respect to the C60. Figure 17 left shows a set of IPES spectra for low coverages of C60 deposited on Pt(111) at RT and the single monolayer evolution after annealing at different temperatures. The bottom curves, related to the multilayer and the clean Pt(111), are shown for comparison. The top most spectrum is related to the chemisorbed (6x5) C60/Au(110) that will be discussed in the next section. IPES spectra of the hexagonal phases of a single monolayer are substantially different from the C60-Au(110) where was estimated by electron spectroscopies and an ionic character dominates interaction a charge transfer of 11 (see for discussion Hinterstein et al. 2008, Felici et al. 2009) electron. When the surface is annealed a 2-domain structure is formed rather dramatic changes in the spectrum IPES spectrum occur: the LUMO-derived feature appears centered at 0.5 eV and the spectral weight near EF is greatly increased, indicating that there is a redistribution of the empty states. This fact has been interpreted as a strong interaction between the substrate and the C60 overlayer when the covalent bond takes place. This result nicely confirms the formation of 12 Pt-C bonds, suggested by the SXRD analysis.
C1s XPS Au(110) Au(111) Pt(111) Ag(111) C60 282 283 284 285 286 287 Binding Energy (eV) Fig. 17. a) C1s photoemission spectra of C60 deposited onto Ag(111), Pt(111), Au(110) and pristine C60. b) Example of IPES spectra taken at normal incidence for different C60 overlayers on Pt(111). The spectra for the chemisorbed 1 ML C60/Au(110) (top) and for the multilayer of C60 on the same Au( 110) (bottom) are plotted for comparison (Pedio1999). For the two-domain structure on Pt(111), vibrational studies have indicated no evidence for charge transfer. Actually in case of Pt substrate a further annealing of the system leads to a 3-domain structure and to fragmentation of the fullerene. The corresponding LEED pattern shows graphitic rings. Higher T and longer annealing produces changes in the IPES spectra. At this stage it has been suggested that the fragmentation products consist in pentagon-
274
Noble Metals
hexagon groups, still arranged in a pseudo-order related to graphitic-like features in diffraction, as discussed in ref. Pedio 1999. Upon deposition of 1 ML of C60 on Au(110) it is possible to observe by STM a nice hexagonal pattern of the fullerene layer showing alternating brighter and darker lines. The uncovered regions of Au modify their reconstruction from 1x2 to a 1x5 surface cell. This 1x5 reconstruction is in perfect register with the brighter and darker lines in the STM images leading the authors to conclude that this kind of reconstruction was extending under the fullerene layer (Modesti et al. 1996 cited in Pedio et al. 2000). On clean 2x1Au(110) deposition of few monolayers of C60 followed by thermal annealing leads to the formation of large terraces showing a (6x5) reconstruction. The evolution of the IPES spectra of C60 deposited on Au(110) for different molecular depositions at room temperature (RT) (Pedio et al. 1995 cited in Pedio et al. 2000) shows, for coverages < 1 ML, that all the molecular structures are broader and their energy separation is different with respect to the multilayer spectrum. The first structure (LUMO) is practically not detectable and a clearly Fermi level emission is present. As soon as we reach the second layer, the LUMO feature appears clearly, though the peaks are still broader than in the multilayer system. For 1 ML deposition at about 450 °C we observed, in the LEED pattern, a (6x5) superstructure. The energy position of the features in the IPES spectra corresponds to the peaks of the 1ML C60 grown at RT, while their intensities resulr much more pronounced. The LUMO emission is confused with the Fermi. The topmost spectrum of Fig. 17 b) shows the 6x5 C60/Au(110). During the formation of the first monolayer, when the system is annealed (either during C60 deposition or after) there is a strong deformation of all the molecular C60 localized states due to a charge transfer from the substrate to the C60 indicating a chemisorbed phase. SXRD data confirmed a strong redistribution of the substrate Au atoms induced by the formation of the 6x5 reconstruction after thermal annealing. When analyzed with xray diffraction the structure of the interface appeared to be much more complicated. The substrate reconstruction was not a “simple” 1x5 but a complex 6x5 reconstruction with no obvious symmetries. This makes the data analysis an almost impossible task. For solving this system we have applied direct methods which are able to provide hints on the electronic density maps of the surface unit cell (Pedio, 2000). Starting from the model proposed by the direct methods, we have been able to refine the analysis and obtain a full 3D solution of the system (Hinterstein 2008). The peculiarity of this solution is the proof that fullerene adsorption induces a strong mass transport involving several layers of the substrate. The gold surface modifies itself in order to form a kind of calyx structure where the fullerene molecules fit. Using this proposed structure we have been able to calculate the electronic properties of the interface which can then be compared with the PES data (Fig. 18). The larger contact area between the C60 and the metal, resulting from the substrate rearrangement, allows for the formation of strong directional C-Au bonds. The theoretical simulations based on the SXRD model can single out the contributions of HOMO and LUMO of the spectra in PES and IPS (see Fig. 18), and clarify the LUMO contribution and the “ionicity” character of the bond. Summarizing, in C60 deposited on (111) and (110) substrates the formation of directional bonds between C and substrate reconstructed atoms is the important factor of the high
Organic Molecules on Noble Metal Surfaces: The Role of the Interface
275
degree of metal surface deformation. These dimples formation is a thermally activated process that produce an anchoring of the molecule. The molecular states are results strongly hybridised.
Fig. 18. Left: Comparison between experimental and calculated in-plane data corresponding to the C60/Au(110)-p(6x5) surface reconstruction. The measured values and their associated uncertainties are proportional to the radii of the two empty semicircles. The filled semicircles are proportional to the calculated values using the final structure Right: Lateral views of the C60/Au(110)-p(6x5) surface final structure. The observed corrugation has a height of one atomic level 4.2 Acenes on noble metals Large acenes, C4n+2 H2n+4 (Figure 11 b) are conjugated organic molecules composed by n hexagonal rings, with H atoms, which saturate the frontier C orbitals. The molecular states orientation is perpendicular to the molecular plane. Acenes form molecular crystals with triclinic structure showing polymorphism in the stacking d(001)-spacing (Mattheus 2001). In these crystals the electronic mobility is comparable with silicon (Schöhn 2000a in Mattheus 2001). Thin films of tetracene (Tc, C18H10) and pentacene (Pn, C22H14), appear most promising candidates for the building of molecular organic semiconductors. Their transport properties in case of well-ordered thin films is highly anisotropic and is strongly influenced by the first layer structural, optical and electronic properties (Lukas, 2001, Söhnchen, 2004 Danişman, 2005, Käfer, 2007, Witte, 2004 and references therein). The recent literature is quite rich on this topic. The bond of acenes on metals, have been revealed weaker than that of C60 on the same substrates. The presence of the H atoms at the molecular borders and their morphology reduce the possibility of hybridization with metal states. Different ordered phases are found for Tc and Pn adsorption on noble metals Pn/Au(111) (Witte 2004) (Schroder2003), Pn/Au(110) (Floreano2006, Badvek2008), Pn/Au(111) (Kafer 2007a, Duhm 2008), Pn/Ag(111),(Danişman 2005, Eremtchenko 2005, Pedio 2007, Kaefer2007b), Tc/Ag(111) (Langner et al. 2005) and in some cases the phase diagram appears complex.
276
Noble Metals
As in other cases the growth mode of acenes is controlled by the nature of the substrate surface and the molecular orientation is determined by a competition of molecule-molecule vs molecule-substrate interactions. On noble metal surfaces acenes have a nearly flat orientation likely to allow the conjugated molecular orbital to overlap at different degree with the metal electronic states, while on semiconductors acenes has the tendency to standing up. The orientation of pentacene molecules is controlled by the electronic structure of the substrate, namely the near-Fermi level density of states above the surface controls the interaction of the substrate with the pentacene π orbitals. A reduction of this density, as compared to noble metals, realized in semimetallic Bi(001) and Si(111)(5×2)Au surfaces, results in pentacene standing up (Thayer 2005). The interaction of pentacene with metal surfaces has been studied extensively (Toyoda, 2010 and references therein) Pn/Cu(111) and Cu(110) (Lukas 2002, Lukas 2004). The intermolecular orientation onto noble metal surfaces, generally, adopts the preferred closedpacked side-by-side orientation Lukas 2002, Lukas 2004, but particular geometry of the substrate can induce a head-to head configuration (see for example Floreano, 2006). The film defects formation versus growth protocols and their effect on the subsequent grown layers, are widely discussed in the literature as well as the role of surface defects and stepped surfaces (Lukas 2001, Danişman 2005). A recent DFT theoretical work relates the distance of the molecular plane of Pn from fcc (111) surfaces, with work function changes and the with hybridization of molecular states with substrate electronic properties. Calculation found that the Au(111) is rather “inert” to Pn layer, while pentacene interacting with Ag(111) and Cu(111) induces hybridization and a weak chemical bond. The sequence of the bond strength follows the Hammer Nørskov reactivity model (section 3). Similarly for the PTCDA molecule on (111) the strength of the bond follows the same trend (Duhm et al. 2008 b). On the other hand the interaction has been interpreted as mainly due to a redistribution of the metal substrate charge (“cushion” effect Witte 2005, Bredas 2010, Li 2009) drawn back by the deposition of weak adsorbates. This effect could lead to work function variations after acenes deposition, compatible with the experimental values on noble metals discussed by Baldacchini et al., 2006. High Resolution photoemission of the Pn/Cu(119) and theoretical DFT results indicate that pentacene adsorbed on noble metals has the tendency to redistribute states upon a weak “chemisorption” (Ferretti 2007). For single layer of Pn/Cu(111) and Pn/Cu(110) the broadening of the NEXAFS features (Lukas, 2004) to was attributed to the electron coupling of the the molecular orbital. Based on PES measurements, some kind of hybridization has been proposed for Pn/Cu(111) and Pn/Ag(111) (Jaeckel, 2008), while the molecule-substrate interaction for Pn/Au(111) is considered weaker. Pn on Au(111) is an example of physisorptive organic/metal interface (Koch 2007). The interaction Pn_Au is weak, non-covalent and resulting from different contributions (Duhm2008). In case of Au(111) the Pn forms a variety of ordered phases, up to the completion of the single monolayer. The Au(111) herringbone reconstruction is still detectable by STM images (Schöder2003, Pong et al. 2009). The flat orientation (Käfer2007) of the first layer is related to a W of 0.95 eV and to the formation of an intermolecular dipole
277
Organic Molecules on Noble Metal Surfaces: The Role of the Interface
modelled by an electrostatic model. The existence of a surface dipole built into molecular layers is conceptually different from the surface dipole at metal Surfaces. Its origin lies in the details of the molecular electronic structure and its magnitude depends on the orientation of molecules relative to the surface of an ordered assembly. The analysis of the dependence by incident light polarization of C K-edge NEXAFS of the 1 ML Pn on Ag(111) indicate that the Pn molecule is chemisorbed with a tilt angle of 10°+/5°. Higher tilt angle 25°+/- 5° were found for submonolayer coverages. This deformation of the LUMO with respect to the LUMO transitions in gas phase Pn (Alagia, 2005) is present for coverages close to the single layer (Figure 19, Pedio2007). This framework in the Pn/Ag(111) is also suggested by (Kaefer 2007b). The electronic molecular states changes across this orientation transition. XAS spectra show a redistribution of the oscillator strength in the C 1s LUMO excitations as a function of the Pn coverage, together with modifications of the density of states in the filled HOMO region. Valence band UPS and NEXAFS spectroscopies applied to Tc and Pn adsorption on Ag(111) and Au(111), from subML to 1 ML coverages, show differences in the HOMO and LUMO states related to a redistribution of the molecular states (Pedio, 2008). From NEXAFS, LUMO results strongly modified in the cases of Tc and Pn deposited on Ag(111) substrate and less perturbed on Au(111). resonances
C K-edge
LUMO+1 LUMO 2 6 4 13 5
4 6 3 5 1
gas phase
2
Multilayer
3 ML
2 ML 10° 1 ML 0.5 ML
27°
0.3 ML
284
286
288
290
292
25°
294
296
298
Photon Energy (eV)
Fig. 19. C K edge XAS of Pentacene on Ag(111) at different molecular coverages in monolayer taken at the magic angle (Pedio 2007). Gas phase spectrum is shown (top); the bars indicate the calculated contributions from different inequivalent C atoms (see numbers in the sketch of pentacene molecule).
278
Noble Metals
Further work is in progress to understand the hybridization degree and the dispersion of the molecular states of the various presented systems. In any case we can indicate a progression of the bond from the stronger Pn/Ag(111) to the weaker Tc/Au(111) (Pedio, 2008). The modification of the HOMO and LUMO molecular states confirms the trend found by DFT (Toyoda 2010) and supporting the modification of the molecular states of adsorbed acenes on the Ag(111) substrate and the weaker interaction with Au(111). A peculiar case is the Pn/Au(110). Even in this case the phase diagram is complex (Figures 20 and 21). A multitechnique approach permitted to determine the molecular orientation of the 6x3, 3x6 and 6x8 phases. The phase diagram indicates that that two-dimensional commensurate growth only occurs in the monolayer range for a substrate temperature, Ts, higher than about 370 K. The highest coverage ordered phase displays a (6 x 8) symmetry and corresponds to the saturation coverage at Ts = 420 K. The (3 x 6) phase corresponds to the saturation coverage of the first layer at Ts =470 K. Helium scattering (HAS) experiments provide information similar to the S-XRD. Figure 20 shows HAS along the [001], Y, direction collected at RT after deposition at Ts = 420 K for the (6 x8) phase (filled triangles) and Ts = 470 K for the (6 x 3) and (3 x 6) phases (open circles and filled squares, respectively). The 2-fold symmetry pattern of the clean missing row reconstructed substrate is also reported at the bottom of the graphic (full line). As a guide to the eye, fractional peaks of the eighth order are indicated at the bottom x axis, while fractional peaks of the sixth order are reported at the top x axis.
He diffraction scaled to the (0,0) peak
-1
1.5
-5/6
HAS Y
-2/3
-1/2
-1/3
-1/6
0
1/6
(6 x 8) (3 x 6) (6 x 3) Au(110)
AuY : 4.078 Å 1.0
0.5
0.0 -1
-7/8 -3/4 -5/8 -1/2 -3/8 -1/4 -1/8
0
1/8
Au(110) reciprocal lattice units
(a)
(b)
Fig. 20. a) Phase diagram of pentacene films on Au(110). The (6 x 3) phase is quoted since it has not a well defined equilibrium coverage. The completion of the first monolayer is conventionally assigned between the (3 x 6) and (6 x 8) phases. In figure b are shown the peaks of the different ordered phase The models of the systems were obtained by means of HAS (Floreano, 2006), NEXAFS and STM (Badvek, 2008). In the monolayer range, pentacene forms two commensurate phases with (3 x 6) and (6 x 8) symmetry. The (3 x 6) phase only contains equivalent, perfectly flat molecules that are aligned side-by-side along [001], thus forming crosstie chains extending along the 110 direction. These chains are also preserved in the high coverage (6 x 8)
279
Organic Molecules on Noble Metal Surfaces: The Role of the Interface
phase, but they display a wider separation since new chains are accommodated in between, with the additional molecules aligned head-to-tail along the 110 direction and tilted by approximately 90 around their molecular axis. This structure, formed by three molecules per unit cell (two flat and one tilted), forms large domains of nanorails. In fig. 20 the HAS measurements shows the disappearing of the ½ peak of the gold reconstruction indicating a deconstruction of the Au(110) missing row caused by the molecular deposition. This has been also confirmed by preliminary SXRD results4.
STM Fig. 21. Models of the 3x6 and 6x8 Pn/Au(110) reconstruction, based on He scattering, STM and NEXAFS measurements. The directional pai states of the Pn are presented in red. These results enlighten the local rearrangement of the charge at the interface. A possible depletion of electron charge in correspondence of the new chains, inducing an upstanding orientation of Pn, can be inferred. 4.3 Porphyrine derivatives on noble metals Porphyrine derivatives constitute the essential functional units for many processes and Nature demonstrates their great functionality, variability and chemical stability in many cases. Metalloporphyrin are base components of biological molecules as chlorophyll (Mn porphyrin), emoglobin (Fe porphyrin) and are efficient in the Oxygen exchange. They are formed by a macrocycle and surrounding groups (Fig. 11 right). The central porphine ring is composed by 4 Pyrrole rings linked by methine bridges (porphyrins) or N (Phtalocyanins). By varying the choice of the metal center, the bonding and characteristics of the metalloporphyrin or the phtalocyanine may be dramatically affected. This is reflected in spectroscopic measurements as XPS and XAS. A clear description of the electronic properties of porphirinoids is still under debate in the literature, due to the high degree of variation in the simulations. The energy sequence of the valence and conduction electronic states show discrepancies, indicating that the energy ordering in metal-organic molecules crucially depends on the electronic solution employed and the functional theory adopted (Stenuit et al., 2010, Maron et al. 2008). Porphyrins films grown by various methods (UHV vapour deposition, solutions etc) received a paramount interest and the literature is extremely rich. New interesting results have been achieved recently, as for example a Kondo effect related to the spin of the central atom in Co and Fe phtalocyanines on Au(111), the induced magnetic order of Mn 4
L.Floreano privat communication
280
Noble Metals
porphyrins on Co films as well as magnetic coupling effects (Wende et al. 2007 cited in Fanetti et al. 2011). Recently in the CoEOP deposited onto Ag(110) (Fanetti et al 2011), a charge transfer to the LUMO orbital has been found. DFT calculations indicate that the molecular interaction with the substrate leads to the electron transfer from the Ag substrate to the molecule. This can be responsible of the steric adsorption of the CoOEP, that results titled of 15°, at variance with other similar systems. Porphyrins can be deposited in highly ordered single monolayers on metal surfaces, leading to ordered structures. Covalent interaction between the central metal atom and substrates, the “Cushion” effect induced at the noble metal surface, and the out-of-plane central atom dipole moments plays a role in the different cases. No clear trend, as a function of external group, central metal atom element and substrate element and structure, is still available. On the noble metal (111) surfaces, and often on the (100) planes, both porphyrins and phtalocyanines are found to lay in a planar-like configuration presenting large terraces domains. In case of Au(111) substrates, the herringbone reconstruction remains detectable. The long range ordening of these “floating” molecular layers show dependency on the substrate element and on the kind of porphyrinoid and central metal atom. For example differences between single layers Cu and Ni octaethylporphyrins deposited on Au(111) have been detected in the diffraction patterns and in the electronic properties (Resta et al. 2010). The interaction with (110) substrates appears different. Restructuring has been indicated by STM in case of Cu-phtalocyanine (CuPc) deposited on Ag(110) (ref. Bohringer et al. 1997 cited in Rosei et al. 2003). CuPc induces a transition from thermodynamically controlled 3dimensional faceting at submonolayer coverage, to a kinetically dominated 2-dimensional step faceting process, when coverage approaches a full monolayer. Transition metalphtalocyanine on Au(110) surfaces result regularly spaced. High Resolution PES show interface electronic states close to the Fermi level. Their energies are different from CuPc to FePc and CoPc molecules. Structurally CuPc on Au(110) present a complex phase diagram with strong mass transport of the substrate as a function of the molecular coverage from submonolayer to the 1 ML (Floreano 2008). Again the molecular deposition deconstructs the Au missing row and a set of higher periodicities (x5, x3, x7) are progressively detected along the [001] direction. In conclusion coverage-dependent transformation on fcc 110 substrates seems to be driven by the molecule−substrate interaction. This interaction seems to take place in other porphyrinoid deposited onto fcc (111) substrates but, in any case it appears such that no mass transport of these substrate takes place. Due to the complexity of the roles played, in the balance among interactions, by the central metal atom in the porphyn ring, by the external groups and frontier orbitals, and by the interaction with the metal substrates (polarization, dipoles etc.), a complete understanding of these systems deserve further study. Note, finally, that in some cases the molecular morphology results altered by STM (Donovan et al. 2010).
5. Conclusions Noble metal surfaces offer a variety of structural/electronic moieties which can be used in the organic-inorganic engineering. The comparisons of the similarities and differences of the (111) and (110) surfaces show how the charge reservoir of isotropic or anisotropic electron
Organic Molecules on Noble Metal Surfaces: The Role of the Interface
281
density guides the interaction, from charge transfer to directional bonds, between molecules and substrate. Noble metal surfaces are valuable substrates for building self assembled organic thin layers because of their:
Low chemical reactivity together with high atomic surface mobility resulting in the capability of reordering after molecular deposition. Often order is thermally activated. Good degree of morphological order of the crystal surfaces Guide for the molecular ordering through the symmetry of the surface. If commensurable the overlayer must follow the substrate symmetry. In case the intermolecular interactions prevail, in strength, compared to the molecular-structural the layer can by uncommensurate. High electron density at the crystal surface (in case of (111) in Au, Ag and Cu the electrons form a quasi-two-dimensional gas at surface) providing a charge reservoir.
The details of interaction are crucial for the functionalization of the molecular films. The anchoring of the molecules is due to a combination of effects (Rosei 2005): i) Adaptation of the surface geometry Larger interaction area, that allows to the molecule to fit into the local structure of substrates ; ii) Higher reactivity of the substrate (stronger bond) facilitates the creation of nanodimple sites underneath the molecules. A simple correlation exists between the bonding strength of a molecule and the metal coordination number of the adsorption site d -band model by Hammer and Nørskov. iii) The adsorption inducing restructuring is typically thermally activated: it provides an Energy gain in the adsorption energy Ead of the molecules on the reconstructed surface, balancing the energy cost Emetal required to break the metal bonds The formation of directional bonds seems the base mechanism for the nanopit formation, at least for strong chemisorbed species (as fullerene). C60 induced reconstruction of substrates is thermally activated, even on the close packed fcc (111) surfaces. The molecule results locally perturbed with the electronic properties (particularly the LUMO orbitals), that are modified by the interaction. The structural characterizationof the molecules onto the (110) substrate demonstrates the formation of NANOPITS and/or FACETTING of the metal surface. In case of “flat” and conjugated molecules, as acenes and prophyrin derivatives, the interrelations of the various aspects (morphology, dipoles-electrostatic configuration at interfaces, distribution of the charge of the metal substrate etc…) are particularly evident. Molecular orientation, long range ordening, surface reconstruction and charge (re)distribution (interface dipole, molecular dipole, “cushion” effect) are all present at different but never negligible degree, depending on the chosen molecule and on the substrate morphology/surface energy/reactivity.
6. References Africh C. 2011. Surface Structure and Reactivity laboratory CNR-IOM, TASC Available from: www.tasc.infm.it Alagia, M.; Baldacchini, C. Betti, M. G. Bussolotti, F. Carravetta, V. Ekström, U.; Mariani, C. & Stranges S. (2005). Core-shell photoabsorption and photoelectron spectra of gas-
282
Noble Metals
phase pentacene: experiment and theory. J Chem. Phys Vol. 122, No. 12 (22 March 2005), pp. 124305 Ashcroft, N. W. & Mermin, N. D. (1976). Solid State Physics. Saunders College, HRW ISBN 0-03-083993-9 BALSAC Available from: http://www.fhiberlin.mpg.de/~hermann/Balsac/pictures.html Bassani, F. & Altarelli M. (1983). Interaction of radiation with condensed matter, In Handbook on Synchrotron Radiation, Vol. I, E.E. Koch (Ed), 463-605, North-Holland Publishing Company Amsterdam (1983). Baldacchini, C.; Mariani, C. Betti, M. G. Gavioli, L. Fanetti, M. & Sancrotti, M. (2006). Molecular gap and energy level diagram for pentacene adsorbed on fille d-band metal surfaces. Appl. Phys. Lett Vol. 89, 2006. pp. 152119 1 -3 Bavdek, G.; Cossaro, A. Cvetko, D. Africh, C. Blasetti, C. Esch, F. Morgante, A. & Floreano, L. (2008). Pentacene Nanorails on Au(110). Langmuir Vol. 24 (No. 3), (December 2007), pp 767–772. Benfatto, M. & Felici, R. (2001). Resonant atomic scattering factor theory: A multiple scattering approach:Phys. Rev. B Vol. 64, No.11 (24 August 2001) 115410 (9 pages). Brühwiler, P.; Karis, A. O. & Mårtensson N. (2002). Charge-transfer dynamics studied using resonant core spectroscopies. Review of Modern Physics, Vol. 74, (2002). pp. 703-740 Besenbacher, F. (1996). Scanning tunnelling microscopy studies of metal surfaces, Rep. Prog. Phys. Vol. 59 (1996), pp. 1737–1802 Chen C. (1993). Introduction to Scanning Tunneling Microscopy . Oxford University Press. Cepek, C.; Goldoni, A. Modesti, S. (1996). Chemisorption and fragmentation of C60 on Pt(111) and Ni(110). Phys. Rev. B Vol. 53, (March 15, 1996)pp. 7466– 7472 Available from: http://link.aps.org/doi/10.1103/PhysRevB.53.7466 Cepek, C.; Giovanelli, L.; Sancrotti, M.; Costantini, G.; Boragno, C.& Valbusa U. (2000). Electronic structure and growth mode of the early stages of C60 adsorption at the Ag(001) surface. Surf. Sci. Vols. 454-456, pp. 766-770 Cepek, C.; Sancrotti, M. Greber T. & Osterwalder J. (2000). Electronic Structure of K doped C60 monolayers on Ag(001) Surf. Sci. Vols. 454-456, (2000) pp. 467–471 Cepek, C.; Vobornik, I. Goldoni, A. Magnano, E. Selvaggi, G. Kröger, J. Panaccione, G. Rossi, G. & Sancrotti M. (2001). Temperature-Dependent Fermi Gap Opening in the c(6×4)–C60/Ag(100) Two-Dimensional Superstructure. Phys. Rev. Lett. Vol. 86, (April 2, 2001) pp. 3100-3102 Available from: http://link.aps.org/doi/10.1103/PhysRevLett.86.3100 Clark, D.E.; Unertl, W.N. & Kleban P.H. (1986). Specific-heat anomaly of Au(110) (1 × 2) studied by low-energy electron diffraction Phys. Rev. B Vol. 34 No. 6 (1986) pp. 4379-4381. Danişman, M. F.; Casalis, L. & Scoles, G. (2005). Supersonic molecular beam deposition of pentacene thin films on two Ag(111) surfaces with different step densities. Phys. Rev. B Vol. 72 pp. 085404. Donovan, P.; Robin, A.; Dyer, M. S. Persson, M. & Raval, R. (2010). Unexpected Deformations Induced by Surface Interaction and Chiral Self- Assembly of CoIITetraphenylporphyrin (Co-TPP) Adsorbed on Cu(110):A Combined STM and Periodic DFT Study. Chem. Eur. J. vol. 16, (2010) pp. 11641 – 11652 Available from: http://dx.doi.org/10.1002/chem.201001776 Dose, V. (1985). Momentum-resolved Inverse Photoemission. Surf. Sci. Rep Vol. 5, No. 8 (1985), pp. 337-378. Available from:
Organic Molecules on Noble Metal Surfaces: The Role of the Interface
283
http://www.sciencedirect.com/science/article/pii/0167572985900068 Duhm, S.; Heimel, G.; Salzmann, I.; Glowatzki, H.; Johnson, R. L.; Vollmer, A.; Rabe, J. P. & Koch, N. (2008). Orientation-dependent ionization energies and interface dipoles in ordered molecular assemblies. Nature Materials, Vol. 7, pp. 326-330 Duhm, S; Gerlach, A.; Salzman, I.; Broeker, B.; Johnson, R.L.; Screiber, F. & Koch, N. (2008). b) PTCDA on Au(111), Ag(111) and Cu(111):Correlation of interface charge transfer to bonding distance. Organic Electronics. Vol. 9 pp. 111-118 Eremtchenko, M.; Temirov, R.; Bauer, D.; Schaefer, J. D. & Tautz F. S. (2005). Formation of molecular order on a disordered interface layer: Pentacene/Ag(111). Phys. Rev. B Vol. 72, No. 11 pp. 115430 (9 pages). Fall, C.J.; Bingelli, N. & Baldereschi, A. (2000). Work-function anisotropy in noble metals: Contributions from d states and effects of the surface atomic structure. Phys. Rev. B Vol. 61, No. 12, pp. 8489–8495. Feidenhans’l, R. (1989). Surface Structure Determination by X-ray Diffraction. Surf.Sci Rep., Vol. 10, pp. 105-188. Hammer, B. (2006). Special sites at Noble and late transition metal catalysts. Chemistry and Material Science, Topics in Catalysis, Vol. 37, No.1, pp. 3-16. Hinterstein, M.; Torrelles, X. Felici, R. Rius, J. Huang, M. Fabris, S. Fuess, H. & Pedio, M. (2008). Looking underneath fullerenes on Au(110): Formation of dimples in the substrate, Phys Rev B Vol. 77 No. 15, (2008) pp. 153412 (4 pages), also selected in Virtual Journal of Nanoscale Science & Technology vol 17, May 12, 2008 issue 19. Hüfner, S. (1995). Photoelectron Spectroscopy Principles and applications. Springer Berlin ISNB 3-540-19108-9 Käfer, D; Ruppel, L. & Witte, G. (2007). a). Growth of pentacene on clean and modified gold surfaces. Phys. Rev. B. Vol. 75 pp. 085309. Available from: http://link.aps.org/doi/10.1103/PhysRevB.75.08530 Käfer, D. & Witte, G. (2007). b). Evolution of pentacene films on Ag(111): Growth beyond the first monolayer. Chem. Phys. Lett. Vol. 442. (June 2007) pp. 376-383 Koch, N.; Vollmer, A. Duhm, S. Sakamoto, S. Suzuki, Y. (2007) The Effect of Fluorination on Pentacene/Gold Interface Energetics and Charge Reorganization Energy. Adv. Mater. Vol. 19, (January 2007) pp.112-116. Fanetti, M. Calzolari, A. Vilmercati, P. Castellarin-Cudia, C. Borghetti, P. Di Santo, G. Floreano, L. Verdini, A. Cossaro, A. Vobornik, I. Annese, E. Bondino, F. Fabris, S. Goldoni, A. (2011). The Structure and the Molecule-Substrate Interaction in a CoOctaethyl Porphyrin Monolayer on the Ag(110) Surface. J. Physical Chemistry C in press. Manuscript ID: jp-2011-011233 Felici, R.; Pedio, M. Borgatti, F. Iannotta, S. Capozi, M. Ciullo, G. Stierle, A. (2005). X-ray diffraction characterization of Pt(111) surface nanopatterning induced by C60 adsorption. Nat. Mat. Vol 4 (September2005) pp.688-692. Felici R. & Pedio M. (2009). Nanostructure induces by the adsorption of fullerenes: structural and Electronic properties review paper in Proceedings of the Workshop Synchrotron Radiation and Nanostructures, Papers in Honour of Paolo Perfetti eds A. Cricenti and G. Margaritondo pp. 209-223 (2009), Word Scientific New Jersey, ISBN-13 978-981-4280-83-9 Ferretti, A.; Baldacchini, C. Calzolari, A. Di Felice, R. Ruini, A. Molinari, E. & Betti M. G. (2007). Mixing of Electronic States in Pentacene Adsorption on Copper. Phys. Rev. Lett. Vol. 99 No. 4, July 25, 2007 pp. 046802 (4 pages).
284
Noble Metals
Floreano, L.; Cossaro, A. Cvetko, D. Bavdek, G. & Morgante A Phase Diagram of Pentacene Growth on Au(110). (2006). J. Phys. Chem. B, 110 (10), (February 17, 2006) pp 4908–4913. Floreano, L.; Cossaro, A. Gotter, R. Verdini, A. Bavdek, G. Evangelista, F. Ruocco, A. Morgante, A. & Cvetko, D. (2008). Periodic arrays of Cu-Phthalocyanine chains on Au(110), J. Phys. Chem. C Vol. 112 (2008) pp.10794.2008. Gavioli, L. & Cepek, C. (2008). Ultrathin Fullerene-Based films via STM and STS. In: Applied Scanning Probe Methods (Eds) Bhushan B; Fuchs, H & Tomitori,M. series Nanoscience and Technology, 2008 Sprinter-Verlag Berlin. Gargiani, P.; Angelucci, M. Mariani, C. & Betti M. G. (2010). Metal-phthalocyanine chains on the Au(110) surface: Interaction states versus d-metal states occupancy. Phys. Rev. B Vol. 81, No. 8 pp. 085412 (7 pages). Giudice, E.; Magnano, E. Rusponi, S. Boragno, C. & Valbusa, U. (1998). Morphology of C60 thin films grown on Ag(001) Surf. Sci. Vol. 405 No. 2-3 (5 May 1998) pp. L561-565. Goldoni A. Cepek C. Magnano E. Laine A. D. Sancrotti M. (1998). Temperature dependence of the electronic structure near EF and electron-phonon interaction in C60/Ag(100) single layers. Phys. Rev. B Vol. 58 No. 4, pp. 2228-2332 Li, H.; Duan, Y. Coropceanu, V. & Bredas J-L. (2009). Electronic structure of the pentacenegold interface: a density-functional theory study. Organic Electronics Vol. 10 pp. 1571-1578. Langner, A.; Hauschild, A. Fahrenholz, S. & Sokolowski, M. (2005). Structural properties of tetracene films on Ag(1 1 1) investigated by SPA-LEED and TPD. Surf Sci Vol. 574 (10 November 2004) pp. 153-165. Li, H. L. ; Pussi, K. Hanna, K. J. Wang, L.-L. Johnson, D. D. Cheng, H.-P. Shin, H. Cuartarolo, S. Moritz, W. Smerdon, J. A. Mc.Grath, R. & Diehl R. D.. 2009. Surface Geometry of C60 on Ag(111). Phys. Rev. Lett. Vol. 103 No. 5, pp. 056101 (4 pages). Lu, X.; Grobis, M. Khoo, K. H. Louie, S. G. & Cromie M. F. (2003). Spatially Mapping the Spectral Density of a Single C60 Molecule. Phys. Rev. Lett. Vol. 90 No.9, 096802 (4 pages). Lukas, S.; Vollmer, S. Witte, G. &Woll Ch. (2001). Adsorption of acenes on flat and vicinal Cu(111) surfaces: Step induced formation on lateral order. J.Chem. Phys Vol. 114, No. 22, pp. 10123-10130. Lukas, S.; Witte, G. & Wöll Ch. (2002) Novel Mechanism for Molecular Self-Assembly on Metal Substrates: Unidirectional Rows of Pentacene on Cu(110) Produced by a Substrate-Mediated Repulsion Phys. Rev. Lett. Vol. 88, No. 2 (December 28, 2002) pp. 028301 (4 pages). Lukas, S.; Söhnchen, S. Witte, G. & Wöll Ch.. (2004). Epitaxial growth of pentacene films on metal surfaces. Chem.Phys.Chem Vol. 5 pp. 266-270. Lüth, H. (1996) Surfaces and Interfaces of Solid Materials, Springer Berlin. ISBN 3-54058576-1 3. Marom N.; Hod, O. Scuseria, G. E. & Kronik L. 2008. Electronic structure of copper phthalocyanine: A comparative density functional theory study. J. Chem. Phys. Vol. 128, No. 16. pp. 164107-(6 pages). Mattheus, C. C.; Dros, A. B. Baas, J. Meetsma, A. de Boer, J. L. & Palstra T.M. Polymorphysm in pentacene. (2001) Acta Crystallographica Section C Crystal Structure Communications Vol. C57 pp. 939-941. ISSN 0108-2701.
Organic Molecules on Noble Metal Surfaces: The Role of the Interface
285
Maxwell, A. J.; Brühwiler, P. A. Nilsson, A. Mårtensson, N. & Rudolf P. (1994). Photoemission, autoionization, and x-ray-absorption spectroscopy of ultrathin-film C60 on Au(110). Phys. Rev. B Vol. 49 No. 15, (April 15, 1994) pp. 10717 –10725. NIST X-ray Photoelectron Spectroscopy Database 20, version 3.4 (Web version), http://srdata.nist.gov/xps/ Nickel, B.; Fiebig, M. Schiefer, S. Göllner, M. Huth, M. Erlen, C. & Lugli P. (2008). Pentacene devices: Molecular structure, charge transport and photo response Phys. Stat.Sol. (a) pp. 205, No. 3, pp. 526–533. Pedio, M.; Hevesi, K. Zema, N. Capozi, M. Perfetti, P. Gouttebaron, R. Pireaux, J.-J. Caudano R. & Rudolf, P. (1999). C60/metal surfaces: adsorption and decomposition. Surf. Sci. Vol. 437, (June 1999) pp. 249- 260. Pedio, M.; Felici, R. Torrelles, X. Rudolf, P. Capozi, M. Rius, J. & Ferrer S. (2000). Study of C60/Au(110)-p(6×5) Reconstruction from In-Plane X-Ray Diffraction Data Phys. Rev. Lett. Vo. 85 No. 5, pp. 1040-1043. Pedio, M.; Doyle, B. Mahne, N. Giglia, A. Borgatti, F. Nannarone, S. Johansson, S. Temirov, R. Tautz, S. Casalis, L. Hudej, R. Danisman, M.F. & Nickel B. (2007). Growth of Pentacene on Ag(111) surface: A NEXAFS study. Applied Surface Science Vol. 254, pp. 103-107 Pedio, M.; Doyle, B. Mahne, N. Giglia, A. Nannarone, S. Montecchi, M. Pasquali, L. (2008). J. Phys.: Conf. Ser. Molecular states of polyacenes grown on noble metal surfaces. Vol. 100 pp. 052072 1-4, IVC-17/ICSS-13 and ICN+T2007 Lund July 2007. Available from: http://iopscience.iop.org/1742-6596/100/5/052072/ Pong, I. F.; Yau, S. Huang, P-Y. & Chen, M.-C. (2009). In situ STM Imaging of the Structures of pentacene Molecules adsorbed on Au(111). Langmuir, Vol 25, No 17 (November 2009) pp. 9887-9893. Resta, A.; Felici, R. Kumar, M. & Pedio M., (2010). Ni and Cu octaethyl porphyrins ordered monolayer on Au(111) surfaces. Journal of Non-Crystalline Solids Vol. 356 pp. 1951–1954.Robinson, I.K. (1986). Crystal truncation rods and surface roughness. Phys. Rev. B Vol. 33, No. 6, (march 1986), pp. 3830-3836. Robinson, K. & Tweet D. J. (1992). Surface X-ray diffraction. Rep. Prog. Phys. Vol. 55, pp. 599651. Available from: http://iopscience.iop.org/0034-4885/55/5/002. Rosei, F.; Schunack, M. Naitoh, Y. Jiang, P. Gourdon, A. Laegsgaard, E. Stensgaard, I. Joachim, Ch. & Besenbacher F. 2003. Properties of Large organic molecules on metal surfaces. Progress in Surface Science Vol. 71, pp. 95-146. Sandy, A.R.; Mochrie, S.G.J. Zehner, D.M. Huang, K.G. & Gibbs D. (1991). Structure and phases of the Au(111) surface: X-ray-scattering measurements. Phys Rev B Vol. 43 No. 6, (15 feb 1991) pp. 4667- 4687. Schöder, P. G.; France, C. B. Park, J. B. & Parkinson B. A. (2003). Orbital Alignment and Morphology of Pentacene Deposited on Au(111) and SnS2 Studied Using Photoemission Spectroscopy . J. Phys. Chem. B Vol. 107. No. 10 (February 2003) pp. 2253-2261 Scudiero, L.; Barlow, D.E. & Hipps, K.W. (2002). Scanning Tunneling Microscopy, Orbital Mediated Tunneling Spectroscopy, and Ultraviolet Photoelectron Spectroscopy of Nickel(II) Octaethylporphyrins Deposited from vapor. J. Phys. Chem. B, Vol. 106, pp. 996-1003.
286
Noble Metals
Singh-Miller, N. E. Marzari, N. (2009). Surface energies, work functions, and surface relaxations of low-index metallic surfaces from first principles. Phys Rev. B Vol. 80 No. 23 (2009) pp. 235407 (9 pages). Smoluchowski, R. (1941). Anisotropy of the Electronic Work Function of Metals. Phys. Rev. Vol. 60, No. 9 pp. 661-674 . ISSN 0031899X. Söhnchen, S.; Lukas, S. & Witte, G. (2004). Epitaxial growth of pentacene films on Cu(110). J. Chem. Phys. Vol. 121, pp. 525. Available from: http://jcp.aip.org/resource/1/jcpsa6/v121/i1/p525_s1 Stenuit, G.; Castellarin-Cudia, C. Plekan, O.K. Feyer, V. Prince, K.C. Goldoni, A. & Umari, P. (2010). Valence electronic properties of porphyrin derivatives. Phys Chem Chem Phys Vol. 12, No. 36, pp. 10812 (7 pages). Available from: http://pubs.rsc.org/en/content/articlelanding/2010/cp10.1039/c004332j Stöhr, J. (1992). NEXAFS Spectroscopy, Springer-Verlag Berlin ISBN 3-540-54422-4 Stolze, P. (1994). Simulation of surface defects. J. Phys::Condens. Matter Vol 6 (1994) pp. 94959517 Toyoda, K.; Hamada, I. Lee, K. Yanagisawa, S. & Morikawa, Y. (2010). J. Chem. Phys. Vol. 132 pp. 134793 (9 pages). Thayer, G.E.; Sadowski, J. T. Meyer zu Heringdorf, F. Sakurai, T. & Tromp R. M. (2005). Phys. Rev. Lett. Vol. 95, No.25 pp. 256106 (9 pages). Triguero, L.; Pettersson, L.G. M. & Ågren, H. (1998). Calculations of near-edge x.ray absorption spectra of gas-phase and chemisorbed molecules by means of densityfunctional and transition-potential theory. Phys. Rev. B Vol. 58, No.12 pp. 8097-8110. Vitos, L.; Ruban, A. V. Skiver, H.L. & Kollàr, J. (1998). The Surface energy of metal. Surf. Sci. Vol. 441, No. 1-2 (August 1998) pp. 186-202. Available from: http://www.sciencedirect.com/science/article/pii/S003960289800363X van Hove, M. A.; Koestner, R. J. Stair, P. C. Biberian, J. P. Kesmodel, L. L. Bartos, I. & Somorjai, G. A. (1981). The surface reconstructions of the (100) crystal faces of iridium, platinum and gold: I. Experimental observations and possible structural models. Surf. Sci. Vol. 103, No.1. (1 feb 1981), pp. 189-217. Vlieg, E.; (2000). ROD: a program for surface X-ray crystallography J. Appl. Cryst. Vol. 33, pp. 401- 405. ISSN 0021-8898 Witte G. & Wöll Ch. (2004). Growth of aromatic molecules on solid substrates for applications in organic electronics J. Mater. Res. Vol. 19, No. 7, pp. 1889- 1916 and references therein. Witte, G.; Lukas, S. Bagus, P.S. & Wöll, Ch. (2005). Vacuum level alignment at organic/metal junctions:”Cushion” effect and the interface dipole. Appl. Phys. Lett.Vol. 87 pp. 263502 (3 pages). Werner W. Tutorial on Electron Spectroscopies. 20.10.2011. Available from: http://eaps4.iap.tuwien.ac.at/~werner/qes_tut.html#main Woodruff, D. P. & Delchar, T. A. (1988). Modern Techniques of Surface Science. Cambridge University Press ISBN 0 521 35719 5. Zahn, D. R.T.; Gavrila, G. N. & Gorgoi M. (2006). The transport gap of organic semiconductors studied using the combination of direct and inverse photoemission. Chemical Physics Vol. 325 pp. 99–112
13 The Effect of Addition of ppm-Order-Pd to Fe-K Catalyst on Dehydrogenation of Ethylbenzene Ryo Watanabe, Yasushi Sekine, Masahiko Matsukata and Eiichi Kikuchi Department of Applied Chemistry, Waseda University Japan 1. Introduction Styrene, used for polymeric materials such as polystyrene resin, acrylonitrile–butadiene– styrene resin, and styrene–butadiene rubber, is an important monomer in the petrochemistry (Meima et al., 2001). The styrene production volume is about 23 million tons annually; more than 90% of styrene is produced by dehydrogenation of ethylbenzene, as in the following chemical equation (1) (Shekhah et al., 2004). C8H10 → C8H8 + H2
(1)
Dehydrogenation of ethylbenzene is an endothermic reaction. High temperatures are necessary for high ethylbenzene conversion because of its thermodynamic limitation. Potassium promoted iron oxide (Fe–K) has been applied for dehydrogenation of ethylbenzene as an industrial catalyst (Lee, 1974). The Fe–K catalyst can be further modified by the addition of other promoters such oxides as MgO, Cr2O3, CeO2 and MoO3 (Eggertsen et al., 1947; Kearby et al., 1945; O’Hara, 1975; Pitzer, 1957; Riesser, 1979). Generally, radial-type adiabatic reactors have been applied in commercial processes for dehydrogenation of ethylbenzene (Addiego, 2001). Superheated steam is supplied to the catalyst bed with ethylbenzene as a heating source for control of the reaction temperature. Steam also acts as a diluent for shifting the equilibrium conversion higher and suppresses over-reduction of the catalyst in the dehydrogenation atmosphere. Additionally, steam has the role of elimination of carbon deposition on the catalyst surface. The removal of coke from the catalyst surface using steam treatment improved the catalytic activity and that a low H2O/ethylbenzene ratio caused coke deposition on the catalyst (Herzog et al., 1984; Devoldere et al., 1999). It was also reported that the increasing the feed molar-ratio of H2O/ethylbenzene decreased the carbon deposition (Coulter et al., 1995). The reaction mechanism of dehydrogenation of ethylbenzene on the Fe–K catalyst has been investigated widely. Langmuir–Hinshelwood (L–H) type including chemisorption of ethylbenzene and styrene proceeded on the Fe-K catalyst according to kinetic studies (Carrà et al., 1965). Analysis of infrared spectroscopy indicated that ethylbenzene adsorbed with the phenyl ring oriented to -Fe2O3 (Busca et al., 1984). The styrene adsorption state on Fe2O3 catalyst was reported that styrene adsorbed via the vinyl group on the catalyst. (Addiego et al., 1994). The result of isotope exchange reaction revealed that the dissociation
288
Noble Metals
of -hydrogen of ethylbenzene was the first step of ethylbenzene dehydrogenation, followed by the dissociation of -hydrogen, which was the rate-determining step or post rate-determining step. (Miura et al., 1994) Some researchers investigated the active phase of the Fe-K catalyst and showed KFeO2 phase as the active site for dehydrogenation of ethylbenzene using a combination of XPS/UPS surface analysis (Hirano et al., 1986; Muhler et al., 1989, 1992). The active state of the Fe–K catalyst was analysed by transient response experiments and reported that initially high activity was correlated with Fe3+ state and the reduction from Fe3+ to Fe2+ state caused deactivation of the catalytic activity (Zhu et al., 2004). The reaction cycle was proposed that ethylbenzene adsorbed onto a terrace Fe3+ site; then C–H in the ethyl group was deprotonated by lattice oxygen at a step site. H2O containing a lattice oxygen was postulated to desorb on the catalyst instead of H2, meaning that oxidative dehydrogenation proceeded on the Fe-K catalyst (Weiss et al., 2000). Recently, it was reported that the addition of small amounts of Pd or Pt enhanced the activity of Fe–K based catalysts (Williams et al., 2002). Previously we investigated hydrogen production by the steam–iron reaction using iron oxide modified with very small amounts of Pd at the temperature of 723 K and under atmospheric pressure. The addition of ppmorder Pd to iron oxide enhanced rates of the reduction by H2 and the oxidation by H2O (Urasaki et al., 2005). This work is intended to clarify the role of added precious metals such as Pd and Pt in relation to the reaction mechanism of dehydrogenation of ethylbenzene on the Fe–K catalyst (Sekine et al., 2008).
2. The activity for dehydrogenation of ethylbenzene over ppm-order Pd/Fe-K catalyst For investigating the effect of Pd addition to the Fe-K catalyst on dehydrogenation activity and selectivity to styrene, we compared the result of activity tests on the Fe-K catalyst and Pd-promoted Fe-K catalyst. (Section 2.1) And also, the effect of Pd loading on dehydrogenation activity was investigated in the section 2.2. 2.1 Comparison of the activity and selectivity over Pd/Fe-K catalyst to those over bare Fe-K catalyst Catalysts used in this study were commercially available Fe-K catalyst and Pd/Fe-K catalyst prepared by an impregnation method on the Fe-K catalyst. Fe-K mixed oxide which contained some promoters such as 10 wt%K2O, 10 wt%CeO2 and trace amounts of MoO3, MgO and CaO immersed in an aqueous solution of the metal precursor salt of Pd(NO3)2. The amount of Pd was 10, 30, 300 and 1000 ppm. Then, the resulting slurry was dried on a hot plate under continuous stirring with subsequent calcination at 873 K for 6 h. Pt catalyst was prepared using the same impregnation method with an acetone solution of Pt(CH3COO)2. The reactor used in this study comprised of a quartz tube (12-mm i.d.) containing the catalyst bed, which was fixed by quartz wool. A type K thermocouple enclosed in a quartz thermowell of 3-mm outer diameter was positioned inside the catalyst bed for accurate measurement of the catalyst temperature. Catalytic activities, selectivities and stabilities were examined in a conventional fixed bed flow reactor. The weight of charged catalyst was 1.0 g. Reactions were carried out at 813 K at
The Effect of Addition of ppm-Order-Pd to Fe-K Catalyst on Dehydrogenation of Ethylbenzene
289
atmospheric pressure in the presence of steam; the molar ratio of steam to ethylbenzene was 12 and WHSV was 1.2 g h-1 g-cat-1. Ethylbenzene and H2O were fed separately using a micro feeder and a micro pump, respectively. Liquid products such as ethylbenzene, benzene, toluene and styrene were analysed using off-line flame ionization detection (FID) gas chromatography (GC8A; Shimadzu Corp.) with a capillary column of DB210 (0.25 mm×30 m) using N2 as a carrier gas at 373 K. Tetralin was used as an internal standard substance. Gaseous products such as H2, CO and CH4 were analyzed using an off-line thermal conductivity (TCD) gas chromatography (GC8A; Shimadzu Corp.) with a 3 mm×2 m stainless steel column packed with active carbon (60/80 mesh) using Ar as a carrier gas at 393 K. Ethylbenzene conversion = ([Sty] + [Bz] + [Tol])/([EB] + [Sty] + [Bz] + [Tol])×100
(2)
Styrene yield = [Sty]/([EB] + [Sty] + [Bz] + [Tol])×100
(3)
Styrene selectivity = [Sty]/([Sty] + [Bz] + [Tol])×100
(4)
In these equations, [EB], [Sty], [Bz], and [Tol], respectively represent the yield of ethylbenzene, styrene, benzene, and toluene. Carbon balances of these investigations amounted to ≥95%. For investigating the effect of Pd addition to the Fe–K based catalyst on dehydrogenation activity and selectivity, activity tests of the Fe–K and 10 ppm-Pd/Fe–K catalysts were carried out.
100
40 95 30 90 20
Styrene selectivity / %
Ethylbenzene conversion / %
50
85 10
0
80 0
1
2
3
4
5
6
Time on stream / h Fig. 1. Ethylbenzene conversion and styrene selectivity of (,) Fe-K catalyst and (,) Pd/Fe-K catalyst.
290
Noble Metals
Figure 1 shows the conversion of ethylbenzene and selectivity to styrene for these catalysts with time on stream. The Fe-K catalyst showed 24.1% of conversion at 1 h reaction. Ethylbenzene conversion was gradually decreased to 22.4% at 5 h reaction. On the other hand, 10 ppm-Pd/Fe-K catalyst showed 26.8% of conversion at 1 h reaction and 27.4% of conversion at 5 h reaction. The addition of small amount of Pd enhanced the activity for dehydrogenation of ethylbenzene over the Fe-K catalyst. Catalytic activity of 10 ppmPd/Fe–K catalyst was stable for 3 to 5 h at least. As for the selectivity to styrene, the Fe-K catalyst showed 97.2 and 97.3% at 1 h and 5 h, respectively. Benzene and toluene were formed as by-products with selectivities of 1.1% and 1.7%, respectively. While, 10 ppmPd/Fe–K catalyst revealed 97.8% selectivity to styrene at 1 h and 5 h. Selectivities to benzene and toluene were 1.1% and 1.1%, respectively at 1 h. The effect of addition of ppm-order-Pd to the Fe-K catalyst enhanced for dehydrogenation activity drastically and also improved selectivity to styrene. 2.2 The promotion effect of Pd on dehydrogenation activity of Fe-K catalyst From section 2.1, we found that the trace amount of Pd addition to the Fe-K catalyst enhanced dehydrogenation activity. So, the promotion effect of Pd loading (the amount of Pd; 10, 30, 300 and 1000 ppm) on the Fe-K catalyst on dehydrogenation activity was investigated. Figure 2 shows the result of activity tests over various catalysts.
40
Styrene yield / %
30
20 Fe-K 10 ppm 30 ppm 300 ppm 1000 ppm
10
0 0
1
2
3
4
Time on stream / h Fig. 2. The effect of Pd loading on styrene yield.
5
6
The Effect of Addition of ppm-Order-Pd to Fe-K Catalyst on Dehydrogenation of Ethylbenzene
291
Figure 2 reveals that the conversion of ethylbenzene increases from 23.4% to 33.5% at 1 h reaction with increasing the amount of Pd. Figure 3 shows the relation between the initial catalytic activity and Pd concentration. As shown in fig. 2, catalysts of 10 ppm-Pd/Fe-K and 30 ppm-Pd/Fe-K showed high stability for dehydrogenation of ethylbenzene with time on stream. However, deactivation proceeded on catalysts of 300 ppm-Pd/Fe-K and 1000 ppm-Pd/Fe-K. From fig. 3, the effect of the addition of Pd seems to be saturated at a few hundred ppm of Pd on the surface of catalyst. Therefore, the optimum amount of Pd was less than 300 ppm in terms of activity and stability for dehydrogenation of ethylbenzene.
Ethylbenzene conversion / %
40
30
20
10
0 0
400 800 Pd content / ppm
1200
Fig. 3. Relation between the initial catalytic activity and Pd concentration. For investigating the effect of the Pt addition to the Fe–K catalyst on dehydrogenation activity and selectivity, the activity test of Pt/Fe–K catalyst was carried out in the fixed-bed flow reactor at 813 K. Loading of Pt on the Fe-K catalyst was equivalent mole of 300 ppmPd/Fe-K catalyst. Figure 4 shows the result of activity and selectivity of the Fe-K, Pd/Fe-K and Pt/Fe-K catalysts. As shown in fig. 4, Pt/Fe-K catalyst showed 36.5 % and 31.6 % of conversion at 1 h and 5 h, respectively. Comparing conversion of Pt/Fe-K catalyst and Fe-K catalyst, trace amounts of Pt also enhanced the activity of the Fe-K catalyst. However catalytic activity of Pt/Fe–K catalyst gradually decreased with time on stream. Styrene selectivity was almost the same to that of the Fe-K catalyst. The result indicated the active site did not change by the addition of trace amounts of Pt to the Fe-K catalyst.
292
Noble Metals
100
40 95 30 90 20
Styrene selectivity / %
Ethylbenzene conversion / %
50
85 10
0
80 0
1
2 3 4 Time on stream / h
5
6
Fig. 4. Ethylbenzene conversion and styrene selectivity of (,) Fe-K catalyst, (,) Pd/FeK catalyst and (,) Pt/Fe-K catalyst.
3. Reaction mechanism of dehydrogenation of ethylbenzene over Pd/Fe-K catalyst In order to clarify the role of Pd, we investigated the reaction mechanism using periodical pulse experiments with reactants of ethylbenzene and H2O supplied alternately to the catalyst bed. The period of each pulse was 600 s. The weight of charged catalyst was 1.0 g. Ethylbenzene and H2O were supplied using a bubbler with He as a carrier gas. The molar ratio of ethylbenzene to He was 1/20; the total flow rate was 7.8×10⁻² mol h-1. The molar ratio of H2O to He was 1/8, and the total flow rate was 8.4×10⁻² mol h-1. Reaction temperature was 783 K. The product composition at the reactor outlet was monitored continuously using an on-line quadruple mass spectrometer (HPR20; Hiden Analytical Ltd.). Calibration of mass spectrometer signals was based on prepared mixtures of a known composition. For all periodical experiments, the gas-phase composition was calculated from the mass signal at the following m/e = 2 (H2), 4 (He), 18 (H2O), 78 (styrene), and 91 (ethylbenzene). Figure 5 shows the fraction of H2O in produced hydrogen species ([H2O]/([H2] + [H2O]) and the conversion of ethylbenzene when the pulse test was conducted on the Fe–K catalyst.
293
The Effect of Addition of ppm-Order-Pd to Fe-K Catalyst on Dehydrogenation of Ethylbenzene
Only H2O
40
2
80
60
30
2
EB conversion EB conversion
2 2
Conversion of H O to H / -
Only EB 50
2
Ethylbenzene conversion / % H O/(H +H O) / %
Only EB 100
20
40
20
H2O conversion
H2O/(H2+H2O)
10 H2O/(H2+H2O)
0 0
300
600
900
1200
1500
0 1800
Reaction time / sec
Fig. 5. Results for the periodical pulse reaction test over the Fe-K catalyst (Sekine et al., 2008). In the case of feeding EB-alone to the catalyst bed, products were styrene and H2O at the initial stage of the reaction. H2 was gradually produced with decreasing of H2O production. The fraction of H2O and the conversion of ethylbenzene showed a high value at the starting time of the reaction. This steep and straight decrease of ethylbenzene conversion from 0 s to 100 s could be attributed to the domination of oxidative dehydrogenation of ethylbenzene (5) because the ratio of H2O/(H2 + H2O) was close to 1 at the early stage of the reaction. C8H10 + O2-lat → C8H8 + H2O + Vox + 2e-
(5)
Here, O2-lat denotes lattice oxygen in the Fe-K catalyst and Vox shows the lattice vacancy. Oxidative dehydrogenation, by which styrene and H2O were formed, competed with and progressed faster than, the simple dehydrogenation (6) (Langmuir-Hinshelwood type reaction) which formed styrene and H2. C8H10 → C8H8 + H2
(6)
Afterward, the conversion of ethylbenzene and fraction of H2O decreased and reached a steady state. When H2O supplied to the catalyst bed after feeding EB-alone, we confirmed the production of H2. H2 was considered to be produced through the following reaction (7). H2O + Vox + 2e-→ O2-lat + H2
(7)
Then, EB-alone was supplied to the catalyst bed again. We observed the formation of styrene and H2O as products. The reactivity seemed to be recovered by the oxidation of the catalyst by H2O. Hence, we concluded that the steady-state reaction mechanism of dehydrogenation of ethylbenzene on the catalyst was redox-type using the lattice oxygen in the catalyst.
294
Noble Metals
We also investigated the reaction mechanism of 30 ppm-Pd/Fe-K catalyst using periodical pulse experiments with reactants of ethylbenzene and H2O supplied alternately to the catalyst bed. Figure 6 shows the results of the modified Fe–K catalyst with small amount of Pd. Only H2O
80
40
2
50
2
Conversion of H O to H / %
Only EB
60
2
30 EB conversion
EB conversion
2
2
Ethylbenzene conversion / % H O/(H +H O) / %
Only EB 100
40
20
20
H2O conversion
H2O/(H2+H2O)
10 H2O/(H2+H2O)
0 0
300
600
900
1200
1500
0 1800
Reaction time / sec
Fig. 6. Results for the periodical pulse reaction test over the 30 ppm-Pd/Fe-K catalyst. Oxidative dehydrogenation of ethylbenzene (5) also proceeded on the catalyst by using lattice oxygen in the catalyst. And simple dehydrogenation (6) proceeded on the catalyst when lattice oxygen in the catalyst was consumed. After feeding EB-alone, H2O supplied to the catalyst bed. H2 was also produced by the oxidation of the catalyst by H2O (7). When EBalone was supplied to the catalyst again, the reactivity was recovered by the oxidation of the catalyst by H2O. Therefore we concluded that redox-type mechanism using the lattice oxygen proceeded on the catalyst. Comparing results of periodical experiments of the Fe-K catalyst and Pd/Fe-K catalyst, there was a difference in the formation rate of H2. Pd/Fe-K catalyst revealed higher oxidation rate at 600 s. So, the effect of ppm-order-Pd addition to the Fe-K catalyst on the enhancement dehydrogenation activity was investigated in terms of reaction mechanism in the next section.
4. The role of Pd on dehydrogenation of ethylbenzene in terms of reaction mechanism For investigating the role of Pd for dehydrogenation of ethylbenzene in terms of reaction mechanism, we calculated the ratio of amounts of reactive lattice oxygen to total amounts of lattice oxygen in the catalyst and elucidated the effect of ppm-order Pd addition on redox property of catalysts (Section 4.1). And also, we considered the relation between the redox property of the catalyst and activity for dehydrogenation of ethylbenzene in this section 4.2.
The Effect of Addition of ppm-Order-Pd to Fe-K Catalyst on Dehydrogenation of Ethylbenzene
295
4.1 Promotion of regenerating rate of lattice oxygen We compared rates of release/regenerating of lattice oxygen over the Fe-K catalyst and Pd/Fe-K catalyst from figures 5 and 6. Here, the release rate of lattice oxygen was regarded as styrene formation rate at the time when feeding of ethylbenzene was started and regenerating rate of lattice oxygen was regarded as H2 formation rate at the time when feeding of H2O was started after feeding of EB-alone. Figure 7 shows the O2-lat balance in the catalysts during periodic pulse experiments.
Only H2O
Only EB
Only EB
0.2
Pd/Fe-K catalyst
-0.2 Fe-K catalyst -0.4
O
2lat
balance in catalyst / %
0
-0.6
-0.8 0
300
600
900
1200
1500
1800
Reaction time / sec Fig. 7. Lattice oxygen balance in Fe-K and 30 ppm-Pd/Fe-K catalyst in the periodic pulse experiments (Sekine et al., 2008). From figures 5, 6 and 7, we found the steep and straight decrease of ethylbenzene conversion from 0 s to 100 s could be attributed to the domination of oxidative dehydrogenation of ethylbenzene. So the amount of lattice oxygen was calculated by integration of releasing lattice oxygen from 0 s to 100 s. As a result, the amount of lattice oxygen showing high reactivity was inferred to be 1.7×10⁻⁵ mol g-1, which was about 25%of surface lattice oxygen from the BET surface area (ca. 2 m2 g-1). The amount of lattice oxygen decreased in a straight trend in 100– 600 s, implying that the concentration of surface lattice oxygen reached a steady state and dominated by the bulk diffusion. On the other hand, we found that the lattice oxygen that was consumed by ethylbenzene was regenerated by H2O because H2 was formed by the reaction with H2O. The initial conversion of H2O to H2 was 20% at 600 s in fig. 5, subsequently, the conversion of H2O decreased. The regeneration rate of lattice oxygen decreased from 1.7×10⁻⁷ mol s-1 g-1 to 4.1×10⁻⁸ mol s-1 g-1 at 700 s; then it reached the steady state. The amount of lattice oxygen that was regenerated before 700 s was 1.7×10⁻⁵ mol g-1.
296
Noble Metals
The total amount of lattice oxygen regenerated during the oxidation reaction with H2O was 3.3×10⁻⁵ mol g-1, which was 52% of the lattice oxygen consumed by ethylbenzene. The reactivity to ethylbenzene was mostly recovered by the oxidation with H2O. As a result, we found that added Pd did not change the release rate of lattice oxygen, but enhanced regenerating rate of lattice oxygen in the catalyst. So enhancement of the regenerating rate of lattice oxygen might affect the activity for dehydrogenation of ethylbenzene. Based on these results, we considered that the mechanism as follows; oxidative dehydrogenation was competitive with and faster than simple dehydrogenation; H2O regenerated the surface lattice oxygen, showing high reactivity with ethylbenzene. The surface lattice oxygen was consumed by oxidative dehydrogenation of ethylbenzene and regenerated by H2O. Previous reports showed that H2O inhibited over-reduction of the catalyst. H2O also acted as a diluent for shifting the equilibrium conversion higher and inhibited carbon deposition on the catalyst surface. However, in this work we considered that H2O had the role of oxidant for the catalyst. Comparing the result of periodic pulse experiment between the Fe–K catalyst (Fig. 5) and Pd/Fe–K catalyst (Fig. 6), there were no appreciable differences on the conversion of ethylbenzene and the fraction of H2O. The rate of consumption of the lattice oxygen on each catalyst showed the same value, which was 1.7×10⁻⁷ mol g-1 s-1. The amount of the lattice oxygen showing high reactivity was 1.7×10⁻⁵ mol g-1, which was 25% of the amount of surface lattice oxygen. Consequently, we conclude that added Pd changed neither the rate of dehydrogenation of ethylbenzene nor the amount of the lattice oxygen giving high reactivity. On the other hand, the initial conversion of H2O to H2 was increased from 20% to 30% by adding Pd to Fe–K catalyst at 600 s in figs. 5 and 6 when H2O supplied to the catalyst. We found that surface lattice oxygen was regenerated promptly within 70 s. The initial rate of regeneration of lattice oxygen was increased by adding Pd. At 670 s of the periodic pulse experiment, regeneration rate of lattice oxygen reached a steady state. H2O regenerated 83% of lattice oxygen consumed by ethylbenzene after steam feed of 600 s, the amount of which was 5.6×10⁻⁵ mol g-1. These results indicated that added Pd promoted the regeneration of lattice oxygen by H2O although it did not affect the rate of dehydrogenation of ethylbenzene or the amount of the lattice oxygen giving a high reactivity. The amount of added Pd was 2.8×10⁻⁷ mol g-1, which was 1.6% of the surface lattice oxygen giving a high reactivity. We found that the addition of Pd fewer than the surface lattice oxygen to Fe-K enhanced the catalytic activity. 4.2 The relation between the regeneration rate and steady-state activity We showed that adding Pd improved the dehydrogenation activity by enhancement of regeneration rate of lattice oxygen. In this section, further experiments by changing the amount of Pd on the Fe-K catalyst were carried out for elucidating redox-type mechanism proceeding on a series of catalyst. The relationship among Pd content on the Fe-K catalyst, styrene formation rate in steady-state and releasing rate of lattice oxygen was investigated. Figure 8 shows the relationship between Pd content on the Fe–K catalyst and the rate of styrene formation/consumption of lattice oxygen. As a result, there was no relation among Pd concentration on the Fe-K catalyst, the rate of styrene formation and releasing rate of lattice oxygen. Further experiments indicated that added Pd did not affect the property of releasing lattice oxygen.
The Effect of Addition of ppm-Order-Pd to Fe-K Catalyst on Dehydrogenation of Ethylbenzene
297
Next, the relation between the regeneration rate of lattice oxygen measured by the periodic pulse experiments and the steady-state dehydrogenation activity was examined. The result shows in figure 9. The regeneration rate of lattice oxygen was calculated by the periodic pulse experiments. The steady-state dehydrogenation activity was the conversion of ethylbenzene observed in the continuous reactor.
0.6
0.5
0.5
0.4
0.4
0.3
0.3
0.2
0.2
The rate of styrene formation / mmol sec
-1
The rate of O2-lat consumption / mol sec-1
0.6
0.1 0
200
400
600
800
0.1 1000
Pd content / ppm Fig. 8. The effect of Pd concentration on the styrene formation rate and O2-lat consumption rate (Sekine et al., 2008). From figure 9, there was a linear relation between the regeneration rate of lattice oxygen and the steady-state dehydrogenation activity. Hence, the addition of Pd increased the regeneration rate of lattice oxygen on/in the Fe-K catalyst and steady-state activity for dehydrogenation of ethylbenzene. Therefore the promotion of regeneration of lattice oxygen with H2O by the addition of small amount of Pd enhanced steady-state activity of the catalyst. Through these investigations, we developed the precious metal-promoted catalyst based on Fe-K which showed high activity for dehydrogenation of ethylbenzene. And also we found that redox-type mechanism which ethylbenzene was oxidized by mobile surface lattice oxygen and consumed lattice oxygen was regenerated by H2O proceeded on a series of catalysts. The effect of an addition of ppm-order-Pd changed neither the rate of oxidative dehydrogenation of ethylbenzene using lattice oxygen nor the amount of the lattice oxygen giving high reactivity. The regeneration rate of lattice oxygen was promoted by Pd addtion, and this result improved the dehydrogenation activity. We elucidated the effectiveness of utilization of steam as an oxidant of the catalyst and the control of activity by control of mobility of lattice oxygen in the catalyst.
298
Noble Metals
50
Ethylbenzene conversion / %
40
30
20
10
0
0
0.2
0.4
0.6
0.8
1
The regeneration rate
of lattice oxygen / mol sec-1 Fig. 9. The relation between regeneration rate of lattice oxygen and ethylbenzene conversion at steady-state (Sekine et al., 2008).
5. Conclusion In this work, we examined the effect of ppm-order Pd addition on the activity of Fe–K mixed oxide catalyst for dehydrogenation of ethylbenzene. Results of periodical pulse experiments indicated that the oxidative dehydrogenation is competitive with and faster than simple dehydrogenation on the Fe–K mixed oxide. Consumed lattice oxygen was found to be regenerated by H2O immediately. The amount of lattice oxygen showing a high reactivity for dehydrogenation of ethylbenzene was 0.14% of the total amounts of lattice oxygen in the catalyst, which meant reactive lattice oxygen was surface or subsurface lattice oxygen. We concluded that added Pd hardly changed the rate of dehydrogenation of ethylbenzene or the amount of surface lattice oxygen showing high activity. The surface lattice oxygen, which was regenerated by H2O and Pd promoted the regeneration rate of surface lattice oxygen by H2O.
6. References Addiego, W.P., Estrade, C.A., Goodman, D.W. & Rosynek. P. (1994). An infrared study of the dehydrogenation of ethylbenzene to styrene over iron-based catalysts, Journal of Catalysis, 146: 407-414.
The Effect of Addition of ppm-Order-Pd to Fe-K Catalyst on Dehydrogenation of Ethylbenzene
299
Addiego, W.P., Liu, W. & Boger. T. (2001). Iron oxide-based honeycomb catalysts for the dehydrogenation of ethylbenzene to styrene, Catalysis Today, 69: 25-31. Busca, G., Zerlia, T., Lorenzelli, V. & Girelli, A. (1984). Fourier transform-infrared study of the adsorption of unsaturated and aromatic hydrocarbons on the surface of Fe2O3: I. Ethylene, Journal of Catalysis, 88: 125-130. Carrà, S. & Forni, L. (1965). Kinetics of Catalytic Dehydrogenation of Ethylbenzene to Styrene, Industrial & Engineering Chemistry Research, 4(3): 281-285. Coulter, K. & Goodman D.W. (1995). Kinetics of the dehydrogenation of ethylbenzene to styrene over unpromoted and K-promoted model iron oxide catalysts, Catalysis Letters, 31: 1-8. Devoldere, K.R. & Froment, G.F. (1999). Coke formation and gasification in the catalytic dehydrogenation of ethylbenzene, Industrial & Engineering Chemistry Research, 38(7): 2626-2633. Eggertsen, F.T. & Voge, H.H. (1947). Catalytic dehydrogenation, U.S. Patent No. 2,414,585. Herzog, B.D. & Rase, H.F. (1984). In situ catalyst reactivation: used ethylbenzene dehydrogenation catalyst with agglomerated potassium promoter, Industrial & Engineering Chemistry Product Research and Development, 23(2): 187-196. Hirano, T. (1986). Roles of potassium in potassium-promoted iron oxide catalyst for dehydrogenation of ethylbenzene, Applied Catalysis, 26: 65-79. Hirano, T. (1986). Active phase in potassium-promoted iron oxide catalyst for dehydrogenation of ethylbenzene, Applied Catalysis, 26: 81-90. Lee, E.H. (1974). Iron oxide catalysts for dehydrogenation of ethylbenzene in the presence of steam, Catalysis Reviews, 8(1): 285-305. Kearby, K.K. & Elizabeth, N. J. (1945). Method for the catalytic dehydrogenation of hydrocarbon, U.S. Patent No. 2,370,797. Meima, P.G. & Menon, P.G. (2001). Catalyst deactivation phenomena in styrene production, Applied Catalysis A: General, 212: 239-245. Miura, H., Ansai, R. & Kawai, H. (1994). Deuterium exchange reaction of ethylbenzene over an Fe2O3-K2CO3-Cr2O3 catalyst, Reaction Kinetics and Catalysis Letters, 53(2): 323-329. Muhler, M., Schlögl, R., Reller, A. & Ertl, G. (1989). The nature of the active phase of the FeK-catalyst for dehydrogenation of ethylbenzene, Catalysis Letters, 2: 201-210. Muhler, M., Schlögl, R. & Ertl, G. (1992). The nature of the iron oxide-based catalyst for dehydrogenation of ethylbenzene to styrene 2. Surface chemistry of the active phase, Journal of Catalysis, 138: 413-444. O’Hara F.J. (1975). Dehydrogenation catalyst, U.S. Patent No. 3,904,552. Pitzer, E.W. (1957). Catalyst and dehydrogenation process, U.S. Patent No. 2,866,790. Riesser, G.H. (1979). Dehydrogenation catalyst, US Patent 4,144,197. Sekine, Y., Watanabe, R., Matsukata, M. & Kikuchi, E. (2008). High Performance of Fe–K Oxide Catalysts for Dehydrogenation of Ethylbenzene to Styrene with an aid of ppm-order Pd, Catalysis Letters, 125: 215-219. Shekhah, O., Ranke, W. & Schlögl. R. (2004). Styrene synthesis: in situ characterization and reactivity studies of unpromoted and potassium-promoted iron oxide model catalysts, Journal of Catalysis, 225: 56-68.
300
Noble Metals
Urasaki, K., Tanimoto N., Hayashi, T., Sekine, Y., Kikuchi, E. & Matsukata, M. (2005). Hydrogen production via steam–iron reaction using iron oxide modified with very small amounts of palladium and zirconia, Applied Catalysis A: General, 288: 143-148. Weiss, W. & Schlögl, R. (2000). An integrated surface science approach towards metal oxide catalysis, Topics in Catalysis, 13: 75-90. Williams, D., Mishima, Y., Andrei, R., Niiyama, K. & Danish, S. (2002). Jpn Patent No. 2002509,790. Zhu, X.M., Schön, M. Bartmann, U., Veen, A.C. & Muhler, M. (2004). The dehydrogenation of ethylbenzene to styrene over a potassium-promoted iron oxide-based catalyst: a transient kinetic study, Applied Catalysis A: General, 266: 99-108.
14 Role of Precious Metal Catalysts Takashiro Muroi Industrial Catalysts Laboratory Japan 1. Introduction Precious metal catalysts have been used in many industries, such as refinery, petrochemicals, polymer, chemicals, pharmaceuticals, and environment, For example, automotive industry utilizes large amounts of precious metal catalysts as a part of auto exhaust gas purifier, because of their high activity and selectivity and stability under various reaction conditions. This article, introduces wide variety of applications on precious metal catalysts. We recognize that precious metal catalysts play very important role in our lives. Not only unique properties of precious metals but also advanced preparation technology allow us to use precious metal catalysts for wide range of applications. Principle of precious metal catalyst preparation is introduced, and various industrial applications of precious metal catalysts follow. Applications of precious metal catalysts were disclosed by some literatures. (Rylander 1967) (Bartholomew and Farrauto 2006 )
2. Properties of precious metal catalysts 2.1 High activity and selectivity of precious metals in catalysis Precious metal catalysts consist of highly dispersed nano-scale precious metal particles on supports with high surface area such as carbon, silica, and alumina. The nano scale metal particles easily adsorb hydrogen and oxygen in the atmosphere. The hydrogen or oxygen is very active due to its dissociative adsorption through d-electron of out of shell of precious metal atoms. Dissociatively adsorbed hydrogen and oxygen readily react with many substitutes at under the mild conditions. Although commercial plants are operated under heated and pressurized conditions, many hydrogenation and oxidation reactions proceed at room temperature. In such case, the product yield is relatively high because byproducts formation can be minimized under milder reaction conditions. For example, in hydrogenation of di-nitrotoluene to di-aminotoluene, reaction conditions of Ni catalyst requires 5 Mpa, 150 C, and solvent such as methanol. However, such reaction with Pd/carbon proceeds under only 0.4 Mpa, and 90 C without solvent. Quantity for Pd/carbon is one tenth of Ni catalyst. Each precious metal catalyst shows unique characteristics, For instance, olefin hydrogenation can be accomplish with Pd/Al2O3 without hydrogenating aromatic bond at mild condition. In case of hydrogenation of phenol, Pd/Al2O3 gives produces cyclohexanone. Similarly, Pt/Al2O3 is highly selective to cyclohexane formation and Rh or Ru/Al2O3 gives cyclohexanol selectively. Furthermore, preparation technology of precious
302
Noble Metals
metal catalyst has been advanced in recent years based upon nano technology. As a result, energy saving, high productivity, production cost reduction were achieved. Precious catalyst is not almighty, low activity for hydrogenolysis of esters, low selectivity for selective oxidation in gas phase. However, many base metal catalysts changed to precious metal catalysts in history. 2.2 Stability Precious metals are stable. They do not easily form oxides by oxidation. The oxides of precious metals are, on the other hand, relatively not stable. Precious metals do not easily dissolve in acid or alkaline solution. Thus for example, Pd/carbon can be used for hydrogenation of maleic acid in water which is acidic condition. However Ni catalyst cannot be used for the same reaction condition due to the leaching. Melting point of precious metals is higher than base metals. It corresponds to resistance to migration and sintering of precious metal catalysts. Because of high thermal stability, precious metal catalyst has been used as automotive exhaust gas purification catalysts. 2.3 Advance in catalyst preparation method 2.3.1 Control of metal particle size Catalytic activity and selectivity largely depend upon metal particle size of metals of the catalysts for the some reactions. It is necessary to make sure if the development of reaction is influenced by metal particles size prior to selection of proper catalyst. (Bond 1968) Generally, hydrogenation and hydrogenolysis prefer to small particles, and oxidation prefers to large metal particles. However, there are many exceptions because of different carrier, preparation method and impurity of the catalysts. Smaller metal particles show high tolerance of sulfur poison because of high surface area for adsorption of sulfur. (Okada 1993) The size of metal can be controlled by selection of metal salts, conditions of impregnation and reduction conditions, including metal concentration and reduction temperature. 2.3.2 Metal distribution of catalysts: Ex. eggshell type Diffusion of reactant to the catalyst surface controls reaction rate at mild condition. Hydrogen and oxygen penetrate into inside of micro pores in the catalysts. However, large molecules are difficult to diffuse into the smaller pores. BASF Catalysts., (Former Engelhard) developed and commercialized highly active hydrogenolysis catalyst which is eggshell type of Pd/carbon as a slurry type catalyst. The catalyst was applied for hydrogenolysis to produce aspartame. DuPont developed eggshell type of vinyl acetate catalyst. This is fixedbed type catalyst, which is prepared by impregnation method using Pd and Au salt and SiO2 carrier. Preparation of vinyl acetate catalysts consist of, 1) impregnation of metal solution, 2) metal fixation by alkaline, 3) keeping long times, 4) treated with reductive agent, 5) washing, 6) drying, 7) impregnate potassium acetate and 8) dry. Pd and Au deposited outer surface layer of the carrier, which is egg-shell type distribution. On the other hand, in case reduction is immediately employed after impregnation, Pd, and Au deposited more inner layer on the carrier. (DuPont 1977) Eggshell type catalysts have been applied for many other reactions, such as hydrogenation of polymer resin and hydrogenolysis of large molecular, and are expected to be used for other reactions as well. However, there is an example that highly dispersion, not eggshell type metal distribution, shows higher activity
Role of Precious Metal Catalysts
303
than eggshell type catalysts in the hydrogenation of benzoic acid under severe condition because of no diffusion control. (Grove 2002) 2.3.3 Unreduced catalysts The reduced catalysts have been supplied commercially. Unreduced catalysts give higher activity for some hydrogenation reactions. Small particles are formed possibly due to some effect by solvent, which is in-situ reduction before the reaction starts. A combination of eggshell and unreduced catalyst also gives higher activity in hydrogenation at mild condition. But, unreduced catalysts cannot be used for dehydrogenation or oxidation. Unreduced Pd(OH)2/carbon, called Pearlman’s catalyst, is used widely in pharmaceuticals. 2.3.4 Bi-metalic catalysts Bi-metalic Pd-Ru/carbon catalyst is highly active for hydrogenation and hydrogenolysis of 1,4-butyndiol. Rh-Ru/carbon shows high activity for hydrogenation of aromatics. (Rylander 1967) Adams catalyst, Pt-Ru shows highly active for aromatic nitrocompounds. (Bond 1964) Pt doped Pd/carbon gives excellent activity for debenzylation. (N.E.Chemcat 2002) 2.3.5 Modified catalysts: Doping Modification effectively improves activity and selectivity of catalysts. Addition of alkaline or alkaline earth metal, such as Na, K, Ba, to Pd/carbon leads to high activity towards hydrogenation of aromatic nitro compounds because of electron transfer to Pd. Pd-PtFe/carbon catalyst is commercialized for hydrogenation of di-nitrotoluene. Pd modified with Na is applied for selective hydrogenation of mesityl oxide to produce MIBK. Na prevents hydrogenation of carbonyl. Selective hydrodechlorination can be achieved by Pd/carbon modified Ag or Sn. Pd/Al2O3 modified with heavy metals, such as Pb, and Bi, is applied for hydrogenation of phenyl acetylene in styrene stream. Modification with heavy metals gives leads to high activity for liquid phase oxidation. 2.3.6 Control of migration and sintering Pd-Au/SiO2 is used for production of vinyl acetate by acetoxylation of ethylene. In case of Pd/ SiO2 without Au addition, sintering is observed, which is caused through palladium acetate formation within a few days. Thus, Au addition prevents sintering of Pd by formation of solid solution with Pd. Fluorocarbon substitute, R-134a is introduced from R114 by hydrodechlorination. Pd/carbon granular shows short life because of sintering in hydrogen chloride. Addition of small amounts of Re or Au to Pd/carbon gives lengthens catalyst life. (Asahi Glass 1989) High thermally stable catalysts have been developed for automotive exhaust catalysts. Precious metal loading amount was needed to be reduced. The technology by interaction with metal oxide such as ZrO2, CeO2, TiO2, enables lower loading of precious metals. 2.3.7 Control of dissolution: Leaching Although precious metal is stable for migration and/or dissolution, it occurs in acidic or alkaline condition with oxygen atmosphere. Pt ion is leached out from the catalyst a few %
304
Noble Metals
at reflux condition. Pd/Al2O3 is highly active and selective in hydrogenation of vinyl acetylene to butadiene in order to recover butadiene after extraction of butadiene. However, Pd is dissolved with acetylene by producing acetylide in short time. Pd4Te/Al2O3 was developed to prevent leaching by acetylene, and the catalyst life was significantly improved. Pd4Te is a chemical compound formed on the alumina carrier. The preparation is, at first Pd/Al2O3 is prepared, and secondary TeCl4 is impregnated to Pd/Al2O3. Subsequently, the impregnated catalyst is heated at 500 °C. (JSR 1987) Pd is dissolved in acetoxylation of butadiene producing 1,4-butandiol because of acidic condition and presence of oxygen. Pd4Te/carbon is developed by Mitsubishi Chemical and commercialized. (Mitsubishi Chemical 1973) Small particle of Au, less than 5 nm shows excellent oxidation and esterification activity. Methyl glycolate can be produced by ethylene glycol and methanol in slurry bed, of Au/TiO2-SiO2. This catalyst gives high activity, however Au leached out at oxidation condition. Addition of Pd to Au prevents dissolution. (Nippon Shokubai 2004)
3. History/background of precious metal catalyst development 3.1 Sulfuric acid Industrial revolution started in England in 19th century. Demand of sulfuric acid as basic chemicals, especially producing sodium carbonate for Leblanc process, was increasing for the purpose of bleaching cotton cloth. The first catalytic process is oxidation of sulfur dioxide by Pt/asbestos which was developed by P. Philips in England in 1831. Lead chamber process replaced by catalytic process. That is the beginning of industrial catalysts. Ammonium sulfate for fertilizer production started using sulfuric acid and ammonia from coal distillation plant in the late of 1830s. Production of explosive cellulose nitrate from niter using sulfuric acid has started in Switzer-land in 1845. Novel developed dynamite which is nitro glycerol impregnated clay in 1866. Pt/asbestos had been used until finding V2O5 catalyst by BASF in 1915. SO2 +
1/2 O2 → SO3
3.2 Nitric acid W. Ostwald found production of nitric acid by oxidation of ammonia with Pt-plate, and the nitric acid plant was commercialized in 1908. He received Novel prize in 1909. Nitric acid is very important to produce explosives. Ammonia was produced in coal furnace at the time. Commercialization of ammonia synthesis using nitrogen in the air by Haber and Boch was in 1913. Nitric acid was produced by CuO-MnO2 or Fe2O3-Bi2O3 once. But since base metal catalysts show lower activity, Pt-Rh-gauze has been used now. Vaporized Pt is collected by Pd at downstream. NH3 + 5/4 O2 → NO + 3/2 H2O NO + 1/2 O2
⇔ NO2
2 NO2 ⇔ N2O4
3 NO2 + H2O
⇔
2 HNO3 + NO
305
Role of Precious Metal Catalysts
3.3 Acetic acid Cellulose nitrate as fiber was replaced by cellulose acetate for flammability issue. Acetic acid, raw material of cellulose acetate was produced by oxidation of acetaldehyde which was produced hydration of acetylene by HgSO4 in coal times. Coming petroleum time around after 1960s, acetaldehyde has started to be produced by oxidation of ethylene. The process was developed by Hoechst-Waker which uses PdCl2 and CuCl2 in homogeneous reaction. CH2=CH2 + 1/2 O2 → CH3CHO + 1/2 O2 →
CH3CHO (PdCl2-CuCl2) CH3COOH (Mn(AcO)2
Most of acetic acid is produced by carbonylation of methanol in the world, which was developed by BP (Former Monsant) using Rh carbonyl complex. The product yield is more than 99%. Consumption of Rh is less than 1ppm. CH3OH
+
CO →
CH3COOH
New development, called CATIVA process by BP, uses Ir and Ru carbonyl complex. The precursors are IrI3 and RuI3. Ru complex works as co-catalyst for Ir complex which consumption is said one tenth of Rh complex. In addition, Showa Denko in Japan developed direct acetic acid process from ethylene by gas phase Wacker process. The catalyst is Pd/ H4SiW12O40-SiO2. The process was commercialized once. (Showa Denko 1994) C2H4 + H2O + O2 →
CH3COOH + H2O
Chiyoda Corporation has developed immobilized Rh complex with resin. It was made as fixed bed process producing acetic acid by carbonylation of methanol. The process was licensed to China. (Chiyoda Corporation 1993)
4. Refinery applications 4.1 Reforming Due to increasing gasoline demand, reforming process, which produces gasoline with high octane number, was developed by Shell in 1949. The reactions are dehydrogenation of naphthene and isomerization of paraffin. The UOP reforming process is called “Platformer” because the catalyst constituent is Pt. At first, the catalyst life was short due to carbon deposition. In 1967, Chevron developed Pt-Re/Al2O3 bi-metalic catalyst which can be used almost 10 years with several times of regeneration. After that, continuous cyclic regeneration (CCR) process was developed by UOP and IFP. This process can produce gasoline with higher octane number due to higher aromatics yield under much severe condition or under low pressure. The catalyst is spherical Pt-Sn/Al2O3. More than three hundred plants including semi-regeneration process are running in the world. 4.2 Aromatization To meet the demand of aromatics for in petrochemical industries, aromatization of nhexane process was developed by Chevron. The catalyst for this application is Pt-F/Lzeolite which was improved by Idemitsu Kosan Co., Several plants in the world have been applying this technology.
306
Noble Metals
4.3 Removing aromatics Removing aromatics from diesel fuel is necessary for environmental protection of atmosphere for more severe environmental protection. Many hydrotreating processes are developed, and consist of two series reactors of reactors. First reactor contains Ni-Mo/Al2O3 or Co-Mo /Al2O3 and the second contains Pt/Al2O3 or Pt/SiO2-Al2O3. Bi-metalic catalyst was also developed because hydrogenation by Ni needs high temperature which occurs dehydrogenation to minimize the negative influence by sulfur. Pt-Pd/SiO2-Al2O3 shows high activity even containing several tens ppm of sulfur. (Vaarkamp 2000) 4.4 Isomerization Isomerization of butane and pentane is difficult by SiO2-Al2O3. Bi-functional catalyst, Pt/SiO2-Al2O3 with halogen can progress isomerization because the reaction occurs through dehydrogenation and hydrogenation by Pt and isomerization by acid. Jet fuel production, for example Hysomer process developed by Shell uses Pt/zeolite under hydrogen pressure. Japan Energy developed Pt-SiO2/ZrO2-Al2O3 for isomerization of naphtha. Small content of sulfur in naphtha deactivate this catalyst. Hybrid catalyst, consisting of Pt/SiO2/ZrO2-Al2O3 with addition of Pd/Al2O3 was developed to improve sulfur tolerance. The mechanism of sulfur tolerance is decomposition of sulfur compound by Pd is explained by Watanabe et al. (Watanabe 2005) 4.5 Hydrocracking Gas oil or heavy gas oil is hydrocracked to produce gasoline. The typical cracking catalysts are Co-Mo/Al2O3 or Ni-W/SiO2 or zeolite. Unicracking process licensed by UOP uses Pd/Y-zeolite producing jet fuel. 4.6 FCC additives Fluid Catalytic Cracking (FCC) processes produce gasoline or diesel fuel from oil from heavier oil. FCC processes are operated in fluid bed with continuous regeneration processes for removal of deposited carbon. The size of catalyst is 70~100 µm composed SiO2-Al2O3 and USY zeolite. Some additives improve stability and propylene yield. Pt/Al2O3 powder is also used to accelerate removal of deposited carbon.
5. Application in petrochemical 5.1 Hydropurification Ethylene and propylene are important raw materials for many chemicals and polymers. Ethylene and propylene contain acetylene and dienes as impurities from cracker. Acetylenes and dienes are selectively hydrogenated to ethylene and propylene respectively with 0.020.2% Pd/Al2O3 in gas phase. These catalysts life is more than several years with carbon removal regeneration. Purification of butadiene in presence of 1-butene and 2-butene is employed under hydrogen by Pd/Al2O3 in liquid phase. Unsaturated C4 and C5 molecules are recycled to ethylene cracker after hydrogenation to increase ethylene yield. Small amount of phenyl acetylene as an impurity is removed as polystyrene applying by hydrogenation by Pd/Al2O3 or modified Pd/Al2O3. (Table-1)
307
Role of Precious Metal Catalysts
Stream
Removal
Catalysts
Phase
Ethylene
Acetylene
0.01-0.02%Pd/Al2O3
Gas
Propylene
Acetylene
0.1-0.2%Pd/SiO2
Gas
Butadiene
Vinyl acetylene
0.2%Pd-Te/Al2O3
Liquid
1-Butene
Butadiene
0.5%Pd/Al2O3
Liquid
2-Butene
Butadiene
0.1%Pd/Al2O3
Liquid
C4, C5
Butene
0.3%Pd/Al2O3
Liquid
Styrene
Phenyl acetylene
0.3%Pd/Al2O3
Gas
Remarks
Addition of CO
Return to cracker
Table 1. Hydropurification in ethylene plant 5.2 Hydrogenation of pyrolysis gasoline Byproducts in liquid phase of ethylene cracker are aromatics and unsaturated compounds. In order to blend into gasoline, di-olefins are selectively hydrogenated to mono-olefin by Pd/Al2O3. Subsequent to the first reactor, Ni-Co/Al2O3 is utilized to remove mono olefins, sulfur, and nitrogen prior to production of benzene, toluene, and xylene before solvent extraction. Catalyst life of Pd/Al2O3 is generally several years with several times of regenerations. Every ethylene cracker equips this hydrogenation process. 5.3 Propylene Propylene demand is increasing due to strong polypropylene market. Dehydrogenation of propane with Pt/Al2O3 is one of commercialized processes. Several plants apply this process. CH3CH2CH3
→
CH2=CHCH3 + H2
5.4 Cyclohexane Highly pure cyclohexane is intermediate of Nylon. It is produced by hydrogenation of benzene with Ni or Pt/Al2O3. 5.5 Oxo alcohol 2-Ethylhexanol, a raw material of di-octylphthalate (DOP), is used for vinyl chloride resin plasticizer. 2-Ethylhexanol is derived from n-butyl aldehyde is produced by hydroformylation of propylene with hydrogen and carbon monoxide by Rh complex catalyst. RhH(CO)(PPh3)3 with tri-phenylphosphine produces n and i butylaldehyde. Rh complex generates more than 10 of n/i ratio. (Table-2) In the same reaction, Co complex shows low n/i ratio. n-Butylaldehyde is separated by distillation from the boiling reactor. 2-Ethylhexanol is produced after condensation with NaOH and subsequent hydrogenation by Ni. (Fig. 1 )
308
Noble Metals
Fig. 1. 2-Ethylhexanol from propylene by hydroformylation Catalyst Temp. °C Pressure atm Catalyst % Metal/Olefin n/i Conversion of Propylene %
RhH(CO)(PPh3)3 60~ 120 1 ~50 0.01~0.1 10 / 1 30
Table 2. Hydroformylation by RhH(CO)(PPh3)3
6. Bulk chemicals 6.1 Ammonia Fe-K catalysts have been used for last hundred years under various reaction conditions since Habar-Boch developed the catalyst. In addition, Ru-Cs/carbon graphite catalyst was developed by BP and Kellogge. (Czuppon 1993) N2 + 3/2 H2 →
2 NH3
The process called KAAP process is commercialized. Two large plants are under operation in Trinidad and Tobago. Adsorption of nitrogen becomes weak due to electron transfer from Cs to Ru and Ru and from Ru to carbon graphite. The catalyst support, graphite is firstly, produced by thermal treatment of active carbon at 1,500 °C in argon, and in air at around 400 °C followed by subsequent thermal treatment at 1,700 °C in argon. Remaining catalyst preparation takes place as, impregnation of RuCl3 solution to the graphite, reduction with hydrogen at 450 °C, drying, impregnation of Cs nitrate solution, and drying. (BP 1984) 6.2 Hydrogen peroxide Hydrogen peroxide, H2O2, has widely been used as bleaching and oxidation agent for food, textile and paper. H2O2 has been producing by oxidation of hydroxyl alkyl anthraquinone after hydrogenation of alkyl anthraquinone by Pd. Small catalyst particles of Pd/Al2O3 or Pd/SiO2 is generally used in slurry phase, and its alkaline modification prevents ring hydrogenation. Kemira process uses Pd black. Some fixed bed processes are commercialized.
309
Role of Precious Metal Catalysts
These catalysts form smooth surface because decomposition of hydrogen peroxide occurs by leaked fine catalyst particles after separation. Carbon monoxide in hydrogen stream is removed to less than 1 ppm by methanation with Ni or Ru/Al2O3 since small quantity of carbon monoxide poisons Pd catalyst at lower reaction temperature, e.g. 40 °C. (Fig. 2)
Fig. 2. Production of hydrogen peroxide by anthraquinone process Direct hydrogen peroxide production, which is the process synthesize H2O2 from hydrogen and oxygen was developed by DuPont and commercialized several plants of paper plants in North America. This process uses Pd/carbon. HBr is used stabilizer of peroxide. H2
+
O2 →
H2O2
Head water has developed direct process at out of explosion range, e.g. H2 3vol%, O2 20vol% N2 77vol% in H2SO4 solution with addition of small amount of NaBr and PdPt/carbon black catalyst. The performance of this process is reported as 33% of the overall hydrogen conversion, 100% H2O2 selectivity with respect to hydrogen and 4.8% of hydrogen peroxide in a final liquid product at 45 C and 10 MPa. (Headwater 2005) 6.3 Phenol Phenol has been used as a raw material of phenol resin, nylon and others. Most phenol process uses cumene process in the world. Cumene is produced by alkylation of benzene with propylene by acid catalyst, such as H3PO4/Al2O3 or zeolite. Subsequently cumene hydroperoxide is produced by oxidation of cumene and phenol and acetone are converted from cumene hydroperoxide by sulfuric acid. In the step of phenol production, α-methyl styrene produced as byproducts is hydrogenated by Pd/Al2O3. Produced cumene by hydrogenation of α-methyl styrene is recycled to the feed. When α-methyl styrene demand increases, cumene hydroperoxide is hydrogenated to cumyl alcohol by Pd/Al2O3 and returned to stream to produce α-methylstyren more. Off gas treatment, such as oxidation of cumene, takes place by Pt/honeycomb catalyst at 350C. 6.4 Aniline Aniline has been produced by amination of phenol using Lewis acid such as Al2O3 and hydrogenation of nitrobenzene by Ni or Pd/carbon in slurry phase. Pd/carbon or modified Pd/carbon by Pt or Fe is used mainly for highly activity.
310
Noble Metals
6.5 Chlorine Hydrogen chloride is produced as byproducts in TDI process, polycarbonate and other plants. It has to be neutralized by NaOH before disposal. Oxidation process for Cl2 production was developed using acid resistant RuO2/TiO2-αAl2O3 by Sumitomo Chemical and was commercialized 3 plants. The commercialized Sumitomo fixed bed process is compact compare to Mitsui fluid bed process using Cr catalyst. In the preparation of RuO2/TiO2-αAl2O3, the carrier is firstly prepared by mixing α-Al2O3 and TiO2 (100%rutile) powder followed by extrusion and calcination at 800 °C, Ru salt is impregnated on the prepared TiO2-αAl2O3, and impregnated carrier is calcined. (Sumitomo Chemical 2004) Commercialized 2 plants are under operation with TDI plant and polycarbonate plant. 2 HCl + 1/2 O2
→
Cl2
+ H2O
6.6 1,4-butanediol 1,4-butanediol(1,4-BG) is used for production of polyester, polyurethane and others. Poly butylenes terephthalate (PBT) is used as engineering plastics for automotive and electronics. PBT is used as performance textile for sport wears and swimsuits, for instance, known spandex. 1,4-BG can be synthesized from butadiene by acetoxylation. The process is developed and commercialized by Mitsubishi Chemical. The catalyst is bi-metalic catalyst which is resistant to acetic acid. The first process was consisted of trickle bed reactor with Pd4Te/carbon granular. The bi-metalic catalyst was prepared by, for example, charging active carbon granular into mixed solution of PdCl2 and TeO2 followed by drying and heating with methanol at 450 °C.(Mitsubishi Chemical 1973) (Tanabe 1981) (Ohno 2000) Improved process use Pd4Te/SiO2 in fixed bed in up flow mode. H2C=CHCH=CH2 + 2AcOH + 1/2O2 → AcO-CH2CH=CHCH2-OAc + H2O Di-acetoxybutene is hydrogenated to di-acetoxybutane by Pd/carbon and hydrolysis to 1,4BG by acid ion exchange resin. Dairen Chemical in Taiwan commercialized homogeneous process, which produces hydroxyfuran by hydroformylation with Rh hydride complex. Hydrogenation to 1,4-BG is conducted by Ni catalyst.(Fig.3)
Fig. 3. Hydrofomylation of allylalcohol 6.7 MIBK MIBK is widely used as a solvent. At first, diacetone alcohol is produced by condensation of acetone with Ba(OH)2. And then, diacetone alcohol is dehydrated to mesityl oxide at second step. At last, mesityl oxide is hydrogenated to MIBK by Cu catalyst or Pd/carbon. Direct synthesis process of MIBK, Pd/acid ion exchange resin catalyst. The condensation and dehydration are with ion-exchange resin. Hydrogenation is done by Pd catalyst. The catalyst is prepared ion exchange of Pd salt and subsequently reduced by reductive agent. (Fig.4)
311
Role of Precious Metal Catalysts
Fig. 4. MIBK production from acetone 6.8 Oxalic acid Oxalic acid is used for hydration of starch, and it is a raw material of fertilizer and others. Di-methyl oxalate (DMO), an intermediate of oxalic acid, is synthesized from methanol and carbon monoxide. Methyl nitrate is produced at first under the mild condition without catalyst. 2 CH3OH + NO + 1/2 O2 → 2 CH3ONO + H2O Carbon monoxide and methyl nitrate react to form DMO and NO by Pd/α-Al2O3. DMO is hydrated to oxalic acid. Produced NO is recycled in the system. For example, a reaction condition is at 0.2Mpa・G, and 110 ℃. (Yamamoto 2010) (Fig.5) 2 CO + 2 CH3ONO → (COOCH3)2
+ 2 NO
(COOCH3)2 + 4 H2O → (COOCH3)2・2 H2O + 2 CH3OH 2 CH3OH + 2 NO + 1/2 O2 →2 CH3ONO + H2O 2 CO + 3 H2O + 1/2 O2 → (COOH)2・2 H2O Fig. 5. Coupling of CO by methyl nitrate Ethylene glycol (EG) can be produced from di-methyl oxalate by hydrogenolysis with Cu/SiO2, e.g. at 3Mpa, 200 °C. China is expecting to produce EG form di-methyl oxalate using carbon monoxide which is originated from coal. (COOCH3)2 + 4 H2 → HOCH2CH2OH + 2 CH3OH 6.9 Di-methyl carbonate (DMC) Di-methyl carbonate is a raw material of resin and others. DMC is expected to replace phosgene in production of polycarbonate and isocyanate. China started to use it diesel fuel additives. DMC is produced from methanol and carbon monoxide. Ube Ind. in Japan developed and commercialized a process applying oxy carbonylation of methanol by PdCl2CuCl2/Al2O3 in gas phase. (Fig.6) 2 CH3OH + 2 NO + 1/2 O2 → 2 CH3ONO + H2O
312
Noble Metals
CO + 2 CH3ONO
→ (CH3O)2CO
+ 2 NO
2 CH3OH + CO + 1/2 O2 → (CH3O)2CO + H2O Fig. 6. Dimethyl carbonate by oxy carbonylation of methanol 6.10 γ-butyrolactone γ-butyrolactone (GBL) used as a resin solvent and an intermediate of N-methylpyrrolidone can be produced from maleic anhydride. Maleic anhydride is hydrogenated to GBL by Ru(AcAc)3 with trioctylphosphine in tetraglyme in homogeneous reaction. This process is commercialized by Mitsubishi Chemical. Reaction rate increases using succinic acid anhydride after hydrogenation by Pd/Al2O3. Conversion of succinic acid anhydride is 79.2%, Selectivity of GBL is almost 100% at 200 °C, 1.0MPa, 14 h.(Fig.7 )
Fig. 7. Hydrogenation of succinic acid anhydride
7. Polymer 7.1 Vinyl chloride Poly vinyl chloride is used very widely such as pipe, sheet, film, housing material for stability. Vinyl chloride monomer (VCM) is produced by thermal decomposition of ethylene dichloride (EDC) which is produced by oxychlorination with CuCl2/Al2O3. After decomposition of EDC, 2,000-4,000 ppm of acetylene is produced in HCl stream. Acetylene in hydrogen chloride atmospher is removed by hydrogenation with acid resistant catalyst which is Pd/α-Al2O3 or Pd/SiC in order to reduce chlorine consumption in recycled oxychlorination process. (Kaneka 1987) 7.2 Methyl methacrylate Methylmethacrylate (MMA) demand has been increasing in Asia. It is a transparent polymer and is used as glass substitute. A few routes are known to produce MMA. Isobutene process is developed in Japan. MMA is produced by esterification of methacryl acid which is introduced two step oxidation through methacroleine from isobutene. Asahi Kasei Chemicals commercialized direct process from methacroleine and methanol by Pd-Pb/SiO2 using slurry bed. Oxygen is fed from the bottom of the reactor as very fine bubbles. The catalyst is Pd3Pb/SiO2. (Asahi Kasei Chemicals 1996) The size of silica carrier containing alumina and magnesia is about 60μm. The catalyst is prepared by starting mixture of HCl solution of PdCl2 and Pb(NO3), immediately the metal solution mixture is impregnated 1hr and then reduced by hydrazine.
313
Role of Precious Metal Catalysts
MMA processes from ethylene are summarized as Fig.8. Lucite commercialized carbomethoxylation by Pd phosphine complex. BASF process uses hydroformylation by Rh complex. (Fig.8)
Eastman
Lucite
BASF
Carbomethoxidation
Hydroformylation
Hydrocarbonylation
CH2=CH2 130 oC, 1.4 MPa HRh(CO)2(PPh3)2
CO, H2O
CO, CH3OH Phosphine ligand Pd < 100 oC, < 10 bar C2"/CO = 1/1 Pd: 0.1- 1mmol/L
Mo(CO)6 180 oC, 5.4 MPa
CH3CH2COOH
CH3CH2CHO Et2NH, AcOH 160-185 oC, 4.7 MPa Y: 98%
HCHO Nb2O5/SiO2 300 oC, 0.2 MPa Sel. 90%
HCHO CH2=C(CH3)CHO 1/2 O2
CH3CH2COOCH3 HCHO
CH2=C(CH3)COOH
Cs/SiO2 350 oC
MA
CH3OH CH2=C(CH3)COOCH3
+
H2 O
MMA Fig. 8. MMA synthesis routs from ethylene 7.3 Toluene di-isocyanate Toluene di-isocyanate (TDI) is used for polyurethane. TDI demand has been increasing due to the applications such as cushion of bed and sheet of car. TDI is produced from diaminotoluene and phosgene. Di-aminotoluene is produced by hydrogenation of dinitrotoluene with Pd/carbon or Pd-Pt-Fe/carbon in slurry bed. 7.4 Hydrogenated methaxylene diamine Methaxylene diamine (MXDA) is used for heat resistant polyamide polymer. It is produced by ammoxidation of o-xylene with Fe catalyst. By Ru/Al2O3, a part of MXDA is hydrogenated to 1,3-di-amino cyclohexane which is highly heat resistant polymer material. 7.5 Cyclohexane di-methanol (CHDM) Cyclohexane di-methyl is used heat resistant polyester resin. It is produced by hydrogenation of di-methylterephthalate. Pd or Ru/Al2O3 is used for hydrogenation of dimethyltrephthalate at first step, hydrogenolysis of cyclohexane di-methyl carboxylate is done by CuCrOx catalyst. (Fig.9 )
314
Noble Metals COOCH3
COOCH3 H2
CH2OH H2
Pd or Ru/Al2O3 COOCH3
CuCrOx COOCH3
CH2OH
Fig. 9. DME synthesis from di-methyl trephthalate 7.6 Hydrogenated polymer Hydrogenation of polymer is important to increase solubility to other polymer and transparency, which is applied such as adhesive for dipper. Hydrogenation of polybutene is conducted by Pd/Al2O3 in fixed bed. C5, C9 and terpentine resin are hydrogenated by Pd/Al2O3 and Pt/Al2O3. Hydroxypolybutadiene rubber is produced by hydrogenation with Ru/carbon prevention of hydrocracking of hydroxyl group. Nitril rubber and norbornene resin are hydrogenated with Rh complex in homogeneous phase. (Bayer 1980) Separation of catalyst from the system is very difficult. If the catalyst is very highly active, the loading quantity can be very small. Consequently, removal of catalyst is not necessary. (Shinohara 1997) It suggests that reaction system does not need filtration system like polymerization of polyethylene or polypropylene. Many resins are hydrogenated by precious metal catalysts. (Table-3) Reactants
Catalysts
Reactor bed
Polybutene
Pd/Al2O3
Fixed
C5 Petroleum resin
Pd/Al2O3
Fixed
C9 Petroleum resin
Pt/Al2O3
Fixed
Ru/carbon
Slurry
Pd/SiO2
Slurry
Norbornene resin
Ru complex
Homogeneous
Terpentine resin
Pd/Al2O3
Fixed
Natural resin
Rosin
Pd/carbon
Fixed, Slurry
Hydrogenated rosin
Hydroxy Polybutadiene Rubber Nitril butadiene rubber
Remarks
Table 3. Commercialized hydrogenated resin
8. Synthetic fiber 8.1 Nylon 8.1.1 Inventa process NO is produced by oxidation of ammonia with Pt-Rh gauze. NO is used for producing hydroxylamine which is reacted with cyclohexanone. NO is reduced by modified Pt carbon
315
Role of Precious Metal Catalysts
catalyst or Pt/carbon graphite in sulfuric acid solution at 40-60 °C. Anone oxime is converted to ε-caprolactam by Beckman rearrangement reaction. Cycrohexanone is produced by oxidation of cyclohexane or hydrogenation of phenol by Pd/carbon or Pd/Al2O3 in fixed bed reactor. (Fig.10) 4 NH3 + 5O2
→ 4 NO + 6 H2O
2 NO + 3 H2 + H2SO4 →(NH2OH)2・H2SO4
Fig. 10. Nylon-6 production route by Inventa process 8.1.2 DSM process Ammonium nitrate is reduced by Pd/carbon or Pd-Pt/carbon in DSM process. Selectivity of Pd/carbon is higher than Pt/carbon. Mixed Pd/carbon and Pd-Pt/carbon gives highly activity and selectivity in H3PO4 aqueous solution with addition of GeO2. Reaction temperature is 40-70 C. The process is continuous slurry bed reactor installed swing filter system. Selectivity is effectively increased by small amount of halogen ion. (Fig.11 ) H3PO4 → H+
+
H2PO4―
NO3― + 2 H+ + 3H2 → NH3OH+ + 2H2O
Fig. 11. Cyclohexanone oxime synthesis by DSM process 8.1.3 Snia viscosa process Firstly toluene is oxidized to benzoic acid by metal acetate such as cobalt acetate in the aqueous phase. Subsequently, benzoic acid is hydrogenated to cyclohexane carboxylic acid by Pd/carbon in slurry bed. Hydrogenation condition is 170 °C, 1.0-1.7 Mpa. The production yield appears to be almost 100%. Cyclohexane carboxylic acid is reacted with NOHSO4 and produces ε-caprolactam sulfate. (Fig.12)
Fig. 12. Hydrogenation of benzoic acid
316
Noble Metals
8.1.4 Asahi Kasei process Asahi Kasei Chemical commercialized selective hydrogenation of benzene to cyclohexene. A 60,000Mton/y plant started to operate in 1990. Selective hydrogenation of benzene to cyclohexene takes place in water with Ru black catalyst. Cyclohexene is hydrated to cyclohexanol by high silica containing MFI. The process was licensed to China. (Fig.13 )
Fig. 13. Cyclohexanone production route by selective hydrogenation of benzene 8.1.5 Nylon 12 Nylon 12 is used as a hot melt adhesive. One of the Nylon 12 processes is hydrogenation of nitril compound. An intermediate of nylon-12, 12-Aminododecane acid is produced by hydrogenation of 11-cyanoundecane acid with Ru/SiC at 110-130 °C and 3.5 MPa, in mixed solvent of NH4OH and n-propanol. Conv. 100%, Sel. 99.6%, yield of secondary amine is less than 0.4%. 11-cyanoundecane acid is produced by ammoxidation of cyclohexanone. (Ube Ind. 1976) (Fig.14)
Fig. 14. Cyano undecane acid from cyclohexanone 8.2 Polyester Most textile fiber has become polyester. Polyethylene terephthalate is produced ethylene glycol and terephthalic acid. Polyethylene terephthalate is very widely used to make bottles, for examples PET. Terephthalic acid is produced by oxidation of p-xylene introduced by isomerization of mixed xylene with ZSM-5 catalyst. Pt/ZSM-5 is used to convert ethyl benzene to p-xylene in hydrogen atmosphere. 4-carboxybenzaldehyde (4-CBA) is produced as a byproduct in oxidation of p-xylene by Co and Mn acetate in acetic acid solution. Producing pure terephthalic acid, 4-CBA is needed to remove to less than 25 ppm by hydrogenolysis by Pd/carbon granular in water solvent under severe condition. (Fig.15)
317
Role of Precious Metal Catalysts C2H5 CH3
Heavy Naftha
CH4
Pt/Al2O3
CH3
Ni Fe Zn
ZSM-5
CO
CH3
H2
Cu-ZnOx
CO CH3
H2O
CH3OH
CH3COOH
RhI3 Mn(AcO) 2 Co(AcO)2 O2
H2 HOOC
CHO
HOOC
CH3
Pd/CG Off Gas
O2 HOOC
COOH
H2C H2O
Pt/Honeycomb H2O
O
O
Ag/Al2O3
2 HOCH2CH2OH
Cu,Zn,Co n HOCH2CH2OC
C2H4
CH2
Off Gas n HOCH2CH2OH
COCH2CH2OH O
Sb2O5 TiO2
C
COCH2CH2O
O
O
n
Fig. 15. Polyester production routs 8.3 Vinyl acetate Vinylacetate is used for textile, paint, adhesive and others. Acetoxylation of ethylene in gas phase is commercialized developed by Bayer and ND (Millenium) with Pd-Au/SiO2 or PdAu/alumina by multi tube reactor. Allylalcohol also commercialized by acetoxylation of propylene with Pd-Cu/SiO2.
9. Gas production and purification 9.1 City gas Producing city gas from coke oven gas contains hydrogen and carbon monoxide. Methanation is applied to produce methane by Ru/Al2O3 after removal of tar and sulfur compounds. CO + 3 H2 → CH4 + H2O 9.2 Purification of hydrogen Removal of oxygen in hydrogen is proceeds with Pd/Al2O3. It is known as DEOXO process, and the catalyst was developed former Engelhard Ind., The technology has been used widely.
318
Noble Metals
The catalyst is applied for purification of He, Ar with addition of hydrogen. CO causes catalyst poisoning for hydrogenation. Thus, methanation using Ru/Al2O3 plays important role to converts CO to non-poisoning CH4. Selective oxidation of CO in hydrogen process is also known. It called “Select oxo process” using Pt/Al2O3 modified with Co or Fe developed by former Engelhard. The principle is originated from the facile adsorption of CO on Pt compared to hydrogen. Oxygen addition leads to reaction with CO on the catalyst surface. The catalyst is used for purification of hydrogen for ammonia synthesis and fuel cell. 9.3 Purification of nitrogen Pure nitrogen is essential in fabrication of semiconductor in atmospheric gas. Pure nitrogen gas is generally produced in cryogenic system from the air. But, small content of CO is difficult to remove from N2 in cryogenic system. Pt or Pd/Al2O3 can oxidize CO to CO2 at 100-150℃ before cryogenic system. 9.4 Carbon dioxide Carbon dioxide is used for as a coolant and for carbonated drinks. Quality of food grade CO2 is regulated by government. Hydrocarbons and CO and others are main impurities in off gas of CO2 from oxidation plant such as ethylene oxide plant. CO2 is purified to food grade by addition of small amount of oxygen by Pt and Pd/Al2O3. 9.5 Reductive gas Hydrogen gas is produced by decomposition of NH3, a mixed catalyst of Pt/Al2O3 and Rh/Al2O3 is used at 700 C. Transfer of H2 is difficult, however it is feasible to transport as liquid NH3. Reductive gas for annealing furnace is produced by combustion of butane with Rh/α-Al2O3 at 800 °C.
10. Specialty chemicals 10.1 Dyestuff and organic pigment Many dyestuffs are produced by hydrogenation of aromatic nitro compounds. Halo nitro compounds are hydrogenated to halo amino compound by Pt/carbon or sulfur modified Pt/carbon. Monochloro acetic acid using as a raw material of dyestuff is produced selective hydrodehalogenation from di-chlrolo and tri-chloro acetic acid with Pd/carbon pellet in fixed bed reactor. The di- and tri-chloro acetic acid are produced by chlorination of acetic acid. p-Methoxy aniline, which is an intermediate of printer ink, is produced from nitrobenzene by Bamberger rearrangement reaction using Pt/carbon in methanol solvent. Intermediate of an important yellow organic pigment is di-chlorohydrazone (DCH). It is produced from o-chlorobenzene using Pt/carbon. 10.2 Rosin Rosin is gathered or extracted from pine tree. Disproportionated rosin is used as an emulsion polymerization agent for butadiene rubber. Disproportionation of rosin is
319
Role of Precious Metal Catalysts
conducted with Pd/carbon without hydrogen. Hydrogenated rosin is very stable. It is used as pavement paint and used as one of the ingredients of chewing gum. Hydrogenated rosin is produced by hydrogenation using Pd/carbon at severe condition. 10.3 Antioxidant Antioxidant for rubbers has been produced by reductive alkylation of di-phenyl amine with MIBK. Pt/carbon or sulfur modified Pt/carbon has been used for reductive alkylation. 10.4 Liquid crystal Liquid crystal is produced by Suzuki coupling reaction. Suzuki coupling reaction is coupling halo compound and boron acid compound by Pd with alkali, for example Pd(PPh3)4 or Pd acetate in homogeneous reaction. 5CB (4-pentyl-4‘-cyanobiphenyl) is typical liquid crystal compound is synthesized by Suzuki coupling reaction. (Fig.16) BND and PBD are produced by Suzuki coupling. (Fig.17) HO Br
+
Na2CO3 B
HO
CN
CN Pd(Pph3)4
Fig. 16. 4CB synthesis by Suzuki coupling
Fig. 17. Example of Liquid crystal produced by Suzuki coupling Pd/carbon can be used instead of Pd complex. 4-Fluorobiphenyl acetic acid is produced by Pd/carbon. 10.5 Food industry Sorbitol, known as a sweetener, is produced by hydrogenation of D-glucose. It is used for a moisturizing agent for ham and bacon, additive in teeth paste and others. Ru/carbon or Ni has been used as hydrogenation catalysts. Continuous process using Ru/carbon granular is developed. Succinic acid is produced by hydrogenation of maleic acid using Pd/carbon in slurry and fixed bed reactor. Lecithin is hydrogenated to hydrogenated lecithin by Pd/carbon, which is used for food additives and cosmetics. 10.6 Synthetic perfume Leaf alcohol (cis-3-hexene-1-ol) is produced by selective hydrogenation by Lindlar’s catalyst which is 5%Pd-2.7%Pb/CaCO3. (Fig.18)
320
Noble Metals
Fig. 18. Leaf alcohol synthesis by Lindlar’s catalysts Many synthetic perfumes are derivatives of isoprene. Acetylene compound is selectively hydrogenated by Lindlar’s catalyst after ethynylation. Linalool is derived from isoprene. (Fig. 19) Many synthetic perfume, such as jasmine, are synthesized by using Lindlar ‘s catalyst.
Fig. 19. Linalool synthesis by Lindlar’s catalyst 10.7 Cosmetics Squalene is extracted from liver of shark lives in deep sea. Squalene is hydrogenated with Pd/carbon to squarane which is used basic oil of cosmetics.
11. Medicines 11.1 Vitamin Lindlar’s catalyst was developed for producing vitamin A. (Fig.20) CH3
CH3
CH3
CH3
CH2OH OH CH3 CH3
CH3
CH3
CH2OH
H2 OH
Fig. 20. Vitamin A synthesis by Lindlar’s catalyst Isophytol , an intermediate of vitamin E, is produced selective hydrogenation of carbonyl by Pd/carbon.
Role of Precious Metal Catalysts
321
11.2 Medicine for pain and fever Acetaminophen has been widely used as medicine for pain and fever. p-Aminophenol is an intermediate of acetaminophen synthesized from nitrobenzene by hydrogenation in sulfuric acid solution or directly by Bamberger rearrangement reaction with Pt/carbon. Ibuprofen, which shows small side effect, is produced from i-butyl benzene using Pd/carbon and Pd(PPh3)4. (Fig.21)
Fig. 21. Ibuprofen synthesis route by Pd 11.3 Hemostatic agent Trans-ternexamic acid, used as a hemostatic agent, is produced by hydrogenation of nitril of p-cyanobenzoic acid with Pd/carbon at 100 C and 5.0 Mpa, in NaOH aqueous solution. Consequently hydrogenation of aromatic conducts by Ru/carbon at the same condition. 11.4 Antibiotics 11.4.1 Di-hydroxystreptomycin Streptomycin is hydrogenated to di-hydrostreptomycin which is more stable to alkaline and does not react with other carbonyl compounds. Hydrogenation is conducted by Adams PtO2 in sulfuric acid solution. (Fig.22 )
322
Noble Metals
Fig. 22. Hydrogenation of streptmycin 11.4.2 Parasiticide Wilkinson catalyst was discovered by Dr. Wilkinson in 1966. Wilkinson catalyst, RhHCl2(PPh3) is used for hydrogenation of avermectin to produce ivermectin for parasiticide. This application is the largest use of Wilkinson catalyst. (Fig.23)
Fig. 23. Hydrogenation of avermectin 11.4.3 Tetracycline Tetracycline type antibiotics are synthesized by Pd/carbon and Rh/carbon. Minocycline is produced by hydrodechlorination with Pd/carbon and employed enantio selective hydrogenation of methylene by Rh/carbon or Wilkinson Rh complex. (Fig. 24 ) Doxycycline also produced through hydrodechlorination by Pd/carbon and hydrogenolysis by Rh/carbon.
323
Role of Precious Metal Catalysts
Cl
CH2
H
CH 2
N(CH3 )2 OH
H
N(CH3 )2 OH
H2
OH
O
OH OH O H
CO NH2 OH CH 3
H
O
CO NH2
N(CH3 )2
H2
OH
O
OH OH O
OH OH O
OH
CO NH2
Fig. 24. Minocycline synthesis route 11.4.4 Carbapenem Carbapenem antibiotics are produced by chiral Ru complex developed by Dr. Noyori. - lactam antibiotics were outstanding as next generation of antibiotics. It was intermediate of carbapenem antibiotics, 1 -methylcarboxylic acid. It is commercialized by chiral synthesis by Ru-BINAP. Target was synthesis of 4-acetoxy-2-azetizinone. Takasago International commercialized 40 ton/y of chiral 3-hydroxybutaneacid from α-acylaminomethyl acetic acid ester, at 50 C, H2 Press. 10Mpa, 20hrs, Yield is 99% ee, 95% de. (Fig.25) (Akutagawa 1987)
Fig. 25. 4-Acetoxy-2-azetizinone synthesis route
324
Noble Metals
11.5 L-Dopa A part of former Monsant developed a drug uses in the treatment of Parkinson’s disease. L-Dopa [3-(3,4-dihydroxyphenyl)L-alanine] is synthesized by Rh complex with chiral bisphosphine ligand such as 1,4-diphenylphosphinobutane, at ~50 C, and ~40psig. (Fig.26)
Fig. 26. L-Dopa synthesis 11.6 Indinavir (protease inhibitor) Piperadine amide is one of the main intermediates of indinavir which is protease inhibitor developed by Merck. There are some synthesis routes to produce piperadineamide. One of synthesis routs is hydrogenation of piperadinecarboxylic acid t-butylamide hydrogenated by Pt/carbon and Ru/carbon and introduced rac-piperadine-2-carboxylic acid. 11.7 Anti-hypertensive Many medicines are producing by Suzuki coupling using tetrakis-tri-phenyl Pd (Pd(PPh3)4) or Pd acetate for anti-hypertensive. (Table-4) Name of medicine
Maker
Valsartan
Novartis
Losartan
Merk
Telmisartan
Boehringar-Ingelheim
Table 4. Example of anti-hypertensive medicine using Suzuki coupling 11.8 Other medicines Suzuki coupling is applied for many anti-cancer medicines such as Vicenistatin. Negishi coupling is applied to produce anti-depressant. Many alkaloids are produced by the reaction using Pd complex. 11.9 Agricultural chemicals Many agriculture chemicals are produced using Pt or Pd/carbon. Chloro pyridine is used for an intermediate of insecticide. Di- or tri chloropyridine which is over chlorination is hydrogenated to mono-chloro pyridine by Pd/carbon. Poly chloro amine is also hydrogenated to mono or di-chloroaniline by Pd-Sn/carbon. Reductive alkylation is general reaction to produce intermediates of herbicide by Pt/carbon. Heck carbonylation using PdCl2 is applied for benzanilide type pesticide.
325
Role of Precious Metal Catalysts
12. Nuclear power plant 12.1 Reduction of Uranium One of extraction method of Plutonium (Pu) from spent Uranium (U) is conducted using U4+. Spent U contains Pu 4+ is reduced to Pu3+ and separated by U4+. U4+ is produced from U6+ by hydrogenation with Pt/SiO2 in PUREX process. U(NO3)6 + 2 H2 → U(NO3)4 + 2HNO3 12.2 Recombiner Operating nuclear reactors mainly function with boiling water reactor (BWR) and pressurized water reactor (PWR) in the world. In BWR, water (light water) is used as coolant, and moderator is warmed to approx. 200 °C and pressurized to 7 Mpa to make steam in nuclear furnace. Steam is directly sent to gas turbine and recycled after cooled by water. In PWR, operates at approx. 15 MPa, 300 °C of liquid water is produced as the first water which makes steam of the second water for gas turbine. The first water is recycled. Water and nitrogen are decomposed to 3H, 6N, 19O and radioactive Kr, and Xe from fuel rod by neutron. Gas in condenser after gas turbine is separated and introduced to recombiner, which installed Pd or Pt catalyst, after heated. H2 including T is reacted with O2 and separated as liquid. Gas components are introduced to gas hold up tower until radioactivity becomes lower. (Fig.27) H2 + 1/2 O2 → H2O T2 + 1/2 O2 → T2O
Fig. 27. Waste gas treatment in BWR In PWR, the first water is recycled which is used warming the second water for gas turbine. Gas containing radioactive rare gases and H2 containing T are purged and treated by recombiner, and treated gas holder as like as BWR (Fig.28)
326
Noble Metals
Fig. 28. Waste gas treatment in PWR Pd/Al2O3 or Pt/metal form is used as a catalyst. Pd/Al2O3 sphere is charged SUS element. Water proof catalyst shows high activity for condensation of water. Pt/metal form is used as plate form, and charged 40 layers in the reactor. (Fig.29)
Pd/Al2O3 sphere
Pt/metal form
Fig. 29. Recombiner catalysts The example of reaction condition is described in Table-5.
Gas Composition % Temp. C
Inlet
Outlet
H2
3.3%
< 1 ppm
O2
1.7%
Steam
Balance
Balance
143
427
Press.0.12 MPa, S.V.: 1,500 hr-1, O2: Leak 0.5%
Table 5. Recombiner reaction condition
327
Role of Precious Metal Catalysts
12.3 Flammability control system (FCM) Three Mile Island accident taught us introducing FCM which is countermeasure of accidental coolant loss by breakage of cooling pipe and/or others. When cooling system is out of order, steam and Zr, which is cover metal of fuel rods, react and produces H2. And H2 is potentially generated from fuel rods even after shut down of nuclear furnace. It may hydrogen explosion. H2O + 1/2 Zr → 1/2 ZrO2 + H2 FCS is installed recombiner catalyst which is the same catalyst as waste gas treatment system. FCS is fixed outside or inside of the vessel as shown in Fig.30.
Fig. 30. FCS installed reactor Radioactive I2 are catalyst poison for Pd and Pt. I2 adsorbent such as Ag/Al2O3 or Ag/zeolite are introduced. Such adsorbents are fixed on the front of the reactor.
13. Environment 13.1 VOC abatement VOC (Volatile Organic Compounds) are removed by catalytic combustion system using Pt/honeycomb at lower than 350 C. A lot of plants, not only chemical plants such as acrylic acid, maleic acid, phenol plants, but also printing, enamel wire, even food plant such as coffee plants, apply VOC removal. In case of high VOC content, heat recovery system equipped with Pt/honeycomb catalysts. The self combustion system after ignition without heating is running in some case. Off gas treatment of PTA plants and phenol plants use Pt/honeycomb, and generated heat during off gas treatment is recovered. In polyester film facilities, Pt/honeycomb reduce falling particle of organic compounds onto the film. Organic chloride compounds are completely oxidized by Pt/mordenite also. 13.2 Gas turbine off gas abatement NOx can be reduced by adding water to fuel gas in gas turbine. NOx concentration can be reduced to 40 ppm from 150 ppm. However, addition of water increases CO from 10 ppm to 400 ppm because of lower flame temperature. In order to solve the problem, Pt/honeycomb is applied to oxidize CO completely. Since Pt/Al2O3 is poisoned by sulfur dioxide producing Al2(SO4)3, sulfur resistant catalysts, Pt/TiO2 are developed. Suggested reaction temperature and GHSV are 315-600 °C, and 200,000hr-1, respectively. (Bartholomew 2006) (Fig.31)
328
Noble Metals
Fig. 31. Gas turbine installed CO oxidation catalyst 13.3 Low NOx burner NOx is produced in the flame at high temperature. Production of NOx can be controlled by flam less combustion using Pd catalyst. Catalytica developed low NOx burner which consists of Pd/honeycomb layer and the combustion room without catalyst. Combustion gas is heated up to approx. 470 C by burner. Catalytic combustion takes place in catalytic layer up to approx. 870 C. At last, final combustion is conducted in flam less combustion room without catalyst. (Fig.32) NOx concentration of off gas is generally less than 5 ppm. Several plants with NOx burner system have been commercialized in USA. Ferrite type stainless containing Al honeycomb is selected for the honeycomb carrier instead of ceramics for prevention of heat destruction. (Shoji 1999) The system called Xonone Combustion System was developed by Catalytica Energy Co., NOx content is very low in the test results at power plant using gas engine. Small amount of NOx is produced at pre-burner, disclosed at Calfornia Air Resources Board Precertification Program in June 2002. (Table-6) Off gas
Content ppm
NOx
1.13
CO
1.36
VOCs
0.16
Table 6. Power plant test result at O2 15%
Fig. 32. Catalytic converter
Role of Precious Metal Catalysts
329
14. Auto exhaust catalyst 14.1 Pt consumption 50% of Pt, 60% of Pd, and 85% of Rh in production from mining per year are consumed for automotive exhaust purification catalysts. Recovery of metals from spent automotive exhaust catalyst is currently 15% for Pt and Pd, and 30% for Rh so far. 14.2 Gasoline engine Three way catalysts that remove CO, HC and NOx from exhaust gas of gasoline engine are used in the world. Contaminants of automotive exhaust gas of gasoline engine are reduced almost 99% by the catalytic converter. Pt and Pd are especially effective for combustion of hydrocarbon and carbon monoxide. Rh is effective for NOx reduction under stoiciometric condition. For example Pd-Pt/honeycomb is fixed in front part and Pd-Rh or Pt-Rh/honeycomb is fixed in the rear part of the converter which is installed under driver floor. (Fig. 33)
Fig. 33. Three way catalyst Pt content cannot be reduced because of sintering which occurs at high temperature when reaches driving speed high. Some advanced technologies have been developed. Toyota Motor found Pt shows positive influence by strong interaction with metal oxide. Pt on CZY ( CZY : 50%CeO2, 46%ZrO2, 4%Y2O3) does not show sintering at 800 °C, 5 hrs, and in the air. This is known as strong metal support interaction (SMSI). Pt is strongly fixed on oxide support by forming Pt oxide with carrier. By conducting XAFS analysis, Toyota Motor proved that Pt strongly bonds with carrier through surface oxygen atm. (Nagai 2007) Daihatsu Motor developed heat resistant catalyst that consists of precious metal and peroveskite as support. PM is taken into lattice of peroveskite at oxidation atmosphere at high temperature. PM is out of lattice at reductive atmosphere at low temperature. Precious metal content of the catalyst can be reduced because sintering is significantly prevented. The catalysts are commercialized for light vehicle, and application of high exhaust gas temperature. The mechanism is investigated by XAFS study. (Daihatsu 2006) (Daihatsu 2008)
330
Noble Metals
14.3 Purification of diesel engine gas NO2 is found to be oxidizing agent for soot. NO is oxidized to NO2 by Pt/Al2O3 / honeycomb at first converter, and then soot is combusted to CO2 at soot trap filter which Pt coated pores of wall through honeycomb consisting of SiC as a heat resistant material. NO + 1/2 O2 → NO2 → CO2 + NO
C + 3/2 NO2 NO 2 NO2
+
1/2 O2
→ NO2
+ C → CO2 + NO
15. Amenity 15.1 Catalytic heater Catalytic heaters, Pt coated on alumina or silica wool, are widely used in Northern Europe. Natural gas or LPG is used as a fuel. Flameless infrared light heats the room. Portable catalytic heaters are sold for outside leisure, for instance, for camping, fishing and others. Honeycomb type of catalytic heaters is several pieces of Pt/honeycomb connected in series. It generates far infrared light which convey heat in distance. Thus, it is very useful to apply for large room such as gymnasium. Cord less catalytic heater is used for soldering iron using LPG. 15.2 Closed type battery Lead batteries are used as a power source for emergency light, telephone system and traffic light and others. Small amount of water is decomposed as hydrogen and oxygen during charging battery. Waterproof Pd/Al2O3 particles are charged in porous ceramic cage. Hydrogen and oxygen are converted to water and dropped back into battery. Water level can be kept same for the long time. 2 H2 +
O2
→ 2 H2O
15.3 Ozone decomposition Aircraft have to take air into the cabin at high altitude where air contains more ozone. This ozone uptake potentially makes from passengers airplane sick. Ozone converter is installed in the every plane now. Ozone is decomposed by Pd/honeycomb catalyst. 2 O3
→ 3 O2
16. Space Decomposition of hydrazine by Ir/Al2O3 is propulsion power for control of satellite position in the space. Thrusters are fixed at the several sides of satellite wall. N2H4
→ N2 + 2 H 2
331
Role of Precious Metal Catalysts
17. Future 17.1 Fuel cell 17.1.1 Fuel cell system Polymer electrolyte fuel (PEFC) is expecting to apply for residential and automotive use for at lower operation temperature. Target amount of Pt use is 0.5-0.7g/unit for residential use, 25-35 g/vehicle. Currently 5-10 times more of Pt is required. Since electric car cannot run long distance, fuel cell car is expected to be commercialized. Infrastructure of hydrogen supply remains as a technical challenge. (Table-7) Residential use
Automobile use
Power Capacity
0.7~1.0 kw
50 kw
Fuel
City gas, LPG, Kerocene
Hydrogen
Pt use amount
0.5~0.7 g/unit
25~35 g/car
Life of Cell
10 years
100,000 km
Table 7. Expecting performance of fuel cell PEFC system for residential use equipped with purification, steam reforming, shift reaction, PROX, electrode and off gas treatment. It still appears to be complicated. (Fig.34)
Fig. 34. Fuel Cell system flow
332
Noble Metals
17.1.2 Reforming and hydrogen purification City gas can be a fuel for a fuel cell of residential use. Containing small amount of sulfur is removable by Fe or Ag/Al2O3. Ni or Pt/Al2O3 is used for steam reforming to produce hydrogen. Since containing CO impurity in hydrogen poisons catalyst, CO is needed to remove by shift reaction with Cu-Zn. Remaining 1% of CO is removed by preferential oxidation (PROX) to less than 10 ppm by using Ru, Pt, or Au/TiO2. Ni/Al2O3 causes carbon formation in case of kerosene as fuel. Ru/ZrO2 is developed to overcome the issue. 17.1.3 Electrode Purified hydrogen is introduced to anode, however small amount of CO (10 ppm) is remain which is catalyst poison, therefore CO resistant Pt-Ru coated carbon is used. Air is fed to Cathode which is Pt coated carbon. Carbon is high temperature treated graphite, however carbon oxidation would not be overcome by produced hydrogen peroxide for long use. Reduction of amount of Pt and Ru loading is the most important target. An example of typical Pt/carbon and Pt-Ru/carbon electrode is shown in Table-8.
Pt content
Cathode
Anode
50 %
27 %
Ru content
―
13 %
Moisture
TO2 > TNO. Methane dissociation is the main step in one of the most intensively investigated process of the partial methane oxidation (PMO). Thus, it was interesting to compare the activity of the Rh active sites in the Al-Rh nanocrystallites which formed on the surface of the low-loaded Rh/Al2O3 catalysts with that of the Rh active sites in the rhodium clusters present on the surface of the high-loaded catalysts. The study of the influence of the concentration of the atomic oxygen surface species on the Al-Rh alloy nanocrystallites on the composition of the PMO products is necessary to understand the role of the CH4: O2 ratio in the PMO process. The investigations of the Al segregation in the Al-Rh alloy nanocrystallites allow one to understand the evolution of the surface structure during the catalyst use at temperatures higher than the synthesis temperature. The simultaneous studies of the NO direct decomposition and CH4 oxidation may confirm the expected sequence of the temperatures of the initial dissociation of CH4, O2 and NO. The knowledge of this sequence would help to estimate the temperature range of the effective direct NO decomposition in the off gases containing methane and an excess of oxygen. 1.2 The methane conversion in the oxygen presence to the synthesis gas over alumina supported rhodium catalysts CO and H2 mixture (the synthesis gas - syn-gas) is applied in the Fischer-Tropsch and methanol syntheses. Hydrogen for ammonia synthesis and the food industry is also obtained from the syn-gas. At present the synthesis gas is produced mainly by the highly endothermic, and thus unfriendly for environment, methane steam reforming. The exothermic partial methane oxidation would be more economical and therefore more friendly for environment. Since a C-H bond can be broken on Rh sites at relatively low temperatures (Wang et al., 1996), the endothermic methane dissociation to C atoms and dihydrogen, followed by carbon oxidation, is most frequently considered as a plausible mechanism of the partial methane oxidation to the synthesis gas over the Rh/Al2O3 catalysts (Enger et al., 2008; Hofstad et al., 1998; Mallens et al., 1997; Nakagawa et al., 1999; Wang et al., 1996). At PMO temperatures hydrogen practically does not adsorb on the Rh surface and thus the possibility of its interaction with surface oxygen or OH groups is rather low ( Rieck & Bell, 1985). The high price of rhodium limits the use of the high loaded Rh/Al2O3 catalysts. Therefore it is of interest to investigate the possibility of the use of the low-loaded ones in PMO. In such catalysts Al-Rh alloys can be formed, besides clusters of metallic Rh, as a result of the strong metal-support interaction (SIMS) (Pietraszek et al., 2007;Zimowska et al., 2006).
Alloying Effect in Low Loaded Rh Catalysts Supported on High Surface Area Alumina on Their Activity in CH4 and NO Decomposition
355
As it was discussed elsewhere (Zimowska et al., 2006), calcination of the precursors of the low loaded Rh/δAl2O3 catalysts (with the specific surface area ca 287m2/g) causes Rh incorporation into the near-to-surface layers of the alumina nanocrystallites resulting in a Rhx+/Al2O3 solid solution (Rhx+/Al2O3 s.s.) formation. The reduction of such a s.s. leads to Al-Rh alloys. 1.3 The NO direct decomposition in the oxygen presence over alumina supported precious metal catalysts Nitrogen oxides NOx in the flue gases from fuel combustion contain more then 90% of NO. It is formed from air in the endothermic N2 oxidation at temperatures above 1273K. NO is a thermodynamically unstable molecule with a high, positive formation enthalpy ∆Hºf (298) = 90,2 kJ/mol. Therefore it could decompose to N2 and O2 at low temperatures (between 293 and 973K ) (Chuang & Tan, 1997; Garin, 2001; Tonetto et al., 2003). The NO decomposition seems to be the best way of NO removal from the flue gases of stationary sources of emission from a practical, environmental as well as an economical point of view. This process does not require any reducer that allows the avoidance of secondary pollutants like oxygenated hydrocarbons, CO, CO2, NH3 or even cyanate and isocyanate (Chuang & Tan, 1997; Parvulescu et al., 1998; Tonetto et al., 2003). However, in the case of the direct NO decomposition N2O can be formed aside from N2 in one of the two possible paths of the process (Parvulescu et al., 1998): 2NO → N2 + O2
(1)
2NO → N2O + ½ O2
(2)
Oxide supported Pt, Rh and Pd high-loaded catalysts are known to be the most active in the direct NO decomposition among the metal catalysts supported on metal oxides (Almusaiteer et al., 2000; Garin, 2001; Gorte et al., 1981; Ishii et al., 2002; Papp & Sabde, 2005; Pietraszek et al., 2007; Rahkamaa & Salmi, 1999; Root et al., 1983; Sugisawa et al., 2001; X. Wang et al., 2004). However, the NO dissociation proceeds on Rh active species in rhodium clusters with a satisfactory rate only above 623K and it is greatly suppressed by the oxygen presence. The reactive atomic species at such temperatures favor NO oxidation. On the other hand, the direct NO decomposition on the Rh active sites in Al-Rh alloy nanocrystallites (Pietraszek et al., 2007) formed on the low loaded alumina supported catalysts may proceed with a relatively high rate at 473K, below the temperature of the oxygen dissociation. The investigation of the alloying effect on the NO direct decomposition in the presence of oxygen and methane on a 0.18 wt.% Rh/δAl2O3 catalyst with rhodium present mostly in the Al-Rh nanocrystallites should give relevant information about the direct NO decomposition in off gasses formed during methane combustion.
2. Results and discussion 2.1 Experimental Two 0.18 wt.% Rh/δAl2O3 catalysts were obtained by one- or three-step Rh3+ deposition on δ-alumina support. It was expected that such a procedure would produce catalysts with Rh sites of different coordination.
356
Noble Metals
The structure of the Rh sites was determined by the FTIR spectroscopy of CO adsorbed and by XPS. The δAl2O3 support (287m2/g) was obtained by the sol-gel method from aluminum tri-secbutylate (Zimowska et al., 2006). The one-step (1-S) and three-step (3-S) Rh depositions were performed from a RhCl3.2H2O aqueous solution of the same concentration. The details of the Rh deposition as well as those of oxidising and reducing thermal treatments were described elsewhere (Pietraszek et al., 2007; Zimowska et al. 2006). The first step of the 3-S synthesis of the 0.18 wt.% Rh/δAl2O3 catalyst consists of: i/ the impregnation of the δAl2O3 support with the RhCl3.2H2O aqueous solution, ii/ the drying of a wet precursor, iii/ the calcination of a dry precursor at 773K and reduction at 623K and 773K of a calcined precursor. The used procedure yields the 0.06 wt.% Rh/δAl2O3 catalyst. The next step of the 3-S synthesis of the 0.18wt.% Rh/δAl2O3 catalyst differs from the previous one only in the first stage; the 0.06 wt.% Rh/δAl2O3 catalyst (not the δAl2O3 support) is impregnated by the RhCl3.2H2O aqueous solution. As a result of the next drying, calcination and reduction the 0.12wt.%Rh/δAl2O3 catalyst is obtained. In the third step of the 3-S synthesis the 0.12 wt.% Rh/δAl2O3 catalyst is impregnated by the same RhCl3.2H2O aqueous solution. The next drying, calcinations and reduction yields the 0.18 wt. % Rh/ δAl2O3 catalyst. The 1-S synthesis of the 0.18 wt.% Rh/δAl2O3 catalyst consists of: i/ the impregnation of the δAl2O3 support with a triple portion of the RhCl3.2H2O aqueous solution, ii/ the drying of a wet precursor, iii/ the calcination of a dry precursor and the reduction of a calcined precursor. The FTIR spectroscopy of CO adsorbed and XPS measurements were performed for the fresh one-step ( F-1-S) and three-step (F-3-S) catalysts as well as for the one-step and threestep catalysts subjected to the interaction with six methane pulses (U-1-S) and (U-3-S). CO was adsorbed on the surface of the catalysts at room temperature and the spectra were taken also at room temperature after outgasing at 373K using a Nicolet 5700 Nexus spectrometer at a resolution of 4 cm-1. The XPS measurements for F-1-S, F-3-S, U-1-S, and U-3-S catalysts were carried out using a scanning photoelectron spectrometer PHI 5000 VersaProbe (Physical Electronics USA/ULVAC Japan) with monochromatic Al Kα radiation (1486.6eV). The signal was collected from 200 x200μm area using an x-ray beam focused to 100μm diameter with 25 W power. For the charge shift compensation all the measurements were made with neutralization by low energy electrons and argon ions. The survey spectra were obtained with a pass energy of 117.4eV in 0.4eV increments. The detailed spectra of the Rh3d, and the Al2p regions were measured with a pass energy of 23.5eV in 0.1eV increments. The binding energy scale (BE) was calibrated based on the Al2p in a Al2O3 support signal (BE = 74.3eV). Signal components were fitted using a non-linear least squares fitting Casa XPS software. The quantitative analysis was done after a Shirley-type background subtraction using the Scofield sensitivity factors.
Alloying Effect in Low Loaded Rh Catalysts Supported on High Surface Area Alumina on Their Activity in CH4 and NO Decomposition
357
The investigation of the interaction of the catalysts with methane pulses was carried out at 873K in an acid-resistant steel tubular reactor with a 6mm internal diameter and 30cm length, under the pressure of 280 kPa and at GHSV =9000h-1. The 700 mm3 methane pulses were introduced into the Ar stream flowing through the reactor, the Carboxen 1000 packed column and the TCD detector of a Hewlett-Packard 5890 chromatograph. The time between consecutive methane pulses was ca. 32min. The direct NO decomposition in methane and the oxygen presence was investigated under the steady-state conditions in 473-673K temperature range. The reaction mixture of 150ppm NO 1500ppm CH4, 7%O2 and Ar as a balance passed over the catalyst placed on quartz-wool in a quartz reactor with GHSV = 20 000h-1. Before the steady-state experiment the catalyst was heated in the reaction mixture from the r.t. to 773K and consecutive measurements were performed stepwise starting from 673K to 473K. A FID detector was used to follow the total concentration of hydrocarbons and the N2 formation was checked by a micro-GC. 2.2 The physicochemical characterisation of 0.18wt.%Rh/Al2O3 catalysts by FTIR spectroscopy of CO adsorbed and XPS Fig. 1. presents the FTIR spectra of CO adsorbed on the F-3-S 0.18wt.%Rh/Al2O3 catalyst (a) and on the F-3-S 0.18 wt.% Rh/Al2O3 one (b). In agreement with the data extensively reported in the literature (Finocchio et al., 2007 ; Hadjiivanov &Vayssilov, 2002; Kraus et al., 1989; Lavalley et al., 1990; Paul et al., 1999; Yates et al., 1979) two main bands at 2087 and 2013 cm-1, present in the spectra of both the catalysts, can be assigned to symmetric and asymmetric stretching vibrations of gem-bicarbonyls adsorbed on the Rh atomically dispersed
Fig. 1. DRIFT spectra CO adsorbed on the surface of the 0.18 wt.% Rh /δAl2O3 catalysts obtained by: a/three-step rhodium deposition, b/ one-step rhodium deposition
358
Noble Metals
on the alumina surface. However, the exact position of the atomically dispersed Rh in the structure of catalyst has yet to be determined (Finocchio et al., 2007 ; Hadjiivanov &Vayssilov, 2002; Kraus et al., 1989; Lavalley et al., 1990; Paul et al., 1999; Yates et al., 1979). According to above cited papers the peak at 2058cm-1, clearly seen in the spectrum of the F-1-S catalyst, results from C-O stretching vibrations in CO linearly adsorbed on the Rh clusters.
Fig. 2. DRIFT spectra of CO adsorbed on the surface of the 0.18 wt.% Rh /δAl2O3 catalysts: a/ obtained by a three-step rhodium deposition and subjected to interaction with six methane pulses, b/ obtained by a one-step rhodium deposition and subjected to interaction with six methane pulses. Thus one may conclude that on the surface of the F-1-S catalysts the atomically dispersed Rh coexists with the Rh clusters. However, on the surface of the F-3-S catalyst atomically dispersed species are hardly seen. Fig. 2 presents the FTIR spectra of CO adsorbed on the three-step (a) and one-step (b) 0.18wt.% Rh/Al2O3 catalysts subjected to interaction with 6 methane pulses at 873K. The distinct decrease of the ratio of Rh in clusters to Rh in alloy nanocrystallites as a result of the catalysts interaction with methane pulses is observed. The increase of the width of the gem-bicarbonyl peaks reveals that during the pulse experiment atomically dispersed Rh with a coordination slightly different than in the fresh catalysts is formed. The comparison of XPS results for the fresh and used catalysts gives further insight in the nature of atomically dispersed rhodium species and in the mechanism of their creation as well as their interaction with the clustered metallic rhodium species. In Table 1 the BEs of peaks obtained by the deconvolution of the Al2p3/2 and Rh3d5/2 bands as well as the percentage of the particular Al and Rh species ((Mex/ΣRhx+ΣAlx).100) in F-1-S, U-1-S, F-3-S and U-3-S catalysts are presented.
Alloying Effect in Low Loaded Rh Catalysts Supported on High Surface Area Alumina on Their Activity in CH4 and NO Decomposition
Catalyst
BE [eV]
(Mex/ΣRhx+ΣAlx).100 [at.%]*
Rh3d5/2
310.0 307.4
0.08 0.05
Al2p3/2
74.3
99.87
Rh3d5/2
307.5 305.0
0.003 0.003
Al2p3/2
75.4 74.3
15.69 84.30
Rh3d5/2
310.2 307.8
0.06 0.09
Al2p3/2
75.5 74.3
9.72 90.13
Rh3d5/2
309.6 307.2
0.003 0.003
Al2p3/2
75.4 74.3
14.21 85.70
Peak
F-1-S
359
U-1-S
F- 3-S
U- 3-S
Mx – metallic or cationic Rh and/or Al species
Table 1. The XPS results for the fresh one-step (F-1-S) and the three-step (F-3-S) 0.18 wt.% Rh/ δ Al2O3 catalysts and for those catalysts subjected to the interaction with six methane pulses (U-1-S and U-3-S). The Al2p3/2 bands in the spectra of the particular catalysts were deconvoluted into two peaks. The major peaks were ascribed to Al in alumina - BE=74.3eV (Wagner et al., 2007). The BE of the less intensive Al2p3/2 peaks as well as those of the Rh 3d5/2 peaks were determined with respect to this one. The less intensive Al2p3/2 peaks with exceptionally high BE (75.4-75.5eV) were ascribed to Al in the Al-Rh alloy. The transfer of the valence Al electrons mainly to Rh unoccupied d-orbitals (Azaroff, 1960; Kittel, 2005) in the alloy should cause the increase of the Al2p3/2 BE and decrease of Rh3d5/2 one with respect to those in separate metals (Wagner, 2007). The Rh3d5/2 bands in the XPS spectra of the F-1-S and F-3-S catalysts were deconvoluted into the peaks of cationic species with BE equal to 310.0 and 310.2eV and of Al-Rh alloy ones with BE equal to 307.4 and 307.8 eV, a little lower than that of metallic Rh (Wagner, 2007). The atomically dispersed Rh species (Finocchio et al., 2007; Hadjiivanov &Vayssilov, 2002; Kraus et al., 1989; Lavalley et al., 1990; Paul et al., 1999; Yates et al., 1979) demonstraded in the FTIR spectra of CO adsorbed on the F-1-S and the F-3-S catalysts (Fig.1) by bands at 2087 and 2013 cm-1, occur probably in the surface lattice position of the Al-Rh alloy nanocrystallites.
360
Noble Metals
The presence of only one 3d5/2 peak of the Rh species with BE =307.4 eV in the spectrum of the F-1-S catalyst reveals an electronic interaction between the Al-Rh intermediate phase nanocrystallites and the Rh clusters. It shows that the Rh clusters occur in the immediate proximity of the Al-Rh nanocrystallites. Such an electronic interaction was earlier observed by Thiam et al. (Thiam et al., 2004) between aluminum foil and a rhodium overlayer. A higher percentage of the metallic Rh species in the F-3-S catalyst (60 %) than in the F-1-S one (ca 40%) could easily be explained by the differences in the syntheses. The one-step Rh deposition is thought to have occurred preferably on the smallest nanocrystallites with the highest surface/bulk ratio, possibly by an Rh3+ cation exchange with protons of the accessible acidic OH groups on alumina. Thus, the Rh deposition calculated per volume unit of alumina crystallites is higher the smaller their dimensions are. Rhodium clusters are formed from an excess of the aqueous Rh3+ ions solution present in pores. On the other hand, the three-step Rh deposition occurs mostly by exchange of the Rh cations with the acidic OH group protons on the surface of the smallest δ alumina crystallites, which is renovated in each synthesis step in the course of the calcinations. It results in the exceptional enrichment of these crystallites in Rh. An incorporation of rhodium into δ alumina during the thermal treatments causes the formation of the Rhx+/Al2O3 solid solution. The reduction of the s.s. nanocrystallites, resulting in inter-metallic Al-Rh alloy formation, is easier the higher the rhodium concentration is. It is obvious that the enrichment of Rh atoms in electrons is the greater the higher their dispersion is in the aluminium matrix. Earlier this problem in particular was discussed regarding the Cu-Ni alloys (Kittel, 2005). The interaction of the F-1-S catalyst with six CH4 pulses causes a complete disappearance of the cationic Rh species and a great decrease in the content of the metallic Rh species. Simultaneously the Rh species with 3d5/2 BE equal to 305.0 eV and the Al species with an exceptionally high 2p3/2 BE (75.4eV) do appear. The disappearance of the cationic species reveals the formation of the new nanocystallites of the Al-Rh alloy by the reduction of the Rhx+/Al2O3 s.s. of low Rh content. The major decrease of the content of Rh species with 3d5/2 BE close to 307 eV and the appearance of the species with 3d5/2 BE = 305 eV and the Al ones with 2p3/2 BE = 75.4 eV could be the result of the Al surface segregation in the alloy nanocrystallites formed at 773K. However, Rh species with 3d5/2 BE = 305 eV and the Al ones with 2p3/2 BE = 75.4 eV could also be formed as a result of the reduction of the Rhx+/Al2O3 s.s. with a low Rh content. The heating of the F-3-S catalyst and its interaction with 6 methane pulses causes a great decrease in the total contents of the Rh species in the surface nanolayers, the disappearance of the species with 3d5/2 BE = 307.8 eV, the appearance of the ones with 3d5/2 BE = 307.2 eV and an increase of the content Al species with 2p3/2 BE = 75.4 eV. The major decrease in the content of the cationic and metallic Rh species, the the decrease in the 3d5/2 BE of the Rh metallic species as well as the increase of the content of the Al ones with 2p3/2 BE = 75.4 eV reveal the reduction of the Rh/Al2O3 s.s. areas with a small Rh content and Al segregation in the Al-Rh alloy nanocrystallites formed at 773K. The great extent of the surface Al segregation can be caused by great difference in Al and Rh melting points and the proximity of the used temperature and the temperature of Al melting (Lide, 2004-2005).
Alloying Effect in Low Loaded Rh Catalysts Supported on High Surface Area Alumina on Their Activity in CH4 and NO Decomposition
361
2.3 Methane dissociation on 1-S and 3-S 0.18 wt.% Rh/δAl2O3 catalysts In Fig 3. the methane conversion (CCH4), selectivity to hydrogen (SH2), selectivity to CO (SCO) and selectivity to CO2 (SCO2) in six consecutive CH4 pulses over F-1-S catalyst are presented.
Fig. 3. CH4 conversion (●) and selectivity to H2(■), CO (♦) and CO2 (▲) in six consecutive CH4 pulses over the one-step 0.18 wt.% Rh/δAl2O3 catalyst (873K, 280kPa, 9000 h-1). The CH4 conversion in the first pulse over the 1-S catalyst is equal to 33%, the selectivity to H2 – 68%, the selectivity to CO - 61% and to CO2 – 10%. In the following methane pulses CCH4 continuously decreases down to 23% in the sixth pulse. The SH2 increases up to 78 % in the sixth pulse, SCO decreases, almost linearly, down to 22% in the sixth pulse and the SCO2 drops to 0% in the fourth pulse. The simultaneous decrease of the CCH4, the SCO and the SCO2 and the increase of SH2 in the consecutive methane pulses can be explain by the decreasing concentration of the atomic species of oxygen adsorbed on the surface Rh species in Al-Rh alloy nanocrystallites and in Rh clusters present on the surface of the 1-S catalyst. The initial SH2 increase accompanied by a decrease in SCO2 reveals that further formation of alloy nanocrystallites with a low concentration of Rh sites have a greater ability to transfer electrons to methane molecules. The 2.8 fold decrease in the SCO in the sixth methane pulse with respect to that in the first methane pulse with a simultaneous increase of the selectivity to hydrogen, suggesting deeper methane dissociation, clearly shows a carbon deposition on the catalyst surface as a result of the deficit of oxygen species adsorbed. In Fig. 4 the methane conversion, selectivity to hydrogen, selectivity to CO and the selectivity to CO2 in six consecutive CH4 pulses introduced to the reactor containing the F3-S catalyst are presented.
362
Noble Metals
Fig. 4. CH4 conversion (●) and selectivity to H2(■), CO (♦) and CO2 (▲) in six consecutive CH4 pulses over the 3-S 0.18wt.% Rh/δAl2O3 catalyst (873K, 280kPa, 9000 h-1). The CCH4 in the first methane pulse is equal to 42%, the SH2 - 83%, the SCO - 72% and the SCO2 – 11%. In the next methane pulses the CCH4 decreases down to 22% in the sixth pulse. The SH2 increases up to 98% in the third pulse and slowly decreases to 94% in the sixth pulse. The SCO decreases almost linearly down to 22% in the sixth pulse and SCO2 drops to 0% in the fourth pulse. The simultaneous decrease in the SCO2 and increase of the SH2 in the consecutive methane pulses up to the forth one could be ascribed to the formation of the new Al-Rh alloy nanocrystallites of a low content of Rh sites with a great ability to transfer the electrons to the methane molecules adsorbed. There is a 50% decrease in the CCH4 and approximately a 70% decrease in the SCO in the sixth pulse in comparison with the first one, not accompanied by the decrease in the SH2 which reveals carbon deposition on the Al-Rh alloy nanocrystallites. The formation of the new alloy nanocrystallites by the reduction of the Rh/Al2O3 s.s. of the relatively low rhodium concentration causes the creation of a very active Rh species. The stronger SCO decrease on the 3-S catalyst (3.3 fold) of a higher activity than on the 1-S one (2.8 fold) of lower activity reveals that carbon is preferably deposited on the Al-Rh nanocrystallites. The higher conversion of the first methane pulse over the F-3-S catalyst than over the F-1-S reveals that the Rh active species in the Al-Rh alloy nanocrystallites are more active in the methane dissociation than those in the Rh clusters (Figs.1 and 2). The decrease of the activity of both the catalysts in the consecutive pulses corresponds to the decrease of the total content of the Rh species accessible for methane adsorption.
Alloying Effect in Low Loaded Rh Catalysts Supported on High Surface Area Alumina on Their Activity in CH4 and NO Decomposition
363
The slower the decrease of the methane conversion over the 1-S catalyst than that over the 3S one may be assigned to a slower carbon deposition on the Rh clusters than on the Al-Rh nanocrystallites. On the other hand, the higher selectivity to hydrogen over the 3-S catalyst than over the 1-S one clearly shows a beneficial influence of the Al proximity on the Rh sites ability to transfer electrons to antibonding orbitals of methane. Fig. 5 presents CH4 conversion and selectivity to H2, CO and CO2 in 41 consecutive CH4 pulses over the 3-S 0.18wt.% Rh/δAl2O3 catalyst (873K, 280kPa, 9000 h-1). The methane pulses were introduced into the reactor mostly in time intervals close to 30min. Less regular time intervals (30-37min.) were applied between the 11th and 17th pulses as well as the 25th and 33rd. The CCH4 and SCO decrease and SH2 increases in consecutive pulses up to the pulse 11. Irregular intervals between the 11 - 17 pulses and the 25 – 33 ones cause fluctuations in the CCH4, the SCO and the SH2 that can be ascribed to the changes in the amount of the carbon deposit oxidized by the oxygen from the gas phase. The 75 min. time interval between 34th and 35th pulses resulted in the CCH4 increase of 11% and of the SCO of 110%. The increase of the time between the 40 and 41 pulses to 110 min. results in the increase of the CCH4 of 25% and of the SCO of 230%. However, the selectivity to hydrogen does not change distinctly in any case. Thus, one can conclude that a long term interaction of the surface of the Al-Rh nanocrystallites, containing the carbon deposit, with the gas phase containing traces of oxygen causes both a carbon deposit removal by oxidation and oxygen adsorption. The oxidation of the carbon deposit causes the recovery of the Rh sites active in the methane dissociation that results in the increase of the CCH4. The surface oxygen species cause oxidation of the carbon formed due to methane dissociation, that leads to the SCO increase. However, their population is not high enough to have an effect on the SH2. Thus, to perform the PMO with the high methane conversion and the high selectivity to CO and H2 the proper CH4:O2 ratio is needed.
Fig. 5. CH4 conversion (●) and selectivity to H2(■), CO (♦) and CO2 (▲) in 41 consecutive CH4 pulses over the 3-S 0.18wt.% Rh/δAl2O3 catalyst (873K, 280kPa, 9000 h-1).
364
Noble Metals
2.4 Direct NO decomposition over the three-step (3-S) 0.18 wt.% Rh/δAl2O3 catalyst NO conversion (CNO), selectivity to N2 (SN2 ) calculated from the results of the steady-state experiments over the 3-S 0.18wt.%Rh/Al2O3 catalysts, are presented in Figure 6.
100
50
80
40
60
30
40
20
20
10
0 423
473
523
573
623
673
C NO [%]
S N2 [%]
The steady-state experiment was performed with the use of the reaction gas containing 150ppm NO, 1500ppm CH4, 7%O2 and Ar as a balance.
0 723
Temperature [K] Fig. 6. NO conversion (●) and selectivity to NO (■) over three-step a 0.18 wt.% Rh/δAl2O3 catalyst (150ppmNO +1500ppm CH4 + 7%O2 /He , 20000h-1, data from steady-state experiment) The highest NO conversion, increasing with a temperature increase, from 38 to 47%, is observed at a temperature range 473K - 573K. The highest but decreasing from 100% to 85% selectivity to N2 is achieved in the same temperature. A simultaneous sudden drop of the SN2 and a deep decrease in CNO are observed at 623K. The direct NO decomposition over the high-loaded rhodium catalysts supported on alumina was earlier observed only at temperatures higher than 623K (Garin, 2001). Thus, the low-temperature NO decomposition on the low loaded 0.18wt.%Rh/δAl2O3 catalyst confirms exceptional activity of the Rh sites in Al-Rh alloy. A simultaneous increase of the CNO and the decrease of the SN2 with the temperature increase in the 473K - 573K range could be explained by the competitive dissociative O2 adsorption on the Rh active sites, increasing with temperature. The atomic oxygen species block the Rh sites active in the direct NO decomposition and facilitate the NO oxidation. The simultaneous sudden drop of the SN2 and a great decrease in the CNO at 623K shows that blocking the Rh sites-active in the NO dissociation becomes much stronger. Such blocking may originate in a methane dissociation on the same sites. In Fig. 7, the CH4 conversion (CCH4) and selectivity to CO2 (SCO2), measured during the thermo-programmed catalyst heating at the rate of 3K/min in the reaction mixture containing 150ppm NO, 1500ppm CH4, 7%O2 and Ar as a balance, are presented.
Alloying Effect in Low Loaded Rh Catalysts Supported on High Surface Area Alumina on Their Activity in CH4 and NO Decomposition
365
100
60
80
50 40
60 30 40 20 20 0 423
C CH4 [%]
S CO2 [%]
The temperature of the sudden drop of the SN2 and CNO (Fig. 6) corresponds to the initial temperature of the total methane oxidation to CO2 (Fig. 7). This confirms competitive methane adsorption on the Rh active sites leading to the formation of the carbon species undergoing oxidation to CO2.
10
473
523
573
623
673
723
0 773
Temperature [K] Fig. 7. CH4 conversion (●) and selectivity to CO2 (▲) over three-step 0.18 wt.% Rh/δAl2O3 catalyst (150ppmNO +1500ppm CH4 + 7%O2 /He , 20000h-1, data from TPSR experiment)
3. Conclusions The DRIFT spectroscopy of the adsorbed CO and XPS were used to show the formation of the Al-Rh alloy nanocrystallites on the surface of the 0.18 wt % Rh/δAl2O3 catalysts obtained by the one-step or three-step impregnation of the high surface area alumina support with the RhCl3 aqueous solution (1-S and 3-S catalysts). The effect of Al-Rh alloying on the catalyst activity in the methane dissociation and the direct NO decomposition was investigated. The activity and selectivity to dihydrogen and to carbon monooxide of both the catalysts were determined at 873K. The results showed unambiguously that alloying distinctly enhances the Rh site activity in the electron donation to antibonding orbitals of methane molecules adsorbed. The observed enhancement of the Rh site activity was ascribed to the Al valence electrons transfer to the Rh 4d shell and slightly to the Rh 5s shell. The direct NO decomposition in the presence of oxygen and methane was investigated in the temperature range of 673-473K over a 3-S catalyst. The NO conversion with 100% selectivity to dinitrogen on the Rh active sites was revealed at an unexpectedly low temperature (473K). Simultaneous increase of the activity and decrease in the selectivity to dinitrogen with a temperature increase up to 573K clearly revealed a competitive dissociative oxygen adsorption on the same active sites. However, the sudden decrease at 623K of the catalyst activity in the NO decomposition and the selectivity to dinitrogen, accompanied by an initial methane oxidation to CO2, undoubtedly showed competitive methane dissociation.
366
Noble Metals
4. Acknowledgment The polish authors (M. N, J. D. and P. K.) acknowledge the financial support by the European Regional Development Fund under the Innovate Economy Operational Programme 2007-2013, POIG.01.01.02-12-112/09 project.
5. References Almusaiteer, K.; Krishnamurthy, R. & Chuang, S.S.C. (2000). In situ infrared study of catalytic decomposition of NO on carbon-supported Rh and Pd catalysts. Catalysis Today, Vol.55, No.3, pp. 291-299, ISSN 0920-5861 Azaroff, L.V. (1960). Introduction to Solids, McGRAW-Hill Book Cmpany, New York Bostrom, M.; Rosner, H.; Prots, Y.; Burkhardt, U. & Grin,Y. (2005). The Co2Al9 Structure Type Revisited. Zeitschrift für anorganische und allgemeine Chemie,Vol.631, No.2-3, pp.534-541, ISSN 1521-3749 Chuang, S.S.C. & Tan, C.–D. (1997). Promotion of oxygen desorption to enhance direct NO decomposition over Tb−Pt/Al2O3 catalyst. The Journal of Physical Chemistry B, Vol.101, No.15, pp. 3000-3004, ISSN 1520-5207 Enger, B.C.; Lodeng, R. & Holmen, A. (2008). A review of catalytic partial oxidation of methane to synthesis gas with emphasis on reaction mechanisms over transition metal catalysts. Applied Catalysis A: General, Vol.346, No.1-2, pp.1-27, ISSN 0926860X Finocchio, E.; Busca, G.; Forzatti, P.; Groppi, G. & Beretta, A. (2007). State of supported rhodium nanoparticles for methane catalytic partial oxidation (CPO): FT-IR studies. Langmuir, Vol.23, No.20, pp. 10419–10428, ISSN 1520-5827 Garin, F. (2001). Mechanism of NOx decomposition. Applied Catalysis A: General, Vol.222, No.1-2, pp. 183-219, ISSN 0926-860X Gasser, R.P.H. (1985). An introduction to chemisorption and catalysis by metals, Oxford University Press, ISBN 0-19-855163-0, New York Gorte, R.J.; Schmidt, L.D. & Gland, J. L. (1981). Binding states and decomposition of NO on single crystal planes of Pt. Surface Science, Vol.109, No.2, pp. 367-380, ISSN 00396028 Hadjiivanov, K.I. & Vayssilov, G.N. (2002). Characterization of oxide surfaces and zeolites by carbon monoxide as an IR probe molecule. Advances in Catalysis, Vol.47, pp. 307511, ISBN 0-12-007844-9 Hofstad, K.H.; Hoebink, J.H.B.J.; Holmen, A. & Marin, G.B. (1998). Partial oxidation of methane to synthesis gas over rhodium catalysts. Catalysis Today, Vol.40, No. 2-3, pp. 157-170, ISSN 0920-5861 Ishii, M.; Hayashi, T. & Matsumoto, S. (2002). Adsorption, desorption and decomposition of nitrogen monoxide on Rh(1 0 0) studied by electron-stimulated desorption, Auger electron spectroscopy and temperature-programmed desorption. Applied Catalysis A: General, Vol.225, No.1-2, pp. 207-213, ISSN 0926-860X Kittel, Ch. (2005). Introduction to Solid State Physics John Willey & Sons. Inc, ISBN 0-47141526-x, USA Kraus, L.; Zaki, M.I.; Knözinger, H. & Tesche, B. (1989). Support and additive effects on the state of rhodium catalysts. Journal of Molecular Catalysis, Vol.55, No.1, pp. 55-69
Alloying Effect in Low Loaded Rh Catalysts Supported on High Surface Area Alumina on Their Activity in CH4 and NO Decomposition
367
Lavalley, J.C.; Saussey, J.; Lamotte, J.; Breault, R.; Hindennann, J.P. & Kiennemann, A. (1990). Infrared study of carbon monoxide hydrogenation over rhodium/ceria and rhodium/silica catalysts. The Journal of Physical Chemistry, Vol.94, No.15, pp. 5941– 5947 Lide, D.R. (2004-2005). Handbook of Chemistry and Physics, CRC Press, ISBN 0-8493-0485-7, Boca Raton Mallens, E. P. J.; Hoebink, J.H.B.J. & Marin, G.B. (1997). The reaction mechanism of the partial oxidation of methane to synthesis gas: A transient kinetic study over rhodium and a comparison with platinum. Journal of Catalysis, Vol.167, No.1, pp. 43-56, ISSN 0021-9517 Nakagawa, K.; Ikenaga, N.; Kobayashi, T. & Suzuki, T. (1999). Transient response of catalyst bed temperature in the pulsed reaction of partial oxidation of methane to synthesis gas over supported rhodium and iridium catalysts. Journal of Catalysis, Vol.186, No.2, pp. 405-413, ISSN 0021-9517 Papp, H. & Sabde, D.P. (2005). An investigation on the mechanism of NO decomposition over Rh/SiO2 catalysts in presence of pulse injected H2. Applied Catalysis B: Environmental, Vol.60, No.1-2, pp. 65-71, ISSN 0926-3373 Parvulescu, V.I.; Grange, P. & Delmon, B. (1998). Catalytic removal of NO. Catalysis Today, Vol.46, No.4, pp. 233-316, ISSN 0920-5861 Paul, D.K.; Marten, C.D. & Yates, J.T.Jr. (1999). Control of RhI(CO)2 formation on Rh/Al2O3 catalysts by complexation of surface −OH groups using NH3. Langmuir, Vol.15, No.13, pp. 4508–4512, ISSN 1520-5827 Pietraszek, A.; Da Costa, P.; Marques, R.; Kornelak, P.; Hansen, T.W.; Camra, J. & Najbar, M. (2007). The effect of the Rh–Al, Pt–Al and Pt–Rh–Al surface alloys on NO conversion to N2 on alumina supported Rh, Pt and Pt–Rh catalysts. Catalysis Today, Vol.119, No.1-4, pp. 187-193, ISSN 0920-5861 Rahkamaa, K. & Salmi, T. (1999). Investigation of the catalytic decomposition of NO and N2O on supported Rh with transient techniques. Chemical Engineering Science, Vol.54, No.20, pp. 4343-4349, ISSN 0009-2509 Rieck, J.S. & Bell, A.T. (1985). Studies of the interactions of H2 and CO with silica- and lanthana-supported palladium. Journal of Catalysis, Vol.96, No.1, pp. 88-105, ISSN 0021-9517 Root, T.W.; Schmidt, L.D. & Fisher, G.B. (1983). Adsorption and reaction of nitric oxide and oxygen on Rh(111). Surface Science, Vol.134, No.1, pp. 30-45, ISSN 0039-6028 Sugisawa, T.; Shiraishi, J.; Machihara, D.; Irokawa, K.; Miki, H.; Kodama, C.; Kuriyama, T.; Kubo, T. & Nozoye, H. (2001). Adsorption and decomposition of NO on Pt (112). Applied Surface Science, Vol.169-170, pp. 292-295, ISSN 0169-4332 Thiam, M.M.; Hrčiř , T.; Matolin, V. & Nehasil, V. (2004). EELS and AES investigation of Rh thin film growth on polycrystalline Al substrate. Vacuum, Vol.74, No.2, pp. 141-145, ISSN 0042-207X Tonetto, G.M.; Ferreira, M.L. & Damiani, D.E. (2003). A combined theoretical and experimental study of NO decomposition on Pd and Pd-Mo catalysts. Journal of Molecular Catalysis A: Chemical, Vol.193, No.1-2, pp. 121-137, ISSN 1381-1169 Wagner, Ch.D.; Naumkin, A.V.; Kraut-Vass, A.; Allison, J.W.; Powell, C.J. & Rumble, J.R.Jr. (2007). NIST X-ray Photoelectron Spectroscopy Database NIST Standard Reference Database 20, Version 3.5, Available from: http://srdata.nist.gov/xps/
368
Noble Metals
Wang, D.; Dewaele, O.; Groote, A.M.D. & Froment, G.F. (1996). Reaction mechanism and role of the support in the partial oxidation of methane on Rh/Al2O3. Journal of Catalysis, Vol.159, No.2, pp. 418-426, ISSN 0021-9517 Wang, X.; Sigmon, S.M.; Spivey, J.J. & Lamb, H.H. (2004). Support and particle size effects on direct NO decomposition over platinum. Catalysis Today, Vol.96, No.1-2, pp. 1120, ISSN 0920-5861 Yates, J.T.; Duncan, T.M.; Worley, S.D. & Vaughan, R.W. (1979). Infrared spectra of chemisorbed CO on Rh. The Journal of Chemical Physics, Vol.70, pp. 1219-1224, ISSN 1089-7690 Zimowska, M.; Wagner, J. B.; Dziedzic, J.; Camra, J.; Borzęcka-Prokop, B. & Najbar, M. (2006). Some aspects of metal-support strong interactions in Rh/Al2O3 catalyst under oxidising and reducing conditions. Chemical Physics Letters, Vol.417, No.1-3, pp.137-142, ISSN 0009-2614
17 Electrooxidation as a Pretreatment Process Before Cyanidation Fatma Arslan Istanbul Technical University, Mining Faculty Mineral Processing Engineering Department, Istanbul Turkey 1. Introduction The poor extraction of refractory gold ores is an old and still existing problem. Gold losses in cyanidation are mainly due to the presence of sulfide and carbonaceous materials (1,2,3). The decomposition of sulfide minerals during the cyanidation of refractory gold ores creates two types of impurities: metal cations and sulfur compounds (HS--, S2O32-, and SO32-). The metal cations form complexes with cyanide ion and consume reagent. The sulfide ion is considered to be a powerful poison during the cyanidation and may adsorb on gold, causing the inhibition of gold dissolution reaction by passivation. Sulfur compounds form thiocyanate by consuming cyanide ion and oxygen. Carbonaceous gold ores contain (a) an activated component which is capable of adsorbing gold complexes from the solution, (b) a mixture of hydrocarbons usually associated with active carbon components (they formed a gold complex during the deposition that was not attacked by cyanide), and (c) an organic acid similar to humic acid, which contains functional groups capable of interacting with gold complexes to form organic gold compounds which might possibly be formed by chelation (1,2,3). Various procedures had been investigated in an attempt to enhance gold recovery from different ores, including roasting, kerosene treatment, flotation, and aqueous oxidation. If roasting or aqueous oxidation is carried out before cyanidation, the sulfur species tend to oxidize to the less harmful sulfate form. There are several aqueous oxidation techniques prior to cyanidation to treat refractory gold ores: chemical (chlorine, hypochlorite, chlorates, perchlorates, ozone, oxygen, and sulfuric acid) or electrochemical oxidation, pressure leaching, and bacterial leaching. Oxidation of carbon and sulfide minerals by sodium hypochlorite is a possible method to render the ore amenable to cyanidation, and earlier work by the USBM indicates that electrochemical generation of hypochlorite is promising. An electro-oxidation process was developed by the U.S. Bureau of Mines for generating oxidizing conditions in situ in a pulp prepared from finely ground carbonaceous gold ore and sodium chloride solution (4). Gold extraction by cyanidation after oxidation increased almost in every case compared to that obtained without pretreatment. Electro-oxidation of carbonaceous gold ores, sulfidic gold and silver ores containing pyrite, pyrrhotite, and arsenopyrite has been extensively studied
370
Noble Metals
in a laboratory and pilot scale. There are also several studies carried out on the oxidation of pyrite, pyrrhotite, chalcopyrite, sphalerite, arsenopyrite, gersdorffite (NiAsS) in chlorine saturated water. Arsenopyritic gold is a major source of refractory gold not amenable to roasting. Biooxidation is a popular treatment option but is slow and needs careful control of the As content of the feed. Electrochemical slurry oxidation in-situ with chlorine in acidified salt water can provide a more environmentally friendly process flow-sheet than carbon-inpulp/leach processing and can be applied to a small or large resource. Chlorine and hypochlorite are not cheap and not fully used in oxidation, electrooxidation process may be alternative and economical to those since all hypochlorite produced in situ are fully used in oxidation. In order to explain the mechanism of electrooxidation of refractory (carbonaceous and sulfide type) gold ores it is better to understand the production of hypochlorite that is given as follows.
2. Hypochlorite production Hypochlorite solutions are easy to handle and relatively safe compared to chlorine, but purchased liquid hypochlorite has some disadvantages. Its transportation cost is high due to having concentrations normally range up to 12-15% of available chlorine. Even these concentrations tend to be unstable and decompose easily. A sodium hypochlorite solution generated in situ from readily available salt, on the other hand, is safe and relatively stable (5). Hypochlorite solutions are prepared commercially by electrolyzing a stirred sodium chloride solution. The electrolysis of sodium chloride solutions gives Cl2 molecules and OHions, and stirring ensures that these species react with each other. The resulting solution is a hypochlorite ion that is a strong reagent (6). Two types of cell design are used to produce hypochlorite, the diaphragm type and non-diaphragm type electrolytic cells. 2.1 Diaphragm type electrolytic cells Chlorine is produced in an electrolyzer where a diaphragm separates the anodic compartment from the cathodic (7) A solution of sodium chloride flows into the anodic compartment and the reaction at the anode is: 2Cl- → Cl2 + 2e-
(1)
A gaseous chlorine dissolves to some extent in the brine and the following equilibria are established in the diaphragm: Cl2 + H2O → CIO- + Cl- + H+
(2)
H+ + CIO- → HCIO
(3)
2H2O + 2e- → H2 + 2OH-
(4)
The cathodic reaction is:
The OH- ions diffuse into the diaphram, where they combine with H+ ions to form water:
Electrooxidation as a Pretreatment Process Before Cyanidation
H+ + OH- → H2O
371 (5)
In addition, chemical and electrochemical chlorate formation reactions take place according to the following reactions: 2HClO + ClO- → CIO3- + 2CI- + 2H+
(6)
6OCl- + 6OH- → 2ClO3- + 4Cl- + 3H2O + 3/2O2 + 6e-
(7)
Reactions (3) and (5) proceed much more rapidly than mass transport due to convection and diffusion. Reaction (6) proceeds relatively slowly with respect to those proceedings. The anodic side becomes acidic and the cathodic side is alkaline. The neutralization reaction in the diaphragm results in the formation of salt and water. At low pH, chlorate formation is mainly due to the homogeneous chemical reaction (6), as the electrochemical reaction (7) occurs at high pH (39). Reaction (6) is competitive with the main anodic reaction (1); therefore, it is inefficient with regard to chlorate formation. For chlorate formation according to reaction (6), both pH and temperature controls are important. The stoichiometric ratio of hypochlorous acid to hypochlorite ion required by reaction (3) is achieved by having a pH of about 6 and the rate of reaction increased by about two orders of magnitude by raising the temperature from 20°C to 80°C (8). At elevated temperatures, however, the solubility of chlorine decreases and the amount of undissociated hypochlorous acid escaping from the reactor increased, both of which lead to process inefficiencies. Figure 1 shows the temperature effect on the solubility of chlorine gas (9). The saturation concentration for chlorine is given as 0.06 mole/liter (10).
Fig. 1. Temperature effect on the solubility of chlorine gas (9). (Experimental conditions: 0.1 M HCI solution and 400 rpm.) Cell components, such as electrodes and separators, affect the design and the selection of the best electrolyzer. The design of the anode structure of a diaphragm type chlorine cell using a graphite plate anode used to be limited by the mechanical properties and the machinability of graphite. Gradual degradation during electrolysis was also a problem (11). Therefore,
372
Noble Metals
carbon electrodes were substituted nearly everywhere (chlor-alkali electrolysis, hypochlorite and chlorate productions) by oxide coated Ti and dimensionally stable anodes (DSA), and the coatings are reported to have life times of 3 to 5 years (11). The reasons for using titanium anodes are summarized as follows: (11, 12)
The excellent stability of titanium against general and pitting corrosion in acidic and slightly basic aqueous solutions. Application of RuO2 coatings or other coatings containing metal oxides or platinum group metals allows the reduction of the over potential for anodic chlorine and anodic oxygen evolution (13). These coatings are particularly stable on a titanium base metal. The price of titanium has decreased greatly during the last decade so that costs are no longer prohibitive for a more extensive use of the Ti anode.
Noble metals, in particular Pt metals, are too expensive to be used as bulk materials for electrodes. It is more appropriate to apply them as a coating to a suitable support. Now, because of using metal anodes, cell designs are more flexible. Due to corrosion, the cathodic compartment of a diaphragm type chlorine cell must be fabricated with corrosion resistant materials such as stainless steel (11). Production of chlorate was studied with a divided laboratory cell equipped with the oxide coated (RuO2-TiO2, Pt-IrO2, and PdO) Ti anodes and Pt foil cathode in the respective compartments (14). Figure 2 shows an example of the concentration changes of the chemical species existing in the anolyte as functions of electrolysis time. The concentrations of ClO-, HCIO, and ClO2- increased for the first three hours and then became constant. On the other hand, the ClO2- concentration increased almost constantly with time after the electrolytic cell reached the steady state. The rates were found to be independent of anode material and are a function of temperature and solution pH. Only the PdO coated anode showed slightly lower values than the others.
Fig. 2. Solution composition change during electrolysis of NaCl solution (15). (Experimental conditions: 4.0 M NaCl, pH=7.0, T=50oC, E=1.2V vs SCE)
Electrooxidation as a Pretreatment Process Before Cyanidation
373
Ibl and Landolt have also studied the anodic chlorate formation in dilute NaCI solutions in a diaphragm type cell using graphite electrodes (10). The diaphragm was porous polyethylene and the solution temperature was 70.5°C. Hypochlorite and chlorate concentrations were measured as a function of time and the results are illustrated in Figure 3 (10). In the each run, the change of hypochlorite concentration with time was followed until a steady state with a constant hypochlorite concentration was reached. Concentration profiles near the anode are shown in Figure 4 (10). The hypochlorite concentration increases with the distance from the anode where chlorine concentration shows a decreasing trend.
Fig. 3. Variation of hypochlorite and chlorate formation during the electrolysis of NaCl solution (10). (Experimental conditions: 4.0 M NaCl, 0.05 M NaCl)
Fig. 4. Schematical representation of concentration profile near anode during the electrolysis of NaCl solution (10).
374
Noble Metals
Separators are another component in the cell design which should be considered. Na+, Cl-, and OH- are the principal ionic species in the cell (11). The sodium ion is the principal electrolytic current carrier across the separator. Hydroxyl ions also carry some current which reduces the current efficiency of hypochlorite production process. Their transport into anolyte causes chlorate formation with the chlorine and unacceptable losses in reduced chlorine evolution. Therefore, the separator should be designed in such a way that the transportation of the OH- ions from the catholyte across the anolyte could be prevented. A diaphragm should be operated such that the bulk flow through the pores is sufficient to keep the OH- ions from migrating across the separator towards the anode in order to prevent reaction (7). 2.2 Non-diaphragm type electrolytic cells Chemical reactions which occur in this type of cell are summarized in the following. In the electrolysis of NaCI solutions, chlorine is generated at the anode according to the following reaction (5,10): 2Cl- → Cl2 + 2e-
(8)
The chlorine generated immediately undergoes hydrolysis according to the reactions: Cl2 + H2O → HClO + Cl- + H+
(9)
HClO → ClO- + H+
(10)
In non-diaphragm hypochlorite cells, solution pH is allowed to range from 7 to 9, insuring complete hydrolysis of the chlorine generated. The pH is balanced by the cathodic evolution of hydrogen as follows: 2H+ + 2e- → H2
(11)
Equations (8) to (11) describe the ideal behavior of a non-diaphragm hypochlorite cell. There are, however, several competing reactions which contribute to cell inefficiencies. Chlorate may be formed by either anodic oxidation of hypochlorite, 6OCl- + 3H2O → 2ClO3- + 6H+ + 4Cl- + 3H2O + 3/2O2 + 6e-
(12)
or by the chemical reaction between the hypochlorite ion and hypochlorous acid: 2HClO + ClO- → ClO3- + 2Cl- + 2H+
(13)
Both of these reactions (12 and 13) have been studied extensively because they are significant in the electrolytic production of chlorate. The chemical chlorate formation, equation (14), proceeds very slowly at room temperature and a basic pH, and when the solution is warmed the disproportionate reaction of hypochlorite occurs rapidly (16). This reaction is, therefore, not significant because cells do not operate over 40°C, and normally equilibrate near pH 9 when making 1 % available chlorine solutions. Current efficiency may also be lost due to the anodic discharge of hydroxyl ions: 2OH- → 2H+ + O2 + 4e-
(14)
Electrooxidation as a Pretreatment Process Before Cyanidation
375
This reaction competes with anodic chlorine evolution. Another reaction which is well documented in the literature (17) because of its importance in chlorate production cells is the cathodic reduction of hypochlorite: ClO- + H2O + 2e- → Cl- + 2OH-
(15)
Finally, a small contribution to inefficiency can result from the chemical reaction: 2ClO- → O2 + 2Cl-
(16)
This reaction is normally significant only in the presence of electrolyte impurities such as iron, or in the presence of active catalytic surfaces. In summary, a non-diaphragm hypochlorite cell functions through equations (8) to (11). Major current efficiency losses result from equations (12), (13), and (14), with minor losses from equations (15) and (16). In the basic solutions, the following reaction occurs instead of reaction (9) to produce hypochlorite (18): 1/2Cl2 + 2OH- → OCl- + H2O + e-
(17)
In reaction (8), neither H+ nor OH- is involved, so the reduction potential is independent of pH. However, chlorine does not exist in aqueous solution at pH's higher than 5. Hypochlorous acid is a weak acid (pKa = 7.4), and therefore it predominates at any pH below 7.4 and OCl- is predominant in the basic solutions. The influence of pH on the dissociation of hypochlorous acid is shown in Figure 5 (19).
Fig. 5. Effect of pH on the dissociation of hypochlorous acid (19). ClO3- is produced with the electrolysis of hot saturated NaCl solution with the addition of a little dichromate to modify the cathode behavior. Its influence is the formation of a thin diaphragm of insoluble chromium chromate on the cathode which is produced by the reduction of dichromate to chromic ions (20). The diaphragm prevents contact of the bulk of the solution with the electrode and thus with the hydrogen. The electrodes employed were graphite anode and iron cathode (18). In another study, a smooth platinum anode and a wrought iron cathode were used as electrodes (20). If the solution were kept cold and if the electrolysis were stopped at an earlier point, the main product would be hypochlorite. The relative effects of operating parameters on cell performance were studied by Bennett in batch electrolysis (5). Experiments were performed in a simple compartment cell using DSA anodes (widely used by the chlorine industry), bare titanium cathodes, 1 A/in2 current density, and 30 g/l NaCI feed. Anodic current efficiency for producing hypochlorite is found
376
Noble Metals
to be approximately 40%. Of the 60% current efficiency lost, approximately 35% is due to the cathodic reduction of hypochlorite, 10% to the anodic oxidation of hypochlorite, and 15% to the anodic evolution of oxygen from hydroxyl ion. According to these results, current density had a significant effect on the hypochlorite production. When 0.5 A/in2 current density was used, anodic current efficiency was near zero due to the sharp increase in the tendency for the cathodic reduction of hypochlorites. Later, a multi-stage cell with continuous flow was developed. Hypochlorite production was gradually increased and total current efficiency in this case could be near 65%, or 25% higher than that for a single compartment. At lower concentrations, salt utilization was found to be poor, and at higher concentrations, the loss of current efficiency made the operation economically unattractive. A multi-stage electrolytic hypochlorite cell (SANILAC, developed by Diamond Shamrock Corp.) developed as a result of this study, using DSA anodes, is capable of producing 50 lbs/day of chlorine (5). The cell feed consists of a 3% NaCI solution. At available chlorine concentrations of 9.0-9.5 g/l, this cell uses 2.3 to 2.4 kWh(AC) and approximately 3 lb of salt per lb of chlorine. Several sizes of cells producing up to 1000 lb/day of chlorine are commercially available. Similar technology is also being used to produce chlorine economically from seawater. 2.3 Electrooxidation of refractory gold ores Electrolysis was investigated by the USBM as a means of generating oxidizing conditions in situ in the ore pulp prepared from finely ground carbonaceous ore and NaCl brine (4). This would result in (a) the potential reduction of costs incident to the purchase of hypochlorite and chlorine reagents as compared: (a) the costs of the power and salt, and (b) producing the required oxidant at the desired rate so that excess oxidant would not be consumed by the ore. The initial research was conducted on the Carlin type carbonaceous gold ores. Later, molybdenum and rhenium reeovery from molybdenite concentrates, and silver and mercury recovery from tailings and Cinnabar ores were studied (21-26). There are several important parameters in the investigation of electrooxidation, such as salt concentration, electrolysis time, temperature, current density, rate of electrolysis, types of electrodes, electrode spacing, and particle size of the ore. The effect of salt concentration in the pulp on gold extraction was determined in a series of experiments in which the oxidation time was 7 hours and pulp density was maintained at 40%. Gold extraction increased linearly with respect to NaCl concentration (27). The concentration of salt maintained in the pulp is a principal variable since it affects the conductivity of the pulp and, consequently, the efficieney of hypochlorite production. The use of salt concentration in excess of 200 lb/ton ore resulted in a 95% gold extraction. The corresponding power consumption decreased from 100 kWh/ton ore to 65 kWh/ton ore at the 95% gold extraction range (4). The effect of temperature on gold extraction was determined at 30, 40, and 50oC. The maximum gold extraction was obtained at 40oC. GeneralIy, the electrode spacing should be as close as is consistent with good pulp flow between the electrodes since the resistance between the electrodes inereases with an inerease in electrode spacing. Conductivity is a function of pulp density and electrode spacing; and pulp density must be adjusted to give the desired temperature. GeneralIy, the use of lower pulp densities enables the use of closer
Electrooxidation as a Pretreatment Process Before Cyanidation
377
electrode spacing, which in turn allows the use of lower salt concentrations. However, this is limited by lower concentrations of the oxidant agent because of slow reaction rates (28). Current density is another factor which affects the voltage and the temperature. As current density increases, the voltage required also increases. The result of high current density is excessive power consumption and increase of heat input to the system. High current densities also cause undesirable electrode reactions that produce NaClO3 in the electrolytic cell. According to the results, it was found that a current density of 0.5 to 0.75 A/in2 of anode surface was acceptable (4). Grinding is an important part of any hydrometallurgical process beeause it is necessary to liberate the mineral from the host rock so that the minerals can come in contact with the reactants. Gold extraction increases as the partide size becomes smaller. It was found that 70% -200 mesh was satisfactory for this ore; however, every ore must be evaluated in order to find the optimum partide size for reaction (28). Several electrode systems were investigated by the USBM (4, 28, 29). The first electrode design utilized was tubular electrodes, as shown in Figure 6. Preliminary experiments with this electrode indicated that considerable resistance to pulp flow was encountered, resulting in a buildup of pulp inside the cathode pipe. The circulation of pulp through this cell was satisfactory during the initial experiments, but with time a deposit of slimes was observed to build up on the cathode, restricting pulp flow.
Fig. 6. Tubular type electrode design (from ref. 28)
378
Noble Metals
The second electrode system was a plate-type electrode system consisting of the series of copper cathodes and graphite anodes, as shown in Figure 7. Pulp flow through the eleetrodes was excellent, but a cathode deposit was still observed to build up with the continued use of the electrode. An alternative arrangement was to substitute graphite for the copper in the plate-type electrodes so that the deposit could be removed by reversing the current. The plate-type arrangement of the cell also offered much less resistance to the pulp flow through the 0.5 inch spacing between the electrodes.
Fig. 7. Plate type electrode design (from ref. 28). The other electrode design, utilizing a PbO2 coated titanium anode and an iron cathode, was investigated to determine its effectiveness in generating that required oxidizing conditions at lower salt concentrations. 90% gold extraction by subsequent cyanidation was achieved with 4% salt solution, but because of the lower conductivity of the pulp, an additional 20% power was required. Some pilot plant studies were also done. The data from the larger scale experiments indicated that scale-up to commercial plants should not present any problems. In silver and mercury recovery from tailings and Cinnabar ores, the plate-type electrode design which is similar to that used in the treatment of carbonaceous gold ores has been used (21-23). The bipolar cell design shown in Figure 8 has been used in the recovery of Mo and Re from molybdenite ores (26). The spacing between electrodes was 5/16 in and the cell consists of ten graphite electrodes held in a plexiglass container. 0.5 A/in2 was applied. The operating
Electrooxidation as a Pretreatment Process Before Cyanidation
379
temperature was maintained at 35-40°C by passing the pulp through water-cooled heat exchangers positioned between the stirred vessel and the celI. The pH was adjusted between 6 and 8. The capacity of the electrolytic oxidation was 1.5 lb/hr of Mo and the concentrate was fed at a rate of between 3.4 and 4.7 lb /h in order to determine the effects of process variables on Mo extraction (26).
Fig. 8. Pulp flow sequence through agitator and bipolar cell (a), and electrooxidation electrode design (b) (from ref. 26)
380
Noble Metals
Chemical reactions which occur during the electrooxidation can be summarized as follows, (23) the chloride ion is converted to chlorine at the anode: 2Cl- → Cl2 + 2e-
(18)
At the cathode water is hydrolyzed to produce hydroxyl ion and hydrogen: 2H2O + 2e- → H2 + 2OH-
(19)
The reaction between the chlorine and the hydroxyl ion produces hypochlorite according to the following reaction: Cl2 + 2OH- → OCl- + Cl- + H2O
(20)
Hypochlorite then reacts with the carbonaceous material in the ore, passivating activated carbon: C + 4OCl- → MCl2 + SO42- + 2Cl-
(21)
and converting the metal sulfides to chlorides that can hydrolyze to a hydroxide depending the pH of the slurry (30): MS + 4OCl- → CO2 + 2Cl-
(22)
The dissolution of the cinnabar can be observed as a two-step process involving oxidation of the sulfide followed by dissolution of sulfate by the chloride ion as shown in the following reactions (23): HgS + 4OCl- → HgCl42- + SO42-
(23)
HgSO4 + excess Cl- → HgCl42- + SO42-
(24)
AIso, direct oxidation of some of the cinnabar apparently occurs at the anode to produce mercuric sulfate: HgS + 4O2- → HgSO4 + 8e-
(25)
The hypochlorite reacts with molybdenite: MoS2 + 9OCl- +OH- → MoO42- + 9Cl- + 2 SO42-
(26)
The reaction for the oxidation of rhenium with hypochlorite is: Re2S7 + 28OCl- + 16OH- → 2ReO4- + 28Cl- + 7SO42- + H2O
(27)
When the technique was used for carbonaceous gold ores, the electrolyte performance was compared with the results obtained by chlorine on the same ore sample (30). The comparison showed that 1.3 to 1.5 kWh of power was required to replace around equivaIent of chlorine. At that time, a monopolar cell was used which has the disadvantage of requiring a high amperage rectifier and a large bus bar. In 1978, the cell had been improved, and the new design (a bipolar cell) had overcome the disadvantages. This cell is capabIe of producing a pound equivalent of chlorine for approximately 1 kWh. Depending on the chlorine prices and the electrical power supply capacity in northeastern Nevada, the electrooxidation technique may provide an economical treatment for carbonaceous ores.
Electrooxidation as a Pretreatment Process Before Cyanidation
381
The mechanism of electrooxidation of carbonecous and sulfide type ores was investigated by Arslan and Duby (31-34) using the two compartment cell as shown in Figure 9, by separating the anolyte and catholyte parts in NaCl solutions. Laboratory work was carried out on the production of hypochlorite and the oxidation of pyrite in an electrochemical cell with a 10% sodium chloride electrolyte at 35–40°C. The production rate of hypochlorite was higher when the pH was not controlled than when it was maintained at the initial value of about 6.5.
Fig. 9. Experimental arrangement: C=cathode, A=anode, 1=copper coulometer, 2=nitrogen gas tank, 3=saturated calomel electrode, 4=pH electrode, 5=sampling, 6=0.5M NaOH solution, 7=catholyte, 8=glass frit, 9=anolyte, 10=saturated CaO solution, 11=thermometer. (31) First of all hypohlorite production is studied without any addition of carbon, pyrite or sulfide type gold ore (31,32). Similarly to the early ones, the chemical reactions which occur during the electrolysis of a NaCl solution can be expressed as follows. The chloride ion is converted to chlorine at the anode: 2Cl- → Cl2 + 2e-
(28)
At the cathode, water is hydrolyzed to produce hydroxyl ion and hydrogen: 2H2O + 2e- → H2 + 2OH-
(29)
At the anodic side, hypochlorite is produced according to the following reactions. Chlorine reacts with water to produce hypochlorous acid: Cl2 + H2O → HClO + H+ + Cl-
(30)
382
Noble Metals
then, the dissociation of hypochlorous acid occurs depending on the solution pH: HClO → ClO- + H+
(31)
and hydroxyl ions produced at the cathode react with hydrogen ions to form water: H+ + OH- → H2O
(32)
After a certain time, hypochlorite production levels off and this is attributed to the production of chlorates, either chemically, 2HClO +ClO- → ClO3- + 2H+ + 2Cl-
(33)
6ClO- + 3H2O → 2ClO3- + 6H+ + 4Cl- + 3/2O2 + 6e-
(34)
or electrochemically,
Electrochemical reduction of hypochlorites at the cathode is also possible according to the following reaction: ClO- + 2H2 + 2e- → H2O + Cl-
(35)
Another reaction is the anodic discharge of hydroxyl ions: 2H2O → 4H+ + O2 + 4e-
(36)
During the experiments the potential and pH measurements are also supported these reactions according to the potential-pH diagrams drawn for the system as hon in Figure 10 and 11. (31)
Fig. 10. A potential-pH diagram for the system containing chloride and water at 40oC (stability of hypochlorites). (Chloride concentration is 1.7M). (31)
Electrooxidation as a Pretreatment Process Before Cyanidation
383
Fig. 11. A potential-pH diagram for the system containing chloride and water at 40oC (stability of chlorates). (Chloride concentration is 1.7M). (31) During the electrooxidation of carbon, when the graphite anode was used, carbon oxidation was observed but it was difficult to determine the amount of CO2 attributed to the oxidation of the graphite anode itself (31-32). Therefore, experiments were run using a Pt/Ir coated Ti anode. Carbon is oxidized by hypochlorite which is produced electrochemically in the cell, according to the following equations: C + 2ClO- CO2 + 2Cl-
C + 2HClO CO2 + 2Cl- + 2H+
(37) (38)
According to the equations (37 and 38) two moles of HClO (or OCl-) are required for the oxidation of one mole of carbon to CO2, corresponding to 4 electrons. Potential and ph measurements taken during the tests were in agreement with those reactions and the potential-ph diagrams of C-Water system shown in Figure 12. Electrooxidation of pyrite with hypochlorite generated electrochemically in the cell can be expressed as (31,33): 2 FeS2 + 15ClO- + H2O + 2H+ 2Fe3+ + 4HSO4- +15Cl-
2 FeS2 + 15HClO- + H2O 2Fe3+ + 4HSO4- + 13H+ +15Cl-
(39) (40)
Pyrite oxidation with hypochlorite is a chemical reaction as given in reactions (39 and 40), but the production of chlorine that results in hypochlorite production is an electrochemical process. When the overall process is considered, 7.5 moles of HClO are required per mole of pyrite corresponding to 15 electrons.
384
Noble Metals
Fig. 12. A potential-pH diagram for the system containing carbon and water at 40oC (for dissolved substances). (Carbon concentration is 0.2M). (31) Total iron in the solution increased with time at the beginning but leveled off after 4 hours and the current efficiency was about 97%. The oxidation rate was directly related to the current and it was not affected by the pulp density.The solution pH was 1.7 at the end of a 7 hour run. This shows pyrite oxidation according to reaction (40). It was reported in the literature (26) that the oxidation of concentrates high in sulfur or pyrite causes a sharp drop in the pH value as observed in our study. The potential and pH measurements are also agreed with those findings by comparing the results with the potential-pH diagrams given in Figures 12 and 13.
Fig. 13. A potential-pH diagram for the system containing iron and water at 40oC (for dissolved substances). (Iron concentration is 0.05M). (31)
Electrooxidation as a Pretreatment Process Before Cyanidation
385
Fig. 14. A potential-pH diagram for the system containing sulfur and water at 40oC (for dissolved substances). (Sulfur concentration is 0.1M). (31) In tests of electrooxidation of pyritic gold flotation concentrate, stoichiometric calculations show that 23% of total iron in the concentrate is in the form of pyrite, 71% as pyrrhotite, and 6% as arsenopyrite (31, 34). Therefore, the total iron dissolved in the solution may come from these minerals. Pyrite (as given above), pyrrhotite, and arsenpyrite are oxidized according to the following reactions: 2FeS2 + H2O + 15HClO 2Fe3+ + 15Cl- + 4HSO4- + 13H+ 2FeS + 9HClO 2Fe3+ + 9Cl- + 2HSO4- + 5H+ + H2O
FeAsS + 7HClO + H2O Fe3+ + 7Cl- + H3AsO4 + HSO4- + 5H+
(41) (42) (43)
According to reactions (41-43), 15 electrons are needed for pyrite oxidation, 9 electrons for pyrrhotite oxidation and 14 electrons for arsenopyrite oxidation. Thus, the weighted average number of electrons is approximately 10.5 and the current efficiencies are calculated by using n=10.5 in all cases. At the end of each run the anolyte pH was around 1 and the catholyte pH was about 12. Analysis of anolyte solutions showed no Fe2+, therefore, all iron in the solution was in the form of Fe+3. This agrees with the oxidation reactions given above and can be seen from Figure 14. Abrantes and Costa is also studied electro-oxidation as a potential alternative process to conventional pre-treatment of a refractory gold ore was investigated. (35) A particulate bed anode of a Portuguese concentrate containing gold was electroleached in a twocompartment electrolytic cell. The effectiveness of the electrochemical treatment is emphasized by comparison with the results of direct leaching under similar conditions. The influence of the operative parameters (e.g., temperature, electrolysis time, current and slurry density) on the overall gold extraction are studied. Up to 90% gold extraction was obtained after electrolytic pre-treatment. A comparison between chemical and electrochemical oxidation using chloride and sulphate solutions was also carried out. The results
386
Noble Metals
demonstrate the better performance of chloride media and that the electrolytic route enhances the amount of precious metal dissolved.
Fig. 15. A potential-pH diagram for the system containing arsenic and water at 40oC (for dissolved substances). (Arsenic concentration is 1.0x10⁻³M). (31) Since arsenopyritic gold is a major source of refractory gold not amenable to roasting and bio-oxidation is a popular treatment option but is slow and needs careful control of the As content of the feed, H. G. In Linge and N. J. Welham studied, electrochemical slurry oxidation in-situ with chlorine in acidified salt water in a membrane cell reactor has been evaluated at laboratory-scale level as a potential processing route (36). A refractory mine concentrate (cyanideable gold content 7%) containing arsenopyrite (FeAsS), pyrite (FeS2) and gersdorffite (NiAsS) has been used to demonstrate that gold recovery > 90% could be achieved. Reaction rates are but sale of the co-produced NaOH can be a valuable process credit. This route can provide a more environmentally friendly process flow-sheet than carbon-in-pulp/leach processing and can be applied to a small or large resource. The silver mine of the Phoenix Mountain in Guangxi is complicated silver mine with higher arsenic, antimony and copper content (37). The electroleaching of silver is studied and it was found that electrolysis conditions are controlled easy. The recurrence of the process of scalingup from small to large-size plant is very good, and the silver extraction rate is over 95%. The electrochemical leaching technology for complex refractory ore was also studied for its high flexibility, easy operation and little pollution (38). It is pointed out that out-field intensification and multifield coupling technology was the development trend for ore processing.
3. References [1] Osseo-Asare K., Afenya P.M., and Abotski G.M., “Carbonaceous matter in gold ores: isolation, characterization, and adsorption behavior in aurocyanide solutions”,
Electrooxidation as a Pretreatment Process Before Cyanidation
387
Precious Metals: Mining, Extraction, and Processing, Ed. By V. Kudryk, D.A. Corrigan, and W.W. Liang, 1984, TMS Publication, pp. 125-144. [2] Guay W.J. and Gross M.A., “The treatment of refractory gold ores containing carbonaceous material and sulfides”, The AIME annual meeting, Chicago, Illinois, Feb. 22-26, 1981. [3] Demopoulos G.P., “Mineralogical and technological aspects of gold extraction from refractory ores”, presented at the Professional Development Seminar in “Mineral Processing of Gold Ores” held at the Dept. of Mining and Metallurgical Eng., McGill Univ., April 30-May 2, 1987. [4] Scheiner B.J., Lindstrom R.E., Guay W.J., and Peterson D.G., “Extraction of gold from carbonaceous ores: pilot plant studies”, Bureau of Mines RI 7597, 1972. [5] Bennett J.E., “Non-diaphragm electrolytic hypochlorite generators”, Chemical Engineering Progress, vol 70, no 12, Dec. 1974, pp 60-63. [6] Masterton W.l., Slowinski E.J., and Stanitski C.L., Chemical Principles, 5th ed., Saunders College Pub., Philadelphia, 1981, pp 530-533. [7] Rousar I., Micka K., and Kimla A., Electrochemical Engineering I, Elsevier Science Pub. Co. Inc., New York, 1986, pp 326-330. [8] Pickett D.J., Electrochemical Reactor Design, Elsevier Science Pub. Co. Inc., New York, 1977, pp 362-363. [9] Cho E.H., “Coal desulfurization with aqueous chlorine”, Met. Trans. B., Oct 1989, vol 20B, pp 567-571. [10] Ibl N. and Landolt D., “On the mechanism of anodic chlorate formation in dilute NaCl solutions”, J. Electrochem. Soc., vol 115, no 7, July 1968, pp 713-720. [11] Ismail M.I., Electrochemical Reactors –Their Science and Technology, Part A, Elsevier Science Pub. Co. Inc., New York, 1989, pp 73-75. [12] de Nora V., “From DSA to NCA”, proc. of the symp. on Performance of Electrodes for Industrial Electrochemical Processes, vol 89-10, The Electrochem. Soc. Inc., 1989, pp 1-13. [13] Muranaga T., Kanaya Y., and Yokota N., “Characteristic of platinum group metal anode for chlor-alkali cells”, proc. of the symp. on Performance of Electrodes for Industrial Electrochemical Processes, vol 89-10, The Electrochem. Soc. Inc., 1989, pp 77-86. [14] Chemistry of Cyanidation, Mineral Dressing Notes, American Cyanamid Co., AIME annual meeting, New York, Feb. 13-16, 1950. [15] Tasaka A. et al., “Activation energy of chlorate production with the oxide coated anodes”, proc. of the symp. on Electrochemical Engineering in the Chlor-Alkali and Chlorate Industries, The Electrochem. Soc. Inc., 1988, pp 147-156. [16] Segal B.G., Chemistry –Experiment and Theory, John Wiley and Sons Inc., New York, 1985, pp 570-572. [17] Wu J., “Kinetics of the reduction of hypochlorite ion”, J. Electrochem. Soc., vol 134, no 6, 1987, pp 1462-1467. [18] Selly N.J., Experimental Approach to Electrochemistry, John Wiley and Sons Inc., New York, 1977, pp 99-101, 123. [19] Pourbaix M., Atlas of Electrochemical Equilibria in Aqueous Solutions, NACE, 1974, pp 591-603. [20] Knibbs N.V.S. and Palfreeman H., “The theory of Electrochemical Chlorate and perchlorate formation”, Trans. of Faraday Soc., 1920, no 16, pp 402-433.
388
Noble Metals
[21] Scheiner B.J., Pool D.L., and Lindstrom R.E., “Recovery of silver and mercury from mill tailings by electrooxidation”, Bureau of Mines RI 7660, 1972. [22] Shedd E.S., Scheiner B.J., and Lindstrom R.E., “Recovery of mercury from cinnabar ores by electrooxidation–extraction plant amenability tests”, Bureau of Mines RI 8083, 1975. [23] Scheiner B.J., Lindstrom R.E., and Shanks D.E., “Recovery of mercury from cinnabar ores”, Bureau of Mines RI 7350, 1973. [24] Scheiner B.J., Pool D.L., Lindstrom R.E., and McClelland G.E., “Prototype commercial electrooxidation cell for the recovery of molybdenum and rhenium from molybdenite concentrates”, Bureau of Mines RI 8357, 1979. [25] Lindstrom R.E. and Scheiner B.J., “Extraction of molybdenum and rhenium from concentrates by electrooxidation”, Bureau of Mines RI 7802, 1973. [26] Scheiner B.J., Lindstrom R.E., and Pool D.L., “Extraction and recovery of molybdenum and rhenium from molybdenite concentrates by electrooxidation: process demonstration”, Bureau of Mines RI 8145, 1976. [27] Scheiner B.J., Lindstrom R.E., and Henrie T.A., “Processing refractory carbonaceous ores for gold recovery”, Journal of Metals, March 1971, pp 37-40. [28] Scheiner B.J., Lindstrom R.E., and Henrie T.A., “Oxidation process for improving gold recovery from carbon-bearing gold ores”, Bureau of Mines RI 7573, 1971. [29] Scheiner B.J., Lindstrom R.E., and Henrie T.A., “Process for recovering gold from carbonaceous ores”, U.S. Patent no. 3,574,600, April 13, 1971. [30] Scheiner B.J., “Relation of mineralogy to treatment methods for carbonaceous gold ores”, The SME annual meeting, Denver, Colorado, Feb. 24-27, 1987. [31] F. Arslan, Electrooxidation of refractory gold ores. Ph.D. Thesis, Columbia Univ. (1991). [32] F. Arslan, P.F. Duby , Mechanism Of Electrooxidation Of Refractory Gold Ores, SME, 1991, Preprint Number 91-38 9 pages. [33] F. Arslan, P.F. Duby, Electro-oxidation of pyrite in sodium chloride solutions, Hydrometallurgy, Volume 46, Issues 1-2, August 1997, pp 157-169. [34] F. Arslan, P.F. Duby, Electrooxidation of gold-bearing sulfide concentrate, Minerals & Metallurgical Processing, Feb 1, 2003. vol. 20, no 1, pp. 10-14. [35] L. M. Abrantes and M. C. Costa, Electro-oxidation as a pretreatment for gold recovery, Hydrometallurgy, Volume 40, Issues 1-2, January 1996, pp 99-110. [36] H. G. Linge and N. J. Welham, Gold recovery from a refractory arsenopyrite (FeAsS) concentrate by in-situ slurry oxidation, Minerals Engineering, Volume 10, Issue 6, June 1997, Pages 557-566. [37] WANG Wei-xi, LUO Jian-ping, LI Li-jun, Study on Extracting Silver from Silver Concentrate in Guangxi by Slurry Electrolysis Process. Nonferrous Metals (Extractive Metallurgy), 2006-05. [38] Z.H. Liu, Y. Li, X.X. Zhou, J. Du, C.Y. Tao, Research Progress of Electro-oxidation of Intensification leaching for Refractory Ore, Advance Materials Research (volumes 236-238), Vol. Application of Chemical Engineering, May 2011, pp 775-780.
Part 5 Application in Biosystem
18 Green Synthesis of Noble Metal (Au, Ag, Pt) Nanoparticles, Assisted by Plant-Extracts Victor Sanchez-Mendieta1 and Alfredo Rafael Vilchis-Nestor2 1College
of Chemistry, Autonomous University of the State of Mexico Center for Sustainable Chemistry UAEMex-UNAM México
2Research
1. Introduction The physicochemical and optoelectronic properties of metallic nanoparticles are strongly dependent on the size and size-distribution, but also nanoparticles shape contributes significantly to the control of their properties. Wide varieties of physical and chemical procedures have been developed in order to synthesize nanoparticles of different compositions, sizes, shapes and controlled polydispersity. Nevertheless, the routinely physicochemical techniques for nanoparticle production such as photochemical reduction [1], laser ablation [2], electrochemistry [3], lithography [4] or high energy irradiation [5], either remain expensive or employ hazardous substances, such as organic solvents, and toxic reducing agents like sodium borohydride and N,N-dimethylformamide. In addition, due to the high surface energy of the nanoparticles, these tend to form aggregates; therefore, surface passivating and capping reagents are frequently added to the reaction systems to avoid coalescence. The development of reliable, eco-friendly processes for the synthesis of nanomaterials is an important aspect of nanotechnology. Nanotechnology also requires the synthesis of nanomaterials of different chemical compositions, sizes and morphology with an excellent control over these characteristics. With the growing need to minimize or eliminate the use of environmental-risk substances, as the green chemistry principles describe [6], the synthesis of nanoparticles using biological entities has received increasing attention in the last decade [7]. The biosynthetic procedures involve either living organisms such as bacteria [8], fungi [9] and plants [10] or biomass, like plant extracts [11-14]. Biological synthetic processes have emerged as a simple and viable alternative to more complex physicochemical approaches to obtain nanomaterials with adequate control of size and shape [15]. The use of the highly structured physical and biosynthetic activities of microbial cells for the synthesis of nanosized materials has recently emerged as a novel approach for the synthesis of metal nanoparticles. The interactions between microorganisms and metals have been well documented [16] and the ability of microorganisms to extract and/or accumulate metals is already employed in biotechnological processes such as bioleaching and bioremediation [17]. A general scheme for nanoparticles synthesis in microorganisms is illustrated in figure 1, reported by Das-Marsili [18], where is easily observed the scheme
392
Noble Metals
of biomineralization process for nanoparticles synthesis assisted by microorganisms. However more detailed studies are required to fully understand the difference in nanoparticles morphology and size between different metals when the same kind of microorganism is employed. Furthermore, the specific mechanism of reduction, nucleation and grow model of metallic ions and nanoparticles respectively, when interact with metabolic process of the microorganism and biomolecules, remains as a big challenge to be reached.
Fig. 1. Scheme of nanoparticles formation by microorganism. (Das-Marsili [18]) 1.1 Noble metals nanoparticles synthesis assisted by bacteria Many organisms, both unicellular and multicellular, are known to produce inorganic materials either intracellularly or extracellularly. One approach that shows immense potential is based on the biosynthesis of nanomaterials using bacteria. Microorganisms, particularly bacteria, are often exposed to extreme environmental conditions and an ability to resist those stresses is essential for their survival. The specific defense mechanisms help the bacteria to quell such stresses, including the toxicity due to high concentration of foreign metal ions or metals. Such mechanisms include efflux systems, alterations of solubility and toxicity by changes in the redox state of the metal ions, extracellular complexation or precipitation of the metals intracellularly and the lack of specific metal transport systems. [19] One major advantage of having prokaryotes as nanoparticles synthesizers is that they can be easily modified using genetic engineering techniques for overexpression of specific enzymes, apart from the ease of handling.
Green Synthesis of Noble Metal (Au, Ag, Pt) Nanoparticles, Assisted by Plant-Extracts
393
1.2 Noble metals nanoparticles synthesis assisted by fungus The use of fungi in the synthesis of nanoparticles is a relatively recent addition and holds promise for large scale nanoparticles production. The use of eukaryotes, especially fungi, is potentially exciting since they secrete large amounts of proteins and enzymes, thus increasing productivity, and are simple to deal with both in the laboratory and at industrial scale. Moreover the process can be easily scaled up, economically viable with the possibility of easily covering large surface areas by suitable growth of mycelia. Furthermore, downstream processing would be much simpler using fungi. [19] Further information about state of the art of the biosynthesis of metallic nanoparticles assisted by microorganisms, can be revised in some reviews available in literature. [7, 18-20] 1.3 Noble metals nanoparticles synthesis assisted by plants Among the use of living organisms for nanoparticle synthesis, plants have found application particularly in metal nanoparticle synthesis. Use of plants for synthesis of nanoparticles could be advantageous over other environmentally benign biological processes as this eliminates the elaborate process of maintaining cell cultures. Biosynthetic processes for nanoparticles would be more useful if nanoparticles were produced extracellularly using plants or their extracts and in a controlled manner according to their size, dispersity and shape. Plant use can also be suitably scaled up for large-scale synthesis of nanoparticles. [21] Noble metals, especially Au and Ag, have been extensible tested for the biosynthetic process assisted by plants, in order to obtain metallic nanoparticles with control over shape and size. A list of the metallic nanoparticles obtained by biosynthesis employing plants biomass or extracts can be checked in recent reviews, reported by Yadav et al. [21] and Bali et al. [22]. In the case of the plants and yeast, the possibility to obtain metallic particles with nanometric dimension were explored just after, these organism were employed for the remediation of metal-contaminated water [23] due to a growing necessity to develop environmentally friendly systems to retrieve metals. It has been shown that many plants can actively uptake and bioreduce metal ions from soils and solutions during the detoxification process, thereby forming insoluble complexes with the metal ion in the form of nanoparticles. The first successfully report of synthesis of nanoparticles assisted by living plants appeared in 2002 when it was shown that gold nanoparticles, ranging in size from 2 to 20 nm, could form inside alfalfa seedlings [10]. Subsequently it was shown that alfalfa also could form silver nanoparticles when exposed to a silver rich solid medium. [24] The research group of Gardea-Torresdey from the University of Texas at El Paso, is the major responsible of the experiments that involve the formation of metallic nanoparticles (primarily gold and silver) by different living plant systems as can be observed in table 1. A virtual circle has been achieved following the biomass method when the catalytic function of the nanoparticles rich biomass was substantiated by the reduction of aqueous 4-nitrophenol, the first report of gold nanoparticle-bearing biomatrix directly reducing a toxic pollutant [25]. The use of plants in metal extraction (phytoremediation) has appeared as a promising alternative in the removal of heavy metal excess from soil and water, and in the process a new method to produce metallic nanoparticles was developed. In order to understand how
394
Noble Metals
the phytoremediation technology works, researchers have used X-ray absorption spectroscopy. X-ray absorption spectroscopy (XAS) consists of two complimentary techniques X-ray absorption near edge structure (XANES) and extended X-ray absorption fine structure (EXAFS), which provide invaluable information about the coordination chemistry of metals and toxic element interactions with phytoremediation systems [27]. Using X-ray absorption spectroscopy (XAS) analysis, XANES, and EXAFS, GardeaTorresdey group has tried to elucidate the process involved during the nanoparticles formation inside living plants and the biomolecules associated with the particles in different parts of the plant. Actually it can be determined the oxidation state, coordination environment, and the average radii of the nanoparticles bound to the hops biomass [28]. The studies suggest that the carboxyl or other oxygen containing ligands on the biomass are the functional groups responsible for the binding and the reduction site for gold on the biomass. Plant Sesbania drummondii
Metal nanoparticle
Shape
Size
Year/ Reference
Gold
Spherical
6-20 nm
2007- [25]
Avena sativa
Gold
Fcc: tetrahedral, decahedral, hexagonal, 5-20 nm and 25icosahedral 85 nm, multitwinned, depending on irregular, and rod pH shape
Medicago sativa (alfalfa sprouts)
Silver
Mostly spherical
2-20 nm
2003-[24]
Medicago sativa
Gold
fcc twinned and icosahedron structure
2-20 nm
2002-[23]
2004-[26]
Table 1. Nanoparticles obtained by bioreduction process, assisted by living plants. From the first reports on the formation of gold and silver nanoparticles by living plants, it was opened up new and exciting ways to fabricate nanoparticles. It showed how it is possible to link materials science and biotechnology in the new emerging field of nanobiotechnology. The next methodology associated with plants to produce metallic nanoparticles employs the dried biomass of the plants and a metallic salt, as bioreducing agent and precursor, respectively. The general procedure can be described in a general way as follow, the plant is dried (typically sun-dried), then is suspended in water and placed in an ultrasonic bath to homogenize the suspension. Finally the suspension is allowed to rest with the metallic ion aqueous solutions followed by a homogenization process. Silver or gold precursors at ambient temperature produces both silver nanoparticles (55–80 nm) and triangular or spherical gold nanoparticles, from sun-dried biomass of Cinnamomum camphora leaf when are incubated together [13]. This report evidence that the mechanism concerned to the gold and silver nanoparticles formation is different despite of the same reducing agent employed. For gold nanoparticles there is strongly evidence that suggests that these particles are the result of coalescence of smaller particles, because there is no reason to expect a rapid growth in the gold particles and the formation of nanotriangles. The author´s
Green Synthesis of Noble Metal (Au, Ag, Pt) Nanoparticles, Assisted by Plant-Extracts
395
indicate the marked difference of shape control between gold and silver nanoparticles was attributed to the comparative advantage of protective biomolecules. The polyol components and the water-soluble heterocyclic components were mainly responsible for the reduction of silver ions or chloroaurate ions and the stabilization of the nanoparticles, respectively. The process were scaled-up successfully for biological production of silver nanoparticles by lixivium of sundried Cinnamomum camphora leaf in continuous-flow tubular microreactors [29] Silver nanoparticles (NPs) were rapidly synthesized by treating silver ions with a Capsicum annuum L. extract [14]. The reaction process was simple and convenient to handle, and was monitored using ultraviolet-visible spectroscopy (UV-vis). The reduction of silver ions and stabilization of the silver NPs was thought to occur through the participation of proteins. From the bioreduction method, originally proposed by Gardea-Torresday [30], where bionanotechnolgy shows a huge potencial to produce metallic nanoparticles with different shapes (figure 2), nevertheless the most important results employing biomass have been reached by J. Ascencio research group, who have developed a procedure based on the use of the tannins of the biomass of Medicago sativa (alfalfa) to obtain Au nanorods [31], bimetallic nanoparticles [32, 33] and even lanthanide clusters [34, 35], and lately has also been demonstrated effective for the synthesis Zn nanoparticles [36], and iron oxide [wuestite (Fe0.902O) and magnetite (Fe3O4)] clusters [37]. The method is based on the reduction of metal ions through biomass at controlled pH conditions to improve the size control of nanoparticles. (See table 2) Plant
Metal nanoparticle
Shape
Medicago sativa
Gold
Cinnamomum camphora
Gold and Silver
decahedral multiple twinned, icosahedral multiple twinned particles, irregular shaped particles, Fcc tetrahedral particles,and hexagonal platelet particles Triangular or spherical
Capsicum annuum L
Silver
Spherical
Medicago sativa
gold
nanorods
Medicago sativa
Eu-Au bimetallic
spherical
Size
Year/ Reference
From 20-100 nm depending on pH
1999-[30]
55–80 nm
2007-[13]
10-40 nm. Depending on reduction time 20 nm diameter From 2-30 nm, depending on pH
2007-[14] 2001-[31] 2003-[32]
396
Noble Metals
Plant
Medicago sativa
Metal nanoparticle Ti/Ni bimetallic, core-shell structure with the Ti covering a Ni core
Shape
Size
Year/ Reference
Mainly spherical
From 2-6 nm, depending on pH
2006-[33]
Medicago sativa
Sm
spherical
From 2-8 nm at pH 4
2005-[35]
Medicago sativa
Zn
Spherical
2-5.6 nm depending on pH
2006-[36]
Medicago sativa
Yb
Spherical
2-10 nm
2004-[34]
Medicago sativa
wuestite (Fe0.902O) and magnetite (Fe3O4)
spherical
3.1 nm average size
2007-[37]
Table 2. Nanoparticles obtained by bioreduction process, assisted by plant biomass.
Fig. 2. Morphologies of gold nanoparticles obtained with Medicago sativa biomass. Enlargement showing the different kinds of gold particles observed. (a) decahedral multiple twinned; (b) icosahedral multiple twinned; (c) irregular shaped; (d) FCC tetrahedral; (e) FCC hexagonal platelets. Yacaman et al. [30] Here we present a simple green synthetic methodology of silver, gold and platinum nanoparticles, which involves the in-situ reduction of aqueous Ag(I), Au(III) and Pt(IV) ions employing Camellia sinensis, and Opuntia ficus indica aqueous extract as a reducing and capping agents.
2. Experimental section 2.1 Materials For the green synthesis, water soluble salts (HAuCl4, AgNO3 and H2PtCl6) were employed as precursor of nanoparticles, all purchased from Sigma-Aldrich Chemicals. The above reagents were of analytical purity and were used without further purification.
Green Synthesis of Noble Metal (Au, Ag, Pt) Nanoparticles, Assisted by Plant-Extracts
397
2.2 Extract preparation In general manner, different portions of plants: 30g of fresh cladodes of Opuntia ficus indica were rinsed with de-ionized water and finely cut. In the case of Camellia sinensis 1.5 g of dried leaves were employed to prepare the extract. Afterwards, it was boiled in 100 mL of de-ionized water for five minutes. The mixture was cooled and vacuum filtered. The resulting extract was used for further experiments. 2.3 Synthesis of metallic nanoparticles Noble metals (Ag, Au and Pt) nanoparticles were prepared by adding different volumes of the plants extracts in a range between 1- 10 mL to 5 mL of 10-3 M AgNO3, HAuCl4 and H2PtCl6 solutions, respectively. Then, the volume was mixed with de-ionized water until to reach a final volume of 20 mL. This mixture was allowed to stand for 24 h. No additional reducing agent or surfactants were needed for the synthesis of gold, silver or platinum nanoparticles. 2.4 UV-Vis absorbance spectroscopy The bioreduction of Ag(I), Au (III), and Pt(IV) in aqueous solution was monitored by following the UV-Vis absorbance of the reaction mixture during 4 hours as a function of time, and after 24 hours of reaction. UV-Vis analysis was performed on a CARY 5000 spectrophotometer operated at a resolution of 1 nm at room temperature. 2.5 Transmission electron microscopy (TEM) Samples for TEM studies were prepared by placing a drop of the silver, gold or platinum nanoparticles colloidal suspension obtained by bioreduction on lacy carbon-coated grids. TEM observations were performed on a transmission electron microscope JEOL 2010.
3. Results 3.1 Camellia sinensis system
It is well known that Camellia sinensis contains polyphenols and terpenoids, such as – cariophyllene, linalool, cis-jasmone, -terpineol, -cadinene, indole, geraniol, among the major bio-components, which have bactericidal and antioxidant activity, and several other useful properties. [38] As stated in previously reported bio-reduction methods, [12, 13, 14] these type of compounds contribute to the metal ion reduction processes, and can also control the size and stabilize the nanostructures formed. For instance, gallic acid, a secondary metabolite present in plants like green tea that also has powerful antioxidant properties, has been successfully used to obtain water soluble Au and Ag nanostructures, and has proved to be an efficient capping agent of these noble-metal nanoparticles.[38, 39] Addition of Camellia sinensis extract to aqueous HAuCl4 solutions, at ambient temperature, quickly turned the initial yellowish solution into pink, grey-blue and pale violet, respectively (inset of figure 3a). In case of formation of silver nanoparticles, the solution turned from yellowish to bright yellow and to dark brown (inset of figure 3b). In the case of
398
Noble Metals
platinum nanoparticles, when the time reaction increased, the color of the solution gradually changed from yellow brown to dark brown. UV-Vis spectra of Au and Ag nanoparticles in aqueous solution are shown in Figure 3a and 3b, respectively. [11] The absorption peaks at around 550 nm for Au and around 430 nm for Ag are characteristic of these noble-metal particles. Colloidal solutions of gold and silver nanoparticles show bright colors, as mentioned before, their origin is attributed to the collective oscillation of the free conduction electrons induced by an electromagnetic field. These resonances are also denoted as surface plasmons. These oscillations depend on the particle size, and with increasing size the plasmon absorption maximum is shifted to longer wavelength and the bandwidth increases. Red shift are observed in both spectra (figure 3), which could be due to an increment in the particle size. In other words, the wavelength shift observed in the plasmon bands is a consequence of the different volume of Camellia sinensis extract added to the metal ions solution; however, the initial metal ion concentrations and the reaction time play also a crucial role in the optical properties and size obtained for these nanostructures. Meanwhile, stable gold nanoparticles are obtained until 24 h of reaction (figure 3a). A good control of optical properties of gold nanotriangles, synthesized with lemongrass extract, was also achieved with a simple variation of the extract concentrations. [48]
Fig. 3. a) UV-Vis-NIR absorption spectra of gold nanoparticles formed after 24 hours of the reaction of different amounts of Camellia sinensis extract with 5 mL of 10-3 M aqueous solution HAuCl4 (4, 2 and 1 mL of Camellia sinensis extract, curves 1-3 respectively). b) UVVis absorption spectra of silver nanostructures formed after 4 hours of the reaction of different amounts of Camellia sinensis extract with 5 mL of 10-3 M aqueous solution AgNO3 (1, 5 and 10 mL of Camellia sinensis extract, curves 1-3 respectively). One of the most convenient techniques for characterization of Pt nanoparticles was UV–vis spectroscopy. Due to the ligand-to-metal charge transfer transition of the [PtCl4]-2, it exhibited a peak at 215 nm in its UV–Vis spectrum. The peak at 215 nm disappeared after
Green Synthesis of Noble Metal (Au, Ag, Pt) Nanoparticles, Assisted by Plant-Extracts
399
the reaction, indicating that the [PtCl4]-2 ions were completely reduced. The Pt nanoparticles had absorption in all ranges of the UV–Vis spectrum and the absorption increased with the decrease of wavelength [40]. Unfortunately, the remnant biomolecules that act as capping and reducing agents, present a strong absorption band in the region between 210 and 260 nm, causing interference with the UV-Vis band of the [PtCl4]-2. TEM images of poly-disperse gold nanoparticles are shown in figure 4 depending on the volume extract used during the synthesis. Some anisotropic nanoparticles with irregular contours could be observed in figure 4b, with an average particle size of around 25 nm, in contrast with the smaller average size (2.5 nm) of the gold nanoparticles obtained from reaction that employs 0.2 mL of camellia sinensis extract. TEM studies also revealed that the concentration of tea extract plays the main role in the morpholgy of the metal nanoparticles. When 0.2 mL of green tea extract was used for formation of Au nanoparticles, more anisotropic particles were obtained (figure 4a). However, by increasing the amount of Camellia sinensis extract from 0.2 to 1 mL, the resulted nanoparticles are slightly bigger and more spherical. It is believed that, when a larger concentration of bio-reducing agent is used, a relatively fast nucleation process occurs, which is followed by a slower growing stage due to stronger interactions between protective bio-molecules and growing Au nanocrystals, leading to the formation of more isotropic particles. [13]
Fig. 4. a) Bright-field TEM micrograph of gold nanoparticles formed after 24 hours of the reaction, using 0.2 mL of Camellia sinensis extract; and b) Dark-field TEM micrograph of gold, nanoparticles formed after 24 hours of the reaction 1mL of Camellia sinensis extract, respectively. In both cases 5 mL of 10-3 M aqueous solution HAuCl4 were employed for the synthesis.
400
Noble Metals
Typical TEM image of silver nanoparticles can be observed in figure 5. The inset in figure 5 corresponds to SAED pattern, associate to face-centered cubic (FCC) silver. The diffraction spots suggest that grow as a single crystal. On the contrary, when a larger volume of Camellia sinensis extract is added to a silver ions solution, the resultant nanocrystals exhibit anisotropy, which is mainly attributed to both, a rapid reduction of the Ag ions and fast sinter of growing crystals into anistropic nanostructures (figure 5). This last outcome can be explained by weaker interactions of Ag growing nanoparticles and protective bio-molecules compared to those with Au nanoparticles. This also explains the different rate of formation of stable Au and Ag nanoparticles using this methodology.
Fig. 5. Typical TEM images of silver nanostructures formed after 24 hours of the reaction, using 2 mL of Camellia sinensis extract with 5 mL of 10-3 M aqueous solution AgNO3. The inset shows the SAED pattern which correspond to a FCC structure. In case of platinum, the nanoparticles obtained by bioreduction with Camellia sinensis aqueous extract, are shown in the micrographs of figure 6. The morphology of the nanoparticles was mainly spherical with a size between 2-10 nm. Control of the size and morphology of the resultant nanostructures can be related to the interactions between biomolecules (e.g., terpenoids, polyphenols and phenolic acids) and metal atoms. Therefore, it is thought that phenolic acid type biomolecules present in Camellia sinensis extract, are responsible for the reduction of silver, chloroaurate and chloroplatinate ions, and also for the stabilization of the nanoparticles throughout electrostatic interactions. Although good efforts have been done to elucidate these reduction and stabilization mechanisms, more studies are required.
Green Synthesis of Noble Metal (Au, Ag, Pt) Nanoparticles, Assisted by Plant-Extracts
401
Fig. 6. Typical TEM images of platinum nanoparticles formed after 24 hours of the reaction, using 5 mL of Camellia sinensis extract with 5 mL of 10-3 M aqueous solution H2PtCl6. 3.2 Opuntia ficus indica system Chemical composition of Opuntia ficus indica cladodes are mainly water (92%), carbohydrates (~4-6%), proteins (~1%), vegetable fats (~0.2%), minerals (~1%) such as calcium and iron predominantly, and vitamins mainly ascorbic acid (vitamin C) [41,42]. On another hand, it has been demonstrated by Sun et al. [43] that gold nanoparticles can be obtained directly and simply by reduction of Au(III) ions with ascorbic acid as reducing agent. The carbohydrate fraction of the Opuntia ficus indica can be attributed mainly to the starch and soluble sugars contents. The cladodes showed higher starch contents (from 7 to 13/100 g of dry weight) than soluble sugars (from 6 to 2/100 g of dry weight), in contrast, protein and fats contents showed poorer quantities. Besides, cladodes exhibited also low pH values due to the presence of many organic acids such as: malic, citric and oxalic acids [44]. Carboxylic moieties show a great affinity towards the surface of the nanoparticles, for this reason nanoparticles can be stabilized through electrostatic interactions with carboxylic groups, as reported previously by K Yoosaf et al. [38]. Opuntia ficus indica is considered as a great source of natural antioxidant compounds due to the content of polyphenols, higher than 900 mg/100g of dry matter, which are mainly responsible for an antioxidant activity [44]. This type of compounds play an important role during metal ion reduction processes in biosynthetic methods, as stated in previously reported [13]. Although a more detailed study is required to establish a detailed mechanism of formation and stabilization of the metallic nanoparticles, we can assumed that hydroxyl and carboxylic groups present in the biomolecules of the Opuntia ficus indica extract play an important role in the Ag(I) and Au(III) ions reduction and can also control the size and the stability of the nanostructures formed.
402
Noble Metals
When Opuntia ficus indica aqueous extract is combined with 10-3 M aqueous AgNO3 and HAuCl4, solutions color changes from pale yellow to dark yellow and from yellowish to red due to the formation of silver and gold nanoparticles respectively, as a consequence of the excitation of surface plasmon vibrations. The UV-vis absorption spectra of silver nanoparticles, formed after 1 hour of reaction using different quantities of Opuntia ficus indica extract, are shown in Fig. 7(a) Spectra 1, 2 and 3 correspond respectively to 10, 5 and 1 ml of Opuntia ficus indica extract used as bioreducing agent. Spectra 2 and 3 show a single absorption band centered at 398 nm. In contrast, spectra 1 exhibits an insignificant intensity band at 404 nm width, which can be attributable to an insufficient amount of reductive biomolecules for the Ag+1 reduction ; consequently fewer silver nanoparticles are formed. As described by Huang et al. [13], weaker binding of biomolecules with the nascent silver nanoparticles could lead to isotropic growth of the crystals and further formation of spherical nanoparticles. In plant-mediated synthesis, the control of the size of silver nanoparticles has been proposed to be time-reaction dependent [45]. Basically, the longer the reaction time, the larger the sizes and the nanoparticles change from polycrystalline to single crystalline. Fig. 7(b) shows UV-vis spectra after 1 and 65 hours or reaction time. The fact that the spectra are very similar indicates that the particles have essentially the same size and shape (spheroids). This behavior takes place only when 5 ml of Opuntia ficus indica extract are used as the reducing agent. However, when this quantity is doubled, the corresponding UV-Vis band disappears after 65 hours, and silver micro-particles are deposited in the reaction solution as a result of a coalescence process of nanoparticles and probably due to the poor efficacy of Opuntia ficus indica extract capping biomolecules in stabilizing the silver nanoparticles through time, thus increasing the size of Ag crystals. Addition of Opuntia ficus indica extract to 10-3 M aqueous HAuCl4 solution led to the appearance of a blue color in solution after about 1 h of reaction, indicating the formation of gold nanoparticles (inset in figure 9). The UV-vis absorption spectrum recorded from this solution shows the characteristic surface plasmon resonance (SPR) band of gold nanoparticles centered at 540 nm (Figure 8). The kinetics of formation of gold nanoparticles was followed by UV-Vis spectroscopy, and the spectra obtained are shown in Figure 8. It is observed that with the progress of the reaction the absorbance intensity at 540 nm increases monotonically with time when 1 mL of Opuntia ficus indica extract is employed, while with time, the band centered at 560 nm for the system that used 2 mL of Opuntia ficus indica extract for the reduction undergoes a further red shift before stabilizing at 640 nm after completion of reaction. These time-dependent features in the UV-Vis spectra are characteristic of aggregated spherical nanoparticles or anisotropic nanostructures whose dimensions change with time. Figure 8b shows the UV-Vis absorbance spectra of gold nanoparticles synthesized 2 mL of Opuntia ficus indica extract recorded from 05 to 4 h of the reaction. It can be observed in figure 9 a clearly band shift to longer wavelengths and strong intensity with the time. It is well known that rodshaped and flat gold nanoparticles absorb in the NIR region of the electromagnetic spectrum [12, 46]. Such nanostructures exhibit two well-separated absorption bands wherein the low wavelength band centered at ca. 540 nm corresponds to the transverse
403
Green Synthesis of Noble Metal (Au, Ag, Pt) Nanoparticles, Assisted by Plant-Extracts
surface plasmon vibration while the long wavelength component corresponds to the longitudinal surface plasmon absorption. [47] The first signal could be enclosed by the second one, causing that the spectra profile non symmetric of figure 8b.
0.30
a
3
Absorbance
0.25 0.20 0.15
2
Absorbance
0.12
0.35
2
b
0.10
1 0.08 0.06 0.04
0.10
0.02 0.05
1
0.00 350
400
450
500
550
600
0.00 350
650
400
450
500
550
600
650
Wavelength (nm)
Wavelength (nm)
Fig. 7. a) UV-Vis absorption spectra of silver nanoparticles formed after 1 hour of the reaction of different amounts (1, 5 and 10 ml, curves 1-3 respectively) of Opuntia ficus indica extract with 5 ml of 10-3 M aqueous solution of Ag NO3. b) UV-Vis absorption spectra of silver nanostructures formed with 5 ml of Opuntia ficus indica extract and 5 ml of 10-3 M aqueous solution of AgNO3 after 1 and 65 hours of the reaction (curves 1 and 2, respectively).
5
a
1.0 4
0.5 h 1h 1.5 h 2h 4h
1.2
3 2
1.0
1
0.5 h 1h 1.5 h 2h 4h
0.6
0.4
0.2
Absorbance
Absorbance
0.8
b
5
4
0.8
3 2
0.6
0.4
1
0.2
0.0 400
500
600
Wavelength (nm)
700
800
0.0 400
500
600
700
800
Wavelength (nm)
Fig. 8. UV-Vis absorption spectra of gold nanoparticles measured during the reaction of a) 1 mL and b) 2ml of Opuntia ficus indica aqueous extract with 5 ml of 10-3 M solution of HAuCl4, respectively (final volume of reaction mixture adjuste to 10 mL using deionized water); after 0.5, 1, 1.5, 2 and 4 h of reaction (curves 1-5, respectively)
404
Noble Metals
Figure 9 presents a plot of the plasmon intensity at 540 nm against reaction time, from the graph in figure 8a. It can be seen easily that the plasmon intensity at the reaction time of 2 h is near to that at 4 h, meaning completion of the reaction. The inset of figure 9 presents the final color in the mixture solution after 4 h of reaction time. The extract was light green before reaction with gold ions and changed to pale blue and blue after 4 hours of reaction time, with 1 mL and 2 mL of Opuntia ficus indica extract, respectively, and then the color did not change any more with reaction time. The characteristic blue of gold nanoparticles solutions provided a convenient spectroscopic signature to indicate their formation.
1.2
Intensity
1.0 0.8
a
0.6
b
0.4 0.2 0.0 0
1
2
3
4
Time (hours)
Fig. 9. Plot of the intensity of surface plasmon resonance at 540 nm against the reaction time, for gold nanoparticles obtained from 1 mL of Opuntia ficus indica aqueous extract with 5 ml of 10-3 M solution of HAuCl4. The inset shows photos of the different nanoparticle solutions after 4 h of the reaction whose labels correspond to spectra a) and b) shown in the figure 8. TEM analysis reveals that silver nanoparticles are predominately ellipsoids, as can be observed in Fig. 10(a). Micrograph 10b and histogram 10b correspond to silver nanoparticles formed after 24 hours of reaction, using 5 ml of 10-3 M of aqueous solution AgNO3. Nanoparticles sizes are between 8 and 50 nm, with an average of 23.5 nm ± 5 nm. A typical selected area diffraction pattern is shown in the inset of Fig. 10a. Diffraction rings can be indexed as (200), (220), (311) and (222) reflections (indicated by numbers 1, 2, 3 and 4 respectively), corresponding to a FCC structure of silver. For the 1 and 10 ml of biomass extract, the average particle size was 8.6 and 53 nm, respectively. Figure 11(a) shows silver nanoparticles after 24 hours of the bioreduction process, with the same amount of silver ions and volume of reducing agent used previously in Figure 10(a) but kept at 60°C instead of at room temperature. Average particle size is reduced to 8.1 nm, and the particles are quite spherical.
405
Green Synthesis of Noble Metal (Au, Ag, Pt) Nanoparticles, Assisted by Plant-Extracts
Particle number
250
b
200 150 100 50 0 0
10
20
30
40
50
60
Particle size (nm) Fig. 10. a) Representative TEM image of silver nanoparticles synthesized with 5 ml of Opuntia ficus indica extract when reacting with 5 ml of 10-3 M aqueous solution of AgNO3. Inset 10 a) Electron diffraction pattern of (a), which can be indexed on the basis of the FCC structures of silver. b) Size distribution of Ag nanoparticles synthesized with 5 ml of Opuntia ficus indica extract when reacting with 5 ml of 10-3 M aqueous solution of AgNO3. 250
b
Particle number
200 150 100 50 0 0
5
10
15
20
25
Particle size (nm) Fig. 11. a) Representative TEM image of Ag nanoparticles formed after 24 hours of the bioreduction, with 5 ml of Opuntia ficus indica extract and 5 ml of 10-3 M aqueous solution of AgNO3 at 60°C. b) Histogram showing the Ag nanoparticles size distribution obtained at 60°C. Figure 12 shows typical TEM micrograph of gold nanoparticles synthesized using of Opuntia ficus indica extract. The morphology of the nanoparticles observed was icosahedral,
406
Noble Metals
Particle number
multiple-twined particles, but also irregular shapes were formed, with an average size of 40 nm. The inset SAED pattern revealed that the diffraction rings from inner to outer, could be indexed as (111), (200), (220), and (311) reflections, respectively, corresponding to facecentered cubic (FCC) gold. The diffraction rings also suggested the NPs were polycrystalline.
Particle size (nm) Fig. 12. a) Transmission electron micrograph of gold nanoparticles after bioreduction. Gold nanoparticles were obtained by exposing 2 mL of Opuntia ficus indica extract to 5 ml of 10-3 M solution of HAuCl4. The inset shows the electron diffraction pattern of the gold particles in the main part of the image. Rings 1, 2, and 3 arise due to reflections from the (111), (200), (220) and (311) lattice planes of FCC gold. b) Histogram of size distribution of gold nanoparticles synthesized by the experiment of figure 12a. The average particle size is 40 nm.
4. Summary If nanotechnology is to realize its full promise and potential, it is essential that these nextgeneration materials be designed from the outset to be benign to human health and the environment. Nanoparticles of gold, silver and platinum have been successfully prepared using a simple and efficient green nanochemistry methodology. Furthermore, we have demonstrated that use of natural, renewable and low cost biological reducing agents, such as Camellia sinensis and Opuntia ficus indica can produce noble metal nanostructures in aqueous solution at ambient conditions, avoiding, in consequence, the presence of hazardous and toxic solvents and waste. The colloidal systems of silver and gold nanoparticles, stabilized by the bio-molecules present in the Camellia sinensis and Opuntia ficus indica aqueous solutions, are currently under evaluation as potential useful bio-imaging agents for medical applications due to their characteristic optical properties exhibited.
Green Synthesis of Noble Metal (Au, Ag, Pt) Nanoparticles, Assisted by Plant-Extracts
407
5. Acknowledgements Authors are grateful to Francisco Ruiz (Centro de Nanociencia y Nanotecnología Universidad Nacional Autónoma de México) for TEM measurements.
6. References [1] S. Eustis, H. Y. Hsu, MA. El-Sayed, J. Phys. Chem. B. (2005), 109, 4811 [2] F. Mafune, J. Kohno, Y. Takeda, T. J. Kondow, Phys. Chem. B. (2002), 106, 7575. [3] L. Rodríguez-Sánchez, M. C. Blanco, M. A. López-Quintela, J. Phys, Chem. B. (2002) 104, 9683. [4] G. Zhang, D.J. Wang, J. Am. Chem. Soc. (2008) 130, 5616. [5] M. Treguer, C. Cointet, H. Remita, J. Khatouri, M. Mostafavi, J. Amblard, J. J. Belloni, Phys. Chem. B. (1998) 102, 4310. [6] PT. Anastas, MM. Kirchhoff, Acc. Chem. Res. (2002) 35, 686. [7] P. Mohanpuria, N. K. Rana, S. K. Yadav, J. Nanopart. Res. (2008) 10, 507. [8] R. Joerger, T. Klaus, C. G. Granqvist, Adv. Mater. (2000) 12, 407. [9] K. C. Bhainsa, S. F. D’Souza, Colloids and Surfaces B: Biointerfaces. (2006) 47, 160. [10] J. L. Gardea-Torresday, J. G. Parsons, E. Gomez, J. Peralta-Videa, H. E. Troiani, P. Santiago, J. Yacaman, Nano. Lett. (2002) 2, 397. [11] AR. Vilchis-Nestor, V. Sánchez-Mendieta, Marco A. Camacho-López, Miguel A. Camacho-López, JA. Arenas-Alatorre, Mater. Lett. 62, 3103 (2008) [12] S. Shankar, A. Ahmad, M. Sastry, Biotechnol Prog. 19, 1627 (2003) [13] J. Huang , Q. Li, D. Sun, Y. Lu, Y. Su, X. Yang, H. Wang, Y. Wang, W. Shao, N. He, J. Hong, C. Chen, Nanotechnology (2007) 105104, 18. [14] S. Li, Y. Shen, A. Xie, X. Yu, L. Qui, L. Zhang, Q. Zhang. Green Chem. (2007) 9, 852. [15] S.S. Shankar, A. Rai, B. Ankamwar, A. Singh, A. Ahmad, M. Sastry, Nature Materials (2004) 3, 482. [16] T.J. Beveridge, M.N. Hughes, H. Lee, K.T. Leung, R.K. Poole, I. Savvaidis, S. Silver, J.T. Trevors. Advances in Microbial Physiology, 38 (1997), 177–243. [17] Jean-Marc Bollag, Tawna Mertz, and Lewis Otjen. Bioremediation through Rhizosphere Technology, Chapter 1: Role of Microorganisms in Soil Bioremediation, 1994, ACS Symposium Series, Volume 563, 2-10. [18] Sujoy K. Das, Enrico Marsili. A green chemical approach for the synthesis of gold nanoparticles: characterization and mechanistic aspect. Rev Environ Sci Biotechnol (2010) 9, 199–204 [19] D. Bhattacharya and R. K. Gupta. Nanotechnology and Potential of Microorganisms. Critical Reviews in Biotechnology, 25, 199–204, (2005). [20] M. Gericke, A. Pinches. Hydrometallurgy (2006) 83, 132–140. [21] V. Kumar and S.K. Yadav. Journal of Chemical Technology and Biotechnology (2009) 84-2, 151–157. [22] R. Bali, N. Razak, A. Lumb and A.T. Harris. The synthesis of metallic nanoparticles inside live plants. Proceedings of the 2006 International Conference on Nanoscience and Nanotechnology (ICONN’2006), 224-227. [23] G. Gamez, K. Dokken, I. Herrera, J. G. Parsons, K. J. Tiemann, and J. L. GardeaTorresdey. Chemical processes involved in Au(III) binding and bioreduction by alfalfa biomass. Proceedings of the 2000 Conference on Hazardous Waste Research.
408
Noble Metals
[24] Jorge L. Gardea-Torresdey, E. Gomez, J. R. Peralta-Videa, Jason G. Parsons, H. Troiani, and M. Jose-Yacaman. Langmuir 2003, 19, 1357-1361. [25] N. C. Sharma, S. Sahi, J. G. Parsons, Jorge L. Gardea-Torresdey, Tarasankar Pal. Environ. Sci. Technol. 2007, 41, 5137-5142. [26] V. Armendariz, I. Herrera, J. R. Peralta-Videa, Miguel Jose-Yacaman, H. Troiani, P. Santiago and Jorge L. Gardea-Torresdey. Journal of Nanoparticle Research (2004) 6, 377–382,. [27] Jorge L. Gardea-Torresdeya, Jose R. Peralta-Videa, G. de la Rosaa, J.G. Parsons. Coordination Chemistry Reviews (2005) 249, 1797–1810. [28] M.L. Lopez, J.G. Parsons, T, J.R. Peralta Videa, J.L. Gardea-Torresdey. Microchemical Journal (2005) 81, 50–56. [29] J. Huang, L. Lin, Q. Li, D. Sun, Y. Wang, Y. Lu, N. He, K. Yang, X. Yang, H. Wang, W. Wang and W. Lin. Ind. Eng. Chem. Res. (2008) 47, 6081–6090. [30] J.L. Gardea-Torresdey, K.J. Tiemann, G. Gamez, K. Dokken, S. Tehuacanero and M. José-Yacamán. Journal of Nanoparticle Research 1 (1999), 397–404. [31] J. Gardea-Torresday, K. Tiemman, G. Gamez, K. Dokken, S. Tehuacanero, M. JoseYacaman. J. Nanoparticles Res. 3 (2001) 475. [32] J.A. Ascencio, Y. Mejia, H.B. Liu, C. Angeles, G. Canizal. Langmuir (2003) 19, 5882. [33] P.S. Schabes-Retchkiman, G. Canizal, R. Herrera-Becerra, C. Zorrilla, H.B. Liu, J.A. Ascencio. Optical Materials (2006), 29, 95–99. [34] J.A. Ascencio, A.C. Rodríguez-Monroy, H.B. Liu, G. Canizal. Chem.Lett. (2004), 33 1056. [35] Jorge A. Ascencio, Ana C. Rincon, and Gerardo Canizal. J. Phys. Chem. B (2005), 109, 8806-8812. [36] G. Canizal, P.S. Schabes-Retchkiman, U. Pal, Hong Bo Liu, J.A. Ascencio. Materials Chemistry and Physics (2006) 97, 321–329. [37] Raúl Herrera-Becerra, Cristina Zorrilla, and Jorge A. Ascencio. J. Phys. Chem. C (2007) 111, 16147-16153. [38] Yoosaf K, Ipe BI, Suresh CH, Thomas G. J Phys Chem C (2007) 12839, 111. [39] Scampicchio M, Wang J, Blasco AJ, Arribas AS, Mannino S, Escarpa A. Anal Chem. (2006) 2060, 78. [40] W. Yang, Y. Maa, J. Tang, X. Yang. Colloids and Surfaces A: Physicochem. Eng. Aspects 302 (2007) 628–633. [41] D. Guzmán-Loayza, J. Chávez, Rev. Soc. Quím. Perú, 73, 41 (2007). [42] N. Salim, C. Abdelwaheb, C. Rabah, B. Ahcene, African Journal of Biotechnology. 8, 1623, (2009). [43] K. Sun, J. Qiu, J. Liu, Y. Miao, J. Mater. Sci, 44, 754, (2009). [44] MA. Ayadi, W. Abdelmaksoud, M. Ennouri, H. Attia, Industrial Crops and Products 30, 40, (2009). [45] V. Kumar, S. Kumar, J. Chem. Technol. Biotechnol. 84, 151 (2008). [46] Cecilia Noguez. J. Phys. Chem. C 2007, 111, 3806-3819. [47] Luis M. Liz-Marzán, Langmuir 2006, 22, 32-41. [48] S. Shiv Shankar, Akhilesh Rai, Absar Ahmad, and Murali Sastry. Chem. Mater. 2005, 17, 566-572.
19 Nobel Metal Nanoparticles in Bio-LED Yen-Hsun Su1, Sheng-Lung Tu2 and Wei-Min Zhang3 1Department
of Material Science and Engineering National Dong Hwa University, Tainan 2Department of Resource Engineering, National Cheng Kung University, Tainan 3Department of Physics, National Cheng Kung University, Tainan Taiwan 1. Introduction Nanomaterials are well known for their interesting physical chemical properties [1-7]. Recently, noble metal nanoparticles have attracted attention [9-15] due to their optical property of surface plasmon resonance. Surface plasmon resonance produces hot light spots due to a stronger electromagnetic field. Because of their low toxicity, ease of delivery, and strong and tunable surface plasmon resonance, noble metal nanoparticles are used in the field of the photothermal ablation therapy to treat cancer [10]. Plants help people confront the global warming by absorbing CO2 in the photosynthesis process. If plants were able to do the photosynthesis process day and night, absorbing CO2 will act in day and night. In this paper, we investigate the life time of noble metal nanoparticle colloids on plants specifically. The buds of Floppers, Bryophyllum pinnatum (Lam.) Kurz., are watered the noble metal cluster colloids. The buds are recorded for six weeks. The results show that noble metal nanoparticle colloids exit plant growth, with the Pt nanoparticles aggregating on the leaf. We expect that this research has potential applications in the fields of biosensing, bio-LED, bioimaging, nanophotonics, photothermal ablation therapy, and nanotoxicity.
2. Experimental produre Chemicals and materials. We prepared 10 L standard solution by adding MgCl= 10.0 ppm, KCl=0.5 ppm, NaCl= 8 ppm, and FeCl3= 0.04 ppm in Milli-Q water. Trisodium citrate (99%) and HAuCl4, AgNO3, and H2PtCl6 were purchased from Showa Chemical Co. (Tokyo, Japan) and Alfa Aesar Chemical Co. (Lancashire, England) and used as supplied, respectively. MilliQ water was obtained from the Milli-Q Element system (Massachusetts, USA), which employs ultra-clean materials and a succession of optimized water purification technologies to produce 18.2 MΩ/cm resistivity ultrapure water (at 25 °C), ideal for trace analysis methods. The solution used in this work was freshly prepared and deoxygenated by bubbling nitrogen gas for at least 30 min prior to use. All materials and apparatus were sterile. Preparation of noble nanoparticles. Au NPs were prepared by a chemical-reduction method with Au, Pt, Ag-salt and Na-cit standard solutions. 1.5 ml of freshly prepared 0.34 M trisodium citrate(aq) solution was added to 15 ml of 0.5 mM HAuCl4(aq) solution, AgNO3(aq)
410
Noble Metals
solution, and H2PtCl6(aq) solution at room temperature and under vigorous stirring for 48 hours. These solutions were stirred for 30 min to control the reaction rate of Au, Ag, and Pt nanoparticles, respectively. All materials and apparatus were sterile. Preparation of Floppers, Bryophyllum pinnatum (Lam.) Kurz. We cut 40 leaves from the plant Bryophyllum pinnatum (Lam.) Kurz., and these were then placed in a 50 ml glass bottom and watered with standard solution. The environment was controlled at 300 K, with 100mW/square-cm radiation with sun lamps and 60% humidity. Buds grew at the edges of the leaves, and when the length of a bud reached 5.980 mm, it was cut, and put at the bottom of a 3 ml glass bottom. The cut buds were hold in a 300 K environment with 100mW/squarecm radiation with sun lamps and 60% humidity. A total of 697 buds were tested using either standard solution or noble metal colloids. The buds were watered with 0.5 ml of the standard solution or noble metal colloids. And all materials and apparatus were sterile. Instruments and Measurements. Dark-field spectroscopy, zetasizer, and TEM were used in the analysis. The morphology of the noble metal nanoparticles was observed by TEM. The as-grown product was observed with a Hitachi model HF-2000 transmission electron microscope operating at 200 kV. The sample was directly dispersed onto a 200-mesh holey carbon film on a Cu grid for TEM analysis. After being watered with standard solution or noble metal colloids for six weeks, the leaves and roots of the buds were observed via darkfield spectroscopy.
3. Results 3.1 Morphology of Au, Ag, and Pt nanoparticles The concentration of the citratic acidic group modifies the noble metal nanoparticles to control their size. The average size for Au, Ag, and Pt nanoparticles was measured with a zetasizer, and was 6.3 nm, 3.2 nm, and 5.8 nm, respectively. From the TEM observation in Fig. 1, the size of the Au, Ag, and Pt nanoparticles is in good agreement with the zetasizer measurements.
(a)
411
Nobel Metal Nanoparticles in Bio-LED
(b)
(c) Fig. 1. Morphology of (a) Au, (b) Ag, and (c) Pt nanoparticles under TEM observation. 3.2 Buds watered with standard solution or noble metal colloids for six weeks After being watered with standard solution or noble metal colloids for six weeks, dark-blue masses on the leaves are seen under the dark-field microscopic observation in Fig. 2. The leaves scatter green light, as shown in Fig. 2 (a). Metal clusters usually scatter strong light due to surface plasmon resonance [9,14]. And as the size of the particles (clusters) increases, so does the damping factor and the absorption. On the other hand, the light scattering gets weaker, as the size of particles (clusters) increases [14,15]. Thus, the metal cluster presents the dark-blue masses. In addition, the nanoparticles aggregate on the surface of leaves, and Fig. 2 shows that Pt nanopartcles aggregate together the most.
412
Noble Metals
(a)
(b)
(c)
413
Nobel Metal Nanoparticles in Bio-LED
(d) Fig. 2. Dark-field microscopic image of leaf on the bud watered with (a) standard solution, (b) Au colloids, (c) Pt colloids, and (d) Ag colloids for six weeks. In Fig. 3, the dark-field microscopic observation shows the roots scatter the weak light, while the metal clusters scatter stronger light. As the size of the metal clusters decreases, the surface plasmon resonance increases, as does the scattering of light [14,15]. Therefore, the particles (clusters) size on the roots are smaller than these on the leaves. However, the light scattering of Pt clusters is weaker than that of the Au or Ag clusters, and Pt nanopartcles also aggregate together more seriously than the others on the roots.
(a)
414
Noble Metals
(b)
(c)
(d) Fig. 3. Dark-field microscopic image of roots on the bud watered with (a) standard solution, (b) Au colloids, (c) Pt colloids, and (d) Ag colloids for six weeks.
Nobel Metal Nanoparticles in Bio-LED
415
According to Fig. 2~3, we observe the noble will not be corroded in leaves and roots. Install, noble metal nanoparticle will aggregate together in vein of leaves or the surface of roots.
4. Conclusions We found that noble metal colloids significantly exit Floppers, Bryophyllum pinnatum (Lam.) Kurz. for several weeks. Future detailed studies should be performed to understand how the mechanism of nanoparticle leaves the plant body.
5. Acknowledgments This work was financially supported by the National Science Council of Taiwan, No. 1002218-E-259-003-MY3, which is gratefully acknowledged.
6. References [1] Pedano ML, Li S, Schatz G C, Mirkin CA 2010 Angew. Chem. Int. Ed. 49 78-82. [2] Camden J P, Dieringer J A, Wang Y, Masiello DJ, Marks LD, Schatz GC, Van Duyne RP 2008 J. Am Chem. Soc. 130 12616. [3] Khlebtsov B, Khlebtsov N 2008 Nanotechnology 19 435703. [4] Hao F, Sonnefraud Y, Van Dorpe P, Maier SA, Halas N J, Nordlander P 2008 Nano Lett. 8 983. [5] Longo A, Pepe GP, Carotenuto G., Ruotolo A, De Nicola S, Belotelov VI, Zvezdin, AK 2007 Nanotechnology 18 365701. [6] Maly J, Lampova H, Semeradtova A, Stofik M, Kovacik L 2009 Nanotechnology 20 385101. [7] Mutombo P, Kiss AM, Berko A, Chab V 2006 Nanotechnology 17 4112. [8] Bouhelier A, Bachelot R, Lerondel G, Kostcheev S, Royer P, Wiederrecht1 GP 2005 Phys. Rev. Lett. 95 267405. [9] Schatz G.C 2010 J. Phys. Chem. Lett. 1 802. [10] Zhang J Z 2010 J. Phys. Chem. Lett. 1 686. [11] Guo PF, Wu S, Ren QJ, Lu J, Chen Z, Xiao SJ, Zhu YY 2010 J. Phys. Chem. Lett. 1 315. [12] Wang C, Zhang M, Wang H, Zou S 2010 J. Phys. Chem. Lett. 1 79. [13] Su YH, Chang SH, Teoh LG, Tu ST, Hon MH 2009 J. Nanosci. Nanotechnol. 9 1181. 14. Su YH, Teoh LG, Lai WH, Chang SH, Yang HY, Hon MH 2007 Appl. Spectrasc. 61, 1007. [14] Su YH, Chang SH, Teoh LG, Chu WH, Tu SL 2009 J. Phys. Chem. C, 113 3923. [15] Skirtach AG, Javier AM, Kreft O, Kohler K, Alberola AP, Mohwald H, Parak WJ, Sukhorukov GB 2006 Angew. Chem.. Int. Ed. 45 4612. [16] Troutman TS, Barton JK, Romanowski M 2008 Adv. Mater. 20 2604. [17] Alkilany AM, Nagaria PK, Hexel CR, Shaw TJ, Murphy CJ, Wyatt MD 2009 Small 5 701. [18] Male KB, Lachance B, Hrapovic S, Sunahara G., Luong JHT 2008 Anal. Chem. 80 5487. [19] Gobin AM, Moon JJ, West J, Ephrin L, Int. 2008 J. Nanomed. 3 351. [20] Bernardi RJ, Lowery AR, Thompson PA, Blaney SM, West J L 2008 J. Neuro−Oncol. 86 165. [21] Lal S, Clare SE, Halas NJ 2008 Acc. Chem. Res. 41 1842.
416
Noble Metals
[22] Huang XH, El-Sayed IH, Qian W, El-Sayed MA 2006 J. Am. Chem. Soc. 128 2115. [23] von Maltzahn G, Park JH, Agrawal A, Bandaru NK, Das SK, Sailor MJ, Bhatia SN 2009 Cancer Res. 69 3892. [24] Letfullin RR, Joenathan C, George TF, Zharov V P 2006 Nanomedicine 1 473. [25] Mironava T, Hadjiargyrou M, Simon M, Jurukovski V, Rafailovich MH 2010 Nanotoxicology 4 120.