New Advances in Building Information Modeling and Engineering Management (Digital Innovations in Architecture, Engineering and Construction) 303130246X, 9783031302466
This book explores the latest advances in the field of building management. Several chapters use new technologies such a
149 23 8MB
English Pages 239 [232] Year 2023
Foreword
Contents
1 Maintenance Management of Existing Building Supported on BIM
1.1 Introduction
1.1.1 BIM Role in FM
1.2 Methodology
1.2.1 Case Study
1.2.2 Introduction of the Parametric Information in the BIM Model
1.2.3 Development of the Preventive Maintenance Plan for Some Building Elements
1.2.4 Obtaining the Information from the Parametric Model
1.3 Conclusions
References
2 Extending Access to BIM Information: Merging Augmented Reality Interfaces and Semantic Enrichment
2.1 Introduction
2.1.1 On the Exchange of BIM Data
2.1.2 Integrated Projects
2.1.3 Natural User Interfaces
2.1.4 Increasing Accessibility to BIM: Natural BIM Interfaces
2.2 Materials
2.3 Results and Discussion
2.4 Conclusion
References
3 A Review on the Digitalization of On-Site Production Management—Case Study in a Portuguese Construction Company
3.1 Introduction
3.2 Methodology
3.3 Results and Discussion
3.3.1 Selected Articles
3.3.2 Characteristics of the Selected Articles
3.3.3 Analysis and Principal Conclusions
3.3.4 Main Tools
3.3.5 Discussion
3.4 Case Study
3.4.1 Framework with the Company
3.4.2 Case Study Methodology
3.4.3 Procedure
3.4.4 Case Study Results
3.5 Conclusions
References
4 Historic Building Information Modeling (HBIM) and Common Data Environment: The Case Study of Palazzo Vitelli in San Giacomo in Città di Castello
4.1 Introduction
4.2 Materials and Methods
4.2.1 The Case Study: Palazzo Vitelli in San Giacomo, Città di Castello (Peruga)
4.2.2 BIM Modeling of Palazzo Vitelli in San Giacomo
4.2.3 Historical-Technical Common Data Environment
4.3 Results and Discussion
4.3.1 CDE Implementation
4.3.2 Discussion of Results
4.4 Conclusions
References
5 A Workflow for Photogrammetric and Thermographic Surveys of Buildings with Drones
5.1 Introduction
5.2 Integration of the Thermographic Data into BIM Models Generated from Photogrammetric Surveys with Drones
5.2.1 Literature Review
5.2.2 Data Collection Using Drones
5.2.3 Thermography Integration into BIM Models for Energy Analysis Studies
5.3 Methodology Proposal for Photogrammetric and Thermographic Surveys of Existing Buildings with Drones
5.3.1 Overview
5.3.2 Reconnaissance and Preparation
5.3.3 Image Collection Using Drones
5.3.4 Processing and Analysis of the Collected Images
5.3.5 Integration into and Modelling in BIM Environment
5.3.6 Integration of IR Images with the BIM Model (Qualitative Approach)
5.3.7 Energy Simulation on BEM Software (Quantitative Approach)
5.4 Conclusion and Further Work
References
6 Digital Asset Production Using Lean Design Management: A Conceptual Framework
6.1 Introduction
6.2 Methodology
6.3 Results and Discussion
6.3.1 Design Problems
6.3.2 Construction Information Management Standards
6.3.3 Lean Design Management (LDM)
6.4 Conclusions
References
7 Risk Assessment Comparative Analysis by the Method “Level of Preventive Action” in Three Case Studies
7.1 Introduction
7.1.1 The Level of Preventive Action Method
7.1.2 Objetive
7.2 Methodology
7.2.1 Description of the Construction Processes
7.2.2 Identification of Hazards and Risks
7.2.3 Risk Analysis
7.2.4 Risk Assessment
7.3 Results
7.3.1 Global Results of Preventive Action Level
7.3.2 Results of the Preventive Action Level by Construction Systems
7.3.3 Results of the Preventive Action Level for the Risks Evaluated
7.3.4 Results of the Preventive Action Level for Risk-Fighting Techniques
7.4 Discussion
7.5 Conclusion
References
8 An Open-Source Built Heritage Management Tool for Inner Areas
8.1 Introduction
8.2 Materials and/or Methods
8.3 The Historical and Environmental Characteristics of the “Sample Area”
8.4 Results and Discussion
8.5 Conclusion
References
9 The Role of Blockchain Technology in the Future of Construction
9.1 Introduction
9.1.1 Building Information Modeling (BIM)
9.2 State of the Art
9.3 Methodology
9.4 Blockchain Technology
9.4.1 Fabric Layer
9.4.2 Application Layer
9.5 Privacy in Blockchain
9.6 Smart Contracts
9.6.1 Advantages of Smart Contract
9.6.2 Disadvantages of Smart Contract
9.7 Applications of Blockchain Technology
9.8 AEC
9.8.1 Challenges AEC Industry
9.8.2 Future for AEC
9.9 Blockchain and Project Management
9.9.1 Blockchain and BIM
9.10 Blockchain and Space
9.10.1 Protection of Space Information by Blockchain
9.11 Conclusions
References
10 Trustless Construction Project Information Exchanging Using Hyperledger Blockchain
10.1 Introduction
10.1.1 Literature Review
10.2 Blockchain for Enterprise Purposes
10.2.1 Hyperledger Fabric Framework
10.2.2 Hyperledger Composer
10.2.3 InterPlanetary File System (IPFS)
10.3 Construction Project Communication Through a Distributed Ledger
10.3.1 Designing the Chaincode
10.3.2 Testing in Composer
10.4 Conclusion
References
11 Open-Access Software Implementation for Critical Path Problems Arising in Planification Theory
11.1 Introduction
11.1.1 Planning and Scheduling Problems
11.1.2 Resolution Methods
11.1.3 Critical Path and Maximum-Length Route Methods
11.1.4 Critical Path Method (CPM)
11.1.5 Maximum-Length Route
11.1.6 Approach as Linear Programming Problem
11.1.7 Roy’s Method
11.1.8 Methodology for the Resolution of Roy Graphs [7]
11.1.9 Objective of Our Contribution
11.2 Materials and Methods
11.2.1 Maximum-Length Route Method
11.2.2 Roy’s Method
11.2.3 Roy’s Method Implementation
11.3 Results and Discussion
11.3.1 Implementation of the Maximum-Length Route Method
11.3.2 Implementation of Roy’s Method
11.3.3 Comparison of Both Methods
11.4 Conclusions
References
12 Spanish Construction Emerging Risks About Health and Psychosocial Risk
12.1 Introduction
12.1.1 Psychosocial Risks in the Construction Sector: Literature Review
12.2 Material and Methods
12.2.1 Survey-Based Study
12.2.2 Data-Based Study
12.3 Results
12.3.1 Results from Questionnaire Block: Psychosocial Risks
12.3.2 Results from Questionnaire Block: Health and Consumption
12.3.3 Results from Questionnaire Block: Site Work
12.3.4 Results from the FLC Drug Addiction Study
12.3.5 Results of ESENER-2 (2014) and ESENER-3 (2019)
12.4 Discussion
12.4.1 Psychosocial Risks in Construction
12.4.2 Drug Addiction and Substance Use in Construction
12.4.3 Participation of Construction Workers
12.5 Conclusions
References
13 Real Estate Market: Smart Renaissance
13.1 Introduction
13.2 Integrated Projects
13.3 Real Estate Market Cycles
13.3.1 Real Estate Crisis in 2007–2008 and the Forecast for Another Crisis
13.3.2 New University Approaches and the Migrant Architect
13.4 Market Reinvention: Smart Renaissance
13.4.1 Applied Intelligence, ICTs, and IoT
13.4.2 The Smart City Well Understood: Innovation Applied to Health and Well-Being in Architecture
13.4.3 Case Study: Gathering of Information for Qualitative Analysis
13.5 Case Study Analysis, Results, and Discussion
13.6 Conclusions and New Research Lines
References
Recommend Papers


![Coding Architecture: Designing Toolkits, Workflows, Industry (Digital Innovations in Architecture, Engineering and Construction) [1st ed. 2024]
3031479122, 9783031479120](https://ebin.pub/img/200x200/coding-architecture-designing-toolkits-workflows-industry-digital-innovations-in-architecture-engineering-and-construction-1st-ed-2024-3031479122-9783031479120.jpg)


![Data and the Built Environment: A Practical Guide to Building a Better World Using Data (Digital Innovations in Architecture, Engineering and Construction) [2024 ed.]
3031510070, 9783031510076](https://ebin.pub/img/200x200/data-and-the-built-environment-a-practical-guide-to-building-a-better-world-using-data-digital-innovations-in-architecture-engineering-and-construction-2024nbsped-3031510070-9783031510076-u-1976757.jpg)
![Beyond Digital Representation: Advanced Experiences in AR and AI for Cultural Heritage and Innovative Design (Digital Innovations in Architecture, Engineering and Construction) [1st ed. 2024]
3031361547, 9783031361548](https://ebin.pub/img/200x200/beyond-digital-representation-advanced-experiences-in-ar-and-ai-for-cultural-heritage-and-innovative-design-digital-innovations-in-architecture-engineering-and-construction-1st-ed-2024-3031361547-9783031361548.jpg)
![Data and the Built Environment: A Practical Guide to Building a Better World Using Data (Digital Innovations in Architecture, Engineering and Construction) [2024 ed.]
3031510070, 9783031510076](https://ebin.pub/img/200x200/data-and-the-built-environment-a-practical-guide-to-building-a-better-world-using-data-digital-innovations-in-architecture-engineering-and-construction-2024nbsped-3031510070-9783031510076.jpg)


File loading please wait...
Citation preview
Digital Innovations in Architecture, Engineering and Construction
María de las Nieves González García Fernanda Rodrigues João Santos Baptista Editors
New Advances in Building Information Modeling and Engineering Management
Digital Innovations in Architecture, Engineering and Construction Series Editors Diogo Ribeiro , Department of Civil Engineering, Polytechnic Institute of Porto, Porto, Portugal M. Z. Naser, Glenn Department of Civil Engineering, Clemson University, Clemson, SC, USA Rudi Stouffs, Department of Architecture, National University of Singapore, Singapore, Singapore Marzia Bolpagni, Northumbria University, Newcastle-upon-Tyne, UK
The Architecture, Engineering and Construction (AEC) industry is experiencing an unprecedented transformation from conventional labor-intensive activities to automation using innovative digital technologies and processes. This new paradigm also requires systemic changes focused on social, economic and sustainability aspects. Within the scope of Industry 4.0, digital technologies are a key factor in interconnecting information between the physical built environment and the digital virtual ecosystem. The most advanced virtual ecosystems allow to simulate the built to enable a real-time data-driven decision-making. This Book Series promotes and expedites the dissemination of recent research, advances, and applications in the field of digital innovations in the AEC industry. Topics of interest include but are not limited to: – – – – – – – – – – – – – – –
Industrialization: digital fabrication, modularization, cobotics, lean. Material innovations: bio-inspired, nano and recycled materials. Reality capture: computer vision, photogrammetry, laser scanning, drones. Extended reality: augmented, virtual and mixed reality. Sustainability and circular building economy. Interoperability: building/city information modeling. Interactive and adaptive architecture. Computational design: data-driven, generative and performance-based design. Simulation and analysis: digital twins, virtual cities. Data analytics: artificial intelligence, machine/deep learning. Health and safety: mobile and wearable devices, QR codes, RFID. Big data: GIS, IoT, sensors, cloud computing. Smart transactions, cybersecurity, gamification, blockchain. Quality and project management, business models, legal prospective. Risk and disaster management.
María de las Nieves González García · Fernanda Rodrigues · João Santos Baptista Editors
New Advances in Building Information Modeling and Engineering Management
Editors María de las Nieves González García Escuela Técnica Superior de Edificación Universidad Politécnica de Madrid Madrid, Spain
Fernanda Rodrigues Departamento Engenharia Civil Universidade de Aveiro Aveiro, Portugal
João Santos Baptista Departamento Engenharia de Minas Universidade do Porto Porto, Portugal
ISSN 2731-7269 ISSN 2731-7277 (electronic) Digital Innovations in Architecture, Engineering and Construction ISBN 978-3-031-30246-6 ISBN 978-3-031-30247-3 (eBook) https://doi.org/10.1007/978-3-031-30247-3 © The Editor(s) (if applicable) and The Author(s), under exclusive license to Springer Nature Switzerland AG 2023 This work is subject to copyright. All rights are solely and exclusively licensed by the Publisher, whether the whole or part of the material is concerned, specifically the rights of translation, reprinting, reuse of illustrations, recitation, broadcasting, reproduction on microfilms or in any other physical way, and transmission or information storage and retrieval, electronic adaptation, computer software, or by similar or dissimilar methodology now known or hereafter developed. The use of general descriptive names, registered names, trademarks, service marks, etc. in this publication does not imply, even in the absence of a specific statement, that such names are exempt from the relevant protective laws and regulations and therefore free for general use. The publisher, the authors, and the editors are safe to assume that the advice and information in this book are believed to be true and accurate at the date of publication. Neither the publisher nor the authors or the editors give a warranty, expressed or implied, with respect to the material contained herein or for any errors or omissions that may have been made. The publisher remains neutral with regard to jurisdictional claims in published maps and institutional affiliations. This Springer imprint is published by the registered company Springer Nature Switzerland AG The registered company address is: Gewerbestrasse 11, 6330 Cham, Switzerland
Foreword
This book titled New advances in Building Information Modeling and Engineering Management results from a compilation of different contributions related to the building management within different phases of the building’s life: design, construction, use and maintenance. The different contributions reflect the strong and international recognized experience of the authors, both based on their technical, academic and research work. In different chapters, particular attention is given to the BIM technology, digitization and augmented reality in different problems and applications of the construction sector. The benefits of using the BIM methodology in the support to the state characterization and conservation of buildings during their life cycle are discussed. BIM modelling of heritage buildings (HBIM), the use of drones for the photogrammetry and thermography survey of buildings to characterize their envelope, to develop energy analysis and in the support to buildings maintenance, among other issues, are discussed. Blockchain technology is also examined, associated with BIM. The evolution of those technologies within the construction industry is deeply discussed based on case studies. Two chapters are focused on occupational hazards. One deals with the adaptation of a risk assessment method, which is calibrated based on its application to three projects developed namely in Portugal, Brazil and Spain. The other chapter deals with risks associated to psychosocial aspects within the construction sector, through the analysis of different surveys. The stress level of workers and other causes related with the work accidents is pointed out as a major concern. Another chapter presents open-access tools and discuss their application for the critical path problems arising in planification theory. The last chapter deals with aspects related to the constant changes and to the fluctuating and cyclical developments within the real state market, which has induced architecture professionals as well as professors to create new teaching methods and ways of working in multidisciplinary teams, together with the adoption of application of different artificial intelligence tools.
v
vi
Foreword
Many case studies are presented and discussed in support to the concepts exposed. I am sure that readers from industry and academia, as well as students, will benefit and learn much from the different contributions included in this book. Humberto Varum Full Professor CONSTRUCT-LESE Faculty of Engineering University of Porto Porto, Portugal
Contents
1
2
3
4
5
6
7
Maintenance Management of Existing Building Supported on BIM . . . . . . . . . . . . . . . . . . . . . . . . . . . . . . . . . . . . . . . . . . . . R. Matos, H. Rodrigues, E. Tavares, A. Costa, A. D. Alves, and Fernanda Rodrigues Extending Access to BIM Information: Merging Augmented Reality Interfaces and Semantic Enrichment . . . . . . . . . . . . . . . . . . . . . F. M. Dinis, J. Poças Martins, B. Rangel, A. S. Guimarães, and A. Soeiro A Review on the Digitalization of On-Site Production Management—Case Study in a Portuguese Construction Company . . . . . . . . . . . . . . . . . . . . . . . . . . . . . . . . . . . . . . . . . . . . . . . . . . . . . Luís Jacques de Sousa, Miguel Chichorro Gonçalves, and J. Poças Martins Historic Building Information Modeling (HBIM) and Common Data Environment: The Case Study of Palazzo Vitelli in San Giacomo in Città di Castello . . . . . . . . . . . . . . . . . . . . . . . F. Bianconi, M. Filippucci, S. Battaglini, and F. Cappilli
1
17
31
49
A Workflow for Photogrammetric and Thermographic Surveys of Buildings with Drones . . . . . . . . . . . . . . . . . . . . . . . . . . . . . . . D. F. R. Parracho, J. Poças Martins, and E. Barreira
77
Digital Asset Production Using Lean Design Management: A Conceptual Framework . . . . . . . . . . . . . . . . . . . . . . . . . . . . . . . . . . . . . . M. Karaz and J. C. Teixeira
97
Risk Assessment Comparative Analysis by the Method “Level of Preventive Action” in Three Case Studies . . . . . . . . . . . . . . . 113 L. C. Pentelhão, João Santos Baptista, A. J. Carpio, and María de las Nieves González García
vii
viii
Contents
8
An Open-Source Built Heritage Management Tool for Inner Areas . . . . . . . . . . . . . . . . . . . . . . . . . . . . . . . . . . . . . . . . . . . . . . . . . . . 137 M. Merola
9
The Role of Blockchain Technology in the Future of Construction . . . . . . . . . . . . . . . . . . . . . . . . . . . . . . . . . . . . . . . . . . . . . . . 153 A. H. Javaheri Khah and M. Valiente López
10 Trustless Construction Project Information Exchanging Using Hyperledger Blockchain . . . . . . . . . . . . . . . . . . . . . . . . . . . . . . . . . 167 M. Darabseh and J. Poças Martins 11 Open-Access Software Implementation for Critical Path Problems Arising in Planification Theory . . . . . . . . . . . . . . . . . . . . . . . . 181 Elena Martin Porta, Álvaro P. Raposo, and José A. Capitán 12 Spanish Construction Emerging Risks About Health and Psychosocial Risk . . . . . . . . . . . . . . . . . . . . . . . . . . . . . . . . . . . . . . . . . 199 Á. Romero Barriuso, B. M. Villena Escribano, María de las Nieves González García, and M. Segarra Cañamares 13 Real Estate Market: Smart Renaissance . . . . . . . . . . . . . . . . . . . . . . . . . 215 G. Cantarero-García, F. I. Gordejuela, and C. P. Gutiérrez
Chapter 1
Maintenance Management of Existing Building Supported on BIM R. Matos , H. Rodrigues , E. Tavares, A. Costa , A. D. Alves , and Fernanda Rodrigues
Abstract The management of building maintenance has changed significantly since the advent of Building Information Modelling (BIM) in architecture, engineering, construction, and operations. However, developing and managing predictive maintenance plans that rely on software remains a difficult and time-consuming task. Therefore, the objective of this work is to demonstrate the advantages of the BIM method for maintaining the condition of buildings during their life cycle. To this end, the methodology developed aims to implement the BIM method in maintenance management by exploring the interoperability between the Revit software and the Excel database, which allows the synchronisation of preventive maintenance plans between these two platforms. The methodology developed and applied to a case study consists of modelling the case study in Revit and introducing the corresponding parametric information. Then, Table 13 of the Omniclass standard was applied, which classifies spaces according to their use. Then, a maintenance plan was developed for some elements of the case study. Finally, a bidirectional interaction between Revit and Excel was established through a Dynamo routine for Revit and through a commercial add-in. This work demonstrates a method to avoid fragmentation of information during the life cycle of a building. This allows for efficient R. Matos (B) · H. Rodrigues · E. Tavares · A. Costa · A. D. Alves · F. Rodrigues RISCO—Research Center for Risks and Sustainability in Construction, Civil Engineering Department, University of Aveiro, Campus Universitário de Santiago, 3810-193 Aveiro, Portugal e-mail: [email protected] H. Rodrigues e-mail: [email protected] E. Tavares e-mail: [email protected] A. Costa e-mail: [email protected] A. D. Alves e-mail: [email protected] F. Rodrigues e-mail: [email protected] © The Author(s), under exclusive license to Springer Nature Switzerland AG 2023 M. N. González García et al. (eds.), New Advances in Building Information Modeling and Engineering Management, Digital Innovations in Architecture, Engineering and Construction, https://doi.org/10.1007/978-3-031-30247-3_1
1
2
R. Matos et al.
management and thus cost reduction in future interventions. This work summarises all building information in a unified model and aims to develop a methodology that can be applied to other building typologies. Keywords Building information modelling · Maintenance management · Preventive maintenance · Modelling · Maintenance plans · Facility management
1.1 Introduction In recent years, the Portuguese government has been concerned about the progressive deterioration of buildings in urban areas. To this end, the Portuguese government, together with the European Union, has proposed several initiatives to promote building rehabilitation, such as “Reabilitar como Regra” in 2017 [1] and the programme “Instrumento Financeiro para a Reabilitação e Revitalização Urbanas” in 2020 [2]. In addition, some programmes such as “Casa Eficiente” [3] and “Programa de Apoio a Edifícios mais Sustentáveis” [4] have been launched to promote sustainable rehabilitation. Europe has also proposed the programme “A renovation Wave for Europe – Greening our buildings, creating jobs, improving lives” to achieve the goals of the European Green Deal soon [5, 6]. This programme aims to fight energy poverty, renovate public buildings and contribute to decarbonization and integration of renewable energy. However, the deterioration process of buildings starts as soon as the construction or renovation is completed, and it has accelerated due to climate change [7]. Therefore, the building needs an efficient and effective maintenance plan. However, maintenance management of existing buildings remains a major challenge but an essential task to keep the performance of buildings and their components at the level for which they were designed [8]. The development of maintenance mechanisms that save resources and avoid conflicting, scattered actions is imperative [9, 10]. Therefore, an efficient Facility Management (FM) strategy should include preventive maintenance plans that include activities, their periodicity, and costs [11]. This process can take advantage of a collaborative methodology, advanced processes and simulations provided by the BIM methodology. Thus, the main objective of this work is to develop a methodology for maintenance management based on BIM. For this purpose, the data from the preventive maintenance plans were inserted into the 3D model developed in Revit software and then the bidirectional interoperability between Revit and Excel was tested using two tools. The first consists of creating a Dynamo routine to establish the bidirectional connection between Revit and Excel. The second tool uses the SheetLink add-in from Diroots to perform this synchronization. A comparison between the methods used is presented. The novelty of this work is that it develops a comprehensive methodology to support building management, focusing on preventive maintenance. It integrates maintenance schedules into Revit software and makes them accessible to BIM users
1 Maintenance Management of Existing Building Supported on BIM
3
and non-users as Revit and Excel are synchronized, allowing for more accessible, organized and efficient building management. This work is significant because it allows quick and easy access to all maintenance information, as well as quick and easy insertion of new elements during the use phase. This methodology also makes it possible to collect and share all the information about the building throughout its life cycle.
1.1.1 BIM Role in FM According to ISO 41011:2017 [12], FM is an “organizational function which integrates people, place and process within the built environment to improve the quality of the life of people and the productivity of the core business.” An effective FM strategy requires professionals with multiple roles and with broad and diverse skills and knowledge. Maintenance management is one of the roles of FM. In this area, facility managers can respond to current emergencies (reactive maintenance) or avoid them by planning preventive measures. The latter strategy saves time and ensures better use of human and financial resources [13]. However, the lack of integration of this information makes it impossible for managers to make optimal maintenance management decisions. Therefore, BIM as a collaborative way of working is the key to optimising the FM strategy. According to ISO 29481-1:2014 [14] and BS EN ISO 19650-1:2018 [15], BIM is a collaborative digital representation of the physical and functional properties of structures (including buildings, bridges, roads, process plants, etc.) to facilitate design, construction, and operation processes and provide a reliable basis for decision making. It enables the representation of a building by smart objects to obtain detailed information about them and even understand their relationship with other objects in the building model. It can facilitate multidisciplinary coordination, collect information, and provide access to information that can be used to support facility management and building operations [16, 17]. Despite the growing interest in managing building data with BIM, there are still some difficulties in data exchange and interoperability that limit the implementation of BIM in FM [18–20, 25]. To address this problem in the BIM-FM, some studies were developed [9]. Developed a management system to support the maintenance and preservation of existing buildings. In this study, an API was developed to allow data exchange between a web application and the model BIM. It allows permanent access to the parametric data of the model and other building documents (drawings, reports and specifications). Also [17] contributes to the improvement of BIM-FM in which a methodology for the integration of BIM, Building Performance Assessment and FM systems was developed. In this study, the authors established a link between the existing FM systems and the BIM model through a conditional logic in Dynamo for the management of environmental systems in hospital operating rooms. Other recent and relevant studies on the optimization of BIM-FM were conducted by [21–23].
4
R. Matos et al.
The use of Revit to perform these studies are a common denominator. This platform is a BIM software that provides a multidisciplinary and collaborative approach to the design and construction process. To add additional functionality for importing/exporting data parameters from Revit to Excel, the Dynamo tool can be used as an add-in to extend Revit’s parametric functions, information retrieval, and documentation when producing O&M results in the format desired by the end user [24–26]. In addition, Revit software has several add-ins, such as SheetLink, which allows synchronization of model data between Revit and Excel spreadsheets [27]. In this study, the two methodologies are applied and compared. For this purpose, the methodology is presented in the next chapter.
1.2 Methodology In this work, a methodology was developed and applied to a case study, which is presented below: 1. The analysis of information and facilities related to a case study (the prefabricated structure was highlighted due to the growing interest in its application). 2. The modelling of the case study building in Revit software. 3. The introduction of the parametric information in the respective building elements. 4. The application of Table 13 of the Omniclass standard in Revit. 5. The development of the preventive maintenance plan for some building elements. 6. The development of a Dynamo routine to establish a bidirectional interaction between Revit and Excel. 7. The testing of the SheetLink to establish a bidirectional interaction between Revit and Excel. 8. The conclusions and comparison between the interoperability tools.
1.2.1 Case Study The purpose of the methodology applied to a case study is to validate it for its future implementation. The building under study is the Civil Engineering Department of the University of Aveiro in Aveiro, in mainland Portugal, built in 2004. The building was designed for academic educational purposes and includes research offices, classrooms and laboratories. The building has a floor area of approximately 1613 m2 and four floors, one underground and three above ground level, including the second floor. Its main facade faces northeast.
1 Maintenance Management of Existing Building Supported on BIM
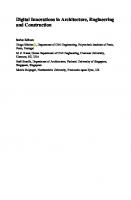
5
Fig. 1.1 Revit model of the Civil Engineering Department of Aveiro’s University
The roof of this building is covered with metal roof tiles on which the mechanical equipment is placed. The rainwater drainage system consists of galvanized zinc gutters and downspouts made of PVC-U. As for the interior of the building, the floors on the ground floor are exposed concrete, vinyl in the classrooms and cork mosaic in the professors’ offices (on the second floor). On the 1st and 2nd floors, the ceilings are mainly covered with plasterboard painted with plastic paint in exposed concrete. The exterior doors and windows are made of metal profiles with tilting mechanisms for the windows. Figure 1.1 shows a three-dimensional model of the civil engineering office developed in Revit [11, 26]. Prefabricated structural roll in the case study. Structural foundations consist of reinforced concrete piles. Prefabricated steel elements form most of the building structure (columns and beams). The floor system of the building consists of alveolar precast reinforced concrete slabs, which are later supplemented by a concrete layer (Fig. 1.2). Prefabrication of assemblies is increasingly used in the construction industry as it allows more work to be completed in less time and reduces rework, which means meeting deadlines, quality and budgets [28]. The prefabricated slab not only has these advantages, but also contributes to a more sustainable construction. Nevertheless, BIM is proposed by [29] to accelerate the implementation of efficient precast construction. Due to the environmental component involved in this work, the Revit 3D model includes the precast slab. Moreover, the modelling of this element in Revit contains the parameterized information to identify it as a precast element.
6
R. Matos et al.
Fig. 1.2 a Building prefabricated structure, b Detail of prefabricated precast-slabs
1.2.2 Introduction of the Parametric Information in the BIM Model Parametric information was introduced into the building elements through shared parameters. In Revit, the shared parameters are parameters associated with different object families with different types of information [26, 8], namely the data related to the constructive elements and their maintenance activities. In addition, the application of Table 13 of Omniclass in Revit Model consists in assigning a default classification to the spaces according to their purpose. This is very useful, since it is possible to determine the need for maintenance elements depending on the space in which they are inserted.
1 Maintenance Management of Existing Building Supported on BIM
7
Fig. 1.3 Layout developed for preventive maintenance plans [11]
1.2.3 Development of the Preventive Maintenance Plan for Some Building Elements For existing buildings, an assessment of the building’s condition is essential in order to prepare appropriate maintenance plans for each individual case. For this reason, the preparation of preventive maintenance plans is preceded by a diagnostic inspection of the condition of the building maintenance [11]. The preventive maintenance plan includes the maintenance actions for each element during the life cycle of the building. In this paper, a part of the preventive maintenance plan for windows is presented as an example. Figure 1.3 shows the layout of the maintenance plan for the case study. The maintenance plan consists of a series of columns that include the element to be maintained, the name of each element, the location, the maintenance action to be applied, the date of the action, the frequency, and the cost of the action. Then, the preventive maintenance data were inserted into the 3D model using shared parameters, as shown in Fig. 1.4. After creating the shared parameters, the maintenance information is associated with each object.
1.2.4 Obtaining the Information from the Parametric Model Dynamo Routine Development. BIM is a collaborative methodology whose main feature is interoperability between different programs. This is a great advantage as it allows for a more organized database where all information is consolidated, although interoperability between programs still presents some challenges. As for interoperability between Excel and Revit, there are two ways to automatically synchronize the data. This article covers both methods as follows. In Revit version 2019, this synchronization was done using Visual Programming. Dynamo is an add-in to extend Revit’s parametric functions, information retrieval, and documentation to create operations and maintenance documents in the format required by the end user [24, 25].
8
R. Matos et al.
Fig. 1.4 Shared parameters created in Revit for preventive maintenance
In addition, the Bumblebee package was used in conjunction with Dynamo. Bumblebee is an open-source project developed by Konrad K. Sobon and is an interoperable Excel extension for Dynamo [30]. An example of an algorithm created in visual programming can be seen in Fig. 1.5, which show the visual program part developed on the Dynamo software interface BIM. When the information from the Revit 3D model is exported, the result is the Excel data sheet shown in Fig. 1.6. This sheet shows the maintenance dates and the interventions that have already expired, highlighted in red. The date of the interventions that will soon expire is highlighted in yellow. To enable the bidirectional connection between Revit and Excel, another visual programming algorithm must be executed to import from the Excel file into Revit (Figs. 1.7 and 1.8). For this purpose, the commands File Path, File from path, Data.ImportExcel are used. Visual programming is a time-consuming task. This programming can be extensive and requires the creation of schedules in Revit.
1 Maintenance Management of Existing Building Supported on BIM
Fig. 1.5 Global perspective of the visual programming to data exportation from Revit to Excel
Fig. 1.6 Excerpt from the window maintenance plan exported from Revit
9
10
R. Matos et al.
Fig. 1.7 Global perspective of the visual programming to data importation from Excel to Revit
Fig. 1.8 Part of the visual programming in Dynamo for the data importation from Excel to Revit
The next subsection introduces the use of the SheetLink add-in to establish the bidirectional connection between Revit and Excel and compares it to the previous method. Bidirectional interaction between Revit and Excel via SheetLink. In Revit version 2022, there is already an add-in developed by Diroots called SheetLink that connects to this software. This add-in allows bidirectional export and import of data between the Revit model and the Excel file [27]. The interface of SheetLink is very intuitive and easy to use (Fig. 1.9). All parameters created and assigned to the different objects can be extracted. It has import and export options that allow easy
1 Maintenance Management of Existing Building Supported on BIM
11
Fig. 1.9 SheetLink layout and selection of the parameters to extract from Revit
synchronisation between Revit and Excel through structured and organised Excel files. Any change is always updated on both platforms. When the information from the Revit 3D model using SheetLink is exported, the result is the Excel data sheet shown in Fig. 1.10. Figure 1.10 shows the Excel data sheet where the information is organized and can be modified for re-import into Revit 2022. SheetLink makes the synchronization process more efficient and easier without having to edit the sheet information after exporting.
1.3 Conclusions Preventive maintenance is still an underappreciated discipline in architecture, engineering, construction and operations. However, without a maintenance plan, it is not possible to efficiently manage a building to keep it fit for the purpose for which it was designed. The BIM methodology collects all the information about the life cycle of a building on one platform, allows continuous updating of information, reduces fragmentation of information and the associated investment in data collection. It is a multidisciplinary, collaborative methodology where different stakeholders can benefit from the digitally shared information through interoperability between platforms. In addition, the BIM methodology promotes the use of more technological and sustainable materials, such as prefabricated materials. The implementation of these materials can be parameterized and promoted through the use of BIM. This
Fig. 1.10 Output of SheetLink in Excel database
12 R. Matos et al.
1 Maintenance Management of Existing Building Supported on BIM
13
methodology allows for a collaborative way of working that reduces rework and allows for a better use of time, personnel and materials. Thus, this work presents a methodology for maintenance management supported by BIM and the benefits of this interaction. In this work, the introduction of the different parameters related to the maintenance plans in the different BIM objects has been presented. Then, for a more efficient and accessible information management for BIM users and non-users, the bidirectional connection between Revit and Excel is presented through two methods: 1—development of a Dynamo routine 2—use of the SheetLink—Revit add-in developed by Diroots. The use of these two methods allows a comparison. The first method uses a dynamo routine, which can be time consuming and results in large programming routines that can sometimes cause an error. It requires the creation of a schedule in Revit, which is then exported. Also, in some cases, the information exported from Revit by a Dynamo routine may need to be edited. This method depends on the compatibility between the Bumblebee package, Dynamo and Revit versions. On the other hand, it is a more customized method that allows adding more commands. The second method uses an add-in called SheetLink. SheetLink is a free add-in that is compatible with Revit versions from 2018. It has a very intuitive user interface that allows you to export and import all data associated with objects from BIM. You do not need to create plans in Revit before you can extract the information. The extracted data is organized and does not need to be manipulated. The process is more automated and faster than the Dynamo routine used for this work. Maintenance plans collect a lot of building data, for which the BIM methodology adds value by simplifying the management process between all stakeholders. The development of a 3D parametric model is more complete and faster because detailed object libraries are available. The study of the bidirectional interaction between the programs Revit, Dynamo and Excel shows that they are tools that allow editing, exporting and importing data and allow their constant updating. This work shows that the data can be obtained, edited and extracted in Revit or Excel and that it is enough to update the routine or add-in to be available in both platforms. Moreover, it is always possible to add more parameters to the model and export the corresponding data. The methodology has been developed for the maintenance management of existing buildings, but it can also be applied to the future maintenance of new buildings. This work is reproducible for any building typology, as well as for facilities that require more specific and detailed maintenance activities. Thus, by exploring the possibilities of BIM throughout the life cycle of a building, it is possible to extend the life of the building and reduce life cycle costs. It also contributes to the sustainability of the building and provides safe and reliable building services to all occupants. The following research is about managing all this maintenance data through business intelligence platforms.
14
R. Matos et al.
Acknowledgements This research was partially funded by the Portuguese Government through the FCT (Foundation for Science and Technology) and the European Social Fund under the PhD grant SFRH/BD/147532/2019 awarded to the first author. This work was supported by the Foundation for Science and Technology (FCT)—Aveiro Research Centre for Risks and Sustainability in Construction (RISCO), Universidade de Aveiro, Portugal [FCT/UIDB/ECI/04450/2020]. This work was funded by: Project PTDC/ECI-EST/28439/2017—POCI-01-0145-FEDER028439—financed by the European Regional Development Fund (ERDF) through the Operational Programme COMPETE2020—Competitiveness and Internationalisation and with financial support from FCT/MCTES through national funds (PIDDAC).
References 1. República Portuguesa (2017) Resolução do Conselho de Ministros n.o 170/2017. Diário da República n.º 216/2017, Série I de 2017-11-09, p 5972 2. European Union (2020) European construction sector observatory—financial instrument for urban rehabilitation and revitalization, pp 1–38 3. República Portuguesa (2020) Casa Eficiente 2020: Regulamento 4. República Portuguesa (2021) Law n. 6070-A/2021—Regulations for the attribution of incentives of the 2nd phase of the Support Programme for More Sustainable Buildings. Diário da República 5. European Commission (2020) Renovation wave—The European Green Deal, no. October, 2020. https://doi.org/10.2833/797135 6. European Commission (2020) A renovation wave for Europe—greening our buildings, creating jobs, improving lives—COM (2020) 662 final 7. Barrelas J, Ren Q, Pereira C (2021) Implications of climate change in the implementation of maintenance planning and use of building inspection systems. J Build Eng 40:102777. https:// doi.org/10.1016/j.jobe.2021.102777 8. Rodrigues F, Matos R, Alves A, Ribeirinho P, Rodrigues H (2018) Building life cycle applied to refurbishment of a traditional building from Oporto, Portugal. J Buil Eng 17:84–95. https:// doi.org/10.1016/j.jobe.2018.01.010 9. Rodrigues F, Teixeira J, Matos R, Rodrigues H (2019) Development of a web application for historical building management through BIM technology. Adv Civ Eng 2019:9872736. https:// doi.org/10.1155/2019/9872736 10. Benítez P, Rodrigues F, Talukdar S, Gavilán S, Varum H, Spacone E (2018) Analysis of correlation between real degradation data and a carbonation model for concrete structures. Cement Concrete Comp 95:247–259. https://doi.org/10.1016/j.cemconcomp.2018.09.019 11. Tavares E (2019) Gestão do Património Edificado com Recurso ao BIM. Master thesis, University of Aveiro, Aveiro, Portugal 12. International Organization for Standardization (2017) ISO 41011:2017(en), Facility management—vocabulary, p 6 13. Klammt (2004) Financial management for facility managers. Facility Design and Management Handbook, no. 5 14. International Organization for Standardization (2014) ISO 29481–1:2014—Building information models—information delivery Manual—Part1: methodology and format 15. BS EN ISO 19650-1:2018, Organization and digitization of information about buildings and civil engineering works, including building information modelling (BIM)—Information management using building information modelling, pp 1–46 16. Motawa I, Almarshad A (2013) A knowledge-based BIM system for building maintenance. Automat Constr 29:173–182. https://doi.org/10.1016/j.autcon.2012.09.008
1 Maintenance Management of Existing Building Supported on BIM
15
17. Marmo R, Nicolella M, Polverino F, Tibaut A (2019) A methodology for a performance information model to support facility management. Sustainability-Basel 11(24):7007. https://doi. org/10.3390/su11247007 18. Becerik-gerber B, Asce AM, Jazizadeh F, Li N, Calis G (2012) Application areas and data requirements for BIM-enabled facilities management. J Constr Eng M 138(3). https://doi.org/ 10.1061/(ASCE)CO.1943-7862.0000433 19. Kassem M, Kelly G, Dawood N, Serginson M, Lockley S (2015) BIM in facilities management applications: a case study of a large university complex. Built Environ Proj Asset Manage 5(3):261–277. https://doi.org/10.1108/BEPAM-02-2014-0011 20. Matarneh ST, Danso-Amoako M, Al-Bizri S, Gaterell M, Matarneh R (2019) Building information modeling for facilities management: a literature review and future research directions. J Build Eng 24:100755. https://doi.org/10.1016/j.jobe.2019.100755 21. Heaton J, Parlikad AK (2019) Schooling J (2019) Design and development of BIM models to support operations and maintenance. Comput Ind 111:172–186. https://doi.org/10.1016/j.com pind.2019.08.001 22. Cecconi FR, Moretti N, Maltese S, Tabliabue LC (2019) A BIM-based decision support system for building maintenance. In: Mutis I, Hartmann T (eds) Advances in informatics and computing in civil and construction engineering. Springer, Cham, pp 371–378. https://doi.org/10.1007/ 978-3-030-00220-6_44 23. Bortolini R, Forcada N, Macarulla M (2016) BIM for the integration of building maintenance management—a case study of a university campus. In: Scherer R (ed) eWork and eBusiness in architecture, engineering and construction. Taylor & Francis Group 24. Autodesk Dynamo (2020) What is Dynamo? https://primer.dynamobim.org/01_Introduction/ 1-2_what_is_dynamo.html 25. Sadeghi M, Elliott JW, Porro N, Strong K (2019) Developing building information models (BIM) for building handover, operation and maintenance. J Facil Manag 17(3):301–316. https:// doi.org/10.1108/JFM-04-2018-0029 26. Matos R, Rodrigues F, Rodrigues H, Costa A (2021) Building condition assessment supported by building information modelling. J Build Eng 38:102186. https://doi.org/10.1016/j.jobe. 2021.102186 27. DiRoots (2021) Sheetlink|Excel Import/Export, p 2021 28. Sharif SA, Hammad A (2018) Simulation-based multi-objective optimization of institutional building renovation considering energy consumption, life-cycle cost and life cycle assessment. J Build Eng 21:429–445. https://doi.org/10.1016/j.jobe.2018.11.006 29. Chen C, Tang LCM, Jin Y (2019) Development of 5D bim-based management system for pre-fabricated construction in China. In: International conference on smart infrastructure and construction 2019 (ICSIC): driving data-informed decision-making, pp 215–224. https://doi. org/10.1680/icsic.64669.215 30. Sobon K (2016) Bumblebee and Bumblebee Primer. https://konradsobon.gitbooks.io/bumble bee-primer/content/
Chapter 2
Extending Access to BIM Information: Merging Augmented Reality Interfaces and Semantic Enrichment F. M. Dinis , J. Poças Martins , B. Rangel , A. S. Guimarães , and A. Soeiro Abstract The potential of combining Building Information Modeling (BIM) and Augmented Reality (AR) has proven beneficial in various Architecture, Engineering, Construction and Operations (AECO) sectors. Despite the gradual adoption of BIM, there is a need for integrative and coordinated interfaces that can leverage the different academic backgrounds, profiles, and tacit knowledge of stakeholders in the AECO sector. As one of the most important research areas related to BIM, AR provides the necessary functionality to improve access to BIM information. This paper describes the early development phases of a BIM-based AR interface for semantic enrichment of BIM models for the HoloLens head-mounted display (HMD). Specifically, the interface provides more natural access to BIM information, even for users with no prior experience or knowledge of BIM tools. Initial lab tests have been conducted to evaluate the feasibility of using voice and gesture interactions to link semantic data to physical objects, which are then transformed into BIM information.
F. M. Dinis (B) · J. Poças Martins · B. Rangel · A. Soeiro CONSTRUCT-GEQUALTEC, Faculty of Engineering (FEUP), Department of Civil Engineering (DEC), University of Porto, Rua Dr. Roberto Frias s/n 4200-465, Porto, Portugal e-mail: [email protected] J. Poças Martins e-mail: [email protected] B. Rangel e-mail: [email protected] A. Soeiro e-mail: [email protected] A. S. Guimarães CONSTRUCT-LFC, Faculty of Engineering (FEUP), Department of Civil Engineering (DEC), University of Porto, Rua Dr. Roberto Frias s/n 4200-465, Porto, Portugal e-mail: [email protected] J. Poças Martins BUILT CoLAB-Collaborative Laboratory for the Future Built Environment, Rua do Campo Alegre, 760, 4150-003 Porto, Portugal © The Author(s), under exclusive license to Springer Nature Switzerland AG 2023 M. N. González García et al. (eds.), New Advances in Building Information Modeling and Engineering Management, Digital Innovations in Architecture, Engineering and Construction, https://doi.org/10.1007/978-3-031-30247-3_2
17
18
F. M. Dinis et al.
Keywords Building Information Modeling · Natural User Interfaces · Integrated projects · Virtual Reality · Augmented Reality
2.1 Introduction 2.1.1 On the Exchange of BIM Data The multidisciplinary and dispersed nature of the Architecture, Engineering, Construction, and Operations (AECO) sector and its projects [1] increases the complexity of interaction between information maintenance systems (see also Laudon and Laudon [2]). Construction projects involve different teams and project stakeholders (e.g., managers, technicians, operations staff, and customers/end users), and Building Information Modeling (BIM) information is exchanged at different stages (i.e., design [i], construction [ii], and operation and maintenance [iii] Figure 2.1). As part of the information system and data management technology for construction projects, BIM plays a special role among the various user interfaces [3]. Figure 2.1 shows the stakeholders of a construction project and the corresponding interfaces where BIM can perform various tasks according to Kerosuo et al. [4]. In addition, a larger grey area has been added for engineers to represent their current role as modellers, which was taken over by drafters in a not-too-distant past. This image is based on an adaptation by Dinis et al. [5], which was originally based on Laudon and Laudon [2] and Poças Martins [6].
Fig. 2.1 Agents, their interactions and BIM uses at construction project interfaces (Adapted from Dinis et al. [5])
2 Extending Access to BIM Information: Merging Augmented Reality …
19
Achieving fully integrated BIM processes requires well-trained AECO professionals, but they typically occupy a relatively small position in the pyramid— operations personnel [4]. Comprehensive BIM-based collaboration between stakeholders, workers, and team members is still scarce; therefore, adaptive and supportive technological developments should fill this identified gap [4]. In this study, the term “permeability” of BIM is used instead of diffusion or even adoption to define the bidirectional exchange of BIM information between actors at different levels of the pyramid (Fig. 2.1). Thus, BIM permeability refers more to the idea of transfer, a theoretical overcoming of hierarchical barriers, expertise, and knowledge within teams. Concepts such as implementation and adoption could lead to a broader understanding of how an organization adopts BIM or even influence understanding of how it spreads to other organizations. Permeability is closely related to Fig. 2.1 and the concept of multiple interfaces, with BIM playing an individual role. In addition, permeability relates to the idea of data use and dissemination, sometimes in both directions, across levels of the work hierarchy, and must be appropriate for the tasks and context at hand.
2.1.2 Integrated Projects The complexity of construction and the sheer number of teams and disciplines involved from the design to the operations phase lead to an overwhelming need for effective communication and integration strategies as numerous stakeholders are actively involved in project development [1]. Backman [7] points out that the design and subsequent realization of a building rely on continuous critical input from the various disciplines, resulting in a network of decisions supported by information. However, the diversity of today’s requirements relies on a number of systems that often do not communicate with each other. Articulation of information and data communication between teams and stakeholders is key to a more effective response. Integration as a working method for disciplinary communication between stakeholders in the project development and construction process should involve all stakeholders, from the designers, the owner (or his representative), the managers, to the future end users and the craftsmen—an “integrated vision of the building by all disciplines, the Integrated Project” [8]. According to the provisions for the implementation of integrated projects in the Sixth Framework Programme of the European Union [9], integrated projects “comprise a coherent set of component parts, often in the form of sub-projects implemented in close coordination, which may vary in size and structure according to the tasks to be carried out, each dealing with different aspects of the overall project implementation plan needed to achieve its agreed objectives”. This document highlights the importance of integrated projects and describes their integration in a number of forms: Vertical Integration (main actors, including users), Horizontal Integration (related to multidisciplinary activities), Activity Integration (inclusion of research activities),
20
F. M. Dinis et al.
Sectoral Integration (private and public sectors, especially between academia and industry), and Financial Integration (public and private funding). The vision of an integrated project gains importance in the search for more democratic interfaces for the permeability of BIM between AECO sector actors. The clear goal of enabling more actors to access the tools and information used in BIM projects requires the optimization of decision making and streamlined sharing of multidisciplinary knowledge and information as part of an integrated delivery approach. However, similar to other relevant industry segments, the AECO industry is facing more competitive and complex projects [10, 11] with increasingly shorter budgets and deadlines, as well as high quality assurance and monitoring requirements, resulting in additional costs and burdens. In addition, the AECO industry is known for its low productivity [12], which may mean that digitization represents an opportunity for the industry to achieve higher performance and accuracy in processes, minimize costs, and streamline production. The implementation of BIM as a paradigm shift for industry [13, 14] inevitably brings conflicts with more traditional and sectoral approaches. Industry professionals and many stakeholders still lack knowledge to fully exploit the technologies and methods of BIM, e.g., in the operational phase [4] or in real-time communication between project teams [15].
2.1.3 Natural User Interfaces Natural User Interfaces (NUIs) can be defined as a set of processes and/or devices that enable a similar level of performance as an experienced user, but require as little time and effort as possible [16]. NUIs enable a sense of near-instantaneous competence based on previously acquired skills and by reducing the cognitive load on users [17]. Interactions should be direct enough to seem natural to users. Consideration of the context and needs of the end users for whom user interfaces are being developed is critical to a natural interaction and experience. Wigdor and Wixon [16] point out that some of the fundamental aspects of NUIs, more than the technological inputs and outputs, are the experiences provided, the actual adaptation to the users’ needs, tasks, and context of use. Moreover, the term “natural” is closely related to the design goal that a person should appear or feel “natural” when using the interface according to their innate abilities [16]. Even within AECO, which is known for its actors’ resistance to moving away from traditional ways of working [18], NUI research has revealed new ways of democratizing practice and access to technology that take into account the diversity of user profiles and knowledge backgrounds. Head-mounted displays (HMDs) (e.g. HoloLens [19], HTC VIVE [20], Oculus Quest 2 [21]), motion and gesture tracking devices (e.g., Project Kinect for Azure [22], Leap Motion [23], Myo [24]), pen-based, touch and multi-touch recognition on handheld devices, and speech recognition (e.g., Microsoft’s Cortana [25], Apple’s Siri [26]) comprise the myriad solutions within NUIs [27].
2 Extending Access to BIM Information: Merging Augmented Reality …
21
However, the (at first glance) expected convenience of speech recognition or touch as an example does not always match the work context or skill level of the user. Construction sites, for example, are complex, noisy, and hazardous environments where voice commands may not be appropriate. Conversely, an HMD-based interface combined with gesture tracking interactions can free the user from holding the device in their hand and paying excessive attention to it, and is therefore more appropriate.
2.1.4 Increasing Accessibility to BIM: Natural BIM Interfaces Ku and Mahabaleshwarkar [28] emphasise the benefits of virtual environments for accessing BIM in construction education and introduce the idea of Building Interactive Modelling (BIM). Similarly, although in a broader scope, this work implements the concept of a Natural BIM Interface (NBI), originally presented by Dinis et al. [5]. NBI is about integrating BIM into a framework to provide instant expertise and direct access to project information. More broadly, NBIs encompass a set of processes and devices that provide access to BIM by reusing actions that are common in other contexts and maximizing the performance/effort ratio. BIM Authoring tools are systems that are designed for specific tasks, usually have many features, and are not intended for short-term, everyday use. Therefore, these tools are designed for longevity and often require a long learning curve [18]. In addition, some tools from BIM are associated with a higher cognitive load, which makes them unsuitable for use by a large number of stakeholders in construction project teams. NBIs aim to increase the permeability of construction information through BIM and are therefore adapted to the different levels and requirements of AECO teams. Therefore, information sharing between teams, stakeholders, and other functional levels is done through “boundary objects” [29], in this particular case NBIs adapted to different tasks, environments, and end-user requirements. Boundary objects have different meanings in different domains, but represent entities with a common structure to different users [29]. They provide enough flexibility to adapt to end-user needs and backgrounds and become important tools for information access and collaboration [30]. Based on Dinis et al. [5], Fig. 2.2 shows an overview of possible NBI-based communication and interaction between construction project teams around the notion of boundary objects (see also Taylor [31]). According to the purpose of Article 22(4) of Directive 2014/EU [32], which states that: “For public works contracts and design contests, Member States may require the use of specific electronic tools, such as of building information electronic modelling tools or similar. (…)”, public procurement is encouraged to use solutions such as BIM. The recent adoption of an international standard for BIM (ISO 19650-1:2018 [33]) on information management in the project life cycle raises the pervasive notion
22
F. M. Dinis et al.
Fig. 2.2 Users’ interactions with a Boundary Object (NBI) (Adapted from Dinis et al. [5])
of a paradigm shift and the consequent need for adaptation. Indeed, BIM is already a requirement for public procurement in countries such as Norway, Denmark, Finland, South Korea, Singapore, the United States, and the United Kingdom [34]. In addition, there have been several initiatives by governments and industry in recent years [12]: UK—UK BIM Task Group; Brazil—Comité Estratégico de Implementação do Building Information Modelling—CE-BIM; France—Plan Transition Numérique dans le Bâtiment (PTNB); Spain—EsBIM; Portugal—Comissão Técnica de Normalização BIM, CT 197; Germany—planen-bauen 4.0 (2020). AECO companies are now faced with the opportunity to take the leap into a paradigm shift, even if it is not clear how this will be done without losing efficiency and without sacrificing profitability with training and equipment. Therefore, the NBI proposal is consistent with the opportunity to introduce BIM to key players in the sector while creating a more comprehensive workflow.
2 Extending Access to BIM Information: Merging Augmented Reality …
23
Figure 2.2 shows the roles and actions of the main actors focused on the interaction with the NBI (the boundary object). As such, NBIs have a dual function: . Interaction-based: Improving collaboration and streamlining electronic and information-based communication. . Process-based: Promote and democratize access to real-time BIM data exchange. Therefore, NUIs are among the technologies that support the development of NBIs focused on adapting and improving the collaborative and integrative aspects of BIM. Indeed, studies have shown that BIM should be adapted and supported by other technologies to increase its adoption by different users [1, 4, 35]. This study describes the early development phases of an NBI based on AR technology for semantic enrichment of BIM models. In addition, the interface is intended to provide more natural access to BIM information, even for users with no prior knowledge or experience with BIM. The following section provides a detailed description of the materials used in the initial development phases. A section on preliminary results and discussion, followed by the conclusions of the study.
2.2 Materials The proposed NBI was developed for the HoloLens 2 HMD and includes two major implementation steps: . Preparation Stage. . User Stage. As shown in Fig. 2.3, the Preparation Stage mainly includes tasks performed by technicians. These include the development and preparation of the underlying BIM model and the export process to a game engine. In addition, this phase includes the use of a Python widget developed to convert the Industry Foundation Classes (IFC) file to JSON and import the JSON file from the game engine to enrich the original IFC. As for the User Stage, which should be performed by operational staff, most of the tasks concern the direct use of the NBI. In particular, users can use voice or gesture commands to identify and filter building elements whose properties (individual object properties or combined in case of multiple object selection) appear on a 3D canvas. Each property (i.e., an IFC attribute or property set) can be edited and stored in a JSON file. From a comprehensive point of view, the complete system is composed of: . A BIM authoring tool—support modelling-related tasks. . A custom Python widget—converts an IFC file to the JSON format. . A game engine—develop the virtual environment and provide interactions with the underlying BIM model.
24
Fig. 2.3 Preparation and user stages swim lanes
F. M. Dinis et al.
2 Extending Access to BIM Information: Merging Augmented Reality …
25
2.3 Results and Discussion More traditional BIM authoring tools are usually designed for specific tasks, have many features, and are not intended for short-term, regular use. In addition, some BIM tools require a higher cognitive load, making them unsuitable for the majority of AECO stakeholders in construction project teams, giving NUIs the opportunity to improve the effectiveness of the tasks performed (cf. Dinis et al. [36]). With the goal of improving collaboration and streamlining digital information-based communication while providing more equal access to BIM information, the use of NBIs is consistent with previous studies that highlight the need for other technologies to support BIM to increase adoption among diverse users [1, 4, 35]. Based on the preliminary results, a framework for developing NBIs for semantic enrichment of BIM models is described. Initial work aimed at using gestures and voice commands to enrich BIM models was first tried on Virtual Reality (VR) interfaces with positive results [37]. Therefore, it was possible to use the experience gained with this type of interface for the development of AR prototypes. Given the need to couple the physical environment with the virtual scene, the prototype interface was based on the Microsoft Mixed Reality Toolkit and the Azure Spatial Anchors service to allow the connection of the building elements with the real space, even between sessions when the devices are turned off. Thus, the position of the virtual elements in the real world is recorded in a cloud anchor and connected to the physical world for later retrieval via the HoloLens AR interface. In addition, it is possible to query the position of a particular BIM element via an underlying BIM model and make it persist its position over the corresponding physical building element. Figures 2.4 and 2.5: The process of setting and querying spatial anchors. In order to retrieve the semantic information of each object, it is necessary to recognize the name of each object, previously stored in a JSON file imported into the game engine (see Fig. 2.3). This process allows matching the properties of each
Fig. 2.4 Setting the location of a set of building elements using spatial anchors
26
F. M. Dinis et al.
Fig. 2.5 Retrieving the location of a previously saved spatial anchor
building element, since the name of the objects is preserved when exporting the geometry. Another aspect worth highlighting is the use of validation methods in the development and implementation of innovative and potentially disruptive interfaces, such as NBI. Notwithstanding previous initiatives on validation methodology for new interfaces and their integration in BIM [38–40], their scope is limited to a specific type of technology or a main activity. Therefore, there is a gap in the need for a holistic usability assessment methodology or guidelines for validating natural interfaces integrated with BIM technology. In addition, such a methodology should consider the individual tasks, stakeholder requirements, and phases of construction projects to highlight the usefulness of the proposed interfaces, in this case NBIs, that can improve the execution of construction-related activities. In addition, an initial assessment phase may include pilot testing as a recommended practice to avoid potential inconsistencies and eliminate unnoticed or incorrect assumptions about the design of tasks or procedures [41]. The validation process should enable comparison of the results of usability assessments of different NBIs to improve or support similar BIM-related tasks.
2.4 Conclusion This study addresses the preliminary stages of developing a framework to improve access to construction information through an AR interface, which simultaneously enables the enrichment of the underlying BIM model. Based on the notion that AR HMD-based interfaces combined with gesture tracking interactions can free AECO stakeholders from the inconvenience of holding the device in their hands and paying
2 Extending Access to BIM Information: Merging Augmented Reality …
27
excessive attention to it, making it more suitable for field use, HoloLens 2 was selected as the preferred device for developing the BIM-based interface. This study also explains the proposed concept of NBI, which includes a set of processes and devices that allow access to BIM information by reusing actions that are common in other contexts, maximizing the ratio between performance and effort. Moreover, according to this concept, information exchange between teams, stakeholders and other functional levels is established through “boundary objects” [29], in this particular case NBIs, adapted to the different tasks and requirements of the end users. Preliminary laboratory tests have shown that coupling immersive interfaces with gesture and voice commands [37] offers potential advantages that are now being exploited to streamline the development phases of the proposed AR interface. In addition, a framework for the steps necessary to use the AR interface is presented. This study is consistent with recent research indicating the need for further adaptation and development of assistive technologies to improve adoption of BIM by diverse users [1, 4]. Because several professional organizations and industry stakeholders do not yet have the knowledge to fully utilize the technologies and methods associated with BIM, this study is intended to contribute to the development of a set of tools that can improve access to BIM information for a broader range of AECO stakeholders, including those who do not yet have experience with BIM. Acknowledgements The first author would like to acknowledge the PhD scholarship 2020.07329.BD awarded by Fundação para a Ciência e a Tecnologia (FCT), cofinanced by the European Social Fund (ESF) through the Programa Operacional Regional Norte. This work was financially supported by: Base Funding—UIDB/04708/2020 of the CONSTRUCT—Instituto de I&D em Estruturas e Construções and the Base Funding— UIDB/00145/2020 of the CEAU—Center for Studies in Architecture and Urbanism, both funded by national funds through the FCT/MCTES (PIDDAC).
References 1. Liu Y, van Nederveen S, Hertogh M (2017) Understanding effects of BIM on collaborative design and construction: an empirical study in China. Int J Proj Manag 35:686–698. https:// doi.org/10.1016/j.ijproman.2016.06.007 2. Laudon KC, Laudon JP (2006) Management information systems managing the digital firm. Pearson Education Inc., Upper Saddle River, New Jersey 3. Smith P (2014) BIM implementation—global strategies. Procedia Eng 85:482–492. https:// doi.org/10.1016/j.proeng.2014.10.575 4. Kerosuo H, Miettinen R, Paavola S, Mäki T, Korpela J (2015) Challenges of the expansive use of Building Information Modeling (BIM) in construction projects. Production 25:289–297. https://doi.org/10.1590/0103-6513.106512 5. Dinis FM, Poças Martins JP, Rangel B, Guimarães AS (2018) Modelo Conceptual para a interação com informação de projeto-Natural BIM Interface. ptBIM - 2º Congresso Nacional de Building Information Modelling, Lisbon
28
F. M. Dinis et al.
6. Poças Martins JP (2009) Modelação do Fluxo de Informação no Processo de Construção Aplicação ao Licenciamento Automático de Projectos. Dissertation submitted to the Faculty of Engineering of the University of Porto for the degree of Doctor of Civil Engineering 7. Bachman LR (2003) Integrated buildings: the systems basis of architecture. Wiley 8. Carvalho BR (2013) Proposta Metodológica para o Desenvolvimento do Projeto Integrado de Habitação Evolutiva em Portugal. Dissertation submitted to the Faculty of Engineering of the University of Porto for the degree of Doctor of Civil Engineering 9. European Commission FP6 Instruments Task Force, Provisions for implementing integrated projects. http://www.ricercainternazionale.miur.it/media/8018/1471.pdf 10. Chan APC, Scott D, Chan APL (2004) Factors affecting the success of a construction project. J Constr Eng Manag 130(1):153–155. https://doi.org/10.1061/(ASCE)0733-9364(2004)130: 1(153) 11. Pham HC, Pedro A, Le QT, Lee DY, Park CS (2019) Interactive safety education using building anatomy modelling. Universal Access Inf 18:269–285 12. COTEC Portugal – Associação Empresarial para a Inovação BIM e a Digitalização da Construção e das Infraestruturas. https://cotecportugal.pt/pt/courses/bim-e-a-digitalizacao-daconstrucao-e-das-infraestruturas/ 13. Succar B (2009) Building information modelling framework: a research and delivery foundation for industry stakeholders. Automat Constr 18(3):357–375. https://doi.org/10.1016/j.autcon. 2008.10.003 14. Antwi-Afari MF, Li H, Pärn EA, Edwards DJ (2018) Critical success factors for implementing building information modelling (BIM): a longitudinal review. Automat Constr 91:100–110. https://doi.org/10.1016/j.autcon.2018.03.010 15. Bassanino M, Fernando T, Wu K-C (2014) Can virtual workspaces enhance team communication and collaboration in design review meetings? Archit Eng Des Manag 10(3–4):200–217. https://doi.org/10.1080/17452007.2013.775102 16. Wigdor D, Wixon D (2011) Brave NUI world: designing natural user interfaces for touch and gesture. Elsevier 17. Mortensen D, Natural User Interfaces—what are they and how do you design user interfaces that feel natural? https://www.interaction-design.org/literature/article/natural-user-interfaceswhat-are-they-and-how-do-you-design-user-interfaces-that-feel-natural 18. Olawumi TO, Chan DWM, Wong JKW, Chan APC (2018) Barriers to the integration of BIM and sustainability practices in construction projects: a Delphi survey of international experts. J Build Eng 20:60–71. https://doi.org/10.1016/j.jobe.2018.06.017 19. Microsoft, Microsoft HoloLens 2. https://www.microsoft.com/en-us/hololens 20. HTC Corporation, VIVE. https://www.vive.com/us/ 21. Meta Quest, Quest 2. https://www.oculus.com/quest-2/ 22. Project Kinect for Azure, Microsoft Azure. https://azure.microsoft.com/en-us/campaigns/kin ect/ 23. Leap Motion. https://www.leapmotion.com/ 24. Welcome to Myo Support. https://support.getmyo.com/hc/en-us 25. Cortana, Sua assistente pessoal e virtual inteligente, Microsof. https://www.microsoft.com/ptbr/windows/cortana 26. Siri—Apple. https://www.apple.com/siri/ 27. O‘Hara K, Harper R, Mentis H, Sellen A, Taylor A (2013) On the naturalness of touchless: putting the “interaction” back into NUI. ACM T Comput-Hum Int 20(1):1–25. https://doi.org/ 10.1145/2442106.2442111 28. Ku K, Mahabaleshwarkar PS (2011) Building interactive modeling for construction education in virtual worlds. J Inf Technol Constr 16:189–208. http://www.itcon.org/2010/13 29. Star SL, Griesemer JR (1989) Institutional ecology, ‘translations’ and boundary objects: amateurs and professionals in Berkeley’s Museum of Vertebrate Zoology, 1907–39. Soc Stud Sci 19:387–420. https://www.jstor.org/stable/285080 30. Star SL (2010) This is not a boundary object: reflections on the origin of a concept. Sci Technol Hum Val 35:601–617. https://doi.org/10.1177/0162243910377624
2 Extending Access to BIM Information: Merging Augmented Reality …
29
31. Taylor JE (2007) Antecedents of successful three-dimensional computer-aided design implementation in design and construction networks. J Constr Eng M 133(12):993–1002 32. EUR-Lex - 32014L0024 - EN - EUR-Lex. https://eur-lex.europa.eu/legal-content/EN/TXT/? uri=celex%3A32014L0024 33. International Standard Organization (2018) ISO 19650-1:2018(en), Organization and digitization of information about buildings and civil engineering works, including building information modelling (BIM)—Information management using building information modelling—Part 1: Concepts and principles. In: ISO. https://www.iso.org/standard/68078.html 34. BIM adoption around the world: Initiatives by major nations. https://www.geospatialworld.net/ blogs/bim-adoption-around-the-world/ 35. Gu N, London K (2010) Understanding and facilitating BIM adoption in the AEC industry. Automat Constr 19(8):988–999. https://doi.org/10.1016/j.autocon.2010.09.002 36. Dinis FM, Martins JP, de Sousa FC, Rangel B, Guimarães AS, Soeiro A (2021) Virtual reality design quality-check tool for engineering projects. In: 38th International conference of CIB W78, Luxembourg. https://itc.scix.net/pdfs/w78-2021-paper-091.pdf 37. Dinis FM, Sanhudo L, Martins JP, Ramos NMM (2020) Improving project communication in the architecture, engineering and construction industry: coupling virtual reality and laser scanning. J Build Eng 30:101287. https://doi.org/10.1016/j.jobe.2020.101287 38. Chu M, Matthews J, Love PED (2018) Integrating mobile building information modelling and augmented reality systems: an experimental study. Automat Constr 85:305–316. https://doi. org/10.1016/j.autocon.2017.10.032 39. McGlinn K, Yuce B, Wicaksono H, Howell S, Rezgui Y (2017) Usability evaluation of a webbased tool for supporting holistic building energy management. Automat Constr 84:154–165. https://doi.org/10.1016/j.autocon.2017.08.033 40. Gheisari M, Irizarry J (2016) Investigating human and technological requirements for successful implementation of a BIM-based mobile augmented reality environment in facility management practices. Facilities 34(1/2):69–84. https://doi.org/10.1108/F-04-2014-0040 41. Nielsen J (1993) Usability engineering. Morgan Kaufman, Mountain View, California
Chapter 3
A Review on the Digitalization of On-Site Production Management—Case Study in a Portuguese Construction Company Luís Jacques de Sousa , Miguel Chichorro Gonçalves , and J. Poças Martins Abstract The Construction Industry (CI) is characterised by a low-skilled workforce and a low level of digitalization and information integration. Compared to similar industries, it suffers from low productivity and low efficiency. This paper explores alternative ways of collecting data at the construction site to improve onsite production management through workforce control, taking into account the technical skills of on-site workers. A bibliometric analysis was conducted to identify the main trends and research tools. The main objective of this research is to propose solutions for the digitalization of worksite processes. The use of technologies, especially mobile applications, accelerates the transmission of productivity information and allows management to make informed decisions and reduce the burden of the control process. This paper presents a case study demonstrating that mobile applications can bridge the gap between the workplace and the office and fit into the context of geographic dispersion. Although mobile applications are beneficial for managing production in the field, a system that integrates all software and data storage in a single location is required to achieve lasting results in efficiently transferring information from the field to the office. This research argues for a gradual adoption of these technologies in construction companies. Further study of the transition between different levels of digitization is essential to determine the true impact on a company’s productivity.
L. Jacques de Sousa (B) · M. Chichorro Gonçalves · J. Poças Martins Departamento de Engenharia Civil, Faculdade de Engenharia da Universidade do Porto, Porto, Portugal e-mail: [email protected] M. Chichorro Gonçalves e-mail: [email protected] J. Poças Martins e-mail: [email protected] L. Jacques de Sousa · J. Poças Martins CONSTRUCT-GEQUALTEC, Department of Civil Engineering (DEC), Faculty of Engineering (FEUP), University of Porto, Porto, Portugal © The Author(s), under exclusive license to Springer Nature Switzerland AG 2023 M. N. González García et al. (eds.), New Advances in Building Information Modeling and Engineering Management, Digital Innovations in Architecture, Engineering and Construction, https://doi.org/10.1007/978-3-031-30247-3_3
31
32
L. Jacques de Sousa et al.
Keywords Building Construction · Digitalization · Construction Management · Information Integration · Mobile Applications
3.1 Introduction With the dawn of an increasingly technological world, new opportunities are opening up for growth and development in one of the world’s largest economic sectors. The CI accounts for 13% of global GDP [1], but it has been slower to adopt ICT than other sectors of the economy. Some technologies, such as CAD, are already firmly established in the CI. Others have been introduced gradually, such as BIM. Previous research has shown that these two technologies are mainly used in the design office [2]. It requires ingenuity to bring the digital world to the construction site. Companies play a critical role in this technological evolution as critical actors and activators of change [3]. The use of mobile management apps can help ensure that more information is available to construction site stakeholders in a timely and clear manner. These technologies can eliminate friction in the production process, shorten cultural distances, and address today’s trend of managers wanting more control without having to visit the jobsite. A defining characteristic of the construction industry is that it is extremely labourintensive. It includes unskilled, semi-skilled and skilled labour, as well as employees with technical and managerial roles. Unskilled and semi-skilled workers, who have little or no qualifications, make up the bulk of the workforce. Skilled workers, on the other hand, tend to be filled by personnel with higher academic qualifications trained in areas such as construction, administration, and management of construction processes, as these positions are more technically demanding and specialised. Since it is a labour-intensive industry, it is necessary to reduce this dependence by investing in improving the productivity of the sector [3]. The competitiveness of the sector depends on the quality of the labour force and even more on the relationship between the quality and the price of labour [4]. Labour is the most important means of production in the CI. It is the basis for the productivity and the quality of the projects, and it is the one that has to bear the consequences of inefficiency. The COVID-19 pandemic has affected labour markets worldwide in 2020. The use of telework is a reality that depends on the characteristics of the activities performed and is therefore very heterogeneous in terms of occupations and economic sectors [5, 6]. A study by Sven Smit of the McKinsey Global Institute [7] examines the profound trends that have taken place on the continent in recent years, some of which may be accelerated by the pandemic. These include increasing automation, growing geographic concentration of employment, shrinking labour supply, and the blending of sectors and occupations-a trend that will continue throughout this decade.
3 A Review on the Digitalization of On-Site Production …
33
Employability in all sectors of the economy will be affected as the crisis unfolds, and the impact will be felt to a greater or lesser degree depending on whether workers need to be nearby, how much work can be done remotely, or whether demand will change. Therefore, the impact of the current situation on the volume of work in the economy may not be fully captured by the decline in employment [5, 6]. By creating an ambitious culture of continuous learning and development, companies have had the benefit of increasing employee engagement. Retraining employees who have already proven themselves can be about 1.5–3 times cheaper than hiring new employees [7]. When it comes to building the workforce of the future, each organisation must find its own path. Researchers can help these organisations by working with them to highlight the competitive advantages that come from developing new skills and using new technologies.
3.2 Methodology The methodology used in this study aims to answer questions related to the use of mobile applications in the construction sector. By applying a systematic review process and additional eligibility criteria, we seek to gather relevant information in this area of study. This research was conducted using the Web of Science and Scopus databases. In the protocol created, the keywords “construction management” and “app” were set as the main terms to search for documents. In order to obtain a wider range of results, other terms were added, namely the field of web-based software and other mobile solutions, resulting in the following search term: (“site production management” OR “construction production management” OR “construction management”) AND (“mobile” OR “web” OR “app” OR “apps”). Due to the large number of results (18,000), Google Scholar was used secondarily to find other relevant articles. With this protocol, it was determined that only Engineering related articles from recent years (2017–2021) would be relevant. These articles should also have an open access status for the full paper to be considered. The final search for this work was conducted by 10/04/2021. Additional screening was performed to exclude articles that did not: . Propose software or model compatible with mobile platform (phone, tablet, webbased). . Propose a model or software that does not directly or indirectly increase on-site productivity. To better understand the scope of this research, the following questions were asked: 1. What are the research trends in the field of production management on construction sites?
34
L. Jacques de Sousa et al.
2. How does the adoption of these technologies affect the construction workforce? 3. What are the main tools described in the literature? 4. What are the main limitations? In addition, a case study was developed to determine the compatibility with existing labor practices and the usability of the product (considering the target users), and to compare the proposed software with existing tools. In this case study, we examine a commercial application that supports the management of employee productivity.
3.3 Results and Discussion 3.3.1 Selected Articles As mentioned earlier, this research was conducted using the online databases Scopus and Web of Science, with Google Scholar playing a minor role. The screening of articles was conducted in several phases: In the first phase, in which only the research strand was considered, a total of 383 articles were found. In the second phase, further screening was performed based on exclusion criteria such as category (civil engineering or structural and civil engineering), year of publication (2017–2021), and article accessibility status (Opens Access), resulting in a total of 38 articles. Finally, in the third phase, the articles were fully read and included in the study based on their content and consistency with the scope of the study. In this phase, a total of 24 articles were excluded because, although they were identified by the search term, their content did not fit the scope of this project. An additional 4 articles were extracted from the Google Scholar database; these articles met all search criteria (Fig. 3.1).
3.3.2 Characteristics of the Selected Articles The last 18 articles were read in their entirety to categorise them in terms of parameters relevant to this study. This categorization can be seen in Table 3.1. According to the protocol, only articles from the last four years are relevant to this study, so a low number of citations is to be expected, but this sample had an average of 10.32 citations per article (Fig. 3.2). The most cited article is the work of Julia Ratajczak with 30 citations [16]. The most prominent author in the field of mobile technologies in construction is Abid Hassan with 3 published articles, followed by Manuel Silverio-Fernandez with 2 articles.
3 A Review on the Digitalization of On-Site Production …
35
Fig. 3.1 Research methodology
The journals that contribute the most to this research area are Automation in Construction with 4 articles, followed by Buildings, Applied Sciences (both from MDPI AG) and ASCE Journal of Management in Engineering with 2 articles each. Regarding the topics, 5 different areas were identified and classified according to the classification proposed by A. Sidani [26]. These areas were: . Collaboration: Field focused on teamwork, mainly communication and cross-team interaction improvement . Quality Management: Field focussed on improving all aspects of the project’s quality . Construction management: Field focussed on improving the management of a construction project throughout the design and construction stages . Education: Field focussed on improving the knowledge of any constructionrelated entity (workers, engineers, architects, etc.) and/or students . Augmented Reality: Field focused on enhancing the real world with virtual elements in an interactive manner The presented topics were assigned to the different articles according to a classification. This classification consists of two levels: The primary level and the secondary level. The aim of this classification is to arrange the articles according to topics, where the primary area is the most important area of the topic and the secondary area is the one that also represents the work it is related to, but does not have the same level of awareness as the first area. From Fig. 3.3, it can be seen that the topic “Construction Management” is the leader in both the primary and secondary areas. This is to be expected since every aspect related to productivity in general, but even more so in the area of productivity management, construction management issues are most relevant in the execution phase with the goal of direct productivity gains.
4 0
2018
Assessing-the-impacts-of-mobile-technology-on-public-transportation-projectinspectionAutomation-in-Construction
Effective project management using mobile applications for construction projects: a review 2021
The perceived benefits of apps by construction professionals in New Zealand
Recent advances in mobile applications for construction; A search for cost management of projects
Evaluating critical success factors for implementing smart devices in the construction industry: An empirical study in the Dominican Republic
A multi-user collaborative BIM-AR system to support design and construction
A web-based BIM–AR quality management system for structural elements
BIM based and AR application combined with location-based management system for the improvement of the construction performance
Construction-databasesupported-and-BIMbased-interface-communication-andmanagement-A-pilot-projectAdvances-in-Civil-Engineering
[10]
[11]
[12]
[13]
[14]
[15]
[16]
[17]
CCit
2019
2019
2019
2021
2019
2020
2017
2
30
11
4
7
1
24
13
[9]
Year 2018
Title
An exploratory study on the impact of mobile ICT on productivity in construction projects
Ref.
[8]
Table 3.1 Selected article titles, years of publication, numbers of citations, sources, and fields Source
Advances in Civil Engineering
Buildings
Applied Sciences
Automation in Construction
Engineering, Construction and Architectural Management
International Journal of Innovative Science and Research Technology
Buildings
International Research J. of Modernization in Eng. Technology and Science
Automation in Construction
University of South Australia
Field
(continued)
Collaboration, Construction Management
Augmented Reality, Quality Management
Quality Management, Augment Reality
Augmented Reality, Collaboration
Construction Management, Education
Education
Construction Management, Education
Construction Management, Education
Construction Management
Construction Management
36 L. Jacques de Sousa et al.
2021 2018
2017
2019
Empirical study on implications of mobile ICT use for construction project management
Structuration model of construction management professionals’ use of mobile devices
Explanatory defect causation model linking digital innovation, human error and quality improvement in residential construction
Mobile augmented reality applications for construction projects
Integration of construction mobile technologies into construction management curriculum: a case study
Mobile computing in the construction industry: Main challenges and solutions
Integrated project delivery with BIM: An automated EVM-based approach
[19]
[20]
[21]
[22]
[23]
[24]
[25]
Year
2017
2021
2019
2020
Title
Digital-twin-and-webbased-virtual-gaming-technologies-for-online-education-A-case-ofconstruction-management-and-engineeringApplied-Sciences-Switzerland
Ref.
[18]
Table 3.1 (continued) CCit
12
7
5
24
0
13
15
24
Source
Automation in Construction
Leadership, Innovation and Entrepreneurship as Driving Forces of the Global Economy
Procedia Engineering
Construction Innovation: Information, Process, Management
Automation in Construction
Journal of Management in Engineering
Journal of Management in Engineering
Applied Sciences
Field
Construction Management
Education, Construction Management
Education, Collaboration
Augmented Reality, Construction Management
Quality Management, Construction Management
Construction Management, Collaboration
Construction Management, Collaboration
Augmented Reality, Construction Management
3 A Review on the Digitalization of On-Site Production … 37
38
L. Jacques de Sousa et al.
Fig. 3.2 Article citation distribution
Fig. 3.3 Identified fields
3.3.3 Analysis and Principal Conclusions Yamaura [9] concluded, after implementing a construction management app at an Australian construction site, that project inspectors who used the mobile technology system were able to significantly increase their productivity without increasing their work hours. By using the mobile technology system, inspectors were able to capture more and varied inspection information and improve daily reporting deadlines. Yamaura concluded by stating that “the mobile technology system can be seen as workforce multiplier.” The bibliography evidences several benefits, namely more efficient management of timesheets, employees, customers, and documents [24]. The results show that the use of these applications can be positively associated with higher productivity and profits. In addition, the benefits of “better client relationship management and satisfaction” are significantly related to overall productivity gains. However, these benefits should be contrasted with the barriers to adoption so that decision makers can
3 A Review on the Digitalization of On-Site Production …
39
weigh the pros and cons. Technology awareness plays a fundamental role in understanding case studies that show the benefits behind the adoption of smart devices, but not always the impact that such systems require [11]. For this reason, the true potential of mobile ICT in construction projects has yet to be realized. Since these technologies have both positive and negative impacts on productivity, practitioners and future researchers need to develop innovative measures to address various issues, such as last-minute changes to plans [8], information overload [20], or poor work-life balance [8]. The second most important topic was AR. In this literature review, it was found that the role of AR can be very important in increasing productivity on the construction site. This topic is one of the most researched in the field of building automation and is currently trending in the ICT community. Due to the nature of the software AR, it can be used in different ways. The use of AR in conjunction with handheld mobile devices such as smartphones and tablets has the potential to solve important problems related to construction management, namely cost, time, and quality. Both Zaher [22] and Ratajczak [16] used AR apps to improve construction performance by creating virtual environments in which workers could interact to obtain real-time information about the status of the work. Mirshokraei [15] developed a AR app to monitor construction quality. This monitoring can help avoid additional rework, which is one of the main reasons for production delays. In addition, Sepas-gozar [18] developed an application AR to enhance the learning experience by helping students understand how a tunnel boring machine works and become familiar with the various structural elements of a building through hands-on experience in a virtual environment. The implications of this work are that it introduces a new technological approach to construction education and training. Construction project managers can use this approach for two purposes: Project teaching and training of novice construction professionals. Extensive research has also been done in education, not only for students [23] (to improve teaching and curricula), but also to educate project managers and managers about the possibilities of mobile applications in this field [11, 13, 24] and even to show the scientific community and software developers how these applications are evaluated and what impact they have on the productivity of companies and their employees [10, 12]. As mentioned in the article [15], quality management is closely related to the environment of AR. In addition, London [21] has developed a model based on a case study that suggests that digitization can impact quality, which in turn can lead to better performance and longer duration of working relationships. Abid Hassan [19] confirms in his study on increasing productivity in construction through mobile ICT that an important factor for this is improving communication. Lin [17] develops a database-driven and BIM-based construction management interface model (DBCMI) that helps BIM engineers, project managers, and stakeholders to exchange data through a web-based application. Case study results show that the system enables participants to identify, track, coordinate, and manage interfaces integrated with elements of the BIM models supported in the database. The results of the field experience show that the proposal, using BIM and web-based technology, is an
40
L. Jacques de Sousa et al.
effective and user-friendly platform system for interface management in the construction industry. However, Hassan warns about the possible information overload that may lead to less effective use of mobile technology [20].
3.3.4 Main Tools The technological development of apps and smartphones has favoured their use in all industries, and CI is no exception. The ability to monitor work progress, quantities, materials and workers with a simple app has changed the way engineers can monitor and oversee their work and their respective job sites. All indications are that this technology will quickly gain acceptance in the industry, justified by the added value in terms of productivity and efficiency gains [27]. The Covid 19 pandemic has also led to investment in technologies that promote “virtual” monitoring of work, as these applications have the potential to eliminate the need for site visits by enabling monitoring and viewing of work digitally [27, 28]. Today, there are quite a few applications on the market for work and project management in general. Competition for market share is aggressive and drives the development of applications so that some become unusable after a few years [12, 23, 27]. Most authors have deliberately chosen to develop their own software/model [14, 15, 17, 22, 25]. Both Uchenna Sampson and Redden compiled 15 and 42 commercially available applications, respectively [12, 23], and the two mentioned BIM 360 from Autodesk [29]. Similarly, in the context of AR, Ratajczak mentioned mobile apps from Autodesk BIM 360 demonstrating the progress of this software in various technological areas [16]. Most models focus on data management and transfer, as improvements in this area can be accompanied by productivity gains. This data can be obtained by conducting on-site inspections and transmitting this information in a timely manner. Therefore, improving communication and collaboration between project stakeholders seems to be the most efficient way that a mobile app can positively impact productivity on the jobsite [8, 11, 13, 19, 23, 24].
3.3.5 Discussion Most authors conducted case studies to evaluate their proposed models. Four case studies were based on interviews, and seven mentioned pilot testing. Many of these experiences relied on a BIM model to obtain data. BIM The information is then combined with field data to analyze productivity. Five of the papers address AR for productivity improvements, demonstrating the existence of this niche in mobile technology in construction.
3 A Review on the Digitalization of On-Site Production …
41
The most frequently mentioned software is BIM 360 (3 times). All other software is mentioned only once [12, 16, 23]. There is a research gap because there are not many tests of other software alternatives that are commercially available. The authors identified other comparable software, some of which were mentioned in the articles reviewed (Procore [30], Raken [31], BuilderTrend [32]). The case studies are country specific and there are limitations in adapting the technologies due to the socioeconomic characteristics of these countries. Different outcomes are expected in terms of worker feedback and the impact of these technologies on productivity [8, 11, 13, 17]. Construction quality and productivity are expected to benefit from the increased speed, volume, and standardization of shared data. However, it is expected that workers will have difficulty adopting these technologies, not only in terms of handling and understanding, but also because of information overload and the speed at which information can be changed. This can lead to a poor balance between life and work. Following this research, a case study was conducted to evaluate the usefulness of a mobile ICT in the Portuguese context. In this project, the compatibility of the tool with current work methods, the usability of the product and its comparison with current work methods will be studied to identify productivity gains.
3.4 Case Study 3.4.1 Framework with the Company A case study was conducted at ACA [33] (a medium-sized Portuguese general contractor). The company’s digital platform is divided into 5 main categories: Tenders, Project Planning, Project Management, Financial Management and Data Storage. The company uses several applications that are also used in many other Portuguese construction companies: CSS-Candy and MSProject for planning, quantity takeoff and budgeting; SAP for financial analysis; Onedrive and Wetransfer for file storage and sharing. Many records are still kept in paper form. In general, the shortcomings of the current way of working need to be addressed, due to the lack of digitalization and decentralisation due to the lack of automatic integration between categories.
42
L. Jacques de Sousa et al.
3.4.2 Case Study Methodology The use of digital tools on the construction site is leading to a culture change in the construction sector, combating the problems caused by the use of outdated management plans and replacing them with a modern and technological mindset characterised by rapid information exchange and efficiency in the construction process [3, 27, 34]. To meet the needs of the business, several alternatives were investigated: Raken [31], ProBuild [35], Procore [30], BuilderTrend [32], FieldPulse [36], Autodesk Bim 360 [29]. These applications can be divided into two categories: those that also provide an integration system in conjunction with a construction progress monitoring system, and those that are used exclusively for work management. According to this organisation, Raken and ProBuild are the simplest applications that provide only basic data interoperability with external software. Applications such as Procore, BuilderTrend and Bim 360 are able to handle different formats and make them available for viewing and editing files within the software. For the company in question, it was important to replace paperwork with a digital tool. This tool would not only increase efficiency, but also supplement the information that the foreman collects daily on the jobsite to improve jobsite management and allow managers to make informed decisions. Of the different apps studied, Raken was identified as the favourite because it responds to the needs of the company, offers a version in Portuguese, is easy to use (essential for use by a foreman), is crossplatform (smartphone, PC, tab-let), has different permissions and can be stored in the cloud. Direct integration with the software offered by Procore was also critical, as this would allow a gradual transition between technologies. The goal of the case study was to determine if it is possible to monitor employee work by quickly checking that deadlines are being met using production metrics so that managers can respond to delays by making thoughtful decisions and documenting errors to correct in the future. The authors implemented Raken, adapted it to the company’s workflows, and tested the extent to which it met the outlined goals. They succeeded in driving the digitization of on-site processes, i.e., obtaining information and sharing data with the administrative hierarchy, which promotes direct control and active, deliberate, and sustainable management.
3.4.3 Procedure The method used in the application of the software can be summarised in 3 phases: (i) preparation of the software, (ii) data collection in the field, (iii) data analysis and processing.
3 A Review on the Digitalization of On-Site Production …
43
By configuring the application in its computer version, it was possible to adapt the mobile version for use by a foreman at the construction site. He was tasked with collecting data about the work by taking photos and videos and filling out daily surveys. Most importantly, linking quantities to tasks and their cost codes (previously entered via Excel spreadsheets and MS project schedules with the option of manual entry) allowed comparison to the original schedule, enabling predictions and estimates of work performance. These measures result in a set of standardized PDF documents that can be routinely sent to management, including key routine reports and the production report (Fig. 3.4).
3.4.4 Case Study Results The case study suggests that this software will improve current reporting, which includes written or verbal notes to support weekly measurement reports. The use of a mobile application could bridge the gap between the jobsite and the office. In addition, the various levels of users, from foremen to production managers, were generally satisfied and acknowledged the benefits. The introduction of tasks with corresponding cost codes, the questions that make up the daily survey, and the customization of the format of the daily report show the configurability of the app and its ability to adapt to the specific situation of different companies. Sending an automatic e-mail with the daily report to the responsible persons is also a powerful tool for the automatic transmission of the information. Of course, the program has some weaknesses, namely errors in the translation into Portuguese. Interoperability is limited, as it only reads CSV files in a specific format. Therefore, a significant effort is required to convert the planning files from the typical Excel spreadsheets to a format that Raken can read.
3.5 Conclusions The systematic review included 18 articles in which mobile ICT was used to improve productivity on construction sites. The following answers are given to the question posed in Sect. 4.2: 1. Most articles describe case studies with specifically developed applications. The main research topics are construction management and AR. Most models focus on managing and transmitting data. Improving communication and collaboration between project stakeholders seems to be the most efficient way for a mobile app to positively impact productivity on the construction site 2. Because of the speed, volume, and standardization of information exchange, the quality and productivity of project participants is expected to increase. Nevertheless, it can be difficult for workers to adopt these technologies in terms of
Fig. 3.4 Example of the reports produced by the application during the case study. On the left a daily report, and on the right the production report
44 L. Jacques de Sousa et al.
3 A Review on the Digitalization of On-Site Production …
45
handling and understanding, but also because of the information overload and the speed with which information can be changed 3. The most frequently mentioned software is BIM 360 from Autodesk 4. The case studies are specific to the country in which they were conducted, and there are limitations due to the socioeconomic characteristics of these countries. It is likely that worker feedback and assimilation will vary due to cultural differences. The impact on productivity may vary depending on the digital infrastructure and readiness of the organisation The case study shows how mobile applications can improve the way reporting is traditionally done. It also concludes that employees need to be trained in the use of these applications. A system that enables software integration is needed to achieve lasting results in communicating information across the project management hierarchy. Given the anticipated difficulties in adapting to new technologies, an approach that emphasises simplicity may be preferred when introducing digital technologies into the workplace. A phased plan that begins with familiar file formats and software tools can facilitate adaptation by organisational personnel. Further study is needed to determine the real and long-term impact of adopting cross-platform, cloud-based integration software on an organisation’s productivity. Acknowledgements This work was financially supported by: European Regional Development Fund (ERDF) through the Competitiveness and Internationalisation Operational Programme (COMPETE 2020) [Funding reference: POCI-01-0247-FEDER-046123] and by Core Funding— UIDB/04708/2020 of CONSTRUCT—Institute of R&D in Structures and Constructions—funded by national funds through the FCT/MCTES (PIDDAC).
References 1. Filipe Barbosa JW, Mischke J, Ribeirinho MJ, Sridhar M, Parsons M, Bertram N, Brown S (2017) Reinventing construction through a productivity revolution. McKinsey Global Institute 2. Martins JPSP (2009) Modelação do fluxo de informação no processo de construção: aplicação ao licenciamento automático de projectos. no. Porto 3. Laudon KC (2010) Management information systems: managing the digital firm. no. 11th ed. Global 4. Bessa D (2008) O Contributo da Engenharia para o Desenvolvimento da Economia. Síntese da Conferência proferida no XVII Congresso 5. D F IMPIC, de Estudos e de Estratégia Instituto dos Mercados Públicos, do Imobiliário e da Construção, IP (2020) Relatório Semestral do Sector da Construção em Portugal | 1º Sem. 2020. Outubro 2020 6. I N d E INE (2020) Produção na Construção contraiu 3,2%—Agosto de 2020. Índices de Produção, Emprego, Remunerações na Construção, 09 de outubro de 2020 7. Sven Smit TT, Lund S, Manyika J, Thiel L (2020) The future of work in Europe. McKinsey Global Institute, June 10, 2020 8. Hasan A, Elmualim A, Rameezdeen R, Baroudi S, Marshall A (2018) An exploratory study on the impact of mobile ICT on productivity in construction projects. Built Environ Project Asset Manage 8(3):320–332. https://doi.org/10.1108/BEPAM-10-2017-0080
46
L. Jacques de Sousa et al.
9. Yamaura J, Muench ST (2018) Assessing the impacts of mobile technology on public transportation project inspection. Automat Constr 96:55–64. https://doi.org/10.1016/j.autcon.2018. 08.021 10. Parikh JH, Mody EJ, Pitroda JR (2021) Effective project management using mobile application for construction projects: A review. Int Res J Modernization Eng Technol Sci 3(3):1197–1203 11. Liu T, Mbachu J, Mathrani A, Jones B, McDonald B (2017) The Perceived Benefits of Apps by Construction Professionals in New Zealand. Buildings-Basel 7(4):111. https://doi.org/10. 3390/buildings7040111 12. Uchenna Sampson I et al (2020) Recent Advances in Mobile Applications for Construction; A Search for Cost Management of Projects. Int J Innovative Sci Res Technol 5(5):414–418 13. Silverio M, Renukappa S, Suresh S (2019) Evaluating critical success factors for implementing smart devices in the construction industry: an empirical study in the Dominican Republic. Eng Constr Archit Manag 26(8):1625–1640. https://doi.org/10.1108/ECAM-02-2018-0085 14. Garbett J, Hartley T, Heesom D (2021) A multi-user collaborative BIM-AR system to support design and construction. Automat Constr 122:103487. https://doi.org/10.1016/j.autcon.2020. 103487 15. Mirshokraei M, De Gaetani C, Migliaccio F (2019) A Web-Based BIM–AR Quality Management System for Structural Elements. Appl Sci-Basel 9(19):3984. https://doi.org/10.3390/app 9193984 16. Ratajczak J, Riedl M, Matt D (2009) BIM-based and AR application combined with locationbased management system for the improvement of the construction performance. BuildingsBasel 9(5):118. https://doi.org/10.3390/buildings9050118 17. Lin YC, Jung S, Su YC (2019) Construction database-supported and BIM-based interface communication and management: a pilot project. Adv Civ Eng 2019:8367131. https://doi.org/ 10.1155/2019/8367131 18. Sepasgozar SME (2020) Digital twin and web-based virtual gaming technologies for online education: a case of construction management and engineering. Appl Sci-Basel 10(13):4678. https://doi.org/10.3390/app10134678 19. Hasan A, Ahn S, Rameezdeen R, Baroudi B (2019) Empirical study on implications of mobile ICT use for construction project management. J Manag Eng 35(6):04019029. https://doi.org/ 10.1061/(ASCE)ME.1943-5479.0000721 20. Hasan A, Ahn S, Baroudi B, Rameezdeen R (2021) Structuration model of construction management professionals’ use of mobile devices. J Manage Eng 37(4):04021026. https:// doi.org/10.1061/(ASCE)ME.1943-5479.0000930 21. London K, Pablo Z, Gu N (2021) Explanatory defect causation model linking digital innovation, human error and quality improvement in residential construction. Automat Constr 123:103505, 03/01/2021. https://doi.org/10.1016/j.autcon.2020.103505 22. Zaher M, Greenwood D, Marzouk M (2018) Mobile augmented reality applications for construction projects. Constr Innov 18(2):152–166. https://doi.org/10.1108/CI-02-2017-0013 23. Redden L, Collins W, Kim J (2017) Integration of construction mobile technologies into construction management curriculum: a case study. Procedia Engineering 196:535–542. https:// doi.org/10.1016/j.proeng.2017.08.026 24. Silverio M, Renukappa S, Suresh S, Donastorg A (2017) Mobile computing in the construction industry: main challenges and solutions. In: Benlamri R, Sparer M (eds) Leadership, innovation and entrepreneurship as driving forces of the global economy. Springer proceedings in business and economics. Springer, Cham, pp 85–99. https://doi.org/10.1007/978-3-319-43434-6_8 25. Elghaish F, Abrishami S, Hosseini MR, Abu-Samra S, Gaterell M (2019) Integrated project delivery with BIM: an automated EVM-based approach. Automat Constr 106:102907. https:// doi.org/10.1016/j.autcon.2019.102907 26. Sidani A, Dinis FM, Snahudo L et al (2021) Recent tools and techniques of BIM-based virtual reality: a systematic review. Arch Comp Method Eng 28(2):449–462. https://doi.org/10.1007/ s11831-019-09386-0 27. Sousa LJ (2021) Digitalização da Gestão e Controlo da Mão-de-Obra em Estaleiro. Caso de estudo numa empresa de construção em Portugal. Msc Thesis, vol. Engenharia civil Civil engineering
3 A Review on the Digitalization of On-Site Production …
47
28. Lund S, Madgavkar A, Manyika J, Smit S, Ellingrud K, Robinson O (2021) The future of work after COVID-19. McKinsey Global Institute, Fevereiro 18, 2021 Report 29. Autodesk, https://www.autodesk.com/bim-360/ 30. Procore, https://www.procore.com/en-gb 31. Raken, https://www.rakenapp.com/ 32. BuilderTrend, https://buildertrend.com/ 33. Grupo ACA, https://www.grupo-aca.com/ 34. Ney DC (2021) Electronic productivity performance monitoring of construction workers. PhD Thesis, Civil Engineering, Faculty of Engineering of University of Porto, Porto 35. ProBuild, https://probuild.app/ 36. FieldPulse, https://www.fieldpulse.com/
Chapter 4
Historic Building Information Modeling (HBIM) and Common Data Environment: The Case Study of Palazzo Vitelli in San Giacomo in Città di Castello F. Bianconi, M. Filippucci, S. Battaglini, and F. Cappilli Abstract This paper represents an attempt to illustrate HBIM (Historic Building Information Modelling) to support the management of historic buildings, with particular attention to the methods of organising and sharing information from a public administration perspective. Within the framework of a research agreement between the Faculty of Civil and Environmental Engineering of the University of Perugia and the Municipality of Città di Castello (PG), it was decided to carry out a case study on Palazzo Vitelli in San Giacomo, a sixteenth century building. The aim is to provide the Municipality with a BIM model of the building and to support them in the digitization processes, completely from an information technology point of view and embedded in a valid data exchange and management system. The BIM modelling of historical architecture is an opportunity to reflect on the potential of this logic and to address the numerous problems related to the complexity of the historical-architectural heritage. Moreover, the comparison with a context of modest possibilities presents the challenge of adapting structures for sharing information created for different purposes to the BIM, revealing that in many cases the transition to new forms of data management must be made in the spirit of continuity and intelligent use of resources. Keywords HBIM · CDE · Digitalization · Data management
F. Bianconi · M. Filippucci · S. Battaglini (B) · F. Cappilli Department of Civil and Environmental Engineering, University of Perugia, Via Duranti 93, 06126 Perugia, Italy e-mail: [email protected] F. Bianconi e-mail: [email protected] M. Filippucci e-mail: [email protected] © The Author(s), under exclusive license to Springer Nature Switzerland AG 2023 M. N. González García et al. (eds.), New Advances in Building Information Modeling and Engineering Management, Digital Innovations in Architecture, Engineering and Construction, https://doi.org/10.1007/978-3-031-30247-3_4
49
50
F. Bianconi et al.
4.1 Introduction BIM as a paradigm of the digitization process represents one of the most important challenges on the innovation path of architecture, engineering and construction (AEC). The revolutionary impact of this “medium” changes the “message”, the project and therefore the results. Translating it into a new language requires an interpreter who must learn to understand it and renew their ability to read that coding. When planners are involved in a process initiated for optimal management of construction processes, those who manage the building are also swept along by this wave. For these reasons, the revolution of BIM in our European context also affects the public administrations that own many historic buildings: If the approach of BIM works well for standardized new buildings, it is important to deepen the application of this new representative language to the cultural heritage often managed by public institutions. This digital disruption is changing the information management of the construction supply chain, represented by the notion of links within and between resources and capabilities, but a chain is only as strong as its weakest link. This study represents an experiment in Historic Building Information Modeling (HBIM) to support the management of historic buildings, with particular attention to methods of organization and information sharing, a process implemented in a case study of a sixteenth century building, Palazzo Vitelli in Città di Castello, Perugia (Fig. 4.1). The developments of the BIM approach, originally developed in the Architecture, Engineering and Construction (AEC) field for new buildings, represent a stimulus for project innovation [1] for objects that also belong to the historicalarchitectural heritage [2], supporting the processes of restructuring, management and conservation of this class of objects. The transfer of the new approach to the project leads to the definition of the acronym HBIM, which first appeared in 2009 in a study by the Dublin Institute of Technology, where it is defined as “the process of mapping BIM objects on a point cloud, which creates the possibility of developing details beyond the surface of the objects, both in terms of their construction methods and the materials used” [3]. Over the years, these methods have been tested and refined several times, leading to an expansion of the original definition of HBIM, which now refers to a process for creating intelligent virtual models of historic buildings that allows the diverse and heterogeneous data and information about the objects under study to be collected, organized, and improved in a coherent and coordinated manner [4]. The research and the main applications developed concern the collection of data about a specific object [5, 6] in view of its management during its life cycle [7] and/or for restoration projects [8], the analysis and mapping of the state of conservation and degradation phenomena [9–11], the structural analysis of the historical-architectural object and the monitoring of the structures over time [12, 13], the energy efficiency of historical buildings [14], the digital representation through virtual and augmented reality [15, 16], the experiments related to the value of the digital twin [17]. Among the main critical aspects of HBIM is the essential difference between the production processes that tend to the seriality of today’s construction industry and the exceptional characteristics of each historic building in terms of materials, architectural
4 Historic Building Information Modeling (HBIM) and Common Data …
51
elements, complex geometries and behaviors. For these reasons, researches have been developed to parameterize the most common elements, such as classical orders [18] or a particular architectural style [19, 20], or even the creation of “libraries” of particularly relevant objects [21, 22]. Following the first definition, we therefore understand the value of relief in this scenario and, in particular, the main role of laser scanning technologies due to their ability to capture the formal characteristics of artifacts in an extremely accurate way [23]. Numerous studies have been carried out to structure an efficient and repeatable “scan-to-HBIM” process [24, 25], although the transition from point clouds to BIM objects requires a significant effort from operators and is therefore time and resource intensive [26], which is why research is focused on the development of semi-automatic and automatic procedures [27–29]. The complexity of BIM modeling historical-architectural heritage has also led to the question of which Levels Of Development (LOD) are most appropriate for HBIM models [30, 31]. Given the specificity of the elements and the long time Fig. 4.1 A view of the exteriors of Palazzo Vitelli in San Giacomo, the XVI century building chosen as a case-study for this research
52
F. Bianconi et al.
period that must be considered, HBIM increasingly refers to Levels Of Knowledge (LOK) [32] of an object based on the quality and quantity of information available for the object. The open and interactive logic of information management, typical of the world of BIM, is integrated in a model that allows the full involvement and integration of the numerous professionals (archeologists, restorers, civil engineers, architects, art historians and many others) involved in intervention projects on the historical-architectural heritage [33]. Thus, the geometries and forms presented are only the basis for a system that regulates the organization, exchange and archiving of information. A fundamental theme in the processes of BIM is the construction of so-called Common Data Environments (CDEs). These are virtual environments (clouds, servers) to which all parties involved in the project must entrust their work (files), according to an approach strongly promoted by the regulations [34–36]. These environments are organized to prescribe methods for structuring activities, defining roles and responsibilities, and providing up-to-date and complete information to all parties involved. The described area reinforces the collaborative and integrative aspects characteristic of the BIM methodology and presents a new challenge for building an optimal environment for the information that characterizes the historical and architectural heritage.
4.2 Materials and Methods 4.2.1 The Case Study: Palazzo Vitelli in San Giacomo, Città di Castello (Peruga) The study begins in the framework of a research protocol between the Department of Civil and Environmental Engineering of the University of Perugia and the Municipality of Città di Castello (PG). The selected case study is Palazzo Vitelli a San Giacomo (Fig. 4.1), a sixteenth century building [37] located in the historical center of Città di Castello in the province of Perugia. Located in an Umbrian area on the border between Tuscany and Emilia Romagna, the building has an almost rectangular plan (Fig. 4.2) and is characterized by the presence of a quadrangular courtyard surrounded by a portico covered with cross vaults. Around the courtyard are arranged the rooms of the three floors of the building, in which many original artistic and decorative elements have been preserved. These are, in particular, coffered ceilings (Figs. 4.3 and 4.4), frescoes and wall paintings. These elements are only a small part of the original decorative equipment, most of which has been lost over time [37]. Palazzo Vitelli in San Giacomo, which was originally a noble residence and remained so until the end of the nineteenth century, has subsequently undergone numerous changes of ownership: it was first used as barracks for the Carabinieri, then as the seat of the local Ginnasio and later as the archive of part of the ancient
4 Historic Building Information Modeling (HBIM) and Common Data …
Fig. 4.2 Building ground floor plan Fig. 4.3 A view of the reception hall of the Palace, in which the sixteenth century coffered ceilings have been preserved
53
54
F. Bianconi et al.
Fig. 4.4 Detail of the coffered ceilings in the reception hall of the Palace
fund of the local library. From 2019 it will house the Città di Castello Municipal Library. The choice of this building as a case study was determined both by its importance as a historical and architectural monument and by the diversity and vitality of the functions it houses. It is, in fact, a very active part of the urban fabric and, as such, is constantly used by citizens, which raises the question of the most appropriate methods and means for its management and preservation. The interest arises from a series of projects carried out by the Municipality, as well as from a series of studies carried out over time.
4 Historic Building Information Modeling (HBIM) and Common Data …
55
4.2.2 BIM Modeling of Palazzo Vitelli in San Giacomo 4.2.2.1
Information Gathering and Laser Scanner Survey
The BIM modeling of Palazzo Vitelli in San Giacomo began with the collection of all information about the building. This information is both geometrical, to give shape to the architectural elements, and historical and artistic, to enrich the model with all the information about the construction phases and the works of art contained in the building. The art historical data are particularly important and characteristic and were found both by research in the archives and by consulting the texts kept in the municipal library. The geometric information about the palace comes partly from the 2D drawings in the possession of the Municipality of Città di Castello and partly from a laser scanner survey carried out as part of this study. The latter concerned two rooms on the second floor of the palace, the Salone di Rappresentanza and the so-called “Sala degli dei” (Hall of the Gods), chosen among the other rooms because they are characterized by an artistic-decorative decoration of particular value. Inside, both the original coffered ceilings and the sixteenth-century fresco cycles have been preserved. A Z + F 5006H laser scanner, capable of generating black and white point clouds, was used for the scans. A total of seven scans were performed (five in the Hall of Representation, two in the Hall of the Gods) in order to accurately capture all the details of the three-dimensional elements. For the spherical photos, a camera with a fisheye lens was used, mounted on a panoramic head and placed at the exact location from which each photo was taken. Each scan was paired with 21 spherical photos, resulting in a total of 147 photos. The point clouds obtained were then processed using Cy-clone software (Fig. 4.5a), removing all interfering elements to obtain the images used for the actual modeling. These images consist of a series of “plans” and “slices” of the point clouds obtained by “clipping” with the adjusted plans as needed (Fig. 4.5b). A total of 32 images were obtained between plans and slices, 14 for the Salone (6 plans, 8 slices) and 18 for the Sala degli Dei (6 plans, 12 slices). The data obtained with the laser scanner make it possible to determine the exact contours of the coffered ceilings and to locate them precisely in the rooms. All previous surveys are rather inaccurate in this respect. In addition, the sections of the point clouds have enabled accurate mapping of the frescoes on the walls and provided images with precise proportions.
4.2.2.2
Modeling of Historical Architectural Elements in the BIM Environment
Autodesk Revit software was used to create the building model BIM (this software was chosen because it is widely used). Most of the structural elements of the building (especially walls and floors) were realised using the system families available in the
56
F. Bianconi et al.
Fig. 4.5 a Point cloud of the Salone di Rappresentanza, derived using Cyclone software from the combination of the five scans made in the room. b Longitudinal section of the same point cloud
software. This was possible due to the relative regularity of the floor plan of the building, which has mainly rectilinear walls and flat floors (Fig. 4.6). However, in modeling the vaults that characterize the first floor of the building, a different approach was taken due to the large number of elements and their complexity. First, two families of the generic adaptive model were created, one for the barrel vaults and one for the pavilion vaults (Fig. 4.7), which were parameterized accordingly. By using these two families (as well as by combining them, as in the case of the lunette vaults, Fig. 4.8), it was possible to obtain elements that corresponded as closely as possible to the actual geometry of all the vaults (Fig. 4.9). In the case of the doors and windows, due to their particular shapes and the presence of valuable architectural elements, it was not possible to use only elements
4 Historic Building Information Modeling (HBIM) and Common Data …
57
Fig. 4.6 General view of the BIM model from the eastern side of the building
Fig. 4.7 Instance belonging to a family of Generic Adaptive Models representing a pavillion vault
already present in the software. In order to include as much information as possible, special families were created (Fig. 4.10) that accurately represent the geometry and moldings of the openings. A similar approach was used for the columns of the central courtyard and the Loggia on the second floor. In contrast, a different approach was taken for modeling the more complex decorative elements, with two different solutions depending on the type of element and the functions of the digital representation. The coffered ceilings were modeled as elements of the “Casework” category, creating instances with geometric properties
58
F. Bianconi et al.
Fig. 4.8 Combination of two barrel vaults and a pavillion vault to create a more complex lunette vault
Fig. 4.9 A view of the BIM model on the ground floor, which shows the vaults that it was possible to create
4 Historic Building Information Modeling (HBIM) and Common Data …
59
Fig. 4.10 Instance belonging to one of the Door families created for Palazzo Vitelli in San Giacomo, with its parameters
corresponding to those of the real element. The elements were modeled outside of Revit using AutoCAD and Rhinoceros programs. This allowed the use of more flexible and powerful modeling tools and the subsequent export of the solid geometries in a format that can be read and thus imported by the programs BIM. The modeling of frescoes, stucco and paintings was done in a completely different way. Since it was not possible to accurately represent all fresco surfaces and faithfully reproduce the details of stucco decorations, it was decided to insert symbolic elements representing these works. For this purpose, a special family was created in the category of “Generic Mod-els” families. The instances belonging to this family have the shape of a simple sphere without attributes. The family was imported into the project and the associated instances were placed on all walls (or other architectural elements) that serve as supports for frescoes, stucco and paintings. The use of these symbolic elements makes it possible to have objects in the project that represent frescoes, stucco and paintings and to which parameters and information can be directly assigned. These two approaches together result in a model that contains representative instances for each artistic/architectural work (Fig. 4.11): In this way, it is possible to assign to them all the data found and to manage the information with modalities similar to those used for the most common architectural elements.
4.2.2.3
The Association of the Information Content of the HBIM Model
The information content of the model is composed of data, which are assigned to the objects by: . the default parameters available in the software;
60
F. Bianconi et al.
Fig. 4.11 a Prospective section of the point cloud of the Hall, in which all the artistic/architectural elements are visible. b View of the BIM model from the same prospective; the stuccoes at the base of the coffered ceilings and the fragments of frescoes in the window sills are represented as symbolic elements that can be parameterized
. some parameters created ad hoc for the case-study. The latter allow the input of information for which the software does not provide specific fields. In fact, the software BIM does not have basic parameters that can fully express the characteristics of historic buildings, limiting the completeness of the information models. To solve this problem, a Shared Parameters file has been created that contains the parameters necessary for the input of the most important information. By using
4 Historic Building Information Modeling (HBIM) and Common Data …
61
Shared Parameters, the parameters defined here can be reused for other future projects. The Shared Parameters file is organized into groups where parameters are divided by subject/sub-discipline. The organization of the Shared Parameters into disciplines/sub-disciplines promotes a repeatable and multidisciplinary approach: the same file can be used in the future to study other areas not specifically addressed here. It is sufficient to follow the proposed structure and create additional groups and other parameters within the file. In particular, two groups have been created for the historical-artistic area, which is of the greatest importance for HBIM: . STO/ART (discipline: Historical; subdiscipline: Artistic); . STO/FAS (discipline: Historical; subdiscipline: Historical Phases). The parameters of these two groups were used to parameterize the artisticarchitectural elements. They were loaded into the model and assigned to the categories of the families that contain these elements, so that a complete information framework for the works can be created, starting with their realization and tracing their evolution until today. To the information directly present in the model, in the form of parameters, are added some others that exist in external files and complete the cognitive picture related to the building. The storage of these documents outside the model facilitates and simplifies their management by the devices. Moreover, storing the documents in an external place allows more forms of consultation (e.g., a quick sequential visualization of images and their comparison) and a “hierarchical” organization of these documents subordinated to the model BIM. The outsourced documents consist of: . a selection of photographs from the photo campaign of the artistic-architectural elements; . historical photographs available for the palace; . images from nineteenth-century publications about the palace, which provide valuable information about the earlier design of the building; . documents in PDF format with images of the cuts made on the point clouds of the Hall and the Hall of the Gods (the storage of the information coming from the point clouds in this way makes it possible to consult the data even if there is no specific software to manage the point clouds). The information listed is organized to suggest direct links with the BIM model. A direct link is a connection (between a model instance and the external document) established by URL parameters. In Revit, URL parameters allow you to associate an instance with an ‘address’ that automatically opens the contents of the external link, whether it is a web page, a local folder, or a single document. In the present case, the content displayed by the links is local and consists of the documents mentioned above. It should be noted that this type of links remains permanently valid only if, within the device for which the link was created, the relative position of the model and the documents is not changed. In other words, once the links are established,
62
F. Bianconi et al.
the structure of the folders and subfolders (with relative assignments) containing the model and documents should remain unchanged. This issue and the problems arising from the need to transmit the created material to the operator of the plant, the Municipality of Città di Castello, are the objective of the second part of this study. The management function of the model implies that it will be used over a long period of time and updated in case of future modifications of the historical building. For this reason, it is necessary to set up a system within the model itself that allows to display and manage the information about the last revision made, in order to take into account the updating status of the information. For this purpose, the model has been set up so that the preview does not show just any view, but a special title block. It contains basic information such as the name of the model, the date of creation, the operator, the date of the last revision, and the operator of the last revision. The title block itself was created as a special family and inserted inside the model in a table named “0 - OpeningTitleBlock”. It is the responsibility of the users of the model to update the information in red within the title block after each revision, but without changing the black fields that indicate immutable properties entered when the model was created. Using the title block allows users to immediately see the metadata of the model they are working on. In this way, the control over the information is higher to avoid mistakes.
4.2.2.4
Characteristics of the Realized HBIM Model
The realized HBIM model contains information intended for the management of the building, among which the historical-artistic data play an important role. The model proposes solutions for their representation and parameterization, which allow to manage in BIM also the information about the artifacts, which are usually not considered in these processes. All data within the model are available in queryable form (through the creation of abacuses for the elements, analysis by means of filters, aggregation by functions, etc.) and can be updated in time. A corresponding cartouche of the model allows the insertion and extrapolation of information about the revisions. Finally, the modalities for future expansion of the information within the model are outlined: This is supported by the structure of a dedicated file of Shared Parameters organized by disciplines and sub-disciplines. However, the realized HBIM model does not directly contain the entirety of the informative heritage related to the historic building. Part of the information has been outsourced to the model itself, in order to allow more forms of consultation and to make the file lighter and easily manageable with the help of devices. In this sense, a number of external documents are “linked” to the model BIM and complete the cognitive picture through direct links with the instances within the model. All these documents must be kept together with the model in a structure that allows
4 Historic Building Information Modeling (HBIM) and Common Data …
63
consultation while providing guarantees for the maintenance and management of the links themselves.
4.2.3 Historical-Technical Common Data Environment 4.2.3.1
The Necessity of a Common Data Environment
The realization of an enriched information model requires a reinterpretation of the structure of exchange, consultation and archiving of data, reflecting the internal order of the same. The Municipality of Città di Castello, like many other local administrations, uses virtualized servers for the management of the entire municipal information system. These archives are mainly used by the technicians of the municipality, but also by the citizens for the provision of services, companies and professionals. However, this information sharing and archiving system is not structured for use on BIM and only offers the possibility of bulk transfer of the material in a simple server folder, losing various information and hierarchies defined during preparation, which limits its future development and functionality. The design of a CDE for historical-technical data is consistent with the goal of delineating a suitable space for the management processes of information-enriched digital models, a path hyperbolically stigmatized by the complexity of HBIM. The environment must be supported by directly available resources, which in this case are the municipal servers already in use, the analyzed case study being only the possibility of a first implementation of a system open to future extensions in quantitative (analyzed assets) and qualitative (managed information) terms.
4.2.3.2
Structure of the Common Data Environment
The first step in designing the Common Data Environment was to outline its structure. It consists of a system of folders and subfolders organized by information levels from general to specific. The data in the folders are listed in the order of building, subject area, sub-subject area, type of document. Thus, the general Common Data Environment contains the folders of buildings, which in turn contain the folders of subject areas, and so on (Fig. 4.12). This phase also determined which and how many different disciplines would be accommodated in the Common Data Environment. As with the data input into the model, a fourth, historical discipline was added to the three disciplines commonly recognized in BIM (Architectural, Structural and Plant). In this way, entire areas of the Common Data Environment can be reserved specifically for all HBIM processes without overloading the architecture area, which would otherwise have to accommodate all historical and artistic information.
64
F. Bianconi et al.
Fig. 4.12 Diagram displaying the container to content ratio within the CDE
The already explained structure of the Common Data Environment is reflected in the naming of the folders that compose it. It follows a predefined scheme for each level, shown in the table in Fig. 4.13a.
4 Historic Building Information Modeling (HBIM) and Common Data …
65
a Level Folders 2 Single buildings’ folders 3 Disciplines’ folders 4 Subdisciplines’ folders 5 Type of documents’ folders
Folders’ naming scheme DUILDING ID
Folders’ naming example Bb1PVG
BUILDING ID_DISCIPLINE BUILDING ID_DISCIPLINE_SUBDISCIPLINE
Bb1PVG_STO Bb1PVG_STO_ART
BUILDING ID_DISCIPLINE_SUBDISCIPLINE_TYPE Bb1PVG_STO_ART_JPG
b
Fig. 4.13 a Folder naming scheme. In the last column, an example of folder naming usage for the case study of Palazzo Vitelli in San Giacomo. b Diagram showing the structure of the folders in the CDE, with their actual designations
66
F. Bianconi et al.
4.2.3.3
Location and Naming of Documents in the Common Data Environment
Within the CDE, each folder has a precise naming scheme, which is as follows: . “BUILDINGID_DISCIPLINE_TYPE”. The BUILDING ID uniquely identifies each folder as referring to a specific building. The BUILDING ID consists of: – Building type abbreviation (referring to the function for which the building in question is used, for example administrative, school, library, etc.); – Building abbreviation (referring to the identification of the specific building among those with the same intended use). . The DISCIPLINE identifies the disciplinary area to which the file refers. One of the following abbreviations is to be adopted: – Historical-artistic = STO (section entrusted to all processes and to all information specifically HBIM) – Architectural = ARC – Structural = STR – Mechanical, Electrical, Plumbing (MEP) = IMP. . TYPE means the type of documents that the folder contains, based on their format. Four types of documents are identified, representative of the main formats that need to be archived within the CDE. Each type of document is abbreviated in the name using the abbreviation of the most common open format that represents it: – – – –
documents = PDF (the folder can contain the extensions:.pdf); images = JPG (the folder can contain the extensions:.jpg, .jpeg, .png, .tif, etc.); spreadsheets = ODS (the folder can contain the extensions: .ods, .xls, etc.); text = ODT (the folder can contain the following: .odt, .doc, .docx, .txt, etc.).
It should be emphasized that, although the folders just described may contain various extensions, open formats are always preferred for documents to be included in the CDE, and therefore the extensions .pdf, .jpg, .ods, .odt. The open formats guarantee undeniable advantages over the so-called “proprietary” formats (formats that are subject to copyright and restrict the reading of the content to specific programs/software). These advantages consist mainly in the fact that the access to the data and information is always guaranteed, without time limitation and without being bound to a specific software. Thus, the use of open formats facilitates interoperability and information exchange, which are among the most important advantages of a CDE. To understand how the environment works, one can look at the archiving of the case study documents. The archived documents are all located in the level 5 folders of the Common Data Environment (the innermost folders).
4 Historic Building Information Modeling (HBIM) and Common Data …
67
The name of the documents is the same as the folder they are in, up to TYPE. If necessary, ADDITIONAL CHARACTERS can be inserted after TYPE. The naming scheme for the documents is as follows . “BUILDING ID_DISCIPLINE_SUBDISCIPLINE_TYPE_ADDITIONAL CHARACTERS”. Additional characters are used to distinguish the document from other similar documents in the same folder. They can provide different information depending on the need. An example of the use of ADDITIONAL CHARACTERS is to link a particular document to the element of the model to which it is linked. In this case, the characters show the “mark” of the corresponding element within the model, so that the document is immediately recognizable as being linked to that element. For example, the document labeled “BblPVG_STO_ART_JPG_AFF23S” is a photograph of a fresco in Palazzo Vitelli in San Giacomo. In the model to which the photograph is linked, the fresco has been parameterized with the marker “AFF23S” (room number 23, south wall).
4.2.3.4
Location and Naming of BIM Models Within the Common Data Environment
Similar to the documents, it can be paradigmatically analyzed that the models of BIM are the only file type within the Common Data Environment that is not contained in the innermost layer. Namely, the model of each building is located in the level 2 folder, i.e., the folder for the individual building. The position of the model in an outermost layer in relation to the other documents emphasizes that it is the connecting element between them. The naming of the models of BIM follows the naming scheme proposed for the folders. Specifically, the scheme is: ID BUILDING_MODEL. If you need to export models in IFC format, these files should be saved in the same folder as the model they come from and have the same name. An example of naming a model BIM is “BblPVG_MODEL”, which denotes the BIM model of Palazzo Vitelli in San Giacomo.
4.2.3.5
Summary Files
Summary files are ODS documents that must be added to each Level 5 folder along with the documents stored in them. The purpose of each summary file is to collect and manage information that is not included in the name of the archived documents, specifically data that may not be included in the document itself. Thus, with the help of the summary file it is possible to manage and visualize most of the metadata related to the documents.
68
F. Bianconi et al.
In this case, the data is the documents archived in the folder, while the metadata includes, for example: . the date when the information was captured (e.g. the date of a particular photo); . the method by which the information was captured (e.g., the type of laser scanning station used to perform a scan); . the author of the last revision of the information, etc. The summary file is in the form of a table. The first column must contain the name of the files stored in the folder, while the following columns contain the metadata required for each file. The diagram in Fig. 4.13b shows the structure of the folders in the Common Data Environment with their actual names, starting with level 1 and ending with the archived documents and the summary files. In this example, we have only created the folders for the case study of Palazzo Vitelli in San Giacomo. As you can see, the Common Data Environment can be extended as needed (in the sections where “…” boxes appear) to create new folders for other buildings. Also, the folders created for Palazzo Vitelli a San Giacomo can be further expanded as studies are conducted on aspects not covered here. However, future extensions must follow the organizational scheme proposed here, including the different levels of folders and subfolders, the names of these folders, and the files to be inserted. Otherwise, you would lose important features of the Common Data Environment, such as the ability to insert model/document links.
4.2.3.6
Compliance of the Common Data Environment with Regulatory Standards
Information and requirements for the creation of a Common Data Environment can be found in relation to Italian standards in UNI 11337, ISO 19650 and PdR 74:2019. The basic requirements of these standards and the way the proposed Common Data Environment should meet them are summarized in Table 4.1. In addition to these features, another fundamental aspect is the fact that the proposed Common Data Environment does not impose any additional costs on the administration that uses it, apart from those required to equip it with the BIM software. In order to access and use the environment, it is not necessary to equip oneself with special programs or acquire special knowledge: rather, it is a certain content of a system (the server) that is already in use and known to the Administration. Its maintenance can therefore be carried out by the same technicians that already deal with the structure in general.
4 Historic Building Information Modeling (HBIM) and Common Data …
69
Table 4.1 The requirements expressed by the UNI 11337 standard and the corresponding characteristics of the proposed CDE UNI 11337 requirement for CDEs
Corresponding feature of the implemented CDE
Unique identification of each container (of each The CDE uses a standard name (which is file) previously documented and agreed upon) for each folder and each file Support of a wide range of data types and formats (including IFC standard from UNI EN ISO 16739)
The CDE is located within a server, which allows the storage of any file format, including IFC
High query fluxes and easy data access The CDE allows browsing between folders recovery and extrapolation (open data exchange (the support server also has a search box for protocols) documents), downloading and uploading files, in the manner defined by the IT structure Traceability and historical succession of the revisions made to the contained data
The CDE contains Summary Files, through which the metadata related to the documents in the folder can be displayed and managed
Data conservation and updating over time
The CDE allows documents to be kept for an indefinite amount of time (equal to that of the support technology) and to update them when necessary
Accessibility, according to pre-established rules, by all the actors involved in the process
The CDE allows access by all interested parties, after they have received permission. It is also possible to set the permission to the contents of a folder as a read-only use
Data confidentiality and security
The CDE has the same guarantees of confidentiality and security offered by the information system of the owning Municipality, which are those required by current legislation regarding the security of computer data
4.3 Results and Discussion 4.3.1 CDE Implementation 4.3.1.1
Documents to Be Added to the Common Data Environment
Regarding the material created in the study of Palazzo Vitelli a San Giacomo, we decided to include the BIM model and all the files directly related to it (images of various kinds, PDF documents) in the Common Data Environment. To these have been added other files that, due to the structure of the Common Data Environment, can now be effectively associated with the model, even if there are no direct links to the instances. In particular, it was decided to add more files to the Common Data Environment:
70
. . . . .
F. Bianconi et al.
Text Documents; Spreadsheets; Summary Files; IFC Files; Shared Parameter Files.
The text documents contain all the collected information about the architectural design, the history of the building and its decorations. The inclusion of these documents in the Common Data Environment means that the information currently scattered in the various publications about Palazzo Vitelli in San Giacomo, as well as the direct knowledge of the individual city and library staff, will be brought together in a single place. In this way, the project of bringing together all the available documentation becomes a reality. The spreadsheets are the abacuses extracted directly from the model and thus can be viewed outside the BIM software (e.g., by non-specialist staff), facilitating data sharing. The summary files were created to collect metadata about the images (photos of the artistic/architectural elements, historical photos) and about the sections of the laser scans to be inserted into the Common Data Environment. The IFC file refers to the export of the BIM model in the open format to be inserted into the Common Data Environment. The shared parameter file is the one described above and should be inserted in the general “CDE_BIM” folder, i.e. outside those of the individual buildings. It can be used for several projects and possibly extended. All these documents have been renamed according to the pattern shown above and should keep this name as long as they remain in the Common Data Environment.
4.3.1.2
Remote Setup of the Common Data Environment Folder
The actual creation of the “CDE_BIM” folder was done remotely, via a local device that was not connected to the municipality’s server. We chose this approach for two reasons: first, to separate the development of the Common Data Environment from the creation of the folder on the server on which it was to be hosted; second, to provide the “finished” product directly to the municipality, without the need to involve technicians in the preparatory phases of the development of the Common Data Environment and in the necessary operational tests. Operationally, a folder named “CDE_BIM” was created on the local device, which is in all respects the final folder that will then be sent to the community. In it, the subfolders mentioned in Sect. 4.2.3.2 were prepared and finally the model and the documents mentioned in Sect. 4.2.3.3 were inserted. For the selected material, the folders “BblPVG_STO” and “BblPVG_ ARC” and their subfolders were used.
4 Historic Building Information Modeling (HBIM) and Common Data …
4.3.1.3
71
Model/Document Links in the Common Data Environment
Within the material inserted into the Common Data Environment, the direct links between the model instances and the outsourced documents (Sect. 4.2.3.3) were revised by inserting “relative” paths into the prepared URL parameters that refer to the structure of the Common Data Environment. In computer science, a “path” refers to the specific location of an item (file or folder) within a data store with a particular tree-structured file system. You have: . Absolute paths: paths that specify the position of an element starting from the root of the file system; therefore they are independent from the current working directory; . Relative paths: paths that describe the location of an item from another location in the file system tree, namely the location of the program or document that uses this relative path to locate the item. Using relative paths for links between model instances and documents in the Common Data Environment allows you not to lose the links you create when you move the entire structure within the city’s server. This is possible because relative paths “decouple” the link within the Common Data Environment folder from the local device on which it is currently located. Relative paths should also be used for links added later (during actual use of the model and the Common Data Environment) to keep all links as internal to the set structure and independent of the individual user (with the intent of allowing multiple users to access and collaborate). However, you must specify that this type of link remains valid only if no changes are made to the Common Data Environment structure during use. For example, the folders and subfolders that make it up (whose names explicitly appear in and determine the relative paths) must not be renamed, nor must the files they contain. In this case, the links would inevitably be lost. For the actual creation of the relative paths, the Revit settings have been changed so that the program draws directly from the “CDE_BIM” folder. With this setting, relative paths can “launch” directly from the Common Data Environment folder and be effectively interpreted by Revit. These settings must be replicated on all local devices that use the Common Data Environment, otherwise the software will recognize the relative paths as invalid. Next, the prepared URL parameters were populated with relative path strings representing the location of the individual document to be associated with each instance.
4.3.1.4
Simulation of Transferring the Common Data Environment to End Users
The entire folder “CDE_BIM” and all its contents have been transferred to the end users, in this case the Municipality of Città di Castello; the material, which at this point is only an experiment, must be transferred from the local device on which it was
72
F. Bianconi et al.
developed to the server of the Municipality. During the transfer, the confidentiality of the information and the intellectual property of the transferred materials must be protected. The issue of security was addressed with the File Transfer Protocol (FTP) process to avoid possible leakage of file information through external and uncontrollable hosting services. In computing and telecommunications, FTP is a protocol for transferring data between hosts based on Transmission Control Protocol (TCP) and a client–server architecture. The protocol requires client authentication via username and password. FTP is also available in “secure” variants that encrypt the transferred data while maintaining confidentiality. Here, a simulation of file transfer over FTP was performed using the open-source FileZilla software. This application enables the transfer of files over the network using the FTP protocol and provides solutions for both the client and the server. The entire Common Data Environment was uploaded to a specially created “fictitious” server. The server folder was then opened and the templates and documents it contained were checked for successful transfer. The settings of the BIM software were changed so that it drew directly from the “CDE_BIM” folder copied to the server, then the model was opened and the existing model/document links were tested. The structure of the Common Data Environment and its internal links did not show any problems during the transfer simulation, so the transfer to the end users can continue in a similar way.
4.3.2 Discussion of Results The goal of representing the historical architecture of Palazzo Vitelli in San Giacomo, including its multiple information, for administrative purposes in BIM was achieved from a geometric point of view, both through integration with other software and through the introduction of symbolic and parameterizable elements. As for the information, the shortcomings of the BIM software in relation to the historical-artistic field have been overcome by the use of a dedicated Shared Parameters file, which also shows the possibilities of future expansion of the information and makes the work exportable for the case study and repeatable for other buildings. The second part of the study has shown that by structuring an environment for sharing the historical-technical data, it is possible to maintain and extend the business capabilities of the model once it has been transferred to the end users. The planned data sharing environment respects, as much as possible, the requirements of the standard and uses only those resources that are directly available to the customer without incurring additional costs. The material created during the case study analysis was used for an initial implementation of the environment and illustrates the procedures that must be followed for effective use. At the same time, it was shown how the Common Data Environment can be extended to other disciplines and buildings thanks to the replicability of the processes.
4 Historic Building Information Modeling (HBIM) and Common Data …
73
4.4 Conclusions This course was developed during the time of the pandemic, which imposed a number of constraints on field activities, interactions, and comparison. Nevertheless, thanks to the virtual interactions, it was possible to develop the research that shows how the prerogative of the HBIM representation process, but focuses on the management and use of data and information. The paradigmatic approach to the representation of the complexity inherent in the uniqueness of the historicized architecture is proposed as a case study capable of encompassing all issues related to the management of public works (Fig. 4.14). The path developed shows, first of all, the principles and the fundamental questions that define the logic of modeling in the BIM environment of the historical architecture chosen as a case study, imposing precise choices for the representation of the artistic and architectural elements that characterize it. At the same time, we have proceeded to insert the collected historical information in the model to create a cognitive framework suitable for the management of the object, with the possibility of inserting data and information that characterize it, using the tools of BIM. If in civil engineering the areas that characterize the environment of BIM are the Architectural, Structural and Plant areas, in HBIM, in addition to revising and deepening the architectural features, including the peculiarities of the history, it is necessary to insert an additional area to represent the historical character, in order to emphasize the importance of this aspect and address the problem of its coordination in BIM. In the second case, the path to structured operational considerations led through the management and improvement of the information collected and organized in this way, by structuring an ad hoc Common Data Environment for the owner of the facility. This system has particularly taken into account the management of the
Fig. 4.14 A view of the courtyard of the BIM model
74
F. Bianconi et al.
historical aspects of the property to adapt to buildings such as that of the case study and others similar. The path developed shows how both the model and the implemented Common Data Environment are the first applications of an essential innovation in the rethinking of the model and the management of information, responding to the open logic of contemporary computer structures and implementing a renewal of the current system that still guarantees later extensions and refinements. The path shown has led to significant results that have triggered the path of innovation of the management structure, which, starting from this path, has increased its interest by awarding research contracts for further case studies. This application highlights an essential problem inherent to the revolution of BIM, which, at least in Italy, faces a technical structure of public institutions that has structural difficulties to absorb and integrate the proposed innovations. In particular, the actual development of the logic of BIM requires a reinterpretation of the entire digital ecosystem of public administration, starting at the national level and then in local authorities. Based on the results of this case study, a new path has been taken, in agreement with the Province of Perugia, which combines experimentation at the college with a rethinking of the digital ecosystem of the management of the assets to be managed, which in turn affects the local administrations where these assets are located. The common definition of protocols for modeling and Common Data Environments is then highlighted as a concrete area for the implementation of innovation, on a path that offers research as a support for the renewal of public institutions and as an ideal context for the first experiments of this revolution that is still in its infancy.
References 1. Bruno N, Roncella R (2019) HBIM for conservation: a new proposal for information modeling. Remote Sens 11(15):1751. https://doi.org/10.3390/rs11151751 2. Del Giudice M, Osello A (2013) Bim for cultural heritage. Int Arch Photogramm Remote Sens Spatial Inf Sci, XL-5/W2:225–229. https://doi.org/10.5194/isprsarchives-xl-5-w2-225-2013 3. Murphy M, Mcgovern E, Pavía S (2009) Historic building information modelling (HBIM). Struct Surv 27(4):311–327. https://doi.org/10.1108/02630800910985108 4. Garagnani S (2015) HBIM nell’esistente storico. Ingenio, pp 1–5 5. Centofanti M, Brusaporci S, Maiezza P (2016) Tra ‘HistoricalBIM’ ed ‘HeritageBIM’: Building Information Modeling per la Documentazione dei Beni Architettonici. ReUSO 2016:42–51 6. Brumara R, Oreni D, Raimondi A (2013) From survey to HBIM for documentation, dissemination and management of built heritage. Digit Herit Int Congr 2013:497–504. https://doi.org/ 10.1109/DigitalHeritage.2013.6743789 7. Jordan-Palomar I, Tzortzopoulos P, García-Valldecabres J, Pellicer E (2018) Protocol to manage heritage-building interventions using heritage building information modelling (HBIM). Sustainability 10(4). https://doi.org/10.3390/su10040908 8. Bruno N, Roncella R (2018) A restoration oriented HBIM system for cultural heritage documentation: The case study of Parma Cathedral. Int Arch Photogramm Remote Sens Spatial Inf Sci, XLII-2:171–178. https://doi.org/10.5194/isprs-archives-XLII-2-171-2018
4 Historic Building Information Modeling (HBIM) and Common Data …
75
9. Malinverni ES, Mariano F, Di Stefano F, Petetta L, Onori F (2019) Modelling in HBIM to document materials decay by a thematic mapping to manage the cultural heritage: the case of ‘chiesa della pietà’ in fermo. Int Arch Photogramm Remote Sens Spatial Inf Sci, XVII2/W11:777–784. https://doi.org/10.5194/isprs-Archives-XLII-2-W11-777-2019 10. Oreni D, Brumana R, Della Torre S, Banfi F, Barazzetti L, Previtali M (2014) Survey turned into HBIM: the restoration and the work involved concerning the Basilica di Collemaggio after the earthquake (L’Aquila). ISPRS Ann Photogramm Remote Sens Spatial Inf Sci II-5:267–273. https://doi.org/10.5194/isprsannals-II-5-267-2014 11. Oreni D (2016) Survey turned into HBIM: the restoration and the work involved concerning the Basilica Di Collemaggio after the Earthquake (L’Aquila). Built Herit Inf Model—BHIMM 12. Banfi F, Barazzetti L, Previtali M, Roncoroni F (2017) Historic BIM: a new repository for structural health monitoring. Int Arch Photogramm Remote Sens Spatial Inf Sci, XLII-5W1:269–274. https://doi.org/10.5194/isprs-Archives-XLII-5-W1-269-2017 13. Mol A, Cabaleiro M, Sousa HS, Branco JM (2020) HBIM for storing life-cycle data regarding decay and damage in existing timber structures. Autom Constr 117:103262. https://doi.org/10. 1016/j.autcon.2020.103262 14. Piselli C et al. (2020) An integrated HBIM simulation approach for energy retrofit of historical buildings implemented in a case study of a medieval fortress in Italy. Energies 13(10). https:// doi.org/10.3390/en13102601 15. Barazzetti L, Banfi F, Brumana R, Oreni D, Previtali M, Roncoroni F (2015) HBIM and augmented information: towards a wider user community of image and range-based reconstructions. Int Arch Photogramm Remote Sens Spatial Inf Sci, XL-5W7:35–42. https://doi. org/10.5194/isprsarchives-XL-5-W7-35-2015 16. Osello A, Lucibello G, Morgagni F (2018) HBIM and virtual tools: a new chance to preserve architectural heritage. Buildings 8(1):12. https://doi.org/10.3390/buildings8010012 17. Jouan P, Hallot P (2019) Digital Twin: a HBIM-based methodology to support preventive conservation of historic assets through heritage significance awareness. Int Arch Photogramm Remote Sens Spatial Inf Sci, XLII-2/W15:609–615. https://doi.org/10.5194/isprs-archivesXLII-2-W15-609-2019 18. Aubin PF, Milburn A (2013) Renaissance Revit: creating classical architecture with modern software, Color. CreateSpace Independent Publishing Platform, Scotts Valley 19. Murphy M, McGovern E, Pavia S (2013) Historic building information modelling—adding intelligence to laser and image based surveys of European classical architecture. ISPRS J Photogramm Remote Sens 76:89–102. https://doi.org/10.1016/j.isprsjprs.2012.11.006 20. Dore C, Murphy M (2014) Semi-automatic generation of as-built BIM façade geometry from laser and image data. ITcon J Inf Technol Constr 19:20–46 21. Oreni D, Brumana R, Georgopoulos A, Cuca B (2013) HBIM for conservation and management of built heritage: towards a library of vaults and wooden bean floors. ISPRS Ann Photogramm Remote Sens Spatial Inf Sci, II-5/W1:215–221. https://doi.org/10.5194/isprsannals-II-5-W1215-2013 22. Capone M, Lanzara E (2019) Scan-to-BIM vs 3D ideal model HBIM: Parametric tools to study domes geometry. Int Arch Photogramm Remote Sens Spatial Inf Sci, XLII-2/W9:219–226. https://doi.org/10.5194/isprs-archives-XLII-2-W9-219-2019 23. Garagnani S (2012) Building Information Modeling semantico e rilievi ad alta risoluzione di siti appartenenti al Patrimonio Culturale. Disegnarecon 5(10):297–302. Available: https://dis egnarecon.unibo.it/article/view/3359 24. López FJ, Lerones PM, Llamas J, Gómez-García-Bermejo J, Zalama E (2017) A framework for using point cloud data of heritage buildings toward geometry modeling in a BIM context: a case study on Santa Maria La Real De Mave Church. Int J Archit Herit 11(7):965–986. https:// doi.org/10.1080/15583058.2017.1325541 25. Nieto JE, Moyano JJ, Rico F, Antón D (2016) Management of built heritage via HBIM project: a case of study of flooring and tiling. Virtual Archaeol Rev 7(14):1–12. https://doi.org/10.4995/ var.2016.4349
76
F. Bianconi et al.
26. Yang X, Lu YC, Murtiyoso A, Koehl M, Grussenmeyer P (2019) HBIM modeling from the surface mesh and its extended capability of knowledge representation. ISPRS Int J Geo-Information 8(7):301. https://doi.org/10.3390/ijgi8070301 27. Garagnani S, Manferdini AM (2013) Parametric accuracy: building information modeling process applied to the cultural heritage preservation. Int Arch Photogramm Remote Sens Spatial Inf Sci, XL-5/W1:87–92. https://doi.org/10.5194/isprsarchives-xl-5-w1-87-2013 28. Thomson C (2015) Boehm J (2015) Automatic geometry generation from point clouds for BIM. Remote Sens 7(9):11753–11775. https://doi.org/10.3390/rs70911753 29. Xiong X, Adan A, Akinci B, Huber D (2013) Automatic creation of semantically rich 3D building models from laser scanner data. Autom Constr 31:325–337. https://doi.org/10.1016/ j.autcon.2012.10.006 30. Brusaporci S, Maiezza P, Tata A (2018) A framework for architectural Heritage HBIM semantization and development. Int Arch Photogramm Remote Sens Spatial Inf Sci, XLII-2:179–184. https://doi.org/10.5194/isprs-archives-XLII-2-179-2018 31. Rossi A, Palmieri U (2019) LOD per il patrimonio architettonico: la modellazione BIM per la fabbrica Solimene. Diségno 4:213–224. https://doi.org/10.26375/disegno.4.2019.20 32. Castellano-Román M, Pinto-Puerto F (2019) Dimensions and levels of knowledge in heritage building information modelling, HBIM: the model of the Charterhouse of Jerez (Cádiz, Spain). Digit Appl Archaeol Cult Herit 14, ne00110. https://doi.org/10.1016/j.daach.2019.e00110 33. Migilinskas D, Popov V, Juocevicius V, Ustinovichius L (2013) The benefits, obstacles and problems of practical BIM implementation. Procedia Eng 57:767–774. https://doi.org/10.1016/ j.proeng.2013.04.097 34. British Technical Standards Series 1192: BS 1192:2007, UK PAS 1192-2:2013 35. D.M. 1 December 2017, n. 560, Art. 2, comma 1 36. UNI 11337-5: 2017 37. Graziani GM (1897) L’arte a Città di Castello. Volume 1. Perugia: S. Lapi
Chapter 5
A Workflow for Photogrammetric and Thermographic Surveys of Buildings with Drones D. F. R. Parracho , J. Poças Martins , and E. Barreira
Abstract The interest in studying the energy performance of existing buildings has increased. Therefore, the integration of relevant information into BIM (Building Information Modelling) and BEM (Building Energy Modelling) is beneficial for energy information management and task automation. For an appropriate analysis of an existing building (“as-is”), it is possible to collect data on its 3D geometric properties and measure the thermal conditions of the building envelope to perform an energy analysis. The use of UAS (Unmanned Aircraft Systems)/drones has become a popular method for collecting building data because it offers advantages such as reduced labour, low cost, and easy access to locations that could not otherwise be reached. In addition, with the advancement of infrared (IR) sensors, which are getting smaller even smaller, it is possible to integrate them into drones. The IR data can be used to study building behaviour and pathologies, as different surface temperatures can be detected. Existing methods focus on fusing RGB (red–green–blue) and IR images, typically merging IR data with 3D geometry in a process that can later be integrated into BIM models. However, they do not achieve the advantages offered by this method with UAS and require additional equipment to perform the surveys. This paper presents a method for integrating building data obtained by photogrammetry and thermography into BIM environment, using only a UAS. In addition to this qualitative approach, a quantitative approach was developed using data collected by photogrammetry with the drone to perform an energy analysis of building envelopes. Keywords Drone · UAS · Photogrammetry · Infrared thermography · BIM · BEM D. F. R. Parracho (B) · J. Poças Martins CONSTRUCT-GEQUALTEC, Department of Civil Engineering (DEC), Faculty of Engineering (FEUP), University of Porto, Rua Dr. Roberto Frias S/N 4200-465, Porto, Portugal e-mail: [email protected] J. Poças Martins e-mail: [email protected] E. Barreira CONSTRUCT-LFC, Department of Civil Engineering (DEC), Faculty of Engineering (FEUP), University of Porto, Rua Dr. Roberto Frias S/N 4200-465, Porto, Portugal e-mail: [email protected] © The Author(s), under exclusive license to Springer Nature Switzerland AG 2023 M. N. González García et al. (eds.), New Advances in Building Information Modeling and Engineering Management, Digital Innovations in Architecture, Engineering and Construction, https://doi.org/10.1007/978-3-031-30247-3_5
77
78
D. F. R. Parracho et al.
5.1 Introduction Given the growing interest in studying the energy performance of existing buildings, it is beneficial to integrate building data into BIM and BEM models. However, in a BEM model, this information must be entered manually, which is a slower and more expensive process [1]. For an appropriate analysis of an existing building (“as-is”), it is possible to collect data on its 3D geometric features and measure the thermal conditions of the building envelope to subsequently perform an energy analysis [2, 3]. The increasing use of 3D technologies to study buildings has led to methods for merging RGB and IR images, typically integrating IR images with the 3D geometry in a process that can be mapped onto BIM models [4]—an approach known as 2D-3D matching (image to model) [2, 5]. IR images are a useful diagnostic tool for building inspections. The IR sensor can be used to detect different surface temperatures, allowing the study of building behaviour and pathologies. These sensors have been further developed to make them smaller and lighter so that they can be integrated into UAS [6]. The use of UAS to collect building data has become a popular method [2] because it offers advantages in terms of reduced labour, low cost, and easy access to hard-toreach locations [6, 7]. Although using RGB imagery to reconstruct 3D point clouds and mesh models with a UAS is now common practise, technologies that do the same with IR imagery still leave much to be desired due to shortcomings related to the low resolution of the IR camera, the effects of weather conditions, distance from the object [2], and potential reflectivity issues [8]. Shariq and Hughes [9] state that there is a lack of innovative proposals in the literature for large-scale inspection of energy buildings and that the development of automated, versatile, and cost-effective techniques for this type of inspection is being missed. Hou et al. [2] share this opinion and add that studies focusing on the fusion of thermal information points with RGB models are crucial. Cho et al. [3] also state that automated methods for 3D model reconstruction should be developed to make the process faster and less error-prone.
5.2 Integration of the Thermographic Data into BIM Models Generated from Photogrammetric Surveys with Drones 5.2.1 Literature Review In their 2018 literature review on the use of UAS for building inspection, Rakha and Gorodetsky explore the use of drones for various applications, including integration with thermography, building energy analysis, and the use of BIM. It should be noted,
5 A Workflow for Photogrammetric and Thermographic Surveys …
79
however, that this review does not consider the use of drones to integrate thermal building data into BIM models. Nevertheless, they note that work on integrating photogrammetry and thermography with BIM, which does not rely exclusively on drones, does not take a standard approach, which is a research gap [6]. A systematic literature review was conducted to find articles that exclusively use drones and the integration of photogrammetric and thermographic data with BIM models for subsequent qualitative or quantitative analysis. Data collection began in February 2021 using online article databases (ScienceDirect and Web of Science) using the keywords: “BIM”, “photogrammetry”, “thermography”, “drone” or “UAS” or “UAV”, “point cloud” and “Revit”, and the same terms in Portuguese. It should be noted that terms related to energy simulations (e.g., “BEM”) were not included in this search, as they derive from the previous tasks (as explained in the framework developed in Sect. 5.3). After combining these keywords, 907 references had to be screened, which were reduced to 600 after duplicates were removed. Based on the 2009 PRISMA method [10], 562 references were removed after reading the titles and abstracts, leaving 38 references for analysis. After adding references from these papers, which were not found in the database search, 48 articles remained. These were then carefully reviewed, and 18 of them were classified as containing BIM and 13 as containing UAS. Finally, the articles were evaluated in terms of how many of them followed the thought process of using RGB and IR data captured by a drone and integrating it into BIM. It turned out that only two articles followed this train of thought, which also included energy analyses of buildings. Figure 5.1(a) and 5.1(b) summarise the process. Only these two articles ([11, 12]) have addressed the proposed method in detail; however, they use not only drones but also laser scanners. Previtali et al. propose an approach to integrate photogrammetric and thermographic data obtained from drones AND terrestrial laser scanners to map thermographic textures onto 3D BIM model façades and investigate the energy efficiency of a building [11]. In [11], an AscTec Falcon 8 is used. This 2 kg drone with eight motors was equipped with a Sony NEX-5N camera and a FLIR Tau 640 as IR camera. For the survey, the cameras are calibrated and ground control points (GCPs) are used for image alignment in addition to other elements such as windows and doors. Later, automatic building modelling methods from point clouds (developed by the authors) are used along with the RANSAC method to segment point clouds. This data is then integrated with BIM, semantically enriching the model and mapping the IR images as textures onto the 3D BIM model. The process concludes with the conversion to the CityGML standard. In [12] the methodology is applied in a case study (a building of the Politecnico di Milano—Polo Territoriale di Lecco) to validate it. The authors present another case study on this building [13], but it does not focus on the use of UAS, but only on the laser scanning part. In this paper, the authors identify and fill a knowledge gap regarding the methodology for drone-exclusive photogrammetric and thermographic surveys and propose a framework for this purpose. This framework is described in Sect. 5.3.
80
D. F. R. Parracho et al.
Fig. 5.1 References obtainment process, based on PRISMA 2009 diagram flow [10] (a) and Venn Diagram of the final step of the process (b)
5.2.2 Data Collection Using Drones When performing photogrammetric and thermographic surveys with a UAS, several influencing factors must be considered. These factors include the angle of image acquisition, flight plan (drone flight path, image overlap, flight altitude, distance to the object, etc.), solar radiation, and weather conditions [2, 6]. Some authors propose detailed protocols for measuring the photogrammetric and thermographic data, e.g., Hou et al. [2] and Entrop and Vasenev [8]. Solar radiation and shadowing should be considered in thermographic surveys, although these factors are not as important when taking RGB images [2, 14]. The following should be considered when planning flights: . Drone battery and airspace legislation in force [15, 16] . The existence of obstacles that can cause accidents due to collisions, and the correct GPS signal for accurate georeferencing [6] . Wind speed [8, 17] and direction [8] . Precipitation [8, 17, 18] can cause noise on the images due to the raindrops, resulting in a deformed point cloud. Thermography results can also be distorted due to the presence of rainwater upon the surfaces [18] . Risks due to adverse weather conditions, other manned or unmanned aircraft [19], or possible bird attacks [20]
5 A Workflow for Photogrammetric and Thermographic Surveys …
81
. Electromagnetic fields, mainly in the vicinity of high-voltage cables, can interfere with the proper performance of the drone [21]. Drones can be controlled manually or automatically via mobile apps such as DroneDeploy or Drone Harmony. According to the literature, this type of app controls several important flight variables, including the angle of image acquisition and the percentage of image overlap, which are critical for drone surveys [14]. It should be noted that camera angles outside the range of 5°–60° should be avoided to prevent radiation reflections. Metallic surfaces and windows can also cause similar problems [8]. When choosing the time of day for photogrammetric and thermographic data collection, it is important to consider some variables (solar radiation, sunlight, and shadows) that can change the emissivity of materials and lead to incorrect results [6]. If only a thermographic survey is required, it can be performed during the night to minimise the effects of solar heat gain [6, 22]. Thermographic surveys must take into account the difference between the indoor and outdoor temperatures of the building [17]. Borrmann et al. [23] note that thermographic surveys benefit from stable weather conditions over an extended period of time. They also note that excessive sunlight should be avoided as it leads to errors, and that the ideal conditions for a thermographic survey are on partly cloudy mornings in winter. Photogrammetric and thermographic surveys can be conducted on the same day, but this is not necessary because the ideal conditions for both are considered independently, i.e., a day may have ideal conditions for a photogrammetric survey but not for a thermographic survey, and vice versa [18]. For UAS surveys, GCPs can be used to mark auxiliary points in the terrain for photogrammetric software [6], keeping in mind that they should be placed so that they are visible and do not interfere with nearby traffic. The size of these markers should be such that they can be detected at the planned flight height, and they should be evenly distributed over the terrain [24]. GCPs are typically used when high absolute accuracy or precise measurements are required (e.g., topographic surveys or some construction projects) [25]. When only relative project accuracy is required (e.g., when exporting to 3D BIM software [26]), these markers can be replaced with easily identifiable points that occur in multiple images (e.g., a window corner), called tie points—these can be recognised by the photogrammetry software (automatic tie points) or added manually by the user (manual tie points) [27].
5.2.3 Thermography Integration into BIM Models for Energy Analysis Studies The literature shows that three main approaches can be used to register IR images and 3D models: 2D-2D (image to image), 2D-3D (image to model), and 3D-3D (model
82
D. F. R. Parracho et al.
to model) [2, 5]. A 2D-3D approach is followed to integrate IR images with a BIM model [4]. According to Lagüela et al. [18], different methods can be used to combine geometry and thermography data. RGB images can be fused with IR images using photogrammetric techniques (2D-2D), or IR images can be combined with laser scan point clouds (2D-3D). In this paper, a method is described in which the geometry of a small building is collected with a laser scanner and thermographic data to obtain a 3D model, with the thermal data textured on a BIM model (qualitative approach). Later, an energy analysis is performed using the collected thermal information (quantitative approach). Natephra et al. [28] investigate how BIM models can be integrated with thermal 4D data for thermal performance analysis and thermal comfort assessment of a building. This 4D data and indoor thermal comfort conditions will be visualised at different locations in the building using BIM-compatible applications (Rhinoceros and Grasshopper) to identify potential thermal problems. A visual analysis of surface temperature in a building envelope is developed, and patterns of excessive heat loss and gain over time are revealed. Gigliarelli et al. [29, 30] apply a method for buildings of cultural interest that integrates thermal data with an HBIM model (Heritage BIM) to analyse a building’s energy performance and calculate solar gains. This approach uses Rhinoceros and Grasshopper to integrate data and EnergyPlus to perform simulations. Ham and Golparvar-Fard [31], propose an automatic method to update the thermal properties of BIM elements based on the as-is condition of a building. Thermal resistance values (R-values) are assigned to the BIM model. The authors collect on-site data using thermal imaging and digital imagery and obtain a 3D point cloud through computer vision algorithms. Cho et al. [3] state that in order to use performance estimation algorithms and BIM in simulations, it is essential to classify the components of a building envelope as individual objects. Although this is a literature review on the integration of thermal data with BIM, these methods focus only on the use of terrestrial means (such as laser scanners), not drones.
5.3 Methodology Proposal for Photogrammetric and Thermographic Surveys of Existing Buildings with Drones 5.3.1 Overview A methodology for UAS-exclusive photogrammetric and thermographic surveys of existing buildings is shown in Fig. 5.2. The proposal follows a continuous workflow that starts with the preparation of the surveys, image acquisition, and data processing with appropriate software so that a 3D BIM model can then be created. After these
5 A Workflow for Photogrammetric and Thermographic Surveys …
83
Fig. 5.2 Methodology for UAS-exclusive photogrammetric and thermographic surveys of existing buildings
steps, two approach scenarios are proposed: a qualitative approach, where the IR images are added to the BIM model, and a quantitative approach, where the collected data are used for energy simulations with BEM software. A more detailed explanation of the methodology can be found in [32] (in Portuguese).
5.3.2 Reconnaissance and Preparation Before starting the process, a suitable drone must be selected for surveying [33]. To start the actual workflow, it is crucial to review some preparatory aspects for photogrammetric and thermographic drone surveys, i.e., assess the applicable legislation [21, 33], plan the flight in advance, and check the site conditions [21, 33–35]. To support the BIM modelling process, it is recommended to obtain useful information about the building whenever possible [21, 28, 33, 34]. Drone selection. Drones selected for the survey must be capable of capturing both RGB and IR images. To obtain usable IR data, the image resolution should be at least 640–480 px [36]. Some examples of UAS with the required IR capabilities are the DJI Mavic 2 Enterprise Advanced and the Autel EVO II Dual quadcopters [32]. Note that strict regulations currently apply to UAS operations. Countries under EASA (European Union Aviation Safety Agency) jurisdiction (such as Portugal and Spain) must comply with Commission Delegated Regulation (EU) 2019/945 [37]
84
D. F. R. Parracho et al.
and Commission Implementing Regulation (EU) 2019/947 [38], as well as applicable national regulations. Applicable legislation regarding the building location. As noted above, operations must comply with applicable airspace laws (including geographic zones). Permits to fly are usually required for legal flights [7] (e.g., permission to take photographs so as not to violate privacy laws). In EASA countries, the drone operator (the owner), the remote pilot responsible for the flight, and the drone itself must be registered on the national aviation authority website [38]. Check the building’s surroundings: depending on the characteristics of the UAS (weight, maximum speed, etc.), there is a maximum distance that a UAS is allowed to have from people and buildings (see [38] for EASA countries). Assessment of site conditions, including obstacles and weather conditions. Even if flying is allowed in a particular zone, other factors must be considered, such as proximity to power lines, schools, hospitals, or other obstacles. Some mobile apps help identify these restrictions (e.g., Guardian by Altitude Angel). For recommendations on obstacles and weather conditions, see Sect. 5.2.2. Remote pilots must self-assess their flight conditions. The I’M SAFE checklist [39] can be used as a reference. Flight Planning. Existing obstacles affect the UAS flight planning process. If flying without obstacles is possible, mobile apps that can plan automatic flights can be used (see Sect. 5.2.2). For accurate data collection, it is recommended to use the following protocol based on existing ones: . Flight height—preferably above the tallest building in the vicinity, maximum 1.5 times this height [2] . Distance to the building—different suggestions can be found in [6]. Due to atmospheric influence on the correct IR data, a distance of 10 m from the building is recommended [40]. This distance should be adjusted to the surroundings of the building (presence of other buildings, walls, etc.) . Flight plan—for façades, on a horizontal line extending over the entire surface, after which the drone moves at a 1.25 times height difference from the previous line (see Fig. 5.3). For roofs, it can be circular, elliptical, grid [6] or Y-shaped (several overlapping flights) [2] . Camera angle of the drone—45° for façades and 30° for roofs [2], within the interval 5°–60° where the radiation is not reflected [8] . Image overlap—90% both frontal and lateral [26]. Search for design elements. Design elements are useful for geometric modelling and for capturing the correct material properties (e.g., thickness) that will later be incorporated into the BIM model. Correctly capturing these properties is a fundamental step for quantitative approaches, as the models require quantification of the thermal properties of the materials (U-values or R-values) for proper building energy performance analysis [28].
5 A Workflow for Photogrammetric and Thermographic Surveys …
85
Fig. 5.3 Using Drone Harmony’s mobile app to plan a flight to survey a facade. In this case the flight height had to be lower than the one suggested in the protocol to avoid colliding with obstacles
Some useful documents are building plans, technical specifications, building registers, etc. [21].
5.3.3 Image Collection Using Drones In this phase, the equipment is first calibrated and, if necessary, the survey site is prepared using georeferencing methods [11, 21, 33, 35] (physical GCPs may be dispensed). Then data acquisition can begin, which is the back bone of the following steps. Equipment calibration. For correct and safe operation of the drone, it is necessary to calibrate the equipment. For this step, follow the drone’s user manual (example: [16]). It is highly recommended to enable MSX (Multi-Spectral Dynamic Imaging) for thermographic surveys [40]. It is recommended to capture IR images in a constant temperature range so that the image coloration and temperature legend do not change [28]. Both the maximum and minimum temperatures should be within the selected scale [40]. Possible use of methods to support georeferencing. As mentioned in Sect. 5.2.2, it is possible to use GCPs to mark auxiliary points in the terrain for photogrammetric programs. For drones using RTK (Real-Time Kinematic), these points are not necessary as they do not significantly affect the absolute accuracy of georeferencing [27]. Pix4D SA acknowledges that clearly satisfactory 3D reconstructions can be produced without the use of GCPs for photogrammetric surveys, although there may be issues with orientation, scale, or absolute positioning. Automatic and manual tie points can improve 3D reconstruction, but not absolute positioning, only relative positioning [27].
86
D. F. R. Parracho et al.
The goal of this 3D photogrammetric model is to export to 3D BIM software; therefore, relative accuracy is most important in these cases [26] (as mentioned in Sect. 5.2.2). As noted in the same Sect. 5.2.2, physical GCPs can be replaced with easily identifiable points that occur in multiple images (tie points)—such as a window corner—[27] to improve the quality of the photogrammetric model [11, 33], and five to ten similar points can be used as checkpoints to evaluate accuracy only [41]. Markings already present in the field are considered a valid substitute for conventional GCPs, so they can be used if any are available in the area under study [27]. Image collection. After completing the previous steps, the image collection can begin. Figure 5.4 shows an example of a photogrammetric and a thermographic survey using the same drone (note that this example does not follow the flight plan described in Sect. 5.3.2). Remember to have all the necessary documentation, courses, credentials, and insurance to fly the drone in compliance with government regulations.
Fig. 5.4 Example of a photogrammetric (up) and a thermographic survey (down) with a drone
5 A Workflow for Photogrammetric and Thermographic Surveys …
87
5.3.4 Processing and Analysis of the Collected Images In this framework, the digital building model is created from images using appropriate software applications [21, 33]. After obtaining the 3D point cloud of the building, the point cloud must be cleaned [21, 33]. This whole phase influences the later BIM modelling and therefore must be successful [11, 34, 35]. Photogrammetric model (point cloud and 3D mesh model). This step aims to reconstruct a dense point cloud (a representation of several information points corresponding to the current state of the studied building in terms of its features [34]) based on the images acquired during the survey. At this stage, software that can process the input data must be used to digitally reconstruct 3D objects from the images [21]. Professional software packages such as Agisoft and Pix4D provide satisfactory results [42]. Cleanup of the point cloud. After the point cloud is created, points from the environment or background of the building (trees, other buildings, sky, etc.) are visible on the acquired images in addition to the objects of interest. These superfluous points should be removed [21, 33], as can be seen in Fig. 5.5. Fig. 5.5 Unnecessary points removal process, in this case in Pix4Dmapper
88
D. F. R. Parracho et al.
5.3.5 Integration into and Modelling in BIM Environment The point cloud created with photogrammetric software must be exported and then imported into BIM authoring software. In the case study, Autodesk Revit was successfully used. Before that, some intermediate steps are required to perform a proper process from cloud to BIM [34]. The point cloud is then used as a reference for the modelling process [34, 35]. Importing the point cloud into Autodesk Revit. Before importing into BIM environment, the created point cloud must be exported. According to Opincar [42], LAS is a valuable format for exporting 3D point clouds created with photogrammetric or LiDAR data, which can then be integrated into the BIM environment. When using Revit as an authoring application, the exported point cloud file must first be imported into Autodesk ReCap to convert it to an appropriate format (.rcp or .rcs) [34]. 3D BIM Modelling. After importing the point cloud, the BIM modeller should check if the orientation of the building needs to be adjusted, and then set the building planes [34]. The correct orientation of the building is related to the energy simulations [43] and therefore needs to be accurate. Based on the imported point cloud, the modelling components (essentially walls, roof, doors, and windows) are defined [34, 44], and the correct dimensions and positions of these basic elements must also be considered for the subsequent energy analysis [44]. Figure 5.6 shows an example of a BIM model with (left) and without (right) the point cloud used. For quantitative approaches, in addition to the exact geometric modelling, the material properties in the BIM model are also an essential factor, so they must be taken into account in the modelling [28].
Fig. 5.6 Example of a BIM model with its point cloud (left) and after its removal (right)
5 A Workflow for Photogrammetric and Thermographic Surveys …
89
5.3.6 Integration of IR Images with the BIM Model (Qualitative Approach) The qualitative approach integrates IR images taken with a drone and uses a method to texture these images on the 3D model [11, 26]—a 2D-3D method known as texture mapping [11]. In this approach, thermography-sensitive anomalies are displayed directly on the BIM model [12]. If the IR camera allows it, the methodology developed by Lagüela et al. can be used. In this method, data from IR point clouds/mesh models are transferred to the facades of the 3D BIM model [18], eliminating the need for initial processing. Fitting and merging IR images. When direct integration of IR point clouds into a 3D BIM model is not possible, a time-consuming intermediate process must be performed [18]. This process consists in adjusting the perspective of the IR images if they are not taken parallel to the surface (camera perpendicular to the surface) [28, 45]—exactly the case for drone images, since, as mentioned in Sect. 5.2.2, the camera angle must avoid radiation reflections [8]. Thus, if several images of the same surface are available, they should be merged into a single one that exactly matches the surface to be textured on the BIM model [26, 28, 45]. This should take into account the distortion of the IR camera lens, which occurs mainly at the edges of the images [11]. This process of fitting and merging requires graphical software such as Adobe Photoshop [28, 45]. Alternatively, software capable of texturing images not taken parallel to the surface directly on the model can be used. Blender is an example of this [32]. Measurement of temperature. Since IR data is acquired during the survey, it is interesting to know the temperature range acquired. Therefore, the IR camera must have radiometric capabilities during the flight and in the post-processing phase. Therefore, the UAS must be able to save or convert temperature information in formats that save the thermal information of each pixel [46, 47]. It is recommended to use formats that allow post-flight correction of radiometric parameters [46], such as tiff, rjpeg, and rjpg [46, 47]. The latter formats are the most recommended [36, 47, 48], since tiff files have some problems in storing thermal data in comparison [46, 47]. The thermal data can be used with software that can convert thermographic colours to temperatures, such as FLIR Tools, or with custom applications developed with MatLab [46] and Visual Basic [28]. It should be noted that some UAS are not able to perform post-flight tasks despite their radiometric cameras. This is the case with the DJI Mavic 2 Enterprise Dual [40]. Texture mapping of the IR images onto the 3D BIM model. A 2D-3D process known as texture mapping can be used to integrate IR images onto a 3D BIM model [11]. There are several software solutions for this, such as Autodesk 3ds Max, PhotoModeler, and Geomagic Studio [11]. Blender is a free solution that can import IFC (Industry Foundation Classes) files for texturing in conjunction with an add-on (BlenderBIM Add-On) [32]. An example can be seen in Fig. 5.7.
90
D. F. R. Parracho et al.
Fig. 5.7 IR texture mapping process in Blender while adjusting the main points
After these steps, the IR-textured BIM model is completed.
5.3.7 Energy Simulation on BEM Software (Quantitative Approach) Before beginning energy simulations, data interoperability issues must be considered, particularly the data exchange formats between 3D BIM and simulation software [49, 50]. This section addresses the data transfer formats from BIM to BEM and the preparation of the BEM model itself. Data transfer formats from BIM to BEM. Data formats such as IFC and gbXML (Green Building eXtensible Markup Language) [43, 49, 50], CityGML [11, 12], or IDF [51] can transfer information between BIM and BEM software. The first two are considered the most commonly used BIM-to-BEM formats [1, 49]. In order to proceed with energy simulations, it is helpful to simplify the building geometry [43, 52, 53]. Element collisions must be avoided because they create gaps in the simulation model [43]. The more complex the model, the worse the performance will be. In the worst case, complex models can lead to complete failure of the simulation experiment [49]. Although there are no standard BIM requirements for energy analysis in BIM-to-BEM processes, it is recommended to work with LOD 200–300 to accurately represent building data. In contrast, LOD 100 can be used for less detailed studies, such as initial investigations of a building’s shape and orientation [54]. For BIM-to-BEM methods, gbXML has been proved to have better performance than IFC [1, 53]; therefore, this is the recommended format. Note that there are still interoperability issues with both formats that need to be resolved [1, 50]. BIM-to-BEM energy simulations and software. Not all of the many energy simulation software applications available are compatible with BIM solutions [43].
5 A Workflow for Photogrammetric and Thermographic Surveys …
91
Fig. 5.8 A building’s representation in DesignBuilder after importing from Autodesk Revit
One recommended BEM software is DesignBuilder, as it is possible to export a gbXML file from Autodesk Revit with the building geometry and then insert the required properties into DesignBuilder (an example is shown in Fig. 5.8) to avoid information loss in the transfer process [55], or through a plug-in between the two [52, 53]. Information requirements that must be considered when creating a BEM model include building geometry, material properties, HVAC systems and lighting characteristics, local weather data, and operational data (occupancy, schedules, etc.) [43, 51, 56]. Geometric data form the basis of these models, as all physical properties of the construction are linked to them, while information about the building’s systems and operations is entered manually and processed directly in the BEM software [51]. Consequently, this shows the importance of the photogrammetric data acquired.
5.4 Conclusion and Further Work This paper proposes a method for UAS-exclusive photogrammetric and thermographic surveys for existing buildings. This proposal fills a gap in the literature where no similar UAS-BIM-BEM framework has been found. The method was developed to take advantage of the use of drones, such as reduced human effort, low cost, and easy access to otherwise inaccessible locations [6, 7]. The proposal follows a continuous workflow that begins with survey preparation, image acquisition, and data processing with appropriate software so that a 3D BIM model can then be created. After these steps, two approach scenarios are proposed: a qualitative approach, where the IR images are added to the BIM model, and a quantitative approach, where the acquired data are used for energy simulations with BEM software.
92
D. F. R. Parracho et al.
As a suggestion for further development, the methodology should be extended to include IR data in energy simulations. This will require appropriate hardware, as not all UAS provide full access to thermal data, and should result in more detailed simulation models being developed quickly. Since the quantitative approach only uses data from the exterior of the building, the methodology needs to be extended to achieve a full performance analysis by also capturing geometric information from the interior of the building. Acknowledgements This work was financially supported by: Base Funding—UIDB/04708/2020 of the CONSTRUCT—Instituto de I&D em Estruturas e Construções—funded by national funds through the FCT/MCTES (PIDDAC); and the research project “REV@CONSTRUCTION”, with reference POCI-01-0247-FEDER-046123, co-funded by the European Regional Development Fund (ERDF) through the Operational Programme for Competitiveness and Internationalization (COMPETE 2020), under the Portugal 2020 Partnership Agreement.
References 1. Gao H, Koch C, Wu Y (2019) Building information modelling based building energy modelling: a review. Appl Energ 238:320–343. https://doi.org/10.1016/j.apenergy.2019.01.032 2. Hou Y, Volk R, Chen M, Soibelman L (2021) Fusing tie points’ RGB and thermal information for mapping large areas based on aerial images: a study of fusion performance under different flight configurations and experimental conditions. Automat Constr 124:103554. https://doi. org/10.1016/j.autcon.2021.103554 3. Cho YK, Ham Y, Golpavar-Fard M (2015) 3D as-is building energy modeling and diagnostics: a review of the state-of-the-art. Adv Eng Inform 29:184–195. https://doi.org/10.1016/j.aei.2015. 03.004 4. Daffara C, Muradore R, Piccinelli N, Gaburro N, de Rubeis T, Ambrosini D (2020) A costeffective system for aerial 3D thermography of buildings. J Imag 6(8):76. https://doi.org/10. 3390/jimaging6080076 5. Lin D, Jarzabek-Rychard M, Tong X, Maas H-G (2019) Fusion of thermal imagery with point clouds for building façade thermal attribute mapping. ISPRS J Photogramm 151:162–175. https://doi.org/10.1016/j.isprsjprs.2019.03.010 6. Rakha T, Gorodetsky A (2018) Review of unmanned aerial system (UAS) applications in the built environment: towards automated building inspection procedures using drones. Automat Constr 93:252–264. https://doi.org/10.1016/j.autcon.2018.05.002 7. Karachaliou E, Georgiou E, Psaltis D, Stylianidis E (2019) UAV for mapping historic buildings: from 3D modelling to BIM. Int Arch Photogramm Remote Sens Spatial Inf Sci 42–2:397–402. https://doi.org/10.5194/isprs-archives-XLII-2-W9-397-2019 8. Entrop AG, Vasenev A (2017) Infrared drones in the construction industry: designing a protocol for building thermography procedures. Energy Procedia 132:63–68. https://doi.org/10.1016/j. egypro.2017.09.636 9. Shariq MH, Hughes BR (2020) Revolutionising building inspection techniques to meet largescale energy demands: a review of the state-of-the-art. Renew Sust Energ Rev 130:109979. https://doi.org/10.1016/j.rser.2020.109979 10. Moher D, Liberati A, Tetzlaff J, Altman DG (2009) Preferred reporting items for systematic reviews and meta-analyses: The PRISMA statement. Plos Med 6:e1000097. https://doi.org/10. 1371/journal.pmed.1000097 11. Previtali M, Barazzetti L, Brumana R, Roncoroni F (2013) Thermographic analysis from UAV platforms for energy efficiency retrofit applications. J Mob Multimedia 9(1–2):66–82
5 A Workflow for Photogrammetric and Thermographic Surveys …
93
12. Previtali M, Barazzetti L, Roncoroni F (2013) Spatial data management for energy efficient envelope retrofitting. In: Murgante B, Misra S, Carlini M, Torre CM, Nguyen HQ, Taniar D, Apduhan BO, Gervasi O (eds) 13th international conference on computational science and applications (ICCSA 2013), Ho Chi Minh City, pp 608–621. https://doi.org/10.1007/978-3642-39637-3_48 13. Previtali M, Barazzetti L, Brumana R, Cuca B, Oreni D, Roncoroni F, Scaioni M (2013) Automatic façade segmentation for thermal retrofit. Int Arch Photogram Remote Sens Spatial Inf Sci XL-5/W1:197–204. https://doi.org/10.5194/isprsarchives-xl-5-w1-197-2013 14. Hou Y, Soibelman L, Volk R, Chen M (2019) Factors affecting the performance of 3D thermal mapping for energy audits in a district by using infrared thermography (IRT) mounted on unmanned aircraft systems (UAS). In: Proceedings of the 36th international symposium on automation and robotics in construction—ISARC 2019, Banff, pp 266–273. https://doi.org/10. 22260/isarc2019/0036 15. International Civil Aviation Organization (2020) [Advisory Circular (AC) 101-1]—Unmanned aircraft systems (UAS) [25 kilograms or less] Operating in compliance with [Part 101] rules. https://www.icao.int/safety/UA/UAID/Documents/AC%20101-1.pdf. Accessed 15 Dec 2021 16. DJI (2021) Mavic 2 enterprise series user manual v1.8. https://dl.djicdn.com/downloads/ Mavic_2_Enterprise/20210413/Mavic_2_Enterprise_Series_User_Manual-EN.pdf. Accessed 15 Dec 2021 17. Van De Vijver S, Steeman M, Van Den Bossche N, Carbonez K, Janssens A (2014) Influence of environmental parameters on the thermographic analysis of the building envelope. In: Proceedings of the 12th international conference on quantitative infrared thermography, Bordeaux. https://doi.org/10.21611/qirt.2014.148 18. Lagüela S, Díaz-Vilariño L, Armesto J, Arias P (2012) Thermographic 3D models as the foundation for building information models. In: 11th international conference on quantitative infrared thermography, Naples. https://doi.org/10.21611/qirt.2012.180 19. International Civil Aviation Organization (2011) ICAO Cir 328—unmanned aircraft systems (UAS). Montréal 20. Flynt J (2019) How to avoid bird attacks on your drone. https://3dinsider.com/bird-drone-att acks/. Accessed 15 Dec 2021 21. Shibasaki A (2019) Inspeção da Torre do Monte da Virgem com o Auxílio de Veículo Aéreo Não Tripulado. MSc Dissertation, Instituto Superior de Engenharia do Porto, Porto 22. Colantonio A, McIntosh G (2007) The differences between large buildings and residential infrared thermographic inspections is like night and day. In: 11th Canadian conference on building science and technology, Banff 23. Borrmann D, Nüchter A, Ðakulovi´c M, Maurovi´c I, Petrovi´c I, Osmankovi´c D, Velagi´c J (2014) A mobile robot based system for fully automated thermal 3D mapping. Adv Eng Inform 28:425–440. https://doi.org/10.1016/j.aei.2014.06.002 24. Corrêa AL, Quaresma JE (2018) Uso de Drone em Levantamento Planialtimetrico para Obtenção de Ortofoto e Modelo Digital do Terreno. Revista Científica Semana Acadêmica 1:19 25. DroneDeploy (2017) When to use ground control points—how to decide if your drone mapping project needs GCPs. https://medium.com/aerial-acuity/when-to-use-ground-controlpoints-2d404d9f5b15. Accessed 15 Dec 2021 26. Han D, Huh J (2019) Thermal data fusion for building insulation. In: 2019 international conference on system science and engineering (ICSSE), Dong Hoi, pp 368–371. https://doi.org/10. 1109/ICSSE.2019.8823350 27. Pix4D SA (2019) Ground control points: why are they important? https://www.pix4d.com/ blog/why-ground-control-points-important. Accessed 15 Dec 2021 28. Natephra W, Motamedi A, Yabuki N, Fukuda T (2017) Integrating 4D thermal information with BIM for building envelope thermal performance analysis and thermal comfort evaluation in naturally ventilated environments. Build Environ 124:194–208. https://doi.org/10.1016/j.bui ldenv.2017.08.004
94
D. F. R. Parracho et al.
29. Gigliarelli E, Calcerano F, Cessari L (2017) Heritage BIM, numerical simulation and decision support systems: an integrated approach for historical buildings retrofit. Energy Procedia 133:135–144. https://doi.org/10.1016/j.egypro.2017.09.379 30. Gigliarelli E, Calcerano F, Calvano M, Ruperto F, Sacco M, Cessari L (2017) Integrated numerical analysis and building information modeling for cultural heritage. In: Building simulation applications BSA 2017—3rd IBPSA-Italy Conference, Bolzano, pp 105–112 31. Ham Y, Golparvar-Fard M (2015) Mapping actual thermal properties to building elements in gbXML-based BIM for reliable building energy performance modeling. Automat Constr 49:214–224. https://doi.org/10.1016/j.autcon.2014.07.009 32. Parracho DFR (2021) Processos Digitais para a Realização de Levantamentos Fotogramétricos e Termográficos com Veículos Aéreos Não Tripulados (VANT). MSc Dissertation, Faculdade de Engenharia da Universidade do Porto, Porto 33. Ribeiro D, Santos R, Shibasaki A, Montenegro P, Carvalho H, Calçada R (2020) Remote inspection of RC structures using unmanned aerial vehicles and heuristic image processing. Eng Fail Anal 117:104813. https://doi.org/10.1016/j.engfailanal.2020.104813 34. Martínez-Carricondo P, Carvajal-Ramírez F, Yero-Paneque L, Agüera-Vega F (2020) Combination of nadiral and oblique UAV photogrammetry and HBIM for the virtual reconstruction of cultural heritage. Case study of Cortijo del Fraile in Níjar, Almería (Spain). Build Res Inf 48:140–159. https://doi.org/10.1080/09613218.2019.1626213 35. Qu T, Zang W, Peng Z, Liu J, Li W, Zhu Y, Zhang B, Wang Y, Janssen P, Loh P (2017) Construction site monitoring using UAV oblique photogrammetry and BIM technologies. In: Janssen P, Loh P, Raonic A, and Schnabel MA (eds) Protocols, flows and glitches, Proceedings of the 22nd international conference of the association for computer-aided architectural design research in Asia (CAADRIA), Hong Kong, pp 655–662 36. Rakha T, Liberty A, Gorodetsky A, Kakillioglu B, Velipasalar S (2018) Heat mapping drones: an autonomous computer-vision-based procedure for building envelope inspection using unmanned aerial systems (UAS). Technol Archit Des 2:30–44. https://doi.org/10.1080/ 24751448.2018.1420963 37. The European Commission (2019) Commission delegated regulation (EU) 2019/945—of 12 March 2019—on unmanned aircraft systems and on third-country operators of unmanned aircraft systems. Off J Eur Union 62:L152/1–L152/40 38. The European Commission (2019) Commission implementing regulation (EU) 2019/947—of 24 May 2019—on the rules and procedures for the operation of unmanned aircraft. Off J Eur Union 62:L152/45–L152/71 39. Jarrel T (2019) Check yourself—Every pilot should be part of their own preflight. https://www. aopa.org/news-and-media/all-news/2019/june/07/are-you-fit-to-fly. Accessed 15 December 2021 40. Magalhães RAA (2021) Avaliação das Potencialidades da Termografia de Infravermelhos Associada a Drones para a Inspeção Digital de Edifícios. MSc Dissertation, Faculdade de Engenharia da Universidade do Porto, Porto 41. Pix4D SA (2018) Do more GCPs equal more accurate drone maps? https://www.pix4d.com/ blog/GCP-accuracy-drone-maps. Accessed 15 Dec 2021 42. Opincar E (2016) Assessing the technology used by UAVs in data acquisition on construction sites. MSc Dissertation, University of Washington, Seattle, WA 43. Alhaidary H, Al-Tamimi AK, Al-Wakil H (2019) The combined use of BIM, IR thermography and HFS for energy modelling of existing buildings and minimising heat gain through the building envelope: a case-study from a UAE building. Adv Build Energy Res. https://doi.org/ 10.1080/17512549.2019.1703812 44. Wang C (2015) Cho YK (2015) Performance evaluation of automatically generated BIM from laser scanner data for sustainability analyses. Procedia Eng 118:918–925. https://doi.org/10. 1016/j.proeng.2015.08.531 45. Natephra W, Motamedi A, Yabuki N, Fukuda T, Michikawa T (2016) Building envelope thermal performance analysis using BIM-based 4D thermal information visualization. In: 16th international conference on computing in civil and building engineering (ICCCBE2016), Osaka, pp 1539–1546
5 A Workflow for Photogrammetric and Thermographic Surveys …
95
46. FLIR Systems (2020) UAS image pixel to temperature conversion? https://flir.custhelp.com/ app/answers/detail/a_id/3496/. Accessed 15 Dec 2021 47. FLIR Systems (2017) FLIR Duo & Duo R user guide. https://thermalcapture.com/wp-content/ uploads/2017/01/FLIR-Duo-User-Guide.pdf. Accessed 15 December 2021 48. Pix4D SA (2018) Processing thermal images. https://support.pix4d.com/hc/en-us/articles/360 000173463-Processing-thermal-images. Accessed 15 Dec 2021 49. Bastos Porsani G, Del Valle De Lersundi K, Sánchez-Ostiz Gutiérrez A, Fernández Bandera C (2021) Interoperability between building information modelling (BIM) and building energy model (BEM). Appl Sci-Basel 11:2167. https://doi.org/10.3390/app11052167 50. Kamel E, Memari AM (2019) Review of BIM’s application in energy simulation: tools, issues, and solutions. Automat Constr 97:164–180. https://doi.org/10.1016/j.autcon.2018.11.008 51. Queiróz G, Grigoletti G, Santos J (2019) Interoperability between Autodesk Revit and EnergyPlus for thermal simulations of buildings. PARC Pesquisa em Arquitetura e Construção 10:e019005. https://doi.org/10.20396/parc.v10i0.8652852 52. Elnabawi MH, Hamza N (2019) Investigating building information model (BIM) to building energy simulation (BES): interoperability and simulation results. IOP Conf Ser: Earth Environ Sci 397:12013. https://doi.org/10.1088/1755-1315/397/1/012013 53. Elnabawi MH (2020) Building information modeling-based building energy modeling: investigation of interoperability and simulation results. Front Built Environ 6:573971. https://doi. org/10.3389/fbuil.2020.573971 54. Sanhudo L, Poças Martins J, Ramos NMM, Almeida RMSF, Rocha A, Pinto D, Barreira E, Simões ML (2021) BIM framework for the specification of information requirements in energy-related projects. Eng Constr Archit Ma 28:3123–3143. https://doi.org/10.1108/ECAM07-2020-0488 55. Pimentel BP, Barbosa ATR, De SMD (2020) Análise de Métodos de Integração entre BIM e Simulação Termo Energética de Edificações Militares. Revista Gestão & Sustentabilidade Ambiental 9:125–146. https://doi.org/10.19177/rgsa.v9e02020125-146 56. Sanhudo L, Ramos NMM, Poças Martins J, Almeida RMSF, Barreira E, Simões ML, Cardoso V (2018) Building information modeling for energy retrofitting—A review. Renew Sust Energ Rev 89:249–260. https://doi.org/10.1016/j.rser.2018.03.064
Chapter 6
Digital Asset Production Using Lean Design Management: A Conceptual Framework M. Karaz and J. C. Teixeira
Abstract While design management is advancing in construction management research and professional practice, various questions were raised on the interactions between social and technical dimensions. The technical dimension provided prescriptions and standard methods to manage design workflows using BIM methodologies and linked digital tools. The social dimension streamlines basis for collaborative information production and identifies the relationship between the involved parties during developing and exchanging the digital asset. Hence, the concepts of waste and value are the basis for current guidelines to improve design productivity and information reliability. Therefore, this paper reviews the theories of lean design management and lean practice in information production management using communication tools for BIM workflows. The paper qualitatively analyzed lean design methods at directive and operational levels during planning for digital asset production. Finally, the paper explores the connections between lean design and BIM Execution Plan (BEP) and Level of Development (LOD) communication tools. A thorough literature review is applied to the current standards of construction information management and lean design management in the same field. The study found that lean construction concepts are implicitly applied in the current information management standards, but the social dimensions were rarely captured, and the existing task management software is external to BIM standards and functionalities. The study provides a general understanding of waste in information and production, and it explains the shortcomings of the current information management practices using traditional methods. Keywords Production theory · Standardization · Information management · Information waste
M. Karaz (B) · J. C. Teixeira Faculty of Civil Engineering, School of Engineering, University of Minho, Campus de Azurém, 4800-058 Guimarães, Portugal e-mail: [email protected] J. C. Teixeira e-mail: [email protected] © The Author(s), under exclusive license to Springer Nature Switzerland AG 2023 M. N. González García et al. (eds.), New Advances in Building Information Modeling and Engineering Management, Digital Innovations in Architecture, Engineering and Construction, https://doi.org/10.1007/978-3-031-30247-3_6
97
98
M. Karaz and J. C. Teixeira
6.1 Introduction In alignment with the growing acceptance of BIM and linked data methodologies, the concept of information waste is getting more attention in design management research and professional practice, to improve design processes and information flow. The literature showed difficulties in managing BIMs in terms of quality and production, specifically in communication between the involved parties. Designers can generate more information in a shorter time with current BIM functionalities, which can overcome tight schedules, but the produced information may be imposed to prolonged inspection periods. The evidence shows that designers spend 70% of their time on reviews and 13% on resolving reworks [1], caused by uncontrolled WorkIn-Progress WIP and large batches. That may hinder the efficiency of information production workflows and information flows. Construction design is information-intensive, and the reliability of information is an essential factor to stabilize production plans and to facilitate effective methods for capturing information requirements from multidisciplined parties [2]. Ideal situation for stable design is an instant availability for information, this information can be in form of model elements, process status, process maps, documents, and other types of information. However, one major cause for design wastes, is the unavailability of required information as a failure in capturing information requirements for digital and physical assets between the diverse parities. The required information should be available when needed for involved actors, stages, product use, and specific milestone. Thus, it is necessary to control exchanges between the distributed information. Approaches from technical standards are not enough to facilitate communication between the fragmented supply chain of the digital asset. Therefore, a sociotechnical approach is recommended to provide better connection between parties while discussing planning for new products, and processes. Lean design management was brought from the manufacturing industry and adapted to the construction based on the Transformation, Flow, Value TFV theory, as explained in Fig. 6.1. The Last Planner System (LPS) was derived as a lean system to improve planning reliability and decrease the negative effect of plan uncertainties. The word “Last-Planner” in LPS stresses the importance of operators (people at the end of production line) to regulate production on a real-time basis. Thus, a linguistic action method was necessary to communicate plans as promises between the involved teams. The primary purpose of lean management is to improve process–product and standardize design practice by reducing variabilities and satisfying internal and external customers. The quality control over design processes and information flow can be inprocess inspection through instruction manuals and training or peer-reviewed coordination during execution a reduce, akin to coordination meetings for clash detection in the BIM process. Design quality refers to product information quality that can be measured through constructability, design errors, and information development level [3, 4]. Therefore, it is necessary to identify system weaknesses (non-value-added)
6 Digital Asset Production Using Lean …
99
Fig. 6.1 Transformation flow value (TFV) Theory according to [5–7]
and strengths (value-added). Such diagnoses and simulation tools can be constructive methodologies to define system variables, identify waste, and visualize the value stream.
6.2 Methodology The focus of the work is to review lean design management theories and applications. Then, this paper discusses the connection between BIM communication tools (BEP, LOD and LION1 ) and lean methodologies (last planner system and action language). A thorough literature review is applied to analyze and synthesize two mainstream research areas. Figure 6.2 illustrates the steps carried out to achieve the abovementioned objectives according to methodology from [8]. This paper will highlight planning techniques to provide process and task schedules. The following questions are asked to query the current lean design management methods to plan for design process and operation: . Why lean design management is required for BIM implementation? . What is planning and scheduling techniques are used for design management? 1
LION: Level of Information Needed. LOD: Level of Development.
100
M. Karaz and J. C. Teixeira
Fig. 6.2 The followed methodology to synthesize between LDM and information management standards [9]
. How the lean planning methods works? . What are the shortcomings of Lean methods in managing construction digital assets?
6.3 Results and Discussion This section will provide the findings from the applied literature review for lean design management and BIM standards for information management. The section is organized into (i) survey for design problems in the literature, (ii) a summary of current standards to manage construction information, and (iii) lean design management approaches to overcome design management issues.
6.3.1 Design Problems Table 6.1 summarizes the problems of construction information among its developers and users’ during planning, developing, and exchanging construction information.
Waiting for approval affects not only the design stage but also cause [14] delays in commencing construction works, obtaining permits and approvals from regularity parties
Regulatory issues and bureaucracy
Interoperable data dictionaries
This issue is encapsulated in missing opportunities of the last [12, 13] responsible people experience and knowledge. Delaying selection or involving the delivery teams in planning and execution for digital asset delivery can increase the size of work packages and work in progress, which could ultimately delay delivery or cause reworks due to multitasking and work pressure in tight deadlines
Late involvement of key stakeholders
Information Flow
Changes may arise from internal or external clients to meet their capabilities and requirements, that could be caused by lack of client’s knowledge to comprehend the project, improper value capture by designers, inaccurate feasibility studies, conflict of interests between stakeholders
Late design changes
(continued)
Attributes for BIM objects are various based on used standards, [15] systems, and according to the internal use for organization, making it difficult for systems in another team in the supply chain to read due to the difficulty in interpreting and classifying objects and processes, or actors. This issue is widely researched, and adequate semantic enrichment can provide operable data dictionaries which translate one attribute from one system to another without loss in information
[11]
Explanation Unclear or missing information on clients’ needs could lead to [10] providing information based on assumptions when its prerequisite from the client is not fully captured. Difficulties in the identification of client needs and failure to translate them into requirements and product specifications. Limited time and effort for identification of client needs, conflicts between multiple stakeholders needs and goals
Problem
Poor capturing for the value
TFV
Value
Table 6.1 Design problems classified according to TFV theory
6 Digital Asset Production Using Lean … 101
Transformation
Flow
TFV
Table 6.1 (continued)
Improper sequencing and allocation of resources driven by increasing uncertainty in tasks and information flow, especially at earliest stages because the ambiguity of perquisites (constraints)
Designers view that time spent on coordination and planning [17] meetings is a waste of time, and their impact is trivial on the process, and product improvement is limited. However, the benefits of these meetings can reap productivity benefits at long term period, through increased learning and enhanced relationships between the involved parties Improper documentation for critical events reduces the chances of learning and can deal with similar issues in another context from scratch. This issue can be related to subletting information production to different organizations from one project to another Some BIM-linked data solutions can be inoperable, and some of them have the risk of being withdrawn or supporting another information system used now
Unclear assignments and unaligned work scope
Long meetings
Missed learning opportunities
Using Unreliable, untested technologies
[19]
[18]
[12]
Unbalanced production rates for information can lead to variabilities [17] between upstream and downstream, which is the main reason for starvation or overproduction of wastes, defects, reworks
Can be in terms of poor interoperability tools or different methods to [16] describe and classify objects, processes, or actors
Data schemas definitions
Ambiguous planned pace
Explanation
Problem
102 M. Karaz and J. C. Teixeira
6 Digital Asset Production Using Lean …
103
6.3.2 Construction Information Management Standards Problems related to Information Exchange directly affects the productivity and quality of construction information. Information exchange is considered waste, but it is inevitable due to the disparities among the existing BIM systems and the variety of interests and needs of the involved parties [20]. The current exchange requirements are represented in spreadsheets to assign responsibilities across milestones and product breakdown, associated with standardized codification systems (i.e., Uniformat, Unicalss). Design professionals may challenge comprehending and using information exchange formats, due to growing numbers of objects, actors, and processes along with information development. Also, there are various naming conventions used for a digital object, that causes misinterpretation between the involved parties during exchange. The current standards seek to manage information exchange issues by instilling information management and collaborative production concepts during information planning and production. ISO 19650 standards was founded on continuous international and national development for managing BIM workflows and reduce information interruptions across project lifecycle. Specifically, to manage information of construction and streamlines generic guidelines to facilitate understanding between the involved parties in digital asset production and management. ISO 19650 comprises four prominent publications, and it aims a manage construction information production using BIM processes; this standard covers the whole lifecycle of the digital asset and targets designers, engineers, owners, manufactures, contractors, and regularity authorities, by providing generic frameworks for different types of projects and various procurement methods [21]. It is worth to mention the ISO 19650 series defined the concept of information waste in terms of exceeding the level of details or information need, duplication, and clashes between systems, subsystems, and objects. However, ISO 19650 lacks operational concepts for delivery teams since assignment management was poorly captured through the proposed frameworks, and detailed plans for short term periods were rarely addressed. When the extracted milestones are the critical decision gates, those assumptions may lead to difficulties dealing with information-flow uncertainties.
6.3.2.1
Level of Development (LOD) and Level of Information Need (LOIN)
Several issues are related to the lack of communication tools to provide the right amount of information at the right time. It is widely researched wastes in the design stages are generating new information without perquisites (Making-Do), overproducing more information than required (Overproduction), and waiting for required information (Waiting) wastes [22]. By specifying the level of development at each procurement stage, model users would be guided to develop, request, and exchange the exact level of information when needed. LOD is a communication tool developed
104
M. Karaz and J. C. Teixeira
Table 6.2 Review on level of information need standard according to TFV theory TFV
EN17412-1:2020 standard
Value
Provide needed information according to internal and external customers
Transformation Facilitate the level of information needed at each process of the project Flow
The concept of flow was not captured through this standard but breaking down the level of information needed into building systems may assist designers to identify information flow and BIM workflows
by AIA to specify the granularity of model information at each stage for building systems to improve the clarity and reliability of BIMs. Typically, it is developed collaboratively from the early stages of design to increase the situational awareness for the involved parties on the information requirements, usability, and its limitations through actionable instructions for model authors during producing geometrical and alphanumerical information by asking (what, when, where, and how) to be developed for downstream and upstream design processes. However, LOD is isolated with limited connection to design schedules; the time spent increases when the change occurs from LOD to allow changes to affect time negatively ahead of chain demand. LOD has limited connection to design schedules, especially at the more refined detail of the design plan (phase planning and weekly plans). That can increase the time spent changing from one LOD to another due to the ambiguity of supply and demand between delivery teams [23]. EN 17412-1:2020 specifies the granularity of the exchanged information (alphanumerical, geometrical, documental) according to purpose, schedule, actor, and building system [24] (Table 6.2).
6.3.2.2
BIM Execution Plan (BEP)
A team-based plan can be classified as an action plan to execute information production using BIM. BEP is a live document that should be updated by involved parties to sustain knowledge. It starts from value capturing and estimation for information requirements between the involved parties. Different standards were provided to develop BEP; some were based on academic research such as PSU, University of Florida, and others were founded on BIM information management standards such as the available BEP using ISO 19650. Professionals find it cumbersome to communicate BEP aspects due to the variety in the language used in both versions. For example, Task Information Development Plan (TIDP) and Master Information Development Plan (MIDP) were used interchangeably in developing BEP based on ISO standards, while in the BEP PSU version, one plan was used like MIDP. Nevertheless, one limitation of the BEP application that many stakeholders deal with as a static document is that it is developed but not updated as the project proceeds; this can
6 Digital Asset Production Using Lean …
105
Table 6.3 Descriptive analysis for BIM execution plan (BEP) according to TFV theory and process levels Organizational
Directive
Operational
Transformation
Select procurement method and delivery method Identify prospected parties
Break down the product into high-level deliverables and milestones
Quantify the product value against used resources
Flow
Estimate information requirements and their levels of development Identify the information handovers between processes and teams
Plan for coordination meetings to decide federation strategy Provide a responsibility matrix
Eliminate clashes systematically and sustain learning Live document that should be updated by involved parties to sustain knowledge
Value
Capture customer value and information requirements
Identify the main actors and the means for information production
Measure preconditions, capabilities, and delivered value
hinder the reliability of planned works. Similarly, a traditional mindset may make planning functionality exclusive for the directive level without engaging delivery teams; these phenomena hurdle the collaborative function of BEP since it is required to capture the needs and responsibilities of all involved parties into BEP (Table 6.3).
6.3.3 Lean Design Management (LDM) Lean design management comprises prescription actions to improve productivity and information flow, incorporate production concepts into design management to increase the process and product reliability. Based on TFV theory and customer satisfaction, action language. Additionally, Lean construction interpreted design waste as a negative iteration that comprises technical, social and team issues [20]. This waste can be diminished by eliminating those negative cycles usually formed in repetitive steps such as rework, waiting and defects [25]. Lean design management provides a set of prescriptions aimed at facilitating value for internal and external customers. Lean urges the involved parties in developing the process product to seek global optimization rather than local optimization. By aligning their interests and advice, designers release their models only when most alternatives are explored to find customers’ fundamental requirements through established communication between different stakeholders.
106
6.3.3.1
M. Karaz and J. C. Teixeira
Last Planner System (LPS)
Reality disconnects from plans; Last Planner System was emerged to fill this gap by shifting the focus from process planning to task (assignment) planning at successive levels. The Last Planner system is the most developed area of lean construction. According to [16], LPS understand assignments as promises and bottlenecks as constraints, which can be communicated through a standardized language such as Action/Language to express the goals and needs of each party involved in product and process development. The project team would delay the design early until the last responsible moment to allow enough time for decision-making processes to narrow product options to reach customer value with reduced costs and time. This additional time also permits the interested parties to reach a standard agreement. LPS consisted of master scheduling, lookahead planning, weekly planning, and activity planning. Including Master scheduling to provide essential milestones and critical project deliveries; Phase scheduling (reverse planning), a collaborative planning technique to facilitate workable packages released from the backlog, and collaborative analysis for tasks interdependencies and information requirements upstream and downstream. Negotiation sessions empowered to discuss work structuring, sequencing, constraint analysis, and ready activities release. The quality criteria apply for work packages, including definition, soundness, sequence, size, and learning [26]. The primary outcome of the LPS application is providing reliable production planning by using mixed methods of pull and push planning. That helps to shield downstream from upstream variability and uncertainty. Thus, as the level of detailing proceeds, the level of uncertainty decrease. In which support production cell or selfcontained tasks can provide [27]. Finally, PPC can measure reliability, which provides control trades promises and performance over time during each weekly meeting. Moreover, LPS is an interoperable system to other planning methods such as takt time, location-based planning, and the traditional method CPM. The literature shows that several knowledge areas can be improved by using LPS, including logic networks to obtain dependencies, learning about flow, reliable promises (ask for information in social requests), postponement, stochastic techniques, and the concept last responsible moment. On the contrary, LPS challenged various design application problems; the current research lacks LPS guidance for the BIM process [4]. Also, it is reported that the application of LPS was limited to weekly work planning, and medium-term planning was challenging to realize because the urgency of tasks can be changed dramatically [13].
6.3.3.2
Design Structure Matrix (DSM)
DSM is a work planning method that represents, and analyses design information and tasks sequences and highlights the interdependencies between activities, highlighted as the intersection between activities in rows and columns. The literature shows that DSM can improve planning reliability for design stages by considering priority between tasks and streamlining a more disciplined design process rather than
6 Digital Asset Production Using Lean …
107
conventional methods [13, 28]. However, DSM can be cumbersome in the application because it needs a high level of details, which are difficult to predict in design. Moreover, it is not easy to interpret for non-knowledgeable team members, requiring training in developing and applying DSM.
6.3.3.3
Visual Management
Information processing has issues in coordination due to software variation and improper synchronization between its production. The visualization of the design and information flows carries potential analytical and actionable activities for the brokendown processes. Understanding workflows and information flows can lead to waste reduction through minimizing non-value activities (NVA) and exposing the source of information fragmentation. Visual Stream Mapping VSM is a standard lean tool used to visualize materials and information in production systems, and it can also be used to interpret BIM workflows and highlight waste across design activities [13] since it aids practitioners to look for performance improvements through revealing wastes by assigning related production indicators. VSM is a collaborative diagnostic tool that captures information interactions and identifies waste sources of a given system, which results in current and future maps [29] to find the synchronization between upstream and downstream. Input data can be collected through communication with practitioners or direct observation. The indicators that governed VSM are NVA, CT, WIP, Takt time, and Queuing time. These indicators can predict process, social, material, environmental, safety, cost, and other measurable factors. At the design stage, the VSM tool can illustrate the capabilities of the BIM process in flowing down design intent until the frontline [30].
6.3.3.4
Task Management Tools
Current tools for task management can support collaborative production, inspired by agile software development, facilitate process-based schedules, and assign responsibilities at the operational level. Design stages can be represented as sprints; each sprint is divided into status (i.e., to-do, planned, WIP, archived, etc.), dynamically determined by the team and design managers according to the readiness of information. Those tools can be used for remote or office working styles and support collocation and big room concepts; typical examples are JIRA, Miro, Trello, and Click Up systems [31]. According to the construction peculiarities, lean construction community advice using Last Planner System, Location-Based Management, to specify handovers between tasks and identify the pace of delivery. However, those systems are external to BIM platforms, which makes communication with them fragmented, and requires non-standardized workflows to communicate construction information, usually referred to by links or uploaded documents. The main focus of the lean organization is people management, and researching social factors is a significant step to its application [32]. Stochastic techniques are
108
M. Karaz and J. C. Teixeira
commonly used to forecast performance across project periods, and they can be used to identify information loss or productivity bottlenecks using time units. The quality of stochastic predictions can be for a short time, but it reduces as time progresses. That requires active collaboration to pull information from the upstream to the downstream and activate backward feedback loops at the early design stages. It also requires a common language that can be used to communicate perquisites from each involved party. Lean community advised using a commitment loop to facilitate (declaration, request, promise, assertion, assessment). That improves technical variables such as planning reliability and productivity and social factors such as trust between team members and mood.
6.4 Conclusions This research aimed to link the current information standards and lean design management concepts, which may assist the involved parties in planning and developing digital assets (designers, developers, manufacturers, and owners). Figure 6.3 illustrates the assembled conceptual framework for planning and developing the construction of digital asset; it was found that the level of details of product and process are essential to provide reliable information and workflow, in addition to social dimensions from delivery teams and appointing parties that should be considered. The current standards adopted several principles and concepts from lean management, including PDCA (Plan, Do Check, Act) cycle and information status principles (WIP, Archived, Planned, etc.). However, the current standards do not provide
Fig. 6.3 Lean methods integrated BIM standards to improve workflow and information flow
6 Digital Asset Production Using Lean …
109
a comprehensive definition of information waste, and they miss the conceptualization of production concepts, particularly at the operative level. That can lead to expanding the gap between existing management methods such as agile and lean design management. Also, the level of information need has incorporated information production schedules only at the directive level and isolated it from weekly and bi-weekly planning. That can exchange construction information between the involved parties throughout the whole lifecycle of the digital asset. At the operational level, by communicating trade-offs among information requirements and workflow dependencies and sequencing. Information delivery starts with customer value research, digital-asset generation and communication, inspection, and coordination, and exchanging authored information. However, it is reported that information flow disconnects when exchanged from one stage to another, and digital data includes many redundancies at separated locations. Although the development of standards to translate between BIM software programs. Social Research has been increasingly developing in recent years, especially with rising the collaborative production of information. This paper identified the following gaps that require attention from future researchers. There is little research on the potentials of action language improving design workflows and information flow. Similarly, more social research is needed, especially at finding measures to improve self-awareness and self-regulation for the delivery team members during digital assets development. Moreover, a question that is not answered fully is Why the current education and training methodologies fail to find a common language among professionals and academics? This research recommends the following investigation questions for the application of information management standards. . How linked data tools and current standards interact with information management concepts and action language? . To which extent do the existing product data templates and classifications facilitate communication between parties? . What is the necessity of measures to control commitment and responsibility levels during planning for digital assets development? This study is limited due to subjective selection method of papers to lean design management research and information management standards, which may ignore other important published documents in the same field. Another limitation of this research is that it neglected Value research in lean design management, which can be a topic for future research to investigate the role of TVD (Target Value Design), SBD (Set-Based Design), CBA (Choose by Advantage), and Concurrent Engineering in digital asset development management. Acknowledgements This work funded by the FCT—Fundação para a Ciência e a Tecnologia, grant number 2021.04751.BD.
110
M. Karaz and J. C. Teixeira
References 1. Al Hattab M, Hamzeh F (2017) A process-social perspective for understanding design information flow. Lean Constr J 2017:1–11 2. Dave B, Sacks R (2020) Construction at the next nexus of Lean and BIM. In: Lean construction: core concepts and new frontiers, Routledge, pp 54–84 3. Sacks R, Radosavljevic M, Barak R (2010) Requirements for building information modeling based lean production management systems for construction. Autom Constr 19(5):641–655. https://doi.org/10.1016/j.autcon.2010.02.010 4. Uusitalo P, Seppänen O, Peltokorpi A, Olivieri H (2019) Solving design management problems using lean design management: the role of trust. Eng Const Archit Manag 26(7):1387–1405. https://doi.org/10.1108/ECAM-03-2018-0135 5. Koskela L (1992) Application of the new production philosophy to construction. Center for Integrated Facility Engineering, CIFE Technical Report No. 72, Stanford University, pp 1–81 6. Koskela L (2000) An exploration towards a production theory and its application to construction. VTT Technical Research Centre of Finland 7. Koskela L (2020) Theory of lean construction. In: Lean construction, Routledge, pp 2–13 8. Wohlin C (2014) Guidelines for snowballing in systematic literature studies and a replication in software engineering. In: Proceedings of the 18th international conference on evaluation and assessment in software engineering—EASE ’14, pp 1–10. https://doi.org/10.1145/2601248. 2601268 9. Kitchenham B, Brereton P (2013) A systematic review of systematic review process research in software engineering. Inf Softw Technol 55(12):2049–2075. https://doi.org/10.1016/j.infsof. 2013.07.010 10. Tauriainen M, Marttinen P, Dave B, Koskela L (2016) The effects of BIM and lean construction on design management practices. Procedia Eng 164:567–574. https://doi.org/10.1016/j.proeng. 2016.11.659 11. Aslam M, Gao Z, Smith G (2020) Optimizing construction design process using the lean based approach. Lean Constr J 2020:176–204 12. Pikas E, Koskela L, Seppänen O (2017) Design management in a design office: development of the model for ‘to-be.’ In: IGLC 2017—Proceedings of the 25th annual conference of the international group for lean construction, pp 555–562. https://doi.org/10.24928/2017/0317 13. Tzortzopoulos P, Hentschke C dos S, Kagioglou M (2020) Lean product development and design management. In: Lean construction, Routledge, pp 14–44 14. Sacks R, Korb S, Barak R (2018) Building lean, building BIM : improving construction the Tidhar way. Routledge Taylor & Francis Group, New York 15. Belsky M, Sacks R, Brilakis I (2016) Semantic enrichment for building information modeling. Comput Civ Infrastruct Eng 31(4):261–274. https://doi.org/10.1111/mice.12128 16. MacOmber H, Gregory GA, Reed D (2005) Managing promises with the last planner system: closing in on uninterrupted flow. In: 13th international group for lean construction conference: proceedings, pp 13–18 17. El Reifi MH, Emmitt S (2013) Perceptions of lean design management. Archit Eng Des Manag 9(3):195–208. https://doi.org/10.1080/17452007.2013.802979 18. Tommelein ID, Gholami S (2012) Root causes of clashes in building information models. In: IGLC 2012—20th conference of the international group for lean construction, vol. 1, no. 510. 19. Al Hattab M, Hamzeh F (2018) Simulating the dynamics of social agents and information flows in BIM-based design. Autom Constr 92:1–22. https://doi.org/10.1016/j.autcon.2018.03.024 20. Michaud M, Forgues E-C, Carignan V, Forgues D, Ouellet-Plamondon C (2019) A lean approach to optimize BIM information flow using value stream mapping. J Inf Technol Constr 24:472–488. https://doi.org/10.36680/j.itcon.2019.025 21. International Organization for Standardization (2018) ISO 19650-1:2018(en), Organization and digitization of information about buildings and civil engineering works, including
6 Digital Asset Production Using Lean …
22.
23.
24. 25. 26. 27. 28.
29. 30. 31.
32.
111
building information modelling (BIM)—Information management using building information modelling—part 1: concepts and principles. https://www.iso.org/standard/68078.html. Accessed 25 May 2019 Formoso CT, Bølviken T, Viana DD (2020) Understanding waste in construction. In: Tzortzopoulos P, Kagioglou M, Kostela L (eds) Lean construction core concepts and new frontiers. Routledge, pp 129–145 Bedrick J, Ikerd W, Reinhardt J (2020) Level of development (LOD) specification part I & commentary for building information models and data. BIMForum, no. Diciembre, pp 263–64. www.bimforum.org/lod EN 17412-1:2020. Building information modelling. Level of information need. Concepts and principles Ballard G, Howell GA (2003) Lean project management. Build Res Inf 31(2):119–133. https:// doi.org/10.1080/09613210301997 Howell G, Ballard G (1998) Implementing lean construction: understanding and action Koskela L, Ballard G (2012) Is production outside management? Build Res Inf 40(6):724–737. https://doi.org/10.1080/09613218.2012.709373 Oloufa AA, Hosni YA, Fayez M, Axelsson P (2004) Using DSM for modeling information flow in construction design projects. Civ Eng Environ Syst 21(2):105–125. https://doi.org/10. 1080/10286600310001638474 Rother M, Shook J (2003) Learning to see: value stream mapping to add value and eliminate muda. The Lean Enterprise Institute, Brookline, MA Gerber D, Gerber B, Kunz A (2010) Building information modeling and lean construction: Technology, methodology and advances from practice. In: Proc IGLC, pp 683–693 Lappalainen E, Uusitalo P, Seppänen O, Peltokorpi A (2021) Design process stability: observations of batch size, throughput time and reliability in design. In: Proceedings of 29th annual conference of the international group for lean construction, pp 605–612. https://doi.org/10. 24928/2021/0144 Rooke J (2020) People and knowledge: lean organisation. In: Lean construction, Routledge, pp 85–101
Chapter 7
Risk Assessment Comparative Analysis by the Method “Level of Preventive Action” in Three Case Studies L. C. Pentelhão , João Santos Baptista , A. J. Carpio , and María de las Nieves González García Abstract The occupational risk assessment method adapted to building works called Level of Preventive Action (Lpac) has been implemented in three construction sites in three different countries: Brazil, Spain, and Portugal. The works have different characteristics, covering different construction phases. From all of them, technical data related to occupational health and safety were taken, and psychosociological data related to workers and their perception of risk in the work environment. The results were transferred to “MS-Excel” tables adapted to the characteristics of each of the construction projects. In the procedure, photographs were taken of the different work units evaluated, showing the work carried out, the health and safety teams, the workers, and the organization. The evaluation method can generate a wide spectrum of results from the large number of graphs, including those related to the total “Level of Preventive Action” and its corresponding parameters related to the construction system. The graphic results also determine the evaluation of the preventive action of the risks in the construction systems; results based on risk management techniques; including the personal perception of risky environments, the social behaviour of workers; and the evaluation of preventive action in work environments (absolute, documentary, constructive and social). Despite the great diversity of results, Lpac makes it possible to visually interpret the risk situation and decide so that the control of preventive action is the most effective.
L. C. Pentelhão · J. Santos Baptista Associated Laboratory for Energy, Transports and Aeronautics, LAETA (PROA), Faculty of Engineering, University of Porto, Porto, Portugal e-mail: [email protected] J. Santos Baptista e-mail: [email protected] A. J. Carpio (B) · M. N. González García Universidad Politécnica de Madrid, Madrid, Spain e-mail: [email protected] M. N. González García e-mail: [email protected] © The Author(s), under exclusive license to Springer Nature Switzerland AG 2023 M. N. González García et al. (eds.), New Advances in Building Information Modeling and Engineering Management, Digital Innovations in Architecture, Engineering and Construction, https://doi.org/10.1007/978-3-031-30247-3_7
113
114
L. C. Pentelhão et al.
Keywords Risk assessment · Construction · Graphic results · Preventive action · Characteristic value
7.1 Introduction At the origin of occupational safety and health, risk assessment methodologies considered negative results (injuries and illnesses) more than positive results (safety and health), which were far more abstract concepts [1, 2]. Risk control techniques were analyzed individually. Complex prevention procedures in safety, hygiene, ergonomics and psychosociology were used for their joint application. Despite various risk assessment systems, no tools have been found that makes it possible to obtain a global assessment of a construction site as a whole [3–10]. However, many investigations incorporate the safety climate in the risk assessment due to the uncertainty of human behavior [11], being necessary to evaluate the aspects of safety, hygiene, ergonomics and psychosociology [12–14]. In order to combat workplace accidents, risk prevention must be integrated into all phases of business management [15] through an occupational risk prevention plan, which uses risk assessment as a tool to implement effective preventive planning. However, risk assessments in construction sites require a detailed study of the different risks to which construction workers are exposed [16]. On top of these criteria, a parametric selection of subjective analysis (qualitative) or objective analysis (quantitative) must be added for risk assessment [17]. However, the evaluation criteria are usually oriented individually in each risk control technique [3]. But the processes in the construction industry joint the complexity of management, organization (interdependence between work units, different phases of work execution), environmental planning (climate, auxiliary resources), human resources (trades, tasks, qualifications, temporality) and materials, among other factors [4]. Risk assessment methodologies have expanded the observation parameters in the search for their suitability for application to construction. Thus, Forteza with his Global Tool method [3] for evaluation of construction procedures collects information on the work structure and the environment, the constructive development, the agents (Technical and Project Management), and the type of work to identify and assess risks, barriers and means. Also, Pinto [4] bases its Qualitative Occupational Safety Risk Assessment Model (QRAM) on the Tree of events on which certain characteristic risks of construction works are analyzed from four observation dimensions: Safety climate, Severity factors (consequences), Possibility factors (probability) and safety barriers (safety means). The fuzzy parameter was added to his formula based on fuzzy set theory [18]. On the other hand, Reyes et al. [7] unify criteria in the decision-making hierarchy and evaluate variations’ consequences on the building’s life cycle, from the design phase to reintegration. The study on the risk posed by Sousa et al. [19] analyzes accidents at construction sites in the construction industry. It determines that a correct definition of the project with adequate measures in the planning and organization of the work can minimize accidents by more than
7 Risk Assessment Comparative Analysis by the Method “Level …
115
60%, emphasizing the need to manage health and safety during the life cycle of the building: design, execution, and use. Finally, Salanova et al. [20] establish the importance of studying psychosocial and ergonomic factors. Generally, risk assessments in construction consider physical, technical, and management aspects, overconfidence and forced postures the main causes of construction accidents. The procedure for assessing occupational risks in construction sites is being developed and adapted to the characteristics of the building process [21], from the initial approaches to prevention in business activity and the conception of the project [22], through the study prevention in the design phase and during the construction phase of a building [23]. The study of the safety climate in social settings and human behavior in prevention should even be considered [24] with the essential study and analysis of psychosocial risks in the entire hierarchical structure of companies [25] and, finally, during the use and maintenance stage of the building with the new owners [26]. This research starts from the critical analysis of the occupational risk assessment methodology called Level of Preventive Action (Lpac) and its implementation in construction. The need to establish the parameters that better reflect the reality of the environment of a construction site is solved. Are also covered four of the main areas to combat the risk (Safety at Work, Industrial Hygiene, Ergonomics and Psychosociology) as well as the preventive observation of the environments and data collection (absolute, documentary, constructive and social environment). Considering the factor of constructive reality, which assumes the risks associated with the complexity of the work units, their location and interdependence [27, 28]; the parameter of the economic investment of the contractor in the construction systems and means of prevention [29, 30]; and the social factor with the participatory interest and the workers’ state of mind [31, 32]. The analysis of these factors corresponds to the documentary environment [33, 34], the constructive environment [35–38] and the social environment as fundamental concepts of observation and evaluation associated with the execution of the work [31, 35, 39–41]. The difficulty and characteristics of the construction environment of the work establish a directly proportional complexity value that affects the initial guidelines established in the documentary environment. However, the development of prevention systems, social activity, roles, hierarchies, and work stress add assessable parameters in the constructive environment with a corrective or inversely proportional character [42]. However, risk assessments in construction sites require a detailed study of the different risks to which construction workers are exposed [16].
7.1.1 The Level of Preventive Action Method The Level of Preventive Action (Lpac) method is an occupational risk assessment approach adapted to construction processes [10, 43, 44] and the complexity and special characteristics during the development and implementation phases. The development of the methodology is based on the mathematical processes developed in the method of William T. Fine [45]. The parameters of the Lpac observe the
116
L. C. Pentelhão et al.
reality of construction work in each of the preventive environments of the construction process: initial, documentary, constructive and social [10, 44]. Comprising four of the techniques to combat the risk: Safety at Work, Industrial Hygiene, Ergonomics and Psychosociology. This risk assessment method establishes the amount of prevention level that is deviating from the initial approach reflected in the Occupational Health and Safety Plan, determining the amount of preventive action that needs to be incorporated into the development of the work to improve the conditions of design, constructive conditions, and social relations, in the initial environment. This observation determines, quantitatively, the risk levels that correspond to the complexity of the work units, their location in work and their interdependence [27] in the documentary environment [36]. Likewise, it determines, quantitatively, the risk levels based on the characteristics of the construction systems and preventive systems [29] in the construction environment [40]. Finally, it determines, quantitatively, the risk levels based on the perception of the environment and the emotional state of the workers [32] in the social environment [42]. Thus, in this approach, the parameters that define the Lpac are [10, 44]: . In the Initial or Absolute Environment (Eab ), the parameters are Probability (P) and Consequences (C) as basic parameters of risk . In the Documentary Environment (Ed ), physical parameters are described with the Relative Risk (Rr ) and geometric parameters of the building with the Border Risk (Rb ) . In the Constructive Environment (Ec ), the degree of worker Exposure (E) to the risk and the Economic Capacity (Ec ) in prevention provided by the company are measured . In the Social Environment (Es ), the parameters of Participatory Interest in prevention (Pi ) and the Level of Satisfaction (Ls ) of workers are measured. The Lpac defines a mathematical expression based on the evaluation parameters of the preventive observation (absolute, documentary, constructive and social) of the work environments and its interpretation, regarding the direct or indirect relationship based on the degree of risk correction is: ) ( ) ( 1 1 1 · · Lpac = (P · C) · (Rr · Rb ) · E · Ec Pi Ls
(7.1)
The mathematical expression of the Lpac is the following: ( Lpac = (Rab ) ·
Rr · Br · E Ec · Pi · Ls
) (7.2)
7 Risk Assessment Comparative Analysis by the Method “Level …
117
7.1.2 Objetive The research objective is to implement the Level of Preventive Action risk assessment methodology in three real construction sites in Brazil, Spain and Portugal. The procedures defined in Lpac implementation protocol were applied. With this, methodology’s effectiveness in detecting and preventing risks can be established. With the results, the method elaborates a great variety of graphics that allow a dynamic and effective interpretation of the prevention methods. With this, the control bases for preventive action are determined in all possible risk environment situations. These preventive action control bases identify and interpret risk and its prevention in a particular way from the formula’s parameters, analyzing the behavior and evolution of risk. These results can be extended to broader concepts, such as preventive observation environments (initial, documentary, constructive and social) and the different techniques to combat risk (Safety at Work, Industrial Hygiene, Ergonomics and Psychosociology). It even identifies the different behaviors of workers and their risk perception in the work environment.
7.2 Methodology An evaluation of occupational risks is carried out systematically, following the method protocol, based on specialized technical observation and a psychosocial survey, with which a complete identification and analysis of the construction systems risks, the environment and the workers’ perception of risk is obtained. Through this process preventive action level control procedures can be identified, eliminating, or mitigating the events considered [46]. In the first step, the construction processes of the three projects evaluated are exhaustively described. The description was carried out in an observational way and through the technical and experienced analysis of the projects. Next, all the dangers and risks were identified by analysing the construction companies’ mandatory Health and Safety Plans, technical field observations and interviews with the workers and project managers. All this knowledge was focused on two tables, one for collecting data from field surveys with workers and those responsible for the construction front; and the other of risk assessment with the application of the Preventive Action Level methodology, which consisted of analyzing the complexity of the evaluated works, border risk, degree of exposure to danger, organizational execution and safety procedures, the participatory interest of the workers and those in charge of the work and the level of satisfaction, verifying the risk situations with as many details as possible.
118
L. C. Pentelhão et al.
7.2.1 Description of the Construction Processes Stage in which the description of the construction processes of each project and the activities carried out by the workers was carried out, to identify the tasks, the number of workers involved, the equipment and work tools used to carry out the task and the prevention systems implemented. At this stage, the methodology used for data collection consisted of dialogues with construction workers and engineers, research in the documents of the companies evaluated in the study, and field observation. The construction works that have been selected for this investigation are: . Execution of a 20-storey Sintra Jardins building, located in Brazil . Expansion of a special education school located in Spain . Remodeling of the Aguda railway stop, located in Portugal. 7.2.1.1
Execution of the 20-Storey Sintra Jardins Building in Brazil
The first project is the execution project of a twenty-story residential and commercial tower located in Brazil. It is a project for incorporating and constructing a mixed-use building that will contain architectural, landscaping, and interior design projects for common areas. Called ‘SINTRA’, the project mentioned above consists of 2 garage basements, ground floor, 2 commercial floors, 2 residential floors with “Studio” apartments and independent access and 12 types of floors (5th to 16th floor), 1 duplex floor (floors 17 and 18), 3 elevators, 1 service that gives access to studios, 1 social for residential and 1 to commercial floors, 1 pressurized fire escape, 1 leisure floor located on the 19th floor with gym, sauna, bathrooms, swimming pool and solarium with exclusive access to apartments 1 per floor, 1 floor with water reservoirs, engine room and slab roof with provision for the installation of solar collectors. Figure 7.1 presents an image of the project. The assessed construction processes for this research were: . Work on the building’s foundations . The first construction phase of the high-rise’s structure. 7.2.1.2
Expansion of a Special Education School, Located in Spain
The work in Spain refers to a project to adapt the ground floor of a school space that is currently a porch for the construction of four classrooms in a Special Education School in Toledo, Spain. The school grounds have a total area of 20,780 m2 , of which 2,681 m2 are currently built for teaching buildings. With the expansion, the land will have as a newly constructed area a total of 174.70 m2 and a total of 26.54 m2 of exterior constructed areas, totaling 215.32 m2 , giving a total constructed area of the school of 2,896.20 m2 . Figure 7.2 shows the appearance of the building.
7 Risk Assessment Comparative Analysis by the Method “Level …
119
Fig. 7.1 Image of the Sintra Jardins building in Brazil
The construction processes evaluated during the conduct of this research were: . . . . .
Execution of the reinforced concrete structure. Execution of hydraulic and electrical installations and air conditioning system. Execution of the facade with bricks. Execution of the compartmentalization of the rooms. Execution of the building’s interior finishes.
120
L. C. Pentelhão et al.
Fig. 7.2 Status of the expansion work of the School of Special Education in Spain
7.2.1.3
Remodeling of the Aguda Railway Station, Located in Portugal
The project in Portugal refers to the modernization of a public railway at a train station in the north of the country, as part of the Comprehensive Railway Renovation— RIV project, with the construction of a Pedestrian Overpass (PSP) and with Light Underpass (PITL). The proposed intervention aims to raise the passenger platforms in an extension of 150 m, the maintenance, in all the width, of the existing platforms, the construction of new rear walls, the total replacement of the passenger shelters and the suppression of the level crossing (PN) existing on the line, with the construction of a PSP, with stairs and elevators, as an alternative. Remodeling the entire train station area to create a new, more attractive and comfortable space where the user feels better and more confident. Figure 7.3 shows the existing train station. The construction processes evaluated during the conduct of this research were: . . . . . . . .
Elevation to 0.90 m above line level Construction of 150 m of new passenger platform Maintenance of the existing platform across its entire width Construction of new quay walls Construction of accesses to the new PSP Removal of existing tiles in the north refuge Supply and installation of 2 passenger shelters Supply and install 1 bicycle parking support located under the PSP access stairs.
7.2.2 Identification of Hazards and Risks After carrying out the description of the production processes and identifying the activities carried out by the workers described in the previous step, a survey was carried out to identify the dangers and risks, the triggering events of each task and
7 Risk Assessment Comparative Analysis by the Method “Level …
121
Fig. 7.3 Aguda train station in Portugal
the possible consequences for the worker, if an accident occurs. These criteria were evaluated according to the author’s knowledge of the study, with consultations with specialists in the area of occupational safety of the projects evaluated, documents of the companies studied and statistical data. Depending on the particular characteristics of each of the construction works that have served as the basis for data collection, the most common and characteristic risks have been identified for each of them. For this, the risk classification published by the National Institute for Occupational Safety and Health (INSST) [47] has been taken. The risks have been identified from this classification for each of the construction works’ processes (Table 7.1). The selected risks are identified with purple color for the work located in Brazil (B); in light-green color, for the work located in Spain (S); and in cinnamon color, for the work located in Portugal (P). It can be clearly identified that there is no equality in the risk ratio of each work. However, risks similar to all three are seen, and they are identified by marking the text of the risk description in bold and with a light salmon background. Likewise, it can be observed that the coinciding risks encompass the evaluation disciplines of Work Safety (010, 020, 040 and 090), Industrial Hygiene (330 and 340), Ergonomics (410 and 430) and Psychosociology (510).
122
L. C. Pentelhão et al.
Table 7.1 Occupational risks classification (INSST) [47] Code
Country
RISK
B S P
Code
ACCIDENTS
Country
RISK
B S P
OCCUPATIONAL DISEASE Exposure to chemical pollutants Exposure to biological contaminants
010
Falls of people at different levels
310
020
People falling to the same level
320
030
Falling objects due to crumble/collapse
330
Noise
040
Fall of objects in handling
340
Vibrations
050
Falling detached objects
350
Thermal stress
060
Footsteps on objects
360
Ionizing radiation
070
Collisions with stationary objects
370
Non-ionizing radiation
080
Collisions with moving objects
380
Illumination
090
Bumps/cuts by objects or tools
100
Projection of fragments or particles
410
Physical. Position
110
420
Physical. Displacement
430
Physical. Effort
440
Physical. Load handling
450
Mental. Information reception
150
Entrapment by or between objects Entrapment due to machine/vehicle overturning Overstressing Exposure to extreme ambient temperatures Thermal contacts
460
Mental. Information processing
161
Direct electrical contacts
470
Mental. Answer
162
Indirect electrical contacts
480
Chronic fatigue
170
510
Content
190
Exposure to harmful or toxic substances Contact caustic and/or corrosive substance Exposure to radiation
520
Monotony
200
Explosions
530
Roles
211
Fires. Initiation factors
540
Autonomy
212
Fires. Spread
550
Communications
213
Fires. Means of fight
560
Relations
214
Fires. Evacuation
570
Working time
220
Accidents caused by living beings
230
Run over or hit by vehicles
120 130 140
180
FATIGUE
DISSATISFACTION
7.2.3 Risk Analysis After carrying out the project’s hazard identification and risk determination, it was necessary to identify the parameters of the risk assessment methods to verify its nature and characteristics. Once the parameters were defined and the risk level obtained for each studied situation, the evaluated parameters were validated with specialists according to the applied risk analysis method.
7 Risk Assessment Comparative Analysis by the Method “Level …
123
7.2.4 Risk Assessment The risk assessment step consists of comparing the results obtained in the risk analysis with the criteria defined in the methodology in order to determine the importance of the risk level so that it is possible to decide the implementation of preventive or corrective measures to eliminate or reduce the workers’ exposure to the identified risks. It is possible to verify the deficiency or effectiveness of the risk control implemented at this stage. The methodology’s application begins with identifying the building agents and the choice of the project to be applied, the method and its construction systems. Subsequently, the documentation is previously analyzed, specifically the project for the execution of the work and the Health and Safety Plan provided by the construction company. With the analysis of the Safety Plan provided by the executing entity, it is possible to identify the existing risks and apply the methodology. The procedure consists of taking general photographs of the work situations and particular photographs of each task for later evaluation. Also, show the work being carried out, the safety elements, the equipment and the organization of the task and work. After the observation, the risk assessment process of the preventive action methodology begins, analyzing the complexity of the work to obtain the relative risk, the position of the task and the workers to obtain the border risk, the degree of exposure of the workers to the risks and environment and access to the workplace, the analysis of the organizational and preventive procedures for the health and safety of the workers to obtain economic capacity, the verification of the participatory interest of the worker in the field of health and safety in work through surveys conducted on-site to obtain relative importance and level of satisfaction through data collection conducted on-site with workers. Subsequently, the documentary influence is analyzed from the Health and Safety Plans provided by the construction companies, and the adapted values are placed, identified in the second phase: the incidence of risk. The constructive and social influence is obtained through the results of the characteristic values of the methodology parameters. In this, the evaluator analyzes whether the incidence of risk is greater or less than the value given by the characteristic value.
7.3 Results The Lpac method allows a great variety of graphical results, described below, and shows the different risk assessment procedures, risks, preventive work environments and the different techniques to risk management, offering results in a particular or general way. All this allows determining with greater effectiveness and approach to the reality of the construction process the amount of preventive action control required to achieve that the Preventive Action Level is optimal. The method protocol establishes specific preventive action controls that better interpret the results based on the value obtained and some color codes, as reflected in Table 7.2.
124
L. C. Pentelhão et al.
Table 7.2 Preventive action controls
Level of Preventive Action
Colour code
Range of values (%) 0 and 4 >4 and 12 >12 and 20 >20 and 36 >36 and 60 >60
Control of preventive action Optimal control Adequate control More control Greater control Intensive control Exhaustive control
80.00 60.00 40.00 20.00
7.19 6.68 9.26
5.79 5.83
17.36
11.56
11.57 13.66
0.00 Documentary
Construtive
Social
Observation Environments Sintra Jardins Building Aguda station Stop
School of Special Education Lpac 60%
Fig. 7.4 Documentary, constructive, and social environments average values
7.3.1 Global Results of Preventive Action Level The methodology analyzes and classifies the risk of the works from three environments that characterize the construction process, adding the reality factor in the documentary, constructive and social fields. The value of the documentary, constructive or social environment directly influences the result of the preventive action method. Thus, Fig. 7.4 shows the mean values of the documentary, constructive and social environment of the work in Brazil (Sintra Jardins), the works in the Spanish school (CEE) and the work in Portugal (rail station); the red line shows the limit for comprehensive control of preventive action. Preventive environments can be interpreted as providing conditions that influence risk assessment. Thus, the works in Brazil and Spain must provide adequate controls both in the documentary and constructive environments; they should provide more control of preventive action in the social environment. However, the work in Portugal should provide more control of preventive action in all preventive settings. Interpreting global values highlights the need for more control of preventive action in the social environment. The psychosocial and economic parameters determine the correction factors in the preventive action.
7 Risk Assessment Comparative Analysis by the Method “Level …
125
Level of Preventive Action
After carrying out the risk assessments of the three sites, the average values of the level of preventive action (% Lpac) are shown in Fig. 7.5. The Level of Preventive Action is similar in the three works and determines that it must be contributed more control of preventive action in a general way since the values are between 12 and 20%. The value of the global Preventive Action Level can be individualized to each of the construction systems evaluated and that, chronologically concerning each work, is represented in the following figures. The development of the Preventive Action Level for the inspections carried out in the Brazilian work (Fig. 7.6) identifies the construction systems that required greater control of preventive action (excavations, retaining walls, placement of reinforcement and foundations) with values between 20 and 36%. The other systems needed more control of preventive action, with values between 12 and 20%, except for the administration and storage works, whose result was optimal control of the preventive action, with values lower than 4%. For the school expansion work in Spain (Fig. 7.7), the Preventive Action Level result identified the need for an intensive control level (values between 36 and 60%) to execute the electrical installation and roofs. Levels of greater control of preventive action (values between 20 and 36%) in the construction systems of laminated plasterboard, plaster coatings, flooring, false ceilings, electrical installation, and covers. For the formwork, plumbing installation, waterproofing and masonry work, adequate preventive action controls were required (levels between 4 and 12%). For the work of the railway halt in Portugal (Fig. 7.8), the result of the Preventive Action Level identified the need for an exhaustive control level (levels greater than 60%) in the earth retaining walls; intensive control level (values between 36 and 60%) in the reinforcement, formwork, and concreting processes of the retaining walls. The rest of the construction systems required more control of preventive action (levels between 12 and 20%). Both differences occur because, in some cases, the earth retaining walls had heights of up to five meters compared to other retaining walls that were up to one meter high. 70.00 60.00 50.00 40.00 30.00 20.00
17.06
19.50
18.35
Sintra Jardins Building
School of Special Education
Aguda Station Stop
10.00 0.00
Study Cases Average Lpac%
Lpac 60%
Fig. 7.5 The average value of the Preventive Action Level per work
L. C. Pentelhão et al. 70 60 50 40 30 20 10 0 Excavation Formwork Armor Excavation Formwork Armor Administrative Administrative Storage Excavation Formwork Armor Excavation Formwork Armor Sewerage Excavation Formwork Armor Fundation Administrative Concreting Scaffolding Scaffolding Scaffolding Formwork Formwork Formwork Formwork Formwork Scaffolding
Level of Preventive Action
126
Constructive Systems Total of Lpac %
60% Lpac
70 60 50 40 30 20 10 0 Fence False Ceiling Water Installation Armor Formwork Armor Stripping Water Installation HVAC Systems Waterproofing Masonry Masonry Plasterboard Plasterboard Plaster Sub-Screed Water Installation Plasterboard Electric Installation Electric Installation Roof False Ceiling Plasterboard False Ceiling Roof Flooring
Level of Preventive Action
Fig. 7.6 Level of Preventive Action average values in the work of Brazil
Constructive Systems
Total of Lpac %
60% Lpac
Fig. 7.7 The average value of the Level of Preventive Action in the work of Spain
7.3.2 Results of the Preventive Action Level by Construction Systems Next, the average values of the Preventive Action Level are represented for each construction system carried out in each of the works. These graphs do not represent chronological evolution. In the case of the work in Brazil (Fig. 7.9), the values obtained and the color code of the corresponding level of preventive action control
127
80 70 60 50 40 30 20 10 0 Armor Formwork Armor Drainage Audiovisual Armadura Formwork Armor Formwork Armor Formwork Demolition Earthworks Armor Formwork Earthworks Concreting Concreting Armor Armor Compaction Sub-Screed Curb Edge Paviment Curb Edge Retaining Wall
Level of Preventive Action
7 Risk Assessment Comparative Analysis by the Method “Level …
Constructive Systems Total of Lpac %
60% Lpac
Formwork
24.62
Sewer
Shoring
21.33
Fundation
13.08
Concreting
0.62 Armor
4.22
10.15
17.99
Excavation
35.21 21.33
Storage
70.00 60.00 50.00 40.00 30.00 20.00 10.00 0.00
Administrative
Level of Preventiva Action
Fig. 7.8 Level of Preventive Action average values in the work of Portugal
Constructive Systems
Fig. 7.9 Level of Preventive Action for construction systems in the work of Brazil
are identified. The works referring to the systems linked to the foundations such as excavations, sanitation and rebar have required greater control of preventive action. In the case of the work in Spain (Fig. 7.10), it is a work in which all the construction systems of the extension have been executed. This implies a greater number of risk elements reflected in the results. The roof works required intensive control of preventive action, and the electrical installation systems, coatings, and laminated plasterboard required greater control of preventive action. In the case of the work in Portugal (Fig. 7.11), the works related to the concrete retaining walls have required exhaustive control of preventive action. The work on the concrete walls of the platforms required greater control of preventive action. The rest of the works required levels of more control and adequate control.
L. C. Pentelhão et al.
38.49 31.51
19.00
False Ceiling
Fence
Electric Installation
Plasterboard
Stripping
15.28
11.95 8.54
4.47 Sub-Screed
Roof
Flooring
Formwork
8.59
Waterproofing
13.28
HVAC Systems
17.97
6.26
26.47
25.09
Plaster
26.47
Water Installation
26.85
Armor
70.00 60.00 50.00 40.00 30.00 20.00 10.00 0.00
Masonry
Level of Preventive Action
128
Constructive Systems
69.00
21.80
rataining Wall
Drainage
Demolition
Sub-Screed
Compactation
Formwork
Constructive Systems
Paviment
16.00 17.00 13.00
10.00 10.00 11.00 8.50
Earthworks
12.50
AMV assembly
22.50
Curb Edge
16.69
Concreting
80.00 70.00 60.00 50.00 40.00 30.00 20.00 10.00 0.00
Armor
Level of Preventive Action
Fig. 7.10 Level of Preventive Action for construction systems in the work of Spain
Fig. 7.11 Level of Preventive Action for construction systems in the work of Portugal
7.3.3 Results of the Preventive Action Level for the Risks Evaluated For the work in Brazil (Fig. 7.12), the results show an evident need for intensive control of preventive action for Industrial Hygiene (noise and vibration) and Ergonomics (wrong position, physical effort, and load handling). The rest of the risks evaluated present adequate control results for Occupational Safety risks and optimal control of preventive action in psychosocial risks.
7 Risk Assessment Comparative Analysis by the Method “Level …
129
Level of Preventive Action
70.0% 60.0% 50.0% 40.0% 30.0% 20.0% 10.0% Lack of communication
Lack of Autonomy
Monotomy
Lack of information
Weight management
Physical effort
Bad position
Vibration
Noise
Exposure to biological contaminants
Running over or hits with vehicles
Blows/cuts by objects or tools
Crash against moving objects
Stepping on objects
Dropping of detached objects
Fall to the same level
Dropping manipulation objects
Fall to different levels
0.0%
Risks Evaluated Average Lpac %
60 % Lpac
Fig. 7.12 Level of Preventive Action for the risks evaluated in the work of Brazil
For the work in Spain (Fig. 7.13), Occupational Safety, Industrial Hygiene and Psychosociology risks stand out for being below the 20% level, with levels of more control of preventive action. Ergonomic risks of poor position and physical exertion required intensive control. For the work in Portugal (Fig. 7.14), higher levels of control of preventive action are required in all the areas of risk evaluation (Safety at Work, Industrial Hygiene, Ergonomics and Psychosociology).
7.3.4 Results of the Preventive Action Level for Risk-Fighting Techniques For the work in Brazil (Fig. 7.15), the results show an evident need for intensive control of preventive action for ergonomic risks. However, the rest of the risk-fighting techniques present moderate-low levels of preventive action control. For the work in Spain (Fig. 7.16), the results show an evident need for intensive control of preventive action for ergonomic risks. On the other hand, it is well known
Average Lapc %
Risks Evaluated
60 % Lpac
Fig. 7.14 Level of Preventive Action for the risks evaluated in the work of Portugal
working time
Lack of communication
Lack of information
physical effort
Average Lpac %
Displacement
bad position
bad lighting
Vibration
Noise
Running over hits vehicles
direct electrical contacts
Blows/cuts tool objects
Crash against moving objects
Falling Objects Manipulation
people fall even level
People fall at different levels
Level of Preventive Action
working time
Monotony
Lack of information
Physical effort
Bad position
Non-ionizing radiation
Vibration
Noise
Fire and explosions
Exposure to toxic substances
Direct electrical contacts
Over effort
Seizure by or between objects
Projection of fragments particles
Blows/cuts by objects
Stepping on objects
Dropping manipulation objects
Falling objects by collapse
Fall to the same level
Fall to different levels
Level of Preventive Action
130 L. C. Pentelhão et al.
70.0%
60.0%
50.0%
40.0%
30.0%
20.0%
10.0%
0.0%
Risks Evaluated
60 % Lpac
Fig. 7.13 Level of Preventive Action for the risks evaluated in the work of Spain
70.0%
60.0%
50.0%
40.0%
30.0%
20.0%
10.0%
0.0%
131
Psychosociology
Psychosociology
Psychosociology
Psychosociology
90 230 320 330 340 410 430 440 510 520 540 550
Ergonomy
80
Ergonomy
Safety
60
Ergonomy
Safety
50
Industrial Hygiene
Safety
40
Industrial Hygiene
Safety
20
Industrial Hygiene
Safety
10
Safety
Safety
70.0% 60.0% 39.3% 39.… 38.3% 38.2% 50.0% 40.0% 30.0% 16.0% 20.0% 4.5% 7.0% 6.1% 6.4% 6.1% 3.4% 4.6% 2.0% 1.6% 2.2% 2.3% 0.6% 1.9% 10.0% 0.0% Safety
Level of Preventive Action
7 Risk Assessment Comparative Analysis by the Method “Level …
Risk-fighting techniques and corresponding risks evaluated 60 % Lpac
Average Lpac %
Psychosociology
Psychosociology
Psychosociology
Ergonomy
Ergonomy
Industrial Hygiene
Industrial Hygiene
Industrial Hygiene
Safety
Safety
Safety
Safety
Safety
Safety
Safety
Safety
Safety
Safety
48.6% 35.9% 17.4% 21.1% 25.6% 20.2% 20.2% 19.5% 18.8% 17.7% 14.7% 7.1%2.5% 6.5% 4.7%2.9%1.2% 3.9%2.6%8.6%
Safety
70.0% 60.0% 50.0% 40.0% 30.0% 20.0% 10.0% 0.0%
Safety
Level of Prevntive Action
Fig. 7.15 Level of Preventive Action for risk-fighting techniques in the work of Brazil
10 20 30 40 60 90 100 110 130 161 170 200 330 340 370 410 430 510 520 570 Risk-fighting techniques and corresponding risks evaluated Average Lpac %
60 % Lpac
Fig. 7.16 Level of Preventive Action for risk-fighting techniques in the work of Spain
that greater control of preventive action is required for Occupational Safety and Hygiene risks, in general. It should also be noted that risks with an optimal level of preventive action have been identified in Work Safety, Industrial Hygiene and Psychosociology. For the work in Portugal (Fig. 7.17), the results show that in this work and during the time of data collection for the investigation, all the risk-fighting techniques required a higher level of preventive action control. In Safety at Work, a risk was identified with an optimal level of preventive action.
L. C. Pentelhão et al.
34.6%
Psychosociology
Psychosociology
Psychosociology
Ergonomy
Ergonomy
90
Ergonomy
80
Industrial Hygiene
40
Industrial Hygiene
Safety
20
Industrial Hygiene
Safety
10
Safety
Safety
3.3%
24.2%25.5% 23.1% 23.0% 22.2% 16.4% 15.6% 13.4% 12.5% 10.3%
Safety
27.5% 19.3% 14.2%
17.4%
Safety
70.0% 60.0% 50.0% 40.0% 30.0% 20.0% 10.0% 0.0%
Safety
Level of Preventive Action
132
161 230 330 340 380 410 420 430 510 550 570
Risk-fighting techniques and corresponding risks evaluated 60 % Lpac Average Lapc %
Fig. 7.17 Level of Preventive Action for risk-fighting techniques in the work of Portugal
7.4 Discussion The method requires a relatively intense data collection to guarantee an adequate Preventive Action Level result. However, this data collection is carried out with a specialized technical observation in which objectivity prevails and from a small psychosocial survey on risk perception. The method’s applicability can be specific on a construction system, partial on a set of different construction systems or global on the entire construction work. Being able to evaluate a single risk or different types of risks. It is a method adapted to the complexity that characterizes construction works. One of the peculiarities of the method is its enormous sensitivity to detect risk situations. The adaptation and development of the William T. Fine method formula does not make the final essence disappear, which is the justification for corrective action. Even, as indicated by the method of W.T. Fine, the quantification values used in the new Preventive Action Level method are the most interesting in terms of the numbering that follows and the possible ranges of results that they offer. They can be modified depending on the work environments being observed for evaluation. It is essential to learn to observe people, from different work environments, in their jobs and identify unsafe or deficient acts [30] since accident prevention and risk management is a social priority in the construction industry. Occupational accidents generate economic losses to companies, administrations, workers and society in general [29], so the accident rate requires analysis from a global environment approach [8, 9, 48–51]. It should be noted that the Preventive Action Level methodology allows the identification of processes in observation environments that require immediate preventive actions, characterized by this great sensitivity. In decision making, preventive action controls imply improving any observation environments. For this, communication
7 Risk Assessment Comparative Analysis by the Method “Level …
133
and the establishment of information and training strategies for workers are important to know how to improve prevention environments. In the documentary environment, it is essential to identify and improve the previous conditions regarding the geometry and constructive characteristics of the building in the conception and design phase. In the construction environment, preventive action must improve the conditions of exposure to risk for workers and collective and individual protection systems during construction work. Finally, participation in prevention and workers’ moods during construction work must be improved with positive communication strategies in the social environment.
7.5 Conclusion The design of the building, the construction systems and the safety elements used during the construction process are fundamental elements. In addition, the state of mind and the participatory interest in safety matters imply decisive degrees of correction in evaluating occupational risks. It is essential to learn to observe the construction from a technical-constructive point of view and analyze the interest shown by the worker regarding his participation in health and safety individually or in a group and his behavior regarding his state of mind; and how constructive development is affected. One of the characteristics of the risk assessment method of the Preventive Action Level is its immediate nature and adaptability to the different construction systems, planning and development of a construction site, being able to identify from the aspects of each of the observation environments, regarding the result of the Preventive Action Level, what is the control base and the amount of preventive action that is required on each one of them to achieve an optimal control situation. This new risk assessment methodology reflects the necessary evolutionary conditions required by the characteristics of the work development and proposes a different transformation approach involving new concepts of human nature. The use of communication techniques is essential to emphasize the participation, sensitization and awareness of workers and construction agents in improving health and safety conditions and quality of work. The great variety of results allows proposing preventive action control recommendations in a specific manner on a particular risk, on a particular worker, on a group of workers or work team, on preventive, absolute, documentary observation environments, constructive and social; or globally on the Level of Preventive Action in each of the techniques to combat risk or on construction in general. This new methodology allows for socializing with the different hierarchical levels of workers and construction agents. The different levels of preventive action control determine the degree of information and communication needed to be implemented during the construction phase to achieve improvements in occupational health and safety. This has significant implications for social relations between workers. It is important to highlight that, based on the necessary preventive information, necessary
134
L. C. Pentelhão et al.
preventive training and, consequently, an improvement in workers’ participation in prevention. This participation can be measured by the parameter of participatory interest, which implies the improvement of the documentary, constructive and social environments of the constructive process.
References 1. Molina J (2006) Historia de la seguridad en el trabajo en España. Dirección General de Trabajo y Prevención de Riesgos Laborales, Spain 2. Swuste P, Groeneweg J, Gulijk C, Zwaard W, Lemkowitz S, Oostendorp Y (2020) The future of safety science. Saf Sci 125:104593. https://doi.org/10.1016/j.ssci.2019.104593 3. Forteza FJ, Carretero J, Sese A (2017) Occupational risks, accidents on sites and economic performance of construction firms. Saf Sci 94:61–76. https://doi.org/10.1016/j.ssci.2017. 01.003 4. Pinto A (2014) QRAM – a Qualitative Occupational Safety Risk Assessment Model for the construction industry that incorporate uncertainties by the use of fuzzy sets. Saf Sci 63:57–76. https://doi.org/10.1016/j.ssci.2013.10.019 5. Simanaviciene R, Liaudanskiene R, Ustinovichius L (2014) Assessing reliability of design, construction, and safety related decisions. Automa Constr 39:47–58. https://doi.org/10.1016/ j.autcon.2013.11.008 6. Salanova M, Gracia E, Lorente L (2005) Metodologia Wont para la evaluacion y prevencion de riesgos psicosociales. Gestión Práctica de Riesgos Laborales 14:22–32 7. Reyes J, San Jose J, Cuadrado J, Sancibrian R (2014) Health & safety criteria for determining the sustainable value of construction projects. Saf Sci 62:221–232. https://doi.org/10.1016/j. ssci.2013.08.023 8. Oliveira C (2010) Propuesta de una metodología integrada para la evaluación del riesgo profesional. Doctoral thesis, Universidad de Leon, Spain 9. Claudino Veras J (2012) Método para la evaluación de riesgos laborales en obras de construcción de grandes viaductos. Doctoral thesis, Universitat Politecnica de Catalunya, Spain 10. Carpio AJ (2017) Nueva metodologia de evaluacion de riesgos laborales adaptada a obras de edificacion, Nivel de la Acción Preventiva. Doctoral thesis, Universidad Politécnica de Madrid, Spain 11. Gürcanli GE, Müngen U (2009) An occupational safety risk analysis method at construction sites using fuzzy sets. Int J Ind Ergon 39(2):371–387. https://doi.org/10.1016/j.ergon.2008. 10.006 12. Mohamed S, Ali TH, Tam WYV (2009) National culture and safe work behaviour of construction workers in Pakistan. Saf Sci 47(1):29–35. https://doi.org/10.1016/j.ssci.2008. 01.003 13. Zhao D, McCoy AP, Kleiner BM, Mills TH, Lingad H (2016) Stakeholder perceptions of risk in construction. Saf Sci 82:111–119. https://doi.org/10.1016/j.ssci.2015.09.002 14. Mushayi T, Deacon C, Smallwood J (2018) The effectiveness of health and safety training and its impact on construction workers’ attitudes, and perceptions. In: Sahin ¸ S (eds) 8th international conference on engineering, project, and product management (EPPM 2017). Lecture notes in mechanical engineering. Springer, Cham, pp. 235–244 15. Act 31 of 8th November 1995 on Prevention of Occupational Risks. Official State Gazette (BOE), 10th November 1995. BOE Number 269. Spain, https://www.insst.es/documents/ 94886/200952/Act+31+of+8th+November+1995+on+prevention+of+occupational+risks 16. Rozenfeld O, Sacks R, Rosenfeld Y, Baum H (2010) Construction job safety analysis. Saf Sci 48:491–498. https://doi.org/10.1016/j.ssci.2009.12.017 17. Zhi H (1995) Risk management for overseas construction projects. Int J Proj Manag 13(4):231– 237. https://doi.org/10.1016/0263-7863(95)00015-1
7 Risk Assessment Comparative Analysis by the Method “Level …
135
18. Zadeh L (1965) Fuzzy sets. Inf Control 8(3):338–353. https://doi.org/10.1016/S0019-995 8(65)90241-X 19. Sousa V, Almeida N (2014) Dias LA (2014) Risk-based management of occupational safety and health in the construction industry—part 1: background knowledge. Saf Sci 66:75–86. https://doi.org/10.1016/j.ssci.2014.02.008 20. Salanova M, Gracia E, Lorente L (2007) Riesgos psicosociales en trabajadores de la construcción. Gestión Práctica de Riesgos Laborales 44:12–19 21. Rodrigues F, Antunes F, Matos R (2021) Safety plugins for risks prevention through design resourcing BIM. Constr Innov 21(2):244–258. https://doi.org/10.1108/CI-12-2019-0147 22. Zhang M, Shi R, Yang Z (2020) A critical review of vision-based occupational health and safety monitoring of construction site workers. Saf Sci 126:104658. https://doi.org/10.1016/j. ssci.2020.104658 23. Shaikh HH, Zainun NY, Khahro SH (2020) Claims in construction projects: a comprehensive literature review. In: Proceedings of the IOP conference series: earth and environmental science, vol 48. Bristol, UK, p. 012095 24. Hallowell MR, Bhandari S, Alruqi W (2020) Methods of safety prediction: analysis and integration of risk assessment, leading indicators, precursor analysis, and safety climate. Constr Manag Econ 38(4):308–321. https://doi.org/10.1080/01446193.2019.1598566 25. Houtman I, van Zwieten M, Leka S, Jain A, de Vroome E (2020) Social dialogue and psychosocial risk management: added value of manager and employee representative agreement in risk perception and awareness. Int J Environ Res Public Health 17(10):3672. https://doi.org/10. 3390/ijerph17103672 26. Szer J (2020) Safety of buildings and construction disasters. Arch Civ Eng 66(1):281–295. https://doi.org/10.24425/ace.2020.131788 27. Lyons T, Skitmore M, Skitmore M (2004) Project risk management in the Queensland engineering construction industry: a survey. Int J Proj Manag 22(1):51–61. https://doi.org/10.1016/ S0263-7863(03)00005-X 28. Mahabadi HA, Khosravi Y, Hassanzadeh-Rangi N, Hajizadeh E, Behzadan AH (2020) Factors affecting unsafe behavior in construction projects: development and validation of a new questionnaire. Int J Occup Saf Ergo 26(2):219–226. https://doi.org/10.1080/10803548.2017.140 8243 29. Silva SA, Araújo A, Costa D, Meliá JL (2013) Safety climates in construction industry: understanding the role of construction sites and workgroups. Open J Safety Sci Technol 3:80–86. https://doi.org/10.4236/ojsst.2013.34010 30. Paolillo A, Silva SA, Carvalho H, Pasini M (2020) Exploring patterns of multiple climates and their effects on safety performance at the department level. J Safety Res 72:47–60. https://doi. org/10.1016/j.jsr.2019.12.009 31. Mohammadi A, Tavakolan M (2020) Identifying safety archetypes of construction workers using system dynamics and content analysis. Saf Sci 129:104831. https://doi.org/10.1016/j. ssci.2020.104831 32. Martínez-Aires MD, Rubio-Gamez M, Gibb A (2010) Prevention through design: The effect of European directives on construction workplace accidents. Saf Sci 48(2):248–258. https:// doi.org/10.1016/j.ssci.2009.09.004 33. Zhi H (1995) Risk management for overseas construction projects. Int J Proj Manag 13:231– 237. https://doi.org/10.1016/0263-7863(95)00015-1 34. Allen E, Iano J (2019) Fundamentals of building construction: materials and methods. John Wiley & Sons, Inc., Hoboken, NJ, USA 35. Gao Y, González VA, Yiu TW (2020) Exploring the relationship between construction workers’ personality traits and safety behavior. J Constr Eng M 146:04019111. https://doi.org/10.1061/ (ASCE)CO.1943-7862.0001763 36. Haslam R, Hide S, Gibb A, Gyi D, Pavitt T, Atkinson S, Du A (2005) Contributing factors in construction accidents. App Ergon 36(4):401–415. https://doi.org/10.1016/j.apergo.2004. 12.002
136
L. C. Pentelhão et al.
37. Fakhratov M, Sinenko S, Akbari M, Asayesh F (2020) Determination of fundamental criteria in the selection of a construction system. Proc E3SWeb Conf 157:06025 38. Forteza FJ, Sesé A, Carretero-Gómez JM (2016) CONSRAT. Construction sites risk assessment tool. Saf Sci 89:338–354. https://doi.org/10.1016/j.ssci.2016.07.012 39. Tepeli E, Taillandier F, Breysse D (2021) Multidimensional modelling of complex and strategic construction projects for a more effective risk management. Int J Constr Manag 21(12):1218– 1239. https://doi.org/10.1080/15623599.2019.1606493 40. Mohamed S, Ali T, Tam W (2009) National culture and safe work behaviour of construction workers in Pakistan. Saf Sci 47:29–35. https://doi.org/10.1016/j.ssci.2008.01.003 41. Bhandari S, Hallowell MR, Van Boven L, Welker KM, Golparvar-Fard M, Gruber J (2020) Using augmented virtuality to examine how emotions influence construction-hazard identification, risk assessment, and safety decisions. J Constr Eng M 146(2):04019102 42. Neal AF, Griffin MA, Hart PM (2000) The impact of organizational climate on safety climate and individual behavior. Saf Sci 34(1–3):99–109. https://doi.org/10.1016/S0925-7535(00)000 08-4 43. Carpio-de los Pinos AJ, González-García MdlN, (2020) Development of the protocol of the occupational risk assessment method for construction works: level of preventive action. Int J Environ Res Public Health 17(17):6369. https://doi.org/10.3390/ijerph17176369 44. Carpio AJ, González MN, Martínez I, Prieto MI (2020) Protocol development: level of preventive action method, considering the preventive environments in construction works. J Civ Eng Manag 26(8):819–835. https://doi.org/10.3846/jcem.2020.13598 45. Fine WT (1971) Mathematical evaluation for controlling hazards. J Safety Res 3(4):157–166 46. Silva APS (2020) Avaliação de Risco em uma obra de construção civil. Dissertação Mestrado em Engenharia de Segurança e Higiene Ocupacionais, Faculdade de Engenharia da Universidade do Porto, Portugal 47. Bestratén M (2000) Evaluación de las Condiciones de Trabajo en Pequeñas y Medianas Empresas. Metodología Práctica. INSST, Ministerio de Trabajo y Asuntos Sociales, Madrid, Spain, pp. 1–21 48. Úbeda de Mingo P (2002) Espacio: Roles, ritos y valores entre los constructores de edificios. Granada, Colegio Oficial de Aparejadores y Arquitectos Técnicos de Granada, Spain 49. Sanni-Anibire MO, Mahmoud AS, Hassanain MA, Salami BA (2020) A risk assessment approach for enhancing construction safety performance. Saf Sci 121:15–29. https://doi.org/ 10.1016/j.ssci.2019.08.044 50. Lucchini RG, London L (2014) Global occupational health: current challenges and the need for urgent action. Ann Glob Health 80(4):251–256. https://doi.org/10.1016/j.aogh.2014.09.006 51. Avdiu B, Nayyar G (2020) When face-to-face interactions become an occupational hazard: jobs in the time of COVID-19. Policy research working paper 9240. World Bank Group; Finance, Competitiveness and Innovation Global Practice.
Chapter 8
An Open-Source Built Heritage Management Tool for Inner Areas M. Merola
Abstract A Management System, which takes into consideration the life cycle of the building and aims at improving the energy performance of the existing building stock, is the objective of the research project whose first results are presented in this contribution. The building park of Piaggine [Salerno], a minor historical centre in the National Park of Cilento and Vallo di Diano and Alburni, as part of the enhancement of inner areas characterised by a significant architectural, naturalistic and environmental heritage, was chosen as a sample area for the experimentation of this tool. The characteristics of the built environment were analysed and collected in a GIS system which, through “dialogue” with known databases, made it possible to implement and associate a quantity of information and data on the existing built heritage. After that, a new database was generated that defined a first life cycle of the buildings, indicating their stratification, maintenance and building density, and identifying unauthorised building and unsuitable building management. In this way, it will be possible for the public and private sector to monitor consumption, plan interventions and manage the built heritage. The added value in the use of this tool is its application by the Public Administration, which will operate with: consultancy activities, through a personalised relationship with the user and convention with public officials and authorised technicians, it will provide suitable hypotheses concerning services for the management and renovation of existing buildings or for future interventions and, through incentive tools, which work dynamically with the system, it will be able to promote access to energy efficiency of goods and services contrasting the phenomenon of energy poverty. Keywords Management System · Opens-source · Database · Buildings · Inner Area
M. Merola (B) Department of Engineering, University of Campania “L. Vanvitelli”, Via Roma, 29, 81031 Aversa, Italy e-mail: [email protected] © The Author(s), under exclusive license to Springer Nature Switzerland AG 2023 M. N. González García et al. (eds.), New Advances in Building Information Modeling and Engineering Management, Digital Innovations in Architecture, Engineering and Construction, https://doi.org/10.1007/978-3-031-30247-3_8
137
138
M. Merola
8.1 Introduction The production and use of energy from non-renewable sources are responsible for a large part of global warming gas emissions; therefore, the decarbonisation of the energy system is a key objective in both the ONU strategies (Agenda 2030) and the long-term strategies for achieving carbon neutrality by 2050 as outlined by the European Union [1]. The European Green Deal focuses on the development of an integrated, interconnected and digitised energy market, guaranteeing a secure and affordable energy source, and giving priority to energy efficiency by improving the energetic performance of buildings through the use of renewable forms of energy. In the Italian national framework, in order to track the policies and measures implemented by the EU Member States, a governance system based on long-term strategies has been set up, which lays the foundations on the Integrated National Energy and Climate Plans (PNIEC) [2], whose objective is to achieve an energy policy, guaranteeing full environmental, social and economic sustainability to the entire sector. Within the Plan, several analyses and forecasts were carried out in the different sectors in order to implement suitable strategies to reduce emissions. In this context, it has emerged that, in the civil construction sector, there could be a significant reduction in the production of CO2 as a consequence of the acceleration of energy efficiency measures in existing buildings, implemented by in-depth redevelopment and the application of high-performance technologies. The technological design at all scales (building, neighbourhood, city, wide area), in this context, has an important role for the regeneration of urban built contexts. In order to reduce emissions, it is essential to adopt a circular design model, which will prioritise the regeneration, recovery, rehabilitation and reuse of existing buildings and which is oriented towards saving resources and implementing the value of the built heritage. The importance of having solid European and national reference strategies goes with the institutional capacity to rearticulate, territory by territory, the connections between the different components and multiple actors of the system, helping to redefine its objectives and instruments, adopting appropriate solutions for each context. In order to achieve the objectives set by the European Council, it should be remembered that in the area of the Next Generation EU [3], the instrument adopted at European level to respond to the pandemic crisis and which envisages investments and reforms to accelerate the ecological and digital transition, the Italian Government has finalised the National Recovery and Resilience Plan (PNRR) [4], an investment programme designed to update national strategies in terms of development and mobility, digitalisation, inclusion, health, education and research, generating a more competitive, dynamic and innovative economy. The measures in this plan are based on three strategic axes shared at European level: digitalisation and innovation, ecological transition and social inclusion. The Italian PNRR is divided into sixteen Components, grouped into six Missions (Fig. 8.1), in which the funds planned for each of them are indicated, allocating a considerable amount of investment for the ecological transition and for digitalisation, innovation, competitiveness, culture and tourism.
8 An Open-Source Built Heritage Management Tool for Inner Areas
139
Fig. 8.1 Assignment of RRF resources to Missions
The subject of research, whose initial results are presented here, is part of this process. Specifically, Research is part of Mission 1, which supports the country’s digital transition, the modernisation of the public administration, communication infrastructures and the production system, of Mission 2, which aims to achieve the ecological transition of society and the economy in order to make the system sustainable and guarantee its competitiveness, and lastly, of Mission 5, which places specific attention on territorial cohesion, with the reinforcement of the National Strategy of Inner Areas (SNAI) [5]. Inland areas are defined as areas significantly distant from a centre offering essential goods and services, such as education, health and mobility. They are characterised by highly important environmental and cultural resources that have been diversified through the stratification of anthropisation processes. These areas are the location of a quarter of the national population, which is distributed over 60% of the territory and occupies approximately four thousand Municipalities (Fig. 8.2). On a subject of such relevance, the research aims to valorise in an integrated approach and to remodel the existent building stock in a contemporary key, intervening in a focused way to reactivate the economic and productive flows of such areas, since a significant amount of the Inland Areas, after the Second World War, have undergone strong declines concerning: depopulation, employment reduction and land use, as well as the decline of public and private services and the degradation in the protection of the cultural and landscape heritage. From a demographic point of view, Italy has suffered a rapid and profound change that has produced not only a quantitative but also a “qualitative” transformation of the population, leading to a loosening of the inhabitants’ control over the territory, a change in the use and destination of the land, particularly in the Inland Areas where these phenomena are most evident, leading to a consequent loss of protection of the territory, the architectural, cultural and environmental heritage and causing an increase in hydrogeological risk.
140
M. Merola
Fig. 8.2 Map of Italy’s Inner Areas
On a subject of such relevance, the research aims to valorise in an integrated approach and to remodel the existent building stock in a contemporary key, intervening in a focused way to reactivate the economic and productive flows of such areas, since a significant amount of the Inland Areas, after the Second World War, have undergone strong declines concerning: depopulation, employment reduction and land use, as well as the decline of public and private services and the degradation in the protection of the cultural and landscape heritage. From a demographic point of view, Italy has suffered a rapid and profound change that has produced not only a quantitative but also a “qualitative” transformation of the population, leading to a loosening of the inhabitants’ control over the territory, a change in the use and destination of the land, particularly in the Inland Areas where these phenomena are most evident, leading to a consequent loss of protection of the territory, the architectural, cultural and environmental heritage and causing an increase in hydrogeological risk. Therefore, it will be necessary to activate development processes for the benefit of these areas, focused on development factors and on themes of great relevance, linked to the potential of hidden resources belonging to these territories. The aim is to obtain visible and measurable results, within a short period of time, through the effort of human capital and the availability of financial support. The implementation of a strategy for Inner Areas aims not only at the valorisation of existing resources in a development perspective, but also contributes to the objective of sustainability and protection of the territory, having as reference the goals to be achieved supported by the 2030 Agenda for Sustainable Development [6], which consists of the 17 Sustainable Development Goals (SDGs). The results pursued by the study, the first results presented here, aim at the goals of Objective 11—Sustainable Cities and Communities (Fig. 8.3), i.e. empowering inclusive and sustainable urbanisation by planning and managing human settlement in a participatory, integrated and sustainable way, in
8 An Open-Source Built Heritage Management Tool for Inner Areas
141
Fig. 8.3 17 Sustainable Development Goals | Objective number 11 in evidence
order to mitigate the challenges imposed by the urban environment that include insufficient funds to provide basic services, deteriorating infrastructure and especially the scarcity of adequate housing, increasing the phenomenon of “energy poverty” [7]. This phenomenon is caused by a condition of inability to access the levels of energy consumption that are socially and materially necessary [8], generating risks to physical and mental health, reducing performance in the workplace and education sectors and, above all, causing negative effects on the environment. However, the energy transition is in fact an immanent reality that will not be fully realised unless it is thought of as one of the dimensions of the epochal change underway, which directly interests the environment, the economy and society in its intrinsic nature as a structured and dynamic system of stakeholders. The co-evolutionary approach of the built system with its environmental surroundings requires a cultural change in the way of designing, increasingly fuelled by ecological intelligence [9]. In order to support a low-energy and decarbonised economy and society, we need to contribute through the development of new highperformance, low environmental impact technologies and through a multidisciplinary approach based on the interaction of different competences [10].
8.2 Materials and/or Methods In order to follow models for sustainable development through the implementation of projects capable of limiting environmental impacts, satisfying the new housing needs linked to current lifestyles and ensuring the quality of urban environments, it is necessary to adopt policies that are oriented towards promoting, in the first instance, the transformation of the existing building stock, from ancient nucleus to more recent expansions [11] and revitalising the social, cultural and economic sector,
142
M. Merola
present in those territorial contexts characterised not only by significant landscapeenvironmental quality, but also by cultural identity and social value [12]. In this context, the National Strategy for Inland Areas (SNAI), which are distinguished by their valuable architectural, natural and environmental heritage, is a strategy to mitigate the problems of these territories, which are characterised by a fragile economic system, depopulation phenomena [13] and the scarce presence of infrastructural connections, which generates the need to adapt the existing to the community’s demands, through the improvement of the performance and services of the urban texture and the built heritage. Inland areas are identified as those areas that are significantly distant from the centres offering essential services and are rich in important environmental and cultural resources. Their conformation is the result of a decisive and respectful anthropic action that has shaped the territory, generating an evocative cultural landscape that exalts the peculiar orographic characteristics and the intense relations between human and natural actions woven over the centuries [14]. A significant part of the inland areas has undergone a process of marginalisation since the Second World War, which has manifested itself through intense deanthropisation phenomena, such as the reduction of the population below the critical threshold, demographic ageing and the reduction of employment and the degree of utilisation of territorial capital. Secondly, this process has manifested itself in the progressive quantitative and qualitative reduction in the local supply of public, private and collective services, which in contemporary European society represent the quality of citizenship. The area of interest is the Cilento Interno, located in the Campania Region (IT) (Fig. 8.4), and is composed of 29 municipalities, of which 14 are in peripheral and ultraperipheral areas (Fig. 8.5). The population lives for 59% in inland areas, with villages that do not reach 600 inhabitants and with depopulation indexes constant over the years, at—5.9% Fig. 8.4 Identification of Inland Cilento Municipalities with area classification
8 An Open-Source Built Heritage Management Tool for Inner Areas
143
Fig. 8.5 Identification of Inland Cilento Municipalities with area classification
from 2001 to 2011 there is a continuity in 2011–2017 with—4%. Therefore, official data show that in recent years the demographic trend has been stagnant with a progressively older population, associated with youth emigration which, despite being connected to its territory, does not transfer its residence; this trend has resulted in a consequent overabundance of empty and obsolete buildings which necessitate the definition of strategies for the reuse of the built environment and the regeneration of contexts at different scales [15]. This is the background to the tool whose results are presented in this contribution. It is related to the possibility for the public sector to monitor consumption, to plan interventions and to manage the public heritage, to protect and to prevent the risks caused by the bad management of private buildings, in a perspective of energy transition [16], by the dynamic management for the improvement and efficiency of the existing built heritage.
144
M. Merola
The aim of the research and its innovative content is the testing and promotion of a Management Tool for existing buildings, which can monitor and enhance the energy performance of buildings in smaller centres, in particular in Inner Areas. “The research method starts from the analysis of the environmental context (data acquired through a direct observation and a statistical database), it analyses the demand for goods and services required by the customer, it identifies the paradigms of bioclimatic architecture, it chooses the tools (software), it processes the data, it transforms the data processed in design solutions and verifies measurements with strict assumptions.” [17] In this way, it is possible to accelerate the implementation of innovative technologies through specific interventions in each existing building. Through the observation and dialogue of existing databases, it is possible to gain information about the life cycle of the building, to organise and manage interventions to increase energetic efficiency and the production of renewable energy, to reduce the decarbonisation of the existing building stock and to evaluate possible interventions for retrofit energy [18]. Moreover, through incentive tools, which work dynamically with the system, it is possible to promote access to energy efficiency of goods and services, combating the phenomenon of energy poverty. This affects a significant number of families, leading the European Commission to highlight the need to manage the energy transition in an equal and inclusive way, giving particular attention to the segment of the population most vulnerable to the effects of climate change and environmental degradation [19]. Achieving carbon neutrality will require reducing the use of nonrenewable resources by changing consumption and production models and increasing the resilience factor of the urban system. “The environmental impacts are progressively reduced and cushioned by the resilience of its environmental surroundings, and at the end of their useful life the reintegration into the natural cycle is total and with positive utility” [20]. In the residential sector, there is ample opportunity to encourage energy restructuring by activating strategies that not only reduce emissions, but also generate cost savings in energy provision, promote innovation, investment and employment [21], “the effectiveness of these instruments, the innovative impetus they can generate, will depend on their adaptability to the particularly variable characteristics of this complex but decidedly strategic segment of the construction industry” [22]. The study of a smart Building Management tool is the central object of the research. The Municipality of Piaggine [SA], located in the inland area of the Cilento Vallo di Diano and Alburni National Park (Fig. 8.6), was chosen as a “sample area” to implement an efficient and circular process of utilisation of the resources present in the inland areas, as part of the implementation strategies aimed at their revitalisation.
8 An Open-Source Built Heritage Management Tool for Inner Areas
145
Fig. 8.6 Cilento, Vallo di Diano e Alburni National Park—identification of the sample area of the Municipality of Piaggine
8.3 The Historical and Environmental Characteristics of the “Sample Area” The municipality of Piaggine, located 630 m above sea level, with its barycentric position, shows all the typical features of the mountain environments of this protected area. In the beginning, the settlement was called Chiaìne Soprane (to distinguish it from Chiaìne Sottane, today’s Valle dell’Angelo) from the Latin Glarea or gravel, because of the banks of sediment from ancient alluviums on which it was born. Later, it was called Laurino Soprano because it depended on Laurino and finally it was called Piaggine (from the Latin plaga); according to G. B. Pacichelli because it was born on the “little beaches of the river”; according to G. B. Pellegrini [23] because on “sloping land”. The territory develops along the high valley of the Calore river, where, along its course, there are suggestive views of uncontaminated nature; it is delimited to the south by the slopes of Mount Cervati, which, with its 1898 m, is the highest peak in Campania, and of the Cima di Mercuri, while to the north it is delimited by the Massif of Mount Motola. The urban agglomeration develops following the sloping ground with a series of streets towards the upper part and towards the Calore
146
M. Merola
river, forming an X. The municipality of Piaggine was founded around 1100 by a religious community. The historic centre is a characteristic agglomeration of stone houses, with numerous aristocratic buildings dating back to the eighteenth century, whose keystones are engraved with the coats of arms of the local families; it is home to numerous views and spaces of great value, which can and must be regenerated through the use of maintenance and design synergies, to bring out and valorise the features of the built environment from a cultural and historical point of view and to characterise the spaces around the buildings, where architectural beauty meets the power of nature, thus making it possible to give new life to the structures and disused areas and assign them to collective activities of growth and participation for the local community. From a methodological point of view, the analysis of the built heritage is the precondition for any kind of technical and management consideration. In fact, after the study of the historical and cultural matrix of the municipal territory, a preliminary cognitive study of the existing built fabric was carried out. The first phase permitted to frame the period of construction of the buildings, which are part of the municipal territory, finding a Medieval origin developed in the valley near the Calore River. During the Borbonic period, the settlement expanded on the northern side of the territory until it assumed its present appearance, where it is possible to see the different stratifications formed over the years (Fig. 8.7).
Fig. 8.7 Overview and stratification of the built heritage in the Municipality of Piaggine
8 An Open-Source Built Heritage Management Tool for Inner Areas
147
As far as the methodological aspect is concerned, in compliance with the functional transformations and typological changes, the actions for the conservation and recovery of the urban building will be directed towards interventions involving the structure, the decorative apparatus, the technological systems, in accordance with the current regulations and in prevision of the eco-innovation applications for the development of a sustainable economy. The diagnosis method, starting from the energy audit through the building system analysis (above all of the envelope) and the evaluation of the energy imprint of the construction, redesigns the whole system or some of its parts under the energetic point of view. This method enables the examination of the behaviour of the building installation system, according to different parameters (envelope performances, installation system efficiency, real energy consumptions from direct users, outdoor environment conditions, indoor comfort levels, integration with active and passive solar systems) until the energy requirements of the whole system under standard use conditions are determined. [24]
The second step involved the assessment of the percentage incidence of useful surface area for integration compared to the total useful surface area for residential use. The potential for energy production from renewable sources varies not only in relation to the orientation and geometric conformation of the supporting structure, but the coverage ratio must also be taken into account. For this reason, the need to examine the development of the volumes of each building, not only along the valley bordering the Calore River, but also along the slopes of the territory, was born, in order to obtain information on the bioclimatic behaviour with regard to exposure, orientation, orography and natural ventilation (Fig. 8.8). Finally, the third phase involved the analysis of the maintenance interventions carried out by the Municipality of Piaggine on the built heritage, taken from the study of the Recovery Plan [25]. The interventions of ordinary and extraordinary maintenance, aimed at guaranteeing the continuity of the building’s use over time; consolidation, to partially or totally integrate, with the appropriate techniques, the original collapsed elements, which cannot be replaced, but are unsuitable for use; renovation, to restore and replace certain parts of the building and, if planned, its enlargement; typological conservation and its conservative restoration, to preserve, enhance and restore the historical-artistic values and the architectural and decorative elements belonging to the valuable buildings; and urban restructuring, concerned with the recovery and rearrangement of the municipal urban fabric (Fig. 8.9). The necessity to collect all the information obtained from the graphical drawings required the inclusion of the last ones in a platform where it could be possible to extend and obtain further data on the existing building. The use of an Information Management System (Gis), allowed the “dialogue” between the different existing databases, open-source, obtaining an implementation of information concerning every single building.
148
M. Merola
Fig. 8.8 Graphical representation of the density and orography of the built heritage in the Municipality of Piaggine
8.4 Results and Discussion The introduction of the data acquired previously within the system and the use of the Agenzia delle Entrate’s national database, useful for obtaining information on cadastral data, made it possible to associate an identification code with each building and, by overlapping it with the geographical information database [ESRI], it was possible to carry out a graphical-logical verification of the building stock, by comparing the identities present in the cadastral database with the built heritage, phenomena of unauthorised building and incorrect management of the existing stock were identified (Fig. 8.10). The collected data were transferred to the open-source Management Information Software (Gis) (Fig. 8.11a), generating a preliminary database of the built heritage. A first cataloguing of the built heritage was carried out within the platform, subdividing each building into a specific category (Fig. 8.11b), at the same time as the composition of the attributes table (Fig. 8.11c) which, in addition to the
8 An Open-Source Built Heritage Management Tool for Inner Areas
149
Fig. 8.9 Graphic representation of maintenance works on the built heritage of the Municipality of Piaggine
Fig. 8.10 Portion of the territory of the municipality of Piaggine | a Agenzia delle Entrate database; b ESRI geographical information system
150
M. Merola
Fig. 8.11 Portion of the territory of the municipality of Piaggine | a Agenzia delle Entrate database; b ESRI geographical information system
generic classification, contains cadastral data, building density, type and destination of use, primarily referring to buildings for the public sector. For the building stock in the possession of the Public Administration, information schedules are also associated, containing tabular data, geo-localisation and photographic documentation (Fig. 8.11d), to facilitate the identification of the structure under investigation. The success of the initiatives to be taken in order to continue along this line will be determined by the ability to create synergies to cover technical, socio-economic, environmental and data processing aspects. This requires a capacity for dialogue between stakeholders from different sectors: Public Administration, research institutions and above all citizens. This tool, supplied to the Public Administration, will allow to monitor and manage the public real estate assets, planning interventions and increasing efficiency and the use of energy from renewable sources and will support private building through a consultancy relationship for the implementation of interventions to improve energy performance, promoting access to incentives for energy efficiency of goods and services and combating the phenomenon of energy poverty. Achieving economic neutrality requires a reduction in resource use by changing the mode of consumption and production. In the residential sector, there is ample scope for energy refurbishment, which will reduce emissions, save on energy supply and promote innovation and employment.
8 An Open-Source Built Heritage Management Tool for Inner Areas
151
8.5 Conclusion The results of the work show how the construction of a knowledge tool of the stratified historical building can be implemented over time through the inclusion of a series of data aimed at practices of valorisation, efficiency and integrated management. The “dialogue” between the known databases will close the information gap that currently makes it difficult to implement strategies on the built heritage, generating a system that takes into account the life cycle of the building, aimed at reducing the decarbonisation of the existing building stock and evaluating energy retrofit measures. This tool enables the Public Administration, where the last one will have an advisory function, through a personalised relationship with the user and an agreement with public officials and authorised technicians, to provide suitable hypotheses concerning services for the management and renovation of existing buildings or for future interventions. Technological and urban design will have a fundamental role in the creation of built urban environments, moving towards the reduction of human-caused activities that affect the surrounding environment.
References 1. Commissione Europea, L’energia e il Green Deal [Online] Available: https://ec.europa.eu/info/ strategy/priorities-2019-2024/european-green-deal/energy-and-reen-deal_it. Accessed 25 Oct 2021. 2. Piano Nazionale Integrato per l’Energia e il Clima (PNEC) [Online] Available: https://www. mite.gov.it/sites/default/files/archivio/pniec_finale_17012020.pdf. Accessed 25 Oct 2021 3. Commissione Europea, Direzione Generale della Comunicazione, Next Generation EU [Online] Available: https://europa.eu/next-generation-eu/index_it. Accessed 25 Oct 2021 4. Piano Nazionale di Recupero e Resilienza (PNRR) [Online] Available: https://www.governo. it/sites/governo.it/files/PNRR.pdf. Accessed 25 Oct 2021 5. Agenzia per la Coesione Territoriale, Strategia Nazionale per le Aree Interne (SNAI), [Online] Available: https://www.agenziacoesione.gov.it/strategia-nazionale-aree-interne/. Accessed 25 Oct 2021 6. Department of Economic and Social Affairs of United Nations, 2030 Agenda for Sustainable Development [Online] Available: https://sdgs.un.org/2030agenda. Accessed 25 Oct 2021 7. Santangelo A (2020) Povertà energetica ed edilizia residenziale pubblica. Possibili azioni per nuove politiche abitative a partire dal ruolo attivo degli utenti. In: Atti della XXII Conferenza Nazionale SIU. L’urbanistica italiana di fronte all’Agenda 2030, Bari-Matera 5-6-7 giugno 2019, pp 289–294 [Online] Available: http://media.planum.bedita.net/0d/ed/Atti_XXII_Conferenza_Nazionale_SIU_MateraBari_WORKSHOP_1.2_Planum_Publisher_2020.pdf. Accessed 30 Jun 2021 8. Bouzarovski S (2018) Energy poverty: (dis)assembling Europe’s infrastructural divide. Springer International Publishing, pp 9–39. https://doi.org/10.1007/978-3-319-69299-9 9. Goleman D (2009) Ecological intelligence, trad. it. D. Didero, BUR Rizzoli, Milano 10. Ferreira P, Soares I, Johannsen RM, Østergaard PA (2020) Policies for new energy challenges. Int J Sustain Energy Plan Manage 26:01–04. https://doi.org/10.5278/ijsepm.3552
152
M. Merola
11. Balletto G, et al. (2015) Urban redevelopment and energy saving. The case of the incentives in Italy, between risks and opportunities. In: Third international conference on advances in information processing and communication technology-IPCT 2015, pp 110–114 12. Danˇek J, Zelený J, Pecka Sejková A, Vaˇckáˇru˚ D (2020) Exploring and visualizing stakeholder value regimes in the context of peri-urban park planning. Soc Nat Resour 33(7):927–940. https://doi.org/10.1080/08941920.2019.1688440 13. Dossıer d’Area Organızzatıvo Cilento interno (Campania Region) [Online] Available: https:// ot11ot2.it/sites/default/files/campania_-_dao_cilento_interno.pdf. Accessed 25 Oct 2021 14. Merola M (2021) The value of the technological footprint on the territory in bio-cultural landscapes: the terraces of the Amalfi Coast. In: Atti dell Convegno Nazionale Vecchi problem e nuove soluzioni. I terrazzamenti della Costa d’Amalfi, paesaggio culturale Unesco, Ravello 9 ottobre 2021, Sustainable Mediterranean Construction land culture, research and technology Magazine, Special Issue n° 06, pp 61–68I. SBN: 978-88-6026-310-0 15. Ladu M, Balletto G, Milesi A, Mundula L, Borruso G (2020) Public real estate assets and the metropolitan strategic plan in Italy. The two cases of Milan and Cagliari. In: Gervasi O et al (eds) Computational science and its applications – ICCSA 2020. ICCSA 2020. Lecture notes in computer science, vol 12255. Springer, Cham 16. Sibilla M, Kurul E (2018) Knowledge integration for low carbon transition: the case of energy retrofit. Eur J Sustain Dev 7(3):493–506. https://doi.org/10.14207/ejsd.2018.v7n3p493-506 17. Faria L, Cannaviello, M, Violano A (2013) Genius loci: useful utopia or real need? Rules of technological design. In: Sabiedriba, Integracija, Izglitiba, vol III, pp 261–271. ISSN: 16915887 18. Dahiya S, Katakojwala R, Ramakrishna S, Venkata Mohan S (2020) Biobased products and life cycle assessment in the context of circular economy and sustainability. Mater Circ Econ 2(7):1–28. https://doi.org/10.1007/s42824-020-00007-x 19. Rapporto OIPE (2020) La povertà energetica in Italia. In: Secondo rapporto dell’Osservatorio Italiano sulla Povertà Energetica, p 21 [Online] Available: https://oipeosservatorio.it/wp-con tent/uploads/2020/12/rapporto2020_v2.pdf 20. Violano A (2020) Technological regenerative design to improve future urban scenarios. In: Lauria M, Mussinelli E, Tucci F (eds) Producig project. Maggioli Editore, Santarcangelo di Romagna (RN), pp 506–514 21. Ronchi E (2021) Le sfide della transizione ecológica. Piemme Editor, pp 78–84. ISBN: 97888-566-80836 22. Piaia E, Turillazzi B, Longo D, Boeri A, Di Giulio R (2019) Tecnologie plug-and-play e processo innovativo (mapping/modelling/making/monitoring) negli interventi di deep renovation. Tech J Techn Arch Environ 18:215–225. Accessed 30 Jun 2021 23. Battista Pellegrini G (1990) Toponomastica Italiana. Hoepli Editor. ISBN: 8820318350 24. Fumo M, Formisano A, Sibilio G, Violano A (2018) Energy and seismic recovering of ancient hamlets: the case of Baia e Latina. Sustainability 10(8):2831. https://doi.org/10.3390/su1008 2831 25. Cartographic material “Piano di Recupero”, at the Technical Office of the Public Administration of the Municipality of Piaggine, table n°2, 1988
Chapter 9
The Role of Blockchain Technology in the Future of Construction A. H. Javaheri Khah
and M. Valiente López
Abstract If we look around, we see a transformation in all areas of digital industry, education or business. There has been a major transformation in the digital sector. Significant work, changes and improvements have been made in the design and manufacturing industries. Both the digital sector and the construction sector are experiencing a digital transfer. Technology continues to evolve to solve various problems that are emerging across all industries. Blockchain is also moving toward the construction industry. Combining Blockchain with Building Information Modeling (BIM) is a great combination. Blockchain is very useful for the manufacturing industry. Blockchain is a chain of interconnected blocks, where each block refers to the block before it. The main feature of Blockchain is to ensure information security. All information is stored in the Blockchain in codified, encrypted and hashed form. Blockchain is used for the accuracy of information exchanged between two actors. The overall structure of blocks in blockchain consists of two main parts. The first part contains the main information of the block in hashed form and the second part contains the address of the previous block in hashed form. In various construction projects, this data may include the smart contracts concluded between the employer, the contractor and the consultant, as well as the correspondence conducted with various organizations and the evaluation of workers’ working hours. The structural information is the most important data in the sensitive projects, and its accuracy should be evaluated, as filtering out such information leads to severe losses. The research method is descriptive with the aim of learning about the blockchain and combining it with the construction industry and building data modeling. Keywords Blockchain · Projects · BIM · Construction · Technology
A. H. Javaheri Khah (B) · M. Valiente López ETSEM Escuela Técnica Superior de Edificación, Universidad Politécnica de Madrid, Madrid, Spain e-mail: [email protected] M. Valiente López e-mail: [email protected] © The Author(s), under exclusive license to Springer Nature Switzerland AG 2023 M. N. González García et al. (eds.), New Advances in Building Information Modeling and Engineering Management, Digital Innovations in Architecture, Engineering and Construction, https://doi.org/10.1007/978-3-031-30247-3_9
153
154
A. H. Javaheri Khah and M. Valiente López
9.1 Introduction A blockchain is a digital, decentralized public document of data, assets, and all related transactions executed and shared by network participants. Although primarily associated with digital cryptocurrencies such as Bitcoin, blockchain is considered an emerging technology that can transform the current digital operating landscape and business practices in finance, information technology, public service, and almost all existing industries [1]. Transform. The main hypothesis behind Blockchain is to create a digitally distributed agreement that ensures data is decentralized across multiple nodes with the same information and that no user has full network authority. This provides transparency and increased data security. Blockchain was originally developed for financial transactions only, with the goal of creating a system that allows for secure data transfer between two parties without an intermediary. By emphasizing trust and collaboration between participants, Blockchain reorganizes existing workflows in any organization where it is deployed and offers many benefits, including shared learning, instant data exchange and automatic contract execution, network security, and enhanced collaboration. On the other hand, the emergence of new technologies can drive the development of other technologies, especially space technology, which is dependent on a number of technologies. Blockchain technology is one of the emerging technologies. As one of the essential infrastructures of digital transformation, this technology can effectively contribute to the development of the space industry by providing a secure platform for the transfer of space data of any kind [2]. Figure 9.1 shows that there are 5 steps in the blockchain, which include (1) transaction, (2) block, (3) confirmation, (4) hash, and (5) performance. On the other hand, from the beginning to the end of the Blockchain transaction can be seen in Fig. 9.1.
9.1.1 Building Information Modeling (BIM) Building Information Modeling (BIM) has found wide application, ranging from design and construction to operation and even demolition of buildings. This technology helps project managers and stakeholders make the right decision at every stage by digitally representing building specifications. Building Information Modeling All construction management activities are associated with two categories of drawings and specifications according to the contract documents, i.e. drawings are used to determine the quantity of work and its quality based on the technical specifications. Generally, BIM adds 3D modeling components to the specific drawings and associated specifications. The distinctive feature is that each element of the design shown on BIM provides, in addition to its three-dimensional physical nature, a set of information about the various activities and tasks of construction management. This information relates to the entire life cycle of the project, from feasibility study, design, first
9 The Role of Blockchain Technology in the Future of Construction
155
Fig. 9.1 General concept of BCT blockchain technology (Chris Linton 2017)
and second phase, preparation, construction and installation, commissioning, operation time and even project completion. So, if we want to summarize BIM in a short sentence, the process of building information creation and management includes the whole life cycle. In other words, the BIM model is a three-dimensional digital representation of the physical and functional characteristics of a building [3]. Currently, the use of technology and the full digitization of the construction industry are still at an early stage. However, with the advent of technologies such as BIM and smart digital technology, all stakeholders and the entire management of the construction design and construction process can collaborate on a common platform. In the construction industry, the levels of production, trade and management can be effectively integrated, project data and management information will be connected, and the era of sustainable building design and construction will come to BIM+ intelligent digital technology.
156
A. H. Javaheri Khah and M. Valiente López
9.2 State of the Art According to the studies conducted in a certain period of time, about 12 articles, 21 conferences, 4 websites, 3 dissertations and 3 books were registered on the topic of blockchain. On the other hand, 4 articles, 3 conferences, 3 websites and 2 dissertations were registered on Blockchin and Bim [4]. We will now review these articles on blockchain. Based on the record of all information in blockchain and understanding the blockchain nature of blockchain, we should include this in our work and store the necessary information in blockchain [5]. To recover data, it is not necessary to record all transactions, including failed transactions. In this research, it is possible to speed up the retrieval of information by taking inspiration from this research [6]. Considering that digital currencies will replace regular currencies in the not-toodistant future, it is possible to consider using cryptocurrencies in research [7]. The public–private blockchain is used to prevent the significant growth of the blockchain and increase the speed of information recovery [3]. The basis of contract work in the proposed model is the smart contract, which can be sufficiently used from the experience of this research [8].
9.3 Methodology This research was written using historical and future information to manage and combine Building Information Modelling and Blockchain. The information for this research was used from books, journals, articles, etc. related to Blockchain and BIM. This research consists of eight main parts. After the introduction, the main areas of Blockchain technology are discussed and then how Blockchain and BIM can be combined. The first part of this research paper on blockchain technology has been evaluated, and the fabric layer and application layer of blockchain are studied in two parts. The next part deals with privacy protection in Blockchain and then proposes smart contracts, which is one of the achievements of Blockchain. Other parts of this study deal with applications of Blockchain technology and AEC. Finally, the method of combining Blockchain technology with project management and BIM is explored.
9.4 Blockchain Technology Block is a combination of the two words block for block or piece and chain for chain. Literally, blockchain means blockchain. A block is an area where a certain amount of information can be stored. When you put these blocks together, you get a chain of blocks that contain interconnected data. This connection is made with hashes. Hash is the same cryptographic code based on the information in a block. Hashes
9 The Role of Blockchain Technology in the Future of Construction
157
Fig. 9.2 The structure of a blockchain (author)
are a series of numbers and letters that contain all the information in a block. When a block is written and its information is completed, a hash is assigned to it, and this hash is inserted into the next block to determine if the new block is a continuation of the previous block. Also, the generation of these hashes continues, and the hash of the previous block is inserted into the next block, and by tracking the hashes, the first block generated can be reached. For example, this hash is the first Bitcoin block known as the Genesis block. Any value can be converted into a hash and encrypted. With the hash algorithm, big data can be reduced to a few letters and numbers, and in this way the information of a block can be converted into a multi-bit expression [9]. Figure 9.2 shows the components of a blockchain, which include the originating block, the hash, the hash of the previous block, and so on. The digital infrastructure of the blockchain network can be divided into two layers of code.
9.4.1 Fabric Layer The data structure of a blockchain is expressed as a linked list of blocks in which transactions are ordered. The blockchain data structure consists of two basic elements: Pointers and a linked list. A linked list is a list of chained blocks with data and pointers to the previous block. Pointers are variables that refer to the location of another variable, and a linked list is a list of chained blocks with data and pointers to the previous block. The Merkle tree is a binary tree of hashes. Each block contains the root hash of the Merkle tree and information such as the hash of the previous block, the timestamp, the nonce, the block version number, and the current difficulty target. In blockchain systems, a Merkle tree provides security, integrity, and
158
A. H. Javaheri Khah and M. Valiente López
non-repudiation. The blockchain system is based on Merkle trees, cryptography, and consensus algorithms. The Genesis block, the first block, is the first in the chain and contains no pointer. To protect the security and integrity of the data contained in the blockchain, transactions are digitally signed. A private key is used to sign transactions, and anyone with the public key can verify the signer. Digital signatures detect the tampering of information. Since the encrypted data is also signed, digital signatures ensure uniformity. Therefore, any tampering invalidates the signature. The data cannot be detected because it is encrypted. They cannot be tampered with again even if they are discovered. The identity of the sender or owner is also protected by a digital signature. A signature is therefore legally bound to its owner and cannot be disregarded [10].
9.4.2 Application Layer Smart contracts, chain code, and decentralized applications make up the application layer. The application layer protocols are further divided into the application layer and the execution layer. The application layer includes the programs that end users use to communicate with the blockchain network. These include scripts, application programming interfaces (APIs), user interfaces, and frameworks [11]. The blockchain network serves as the back-end technology for these applications, and they communicate with it through APIs. Smart contracts, underlying rules, and chain code are part of the execution layer [12]. Although a transaction moves from the application layer to the execution layer, it is validated and executed in the semantic layer. Applications give instructions to the execution layer, which executes the transactions and ensures the deterministic nature of the blockchain [13].
9.5 Privacy in Blockchain One of the main advantages of the blockchain is its security. Blocks are always stored in chronological order, and it is very difficult to change a block after it has been added to the end of the blockchain. Each block has its own hash code, as does the hash block that precedes it. When a hacker wants to edit a block, the hash code of that block changes [14]. This means that the hacker must change the hash code of the next block in the chain, and this process continues. Thus, to change one block, a hacker must change every other block, which requires a lot of computing power. Although the blockchain uses consensus algorithms, it is still vulnerable to a 51% attack. In this case, the attacker controls more than 50% of the total computing power of the blockchain and gets the opportunity to overwhelm the other participants of the network. However, this type of attack is unlikely because its execution requires a lot of effort and computational power [15].
9 The Role of Blockchain Technology in the Future of Construction
159
9.6 Smart Contracts With the advent of blockchain technology and the creation of the world’s first digital currency (Bitcoin), the way money, documents and written records are sent and received has changed, and intermediaries such as banks are gradually being eliminated. The alternative to this system is smart contract technology. Simply put, smart contracts take over the task of trading. A process that is already performed by a third party. Like all contracts in our daily lives, such as written contracts or software contracts, a smart contract has the same terms as a contract; however, unlike traditional contracts, the terms of the smart contract run as zero and 1 or as code on a blockchain network such as Atrium [16]. This is usually done by intermediaries for trade orders. A smart contract is a program that can be stored on the blockchain and activated under certain predetermined conditions. These contracts are used to execute the agreement automatically so that all contract participants can reach a final result very quickly, without interference, and in a fraction of the time. These contracts also automatically activate the workflow, and when the conditions are met, the next activity begins [17]. Smart contracts are written in a variety of programming languages (including Solidity, Web Assembly, and Mickelson). In the Atrium network, each smart contract code is stored on the blockchain so that any interested party can check the contract code and current status to confirm its performance. Figure 9.3 shows the differences between smart contracts and traditional contracts [15].
Fig. 9.3 The difference between smart contracts and traditional contracts (author)
160
A. H. Javaheri Khah and M. Valiente López
9.6.1 Advantages of Smart Contract Since smart contracts are based on blockchain technology, they have high security and speed, are cost-effective, and at the same time offer users great diversity. . Security: the smart contract is intelligently distributed to all nodes in the network. This eliminates the possibility of losing it or changing it illegally. . Low cost and high speed: these contracts are executed automatically, eliminating the need for intermediaries and third parties. . Variety: there is a wide range of smart contracts from which you can choose and modify some of the clauses according to your needs [10].
9.6.2 Disadvantages of Smart Contract But like any other technology, smart contracts are not without flaws and have drawbacks. . The human factor: the codes in smart contracts are written by humans, and humans can make mistakes! Once a smart contract is added to a block, it cannot be changed. One of the most famous human errors related to smart contracts happened with The DAO. The developers’ mistake in writing this code cost the user dearly, and some hackers were able to exploit the mistake and steal about $60 million. . Uncertain legal status: no country has yet enacted regulations for smart contracts. Therefore, it is possible that some countries will soon issue a set of regulations in this area that will change the legal status of this type of contracts. . Cost of writing: Smart contracts cannot be implemented without programming. One or more experienced programmers are required to write this type of contract, and of course the internal structure of the contracting parties must be compatible with blockchain technology [10].
9.7 Applications of Blockchain Technology Blockchain technology should be presented as one of the greatest innovations of the twenty-first century, as it has a great impact on the future in various industries and sectors. One can easily understand the impact of this technology on human life nowadays in one sentence, also governments, companies and other organizations are trying to explore and even implement Blockchain technology in various fields, and many of these fields have nothing to do with digital currencies. Blockchain can provide security, immutability, traceability, and transparency across a distributed network. These unique characteristics make blockchain a viable option for implementation in areas where traditional infrastructure is inefficient [18].
9 The Role of Blockchain Technology in the Future of Construction
161
9.8 AEC AEC stands for Architectural Engineering and Construction. The acronym describes the collaboration of architects, engineers and construction professionals on residential, commercial or industrial building projects to ensure their smooth execution. These three disciplines are involved in the project from design to construction [19]. . Architecture: architects design the concept for the construction, restoration or renovation of buildings. . Engineering: Engineers oversee the construction and maintenance projects required to implement this concept. . Construction: Construction project managers and their skilled workers execute the design.
9.8.1 Challenges AEC Industry The biggest challenge facing the AEC industry is labor shortages. With an aging workforce and a large skills gap, it can be very difficult to find the talent the industry needs. Positions in the architecture, engineering, and construction industries require highly skilled leaders with safety awareness, technical expertise, and project management skills-a combination that is hard to find [20]. “The ability to find talent for the AEC industry is changing. Younger people are entering the workforce, older workers are leaving the workforce, and more people are working remotely,” explains Stacia Norman, Director of Construction Recruitment at Orion Talent. It will be a challenge to recruit, hire and retain talent in 2022; but with the right recruitment team, it’s doable [21].
9.8.2 Future for AEC The AEC industry has been through a turbulent time due to the pandemic-related loss of revenue. Companies that want to move forward need to think outside the box and embrace new technologies. They should start by identifying new segments and even locations to target, and then take advantage of the time and cost savings that can be achieved by moving to the cloud or using technologies such as BIM Level 2 [20, 21].
162
A. H. Javaheri Khah and M. Valiente López
9.9 Blockchain and Project Management Information aggregation focuses on information management technologies. Blockchain can provide a reliable infrastructure for managing information during the construction cycle. Even when used in a Building Information Modeling (BIM) project, the role of blockchain is essential for managing information about who did what and when. We conclude that Blockchain offers solutions to many problems in information management in construction [22].
9.9.1 Blockchain and BIM This section addresses the potential opportunities for BCT to scale and enrich the BIM process. It explores various aspects of existing BIM workflows that could benefit from the integration of blockchain technologies. BIM is at the forefront of digital transformation in the AEC industry, fostering collaboration and trust and simplifying data sharing. McGraw-Hill reports that adoption of BIM increased from 49% in 2009 to 71% in 2012. BIM models provide a comprehensive design model of the building that can include all aspects of the structure, such as architecture, structural elements, and MEP areas. In addition, several integrated plug-ins in BIM platforms such as Autodesk Revit allow simulation of external site conditions, geography and weather, as well as performing energy analysis, building modeling, structural analysis, etc. In the future, the development of BIM will aim to unify all design and analysis tools in one platform. Regarding the benefits of adopting BIM in the AEC industry, data from 408 projects over a six-year period totaling $558,858,574 was examined to quantify how much BIM contributed to cost savings. The report shows that BIM saved more money and the project team worked better together in the process. Another example is the study by that reached similar conclusions. Their research included a series of 35 case studies between 2008 and 2010, all of which pointed to cost savings from using BIM. The study also found that project schedules were shortened, communication improved, information sharing increased and coordination improved. The data clearly indicates that initial costs, such as hardware upgrades, software implementation and staff training, are offset in the long run when BIM is implemented. However, the BIM process still has a number of shortcomings. These include some limitations of the schema, technical tools, and administrative aspects of the current BIM process.
9 The Role of Blockchain Technology in the Future of Construction
163
9.10 Blockchain and Space Blockchain technology can be used not only as a technology but also as a tool due to its inherent capabilities. This technology can have a positive impact on reducing electrical and operational complications and increasing security. Below are some characteristics of blockchain that can be used to determine its role in the development of the space industry. These characteristics include: . . . . . .
Distributed database Peer-to-peer transactions Trust Transparency Immutability of records Implicit logic.
Based on this, blockchain technology, per se, can be used in the space industry [2].
9.10.1 Protection of Space Information by Blockchain The security of the blockchain platform in the space can be mentioned in several cases. The distributed Blockchain network eliminates the vulnerability of omniscient and also marks the spatial assets based on proprietary cryptography and protects them from interference and data tampering to a reasonable extent. It also informs the companies and owners of this industry about all the assets located in the space and their status, providing them with clear information. This technology detects any attack, tampering or sabotage of systems or information in the form of an alert to operators. The encryption of transactions and the presence of smart contracts in this system increase security, which is an example of secure communication in space. None of the intermediaries is able to decrypt the data because they do not have hash codes and private keys. The presence of functions such as the block cypher is one of the security aspects. In the research conducted on the blockchain platform (the hash function is SHA-256), the probability of an attack on the blocks (i.e., inserting an unrelated block into the chain) is almost zero after about 20 correct blocks. The results were obtained based on the Poisson function and the Poisson process [23]. In Fig. 9.4, the probability of the blockchain being hacked approaches zero after about 20 blocks.
164
A. H. Javaheri Khah and M. Valiente López
Fig. 9.4 The probability of attacking the blockchain chain according to the number of trusted blocks [23]
9.11 Conclusions This article provides an overview of blockchain and its applications in the construction, BIM and space industries. The construction industry is looking for sustainable development that addresses the challenges of energy consumption and profitability in the construction industry. The development of smart technologies has many advantages for the construction industry. However, the main function of Blockchain and BIM in building design and sustainable construction process focuses on smart energy use and construction management. The future of blockchain technology is somewhat unclear due to the way governments and companies want to drive innovation and applications. What is clear, however, is that one day there will be a public blockchain that everyone can use. Blockchain proponents expect the technology to be embedded into the automation of certain tasks to help in all areas. The development of blockchain technology in recent years has increased the demand for blockchain experts. Companies are also planning to use blockchain applications in their business areas to reap the benefits of this technology. With the entry of this technology into the space, new capabilities and applications need to be created in addition to facilitating some matters or increasing security.
9 The Role of Blockchain Technology in the Future of Construction
165
References 1. Crosby M, Pattanayak P, Verma S, Kalyanaraman V (2016) Blockchain technology: beyond bitcoin. Appl Innov Rev 2:6–19 2. Karen L. Jones (2019) Blockchain: building consensus and trust across the space sector. 35th Space Symposium, Technical Track, Colorado Springs, Colorado, p 19 3. Erri Pradeep A, Yiu T, Amor R (2019) Leveraging blockchain technology in a BIM workflow: a literature review. International Conference on Smart Infrastructure and Construction 2019 (ICSIC) Driving Data-Informed Decision-Making, 371–380. ICE Publishing. https://doi.org/ 10.1680/icsic.64669.371 4. Nawari NO, Ravindran S (2019) Blockchain technology and BIM process: review and potential applications. J Inf Technol Constr 24:209–238. https://www.itcon.org/2019/12 5. Xue F, Lu W (2020) A semantic differential transaction approach to minimizing information redundancy for BIM and blockchain integration. Autom Constr 118:103270. https://doi.org/ 10.1016/j.autcon.2020.103270 6. Dounas T, Jabi W, Lombardi D (2020) Smart contracts for decentralised building information modelling. In: Köering D, Werner LC (eds) Proceedings of 38th Education and research in computer aided architectural design in Europe (eCAADe) conference 2020 (eCAADe 2020); anthropologic: architecture and fabrication in the cognitive age, 16–17 September 2020 [virtual conference] Berlin, 2:565–574. https://doi.org/10.13140/RG.2.2.34686.20809 7. Ye X, Sigalov K, König M (2020) Integrating BIM-and cost-included information container with Blockchain for construction automated payment using billing model and smart contracts. ISARC. Proceedings of the 37th International Symposium on Automation and Robotics in Construction, 1388–1395, IAARC Publications, Kitakyushu, Japan. https://doi.org/10.22260/ ISARC2020/0192 8. Shojaei A, Flood I, Moud HI, Hatami M, Zhang X (2019) An implementation of smart contracts by integrating BIM and blockchain. Proceedings of the Future Technologies Conference, pp 519–527, Springer. https://doi.org/10.1007/978-3-030-32523-7_36 9. Buterin V (2015) On public and private blockchains. Ethereum blog 10. Nawari NO, Ravindran S (2019) Blockchain and building information modeling (BIM): review and applications in post-disaster recovery. Buildings 9(6):149. https://doi.org/10.3390/buildi ngs9060149 11. Clack CD, Bakshi VA, Braine L (2016) Smart contract templates: foundations, design landscape and research directions. arXiv preprint arXiv:1608.00771. https://doi.org/10.48550/ arXiv.1608.00771 12. Clack CD, Bakshi VA, Braine L (2016) Smart contract templates: essential requirements and design options. arXiv preprint arXiv:1612.04496. https://doi.org/10.48550/arXiv.1612.04496 13. Christidis K, Devetsikiotis M (2016) Blockchains and smart contracts for the internet of things. IEEE Access 4:2292–2303. https://doi.org/10.1109/ACCESS.2016.2566339 14. Seijas PL, Thompson S, McAdams D (2016) Scripting smart contracts for distributed ledger technology. Cryptology ePrint Archive. https://eprint.iacr.org/2016/1156 15. Frantz CK, Nowostawski M (2016) From institutions to code: Towards automated generation of smart contracts. 2016 IEEE 1st International Workshops on Foundations and Applications of Self* Systems (FAS* W), pp 210–215, IEEE. https://doi.org/10.1109/FAS-W.2016.53 16. Bhargavan K, Delignat-Lavaud A, Fournet C, Gollamudi A, Gonthier G, Kobeissi N, Kulatova N, Rastogi A, Sibut-Pinote T, Swamy N (2016) Formal verification of smart contracts: short paper. Proceedings of the 2016 ACM workshop on programming languages and analysis for security, pp 91–96. https://doi.org/10.1145/2993600.2993611 17. Dhawan M (2017) Analyzing safety of smart contracts. Proceedings of the Conference: network and distributed system security symposium, San Diego, CA, USA, pp 16–17 18. Benisi NZ, Aminian M, Javadi B (2020) Blockchain-based decentralized storage networks: a survey. J Netw Comput Appl 162:102656. https://doi.org/10.1016/j.jnca.2020.102656
166
A. H. Javaheri Khah and M. Valiente López
19. Ablyazov T, Petrov I (2019) Influence of blockchain on development of interaction system of investment and construction activity participants. IOP Conf Ser Mater Sci Eng 497:012001, IOP Publishing 20. Ahram T, Sargolzaei A, Sargolzaei S, Daniels J, Amaba B (2017) Blockchain technology innovations. 2017 IEEE technology & engineering management conference (TEMSCON), pp 137–141, IEEE. https://doi.org/10.1109/TEMSCON.2017.7998367 21. Kshetri N (2017) Blockchain’s roles in strengthening cybersecurity and protecting privacy. Telecommun Policy 41:1027–1038. https://doi.org/10.1016/j.telpol.2017.09.003 22. Mathews M, Robles D, Bowe B (2017) BIM+ blockchain: a solution to the trust problem in collaboration? CITA BIM Gathering 2017, November 23rd–24th 2017. https://doi.org/10. 21427/D73N5K 23. Pan Y (2018) Mathematical derivation and analysis of success probability of Bitcoin attack. 2018 International Conference on Network, Communication, Computer Engineering (NCCE 2018), pp 129–133, Atlantis Press. https://doi.org/10.2991/ncce-18.2018.22
Chapter 10
Trustless Construction Project Information Exchanging Using Hyperledger Blockchain M. Darabseh
and J. Poças Martins
Abstract The distributed ledger is an immutable record for data stored inside it. This technology can be helpful for construction project events and communication recording. This article investigates the Hyperledger project, a modular enterprise Blockchain with pluggable products to create a construction communication and data exchange ledger. Hyperledger is an open-source modular Blockchain architecture designed to help enterprises run distributed ledgers to benefit from the technological advancement provided by Blockchain technology. These ledgers are immutable, distributed, and trustless. These features allow for transparent communication between stakeholders, which could positively impact construction project workflow and the participation of projects actors. The article uses Hyperledger products Fabric and Composer to showcase a hypothetical Blockchain to exchange project metadata and communication between construction project participants. The article presents an example of using Blockchain for the construction project process by designing a Blockchain to handle the Request for Information (RFI) process. Keywords Construction · RFI · BIM · Hyperledger · Fabric · Composer
10.1 Introduction Blockchain is a disruptive technology and a foundation layer for web 3.0 applications. The internet in its current form helps individuals and organisations exchange information faster; however, the quality and the integrity of the information is not vouched for. This forced organisations to add multiple layers of security to increase the reliability of data exchanged through the internet. Blockchain was first used in M. Darabseh (B) · J. Poças Martins GEQUALTEC, Faculty of Engineering (FEUP), University of Porto, Rua Dr. Roberto Frias S/N, 4200-465 Porto, Portugal e-mail: [email protected] J. Poças Martins e-mail: [email protected] © The Author(s), under exclusive license to Springer Nature Switzerland AG 2023 M. N. González García et al. (eds.), New Advances in Building Information Modeling and Engineering Management, Digital Innovations in Architecture, Engineering and Construction, https://doi.org/10.1007/978-3-031-30247-3_10
167
168
M. Darabseh and J. Poças Martins
Bitcoin by Satoshi Nakamoto [1]. Bitcoin uses a decentralised, distributed Ledger to verify and register every transaction [1]. The Use of Blockchain as an underlying technology in Bitcoin encouraged organisations from several industries to investigate the possibility of implementing it within their traditional digitalised businesses. Projects such as Hyperledger [2], R3 Corda [3] and Multichain [4] are examples of Blockchain implementation within the traditional information and communication enterprise systems. This article investigates the recent development of Blockchain to support businesses data exchange processes. The article includes five sections: (1) this introduction; (2) a review of the recent development in Blockchain construction industry related studies; (3) Blockchain enterprise-grade solutions; (4) an example on a construction project through a distributed Ledger; and (5) conclusions.
10.1.1 Literature Review The digitalisation of construction data helps data owners to be more productive [5]; however, digital data are prone to cyber threats and require participants to trust each other’s [6]. In order to reduce these threats and improve the overall data exchanging process, Blockchain was introduced by several studies as a solution to create a secure digital construction digital environment by developing traceable and trustless data exchange systems. The total available studies on the Scopus indexing service at the time of writing is 129 records. Fifty-five articles, sixteen reviews, fifty conference articles, and eight book chapters. The search was conducted on 8 October 2021 using the “Blockchain AND Construction” search string, limited to Engineering category and English languages records only, followed by a manual filtration process to get the studies related to the construction industry only. Figure 10.1 shows a histogram for records retrieved per year. The results show an uptrend in the number of studies during the five years between 2017 and 2021. Fifty-seven studies were published in 2021 compared to one study in 2017. The search was limited to Scoups to give a general overview and avoid duplicated records. For a detailed literature review, refer to Darabseh and Poças Martins, 2020 [7].
10.2 Blockchain for Enterprise Purposes While Blockchain capabilities were proven in several fields, implementing a new technology requires overcoming the current infrastructure limitation and barriers. These barriers can be categorised into three categories: (1) social barriers, which refer to people acceptance and trusting Blockchain-based services; (2) legal barriers, which refer to the shortage in law coverage for Blockchain-based services; (3) technological barriers, which refer to the changes required in the current digital infrastructure to be Blockchain friendly [8]. In order to overcome the technological barriers and bridge the gap between the traditional digital environment and Blockchain-based
10 Trustless Construction Project Information Exchanging Using …
169
60 50 40 30 20 10 0 2017
2018
2019
2020
2021
Fig. 10.1 Number of relevant publications about Blockchain applications in construction on Scopus per year [7]
systems, several projects emerged to provide a head start to help enterprises in the transformation to an enterprise-friendly organisation. Blockchains, according to their records exposure, can be categorised into two categories: (1) public; and (2) private. While the number of public Blockchains can be counted, the number of private Blockchains is unknown. Public Blockchain can be arranged into three generations: (1) first generations Blockchains which were designed to serve a specific purpose; an example is Bitcoin which was designed to record the transaction of its own digital currency [1]; (2) second generation Blockchain, which introduced the smart contract concept. An example is Ethereum Blockchain which is the first to offer smart contracts [9]. (3) Third generation Blockchains are the recently developed multipurpose smart contracts platforms that aim to address the second generation Blockchains trilemma [10]. The Blockchains trilemma refers to the hardship for public Blockchain to find the balance between the three factors that evaluate a Blockchain network. These factors are (1) decentralisation, (2) security, and (3) scalability. The Ethereum Blockchain is considered the primary influencer for the public Blockchains development, regardless of its scalability issues. The Ethereum network smart contracts support multiple programming languages such as Solidity; however, the smart contract is stored in the Blockchain as a bytecode, a digested version of the original code. This version of the contract is interpreted using the Ethereum Virtual Machine (EVM), a layer of the Ethereum network that acts as a runtime environment and is responsible for transactions execution. As a result of the popularity of the Ethereum network, many third-generation Blockchains are EVM compatible, which allow developers to deploy their smart contracts on these chains without the need to make changes [11]. Private Blockchains are used within the organisation level or at the interorganisational level to track assets or record the activities of these organisations. The Hyperledger is a consortium created by the Linux Foundation and developed by multiple organisations to accelerate Blockchain adoption at the organisation level
170
M. Darabseh and J. Poças Martins
Fig. 10.2 Summary of the current Blockchain horizon
[12]. The project approach toward all the fostered projects is modularity. According to the consortium, modularity gives the projects the following features: (1) Flexibility for components modification; (2) Familiar interfaces with common functions; (3) reusable components; (4) code extensibility; (5) accelerated testing process; and (6) larger developer community. The consortium fosters four types of projects: (1) Frameworks which is multipurpose, adaptable pluggable distributed ledgers such as Hyperledger Fabric; (2) Domain-Specific frameworks, which is a single purpose such as Hyperledger Grid which is designed for supply-chain related applications; (3) Tools which is a second layer that works on top of the framework to extend it or facilitate using it, an example on that is Hyperledger Composer; (4) Libraries are reusable code components used inside another Hyperledger project or others to serve its own purpose. An example of a Hyperledger library project is Hyperledger Transact which aims to reduce development time for distributed ledgers by simplifying the smart contact deployment process [13]. Figure 10.2 shows a summary for this section.
10 Trustless Construction Project Information Exchanging Using …
171
10.2.1 Hyperledger Fabric Framework Fabric is one of the six frameworks developed under the Hyperledger project and developed by IBM [14]. Fabric modular structure allows the deployer to choose the components that fit the purpose intended for the Blockchain network. Fabric offers several types of plug-and-play components, such as consensus, which refer to the method used in the Blockchain network between nodes to determine the validity of the data before adding the transaction to the ledger. Five fabric concepts are essential to understand how it works: peers, ordering, network, channel, and Chaincode. Peers maintain the state of the network and store a copy of the Blockchain ledger. There are two types of peers: (1) committers and (2) endorses. Endorsing peers simulate and endorse transactions. Committing peers verify endorsement and validate transactions results prior to committing the transactions to the Blockchain. Endorsing peers are a special type of committing peers because all peers have the right to commit blocks to the distributed ledger [15]. Fabric framework generates a permissioned Blockchain, which means only allowed participants can join the network. Permissioned Blockchains are not forkable. A Blockchain fork happens when a Blockchain is split into two separate Blockchains due to a conflict between nodes on the transaction order in the ledger. The Fabric frameworks use an ordering service to avoid forks. The ordering service accepts endorsed transactions, arranges them in the block then delivers the block to the committing peers. Figure 10.3 illustrates the Fabric transactions lifecycle.
Fig. 10.3 Transaction’s lifecycle in Fabric
172
M. Darabseh and J. Poças Martins
Fig. 10.4 Fabric Chaincode interaction channels
10.2.2 Hyperledger Composer Hyperledger Composer is a tool designed to facilitate the interaction with Hyperledger Fabric [16]. Fabric is a standalone framework which means it does not require Composer to work. However, Composer simplifies interacting work Fabric. Composer provides users with the following benefits: (1) Graphical web user interface for Chaincodes development and testing; (2) simplified Chaincode approach where the Chaincode components are built-in separate pieces then joined together in Business Networks Archive (BNA) file; (3) simplified Chaincode interaction process for users and applications through Rest API. Rest API is a standardised application programming interface for web services [17]. Interacting with the Chaincode can be done through the following method: (1) the Command Line Interface (CLI); (2) through Fabric Software Development Kit (SDK); (3) through composer Rest API. Figure 10.4 represents an illustration for Chaincode interaction channels.
10.2.3 InterPlanetary File System (IPFS) The InterPlanetary File System (IPFS) is a data sharing and exchanging protocol. There are two features for IPFS: (1) IPFS stored data in a distributed file system where data is spread over multiple peers; (2) the data stored in IPFS nodes are identified using a Content Identifiers (CID) instead of the traditional system where data is identified using its location on the storage directory [18]. Figure 10.5 shows an example of a file stored in the IPFS node; the highlighted code is the CID, which can be used to find the file on the node and access it.
10 Trustless Construction Project Information Exchanging Using …
173
Fig. 10.5 An example of a CID for a file stored in the IPFS
10.3 Construction Project Communication Through a Distributed Ledger Trust in construction Projects is discussed throughout the construction projects management and performance literature such as the Latham report [19], Egan Report [20], Khalfan et al. [21], and Gad and Shane [22]. Khalfan et al. [21] study showed three important aspects for trust in construction: (1) communication honesty, (2) reliance, and (3) the delivery of the project defined outcomes. Communication in construction projects refers to how people exchange information during the project lifecycle. Trust in communication exists when people are open and honest when sharing information with the rest of the stockholders. Furthermore, information should have a high level of accuracy and be shared within a sufficient timeframe to act according to the information provided. The ICE Blockchain in construction report presented Blockchain as a solution for the construction project trust issues by developing transparent, tradable and trustless collaboration systems [23]. This article uses Blockchain technology through the Hyperledger project products Fabric and Composer to show how Blockchain can be used to improve construction project communication. However, the Chaincode will be tested only inside the Composer testing environment. The Request For Information (RFI) is a formal recurring process during a construction project lifecycle, carried out by a stakeholder to clarify, verify or gather information regarding one or more of the projects activities, processes or issues [24]. This article uses Fabric and Composer to store construction projects RFIs as assets on a Blockchain ledger.
10.3.1 Designing the Chaincode In order to manage an asset using a Hyperledger Fabric, it is necessary to design the Chaincode. The Chaincodes are built around the assets meant to control. When using Hyperledger Composer, the model file contains the primary information about the Chaincode such as assets details, participants and transactions. Participants are the users of the ledger who will own the assets registered on the ledger. Transactions are the defined possible modifications for the assets defined, such as transferring the ownership of the asset. In Blockchain ledgers, assets are represented by a set of data strings, integers, and Booleans. Therefore, a basic RFI template was transformed into an asset. The first step was to visualise the RFI structure and participants relationships, as presented in Fig. 10.6.
174
M. Darabseh and J. Poças Martins
Fig. 10.6 RFI components visualised
Step two is to translate the structure developed into code. Figure 10.7 (a) shows the RFI translated to Composer modelling language. Figure 10.7 (b) shows how it decoded when deployed in a Composer testing environment.
10.3.2 Testing in Composer The next step after designing the RFI Chaincode is to test it within a Composer Testing environment, which consists of two parts: (1) adding participants; and (2) adding assets to the ledger. Figure 10.8 shows an example of adding participants where two stakeholders were added, a consultant and a contractor, which are represented in JSON format. The JSON file format is a data exchange standard used to store data objects. In the Chaincode, the RFI process was divided into three subprocesses: (1) Sending RFI carried out by a consultant participant; (2) Respond to RFI carried out by a contractor participant; (3) RFI decision carried out by a consultant participant. Figure 10.9 shows an example of these three steps processes. After testing the business logic of the Chaincode in the composer testing environment, the next step is to deploy it on the fabric network. Composer facilitates that by generating a Business Network Archive, which can be deployed directly to a Fabric network.
10 Trustless Construction Project Information Exchanging Using …
175
Fig. 10.7 a. The RFI Chaincode Composer Model file; b. Options available when the Chaincode is deployed
176
M. Darabseh and J. Poças Martins
Fig. 10.8 a. Added participants to the Chaincode as contractor; b. Added participants to the Chaincode as a consultant
10.4 Conclusion The information exchange process in the construction process often suffers from several problems, such as slow and inaccurate information without efficient tracking for the information quality and its source. In this article, a Hyperledger Fabric and Composer was presented in order to streamline the RFI process during construction projects lifecycle. The RFI was translated to a model file then used in Composer to act as a smart contract or, in Hyperledger terminology, a Chaincode. RFI recorded in a Blockchain creates a verified trustless source of information for all participants, which could help make the process transparent and accurate. The article contributes to the Blockchain in construction research by presenting a visual representation of the RFI process running on Blockchain. However, further details need to be investigated to create a functional Chaincode that fits the construction industry in a real project environment.
10 Trustless Construction Project Information Exchanging Using …
177
Fig. 10.9 Examples on RFI divided into three steps
Acknowledgements The authors acknowledge the financial support from the Portuguese Foundation for Science and Technology (FCT) through the PhD. Grant 2020.05786. BD. This work was financially supported by Base Funding: • UIDB/04708/2020 of the CONSTRUCT—Instituto de I&D em Estruturas e Construções • Funded by national funds through the FCT/MCTES (PIDDAC).
178
M. Darabseh and J. Poças Martins
References 1. Nakamoto S (2008) Bitcoin: a peer-to-peer electronic cash system. Decentralized Bus Rev, 21260 2. Hyperledger – Open Source Blockchain Technologies. Hyperledger. https://live-hyperledger. pantheonsite.io/. Accessed 3 June 2020 3. Corda Platform. R3. https://www.r3.com/corda-platform/. Accessed 3 Nov 2021 4. MultiChain|Open source blockchain platform. https://www.multichain.com/. Accessed 3 Nov 2021 5. Schneider M (2018) Digitalization of production, human capital, and organizational capital. In: Harteis C (ed) The impact of digitalization in the workplace: an educational view. Springer International Publishing, Cham, pp 39–52. https://doi.org/10.1007/978-3-319-63257-5_4 6. Nweke LO, Wolthusen S (2020) Legal issues related to cyber threat information sharing among private entities for critical infrastructure protection. In: 2020 12th International Conference on Cyber Conflict (CyCon), May 2020, 1300:63–78. https://doi.org/10.23919/CyCon49761.2020. 9131721 7. Darabseh M, Martins JP (2020) Risks and opportunities for reforming construction with blockchain: bibliometric study. Civ Eng J 6(6):1204–1217. https://doi.org/10.28991/cej-20200391541 8. Darabseh, Martins JP (2021) Protecting BIM design intellectual property with blockchain: review and framework. In: Proc of the Conference CIB W78:2021:80–90. http://itc.scix.net/ paper/w78-2021-paper-009 9. Wood G (2014) Ethereum: a secure decentralised generalised transaction ledger. Ethereum Project Yellow Paper 151(2014):1–32 10. Paulaviˇcius R, Grigaitis S, Igumenov A, Filatovas E (2019) A decade of blockchain: review of the current status, challenges, and future directions. Informatica 30(4):729–748 11. Hirai Y (2017) Defining the ethereum virtual machine for interactive theorem provers. In: International Conference on Financial Cryptography and Data Security, 520–535 12. Supporting Members. Hyperledger Foundation. https://www.hyperledger.org/about/members. Accessed 3 Nov 2021 13. Hyperledger Transact. Hyperledger. https://www.hyperledger.org/projects/transact. Accessed 2 Jul 2020 14. Hyperledger Fabric. Hyperledger Foundation. https://www.hyperledger.org/use/fabric. Accessed 3 Nov 2021 15. Peers—hyperledger-fabricdocs master documentation. https://hyperledger-fabric.readthedocs. io/en/release-2.2/peers/peers.html. Accessed 3 Nov 2021 16. Introduction|hyperledger composer. https://hyperledger.github.io/composer/v0.19/introduct ion/introduction. Accessed 3 Nov 2021 17. Li L, Chou W (2011) Design and describe REST API without violating REST: a Petri net based approach. In: 2011 IEEE International Conference on Web Services, pp 508–515 18. Benet J (2014) IPFS-content addressed, versioned, P2P file system. ArXiv Prepr. ArXiv14073561 19. Latham M, et al (1994) The Latham Report Constr Team 20. Murray M (2003) Rethinking construction: the egan report (1998). Blackwell Science, Oxford, UK 21. Khalfan MMA, McDermott P, Swan W (2007) Building trust in construction projects. Supply Chain Manag Int J 12(6):385–391. https://doi.org/10.1108/13598540710826308 22. Gad GM, Shane JS (2014) Trust in the construction industry: a literature review. In: Construction research congress 2014: construction in a global network, pp 2136–2145
10 Trustless Construction Project Information Exchanging Using …
179
23. ICE (2018) Blockchain technology in the construction industry: digital transformation for high productivity. [Online]. Available: https://www.ice.org.uk/ICEDevelopmentWebPortal/media/ Documents/News/Blog/Blockchain-technology-in-Construction-2018-12-17.pdf 24. Reginato J, Higgins D, Fryer S (2013) Using the forward-thinking index to measure request for information submission effectiveness. 49th ASC Annual International Conference Proceedings, San Luis Obispo, CA, 10–13 April
Chapter 11
Open-Access Software Implementation for Critical Path Problems Arising in Planification Theory Elena Martin Porta, Álvaro P. Raposo , and José A. Capitán
Abstract In planning theory, Critical Path Problems are used to solve the schedule of a planning. These problems are based on calculating the total duration of a project, as well as on obtaining information about the expected time spam for every activity to be carried out along the project. There is a variety of methods that solve this type of problems, usually implemented in computer software packages, most of which are not free for the general public. In this contribution we propose two different ways to solve Critical Path Problems with access-free software. Our implementations allow to find the solution of general planification problems using a simple spreadsheet (Calc or Excel, for example) to which the personnel in universities and companies have access. Our contribution consists of a toolbox formed by two spreadsheets that we developed for solving Critical Path Problems using Excel, although our implementation is valid for OpenOffice versions and the like. The first spreadsheet is based on a graph representation of the Critical Path Method. In this case, the resolution of the problem consists of posing it as if it were a linear programming problem, specifically a Maximum-length Route Problem. The second spreadsheet uses Bernard Roy’s methodology and implements the algorithm in a way that allows to determine critical paths automatically by simply entering planning timings and dependencies. In the contribution we will explain our spreadsheet implementations using an example, consisting of a few activities of a planning problem. We will show how our implementation is flexible and can be easily modified and scaled to solve larger planification problems. Our spreadsheet implementations are available to free usage by general public.
E. Martin Porta · Á. P. Raposo · J. A. Capitán (B) Departamento de Matemática Aplicada, Universidad Politécnica de Madrid, Madrid, Spain e-mail: [email protected] E. Martin Porta e-mail: [email protected] Á. P. Raposo e-mail: [email protected] © The Author(s), under exclusive license to Springer Nature Switzerland AG 2023 M. N. González García et al. (eds.), New Advances in Building Information Modeling and Engineering Management, Digital Innovations in Architecture, Engineering and Construction, https://doi.org/10.1007/978-3-031-30247-3_11
181
182
E. Martin Porta et al.
Keywords Planning · Scheduling · Free software implementations · Optimization in graphs · Duration · Linear programming · Restrictions · Activity slack
11.1 Introduction To achieve any objective, it is necessary to carry out a planning, which defines what are the procedures to be followed and establishes an ordering among the different activities to be completed. Effective planification solutions also allow us to ensure a correct allocation of resources, which in addition will lead to a reduction of the total final cost of the project. Therefore, what is intended with every planification scheme is the achievement of a certain objective in the most efficient way among different possibilities. Establishing a plan amounts to provide a sequence of activities that can be interdependent among each other. Once the planification has been decided and evaluated, a time span has to be assigned to each process or activity, as well as the dates that indicate the moment in which each activity must begin or end. This is what is called programming, which has as its final objective to provide a total duration and an indicative date of end of project [2]. In certain cases, despite having carried out a correct planning and programming of all the tasks and work packages involved in the project, the established deadlines are not always met. That is why it is essential to have a schedule that allows us to relativize the progress of the project, for the project manager to be able to compare the point at which the project is with the point where it should be. Therefore, in the case of perceiving that there is (or may be) a delay in the development of the project, it is possible to make the corresponding adjustments in the schedule. Such adjustments may involve hiring a larger number of resources for future activities, or assuming the cost that may arise from the delay in completion. These decisions are always taken with the goal of carrying out the project in the most efficient way in terms of overall time and cost [3].
11.1.1 Planning and Scheduling Problems Planning is defined as the action of sequencing the activities and work packages which a project is comprised of, establishing the order that they must follow along the project, as well as specifying the relationships between these activities [4]. Scheduling is aimed at establishing the time spans and precise dates for each activity in the plan previously elaborated, as well as at determining the total duration of the project [5]. Planning problems are represented by graphs (also known as networks). They are a set formed by two types of elements: vertices (or nodes) and edges (or links). Each edge connects pairs of vertices, and can be either directed (arrows) or not, depending
11 Open-Access Software Implementation for Critical Path Problems …
183
on the type of graph. Edges can be weighted (i.e., accompanied by a real number that measures the “strength” of the link) or not. To model a planification problem, nodes can represent events and links activities, or vice versa. There are different, graphbased resolution methods to obtain an optimal scheduling of the project. Formulated as optimization problems over graphs, we have to find the optimal sequence of activities (path) across the graph that maximizes the overall duration of the project.
11.1.2 Resolution Methods In this contribution we have focused on two methods of solving scheduling problems, which mainly differ on the way in which the graph represents the planification problem. Graphs can be of two types: 1. Type I graphs, where nodes represent events and arrows activities. In this first case, activities are represented by arrows that reach events, which in turn are defined as the meeting point of activities that do not consume time or space. Events represent instants at which all the activities that come to it are finished, or equivalently, times at which all the activities that come out of the event can begin. Directed links are weighted, the weight of each arrow being interpreted as the duration of each activity. 2. Type II graphs, where nodes represent activities and the arrows links. In this second case, activities are represented by nodes, which provide all the necessary information about the start, end, and activity’s duration time. Directed links, however, are interpreted as restrictions (ligatures) between activities and provide information about the relationships and dependencies between nodes. According to Roy [6], all graphs, both in case I and II, are meant to provide the following common elements and information: . Activities: are the different work packages that must be executed to carry out the project. . Activity time span (t): it stands for the duration that is established a priori for each activity. It is usually measured in days. . Earliest start (ES): earlier date on which each activity can start, because all the activities that precede it are already completed. . Latest Start (LS): stands for the later date on which the activity can begin without altering the total duration of the project. . Earliest Finish (EF): earlier date on which the activity could end. . Latest Finish (LF): it is later date on which the activity can be finished without the total duration of the project being affected. . Activity Free Slack (FS): time that an activity can be delayed without altering the earliest start date of any successor activity, therefore, without altering the total duration of the project either. It is calculated with the following formula:
184
E. Martin Porta et al.
F S = E F − (E S + t), being t the duration of the activity. . Activity Total Slack (TS): it is the time a that an activity can be delayed without altering the project execution timeframe. It is calculated according to the following formula:
T S = L F − (E S + t), where, again, t is the activity’s time span. . Edges (arrows) represent the relationships between the activities. . Critical path: it is composed of those activities that cannot alter their duration, or their scheduled start or end time, without compromising the final duration of the project. That is, the sequence of activities that form a path with no time slack overall. The total duration of the project is given by the sum of the time spans for all the activities that form the critical path.
11.1.3 Critical Path and Maximum-Length Route Methods For the resolution of planning and programming problems with these two methods, the graph is posed as a directed network formed by a set of nodes representing events, joined by a series of arrows representing activities (type I graph). There are two prominent nodes on the network: the Start node, which represents the beginning of the project, and the End node, which is interpreted as the termination of the project. The problem is completely defined by specifying the graph, together with a weight for each edge, as well as the start and end vertices.
11.1.4 Critical Path Method (CPM) According to Romero López [3], with this method all the times and durations corresponding to each activity can be calculated, namely: the time earlier an activity can start (ES), the time earlier it can end (EF), the time later it can start (LS), and the time later it can end (LF), as well as the total time span expected for the project. In addition, it also provides information about the critical path (i.e., a path such defined with no activity slack overall) and what are the activities that make it up. Each activity of a CPM network is related to two events: (i) the event from which it is born, which indicates both the date on which the activity can begin the earliest (ES) and the date that can later begin (LS), and (ii) the event which the activity comes
11 Open-Access Software Implementation for Critical Path Problems …
185
to, characterized by the date that can end the earliest (EF) as well as the date that can later end (LF). When ES and LS coincide and so do EF and LF, there are no gaps in the activity (its slack is equal to zero), so it is considered critical. This means that if its time span or any of the dates defining the activity vary, the total duration of the project would also change accordingly. This system of representation has the peculiarity of using activities that are called fictitious, which are defined as activities that do not occupy time or space and that do not appear in the planning but are used in their representation to relate some events with others, in such a way that a dependence is generated between the activities that reach them.
11.1.5 Maximum-Length Route Using type I graphs, it is easy to show that Critical Path Method (CPM) resolution method that can be posed as a linear programming problem, specifically a maximum path problem [1–3]. The LP formulation aims at finding the path that connects the Start and the End vertices, maximizing the overall duration time across the path. This resolution has the limitation that the only information that will be obtained is the total time span of the project, in addition to which ones are the activities that form the critical path. But no information about the start and end dates of the different activities will be obtained with this LP formulation.
11.1.6 Approach as Linear Programming Problem As a LP problem [2], the maximum path problem is completely defined by the decision variables (which will be binary variables in this case), the objective function, and a set of constraints specifying the problem to be solved. First, we consider a binary decision variable xi j for each edge connecting nodes i and j. When the value of the assigned binary variable is equal to zero, it will be interpreted as that this activity is not part of the critical path of the schedule. When it takes the value one, then the activity linking nodes i and j will be of the critical path of the project. Second, the objective of the problem is to find the path of the graph that maximizes the overall project’s time span. Let ci j be the weight of the edge connecting nodes i and j, that is, the duration of the activity defined by that link. Then the total spanned time along the project is expressed as: maxz =
Σ ij
ci j xi j ,
(11.1)
186
E. Martin Porta et al.
where the sum extends to all edges in the graph. It is a linear expression. Finally, the problem of the maximum route finds the critical path of the schedule, which is the one that maximizes the overall duration of the project. Unless the problem is degenerated, this path is unique and continuous. If the problem is degenerated (i.e., there exists more than one critical path with the exact same maximum value of the objective function), then the method provides one of the critical paths. There are some restrictions: 1. Restriction for the Start node: starting from the node that initiates the project, only one activity must be chosen as part of the critical path. Therefore, Σ
x S j = 1,
(11.2)
j
where S stands for the Start node. 2. Restriction of intermediate nodes: we must ensure that the path is continuous. This can be achieved by equating the number of activities that enter a node to the number of activities that leave it (continuity condition): Σ
x ji =
j
Σ
xi j ,
(11.3)
j
for each intermediate vertex i. 3. Restriction for the End node: to the node that represents the end of the project, only one activity must be chosen as part of the path: Σ
x j E = 1,
(11.4)
j
where E stands for the End node. All constraints are linear on decision variables.
11.1.7 Roy’s Method According to the French mathematician Bernard Roy [6], his method serves to solve scheduling problems defined on type II graphs, in which activities are not represented with arrows, but as nodes. Nodes include the following information:
11 Open-Access Software Implementation for Critical Path Problems …
. . . . . .
187
Name or designation of the activity. Duration time (t). Earliest start time (ES). Latest start (LS). Earliest finish time (EF). Latest finish (LF).
The advantage of this type of graph is that its representation is clearer and easier to interpret since there is no need to use fictitious activities and allows the representation of several different types of relationships between activities.
11.1.8 Methodology for the Resolution of Roy Graphs [7] In this section we will make a brief explanation, following Roy [6] and Sevillano Naranjo [7], about the way in which programming is calculated “manually” with paper and pencil (that is, not automatically) using Roy graphs. The first thing to do is to map out the network. A vertical line that represents the beginning of the graph is drawn, from which the ligatures corresponding to the initial activities of the project depart. Then we represent all the activities with their corresponding ligatures, until reaching the activity or activities of the final project, which are linked together by a ligature represented by vertical line that marks the end of the project. Once the graph has been drawn, we proceed to calculate all the times associated to each activity and the overall duration of the project.
11.1.9 Objective of Our Contribution Optimal planning and scheduling problems can be solved with paper and pencil. But, in the case of projects with many activities, it should be very laborious, and it is easy to make mistakes. In addition, during the process of executing a project, for many reasons it is possible to not stick strictly to the schedule. Therefore, some adjustments of the schedule will be necessary, which in the case that the schedule has been calculated with paper and pencil will imply having to re-evaluate the entire calculation. There is also computer software that allow for good programming solutions, but they are not freely accessible: almost always are licensed software. The objective of this work is to implement an algorithm in an open access program suite, such as OpenOffice, which allows to find automatically the optimal schedule of a given planification problem. The only input data needed in our implementation are the data provided by the graph representing the problem, i.e., the information related to activities, their durations, as well as their dependencies and relationships between them.
188
E. Martin Porta et al.
For this purpose, two different spreadsheets have been implemented. The first one solves the scheduling problem as a LP problem, and the second of them is formed by a series of formulas and calculations implemented by ourselves that allow the automatic resolution using Roy’s method, following the same procedure that should be followed if the graph were solved manually.
11.2 Materials and Methods 11.2.1 Maximum-Length Route Method This method is based on Type I graphs: nodes represent events, and links stand for activities, which are weighted with the total time span of each activity. An example of such graphs could be the one shown in Fig. 11.1. The main objective of this method is to calculate the total duration of the project and not to know the start and end times of each activity. This duration will be defined by the activities that form the critical path, so with this method we obtain only information about those activities. To transcribe this graph into Excel and proceed to its resolution, first we made a table in which the planning data is written. According to Eq. (11.1), to calculate the total duration of the project, the SUMPRODUCT function is used, which multiplies the duration times of each activity by the value of the binary variable that corresponds to it. In this way, if the activity is not part of the critical path, its duration will be multiplied by 0, so its contribution will be zero. If the activity is part of the critical path, its time span will be multiplied by 1 and will contribute to the overall sum.
Fig. 11.1 Example of a planning problem. Initial (I) and Final (F) events are marked, and activities and their dependencies are symbolized by graph links (including the associated time span t between parenthesis). Events (nodes) are denoted by numbers, and activities are denoted by letters. The duration of the activities (t), depending of the type of project, can be measured in seconds, minutes, days, or months, depending on the scale defining the project. In this example, the planning problem consists of 14 activities and 8 events together with the Start (I) and End (F) events. In addition, it also has two fictional activities, not time consuming, that link events 2 with 3 and 5 with 6, with the aim of creating a dependence between the activities that arrive and leave those nodes
11 Open-Access Software Implementation for Critical Path Problems …
189
The associated optimization problem (1) is a LP problem, whose solution can be obtained with the Solver add-on once the constraints (2)–(4) are introduced in the spreadsheet. As discussed before, there is a restriction associated with each intermediate node, as well as the initial node and at the end: there are n + 2 restrictions overall, n being the number of nodes. This table is composed, first, by a column (“Node”) in which all the nodes of the graph are listed, including “Start” and “End”. The next two columns (“Output” and “Input”) use the SUMIF function. In this way, the program looks for each of the nodes in the stated table. First, it searches the column (“Output”) and then it does so in the “Input” column and shows the value of the corresponding variable. In this way, if in the columns “Exit” and “Input” a 1 appears instead of a 0, it means that the critical path passes through that node, otherwise the node will not be part of that path (see Fig. 11.2). The third column (“Flow”) allows to comply with the restriction that if an activity reaches one of the nodes, there must be another activity that leaves it, because the path must be continuous. The data that will appear in that column is the result of subtracting from the value of the column “Output” the value of the column “Input”, and must always be equal to 0, so it is forced that, if an activity enters the node, another must leave (1−1 = 0) and that if the node does not reach any activity, none can leave from it (0−0 = 0). Exceptions are the beginning and the ending nodes, because for the “Start” node only one activity comes out but none arrives, and on the contrary, for the “Final” node, to which one activity must arrive, but none comes out from it. Therefore, the flow of the “Start” node must be equal to 1 (1−0 = 1), while in the case of the node “Final” node must be equal to −1 (0−1 = −1). Binary decision variables are included in the column “Variables”, as many as activities are included in the planification problem. These variables are equal to 1
Fig. 11.2 Appearance, as described in the text (labels are in Spanish), of the spreadsheet implemented to solve the Maximum-length Route Problem defined by the graph in Fig. 11.1
190
E. Martin Porta et al.
Fig. 11.3 Maximum-length Route solution for the planification example depicted by the graph in Fig. 11.1
for activities that are part of the critical path, and 0 otherwise. Therefore, for the LP problem to be solved, a restriction is added that the cells in that column (decision variables) must have binary values. Finally, we add the aforementioned restrictions, to allow continuity to the path and force only one route to be chosen that leaves the “Start” node and ensuring that a single activity reaches the “End” node. The resolution method chosen is the simplex method, which is commonly used in linear programming problems. The resulting critical path is shown in Fig. 11.3.
11.2.2 Roy’s Method For this resolution method, a type II graph is proposed in which the activities are represented as nodes and the edges have only a meaning of dependence between activities. An example of a type II graph is shown in Fig. 11.4. Our Excel template consists of four sheets. The first of them contains the planning data. These data must be entered manually for each schedule to be solved, whereas the calculations will be carried out automatically. Obviously, the introduction of activities in each specific case cannot be automated. With this method we can solve planning problems without limits in their number of activities. The template that we have developed is prepared for the calculation of a schedule that contains a maximum of 150 activities by default, but in case of being more, it will be enough to drag all the formulas in cells below. To transcribe a type II graph into Excel and proceed to its resolution, a table is first made in which the planning data is summarized. In the first column (“Activity”) all activities are recorded in alphabetical order, including a row for the beginning of the planning and another for the end, even if they do not occupy time or space in the project. In the second column (“Duration”) the times corresponding to the durations of each of the activities are annotated, which will be equal to 0 in the case of Start and End. In the next two columns (“From”) and (“To”), the information related to the ligatures is transcribed, that is, the activity from which a ligature starts and the
11 Open-Access Software Implementation for Critical Path Problems …
191
Fig. 11.4 Example of a graph for the Roy’s Method. It represents a plan consisting of 14 activities, related to each other by 25 dependencies, including those that join the initial activities with the vertical line that represents the beginning of the project, as well as those ligatures that join the final activities with the line that represents the end of the project. Activities in each node are labeled with Latin letters, and every node contains the duration time (t), earliest start time (ES), latest start (LS), earliest finish time (EF), and latest finish (LF)
activity to which it arrives are specified, to list all the dependencies existing between activities. Once the specific data of the planning problem has been entered in the Excel sheet, the calculations will be carried out automatically. For every activity, the spreadsheet provides information about the earliest and later times when it can start, and the earliest and later times when it can finish, in addition to calculating the gaps (slacks) associated to each activity, useful to determine which ones are critical and how long the non-critical activities could be moved.
11.2.3 Roy’s Method Implementation Here we explain our Excel implementation of Roy’s method. For the calculation of the dates earlier, two formulas are used, the first of which is EF = ES + t and is entered into the table. The second formula indicates that the earliest start time (ES) of each activity is the maximum earliest completion times (EF) of the activities that precede it. So, to continue with the calculation, it is necessary to know, for each activity, which one has the highest FO value among all its predecessors. And it is precisely this step that complicates the automatic calculation in this method since an intermediate calculation is needed. To make it possible for
192
E. Martin Porta et al.
Excel to find which activity has the highest FO value, two intermediate tables have been developed between the table which contains the planning data and the table which the programming solution is calculated. These tables are called “Auxiliary Tables”. Our sheet uses Excel’s VLOOKUP function to find predecessor activities. The limitation of this function is that it only shows the first occurrence of the data it finds, so if an activity had more than one predecessor, it would only give information about one of them. To solve this problem, a table called “Search Keys” has been used, which works as follows. First, a column is elaborated in which the number of times a repeated activity appears as a successor to another is counted, using the COUNTIF function. Following the order from top to bottom in the table, the first time the activity appears a 1 is displayed, the second time a 2, and so on. A second column is elaborated in which the function VLOOKUP concatenates the number that has been calculated in the previous point with the letter that designates the activity. In this way, each activity is given a name for each of its ligatures, and as many denominations as ligatures there are in the initial graph. By this way, for example, the ligature that joins “Start” with activity “A”, is now called “A1”, the ligature that joins the activities “D” and “G” is now called “G2”, and so on for other ligatures. Once this re-labelling procedure has been completed, the VLOOKUP function can be already used because ligature numbers have been singularized. To effectively carry out the list of predecessor activities, together within this function it is necessary to also use CONCATENATE, which serves to concatenate the designation of the activity with the column number in which the predecessor activity will appear. In this way, although the table shows the actual designation of the predecessor activity (that is, A, B, C…), what the function is actually looking for is the designation that has been created in “Search Keys”. For example, if there is a ligature joining activity “A” with activity “C”, this ligature is named (according to “Search Keys”) as “C1”, so when using the function VLOOKUP plus CONCATENATE the activity “C” is concatenated with “1”, and then “C1” is searched in the “Auxiliary Table”, showing activity “A”, as the predecessor of “C” (Fig. 11.5). The second intermediate table shows the earliest final times (EF) of each predecessor. Thus, in the “Solution Table” we just need to use the MAX function to find the largest EF of the predecessors. For the calculation of the times later one proceeds backwards, starting by the final activities, until reaching the initial ones. First, the latest final time (LF) of the final activities is the minimum earliest final times (EF) of those activities. For the calculation of the remaining latest final times (LF), two intermediate tables have been elaborated, which work in the same way as explained above, using Excel’s functions VLOOKUP and CONCATENATE. The only difference is that, in this case, all the latest start times (LS) of each of the successor activities are computed. Subsequently, in the “Solution Table” the smallest of them is calculated using Excel’s function MIN.
11 Open-Access Software Implementation for Critical Path Problems …
193
Fig. 11.5 Exhaustive enumeration of predecessor activities for a given one (labels are in Spanish)
Finally, for the calculation of the latest start times (LS) of each activity, the formula LS = LF − t is used. Once all the times of every activity have been calculated, the gaps can be calculated, which allow us to know how much an activity can be moved in time without varying the total duration of the project. Two slacks are calculated: (i) the free activity slack (FS), which corresponds to the time an activity can be delayed without altering the earliest start dates of the successor activities. It is calculated as FS = EF − (ES + t), EF being the shortest of the earliest final times of the successor activities. And (ii) the total activity slack (TF) is calculated, which corresponds to the time a task can be delayed without altering the project’s execution time. It is calculated as TF = LF − (ES + t). Figure 11.6 shows the “Solution Table” sheet for the example in Fig. 11.4. Finally, Fig. 11.7 summarizes all the calculations provided by our Excel implementation for the planification problem depicted as a type II graph in Fig. 11.4.
194
E. Martin Porta et al.
Fig. 11.6 “Solution Table” obtained after solving the planification problem in Fig. 11.4 by Roy’s Method (labels are in Spanish). As mentioned, our implementation calculates the earliest start time (ES), latest start (LS), earliest finish time (EF), and latest finish (LF)
Fig. 11.7 Optimal solution for the example graph in Fig. 11.4. The critical path, for which every activity slack is equal to zero, is highlighted in red
11 Open-Access Software Implementation for Critical Path Problems …
195
11.3 Results and Discussion 11.3.1 Implementation of the Maximum-Length Route Method The Maximum-length Route Method formulates a planification problem as a LP problem. The graph on which the calculation is based is formed by nodes, which are called events, to which they arrive and from which the activities leave. These activities are represented as directed links that are weighted with the activity time span. The objective of the calculation is to find the route (that is, the sequence of activities) that that maximizes the total duration of the project, which is known as critical path. In other words, the objective is to calculate the duration of the project and to know which are the activities that delimit that duration. Once the implementation of the method in Excel has been used to find an optimal, despite having reached a result and having calculated the duration of the project quickly, one observes that this method has many limitations. It does not provide information the execution times of every activity. That is, one obtains when the project begins and when it ends, but cannot find the time when an activity should begin or when it should have ended, except for those activities that are part of the critical path. In addition, if degeneration occurs, i.e., if there are more than one critical path for the planification problem, only information about one of them can be retrieved. In summary, it is a fast, easy-to-use method that can be very useful if the objective is simply to know how long it can take to carry out a certain project. It can be used as a preliminary calculation of a more detailed future schedule, as an estimate of how long its execution may take.
11.3.2 Implementation of Roy’s Method The Roy’s Method based on type II graphs, which represent activities as nodes, linked by ligatures (dependencies) that are meaningful for the relationships between activities. It is a method that provides information about all activities, the time earlier and later they could start without altering the total duration of the project, together with the time earlier and later they could end. In addition, it calculates the total duration that the project will have and indicates which activities are critical. It also provides information about the slack associated to non-critical activities. In summary, all the necessary information that a program must have is provided, so that it can be used during the execution of the project in terms of organization as well as in decision making. The difficulty of implementing the method in the spreadsheet lies in the need to know all the times to be able to choose, depending on the case, the longest of the final times of the predecessor activities or the shortest of the start times of the successor
196
E. Martin Porta et al.
activities. This problem has been solved by performing a series of intermediate calculations. As our Excel template is presented, the calculation of a schedule that has a maximum of 150 activities is allowed by default. However, for larger projects it is enough to drag the formulas across sheets to perform the calculation. Therefore, it could be said that there is no limitation in terms of the number of activities that can include a schedule so that it can be solved using our Excel implementation of Roy’s Method. Currently, Roy’s Method is used for the calculation of optimal schedules. This calculation can be done using paper and pencil or automatically using software that require the acquisition of a license. With the implementation we provide, the calculation of the schedule is allowed using an open access program (such as Calc) that most companies and universities have. The spreadsheet that we provide has a certain degree of complexity regarding its implementation, but its use is very simple. That is, with it, anyone, with or without notions about planning or even about the Excel program, may be able to calculate the times of a planning and reach a valid conclusion, which is not possible if planification is to be solved with paper and pencil, or using any of the specific planning software at hand, that require specific training.
11.3.3 Comparison of Both Methods Two different implementations have been developed applied to two different methods, to know which of them allows a faster execution and, on the other hand, which of them allows a more exhaustive calculation, providing more information. In terms of time required to obtain results, it is faster to enter the data in the Maximum-length Route Method, since by representing the activities as arrows and not as nodes, the number of arrows is less than in the case of the Roy’s Method. If you had to calculate the programming of a planning with many activities and relationships between them, the difference can be remarkable. In terms of the information provided, the Maximum-length Route Method is very limited with respect to Roy’s Method. In addition, the implementation of the Maximum-length Route Method has a limit in the number of activities and events that the planning can contain, while in the implementation of the Roy’s Method there is no such limit.
11.4 Conclusions Overall, in our contribution we provide a toolbox to solve generic planning problems in companies, through free access software. Two different methodologies were implemented: the first one (the Maximum-length Route Method) is faster, but less informative, so it could be used to quickly know what the total duration of the project
11 Open-Access Software Implementation for Critical Path Problems …
197
will be. In this way, decisions could be made such as when it is convenient to start the project to be able to finish it before a certain moment. That is, it could be used as a preliminary calculation, prior to the realization of a more detailed programming. On the other hand, the Roy’s Method provides all the information about every activity and about the project as well, specifying the time span for every activity and the optimal sequence or sequences. In addition, although its implementation was based on a graph that represents the activities as nodes, this does not mean that it cannot be used also in the case in which the graph represents the activities as arrows, since the information provided by both graphs is the same. Finally, both methods are useful if adjustments are to be made during the execution of the project, since if the duration of any specific activity were to change, one simply has to update that duration data in the Excel spreadsheet and the calculation of the new route would be done again automatically.
References 1. Taha HA (2012) Investigación de operaciones. Ed. Pearson Educación, México 2. Hillier FS, Lieberman GJ (2006) Introducción a la investigación de, operaciones. McGraw-Hill, México, D.F. 3. Romero López C (1997) Técnicas de programación y control de proyectos. Ed. Pirámide 4. Westreicher G (2020). Economipedia. Obtained from: Técnicas de programación y control de proyectos 5. Terrazas Pastor R (2011) Operations planning and programming. Perspectivas 14 (28):7– 32. http://www.scielo.org.bo/scielo.php?script=sci_arttext&pid=S1994-37332011000200002& lng=es&tlng=es 6. Roy B (1964) Algunos aspectos teóricos de los problemas de programación. Coloquio hispanofrancés sobre métodos modernos de gestión, Barcelona 7. Sevillano Naranjo E (2010) Métodos de planificación y programación: Roy y diagrama de Precedencias. Ed. Abecedario
Chapter 12
Spanish Construction Emerging Risks About Health and Psychosocial Risk Á. Romero Barriuso , B. M. Villena Escribano , María de las Nieves González García , and M. Segarra Cañamares
Abstract The aim of this research paper is to study the psychosocial risks which are present in the construction sector in Spain, as well as their consequences for construction workers, in conjunction with drug addiction and the use of substances to which this group is exposed, before comparing the Spanish results with the European findings obtained from the third ESENER survey. To this end, a quantitative study has carried out of the research indicators based on the survey, just like that performed in third ESENER survey’s case, in order to be able to extract the results from both studies and compare them, whilst focusing upon Spain’s profile. The results obtained reveal the importance of preventing these psychosocial risks, with worrying data concerning the level of stress among workers, along with the workers’ legal obligation to participate in health and safety matters, which only a low percentage of companies in the sector fulfil. On top of this, the alarming level of substance use during the working day must also be considered as must its involvement in workplace accidents. In conclusion, these kind of risks must be incorporated in workplace assessments, and companies must be equipped with the resources to prevent them, as well as implementing training activities and campaigns to raise awareness about the dangers of consuming substances during the working day. Keywords Psychosocial risks · Construction sector · Spain · Occupational risk-prevention · Drug addiction Á. Romero Barriuso (B) Universidad Isabel I, Burgos, Spain e-mail: [email protected] B. M. Villena Escribano Universidad Nacional de Educación a Distancia, Madrid, Spain e-mail: [email protected] M. N. González García Universidad Politécnica de Madrid, Madrid, Spain e-mail: [email protected] M. Segarra Cañamares Universidad de Castilla-La Mancha, Cuenca, Spain e-mail: [email protected] © The Author(s), under exclusive license to Springer Nature Switzerland AG 2023 M. N. González García et al. (eds.), New Advances in Building Information Modeling and Engineering Management, Digital Innovations in Architecture, Engineering and Construction, https://doi.org/10.1007/978-3-031-30247-3_12
199
200
Á. Romero Barriuso et al.
12.1 Introduction A clear shift may be observed in the prevailing prevention paradigm, an increasingly greater importance being attached to psychosocial risks in all production sectors, they are having previously gone unnoticed. This change has been driven by the European Agency for Safety and Health at Work [1] itself. Which together with the various editions of the European Survey of Enterprises on New and Emerging Risks (hereafter, ESENER), has carried out an extensive study into the management of risks concerning health and safety in European places of work, which devotes a specific section amongst the four blocks of which it is composed to psychosocial risks. Likewise, it consigns another block to workers’ participation in health and safety practices, this being the employer’s legal obligation, and the fact that they have an increasing impact on the correct inclusion of health and safety in the workplace. So much so that three editions of this macro study have now been carried out, the most recent of which [2] featured the participation of 45,420 companies from all the production sectors in the 33 countries included, among them the European Union member states [3]. These actions are complemented, in the case of Spain, by campaigns to prevent and raise awareness about the importance of psychosocial risks in the workplace, implemented by the Spanish Institute of Health and Safety at Work (INSST), such as the 2014–2015 campaign concerning stress management, within the framework of the European campaign for “safe and healthy places of work” [1, 3, 4]. Both this kind of psychosocial risks, and the participation of workers in health and safety practices, take on greater relevance if focused upon the construction sector, which features a high rate of accidents at work [5] and, since the associated workplaces are mobile, does not usually feature such established prevention measures as companies with permanent places of work [3, 6]. Furthermore, there are factors which mean that this production sector has characteristics which are dissimilar to the rest, with a special context that is rooted in traditional construction practices and processes, which in the specific case of Spain, makes it a “refuge sector” receiving workers from any other sector, without previous experience, since it has no entry requirements, making it difficult to correctly incorporate a “collective preventive culture” amongst all of the players involved in constructive-preventive processes, in addition to the language barrier between workers, since it is a sector with high levels of immigrant workers [3, 7]. Another factor to be considered, is the sector’s real need to become more professional, so as to be able to compete with the other production sectors and with the aim of reducing the high rate of accidents at work in this sector [8], as well as the high level of substance use during the working day which ends up leading to accidents in which consumption is involved [3, 9]. A huge difference that exists about alcohol and substance consumption during the working day in the case of Europe compared to the case of Spain is that Europe has raised workers’ awareness concerning the prevention of addictions, as the ESENER-3 states [3].
12 Spanish Construction Emerging Risks About Health and Psychosocial Risk
201
12.1.1 Psychosocial Risks in the Construction Sector: Literature Review It is increasingly important to consider the psychosocial risks in the construction sector when assessing the workplace and this rarely happens. Despite the existence of the 2015–2020 Spanish Health and Safety at Work Strategy, as well as European and state-level action plans, European campaigns and biannual state campaigns, safe and healthy work environments have not been created (according to data from the National Statistics Institute, in Spain, 59% of workers suffer from some kind of stress at work.), this situation being particularly pronounced in the construction sector, where the rate of accidents at work is very high (in comparison with other Spanish production sectors, it always occupies the second position, in terms of the incidence rate). Such is the importance of psychosociology that it forms part of one of the four techniques or disciplines used in Occupational Risk-Prevention, which must be understood in an interrelated rather than isolated fashion. The aim of this chapter is to study the psychosocial risks which are present in the construction sector in Spain and their consequences for construction workers. It is for this reason, that Table 12.1 sets out the main indicators relating to the present research, which form part of the European strategy, by means of the various editions of the ESENER, as well as the specific psychosocial risks of the sector, connected to drug addiction and the consumption of substances and alcohol during the working day, which exacerbates the complicated situation in the sector and makes it a risky sector. Table 12.1 Refutation, by means of bibliographic references, of the aspects relating to this research
Indicator
Reference
ESENER
Payá (2020) [10] Romero et al. (2019) [8] Stamatogianni et al. (2019) [11] Cantonnet et al. (2019) [12]
Psychosocial risks in construction
Houtman et al. (2020) [13] Sánchez-Herrera and Donate (2019) [14] Marín et al. (2019) [15] Han et al. (2014) [16] FLC (2016) [17] Cedstrand et al. (2020) [18]
Drug addiction and substance use in construction
Choe and Leite (2020) [19] FLC (2019) [9] Roche et al. (2015) [20] Marques et al. (2014) [21] Ompad et al. (2019) [22] Schofield et al. (2013) [23] PNSD (2018) [24]
202
Á. Romero Barriuso et al.
It is concluded that psychosocial risks should be incorporated into workplace assessments, and companies should be endowed with the resources to prevent them.
12.2 Material and Methods This section sets out the joint methodology used in the research, which relies on the survey as a method for extracting information, together with the databases supplied by the third edition of the European Survey of Enterprises on New and Emerging Risks (hereafter, ESENER-3).
12.2.1 Survey-Based Study In order to carry out this research, the survey is used as a forecasting technique for obtaining quantitative information. In order to achieve this, a questionnaire is produced which is made up of a total of seventy-two questions, structured in seven themed blocks, concerning the different aspects of working on a building site encountered by the tradespeople who work in construction: bricklayers, plumbers, electricians, welders, etc. The language used in the survey was adapted to suit its target audience, manual workers who have either not studied at all, or who, in the case of the vast majority, have completed the compulsory basic studies. This survey analyzes a total of 250 manual workers from the construction sector belonging to the autonomous community of Castile-Leon, Spain, obtaining this sample size by applying a famous mathematical axiom used to calculate sample sizes for global data and market research [25], which gives the study a confidence level of 99%. Given the nature of the study, particular emphasis is placed on aspects relating to the themed blocks which analyze the psychosocial risks to which construction workers are exposed (the six questions making up Block V: Psychosocial risks, are used for the study) and relating to the consumption of alcohol and substances during the working day (the seven questions from Block VI: Health and consumption, are used), as well as the five questions making up Block VII: Site work. In conclusion, eighteen of the seventy-two questions making up the questionnaire are used.
12.2.2 Data-Based Study In addition, the reports published on drug addiction by the FLC are considered [9], these using a sample of 1547 workers surveyed nationwide (including, in the specific case of the autonomous community of Castile-Leon, a sample of 112 workers), as are the initial results provided by the ESENER-3. The initial findings of this macro
12 Spanish Construction Emerging Risks About Health and Psychosocial Risk
203
survey, which covers over 45,000 companies of every size and sector of activity (the comparison focusing upon the data concerning the construction sector, which has the lowest response rate of the sectors analyzed, at only 9%) from 33 European countries (including Spain—with a response rate of 6% and a sample of 2,266 companies from all of the production sectors, including construction; compared to the 1,566 companies analyzed in the first edition of this survey), were released at the end of 2019 [26] and will be published during 2020. For the present research, the data relating to the construction sector in Spain was analyzed, looking at a total of nine questions which provide results related to the research indicators. The data produced by both studies completes the quantitative methodology of the study, both being devised to obtain information by means of the survey technique.
12.3 Results This section details all of the results produced from the surveys completed by workers in the construction sector in Spain for the indicators which relate to the present research, together with the data provided by the databases of the ESENER-3 and the FLC drug addiction study in collaboration with the Spanish Department of Health, Consumption and Social Well-being’s National Anti-Drugs Plan [24].
12.3.1 Results from Questionnaire Block: Psychosocial Risks Given the high level of temporariness and mobility amongst construction sector workers, it is not surprising to observe that 70.00% of them are either separated or divorced or have a workmate that is (Q34), as shown in Fig. 12.1. On asking the workers about whether their work has been affected by personal or family problems, it is observed that this is true in 52.80% of cases (Q35). With regard to whether their work has affected their personal or family lives, 62.00% of those surveyed responded positively (Q36). With reference to whether they suffer or have suffered stress as a result of their work, 56.05% stated that they suffer from stress (Q37). Where suffering or having suffered mobbing or workplace bullying is concerned, the percentage reduces to 30.80% (Q38), although this is still very high. Lastly, and in order to complete the questions from this block of the questionnaire, only 5.60% of the workers surveyed stated that they had been signed off because of depression, stress, etc. at some time during their professional career (Q39).
204
Á. Romero Barriuso et al.
Health and consumption
100 0
Q40
Q41
Q42 Yes (%)
Q43
Q44
Q45
Q46
No (%)
Fig. 12.1 Questions and percentages per response obtained in the questionnaire for construction sector workers referring to block V: Psychosocial risks (Total: 6 questions). Where: Q34: Are you separated/divorced, or do you have any colleagues who are separated/divorced? Q35: Do you think that your work has been affected as a consequence of personal or family problems at any time? Q36: Do you think that your personal life suffers or has suffered as a consequence of your job? Q37: Have you suffered from, or do you suffer from stress as a consequence of your job? Q38: Do you think that you have experienced mobbing or workplace bullying during your professional career? Q39: Have you ever been signed off due to depression, stress, etc. at any time during your professional career?
12.3.2 Results from Questionnaire Block: Health and Consumption With regard to the worrying situation of drug addiction and substance use that the sector is going through, and which places it as the sector featuring the highest rate of consumption, 58.40% of workers state that they smoke or have smoked during the working day (Q40), as can be seen in Fig. 12.2. The percentage falls considerably when the consumption of energy or stimulant drinks is analyzed, with 18.40% of workers consuming them during the working day (Q41). With reference to the consumption of alcoholic drinks, the percentage increases to 31.60% of workers consuming them during the working day (Q42). The use of cannabis and cocaine during the working day stands at 15.60% of those working in the sector that were surveyed (Q43). Where the perception held by workers in the sector with regard to substance use is concerned, 94.35% of them believe that the consumption of alcohol or drugs during the working day is dangerous (Q44). In relation to the aforementioned perception, 99.60% of workers in the sector believe that the consumption of alcohol or drugs during the working day could cause an accident at work (Q45). Finally, in order to complete this block, it is of concern that 36.55% of the workers do not have the compulsory annual medical examination (Q46).
12.3.3 Results from Questionnaire Block: Site Work The high rate of accidents at work in the construction sector means that year after year it is the sector with the highest incidence rate (overtaken by the extractive industry in 2019, according to the latest data published by the Spanish Department of Labor and Social Economy), which is why it is not surprising that 53.20% of the workers in the
12 Spanish Construction Emerging Risks About Health and Psychosocial Risk
205
Psychosocial risks
100 50 0
Q34
Q35
Q36
Yes (%)
Q37
Q38
Q39
No (%)
Fig. 12.2 Questions and percentages per response obtained in the questionnaire for construction sector workers referring to block VI: Health and consumption (Total: 7 questions). Where: Q40: Do you smoke, or have you smoked during the working day? Q41: Do you consume, or have you consumed energy drinks (Red Bull, Burn, Monster, etc.) during the working day? Q42: Do you consume, or have you consumed alcoholic drinks (beer, wine, spirits, etc.) during the working day? Q43: Do you consume, or have you consumed drugs (cannabis or joints, cocaine, speed, ecstasy, LSD, etc.) during the working day? Q44: Do you think that the consumption of alcohol and drugs during the working day is dangerous? Q45: Do you think that the consumption of alcohol and drugs during the working day can cause accidents at work? Q46: Do you have a compulsory medical examination every year?
Table 12.2 Questions and percentages per response obtained in the questionnaire for construction sector workers referring to block VII: Site work (Total: 5 questions) Question
Yes (%)
No (%)
Q47: Have you ever had an accident at work?
53.20
46.80
Q48: Have you ever suffered an illness related to your work?
20.00
80.00
Q49: Do you think that the construction sector is more dangerous than other production sectors?
85.96
10.04
Q51: Are you consulted about or allowed to participate in matters which affect site safety?
33.47
66.53
Q53: Do you receive at least one visit per year from your company’s Risk Prevention Service experts?
37.25
62.75
sector who were surveyed have suffered an accident as a result of doing their work (Q47), as shown in Table 12.2. It is worrying that 20.00% of them have suffered an illness related to their work (Q48). With regard to whether they consider the construction sector to be the most dangerous production sector, 85.96% stated that they did (Q49). Concerning the role that they play in site safety, 66.53% state that they are not consulted on or allowed to participate in matters which affect site safety (Q51). In order to complete this block, it is of concern that an overwhelming 62.75% of workers do not receive at least one visit per year from the Risk Prevention Service (be it internal or external) (Q53).
206
Á. Romero Barriuso et al.
Table 12.3 Substance use by sector (Source [24]) Alcohol (%) Alcohol risk (%) Tobacco (%) Cannabis (%) Cocaine (%) 19.40
9.00
43.40
11.70
3.90
National average 10.50
4.80
33.80
6.70
1.40
Construction
12.3.4 Results from the FLC Drug Addiction Study This section details the results of the drug addiction study carried out by the FLC [9] among workers in the construction sector, for the positions of laborer, construction manager, director, foreman, tradesperson and administrative staff. Likewise, this study highlights how consumption shoots up, for the majority of substances analyzed, in the cases where the worker is separated or divorced, followed by, although representing a smaller percentage, the cases in which the worker is single, the lowest percentages being obtained for the situations in which the worker is married or in a stable relationship. First of all, the construction sector is compared with the other sectors, obtaining the national average. These results, set out in Table 12.3, show that the construction sector is first in the list of production sectors in terms of the rate of consumption for the substances analyzed (alcohol, alcohol risk, tobacco, cannabis and cocaine), occupying first place in all categories, with the exception of cocaine (where it is in third place, just behind the second sector, hospitality, where consumption represents 4.00%, compared to 3.90% in the construction sector). For all of the substances used, the only criterion analyzed is the consumption that occurs during the working day, which may result in accidents or incidents at work. This criterion is due to the fact that, in the case of all of the substances, their use shoots up at the weekend or on days off (multiplying by ten for some substances such as cannabis, and even by seventy in the case of alcohol). As such, Table 12.4 shows the use, during the working day, of the substances analyzed in the surveys in which workers from the sector participated, in other words, energy drinks, alcoholic drinks, cannabis and cocaine. The percentage of cases in which the substances analyzed have been involved in accidents at work during the working day is of particular concern, such as, for example, the case of cannabis, which was shown to be 39.31%, compared to the lower percentage for alcohol, which was 5.16%.
12.3.5 Results of ESENER-2 (2014) and ESENER-3 (2019) This section sets out the results regarding the construction sector in Spain from the last two editions of the ESENER concerning aspects related to the research, which are shown in Fig. 12.3 in order to facilitate a structured reading and understanding thereof.
12 Spanish Construction Emerging Risks About Health and Psychosocial Risk
207
Table 12.4 Use of substances per job function, shown as a percentage, alongside the percentage of accidents at work in which the use of each substance analyzed during the working day has been involved (Source [9]) Energy drinks (%)
Alcohol (%)
Laborer
7.44
3.29
Cannabis (%) 2.29
–
Cocaine (%)
Construction manager
7.59
3.45
1.38
–
Director
3.77
5.66
1.89
–
Foreman
8.79
5.49
2.20
–
Tradesperson
5.24
3.71
1.31
–
Administrative staff
5.94
0.99
0.99
–
Involved in accident at work
–
5.16
39.31
0.29
Fig. 12.3 Data relating to the fulfilment of the 7 items in the questionnaire for the construction sector in Spain (ESENER-2 in 2014 and ESENER-3 in 2019) (Source [2]). Where: EQ1: No action plan to prevent work-related stress. EQ2: Long or irregular working hours. EQ3: No procedures in place to deal with bullying or harassment. EQ4: No intervention if an employee works excessively long or irregular hours. EQ5: No raising awareness about preventing addiction, e.g., to smoking, alcohol or drugs. EQ6: No visit by the Health and Safety Authority in the last 3 years to check health and safety conditions. EQ7: Risk assessments mainly conducted by internal staff. EQ8: Employees are not involved in the design of measures following a risk assessment. EQ9: Pressure due to time constraints
The percentage of companies without an action plan for preventing work-related stress has gone down, falling from 74.00% in 2014 to 52.40% in 2019, according to the ESENER-3 (EQ1). The endless working days and irregular schedules have also reduced by two percentage points between the two editions of ESENER, which means that 13.60% of companies must still improve this aspect (EQ2), which may result in problems when it comes to balancing family and personal lives, known as the work-family conflict. It was confirmed that 46.90% of construction companies do not have procedures to deal with harassment or mobbing (EQ3), this representing a considerable improvement when compared to 2014, when 70.00% of companies did not have procedures. Likewise, 74.30% of companies stated that they have not implemented intervention mechanisms to cover the scenario where an employee
208
Á. Romero Barriuso et al.
works excessively long shifts or irregular working days (EQ4), which disturbs the balance between their personal and professional lives; this information indicates an improvement of ten percentage points compared to the 2014 results, where the percentage of companies in this category was 84.50%. With regard to an increasingly worrying aspect of the sector, 49.50% of companies do not create awareness about the prevention of addictions to substances such as alcohol, tobacco or drugs, this representing a slight improvement when compared to the data obtained in 2014 (EQ5). Another key aspect which emerges from the sector’s high accident rate, is that 58.70% of companies state that they have not received a single visit from the Health and Safety Authority in the past three years in order to verify the health and safety conditions of the site, which generates a false sensation of impunity in the presence of malpractice, worsening the data obtained in ESENER-2, with a result of 57.60% (EQ6). Similarly, only 10.00% of companies carry out risk assessments using in-house staff, this data being in line with the 2014 figure, which was 10.80% (EQ7). This means that 11.50% of companies confirm that their employees are not considered when devising onsite risk prevention measures, a percentage that is almost identical to that obtained in ESENER-2, which was 11.10% (EQ8). Finally, consistent with the data obtained in questions EQ1, EQ2 and EQ3, 26.80% of companies state that they put pressure on employees to comply with the established delivery dates (EQ9).
12.4 Discussion This section contains a discussion spanning the themed blocks, with regard to the indicators reflected in Section 12.1.1 of this chapter, concerning the different results obtained from the studies considered for the present research, be it by means of the survey carried out on manual workers in the construction sector, the data gathered from the study into drug addiction among workers in the sector produced by the FLC or the initial data obtained from ESENER-3 concerning the construction sector in Spain.
12.4.1 Psychosocial Risks in Construction Table 12.5 shows, as a comparison, the main data related to psychosocial risks among Spanish constructions workers and their environment, which are extracted from the results obtained by both the ESENER-3 (the results of which are listed in Fig. 12.3), as well as the data extracted from the survey carried out with Construction Sector workers (whose results are shown in Fig. 12.1).
12 Spanish Construction Emerging Risks About Health and Psychosocial Risk
209
Table 12.5 Cross-links results related to psychosocial risks in construction Construction workers surveys
ESENER-3
56.05% of construction sector workers state that they suffer from or have suffered from stress as a consequence of their work. The percentage of workers who have been signed off for this reason being low, standing at 5.60% of them
Only 47.60% of construction companies have action plans for preventing problems related to stress. 26.80% of companies state that when time is short, they put pressure on workers to meet deadlines
62.00% of the workers believe that their family and personal life has been affected as a consequence of the job that they do, producing a work-family conflict
13.60% of construction companies have excessively long working days and irregular schedules. A high percentage of companies, 74.30%, do not intervene if an employee works excessive hours or irregular working days
30.80% of the workers have suffered mobbing 46.90% of companies state that they do not or workplace bullying during their professional have established procedures for dealing with career cases of mobbing or workplace bullying
Table 12.6 Cross-links results related to drug addiction and substance use in construction Construction workers surveys
Drug addiction study
ESENER-3
During the working day, 58.40% of the workers surveyed smoke, 31.60% consume alcoholic drinks, 15.60% use cannabis and/or cocaine, and there is a significant increase in the consumption of stimulant beverages
The consumption of tobacco in construction is 43.40%, followed by alcohol, at 19.40%, and cannabis, at 11.70%
49.50% of construction companies do not have programs for raising employees’ awareness about preventing addiction to tobacco, alcohol or drugs
94.35% of those surveyed believe that the consumption of alcohol or drugs during the working day is dangerous and 99.60% believe that this situation may lead to an accident on site
It was confirmed that in 5.16% of cases, alcohol was involved in a construction site accident, compared to a worrying 39.31% for cannabis and 0.29% for cocaine
12.4.2 Drug Addiction and Substance Use in Construction This section shows the main findings regarding to the real situation of drug addiction and substance use in construction sites in Spain, which Table 12.6 collects through a comparison, linking the data extracted from the survey carried out with Construction Sector workers (belonging to the data shown in Fig. 12.2), the study of drug dependence carried out by the FLC (the results of which are shown in detail in Table 12.3 and in Table 12.4) and the data provided by the ESENER-3 (summarized in Fig. 12.3).
210
Á. Romero Barriuso et al.
Table 12.7 Cross-links results related to the participation of construction workers Construction workers surveys
ESENER-3
62.75% of workers in the construction sector state that they do not receive visits at least once a year from prevention experts to check on-site safety measures
58.70% of construction companies state that they have not received visits from the health and safety authority to review site safety conditions during the last three years
66.53% of workers state that the legal requirement to consult them concerning issues affecting site safety is not fulfilled
11.50% of construction companies state that employees are not consulted and do not participate in devising the measures which result from a risk assessment
12.4.3 Participation of Construction Workers This last section shows the legal obligation of construction workers participation, as shown in Table 12.7 by means of a comparison, compiling the data extracted from the survey carried out with Construction Sector workers (whose results are extracted from Table 12.2), and the data provided by the ESENER-3 (whose results are shown in Fig. 12.3).
12.5 Conclusions Substance use and drug addiction are a risk factor to be taken into account, particularly in construction, which has the highest consumption rate of all production sectors for all substances except cocaine, since the level of use during the working day is increasing, this translating into a greater number of accidents in which substance use during the working day was involved. This makes it surprising that 46.50% of companies do not create awareness about the prevention of addiction to alcohol, drugs and tobacco. Likewise, the high level of awareness amongst workers in the sector concerning the danger of substance use during the working day and the high chance of such use resulting in an accident at work is surprising, in both cases reaching values of more than 90%, when compared to the considerable level of consumption of the various substances analyzed which occurs among these workers during their working day, the consumption of alcohol and cannabis always being lower than the high rates of tobacco consumption. The scarce on-site presence of the labor authority, barely reaching 41.30% for a three-year period, and the scant visits from prevention experts, with an annual on-site presence of barely 37.25%, are one of the reasons for the sector’s high rate of accidents at work (53.20% of workers surveyed having suffered an accident as a consequence of their work). Not having any on-site control or monitoring of health and safety matters, workers usually act more recklessly than when there is specific supervision. This is in part due to the workers’ scarce participation in making decisions relating to on-site health and safety, such participation representing a legal obligation for the employer,
12 Spanish Construction Emerging Risks About Health and Psychosocial Risk
211
mainly due to the fact of not allowing them to attend safety meetings, something that repeatedly occurs in 11.50% of the companies surveyed, this differing from the results obtained in surveys of manual workers, where this percentage reaches 66.53%. On top of this, risk factors such as marathon working days, a reality in 13.60% of construction companies, and the high levels of stress to which workers are exposed in order to complete the work on time, must also be considered, it being representative that 5.60% of workers are signed off for this reason, this resulting in a family-work conflict on countless occasions, which in turn translates into high rates of divorce or separation, representing 70.00% of cases, which means that their family and personal lives suffer as a consequence of doing their work in 62.00% of cases. An increasingly greater importance is being attached to psychosocial risks in production sectors such as construction, it being observed that in 52.40% of cases, companies in the sector do not have action plans for combating the stress suffered by 56.05% of workers, this being one of the most demanding production sectors, featuring high pressure due to a lack of time, in 26.80% of cases. To make this situation worse, it has been seen that 46.90% of companies do not have established procedures for dealing with workplace bullying or mobbing, which are suffered by 30.80% of the workers surveyed. Acknowledgements This research would not have been possible without the help of all of the public and private bodies that were consulted for their assistance and, particularly, the EU-OSHA, for making the ESENER dataset available to the public.
References 1. EU-OSHA (2014) Psychosocial risks in Europe: prevalence and strategies for prevention. Publications Office of the European Union, Brussels, Belgium 2. EU-OSHA (2020) Third European Survey of Enterprises on New and Emerging Risks (ESENER-3). European Agency for Safety and Health at Work. European Union, https://visual isation.osha.europa.eu/esener#!/en/survey/datavisualisation/2019. Accessed on 24 July 2020 3. Romero Á, Villena BM, González, MN, Segarra M (2021) The importance of the prevention of psychosocial risk and drug addiction among Spanish construction sector workers. 3rd Building and Management International Conference 110–112. Fundación General de la UPM, Madrid, Spain 4. EU-OSHA (2015) Annual report 2014. European Agency for Safety and Health at Work. Psychosocial Risks in Europe: Prevalence and Strategies for Prevention. Publications Office of the European Union: Brussels, Belgium. https://osha.europa.eu/en/publications/annual-rep ort-2014-improving-working-conditions-across-europe 5. González MN, Segarra M, Villena BM, Romero Á (2021) Construction’s health and safety plan: the leading role of the main preventive management document on construction sites. Saf Sci 143:105437. https://doi.org/10.1016/j.ssci.2021.105437 6. Segarra M, Villena BM, González MN, Romero Á, Rodríguez Á (2017) Occupational riskprevention diagnosis: a study of construction SMEs in Spain. Saf Sci 92:104–115. https://doi. org/10.1016/j.ssci.2016.09.016
212
Á. Romero Barriuso et al.
7. Romero Á, Villena BM, Segarra M, González MN, Rodríguez Á (2018) Analysis and diagnosis of risk-prevention training actions in the Spanish construction sector. Saf Sci 106:79–91. https:// doi.org/10.1016/j.ssci.2018.02.023 8. Romero Á, González MN, Segarra M, Villena BM, Rodríguez Á (2019) Mind the gap: professionalization is the key to strengthening safety and leadership in the construction sector. Int J Environ Res Public Health 16(11):2045. https://doi.org/10.3390/ijerph16112045 9. FLC (2019) Study of the drug addiction situation in the construction sector. Labor Foundation for Construction in collaboration with the State Foundation for Occupational Risk Prevention, FSP Spain. http://www.lineaprevencion.com/uploads/proyecto/applications/ARCH5cadc e895c3f2.pdf 10. Payá R (2020) The impact of the direct participation of workers on the rates of absenteeism in the Spanish labor environment. Int J Environ Res Public Health 17(7):2477. https://doi.org/10. 3390/ijerph17072477 11. Stamatogianni E, Anyfantis ID, Dimopoulos C, Boustras G (2017) Validating the accuracy of ESENER-II in assessing psychosocial risks for the case of micro firms in Cyprus. Saf Sci 120:783–797. https://doi.org/10.1016/j.ssci.2019.08.006 12. Cantonnet ML, Aldasoro JC, Iradi J (2019) New and emerging risks management in small and medium-sized Spanish enterprises. Saf Sci 113:257–263. https://doi.org/10.1016/j.ssci.2018. 11.032 13. Houtman I, van Zwieten M, Leka S, Jain A, de Vroome E (2020) Social dialogue and psychosocial risk management: added value of manager and employee representative agreement in risk perception and awareness. Int J Environ Res Public Health 17(10):3672. https://doi.org/10. 3390/ijerph17103672 14. Sánchez-Herrera IS, Donate MJ (2019) Occupational safety and health (OSH) and business strategy: the role of the OSH professional in Spain. Saf Sci 120:206–225. https://doi.org/10. 1016/j.ssci.2019.06.037 15. Marín LS, Lipscomb H, Cifuentes M, Punnettu L (2019) Perceptions of safety climate across construction personnel: associations with injury rates. Saf Sci 118:487–496. https://doi.org/10. 1016/j.ssci.2019.05.056 16. Han S, Saba F, Lee S, Mohamed Y, Peña-Mora F (2014) Toward an understanding of the impact of production pressure on safety performance in construction operations. Accid Anal Prev 68:106–116. https://doi.org/10.1016/j.aap.2013.10.007 17. FLC (2016) Publication concerning the importance of psychosocial aspects in the construction sector. Labor Foundation for Construction in collaboration with the State Foundation for Occupational Risk Prevention, FSP. Spain. http://www.lineaprevencion.com/uploads/proyecto/app lications/ARCH5810ae2d15cf9.pdf 18. Cedstrand E, Nyberg A, Bodin T, Augustsson H, Johansson G (2020) Study protocol of a cocreated primary organizational-level intervention with the aim to improve organizational and social working conditions and decrease stress within the construction industry – a controlled trial. BMC Pub Health 20:424. https://doi.org/10.1186/s12889-020-08542-7 19. Choe S, Leite F (2020) Transforming inherent safety risk in the construction industry: a safety risk generation and control model. Saf Sci 124:104594. https://doi.org/10.1016/j.ssci.2019. 104594 20. Roche AM, Lee NK, Battams S, Fischer JA, Cameron J, McEntee A (2015) Alcohol use among workers in male-dominated industries: a systematic review of risk factors. Saf Sci 78:124–141. https://doi.org/10.1016/j.ssci.2015.04.007 21. Marques PH, Jesus V, Olea SA, Vairinhos V, Jacinto C (2014) The effect of alcohol and drug testing at the workplace on individual´s occupational accident risk. Saf Sci 68:108–120. https:// doi.org/10.1016/j.ssci.2014.03.007 22. Ompad DC, Gershon RR, Sandh S, Acosta P, Palamar JJ (2019) Construction trade and extraction workers: a population at high risk for drug use in the United States, 2005–2014. Drug Alcohol Depend 205:107640. https://doi.org/10.1016/j.drugalcdep.2019.107640 23. Schofield KE, Alexander BH, Gerberich SG, Ryan AD (2013) Injury rates, severity, and drug testing programs in small construction companies. J Saf Res 44:97–104. https://doi.org/10. 1016/j.jsr.2012.08.021
12 Spanish Construction Emerging Risks About Health and Psychosocial Risk
213
24. PNSD (2018) National anti-drugs plan. Surveys concerning alcohol and other drugs in Spain (EDADES), 1995–2017. Spain. https://pnsd.sanidad.gob.es/profesionales/sistemasInfo rmacion/sistemaInformacion/encuestas_EDADES.htm 25. del Castillo ÁM (2008) 18 Fundamental axioms of market research. Business Pocket Collection. Editorial Netbiblo, A Coruña, Spain 26. EU-OSHA (2019) Third European Survey of Enterprises on New and Emerging Risks (ESENER-3). European Agency for Safety and Health at Work, European Union. https://osha.europa.eu/es/publications/third-european-survey-enterprises-newand-emerging-risks-esener-3/view
Chapter 13
Real Estate Market: Smart Renaissance G. Cantarero-García , F. I. Gordejuela, and C. P. Gutiérrez
Abstract In the three years following the Real Estate boom, the change in architectural studies was remarkable. In the last twelve years, architects, technical architects, engineers, testing and quality companies, developers, builders, site managers, operators of different trades as well as installation, materials, and Real Estate companies were forced to change their business focus on different goals. This crisis even had an impact on university studies and private architecture schools that were created during the boom and both suffered from enrollment losses with new graduates seeking professional opportunities beyond the national scene. The current situation has been different for the last two years as the role of the architectural studio has changed and it no longer exists as such. The architect now works within business, engineering and even consulting synergies. By means of a real case study, and in collaboration with the university and Real Estate companies, this study contributes new conclusions to the state of the question. These findings result from constant changes as well as the fluctuating and cyclical speed of development in the architecture sector. The latest crisis that occurred in the sector, as well as the COVID-19 pandemic, has affected several disciplines, causing professionals and teachers to create new teaching methods and ways of working in diverse teams, which has opened research fields for new ways of building and urban development. Keywords Real Estate market · Smart cities · Architecture · COVID 19 pandemic
G. Cantarero-García (B) · F. I. Gordejuela · C. P. Gutiérrez Architecture and Design Department, Institute of Technology, CEU San Pablo University, Campus de Monteprincipe, 28668 Madrid, Spain e-mail: [email protected] F. I. Gordejuela e-mail: [email protected] C. P. Gutiérrez e-mail: [email protected] © The Author(s), under exclusive license to Springer Nature Switzerland AG 2023 M. N. González García et al. (eds.), New Advances in Building Information Modeling and Engineering Management, Digital Innovations in Architecture, Engineering and Construction, https://doi.org/10.1007/978-3-031-30247-3_13
215
216
G. Cantarero-García et al.
13.1 Introduction The multidisciplinary and scattered nature of the Architecture, Engineering, Construction, and Operations (AECO) sector and its projects [1] provides added complexity to the interaction between information maintenance systems (see also Laudon and Laudon [2]). Indeed, construction projects embrace various teams and project stakeholders (e.g., Managers, Technicians, Operational staff, and Clients/End-users) where Building Information Modeling (BIM) information is exchanged within different phases (i.e., Design [i], Construction [ii] and Operations and Maintenance [iii] Fig. 13.1). While part of the information systems and data maintenance technology for construction projects, BIM holds specific roles among different user interfaces [3]. As such, Fig. 13.1 presents the agents of a construction project and the corresponding interfaces where BIM might play different usages, according to Kerosuo et al. [4]. Additionally, a larger grey sector pertaining to Technicians was added to depict their recent modelling role, which draughtsmen carried out in a not-so-distant past. This image is devised from an adaptation of Dinis et al. [5], based initially on Laudon and Laudon [2] and Poças Martins [6]. Well trained AECO professionals are necessary to achieve fully integrated BIM processes, although these usually assume a relatively narrow position in the pyramid—Operational Staff [4]. Full BIM-based collaboration between stakeholders, workers and team members is still scarce; therefore, adaptative and supportive technological developments should address this identified gap [4].
Fig. 13.1 House prices and rent—EU—Index levels (2010 = 100), 2010T1–2021Q2 (Source Eurostat[prc_hpi_q]; [prc_hicp_midx])
13 Real Estate Market: Smart Renaissance
217
In this study, the term “permeability” of BIM is used, in preference to diffusion or even adoption, to define the bidirectional interchange of BIM information amongst the agents portrayed in the different levels of the pyramid (Fig. 13.1). As such, the permeability of BIM relates more to the idea of transposal, a theoretical crossing over hierarchical barriers, expertise and knowledge within teams. Terms such as implementation and adoption could lead to a broader sense of BIM acceptance by an entity or even sway the understanding in the sense of multi-organizational diffusion. Permeability is closely related to Fig. 13.1 and the notion of several interfaces where BIM plays individual roles. Furthermore, permeability relates to the idea of deployment and propagation of building information data, sometimes bidirectionally, that must be attained across work hierarchy levels and be suited to the tasks and context at hand. The objective of the research focuses on the study of cycles and the search for the ideal way to improve the development of the concept of Real Estate in the coming years.
13.2 Integrated Projects The present investigation uses findings from previous investigations that line up with this topic. In addition, university professors, experts in the Real Estate market, and builders whose companies have survived the 2007 Real Estate crisis and the 2020 COVID-19 pandemic have participated in this research. Other data on youth demand [1], the employment situation [2], the immigration factor [3], and the increase in physical and intellectual disabilities [4] caused by the aging population will give us clues about how to innovate our understanding of architecture and the Real Estate sector. This study analyzes the time lapses of a hypothesis established periodically, noting that it supports unexpected events that have had an economic impact over the years. The method combines and cross references the conclusive data of the time lapses with those provided by experts in the field and the statistics shown in reliable international databases on inter-annual variation such as Eurostat and national ones such as the Bank of Spain and the EpData application.
13.3 Real Estate Market Cycles At the end of the nineteenth century, the American economist Henry George, the most influential representative of Single Tax advocates, appreciated that in the Real Estate market there is a constant cycle that has been repeated relentlessly over the course of the last centuries. These cycles last the same amount of time with the exception of a couple of periods when disruptive events caused high economic and
218
G. Cantarero-García et al.
Table 13.1 Hypothesis of the 7-year cycle in relation to Henry George’s Theory used in this study since 1986 till 2035. In red: crisis-recession, in green: recovery, in blue: prices drop—expansion, in yellow: price hike—oversupply
Source Compiled by author
social upheaval. A disruptive event could be a world war, for example, that breaks the natural supply and demand cycle in the Real Estate system. George anticipated in his writings that the Real Estate market goes through four phases of a cycle that lasts 18 years. This cycle repeats itself and continually goes through the four phases that he described as: Recession, recovery, expansion, and oversupply. Applying George’s theory, a peak in property prices in 2023 is expected, causing the next economic crisis around 2026. Thus, prices should bottom out again around 2030. However, the global pandemic caused by the COVID-19 virus has disrupted this theory, with many unforeseen factors coming into play. See Table 13.1. In addition, the four construction phases must be applied to the cycles that establish prices and thus, while returning to the premise of the seven-year cycle, it is possible to link the periods of the present hypothesis with those estimated by George. This study shows a seven-year cycle hypothesis that leads us to envision a positive rebound starting in 2029 through to 2036 and so on.
13.3.1 Real Estate Crisis in 2007–2008 and the Forecast for Another Crisis From a Real Estate point of view, one could question the premise of Henry George. He said, “People justly own what they create, but natural opportunities and land belong equally to all.” As such, owning a home would imply building it. It is evident that this is not feasible unless one is a housing developer. Earning money and having financial savings to invest in property is a goal for most human beings but that does not seem to be the prevailing premise in twenty-first century where the possession of Real Estate property implies staying in that home. Temporary use of dwellings has encouraged renting and, therefore, possession is not that necessary unless the owner wants to take advantage of the situation by
13 Real Estate Market: Smart Renaissance
219
renting it out. That is where the role of speculation in this century has been promoted as a means of investment. The property and the renter of the property at the service of the tenant have forced the establishment of rental clauses that favor the tenant and has increased the demand for renting. The reason for the establishment of rental clauses is to avoid debt and the personal risk that it entails when mortgage loans were offered to many families without financial solvency. This solution has been suggested from the beginning of the 2007 Real Estate crisis. People lost their jobs trying to pay off their mortgages and added loans. The impact of the unsustainable mortgage system and its variable interest rates have been a study of what is referred to as “new safe investments.” This leads us to research the reinvention of the Real Estate market and the training of the new architect in preparation for dealing with a new crisis. Based on the theory of cycles and data presented here, the new peak in prices will occur in May 2022 which, added to the high costs of electricity of the last seven months of 2021, will trigger a new crisis in 2023 that will last until 2028 and will begin to positively change in 2029.
13.3.2 New University Approaches and the Migrant Architect From a universal point of view, the university is key for the integral formation of these multidisciplinary teams with the basis of common knowledge. The latest trends in research from professionals and university professors include creating platforms, observatories, and specialized laboratories which debate the proper use of different intelligences and, in particular, a human and emotional intelligence applied to the city. Universities are launching projects and platforms that study new technologies and raise awareness among organizations and Spanish society of the ethical and social impact of AI. This is achieved through informative and scientific dissemination in publications, events, and training courses [5]. Those who are not familiar with the Spanish architectural university education system find it surprising that international architects come to Spain for training. Architectural professional training (MECES III) in Spain provides architects with an excellent capacity for both design and engineering. On the other hand, the role of the architectural studio has changed to the point that it no longer exists as such. The architect works within business, engineering, and even consulting synergies. Therefore, nowadays qualified Spanish architects are an emigrant figure, providing their services outside the national sphere. They are equipped with knowledge and tools that allow them to convey and organize their ideas while understanding the complexities of building and urban planning. In Spain, unemployment in architecture is over 42% and is much higher in the 25–35 age group, possibly reaching levels as high as 80%. China, India, Switzerland, Norway, Germany, Qatar, the Arab Emirates, Australia, Chile, Canada, and the United Kingdom are the destinations that Spanish
220
G. Cantarero-García et al.
architects demand. University strategies begin by reaching agreements to employ their alumni at private companies and by encouraging alumni to link up with new graduates in order to attract them to their international studios.
13.4 Market Reinvention: Smart Renaissance The work required to achieve a comprehensive and coherent project in a Smart City must be configured on the basis of multidisciplinary convergence, which requires teamwork from the different disciplines involved. Politicians, sociologists, economists, lawyers, and technicians (architects, technical architects, engineers, landscape architects, geographers, surveyors, etc.), have to shape the current requirements of Smart City inhabitants. Thus, citizens are considered participants and protagonists and they determine the premises required to meet the demands of a Smart City. Utopian reformers par excellence, such as Owen at the end of the eighteenth century in Scotland (and as well Fourier, Cabet and Godin in France), stated that “proposed implementation models in the form of closed patterns such as familisteries and phalansteries, which worked for some labor objectives but failed for sociological purposes” [6]. When it refers to a city as being smart, usually it is associated with a particular intelligent use of mobile applications to speed up orders, delivery, and mail services, but also with collective city use measures such as carbon footprint, CO2 emissions, recycling, energy consumption, and energy savings (urban lighting, parking, traffic control etc.). Nineteenth century designs did not understand these concepts that are currently on everyone’s lips and in the hands of some. Nevertheless, networks and energy savings were already being discussed [7]. The scope of work encompassed the urban and architectural fields and treated projects in a holistic manner, which is the key to the success of well-understood urban planning that serves the city and the citizen in the broadest sense.
13.4.1 Applied Intelligence, ICTs, and IoT While applying definitions of psyche analysts to the Smart City, currently it is designated as intelligent the systems that, when applied to daily life, solve or provide solutions in a simpler way and facilitate the autonomy of the citizen. Therefore, needs change continuously as do the responses to those needs. This is what is called “service.” It is technology at the service of humankind. However, lifestyles are not evaluated. Needs arise from the way of life we adopt or acquire from the time of birth until the time of death. Ten years later, Goleman [8] made a digression on Payne’s theories on emotional intelligence and stated that “the great power of emotions over who people are, what people do, and how people relate to each other.”
13 Real Estate Market: Smart Renaissance
221
For Sternberg, intelligence is any mental activity that leads to conscious adaptation to the environment and to the selection or transformation of the environment for the purpose of predicting results and being able to actively provoke one’s adaptation to the environment or the environment’s adaptation to one. It is the set of thinking abilities that are used in the resolution of ordinary and abstract problems. Intelligence as the capacity or set of mainly cognitive capacities that allow people to adapt to the environment, solve the problems it poses and even anticipates them successfully.
13.4.2 The Smart City Well Understood: Innovation Applied to Health and Well-Being in Architecture Currently, the Smart City concept is presented as a parallel variable to the dream city of the past, but it ignores the emotional intelligence of the citizens who inhabit it. Society expresses itself through ideals sought after but not always found since there is no channel for receiving the necessary information to develop well-designed projects nor to execute them effectively. In other words, there are basic factors that determine that a city is smart in terms of its response to the needs demanded here, today. It is necessary, therefore, to bear in mind that this premise is outdated [9]. Innovative projects and urban proposals should move together in time, although this is not the case. In the time it takes to design and approve an urban plan, many different innovations arise. Taking them up again means using the same amount of time it takes for these innovations to evolve into new ones. COVID-19 has undoubtedly led to considering the suitability of housing in the city. Especially the question of housing scale that is adequate for the inhabitant and how essential goods reach the household when the inhabitant cannot leave the house. Following the lockdown experienced in Spain in 2020, Madrid was drastically affected by a snowstorm (Filomena), causing areas to be declared catastrophic. Citizens experienced home confinement once again. However, those who were malleable, flexible, and adaptable by nature, were able to respond to this situation. A case study on interior well-being in relation to the landscape was presented to support these reflections. Two different external contexts in Madrid were studied in accordance with the following research study topics: Tellurism, geometry, and landscape published in [10]. In addition, it is appreciated that the pandemic caused by COVID-19 has affected the Real Estate sector in terms of people relocating to the outskirts of the city. Researchers from architecture and engineering schools are starting to frther explore how landscape plays an essential role in the citizen’s life.
222
G. Cantarero-García et al.
13.4.3 Case Study: Gathering of Information for Qualitative Analysis The case study presented is a qualitative analysis of the Real Estate market based on data provided by professional experts, Real Estate entrepreneurs, economists, and professors of Real Estate management in Spain. The purpose of gathering these opinions is to extract (and cross-analyze) the information obtained in order to provide a new conclusion to the state of the question. This conclusion will address how to anticipate the optimal market segment and how and when to establish such an investment. Pedro Rodera Zaxo, an expert in the Real Estate development of residential buildings, talks about how to anticipate and identify development opportunities using market analysis. Large Real Estate companies and the Real Estate sector in general need to incorporate new markets with new products in order to carry out sustained industrial activity. This will enable us to be better protected from the economic cycles that have a major impact on traditional Real Estate products. In 2007, Rodera Zazo spoke of considering the senior citizen population, as was suggested 14 years ago when the aging index and demographic statistics already showed the need to focus on people over the age of 65. When studying market segmentation, it is important to take into account the longevity factor, which extends to 25 or 30 years giving us a potential consumer concerned with a residential environment that provides a medical, affective, and occupational environment. On the other hand, expert Jorge Luis Guerra Díaz Maroto pointed out in 2007 the main differences between Spanish regulations and the International Accounting Standards Board (IASB) standards on construction contracts. In Spain, in accordance with the adaptation of the general construction plan for construction companies, income is calculated according to the completion method percentage over the material execution budget thus resulting in the contract execution budget after adding VAT (Value Added Tax), industrial profit, and general expenses. According to the IASB, a series of requirements applicable to each construction contract is established separately from each other using contract segmentation. It is also allowed to apply the same rule to a group of contracts, which is called grouping contracts. Thus, if Spain does not allow for segmenting or grouping construction contracts, not even when dealing separately with work units, and if the construction sector suffers a fall in the stock market, prices have an impact on the entire contract. This makes it easier for the contractor to suspend payments. This has happened on countless occasions. In 2006 (the peak of the Real Estate bubble in Spain), the expert in management accounting for development companies, Ginés López Montes, showed the portfolio of land and developments underway in Spain. The average number of promotions (all of them social housing) was about 50 single-family homes in satellite areas of large capitals, costing an average of EUR 7,000,000 and also blocks of about 90 dwellings at EUR 9,000,000. In February
13 Real Estate Market: Smart Renaissance
223
2006, all these homes were sold at 95% on average because access to the mortgage system was easy but the bubble was about to burst. Finally, about urban planning, expert Felipe Iglesias González indicated in 2006–2007 how land liberalization and political programs impacted Real Estate development during these critical years. Iglesias pointed out that the programming of urban development activity does not disappear with the mere integration of the old types of programmed and unprogrammed land for development into the new category of land for development. Programming is nothing but planning and public activity is always the object of planning. In fact, the dichotomy between programmed and unprogrammed land for development has in practice come to be identified with the new categories of sectorized and non-sectorized land for development. These are defined in Law 6/1988 of April 13, 1988, the same law of which Soriano stated that one of the fundamental changes consists in the suppression of “the unfortunate regime of coercive programming on the owners and on the administration.” Market analyst, Alejandro Fuentes-Lojo, conducted an exhaustive analysis of Real Estate sales and purchase contracts and their practical problems. He examined, indepth, each of the different legal disciplines that are affected by the paradigmatic contract of Real Estate Law—Civil, Urban, and Tax Law [11]. Finally, Teresa Franchini and Teresa Raventós, urban planners, teachers, and Doctors of Architecture, implement in their books a very complete teaching program for urban architects that adapts urban planning regulations, updating them to promote the design of urban plans in accordance with current requirements [12].
13.5 Case Study Analysis, Results, and Discussion The Housing Price Index (HPI) measures inflation in the residential Real Estate market. The HPI captures the price changes of all types of residential property purchased (apartments, single-family houses, townhouses, etc.), both new and existing. Only market prices are considered, so self-built homes are excluded, however, the land of the residential property is included. These indexes are the result of the work that the Spanish National Statistical Institutes (Institutos Nacionales de Estadística, INE) has carried out mainly within the framework of Owner-Occupied Housing (OOH), a pilot project coordinated by Eurostat. The HPI is available to all EU member states (except Greece), the United Kingdom, Iceland, Norway, and Turkey. In addition to the individual country, Eurostat produces indexes for the euro area and for the EU. Data based on an OOH pilot study on the specific case of the European Union and the case of Spain within the eurozone framework provided by the INE (complemented with Eurostat estimates for the first quarter of 2005 and the third quarter of 2005 based on non-harmonized data), the link to the INE website on the housing price
224
G. Cantarero-García et al.
index (Methodology and results as press release, quarterly series, annual average indexes, and considerations are available in Table 13.2). This table shows that house prices rose by 6.8% in the eurozone and 7.3% in the European Union in the second quarter of 2021, compared to the same quarter in 2020 when the COVID pandemic affected the entire international scene. House prices rose by 6.8% in the eurozone and 7.3% in the European Union in the second quarter of 2021, compared to the same quarter in 2020. Between 2010 and the second quarter of 2011, house prices and rent in the EU followed similar paths. Since the second quarter of 2011, that has changed as rent increased steadily throughout the period up to the fourth quarter of 2020 and house prices fluctuated significantly. After a sharp drop between the second quarter of 2011 and the first quarter of 2013, housing prices remained fairly stable between 2013 and 2014. Then, there was a rapid increase in early 2015 when housing prices rose at a much faster pace than rent. During the 2010 period through the fourth quarter of 2020, rent increased by 14.9% and housing prices by 28.6%. These are shown in Figs. 13.1 and 13.2, which show the long-term trends in housing prices and rent (since 2010). During the 2010 period through the second quarter of 2021, rent increased by 15.7% and housing prices by 34.4%. Rent and house prices in the EU continued their steady increase in the second quarter of 2021, rising by 1.3 and 7.3%, respectively, compared to the second quarter of 2020. Between 2010 and the second quarter of 2011, house prices and rent in the EU followed similar paths. From the second quarter of 2011 they have followed very different paths. While rent increased steadily throughout the period up to the second quarter of 2021, house prices fluctuated significantly. After a sharp drop between the second quarter of 2011 and the first quarter of 2013, housing prices remained fairly stable between 2013 and 2014. Then, there was a rapid increase in early 2015, since housing prices rose at a much faster pace than rent. Comparing the second quarter of 2021–2010, housing prices increased more than rent in 18 EU member states. House prices increased in 23 member states and decreased in four, with the largest increases in Estonia (+132.7%), Luxembourg (+110.8%), and Hungary (+108.9%). Decreases were observed in Greece (−28.0%), Italy (−13.0%), Cyprus (−7.8%), and Spain (−2.5%). The pattern was different for rent. Comparing the second quarter of 2021 with 2010, prices increased in 25 EU member states and decreased in two, with the largest increases in Estonia (+142.4%), Lithuania (+109.1%), and Ireland (+65.6%). Decreases were recorded in Greece (-25.1%) and Cyprus (−3.3%). Table 13.3 analyzes the data in percentages of new home sales, used home sales, total sales, price/m2 , mortgages, price index, and household debt in Spain from 2017 to 2021. Only the key months are highlighted in color, with positive in green, negative in orange, and figures in red. This shows that the historical upturn in sales and purchases that took place in May 2021 was due to an exceptional and specific cause that broke the pattern of homogeneous growth. The end of the state of alarm and the reactivation of the activity of public and private institutions meant that in
155.71 109.92
192.71 135.44 152.50 204.32 99.85 118.87
116.39 112.05 153.44 108.34 106.41 122.35 155.97 91.33 130.20 166.82 190.90 130.61 148.60 202.98 95.60 116.69
Poland
Lithuania
Slovenia
Croatia
Bulgaria
Luxembourg
Spain
Malta
Latvia
Estonia
Slovakia
Germany (until 1990 former territory of the FRG)
Iceland
Cyprus
European Union—27 countries (from 2020)
174.48
134.84
92.36
163.89
123.11
109.17
114.66
118.30
120.54
93.57
205.74
154.60
138.99
197.43
179.94
138.89
93.84
167.71
124.73
109.86
112.05
157.19
117.02
119.79
121.66
94.34
210.58
158.30
142.13
203.11
180.08
143.75
93.23
171.19
126.64
113.07
112.30
158.87
120.31
121.70
134.22
153.70
123.37
96.67
212.52
159.60
147.78
212.80
181.42
137.37
94.33
178.02
128.10
116.10
113.47
163.01
124.66
123.73
140.87
156.50
125.17
96.97
217.02
162.40
148.53
200.47
177.10
140.14
94.37
185.60
126.72
118.20
115.66
166.56
127.17
126.67
142.05
159.10
126.98
92.31
221.03
167.40
150.78
205.13
183.05
142.59
95.55
190.88
131.19
117.45
115.74
167.27
129.78
129.79
142.77
163.20
128.72
96.63
225.80
172.10
152.44
212.85
184.10
146.11
94.79
199.75
133.48
120.35
118.11
173.81
131.07
132.35
145.81
167.50
130.87
91.07
230.85
173.80
150.66
226.81
186.65
143.70
95.22
208.60
137.72
121.48
121.74
182.52
133.66
137.65
148.19
175.40
(continued)
134.36
92.18
242.98
180.20
155.58
232.69
199.09
147.58
97.47
210.83
138.21
125.85
127.16
188.67
137.77
142.84
151.40
182.30
208.94
Netherlands
133.31
150.60
206.46
131.79
191.37
147.60
193.83
127.74
186.74
144.10
190.84
Portugal
183.52
Czechia
184.95
176.21
Hungary
182.09
2019Q1 2019Q2 2019Q3 2019Q4 2020Q1 2020Q2 2020Q3 2020Q4 2021Q1 2021Q2
GEO/TIME
Table 13.2 HPI House price index (2015 = 100)—quarterly data (07/10/2021). Number of values 21415
13 Real Estate Market: Smart Renaissance 225
83.90 –
159.36 114.24 114.46 121.35 100.30 232.51 108.83 127.98 155.43 133.72 110.43 82.70 –
Euro area (EA11-1999, EA12-2001, EA13-2007, EA15-2008)
Euro area—19 counties (from 2015)
Belgium
Romania
Turkey
France
Denmark
Sweden
United Kingdom
Finland
Italy
Source Eurostat
Switzerland
121.01
118.97
112.15
134.64
157.53
130.92
110.13
236.74
101.88
121.87
116.54
116.32
164.59
–
83.60
111.68
136.92
160.26
131.14
112.62
245.57
103.37
126.15
118.12
117.85
166.42
122.75
–
83.40
110.93
136.41
160.52
128.41
112.98
253.24
104.97
125.78
119.10
118.87
169.02
123.68
–
84.10
111.96
136.41
162.51
130.55
114.16
267.42
108.43
125.65
120.41
120.18
171.69
–
125.41
161.29
–
86.70
112.97
136.49
162.65
132.75
115.82
297.54
108.55
127.33
122.4
122.11
175.82
–
127.25
165.35
–
84.50
113.53
140.62
166.22
139.25
118.11
312.85
105.72
130.14
124.01
123.77
180.62
–
129.08
168.81
–
84.70
114.72
–
168.99
142.27
119.58
330.24
107.05
132.98
125.74
125.50
181.85
–
130.86
169.24
–
85.60
116.07
–
174.27
148.94
120.46
352.95
109.96
134.35
127.33
127.08
188.42
–
133.04
176.88
–
87.00
119.06
–
180.42
153.51
122.44
384.44
111.77
136.73
130.70
130.45
196.32
–
136.59
182.42
133.69
Austria
123.67
158.34
130.56
European Union—28 countries (2013–2020)
122.75
159.08
128.61
121.00
126.98
160.60
126.1
156.46
126.75
European Union (EU 6-1958, EU 9-1973, EU 10-1981, 118.97 EU 12-1986)
127.71
Norway
128.00
125.50
Ireland
126.18
2019Q1 2019Q2 2019Q3 2019Q4 2020Q1 2020Q2 2020Q3 2020Q4 2021Q1 2021Q2
GEO/TIME
Table 13.2 (continued)
226 G. Cantarero-García et al.
13 Real Estate Market: Smart Renaissance
227
Fig. 13.2 House prices and rent—Variations between 2010 y 2021Q2 (%) (Source Eurostat [prc_hpi_a]; [prc_hpi_q] [tipsho20]; [prc_hicp_aind]; [prc_hicp_midx])
just 12 months the issues that had been paralyzed before the pandemic (end of 2019) were reactivated, hastening the stagnant sale from the previous peak in January 2019 and even multiplied the 2019 rate by 10 (from 11.68 to 115.68%). The analyses and results presented here below in Figs. 13.3 and 13.4 (this last table is based on the previous one), predict a smooth growth line until mid-2022 (probably May) and from then the decline, which will be marked in 2023 until 2028. Surprisingly, it is appreciated that the growth angle (Fig. 13.3 below highlighted in green) had remained on the previous ascending line (Fig. 13.3 below highlighted in blue) despite the crisis generated by the 2020 COVID pandemic.
228
G. Cantarero-García et al.
Table 13.3 Data analysis in percentages of new, used, total home sales, price/m2 , mortgages, price index, and household debt in Spain from 2017 to 2021
Data Source epdata.es and (d.a): Author’s contribution of key dates in color
Fig. 13.3 Property sales and purchases chart in Spain from 2007 and the end of the Real Estate bubble until July 2021. The vertical graph shows the units of homes sold and the horizontal graph shows the time cycle. Key dates and crisis and growth lines highlighted by the research author (Graph source epdata.es and [d.a]: Author’s contribution of key dates in color)
13.6 Conclusions and New Research Lines It is practically unavoidable to look at the past and try to understand it and discard the unusable elements that have to meet new requests and demands by means of state-ofthe-art technologies. Owen’s own experience reveals the difficulty of implementing
13 Real Estate Market: Smart Renaissance
229
Fig. 13.4 Forecast based on previous Table 6 on the graph of housing sales and purchases in Spain since 2007 and the end of the Real Estate bubble until July 2021. Key dates in bottom line every 7 years according to the research author’s cycle hypothesis and future crisis and growth lines highlighted in color (Graph source epdata.es and [d.a]: Author’s contribution of key dates in color)
a theoretical model into an architectural and urban reality when in 1825 he implanted his ideal of a city in Harmony, Indiana. His initiative failed and the city plunged into poverty [7] and [8]. There are basic factors that determine that a city is smart insofar as it responds to the needs that are currently in demand. However, this premise is outdated and that, according to the timeless progress of technologies and networks, citizens’ understanding of the use of these technologies depends very much on the culture in which they live. What is called intelligent is thus inherent from the beginning, from the project and historical basis (political and social, but also geological and logical of the land and the city that hosts it. AENOR and the Ministry of Public Works and Transport are working on something that is lacking, which is an evaluation that assesses or rates intervention points, making it a coherent system for the Smart City concept. This is pointed out by Mr. Eduardo Gutiérrez, professor of Political Science and Administration II and representative of SESIAD-MINETAD in CTN 178 Smart Cities of UNE and Chairman of CTN 178/SC6 Government and Public Services 4.0 in the presentation at UCM Faculty of Law of Madrid in the Conference organized by Magdalena Suárez. The factors to be taken into account when preparing this audit are multiple and include the physical and natural environment, road and urban infrastructure networks, the socioeconomic aspect of the municipality or city, transportation, mobility and public safety, as well as the implementation of new technologies or ICTs and the control of energy demand and expenditure. Some of the solutions and recommendations reached in this Real Estate study and in relation to the ideal Smart City of the present are the following: . Society needs to enter into the current debate of working in multidisciplinary rather than non-multidisciplinary teams in order to investigate these concepts and offer an answer to present cities that will be useful for the city of the future. Actions from the university should be the modification of current urban planning curricula
230
.
.
. .
.
.
G. Cantarero-García et al.
as an undergraduate or graduate degree, the creation of practical multidisciplinary teams from the university environment, and the study of the application of applied emotional and artificial intelligences. The preparation of the university student, not only the architect, to be prepared to understand the humanistic and technical multidisciplinary of economics, history, sociology, anthropology, law, politics, topography, environment, sustainability, construction, and urban planning. The transformation of public and private markets towards the understanding of a single objective that favors the final consumer who is ultimately the human being (who is neither public nor private, but a person with rights of freedom of choice acquired from birth). Technology at the service of the human being and not the other way around, since virtual dependency means that the relationship with the real context is shifting to a different paradigm that escapes our understanding. Focus on markets related to health and improvement of the quality of life of the elderly as the rapid aging of the population is eminent in the northern hemisphere. Immigration, poverty rates, needs of the youth and of people with physical and intellectual disabilities may also provide insights for new research lines in Real Estate markets. Land policies have encouraged excessive construction as well as tighter restrictions on developers’ freedom or restriction on action. These policies that limited the price of public subsidized housing and state subsidized housing had an impact on the increase in the price of the public subsidized, low-cost housing. This led to excessive speculation between 2000 and 2007, which ended in the sector’s bankruptcy. The transfer of land for public use and the construction of infrastructure by the developer further motivated the increase in the price of public subsidized, low-cost housing. The debt that citizens incurred in those years had an impact on the last 14 years, with recovery being very slow and the crisis still being felt. Schools of Architecture in 2021 have experienced an increase in applications. This is because there have been two, 7-year cycles in decline, resulting in a 20% reduction in the number of students in 14 years. This is considered to be a key moment to focus on the training of an architect who is aware of Smart Cities, accessibility, and sustainability in order to be able to develop his or her work on both the national and international scene.
The preparation of a person as a citizen to face a new crisis that is yet to come and that will last another seven years (from 2022 to 2028). The Spanish building crisis of 2007 was a faithful reflection of what happened throughout the whole European continent. The analyses and results presented here predict a smooth growth line until mid-2022 (probably May) and from then the decline, which will be marked in 2023 until 2028. Cross-referencing this data with Henry George’s theory shows that a good time to invest in the Real Estate market as physical entities was in the recovery period from January 2018 to May 2019, as it
13 Real Estate Market: Smart Renaissance
231
will also be a good time to invest between the years 2029 to 2030. The hypothesis put forward in this study regarding seven-year cycles leads one to envision a positive upturn starting from 2029 to 2036 and so on.
References 1. (2015) Being young in Europe today, Eurostat compact guides. In: Eurostat (ed) Luxemburg. ISBN 978-92-79-43243-9. https://doi.org/10.2785/59267 2. (2015) Regional estimates of poverty indicators based on a calibration technique, Eurostat compact guides. In: Eurostat (ed) Luxemburg. ISBN 978-92-79-47461-3. https://doi.org/10. 2785/879307 3. (2015) Migrant integration statistics, Eurostat Compact Guides. In: Eurostat (ed) Luxemburg. ISBN 978-92-79-36625-3. https://doi.org/10.2785/52263 4. (2015) Employment for disabled people. In: Eurostat (ed) Luxemburg. ISBN 978-92-79-401794. https://doi.org/10.2785/56001 5. Cantarero-García G (2018) Reflexiones urbanísticas. Referencias del pasado y situación actual de Madrid como ciudad inteligente potencial. In: Tirant lo Blanch (ed) VVAA: Gestión inteligente y sostenible de las ciudades, gobernanza, smart cities y turismo. Valencia, pp 101–125 6. Benévolo L (1974) Historia de la Arquitectura moderna, History of Modern Architecture, Ed. Gustavo Gili, Barcelona, p 63, fig 68, p 86 7. Cantarero-García G (2020) Intelligence applied to smart cities through architecture and urbanism: reflections on multiple and Artificial Intelligences, Chapter 8. In: IGI GLOBAL (ed) Social, legal, and ethical implications of IoT, Cloud, and Edge Computing Technologies, Gianluca Cornetta (Dir.), Abdellah Touhafi and Gabriel-Miro Muntean, ISBN 13: 9781799838173 8. Goleman (1995) Emotional intelligence. Bantam Books, New York, NY 9. Piñar Mañas JL (Dir.), Suárez M (Coord.), Cantarero G, Cantó T, Martínez R, Navarro N (2016) Smart Cities derecho y técnica para una ciudad más habitable, Smart Cities Law and Technique for a More Livable City. In: Editorial Reus (ed) Madrid. ISBN: 978-84-290-1985-8 10. Cantarero-García G (2021) Integration of Tellurism and Sacred Geometry in Professional Training: Innovation, Healthy Architecture & Landscape. In: Gonzalez Lezcano Roberto (ed), Health and well-being considerations in the design of indoor environments, IGI GLOBAL. https://doi.org/10.4018/978-1-7998-7279-5.ch010 11. Fuentes-Lojo A (2019) La compraventa inmobiliaria, The Real Estate Sale. In: Bosch (ed) ISBN 978-84-9090-366-7 12. Franchini T (Dir.) y Raventós T (Coord.) Temas de planeamiento urbano, Urban Planning Issues. In: CEU Ediciones, Madrid