Neopterin: Biochemistry - Methods - Clinical Application 9783110852783, 9783110117905
244 52 17MB
English Pages 307 [308] Year 1991
1 Pteridines
1.1 Historical remarks
1.2 Occurrence
1.3 Biosynthesis
1.4 Biochemical functions
References
2 Neopterin
2.1 Chemical characteristics
2.2 Catabolism
2.3 Biochemical and physiological relevance
References
3 Measurement of Neopterin
3.1 Historical remarks
3.2 Measurement by reversed phase HPLC without pretreatment of samples
3.3 Measurement of neopterin by reversed phase HPLC with on-line deproteinization
3.4 Measurement of neopterin by immunoassays
References
4 Normal Ranges of Neopterin Concentrations in Various Body Fluids
4.1 Normal ranges of neopterin concentrations in urine
4.2 Normal ranges of neopterin concentrations in serum
4.3 Normal ranges of neopterin concentrations in cerebrospinal fluid
4.4 Normal ranges of neopterin concentrations in synovial fluid
4.5 Normal ranges of neopterin concentrations in saliva
4.6 Discussion
References
5 Biosynthesis of Pteridines and the Human Immune System
5.1 Immunological activation and cytokines
5.2 Cytokines and pteridine biosynthesis
5.3 Inducers of pteridine synthesis in human cells
5.4 Cell culture techniques
5.5 Determination of pteridines in cell homogenates and supernatants
5.6 Enzyme activities of pteridine synthesis in cell extracts
5.7 Biological significance of cytokine-induced pteridine synthesis
References
6 Neopterin in Organ Transplantation
6.1 Renal transplantation
6.2 Transplantation of solid organs other than kidney
6.3 Transplantation of bone marrow
References
7 Neopterin in Autoimmune Diseases and Related Inflammatory Disorders
7.1 Neopterin in rheumatoid arthritis
7.2 Neopterin in inflammatory bowel diseases
7.3 Neopterin in autoimmune diabetes
7.4 Neopterin in autoimmune diseases of the thyroid
7.5 Neopterin in systemic lupus erythematosus
7.6 Neopterin in multiple sclerosis
7.7 Neopterin in sarcoidosis
7.8 Neopterin in celiac disease
References
8 Neopterin in Malignant Diseases
8.1 Hematological malignancies
8.2 Gynecological malignancies
8.3 Malignancies of the urogenital tract
8.4 Lung cancer
8.5 Gastrointestinal, pancreatic and hepatic cancer
8.6 Breast cancer
8.7 Cancers of the head and neck region
8.8 Malignant melanoma
8.9 Neopterin in malignant diseases - a summary
References
9 Neopterin in Infectious Diseases
9.1 Infections by viruses
9.2 Neopterin during infection by human immunodeficiency virus type 1 (HIV-1) and the acquired immunodeficiency syndrome (AIDS)
9.3 Infections by intracellular protozoa
9.4 Infections by bacteria
9.5 Neopterin during sepsis and trauma
References
10 Monitoring of Immunostimulatory Therapy
References
11 Neopterin in Transfusion Medicine
References
Appendix
References
Subject Index
Recommend Papers


![Blackwell's underground clinical vignettes. Biochemistry [3rd ed]
0632045450, 9780632045457](https://ebin.pub/img/200x200/blackwells-underground-clinical-vignettes-biochemistry-3rd-ed-0632045450-9780632045457.jpg)
![Clinical Biochemistry Made Ridiculously Simple [1 ed.]
0940780305, 9780940780309](https://ebin.pub/img/200x200/clinical-biochemistry-made-ridiculously-simple-1nbsped-0940780305-9780940780309.jpg)


File loading please wait...
Citation preview
Neopterin
H. Wächter D. Fuchs, A. Hausen, G. Reibnegger, G. Weiss, E. R. Werner, G. Werner-Felmayer
Neopterin Biochemistry - Methods Clinical Application Foreword by A. Butenandt and H. Rembold
W DE
G Walter de Gruyter Berlin · New York 1992
Autors Univ.-Prof. Dr. Dr. h. c. Helmut Wächter Univ.-Doz. Dr. Dietmar Fuchs Univ.-Prof. Dr. Arno Hausen Univ.-Doz. Dr. Gilbert Reibnegger Dr. Günter Weiss Univ.-Doz. Dr. Ernst R. Werner Dr. Gabriele Werner-Felmayer Institut für Medizinische Chemie und Biochemie Universität Innsbruck A-6010 Innsbruck. With 161 Figures and 26 Tables
Library of Congress Cataloging-in-Publication Data Neopterin: biochemistry, methods, clinical application/H. Wächter . . . [et al.]: foreword by A. Butenandt and H. Rembold. Includes bibliographical references and index. ISBN 3-11-0011790-8 (alk. paper) ISBN 0-89925-509-4 (alk. paper) 1. Neopterin-Physiological effect. 2. Neopterin-Immunology 3. Neopterin-Analysis. 4. Neopterin-Diagnostic use. 5. Biochemical markers. I. Wächter, H. (Helmut), 1929[DNLM: 1. Biopterin-analogs & derivatives. 2. Biopterin-physiology. QU 188 N438] QP801.N44N46 1991 612'.0157~dc20 91-34543 DNLM/DLC CIP
Die Deutsche Bibliothek - Cataloging-in-Publication Data Neopterin: biochemistry - methods - clinical application/ H. Wächter and . . . Foreword by A. Butenandt and H. Rembold. Berlin: de Gruyter, 1991 ISBN 3-11-011790-8 NE: Wächter, Helmut Θ Printed on acid free paper Copyright © 1991 by Walter de Gruyter & Co., D-1000 Berlin 30. All rights reserved, including those of translation into foreign languages. No part of this book may be reproduced in any form - by photoprint, microfilm, or any other means nor transmitted nor translated into a machine language without written permission from the publisher. Typesetting: Dörlemann-Satz, Lemförde. - Printing: Gerike GmbH, Berlin. - Binding: D. Mikolai, Berlin. - Printed in Germany.
Foreword
The history of pteridine biochemistry reflects the history of biochemistry in general, extending from classical bioorganic chemistry through their function as enzyme cofactors into the present field of acting as signals within immunological networks. After establishment of the xanthopterin, isoxanthopterin, and leucopterin structures by Purrmann in 1941, these nitrogen-rich heterocycles were treated as obscure wing pigments present in some butterflies or as end products originating from a sideway of purin or of folic acid catabolism. They were mentioned in the chapter of descriptive biochemistry textbooks as a sort of curiosity. It took more fourteen years, till Patterson et al. published, in 1955, the isolation of a very specific and potent growth factor for the flagellate, Crithidia fasciculata, from human urine, and the structural elucidation of what they named biopterin. Using a biopterin-free diet and germfree rats, we proved in 1963, that this growth factor was no vitamin for the mammal. It was Kaufman who in the same year demonstrated its cofactor function: biopterin came out, in its reduced form, as the natural cofactor of phenylalanine hydroxylase. With this proof pterins became, at the level of classical dynamic biochemistry, a curiosity for the understanding of atypical phenylketonuria. Our own demonstration in 1972, that reduced pterins and especially biopterin are possibly involved in cellular electron transfer, still remains obscure. It was in 1963 when we isolated, from royal jelly and honey bee pupae, another polyhydroxyalkyl pterin which obviously was a biopterin precursor from the guanosine pathway and which, after some discussions, we named as neopterin. This pterin was in the bee associated with biopterin at a constant ratio. However, neither biopterin nor neopterin came out to be the vitamin which could explain honey bee queen establishment. It again took quite some time till the first author of this book came to Martinsried with a uv-spectrum which finally proved to be neopterin and which became of ever increasing interest as a marker for activation of the human immune system. With this background we now begin to open a new chapter in the understanding of pteridines: they seem to be members of a universal class of signals in the field of biosemiotics, the understanding of which is just at its beginning. May this laboratory manual not only be of practical use in medicine but also help to raise an increasing interest in the upcoming field of studies on signal- mediated biological networks. Adolf Butenandt
Heinz Rembold
Preface
The discovery of strongly fluorescing compounds in urine specimens from patients with malignant diseases in our laboratory in 1969, paved the way to recognize in the early 1980's that neopterin, a small heterocyclic molecule belonging to the class of pteridines, is synthesized and released by human monocytes/ macrophages after stimulation by interferon gamma. Then, its quantitation in various body fluids has been proposed as a sensitive in v/vo-marker for the activation of the cellular immune system in diverse fields of clinical medicine. Numerous investigations by different research teams in different countries have confirmed this expectation. Today, neopterin determination gains growing importance within the repertoire of laboratory methods: it provides information on the activation state of the cellular immune system in vivo, and research in quite different clinical settings has demonstrated neopterin concentrations very often to carry predictive significance for the course of diseases. The determination of neopterin concentrations in biological fluids has been demonstrated to be of use in medical disciplines as diverse as oncology, infectiology, transplantation medicine, autoimmunology and transfusion medicine. Concomitantly, great efforts have been made to inquire into the biochemical fundamentals of enhanced neopterin biosynthesis. The question why the human macrophage synthesizes so much larger amounts of neopterin than other cells, remains an enigma teleologically. However, details of the regulation of pteridine biosynthesis have been elucidated during recent years in sufficient detail to understand at least mechanistically the varying ratio between neopterin and other pterin derivatives synthesized by different cells under different conditions. Moreover, these investigations have revealed relationships between pteridine metabolism and other biochemical pathways such as tryptophan catabolism and biosynthesis of nitric oxides from arginine. These relationships are far from being understood in all detail and appear to have great potential for future research. We felt that at this stage it might be useful to present the various facettes of knowledge on neopterin as an immunological activation marker in a monograph. This volume contains a collection of chapters dealing with various aspects of neopterin. These cover fundamentals of cytokine-induced pteridine biosynthesis in different human and non-human cells and cell lines, and methodological issues of determination of neopterin and related compounds in supernatants of cell culture systems and in cellular extracts, and also in various body fluids in research and routine laboratory settings. The main part of the exposition is devoted to describe, in sufficient detail, clinically oriented topics concerning behavior and diagnostic interpretation of neopterin data in different pathological situations, ordered by disease classification.
Vili
Preface
The book is intended to provide a compendium of important procedures and observations. Whereas also most recent scientific literature was incorporated to make the presentation as timely as possible, no attempt was made to cover all articles having been published on a topic. Papers were selected for inclusion if they seemed to enlighten aspects making the stream of exposition particularly compelling; exclusion of a paper by no means intends to indicate unimportance of that work per se. Pteridines comprise a group of substances with fascinating chemical peculiarities, and their ubiquitous occurrence in practically all living cells contrasts sharply with the relative scarceness of firmly established biochemical knowledge. We are confident that pteridines deserve more attention from biochemical and medical researchers, and we hope that this volume might contribute to this aim. Innsbruck, April 1991
H. Wächter · D. Fuchs · Α. Hausen G.Reibnegger · G. Weiss E. R. Werner · G. Werner-Felmayer
Contents
1 Pteridines 1.1 Historical remarks 1.2 Occurrence 1.3 Biosynthesis 1.4 Biochemical functions 1.4.1 Conjugated pteridines 1.4.2 Unconjugated pteridines References
1 2 2 3 4 4 4 5
2 Neopterin 2.1 Chemical characteristics 2.2 Catabolism 2.3 Biochemical and physiological relevance References
7 7 8 9 9
3 Measurement of Neopterin 3.1 Historical remarks 3.2 Measurement by reversed phase HPLC without pretreatment of samples 3.2.1 Principle 3.2.2 Collection of samples 3.2.3 Preparation of standard solutions 3.2.4 Procedure 3.2.5 Performance characteristics 3.3 Measurement of neopterin by reversed phase HPLC with on-line deproteinization 3.3.1 Principle 3.3.2 Apparatus 3.3.3 Collection of samples and preparation of standard solutions 3.3.4 Procedure 3.3.5 Performance characteristics 3.4 Measurement of neopterin by immunoassays 3.4.1 Principle 3.4.2 Procedure 3.4.3 Performance characteristics. Comparison with HPLC References
13 13 14 14 14 15 15 17 17 17 18 19 19 21 22 22 22 23 23
X
Contents
4 Normal Ranges of Neopterin Concentrations in Various Body Fluids . . 4.1 Normal ranges of neopterin concentrations in urine 4.2 Normal ranges of neopterin concentrations in serum 4.3 Normal ranges of neopterin concentrations in cerebrospinal fluid . . 4.4 Normal ranges of neopterin concentrations in synovial fluid 4.5 Normal ranges of neopterin concentrations in saliva 4.6 Discussion References
25 26 28 29 30 31 31 31
5 Biosynthesis of Pteridines and the Human Immune System 5.1 Immunological activation and cytokines 5.2 Cytokines and pteridine biosynthesis 5.3 Inducers of pteridine synthesis in human cells 5.4 Cell culture techniques 5.4.1 Purification of human monocytes/macrophages from peripheral blood 5.4.2 Cultivation of peripheral blood mononuclear cells 5.4.3 Cultivation of cell lines 5.5 Determination of pteridines in cell homogenates and supernatants 5.5.1 Determination of neopterin in supernatants of macrophages or THP-1 cells to assess pteridine synthesis-activation potential of cytokines 5.5.2 Determination of intracellular levels of pteridines in cultured cells 5.6 Enzyme activities of pteridine synthesis in cell extracts 5.7 Biological significance of cytokine-induced pteridine synthesis References
33 33 34 38 40
6 Neopterin in Organ Transplantation 6.1 Renal transplantation 6.1.1 Neopterin concentrations in urine 6.1.2 Neopterin concentrations in serum and plasma 6.2 Transplantation of solid organs other than kidney 6.2.1 Neopterin in liver transplantation 6.2.2 Neopterin in heart transplantation 6.2.3 Neopterin in pancreas transplantation 6.3 Transplantation of bone marrow 6.3.1 Neopterin concentrations during the phase of bone marrow aplasia until engraftment 6.3.2 Neopterin concentrations and immunological complications after bone marrow transplantation References
40 44 44 44
45 45 46 48 52 55 56 56 66 68 69 70 72 72 73 74 74
Contents
XI
7 Neopterin in Autoimmune Diseases and Related Inflammatory Disorders 77 7.1 Neopterin in rheumatoid arthritis 78 7.1.1 Neopterin concentrations in urine of patients with rheumatoid arthritis versus osteoarthritis 79 7.1.2 Neopterin concentrations in relation to stage and extent of rheumatoid arthritis 80 7.1.3 Neopterin concentrations in relation to clinical activity of rheumatoid arthritis 80 7.1.4 Neopterin and other laboratory variables for assessment of clinical activity in rheumatoid arthritis - linear discriminant analysis 82 7.1.5 Neopterin in urine and C-reactive protein for assessment of clinical activity in rheumatoid arthritis: generalized likelihood ratio model 84 7.1.6 Neopterin concentrations in other biological fluids from patients with rheumatoid arthritis 85 7.2 Neopterin in inflammatory bowel diseases 87 7.2.1 Neopterin and its value in assessment of clinical activity of Crohn 's disease 88 7.2.2 Neopterin as marker of clinical activity in juvenile Crohn's disease 91 7.2.3 Neopterin as marker of clinical activity in patients with ulcerative colitis 92 7.2.4 Neopterin and cellular or soluble markers of Τ lymphocyte activation in patients with inflammatory bowel disease 93 7.3 Neopterin in autoimmune diabetes 95 7.4 Neopterin in autoimmune diseases of the thyroid 97 7.5 Neopterin in systemic lupus erythematosus 97 7.6 Neopterin in multiple sclerosis 99 7.7 Neopterin in sarcoidosis 101 7.8 Neopterin in celiac disease 104 References 105 8 Neopterin in Malignant Diseases 8.1 Hematological malignancies 8.1.1 Neopterin as an aid in diagnosis 8.1.2 Neopterin as a predictive marker 8.1.3 Neopterin and its correlation with interferon gamma and hemoglobin in hematological neoplasia 8.2 Gynecological malignancies 8.2.1 Neopterin in carcinoma of the uterine cervix 8.2.2 Neopterin in ovarian cancer 8.2.3 Neopterin in women with uterine sarcomas
109 110 110 114 116 117 117 127 140
XII
Contents
8.3 Malignancies of the urogenital tract 8.3.1 Neopterin concentrations in various types of genitourinary tract malignancies 8.3.2 Neopterin and prognosis in prostatic carcinoma 8.4 Lung cancer 8.4.1 Neopterin concentrations in patients with various types of lung cancer 8.4.2 Neopterin and prognosis of lung cancer 8.5 Gastrointestinal, pancreatic and hepatic cancer 8.5.1 Neopterin concentrations in patients with various gastrointestinal and with pancreatic tumors 8.5.2 Neopterin values in gastrointestinal and pancreatic carcinomas after surgical therapy 8.5.3 Neopterin and prognosis of hepatocellular carcinoma 8.6 Breast cancer 8.7 Cancers of the head and neck region 8.8 Malignant melanoma 8.9 Neopterin in malignant diseases - a summary References 9 Neopterin in Infectious Diseases 9.1 Infections by viruses 9.1.1 Neopterin concentrations in viral liver disease 9.1.2 Neopterin concentrations in other viral diseases 9.1.3 Neopterin and vaccination 9.2 Neopterin during infection by human immunodeficiency virus type 1 (HIV-1) and the acquired immunodeficiency syndrome (AIDS) 9.2.1 HIV-1 and the human immune system 9.2.2 Neopterin in HIV-1 infection - early results 9.2.3 Neopterin and the early phase of infection - an animal model 9.2.4 Neopterin concentrations in HIV-1 antibody negative and positive members of groups being at increased risk of contracting AIDS 9.2.5 Neopterin and its correlation with Τ cell subset data in HIV-1 related disease 9.2.6 Neopterin as a predictive marker for the course of HIV-1 disease 9.2.7 Neopterin and endogenous production of interferon gamma in patients infected with HIV-1 9.2.8 Neopterin in the central nervous system of patients with neurologic/psychiatric disorders related to HIV-1 disease
144 144 146 148 148 151 155 155 158 158 161 163 163 164 165 169 170 170 180 184
186 187 188 192
195 201 211 225 229
Contents
9.3 Infections by intracellular protozoa 9.3.1 Neopterin in malaria 9.3.2 Neopterin in human schistosomiasis mansoni 9.4 Infections by bacteria 9.4.1 Neopterin in lung tuberculosis 9.4.2 Neopterin in leprosy 9.4.3 Neopterin in melioidosis 9.4.4 Neopterin in Lyme neuroborreliosis 9.4.5 Neopterin and the differential diagnosis of bacterial and viral infections 9.5 Neopterin during sepsis and trauma References
XIII
237 237 244 247 247 248 249 251 252 254 257
10 Monitoring of Immunostimulatory Therapy References
265 272
11 Neopterin in Transfusion Medicine References
275 280
Appendix References Subject Index
281 285 287
1 Pteridines The term »pteridines«, coined for a class of at that time unidentified pigments from wings of lepidoptera, originates from the Greek name for wing, pteron ( Wieland and Schöpf, 1925; Schöpf and Becker, 1936). Today it designates the bicyclic nitrogenous ring system pyrazino-(2,3-d)-pyrimidine which is formally derived from a pyrazine fused with a pyrimidine. Derivatives of this parent compound bearing small substituents such as neopterin and biopterin are termed »unconjugated pteridines«, derivatives with larger residues, e.g., folic acid, riboflavin and methanopterin, are named »conjugated pteridines«. Pteridines are classified as pterins (derivatives of 2-amino-4-oxo-3,4-dihydropteridine) and lumazines (derivatives of 2,4-dioxo-l,2,3,4-tetrahydropteridine) (Pfleiderer, 1964).
Pteridine
o
o
H Pterin
Lumazine
o NH—( Gil! n) = l t o
unconjugated
pteridine:
Neopterin Figure 1.1:
conjugated
8
pteridine:
Folic acid
Chemical structures o f pteridines.
In nature, pteridines occur in different oxidation states: fully oxidized (aromatic) pterins, 7,8-dihydropterins and quinonoid 5,8-dihydropterins, and 5,6,7,8-tetrahydropterins.
2
1 Pteridines
1.1 Historical remarks Pteridines were isolated from wings of butterflies (Hopkins, 1889). Despite longstanding investigations on their nature, elucidation of the structure of these pigments was achieved only after several decades (Purrmanrt, 1941). He showed that the insect pigments, xanthopterin, isoxanthopterin and leukopterin, contain the pteridine moiety. Stokstad at the Lederle Laboratories was the pioneer to isolate folic acid. This work led to the resolvement of the structure and to the synthesis of this vitamin (Angier et al, 1945). Biopterin was identified in human urine (Patterson et al., 1956), neopterin in bees (Rembold and Buschmann, 1963). Neopterin was then isolated from human urine (Sakurai and Goto, 1967). Kaufman showed for the first time that an unconjugated pterin is metabolically active: 5,6,7,8-tetrahydrobiopterin serves as the cofactor for aromatic amino acid monoxygenases (.Kaufman, 1963). A further pterin, molybdenum cofactor, was found in molybdenum containing enzymes such as nitrate reductase, sulfite oxidase, xanthine oxidase, aldehyde oxidase and formate dehydrogenase. Due to the extreme lability of the cofactors, only their oxidized forms were isolated and characterized as pteridines (Johnson et al., 1984). Albert suggested that the biosynthesis of pteridines may start from purines (Albert, 1957). Indeed, guanosine triphosphate (GTP) was converted into pteridines in a cell free enzymic system (Reynolds and Brown, 1964). GTP is considered to be the precursor of natural pteridines including folic acid, riboflavine, methanopterin and unconjugated peridines.
1.2 Occurrence Unconjugated pteridines, for instance xanthopterin, isoxanthopterin and leukopterin, are found in high concentrations as pigments of insects, amphibia, reptiles and fish {Blakley, 1969; Ziegler and Harmsen, 1969; Forrest and VanBaalen, 1970). They occur, however, ubiquitously, albeit in very small amounts, in many living cells (Iwai et al., 1970; Rembold and Gyure, 1972; Wächter et al., 1980; Gerisch et al., 1982; Loidl et al., 1982).
3
1.3 Biosynthesis
1.3 Biosynthesis The biosynthesis of pteridines starts from GTP {Brown, 1971). The first step is catalysed by the enzyme GTP cyclohydrolase I which cleaves the imidazole ring of the purine. Then, the C-8 of the starting compound is removed as formate, and the ribosityl residue is converted to a 1-deoxypentulose by Amadori rearrangement. As first isolable intermediate, 7,8-dihydroneopterin triphosphate is produced by forming the pyrazine ring. This intermediate is the key precursor in the biosynthesis of folate, riboflavine, methanopterin, tetrahydrobiopterin and neopterin. A simplified scheme of the biosynthetic pathway leading to tetrahydrobiopterin is shown in Figure 1.2.
Guanosine-5"-triphosphate (GTP) J
Λ
HoN'
G T P cyclohydrolase I
II J^
I Λ
phosphatases 7,8-dihydroneopterin
Η
Τ f< R
7,8-dihydroneopterintriphosphate
6-pyruvoyl-tetrahydropterin
synthase
sepiapterin reductase
5,6,7,8-tetrahydrobiopterin
Figure 1.2:
Simplified scheme of pteridine biosynthesis from guanosine triphosphate.
The ability to synthesize folates has been lost by vertebrates and several other organisms during evolution but they have retained the biosynthetic capability for pterins, such as tetrahydrobiopterin, neopterin and molybdopterin.
4
1 Pteridines
1.4 Biochemical functions 1.4.1 Conjugated pteridines Tetrahydrofolate cofactors play a significant role in thymine synthesis and in the trànsfer of one-carbon groups in various reactions in purine, pyrimidine and amino acid metabolism (Stokstad and Koch, 1967). A cofactor being structurally related to folic acid is found in methanogenic bacteria and is referred to as methanopterin. It is involved in the reduction of carbon dioxide to methane. The structure of methanopterin has been elucidated only recently ( VanBeelen et al., 1984).
1.4.2 Unconjugated pteridines Several biological functions of unconjugated pteridines are known. The trypanosomid parasite of moscitos Crithidia fasciculata requires biopterin as growth factor CBroquist et al., 1955). 5,6,7,8-Tetrahydrobiopterin functions as cofactor for mammalian aromatic amino acid monooxygenases (Kaufman, 1963), oxidative cleavage of etherlipids (Tietz et al., 1964), and the conversion of arginine to citrulline and nitric oxide ( Tayeh and Marietta, 1989; Kwon et al., 1989). Aromatic aminoacid monooxygenases are involved in hydroxylation of phenylalanine, tyrosine and tryptophan. Thereby, they control biosynthesis of the neurotransmitters dopamine, norepinephrine and serotonin. Lacking biosynthesis of tetrahydrobiopterin causes severe neurological illness by accumulation of phenylalanine and deficient production of neurotransmitters. Insufficient availability of tetrahydrobiopterin is responsible for the atypical variants of phenylketonuria. Phenylketonuria is a genetic defect caused by either a defect of the phenylalanine hydroxylase apoenzyme (classical form) or of the tetrahydrobiopterin cofactor (atypical form, tetrahydrobiopterin deficiency). Phenylketonuria is diagnosed by screening at birth for abnormally high concentrations of phenylalanine in blood. In case of tetrahydrobiopterin deficiency, a comparatively small oral dose of tetrahydrobiopterin leads to a decrease of serum phenylalanine concentrations. This defect of the cofactor is responsible for about 1-3% of phenylketonuria patients {Danks et al., 1976). Depending on the defect leading to decreased production of tetrahydrobiopterin, altered pteridine concentrations in body fluids can be used to further characterize atypical phenylketonuria. Biopterin levels are elevated when dihydropteridine reductase deficiency leads to low availability of tetrahydrobiopterin ( Watson et al., 1977; Curtius et al., 1979; Niederwieser et al., 1984; Niederwieser et al., 1985). The most frequent defect is low or lacking activity of 6-pyruvoyltetrahydropterin synthase. This enzyme eliminates the triphosphate
1.4 Biochemical functions
5
group from dihydroneopterin triphosphate. In this defect, called dihydropteridine synthase deficiency, the concentrations of biopterin are low; levels of neopterin, dihydroneopterin and 3'-hydroxysepiapterin are high. Concentrations of all pteridines are low in case of GTP cyclohydrolase I deficiency. Molybdopterin is part of the molybdenum cofactor. This cofactor plays an important role in molybdenum containing enzymes, e.g. sulfite oxidase, xanthine oxidase and nitrate reductase. In humans, the excretion product of the molybdenum cofactor is urothione, a sulfur containing pterin the structure of which has been elucidated (Goto et al., 1969). The synthesis of the molybdenum cofactor is impaired in patients with an inborn metabolic error. These patients suffer from a combined defect of sulfite oxidase and xanthine oxidase.
References Albert A: Transformation of purines into pteridines. Biochem J 1957; 65: 5310-5314. Angier RB, Booth JH, Hutchings BL, Mowat JH, Semb J, Stokstadt ELR, Subbarow, Y, Waller CW, Cosulich DB, Fahrenback MJ, Hultquist ME, Kuh E, Northey EH, Selgar DR, Sickels JP, Smith JM: Synthesis of compound identical with L. casei factor isolated from liver. Science 1945; 102: 227-228. Blakley RL: Natural occurrence of pterins and folate derivatives. In: The Biochemistry of Folic Acid and Related Pteridines (Pfleiderer W, Taylor EC, eds.) North-Holland Publications, Amsterdam, 1969, pp 8-57. Broquist HP, Albrecht AM: Pteridines and the nutrition of the protozoan Crithidia fasciculata. Proc Soc Biol Med 1955; 89: 178-180. Brown GM: The biosynthesis of pteridines. Adv Enzymol 1971; 35: 5-77. Curtius Η-C, Niederwieser A, Viscontini M, Otten A, Schaub J, Scheibenreiter S, Schmidt H: Atypical phenylketonuria due to tetrahydrobiopterin deficiency. Diagnosis and treatment with tetrahydrobiopterin, dihydrobiopterin and sepiapterin. Clin Chim Acta 1979; 93:251262.
Danks DM, Cotton RGH, Schlesinger Ρ: Variant forms ofphenylketonuria. Lancet 1976; 1: 1236-1237. Forrest H, VanBaalen C: Microbiology of unconjugated pteridines. Annu Rev Microbiol 1970; 24: 91-108. Gerisch G, Blank G, Schweiger M, Fuchs D, Hausen A, Reibnegger G, Wächter H: Pteridines released from Dictyostelium discoideum cells into the extracellular medium. In: Biochemical and Clinical Aspects of Pteridines (Wächter H, Curtius Η-C, Pfleiderer W, eds) Walter de Gruyter, Berlin - New York, 1982, vol 1, pp 253-256. Goto M, Sakurai A, Ohta K, Yamakami H: The structure of urothione. J Biochem (Tokyo) 1969; 65: 611-620. Hopkins FG: Note on a yellow pigment in butterflies. Nature 1889; 40: 335. Iwai K, Kobashi M, Fujisawa H: The pteridines produced by Serratia indica. In: Chemistry and Biology of Pteridines (Iwai K, Akino M, Goto M, Iwanami Y, eds) Int Academic Printing Co Ltd, Tokyo, 1970, pp 199-207. Johnson JL, Hainline BE, Rajagopalan KV, Arison BH: The pterin component of the molybdenum cofactor. J Biol Chem 1984; 259: 5414-5422.
6
1 Pteridines
Kaufman S: The structure ofphenylalanine hydroxylation cofactor. Proc Natl Acad Sci USA 1963; 50: 1085-1093. Kwon NS, Nathan CF, Stuehr DJ: Reduced biopterin as cofactor in the generation of nitrogen oxides by murine macrophages. J Biol Chem 1989; 264: 20496-20501. Loidl P, Fuchs D, Gröbner Ρ, Hausen A, Reibnegger G, Wächter H: Pteridines during growth and differentiation of Physarum polycephalum. In: Biochemical and Clinical Aspects of Pteridines (Wächter H, Curtius Η-C, Pfleiderer W, eds) Walter de Gruyter, Berlin - New York, 1982, vol /, pp 257-266. Niederwieser A, Blau Ν, Wang M, Joller Ρ, Atares Μ, Gardesa-Garcia J: GTPcyclohydrolase I deficiency, anew enzyme defect causing hyperphenylalaninaemia with neopterin, biopterin, dopamine, and serotonin deficiencies and muscular hypotonia. Eur J Pediatr 1984; 141: 208-214. Niederwieser A, Leimbacher W, Curtius Η-C, Ponzone A, Rey F, Leupold D: Atypical phenylketonuria with »dihydrobiopterin synthetase« deficiency: absence of phosphate-eliminating enzyme activity demonstrated in liver. Eur J Pediatr 1985; 144: 13-16. Patterson EL, Saltza MH, Stokstad ELR: The isolation and characterization of a pteridine required for the growth of Chrithidia fasciculata. J Am Chem Soc 1956; 78: 5871-5873. Pfleiderer W: Recent developments in the chemistry of pteridines. Angew Chem Int Ed 1964; 3: 114-132. Purrmann R: Konstitution und Synthese des sogenannten Anhydroleukopterins. Justus Liebigs Ann Chem 1941; 548: 284-292. Rembold H, Buschmann L: Struktur und Synthese des Neopterins. Chem Ber 1963; 96: 1406-1410. Rembold H, Gyure WL: Biochemistry of pteridines. Angew Chem Int Ed 1972; 11: 10611072. Reynolds JJ, Brown GM: The biosynthesis of folic acid. J Biol Chem 1964; 239: 317-325. Sakurai A, Goto M: Neopterin: isolation from human urine. J Biochem (Tokyo) 1967; 61: 142-145. Schöpf C, Becker E: Über neue Pterine. Justus Liebigs Ann Chem 1936; 524: 49-144. Stokstad ELR, Koch J: Folic acid metabolism. Physiol Rev 1967; 47: 83-116. Tayeh MA, Marietta MA: Macrophage oxidation of L-arginine to nitric oxide, nitrite, and nitrate. J Biol Chem 1989; 264: 19654-19658. Tietz A, Lindberg M, Kennedy EP: A new pteridine-requiring enzyme systemfor the oxidation of glyceryl ethers. J Biol Chem 1964; 239: 4081-4090. VanBeelen P, Stassen APM, Bosch JWG, Vogels GD, Guijt W, Haasnoot CAG: Elucidation of the structure of methanopterin, a coenzyme from Methanobacterium thermoautotrophicum, using two-dimensional nuclear magnetic resonance techniques. Eur J Biochem 1984; 138: 563-571. Wächter H, Hausen A, Reider E, Schweiger M: Pteridine excretion from cells as indicator of cell proliferation. Naturwiss 1980; 67: 610-611. Watson BM, Schlesinger Ρ, Cotton RGH: Dihydroxanthopterinuria in phenylketonuria and lethal hyperphenylalaninaemia patients. Clin Chim Acta 1977; 78: 417-423. Wieland Η, Schöpf C: Über den gelben Flügelfarbstoff des Zitronenfalters (Gonepteryx rhamni). Ber Deutsch Chem Ges 1925; 58: 2178-2183. Ziegler I, Harmsen R: The biology of pteridines in insects. Adv Insect Physiol 1969; 6:139203.
2 Neopterin Neopterin was discovered in larvae of bee, in worker bees and in royal jelly (Rembold and Buschmann, 1963a, 1963b). The chemical structure (see also Figure 1.1) was identified by comparison with newly synthesized material as 2-amino-4hydroxy-6-(D-erythro-1', 2', 3'-trihydroxypropyl)-pteridine. 7,8-Dihydroneopterin triphosphate is produced during biosynthesis from guanosine triphosphate as first isolable intermediate (Jones et al., 1967). Four years after the discovery of neopterin, 25 mg of the compound were isolated from 500 liters of human urine (Sakurai and Goto, 1967). Increased concentrations of urinary neopterin were reported in patients with an extremely rare variant of atypical phenylketonuria (Kaufman et ai, 1975; Niederwieser et al., 1979). In the same year, raised urinary neopterin concentrations were reported in patients with malignancy and with viral infection ( Wächter et al., 1979). These results were confirmed by several groups within the next few years (Rokos et al, 1980; Stea et al., 1981; Dhondt et ai, 1982). It was suggested that increased neopterin may originate from the immune response of patients directed against tumor cells or virally infected cells (Hausen et al., 1981). Subsequently, it was shown that antigenic stimulation of human peripheral blood mononuclear cells leads to neopterin release into cell culture medium (Fuchs et al., 1982; Huber et al., 1983), and finally, that human macrophages produce neopterin in vitro when stimulated by interferon gamma (Huber et al., 1984). Since then, the results of numerous investigations in vitro as well as in vivo are consistent with the view that neopterin biosynthesis is closely associated with activation of the cellular immune system.
2.1 Chemical characteristics In this paragraph, only those chemical properties of neopterin are discussed which are of importance for its measurement in biological samples. The sensitivity of neopterin to photodecomposition is of primary importance in the clinical laboratory because specimens of body fluids sometimes may be stored for days before being analysed. Generally, there are no problems met when specimens are protected from light, for example, by tin foil. Neopterin is better soluble in water than in organic solvents and, therefore, cannot be extracted by such solvents. Neopterin and its hydrogenated forms can be characterized and determined by ultraviolet spectra or ultraviolet absorption, respectively. Neopterin is aromatic
8
2 Neopterin
and strongly fluorescing in its fully oxidized form, and can, therefore, be measured with high sensitivity by using its native fluorescence. The reduced species, 7,8dihydroneopterin and 5,6,7,8-tetrahydroneopterin do not fluoresce and, hence, require oxidation to neopterin before fluorescence measurement. The reactivity and redox potentials of reduced forms of 6-substituted pterins such as neopterin and biopterin are virtually identical (Fukushima and Nixon, 1979; Huck, 1983). Oxidation of 7,8-dihydroneopterin and of 5,6,7,8-tetrahydroneopterin with iodine, ferricyanide or manganese dioxide in acidic solution yields neopterin almost quantitatively. In alkaline environment, however, 5,6,7,8-tetrahydroneopterin is converted by oxidation preferentially to pterin (cleavage of the side-chain), and only trace amounts of neopterin are formed. Autoxidation of tetrahydroneopterin yields neopterin, xanthopterin and pterin. Autoxidation of 7,8-dihydroneopterin yields neopterin and xanthopterin. The aerobic oxidation of 5,6,7,8-tetrahydroneopterin was investigated in some detail (Armarego and Randies, 1983). The compound is oxidized to quinonoid 7,8-(6H)-dihydroneopterin which rapidly looses the side chain and forms 7,8-dihydropterin. Then, water is added across the 5,6-double bond, the intermediate is further oxidized aerobically, and rearranges to 7,8-dihydro-xanthopterin.
2.2 Catabolism High concentrations of total neopterins are detected only in urine of humans and primates, very low concentrations in dog but not in mouse, rat, guinea pig and hamster urine (Duch et al., 1984). In monkeys, the organs with highest concentrations of GTP cyclohydrolase I are pineal gland, small intestine, liver and kidney. The highest concentrations of total neopterins are observed in liver, spleen, pineal gland, kidney and lung. A similar distribution of radioactively labelled 5,6,7,8tetrahydrobiopterin has been previously reported {Hennings and Rembold, 1982). The pterins are present as aromatic, dihydro- and tetrahydro- forms within the tissues. Neopterin and 7,8-dihydroneopterin are found in serum and urine in remarkably constant ratio. This has been demonstrated with freshly collected and uniformly handled specimens (Levine and Milstien, 1984). The ratio of aromatic neopterin to total (aromatic plus acid-oxidizable) neopterin was 0.45 for urine and 0.43 for serum. It has been reported that more than 70 % of total neopterin are present as 7,8-dihydroneopterin in cerebrospinal fluid (Howells et al., 1986). In homogenates of macrophages stimulated by interferon gamma, the ratio of aromatic neopterin to total neopterin of about 1:3 ( Werner et al., 1989) is similar to the value found in serum and urine. Studies on the catabolism of neopterin in humans are not available at present.
2.3 Biochemical and physiological relevance
9
However, the similar ratio of aromatic neopterin and 7,8-dihydroneopterin in culture supernatants of macrophages, in serum and in urine suggests that both compounds are excreted mainly unmetabolized. The catabolism of neopterin in humans and primates differs from the degradation pathways in rats, however, where a pterin deaminase is known to convert pterins into lumazines (Rembold, 1970). Folic acid and riboflavin do not function as source of neopterin in humans. While 7,8-dihydroneopterin is an intermediate in the biosynthesis of these vitamins there is no reversibility of the metabolic pathways from folic acid and riboflavin back to dihydroneopterin.
2.3 Biochemical and physiological relevance (See also Chapter 5 for a more extended discussion of these issues.) A biochemical and physiological function of neopterin or 7,8-dihydroneopterin is not established at present. The production and release of both components accompanies activation of macrophages in vitro as well as in vivo. The activation of macrophages is induced by action of interferon gamma. Exposure of macrophages to interferon gamma leads to enhanced capacity to secrete partly reduced forms of molecular oxygen, such as superoxide anion and hydrogen peroxide. The secretion of hydrogen peroxide by macrophages is a two-step process: activation by interferon gamma induces only the capacity to produce large amounts of hydrogen peroxide. This priming step must be followed by a stimulus for secretion, such as interaction with microorganisms, immune complexes, or soluble secretagogues, for instance phorbol myristate acetate. Only the first step is paralleled by synthesis of neopterin. The release of hydrogen peroxide, however, is not accompanied by further secretion of neopterin (Nathan, 1986). Interferon gamma induces indoleamine 2,3-dioxygenase activity in macrophages simultaneously with neopterin release ( Werner et al., 1987).This enzyme degrades the essential amino acid tryptophan to N-formylkynurenine. From this intermediate, kynurenine, anthranilic acid and 3-hydroxyanthranilic acid are formed ( Werner et al., 1987). However, a biochemical connection between both processes, if present, remains to be demonstrated.
References Armarego WLF, Randies D: Aerobic oxidation of 5,6,7,8-tetrahydroneopterin. In: Chemistry and Biology of Pteridines (Blair JA, ed) Walter de Gruyter, Berlin - New York, 1983, pp 423-427. Dhondt J-L, Hayte J-M, Bonneterre J, Adenis L, Démaillé A, Ardouin P, Farriaux JP: Pteridines in urine and serum from cancer patients. In: Biochemical and Clinical Aspects
10
2 Neopterin
of Pteridines (Wächter H, Curtius Η-C, Pfleiderer W, eds) Walter de Gruyter, Berlin New York, 1982, vol 1, pp 133-140. Duch DS, Bowers SW, Woolf JH, Nichol CA: Biopterin cofactor biosynthesis: GTP cyclohydrolase, neopterin and biopterin in tissues and bodyfluids of mammalian species. Life Sci 1984; 35: 1895-1901. Fuchs D, Hausen A, Huber C, Margreiter R, Reibnegger G, Spielberger M, Wächter H: Pteridinausscheidung als Marker für alloantigen-induzierte Lymphozytenproliferation. Hoppe-Seyler's Ζ Physiol Chem 1982; 363: 661-664. Fukushima T, Nixon JC: Oxidation and conversion of reduced forms of biopterin. In: Chemistry and Biology of Pteridines (Kisliuk RL, Brown GM, eds) Elsevier/NorthHolland, Amsterdam, 1979, pp 31-34. Hausen A, Fuchs D, Grünewald Κ, Huber Η, König Κ, Wächter Η: Urinary neopterin as marker for haematological neoplasias. Clin Chim Acta 1981; 117: 297-305. Hennings G, Rembold H: Regional and subcellular distribution of biopterin in the rat. Int Ζ Vit Ernährungsforsch 1982; 1: 1-6. Howells DW, Smith I, Hyland K: Estimation of tetrahydrobiopterin and other pterins in cerebrospinal fluid using reversed-phase high-performance liquid chromatography with electrochemical and fluorescence detection. J Chromatogr 1986; 381: 285-294. Huber C, Fuchs D, Hausen A, Margreiter R, Reibnegger G, Spielberger M, Wächter H: Pteridines as a new marker to detect human Τ cells activated by allogeneic or modified self major histocompatibility complex (MHC) determinants. J Immunol 1983; 130: 1047-1050. Huber C, Batchelor JR, Fuchs D, Hausen A, Lang A, Niederwieser D, Reibnegger G, Swetly P, Troppmair J, Wächter Η: Immune response-associated production of neopterin. Release from macrophages primarily under control of interferon gamma. J Exp Med 1984; 160: 310-316. Huck H: Cyclische Voltammetrie mit Biopterin- und Neopterinderivaten. Fresenius Ζ Anal Chem 1983; 315: 227-231. Jones THD, Brown GM: The biosynthesis offolic acid. VII. Enzymatic synthesis of pteridines from guanosine triphosphate. J Biol Chem 1967; 242: 3989-3997. Kaufman S, Holtzman NA, Milstien S, Butler IJ, Krumholz A: Phenylketonuria due to a deficiency of dihydropteridine reductase. Ν Engl J Med 1975; 293: 785-790. Levine RA, Milstien S: The ratio of reduced to oxidized neopterin and biopterin in human fluids: significance to the study of human disease. In: Biochemical and Clinical Aspects of Pteridines (Pfleiderer W, Wächter H, Curtius Η-C, eds) Walter de Gruyter, Berlin - New York, 1984, vol 3, pp 277-284. Nathan CF: Peroxide and pteridine: a hypothesis of the regulation of macrophage antimicrobial activity by interferon gamma. In: Interferon 7 (Gresser J, ed) Academic Press, London, 1986, pp 125-143. Niederwieser A, Curtius Η-C, Bettoni O, Bieri J, Schircks M, Viscontini M, Schaub J: Atypical phenylketonuria caused by 7,8-dihydrobiopterin synthetase deficiency. Lancet 1979; 1: 131-133. Rembold H, Buschmann L: Struktur und Synthese des Neopterins. Chem Ber 1963a; 96: 1406-1410. Rembold H, Buschmann L: Untersuchungen über die Pteridine der Bienenpuppe (Apis mellifica). Justus Liebigs Ann Chem 1963b; 662: 72-82.
2.3 Biochemical and physiological relevance
11
Rembold H: Catabolism of unconjugated pteridines. In: Chemistry and Biology of Pteridines (Iwai K, Akino M, Goto M, Iwanami Y, eds) International Academic Printing, Tokyo, 1970, pp 163-178. Rokos H, Rokos K, Frisius H, Kirstädter HJ: Altered urinary excretion of pteridines in neoplastic disease. Determination of biopterin, neopterin, xanthopterin, and pterin. Clin Chim Acta 1980; 105: 275-286. Sakurai A, Goto M: Neopterin: isolation from human urine. J Biochem (Tokyo) 1967; 61: 142-145. Stea B, Halpern RM, Halpern BC, Smith RA: Urinary excretion levels of unconjugated pterins in cancer patients and normal individuals. Clin Chim Acta 1981; 113: 231-242. Wächter H, Hausen A, Graßmayr Κ: Erhöhte Ausscheidung von Neopterin im Harn von Patienten mit malignen Tumoren und mit Viruserkrankungen. Hoppe-Seyler's Ζ Physiol Chem 1979; 360: 1957-1960. Werner ER, Hirsch-KaufFmann M, Fuchs D, Hausen A, Reibnegger G, Schweiger M, Wächter H: lnterferon-gamma induced degradation of tryptophan by human cells in vitro. Biol Chem Hoppe-Seyler 1987a; 368: 1407-1412. Werner ER, Bitterlich G, Fuchs D, Hausen A, Reibnegger G, Szabo G, Dierich MP, Wächter H: Human macrophages degrade tryptophan upon induction by interferon-gamma. Life Sei 1987b; 41: 273-280. Werner ER, Werner-Felmayer G, Fuchs D, Hausen A, Reibnegger G, Wächter H: Parallel induction of tetrahydrobiopterin biosynthesis and indoleamine 2,3-dioxygenase activity in human cells and cell lines by interferon-gamma. Biochem J 1989; 262: 861-868.
3 Measurement of Neopterin Neopterin occurs in two forms: fully oxidized aromatic neopterin and reduced 7,8-dihydroneopterin. Both neopterin and 7,8-dihydroneopterin are excreted by activated macrophages. Approximately 30-50 per cent of total neopterin derivatives are already present in the oxidized, fluorescent form ( Werner et al., 1989). Neopterin is found at similar percentage in serum and urine (43 % and 45 % of total neopterin is in the oxidized form) when measured in freshly collected and uniformly handled samples {Levine and Milstein, 1984). It is discussed by some authors whether determination of aromatic neopterin or total neopterin is more advantageous in clinical use. The data hitherto show that the diagnostic information does not depend on which neopterin derivatives are chosen. Consistent with these observations is a study conducted on patients infected with human immunodeficiency virus type 1 : assessment of aromatic neopterin in one laboratory and of total neopterin in another, yielded essentially equal diagnostic conclusions (.Fuchs et al., 1989). Some problems are encountered when measuring neopterin in biological samples: its sensitivity to light induced degradation and, particularly, the lability of 7,8-dihydroneopterin to oxidative reactions must be accounted for. Dependent on pH-value, 7,8-dihydroneopterin is easily degraded to variable extent into dihydroxanthopterin, xanthopterin and pterin if collection is not immediately followed by analysis. Thus, it is recommended to determine the aromatic neopterin but not total neopterin when assessment of activated cellular immunity is attempted. Because virtually all determinations of neopterin in connection with cell-mediated immunity have been performed by measurement of aromatic neopterin, only this method will be considered in the following.
3.1 Historical remarks Neopterin was for the first time isolated from puppae of bees by anion exchange chromatography followed by paper chromatography {Rembold and Buschmann, 1963a, 1963b). For the first isolation from human urine, colored urinary compounds were removed by column chromatography, and pteridines were then absorbed on charcoal (Sakurai and Goto, 1967). Pteridines were eluted, separated by anion exchange chromatography, and neopterin was identified by chemical reactivity and ultraviolet absorption spectra. Later, a gas chromatographic-mass fragmentographic method was decribed allowing determination of neopterin and of other pterins in urine (Röthler and Karobath, 1976). A method for separation
14
3 Measurement of Neopterin
and analysis of pterins and pteridines by high performance liquid chromatography (HPLC) following oxidative treatment of samples was subsequently used by many authors for biochemical studies (Fukushima and Nixon, 1979). In the first investigation of urinary neopterin concentrations from patients with viral and malignant diseases, measurement was by HPLC without oxidative pretreatment of specimens ( Wächter et al., 1979). Subsequently, this method was adapted for use in routine laboratory {Hausen et al., 1982), for automated analysis (Fuchs et al., 1982) and, in modified version, for determination of neopterin in serum ( Werner et al., 1987a). Additionally, radioimmunoassay techniques were developed for rapid measurement of neopterin in large numbers of specimens (Rokos and Rokos, 1983; Nagatsu et al., 1984).
3.2 Measurement by reversed phase HPLC without pretreatment of samples 3.2.1 Principle This section describes analytical methods allowing rapid separation and sensitive quantitation of neopterin in large numbers of samples. In particular, the techniques were designed with the aim of avoiding laborious sample clean-up steps and pretreatment with preservatives. An analytical technique fulfilling these requirements was developed for measurement of neopterin in urine by reversedphase HPLC on an octadecylsilica column. In addition to neopterin quantitation, this method allows determination of urinary creatinine within the same chromatographic run. This is of vital importance when using urine: as a compound which is excreted in quite constant amounts over time, creatinine concentration helps to correct for physiological variations of urine concentrations. Since unpurified specimens are analysed, short guard cartridges packed with the same material are used to protect the main column. The analytes are eluted with Soerensen buffer (aqueous 15 mmol/1 potassium phosphate at pH 6.4). After separation, neopterin is measured by its native fluorescence and creatinine by ultraviolet absorption.
3.2.2 Collection of samples When collecting urinary samples, daily neopterin excretion is of interest. However, collection of 24 hours urine is not easily accomplished in clinical routine. Use of the first morning urine and calculating the ratio neopterin per creatinine, yields very satisfactory results (Fuchs et ai, 1982). Aliquots of urinary specimens are collected for subsequent neopterin analysis.
3.2 Measurement by reversed phase HPLC without pretreatment of samples
15
The samples are immediately protected from light by enveloping them in tin-foil covers and then analysed or stored at -20 degree Celsius until measurement. All operations are performed strictly avoiding exposure to direct sunlight and unnecessary exposure to other sources of light. When protected from light, urinary samples are stable for at least six months at -20 degree Celsius, for two weeks at 4 degree Celsius and for two days at room temperature.
3.2.3 Preparation of standard solutions Standard solutions for neopterin and creatinine are prepared by dissolving 130 mg dithioerythritol, 0.2 g sodium hydroxide and 10 mg neopterin in 10 liter of distilled and degassed water. The mixture is then stirred in the dark for 10 hours (solution A). In addition, 226 mg creatinine are dissolved in 125 mliter degassed Soerensen buffer (0.015 mol/liter potassium dihydrogen-phosphate, pH 6.4, solution B). Finally, 125 mliter A and 125 mliter Β are combined and diluted to a final volume of 1 liter with Soerensen buffer. Thus, the standard solution contains 494 nmol/ liter neopterin and 2.00 mmol/liter creatinine. Aliquots (e.g., 10 mliter) are stored at -20 degree Celsius in the dark up to 8 months until use.
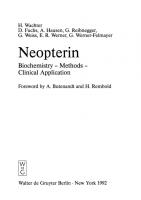
3.2.4 Procedure Advantageously, a fully automated HPLC system is employed. In the laboratory of the authors, the following configuration is used: a Model LC 5500 liquid Chromatograph, System 8055 air-actuated auto-injection device, Fluorichrom fluorescence detector, UV absorbance detector and Vista 402 data system (all from Varian, Palo Alto, CA, USA). Figure 3.1 shows the configuration of the HPLC system used. Aliquots of urine (100 μϋίεΓ) are diluted and mixed with 1 ml of Soerensen potassium phosphate buffer (15 mmol/1, pH 6.4) containing in addition 5.4 mmol/ 1 disodium diaminoethylene tetraacetate in order to dissolve urinary sediments. Diluted aliquots of urine (10 μϋίεΓ) are injected by the automated sampling device into the chromatographic system. For protection of the analytical column, a guard cartridge is used (e.g. Hibar LiChroCart, 4x4 mm, E. Merck, Darmstadt, Germany; packed with 7 μηι reversed phase C-18 material LiChroSorb, RP18, E. Merck). A ready-to-use cartridge is used for chromatography (e.g. Hibar Li-ChroCart, 125x4 mm, E. Merck·, packed with the same material as the guard cartridge). The cartridges are fitted in a column holder (Auto Fix II, E. Merck) at 25 degree Celsius. Chromatographic elution is performed with degassed Soerensen potassium phosphate buffer, 15 mmol/liter, pH 6.4, at column temperature of 25 degree Celsius and a flow rate of 0.8 mliter per minute. Neopterin is quantitated by its native
16
Figure 3.1:
3 Measurement of Neopterin
Configuration of a fully automated high-performance liquid chromatography system for simultaneous determination of neopterin and creatinine in human urine.
fluorescence (353 nm excitation, 438 nm emission wavelengths, retention time about 4.2 minutes). Neopterin concentration is related to creatinine concentration being determined by U V absorption at 235 nm wavelength in the same chromatographic run (retention time about 2.8 minutes). Concentrations of both analytes are calibrated by external standard method. The arrangement of samples on the autosampler is as follows: two urinary controls (aliquote of a urine with known neopterin concentration are stored frozen until use), standard, five samples, methanol, six samples. The cycle time between two samples is about 9 minutes when using the described technique. About 100 analyses can be easily performed within one day. After chromatography of about 100 samples, the column has to be cleaned by a methanol-water gradient at flow rate of 0.3 mliter per minute. The composition of eluent is changed by linear gradient from 100% water to 100% methanol during 10 minutes. Then, pure methanol is maintained for 30 minutes. Finally, composition of eluent is reversed again from 100% methanol to 100% water during 10 minutes. This purification procedure markedly prolongs lifetime of one cartridge; normally, a cartridge can be used daily for at least three weeks of for at least 1500 samples. Figure 3.2 shows a chromatogram of a urinary sample obtained using the described method. The right lane monitors the fluorescence detector, the left lane shows the ultraviolet absorption detector.
3.3 Measurement by reversed phase HPLC with on-line deproteinisation UV absorption
Figure 3.2:
17
— f l u o r e s c e n c e
Typical chromatogram of a human urine specimen.
3.2.5 Performance characteristics Analytical sensitivity was determined to be 120 fmol neopterin per injection and 36 pmol creatinine per injection at a peak-to-noise ratio of 5:1. Thus, the detection limit is 72 nmol neopterin/liter urine which is one order of magnitude below the lowest concentrations occurring in human urine. Within-run precision was 4.7% and day-to-day precision 5.8% for the ratio neopterin per creatinine. Mean recovery of 99.3% was obtained for this ratio. Neither other studied pterins nor urinary components interfered with the presented method. Due to its sensitivity, precision, accuracy, specificity and practicability the method is well suitable for application in a clinical routine laboratory.
3.3 Measurement of neopterin by reversed phase HPLC with on-line deproteinisation 3.3.1 Principle Direct determination of neopterin in serum, cerebrospinal fluid, cell culture supernatants or cell homogenates is complicated by high protein content and by 500-fold lower neopterin concentration in these media when compared to urine. Fukushima and Nixon (1979) have developed a method to measure total amount of neopterin derivatives using the following procedures: oxidation of reduced pterins, acidic precipitation of protein, purification on a first ion-exchange column, accumulation of analytes on a second ion-exchange column and, finally, the actual measurement by reversed phase HPLC. By modifying the above-described procedure, a method has been developed by the authors which measures simultaneously neopterin and creatinine in serum by reversed phase HPLC ( Werner et
18
3 Measurement of Neopterin
al., 1987a). By an on-line deproteinisation step combined with enrichment of analytes, this method avoids precipitation of proteins. The method is very sensitive since enrichment of neopterin is possible; it requires, however, a special instrument: removal of proteins without precipitation as well as enrichment of the analytes is achieved by use of solid-phase extraction of small molecular mass compounds on a solid-phase cartridge. The extraction step is achieved from serum by propylbenzene sulfonic acid-modified silica sorbent which effectively adsorbs neopterin and creatinine when both compounds are protonated to positively charged ions. Subsequently, the extracted analytes are eluted on-line from the solid phase cartridge onto the HPLC column. Compared with the aforementioned method for quantitation of neopterin in urine, twice the column length is used here. This not only enables detection of neopterin and creatinine, but also allows a base-line separation of biopterin from other pterins and serum constituents. Thus, this method is also useful for quantitation of neopterin and biopterin in serum and other body fluids (bile fluid, sputum, saliva, gastric or pancreatic juice, synovial fluid), tissue or cell extracts, and enzyme incubation mixtures.
3.3.2 Apparatus The HPLC system used in the laboratory of the authors is detailed here because some unusual components are included. An isocratic pump (e.g. LC T414, Kontron, Zurich, Switzerland), a manual injection valve (210 Altex, Berkeley, CA, USA), a UV spectrophotometry detector (SPD-6-A, Shimadzu, Kyoto, Japan), a fluorescence detector (LS4, Perkin-Elmer Corporation, Beaconsfield, U.K.) and a module for automatic insertion of solid-phase cartridges upstream of the HPLCcolumn (AASP, Varían, Sunnyvale, CA, USA) are used. Thus, extracted analytes are eluted directly from the cartridge onto the HPLC column. Automatic processing of up to 10 cassettes is possible by the AASP. Distilled water serves as purge solvent in order to eliminate air trapped within cartridges or tubes before the 10port valve of the AASP (Figure 3.3) is switched to inject position. The fluid connections of the 10-port valve are modified, thus facilitating elution of analytes from the cartridges (Figure 3.3). The sample loop is placed between HPLC pump and solid-phase cartridge in the inject position. The loop must be refilled with concentrated buffer during the load phase. A low pressure peristaltic pump (type N, Serva, Heidelberg, Germany) is continuously pumping concentrated buffer (0.4 mol/liter potassium phosphate, pH 6.8) into the loop inlet (port 1, Figure 3.3). The analytes elute from the cartridge when the valve is switched to the inject position. A 250 χ 4 mm reversed phase C18 column, 7 μηι particle size, (LiChroCart, Merck) serves as HPLC column. The column temperature is controlled by a coiled copper tube arounding the column through which water of 25 + / - 0.1 degree Celsius is pumped by a circulating thermostate (e.g. UC5B, Julabo, Seelbach, Germany).
3.3 Measurement by reversed phase HPLC with on-line deproteinisation
19
loop
Figure 3.3:
Modified fluid connections of the AASP instrument.
3.3.3 Collection of samples and preparation of standard solutions Serum samples are stable with respect to aromatic neopterin {but not reduced neopterin derivatives) for more than one year, if frozen at -20 degree Celsius. Standard solutions for calibration are prepared by dissolving 7 g of bovine serum albumin, 900 mg of sodium chloride and 300 mg of sodium hydrogen carbonate in 100 mliter of distilled water. Then, appropriate amounts of concentrated solutions of neopterin (1 mg per liter) and of creatinine (1 g per liter) are added (preparation of solutions A and B, see Section 3.2.3).
3.3.4 Procedure Figure 3.4 shows the experimental conditions. 100 μΐ Serum are pipetted into 10 μΐ solution containing a 0.1 mol per liter solution of ferric salt (4.0 g Fe(N0 3 ) 3 .9H 2 0) and disodium salt of ethylenediamine tetraacetate (3.7 g in 100 ml H 2 0). The mixture is incubated at room temperature for 20 minutes, leading to breakdown of 7,8-dihydroneopterin which otherwise might be oxidized in the subsequent steps to yield aromatic neopterin, and thus would interfere with the determination. Alternatively to this incubation step, fresh samples could be oxidized with 0.1 mol per liter iodine solution in phosphoric acid to obtain total neopterin (and biopterin) concentrations (Figure 3.4). Then, 100 μϋίβΓ of the mixture is pipetted
20
3 Measurement of Neopterin Analysis of neopterin in serum with and without oxidative pretreatment
0.100 mliter serum (N + N H ) 2
u
υ
0.010 mliter Fe(lll)-EDTA
Ό
0.010 mliter ΗηPO A
υ "
2
0.010 mliter ascorbate
Ό
υ
S C X - cartridge
S C X - cartridge
υ
υ
wash (Η PO )
3 4
A A S P - HPLC
neopterin
Figure 3.4:
0.010 mliter Η P O - I
wash (Η PO )
3 4
ü
AASP - HPLC
total neopterin
Experimental conditions for simultaneous determination of neopterin and creatinine in serum and other fluids with high protein content.
into 10 μ Ι ϊ ί β Γ phosphoric acid-ascorbic acid solution (equivolumic mixture of 0.1 mol per liter ascorbic acid and 10 mol per liter phosphoric acid). The solution is mixed. 100 μΙΗβΓ are transferred to the AASP solid-phase cartridge SCX which has been preequilibrated with 1.0 mliter of distilled water and with two 0.5 mliter portions of 0.1 mol/liter phosphoric acid. The sample is forced through the cartridge under pressure of 150 kPa and washed with 0.5 mliter of 0.1 mol per liter phosphoric acid. Finally, the cartridge cassette is removed from the PrepStation. The surfaces are cleaned with distilled water and the cassette is applied to the AASP module. Modified fluid connections shown in Figure 3.3 are used for HPLC. The loop of the 10-port valve is refilled with concentrated potassium phosphate buffer (0.4 mol per liter, pH 6.8) before every injection. This is done, e.g., by continuously pumping concentrated buffer into the loop at flow rate of 0.1 mliter per minute by means of the peristaltic pump. Then, the valve is switched to the inject position whereby the concentrated buffer promptly elutes the analytes from the cartridge onto the reversed phase column. Chromatographic separation is performed with potassium phosphate buffer (15 mmol per liter, pH 6.0) at flow rate of 0.8 mliter per minute. Distilled water purges are applied five times (total volume: 125 μ ϋ ί β Γ ) before injection. Then, the valve is switched to the inject position for 1 minute and purged further 20 times (total volume: 0.5 mliter). The cycle time is 25 minutes before the next injection. Creatinine is measured by ultraviolet absorption at a wavelength of 235 nm, retention time is 6.1 minutes,
3.3 Measurement by reversed phase HPLC with on-line deproteinisation
21
and neopterin by fluorescence at excitation wavelength 353 nm, emission wavelength 438 nm, retention time 9.2 minutes. The peak heights are used for quantitation. Concentrations of both analytes are calibrated by external standard method. The arrangement of samples, standards and control sera on the cassette is as follows: control serum (aliquots of one serum sample with measured neopterin concentration are stored at -20 degree Celsius until use), standard, 4 samples, standard, 3 samples, control serum. Then, the arrangement of the last 10 positions is repeated. The analysis of one serum sample requires 25 minutes. Thirty specimens can be measured within one day. After chromatography of 30 samples, the column is cleaned with distilled water at flow rate of 0.3 mliter per minute during 20 minutes, followed by distilled methanol during 30 minutes and, finally, by distilled water during 20 minutes. The column is thoroughly equilibrated with elution buffer before the next analysis series. UV absorption
fluorescence — •
creatinine
Figure 3.5:
Typical chromatogram of a human serum specimen.
Figure 3.5 shows a chromatogram of a serum sample. The right lane was obtained by fluorescence detection, the left pattern by ultraviolet absorption detection.
3.3.5 Performance characteristics Detection limits of the presented method are 40 fmol neopterin per injection and 80 pmol creatinine per injection at signal: noise ratio of 5:1. If 100 μΙϊίβΓ serum is analysed (then, 82.6 μϋίβΓ is injected), detection limit is 0.5 nmol per liter for neopterin and 1 μηιοί per liter for creatinine. The method is linear in the range tested: 1.47 to 523 nmol neopterin per liter and 18 to 1510 μηιοί creatinine per liter. Linear correlation coefficients between neopterin concentrations and detector signals are 0.999 for neopterin and 0.998 for creatinine over the range of concentrations tested. Precision of the method was studied with normal and pathological
22
3 Measurement of Neopterin
sera. Coefficients of variation range from 5% to 10% for both between-run and dayto-day precision. Mean analytical recovery was found to be 100% for neopterin and 103.5% for creatinine. Forty-five low molecular mass substances did not interfere with determination of neopterin. The described method thus shows satisfactory performance characteristics and meets the requirements of quality control for everyday routine work.
3.4 Measurement of neopterin by immunoassays For assaying large numbers of specimens for neopterin concentration, immunoassays have been developed (Rokos and Rokos, 1983; Nagatsu et al., 1984). The currently most widely used radioimmunoassay (RIA) is commercially available from Henning-Berlin (Berlin, Germany).
3.4.1 Principle The assay is based on the competition of unlabelled neopterin (antigen) from the serum samples or standards and of radiolabeled neopterin (tracer) for the binding sites of a polyclonal anti-neopterin antibody. Depending on the concentration of unlabelled neopterin present in the sample, a variable amount of tracer is bound to the anti-neopterin antibody. The radioactivity of the antigen-antibody complex is thus inversely proportional to the concentration of unlabelled neopterin in the sample. After the neopterin-antibody complex is formed, it is precipitated using a solution of polyethylene glycol. After centrifugation and removal of the supernatant, the radioactivity of the pellet is measured using a gamma counter.
3.4.2 Procedure Serum samples are used immediately or stored at 4 to 8 degree Celsius for two days or kept at -20 degree Celsius. Repeated freezing and thawing should be avoided. All handling and incubations are done avoiding direct sunlight. If the necessary calculations are carried out without assistance of a computer program, a plot of B/B0 versus logarithm of concentration is recommended: the mean count rate Β of each tube is related to the mean count rate of the zero standard (B0 = 100 %). The mean percent values B/B0 of each standard are plotted versus the logarithmic neopterin concentration of each standard. The mean percent values of the ratio B/B0 of samples are then used to estimate the corresponding neopterin concentrations from the standard curve. If computer-assisted evaluation is possible, algo-
3.4 Measurement of neopterin by immunoassays
23
rithms based on spline functions are strongly recommended instead of evaluation by linear regression using, e.g., the logit function of B/B 0 versus log concentration. The latter technique produces too high results, particularly in the important region of about 10 nmol per liter.
3.4.3 Performance characteristics. Comparison with HPLC The detection limit of the RIA method for measurement of neopterin in serum is about 1 nmol per liter (Rokos and Rokos, 1983). The intra-assay coefficient of variation is 1.2 % and the inter-assay coefficient of variation 12 %. The results of RIA and HPLC correlated well when analysed by linear regression and by Spearman's rank correlation method ( Werner et al., 1987b). According to many studies, the RIA method for determining neopterin in serum is sensitive, specific and convenient. It offers a practicable technique for the routine laboratory, particularly for rapid evaluation of large samples numbers.
References Fuchs D, Hausen A, Reibnegger G, Wächter H: Automatized routine estimation of neopterin in human urine by HPLC on reversed phase. In: Biochemical and Clinical Aspects of Pteridines (Wächter H, Curtius Η-C, Pfleiderer W, eds) Walter de Gruyter, Berlin - New York, 1982, vol 1, pp 67-79. Fuchs D, Milstien S, Krämer A, Reibnegger G, Werner ER, Goedert JJ, Kaufman S, Wächter H: Urinary neopterin concentrations vs total neopterins for clinical utility. Clin Chem 1989; 35: 2305-2307. Fukushima T, Nixon JC: Oxidation and conversion of reduced forms of biopterin. In: Chemistry and Biology of Pteridines (Kisliuk RL, Brown GM, eds) Elsevier/NorthHolland, Amsterdam, 1979, pp 31-34. Hausen A, Fuchs D, König Κ, Wächter Η: Determination of neopterin in human urine by reversed-phase high-performance liquid chromatography. J Chromatogr 1982; 227: 61-70. Levine RA, Milstien S: The ratio of reduced to oxidized neopterin and biopterin in human fluids: significance to the study of human disease. In: Biochemical and Clinical Aspects of Pteridines (Pfleiderer W, Wächter H, Curtius Η-C, eds) Walter de Gruyter, Berlin - New York, 1984, vol 3, pp 277-284. Nagatsu T, Sawada M, Yamaguchi T, Sugimoto T, Matsuura S, Akino M, Nakazawa N, Ogawa H: Radioimmunoassay for neopterin in body fluids and tissues. Anal Biochem 1984; 141:472-480. Rembold H, Buschmann L: Struktur und Synthese des Neopterins. Chem Ber 1963a; 96: 1406-1410. Rembold H, Buschmann L: Untersuchungen über die Pteridine der Bienenpuppe (Apis mellifica). Justus Liebigs Ann Chem 1963b; 662: 72-82. Rokos H, Rokos K: A radioimmunoassay for determination of D-erythro-neopterin. In:
24
3 Measurement of Neopterin
Chemistry and Biology of Pteridines (Blair JA, ed) Walter de Gruyter, Berlin - New York, 1983, pp 815-819. Röthler F, Karobath M: Quantitative determination of unconjugated pterins in urine by gas chromatography/mass fragmentography. Clin Chim Acta 1967; 69: 457-462. Sakurai A, Goto M: Neopterin: isolation from human urine. J Biochem (Tokyo) 1967; 61: 142-145. Wächter H, Hausen A, Graßmayr Κ: Erhöhte Ausscheidung von Neopterin im Harn von Patienten mit malignen Tumoren und mit Viruserkrankungen. Hoppe-Seyler's Ζ Physiol Chem 1979; 360: 1957-1960. Werner ER, Fuchs D, Hausen A, Reibnegger G, Wächter H: Simultaneous determination of neopterin and creatinine in serum with solid-phase extraction and on-line elution liquid chromatography. Clin Chem 1987a; 33: 2028-2033. Werner ER, Bichler A, Daxenbichler G, Fuchs D, Fuith LC, Hausen A, Hetzel H, Reibnegger G, Wächter Η: Determination of neopterin in serum and urine. Clin Chem 1987b; 33: 62-66. Werner ER, Werner-Felmayer G, Fuchs D, Hausen A, Reibnegger G, Wächter Η: Parallel induction of tetrahydrobiopterin biosynthesis and indoleamine 2,3-dioxygenase activity in human cells and cell lines by inteiferon-gamma. Biochem J 1989; 262: 861-868.
4 Normal Ranges of Neopterin Concentrations in Various Body Fluids When quantitative laboratory measurements are employed for aiding, e.g., in the diagnosis of a specific disease, it is common practice to use so-called normal ranges: these ranges define the range of values for a certain analyte which is observed in a major fraction of clinically healthy individuals ("healthy" here means "absence of the specific disease under consideration"). These normal ranges are dependent on non-biologic factors (accuracy and precision of the analytical technique, collection, transport and storage of specimens, statistical fluctuations) and biological factors (age- and sex dependency, chronobiological rhythms). Various definitions of normal ranges are common; among these are parametric (for example, "mean plus a certain multiple of the standard deviation") and non-parametric measures (for example, "a certain fractile of the empirically determined distribution of observed values"). For neopterin, the situation with respect to biological influence factors is best known for urine and for serum. As is usual in clinical chemical practice, certain biological factors such as chronobiological variability can be minimized in their effect by collecting specimens under standardized circumstances. For example, it is generally recommended to use the first morning urine specimens for neopterin determination in urine (see Chapter 3). The following paragraphs will outline, for the various body fluids, the usually employed normal ranges of neopterin concentrations. It should be borne in mind that these ranges are to be used under the restriction that they stem from clinically healthy subjects. In many clinical situations, however, it is necessary to discriminate a certain disease from other diseases presenting with, e.g., similar symptoms. In these cases, knowledge of normal ranges obtained from healthy subjects is not necessarily very useful: rather, the distributions of values in both conditions to be compared must be known. Likewise, if the measurements of a biochemical analyte are to be used for, e.g., improving prediction of the further fate of a patient, in most examples other cut-off values prove useful than the cut-off limits defined on the basis of healthy individuals.
26
4 Normal Ranges of Neopterin Concentrations in Various Body Fluids
4.1 Normal ranges of neopterin concentrations in urine Age- and sex dependency Compared with most other biological fluids, urine has a unique position: its water content is not held constant by the organism. Therefore, it is an absolute necessity to adjust measured values for an analyte for these strongly variable degrees of concentration. Several methods are possible: one, for example, is the collection of urine over a 24-hour period. This technique being very laborious, other possibilities are sought, and frequently the fact is exploited that creatinine is excreted in quite constant amounts over time. Thus, dividing the measurements of a certain analyte by simultaneously determined creatinine values is common practice. Consequently, has been mentioned in Chapter 3, urinary neopterin is reported as neopterin per creatinine ratio. This ratio is very constant over longer periods of time in healthy individuals, it is practically independent from water uptake and water loss by, e.g., sweating. From the fact that men normally have a greater muscle mass than women and therefore excrete normally more creatinine per day, it is to be expected that a sex- and age dependency should exist for neopterin per creatinine ratios in urine. That this expectation is really justified is shown by the normal ranges reported in Table 4.1. The mean neopterin concentrations and the upper limits of the normal ranges are strongly dependent on age, children showing by far the highest levels. Moreover, in adults there is a significant dependence of levels on sex, women showing higher neopterin per creatinine ratios than men. The normal ranges shown in this table were compiled from several independent studies, and therefore, the definitions of the normal ranges is not unique for all age- and sex groups. The levels on children of ages below one year are given as mean and standard deviation only (Shintaku et ai, 1982). Normal ranges in children older than one year and up to eighteen years were defined as follows (Reibnegger et al., 1984): from a linear regression analysis, the following equations for the mean values and for the upper limit of normal were established: mean = 266.5 - 7.7 age, and upper limit = 447 - 7.7 age, where mean and upper limit is expressed as μηιοί neopterin per mol creatinine, age is in years, and the upper limit is defined as mean plus 2.5 times the standard estimation error of 72.3 following from the regression analysis. The values generally used as upper limits of normal ranges for adults were defined according to Lieberman (1958) to include, with 95% probability, 97.5% of healthy individuals {Hausen et al., 1982a).
4.1 Normal ranges of neopterin concentrations in urine
27
Table 4.1 Neopterin concentrations* in urine of healthy subjects Age
Sex+
Ν
Mean value (SD)
0-3 days 4 days 5 days 1 month 3-8 months 1-4 yr 4-7 yr 7-12 yr 12-15 yr 15-18 yr 18-25 yr 26-35 yr 36-45 yr 46-55 yr 56-65 yr > 65 yr 18-25 yr 26-35 yr 36-45 yr 46-55 yr 56-65 yr > 65 yr
m,f m,f m,f m,f m,f m,f m,f m,f m,f m,f m m m m m m f f f f f f
13 21 15 9 4 13 25 55 45 11 42 29 41 32 31 33 55 28 31 28 26 41
972 (661) 1510 (641) 1602 (657) 906 (527) 560 (53) 267 (94) 226 (76) 181 (73) 171 (73) 144 (65) 123 (30) 101 (33) 109 (28) 105 (36) 119(39) 133 (38) 128 (33) 124 (33) 140 (39) 147 (32) 156 (35) 151 (40)
* Neopterin, μπιοί per mol creatinine;
+
Upper limit of normal -
432 405 374 343 320 195 182 176 197 218 229 208 209 239 229 249 251
m, male; f, female.
Daily rhythm In contrast to early reports (Stea et al., 1980), neopterin excretion into urine is not constant over the period of one day: during night time, there exists a maximum {Fuchs et al., 1982). A maximum between 7.00 a.m. and 12.00 a.m. has been observed after oxidative treatment of urine (Pheasant, 1986). Probably the best data on the diurnal rhythm of urinary neopterin levels were published by a French group (Auzeby et ai, 1988, 1989). These authors have investigated, under strictly standardized conditions, urinary neopterin and creatinine excretion in five healthy young men after synchronization of diurnal activity. Meals were taken at fixed times. Urine voidings were collected every four hours during a span of 48 hours at fixed clock hours. This procedure was performed three times, one week apart. The total protocol thus yielded 180 specimens. Figure 4.1 shows the results obtained for neopterin per creatinine ratio. The data show clearly that there exists a circadian rhythm for neopterin excretion into urine. Noteworthy, the variability of the results was very small due to the high standards of the investigation; therefore, the variances are not shown in the
28
4 Normal Ranges of Neopterin Concentrations in Various Body Fluids Neopterin in urine
Time of day Figure 4.1:
Diurnal rhythm of urinary neopterin concentrations in healthy subjects.
Values are in μηιοί neopterin per mol creatinine. (Adapted from Auzeby et al., 1988).
Figure. A single peak occurs during late night and early morning hours, in accordance with earlier results. In accordance with common practice, the authors concluded from their data that urine collection for neopterin determinations should be done at regular clock times, and they suggested to use first morning urine specimens. Long-term stability To investigate the stability of urinary neopterin per creatinine ratios in healthy subjects over a longer period of time, four healthy adults were studied daily over one month {Hausen et al., 1982b). Small variations were observed which in no case exceeded the normal range. In a more extended protocol, 25 individuals (10 men, 1 woman, 5 children) were followed over one year in bi-weekly intervals (Wächter et al., 1989). The results were similar; one event of influenza was accompanied by a strongly elevated neopterin level but all other measurements were within the normal range and only very small variability of levels was noted.
4.2 Normal ranges of neopterin concentrations in serum In serum, an investigation on a large number of individuals of different ages and both sexes ( Werner et al., 1987) showed a significant dependence on age but not on sex (Table 4.2). The neopterin concentrations in sera from healthy adults between
4.3 Normal ranges of neopterin concentrations in cerebrospinal fluid
29
18 and 75 years of age agree perfectly with data obtained on large numbers of healthy blood donors (Kern et al., 1984; Haas and Gerstner, 1985; Hönlinger et al., 1989). Table 4.2 Neopterin concentrations* in serum of healthy subjects Age (years)
Sex+
Ν
Mean value (SE)
Upper limit of normal®
0-18 19-75 >75
m,f m,f m,f
263 359 40
6.78 (0.22) 5.34(0.14) 9.67 (0.79)
13.5 8.7 19.0
* Neopterin, nmol per liter;
+
m, male; f, female;
$
95th percentiles.
Recent data show that in contrast to other biochemical analytes as, e.g., carcinoembryonic antigen, smoking has no influence on neopterin concentrations in serum of healthy individuals (Bums et al., 1991). Long-term stability Due to the more invasive character of sample collection, little is known about the behavior of serum neopterin concentrations in one individual over a longer period of time. Some data exist, however, on a group of six women and one man in whom serum neopterin was determined daily over one month (Haas and Gerstner, 1986). Only small variations were seen, and with one single exception, the values remained within the normal range. Only in one woman two values were slightly outside the normal range on days 29 and 30 of her menstrual cycle.
4.3 Normal ranges of neopterin concentrations in cerebrospinal fluid The invasive character of sample collection from cerebrospinal fluid has hampered the determination of normal neopterin concentrations in this medium in healthy subjects. Nevertheless, from several studies data are available on patients with certain neurologic disorders such as headache, who served as controls for more severe neurologic and/or psychiatric diseases. Table 4.3 compiles results from different studies. Generally, neopterin concentrations in cerebrospinal fluid are somewhat smaller than in serum but they are of the same order of magnitude.
30
4 Normal Ranges of Neopterin Concentrations in Various Body Fluids
Table 4.3 Neopterin concentrations* in cerebrospinal fluids (CSF) of healthy subjects* Author
CSF
Serum
1.25 - 3.30 1.6 0.6 1.25
2.3 - 9.8 4.7 2.1 4.3
8.8 2.6
9.3 0.8
Fredrikson et al., 1987
number = 19 range mean SD median Griffin et al., 1991
number = 46 mean SD * Neopterin, nmol per liter; +
control subjects with headache and other minor neurologic disorders, immune activation unlikely.
4.4 Normal ranges of neopterin concentrations in synovial fluid Synovial fluid must be collected by invasive methods, and therefore, data on healthy subjects are lacking. However, in several studies on inflammatory rheumatic disorders affecting joints, control patients with non-inflammatory diseases were used for control purposes, and it may be reasonably assumed that such patients show neopterin concentrations not too different from healthy individuals. For example, neopterin was determined in 30 control patients with osteoarthritis, osteochondritis dissecans, chondropathia patellae, and traumatic lesions of the knee joint {Maerker-Alzer et al., 1986). These subjects were compared with 30 patients suffering from inflammatory joint diseases. The control patients had neopterin levels in the range from 2.0 to 8.0 nmol per liter, which was significantly lower than values found in synovial fluids from patients with inflammatory affections who showed concentrations up to 30 nmol per liter. Similar data were obtained by Krause et al. (1989) who found a median value of about 8 nmol per liter in synovial fluids from controls (patients undergoing meniscectomy).
4.5 Normal ranges of neopterin concentrations in saliva
31
4.5 Normal ranges of neopterin concentrations in saliva Neopterin concentrations in human saliva were investigated by two groups (Katoh et al., 1989; Reibnegger et al., 1990). For healthy controls, both reports show good agreement: mean value in nine healthy young men was 1.4 nmol per liter (Katoh et al., 1989); in eight healthy adults (four men, four women), a median value of 3.0 nmol per liter (range from 1.0 to 4.6 nmol per liter) was found {Reibnegger et al., 1990). These values were significantly lower than the neopterin level in saliva from 21 patients infected by human immunodeficiency virus type-1 who had a median neopterin concentration of 6.5 nmol per liter (range from 1.0 to 37.0 nmol per liter).
4.6 Discussion The origin of the basal neopterin levels in human body fluids is not clear. Several possibilities exist; further research about a potential physiological role of neopterin will perhaps present a clue to this problem. The basal production of neopterin might perhaps result from clinically silent immune responses in the continuous attempt of the immune system to defend against invading microorganisms or destroy altered self structures; equally likely, however, is an origin of this neopterin production in those cell systems which regularly synthesize 5,6,7,8tetrahydrobiopterin cofactor for hydroxylation of aromatic amino acids and for neurotransmitter synthesis (liver and neural tissues). It is to be hoped that the evolving molecular biological methodology will help to clarify these issues: for example, it is well conceivable that different isoenzymes are responsible for pteridine synthesis in neural and liver tissue versus the immune system.
References Auzeby A, Bogdan A, Krosi Z, Touitou Y: Time-dependence of urinary neopterin, a marker of cellular immune activity. Clin Chem 1988; 34: 1866-1867. Auzeby A, Bogdan A, Krosi Z, Touitou Y: Large-amplitude circadian variations of urinary neopterin in healthy man. Pteridines 1989; 1: 17-18. Burns DN, Krämer A, Yellin F, Fuchs D, Wächter H, DiGioia RA, Sanchez WC, Grossman RJ, Gordin FM, Biggar RJ, Goedert JJ: Cigarette smoking: a modifier of human immunodeficiency virus type 1 infection? J AIDS 1991; 4: 76-83. Fredrikson S, Eneroth P, Link H: Intrathecal production of neopterin in aseptic meningoencephalitis and multiple sclerosis. Clin Exp Immunol 1987; 67: 76-81. Fuchs D, Hausen A, Reibnegger G, Wächter H: Automatized routine estimation of neopterin in human urine by HPLC on reversed phase. In: Biochemical and Clinical Aspects of
32
4 Normal Ranges of Neopterin Concentrations in Various Body Fluids
Pteridines (Wächter H, Curtius Η-C, Pfleiderer W, eds) Walter de Gruyter, Berlin - New York, 1982, vol 1, pp 67-79. Griffin DE, McArthur JC, Cornblath DR: Neopterin and interferon gamma in serum and cerebrospinalfluid of patients with HIV-associated neurologic disease. Neurology 1991; 41: 69-74. Haas R, Gerstner L: Radioimmunologische Bestimmung von Neopterin bei Blutspendern. Allerg Immunol 1985; 31: 179-182. Haas R, Gerstner L: Neopterinschwankungen während des weiblichen Zyklus. Allerg Immunol 1986; 32: 169-173. Hausen A, Fuchs D, Grünewald K, Huber H, König K, Wächter H: Urinary neopterin in the assessment of lymphoid and myeloid neoplasia, and neopterin levels in haemolytic anaemia and benign monoclonal gammopathy. Clin Biochem 1982a; 15: 34-37. Hausen A, Fuchs D, König Κ, Wächter Η: Determination of neopterin in human urine by reversed-phase high-performance liquid chromatography. J Chromatogr 1982b; 227:61-70. Hönlinger M, Fuchs D, Hausen A, Reibnegger G, Schönitzer D, Werner ER, Reissigl H, Dierich MP, Wächter H: Serum-Neopterinbestimmung zur zusätzlichen Sicherung der Bluttransfusion. Erfahrungen an 76587 Blutspendern. Deutsch Med Wochenschr 1989; 114: 172-176. Katoh S, Sueoka T, Matsuura S, Sugimoto T: Biopterin and neopterin in human saliva. Life Sei 1989; 45: 2561-2568. Kern P, Krebs HJ, Dietrich M: Serum neopterin. Screening test to exclude transfusion hazards by blood donors with cytomegalovirus infection, AIDS, etc. 18th Congress of the International Society of Blood Transfusion, München 1984; PIO. Krause A, Protz H, Goebel KM: Correlation between synovial neopterin and inflammatory activity in rheumatoid arthritis. Ann Rheum Dis 1989; 48: 636-640. Lieberman GJ: Tables for one-sided statistical tolerance tests. Industry Qual Contr 1958; 14: 7-9. Maerker-Alzer G, Diemer O, Strümper R, Rohe M: Neopterin production in inflamed knee joints: high levels in synovial fluids. Rheumatol Int 1986; 6: 151-154. Pheasant AE: Diumal variation of urinary pterin excretion in man. In: Chemistry and Biochemistry of Pteridines (Cooper BA, Whitehead VM, eds) Walter de Gruyter, Berlin New York, 1986, pp 268-270. Reibnegger G, Fuchs D, Hausen A, Kostron-Krainz C, Wächter H: Urinary neopterin in malignant diseases of childhood. A marker for activity of the cell-mediated immunity. Tumor Diagn Ther 1984; 5: 234-237. Reibnegger G, Fuchs D, Zangerle R, Wächter H: Increased neopterin concentration in saliva of patients with HIV-1 infection. Clin Chem 1990; 36: 1379. Shintaku H, Isshiki G, Hase Y, Tsuruhara Τ, Oura Τ: Normal pterin values in urine and serum in neonates and its age-related changes throughout life. J Inher Metab Dis 1982; 5:241-242. Stea B, Halpem M, Halpern BC, Smith RA: Quantitative detection of pterins in biological fluids by high-performance liquid chromatography. J Chromatogr 1980; 188: 363-375. Wächter H, Fuchs D, Hausen A, Reibnegger G, Werner ER. Neopterin as marker for activation of cellular immunity: immunologic basis and clinical application. Adv Clin Chem 1989; 27: 81-141. Werner ER, Bichler A, Daxenbichler G, Fuchs D, Fuith LC, Hausen A, Hetzel H, Reibnegger G, Wächter H: Determination of neopterin in serum and urine. Clin Chem 1987; 33: 62-66.
5 Biosynthesis of Pteridines and the Human Immune System Pteridines constitute several biologically relevant molecules. These include important vitamins such as riboflavin and folic acid derivatives, belonging to the subclass of conjugated pteridines (see also Figure 1.1). In contrast to these vitamins, mammals have retained the ability to synthesize so-called unconjugated pteridines such as neopterin, biopterin, monapterin from guanosine triphosphate (see also Figure 1.2). The key enzyme of this pathway is GTP cyclohydrolase I (E.C. 3.5.4.16) which cleaves the purine and synthesizes 7,8-dihydroneopterin triphosphate, whereby the C-atoms from the ribose moiety are used to build the pyrazine part of the pteridine ring system. This key intermediate in pteridine biosynthesis is then converted by two subsequent enzymes (6-pyruvoyltetrahydropterin synthase and sepiapterin reductase) to 5,6,7,8-tetrahydrobiopterin, which acts as essential cofactor in several enzymatic hydroxylation reactions. Alternatively, 7,8-dihydroneopterin triphosphate is cleaved by phosphorylases to 7,8dihydroneopterin, which leaks from the cells and gives rise to the neopterin concentrations observed in culture supernatants and body fluids.
5.1 Immunological activation and cytokines Figure 5.1. shows a very simplified scheme of what may be considered the framework of the events ultimately leading to immunologically triggered increase of neopterin production and release in vivo. The immune system recognizes a nonself structure, i.e., a modified cellular structure such as a virally infected cell expressing viral antigens on its surface, an allogeneic cell (after allotransplantation), or a malignantly transformed cell. Alternatively, in conditions such as sepsis, blood cells may be confronted with high concentrations of endotoxins (lipopolysaccharide), or patients with various diseases may receive immunomodulating therapy (exogenous application of interferons, interleukins, tumor necrosis factor). All these activation stimuli then cause the release of cytokines by blood cells. The formation of cytokines is embedded in an overwhelmingly complex network of interactions involving cell-to-cell communications, but also mediator feed-back and autocrine regulation loops. This system is by no means fully understood today, and even the description of only the established facts, is far beyond the scope of this monograph. The cytokines formed are potent modulators and
34
5 Biosynthesis of Pteridines and the Human Immune System
Figure 5.1 : Simplified scheme of immune activation and some ofits actions on metabolic pathways Abbreviations: MHC, major histocompatibility complex; IDO, indoleamine 2,3-dioxygenase; GTP-CH I, GTP cyclohydrolase I.
regulators of a multitude of different cell systems such as fibroblasts, macrophages, and also tumor cell lines in cell culture.
5.2 Cytokines and pteridine biosynthesis It has been shown that for neopterin formation and release, interferon gamma and tumor necrosis factor alpha are the key cytokines, and macrophages are the most important cellular source (Huber et al., 1984; Werner et al., 1989). Interferon gamma and tumor necrosis factor alpha are known to cause a number of changes on the target cells. These include, e.g., suppression of collagen and steroid synthesis as well as increased formation of major histocompatibility complex (MHC) antigens, induction of the tryptophan-cleaving enzyme indoleamine 2,3dioxygenase, induction of the pteridine-synthesizing enzyme GTP-cyclohydrolase I, and, at least in murine cells, induction of the enzyme responsible for formation of nitrogen oxide, NO synthase. Hence, in clinical studies neopterin concentrations are often correlated with levels of products resulting from these cytokine effects, such as beta-2 microglobulin (a degradation product of the MHC-antigen
35
5.2 Cytokines and pteridine biosynthesis Table 5.1
Reridine* synthesis in human cells
Cell Macrophages (blood) THP-1 Fibroblasts A 431 A 498 A 549 Sk-HEP-1 U-138-MG Τ 24
Control Neo Bio -
-
-
-
-
-
-
-
-
-
-
-
-
+
-
+ +
Neo +++ +++ + + +
+ + + + + +
Interferon gamma Bio Neo/Bio + + + + + + + + + + + + + + +++
62 51 0.24 0.52 0.18 0.15 0.16 0.80 0.02
* Neo, neopterin; Bio, biopterin; " -, < 1; +, 1 to 10; ++, 10 to 100; + + + , 100 to 600 pmol per mg protein.
Cells were cultivated with or without interferon gamma for 72 hours, harvested, and the cytosolic fraction oxidized with acidic iodine solution. Intracellular concentrations of pteridines were then measured by HPLC with fluorescence detection. (Compiled from Werner et al., 1989; Werner-Felmayer et al, 1990a)
molecules), or kynurenine and quinolinic acid (tryptophan metabolites). These cytokine actions, outlined in Figure 5.1, are indeed only a small fraction of all actions exerted by interferon gamma and tumor necrosis factor alpha: it is known, for example, that more than 20 proteins (of mostly unknown function and significance) are under the regulation of these two potent cytokines in cultured cells ( Weil et al, 1983). In vitro, a number of human cells are triggered by interferon gamma to synthesize increased amounts of neopterin (Table 5.1). Among these, macrophages and THP-1 monocytoma cells release much more neopterin than biopterin derivatives. What is the mechanism of this increased pteridine biosynthesis? Interferon gamma induces exclusively the activity of the first enzyme of pteridine biosynthesis, GTP cyclohydrolase I, whereas the two subsequent enzyme activities in the biosynthesis of 5,6,7,8-tetrahydrobiopterin, namely, 6-pyruvoyl-tetrahydropterin synthase and sepiapterin reductase, are constitutively present in the cells and are unaffected by interferon gamma (Figure 5.2). The amounts of neopterin and biopterin accumulating in the cells are determined by the relative activities of the induced GTP cyclohydrolase I versus the constitutively present activity of 6-pyruvoyl-tetrahydropterin synthase: in human macrophages, GTP cyclohydrolase I activity exceeds the activity of the 6-pyruvoyl-tetrahydropterin synthase (Figure 5.2). 7,8-Dihydroneopterin triphosphate, the product of the first reaction catalyzed by GTP cyclohydrolase I, therefore accumulates in macrophages stimulated by interferon gamma. The triphosphate moiety is cleaved by the omnipresent phosphatases, and the result-
36
5 Biosynthesis of Pteridines and the Human Immune System Human macrophages Enzyme activities
GTP CH I Π Control
Figure 5.2:
PTPS
Human fibroblasts Enzyme activities
GTP CH I
PTPS
IIFN gamma stimulation
Enzyme activities (pmol per mg protein per minute) of the biosynthetic pathway from guanosine triphosphate to 5,6,7,8-tetrahydrobiopterin in human cells with and without stimulation by interferon gamma
Abbreviations: GTP-CH I, GTP cyclohydrolase I; PTPS, 6-pyruvoyl-tetrahydropterin synthase; SR, sepiapterin reductase; IFN, interferon.
Cells were cultivated with or without interferon gamma for 72 hours, harvested, broken, and the enzyme activities determined in cytosolic fractions. Enzyme assays are based on the analysis of the respective products by HPLC with fluorescence detection.
ing molecular species, 7,8-dihydroneopterin and neopterin can leak from the cells. In fibroblasts, in contrast, GTP cyclohydrolase I activities always remain smaller than 6-pyruvoyl-tetrahydropterin synthase and sepiapterin reductase activities (Figure 5.2). Therefore, the 7,8-dihydroneopterin triphosphate synthesized by GTP cyclohydrolase I is efficiently converted to 5,6,7,8-tetrahydrobiopterin without significant accumulation of neopterin derivatives ( Werner et al., 1990). In murine cells, the following differences are seen compared to human cells: at first, no neopterin derivatives are found irrespective of cytokine treatment. Secondly, interferon gamma is less active than on human cells, and thirdly, murine macrophages and macrophage lines contain high amounts of pteridines already when being unstimulated (Table 5.2). Murine dermal fibroblasts, however, behave quite similarly as their human counterparts with respect to tumor necrosis factor alpha which, like in the human cells, causes a severalfold increase in GTP cyclohydrolase I activity.
5.2 Cytokines and pteridine biosynthesis Table 5.2
Cytokine induced pteridine synthesis in human and murine cells
Cell human
murine
37
macrophages (blood) THP-1 fibroblasts macrophages (spleen) macrophages (perit.) Ρ 388 D l J 774 A l fibroblasts
Control Bio Neo -
-
-
IFN-gamma* Neo Bio
TNF-alpha Neo Bio
+++
+
+++ +
+ ++
+
+ +
-
-
-
-
_
++
-
+++
_
+++
-
++
-
+++
-
+++
-
+++ +++ -
-
+++ +++ +
-
+++ +++ + +
* IFN, interferon; TNF, tumor necrosis factor; Neo, neopterin; Bio, biopterin; ** -, < 1; +, 1 to 10; ++, 10 to 100; +++, 100 to 600 pmol per mg protein.
(Compiled from Werner et al., 1989\ Werner-Felmayer et al, 1990a)
Why do the murine cells not synthesize neopterin? This phenomenon is caused by the two orders of magnitude higher activity of 6-pyruvoyl-tetrahydropterin synthase (Figure 5.3). The high activity of this enzyme is able to convert, irrespective of the GTP cyclohydrolase I activity, all synthesized 7,8-dihydroneopterin triphosphate with high efficiency to 5,6,7,8-tetrahydrobiopterin, before it can be attacked and degraded by phosphatases. What is the precise mechanism of the activation of GTP cyclohydrolase I? The answer to this question has not been given yet. It is known, however, that activation takes about 30 hours to reach maximum levels, and it is inhibited by cycloheximide. The Km for the substrate GTP does not change during the activation process. This suggests that, like other cytokine actions, the mechanism of activation may be a de novo synthesis of GTP cyclohydrolase I protein. Studies using antisera against murine liver GTP cyclohydrolase I suggest that the cytokine-induced form of the enzyme may differ from the liver enzyme (Werner ER, Werner-Felmayer G, Fuchs D, Hausen A, Reibnegger G, Yim JJ, Wächter H: Impact of tumor necrosis factor-alpha and interferon-gamma on tetrahydrobiopterin synthesis in murine fibroblasts and macrophages. Submitted for publication). This observation is in line with other findings such as, e.g., cytokine-induced superoxide dismutase and tryptophan-cleaving dioxygenases: also these cytokine-induced enzymes are different from the conventionally observed enzyme proteins.
38
5 Biosynthesis of Pteridines and the Human Immune System
PTPS activity 40 η
30
20
10
-
0 -I
e ^ · macrophages
G murine Figure 5.3:
fibroblasts
• human
Activity of 6-pyruvoyl-tetrahydropterin synthase (PTPS; in pmol per mg protein per minute) in human versus murine macrophages and fibroblasts
The enzyme is constitutively present in the cells; its activity remains unchanged upon cytokine treatment. Notably, essentially the same results are found when comparing several h u m a n and murine cell lines.
5.3 Inducers of pteridine synthesis in human cells As already outlined above, macrophages and monocytes are the major producers of neopterin in man, and interferon gamma is the strongest stimulus (Huber et al., 1984). However, great care has to be taken when interpreting experimental data: wrong interpretations are easily possible if, for instance, the cells investigated are not very pure, or if culture media contain endotoxins, and the like. A most important issue in this respect is the fact that Τ cells are capable of synthesizing interferon gamma upon a variety of stimuli, and even very few residual Τ cells in, e.g., a preparation of macrophages are sufficient to release enough interferon gamma to fully activate neopterin biosynthesis by macrophages. As an experimental tool, THP-1 monocytoma cells are therefore extremely helpful and valuable: they behave quite similarly to macrophages regarding neopterin formation, but due to being a clonal tumor cell line they are with certainty absolutely devoid of any Τ cell contamination. The THP-1 cells are
5.3 Inducers of pteridine synthesis in human cells
39
commercially available (.American Type Culture Collection, Rockville, Maryland, U.S.A.). As mentioned before, impurities of additives or culture media, in particular lipopolysaccharide contaminations, play a major role when investigating pteridine metabolism of cells in vitro. In peripheral blood mononuclear cells, as little as 10 pg per mliter lipopolysaccharide lead already to half maximum neopterin response, and 100 pg per mliter are sufficient to fully activate the cells. In such cell populations, i.e., in the presence of Τ lymphocytes, lipopolysaccharide acts by activating Τ cells to produce cytokines (interferon gamma, tumor necrosis factor alpha) which then trigger neopterin formation and release by monocytes/macrophages ( Werner-Felmayer et al., 1989). Table 5.3 gives a summary of the present knowledge concerning inducers of pteridine synthesis in human macrophages and THP1 cells. Table 5.3
Inducers of pteridine synthesis in human macrophages and THP-1 cells (in decreasing order of stimulating potency)
Stimulus
Costimulus
interferon gamma
lipopolysaccharide tumor necrosis factor alpha dexamethasone
lipopolysaccharide
dexamethasone
interferon beta
lipopolysaccharide tumor necrosis factor alpha
interferon alpha
lipopolysaccharide tumor necrosis factor alpha
A detailed investigation of cytokines is still missing, but several inducers such as lectins, phorbolmyristate acetate, zymosan, interleukin 2, interleukin 6, granulocyte-monocyte colony stimulating factor, the calcium ionophore A 23471 and the chemotactic tripeptide N-formyl-methionyl-leucyl-phenylalanine have been tested as single agents, but were found to be poor inducers. Tumor necrosis factor alpha, though being a potent costimulator, is almost inactive in inducing pteridine synthesis in purified macrophages as single agent. In peripheral blood mononuclear cells, the situation is very different from that in pure macrophages due to the presence of Τ lymphocytes which are potent sources of cytokines when being activated. Thus, in such cell populations being one step more similar to the true in v/vo-situation than purified macrophages, more agents act stimulatory. For example, whereas the activating potencies of the three different types of interferons (alpha, beta, gamma) are markedly different on macrophages, in peripheral blood mononuclear cells many stimuli are able to equally evoke maximum neopterin response. These include all interferons, lipopolysaccharide,
40
5 Biosynthesis of Pteridines and the Human Immune System
interleukin 2, or phytohemagglutinin, to name just a few. Even typical Β cell stimulators such as pokeweed mitogen lead to pronounced neopterin formation in peripheral blood mononuclear cells, presumably by triggering cytokine formation cascades. Consistent with the assumption that in peripheral blood mononuclear cells lymphocyte activation participates in producing the observed effects, anti-inflammatory agents such as dexamethasone and cyclosporin A are capable of suppressing most of the cited effects other than those of interferon gamma on the mixed cells ( Werner-Felmayer et ai, 1989). Moreover, using specific antibodies against human interferon gamma, it has been demonstrated that interferon gamma is an essential component of the lymphokines stimulating neopterin formation in activated peripheral blood mononuclear cells (Huber et al., 1984). In fibroblasts, response to cytokines differs somewhat from macrophages. Due to the higher 6-pyruvoyltetrahydropterin synthase activity, biopterin instead of neopterin is the major product of the induced GTP cyclohydrolase I. Tumor necrosis factor alpha, which is almost inactive on macrophages/monocytes as single inducer, is as effective as interferon gamma on human (and murine) fibroblasts (unpublished data).
5.4 Cell culture techniques How can the capacity to induce pteridine biosynthesis of a given cytokine be determined experimentally ? The most reliable technique is to determine the activity of the relevant enzyme, GTP cyclohydrolase I, after 48 hours of cytokine action, and to relate this activity to the protein content of the cell homogenate used: GTP cyclohydrolase I in the cells is activated up to hundred-fold by cytokines. Alternatively, the amount of pteridines released into the supernantant by a defined amount of cells during a period of 72 hours may be determined. A typical example using 5x10s cells per mliter is shown in Table 5.4.
5.4.1 Purification of human monocytes/macrophages from peripheral blood Outline Cells are purified from buffy coats obtained from blood of healthy volunteers using the standard procedures (Boyum, 1968; Ulmer and Fiad, 1979). Thus, peripheral blood mononuclear cells are enriched by density centrifugation over Ficoll. Monocytes are further purified by centrifugation over a discontinuous Percoli gradient and by plastic adherence.
5.4 Cell culture techniques
41
Table 5.4 GTP cyclohydrolase I activity, neopterin and biopterin in supernatants of human macrophages, THP-1 cells and human dermalfibroblasts(mean values and SD in parentheses, triplicates) Cell type Macrophages control IFN gamma$ THP-1 control IFN gamma Fibroblasts control IFN gamma
GTP-CHI*
Neopterin"
Biopterin"
0.05). Furthermore, to test whether there were associations between the biochemical variables and neopterin, the patients with hepatocellular carcinoma were divided into two groups according to total urinary neopterin values (745 μηιοί per mol creatinine was taken as cut-off limit), and the other variables were compared between both groups thus formed. Of the variables listed above, significant differences were detected for tumor size (positive association; Ρ < 0.05), alkaline phosphatase (positive association; Ρ < 0.05), and serum AFP (positive association, Ρ < 0.01). The probability for three-year survival was 17% for all patients. In the group with lower concentration of total neopterins (below and up to 745 μηιοί per mol creatinine), the median survival time was 18 months versus eight months in the group with higher neopterin (Figure 8.49). The difference between the survival probabilities for both groups studied was statistically significant (P < 0.05). It is to be noted that the diagnostically discriminating value of neopterin in this group of patients was not very high since there was a considerable overlap of values for patients and controls. Nevertheless, there was a significant predictive value of neopterin concentrations also in this group of cancer patients, pointing to an association of high neopterin and poor prognosis in a manner very similar to the studies reported and discussed in the preceding chapters.
8.6 Breast cancer Breast cancer in the western hemisphere accounts for more deaths in the female population than any other malignancy: about one quarter of all cancers in women are breast carcinomas. Despite a long history and evolution of therapeutic experience, more than half the patients initially treated by locally "curative" modalities finally relapse and succumb to their disease within less than 10 years after primary treatment. The value of neopterin determinations has been investigated in this group of cancer patients but the results have been disappointing: breast cancer patients show elevated neopterin levels only in rare instances, and this statement holds true even for patients with advanced breast cancer ( Wiegele et al., 1984; von Ingersleben et al., 1988). Urinary neopterin concentrations were measured in 43 women before initiating therapy ( Wiegele et al., 1984). Mean neopterin values and frequencies of elevated neopterin levels (compared with the usual age-dependent upper limits of normal
8 Neopterin in Malignant Diseases
162 Neopterin in urine
Number of subjects
400
20
200
10
I
II
III
IV
I
Tumor stage
Figure 8.50:
I'M
I - -
II
π III
IV
Tumor stage •
normal neopterin
•
elevated neopterin
Stage dependence of neopterin concentrations (mean, SD, μηιοί per mol creatinine) and frequencies of elevated neopterin concentrations in urine of patients with breast carcinoma. Neopterin in urine
Number of subjects
400
200
no
yes
no
Metastases
Figure 8.51:
yes
Metastases •
normal neopterin
•
elevated neopterin
Differences of neopterin concentrations (mean, SD, μηιοί per mol creatinine) and frequencies of elevated neopterin concentrations in urine of patients with breast carcinoma without and with presence of metastases.
range) in dependence on tumor stage are shown in Figure 8.50. There is a slight stage dependence of frequencies of elevated neopterin (P = 0.030; chi-square test for linear trend of proportions), but even in stage IV the frequency is disappointingly low. Taken together, only eigth of the 43 women (18%) had raised neopterin. No influence of grading of the tumor was observed (data not shown). Of the 43 women, nine had metastatic breast cancer: four of the women with raised neopterin fell into this class. A comparison of these two groups of patients is
8.8 Malignant melanoma
163
shown in Figure 8.51; there is a significantly higher mean value in the metastatic women (P < 0.05; Student's t test) and significantly more patients with metastatic breast cancer show raised neopterin than those with non-metastatic breast cancer (odds ratio = 6; Ρ = 0.027). Additionally, in 36 of the patients also plasma levels of the tumor markers carcinoembryonic antigen (CEA) and tissue peptide antigen (TPA) were measured; these markers had sensitivities of 58% (CEA) and 39% (TPA); the combination of CEA and TPA had a joint sensitivity of 67%. Neopterin failed to contribute additional information. The second study (von Ingersleben et al., 1988) showed essentially the same results for serum neopterin concentrations. Thus, it must be concluded that in breast cancer patients neopterin is only rarely increased, and at present, there is no evidence that neopterin measurements might be of use in this patient group. It should be stressed, however, that the possibility of a predictive value of neopterin in breast cancer patients has not been ruled out so far; breast cancer is generally far more slowly progressing than, e.g., lung cancer. Therefore, within the years to come, the data accumulated for the cited papers should be reevaluated under the aspects of survival expectation of the patients.
8.7 Cancers of the head and neck region A picture has emerged on neopterin in patients suffering from malignancies of the head and neck region which is very similar to that shown above for breast cancer: only rarely is neopterin found in increased concentrations in these patients in serum (Dhondt et al., 1982) and urine (Dhondt et al., 1982; Reibnegger et al., 1982): for example, only seven of 30 patients with carcinoma of the larynx, oral cavity, pharynx, paranasal sinuses or with cervical metastases showed urinary neopterin levels above the upper limits of the age- and sex-dependent normal ranges (Reibnegger et al., 1982).
8.8 Malignant melanoma The clinical significance of urinary neopterin concentrations in the follow-up of 151 patients after exeresis of malignant melanoma has been studied by a French group (Mura et al., 1989). The results of this study are interesting because they point to a possible relevance of neopterin monitoring for detecting visceral metastasis. There were 123 patients remaining in clinical remission during the observation period; these showed a mean neopterin excretion of 188 μιηοΐ per mol
164
8 Neopterin in Malignant Diseases
creatinine (SD, 84). In particular, these patients had generally neopterin levels within the normal range. In contrast, the remaining 28 patients developed metastasis during follow-up (10 subjects, ganglionic; six, skin; 12, visceral metastasis). Skin metastasis was associated with essentially the same neopterin patterns that was found in patients with remission; mean neopterin was 188 μηιοί per mol creatinine (SD, 71). On the contrary, patients with ganglionic or visceral metastasis showed much higher neopterin excretion values; mean levels were 412 μηιοί per mol creatinine (SD, 102) for ganglionic, and 554 μηιοί per mol creatinine (SD, 256) for visceral metastasis, irrespective of precise localization. The results are interesting since detection of ganglionic or visceral metastasis after malignant melanoma is a difficult task, in contrast to skin metastasis. Notably, the authors reported that neopterin increases always preceded clinical deterioration by several weeks or months.
8.9 Neopterin in malignant diseases - a summary The body of knowledge being available so far on neopterin concentrations in body fluids during human disease as well as in vitro experiments, suggests that neopterin levels during malignant disease reflect the interaction between cancer cells and the immune system of the host. There is no indication that cancer cells themselves are excreting increased amounts of neopterin (with the exception of the monocytoma cell line, THP-1; see Chapter 5). The results obtained from several independent research workers at quite different locations all over the world agree in the following major aspects: neopterin concentrations are raised in many cancer patients, depending on the tumor type and location and on the extent of the malignant process. Additionally, a positive correlation between high neopterin and high risk of rapid progression of the disease has been consistently found. This latter point deserves some comments: from the standpoint of a naive immunosurveillance theory, one would rather expect a beneficial effect of cellular immune activation (which is responsible for the increased neopterin concentrations). In addition, it has been known since a long time that immune cells from cancer patients show diminished rather than enhanced in vitro response to mitogenie or allogenic stimulation. How can the results from the studies on neopterin in malignant diseases be reconciled with these longstanding concepts? In the view of the authors, the data accumulated on neopterin concentrations in malignant diseases indicate that certain immunologic phenomena and mechanisms are activated. One must not conclude from this obvious fact, however, that a complete and - from the point of the host - successful immune reaction and immune-mediated complete elimination of the tumor cells will necessarily take
8.9 Neopterin in malignant diseases - a summary
165
place. Neopterin release in vitro seems to be associated with quite early events of cellular immune response and is not directly linked with the cytotoxic effector function of, e.g., activated lymphocytes or monocytes/macrophages. Interferon gamma is known to prime macrophages in vitro for, e.g., tumoricidal activity. The primed macrophages must be induced, however, by a second signal such as phorbolesters to initiate the "respiratory burst", i.e., the effector functions, in vitro. In experiments it has been shown that neopterin is released already during the priming step, and its production and release can be clearly dissociated from the release of activated oxygen species during the respiratory burst (Nathan, 1986). It therefore seems that in tumor patients with high neopterin levels very early events of the immune activation cascade are activated. Persistent presence of cytokines such as interferon gamma may exert suppressive effects on cells, and may in fact be responsible for the observed reduction of in vitro responsiveness. In all the diseases discussed in this monograph which are associated with high neopterin concentrations (allograft rejections, viral and certain microbial infections, trauma, autoimmune states), Τ cell responses in vitro are typically diminished, possibly by the presence in vivo of cytokines due to persistent immune activation (Fuchs et al., 1989/1990). This reasoning is compatible with the observed presence of increased amounts of endogenous interferon gamma in patients with hematological malignancies (Denz et al., 1990). Furthermore, similar arguments are likely to hold true for the explanation of the findings in HIV infection (see Chapter 9). Summarizing the data, it is beyond doubt now that neopterin determination in urine or serum of cancer patients adds significant and clinically relevant information on the immune status of patients. Neopterin is generally not very useful as a screening marker for early diagnosis of cancer: in early stages, diagnostic sensitivities are usually low (with the exception of most hematologic malignancies in which high levels of neopterin are detectable already in earlier stages). Rather, neopterin is particularly useful for prognosis and for follow-up of patients with cancers of quite different locations. Neopterin is not a tumor marker; by its intimate association with immune activation phenomena it contributes a quality of information which is not easily obtained by the usual indicators of a malignant process.
References Abate G, Cornelia P, Marfella A, Santelli G, Nitsch F, Fiore M, Perna M: Prognostic relevance of urinary neopterin in non-Hodgkin's lymphomas. Cancer 1989; 63: 484-489. Aulitzky W, Frick J, Fuchs D, Hausen A, Reibnegger G, Wächter H: Significance of urinary neopterin in patients with malignant tumors of the genitourinary tract. Cancer 1985; 55: 1052-1055. Bast RC, Klug TL, St John E, Jenison E, Niloff JM, Lazarus H, Berkowitz RS, Leavitt Τ, Griffiths Τ, Parker L, Zurawski VR, Knapp RC: A radioimmunoassay using a monoclonal
166
8 Neopterin in Malignant Diseases
antibody to monitor the course of epithelial ovarian cancer. Ν Engl J Med 1983; 309: 883887. Bichler A , Fuchs D, Hausen A , Hetzel H, König Κ, Wächter Η: Urinary neopterin excretion in patients with genital cancer. Clin Biochem 1982; 15: 38-40. Bichler A , Fuchs D, Hausen A , Hetzel H, Reibnegger G, Wächter Η: Measurement of urinary neopterin in normal pregnant and non-pregnant women and in women with benign and malignant genital tract neoplasms. Arch Gynecol 1983; 233: 121-130. Conrad F, Bodner E, Fuchs D, Grubauer G, Hausen A , Reibnegger G, Wächter H: Determination of neopterin - a marker of cellular immunity - in gastrointestinal and pancreatic carcinoma. In: Biochemical and Clinical Aspects of Pteridines (Pfleiderer W , Wächter H, Curtius Η-C, eds) Walter de Gruyter, Berlin New York, 1984, vol 3, pp 357366. Conrad F, Salzer G M , Fuchs D, Hausen A , Reibnegger G, Wächter H: Neopterin - a marker of the cellular immune response in patients with lung cancer. In: Biochemical and Clinical Aspects of Pteridines (Wächter H, Curtius Η-C, Pfleiderer W, eds) Walter de Gruyter, Berlin N e w York, 1985, vol 4, pp 535-543. Conrad F, Fuchs D, Hausen A , Reibnegger G, Werner ER, Salzer G M , Wächter H: Prognostic value of neopterin in patients with lung cancer. In: Biochemical and Clinical Aspects of Pteridines (Pfleiderer W, Wächter H, Blair JA, eds) Walter de Gruyter, Berlin New York, 1987, vol 5, pp 233-241. Denz H, Grünewald Κ, Thaler J, Huber H, Fuchs D, Hausen A , Reibnegger G, Werner ER, Wächter Η : Urinary neopterin as a prognostic marker in haematological neoplasias. Pteridines 1989; 1: 167-170. Denz H, Fuchs D, Huber H, Nachbaur D, Reibnegger G, Thaler J, Werner ER, Wächter Η: Correlation between neopterin, interferon-gamma and haemoglobin in patients with haematological disorders. Eur J Haematol 1990; 44: 186-189. Dhondt J-L, Hayte J-M, Bonneterre J, Adenis L, Démaillé A , Arduin P, Farriaux J-P: Pteridines in urine and serum of cancer patients. In: Biochemical and Clinical Aspects of Pteridines (Wächter H, Curtius Η-C, Pfleiderer W , eds) Walter de Gruyter, Berlin New York, 1982, vol 7, pp 133-140. Frick J, Aulitzky W, Fuchs D, Hausen A , Joos H, Reibnegger G, Wächter H: The value of urinary neopterin as an immunological parameter in patients with malignant tumors of the genitourinary tract. Urol Int 1985; 40: 155-159. Fuchs D, Malkovsky M, Reibnegger G, Werner ER, Forni G, Wächter H: Endogenous release of interferon-gamma and diminished response ofperipheral blood mononuclear cells to antigenic stimulation. Immunol Lett 1989/1990; 23: 103-108. Fuith LC, Dapunt O, Hetzel H, Reibnegger G, Wächter H: Second-look operation in women with ovarian cancer: I. Concentrations of neopterin in urine and CA 125 in serum at secondlook laparotomy. Tumor Diagn Ther 1990a; 11: 147-151. Fuith LC, Fuchs D, Hausen A , Hetzel H, Reibnegger G, Werner ER, Wächter H: Urinary neopterin excretion in patients with uterine sarcomas. Cancer 1990b; 65: 1228-1231. Fujita K, Shinpo K, Kimura E, Sugimoto T, Matsuura S, Sawada M , Yamaguchi T, Nagatsu T: Combined use of urinary pteridines measured by radioimmunoassay and polyamines as tumor markers. Biogen Amines 1987; 4: 33-43. Gadner H, Krepier Ρ, Kummer M , Pawlowsky J, Busch U, Haas H, Höcker Ρ, Kärcher ΚΗ, Kundi Μ, Messner H, Mutz I, Pichler E, Rücker J, Tulzer W, Urban C: Derzeitiger Stand der Leukämiebehandlung im Kindesalter. Wien Med Wochenschr 1983; 133: 567-572.
8.9 Neopterin in malignant diseases - a summary
167
Hausen A, Fuchs D, Grünewald Κ, Huber Η, König Κ, Wächter Η: Urinary neopterin as marker for haematological neoplasias. Clin Chim Acta 1981; 117: 297-305. Hausen A, Fuchs D, Grünewald Κ, Huber Η, König Κ, Wächter Η: Urinary neopterin in the assessment of lymphoid and myeloid neoplasia, and neopterin levels in haemolytic anaemia and benign monoclonal gammopathy. Clin Biochem 1982; 15: 34-37. Ho AD, Moritz D, Rensch K, Hunstein W, Kirchner Η: Deficiency in interferon production of peripheral blood leukocytes from patients with non-Hodgkin's lymphoma. J Interferon Res 1988; 8: 405-413. Joos H, Aulitzky W, Frick J, Fuchs D, Hausen A, Reibnegger G, Wächter Η: Die UrinNeopterin-Ausscheidung beim Hodentumorpatienten - ein biochemischer Parameter? Helv Chir Acta 1986; 53: 329-331. Kawasaki H, Watanabe H, Yamada S, Watanabe Κ, Suyama A: Prognostic significance of urinary neopterin levels in patients with hepatocellular carcinoma. Tohoku J Exp Med 1988; 155: 311-318. Kuzmits R, Ludwig H, Legenstein E, Szekeresz Τ, Kratzik C, Hofbauer J: Neopterin as tumour marker. Serum and urinary neopterin concentrations in malignant diseases. J Clin Chem Clin Biochem 1986; 24: 119-124. Lewenhaupt A, Ekman P, Eneroth P, Eriksson A, Nilsson B, Nordström L: Serum levels ofneopterin as related to the prognosis of human prostatic carcinoma. Eur Urol 1986; 12: 422-425. Lewenhaupt A, Ekman P, Eneroth P, Nilsson B: Tumour markers as prognostic aids in prostatic carcinoma. Brit J Urol 1990; 66: 182-187. Miller KL, Silverman PH, Kullgren B, Mahlmann LJ: Tumor necrosis factor alpha and the anemia associated with murine malaria. Infect Immunol 1989; 57: 1542-1546. Mura Ρ, Barriere M, Papet Y, Reiss D, Camenen I, Vaillant L, Lorette G: The clinical significance of urinary neopterin in the follow-up of patients after exeresis of a malignant melanoma. Pteridines 1989; 1: 19-21. Murphy M, Perussia B, Trinchieri G: Effects of recombinant tumor necrosis factor, lymphotoxin, and immune interferon on proliferation and differentiation of enriched hematopoietic precursor cells. Exp Hematol 1988; 16: 131-138. Nathan CF: Peroxide and pteridine: a hypothesis of the regulation of macrophage antimicrobial activity by interferon-gamma. In: Interferon 7 (Grosser J, ed) Academic Press, London, 1986, pp 125-143. Putzki H, Aschern F, Henkel E, Heymann H: Neopterin - a tumor marker in colorectal carcinoma? Dis Colon Rectum 1987; 30: 879-883. Reibnegger G, Fuchs D, Hausen A, Wächter H, Bichler E, Böheim Κ: Urinary neopterin in patients with head and neck cancer. In: Biochemical and Clinical Aspects of Pteridines (Wächter Η, Curtius Η-C, Pfleiderer W, eds) Walter de Gruyter, Berlin New York, 1982, vol 1, pp 207-215. Reibnegger G, Fuchs D, Hausen A, Kostron-Krainz C, Wächter H: Urinary neopterin in malignant diseases of childhood. A marker for activity of the cell-mediated immunity. Tumor Diagn Ther 1984; 5: 234-237. Reibnegger G, Bichler A, Dapunt O, Fuchs D, Fuith LC, Hausen A, Hetzel H, Lutz H, Werner ER, Wächter H: Statistical evaluation of urinary neopterin in the prognosis and follow-up of patients with cervical cancer. Tumor Diagn Ther 1985; 6: 215-222. Reibnegger G, Bichler A, Dapunt O, Fuchs D, Fuith LC, Hausen A, Hetzel H, Lutz H, Werner ER, Wächter H: Neopterin as a prognostic indicator in patients with carcinoma of the uterine cervix. Cancer Res 1986; 46: 950-955.
168
8 Neopterin in Malignant Diseases
Reibnegger G, Hetzel H, Fuchs D, Fuith LC, Hausen A, Werner ER, Wächter H: Clinical significance of neopterin for prognosis and follow-up in ovarian cancer. Cancer Res 1987; 47: 4977-4981. Sambo A, Giannatasio B, Flamini G, Nicoletti G, Magalini S, Luciani G, Leone G, Cittadini A: Preliminary observations on urinary neopterin as a marker of neoplastic proliferation and lymphocyte activation. Acta Med Rom 1985; 23: 533-545. Santelli G, Mariella A, Abate G, Cornelia P, Nitsch F, Perna M: Urinary neopterin levels in hematologic malignancies. Tumori 1986; 72: 139-143. Shintaku H, Yamato K, Sawada Y, Miyata Y, Isshiki G, Hase Y, Tsuruhara Τ, Oura Τ, Tanaka M, Nakamura S: Urinaiy neopterin in children with malignant diseases. In: Biochemical and Clinical Aspects of Pteridines (Wächter H, Curtius Η-C, Pfleiderer W, eds) Walter de Gruyter, Berlin - New York, 1985, vol 4, pp 501-513. Thomas P, Mura Ρ, Tallineau C, Bounaud MP, Reiss D, Bontoux D: Intérêt du dosage del la néoptérine urinaire dans le myélome multiple. Rev Rhumatisme 1985; 52: 381-383. von Ingersleben G, Souchon R, Fitzner R: Serum neopterin levels in lung and breast cancer patients undergoing radiotherapy and/or chemotherapy. Int J Biol Markers 1988; 3: 135139. Wächter H, Hausen A, Graßmayr Κ: Erhöhte Ausscheidung von Neopterin im Ham von Patienten mit malignen Tumoren und mit Viruserkrankungen. Hoppe-Seyler's Ζ Physiol Chem 1979; 360: 1957-1960. Wiegele J, Margreiter R, Huber C, Dworzak E, Fuchs D, Hausen A, Reibnegger G, Wächter H: Urinary neopterin excretion in breast cancer patients. In: Biochemical and Clinical Aspects of Pteridines (Pfleiderer W, Wächter Η, Curtius Η-C, eds) Walter de Gruyter, Berlin New York, 1984, vol 3, pp 417-424. Zitko M, Andrysek O, Cernovska I, Vasickova M: Renal excretion of neopterin and biopterin in patients with malignant melanoma and Hodgkin's disease. Neoplasma 1986; 33: 387391. Zoumbos NC, Djeu JY, Young NS : Interferon is the suppressor of hematopoiesis generated by stimulated lymphocytes in vitro. J Immunol 1984; 133: 769-774.
9 Neopterin in Infectious Diseases The observation of raised neopterin excretion into urine not only in patients with cancer but also with viral infections ( Wächter et al., 1979) was a keystone in the process leading finally to recognition of neopterin as a marker for cellular immune activation. These initial data are easily explained now in terms of the presence of cytokines during ongoing infection, particularly of interferon gamma. Therefore, before starting the discussion of neopterin in various infectious diseases it might be appropriate to recall some facts about the roles of interferon gamma during such states (Dijkmans and Biliau, 1988). Vertebrates have evolved numerous mechanisms to keep microbial and viral parasites in check, ranging from primary non-specific mechanisms to precisely fine-regulated specific immune reactions, comprising cellular and humoral components; and interferon gamma plays important roles for both types of immunity. The two main cell types involved in cell-mediated immunity are Τ lymphocytes and macrophages. Since interferon gamma is produced by Τ cells and is probably the most important activator of macrophages, a pivotal role of the lymphokine in cellular immunity can be anticipated. Interferon gamma has anti-viral activities in vitro on a large number of cell types including fibroblasts, macrophages and lymphoid cells. In vivo, the lymphokine may help to control viral infections by direct antiviral activity, but also by its effect on macrophage phagocytosis, on activity of natural killer cells, on formation of cytolytic Τ cells and on antibody production. Protection by endogenous interferon gamma against (mainly intracellularly living) microbes can occur through different mechanisms. First, the lymphokine has a well-documented and profound effect on the effector functions of monocytes/macrophages. These cells possess a repertoire of many different mechanisms which are essential in the defense against microbes, and interferon gamma can markedly enhance such activities. Also direct inhibitory effects of interferon gamma on certain organisms have been documented in cells which are usually not considered to be phagocytes, such as hepatocytes and fibroblasts. Notably, interferon gamma can also interfere with humoral mechanisms; it may have net positive or negative effects on Β cell activation depending on the type of the Β cell and on the presence of other Β cell growth factors. In addition to effects on the synthesis of antibodies, interferon gamma exerts a profound influence on the antibody-induced effector mechanisms. Summarizing, interferon gamma has many different activities on various kinds of immune response against viral and microbial pathogens. It is not surprising, therefore, that neopterin in various types of infectious diseases has attracted considerable interest as a sensitive indicator of the ongoing immune reactions.
170
9 Neopterin in Infectious Diseases
The various aspects of neopterin in infectious diseases will be discussed in the following order: (I), viral infections; (II), a separate section devoted to infection by human immunodeficiency virus; (III), infections by intracellular protozoa; (IV), infections by bacteria; and (V), sepsis and trauma.
9.1 Infections by viruses A discussion of various aspects of neopterin determination in different forms of infections with hepatitis viruses will serve as a paradigm to introduce this section. Other viral infections will be treated thereafter, andfinally,the neopterin response to vaccination with attenuated live viruses or with viral antigens will be reported.
9.1.1 Neopterin concentrations in viral liver disease Viral hepatic diseases belong to the most frequent viral infections known. The spectrum of the diseases is quite complicated; there are various serologically distinct pathogens known, and the clinical pattern may vary from an acute type disease to a chronic form. Hepatitis A, caused by an identified and serologically well-defined virus, hepatitis A virus (HAV), and non-A,non-B hepatitis, for which more than one viruses are thought to be responsible (one such virus, hepatitis C virus, HCV, has been recently identified and is probably the causative agent for a part of the non-Α, non-B hepatitis cases), contribute to about 30% of the cases worldwide; the remaining two thirds of cases are made up by hepatitis B, the causative virus of which is also well known (hepatitis Β virus, HBV). There is a reservoir of silent carriers of HBV and also of non-A, non-B hepatitis; these are a steady source of infection for other persons, and they carry an increased risk of developing a primary hepatocellular carcinoma. Hepatitis A can be diagnosed rapidly and with certainty. Development of a chronic infection with HVA has never been documented; however, fulminant cases have been reported. The disease is typically self-limiting, and all clinical and biochemical signs of hepatitis disappear within three weeks of onset of acute illness. Hepatitis Β diagnosis is more complicated; there are several serologic markers with different implications (for review, see e.g. Arnold et al., 1983). More than half of infected subjects may remain free of symptoms; 5 to 10% develop a carrier state (HBsAg carrier), and many of these individuals are likely to develop a chronic liver disease, such as cirrhosis of the liver. Non-A, non-B hepatitis is at present diagnosed by exclusion of HAV, HBV, cytomegalovirus, herpes virus and Epstein-Barr-virus infection. The transmission route is predominantly by blood transfusion; due to the lack of serologically known agents, withdrawal of infectious blood is still impossible with certainty, and
9.1 Infections by viruses
171
surrogate tests are being performed to exclude at least with some probability dangerous blood (e.g., determination of serum concentration of alanine aminotransferase or more recently, of HCV antibody titer). Non-Α, non-B hepatitis shows a markedly increased tendency to chronicity compared with hepatitis B; the course of such disease is generally mild, and frequently it may be detected only by chance. It is obvious that the complicated clinical (and, in the case of HBV, serologic) pattern results from a complex network of interactions between the virus, the infected hepatocyte and the immune system. It is believed that it is mainly the immune reaction which is responsible for destruction of hepatocytes, and thus for the clinical symptoms of hepatitis. In the acute phase it is probably cytotoxicity mediated by Τ cells; in chronic inflammation, also other mechanisms seem to participate: for example, antibodies, lymphokines, and immune complexes may trigger antibody-dependent cytotoxic reactions. The targets of all these immunological activities are probably virus-associated antigens expressed at the hepatocytes' surface. Neopterin concentrations have been measured in urines from patients with acute viral liver diseases (Farci et al., 1985; Reibnegger et al., 1988) and with chronic forms of nonA, non-B hepatitis (Farci et al., 1985; Prior et al., 1987). Acute viral hepatitis Urinary neopterin concentrations were measured in patients with acute type A, Β or non-Α, non-B hepatitis and compared with levels from clinically healthy HBsAg carriers, from patients suffering from jaundice or elevated levels of transaminases in serum in whom viral hepatitis could be excluded, and from patients with alcohol-induced hepatitis (Reibnegger et al., 1988). Figure 9.1 shows the composition of the studied subjects and median neopterin concentrations in urinary specimens for the different patient groups. In perfect accordance with expectation, there was a striking and highly significant difference between neopterin excretion levels in patients with virally caused hepatitis, and the control groups. Moreover, hepatitis A showed significantly higher levels compared with hepatitis Β (P = 0.037) or non-A, non-B hepatitis (P = 0.012). In contrast, hepatitis Β and non-Α, non-B hepatitis did not differ with respect to neopterin excretion. Of interest were the correlations between neopterin on the one hand, and the other laboratory variables on the other hand. In hepatitis A, several significant correlations with established markers were noted; they are given in Figure 9.2. In hepatitis B, neopterin was correlated with the ratio of gamma-glutamyl transpeptidase to aspartate aminotransferase (Spearman's rank correlation coefficient R^ 0.35; Ρ < 0.050); in non-Α, non-B hepatitis, a significant correlation was observed with alkaline phosphatase (R, = 0.62; Ρ < 0.025). Furthermore, strong correlations were found between neopterin and routine liver function tests when individual patients were followed-up during the course of their disease.
172
9 Neopterin in Infectious Diseases
In sum, urinary neopterin was elevated above the upper limits of normal range in 51 of 53 (96%) patients with acute hepatitis; there were only two patients diagnosed as having non-A, non-B hepatitis with normal neopterin values. Generally, recovery from the disease in individuals was associated with decreasing and Groups
investigated
H
Hepatitis A
H
Hepatitis Β
[
: Neopterin in urine
1 N o n - A , non-B hepatitis
26
tpf 62
Β
Figure 9.1:
Healthy HBsAG-carriers
H
Alcohol-induced hepatitis
I
1 Miscellaneous : malignant tumor (2) cholangitis (1) cholecystitis (3) abscess (1) bile duct obstruction (1)
carriers alcoholics miscellaneous diseases (Median valu
Urinary neopterin concentrations (μπιοί per mol creatinine) in patients with acute viral hepatitis and other liver diseases.
Abbreviations: HAV, hepatitis A virus; HBV, hepatitis Β virus; NANB, non-Α, non-B hepatitis Correlation b e t w e e n urinary neopterin a s p a r t a t e aminotransferase (AST)
and:
Ρ < 0.025
—:
gamma-glutamyltranspeptidase per A S T
1—
Ρ < 0.50
alkaline phosphatase
Ρ < 0.50
alanine aminotransferase
Ρ < 0.50
-0.6
-0.4
-0.2
0.0
0.2
0.4
0.6
Spearman's rank correlation Figure 9.2:
Correlations between urinary neopterin concentrations and other liver function parameters in patients with acute hepatitis A
Ρ denotes level of statistical significance.
9.1 Infections by viruses
173
normalizing neopterin levels, in good agreement with the pattern of conventional liver biochemical investigations. The clinically healthy carriers of HBsAg, although having significantly lower neopterin concentrations than patients with acute hepatitis, had nevertheless a surprisingly high frequency of mildly raised neopterin: 13 subjects (23%) presented with values slightly above the upper normal limits, i.e., in the range from about 250 to 300 μπιοί per mol creatinine. There was no correlation detectable between neopterin and other biochemical tests, and the cause for the elevated neopterin concentrations in such individuals remains unexplained. Notably, in the group of patients with other liver or pancreatic diseases and in the patients with alcohol-induced hepatic disease, neopterin levels were normal or only mildly elevated, despite markedly increased aminotransferase levels and severe liver injury. Thus, it is unlikely that strongly raised neopterin concentrations in patients with acute hepatitis merely reflected liver cell necrosis; rather, the most likely explanation for the high neopterin levels is a strong activation of immune mechanisms in acute hepatitis, including Τ cell activation, production of gamma interferon and other cytokines and activation of monocytes/macrophages. Chronic viral hepatitis A study was undertaken to investigate the potential of neopterin determinations to discriminate between chronic non-A, non-B hepatitis and fatty liver (Prior et al., 1987). The motivation for this study was the fact that both, fatty liver and chronic non-A, non-B hepatitis, are usually mild diseases which often are detected only by chance (for instance, when a mild elevation of aminotransferase levels is found in routine tests done on donated blood). On the other hand, these disease entities differ entirely in their management and prognosis. Whereas fatty liver is a harmless disorder, individuals with suspected non-Α, non-B hepatitis must be precluded from blood donations, they might go on to cirrhosis of the liver or hepatocellular carcinoma, and may be considered for therapy with, e.g., interferons. Neopterin as a marker for cellular immune activation was suspected to be elevated in the case of viral non-A, non-B hepatitis, but normal in patients with fatty liver. For the investigation, 42 subjects were included, showing three separate diagnostic entities: fatty liver, chronic persistent, and chronic aggressive non-A, non-B hepatitis. Figure 9.3 shows the distribution of patients according to these diagnoses. In these patients, besides urinary neopterin a large panel of common laboratory tests was performed, and the potential was studied of all these tests to discriminate, separately or in combination, between the diagnoses. These other tests were (limits for dichotomizing the results are given in parentheses for each marker): erythrocyte sedimentation rate (ESR, 20 mm per hour), aspartate aminotransferase (AST, 18 U per liter), alanine aminotransferase (ALT, 22 U per liter), gamma-glutamyl transpeptidase (GGT, 28 U per liter), alkaline phosphatase (170 U per liter), bilirubin (17.1 μπιοί per liter), cholesterol (6.48 mmol per liter),
174
9 Neopterin in Infectious Diseases
triglycerides (1.94 mmol per liter), gamma-globulin (1.65 g per dliter), the Quetelet index (body mass divided by the squared body length, 25 kg per m2), and two enzyme ratios which are considered to be useful in discriminating between distinct liver disease entities, AST/ALT (0.7) and GGT/AST (1.0). Figure 9.3 shows also the results of urinary neopterin determinations: as expected, there was a highly significant difference between fatty liver compared with both types of non-A, non-B hepatitis, but neopterin was not able to discriminate between chronic persistent and chronic aggressive non-Α, non-B hepatitis. When both viral disease entities were considered together and were contrasted with fatty liver, the diagnostic sensitivity of neopterin was 89% (23 of 26 patients with non-A, non-B hepatitis had raised neopterin), and specificity was 94% (15 of 16 patients with steatosis showed normal neopterin). For the discrimination between chronic persistent and chronic aggressive nonA, non-B hepatitis, two variables were helpful: ESR was above 20 mm per hour in 60% of patients with chronic aggressive non-A, non-B hepatits and in 7 % with the chronic persistent form of the disease (P = 0.0068, Fisher's exact test). AST/ALT ratios above 0.7 were more common in chronic aggressive (70%) than in chronic persistent non-A, non-B hepatitis (6%); thus, this latter variable was the best discriminator (P = 0.0013). The clinically most interesting differential diagnostic problem is between fatty liver and chronic persistent non-Α, non-B hepatitis. Figure 9.4 presents the fractions of patients with values of the investigated laboratory findings above the Neopterin in urine
Subjects:
Fatty liver U j Chronic persistent hepatitis H
Chronic aggressive hepatitis (Median values)
Figure 9.3:
Median neopterin concentrations in urine (μπιοί per mol creatinine) of patients with fatty liver versus chronic hepatitis
Abbreviations: FL, fatty liver; CPH, chronic persistent non-A, non-B hepatitis; CAH, chronic aggressive non-Α, non-B hepatitis
175
9.1 Infections by virases
specified cut-off values for the contrast between these two disease entities. It is obvious from this Figure that neopterin has the highest diagnostic efficiency because the frequencies of elevated levels in both diagnostic classes differ most (P < 0.0001). Two other variables provide a significant discrimination, namely, level o f triglycerides (P = 0.0006) and the ratio between A S T and A L T (P = 0.0054); all other variables are not statistically significant. The results explained in the above paragraph were based upon laboratory variables dichotomized according to a prespecified cut-off value. T h e variables were also subjected to univariate and bivariate logistic regression analysis in order to find out, firstly, whether untransformed values provide a better discrimination between fatty liver and chronic persistent non-Α, non-B hepatitis; secondly, whether or not a different cut-off limit would yield better classification results than the pre-specified ones: and thirdly, whether bivariate combinations would enhance the discriminative power. The results of univariate logistic regression analyses are given in Table 9.1; for variables with a positive regression coefficient, higher values are associated with a
% with abnormal values
Neopterin AST ALT Gamma globulin
AST/ALT Triglycerides
|
GGT/AST
I
ESR
[
Alkaline phosphatase
[
Bilirubin
[
Cholesterol Quetelet index
I
GGT
I 100 Fatty liver
Figure 9.4:
L
0
100
Chronic persistent hepatitis
Frequency of patients with abnormal values of various biochemical indicators of liver function (for definition of cut-off limit see text).
Abbreviations: AST, aspartate aminotransferase; ALT, alanine aminotransferase; GGT, gamma-glutamyl transpeptidase; ESR: erythrocyte sedimentation rate
176 Table 9.1
9 Neopterin in Infectious Diseases Univariate logistic regression analyses for discrimination between fatty liver and chronic persistent non-Α, non-B hepatitis
Variable* Neopterin ALT Triglycerides AST/ALT GGT/AST Cholesterol Gamma globulin
Regression coefficient***
Intercept
P-value
50%-cut-ofT*
0.0248 0.0486 -1.307 -3.44 -0.299 -0.795 2.24
-5.15 -3.03 2.15 1.77 0.983 3.86 -2.91
0.0001
208 62 1.64 0.52 3.29 4.86 1.30
0.0003 0.0016 0.0038 0.0041 0.0055 0.057
* For units see text. ALT, alanine aminotransferase; AST, aspartate aminotransferase; GGT, gamma-glutamyl transpeptidase. ** The models were used to identify the cut-off limits being associated with equal probability for fatty liver and for chronic persistent non-Α, non-B hepatitis. *** Example: a patient suspected to have fatty liver or chronic persistent non-Α, non-B hepatitis has a neopterin concentration of 300 μπιοί per mol creatinine. Then, his individual probability to have viral hepatitis, is exp(0.0248x300-5.15)/[l+exp(0.0248x300-5.15)] = 0.908.
higher risk of chronic persistent non-A, non-B hepatitis, for those with a negative regression coefficient, higher values are associated with a higher probability of fatty liver. In accordance with the simple frequency analyses shown in Figure 9.4, neopterin remains the best single classification variable. In addition to the variables which above were shown to be significant, the variables ALT, GGT/AST, cholesterol and gamma globulins were also significant but with markedly changed cut-off limits. When bivariate logistic regression analyses were performed, neopterin was always included into the regression model as the first variable because of its high statistical significance; the following variables were significant in addition to neopterin: ALT, GGT/AST, triglycerides and AST/ALT. Table 9.2 shows the Table 9.2
Bivariate logistic regression analyses: neopterin plus one additional variable
Variable*
Regression coefficient** Neopterin Variable
ALT GGT/AST Triglycerides AST/ALT
0.0554 -0.770 -0.009 -4.330
0.0266 0.0330 0.0211 0.0305
Intercept -8.75 -4.90 -2.75 -3.30
* For units see text. ALT, alanine aminotransferase; AST, aspartate aminotransferase; GGT, gamma glutamyltranspeptidase. ** Example: a patient suspected to have fatty liver or chronic persistent non-Α, non-B hepatitis has an ALT concentration of 100 U per liter and neopterin of 300 μπιοί per mol creatinine. The linear term in the exponential is: 0.0554x100+0.0266x300-8.75 = 4.77. The probability for the viral disease is exp(4.77)/[l+exp(4.77)] =0.992.
9.1 Infections by viruses
177
respective regression results for these significant combinations, and on this basis, Figure 9.5 shows schematically for each combination, which region in the plane defined by the pair of variables is more likely to be found in fatty liver patients, and vice versa. In other words, if for an individual patient (with prior probability of 50% for each of the two compared diagnoses) neopterin and the respective laboratory Neopterin in urine
500
Neopterin in urine CPH
AST/ALT
GGT/AST
Neopterin in urine
500τ
0
40
!
τ
80
120
ALT
Figure 9.5:
Neopterin in urine
160
200
0
100
300
500
Triglycerides
Bivariate discriminant functions for differentiating fatty liver from chronic persistent non-A, non-B hepatitis
Abbreviations: FL, fatty liver; CPH, chronic persistent non-Α, non-B hepatitis; AST, aspartate aminotransferase; ALT, alanine aminotransferase; GGT, gamma-glutamyl transpeptidase Units: Neopterin, μηιοί per mol creatinine; ALT, U per liter; triglycerides (mmol per liter).
178
9 Neopterin in Infectious Diseases
test are known, these diagrams provide a simple means of judging in a first approximation to which category the patient is likely to belong. In addition to these analyses, the results of this study were reevaluated using the generalized likelihood ratio approach coupled with logistic regression analysis which is explained in the Appendix (Reibnegger et al., 1989b). The aim of this evaluation was to derive a statistical model which enables one to distinguish between the three diagnostic categories, fatty liver, chronic persistent and chronic aggressive non-Α, non-B hepatitis. Two variables were finally selected for the model on statistical grounds, namely, neopterin concentration in urine and the AST/ALT ratio. This choice is certainly reasonable: neopterin offers a good discrimination between fatty liver versus the viral diseases, and AST/ALT differentiates between chronic persistent non-A, non-B hepatitis versus fatty liver and chronic aggressive non-Α, non-B hepatitis. Table 9.3 Estimation of likelihood ratio functions for binary contrasts of diagnostic categories: neopterin (coded as continuous variable, in μιηοΐ per mol creatinine) plus AST/ALT* ratio (coded as categorical value +1, if AST/ALT 0.7; 1, otherwise) Diagnoses** FL vs CPH FL vs CAH CPH vs CAH
Regression coefficients (and P-values) Neopterin AST/ALT Intercept -0.034798 (< 0.0001) -0.037957 (< 0.0001) -0.004387 (0.27)
2.4667 (0.0033) 1.4733 (0.18) -1.8066 (0.0004)
7.9644 8.1324 1.2641
" ALT, alanine aminotransferase; AST, aspartate aminotransferase. ** FL, fatty liver; CPH, chronic persistent non-Α, non-B hepatitis; CAH, chronic aggressive non-Α, non-B hepatitis
At first (see Appendix), separate logistic regression analyses were performed for each possible pair of the three diagnostic categories. For these analyses, neopterin was used as a continuously coded variable, and AST/ALT was dichotomized using 0.7 as cut-off value. The results of these analyses are given in Table 9.3. From the regression coefficients, the following likelihood ratio functions (LR) are obtained for the binary contrasts (note that there were 16 patients with fatty liver, 16 with chronic persistent hepatitis and 10 with chronic aggressive hepatitis): Fatty liver versus chronic persistent hepatitis LR = -0.034798 A + 2.4667 Β + 7.9644 - log (16/16); Fatty liver versus chronic aggressive hepatitis LR = -0.037957 A + 1.4733 Β + 8.1324 - log (16/10);
9.1 Infections by viruses
179
Chronic persistent versus aggressive hepatitis LR = -0.004387 A - 1.8066 Β + 1.2642 - log (16/10).
In these expressions, A denotes neopterin in urine (in μπιοί per mol creatinine) and Β is coded "+1", if AST/ALT > 0.7, and "-1", otherwise; "/og" means the natural logarithm. Using these likelihood ratio functions, the resulting probabilities for each diagnostic category can be computed according to the methods detailled in the Appendix; these probabilities are shown in Figure 9.6 as a function of neopterin and AST/ALT ratio. It is evident from the Figure that a low neopterin value is always a strong indication for fatty liver. The probability of chronic persistent nonA, non-B hepatitis is, in the case of an AST/ALT ratio exceeding 0.70, below 10%, irrespective of neopterin. However, if the AST/ALT ratio is below 0.7, chronic persistent and chronic aggressive hepatitis are concurring each other; at very high neopterin levels, chronic aggressive hepatitis is somewhat more probable, and the chronic persistent form is most likely at moderately raised neopterin levels of about 300 μπιοί per mol creatinine.
AST/ALT 0.10). However, due to the small sample size the power of the study to detect such differences was not very strong. It may be concluded that the concept discussed above is true also in this patient group: hemophilia patients appear to having been particularly vulnerable for HIV-1 because they had a high incidence of a prestimulated immune system due to administration of insufficiently purified and sterilized blood products. Exposure to HIV-1 being frequent in these individuals before 1985, the chances for the virus to productively infect such patients were considerably higher than with healthy and immunocompetent persons.
200
9 Neopterin in Infectious Diseases
In the cited study {Fuchs et al, 1988b) there was no direct correlation detected between neopterin and the remaining variables. This observation suggests that activation of Τ cells as demonstrated by elevated neopterin levels, and polyclonal Β cell activation as shown by abnormal concentrations of immunoglobulins IgG and IgM, are not closely associated in HIV-1 infected subjects. Such a lack of direct correlation is not unreasonable because the studied parameters may be assumed to differ kinetically: neopterin according to present-day knowledge is quite an early indicator of an acute immune activation episode and usually normalizes promptly when the stimulating pathogen is eliminated. By contrast, antibodies become detectable later in the course of, e.g., a viral infection, and levels of immunoglobulins may remain high for a much longer period of time. A five-year prospective study of HIV-infection in the Edinburgh hemophiliac cohort (Cuthbert et al., 1990) confirmed the reported trend: 32 adolescent and adult subjects were longitudinally followed up for five years; in these patients also specimens from the time prior to exposure to HIV-1 contaminated factor concentrates were available. Neopterin was measured in plasma. Before exposure, there was no difference in neopterin and other criteria (CD4+ Τ cell count, beta-2 microglobulin, plasma immunoglobulin A) between the subjects who seroconverted in the subsequent course from those who did not. In the five-years observation period, plasma neopterin levels in the non-seroconverters remained stable, but in seroconverters levels increased initially, and - after about three years - a declining trend became visible. The increase was dependent on the
Neopterin
HIV- HIV*
normal abnormal
IgG normal
2
3
1
β
IgM
HIV- HIV* É
normal
3
5
abnormal
0
4
HIV- HIV* J
abnormal
normal abnormal
Figure 9.23:
CD4+/CD8*
1
HIV- HIV* 1 1 2
1 1
gamma globulin normal abnormal
HIV- HIV* h 3 0
1
I
8
1
- U
Two-way contingency tables obtained at the final visit of patients with hemophilia in June 1987. Tables show results of laboratory tests in relationship to anti-HIV-1 serological status.
Abbreviations: IgG(M), immunoglobulin G (M)
9.2 Neopterin during infection by human immunodeficiency virus type 1 (HIV-1)
201
clinical severity of HIV-associated disease: those who showed CDC class I or II disease showed a markedly smaller increase than those developing CDC class IV disease afterfiveyears. Beta-2 microglobulin did not exhibit as rapid an increase as neopterin but rose more slowly, and only after four years of exposure levels began to stabilize on a certain level. Immunoglobulin A in the seroconverters also increased but only those developing CDC class IV disease had an increase above the upper limit of normal range. Finally, a recent study on 25 patients with hemophilia (children, adolescents and adults) who were anti-HIV-1 seropositive at initiation of the study in March 1986 revealed an interesting feature (Ujhelyi et al., 1990): at the last measurement performed in November 1989, children of ages below 14 years (n = 6) had significantly higher counts of CD4+ Τ cells in their peripheral blood and significantly lower neopterin concentrations and numbers of activated CD3+DR+ lymphocytes than adolescents (age 14 years; n= 8) and adults (n=ll). These findings pointed to a smaller risk of developing HIV-1 related disease among the children. As a matter of fact, by December 1989 none of the children had developed AIDS (adolescents: 1 patient; adults: 2 patients) or ARC (adolescents: 5 patients; adults: 2 patients). Moreover, the progression was already predicted by the CD4+ Τ cell and neopterin measurements done as early as 1987: the three individuals who finally progressed to AIDS had CD4+ Τ cell counts below 350 per μϋίβΓ and serum neopterin above 20 nmol per liter in 1987. Thus, in patients with hemophilia progression to AIDS appears to be influenced by age; prepuberty children appear to show a relatively slower progression rate than subjects above this age. This lower progression rate also seems to correlate with a lower degree of Τ cell activation as indicated by lower neopterin levels and CD3+DR+ Τ cell counts.
9.2.5 Neopterin and its correlation with Τ cell subset data in HIV-1 related disease HIV-1 has the potential to infect various cell types which are able to express the CD4 molecule on their surface, e.g., lymphocytes, monocytes, macrophages, Langerhans cells, astrocytes; the CD4+ Τ lymphocytes, however, are deemed to be the primary target, and the impact of HIV-1 on these cells is supposed to be of central importance for the development of HIV-1 related diseases. It is, therefore, not surprising that the quantitative enumeration and the functional analysis of Τ cell subset populations very quickly have gained pivotal importance for the laboratory characterization of subjects infected with HIV-1. For routine purposes, quantitation of CD4+ Τ cells and estimation of the ratio between CD4+ and CD8+ Τ cells have become the most popular methods. Any other potential new laboratory marker has to be compared with Τ cell subset data in order to judge its usefulness. Several investigations are at hand comparing neopterin and Τ cell
9 Neopterin in Infectious Diseases
202
subset data in different cohorts of individuals infected with HIV-1. Moreover, the influence of the specimen matrix used (i.e, serum or urine) has been studied, and neopterin data without and with preanalysis oxidative treatment have been compared. The subsequent paragraphs will discuss these results. Importantly, it is by no means intended here and in the paragraphs which will follow, to suggest replacement of serological testing by other laboratory methods such as neopterin determination or quantitation of Τ cell subset variables. Rather, when these laboratory tests are compared with serologic status, anti-HIV-1 serology functions as a golden standard which can be employed to better characterize the specific role of laboratory tests in various clinical situations. Neopterin versus CD4+ / CD8+ Τ cell ratio for differentiating between anti-HIV-1 seronegative and seropositive individuals and patients with AIDS The first study comparing the potential of (urinary) neopterin and CD4+/CD8+ Τ cell ratio for distinguishing between (otherwise comparable) anti-HIV-1 seronegative and seropositive subjects (Fuchs et al., 1988c) comprised 105 voluntary attendants of a service institution of the Austrian AIDS-ffilfe in Vienna. A demographic characterization as well as the outcome of serologic testing for HIV-1 antibodies is shown in Figure 9.24. Of the 83 seropositive individuals, there were three with AIDS who did not suffer from opportunistic infections at the time of sampling; seven had AIDS related complex and the remaining 73 were free from symptoms with the exception of generalized lymphadenopathy in 44 patients. Figure 9.25 shows the results of the laboratory tests. All four variables, neopterin, CD4+ Τ cell number, CD8+ Τ cell number, and the ratio between CD4+/ Subjects:
HIV-1
94 men, 11 women; 19 to 5 2 years
(ELISA, Western blot)
θ ' 35 I
homosexual/bisexual men
I i parenteral drug addicts O
serology:
m I
positive
I
I negative
hemophilic patient
I H heterosexual exposure to HIV
Figure 9.24: Distributions of subjects according to demographic characteristics and HIV-1 antibody status.
9.2 Neopterin during infection by human immunodeficiency virus type 1 (HIV-1)
203
CD8+ Τ cell numbers differed significantly between anti-HIV-1 seropositive and seronegative subjects. However, the abilities to discriminate between anti-HIV-1 seronegatives and seropositives, of neopterin and of CD4+/CD8+ Τ cell ratio were considerably stronger than those of CD4+ or CD8+ Τ cell numbers taken singly. This result was also seen when different cut-off values for all variables were checked for their associated diagnostic sensitivities and specificities (i.e., receiver operated characteristic curves were computed). Figure 9.26 shows, as a result of these calculations, the so-called Youden indices (Youden index = sensitivity + specificity -1) at the optimal discriminator points for each variable (neopterin, 202 μιηοΐ per mol creatinine; CD4+/CD8+ Τ cell ratio, 1.0; CD4+ Τ cell number, approximately 550 per μΙίίεΓ, very broad multimodal maximum; CD8+ Τ cell number, approximately 700 per μΙΠβΓ, very broad multimodal maximum). For neopterin, the highest Youden index was obtained, indicating that neopterin has the greatest combined efficiency as a discriminatory test.
CDS* Τ cell number
CD4* Τ cell number
Γι
U • 9.89, Ρ · 0.0017
CD4*/CD8» Τ cell ratio
Neopterin in urine
U • 34.14, Ρ < 0.0001
Η I
Figure 9.25:
I anti-HIV-1 negative
antl HIV-1 positive
Median values of laboratory measurements in patients according to antiHIV-1 serological status (statistical tests for differences between groups by Wilcoxon-Mann-Whitney U test).
Units: Neopterin, (μηιοί per mol creatinine); Τ cell numbers, per μΐίΐεπ
204
9 Neopterin in Infectious Diseases
Additionally, the mutual intervariable correlation structure of the investigated variables was investigated: in seropositive but not in seronegative individuals, neopterin showed a significant inverse correlation with CD4+ Τ cell number (Spearman's rank correlation coefficient R, = -0.43, Ρ < 0.0001) and with CD4+/ CD8+ Τ cell ratio (K, = -0.34, Ρ < 0.0001). The lack of significant correlation between neopterin and Τ cell subset data in the seronegative group indicates that neopterin data per se are largely independent from Τ cell subset variables; the significant correlations are caused by the common effect of HIV-1 on both neopterin as well as CD4+ Τ cell number. Importantly, despite of the fact that low CD4+ Τ cell numbers are considered to reflect significant pathology of HIV-1 since these cells are the primary target for the virus, neopterin in this study showed practically the same potential as discriminator variable as the best Τ cell subset variable, i.e., the CD4+/CD8+ Τ cell ratio. The high diagnostic sensitivity of neopterin in this specific situation appears to be due to the fact that neopterin increases are seen veiy early in the course of HIV-1 disease, and in fact were shown by others to precede HIV-1 related loss of CD4+ Τ cells (Lambin et al., 1988; Melmed et al., 1989). Another study compared urinary neopterin concentrations and Τ cell subset data with respect to their ability to discriminate between anti-HIV-1 seronegatives and seropositives, and between seropositives and patients with full-blown AIDS (,Reibnegger et al., 1990). This investigation comprised a subset of 144 subjects of a cohort of 150 homosexual men enrolled in the spring of 1982 as consecutive patients of three physicians in the U.S.A. (Goedert et al, 1985a and b). According to their clinical status at the time of sample collection (April to August, 1986) there Best Youden index
Ο.Θ
Neopterin in urine
Figure 9.26:
CD4+/CD8+ Τ cell ratio
CD4+ CD8+ Τ cell number
Youden indices of laboratory measurements at optimum cut-off limit for discrimination between anti-HIV-1 seronegatives and seropositives.
9.2 Neopterin during infection by human immunodeficiency virus type 1 (HIV-1)
205
were three groups of patients (71 seronegatives, 64 seropositives and 9 individuals with overt AIDS), and in all patients urinary neopterin and numbers of CD4+ and CD8+ Τ cells were concomitantly determined. Additionally, based on these three variables, three further composite variables were evaluated: CD4+/CD8+ Τ cell ratio, neopterin per number of CD4+ Τ cells, and finally, neopterin per CD4+/ CD8+ Τ cell ratio. The interest in the latter two variables arose because of a report suggesting that the ratio between CD4+ Τ cells and neopterin provided particularly good performance as measured by its correlation with the Walter Reed Staging System (Crocchiolo et al., 1988). Figures 9.27 and 9.28 show the results. In accordance with the other studies reported, neopterin concentrations were significantly higher in seropositive than in seronegative subjects, and highest levels were found in patients with AIDS. The average neopterin excretion levels are in good agreement with the study reported in the preceding chapter (Fuchs et al., 1988c). The number of CD8+ Τ cells did not vary greatly across the three categories (a slight increase was seen in seropositives as compared with seronegative patients, in accordance with other studies), the CD8+ Τ cell number
CD4-» Τ cell number
w Neopterin In urine
I
Figure 9.27:
Units: Neopterin,
I seronegative
Q
CD4+/CD8* Τ cell ratio
seropositive
AIDS
Distributions of laboratory measurements in controls and patient groups with different status of HIV-1 disease.
(μηιοί
per mol creatinine); Τ cell numbers, per
μΙίίβΓ.
206
9 Neopterin in Infectious Diseases
CD4+ Τ cell number as well as the CD4+/CD8+ Τ cell ratio behaved as expected: with progression of disease, a marked decrease of these variables was found. A dramatic difference was found between seropositives and AIDS cases for the two new composite variables, neopterin per CD4+ Τ cell number and neopterin per CD4+/CD8+ Τ cell ratio. Clearly, combining neopterin with the Τ cell variables in this manner enhances the differences between the groups, and this enhancement is particularly strong for AIDS patients because of their extraordinarily high neopterin levels and low CD4+ Τ cell numbers. Figure 9.29 shows the resulting Youden indices for the dichotomy seronegatives versus seropositives. The optimal cut-off values (given in the units used throughout this monograph) being associated with these Youden indices were: neopterin per CD4+/CD8+ Τ cell ratio, 199; neopterin per CD4+ Τ cell number, 0.25; neopterin, 168; CD4+/CD8+ Τ cell ratio, 1.07; CD4+ Τ cell number, 859; CD8+ Τ cell number, 925 (given the extremely poor discriminative power of this latter variable, this figure is practically meaningless). For the differentiation between seropositives and AIDS patients, the following optimal cut-off limits were obtained: neopterin, 445 (Youden index Y = 0.84); neopterin per CD4+/CD8+ Τ cell ratio, 779 (Y = 0.84); neopterin per CD4+ Τ cell number, 1.64 (Y = 0.83); CD4+ Τ cells, 355 (Y = 0.77); CD4+/CD8+ Τ cell ratio, 0.587 (Y = 0.66); CD8 + Τ cell number, 483 (Y = 0.54). These results are to be taken only as a preliminary approximation, given the low number of patients with AIDS in this investigation. Neopterin per CD4+ Τ cell number
Neopterin per CD4+/CD8+ Τ cell ratio 3000
2