Mass transfer : principles and applications 0849322391, 9780849322396
395 12 2MB
English Pages 390 p. : ill. ; 25 cm [416] Year 2004
Content: Ch. 1. Some Basic Notions: Rates of Mass Transfer --
Ch. 2. Modeling Mass Transport: The Mass Balances --
Ch. 3. Diffusion through Gases, Liquids, and Solids --
Ch. 4. More about Diffusion: Transient Diffusion and Diffusion with Reaction --
Ch. 5. A Survey of Mass Transfer Coefficients
Recommend Papers
![Principles and Modern Applications of Mass Transfer Operations, Second Edition [2 ed.]
0470181788, 9780470181782](https://ebin.pub/img/200x200/principles-and-modern-applications-of-mass-transfer-operations-second-edition-2nbsped-0470181788-9780470181782.jpg)


![Mass Spectrometry: Principles and Applications [3 ed.]
047003310X, 9780470033104](https://ebin.pub/img/200x200/mass-spectrometry-principles-and-applications-3nbsped-047003310x-9780470033104.jpg)


![Heat and Mass Transfer [4]
0256114439, 9780256114430](https://ebin.pub/img/200x200/heat-and-mass-transfer-4-0256114439-9780256114430.jpg)

- Author / Uploaded
- Diran Basmadjian
File loading please wait...
Citation preview
MASS TRANSFER Principles and Applications
MASS TRANSFER Principles and Applications
DIRAN BASMADJIAN
CRC PR E S S Boca Raton London New York Washington, D.C.
This edition published in the Taylor & Francis e-Library, 2005. “To purchase your own copy of this or any of Taylor & Francis or Routledge’s collection of thousands of eBooks please go to www.eBookstore.tandf.co.uk.”
Library of Congress Cataloging-in-Publication Data Basmadjian, Diran. Mass transfer : principles and applications / Diran Basmadjian. p. cm. Includes bibliographical references and index. ISBN 0-8493-2239-1 1. Mass transfer. I. Title QC318.M3B37 2003 660′.28423--dc22
2003060755
This book contains information obtained from authentic and highly regarded sources. Reprinted material is quoted with permission, and sources are indicated. A wide variety of references are listed. Reasonable efforts have been made to publish reliable data and information, but the author and the publisher cannot assume responsibility for the validity of all materials or for the consequences of their use. Neither this book nor any part may be reproduced or transmitted in any form or by any means, electronic or mechanical, including photocopying, microfilming, and recording, or by any information storage or retrieval system, without prior permission in writing from the publisher. The consent of CRC Press LLC does not extend to copying for general distribution, for promotion, for creating new works, or for resale. Specific permission must be obtained in writing from CRC Press LLC for such copying. Direct all inquiries to CRC Press LLC, 2000 N.W. Corporate Blvd., Boca Raton, Florida 33431. Trademark Notice: Product or corporate names may be trademarks or registered trademarks, and are used only for identification and explanation, without intent to infringe.
Visit the CRC Press Web site at www.crcpress.com © 2004 by CRC Press LLC No claim to original U.S. Government works International Standard Book Number 0-8493-2239-1 Library of Congress Card Number 2003060755 ISBN 0-203-50314-7 Master e-book ISBN
ISBN 0-203-59042-2 (Adobe eReader Format)
Preface The topic of mass transfer has a long and distinguished history dating to the 19th century, which saw the development and early applications of the theory of diffusion. Mass transfer operations such as distillation, drying, and leaching have an even earlier origin, although their practice was at that time an art rather than a science, and remained so well into the 20th century. Early textbook publications of that era dealt mainly with the topic of diffusion and the mathematics of diffusion. The development of mass transfer theory based on the film concept, which began in the 1920s and continued during two decades of intense activity, brought about a shift in emphasis. The first tentative treatments of mass transfer processes dealing primarily with distillation and gas absorption began to appear, culminating with the publication, in 1952, of Robert Treybal’s Mass Transfer Operations. It was to serve generations of students as the definitive text on the subject. The 1950s and the decades that followed saw a second shift in emphasis, signaling a return to a more fundamental approach to the topic. Mass transfer was now seen as part of the wider basin of transport phenomena, which became the preferred topic of serious authors. The occasional text on mass transfer during this period viewed the topic on a high plane and mainly within the context of diffusion. For the most part, mass transport was seen as one of three players on the field of transport phenomena, and often a minor player at that. In the 1980s and 1990s, it became fashionable to treat mass transfer as part of the dual theme of heat and mass transfer. In these treatments, heat transfer, as the more mature discipline, predominated and mass transfer was usually given short shrift, or relegated to a secondary role. This need not be and ought not to be. The author has felt for some time that mass transfer is a sufficiently mature discipline, and sufficiently distinct from other transport processes, to merit a separate treatment. The time is also ripe for a less stringent treatment of the topic so that readers will approach it without a sense of awe. In other words, we do not intend to include, except in a peripheral sense, the more profound aspects of transport theory. The mainstays here are Fick’s law of diffusion, film theory, and the concept of the equilibrium stage. These have been, and continue to be, the preferred tools in everyday practice. What we bring to these topics compared to past treatments is a much wider, modern set of applications and a keener sense that students need to learn how to simplify complex problems (often an art), to make engineering estimates (an art as well as a science), and to avoid common pitfalls. Such exercises, often dismissed for lacking academic rigor, are in fact a constant necessity in the engineering world.
Another departure from the norm is the organization of the material according to mode of operation (staged or continuous contact), rather than the type of separation process (e.g., distillation or extraction). Phase equilibria, instead of being dispersed among different operations, are likewise brought together in a single chapter. The reader will find that this approach unifies and strengthens the treatment of these topics and enables us to accommodate, under the same umbrella, processes that share the same features but are of a different origin (environmental, biological, etc.). The readership at this level is broad. The topic of separation processes taught at all engineering schools is inextricably linked to mass transport, and students will benefit from an early introductory treatment of mass transfer combined with the basic concepts of separation theory. There is, in fact, an accelerating trend in this direction, which aims for students to address later the more complex operations, such as multicomponent and azeotropic distillation, chromatography, and the numerical procedures to simulate these and other processes. Mass transport also plays a major role in several other important disciplines. Environmental processes are dominated by the twin topics of mass transfer and phase equilibria, and here again an early and separate introduction to these subject areas can be immensely beneficial. This text provides detailed treatments of both phase equilibria and compartmental models, which are all-pervasive in the environmental sciences. Transport, where it occurs, is almost always based on Fickian diffusion and film theory. The same topics are also dominant in the biological sciences and in biomedical engineering, and the text makes a conscious effort to draw on examples from these disciplines and to highlight the idiosyncrasies of biological processes. Further important applications of mass transport theory are seen in the areas of materials science and materials processing. Here the dominant transport mode is one of diffusion, which in contrast to other disciplines often occurs in the solid phase. The reader will find numerous examples from these fascinating fields as well as a considerable amount of preparatory material of benefit to materials science students. The text starts in an unconventional way by introducing the reader at an early stage to diffusion rates and Fick’s law and to the related concepts of film theory and mass transfer coefficients. This is done in Chapter 1, but the topics are deemed of such importance that we return to them repeatedly in Chapters 3 and 4, and again in Chapter 5. In this manner, we develop the subject matter and our grasp of it in successive and complementary stages. The intervening Chapter 2 is entirely devoted to the art of setting up mass balances, a topic that is all too often given little attention. Without a good grasp of this subject we cannot set about the task of modeling mass transfer, and the many pitfalls we encounter here are alone sufficient reason for a separate treatment. The balances include algebraic and ordinary differential equations (ODEs). The setting up of partial differential equations (PDEs) is also discussed, and some time is spent in examining the general conservation equations in vector form. We do not attempt solutions of PDEs
but instead provide the reader with known solutions and solution charts, which we use in Chapter 3 to solve a range of important problems. That chapter also considers the simultaneous occurrence of mass transfer and chemical reaction. Chapter 6 deals with phase equilibria, which are mainly composed of topics not generally covered in conventional thermodynamics courses. These equilibria are used in Chapter 7 to analyze compartmental models and staged processes. Included in this chapter is a unique treatment of percolation processes, which should appeal to environmental and chemical engineers. Chapter 8 takes up the topic of modeling continuous-contact operations, among which the application to membrane processes is given particular prominence. Finally, in Chapter 9 we conclude the text with a brief survey of simultaneous mass and heat transfer. The text is suitable for a third-year course addressed to engineering students, particularly those in the chemical, civil, mechanical, environmental, biomedical, and materials disciplines. Biomedical and environmental engineers will find topics of interest in almost all chapters, while materials science students may wish to concentrate on the earlier portions of the text (Chapters 1 to 5). The entire text can, with some modest omissions, be covered in a single term. The professional with a first-time interest in the topic or a need for a refresher will find this a useful and up-to-date text.
Acknowledgments
The author is much obliged to his colleague, Professor Olev Trass, who was kind enough to make his course notes and problems available. Illustration 1.6, which deals with the analysis of hypothetical concentration profiles, was drawn from this source. We were, as usual, immensely aided by the devoted efforts of Arlene Fillatre, who typed the manuscript, and Linda Staats, who produced impeccable drawings from rough sketches, which defy description. My wife, Janet, and granddaughter, Sierra, provided an oasis away from work.
Author
Diran Basmadjian is a graduate of the Swiss Federal Institute of Technology, Zurich, and received his M.A.Sc. and Ph.D. degrees in chemical engineering from the University of Toronto. He was appointed assistant professor of chemical engineering at the University of Ottawa in 1960, moving to the University of Toronto in 1965, where he subsequently became professor of chemical engineering. He has combined his research interests in the separation sciences, biomedial engineering, and applied mathematics with a keen interest in the craft of teaching. His current activities include writing, consulting, and performing science experiments for children at a local elementary school. Professor Basmadjian has authored four books and some fifty scientific publications.
Notation
a A A B C C Cp d D D D′ De erf erfc E E E E Ea Eh f F F F ℑ G Gs h h H H
specific surface area, m2/m3 area, m2 raffinate solvent, kg or kg/s extract solvent, kg or kg/s concentration, mol/m3 number of components heat capacity at constant pressure, J/kg K or J/mol K diameter, m diffusivity, m2/s distillate, mol/s cumulative distillate, mol effective diffusivity, m2/s error function complementary error function effectiveness factor, dimensionless extract, kg or kg/s extraction ratio, dimensionless stage efficiency, dimensionless activation energy, J/mol enhancement or enrichment factor, dimensionless fraction distilled degrees of freedom feed, kg or mol, kg/s or mol/s force, N Faraday number, C/mol gas or vapor flow rate, kg/s or mol/s superficial carrier flow rate, kg/m2 s heat transfer coefficient, J/m2 s K height, m Henry’s constant, Pa m3 mol–1 or kg solvent/kg adsorbent enthalpy, J/kg or J/mol
Ha Hatta number, dimensionless HETP(S) height equivalent to a theoretical plate or stage, m HTU height of a transfer unit, m i electrical current, A Jw water flux, m3/m2 s k thermal conductivity, J/m s K kC, kG, kL, kx, ky, kY mass transfer coefficient, various units ke elimination rate constant, s–1 kr reaction rate constant, s–1 K partition coefficient, various units K permeability, m/s or m2 Ko overall mass transfer coefficient, various units
ᐉ L L L Ls m m M M N N N NT NTU p P Po PT Pw pBM Pe q q Q r
length, m length, m liquid flow rate, kg/s or mol/s liquid mass, kg superficial solvent flow rate, kg/m2 s distribution coefficient, various units mass, kg mass of emissions, kg, kg/s, or kg/m2 s molar mass, dimensionless mass fraction (leaching), dimensionless molar flow rate, mol/s number of stages or plates number of mass transfer units number of transfer units pressure, Pa number of phases vapor pressure, Pa total pressure, Pa water permeability, mol/m2 s Pa log-mean pressure difference, Pa Peclet number, dimensionless heat flow, J/s thermal quality of feed, dimensionless volumetric flow rate, m3/s radial variable, m
r R R R R R R RO S S S Sc Sh St t T T u u U v vH V V W W x x x X X y y Y Y z zFH
recovery, dimensionless gas constant, J/mol K radius, m raffinate, kg or kg/s reflux ratio, dimensionless residue factor, dimensionless resistance, Ω reverse osmosis amount of solid, kg or kg/s shape factor, m solubility, cm3 STP/cm3 Pa Schmidt number, dimensionless Sherwood number, dimensionless Stanton number, dimensionless time, s dimensionless time (adsorption) temperature, K or °C dependent variable velocity, m/s overall heat transfer coefficient, J/m2 s K velocity, m/s specific volume, m3/kg dry air voltage, V volume, m3 or m3/mol bottoms, mol or mol/s weight, kg liquid weight or mole fraction, dimensionless raffinate weight fraction, dimensionless solid-phase weight fraction (leaching), dimensionless adsorptive capacity, kg solute/kg solid liquid-phase mass ratio, dimensionless extract weight fraction, dimensionless vapor mole fraction, dimensionless humidity, kg water/kg dry air gas-phase mass ratio, dimensionless distance, m heat transfer film thickness, m
zFM Z Z
mass transfer film thickness, m dimensionless distance (adsorption) flow rate ratio (dialysis)
Greek Symbols α α α α γ γ˙ δ ε λ µ ν π ρ σ σ st τ τ φ
relative volatility, dimensionless selectivity, dimensionless separation factor, dimensionless thermal diffusivity, m2/s activity coefficient, dimensionless shear rate, s–1 film or boundary layer thickness, m porosity, dimensionless mean free path, m viscosity, Pa s kinematic viscosity, m2/s osmotic pressure, Pa density, kg/m3 liquid film thickness, m length of stomatal pore, m shear stress, Pa tortuosity, dimensionless pressure ratio, dimensionless
Subscripts as b c C db D
adiabatic saturation bed, bulk cold, molar concentration units (kc) cross section, condenser dry bulb distillate, dialysate
e f, F g, G h i i i L m o OW p p p v w w
effective feed gas hot initial inside impeller liquid mean outside octanol–water particle, pellet permeate pore vessel bottoms water
Superscripts * o o ′
equilibrium initial pure component cumulative
Table of Contents
Chapter 1 Some Basic Notions: Rates of Mass Transfer .............. 1
1.1
Gradient-Driven Transport .........................................................................2 Illustration 1.1: Transport in Systems with Vanishing Gradients .............................................................................6 Illustration 1.2: Diffusion through a Hollow Cylinder ..............8 Illustration 1.3: Underground Storage of Helium: Diffusion through a Spherical Surface ...........................................10 1.2 Transport Driven by a Potential Difference: The Film Concept and the Mass Transfer Coefficient ...........................................................12 1.3 Units of the Potential and of the Mass Transfer Coefficient ...............16 Illustration 1.4: Conversion of Mass Transfer Coefficients ...... 17 1.4 Equimolar Counterdiffusion and Diffusion through a Stagnant Film: The Log-Mean Concentration Difference ................................................18 1.4.1 Equimolar Counterdiffusion .........................................................19 1.4.2 Diffusion through a Stagnant Film ..............................................20 Illustration 1.5: Estimation of Mass Transfer Coefficients and Film Thickness. Transport in Blood Vessels .........22 1.5 The Two-Film Theory .................................................................................24 1.6 Overall Driving Forces and Mass Transfer Coefficients .......................27 Illustration 1.6: Qualitative Analysis of Concentration Profiles and Mass Transfer ..............................................29 Illustration 1.7: Drying with an Air Blower: A Fermi Problem .............................................................31 1.7 Conclusion ...................................................................................................33 Practice Problems ................................................................................................33
Chapter 2 Modeling Mass Transport: The Mass Balances ......... 39 2.1
2.2
The Compartment and the One-Dimensional Pipe ..............................40 Illustration 2.1: Evaporation of a Solute to the Atmosphere ...........................................................42 Illustration 2.2: Reaeration of a River..........................................47 The Classification of Mass Balances ........................................................49 2.2.1 The Role of Balance Space ............................................................50 2.2.2 The Role of Time ............................................................................50 2.2.2.1 Unsteady Integral Balance .............................................50 2.2.2.2 Cumulative (Integral) Balance .......................................50 2.2.2.3 Unsteady Differential Balances .....................................51
2.2.2.4 Dependent and Independent Variables .......................51 Illustration 2.3: The Countercurrent Gas Scrubber: Genesis of Steady Integral and Differential Mass Balances .............................................................................53 Illustration 2.4: Two Examples from Biology: The Quasi-Steady-State Assumption ............................57 Illustration 2.5: Batch Distillation: An Example of a Cumulative Balance................................................. 62 2.3 The Information Obtained from Model Solutions ................................64 2.4 Setting Up Partial Differential Equations ...............................................66 Illustration 2.6: Unsteady Diffusion in One Direction: Fick’s Equation ................................................................. 67 Illustration 2.7: Laminar Flow and Diffusion in a Pipe: The Graetz Problem for Mass Transfer ........................70 Illustration 2.8: A Metallurgical Problem: Microsegregation in the Casting of Alloys and How to Avoid PDEs ....73 2.5 The General Conservation Equations .....................................................79 Illustration 2.9: Laplace’s Equation, Steady-State Diffusion in Three-Dimensional Space: Emissions from Embedded Sources .............................81 Illustration 2.10: Lifetime of Volatile Underground Deposits .............................................................................84 Practice Problems..................................................................................................85
Chapter 3 Diffusion through Gases, Liquids, and Solids .......... 91 3.1
Diffusion Coefficients ................................................................................91 3.1.1 Diffusion in Gases ..........................................................................91 Illustration 3.1: Diffusivity of Cadmium Vapor in Air ............93 3.1.2 Diffusion in Liquids ......................................................................95 Illustration 3.2: Electrorefining of Metals. Concentration Polarization and the Limiting Current Density .........98 3.1.3 Diffusion in Solids .......................................................................101 3.1.3.1 Diffusion of Gases through Polymers and Metals ......................................................................102 Illustration 3.3: Uptake and Permeation of Atmospheric Oxygen in PVC ..............................................................104 Illustration 3.4: Sievert’s Law: Hydrogen Leakage through a Reactor Wall .................................................106 Illustration 3.5: The Design of Packaging Materials ..............108 3.1.3.2 Diffusion of Gases through Porous Solids ................ 110 Illustration 3.6: Transpiration of Water from Leaves. Photosynthesis and Its Implications for Global Warming .......................................................................... 112 Illustration 3.7: Diffusivity in a Catalyst Pellet ....................... 115 3.1.3.3 Diffusion of Solids in Solids ........................................ 116
Illustration 3.8: Diffusivity of a Dopant in a Silicon Chip .................................................................................. 117 Practice Problems .............................................................................................. 117
Chapter 4 More about Diffusion: Transient Diffusion and 4.1
4.2
Diffusion with Reaction ........................................................... 121 Transient Diffusion ...................................................................................122 4.1.1 Source Problems ...........................................................................123 4.1.1.1 Instantaneous Point Source Emitting into Infinite Space ................................................................................123 4.1.1.2 Instantaneous Point Source on an Infinite Plane Emitting into Half Space ..............................................125 4.1.1.3 Continuous Point Source Emitting into Infinite Space ................................................................................127 Illustration 4.1: Concentration Response to an Instantaneous Point Source: Release in the Environment and in a Living Cell ......................................................................128 Illustration 4.2: Net Rate of Global Carbon Dioxide Emissions ........................................................................129 Illustration 4.3: Finding a Solution in a Related Discipline: The Effect of Wind on the Dispersion of Emissions ....................................................................131 4.1.2 Nonsource Problems ...................................................................133 4.1.2.1 Diffusion into a Semi-Infinite Medium ......................133 Illustration 4.4: Penetration of a Solute into a Semi-Infinite Domain ............................................................................134 Illustration 4.5: Cumulative Uptake by Diffusion for the Semi-Infinite Domain .............................................135 4.1.2.2 Diffusion in Finite Geometries: The Plane Sheet, the Cylinder, and the Sphere .......................................136 Illustration 4.6: Manufacture of Transformer Steel ................138 Illustration 4.7: Determination of Diffusivity in Animal Tissue ...............................................................................139 Illustration 4.8: Extraction of Oil from Vegetable Seeds.........140 Diffusion and Reaction ............................................................................140 4.2.1 Reaction and Diffusion in a Catalyst Particle .........................141 4.2.2 Gas–Solid Reactions Accompanied by Diffusion: Moving-Boundary Problems ......................................................142 4.2.3 Gas–Liquid Systems: Reaction and Diffusion in the Liquid Film .................................................................................................143 Illustration 4.9: Reaction and Diffusion in a Catalyst Particle. The Effectiveness Factor and the Design of Catalyst Pellets ...............................................................................143 Illustration 4.10: A Moving Boundary Problem: The Shrinking Core Model ..................................................148
Illustration 4.11: First-Order Reaction with Diffusion in a Liquid Film: Selection of a Reaction Solvent ............151 Practice Problems ..............................................................................................153
Chapter 5 A Survey of Mass Transfer Coefficients .................. 157 5.1
Dimensionless Groups .............................................................................158 Illustration 5.1: The Wall Sherwood Number .........................159 5.2 Mass Transfer Coefficients in Laminar Flow: Extraction from the PDE Model ..........................................................................................160 5.2.1 Mass Transfer Coefficients in Laminar Tubular Flow ...........162 5.2.2 Mass Transfer Coefficients in Laminar Flow around Simple Geometries ....................................................................................163 Illustration 5.2: Release of a Solute into Tubular Laminar Flow: Transport in the Entry Region ..........................164 5.3 Mass Transfer in Turbulent Flow: Dimensional Analysis and the Buckingham p Theorem ...........................................................166 5.3.1 Dimensional Analysis ..................................................................167 5.3.2 The Buckingham p Theorem ...................................................... 168 Illustration 5.3: Derivation of a Correlation for Turbulent Flow Mass Transfer Coefficients Using Dimensional Analysis ...........................................................................169 Illustration 5.4: Estimation of the Mass Transfer Coefficient kY for the Drying of Plastic Sheets ..............................172 5.4 Mass Transfer Coefficients for Tower Packings ..................................173 Illustration 5.5: Prediction of the Volumetric Mass Transfer Coefficient of a Packing ................................................177 5.5 Mass Transfer Coefficients in Agitated Vessels ...................................177 Illustration 5.6: Dissolution of Granular Solids in an Agitated Vessel ...............................................................179 5.6 Mass Transfer Coefficients in the Environment: Uptake and Clearance of Toxic Substances in Animals: The Bioconcentration Factor .........180 Illustration 5.7: Uptake and Depuration of Toxins: Approach to Steady State and Clearance Half-Lives ........................................................................183 Practice Problems ..............................................................................................185
Chapter 6 Phase Equilibria .......................................................... 189 6.1 6.2
Single-Component Systems: Vapor Pressure .......................................190 Illustration 6.1: Maximum Breathing Losses from a Storage Tank ..................................................................................193 Multicomponent Systems: Distribution of a Single Component ................................................................................................195 6.2.1 Gas–Liquid Equilibria .................................................................196 Illustration 6.2: Carbonation of a Soft Drink ...........................197 6.2.2 Liquid and Solid Solubilities ......................................................199
Illustration 6.3: Discharge of Plant Effluent into a River ...... 200 Fluid–Solid Equilibria: The Langmuir Isotherm ....................201 Illustration 6.4: Adsorption of Benzene from Water in a Granular Carbon Bed ............................................205 Illustration 6.5: Adsorption of a Pollutant from Groundwater onto Soil ................................................. 208 6.2.4 Liquid–Liquid Equilibria: The Triangular Phase Diagram .........................................................................................209 Illustration 6.6: The Mixture or Lever Rule in the Triangular Diagram ............................................................................213 6.2.5 Equilibria Involving a Supercritical Fluid ...............................215 Illustration 6.7: Decaffeination in a Single-Equilibrium Stage .................................................................................218 6.2.6 Equilibria in Biology and the Environment: Partitioning of a Solute between Compartments ..........................................220 Illustration 6.8: The Octanol–Water Partition Coefficient ......221 6.3 Multicomponent Equilibria: Distribution of Several Components................................................................................................222 6.3.1 The Phase Rule .............................................................................222 Illustration 6.9: Application of the Phase Rule ......................222 6.3.2 Binary Vapor–Liquid Equilibria ................................................223 6.3.2.1 Phase Diagrams .............................................................224 6.3.2.2 Ideal Solutions and Raoult’s Law: Deviation from Ideality .............................................................................226 6.3.2.3 Activity Coefficients ......................................................229 6.3.3 The Separation Factor a: Azeotropes........................................ 231 Illustration 6.10: The Effect of Total Pressure on a .................235 Illustration 6.11: Activity Coefficients from Solubilities ........236 Practice Problems ..............................................................................................238 6.2.3
Chapter 7 Staged Operations: The Equilibrium Stage ............. 243 7.1
Equilibrium Stages ...................................................................................245 7.1.1 Single-Stage Processes .................................................................245 Illustration 7.1: Single-Stage Adsorption: The Rectangular Operating Diagram ........................................................248 Illustration 7.2: Single-Stage Liquid Extraction: The Triangular Operating Diagram ....................................249 7.1.2 Single-Stage Differential Operation ..........................................251 Illustration 7.3: Differential Distillation: The Rayleigh Equation ..........................................................................252 Illustration 7.4: Rayleigh’s Equation in the Environment: Attenuation of Mercury Pollution in a Water Basin .................................................................................254 7.1.3 Crosscurrent Cascades ................................................................257
Illustration 7.5: Optimum Use of Adsorbent or Solvent in Crosscurrent Cascades ..................................................260 Illustration 7.6: A Crosscurrent Extraction Cascade in Triangular Coordinates .................................................263 7.1.4 Countercurrent Cascades ............................................................264 Illustration 7.7: Comparison of Various Stage Configurations: The Kremser–Souders–Brown Equation ....................269 7.1.5 Fractional Distillation: The McCabe–Thiele Diagram ...........273 7.1.5.1 Mass and Energy Balances: Equimolar Overflow and Vaporization ............................................................275 7.1.5.2 The McCabe–Thiele Diagram ......................................278 7.1.5.3 Minimum Reflux Ratio and Number of Plates..........282 Illustration 7.8: Design of a Distillation Column in the McCabe-Thiele Diagram................................................285 Illustration 7.9: Isotope Distillation: The Fenske Equation ..........................................................................288 Illustration 7.10: Batch-Column Distillation: Model Equations and Some Simple Algebraic Calculations ....................................................................290 7.1.6 Percolation Processes ...................................................................296 Illustration 7.11: Contamination and Clearance of Soils and River Beds ...............................................................299 7.2 Stage Efficiencies....................................................................................... 299 7.2.1 Distillation and Absorption ........................................................301 7.2.2 Extraction .......................................................................................301 7.2.3 Adsorption and Ion-Exchange ...................................................301 Illustration 7.12: Stage Efficiencies of Liquid–Solid Systems ............................................................................302 7.2.4 Percolation Processes ...................................................................304 Illustration 7.13: Efficiency of an Adsorption or Ion-Exchange Column ..................................................305 Practice Problems ..............................................................................................306
Chapter 8 Continuous-Contact Operations ................................ 313
8.1
8.2
Packed-Column Operations ....................................................................314 Illustration 8.1: The Countercurrent Gas Scrubber Revisited ..........................................................................314 Illustration 8.2: The Countercurrent Gas Scrubber Again: Analysis of the Linear Case .........................................319 Illustration 8.3: Distillation in a Packed Column: The Case of Constant a at Total Reflux ......................................322 Illustration 8.4: Coffee Decaffeination by Countercurrent Supercritical Fluid Extraction ......................................324 Membrane Processes ................................................................................326 8.2.1 Membrane Structure, Configuration, and Applications .........327
8.2.2
Process Considerations and Calculations .................................333 Illustration 8.5: Brian’s Equation for Concentration Polarization ......................................................................335 Illustration 8.6: A Simple Model of Reverse Osmosis ............ 336 Illustration 8.7: Modeling the Artificial Kidney: Analogy to the External Heat Exchanger ...................................338 Illustration 8.8: Membrane Gas Separation: Selectivity a and the Pressure Ratio f ...............................................342 Practice Problems ..............................................................................................345
Chapter 9 Simultaneous Heat and Mass Transfer .................... 349 9.1
The Air–Water System: Humidification and Dehumidification, Evaporative Cooling ................................................................................350 9.1.1 The Wet-Bulb Temperature ........................................................350 9.1.2 The Adiabatic Saturation Temperature and the Psychrometric Ratio .....................................................................352 Illustration 9.1: The Humidity Chart ........................................353 Illustration 9.2: Operation of a Water-Cooling Tower ............357 9.2 Drying Operations ....................................................................................361 Illustration 9.3: Debugging of a Vinyl Chloride Recovery Unit ..................................................................................363 9.3 Heat Effects in a Catalyst Pellet: The Nonisothermal Effectiveness Factor ..................................................................................365 Illustration 9.4: Design of a Gas Scrubber: The Adiabatic Case ........................................................369 Practice Problems................................................................................................371
Selected References ...................................................................... 373 Appendix A1 The D-Operator Method ..................................... 379 Appendix A2 Hyperbolic Functions and ODEs ....................... 381 Subject Index .................................................................................. 383
1 Some Basic Notions: Rates of Mass Transfer
We begin our deliberations by introducing the reader to the basic rate laws that govern the transport of mass. In choosing this topic as our starting point, we follow the pattern established in previous treatments of the subject, but depart from it in some important ways. We start, as do other texts, with an introduction to Fick’s law of diffusion, but treat it as a component of a broader class of processes, which is termed gradient-driven transport. This category includes the laws governing transport by molecular motion, Fourier’s law of conduction and Newton’s viscosity law, as well as Poiseuille’s law for viscous flow through a cylindrical pipe and D’Arcy’s law for viscous flow through a porous medium, both of which involve the bulk movement of fluids. In other words, we use as common ground the form of the rate law, rather than the underlying physics of the system. This treatment is a departure from the usual pedagogical norm and is designed to reinforce the notion that transport of different types can be drawn together and viewed as driven by a potential gradient (concentration, temperature, velocity, pressure), which diminishes in the direction of flow. The second departure is the early introduction of the reader to the notion of a linear driving force, or potential difference as the agent responsible for transport. One encounters here, for the first time, the notion of a transport coefficient that is the proportionality constant of the rate law. Its inverse can be viewed as the resistance to transport and in this it resembles Ohm’s law, which states that current transport i is proportional to the voltage difference DV and varies inversely with the Ohmian resistance R. Associated with the transport coefficients is the concept of an effective film thickness, which lumps the resistance to transport into a fictitious thin film adjacent to a boundary or interface. Transport takes place through this film driven by the linear driving force across it and impeded by a resistance that is the inverse of the transport coefficient. The reader will note in these discussions that a conscious effort is made to draw analogies between the transport of mass and heat and to occasionally invoke as well the analogous case of transport of electricity. The chapter is, as are all the chapters, supplemented with worked examples, which prepare the ground for the practice problems given at the end of the chapter. 1
2
1.1
Mass Transfer: Principles and Applications
Gradient-Driven Transport
The physical laws that govern the transport of mass, energy, and momentum, as well as that of electricity, are based on the notion that the flow of these entities is induced by a driving potential. This driving force can be expressed in two ways. In the most general case, it is taken to be the gradient or derivative of that potential in the direction of flow. A list of some rate laws based on such gradients appears in Table 1.1. In the second, more specialized case, the gradient is taken to be constant. The driving force then becomes simply the difference in potential over the distance covered. This is taken up in Section 1.2, and a tabulation of some rate laws based on such potential differences is given in Table 1.2. Let us examine how these concepts can be applied in practice by taking up a familiar example of a gradient-driven process, that of the conduction of heat. The general reader knows that heat flows from a high temperature T, which is the driving potential here, to a lower temperature at some other location. The greater the difference in temperature per unit distance, x, the larger the transport of heat; i.e., we have a proportionality:
TABLE 1.1 Rate Laws Based on Gradients Name 1. Fick’s law
Process
Flux
Diffusion N / A = -D
2. Fourier’s law
Conduction
3. Alternative formulation 4. Newton’s viscosity law
Molecular momentum transport
5. Alternative formulation 6. Poiseuille’s law
7. D’Arcy’s law
Gradient Concentration
dC dx
dT dx d (rCpT ) q / A = -a dx dv Fx / A = t qx = -m x dy q / A = -k
Fx / A = t yx - n Viscous flow in a circular pipe Viscous flow in a porous medium
q/A = vx = -
d (rvx ) dy
d 2 dp 32m dx
q / A = vx = -
K dp m dx
Temperature Energy concentration Velocity
Momentum concentration Pressure
Pressure
3
Some Basic Notions: Rates of Mass Transfer TABLE 1.2 Rate Laws Based on Linear Driving Forces Process 1. Electrical current flow (Ohm’s law) 2. Convective mass transfer 3. Convective heat transfer 4. Flow of water due to osmotic pressure p
Flux or Flow
Driving Force
Resistance
i = DV/R
DV
R
N/A = kCDC
DC
1/kC
q/A = hDT
DT
1/h
NA/A = PwDp
Dp
1/Pw
qµ-
DT Dx
(1.1)
The minus sign is introduced to convert DT/Dx, which is negative quantity, to a positive value of heat flow q. In the limit Dx Æ 0, the difference quotient converts to the derivative dT/dx. Noting further that heat flow will be proportional to the cross-sectional area normal to the direction of flow and introducing the proportionality constant k, known as the thermal conductivity, we obtain Heat flow q( J / s) = - kA
dT dx
(1.2a)
or equivalently Heat flux q / A( J / sm 2 ) = - k
dT dx
(1.2b)
These two expressions, shown graphically in Figure 1.1b, are known as Fourier’s law of heat conduction. It can be expressed in yet another alternative form, which is obtained by multiplying and dividing the right side by the product of density r (kg/m3) and specific heat Cp (J/kg K). We then obtain (Item 3 of Table 1.1) q / A = -a
d(rCp T ) dx
(1.3)
where a = k/rCp is termed the thermal diffusivity. We note that the term rCpT in the derivative has the units of J/m3 and can thus be viewed as an energy concentration. The reason for introducing this alternative formulation is to establish a link to the transport of mass (Item 1 of Table 1.1). Here the driving potential
4
Mass Transfer: Principles and Applications
a.
T = f(x) dT dx x
Temperature T
q
x
b.
x
C = f(x) dC dx x
Concentration C N
x
x
y
c.
dv dy y
mvx y
Distance Transverse to Flow
txy
Flow
vx = f(y)
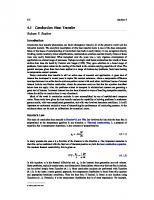
x Distance in Direction of Flow FIGURE 1.1 Diffusive transport: (a) heat; (b) mass; (c) momentum.
is expressed in terms of the molar concentration gradient dC/dx and the proportionality constant D is known as the (mass) diffusivity of the species, paralleling the thermal diffusivity a in Equation 1.3. Transport takes place from a point of high concentration to a location of lower concentration. Noting, as before, that the molar flow will be proportional to the crosssectional area A normal to the flow, we obtain Molar flow N (mol/s) = -DA and equivalently
dC dx
(1.4a)
5
Some Basic Notions: Rates of Mass Transfer
Molar flux N/A (mol/sm2) = -D
dC dx
(1.4b)
These two relations, depicted in Figure 1.1a, are known as Fick’s law of diffusion. There is a third mode of diffusive transport, that of momentum, that can likewise be induced by the molecular motion of the species. Momentum is the product of the mass of the molecular species and its velocity in a particular direction, for example, vx. As in the case of the flow of mass and heat, the diffusive transport is driven by a gradient, here the velocity gradient dvx/dy transverse to the direction of flow (Figure 1.1c). It takes place from a location of high velocity to one of lower velocity, paralleling the transport of mass and heat. As the molecules enter a region of lower velocity, they relinquish part of their momentum to the slower particles in that region and are consequently slowed. There is, in effect, a braking force acting on them, which is expressed in terms of a shear stress Fx/A = tyx pointing in a direction opposite to that of the flow. The first subscript on the shear stress denotes the direction in which it varies, and the second subscript refers to the direction of the equivalent momentum mvx. The relation between the induced shear stress and the velocity gradient is attributable to Newton and is termed Newton’s viscosity law. It is, like Fick’s and Fourier’s law, a linear negative relation and is given by Fx / A = t yx = -m
dv x dy
(1.5)
Equation 1.5 can be expressed in the equivalent form: t yx = -
d(rv x ) m d(rv x ) = -n dy r dy
(1.6)
where n is termed the kinematic viscosity in units of m2/s and the product of density r and velocity vx can be regarded as a momentum concentration in units of (kg m/s)/m3. This version of Newton’s viscosity law brings it in line with the concentration-driven expressions for diffusive heat and mass transport, Equation 1.3 and Equation 1.4. A summary of the relevant relations appears in Table 1.1. Table 1.1 contains two additional rate processes, which are driven by gradients. The first is Poiseuille’s law, which applies to viscous flow in a circular pipe, and a similar expression, D’Arcy’s law, which describes viscous flow in a porous medium. Both processes are driven by pressure gradients and both vary inversely with viscosity, which is to be expected. We now proceed to demonstrate the use of these rate laws with three illustrative examples. The first illustration examines several gradient-driven
6
Mass Transfer: Principles and Applications
processes in which the gradient vanishes at a particular location of the system, yet transport still takes place. Such zero gradients are important in the solution of the differential equations of diffusion because they provide boundary conditions that can be used in the evaluation of integration constants. The second and third examples scrutinize diffusional processes that take place in different geometries. The solutions here are all effected by simple integration using the method of separation of variables. This procedure is employed extensively throughout the text. Occasional use is also made of the D-operator method, which is outlined in the Appendix. Illustration 1.1: Transport in Systems with Vanishing Gradients It frequently happens in transport processes that the driving gradient vanishes at some position in the system, without inhibiting the flow of mass, heat, or momentum. There are two special situations that give rise to such behavior: First, the potential exhibits a maximum or a minimum at a point or axis of symmetry. These locations can be the centerline of a slab, the axis of a cylinder, or the center of a sphere. Figure 1.2a and Figure 1.2b consider two such cases. Figure 1.2a represents a spherical catalyst pellet in which a reactant of external concentration C0 diffuses into the sphere and undergoes a reaction. Its concentration diminishes and attains a minimum at the center. Figure 1.2b considers laminar flow in a cylindrical pipe. Here the state variable in question is the axial velocity vx, which rises from a value of zero at the wall to a maximum at the centerline before dropping back to zero at the other end of the diameter. Here, again, symmetry considerations dictate that this maximum must be located at the centerline of the conduit. The second case of a vanishing derivative arises when flow or flux ceases. Because the proportionality constants in the rate laws cannot themselves vanish, zero flow must perforce imply that the gradient becomes zero. This situation arises when flow or diffusional flux is brought to a halt by a physical barrier. Figure 1.2c and Figure 1.2d depict two such cases. Figure 1.2c shows a capillary that is filled with a solvent and is suddenly exposed to a solution containing a dissolved solute of concentration C0. This configuration has been used in the past to determine diffusivities. As the solute diffuses into the capillary, a concentration profile develops within it, which changes with time until the concentration in the capillary equals that of the external medium. As these profiles grow, they maintain at all times a zero gradient at the sealed end of the capillary. This must be so since N, the diffusional flow in Equation 1.4, can only vanish if the gradient dC/dx itself becomes zero. Figure 1.2d depicts a polymer extruder in which molten polymer enters one end of a pipe and exits as a thin sheet through a lateral slit. Here the barrier is the sealed end of the pipe, which prevents an axial outflow of the polymer melt and forces it instead into the lateral channel. The only way for flow to cease, Q/A = 0, is for the pressure gradient dp/dx to vanish at this point. The resulting axial pressure profile is shown in Figure 1.2d.
7
Some Basic Notions: Rates of Mass Transfer
a.
c. C = C0 = const
C0 0
R C(R) = C0
O
r
x
C = C0
C = f(x, t) t=0
dC = 0 C = f(r) dr r = 0
L
Capillary
dC = 0 dx L
b.
d.
dp =0 dx x = L L
vx = 0
r
t
p = f(x) p0 x
x vx = f(r)
dvx =0 dr r = 0
FIGURE 1.2 Systems with vanishing gradients: (a) catalyst pellet; (b) viscous flow in a pipe; (c) diffusion into capillary; (d) polymer extruder.
Comments: These examples draw the readers’ attention to the appearance of zero gradients in transport processes. Because these are confined to a specific location, they can serve, along with boundary values of the dependent variable itself, as boundary conditions in the solution of the model equations. Thus the catalyst pellet shown in Figure 1.2a has two such conditions, one at the center, where the flux vanishes, and a second at the surface, where the reactant concentration attains a constant value. The pellet is encountered again in Chapter 4 (Illustration 4.9) where the underlying model is found to be a second-order differential equation. Such equations require the evaluation of two integration constants, and must therefore be provided with two boundary conditions.
8
Mass Transfer: Principles and Applications
Illustration 1.2: Diffusion through a Hollow Cylinder The problem addressed here is the diffusional transport through a cylindrical wall of substantial thickness shown in Figure 1.3. Such processes can occur, for example, in the case of fluids contained in a cylindrical enclosure under high pressure. We consider two problems. The first, and more important one, is the determination of the diffusional flux that results under these conditions. The second problem is the derivation of the concentration profile and is of mainly academic interest. Both problems involve the solution of a simple ordinary differential equation by the technique of separation of variables. 1. Diffusional flow N The starting point here is Fick’s law of diffusion, which is applied to a cylindrical surface of radius r and length L (Figure 1.3). We obtain
a. r ri r0 C(r)
Ci
C0 Ni
b.
r
ri
N
N
N N
FIGURE 1.3 Diffusional flow from (a) a hollow cylinder; (b) a spherical cavity.
9
Some Basic Notions: Rates of Mass Transfer
N = - D2prL
dC dr
(1.7a)
where N = constant since we assume steady operation. Separating variables and formally integrating between the limits of internal and external concentrations Ci and Co we obtain
Ú
Co
dC = -
Ci
N D2pL
Ú
ro
ri
dr r
(1.7b)
and after evaluation of the integrals and rearrangement
N = D2pL
(Ci - Co ) ln ro / ri
(1.7c)
where i and o denote the inner and outer conditions. This is the desired relation, which expresses diffusion rate N in terms of a driving force Ci – Co and the geometry of the system. By multiplying numerator and denominator by (ro – ri), this expression can be cast into the frequently used alternate form:
N = DAm
(Ci - Co ) (Ci - Co ) = ro - ri R
(1.7d)
where Am is the so-called logarithmic mean of the inner and outer areas, given by
Am =
Ao - Ai ln Ao / Ai
(1.7e)
and R is a resistance defined by R=
ro - ri DAm
(1.7f)
The introduction of the resistance carries the advantage that one can, in the case of a composite cylinder made up of different materials, describe the system by simply adding resistances. This principle of adding resistances in series is routinely applied in electrical circuits. For a cylinder composed of three different materials, for example, one obtains
10
Mass Transfer: Principles and Applications
N=
(Ci - Co ) R1 + R2 + R3
(1.7g)
where the resistances can be expressed respectively as R1 =
r1 - ri D1 Am1
R2 =
r2 - r1 D2 Am 2
R3 =
ro - r2 D3 Am 3
(1.7h)
2. Concentration profile C = f(r) We return to Fick’s law, Equation 1.7a and integrate again, but this time only up to an arbitrary radius r and the concentration C at that point. We obtain
Ú
r
ri
N dr =D2pL r
Ú
C
dC
(1.8a)
Ci
or, since N is a constant given by Equation 1.7c, C(r ) = Ci -
Ci - C o ln r / ri ln ro / ri
(1.8b)
This equation expresses the concentration profile within the cylindrical wall. Comments: Of the various expressions presented, Equation 1.7c and its extension Equation 1.7g are the ones most frequently used in engineering applications. They allow the desired calculation of the mass flow N, which is the quantity of greatest practical interest. The concentration profile is not of immediate use, but reveals the surprising fact that C(r) is independent of diffusivity. It is these unexpected results that are the most rewarding feature of modeling. One should never set aside a solution without scrutinizing it first for unusual features of this type. We shall make frequent use of this maxim in subsequent illustrations. Illustration 1.3: Underground Storage of Helium: Diffusion through a Spherical Surface The previous illustration considered the rate of diffusion through a cylindrical wall and the resulting concentration profile within that wall. A similar approach can be used to calculate these quantities for diffusion through a spherical wall (Figure 1.3b). This case arises much less frequently, as it requires the steady production of the diffusing species within the spherical cavity, or
11
Some Basic Notions: Rates of Mass Transfer
else assumes the diffusion rate to be sufficiently small so that the internal concentration remains essentially constant. The case to be considered here falls in the latter category and involves the diffusional losses of helium from an underground storage facility. The background to this problem is as follows: Helium is present in air at a concentration of about 1 ppm, which is far too small for the economic recovery of this gas. It also occurs in natural gas (methane CH4), where its concentration is considerably higher, of the order of 0.1 to 5%, making economic extraction possible. Because helium is a nonrenewable resource, regulations were put in place starting in the early 1960s that required all shipped natural gas be treated for helium recovery. With supply by far outweighing the demand, ways had to be found to store the excess helium. One suggested solution was to pump the gas into abandoned and sealed salt mines where it remained stored at high pressure. The problem here will be to estimate the losses that occur by diffusion through the surrounding salt and rock, assuming a solid-phase diffusivity Ds of helium of 10-8 in.2/s, i.e., more than three orders of magnitude less than the free-space diffusivity in air. The helium is assumed to be at a pressure of 10 MPa (~100 atm) and a temperature of 30r C. The cavity is taken to be spherical and of radius 100 m. Applying Fick’s law, Equation 1.4a, and converting to pressure we obtain N = - Ds 4 pr 2
D 4 pr 2 dp dC =- s dr RT dr
(1.9a)
Separating variables and integrating yields
-
4 pDs RT
Ú
0 p
dp = N
Ú
•
r1
1 dr =N 2 r r1
(1.9b)
and consequently N=
4 pDs r1 p 4 p10 -8 ¥ 10 2 ¥ 10 7 = 8.314 ¥ 303 RT
(1.9c)
N = 0.05 mol/s
(1.9d)
Comments: We have here an example of some practical importance, which nevertheless yields to a simple application and integration of Fick’s law. Two features deserve some mention. The first is the formulation of the upper integration limit in Equation 1.9b. We use the argument that “far away” from the spherical cavity, i.e., as r Æ •, the concentration and partial pressure of helium
12
Mass Transfer: Principles and Applications
tends to zero, i.e., we assume the cavity to be embedded in an infinite region. The second point that needs to be examined is the assumption of a constant cavity pressure. We compute for this purpose the yearly loss and show that even over this lengthy period, the change in cavity pressure will be negligibly small. Thus, Yearly loss = 0.05 (mol/s) ¥ 60 ¥ 365 = 2.6 ¥ 104 mol/year i.e., about 100 kg per year. By comparison,
Cavity contents: n =
pV 10 7 43 p10 6 = = 1.17 ¥ 1010 mol RT 8.31 ¥ 303
and therefore % loss/year = (2.6 ¥ 10 4 / 1.7 ¥ 1010 )100 = 1.5 ¥ 10 -4% / year Even if D were raised to that prevailing in free air (~10–4 m2/s), the losses would still amount to only 1.5% per year. This justifies the use of our assumption. We shall have occasion to examine this problem again in Illustration 2.9.
1.2
Transport Driven by a Potential Difference: The Film Concept and the Mass Transfer Coefficient
In the gradient-driven procedure we considered previously, the operative gradient varied in the direction of transport, as indicated in Figure 1.1. In a number of important cases, however, the gradient either is constant or is assumed to be of constant value. Let us first consider a case where no such assumption is made. We turn, for this purpose, to the familiar Ohm’s law, which relates the flow of electrical current i (C/S or A) to the applied voltage: i = DV/R
(1.10a)
This is a linear law, involving a linear driving force DV and a proportionality constant, which is the inverse of the electrical resistance R(W) of the conductor. There is, at first sight, no gradient involved. Closer scrutiny of the resistance R reveals, however, that it must vary directly with the length of the conductor DL, and inversely with its cross-sectional area AC, which we assume to be constant. We can then write
13
Some Basic Notions: Rates of Mass Transfer R = RsDL/AC
(1.10b)
where Rs is termed the specific resistance of the conductor in units of Wm. Ohm’s law can then be expressed as follows: i = ( Rs / AC )
DV DL
(1.10c)
This equivalent form of the celebrated law shows that current is in fact driven by a gradient, which does, however, turn out to be constant. Items 2 and 3 of Table 1.2 concern what we term convective mass and heat transfer. Let us illustrate these terms by making use of Figure 1.4a. This figure depicts turbulent flow of either a gas or liquid past a liquid or solid boundary shown crosshatched on the left. That boundary can be the confining wall of a duct, or the interface separating two phases. Mass transfer is assumed to occur from a concentration CA2 of the boundary to a lower concentration CA1 in the bulk of the flowing fluid. This can come about if the boundary consists of a soluble substance or if a volatile liquid evaporates into a flowing gas stream. These two operations, as well as the reverse processes of condensation and crystallization, are shown in Figure 1.5. In all four cases shown, the concentrations and partial pressures in the fluid phase are in equilibrium with the neighboring condensed phase. This condition is denoted by an asterisk. Thus, p* is the equilibrium vapor pressure of the liquid, and C* is the equilibrium solubility of the solid. Mass transfer takes place initially through a laminar sublayer, or boundary layer, which is located immediately adjacent to the interface. Transfer through this region, also known as an “unstirred layer” in biological applications, is relatively slow and constitutes the preponderant portion of the resistance to mass transport. This layer is followed by a transition zone where the flow gradually changes to the turbulent conditions prevailing in the bulk of the fluid. In the main body of the fluid we see macroscopic packets of fluid or eddies moving rapidly from one position to another, including the direction toward and away from the boundary. Mass transfer in both the transition zone and the fully turbulent region is relatively rapid and contributes much less to the overall transport resistance than the laminar sublayer. One notes in addition that with an increase in fluid velocity there is an attendant increase in the degree of turbulence and the eddies are able to penetrate more deeply into the transition and boundary layers. The latter consequently diminish in thickness and the transport rate experiences a corresponding increase in magnitude. Thus, high flow rates mean a greater degree of turbulence and hence more rapid mass transfer. Concentrations in the turbulent regime typically fluctuate around a mean value shown in Figure 1.4a and Figure 1.4b. These fluctuations cannot be easily quantified, nor do they lend themselves readily to the formulation of
14
Mass Transfer: Principles and Applications
Flow
a. CA2
Limit of Laminar Flow Actual Mean Profile
CA1 Film Theory Effective Film Thickness 0
ZFM
Distance into Flow Flow
b. T2
Limit of Laminar Flow Actual Mean Profile
T1 Film Theory Effective Film Thickness ZFH
Distance into Flow
FIGURE 1.4 The effective film in the transport of (a) mass and (b) heat.
a rate law. This can be overcome by postulating the existence of an equivalent linear concentration profile that extends from the boundary into the bulk fluid. This postulate is enshrined in the concept known as film theory, and the dimension of the film in question is termed the effective film thickness, denoted as zFM in Figure 1.4a. Let us see how this concept can be quantified into a rate law. We start with Fick’s law, and applying it to the constant gradient of film theory we obtain NA / A = - D
dCA (C - CA1 ) = D A2 dz zFM
(1.11a)
The ratio of diffusivity to film thickness D/zFM is coalesced into a single term called the mass transfer coefficient kC and we obtain
15
Some Basic Notions: Rates of Mass Transfer
a.
Evaporating Liquid
b.
P*
Pb
Gas Flow Pb
Cold Wall
Vapor Flow P*
Condensing Vapor
c.
Tb
Ti
d. Solution
Dissolving Solid
C* Liquid Flow Cb
Cb Cold Wall Crystallizing Solid
C* Tb Ti
FIGURE 1.5 Four types of single-film mass transfer: (a) evaporation; (b) condensation; (c) dissolution; (d) crystallization.
NA / A =
D (C - CA1 ) = kC ( DCA ) zFM A2
(1.11b)
as shown in Table 1.2. A similar film theory can be postulated for the case of heat transfer, shown in Figure 1.4b. The conditions here parallel those shown for mass transfer with temperature replacing concentration as the driving potential. Starting with Fourier’s law, Equation 1.2b, we then obtain q / A = -k
(T - T ) dT =k 2 1 dz zFH
(1.12a)
Coalescing the ratio k/zFH into a single term h then leads to q/ A=
k (T - T ) = hDT zFH 2 1
(1.12b)
16
Mass Transfer: Principles and Applications
where h is now termed the heat transfer coefficient. The effective film thicknesses for the two cases, zFM and zFH, are not in general equal, but depend in a complex functional form on the physical properties, the geometry, and the velocity of flow of the system. That functional form will be explored in greater detail in Chapter 5. In addition, the transport rate depends linearly on the potential difference, a feature that is often referred to as a linear driving force. All three items 1 to 3 have this characteristic in common. A special type of driving force arises in Item 4 of Table 1.2. The process here is the selective transport of water through a semipermeable membrane from a dilute solution (high water concentration) to a more concentrated solution (low water concentration). The driving force is in this case the difference of the so-called osmotic pressure p, which makes its appearance in transport through cell membranes as well as in industrial processes termed reverse osmosis. We have occasion to take a closer look at osmotic-pressuredriven processes in Chapter 8.
1.3
Units of the Potential and of the Mass Transfer Coefficient
In deriving the mass transfer rate law, Equation 1.11b, we started with Fick’s law, which uses molar concentration C in units of mol/m3 as the driving potential. This quantity was retained to describe the driving force in the final expression (Equation 1.11b). It is a convenient quantity to use in many gasliquid operations and carries the advantage of imparting units of m/s to the mass transfer coefficient. kC can thus be viewed as the velocity with which the rate process proceeds. It frequently happens, however, that molar concentrations are inconvenient to use in the description of certain mass transfer operations. In distillation, for example, the preferred concentration unit is the mole fraction since the associated vapor–liquid equilibrium is commonly expressed in liquid and vapor mole fractions (x, y). In the evaporation of liquids, the vapor pressure is the potential of choice, and it then becomes convenient to use a pressure difference as the driving force. Yet another operation that calls for a change in concentration units is humidification, in which the preferred concentration is the absolute humidity in units of kg water/kg dry air. In each of these cases, the change in concentration units carries with it a change in the units of the mass transfer coefficient. The pertinent rate laws, driving forces, and mass transfer coefficients, together with their units, are summarized in Table 1.3. Pressure heads the list of driving potentials for gases and vapors, followed by mole fraction, moles/ volume, and mass ratio in the order of preference and frequency of use. For liquid systems, molar concentration is the unit of choice, followed by mole fraction.
17
Some Basic Notions: Rates of Mass Transfer TABLE 1.3 Rate Laws and Transfer Coefficients for Diffusion through a Stagnant Film Flux (mol/m2 s)
Driving Potential
Mass Transfer Coefficient
Gases NA/A = kGDpA NA/A = kyDyA NA/A = kCDCA WA/A = kYDYA (kg/m2/s)
pA (Pa) yA (mole fraction) CA (mol/m3) YA (kg A/kg B)
kG (mol/m2 s Pa) ky (mol/m2 s mole fraction) kC (m/s) kY (mol/m2 s DYA)
CA (mol/m3) xA (mole fraction)
kL (m/s) kx (mol/m2 s mole fraction)
Liquids NA/A = kLDCA NA/A = kxDxA Conversion Factors Gases Liquids
kG = kY/PT = kC/RT = kY/MpBM k LC = k x
Also listed in Table 1.3 are conversion factors for the transformation of mass transfer coefficients from one set of units to another. These are frequently required to convert literature values of k given in a particular set of units, to one needed in a different application. This type of conversion is taken up in Illustration 1.4. Of note as well in Table 1.3 is the appearance of the term pBM, the so-called logarithmic mean, or log-mean driving force, defined by pBM =
pB2 - pB1 p ln B2 pB1
(1.13)
where the subscript B denotes the second component in a binary system; the first is the component A being transferred. Derivation of this quantity, and its appearance in the conversion factor, is addressed in Section 1.4. Illustration 1.4: Conversion of Mass Transfer Coefficients In a particular application related to air flowing over a water surface, the following data were reported at T = 317 K: pA1 = 2,487 Pa pB1 = 101,300 – 2487 = 98,813 Pa pB2 = PT = 101,300 Pa kCA = 0.0284 m/s Water evaporates into the dry airstream at a total pressure PT = 101.3 kPa and is denoted by the subscript A; B refers to the air component. kC is the mass
18
Mass Transfer: Principles and Applications
transfer coefficient, here of water. We wish to calculate the corresponding value for kY in units of kg H2O/m2 s DY. The conversion formula given in Table 1.3 is kY = kC
MB p RT BM
(1.14)
where MB is the molar mass of air = 29 ¥ 10–3. We obtain kY = 0.0284
29 ¥ 10 -3 98, 813 - 101, 300 98, 313 8.31 ¥ 317 ln 101, 300
and therefore kY = 0.0312 kg H2O/m2 DY
1.4
Equimolar Counterdiffusion and Diffusion through a Stagnant Film: The Log-Mean Concentration Difference
So far our treatment has been confined to mass transfer due to diffusion only. We have considered diffusion in a stationary or unmixed medium, which has led to the use of Fick’s Equation 1.4. When a stirred or turbulent medium was involved, we invoked film theory and the linear driving force concept to describe transport in such situations. This led to the formulation of the expression (Equation 1.11b). Mass transport can, however, also come about as a result of the bulk motion or flow of a fluid. To take this factor into account, we postulate the total flux of a component A to be the sum of a diffusive flux term and a bulk flow term. Thus, for a gaseous mixture NA / A Flux of A
=
- CDAB
dy A dz
Diffusional Flux
+
y A ( N A / A + N B / A)
(1.15a)
Bulk Flow
Here we have replaced the CA, which appears in Fick’s law, by the equivalent term CyA where C = total molar concentration, assumed to be constant. For ideal gases we have yA = pA/PT and C = PT/RT, where PT = total pressure, so that Equation 1.15a becomes
Some Basic Notions: Rates of Mass Transfer
NA / A = -
DAB dp A p A + ( N A / A + N B / A) RT dz PT
19
(1.15b)
This is the form we wish to develop and simplify. Two special cases of Equation 1.15a are to be noted: equimolar counterdiffusion and diffusion through a stagnant film.
1.4.1
Equimolar Counterdiffusion
In this case we have NA = –NB
(1.16)
and Equation 1.15b reduces to Fick’s law. This situation arises in the interdiffusion of pure fluids of equal molar volume or in binary adiabatic distillation processes of substances with identical molar heats of vaporization. Straightforward integration of Fick’s law then leads to, for a gaseous system: N A¢ / A =
DAB DAB ( p - pA2 ) = ( p - pA2 ) RT ( z2 - z1 ) A1 RTzFM A1
(1.17a)
or in short NA¢/A = kG¢ DpA
(1.17b)
where we use the prime symbol to denote equimolar counterdiffusion. Similarly, for a liquid system, using mole fraction as the driving potential, N A¢ / A =
CDAB CDAB ( x - x A2 ) = ( x A1 - x A2 ) ( z2 - z1 ) A1 zFM
(1.17c)
or in short NA ¢/A = kx¢DxA
(1.17d)
Because Dp/zM and Dx/zFM are constant, the concentration profiles in both cases are linear. This is shown for a liquid system in Figure 1.6a. A summary of the pertinent rate laws, transfer coefficients, and conversion factors that apply to equimolal counterdiffusion appears in Table 1.4.
20
Mass Transfer: Principles and Applications
a. XB2
XA2 XA
XB
NA
NB
A+B
A+B XB1 XA1 z
b. pB2
pA2 NA
pA
NB = 0
A
A+B pB
pB1
pA1
z FIGURE 1.6 Two modes of transport: (a) equimolar counterdiffusion; (b) diffusion through a stagnant film.
1.4.2
Diffusion through a Stagnant Film
Here the flux of the species B is zero and we have NB/A = 0
(1.18a)
so that Equation 1.15b, after solving for NA/A, is reduced to the expression NA / A = -
DAB PT dp A RT ( PT - p A ) dz
(1.18b)
21
Some Basic Notions: Rates of Mass Transfer TABLE 1.4 Rate Laws and Transfer Coefficients for Equimolar Diffusion Flux (mol/m2 s)
Driving Potential
Mass Transfer Coefficient
Gases NA¢/A = kG¢DpA NA¢/A = ky¢DyA NA¢/A = kCDCA
pA (Pa) yA (mole fraction) CA (mol/m3)
kG¢ (mol/m2 s Pa) ky¢ (mol/m2 s mole fraction) kC (m/s)
CA (mol/m3) xA (mole fraction)
kC¢ (m/s) kx (mol/m2 s mole fraction)
Liquids NA¢/A = kL¢DCA NA¢/A = kx¢DxA Conversion Factors Gases
kG ¢ =
ky y PT
=
kC ¢ RT
kL ¢ C = ky ¢
Liquids
Conversion from Equimolal to Stagnant Film Coefficients Gases
kG ¢ = kG
pBM PT
ky ¢ = ky
CBM = kC x BM P
kx ¢ = kx xBM
pBM = ky yBM PT
kC ¢ = kC
pBM C = kC BM PT C
Liquids
kC ¢ = kC
which can be integrated to yield NA / A = -
( P - p A1 ) DAB PT DAB PT p ln T = ln B1 ( z2 - z1 )RT ( PT - p A 2 ) ( z2 - z1 )RT pB 2
(1.18c)
Because of the logarithmic terms, the profiles for both component A and component B are nonlinear. This is depicted in Figure 1.6b. We now introduce a clever device to reduce the nonlinear terms in Equation 1.18c to the product of a linear driving force in the diffusing species A, pA1 – pA2, and a constant mass transfer coefficient kG. This is done by writing: 1=
pB 2 - pB1 PT - p A 2 - PT + p A1 p A1 - p A 2 = = p B 2 - p B1 p B 2 - p B1 p B 2 - p B1
(1.18d)
Using the definition of the log-mean pressure difference pBM given by Equation 1.13 and setting z2 – z1 = zFM as before, we obtain
22
Mass Transfer: Principles and Applications
NA / A =
DAB PT ( p - pA1 ) zFM RTpBM A2
(1.18e)
or in short NA/A = kGDpA
(1.18f)
We have thus reduced a complex nonlinear situation to one that fits the linear driving force and film concepts and agrees with the tabulations of Table 1.3.
Illustration 1.5: Estimation of Mass Transfer Coefficients and Film Thickness. Transport in Blood Vessels It is of some interest to the practicing engineer to have a sense of the order of magnitude both of the mass transfer coefficient and of its associated film thickness. This would appear to be an impossible task, given the wide range of flow conditions, geometrical configurations, and physical properties encountered in practice. Surprisingly, we can arrive at some reasonable estimates of upper and lower bounds in spite of this diversity. This is due to three factors: First, it is common engineering practice to associate the upper limit of normal turbulent flow with velocities of the order 1 m/s in the case of liquids and 10 m/s for gases. This applies to industrial systems (pipe and duct flow) as well as within an environmental context (wind, river flow) and holds even in extreme cases. Hurricane-force winds, for example, may range as high as to 30 m/s but are still within the order of magnitude cited. Second, the diffusivities for a wide range of substances are, as we shall see in Chapter 3, surprisingly constant. They cluster, in the case of gases, around a value of 10–5 m2/s and for liquids around 10–9 m2/s. Third, if we confine ourselves to flow over a plane as a representative configuration, it will be found that mass transfer coefficients vary inversely with the 2/3 power of the ratio (m/rD) (see Table 5.5). That ratio, termed the Schmidt number, Sc, is again surprisingly constant. It is of the order 1 for gases, and some three orders of magnitude higher for transport of modest-sized solutes in liquids. Drawing on the correlation given in Table 5.5: kC = 0.036 Re -0.2 Sc -0.67 v
(Re > 10 6 )
and noting the extremely weak dependence on the Reynolds number, Re, we obtain the following order-of-magnitude estimates for turbulent flow mass transfer:
Some Basic Notions: Rates of Mass Transfer
23
For gases: kC ~ 10–2 m/s For liquids: skC ~ 10–5 m/s For the effective film thickness, zFM = D/kC the corresponding values are For gases: zFM ~ 1 mm For liquids: zFM ~ 0.1 mm The kC values given here represent the order of magnitude of the outer limits of what can be accomplished, i.e., the maximum rate of mass transfer obtainable or the minimum time required to achieve the transfer of a given mass to or from a flat surface. Mass transfer by molecular diffusion resides at the other end of the spectrum. It yields the lowest possible mass transfer rate and sets an upper limit on time requirements. The solvent spill considered in Practice Problem 4.4, for example, requires several days to complete evaporation by diffusion into stagnant air. The same data applied to turbulent air flow at the same temperature yield an estimate of several minutes, lower by three orders of magnitude. The factor of 1000 can thus be viewed as separating the two extremes of diffusive and turbulent mass transfer. Transport in blood vessels presents another interesting subcase. Here the species involved in mass transfer, typically proteins, have much lower diffusivities than ordinary solutes, of the order 10–10 to 10–11 m2/s. Flow is generally laminar, and of a pulsatile nature. A further departure from the norm is the complex geometry of the vascular systems, which involves multiple branchings, and constrictions in flow as well as expansions. Because of these complexities, it has become customary to measure local mass transfer coefficients confined to a typical wall area of 1 mm2. A host of such measurements has by now been reported. The surprising fact that has emerged from these studies is that irrespective of location or configuration, the vast majority of kC values clusters around a value of 10–5 m/s. Thus, kC ~ 10–5 m/s and for a protein with a diffusivity of 10–10 m2/s, zFM ~ 10–2 mm The studies referred to have been immensely helpful in analyzing the progress of vascular diseases, which are often associated with the migration of proteins to the vessel wall followed by an interaction with wall cells, leading, for example, to blood coagulation. Mass transfer is also important in the performance of vascular grafts and of controlled release devices (see Practice Problems 1.7 and 1.10).
24
1.5
Mass Transfer: Principles and Applications
The Two-Film Theory
Our considerations so far have been limited to transport through a single phase; i.e., in postulating the film theory it was assumed that a single film resistance was operative. This was the case for a pure liquid evaporating into a gas stream, or when a solid dissolved into a solvent stream. We now consider the extension of this process to encompass simultaneous transport in two adjacent phases. This leads to the formation of two film resistances, and brings us to the so-called two-film theory, which is taken up below. Consider two phases, I and II, in turbulent flow and in contact with each other, as shown in Figure 1.7a. Transport takes place in the first place, from a high concentration yA through the effective film associated with Phase II to the interface. Here the Phase II concentration y*Ai is assumed to be in equilibrium with the Phase I interfacial concentration xAi, so that y*Ai = mxAi
(1.19)
Concentration A
a. Interface Phase II
Film XA1
yA
Phase I yA
Film
XA
yA Distance
b.
Temperature T
Separating Wal Hot Fluid
Film
Th Tw2
Tw1
Film
Cold Fluid
TC Distance
FIGURE 1.7 The two-film concept: (a) mass transfer; (b) heat transfer.
25
Some Basic Notions: Rates of Mass Transfer
where m is the local slope of the equilibrium curve and the asterisk serves to denote equilibrium conditions. Transport then continues from the interface, through the second film to the bulk of Phase I of concentration xA. We can write for the entire process: NA/A = ky(yA – yAi) = kx(xAi – xA)
(1.20)
These expressions, while valid under the constraints of two-film theory, are nevertheless ill-suited for practical use, as neither of the interfacial concentrations xAi or yAi is generally known. We avoid this difficulty by postulating an equivalent rate law, given by NA/A = Koy(yA – yA*)
(1.21a)
NA/A = Kox(xA* – xA)
(1.21b)
where Koy and Kox are termed overall mass transfer coefficients and the asterisked quantities are the concentrations in equilibrium with the bulk concentration of the neighboring phase. These are generally known and are displayed in Figure 1.8. It is shown in the following section that the equations are valid provided the overall coefficients are related to the film coefficients as follows:
Equilibrium Curve A
yA
yA– yAi yAi Gas Phase Mole Fraction yA yA*
Slope – kx/ky
B
Slope m
C
D
yA– yA* E XAi–XA
XA*–XA Slope = H XA
XAi
XA*
Liquid Phase Mole Fraction XA FIGURE 1.8 The driving forces.
26
Mass Transfer: Principles and Applications 1 1 m = + K oy k y k x
(1.22a)
1 1 1 = + K ox mk y k x
(1.22b)
The reciprocal terms appearing in these expressions may be regarded as resistances to the mass transfer process. Thus, in Equation 1.22a, 1/ky is the resistance due to the gas film, m/kx represents the liquid film resistance, and the sum of the two yields the overall resistance 1/Koy . This is often referred to as the law of additivity of resistances, which was previously encountered in Equation 1.7g. Similar arguments apply to Equation 1.22b. Note that when m is small compared to kx, we obtain the approximate relation 1 1 =˙ K oy k y
m > 1
(1.22c)
This implies that the gas is highly soluble and that most of the resistance is likely to reside in the gas phase. We speak of the process as being gas-film controlled. Conversely, if m is large, i.e., the gas is sparsely soluble, we obtain 1 1 =˙ K ox k x
m > VB, so that the slope becomes VT/KQ. The flow rate Q is usually known from independent measurements (see Practice Problem 2.6), while the partition coefficient can often be determined in vitro, i.e., in the laboratory using extracted tissue. The value of the slope can then be used to determine the unknown tissue volume VT. Conversely, if tissue volume is known from independent measurements, the slope will yield a value for the partition coefficient Ka. Note that the tissue concentration is then given by È Ê QKt ˆ ˘ CT = CB / K = (CBo / K )Í1 - expÁ ˜˙ Ë VB + VT ¯ ˙˚ ÍÎ
(2.13g)
Once these parameters have been established from appropriate experiments, we can use Equation 2.13g to establish the time required to attain a desired therapeutic concentration. 2. A Well-Mixed Tissue Compartment in Contact with Flowing Blood with a Varying Concentration The case in question is sketched in Figure 2.5b, and involves the exchange of a substance between a tissue region of uniform concentration and blood flowing in a capillary along which concentration varies. The membrane separating the two has a transport resistance represented by the mass transfer coefficient km, which equals diffusivity divided by the thickness of the membrane. Let us consider first the case of substance uptake by the tissue. If that substance enters the capillary at a flow rate Q, we can write for the difference element shown in Figure 2.5b Rate of solute in – Rate of solute out = 0 Q CB z – (Q CB z+ Dz + N avg ) = 0
(2.14a)
or, using an explicit expression for Navg and setting CB* = KCT , as given by Equation 2.13a, Q CB z - Q CB z+Dz - k m PDx(CB - KCT ) = 0
(2.14b)
where P = perimeter of capillary. Here, use has been made of the quasisteady-state assumption; i.e., the process was taken to be slow enough that over a short finite period of observation (say, a few minutes) neither the tissue nor the blood concentrations vary significantly. Dividing by Dx and going to the limit Dx Æ 0 we obtain the ODE
61
Modeling Mass Transport: The Mass Balances
Q
dCB + k m P(CB - aCT ) = 0 dz
(2.14c)
Integration by separation of variables then leads to
Ú
CB
CBo
k P dCB =- m CB - KCT Q
Ú
L
0
dz
(2.14d)
and consequently ln
k A CB - KCT =- m CBo - KCT Q
(2.14e)
or alternatively Uptake:
CB - KCT Ê km A ˆ ˜ 0 = expÁ CBo - KCT Ë Q ¯
(2.14f)
where A = interfacial area. For the reverse process, i.e., when the substance is removed by blood that enters the capillary devoid of it, we have Clearance:
Ê k Aˆ CB / KCT = 1 - expÁ - m ˜ Ë Q ¯
(2.14g)
This process is referred to as clearance of the tissue. Comments: A quick check for validity of solution gives CB = CBo for A Æ 0, as it should, and CB = KCT for A Æ •. The latter is the result of equilibration of blood and tissue that occurs as x, and consequently area A, goes to infinity. Expression 2.14f and Expression 2.14g are used particularly for the determination of the mass transfer coefficient, assuming that values of K and Q have been determined independently. This can be done in the usual fashion by making a semilog plot of the concentration fraction in Equation 2.14e against the reciprocal 1/Q, i.e., by running a series of experiments at different volumetric flow rates Q. For clearance experiments, CBo is set equal to zero. The slope of the plot then yields the product kmA. Because detailed anatomical information for the determination of the interfacial area A is rarely available, we must be content to deal with the product kmA itself. That quantity, however, is still highly useful because it provides a measure of the overall permeability of the tissue–capillary interface.
62
Mass Transfer: Principles and Applications
Experiments of the type just described are critical in evaluating the effectiveness of drugs designed to increase the passage of metabolically important materials into tissue. Such drugs are referred to as vasoactive and they act by increasing the area available for transfer, or by increasing the permeability of the membrane itself. This is reflected in an increase in the slope of the plot of Equation 2.14e. Illustration 2.5: Batch Distillation: An Example of a Cumulative Balance Batch distillation is practiced with considerable frequency both on a laboratory and an industrial scale for the purpose of separating and purifying liquid mixtures. A simple version of the process that comes close to that used in laboratory practice is sketched in Figure 2.6. The still, shown on the left, is loaded with a liquid mixture of composition xW0 and total mass W0 and subsequently brought to a boil by internal or external heating. The vapor produced at a rate D mol/s is passed into a water-cooled condenser and the resulting liquid condensate is collected in a receiver shown on the right of Figure 2.6. The composition and total mass in the still at any instant are denoted by xW and W and that in the receiver by xD¢ and D¢. We note that in industrial practice a cylindrical column containing various vapor–liquid contacting devices such as packing of the type used in gas absorbers (see Illustration 2.3) is mounted on the still to promote additional fractionation of the vapor. The
Water out
Condenser
Water in yD, D XW, W
Steam
Still
XD', D'
Receiver
FIGURE 2.6 A batch-distillation apparatus.
Modeling Mass Transport: The Mass Balances
63
liquid phase for this section is provided by diverting part of the liquid condensate, termed reflux, to the top of the column. This type of operation is discussed in greater detail in Chapter 7 (Illustration 7.10). As is usual in systems of some complexity, a number of different balances can be made depending on the choice of balance space. We may choose, for example, to make an unsteady integral balance about the still, or to make a similar balance about the receiver. They can be instantaneous or cumulative in time and can involve total or component mass balances. The balance considered here is the cumulative balance up to some point in time t. We apply the scheme previously given in Equation 2.7 and write: Mass initially present = Mass left in still + Mass in receiver W0 = W + D¢
(2.15a)
and for the component mass, assuming a binary system: xW0W0 = xWW + xD¢D¢
(2.15b)
where the total mass is expressed in kg or in mol, and the compositions represent mass or mole fractions. The receiver contents D¢ have been primed to distinguish them from the rate of distillation (mol/s), which is commonly given the symbol D. Comments: Cumulative balances such as the two simple expressions (Equations 2.15a and Equation 2.15b) are often overlooked in modeling, or else written out without much thought to their origin. It is important to note that they are quite independent of the unsteady integral balances mentioned previously and consequently serve as additional tools that can be used to supplement the model equations. Typically, they are used as adjuncts to instantaneous balances in batch distillation. We can, for example, solve for either still or distillate composition and obtain xd ¢ =
xW 0 - xW (1 - f ) f
(2.15c)
xW =
xW 0 - xD ¢ (1 - f ) f
(2.15d)
where f = 1 – W/W0 = fraction distilled. Use of these equations is demonstrated in Illustration 7.10.
64
2.3
Mass Transfer: Principles and Applications
The Information Obtained from Model Solutions
The reader will have noted that in several of the illustrations so far, the model and its solution were used to extract a particular piece of information about the underlying physical system or process. Thus, in the two biological examples given in Illustration 2.4, the suggested use of the solution was the determination of tissue volume and permeability. We now wish to generalize this aspect of modeling and ask the question: What types of information can we expect to find in the solution of a model? This is evidently a question of some importance because, without a priori knowledge of the information contained in the solution, modeling would presumably not be undertaken at all. The question can be answered in a general way by stating that any of the quantities appearing in the solution, including the dependent and independent variables, can be the unknown or the information being sought. These solutions generally take one of the following forms: u = f(t, parameters)
(2.16a)
u = g(z, parameters)
(2.16b)
u = F(v, parameters)
(2.16c)
or
Here, the dependent variable u, which is typically a concentration or a mass related to the system, is seen to be a function of time t, distance z, or another mass or concentration v plus a set of specific parameters pertinent to the system. Two additional forms make their appearance: z = G(t, parameters)
(2.16d)
u = H(x, y, z, t, parameters)
(2.16e)
and
The first of these represents the special case where distance z becomes the dependent variable and time the independent variable. Solutions of this form arise, for example, in systems involving reacting particles, where particle radius is now the dependent variable, which varies with time. The mathematical expression that results has been given by Equation 2.9. The second, Equation 2.16e, is a multidimensional one and arises from a PDE. Some solutions to such PDE models appear in Chapter 3, and the models themselves are taken up in Illustration 2.6 and Illustration 2.7.
65
Modeling Mass Transport: The Mass Balances
We first note that in addition to u either t or z may be the unknowns being sought. This is in fact the most common occurrence. We may wish, for example, to determine the time or distance necessary to affect a prescribed concentration change. Designing a scrubber, i.e., calculating its height z, falls in the latter categories. Next in importance as an unknown are the parameters, which we can accommodate in the following broad categories: 1. Transport coefficients, such as diffusivities, film coefficients, overall mass transfer coefficients, and permeabilities 2. Rate constants pertaining to chemical or biological reactions taking place in the system 3. Flow rates, including those in and out of compartments, pipes and columns; carrier and solvent flow rates 4. Volumes, in particular those in addition to concentration or mass pertaining to a stirred tank or compartment 5. Parameters describing phase equilibria such as partition coefficients and Henry’s law constants, relative volatilities, equilibrium solubilities, and vapor pressures 6. Inlet concentrations to compartments, pipes, and columns There is yet another type of information contained in the model that is obtained by manipulation of the primary results. We call this derived information. The manipulations involved typically consist of differentiation or integration of the results. If these come in the form of concentration distributions, we obtain the following derived quantities: By differentiation N = - DA
dC Diffusional flow dz
(2.16f)
By integration
C=
Ú CdA
(2.16g)
A
or
Average concentrations C=
Ú CdV V
66
Mass Transfer: Principles and Applications
Use is made of these expressions in Illustration 4.9 and Practice Problem 4.11 and again in Section 5.2. They can be regarded as part of the information package provided by the model solution. We have summarized both the model solutions and the information contained in them for convenient reference in Table 2.2. TABLE 2.2 Models, Model Solutions, and the Information Contained in Them Model
Model Solutions
A. Integral Balances 1. Steady-state balance 2. Unsteady balance 3. Cumulative balance
u = f(v, parameters) u = F(t, parameters) u = g(v, parameters)
B. Differential balance 1. 2. 3. 4.
Steady-state 1-D balance Unsteady-state 1-D balance Steady-state multidimensional balance Unsteady multidimensional balance
u u u u
= = = =
G(z, parameters) g(z, t, parameters) H(z, t, parameters) k(x, y, z, t, parameters)
C. Parameters 1. Transport coefficients 3. Flow rates 5. Phase equilibrium parameters
2. Rate constants 4. Volumes 6. Inlet concentrations
D. Derived Information 1. Diffusional flow 2. Average concentration
2.4
Setting Up Partial Differential Equations
The mass balances that have been considered up to this point are confined to cases involving a single independent variable, time or distance. We now examine situations in which more than one such variable needs to be taken into account. Suppose, for example, that diffusion takes place from an external medium into a porous cylindrical or spherical particle, which is initially devoid of the diffusing species. Concentrations will then vary both with time and radial distance and, in the case of the cylindrical particle, with axial distance as well. This is a system that is distributed in both time and distance and that consequently leads to a PDE (see Table 2.1). Let us assume that the variations are with respect to one distance variable x and with time t. We have previously considered, at the ODE level, distributions in time only, or in distance only. This has led to the
Modeling Mass Transport: The Mass Balances
67
schemes represented by Equation 2.1 and Equation 2.2. To deal with simultaneous variations in both time and distance, we superpose the two expressions; i.e., we write Rate of mass in at x and over Dx
=
–
Rate of mass out at x + Dx and over Dx
Rate of change Èx ˘ = Í ( mass)˙ of mass in Dx Î xt ˚ Dx
(2.17)
On occasion, mass will enter at x + Dx and leave at x, in which case the scheme is adjusted accordingly. This is the formulation that must be used when the system is distributed over distance x and time t. When variations occur in more than one direction, we merely add appropriate terms to the left side of Equation 2.17, for example, “Rate of mass in at y and over Dy” and so on. For variations in the radial direction, y and Dy are replaced by r and Dr. Note that the time derivative in Equation 2.17 is now a partial derivative because we are dealing with more than one independent variable. The following illustration provides an example of the application of Equation 2.17.
Illustration 2.6: Unsteady Diffusion in One Direction: Fick’s Equation Consider diffusion to be taking place into a rectangular slab, which is infinitely wide in the y and z directions and of finite width L in the x direction. The slab can be a stagnant gas or liquid, or a porous solid, and initially contains the diffusing species at a concentration level C = Co. At time t = 0, the two sides of the slab at x = L/2 and x = –L/2 are suddenly exposed to a higher external concentration C = Ce. Diffusion into the slab commences, with the diffusing species entering each face and moving simultaneously toward the centerline. The resulting profiles and their development with time are shown in Figure 2.7a. Initially, at t = to the profile is flat and uniform at the level C = Co. As time progresses and solute penetrates into the interior, the profile assumes a parabolic shape, which becomes increasingly flatter until at time t = t• it has reached the level of the external concentration C = Ce. Diffusion then comes to a halt. To model this process, we choose a difference element to the right of x = 0 (see Figure 2.7b). Solute movement will then be from right to left, entering at the position x + Dx and exiting at x. Applying the scheme of Equation 2.18, we obtain the following result: Rate of mass in Rate of mass out Êx ˆ = Á mass˜ Ë ¯ Dx at x + Dx at x xt
(2.18a)
68
Mass Transfer: Principles and Applications
a.
Ce
Ce
t• t3 C0
t2
t1
C0
t0
–L/2 0
X
+L/2
L
b. (mass) t
Nx
Nx + Dx
x
x + Dx
FIGURE 2.7 Diffusion into a slab: (a) development of concentration profiles; (b) difference element for the mass balance.
or, introducing Fick’s law of diffusion, Equation 1.4a DA
x xC xC = ADxCavg - DA xx x xt x x x +Dx
(2.18b)
The reader is reminded that in the original formulation of Fick’s law, concentration diminished in the direction of increasing x (see Figure 1.1a) resulting in a negative gradient. The reverse is true here: Flow is in the direction of diminishing values of x and C, yielding a positive gradient xC/ xs. The need for a negative sign in Fick’s law is thus removed, and we simply write N = DAxC/xx. This ensures that the diffusional flow will be a positive quantity.
Modeling Mass Transport: The Mass Balances
69
To obtain the final result, Equation 2.18b is divided by ADx and Dx is allowed to go to zero. This yields
D
x 2C x C = xt xx2
(2.18c)
This is Fick’s equation in one dimension. Its solution yields the timedependent concentration profiles shown in Figure 2.7a. Illustrations dealing with Fick’s law will appear in Chapter 3. Comments: Although we have confined ourselves to Fick’s law in one dimension, its extension to three dimensions is straightforward. We merely have to extend Equation 2.18a to three dimensions in the increments Dx, Dy, Dz, which now represent the sides of a cube. The result is ÈÊ x C ˆ Ê xC ˆ ˘ ÈÊ x C ˆ Ê xC ˆ ˘ DDyDz ÍÁ ˜ - Á ˜ ˙ + DDxDz ÍÁ ˜ -Á ˜ ˙+ ÍË x y ¯ y + Dy Ë x y ¯ y ˙ ÎË x x ¯ x + Dx Ë x x ¯ x ˚ Î ˚ ÈÊ x C ˆ Ê xC ˆ ˘ x DDxDy ÍÁ ˜ - Á ˜ ˙ = DxDyDzC Ë ¯ Ë xz ¯ z ˚ xt x z z + Dz Î
(2.18d)
On dividing by Dx, Dy, Dz and allowing the increments to go to zero, we obtain the three-dimensional version of Fick’s law in rectangular coordinates: Ê x 2C x 2C x 2C ˆ x C DÁ 2 + 2 + 2 ˜ = xy xz ¯ xt Ë xx
(2.18e)
For radial, spherical, and cylindrical coordinates, the distance derivatives are somewhat more complicated. Although we do not, in this text, take up the actual solution of PDEs, it is important to examine one of the tools needed for this purpose, the boundary and initial conditions. The reader may recall that at the ODE level, the number of boundary conditions required equals the order of the equation. This concept can be extended to PDEs as follows: Each set of partial derivatives requires a number of conditions equal to its highest order. Thus, the 1-D Fick’s equation (Equation 2.18c) requires two boundary conditions for the distance derivative x 2C/xx2, and one condition, also called an initial condition, for the time derivative xC/xt. These conditions are obtained from an examination of the physical system. Thus, from Figure 2.7a, we have the following conditions:
70
Mass Transfer: Principles and Applications
For the distance derivative 1. C = Ce at x = +L/2 and any time 2. C = Ce at x = –L/2 and any time For the time derivative 3. C = Co at t = 0 and any position These conditions can be placed in the following terse forms: 1.
C(t, L/2) = Ce
(2.18f)
2.
C(t, –L/2) = Ce
(2.18g)
3.
C(0, x) = Co
(2.18h)
These, and other boundary conditions, are encountered again in Chapter 4 where they are used for a number of different processes and geometries. As noted, we do not undertake the actual solutions of the PDEs, but rather present them in graphical or tabular form and use them to address a number of practical problems. At this, the reader will wish to breathe a sigh of relief. Let us next consider a process that is at steady state, but one in which the dependent variable varies in two directions. This, too, leads to a PDE. Illustration 2.7: Laminar Flow and Diffusion in a Pipe: The Graetz Problem for Mass Transfer When a solute is released from a soluble tubular wall into a flowing fluid, two cases need to be distinguished: 1. The fluid is in turbulent flow. This implies that the core is well mixed and has a uniform concentration Cb(x), which varies in the direction of flow. That bulk concentration is initially zero at the inlet if we assume the feed to be pure solvent and gradually increases in level as material dissolves into the flowing fluid. Ultimately, at long distances from the inlet, the fluid becomes fully saturated with solute and the bulk concentration equals the equilibrium solubility, Cb = C*. Mass transfer then comes to a halt. This situation is depicted in Figure 2.8a and leads to an ODE when a mass balance is applied to an increment Dx in the direction of flow. A situation similar to this case has been encountered in Illustration 2.2, where oxygen from the atmosphere entered and dissolved in a river that was in turbulent flow. 2. When the fluid is in laminar flow, the core is no longer well mixed and we see instead a gradual variation of concentration in the radial direction as solute from the wall enters and dissolves in the flowing fluid. The concentration profile assumes the shape of a parabola
71
Modeling Mass Transport: The Mass Balances
a.
C*
C* Cb(x)
C=0
Cb = C*
C*
X
b.
C*
C*
C*
C*
C*
C*
C*
r x
C=0
C(r,x)
C(r,x)
C*
C(r,x)
C*
C*
C(r,x) C*
r + Dr r
c. Nr
CX
x
N r + Dr
C x + Dx
x + Dx
FIGURE 2.8 Solute dissolution into a flowing fluid: (a) turbulent flow; (b) laminar flow; (c) difference element for laminar flow.
whose height gradually diminishes in the direction of flow until the fluid is fully saturated. At this point the concentration has become uniform (C(r, x) = C*), and mass transfer again ceases. This situation is depicted in Figure 2.8b. Because we are here dealing with concentration variations in two directions, r and x, the mass balance must be taken over an element with increments Dx and Dr. This leads to the doughnut shape shown in Figure 2.8c, and ultimately yields a PDE. Let us proceed to write a mass balance over this element. The volumetric flow rate into and out of the element is given by the product of velocity and area; i.e., [v(r)]avg 2prDr, where the bracketed term represents the local average velocity. The mass of solute entering or leaving the element is then obtained by multiplication by the solute concentration C at the two locations. Radial transport is by diffusion and here we note that, once again, as in the previous
72
Mass Transfer: Principles and Applications
illustration, flow is in the direction of diminishing values of the distance variable and of C. The minus sign in Fick’s law is consequently dropped and we use instead the form N = DA(xC/xr). With these expressions in place, the mass balance becomes Rate of solute in Rate of solute out – =0 at x and r + Dr at x + Dx and r È [v(r )]avg 2 prDrC1x ˘ È[v(r )]avg 2 prDrC1x + Dx ˘ ˙ Í Í C x xC ˆ ˙ = 0 – (2.19a) Ê ˆ Ê ˙ Í+ DDx Á 2 pr Í + DDx Á 2 pr ˜ ˜ ˙ Ë Ë x r ¯ r + Dr ˙˚ x r ¯ r ˙˚ ÍÎ ÍÎ Dividing by 2prDxDr and letting both increments go to zero, we obtain the PDE xC 1 x Ê xC ˆ =D Ár ˜ xx r xr Ë xr ¯
(2.19b)
È x 2C 1 x C ˘ xC = DÍ 2 + r x r ˙˚ xx Î xr
(2.19c)
v(r ) or in expanded form v(r )
where [v(r)avg] has now become a point quantity. The boundary conditions are again three in number, the radial derivatives requiring two such conditions (highest order 2) and the axial derivative one. They are the following: Condition at the wall:
C(x, R) = C*
(2.19d)
Condition at the axis:
xC =0 x r r =0
(2.19e)
Condition at the inlet:
C(0, r) = 0
(2.19f)
The condition at the axis is of a type encountered before in Illustration 1.1 (see Figure 1.2a and Figure 1.2b) and reflects the fact that the concentration profile must be symmetrical about the central axis and its derivative must consequently vanish there. This system of equations (Equation 2.19c through Equation 2.19f) yields, on solution, the radial and axial concentration gradients shown in Figure 2.8b.
Modeling Mass Transport: The Mass Balances
73
Comments: The Graetz problem, also known as the Graetz–Nusselt problem, was originally formulated for the corresponding heat transfer case, which is represented by the PDE v(r )
È x 2T 1 x T ˘ xT = aÍ 2 + xx r x r ˙˚ Î xr
(2.19g)
where a = thermal diffusivity. In the original version, first put forward in the 1880s, two boundary conditions were considered: constant wall temperature T(x, R) = Tw and constant flux k
xT ( z, R) = qw xr
Some initial results were given by Graetz, but it was not until 1956 that the complete analytical solution became available. Since its inception, the Graetz problem has been applied to a host of related problems in both heat and mass transfer with a variety of boundary conditions encompassing both Newtonian and non-Newtonian flow. In Chapter 5 we show how the solution profiles of the Graetz problem can be cast into equivalent mass transfer coefficients, which can then be used to model the process at the ODE level. Illustration 2.8: A Metallurgical Problem: Microsegregation in the Casting of Alloys and How to Avoid PDEs One method of casting alloys is to pour the molten charge into a mold and allow it to cool in contact with the ambient air. The process of solidification that results is a complex one involving the transport of heat to the external medium and a simultaneous transfer of mass from the liquid to the solid phase. The progress of the proceedings is best visualized by means of a plot of temperature vs. liquid and solid compositions termed a phase or meltingpoint diagram. A simple version of this diagram for a binary (i.e., two-component) system appears in Figure 2.9a, and we shall see in Chapter 6 that similar diagrams can be constructed for vapor–liquid systems (see Figure 6.17a). The upper curve, referred to as the liquidus, represents a plot of liquid composition vs. temperature, and the lower curve, termed the solidus, shows the corresponding solid compositions. Horizontal lines drawn through the diagram intersect the two curves at points representing liquid and solid compositions in equilibrium with each other. The extremities of the diagram denote the melting point of the metal components of the alloy, Tmp1 > Tmp2.
74
Mass Transfer: Principles and Applications
a.
Liquid Weight Fraction
Feed Tmp1
Solid Weight Fraction B
A D
C
Temperature Tmp2 0 XSF* X*
XF
1
Dendrite, Weight Fraction xS*
b.
Liquid Pool Weight Fraction xL
x=0 x=L
c.
End of Solidification
Concentration
Start of Solidification
x=0 x=L FIGURE 2.9 Microsegregation in the casting of alloy: (a) phase diagram; (b) dendrite formation; (c) concentration profile.
On cooling, the liquid charge proceeds along the vertical line of constant composition xF until it reaches the liquidus at point A. Here the first solid crystals of composition xsF* are formed, which are in equilibrium with the feed composition xF. On further cooling and solidification, a gradual shift of these compositions along the liquidus and solidus curves takes place, resulting in ever-increasing concentrations of component 2 in the liquid and solid phases. These two phases are at all times in equilibrium with each other, with the two compositions located at the end points xS* and xL of a horizontal line drawn through the diagram. These two concentrations gradually approach each other and with further cooling ultimately converge to a single
Modeling Mass Transport: The Mass Balances
75
point representing the pure metal component 2 with the lower melting point Tmp2. Solidification is then complete. The physical structure of the charge during this solidification process is depicted in Figure 2.9b. Typically, the solid phase is initially confined to narrow, fingerlike protrusions termed dendrites. These regions are surrounded by small pools of liquid, which gradually diminish in size as solidification progresses. Simultaneously, the concentration of component 2 in the thickening dendrite increases until it peaks as pure metal 2. The resulting concentration profile is a single dendrite shown in Figure 2.9c. These dendrites form a repetitive pattern of microsegregation throughout the cast and are an undesirable feature because they lead to non-uniform properties of the material. To remove these nonhomogeneities, the cast is subjected to a subsequent thermal treatment termed homogenization in which the concentrations are smoothed by a slow process of solid-phase interdiffusion. This process is an unsteady one and is described by Fick’s equation (Equation 2.19c). We do not wish to address its solution, which is a fairly complex one, here, but note that it requires as an initial condition the concentration profile shown in Figure 2.9c. It is this distribution that initiates the homogenization process and ultimately leads to a cast of uniform properties. Although the process of solidification is a highly complex one requiring in principle a set of PDEs, the derivation of the concentration distribution in the dendrite is apparently amenable to a simple treatment. The literature on the subject proposes the following differential equation for the description of the process: (xL – xS*)dfS = (1 – fS)dxL
(2.20)
where fS is the local weight fraction of the solid, x is the weight fraction of the component that crystallizes out, and xS* is the equilibrium weight fraction at the solid–liquid interface. Although superficially this expression resembles a mass balance, it is not clear how it is arrived at. It does not contain time or distance as an independent variable, which invariably appears when we model a compartment or what we termed a 1-D pipe. We must also rule out a cumulative balance, which is always algebraic in form. The question then arises whether a new type of mass balance formulation is required to cover this case. Fortunately, as is shown below, this does not turn out to be the case. The three mainstay formulations æ compartmental, 1-D distributed, and cumulative æ are able to cover this case as well. Let us proceed to model the system using one of our formulations, the compartmental model. To do this we assume the liquid to be well mixed with a uniform concentration of xL. This is not an unreasonable assumption as the size of the pool is quite small, typically 50 to 200 mm in width. The solid phase, on the other hand, cannot be considered uniform because solidphase diffusivities are several orders of magnitude smaller than those prevailing in the liquid (see Section 3.1 in the next chapter). Concentrations
76
Mass Transfer: Principles and Applications
in the dendrite will consequently vary in the lateral direction, with the local interfacial concentration xS* in instantaneous equilibrium with the uniform liquid pool at all times (Figure 2.9c). Drawing an envelope around the liquid pool we obtain the following mass balance: Total mass balance Rate of total mass in – Rate of total mass out = 0
–
=
R
d ( total contents) dt d L dt
(2.21a)
Component mass balance Rate of solute in – Rate of solute out = 0
–
xS* R
=
d (solute content ) dt d x L dt L
(2.21b)
where R = rate of solidification (kg/s) and L is the total mass of liquid in the pool (kg). As expected, the time variable t makes its appearance, as does the unknown variable R, the rate of solidification. Neither of these appears in Equation 2.20, thus bringing the proceedings to a seeming impasse. Some thought will reveal that both of these undesirable variables may be eliminated by the simple device of dividing the two equations. We obtain xS * =
d( x L L) dL
(2.21c)
or, in expanded form, xS * = x L + L
dx L dL
(2.21d)
This is beginning to look much more like the desired expression (Equation 2.20), and one final step will bring us to that goal. We invoke a cumulative mass balance, which serves to convert liquid mass L to the solid weight fraction fS. We have up to any time t L + S = MTot
(2.21e)
where S = mass of solid and MTot = total mass (liquid pool + half the dendrite width). Consequently,
77
Modeling Mass Transport: The Mass Balances S L = fS = 1 MTot MTot
(2.21f)
and Equation 2.21d becomes, after some rearrangement, (xL – xS*)dfS = (1 – fS)dxL
(2.20)
which is the desired result. Because the fraction solidified fS, can be written in the form fS =
Ax rS x = Al rS l
(2.21g)
the solution of Equation 2.20 can be used to derive the concentration profile in the dendrite, and thus establishes the initial condition required for the homogenization process. Comments: • Two features stand out in the treatment of this problem. First and foremost, we have reinforced our confidence in the three basic mass balance formulations at the algebraic and ODE level: the compartmental, 1-D distributed, and cumulative balances. They are vindicated as a comprehensive tool kit at this level of modeling. • Second, we see here again the near-miraculous reduction of a highly complex process to manageable proportions. This was accomplished by assuming the liquid pool to be well mixed and in equilibrium with the solid interface, both reasonable assumptions. We followed this up with the neat “trick” of dividing the two mass balances, thereby eliminating both the independent variable t and the unknown R. This gave us the desired relation between the solidphase concentration and the fraction solidified. • The analysis used here is not confined to liquid–solid systems. It can be applied to any process in which a transfer of mass takes place between two phases that are in constant equilibrium with each other. It was first applied by Rayleigh to analyze equilibrium batch distillation and to derive the attendant concentration changes as a function of the fraction distilled. This case as well as other batch processes of the same type are taken up in Chapter 7 dealing with equilibrium stage processes. • Equation 2.20 as it stands cannot be integrated directly because it contains more than two variables, i.e., f, xL, and xS*. A second equation will be required, which is given by the following equilibrium relation:
78
Mass Transfer: Principles and Applications xS* = f(xL)
(2.22a)
Many binary alloys have phase diagrams in which the ratio xS*/xL can be approximated as a constant K, termed the partition coefficient. Combining Equation 2.20 and Equation 2.22a, we obtain [–(K – 1)xL]df = (1 – fS)dxL
(2.22b)
which, after separating variables and formal integration, yields the result -( K - 1)
Ú
xL
xL 0
dx L = xL
Ú
r
0
dfS 1 - fS
(2.22c)
Evaluating the integrals, we obtain ( K - 1) ln
xL = ln(1 - fS ) xL 0
(2.22d)
or alternatively xL = (1 - fS ) K -1 xL 0
(2.22e)
The corresponding solid-phase concentration is given by xS * = K(1 - fS ) K -1 xL 0
(2.22f)
where K < 1. This form of expression, known as the Rayleigh equation, is encountered again in Chapter 7 (Illustration 7.3 and Illustration 7.4). The equation applies only over a limited concentration range, as it predicts that xS* goes to infinity as fS attains unity. A more realistic representation of the equilibrium is given by the expression xS * =
xL (a - 1)x L + a
where a is the so-called separation factor, defined as
(2.22g)
Modeling Mass Transport: The Mass Balances
a=
x L (1 - xS *) xS * (1 - x L )
79
(2.22h)
with a > 1. At low concentrations a Æ 1/K. Application of this expression is left to the exercises (Practice Problem 2.10).
2.5
The General Conservation Equations
The method we have described for setting up PDEs has a cumbersome feature attached to it. It must be repeated each time there is a change in geometrical configuration or in the process conditions. A switch from rectangular to cylindrical coordinates, for example, requires a new balance to be made. So does the inclusion of reaction terms. This drawback can be overcome by formulating the mass balances in a generalized vectorial form, using the symbolism of vector calculus. These symbols, or operators as they are termed, arise in a natural way in the formulation of generalized transport equations. They are at first sight forbidding, and the beginner will probably be best served by regarding them as a convenient shorthand, without delving into their deeper origins. The symbol —2u for example, which is termed the Laplacian of u (and pronounced “del square u”) is shorthand for a collection of second-order partial derivatives. The symbols —u and —•v, (“del u” and “del dot v”) serve the same purpose for combinations of first-order partial derivatives. For example, in rectangular coordinates, del dot of the velocity vector v is synonymous with the sum of the first-order derivatives of the velocity components. Thus, — yv =
x vx x vy x vz + + xy xz xx
(2.23a)
Similarly, we have for the Laplacian —2u =
x 2u x 2u x 2u + + xx2 xy2 xz2
(2.23b)
Thus, both del dot and del square tend to be scalar expressions. Del u, on the other hand, is a vector. Some thought will lead us to the conclusion that del dot terms will likely arise in flowing systems, whereas the Laplacian will most probably appear in the description of diffusion processes. This is indeed the case.
80
Mass Transfer: Principles and Applications
The use of these operators in the formulation of mass balances leads to the following generalized conservation equations. We have, for the component mass balance v•—CA + D—2CA ± Flow
Diffusion
rA Reaction
x CA xt
=
(2.24a)
Transient
and for the total mass balance, also known as the continuity equation, —•v = 0
(2.24b)
Two restrictions apply to these expressions. First, they are confined to incompressible flow, i.e., systems in which density changes can be neglected, such as liquid flow or gas flow involving low pressure drops. Second, the formulation requires continuity of the concentration within the flow field. Systems in turbulent flow in which CA undergoes an abrupt transition from linear gradient in the film to a constant value in the fluid core cannot be accommodated by these expressions. We must, in these cases, revert to the use of the classical shell balance. To aid the reader in the use of these equations, we have compiled a “dictionary” of the operator symbols, which provides a translation into scalar form for the three principal geometries (rectangular, cylindrical, and spherical). We can use this dictionary, Table 2.3, to extract several important subsidiary relations. For example, in the absence of flow and reaction, the general conservation equation becomes D— 2 CA =
x CA xt
(2.24c)
which is Fick’s equation in three dimensions, with the Cartesian representation (see Table 2.2) È x 2 CA x 2 CA x 2 CA ˘ x CA DÍ + + ˙= 2 xt xy2 xz2 ˚ Î xx
(2.24d)
This expression is identical to Equation 2.18d, which had been derived by means of a shell balance. Its counterpart for heat conduction, known as Fourier’s equation, is given by È x 2T x 2T x 2T ˘ x T aÍ 2 + 2 + 2 ˙ = xy xz ˚ xt Î xx
(2.24e)
Modeling Mass Transport: The Mass Balances
81
The Graetz problem can be accommodated in similar fashion. Here the transient and reaction terms are dropped and we obtain v•—CA = D—2CA
(2.24f)
The dot product on the left is composed by the rules of vector algebra. In other words, it equals the sum of the vector component products. Setting vr = xCA/xq = x 2CA/xz2 = 0 and using the tabulations of Table 2.3, we obtain vz
x CA 1 x Ê xC ˆ =D Ár ˜ r xr Ë xr ¯ xz
(2.24g)
which is in agreement with Equation 2.19b. Finally, when all but the reaction and transient forms are omitted, we are led to the result ±VrA = V
dCA dt
(2.24h)
This will be recognized as a mass balance for a batch reactor of volume V. Illustration 2.9: Laplace’s Equation, Steady-State Diffusion in ThreeDimensional Space: Emissions from Embedded Sources Steady-state diffusion has been considered in some detail in Chapter 1 at the elementary level of 1-D transport. In Cartesian space the operative expression was Fick’s law (Equation 1.4), which can also be written in the equivalent form: d 2C =0 dx 2
(2.25a)
The extension to three Cartesian dimensions is given by x 2C x 2C x 2C + + =0 xx2 xy2 xz2
(2.25b)
or in a generalized vectorial form by —2C = 0
(2.25c)
This is the classical and much-studied expression known as Laplace’s equation. It can be obtained from Fick’s equation by omission of the transient
82
Mass Transfer: Principles and Applications
TABLE 2.3 Dictionary of Vector Operators ∇u 1. Cartesian
2. Cylindrical
3. Spherical
(∇u) x =
∂u ∂x
(∇u) y =
∂u ∂y
(∇u) z =
∂u ∂z
(∇u)r =
∂u ∂r
(∇u)θ =
1 ∂u r ∂θ
(∇u) z =
∂u ∂z
(∇u)r =
∂u ∂r
(∇u)θ =
1 ∂u r ∂θ
(∇u)ϕ =
1 ∂u r sin θ ∂ϕ
∇•v 1. Cartesian
∇•v =
∂v x ∂vy ∂vz + + ∂x ∂y ∂z
2. Cylindrical
∇•v =
1 ∂ 1 ∂vθ ∂vz + (rv ) + ∂z r ∂r r r ∂θ
3. Spherical
∇•v =
1 ∂ 2 1 ∂ 1 ∂vϕ ( r vr ) + ( vθ sin θ) + 2 r ∂r r sin θ ∂θ r sin θ ∂ϕ
1. Cartesian
∇2u =
∂2u ∂2u ∂2u + + ∂x 2 ∂y 2 ∂z 2
2. Cylindrical
∇2u =
1 ∂ ∂u 1 ∂ 2 u ∂ 2 u + r + r ∂r ∂r r 2 ∂θ 2 ∂ 2 z
3. Spherical
∇ 2u =
1 ∂ 2 ∂u 1 1 ∂ ∂u ∂ 2u θ sin r + + ∂θ r 2 sin θ ∂ϕ 2 r 2 ∂r ∂r r 2 sin θ ∂θ
∇ 2u
term, or from the general conservation equation (Equation 2.24a) by omitting transient, reaction, and flow terms. A host of solutions of this problem are known from the analogous case of heat conduction and are easily adapted by substituting concentration and diffusivity for temperature and thermal conductivity. Many of these solutions, particularly those dealing with finite geometries, are forbidding in form and difficult to apply in practice. The intent here is to draw the reader’s attention to some simple solutions, which are particularly useful in an environmental and biological context.
83
Modeling Mass Transport: The Mass Balances
The geometry considered is a semi-infinite medium bounded by a plane surface. An object of finite dimensions (sphere, disk, cylinder) is embedded at a distance x from the surface and is assumed to have a constant surface concentration C2. Solute diffuses into the surrounding space and ultimately reaches the bounding surface, which is held at a constant concentration C1 (Figure 2.10). C1 is often near zero because of dispersion into a flowing fluid or the atmosphere. The release rate when C1 = 0 exceeds that of any other practical configuration and sets an upper limit to diffusion from a source of constant concentration. It can therefore be used to estimate the maximum performance to be expected in finite spaces. Examples of such embedded objects are underground deposits of a toxic or benign nature and artificial implants (see Practice Problem 2.13). The situation described in Illustration 1.3 æ helium storage in an abandoned salt mine æ is another example. The primary information obtained from Laplace’s equation concerns the three-dimensional concentration distributions, which are of no direct practical use. It is common practice to convert these results into an equivalent rate equation based on a linear driving force. For conduction, it takes the form q(J/s) = kS(T2 – T1)
(2.26)
N(mol/s) = DS(C2 – C1)
(2.27)
and for diffusion
Infinite Plane, C = C1 < C2
x Sphere, C = C2 d
FIGURE 2.10 Diffusion from a sphere embedded in a semi-infinite medium.
84
Mass Transfer: Principles and Applications
These are, of course, precisely the type of simple expressions we wish to have on hand to calculate the flux that results in these complex geometries. Equation 2.27 requires knowledge only of the bounding concentrations and the diffusivity. The geometry of the system is accounted for through the socalled shape factor S, which has the dimensions of length and is extensively tabulated in standard handbooks of heat transfer. A short version is given in Table 2.4. Let us use these tabulations to reexamine the helium storage problem of Illustration 1.3. For distances from the surface x much larger than the cavity dimension, we have, with C1 ª 0 N = DS(C2 – C1) ª D 2pd C2
(2.28a)
N = D 4pr p/RT
(2.28b)
or equivalently
This expression is identical to Equation 1.9c, obtained by a spherical shell balance, and represents diffusion into an infinite medium. When distance x is reduced, the result begins to be affected by the proximity of the surface plane, but not by much. Suppose, for example, that the center of the storage cavity is at a distance of only 100 m from the surface. We then have N = D[2pd/(1 – 100/400)]C2
(2.28c)
i.e., the losses increase by 33%. The use of a spherical shell balance within an infinite medium is thus justified at large depths but is only an approximation in the vicinity of the planar surface. This is in agreement with physical reasoning. Illustration 2.10: Lifetime of Volatile Underground Deposits A shallow buried dump 100 m in diameter (d) contains dispersed in it an estimated 100 mol of a toxic substance with a low vapor pressure of 10–2
TABLE 2.4 Shape Factors for Various Geometries Embedded in a Semi-Infinite Medium Embedded Object 1. Sphere, diameter d 2. Thin circular disk, diameter d 3. Thin rectangular plate a < b 4. Horizontal cylinder, length L, diameter d
Shape Factor S 2pd /(1 – d/4x) 2pd 2d 4d pa ln(4a/b) 2pa ln(4a/b) 2p L/ln(2L/d)
Conditions x > d/2 x>d x=0 x>d x=0 x>a x>d
85
Modeling Mass Transport: The Mass Balances
mmHg. It is desired to estimate the minimum time it takes for the charge to evaporate and disperse into the surrounding space. We assume the geometry to be that of a shallow disk with a maximum shape factor S = 4d. Diffusivity is set at D = 10–8 m2/s. We then obtain from Equation 2.27b N = DSC2 = DSp/RT
(2.29a)
= 10–8 4 ¥ 100 (10–2/760)105/8.314 ¥ 298 N = 2.12 ¥ 10–9 mol/s For a charge of 100 mol, the lifetime of the deposit works out to t=
100 years 2.12 ¥ 10 ¥ 3600 ¥ 24 ¥ 365 -9
t = 6.69 ¥ 104 years On the other hand, for the same amount of the carcinogen benzene, which has a vapor pressure of 95 mmHg, the lifetime drops to a value of t = 6.69 ¥ 104 (10–2/95) = 7.4 years Comments: In either case, the evaporative disposal time is unacceptably high. The charge to be disposed of is relatively small, 7.8 kg in the case of benzene or 100 kg if we assume a molar mass of 1000 for the less-volatile substance. Some relief may be found by adjusting diffusivity upward. Chapter 3 provides an expression for the rough estimate of diffusivity in porous media, given by D = Doe/4. Do represents the free-space diffusivity, of the order 10–5 m2/s for gases, and e is the porosity of the medium. If we assume a highly porous soil with e = 0.4, D is reduced by two orders of magnitude and the lifetime of the benzene deposit drops to 0.074 years = 27 days. For the less volatile substances, it remains unacceptably high, at 669 years.
Practice Problems 2.1. Compartmental Modeling in Pharmacokinetics The subject of pharmacokinetics comprises the study of the fate of an injected drug in the human or animal body. A typical exercise involves the monitoring of the drug concentration in the blood after
86
Mass Transfer: Principles and Applications injection and extracting from the resulting time history relevant kinetic or transport parameters. A favorite device for the interpretation of the experimental findings is the one-compartment model shown in Figure 2.11a. After the one-shot injection of the drug, the drug concentration declines exponentially in the manner shown in the accompanying diagram. That curve, determined experimentally, is usually described by a first-order rate law, which is incorporated in a mass balance around the compartment. We have Rate of drug in – Rate of drug out =
0 – keCV =
d VC dt
d contents dt (2.29a)
with the solution ln C/Co = –ket
(2.29b)
where ke is the so-called elimination-rate constant, which can be obtained from a semilog plot of the experimental concentration-time data and which is often reported in terms of the half-life of the drug t1/2 = ln 2/ke, i.e., the time required to reduce its concentration to
FIGURE 2.11 One-compartment models and the time course of drug concentration: (a) clearance following injection; (b) steady infusion.
Modeling Mass Transport: The Mass Balances one-half the initial level. Note that the injected dose does not enter the mass balance directly but appears instead as the initial concentration Co, which is obtained by extrapolation of the data to time t = 0 (Figure 2.11). ke can then be used to determine the time course of drug concentration during its steady infusion, or administration, to a patient. Infusion follows the time course shown in Figure 2.11b. It reaches a plateau value termed the effective therapeutic concentration (ETC) when infusion and elimination rates are exactly in balance. Consider the case of a patient who has undergone major surgery and requires a slow, intravenous infusion of aminocaproic acid to control hemorrhage. It is planned to infuse at the rate of 1 g/h, and the drug is known to have a half-life of 3.9 h. If the drug is only effective above 0.048 g/l, how long does it take to reach this level after the start of infusion? Assume a fluid volume of 50 l. Answer: 3.25 h 2.2. Solute Release from a Tubular Wall into a Stream in Turbulent Flow A solute is released from a tubular wall into a fluid in turbulent flow. Two cases are to be considered: a. The substance is released at a constant rate N (mol/m2/s) all along the length of a tube. This case arises in some medical applications. b. The solute concentration at the wall is constant and equal to its equilibrium solubility C*. This leads to the type of profile development we had seen in Figure 2.8a. Derive for both these cases the variation in the axial direction of the bulk concentration Cb of the solute. Answer: a. b.
Cb =
4N x vd
(C* – Cb)/C* = exp(–4kcx/vd)
2.3. Clearance of a Contaminated River Bottom Sediment A toxic substance is released into a river at a constant concentration and over a time interval Dt. The contaminant is adsorbed onto the bottom sediment and, after contamination has ceased, is gradually cleared into the river. It is desired to calculate the time necessary for the sediment to be cleared of 95% of its contaminant. Assume the concentration in the sediment and the water to be uniform in the vertical direction but not in the direction of flow.
87
88
Mass Transfer: Principles and Applications
a. Is the process an unsteady one or can it be considered to be at a steady state? b. What are the dependent and independent variables for the system? c. Describe the space over which the mass balance has to be applied. d. Describe the resulting model equations without actually deriving them. 2.4. Performance of a Dryer A batch of wet solids holding a total of 10 kg of water is to be dried by passing hot air over it. The air enters with a humidity of 0.03 kg H2O/kg air and leaves with a humidity of 0.10 kg H2O/kg air. The (dry) airflow rate is constant at 0.05 kg/s. Calculate the time necessary to evaporate 95% of the moisture. (Hint: Make a cumulative balance.) 2.5. The Countercurrent Heat Exchanger The countercurrent heat exchanger is the heat transfer analogue to the countercurrent gas scrubber described in Illustration 2.3. Cold fluid enters the central tube at a flow rate of Fc kg/s countercurrent to a hot fluid, which enters the concentric shell on the right and with a flow rate Fh kg/s. Heat is transferred to the cold fluid at a rate q = UADT causing a change in the enthalpy Hc, and consequently the temperature TC of the cold fluid. Enthalpy is related to temperature through the expression H = FCp(T – Tref). a. Make an integral heat balance over the entire exchanger. The resulting expression corresponds to Equation 2.11b obtained for the countercurrent gas scrubber. b. Derive the thermal counterparts to the differential mass balances (Equations 2.12d and 2.12e) but do not solve. 2.6. The Use of the Dye Dilution Method in Determining Flow Rates Blood flow rates Q through an organ may be determined by adding a dye or other tracer to the ingoing arterial bloodstream and monitoring the concentration of the (venous) outlet. Type and size of the chosen tracer are such that we can assume it stays strictly in the blood phase and does not permeate into the surrounding tissue. Derive an expression for Q in terms of measurable quantities. Answer: Q =
m
Ú
•
0
Cv dt
2.7. Unsteady Diffusion with a Chemical Reaction Consider the case of a substance diffusing into a porous solid slab (see Illustration 2.7) in which it is irreversibly bound to the solid
89
Modeling Mass Transport: The Mass Balances substrate in accordance with a first-order rate law. Modify the result obtained in Illustration 2.7 to describe this process. 2.8. Unsteady Diffusion from a Sphere into a Solution of Finite Constant Volume Soluble material is leached from a slurry of porous spherical particles by suspending them in a well-stirred liquid solvent of constant volume. This type of operation finds frequent use in the leaching of ores, and in the extraction of edible oils from seeds. Show that the model for this system is made up of a single PDE for the spheres and an ODE for the stirred tank. What are the relevant boundary and initial conditions? Solutions to this problem and an illustrative example are given in Chapter 4. 2.9. A Total Mass Balance: The Continuity Equation in Three Dimensions Show that the total mass balance for a flowing system with and without chemical reactions in a rectangular coordinate system is given by Èx ˘ xr x x - Í rv x + rv y + rv z ˙ = xz xy Î xx ˚ xt
(2.30)
where r = density and vx, vy , vz are the velocity components in the three directions. (Hint: Consider a cube with sides Dx, Dy, Dz.) 2.10. Use of the Separation Factor in Solidification Processes Solve the differential Equation 2.20, using the equilibrium relation represented by Equation 2.22h. Hint: dx
1
Ú x(a + bx) = - a ln
a + bx x
2.11. Eutectic Compositions and Solidification The phase diagram shown in Figure 2.9a is an ideal case that occurs with some frequency but not exclusively. A fairly common extension of this case arises when the lenslike region shown in Figure 2.10a extends only partway from zero weight fraction to some intermediate composition xSE termed a eutectic. It is joined there at its tip by a second lens, which covers the remaining weight fraction range from xSE to xS = 1. Similar diagrams arise in vapor–liquid equilibria, where the eutectic composition is termed an azeotrope (see Figure 6.20a). Indicate how the separation factor of the preceding problem should be modified to cover this case.
90
Mass Transfer: Principles and Applications
2.12. Diffusion and Reaction in a Spherical Catalyst Pellet Use the general conservation Equation 2.24a and Table 2.2 to derive the differential equation for uniform diffusion and reaction in a spherical catalyst pellet. 2.13. Controlled-Release Implants Controlled-release devices consist in essence of encapsulated saturated suspensions of a medication. The release proceeds through a confining porous membrane into the surrounding tissue, ultimately reaching the target area or organ where the medication is assimilated. Estimate the maximum possible release rate, given the following data: Implant: 0.5 ¥ 0.5 cm cylinder Saturation solubility: Cs = 1 mmol/l Diffusivity: D = 10–5 cm2/s
3 Diffusion through Gases, Liquids, and Solids
Chapter 1 introduced the reader to the notion of diffusional processes in which mass transfer takes place by molecular motion only and is proportional to the concentration gradient of the diffusing species. This proportionality is enshrined in Fick’s law of diffusion and this introductory chapter was used to acquaint the reader with some simple applications of that law (see Illustration 1.2 and Illustration 1.3). The intent of the present chapter, and the one that follows, is to amplify and expand the material on diffusion presented in Chapter 1. We examine in some detail the important diffusion coefficient, which, when viewed mathematically, is the proportionality constant in Fick’s law. It is also a material property that depends on the nature of the diffusion species, the matrix through which diffusion takes place, as well as on temperature, and, in the case of gases, on pressure. We consider in some detail the diffusivities of gases within gases, within liquids, and within solids, and the diffusivities associated with the interdiffusion of liquids and solids. These coefficients are of considerable practical importance in various engineering disciplines, in materials processing, and in the biological and environmental sciences.
3.1 3.1.1
Diffusion Coefficients Diffusion in Gases
The mechanisms by which diffusion in gases takes place are depicted schematically in Figure 3.1a. Gas molecules move in space in random motion with an average velocity u, repeatedly undergoing collision with other moving gas molecules, which causes them to be deflected into a new direction. The average distance traveled by a molecule is referred to as the mean free path l, where l is of the order 10–7 m at atmospheric pressure and is a direct measure of the diffusivity of a substance. A selected list of diffusivities of gases and vapors in air appears in Table 3.1.
91
92
Mass Transfer: Principles and Applications
a.
Free Path Diffusing Molecule
b. Vacancies or Defects
Diffusing Molecule FIGURE 3.1 Diffusional mechanisms in (a) gases and (b) liquids and solids.
TABLE 3.1 Diffusivities in Air (P = 1 atm, T = 25rr C) Diffusing Species Hydrogen Helium Ammonia Water Oxygen Ethanol Acetic acid Benzene Toluene n-Hexane Carbon tetrachloride Chlorotoluene DDT 2,4,2¢,4t-Tetrachlorobiphenyl (a PCB) Mercury
Diffusivity, cm2/s 0.78 0.70 0.22 0.26 0.20 0.14 0.12 0.090 0.086 0.080 0.083 0.065 0.047 0.052 0.13
A first simple expression for the diffusivity of gases was derived some 150 years ago based on the kinetic theory of gases. In this theory, the molecules are regarded as point entities, which undergo elastic collisions with each
93
Diffusion through Gases, Liquids, and Solids
other without the intrusion of intermolecular attractive or repulsive forces. This simple model led to the expression D=
1 ul µ 3
T n / M V
(3.1)
where the average velocity u varies directly with the square root of absolute temperature and the mean free path is inversely proportional to the molar density n/V. This expression correctly predicts the order of magnitude of D (see Practice Problem 3.1) and the dependence on gas pressure and molar mass M, but gives a much less accurate representation of the variation with temperature. This first attempt at a prediction of D was followed by a series of more elaborate theories, which took account of the finite size of the gas molecules, as well as the effect of intermolecular forces. Probably the most popular among current prediction methods is that due to Fuller, Schettler, and Giddings, who proposed the following expression for the calculation of gas diffusivities: DAB =
1.00 ¥ 10 -3 T 1.75 (1 / M A + 1 / MB )
[
PT ( SVA )1/3 + ( SVB )1/3
]
2
(3.2)
Here DAB is in units of cm2/s, T is the absolute temperature (K), PT the total pressure in atmospheres, and V are the atomic and molecular volume contributions. These are empirical constants that correspond very approximately to the molar volume of the substances in cm3/mol. They have been tabulated and a partial list for use with organic molecules appears in Table 3.2.
Illustration 3.1: Diffusivity of Cadmium Vapor in Air Cadmium vapor is a toxic substance whose diffusivity in air is not readily available in the literature. It is desired to calculate its diffusivity at its boiling point of 1038 K and a pressure of 1 atm. Because an empirical atomic volume is not available, we use the reported value for its liquid volume of 14 cm3/ mol for an atomic weight of 112.4. We obtain, using Equation 3.2:
DAB =
1ˆ Ê 1 10 -3 (1038)1.75 Á + ˜ Ë 112.4 29 ¯
[
1.0 14 1/3 + 20.11/3 DAB = 1.6 cm2/s
]
2
1/2
94
Mass Transfer: Principles and Applications TABLE 3.2 Atomic and Molecular Volume Contributions for Diffusivity Calculations Volume V (cm3/mol)
Species
A. Gases (Fuller, Schettler, and Giddings Method) C H O N Cl Aromatic ring Air
16.5 1.98 5.48 5.69 19.5 –20.2 20.1
B. Liquids (Wilke–Chang Method) C H O O in high esters and others O in acids (–OH) Cl (terminal) 6-numbered ring
14.8 3.7 7.4 11.0 12.0 21.6 –15
A data point for the diffusivity of Cd in N2 at 273 K is available for comparison. Its value is 0.15 cm2/s and we obtain, by applying a temperature correction in line with Equation 3.2, 1038 ˆ DAB = 0.15 ¥ Ê Ë 273 ¯
1.75
= 1.55 cm 2 / s
This is in good agreement with the calculated value of 1.6 cm2/s. Comments: Some remarks are in order regarding the magnitude of gas phase diffusivities. We note from Table 3.1 that at 25r C and a pressure of 1 atm, most diffusivities cluster around a value of 0.1 cm2/s. This includes metal vapors, as well as medium-sized organic molecules such as DDT and the PCBs. The reason for this lies in the relatively weak dependence of DAB on molar volume and mass and the limited number of gaseous or volatile substances available. The larger organic molecules such as polymers, proteins, and carbohydrates that would lead to low diffusivity values do not exist in the vapor phase. Thus, gas diffusivities lower than 0.01 cm2/s are unlikely to be encountered. An upper ceiling is provided by the lightest molecules, hydrogen and helium, which have a mutual diffusion coefficient of 1.35 cm2/s at 25r C and 1 atm. A reasonable order-of-magnitude estimate can therefore be arrived at in most cases by starting with a value of DAB = 0.1 cm2/s and applying temperature or pressure correction factors in accordance with Equation 3.2.
95
Diffusion through Gases, Liquids, and Solids
Applying this procedure to the cadmium vapor of Illustration 3.1, we obtain a value of 1038 ˆ DCd- Air = 0.1Ê Ë 273 ¯
1.75
= 1.04 cm 2 / s
which is of the correct order of magnitude.
3.1.2
Diffusion in Liquids
Liquid densities exceed those of gases at normal atmospheric pressures by a factor of about 1000. These differences are reflected in the intermolecular distances that exist in the two phases. In gases under standard conditions these distances are some three orders of magnitude greater than the molecular dimensions. Liquid molecules are by contrast closely packed, with intermolecular distances of the same order as the molecular size. Gas molecules spend most of their time in transit between collisions and are only modestly affected by intermolecular forces. In liquids these forces are the dominant factor that determines the mobility of the molecules. They are notoriously difficult to quantify, and as a consequence, the prediction of liquid diffusivities has lagged behind theories describing the motion of gas molecules. The Stokes–Einstein equation, one of the earliest theoretical expressions for liquid diffusivities, viewed the diffusion process as a hydrodynamic phenomenon in which the thermal motion of the molecules is resisted by a Stokesian drag force. This theory, along with subsequent modification by Sutherland and Eyring, established the following proportionality for the diffusion coefficient: DAB (cm 2 / s) = a
T m BVA1/ 3
This relation, which is most successful for large molecules (VA > 500 cm3/ mol), states that diffusivity varies inversely with the viscosity of the solvent and the molecular dimension of the diffusion molecule. This agrees with our intuitive grasp of the process. Modern theories consider the diffusing particle to be contained in a cage whose dimensions are constantly fluctuating. Local fluctuations in density periodically open holes or vacancies large enough to allow the particle to diffuse out of the cage (Figure 3.1b). Although this view has led to some progress in the quantification of the diffusion process, we are at present still constrained to using semiempirical expressions for the prediction of diffusivities. One such relation, proposed by Wilke and Chang, has been
96
Mass Transfer: Principles and Applications
reasonably successful in predicting diffusion coefficients of small molecules in aqueous and organic systems at normal temperatures. It has the form DAB (cm 2 / s) = 7.4 ¥ 10 -8 (jMB )
1/ 2
T(K ) m B (cp)VA 0.6
(3.3)
where MB and VA (cm3/mol) are the molar mass of solvent and volume of the diffusing species and j is an empirical coefficient with a value of 2.6 for water and 1.0 for unassociated solvents. For organic solutes VA is composed of atomic and ring contributions, a partial list of which is given in Table 3.2B. An example of the application of Equation 3.3 is given in Practice Problem 3.3. Diffusivities in molten salts and metals are even more difficult to predict and here we often resort to an Arrhenius-type relation to express the strong temperature dependence of the diffusion coefficient, which is concealed in the viscosity of Equation 3.2 and Equation 3.3: DAB = D0 exp(–Ea/RT)
(3.4)
This equation also finds use as a correlation for diffusion coefficients in solids. Tabulations of D0 and the activation energy Ea for various species can be found in the pertinent literature. An example of their application appears in Practice Problem 3.10. Given the uncertainties of current prediction methods for liquid diffusivities, it is clearly preferable to use measured values of DAB. Table 3.3 lists diffusion coefficients in water at 25r C of a variety of solutes, including gases (Part A) and ions (Part C), and solutes of a biological or toxic nature (Parts D and E). In Table 3.4 we have reproduced a small selection of diffusivities in liquid metals and molten salts at different temperatures. The remarkable feature that emerges from these tabulations is the relatively small numerical range of the diffusivities for a wide variety of different substances. Most coefficients cluster around a value of 10–5 cm2/s, with the lighter and smaller solutes (H2 and He) exceeding this benchmark by a factor of 5 to 7, while very large molecules of a biological origin fall below this value by factors of 2 to 20. Diffusivities in molten metals and salts, which are quite different in nature from normal liquids, likewise fall in the range 10–5 to 10–4 cm2/s; the higher values are due mainly to the higher temperatures involved. A rough initial estimate of D = 10–5 cm2/s when liquid diffusivities are not known will therefore not be too far off the mark. The corresponding average value for gases is, as was seen, 10,000 times higher at D = 10–1 cm2/s. However, because gases are much less dense than liquids and consequently have lower concentration gradients, the diffusion rates themselves are only about 10 times higher than the corresponding values in liquids.
97
Diffusion through Gases, Liquids, and Solids TABLE 3.3 Diffusivities in Water (T = 25rr C) Diffusing Species
Diffusivity, cm2/s ¥ 105
A. Gases Hydrogen Helium Methane Ammonia Carbon monoxide Oxygen Nitrogen Hydrogen chloride Carbon dioxide Sulfur dioxide
4.8 7.3 1.8 2.0 2.17 2.42 2.0 3.1 2.0 1.7
B. Liquids Methanol Ethanol Acetic acid Acetone Benzene
1.28 1.24 1.26 1.28 1.02
C. Ions H+ OH– NH4+ Na+ Mg2+ Cl– K+ Fe3+ Cu2+ NO3– SO42–
9.3 5.3 2.0 1.3 0.71 2.0 2.0 0.60 0.71 1.9 1.1
D. Biological Substances Urea Glucose Oxygen in blood Oxygen in muscle tissue Lysozyme (egg white) Hemoglobin Fibrinogen Tobacco mosaic virus
Molar Mass 1.4 1.3 1.4 1.7 1.0 0.69 0.2 0.044
E. Environmentally Toxic Substances Chlorine Chlorobenzene 1,2,4-Trichlorobenzene Mercury DDT 2,4,2¢,4-Tetrachlorobiphenyl (a PCB)
1.45 0.91 0.76 2.9 0.49 0.55
60 32 32 14,000 68,000 330,000 40,000,000
98
Mass Transfer: Principles and Applications
TABLE 3.4 Diffusivities in Liquid Metals and Salts T rC 1270 40 600 450 906 933 328 328
Diffusing Species
Melt
D (cm2/s) ¥ 105
Fe Hg Zn Sn Na+ Cl– Na+ NO3–
Fe (4.6%C) Hg Zn Pb NaCl NaCl NaNO3 NaNO3
10.0 2.0 5.0 2.0 14.2 8.8 2.0 1.36
To demonstrate the use of liquid-phase diffusivities, we turn to the somewhat unusual case of ion migration in an electrolytic process, and the electrical current that results from it. Illustration 3.2: Electrorefining of Metals. Concentration Polarization and the Limiting Current Density The final processing in the production of high-purity metals is often carried out electrolytically and is referred to as electrorefining. In this process the metal to be refined, such as copper or silver, has a typical initial purity of 95 to 99% and the aim is to reduce the impurity level to less than 0.1%. Conventional purification processes are often either inadequate or too expensive for this purpose. In electrorefining, the impure metal, e.g., copper, is placed in an electrolytic bath as an anodic plate that is paired with a cathode on which the purified metal is deposited electrolytically. The electrolyte typically consists of an aqueous solution of a salt of the metal to be purified, for example, copper sulfate, and the electrolytic cell is composed of an array of closely spaced alternating cathodes and anodes. A sample electrode pair and the configuration of the electrolytic cell are shown in Figure 3.2a. When a potential is applied to the electrodes, two processes take place. At the anode, the metal, along with its impurities, dissolves as positive cations into the electrolytic bath. These ions migrate to the negative cathode where they are discharged as metal. The impurities, such as iron, usually require a higher potential to be deposited, and consequently remain in solution. As a result of the applied voltage and the attendant migration of ions, a concentration gradient develops within the bath that ultimately leads to a linear steady-state profile shown in Figure 3.2b. A distinction must be made between the behavior of the cations, here exemplified by Cu++, and the negative counterions represented by SO4 -- . For the former, the transport rate is made up of two components that act in the same direction (Figure 3.2c). Diffusional transport with a rate N, and transport due to the applied electrical potential, is represented by the rate FE. We can then write
99
Diffusion through Gases, Liquids, and Solids
– +
a. e–
e–
Cu++
Cathode (–) Cu++ + 2e–ÆCu
Anode (+) CuÆCu++ + 2e–
S04--
b. Cu++
C
S04-0
c.
FE
x
L
Cu++
N
N
S04--
FE
FIGURE 3.2 Electrorefining and concentration polarization: (a) sample electrode pair and electrolytic bath; (b) concentration gradients; (c) flux due to diffusion and electrostatic potential.
NTot / A = DCu ++
dCCu ++ dx
Diffusional flux
+
FE / A
(3.4a)
Electrostatic flux
For the anions, the two transport mechanisms act in opposite directions (Figure 3.2c). SO4 -- ions migrate toward the cathode by diffusion, as do the copper ions, but they are repelled there and driven back into solution by the
100
Mass Transfer: Principles and Applications
negative charge of the electrode. The result is that there is no net flux of the anions. Diffusional transport is exactly balanced by electrostatic transport and we can write
0 = DSO -4
dCSO -4
dx
- FE / A
(3.4b)
We note that CSO -- = CCu ++ , and for electrical neutrality to be maintained, 4
we must have DSO -- = DCu ++ . Adding Equations 3.4a and 3.4b to eliminate 4
the electrostatic flux, we obtain NTot / A = 2 DCu ++
dCCu ++
(3.4c)
dx
On integration by separation of variables there results
NTot / A = 2
DCu ++ (C
Cu ++ L
-C
Cu ++ 0
)
L
(3.4d)
The maximum flux occurs when the concentration at the cathode has dropped to zero. Noting that the concentration at the anode is then twice o the initial electrolyte concentration, CCu 2+ , we can write ( NTot / A)Max = 4
o DCu ++ CCu ++
L
(3.4e)
Let us apply this equation to a particular condition. Suppose that the electrodes are spaced 1 cm apart and the initial concentration of copper sulfate is 0.1 molar. Using the diffusivity for Cu++ listed in Table 3.3C we then obtain ( NTot / A)Max =
4 ¥ 0.71 ¥ 10 -5 ¥ 10 -4 1
( NTot / A)Max = 2.84 ¥ 10 -9 mol / cm 2s Comments: Equation 3.4e gives a good electrolytic cells and their shows, first and foremost, deposition or production,
(3.4f) (3.4g)
semiquantitative description of the behavior of counterpart, the galvanic cells or batteries. It that there is a limit to the rate of electrolytic which cannot be exceeded by increasing the
Diffusion through Gases, Liquids, and Solids
101
applied voltage. Similarly, there is a limiting maximum current that can be drawn from batteries. These limits are imposed by the diffusional processes, which accompany all electrochemical processes, be they galvanic or electrolytic in nature. Equation 3.4e also shows the need for close electrode spacing to achieve high production rates. In car batteries, for example, the plate spacing is of the order of 1 mm. Deviations from Equation 3.4e occur mainly as a result of the concentration dependence of the diffusivities. This is the case particularly at high electrolyte concentration where electrostatic interactions reduce the ion mobility below the values listed in Table 3.3C. The latter apply to conditions at infinite dilution. Equations of the form of Equation 3.4e can also be used to calculate the current associated with electrochemical processes. To do this, we use the conversion factor given by the so-called Faraday number ¡: ¡ = 96,520 C/mol electrons
(3.5)
where C denotes coulombs or ampere-seconds. Let us use this conversion and Equation 3.4e to calculate the current associated with the electrorefining of copper. We assume the unit to be composed of 20 cathodes and 20 anodes, each 1 ¥ 1 m in dimension and spaced L = 2 cm apart. Diffusivity of the copper ions is 0.71 ¥ 10–5 cm2/s (see Table 3.3C) and the concentration C is set at 10–3 mol/cm3. We obtain for the current i i = 2 ¡¥ A ¥ DCu ++ ¥ C / L
(3.6a)
i = 2 ¥ 96,520 ¥ (20 ¥ 100 ¥ 100) ¥ 0.71 ¥ 10–5/2 ¥ 10–3
(3.6b)
This yields i = 137 A
(3.6c)
Note that while currents in these operations are considerable, the applied voltage is quite small. Dissolution and deposition potentials almost exactly cancel each other and the only voltage drop that occurs is due to the Ohmian resistance of the electrolyte solution. This rarely amounts to more than a fraction of a volt. The reader is directed to Practice Problem 3.4, which deals with the calculation of the size of an electrorefining plant.
3.1.3
Diffusion in Solids
In the diffusion through solids, several distinct cases arise that depend on the nature of the diffusing species and of the solid medium. The diffusing
102
Mass Transfer: Principles and Applications
species can be gaseous or liquid in form, or, surprisingly, can also be a solid. For the solid medium, a distinction is made between consolidated media, such as polymers, and those that have a porous structure. We limit ourselves here to a discussion of three important cases of transport through solids, which we take up in turn: diffusion of gases through polymers and metals and through porous media, and the interdiffusion of solids. 3.1.3.1 Diffusion of Gases through Polymers and Metals The diffusion of gases through polymers and similar consolidated media is viewed as a three-step process (Figure 3.3): (1) At the high-pressure interface, the gas dissolves or condenses in the solid matrix. (2) Following dissolution or condensation, the gas diffuses along a solid-phase concentration gradient dC/dx in accordance with Fick’s law to the low-pressure interface. (3) On arrival at the low-pressure gas-solid boundary, the dissolved gas is desorbed or released to the gaseous medium. In Steps 1 and 3, the gas is assumed to be in instantaneous equilibrium with the neighboring solid matrix. The solid-phase concentration C is related to the gas pressure by a linear relation, given as C = Sp
(3.7)
where S is termed the solubility of the gas in the solid. The units used for C are somewhat unconventional and are expressed as cm3 gas at STP/cm3 solid. Units for pressure p are either in atmospheres or Pa, both of which are
p1 Pressure Driving Force Dp = p1–p2 C1 = Sp1
p2
C2 = Sp2
Solid Phase Concentration Gradient Polymer Film
0
x
L
FIGURE 3.3 External gas pressures and internal solid-phase concentration in the diffusion of gases through polymers.
103
Diffusion through Gases, Liquids, and Solids
currently still in use. As a consequence of this dual usage, the solubility S is reported either in units of cm3 (STP)/cm3 Pa or cm3 (STP)/cm3 atm. A dual approach is also used in the formulation of the diffusional rate laws. In the first version, Fick’s law is used with concentrations as defined above; i.e., we have N (ccSTP / s) = - DA
dC dx
(3.8a)
where D is the diffusion coefficient in cm2/s. The second and preferred version uses a pressure gradient and leads to the rate law N (ccSTP / s) = - PA
dp dx
(3.8b)
Here P is the so-called permeability, which is most commonly expressed in units of cm3 (STP) ¥ cm/cm2 s or cm3 (STP) ¥ cm/cm2 s Pa. Several other additional units are still in current use and the translation from one set of units to another is a frequent necessity. To ease this task, we have provided in Table 3.5 a listing of the most commonly required conversion factors. Permeability is related to the Fickian diffusivity D through the solubility S. This is seen by substituting Equation 3.7 into Equation 3.8a and comparing the result with Equation 3.8b. We obtain the relation P = DS
(3.9)
which can be used to calculate D from independent measurements of permeability and the equilibrium solubility S. In contrast to the diffusivities in gases and liquids, which cluster around values of 10–1 and 10–5 cm2/s, the diffusion coefficients and permeabilities we encounter here are not confined to a narrow numerical range. They are strongly material-dependent and range over several orders of magnitude. This is shown in Table 3.6, which lists values of P and S for six common gases and vapors in several commercial polymers. Permeabilities typically vary over the range 10–17 to 10–10 cm3 STP ¥ cm/ cm2 s Pa, values for D = P/S over the somewhat narrower range of 10–9 to 10–5 cm3/s, with no apparent relation to species and material properties. Even odder behavior is observed when we compare the mobility of different gases in the same material. Large molecules with a high molar mass, which we would intuitively expect to be less mobile than their lighter counterparts, can in fact have considerably higher permeation rates. Thus, in PVC, water vapor with a molar mass 4.5 times that of helium and twice its molecular size nevertheless has a permeability rate more than 100 times that of helium. This reinforces the notion that the movement of gas molecules
104
Mass Transfer: Principles and Applications
TABLE 3.5 Conversion Factors for Gas Permeabilities in Solids Multiplication Factors to Obtain P in
From
cm 3 cm cm 2 s cm Hg
cm 3 cm cm 2 s Pa
cm 3 cm m 2 day atm
cm 3 cm cm 2 s cm Hg
1
7.5 ¥ 10–4
6.57 ¥ 1010
cm 3 mm cm 2 s cm Hg
10–1
7.5 ¥ 10–5
6.57 ¥ 109
cm 3 cm cm 2 satm
1.32 ¥ 10–2
9.87 ¥ 10–6
8.64 ¥ 108
in.3 mil 100 in.2 day atm
9.82 ¥ 10–12
7.37 ¥ 10–15
6.45 ¥ 10–1
1.33 ¥ 103
1
8.75 ¥ 1013
3.87 ¥ 10–14
2.9 ¥ 10–17
2.54 ¥ 10–3
cm 3 cm cm 2 s Pa cm 3 mil cm 2 day atm
through polymers is a highly complex process, which does not exhibit the simple inverse relation to molecular mass and size seen in diffusion through gases and liquids. Much more elaborate theories, which are still in a state of development, are required to quantify this process. The following example provides some practice in the use of solubilities and permeabilities. Illustration 3.3: Uptake and Permeation of Atmospheric Oxygen in PVC Consider a polyvinyl chloride sheet 0.1-mm thick with a one-sided area of 1 m2. Its density is 1.1 g/cm3 and it is exposed to atmospheric air at 100 kPa. We wish to calculate (1) the uptake of oxygen from the air, and (2) the daily rate of permeation that prevails when one face of the sheet is in contact with the atmosphere, and the other is in contact with pure nitrogen at the same total pressure of 100 kPa. 1. Uptake of Oxygen We start with Equation 3.7 and convert from C (cc STP O2/m3) to mass mO2 of oxygen. This yields mO2 = S ¥ pO2 ¥ VPVC ¥ MO2 / VO2
(3.10a)
105
Diffusion through Gases, Liquids, and Solids TABLE 3.6 Permeabilities and Solubilities of Gases in Polymers (T = 25rr C unless otherwise indicated) Polymer Polyethylene (low density) Polyethylene (high density) Polystyrene (biaxially oriented) Polyvinyl chloride (PVC-unplasticized) Polyvinyldene chloride (Saran) Polytetrafluoroethylene (Teflon) Polychloroprene (Neoprene G) Cellulose hydrate (Cellophane) Vulcanized rubber Note:
P S P S P S P S P S P S P S P S P S
H2
He
O2
CO2
N2
H2O
7.4 1.6
3.7 0.054 0.86 0.028 14
2.2 0.47 0.30 0.18 1.9
9.5 2.5 0.27 0.22 7.9
0.73 0.23 0.11 0.15 0.59
68
1.5 0.055 0.233 (30r C) 9.0 1.1
0.034 0.29 0.0038 (30r C) 3.2 2.1 3.0 0.74 0.0016
0.12 4.7 0.0022 (30r C) 7.5 9.2 19.0 8.2 0.19
0.0089 0.23 0.00071 (30r C) 1.0 1.2 0.88 0.36 0.0024
15 0.69
98 8.9
5.3 0.35
17 1.3 0.26
7.4 4.9 10 0.29 0.0046 34 0.40
0.00038
9.0 1350 206 870 7.0 6.8 (38r C) 683 18,900
P in [cm3 STP ¥ cm/cm2 s Pa]1013; S in [cm3 STP/cm3 Pa]106.
Here pO2 equals the partial pressure of oxygen in the air (Pa), VPVC is the volume of the sheet (cm3), and MO2 and VO2 are the molar mass and volume (STP) of the oxygen, respectively. Using the values for solubility given in Table 3.6 we obtain mO2 = 0.29 ¥ 10 -6 cm 3 STP / cm 3 Pa ¥ 21, 000 Pa ¥(100 2 ¥ 0.01)cm 3 ¥ 32 g / cm 3 / 22, 410 cc / mol
(3.10b)
and consequently mO2 = 8.7 ¥ 10 -4 g
(3.10c)
i.e., approximately 1 mg. 2. Permeation Rate of Oxygen The relevant expression for this case is Equation 3.8b, which after insertion of the appropriate numerical values yields
106
Mass Transfer: Principles and Applications N(ccSTP / day) = 0.034 ¥ 10 -13 ccSTP cm / cm 2 s Pa ¥ 10 4 cm ¥ (21, 000 Pa / 0.01cm) ¥ 3,600s / h ¥ 25 h / day N= 6.17 cc STP/day
(3.10d) (3.10e)
or equivalently N ¢(g / day) =
6.17 32 = 8.8 ¥ 10 -3 g / day 22, 410
(3.10f)
Comments: The permeation rate of atmospheric oxygen in PVC is seen to be quite low, in spite of the considerable area of the sheet in question and its very small thickness. PVC would consequently be a good packaging material in cases where atmospheric oxygen is to be excluded. Illustration 3.4: Sievert’s Law: Hydrogen Leakage through a Reactor Wall Permeation of gases through metals initially follows the same mechanism that applies to diffusion through polymeric materials; i.e., the gas dissolves or condenses in the solid metal matrix. On dissolution, however, a number of diatomic gases such as hydrogen, oxygen, and nitrogen undergo dissociation into their component atoms according to the scheme: Æ 1 G ( g) G (s) 2 2 ¨
(3.11a)
As a consequence of this process, the equilibrium solid-phase concentration C is no longer related linearly to gas pressure but depends instead on the square root of p. The linear relation (Equation 3.7), C = Sp, must consequently be replaced by the expression C = Kp1/2
(3.11b)
where K is the equilibrium dissociation constant for the reaction (Equation 3.11a). A corresponding change must be effected in the definition of the permeability. Whereas previously we had defined P as P = DS (Equation 3.9), we now write P = DK where P has the new units of cm3 STP cm/cm2 s atm1/2.
(3.11c)
107
Diffusion through Gases, Liquids, and Solids
Expression 3.11b is known as Sievert’s law and can be used to calculate the permeation rate of diatomic gases through metals. The example considered here involves a tubular reactor made of steel that is to be used in the high-pressure hydrogenation of hydrocarbon vapor. The vessel is 3 m long, has an internal radius ri of 5 cm, and is to be operated at a pressure of 100 atm and a temperature of 450r C. The permeability P at this temperature has a value of 8.4 ¥ 10–6 cm3 (STP) cm/cm2 s atm1/2. We wish to calculate the wall thickness required to keep hydrogen losses within reasonable bounds. The reader may recall that a similar configuration and process had been considered in Illustration 1.2 to derive the diffusion rate through a hollow cylinder. That rate was given by the expression N = D2pL
Ci - C o ln ro / ri
(1.7c)
where the subscripts i and o refer to inside and outside conditions. For the case at hand, we replace C by pressure using Equation 3.11b and eliminate D by introducing the permeability P given by Equation 3.11c. This leads to the result
N[cm 3 (STP) / s] = P2pL
(
pi - po
)
ln ro / ri
(3.11d)
Assuming negligible external hydrogen pressure (po = 0), we obtain N[cm 3 (STP) / s] = 8.4 ¥ 10 -6 2 p300
100 ln ro / ri
(3.11e)
The resulting diffusion rates as a function of external radius ro are tabulated below. N[cm3 (STP)/s] 1.7 0.87 0.33 0.23 0.18 0.11
ro (cm) 5.5 6 8 10 12 20
ro – ri (cm) 0.5 1 3 5 7 15
We note that, after an initial rapid drop, the diffusion rate tapers off asymptotically with an increase in wall thickness ro – ri due to the logarithmic dependence on external radius. A wall thickness of 0.5 cm is clearly insufficient, as it leads to substantial hydrogen losses at a level of 1.7 cc (STP)/s. On the other hand, tripling the wall thickness from 5 cm to the inordinately
108
Mass Transfer: Principles and Applications
high value of 15 cm merely brings about a reduction from 0.23 to 0.11 cc (STP)/s. A wall thickness of 5 cm therefore appears to be a reasonable compromise value. Ventilation will nevertheless have to be provided to prevent a dangerous buildup of hydrogen. Illustration 3.5: The Design of Packaging Materials The use of packaging materials is today all-pervasive. Virtually every product that reaches the stores and the consumer is packaged at some stage during its passage from the manufacturing plant to its ultimate destination. Packaging in crates, cardboard boxes, or sacks and bags eases handling and provides protection from damage during transportation. Additional packaging may be provided to prolong shelf life. Food items are often packaged to maintain freshness and prevent the loss of moisture. In other cases, the opposite result is desired: Atmospheric moisture is the enemy and must be excluded by a suitable protective barrier. This arises in the packaging of moisture-sensitive items such as electronic components. Both instances require a barrier with low water permeability. Consider the case of a moisture-sensitive item that must be kept in an atmosphere of less than 10% relative humidity. This means that the partial pressure of moisture in the air cannot exceed 10% of the saturation vapor pressure. To protect the item against accidental excursions of the humidity of the surrounding air, it is proposed to package it in an appropriate material. Inspection of Table 3.6 shows that high-density polyethylene has a suitably low permeability to water vapor. We now stipulate that the thickness of the packaging material should be sufficient to protect the item against the accidental exposure to 95% humidity air of 1-h duration. It is not immediately clear at the outset how this information is to be obtained. Because the permeation process is an unsteady one, a good way to start is to set up an integral unsteady moisture balance, in which the rate of permeation into the package is balanced by the change in moisture content of the interior air. Some further thought will then reveal that the thickness L being sought resides in the permeation gradient Dp/L. We can consequently write Rate of change Rate of moisture in – Rate of moisture out = of moisture content
PA
p o - pi d nH O –0= dt 2 L
(3.12a)
where po and pi are the constant exterior and varying interior partial water pressures and nH2O equals the moles of water vapor contained in the pack-
109
Diffusion through Gases, Liquids, and Solids
age. As we have two dependent variables in pi and nH2O , a second expression relating the two is required. This relation is provided by the ideal gas law nH2O ( mol) =
piV RT
(3.12b)
Combining Equations 3.12a and 3.12b and introducing the molar conversion factor then yield PA( po - pi ) / 22.410 L =
V dpi RT dt
(3.12c)
where the factor 22.410 is used to convert cm3 (STP) contained in the permeability to units of mole. Integrating by separation of variables, we obtain ( PA)( RT ) 22, 410 VL
Ú
t
0
dt =
Ú
pi f
pi
o
dpi p o - pi
(3.12d)
and consequently p - pi o ( PA)( RT )t = ln o 22, 410 VL p o - pi f
(3.12e)
where the superscripts o and f denote the initial and final moisture content of the interior air. The desired packaging thickness is obtained by solving for L: L=
( PA)( RT )t p - pi o 22, 410 V ln o p o - pi f
(3.12f)
We set temperature at 25r C, area-to-volume ratio A/V at 2, and the initial interior humidity at zero. Using a permeability of 9 ¥ 10–13 cm3 STP cm/cm2 s Pa listed in Table 3.6 we obtain L=
(9 ¥ 10 -13 ) ¥ (2) ¥ (8.314 ¥ 10 6 ) ¥ (298) ¥ (3600) 0.9 psat 22, 410 ¥ ln 0.9 psat - 0.1 psat L = 0.0061 cm
(3.12g)
(3.12h)
110
Mass Transfer: Principles and Applications
Comments: This thickness of less than 0.1 mm is not unduly large. In fact, we could extend the exposure time to 10 h without exceeding acceptable thickness limits. 3.1.3.2 Diffusion of Gases through Porous Solids The permeation process considered in the previous section was somewhat unusual. It required the prior dissolution of the gas in the solid matrix before it could make its way through the medium by a process of solid phase Fickian diffusion. A more conventional permeation process occurs when the solid involved is porous or is composed of loosely packed particles. Here the permeating gas enters the solid through the pore openings and continues its way through the porous passages, all the while remaining in the gas phase. Diffusion is strictly Fickian and no penetration of the solid matrix per se takes place. To describe this process, two factors need to be taken into account. The first is the reduction in cross-sectional area available for diffusion, which reduces the diffusion coefficient by a factor equal to the void fraction e of the solid. Here e is expressed as the ratio of open cross-sectional area to total cross-sectional area and ranges from 0 to 1. The second factor is due to the tortuous nature of the porous pathway that is often associated with these media. The gas molecules are made to zigzag their way through the solid, rather than going straight through, occasionally coming to a complete halt in so-called dead-end pores (Figure 3.4a and Figure 3.4b). The net effect is to lengthen the diffusional pathway and consequently reduce the effective diffusion rate. This lengthening of the path and the effect of dead-end pores is accounted for through the so-called tortuosity factor t, which has a value greater than unity. Both of these effects are lumped into the diffusion coefficient, resulting in an effective and reduced diffusivity De; i.e., we have De =
De t
(3.13a)
where D remains the ordinary diffusivity applicable to free space. De is used in conjunction with Fick’s law, which retains its original form; i.e., we have N / A = - De
dC dx
(3.13b)
Void fractions for many porous media typically vary over the range 0.1 to 0.5, with 0.3 a good average value. Tortuosity t has a range of 1.5 to 10, with occasional excursions to higher values. A value of t = 4 gives a good initial estimate in the absence of precise data. The combined effect of the reduction in cross-sectional area and the lengthening of the diffusional pathway is to
111
Diffusion through Gases, Liquids, and Solids
a.
b.
c.
d.
Dead End Pore
FIGURE 3.4 Diffusion in a porous solid: (a) straight-through pores; (b) tortuous pores with branching; (c) molecular diffusion; (d) Knudsen diffusion.
reduce the free-space diffusivity by approximately one order of magnitude. Thus, the diffusion of oxygen in air, previously set at 0.2 cm2/s (Table 3.1), now drops by a factor of 10 to approximately 0.02 cm2/s. We have up to this point assumed that permeation in the pores follows the mechanism of gaseous diffusion in free space, i.e., that the gas molecules undergo repeated collisions with each other as they progress through the medium. However, when pore diameter drops below the value of the mean free path l, the diffusional mechanism undergoes a change to what is termed Knudsen diffusion. Here the impeding collisions no longer occur between gas molecules, but rather between gas molecules and the wall of the pore itself. The pathway is still a random one, but it now zigzags between the walls of the pores, which deflect the gas molecules into a new direction (Figure 3.4d). Equation 3.2, which was given for diffusivity in free space, no longer applies. Although Knudsen diffusion still varies directly with temperature, and inversely with molar mass M, it now also depends on the radius of the pore itself. The relevant expression is given by DK(cm2/s) = 9700rp(T/M)1/2
(3.14)
where rp is the pore radius in cm and T the absolute temperature in Kelvin. Knudsen diffusivities can be several orders of magnitude smaller than molecular diffusivities and are the controlling transport coefficient in many diffusional processes through porous media.
112
Mass Transfer: Principles and Applications
To illustrate diffusion through porous media, we consider two examples. The first deals with diffusion into and out of a leaf, which takes place through tiny, straight-through pores in the underside of leaves. This illustration, and the practice problem that accompanies it, introduces the reader to the fascinating world of plant physiology and the biophysical processes that sustain plant life, as well as our own. In the second example we consider diffusion in a porous catalyst pellet. Here the pore structure is no longer “straightthrough” but becomes tortuous and often gives rise to Knudsen diffusion because of the small dimension of the pores. Transport into and out of catalyst particles plays an important role in determining the overall performance of the catalyst, and is taken up in more detail in Chapter 4. Illustration 3.6: Transpiration of Water from Leaves. Photosynthesis and Its Implications for Global Warming The principal transport processes in a leaf, apart from the conveyance of nutrients, are the uptake of carbon dioxide from the air, and the release of oxygen and of water vapor to the atmosphere. The latter process is referred to as transpiration. The cell structure of a typical leaf is shown in Figure 3.5. Transport takes place mainly through openings termed stomatal pores (stoma: Greek for mouth), which are concentrated at the underside of the leaf. Stomata have a typical length of 10 to 20 mm, an average radius of 5 to 10 mm and cover a fractional area ranging from 0.002 to 0.02 (0.2 to 2%). The remainder of the leaf surface is covered by a layer termed cuticle, which is essentially impermeable to gases (Figure 3.5). The stomatal pores are flanked on either side by guard cells that control the size of the pore opening by expanding or contracting in response to external stimuli. In the dark, and at low external humidities, the guard cells are triggered to expand, partially closing the stomatal pores. Under these conditions, transport of gases through the pores is reduced or ceases entirely. The movement of the guard cells, which causes the losses, is brought about by a change in osmotic pressure of the cell fluids. The interior of the leaves contains the mesomorphic cells, which are arranged in either a loosely packed, “spongy” configuration or in the denser “palisade” form. The intervening spaces are taken up by intercellular air. These mesomorphic cells contain smaller cells termed chloroplasts, which in turn carry chlorophyll, the principal substance responsible for photosynthesis, i.e., the conversion of carbon dioxide into organic compounds and oxygen. This process is addressed in greater detail in Practice Problem 3.7. In the present illustration we consider the transport of water vapor from the interior of the leaf through the stomatal pores into the surrounding atmosphere. To obtain an assessment of the maximum possible moisture loss, we assume the interior of the leaf to be saturated with water vapor. In principle, the external resistance will depend on wind conditions, which vary with time as well as with location. Extensive studies have shown that
113
Diffusion through Gases, Liquids, and Solids
a. Cuticle Upper Epidermis
Palisade Mesophyll Cells
Chloroplasts
Intercellular Air Space
100 mm
Spongy Mesophyll Cells
Lower Epidermis Stomatal Pore
Guard Cell
b.
Stomatal Pore
dst
Guard Cell
rst Boundary Layer FIGURE 3.5 Mass transport in a leaf: (a) leaf cell organization; (b) transport in a stomatal pore.
this resistance can be accounted for in an approximate fashion, by adding a distance equal to the average stomatal radius, rst, to the length of the pore, sst. The total effective length then becomes ᐉst = sst + rst (Figure 3.5b). Let us use these concepts to calculate the water loss from a typical garden or city tree of modest size. We assume a stomatal length and radius of sst = 15 ¥ 10–6 m and rst = 7.5 ¥ 10–6 m, with a fractional open area of 1% (e = 0.01), and set the leaf area at 25 cm2 and the leaf population at 10,000 leaves per tree. External humidity is assumed to be 50% at a temperature of 25r C, with a corresponding saturation water vapor psat pressure of 23.8 mmHg. Diffusivity D of water vapor in air is 2.6 ¥ 10–5 m2/s (Table 3.1). The relevant transport equation is then given by
114
Mass Transfer: Principles and Applications
N = DeA
C - 0.5 C DC = DeA sat st st sat Dx s +r
(3.15a)
We first calculate the saturation concentration Csat, which is given by Csat =
nsat psat (23.8 / 760)1.01 ¥ 10 5 = = = 1.28 mol / m 3 V RT 8.31 ¥ 298
(3.15b)
Substitution of this and other numerical values into Equation 3.15a then yields N = 2.6 ¥ 10 -5 ¥ 0.01 ¥ 10 4 ¥ 25 ¥ 10 -4
1.28 - 0.5 ¥ 1.28 15 ¥ 10 -6 + 7.5 ¥ 10 -6
N = 0.185 mol/s
(3.15c) (3.15d)
This is the maximum possible moisture loss under the stipulated conditions. Actual losses may be considerably lower due to less than saturation values in the interior and due to evaporative cooling, which lowers the interior water vapor pressure and hence diminishes the driving force. Comments: The first impression of this model is its striking simplicity in the face of fairly complex circumstances. The fact that the interior of the leaf was taken to be at saturated water levels is acceptable in view of the larger surface area of cells and capillaries from which water emanates. The use of an equivalent resistance for the boundary layer equal to the radius of the stomata is not immediately transparent but becomes more reasonable on closer scrutiny of the configuration involved. Because no water vapor emanates from the leaf except at the stomata, the humidity will be constant and equal to the external level over the impermeable portion of the leaf. Concentration cannot change abruptly to the level prevailing at the pore mouth, and we must therefore expect that concentration contours in the form of humps will develop around the opening (Figure 3.5b). Based on these concepts, early workers postulated an equivalent resistance equal to the average pore radius. This was an inspired approximation, which was later confirmed in more elaborate studies. These more refined results, while much closer conceptually to the actual situation, nevertheless did not result in substantial changes in the original approximation. The use of the equivalent length rst is now firmly entrenched in the literature. In Practice Problem 3.7 we examine the reverse process of CO2 uptake by the leaf. The transport of carbon dioxide into the leaf interior is a more complex phenomenon involving several resistances as well as the reaction steps of photosynthesis. It is nevertheless possible to arrive at some simple
Diffusion through Gases, Liquids, and Solids
115
results that illuminate this hugely important process with implications for global warming. Practice Problem 3.9 balances these results against the daily emissions of an average car. Illustration 3.7: Diffusivity in a Catalyst Pellet Catalysts almost invariably consist of porous particles with a substantial internal surface area, which typically varies from a few square meters per gram to a few tens or even 100 m2/g. For a reaction to occur, the reacting species must diffuse into the interior of the particle to reach the reactive surface. Conversely, the product gases, once formed, must in turn diffuse out in order to maintain a steady state. Both the diffusional process and the local reaction rate play a role in determining the overall rate of conversion of reactants. When diffusion is fast, which is the case for small particles with large pores, the reaction becomes the rate-determining step. Conversely, when the particle is large and the pores small, the rate of diffusion becomes the dominant factor. This interplay of diffusion and reaction is examined in greater detail in Chapter 4 (Illustration 4.9). It is shown there that the impeding effect of diffusional resistance can be expressed in terms of an effectiveness factor E, which varies in value from zero to one. When diffusion is fast, reaction is the dominant process and E approaches one. Conversely, low diffusion rates and fast reactions lead to small values of the effectiveness factor. The evaluation of E requires a knowledge both of the diffusivity and the reaction rate constants. Our task in the present illustration is to estimate the diffusivity of a reacting species, given certain physical parameters of the catalyst particle. Let us consider the diffusion of oxygen in a silica-alumina cracking catalyst with an average pore radius of 24 Å = 24 ¥ 10–8 cm and a void fraction e of 0.3 cm3/cm3. The tortuosity factor is not known, and we consequently use an average value of t = 4. Because pore radius is much smaller than the mean free path, which is of the order of 10–5 cm at atmospheric pressures, it is suspected that Knudsen diffusion may be operative. We turn to Equation 3.14 and obtain, for a reaction temperature of 420 K, (DK)pore = 9700 ¥ 24 ¥ 10–8 (420/32)1/2
(3.16a)
(DK)pore = 8.5 ¥ 10–3 cm2/s
(3.16b)
This value is more than 10 times lower than the molecular diffusivities of 0.20 cm2/s. We conclude therefore that Knudsen diffusion is indeed the operative mode of diffusion. To calculate the effective diffusivity for the entire particle, we draw on Equation 3.13a and obtain De = Dporee/t = 8.5 ¥ 10–3 ¥ 0.3/4
(3.16c)
116
Mass Transfer: Principles and Applications De = 6.4 ¥ 10-4 cm2/s
(3.16d)
This is the effective diffusivity to be used in assessing catalyst performance. 3.1.3.3 Diffusion of Solids in Solids The diffusion of solid ions, atoms, or molecules through solid matrices, while seemingly not possible, can and does in fact take place. It does so by a mechanism akin to that which described liquid-phase diffusion: Local density fluctuations lead to a momentary opening or vacancy into which a neighboring particle can displace itself (see Figure 3.1b). Thus, a diffusional flow occurs, which follows Fick’s law, as do more conventional diffusional processes. A short compilation of important diffusion coefficients is presented in Table 3.7. Several features are of note here. The first is the strong dependence on temperature that we see in the diffusivities of boron in germanium, and the self-diffusion of Si. A 10 to 20% increase in absolute temperature can lead to a rise in diffusivity of several orders of magnitude. The temperature dependence is clearly an exponential one and is commonly expressed by an Arrhenius-type relation: D = Do exp(–Ea/RT)
(3.17)
where Ea is an activation energy and Do is a preexponential factor. The implication here is that the solid-phase diffusion is to be viewed as an activated process in which the diffusing particle has to attain a threshold activation energy Ea before displacement can take place. A second feature seen in Table 3.7 is the strong influence of impurities on the magnitude of diffusivities. An impurity level of only 1% can result in a dramatic increase in the diffusion coefficient of several orders of magnitude (see the diffusion of carbon in iron). The reason for this lies in the local change in packing of the molecules with an attendant increase in the probability of a vacancy opening up. While the magnitude of solid–solid diffu-
TABLE 3.7 Approximate Diffusivities of Solids in Solids Diffusing Species
Solid Matrix
D (cm2/s)
T (K)
C C C B B B Si Si
Fe Fe + 2% Cr Fe + 1% Mn Ge Ge Ge Si Si
6 ¥ 10 5 ¥ 10–5 4 ¥ 10–4 1 ¥ 10–16 3 ¥ 10–14 4 ¥ 10–13 7 ¥ 10–15 3 ¥ 10–12
1667 1667 1667 1000 1110 1176 1429 1667
–6
Diffusion through Gases, Liquids, and Solids
117
sivities generally falls below values of 10–10 cm2/s, much higher levels comparable to those that prevail in liquids are also encountered. An example of this is seen in the diffusion of carbon in solid iron (Table 3.7). The reader may be puzzled about the relevance of solid–solid diffusional processes. The low values that pertain and the universal nature of the system would appear to make this a topic of mainly academic interest. In fact, the diffusion of solids within solids is highly important in a number of disciplines. In metallurgy, solid-phase diffusion is induced to desegregate local accumulations of alloy components and to relieve stresses caused during casting. This is implemented by maintaining the cast form just below its softening point for prolonged periods of time. The resulting diffusional process is an unsteady one that uses as its initial condition the concentration profile that was derived in Illustration 2.8. Solid-state diffusion also plays an important role in the manufacture of semiconductors. To produce the junctions needed in these devices, a dopant such as boron is deposited on the surface of the semiconductor crystal, e.g., silicon or germanium, and is subsequently made to diffuse into the interior. This process, termed drive-in diffusion, is again carried out at elevated temperatures. An analysis of it and some relevant calculations appear in Chapter 4, Practice Problem 4.4. The diffusivity required in these calculations is derived in the short illustration given below. Illustration 3.8: Diffusivity of a Dopant in a Silicon Chip We wish to calculate the diffusivity of the dopant boron in silicon at a temperature of 1150r C, using tabulated values for the Arrhenius constants of Do = 1.5 ¥ 10–4 m2/s and Ea = 357 kJ/mol. We substitute these values and other pertinent numbers in Equation 3.17 and obtain D = 5.1 ¥ 10–4 exp(–357 ¥ 103/8.314 ¥ 1383) D = 1/6 ¥ 10-17 m2/s
Practice Problems 3.1. A Fermi Problem: Estimation of Gas Diffusivities Make an order-of-magnitude estimate of the diffusion coefficient in simple gases other than He and H2, given that the velocity of sound at atmospheric pressure is of the order 300 m/s and the liquid to gas densities for most gases are in the approximate ratio of 1:1000. (Hints: Sound propagates approximately at the same speed as that
118
Mass Transfer: Principles and Applications
of molecular motion. The diameter of a typical small molecule is of the order of 1 Å = 10–8 cm.) 3.2. Pressure Dependence of Diffusivity in Gases a. Explain why molecular diffusivity varies inversely with pressure. b. Why is Knudsen diffusivity independent of pressure? c. Is Knudsen diffusion more likely to occur at high pressures or low pressures? 3.3. Estimation of the Diffusivity of DDT in Water Use the Wilke–Chang equation (Equation 3.3) to estimate the diffusion coefficient of DDT in water at 25r C. The viscosity of water at this temperature is 0.894 cp (centipoises). Compare the result with the value tabulated in Table 3.3E. (Hint: The formula for DDT is given by 1-trichloro-2,2-bis(p-chlorophenyl)ethane. It contains two phenol rings and five chlorine atoms.) 3.4. Electrorefining of Copper Copper is to be refined electrolytically at the rate of 10 kg/h using a cell with 2-cm plate spacing and a 1-molar CuSO4 electrolyte. a. What is the minimum electrode area required to carry out the process? b. If the electrode dimensions are 2 m ¥ 2 m ¥ 1 cm, what is the minimum length of the electrolytic cell? Answer: a. 309 m2 3.5. Diffusivity in Polymers Although permeability is the most commonly employed transport coefficient for polymers, occasional use is also made of diffusivities. a. Calculate the range of diffusivities for the substances listed in Table 3.6. How do they compare with the diffusivity of gases in liquids? b. Repeat the calculation for Illustration 3.3, Part 2, using a diffusivity and solid-phase concentrations instead of permeability and a partial-pressure driving force. 3.6. Performance of Saran Wrapping A package is made of three ears of corn by placing them on a Styrofoam® tray and enclosing them with Saran Wrap® 0.01-mm thick. The exposed area is 400 cm2. It is desired to keep moisture losses below 1% of the total water content estimated at 100 g per package for a shelf life of 10 days. Does the wrapping meet these requirements? Assume a constant internal saturation vapor pressure of 23.8 mmHg (25r C) and zero external moisture.
119
Diffusion through Gases, Liquids, and Solids
3.7. Photosynthesis: CO2 Uptake by an Average Tree Photosynthesis involves the uptake by plants of carbon dioxide from the surrounding air and its conversion to organic compounds and oxygen CO2 + H 2O + other
Photo Organic Compounds + Oxygen synthesis
It is the largest synthetic process on Earth and results in the fixing of approximately 7 ¥ 1013 kg carbon per year. Transport of CO2 into the leaves is considered to be the rate-determining process in this chain of events and involves a series of steps, which are represented as a sum of resistances. This is akin to the concept we used in Section 1.4 of Chapter 1 to represent transport according to the two-film theory. The Fickian rate process is then expressed in the form N/A =
DC SR
(3.18a)
where DC is the concentration driving force and SR represents the sum of resistances. In a leaf the major resistances are three in number and are due to (1) the stomata, (2) the mesophyll cells, and (3) the chloroplasts (see Figure 3.5). The range of values of resistances is tabulated in Table 3.8. We wish here to calculate the maximum daily CO2 uptake by the modest-sized tree used in Illustration 3.6. To this end we choose the lower values of the resistances listed in Table 3.8 and set the chloroplast resistance at 200 sm –1. We further neglect the carbon dioxide produced by the tree by respiration to maintain its own life. This is usually less than 10% of the total carbon dioxide uptake. Because photosynthesis is rapid compared with the transport process, the carbon dioxide concentration within the chloroplasts is set at zero. These are the approximations we use to calculate the carbon dioxide uptake. Answer: 15 mol CO2/day TABLE 3.8 Representative Values of Resistances for CO2 Diffusion into Leaves Component Crops, open stomata Trees, open stomata Mesophyll cells Estimation Measurements Chloroplasts Estimation Measurements
Resistance sm–1 170–830 500–2500 600 200–800 0 in which the concentration Co is uniform throughout and which is exposed at time t u 0 and the position x = 0 to a constant surface concentration Cs. The solution to this problem can be given as a terse analytical expression and takes the form C - Cs x = erf Co - Cs 2 Dt
(4.9a)
For a medium initially devoid of solute, Co = 0, the equation reduces to C x x = 1 - erf = erfc 2 Dt 2 Dt Cs
(4.9b)
Both of these expressions make frequent appearances in the literature. They contain, as do some source problems, an error function, but lack the preexponential factor we have seen there. As a result, the concentration distributions that arise in this case are a function of only one dimensionless parameter, x / 2 Dt . It follows from this that: 1. The distance of penetration of any given concentration is proportional to the square root of time.
134
Mass Transfer: Principles and Applications
2. The time required for any point to reach a given concentration is proportional to the square of its distance from the surface and varies inversely with the diffusivity. We demonstrate the use of these simple relations with the following example. Illustration 4.4: Penetration of a Solute into a Semi-Infinite Domain 1. Suppose a spill of a solvent has occurred (a) on land and (b) into a water basin. How much longer will it take a particular concentration to penetrate the same distance in water that it does in air? Since the concentration is the same in both cases, we must have, in accordance with Equation 4.9, È x ˘ È x ˘ ÍÎ 2 Dt ˙˚ = ÍÎ 2 Dt ˙˚ air water twater =
Dair t Dwater air
(4.10a)
(4.10b)
Now, diffusion in air is of the order 10–5 m2/s, that in water of the order 10–9 m2/s (see Tables 3.1 and 3.3). Consequently, the time of penetration in water is 10,000 times longer than that in air. 2. If it takes a particular concentration 100 h to penetrate a distance of 1 m, how long will it take the same concentration to advance 10 m? Here again we are dealing with identical concentrations, which by virtue of Equation 4.9 leads to x1 x2 = 2 Dt 2 Dt
(4.10c)
and consequently Êx ˆ t2 = t1 Á 2 ˜ Ë x1 ¯
2
(4.10d)
or 2
10 t2 = 100Ê ˆ = 10 4 h Ë 1¯
(4.10e)
Hence it takes 100 times longer to penetrate from a distance of 1 m to a distance of 10 m.
More about Diffusion: Transient Diffusion and Diffusion with Reaction
135
These simple examples show that the case of diffusion into a semi-infinite medium can yield rapid answers in a relatively straightforward fashion. Furthermore, the geometry is not trivial. It can often be used to approximate finite geometries, particularly if the diffusion process is a slow one, as it is in liquid or solid media. Penetration will then be confined to short distances from the surface, at least initially, and the medium can consequently be regarded as a semi-infinite one for the short period under consideration (note the similarity to Illustration 4.1). In diffusion problems, we often seek to calculate the cumulative amount of material that has entered or left a medium, rather than a particular concentration level or the time it takes to attain that level. In the case of accidental spills, for example, it is often of greater interest to know the time required for complete evaporation or dissolution of the material, rather than the detailed concentration transients. To obtain this information, some mathematical manipulations of the distribution Equation 4.9 are required, and these are discussed in the following illustration.
Illustration 4.5: Cumulative Uptake by Diffusion for the Semi-Infinite Domain Here we calculate the amount of material per unit area that has diffused into a semi-infinite medium to a certain point in time t. We proceed in two steps by first calculating the rate of diffusion at the base plane and then integrating that rate over time. Calculation of the rate requires taking the derivative of the error function in Equation 4.9a. Let us consider the special (and usual) case of zero initial concentration Co = 0. The need is then to evaluate N / A = -D
x xC x erf = Cs 2 Dt x x x =0 xx
(4.11a) x =0
Now from Item 5 of Table 4.1 we have 2 d erf x = exp( - x 2 ) dx p
(4.11b)
Ê x2 ˆ x 2 1 x erf = expÁ ˜ 2 Dt xx p 2 Dt Ë 4 Dt ¯
(4.11c)
and consequently
Combining Equations 4.11a and 4.11c we obtain, for this intermediate step,
136
Mass Transfer: Principles and Applications
N / A = -D
xC xx
=
DCs
x =0
pDt
(4.11d)
This is the expression that now must be integrated with respect to time. We obtain immediately Ê Dt ˆ Mt = 2Cs Á ˜ Ë p¯
1/2
(4.11e)
where Mt is the desired total mass per unit area that has diffused into the semi-infinite domain up to time t. Note that Mt varies directly with the surface concentration Cs but only with the square root of time. In Practice Problem 4.3, use will be made of Equation 4.11e to estimate the time required for spilled solvent to evaporate into the atmosphere. 4.1.2.2
Diffusion in Finite Geometries: The Plane Sheet, the Cylinder, and the Sphere It has previously been indicated that the diffusion into finite geometries leads to expressions of considerably greater complexity than was the case for the semi-infinite medium. The solutions typically take the form of infinite series, which not only are cumbersome to evaluate but also contain implicit parameters that cannot be conveniently extracted. It has become customary in these cases to represent the results graphically, which allows any of several parameters to be read off with ease. We present several of these for the convenience of the reader. Figure 4.2 presents the concentration profiles that arise in a sheet of thickness 2L, which is exposed to a surface concentration Cs at time t = 0 and contains an initial concentration C1. We can use these plots to calculate, for example, the time required for a certain concentration C to reach a particular position x, or conversely, to calculate the prevailing concentration at a specified x after the lapse of time t. The position x = 0 is of particular interest as it represents the midpoint of the sheet and is the farthest removed from the imposed surface concentration Cg. Note that the sheet is infinite in extent; i.e., there are no concentration variations in the y and z directions. The finite three-dimensional case evidently leads to more complex distributions, which cannot be plotted conveniently. Figure 4.3 dispenses with the display of detailed profiles and presents, instead, the average concentration in the medium after the lapse of time. This quantity, like the total uptake that can be derived from it, is again of greater interest than the concentration distributions and can be used for a number of calculations of practical interest. The plots of this quantity are given for a slab or sheet of infinite extent, for an infinitely long cylinder, and for the sphere.
More about Diffusion: Transient Diffusion and Diffusion with Reaction
137
1.0 1.5
(C – C0)/(CS – C0)
1.0
0.8
0.8 0.6
0.6 0.4
0.4
0.3
0.2
0.2 0.15 0.1
0.2
0
4
6
0.08 0.0
0.0
0.4
3 02 .01 0.0 0. 0
0.005
0.6
0.8
1.0
x/L
(C – C0)/(CS – C0)
FIGURE 4.2 Concentration distributions at various times in the sheet –L < x < L with initial uniform concentration Co and surface concentration CS. Numbers on curves are values of Dt/L2.
1.0 0.8 0.6 0.4 0.3 0.2
Sla
b
1.10 0.8 0.6 0.4 0.3 0.2
Cy
lin
r
he
Sp
1.010 0.008 0.006 0.004 0.003 0.002
re
0.001
de
0
0.1 0.2 0.3 0.4 0.5 0.6 0.7
Dt Dt 2 or 2 L R R = radius; L = semithickness FIGURE 4.3 The relative change in average composition for the basic shapes.
138
Mass Transfer: Principles and Applications 1.0 0.9 90
0.8
70
50 30
Mt/M•
0.7
0
100(1 + Vsol’n/Vsphere)–1
0.6 0.5 0.4 0.3 0.2 0.1 0.0 0.0
0.1
0.2
0.3
0.4
0.5
0.6
0.7
0.8
(Dt/R2)1/2 FIGURE 4.4 Fractional diffusional uptake and release in a sphere as a function of dimensionless time in a well-stirred solution of limited volume.
Finally, Figure 4.4 presents the cumulative uptake of material by a sphere contained in a solution of limited volume. This case arises when material must be deposited in a porous sphere or impurities are to be removed from a solution by adsorption. The parameter shown expresses the ratio of volumes of the sphere and the solution and also represents the amount of solute taken up by the sphere. For adsorption, the parameter must be adjusted to accommodate the partition coefficient, or Henry’s constant H. We note that the plot can also be used for the reverse processes of leaching or desorption. This is illustrated with a number of examples. Illustration 4.6: Manufacture of Transformer Steel To make a transformer steel with the proper hysteresis characteristics, it has to be loaded with silicon up to a certain prescribed content. This is accomplished by exposing a steel sheet that is low in silicon content and of 2 mm thickness to an atmosphere of SiCl4 that dissociates to Si(g) and Cl2(g). The silicon gas dissolves in the steel up to 3 wt% at equilibrium. The treatment is to be carried out at 1255 K. Silicon diffusivity in steel at this temperature is 8.2 ¥ 10–13 m2/s. The task here is to calculate the time necessary to achieve a target average concentration of 2.85 wt% silicon in the steel. We draw for this purpose on Figure 4.3, whose ordinate values contain the average concentration C being sought. We start by noting that we can set the initial concentration Co = 0 in view of the low silicon content of the steel to be treated. The surface concentration
More about Diffusion: Transient Diffusion and Diffusion with Reaction
139
Cs required for the ordinate value is taken to be 3 wt%; i.e., it is assumed that at time t = 0, the steel surface is at equilibrium with the surrounding silicon atmosphere. We obtain, for the ordinate of Figure 4.3, C - Cs 2.85 - 3.0 = 0.05 = 0 - 3.0 Co - C s
(4.12a)
Linear extrapolation of the slab line of Figure 4.3 yields Dt @ 1.13 L2
(4.12b)
from which there results t = (1.13)
(1 ¥ 10 -3 )2 = 13.8 ¥ 10 6 s = 383 h 8.2 ¥ 10 -13
(4.12c)
Thus, some 16 days are required for the target concentration to be attained. This is entirely due to the low diffusivity of silicon in the steel, which is some three orders of magnitude lower than typical diffusivities in liquids. To reduce the inordinate length of treatment, the operation will likely have to be carried out at a higher temperature. Since the diffusivity in solids varies exponentially with temperature (see Equation 3.17) a modest increase in the latter will quickly lead to substantially higher diffusivities and thus shorten the duration of the treatment considerably. Figure 4.3, which has been used here to calculate time t required to achieve a certain concentration, can also be put to the task of extracting diffusivities from experimental data. This is shown in the following illustration. Illustration 4.7: Determination of Diffusivity in Animal Tissue To determine the diffusivity of carbohydrates in animal tissue, a sample specimen 1 mm in thickness is soaked in sugar solution for a lengthy period of time, and then mounted on a holder and placed in a large, well-stirred bath of water. After exposure for 1 h, the sample is removed and the residual sugar content determined. It is found to have dropped to 20% of the initial concentration. We wish to use the data to calculate the diffusivity of sugar within the tissue. The problem again calls for the use of Figure 4.3, with the ordinate value now given by C / C0 = 0.2. The corresponding abscissa value is 0.54 so that Dt = 0.54 L2
(4.13a)
140
Mass Transfer: Principles and Applications
and consequently D = 0.54L2/t = 0.54(0.5 ¥ 10–3)2/3600
(4.13b)
D = 3.8 ¥ 10–11 m2/s Illustration 4.8: Extraction of Oil from Vegetable Seeds Vegetable oils can be extracted from their parent seeds by contacting them with solvent in a well-stirred tank. External film resistance can in these cases often be neglected and the principal events are confined to the interior of the seeds. Figure 4.4 can then be used to carry out pertinent calculations. Suppose we desire to calculate the time required to extract 90% of the oil contained in oil-bearing vegetable seeds assumed to be spherical. The given data are as follows: R = 0.25 cm, D = 5 ¥ 10–6 cm2/s, VSol’n/VSolids = 2 so that 100 (1 + VSol’n/VSolids) = 33.3. From Figure 4.4 we obtain, for Mt/M• = 0.9, Dt/R2 = 0.39. Hence
4.2
t = 0.39R2/D
(4.14a)
t = 0.39 (0.25)2/5 ¥ 10–6 = 4.9 ¥ 103 s = 1.36 h
(4.14b)
Diffusion and Reaction
Processes in which diffusion is accompanied by a chemical reaction arise frequently and in a variety of different contexts. All catalytic reactions, in which the catalyst resides within a porous matrix, are necessarily accompanied by diffusional transport of the reactants and products into and out of this catalyst particle. In noncatalytic gas-solid and liquid-solid reactions, diffusion occurs not so much within the solid particle but rather through a gas or liquid film, or through ash layers surrounding the reacting core. Here again diffusion is coupled with reaction. Reactions accompanied by diffusion also occur in fluid systems. The atmosphere is one vast reacting reservoir in which gaseous pollutants such as the nitrogen oxides (the famous Nox) or sulfur oxides (the equally famous Sox) diffuse into the air and undergo reactions with atmospheric oxygen. In gas-liquid systems, the liquid phase often contains a reacting component that interacts with the gas diffusing into it. Here, too, reaction is linked to diffusion.
More about Diffusion: Transient Diffusion and Diffusion with Reaction
141
Evidently, in each of the systems mentioned, a host of different reactions are possible. A reacting solid particle, for example, may involve the combustion of a fuel or the calcining of calcium carbonate (limestone) to calcium oxide and carbon dioxide. Reactants involved in catalytic reactions are almost infinite in their variety, as are those participating in atmospheric reactions. To convey a flavor of these events without overwhelming the reader with a mass of details, we limit ourselves to the following cases.
4.2.1
Reaction and Diffusion in a Catalyst Particle
In this example, we consider the diffusion of a reactant into a porous catalyst particle where it undergoes a first-order reaction. The model here is a second-order ODE, which is solved by the D-operator method given in the Appendix and yields the concentration profile of the reactant within the particle. This is interesting but not immediately useful information for the design of catalytic reactors. To transform the result into a tool for engineering use, we derive the overall rate of reaction in the pellet with diffusional resistance and divide the result by the reaction rate that would prevail in the absence of a diffusional resistance. This ratio, known as the catalyst effectiveness factor E, can be viewed as the efficiency of the catalyst in converting the reactant to product. When diffusion is very fast, or the reaction slow, the interior reactant concentration will be nearly that prevailing at the surface. The effectiveness factor will then be nearly 1 and catalyst efficiency will be approximately 100%, the maximum it can attain. With increasing diffusional resistance, the reactant concentration within the particle begins to fall below that prevailing at the surface, causing the reaction rate to decrease. This is reflected in a lower effectiveness factor E, which is now below 1; the corresponding catalyst efficiency is less than 100%. We thus obtain a good sense, through the value of E, of how well the catalyst is performing, in coping with the diffusional resistance. It also enables us to take countermeasures to raise the efficiency, for example, by increasing porosity or reducing particle size, both of which have the effect of diminishing diffusional resistance. There is a second important reason for introducing the concept of an effectiveness factor. In the ordinary course of events, concentrations within a catalytic reactor packed with catalyst particles will vary both axially in the direction of flow and radially within the catalyst pellets. The model mass balance for such a system would consequently lead to a PDE. By using an effectiveness factor we reduce the PDE to an equivalent set of two ODEs, one the pellet mass balance in the radial direction, and the other the reactor mass balance in the direction of flow. The reaction rate, which previously varied in two directions rA(r, z), is now a function of the axial distance only. We replace rA(z, r) by ErAi(z); rAi is the so-called intrinsic reaction rate, which is measured experimentally on a fine powder and excludes diffusional
142
Mass Transfer: Principles and Applications
effects. The latter are lumped into the effectiveness factor, which now acts as a fractional efficiency on the intrinsic rate rAi. It is this product of ErAi(z) that is used in the reactor mass balance.
4.2.2
Gas–Solid Reactions Accompanied by Diffusion: Moving-Boundary Problems
The topic addressed in this example is that of a solid particle that undergoes a continuous reaction with a gas, building up in the process a layer of porous solid product, which we denote by the general term ash. Reactant diffuses through a growing layer of ash to the surface of the shrinking particle where the reaction takes place. Such systems of two phases, in which the phase boundary undergoes a continuous movement due to some physical or chemical event, are referred to as moving-boundary problems. Examples of this type of behavior are numerous and important. In addition to reacting systems, moving-boundary problems arise in operations involving phase change such as evaporation, condensation, freezing and melting, crystal growth and dissolution, metal or polymer casting, and the freeze-drying of foods. The state variables in these processes, such as temperature or concentration, are in principle functions of both distance and time, leading to PDEs that are usually coupled and nonlinear. To reduce the model to a manageable set of ordinary differential and algebraic equations, the following assumptions are made: 1. The “core” contained by the moving front, such as a burning fuel particle, has uniform properties and can be treated as an unsteady compartment. 2. The movement of the front itself is sufficiently slow that the transport gradients outside the core attain a quasi-steady state. This condition, which we have encountered before in Illustration 2.4, has the effect of eliminating time as a variable, with a consequent simplification of the model equation. 3. The processes involved æ transport and reaction æ are dominated by a rate-controlling slow step. Thus, although both time and distance are retained as variables, distance (expressed through the changing size or mass of the core) becomes a dependent variable for the core-unsteady balance but is retained as an independent variable for the external, quasi-steady-state balance. Time is an independent variable as well, but appears only in the core balance. A systematic way of modeling these systems is to start with unsteady balances about the core, followed by a consideration of the quasi-steadystate process outside the moving boundary. It is good practice to keep track of the number of dependent variables, which must ultimately be matched
More about Diffusion: Transient Diffusion and Diffusion with Reaction
143
by the number of equations. These procedures are demonstrated in Illustration 4.10.
4.2.3
Gas–Liquid Systems: Reaction and Diffusion in the Liquid Film
It is not uncommon practice in gas-absorption operations to employ a solvent that reacts with the solute being absorbed from the gas phase. The purpose of this practice is to promote the solute removal rate and to enhance the efficiency of the gas absorber. Acid gases such as H2S and CO2 are often contacted with solvents containing an alkaline component such as potassium or sodium hydroxide, or an ethanol amine. Conversely, the absorption of a basic solute such as ammonia can be promoted by reacting it with an acidic solvent. The stoichiometry of these liquid-phase reactions can be represented in the general form A(g) + bB(ᐉ) Æ products
(4.15)
B(ᐉ) may refer to pure liquid B, or, more commonly, to B dissolved in a liquid solvent. In Illustration 4.11 we take up the case of a first-order reaction taking place in the liquid, which is fast enough to cause the reactant concentration to drop to zero within a relatively short distance from the interface, i.e., within what is conventionally regarded as a liquid film. The resulting concentration profiles are shown in Figure 4.5. We note here that because of the rapid reaction in the liquid film, the profiles are highly nonlinear and can no longer be approximated by a linear driving force. We must resort to a full diffusional mass balance. This is undertaken in Illustration 4.11. Here again, as in the case of the catalyst particle, the resulting concentration profile does not yield information of immediate interest, and is translated instead into a quantity of greater engineering usefulness. The quantity in question is the so-called enhancement factor Eh, which is defined as the ratio of mass transfer with reaction to the mass transfer rate without reaction. In contrast to the catalyst effectiveness factor, the value of E is above rather than below unity. This is because the reaction continuously removes reactant, thus sharpening its gradient and in consequence enhancing the mass transfer rate. Illustration 4.9: Reaction and Diffusion in a Catalyst Particle. The Effectiveness Factor and the Design of Catalyst Pellets We consider, in this example, the diffusion of a reactant A into a flat-plate catalyst particle, where it undergoes a first-order reaction. The geometry, the associated boundary conditions, and the resulting concentration profile are shown in Figure 4.6a.
144
Mass Transfer: Principles and Applications
Gas Film
Liquid Film
PA CAi
CB
Bulk Gas
Bulk Liquid
CA = 0 0
x
d
FIGURE 4.5 Concentration profiles in a gas-liquid reaction; fast first-order reaction in the liquid film, with reactant concentration dropping to zero at x = d.
Diffusion is assumed to take place unidirectionally through the largest exposed area, while the edges of the plane are taken to contribute an insignificant amount of flow. The surfaces of the particle are maintained at a constant concentration CAs, leading to the parabolic concentration profile shown in Figure 4.6a. The distribution is symmetric about the midplane and has a vanishing derivative at that point. These two conditions, prevailing at the surface and the center plane, respectively, constitute the boundary conditions (BCs) for the model equation. Figure 4.6b shows the difference element over which the mass balance is taken. We obtain Rate of A in - Rate of A out = 0
-De AC
dCA ˘ È dCA -D A - Í e C dx x + Dx ˙ = 0 dx x Í+ k (C ) A Dx ˙ ÍÎ r A avg C ˙˚
(4.16a)
where De is the effectiveness diffusivity. Dividing by ACDx and letting Dx Æ 0 we obtain d2CA/dx2 – krCA/De = 0
(4.16b)
This equation can be cast in a convenient nondimensional form by defining y = CA/CAs
(4.16c)
More about Diffusion: Transient Diffusion and Diffusion with Reaction
a.
145
Impermeable Surface
CAS
CAS
CA = f(x)
dCA = 0 dx 0
x
L Impermeable Surface
b.
–DAC dCA dx x
(rA)avg
x
–DAC dCA dx x + Dx
x + Dx
FIGURE 4.6 Diffusion and reaction in a flat-plate catalyst particle: (a) geometry and boundary conditions; (b) difference element.
z = x/L
(4.16d)
j = L(kr/De)1/2
(4.16e)
Equation 4.16b then becomes d2y/dz2 - j2y = 0
(4.16f)
This is the expression that now has to be solved for the dimensionless concentration ratio y. We draw for this purpose on the D-operator method given in the Appendix, which yields the solution:
146
Mass Transfer: Principles and Applications y = C1 exp(jz) + C2 exp(–jz)
(4.16g)
y(0) = 1
(4.16h)
y¢(1) = 0 The integration constants obtained from these two conditions are C1 = exp(-j)[exp(j) + exp(-j)]
(4.16i)
C2 = exp(j)/[exp(j) + exp(-j)} On introducing them into the solution (Equation 4.16g) we obtain y=
exp[-j(1 - z) + exp[j(1 - z)] exp(j) + exp( -j)
(4.16j)
or alternatively CA cosh[j(1 - z)] =y= CAs cosh j
(4.16k)
where we have used the hyperbolic function cosh j = [exp(j) + exp(-j)]/2 listed in the Appendix. j is called the Thiele modulus, after one of the pioneers in the field, and expresses the combined effect of reaction rate constant kr and effective diffusivity De on the concentration profile in the pellet. Large values of this parameter are associated with larger pellets and low diffusivities, and imply a strong pore diffusion resistance. This means that the reaction rate outpaces the transport rate, which is unable to adequately replenish the consumed reactant. A sharp drop in reactant concentration results and may in extreme cases lead to a vanishing concentration at some location in the pellet. Small values of j, on the other hand, imply a low reaction rate and high diffusivities. Concentration profiles under these conditions will be nearly flat, and the pellet operates near its maximum effectiveness. We now turn to the task of converting the concentration profile (Equation 4.16h), into the more useful effectiveness factor E, which had been defined as the ratio of the reaction rate with diffusional resistance to the reaction rate without diffusional resistance: E=
rate with diffusional resistance rate without diffusional resistance at CAs
(4.17a)
More about Diffusion: Transient Diffusion and Diffusion with Reaction
147
Because the rate of reaction in the pellet must, at steady state, equal the rate of supply of reactant, we have alternatively E=
rate of diffusion at z = 0 rate of reaction at C = CAs
(4.17b)
- De AC (dCA / dx) x =0 LAC kr CAs
(4.17c)
or E=
where the derivative is obtained from Equation 4.16k. The result, obtained after some manipulation, is given by E=-
1 È -j sinh j(1 - z) ˘ ˙ j 2 ÍÎ cosh j ˚ z=0
(41.7d)
or alternatively E = (tanh j)/j
(4.17e)
A plot of this relation is shown in Figure 4.7. The important fact that emerges from it is that up to values of j = 0.5, the pellet is very nearly at its maximum effectiveness, E = 1. This is precisely the region in which we want to operate and we can use this threshold value of j = 0.5 to establish some of the properties a good catalyst pellet should possess. Suppose it is desired to carry out a gas-phase reaction in a reactor packed with catalyst pellets. A reasonable size for the pellets that balances lowpressure drop and acceptable contact area is about 1 cm. Rate constants for many important gas-phase catalytic reactions are of the order 10–3 s–1. The question then arises whether a typical pellet diffusivity De satisfies the criterion j £ 0.5 or whether it has to be adjusted, along with pellet size, to yield an acceptable effectiveness. We have the requirement j = L(kr/De)1/2 £ 0.5
(4.17f)
A rough estimate of pellet diffusivity assuming molecular rather than Knudsen diffusion comes from the relation given in Chapter 3: De =
De 4
(4.17g)
148
Mass Transfer: Principles and Applications 1.0 G
E
0.1
0.01 0.1
1
10
100
j FIGURE 4.7 Catalyst particle effectiveness factor E as a function of the Thiele modulus and isothermal first-order reaction.
j for a flat plate
where e = porosity. If we set e = 0.4 and use D = 10–1 cm2/s for the diffusivity of a typical gas, we obtain j = 0.5 (10–3/10–2)1/2 = 0.16
(4.18)
Thus our criterion is fully met. In fact, we can drop De by an order of magnitude or raise the rate constant by the same amount without violating the criterion. There is also some freedom to manipulate pellet size, if needed. All of this is revealed in simple fashion by an inspection of the Thiele modulus. Illustration 4.10: A Moving Boundary Problem: The Shrinking Core Model The reader had previously been introduced to the concepts that must be applied in modeling the progress of a gas-solid reaction. They involve separating the system into a core, which reacts and continuously shrinks in size, and an external layer, which grows with time but is assumed to be at a quasisteady state. This configuration is referred to as the shrinking core model and has associated with it the assumption of a quasi- or pseudo-steady state. We illustrate these concepts with the following example: Suppose a solid particle undergoes a reaction according to the scheme A(g) + bB(s) Æ Products
(4.19)
with rates rA and rB, which are related by the stoichiometry of the reaction as follows rA =
1 r b B
(4.20)
More about Diffusion: Transient Diffusion and Diffusion with Reaction
149
Reactant A Diffusing into Ash Layer
CA
Ash Layer Core Containing Solid B CA = 0 (Fast Reaction)
rC
r0 r FIGURE 4.8 A reacting solid particle and its external ash layer.
The rate of reaction is assumed to be fast enough that all the reactant arriving at the surface of the particle is instantaneously consumed. Hence, (CA )r =rC = 0 (Figure 4.8). On the other hand, the movement of the core front is, because of its high density, sufficiently slow that the external layer of solid products can be taken to be at steady state. The oxidative degradation of organic aerosols in the atmosphere is an example of such a reactor. The task is to determine the time dependence of the particle radius rC and hence that of its mass. We start, as recommended, with an unsteady core balance and write Rate of B in - Rate of B out =
0 - rB = 4 prC 2rB
Rate of change of B
(4.21a)
drC dt
where we have placed the unknown reaction rate rB in the “out” column and denoted particle density by rB. This is followed by a quasi-steady-state mass balance in the product layer, which is composed as follows: Rate of A in at r - Rate of A out at rC = 0 4 pr 2 De
dCA – rA = 0 dr
(4.21b)
150
Mass Transfer: Principles and Applications
where De is the effective diffusivity of reactant A in the product layer. This last expression can be immediately integrated by separation of variables to yield ( 4 pDe / rA )
Ú
CA o
0
dCA =
Ú
rC
rC
dr r2
(4.21c)
or ( 4 pDe CA o / rA ) =
1 1 rC ro
(4.21d)
where ro = initial radius of particle. We pause at this stage to take a brief inventory. We have, in Equation 4.20, Equation 4.21a, and Equation 4.21d, three equations in the three dependent variables rA, rB, and the core radius rC. The model is consequently complete and we can proceed with the elimination of the unknown reaction rates rA and rB to arrive at the desired solution rC = f(t). We obtain from the three aforementioned equations -
dr 4 pDe bCA o = rprC 2rB C 1 / rC - 1 / r dt
(4.21e)
which can again be integrated by separation of variables: -
De bCA o rB
Ú
t
0
Ê rC 2 ˆ r Á C r ˜ drC Ë o ¯
(4.21f)
2 3 È Êr ˆ Êr ˆ ˘ Í1 - 3Á C ˜ + 2Á C ˜ ˙ Í Ë ro ¯ Ë ro ¯ ˙˚ Î
(4.21g)
dt =
Ú
rC
0
The final result is then rB ro 2 t= 6bDe CA o
Comments: The illustration demonstrates how the use of clever simplifying assumptions and some inspired modeling can reduce the complexities of a process to manageable proportions. The assumptions would be violated only if the progress of core consumption were extremely rapid, in which case events in the outer layer become both time- and distance-dependent, leading to a PDE. The time required for the reaction to be complete is obtained from Equation 4.21g by setting rC = 0. This leads to
More about Diffusion: Transient Diffusion and Diffusion with Reaction
tTot =
rBro 2 6bDeCAo
151
(4.21h)
where tTot is seen to vary inversely with the effective diffusivity De and the external reactant concentration CAo. This was anticipated on physical grounds, as both these factors increase the rate of reactant consumption. Somewhat less expected is the direct dependence on the square of the initial particle radius, ro2. It might have been argued that the time necessary for total consumption should vary with the mass of the particle, i.e., with the radius cubed. That this is not so is neatly revealed by the model, and this is the case because the rate of consumption is dictated by, and hence proportional to, the surface area of the particle at any instant. It will also be noted that a knowledge of the reaction rates is not required in this instance. This is a consequence of the assumption that the rate of reaction is very rapid and as a result ceases to affect the overall rate of the process. The rate-determining step here is the speed with which the core front recedes, which is very low given the high density rb of the particle. This, together with the low values of De and CAo, leads to high values of the consumption time tTot. Illustration 4.11: First-Order Reaction with Diffusion in a Liquid Film: Selection of a Reaction Solvent We consider the situation depicted in Figure 4.5, involving transport through a gas film to a liquid interface, followed by diffusion and reaction in the liquid film. The difference element over which the mass balance is taken is the same as that for the flat-plate catalyst pellet, and leads to the same differential equation and the same boundary conditions: d 2 CA - kr CA / DL = 0 dx 2
(4.16a)
CA(0) = CAi
(4.16b)
dCA (d ) = 0 dx Where the treatment of the two cases differs is in the ultimate goal of the solution. The catalyst pellet required us to derive the ratio of reaction rate with diffusion to reaction rate without diffusion. For the liquid film the requirement is reversed: We compose the ratio of diffusion rate with reaction over diffusion rate without reaction. The results are exact inverses of each other. We obtain
152
Mass Transfer: Principles and Applications
For the catalyst pellet: E=
tanh j j
(4.16c)
Eh =
Ha tanh Ha
(4.16d)
For the liquid film:
where Eh is the enhancement factor and Ha = d(kr/DL)1/2 is the Hatta number, named after one of the pioneers in the field. For the case of no reaction, Ha = 0 and Eh = 1; that is to say, no enhancement occurs. Enhancement Eh rises above 1 when Ha > 0 and continues to increase with further increases in the reaction-rate constants kr . Values of Eh can be read off Figure 4.7 by setting j = Ha and Eh = 1/E. Details of the derivation of Equation 4.16d are left to the exercises (Practice Problem 4.11). The intent here is to use the enhancement factor to make a rational selection of a reactive solvent. Let us assume a typical turbulentflow film thickness of 0.1 mm (see Illustration 1.5) and a value of DL = 10–5 cm2/s, which is the commonly used order of magnitude of liquid-phase diffusivities (see Chapter 3). To find out at which value of Ha enhancement begins to exceed 1, we use the criterion Ha > 0.5, i.e., the inverse of that proposed for the catalyst pellet, j < 0.5. We obtain, for Ha = 0.5
2
2
Ha 0.5 kr = DL Ê ˆ = 10 -5 Ê -2 ˆ = 0.025 s-1 Ë d ¯ Ë 10 ¯ Some other values are listed below: kr, s–1 Eh
2.5 5
10 10
25 50
100 100
Thus, for the reaction to have a significant effect on mass transfer rate, the rate constant must be in excess of 0.025 s–1. This is in fact the range of many liquid-phase reaction rates. The requirements become less stringent with an increase in film thickness. For d = 1 mm, for example, rate constants can be lowered by a factor of 100 to achieve the same result. Reactive solvents are routinely used in the scrubbing of acidic gases. An idea of what can be accomplished is reflected in Table 4.4.
More about Diffusion: Transient Diffusion and Diffusion with Reaction
153
TABLE 4.4 Enhancement Factor for the Absorption of Carbon Dioxide in Various Solvents Solvent
Eh
2N Potassium hydroxide 2N Sodium hydroxide 2N Ethanol amine
6.25 10.5 62.5
Practice Problems 4.1. Emissions from a Chimney A 10-m-tall chimney emits a toxic substance at the rate of 10 kg/s. Calculate the prevailing concentration at the base of the chimney 100 h after the start of the emissions, assuming a diffusivity in air of 10–5 m2/s. (Hint: Use coordinates z – zo, where zo = chimney height.) Answer: 2.48 ¥ 10–24 g/m3 4.2. A Simplified Model of a Nicotine Patch A nicotine patch attached to the skin of a smoker releases 1 mg of nicotine per second. The substance penetrates the skin and ultimately enters the blood vessels assumed to be 1 mm beneath the skin surface. Calculate the maximum concentration of nicotine attainable at the point of entry into the blood. (Hint: Assume the patch to be a continuous point source and set D = 10–9 m2/s.) Answer: 160 mg/cm3 Note: Nicotine patches usually last no more than 24 h, so the maximum given here is unlikely to be approached. 4.3. Evaporation of a Solvent Spill A load of solvent is spilled over a large area, resulting in a layer of liquid with an area density of 1 kg/m2. The solvent has a vapor pressure of 10 kPa and an average molar mass of 100. Diffusivity is estimated at 10–5 m2/s. Calculate the time of evaporation in the absence of any air currents. This is the maximum to be expected. Answer: 136 h
154
Mass Transfer: Principles and Applications
4.4. Doping of a Silicon Chip with Boron A junction in silicon is made by doping it with boron. This is done by first depositing a layer of boron on the chip (predeposition), followed by what is termed drive-in diffusion. If the deposition step requires 5 min, at what distance from the surface is the concentration of boron raised by 3 ¥ 1018 atoms/cm3 during this interval? The density of pure boron is 5.1 ¥ 1020 atoms/cm3, its diffusivity 5.8 ¥ 10–2 mm2/h. Answer: 0.271 mm 4.5. Leaching of an Ore The leaching of ores to recover valuable mineral components is a commonly applied operation in the field of hydrometallurgy. The extraction of gold with cyanide solution is a familiar example. Suppose the finely ground ore can be thought of as plane flakes, and that it is desired to carry the process to the point where no more than 2% of the original material remains at the midplane of the flake, which has a thickness of 2 mm. Diffusivity is estimated at 10–9 m2/ s. Estimate the time of leaching. Answer: 0.417 h 4.6. Batch Adsorption of a Trace Substance When a diffusing solute partitions or adsorbs onto a solid matrix, we can often use standard solutions for nonsorbing solids to follow the course of adsorption by suitably modifying one of the solution parameters. For the case of adsorption by spherical particles from a well-stirred solution of limited volume, for example, the parameter VSol’n/VSpheres in Figure 4.4 is replaced by VSol’n/KVSpheres, where K is the partition coefficient or Henry’s constant. Assume the following parameter values: K = 10, VSol’n/VSpheres = 10, D = 10–5 cm2/s, R = 0.46 cm. What is the fractional saturation of the adsorbent after 1 h? Answer: 0.74 4.7. The Catalyst Pellet under Nonisothermal Conditions Derive the energy balance for a flat-plate catalyst pellet operating under nonisothermal conditions (first-order exothermic reaction). Give a plausible argument why the effectiveness factor can in this case exceed unity. 4.8. Catalyst Pellets in the Form of Raschig Rings Catalyst pellets are on occasion cast in the form of hollow cylinders (Raschig Rings). Discuss the advantages and drawbacks of this geometry. How would you define the dimension needed to define the Thiele modulus?
More about Diffusion: Transient Diffusion and Diffusion with Reaction
155
4.9. A Heat Transfer Counterpart to the Shrinking Core Model: Freeze-Drying of Food In the process considered here, it is desired to derive a model that would allow us to obtain relevant transport coefficients from freezedrying rate data. The food to be dried, i.e., a slab of frozen poultry meat, has an initial (frozen) water content of mo kg. It is heated with an electric heater and, in the experiment in question, provided with thermocouples to measure surface temperature Tg (Figure 4.9). Sublimation of the ice takes place in a vacuum chamber, and water loss is monitored by means of a spring balance. As sublimation progresses, the core ice front, assumed to be at the constant temperature Ti, recedes into the interior, exposing an ice-free matrix, which increases in thickness with time. Heat conduction through this matrix is assumed to be at a quasi-steady state so that a linear temperature gradient prevails at any given instant. Start in the usual fashion by first making mass and energy balances about the core, followed by an energy balance on the ice-free matrix. Use the fraction of ice removed, f, as the dependent variable. Answer: t/f = af + b 4.10. More about Gas–Liquid Reactions with Diffusion Show that for the system considered in Illustration 4.11, the rate of reaction is given by the expression rA =
pA 1 HA + k g kL E
where HA = Henry’s constant. Receding Ice Front Ice-Free Matrix
Tg
Tg Gas Film Ti
L z FIGURE 4.9 Freeze-drying of meat.
156
Mass Transfer: Principles and Applications
4.11. The Enhancement Factor Eh Give a derivation of Equation 4.16d for the enhancement factor, using the procedure used to derive the catalyst effectiveness factor.
5 A Survey of Mass Transfer Coefficients
Chapter 1 introduced the reader to the notion of a mass transfer coefficient and has shown the connection to what is termed film theory. In essence, this approach assumes the resistance to mass transfer to be confined to a thin film in the vicinity of an interface in which the actual concentration gradient is replaced by a linear approximation. The result is that the rate of mass transport can be represented as the product of a mass transfer coefficient and a linear concentration difference, or concentration driving force. Thus, NA/A = kCDC
(5.1)
It was further shown that individual transport coefficients could be combined into overall mass transfer coefficients to represent transport across adjacent interfacial layers. The underlying concept is referred to as two-film theory. Chapter 1 has been confined to simple applications of the mass transfer coefficient which is either assumed to be known, or is otherwise evaluated numerically in simple fashion. This chapter seeks to enlarge our knowledge of mass transfer coefficients by compiling quantitative relations and data for use in actual calculations applied to practical systems. There are evidently a host of such systems, and our aim here is to convey the coefficients pertinent to these systems in an organized fashion. When the system under consideration is in laminar flow, it is often possible to give precise analytical expressions of the transport coefficients. In most other cases, including the important case of turbulent flow, the analytical approach generally fails and we must resort to semiempirical correlations, arrived at by the device known as dimensional analysis, which involves the use of dimensionless groups. To represent these facts in an organized fashion, we start our deliberations with a brief survey of the dimensionless groups pertinent to mass transfer operations. We next turn to transport coefficients that apply to systems in laminar flow and show how these coefficients are extracted from the solutions of the pertinent PDE models. This is followed by an analysis of systems in turbulent flow where the approach of dimensional analysis is used. We
157
158
Mass Transfer: Principles and Applications
describe the method and present the results obtained for some simple geometries, including flow in a pipe and around spheres and cylinders. More complex geometries involving commercial tower packings are taken up next. Such packings, used in separation and purification methods such as gas absorption and distillation, have their own peculiar characteristics, and our main source of information here is the data given in manufacturers’ catalogs. Even more complex conditions apply to mass transfer operations carried out in stirred vessels. Configuration of the stirring mechanism and the speed of stirring enter the picture here, leading to rather complex expressions. Finally, we turn our attention briefly to transport in an environmental context. The methodology used by environmentalists in determining transport coefficients has its own peculiarities, which are discussed and related to the standard concepts used here.
5.1
Dimensionless Groups
The two principal dimensionless groups of relevance to mass transport are the Sherwood and Schmidt numbers. They are defined as follows:
Sh =
kc l D
(5.1a)
Sc =
m rD
(5.1b)
where ᐉ is some pertinent dimension of the system, such as the diameter of a pipe or a sphere, and kc is the mass transfer coefficient in units of m/s. The Sherwood number can be viewed as describing the ratio of convective to diffusive transport, and finds its counterpart in heat transfer in the form of the Nusselt number. The Schmidt number is a ratio of physical parameters pertinent to the system, and corresponds to the well-known Prandtl number used in heat transfer. Added to these two groups is the Reynolds number, which represents the ratio of convective-to-viscous momentum transport and serves in essence to describe the flow conditions. Two additional dimensionless groups, the Peclet number and the Stanton number, are also used, although with lesser frequency. Both of these numbers are composites of other dimensionless groups, which frequently occur in unison. Thus, the Reynolds and Schmidt numbers often crop up combined as a product, which leads to the Peclet number:
159
A Survey of Mass Transfer Coefficients
Pe = Re Sc =
lvr m lv = m rD D
(5.1c)
The Stanton number is a combination of Sherwood, Reynolds, and Schmidt numbers, which likewise often appear in unison. It is defined as St = Sh / Re Sc =
kc v
(5.1d)
The result here is a particularly simple one, and in essence represents the ratio of two velocities: the “velocity” of mass transfer kc in units of m/s and the velocity of flow, likewise in units of m/s. Table 5.1 summarizes these groups for both mass and heat transfer processes. Illustration 5.1: The Wall Sherwood Number In dialysis and similar processes through permeable membranes, it has become convenient to replace the permeabilities, which were defined in Chapter 3, by an effective mass transfer coefficient, termed kw, which equals the ratio of membrane diffusivity over membrane thickness. Thus, kw =
Dm tm
(5.2)
where tm = membrane thickness. TABLE 5.1 Summary of Dimensionless Groups Used in Mass and Heat Transfer Processes Mass Transfer Sherwood number
Sc =
Schmidt number
Reynolds number
Peclet number
Sh =
kc l D
m rD
lvr Re = m
Pe m =
Stanton number
Heat Transfer
lv D
k St m = c v
Nusselt number
Nu =
Prandtl number
Pr =
Reynolds number
Peclet number
k lvr Re = m
Pe h =
Stanton number
hl k Cp m
lvrCp
St h =
k h Cp vr
160
Mass Transfer: Principles and Applications
When flow in a tubular membrane device is laminar, with material diffusing from the flowing fluid into and across the membrane, the transport equations become distributed in both radial and axial directions and in consequence lead to PDEs. One of the boundary conditions for this PDE is given by the relation k w (Cw - Cext ) = - D
dC dr r = R
(5.3)
which in essence equates the rate of passage through the membrane to the rate of arrival of the dissolved solute at the membrane wall. It has become customary in models describing these events to combine the transport coefficients kw and D with the tubular diameter d into a dimensionless group termed the wall Sherwood number, Shw . Thus, Sh w =
kw d D
This number can be viewed as the ratio of membrane transport to transport through the tubular fluid and has found extensive use in describing and correlating membrane transport processes. With typical membrane and liquid diffusivities of 10–7 and 10–5 cm2/s, respectively, membrane thickness of 10–3 mm, and tubular diameter of 1 mm, a typical wall Sherwood number becomes kw d ( Dm / tm )d = D D
(5.4a)
(10 -6 / 10 -4 ) -1 10 = 100 10 -5
(5.4b)
Sh w =
Sh w =
i.e., of the order 100. We have occasion to discuss membrane processes further in Chapter 8.
5.2
Mass Transfer Coefficients in Laminar Flow: Extraction from the PDE Model
Mass transport in laminar flow in a tubular geometry or around simple submerged shapes is generally modeled by PDEs because there is more than
161
A Survey of Mass Transfer Coefficients
one direction of diffusional flow involved. These PDEs have been solved analytically for a number of cases and generally lead to fairly formidable expressions representing the concentration and velocity profiles in the geometries in question. As had been indicated on a number of previous occasions, concentration profiles, which represent the primary information obtained from the PDE model, are often not directly useful for engineering purposes. We have shown this, for example, in the case of diffusion and reaction in a catalyst pellet, Illustration 4.9, where the primary profiles were converted into the more useful quantity known as the effectiveness factor. In the present case the useful quantity we wish to extract from the primary information is an equivalent mass transfer coefficient. Let us demonstrate its derivation using transport in a tube as an example. The situation here is one in which solute diffuses in the radial direction, either as a result of release from the wall, or in consequence of transport to and ultimately through a permeable wall. The model for this case has been presented in Section 2.8 and there referred to as the Graetz problem in mass transfer. The concentration profiles that arise in this case are distributed in both the radial and axial directions, as diffusion in one direction is superposed on convective transport in the other direction. To obtain a mass transfer coefficient from this information, we perform a mass balance at the tubular wall, equating diffusional transport rate to an equivalent “convective” rate expressed by means of a mass transfer coefficient. Thus,
-D
xC = kc (Cm - Cr = R ) x r r= R
(5.5a)
To evaluate kc, two quantities need to be obtained from the primary concentration profile. One is the derivative at the tubular wall given above, which is obtained by differentiating the solution C(r,z); the second is the mean integral concentration Cm in the flowing fluid. This latter quantity is obtained from the expression
Cm
Ú =
R
0
C(r , z)2 prdr pR 2
(5.5b)
Note that both of these items are part of the “information package” contained in a model that we had alluded to in Table 2.2. With these two quantities in place, Equation 5.5a can be solved for kc and the latter tabulated. Similar calculations can be carried out for systems involving flow around simple geometries.
162 5.2.1
Mass Transfer: Principles and Applications Mass Transfer Coefficients in Laminar Tubular Flow
In the case of tubular mass transfer coefficients, we distinguish between mass transfer in the so-called entry or Lévêque region, in which concentration changes are confined to a thin boundary layer d(x) adjacent to the wall, and the so-called fully developed region, in which the concentration changes have penetrated into the fluid core. The situation is depicted in Figure 5.1, and represents a tubular wall coated with a soluble material of solubility Cs dissolving into pure solvent. Because of the thinness of the boundary layer, mass transfer in the entry region is very rapid, with Sherwood numbers in excess of 1000 attained near the tubular entrance (Figure 5.2). As we move away from the entrance in the downstream direction, the boundary layer gradually thickens and the Sherwood number diminishes with the one-third power of axial distance x. Eventually it levels off and attains a constant value as the fully developed region is reached (Figure 5.2). Table 5.2 lists some of the relevant Sherwood numbers obtained in ducts of various geometries and constant wall concentration. For engineering calculations, it is often more convenient to deal with mass transfer coefficients that have been averaged over the entire length of the entry region. The result is expressed in terms of the dimensionless Reynolds
C=0 Flow
Entry Region
Start of Fully Developed Region
C=0 d(x)
C = CS
C = CS
FIGURE 5.1 Mass transfer from a coated tubular wall into a flow of pure solvent.
TABLE 5.2 Mass Transfer Coefficients in Ducts of Various Geometries for Laminar Flow Duct Geometry Cylinder
Parallel planes Square Triangular
Entry Region
Sh = 1.08Ê
xD ˆ
Sh = 1.23Ê
xD ˆ
Fully Developed Region -1/ 3
Ë vd ¯
Ë vd ¯
— —
Sh = 3.66
2
2
-1/ 3
Sh = 7.54 Sh = 2.98 Sh = 2.47
163
A Survey of Mass Transfer Coefficients
103
102 k d Sh = C D
Fully Developed Flow
10 Entry Region 1 10–4
10–3
10–2 xD vd2
10–1
1
10
1/3
FIGURE 5.2 Sherwood numbers for laminar flow in a cylindrical duct.
and Schmidt numbers and takes the following form for laminar flow in cylindrical tubes Ê vd 2 ˆ Sh = 1.86 (Re Sc d / L)1/ 3 = 1.86Á ˜ Ë DL ¯
1/ 3
(5.6)
where L is the length of pipe in question. The mass transfer coefficient here is a constant, rather than a function of distance, and can be directly incorporated in the usual tubular mass balances. This is shown in Illustration 5.2. Mass transfer in the entry region is far from a rare event. Transport in the larger blood vessels lies entirely in the entry region, and so does mass transfer in commercial reverse osmosis desalination plants and other membrane processes (see Chapter 8). Entry lengths of many meters are not uncommon, particularly for low-solute diffusivities. The only requirement is that flow must be in the laminar regime (Re < 2000).
5.2.2
Mass Transfer Coefficients in Laminar Flow around Simple Geometries
In the case of mass transfer involving laminar flow about simple geometries, no distinction is made between regions near the leading front of the particle and portions farther downstream. Instead, we report transfer coefficients averaged over the entire particle. The results are expressed as correlations of the Sherwood or Stanton numbers as a function of Reynolds and Schmidt numbers.
164
Mass Transfer: Principles and Applications
TABLE 5.3 Mass Transfer Coefficients in Laminar Flow around Simple Geometries Geometry
Correlation
Flat plate Sphere Cylinder
Re
St = 0.66(Re) (Sc) Sh = 2.0 + 0.60 (Re)1/2 (Sc)1/3 Sh = 0.43 + 0.53 (Re)1/2 (Sc)0.31 –1/2
–2/3
20,000 4. Packed bed of spheres Re > 50
Correlation St = 0.036 (Re)–0.2 (Sc)–0.67 Sh = 2.0 + 0.60 (Re)0.5 (Sc)0.33 Sh = 0.026 (Re)0.8 (Sc)0.33 St = 0.61 (Re)–0.41 (Sc)–0.67
172
Mass Transfer: Principles and Applications
Illustration 5.4: Estimation of the Mass Transfer Coefficient kY for the Drying of Plastic Sheets It is desired to establish the mass transfer coefficient that needs to be applied to estimate the time of drying of wet plastic sheets exposed to air in turbulent flow. It is customary in drying operations to use humidity Y as a driving force. This calls for the use of the mass transfer coefficient kY, which has been previously listed in Table 1.4. Because the correlations in Table 5.5 are given in terms of the coefficient kc (m/s), a two-step procedure is used to arrive at the desired result. In the first instance, we calculate kc from the correlation for a flat plate given in Table 5.5. This value is then converted into kY using the appropriate conversion factor given in Table 1.4. The following are the data to be used in this connection: Length of sheet L = 15.2 m Width of sheet b = 1.52 m Velocity of air v = 15 m/s Density of air r = 1.12 kg/m3 Viscosity of air m = 1.93 ¥ 10–5 Pa s Schmidt number Sc = 0.606 Vapor pressure at interface pA = 2487 Pa Temperature of air TA = 44r C We start by establishing that the flow conditions do in fact fall in the turbulent range. The Reynolds number, which is the criterion here, is given by Re =
Lvr (1.52)(15)(1.12) = = 1.32 ¥ 10 7 m 1.93 ¥ 10 -5
(5.12a)
i.e., it is in excess of 106, which entitles us to use the correlation listed in Table 5.5. We have Ê Lvr ˆ kc = 0.036Á ˜ v Ë m ¯
-0.2
(Sc)-0.67
(5.12b)
Substitution of numerical values gives kc = 0.036(1.32 ¥ 10 7 ) -0.2 (0.606) -0.67 15
(5.12c)
A Survey of Mass Transfer Coefficients
173
from which there results kc = 0.0284 m/s
(5.12d)
This agrees with the order of magnitude estimate of 10–2 m/s derived in Illustration 1.5. Conversion to kY requires the following relation given in Table 1.4: kY = k c
MB 29 ¥ 10 -3 pBM = 0.0284 p RT 8.31 ¥ 317 BM
(5.12e)
For the computation of pBM we note that, with water partial pressure pA set at 2487 Pa, we have for the inert air component pB1 = 101300 – 2487 = 98813 Pa and pB2 = 101300 Pa so that kY = 0.0284
29 ¥ 10 -3 98813 - 101300 8.31 ¥ 317 ln 98813 101300
kY = 0.0313 kg H2O/m2s DY
(5.12f)
(5.12g)
This is the mass transfer coefficient to be used in modeling the air-drying of plastic sheets.
5.4
Mass Transfer Coefficients for Tower Packings
To this point in our narrative, we have confined ourselves to mass transfer in and around simple geometries such as channels of various types and exterior flow about flat plates, cylinders, and spheres. In this section we turn our attention to more complex shapes represented by tower packings used in operations such as gas absorption, stripping, and distillation. The operation of such columns is addressed in more detail in Chapter 8. Tower packings are used to fill the interior of large upright cylindrical shells in which two phases, usually a gas and a liquid or two liquids, are brought into intimate contact for the purpose of transferring or exchanging certain components contained in these phases. In gas absorption, for example, the aim is to remove an objectionable component from the gas stream or to recover a valuable component contained in it by contacting it with an appropriate liquid solvent. Both phases flow through the tower, usually in countercurrent fashion.
174
Mass Transfer: Principles and Applications
Packed towers and tower packings have been in use for more than 100 years. Some early examples of their application involve the production of sulfuric acid and the purification of coke oven gas. Prior to 1915, these towers were filled with coke, random-sized and -shaped quartz, broken glass, or broken crockery. Tower performance was unpredictable and no two towers would perform alike. The development in 1915 of the Raschig Ring made it possible for the first time to impart a degree of predictability and dependability to tower performance. These first uniformly shaped packings not only improved tower performance but also enabled engineers to translate the performance of one tower to others. Today, modern tower packings such as the Super Intalox Saddle and the Pall Ring greatly exceed the capacity and the efficiency of the early Raschig Ring. Figure 5.3 displays some of the shapes in current use. The mass transfer characteristics obtained on packings are reported in several different ways. At the more fundamental level, we extract volumetric mass transfer coefficients from the experimental performance data. These coefficients, which we have encountered before in Illustrations 2.2 and 2.3, consist of the product of a film coefficient and the nominal specific surface area a of the packing, expressed in units of m2 per m3 of packing. If we use the molar concentration-based coefficient kc or kL, which has units of m/s, then the Plastic Pall Ring‚
Metal Pall Ring‚
Super Intalox‚Saddle
Plastic Intalox‚Saddle
FIGURE 5.3 Sample tower packings.
Raschig Ring‚
Intalox‚Saddle
175
A Survey of Mass Transfer Coefficients
volumetric coefficient given by the product kca or kLa will have units of reciprocal seconds, which is the same as that of a first-order reaction rate constant. Table 5.6 lists values of kca and kLa extracted from the literature for four systems and a range of conventional packings and superficial flow rates per m2 column cross section. These are all based on experimental performance data obtained over a range of gas and liquid flow rates. The liquid flow rates listed in this table represent the range commonly used in gas–liquid operations. They fall between the extremes of too low a flow, which fails to thoroughly wet the packing, and an excessively high flow, which causes the tower to flood. Neither of these conditions is desirable and the range listed, typically L = 1 – 10 kg/m2 s, provides a guideline for avoiding these extremes. The gas flow rates, which lie an order of magnitude lower at G = 0.1 – 1 kg/m2 s, fall between two different extremes, that of insufficient flow to force the gas through the column and an excessively high flow, which would tend to entrain liquid out of the column. These two
TABLE 5.6 Mass Transfer Coefficients in Various Commercial Packings Packing
G, kg/m2 s
L, kg/m2 s
kca, s–1
0.61–0.68 0.61–0.68 0.61–0.68 0.61–0.68 0.68 0.61–0.68 1.2 1.2 0.61–0.68 0.61–0.68 1.2
1.4–14 1.4–14 1.4–14 1.4–27 1.4–54 1.4–27 2.7–27 4.1–41 1.4–14 1.4–14 1.4–54
0.14–0.33 0.09–0.31 0.16–0.32 0.16–0.33 0.13–0.33 0.19–0.44 0.28–0.43 0.20–0.30 0.30–0.51 0.17–0.36 0.04–0.22
G, kg/m2 s
L, kg/m2 s
kca or kLa, s–1
0.54 0.54 0.54 0.54 0.45–2.5
0.68–6.1 0.68–6.1 0.68–6.1 0.68–6.1 4.2
1.3–5.2 0.87–2.6 1.7–4.3 1.3–4.0 2.0–7.0
0.4–2.0
4.2
11
0.054–0.54
2.7
0.14–1.4
System: CO2-aqueous NaOH (kCa) 1-in. Raschig ceramic 2-in. Raschig ceramic 1-in. Raschig metal 1-in. Pall plastic 2-in. Pall plastic 1-in. Pall metal 1-in. Intalox plastic 2-in. Intalox plastic 1 -in. Intalox ceramic / 2 1-in. Intalox ceramic 3-in. Intalox ceramic Packing System: NH3-Water (kCa) 1-in. Raschig ceramic 2-in. Raschig ceramic 1-in. Berl ceramic 2-in. Berl ceramic 50-mm Pall plastic System: CO2-water (kLa) 50-mm Pall plastic System: O2-water (kLa) 1.5-in. Raschig ceramic
176
Mass Transfer: Principles and Applications
undesirable conditions can be avoided by operating within the range indicated in Table 5.6. The mass transfer coefficients listed can be used as a guide for sizing packed columns. Quantitative prediction methods for volumetric mass transfer coefficients that rely on empirical coefficients for each particular packing and packing size have been developed and can be found in the relevant literature. We do not often resort to complete predictions of this type, and it is more common to use relations that will extend known coefficients, such as those listed in Table 5.6, to a different set of conditions. This can be done in an approximate fashion using the following proportionalities: For the gas film coefficient: kca(s–1) µ DG0.67(GrG)0.8(L/rL)0.5
(5.13a)
For the liquid film coefficient: kLa(s–1) µ DL1/2(L/rL)0.75
(5.13b)
In Illustration 5.5, we use these relations to extend existing data to a different set of conditions. A second and less fundamental way of expressing packing performance is through the concept of the height equivalent to a theoretical plate, or HETP. The theoretical plate, which is a concept we encounter in Chapter 7, is a hypothetical gas-liquid contacting device in which the two phases are brought into intimate contact and exit under equilibrium conditions. The number Np of such theoretical plates required for a particular separation performance is easily derived by means of graphical procedures to be described in Chapter 7. The total height H of packed column needed is then established by the product of Np and the equivalent height of the theoretical plate; i.e., we have H = Np ¥ HETP
(5.14)
For rough estimates of the HETP, the following recommendations, given in English units and nominal packing size dp, hold: 1. Pall Rings and similar high-efficiency random packings with low viscosity liquids HETP, ft = 1.5dp, in.
(5.15a)
2. Absorption with viscous liquids in general HETP = 5 to 6 ft
(5.15b)
177
A Survey of Mass Transfer Coefficients 3. Vacuum service HETP, ft = 1.5dp, in. + 0.5
(5.15c)
4. Small-diameter columns, dT < 2 ft HETP, ft = dT, ft, but not less than 1 ft
(5.15d)
Illustration 5.5: Prediction of the Volumetric Mass Transfer Coefficient of a Packing The mass transfer coefficient for the system ammonia–water using 50-mm Pall Rings is known to have a value of 3.6 s–1 at a liquid flow rate of 1.2 kg/ m2 s. We wish to calculate the coefficient that prevails at the same gas flow rate and a liquid throughput of 10 kg/m2 s. Then from Equation 5.13a we have (kc a)new Ê Lnew ˆ = (kc a)old ÁË Lold ˜¯
0.4
10 ˆ =Ê Ë 4.2 ¯
0.4
= 1.42
and consequently (kca)new = 3.6 ¥ 1.42 = 5.1 s–1 This compares with an experimental value of 5.3 s–1.
5.5
Mass Transfer Coefficients in Agitated Vessels
Mass transfer involving tower packings, which we have considered in the previous section, is our first introduction to systems with complex and highly irregular geometries. The approach we had to take there was to make direct use of experimental data or else convert them by means of some simple empirical rates for use in similarly structured systems. Agitated vessels represent yet another example of an unusual and not easily quantifiable geometry. The prominent irregularity here is the shape and size of the impeller and the geometry of its blades. Internal baffles, which are frequently used to enhance transport rates, are an additional unusual feature. Agitated vessels find their use in a considerable number of mass transfer operations. At the simplest level, they are employed to dissolve granular or powdered solids into a liquid solvent in preparation for a reaction or other subsequent operations. The reverse process of precipitation or crystallization
178
Mass Transfer: Principles and Applications
is likewise carried out in stirred vessels. Agitation is also used in leaching operations, or its reverse counterpart, adsorption, which is used to remove objectionable materials from a liquid solution or to recover valuable substances. Liquid extraction processes are often carried out in a batch mode using agitated tanks, as are a host of heterogeneous “stirred tank” chemical reactions. In all of these operations we are concerned with establishing mass transfer coefficients that determine the rate of transport to the continuous phase. Fundamental work in this area dates to the 1940s and 1950s, and has been refined in subsequent decades. These studies have revealed that mass transfer coefficients in these systems can be correlated by the same combination of Sherwood, Reynolds, and Schmidt numbers we have encountered in simpler geometries, provided the former two are suitably modified to account for the altered system geometry and operation. These modifications are implemented as follows: • For the Sherwood number, the dimensional length to be used is the vessel diameter dv . • For the Reynolds number, the dimensional length is represented by the impeller diameter di and the dimensional velocity by the product diN, where N represents the number of revolutions per unit time. All other parameters are used in the same fashion as before; i.e., m, r, and D are the viscosity, density, and diffusivity of the continuous phase. Using these modified dimensionless groups, it has been found possible to correlate a host of experimental data for a wide range of operations. The following correlations, tabulated in Table 5.7, have been found useful in predicting transport coefficients in the continuous phase of the stirred tanks.
TABLE 5.7 Mass Transfer Coefficients in Agitated Vessels System
Correlation 0.65
Solid-liquid baffled vessel Re = 104 - 106
Ê d 2 Nr ˆ kc dv = 1.46Á i ˜ D Ë m ¯
Solid-liquid unbaffled vessel Re = 102 - 105
Ê d 2 Nr ˆ kc dv = 0.402Á i ˜ D Ë m ¯
0.65
Ê d 2 Nr ˆ kc dv = 0.052Á i ˜ D Ë m ¯
0.833
Liquid-liquid
(Sc)0.33
(Sc)0.33
(Sc)0.5
179
A Survey of Mass Transfer Coefficients
To illustrate the use of these equations, we consider the case of the dissolution of granular solids in a stirred tank. This is done in two steps: In Illustration 5.6, we derive the appropriate model to describe the process. The reader is then asked, in Practice Problem 5.7, to derive the mass transfer coefficient for the particular case of the dissolution of potassium hydroxide in a stirred tank and use it to compute the time of dissolution of the charge.
Illustration 5.6: Dissolution of Granular Solids in an Agitated Vessel The assumption made at the outset is that the concentration at the surface of the particles equals the saturation concentration Cs of the solid material and that the mass transfer is driven by the linear potential (Cs – C), where C is the prevailing concentration in the liquid at any particular instant. An initial unsteady mass balance over the solid phase leads to the following expression Rate of change of solid contents d = m dt
Rate of solid in – Rate of solid out = 0
–
kcAs(Cs – C)
(5.16a)
Note that both the surface area As and concentration in the liquid C vary with time or indirectly with the remaining mass m. For the area, which can be quite irregular, we stipulate that it varies with the two-thirds power of volume, so that As = aV 2/3 =
a m 2/3 = bm 2/3 r2/3
(5.16b)
where a is some shape factor and equals 4.83 for spherical particles. To obtain an expression for the external concentration C, we apply a simple cumulative mass balance, which reads Initial solid = Solid leftover + Solid in solution mo
=
m
+
CV
(5.16c)
and consequently C=
mo - m V
(5.16d)
Substituting Equations 5.16b and 5.16d into the original mass balance (Equation 5.16a), we obtain
180
Mass Transfer: Principles and Applications m - m ˆ dm Ê - kcbm 2/3 Á Cs - o ˜= Ë V ¯ dt
(5.16e)
which yields, after integration by separation of variables At =
Ú
m
mo
dm m 2/3 (m / V + Cs - mo / V )
(5.16f)
where A = kcb = kca/rs2/3. Evaluation of the integral is by numerical or graphical integration, which we do not address here. We consider instead the case where vessel volume V and solubility Cs are sufficiently high, that the term (mo – m)/V in Equation 5.16f can be neglected compared to Cs. This applies to the situation considered in Practice Problem 5.5. The result (Equation 5.16f) then becomes t=
3r s 2/3 1/3 m akc Cs o
(5.16g)
where t is now the total dissolution time. Comments: There are several points of note in the final relation given. First, time of dissolution varies inversely with the mass transfer coefficient kc and the solubility Cs. This is in line with physical reasoning: High values of these coefficients imply a high mass transfer rate, which results in shorter dissolution times. A more startling result is the one-third power dependence on initial mass. This implies that an eightfold increase in the charge will increase dissolution time only by a factor of two. This was certainly not anticipated on physical grounds and is a direct consequence of the area-volume relation introduced in Equation 5.16b. We see here yet another example of the power of modeling to reveal the unexpected.
5.6
Mass Transfer Coefficients in the Environment: Uptake and Clearance of Toxic Substances in Animals: The Bioconcentration Factor
The last three decades have seen a dramatic increase in awareness of the effect of various toxic substances on animal life, in particular that of aquatic species. Among the identified culprits, the chlorinated hydrocarbons used
181
A Survey of Mass Transfer Coefficients
in pesticides, the polychlorinated biphenyls (PCBs) and various organometallic compounds stand out. Research in this area has focused, on the one hand, on the physiological consequences of exposure to these substances, and on the other, on tracking their fate both in the environment and in the affected wildlife and their specific organs. It is the latter aspect that is considered here. The fate of toxic substances within an animal is monitored in two ways: first, by measuring the concentration changes during uptake from a controlled environment, and second by following the decline in concentration after exposure has ceased. The latter process is termed clearance, elimination, or depuration. Interpretation of the experimental data is usually carried out by means of compartmental models. The simplest of these, the one-compartment model, yields the following results: During uptake, the relevant mass balance over the animal body takes the form Rate of change of toxic contents dC = V a dt
Rate of toxin in - Rate of toxin out = kcuAuCw
-
kcdAdCa
(5.17a)
where kcu and kcd are the mass transfer coefficients in units of m/s for uptake and depuration, Au and Ae are the associated transfer areas, Cw denotes concentration in the water or other medium, taken to be constant, and Ca is the time-varying concentration within the animal or one of its organs. Before integrating, it is customary to divide Equation 5.17a by volume, with the results that kcu and kce are converted into volumetric mass transfer coefficients ku = kcuAu/V and kd = kcdAd/V. Equation 5.17a consequently becomes k u Cw - k d C a =
dCa dt
(5.17b)
The coefficients now have units of reciprocal time (s–1) and are precisely of the same type encountered in Section 5.4 in connection with mass transfer in packed towers. We have termed them kca and kLa, where a is the specific surface area of the packing in units of m2 per m3 packing. The corresponding term here is the ratio of transfer areas to body or organ volume A/V. The advantage of this procedure is that both these factors, which are either unknown or not known with precision, are lumped into a single empirical transfer coefficient, which is determined experimentally. The fact that these volumetric coefficients have units of reciprocal time has led to the erroneous impression, and even statements, that the process is one of chemical reaction, with ku and ke playing the role of first-order rate
182
Mass Transfer: Principles and Applications
constants. The mechanism of uptake is clearly one of mass transfer and that of elimination is probably a combination of reaction and transport. Mass transfer is therefore the key phenomenon that dominates these processes. We now turn to Equation 5.17a and obtain, by separating variables and integrating, Ca/Cw = (ku/kd)[1 – exp) - kdt)]
(5.17c)
This result expresses the toxin concentration in the animal, Ca, as a function of time. We note that as t Æ •, a balance between uptake and elimination is obtained and a steady-state concentration ratio (Ca/Cw)ss results. This ratio is termed the bioconcentration factor (BCF) and expresses the magnification of toxic concentration in the animal over that prevailing in the surrounding water. It equals the ratio of the two mass transfer coefficients and is given by BCF = (Ca/Cw)ss = ku/kd
(5.17d)
Turning next to the elimination process, a mass balance similar to that performed for the uptake step leads to the following result Rate of change in toxin contents dC V a = dt
Rate of toxin in - Rate of toxin out = 0
-
kCdAdCa
(5.18a)
or equivalently - k d Ca =
dCa dt
(5.18b)
which upon integration by separation of variables yields Ca/(Ca)ss = exp(-kdt)
(5.18c)
Here (Ca)ss is taken to be the steady-state concentration attained during uptake. The uptake and elimination coefficients ku and ke can in principle be calculated by first extracting kd from Equation 5.18c using measured-clearance histories, and then substituting it into Equation 5.17c and performing a similar analysis of uptake-concentration histories. In actual practice, it is more common to perform an independent evaluation of ku by using the initial portion of the uptake process, which is unaffected by the relatively slow elimination process. Equation 5.17b then assumes the reduced form
183
A Survey of Mass Transfer Coefficients dCa dt
(5.19a)
Ca = kuCwt
(5.19b)
k u Cw = which is integrated to yield
This expression is used to calculate ku from a linear plot of the initial uptake data. Table 5.8 presents uptake and elimination constants obtained on bluegill fish, exposed to an aqueous environment containing anthracene and benzopyrene, and ring doves, which were fed pellets containing various PCBs. This is supplemented, in Table 5.9, by the BCF found in various organs of the bluegill fish. Of note in the latter is the extraordinary magnification that takes place particularly in the gallbladder of this species, which attests to the dangerous effect of these toxins. Illustration 5.7: Uptake and Depuration of Toxins: Approach to Steady State and Clearance Half-Lives Two topics are addressed here. The first involves the calculation of the time required to attain 95% of the ultimate steady state during toxin uptake. This conveys a sense of the speed with which this process occurs. In the second calculation, we seek to quantify the depuration process by calculating its half-life, i.e., the time required for the toxin concentration to drop to one half its original steady-state concentration. This again serves as an indicator of the speed with which depuration proceeds. TABLE 5.8 Uptake and Depuration of Some Toxic Substances Toxin Bluegill fish Ring doves
Anthracene Benzopyrene PCBs
ku (h–1)
kd (h–1)
36 49 (0.3–4.4)103
0.04 0.01 0.094–0.24
TABLE 5.9 BCF in Various Organs of Bluegill Fish BCF Tissue Gallbladder Liver Viscera Brain Carcass
Anthracene
Benzopyrene
1,800 561 640 555 42
14,000 1,600 770 90 30
184
Mass Transfer: Principles and Applications
1. Approach to 95% of Steady State Here we make use of Equation 5.17c and Equation 5.17d, which upon division by each other yield Ca/(Ca)ss = 1 – exp(-kdt)
(5.20a)
1 ln[1 - Ca / (Ca ) ss ] kd
(5.20b)
and consequently t=-
Applying this to the uptake of benzopyrene by bluegill fish listed in Table 5.8, we obtain t = ( -1 / 0.01) ln[1 - 0.95]
(5.20c)
t + 300 h
(5.20d)
2. Half-Life t1/2 of Depuration The pertinent expression here is obtained from Equation 5.19c by setting Ca/ (Ca)ss = 0.5. Hence 0.5 = exp(-kdt)
(5.21a)
and consequently t1/2 =
ln 2 kd
(5.21b)
Applying this to the same data as before, we have t1/ 2 =
ln 2 = 69 h 0.01
(5.21c)
To obtain a more direct comparison with the uptake case, we allow Ca/ (Ca)ss to drop to 5% of its original value. This time there results t=
ln 20 = 300 h 0.01
(5.21d)
Comments: The surprising fact that emerges from these calculations is that the uptake and depuration processes proceed at the same speed. Both are long, drawn-
185
A Survey of Mass Transfer Coefficients
out events taking place over a period of days. This is encouraging news for the uptake step because it implies no harmful effects for brief exposure times of, say, 10 min. The long depuration period, on the other hand, is disturbing because the animal will require many days in a clean environment to recover from its exposure. We have here a mix of good and bad news, which is often the norm in environmental events. The BCF mentioned above has its benign counterpart in the effective therapeutic concentration (ETC), which has been encountered in Practice Problem 2.1. Both result when the rate of inflow of the material is exactly balanced by the rate of elimination. Thus, although the two substances are at opposite poles, one, toxic, the other, therapeutic, the mechanism by which they reach their plateau values are identical.
Practice Problems 5.1. The Heat Transfer Analogy Derive the heat transfer counterpart for laminar entry flow and for turbulent flow in a cylindrical pipe. 5.2. Mass Transfer Coefficients in Terms of Shear Rate g˙ In physiological flows, such as that of blood, it is customary to replace velocity by the shear rate g˙ , which equals the velocity gradient at the vessel wall. Show that the kC in the entry region is then given by Ê g˙ D 2 ˆ kC = 0.54Á ˜ Ë l ¯
1/3
(Hint: Use the parabolic velocity distribution for laminar flow as a starting point and derive the relation g˙ = 8v/d.) 5.3. Mass Transfer Regimes in Blood Flow: The Critical Blood Vessel Diameter Shear rates g˙ in physiological blood flow typically lie in the range 100 – 1000 s–1. Show that for proteins (D = 10–10 m2/s), mass transfer in the “larger” blood vessels, d > 1 mm, falls entirely in the developing (Lévêque) region, while for d < 10–2 mm, the concentration profile is fully developed. (Hint: Use the relation g˙ = 8v/d.) 5.4. Mass Transfer in the Kidney: The Loop of Henle The Loop of Henle is part of an intricate system of permeable channels that carry raw urine through the kidney and to the bladder. During its passage, the urine exchanges water and solutes with the surrounding tissue to ensure that not too much or too little of either is withdrawn from the body. The total amount of salt reabsorbed into
186
Mass Transfer: Principles and Applications
the tissue depends in a complex way on flow velocity, and early workers attributed this to a flow-sensitive boundary layer within the tube: Show that this is not the case and show also that we can still have flow-sensitive reabsorption. Data: d = 2 ¥ 10–3 cm, D = 2 ¥ 10–5 cm2/s, v = 10–1 cm/s, wall Sherwood number £ 2. (Hint: Show that transport is in the fully developed region.) 5.5. Controlled Release of Anticoagulants from Artificial Blood Vessels The use of artificial grafts to replace diseased blood vessels has by now become a commonplace operation. The danger of blood clot formation, which attends these replacements, can be largely eliminated by incorporating an anticoagulant in the graft, which is slowly released to the bloodstream. One such anticoagulant is the protein heparin, which effectively prevents the onset of coagulation. It has been estimated that to achieve this, a microenvironment with a heparin concentration of Cs = 0.5 mg/cm3 must be provided at the blood vessel surface. The problem to be addressed here is to calculate the release rate N (mg/cm2 s) required to maintain this concentration within 0.5 cm from the tubular entrance. Flow is laminar and mass transfer resides entirely within the entry region. Shear rate is set at 1000 s–1 and the heparin diffusivity is 7.5 ¥ 10–7 cm2/s. Answer: 5.2 ¥ 10–4 mg/cm2 s 5.6. Solution Mining of Potash One proposed method for harvesting underground deposits of potash (KCl or sylvite) is the technique called solution mining. The procedure consists of cracking the deposit open by pumping highpressure water through an “injection well” drilled at one end of the deposit (“hydrofracturing”). A second well, the so-called production well, is drilled at the far end of the fracture. Water is then continuously pumped into the deposit through the injection well, dissolving potash as it passes through the open fracture and returning to the surface through the production well as a KCl solution. It is desirable in these operations to have an a priori estimate of the KCl concentration in the effluent, as this will determine the production rate of the mine. Consider in this connection the following data: Fracture height d = 1 m Fracture length L = 500 m Fracture perimeter P = 500 m Water velocity v = 0.1 m/s As a result of the geothermal gradient, temperature near the fracture is estimated to be 50r C. The following physical parameters have been calculated with this factor in mind:
A Survey of Mass Transfer Coefficients
187
Density r: 985 kg/m3 Viscosity m: 0.6 ¥ 10–3 Pas Diffusivity D: 1.8 ¥ 10–9 m2/s The problem we set ourselves is to calculate the degree of saturation C/C* attained at the far end of the fracture. Simplifying assumptions: We assume isothermal operation even though the endothermic nature of the dissolution process will cause a drop in temperature and consequently of the solubility C*. The variation in fracture height that occurs with time is neglected, as are the variations in physical properties due to the changing KCl concentration. The correlation for tubular flow listed in Table 5.5 is assumed to hold, with fracture height taking the place of tubular diameter. Answer: C/C* = 0.047 5.7. Dissolution of Potassium Hydroxide in an Agitated Vessel In preparation for carrying out a hydrolysis reaction, a 1-molar aqueous solution of KOH at 100r C is to be produced using a baffled stirred tank. The vessel has a diameter dv of 4 m with 0.3-m-long impeller blades di and a volume of approximately 50 m3. The required amount of potassium hydroxide mo is 2500 kg (rs = 2000 kg/m3) and its saturated concentration 900 kg/m3. In addition, we set the number of revolutions N at 1 s–1. Other data are as follows: m = 0.28 ¥ 10–3 Pas r = 1000 kg/m3 D = 2 ¥ 10–9 m2/s Note: These are only approximate averages of the actual time-varying values. It is desired to use this information to estimate the approximate time of dissolution of the charge. Calculate the dissolution time. Answer: 5380 s 5.8. Diameter of a Packed-Gas Scrubber List some criteria you would use for choosing a packed tower diameter. Where in this chapter can you find some guidelines? 5.9. Bioconcentration in a Two-Compartment Model Consider the two-compartment model shown in Figure 5.4. Toxins enter the first compartment from the water phase and are eliminated from it with first-order rate constants of k1 and k2. Simultaneously,
188
Mass Transfer: Principles and Applications
k1
C1
Cw
k3
C2
V1
k4
V2
k2 FIGURE 5.4 Two-compartment model for bioconcentration.
a reversible exchange of toxins takes place with an adjacent second compartment with first-order rate constants of k3 and k4, respectively. The first compartment may be viewed as the circulatory system; the second compartment represents the tissue, which ultimately, at steady state, equilibriates with the first unit. We define a relative mass for the first compartment, given by f1 =
m1 m1 + m2
Show that with this definition in place the total BCF for the two compartments is given by BCFTot = CTot/Cw = f1(k1/k2) + (1 - f1)(k1/k2)(k3/k4) (Hint: Set up the ultimate steady-state balances for the two compartments.)
6 Phase Equilibria
Throughout the preceding chapters, it is evident that, along with transport coefficients, phase equilibria play a crucial role in determining overall mass transfer rates. In processes involving single-film resistances, equilibrium compositions or pressures constitute the anchor of the driving force responsible for the transport of mass. This is shown most vividly in Figure 1.5. The driving forces here are all of the form C* - C or p* - p, where the asterisked quantities represent equilibrium compositions and partial pressure, and the plain symbols denote the same quantities in the bulk fluid. Evidently, transport will continue only as long as the two quantities are unequal, and will come to a halt when C* = C and p* = p. The two phases are then said to be in equilibrium. Phase equilibria also appear in processes involving two-film resistances in series, but their role here is somewhat more complex. They still appear as one of the two partners constituting the driving forces in the individual films. This comes about because, in two-film theory, the interface separating the two phases is postulated to be at equilibrium (see Figure 1.7). The use of individual coefficients and driving forces, however, is awkward because conditions at the interface are generally unknown. It then becomes convenient to express transport in terms of overall driving forces that bridge the interface and extend from one bulk concentration to the other. Driving forces still retain their previous form, C* – C and p* – p, but the asterisked quantities are now hypothetical compositions and pressures denoting equilibrium with the second phase at a particular point of the system. This is described in detail in Section 1.5. Yet another important aspect of phase equilibria rests on the fact that they determine certain maximum or minimum quantities associated with the process. Suppose, for example, that a liquid evaporates into an enclosure. By allowing the process to proceed to equilibrium, i.e., to full saturation, we are able to determine the maximum amount of liquid that will have evaporated, or, conversely, the minimum mass of air that can accommodate that amount of vapor. Suppose next that the same liquid, for example, water, adheres to a solid that is to be dried by passage of air over it. Then by using very low flow rates we can ensure that the air leaving the drying chamber is fully saturated and that consequently the air consumption is at a minimum. 189
190
Mass Transfer: Principles and Applications
The picture that emerges from this brief discussion is that the role of equilibrium is a very considerable one. Equilibrium, or the departure from it, determines the driving potential of the process and sets upper and lower limits to the enrichment attainable and the material inventory involved. Equilibrium can consequently be viewed as one of the two key players in mass transport; the other is the transport coefficients themselves. Because each of these factors has a distinct role to play, it has become customary to examine the component factors separately and subsequently combine the results for a complete description of the event. In this procedure we start by first ignoring the effect of transport resistance and allowing the two phases to come to equilibrium. The device in which this step is carried out is termed an equilibrium or ideal stage. Concentration or pressure changes that result from the procedure are noted and set aside. The effect of transport resistance is examined next. In the case of staged operations, this involves an assessment of stage efficiency, which is a measure of the effect of transport resistance on the amount transferred. When resistance is negligible, the efficiency is 100% and the process proceeds to complete equilibrium. When efficiency is 50%, only half of the attainable enrichment is obtained. In the final step, the results of this dual scrutiny are combined to arrive at an overall description of the process. These steps, as well as the underlying concept of an equilibrium stage, are taken up in the next chapter. While some of the topics in the present chapter will be new to the reader, others may be known from previous courses in thermodynamics. They are repeated to provide a refresher and a link to subsequent chapters.
6.1
Single-Component Systems: Vapor Pressure
Most pure substances that the reader will be familiar with can exist in the solid, liquid, and vapor phases. The principal exceptions are high-molecularweight solid compounds such as proteins, carbohydrates, and polymers that decompose before they can pass into the liquid or vapor phase. These will not be of concern here. The wider class of substances, which are addressed in this chapter, is capable of existing in all three phases. Their behavior is best illustrated by means of a pressure-temperature phase diagram; a representative example is shown in Figure 6.1a. The diagram is divided into three regions representing the solid phase (S), the liquid phase (L), and the vapor phase (V). The dividing boundaries between these regions are the melting point or freezing point curve A, the sublimation curve B, which separates the solid and vapor phases, and the vapor pressure or boiling point curve C, which is the dividing line between liquid and vapor phases. It is principally the latter curve and the relation between vapor pressure and temperature that we are concerned with here. Also marked on the diagram are four specific pressure-temperature pairs,
191
Phase Equilibria
a. Pressure PC L
A
101.3 kPa
S
C
Pt
V
B
Tt NMP
NBP
TC
Temperature
b. Liquid Single Phase
Density Two Phases
Vapor
TC
Temperature
FIGURE 6.1 (a) Phase diagram of a pure substance; (b) approach to the critical point.
which characterize the system. NMP and NBP are the “normal” melting and boiling points, i.e., those that prevail at a pressure of 1 atm or 101.34 kPa. The prefix normal is often dropped and the shorter version used to denote conditions of 1 atm. The pair Pt–Tt marks the triple point and represents the conditions under which all three phases can coexist. For water, the pressure and temperature values are 0.006 atm and 0.01r C, respectively. Suppose, now, that a liquid sealed in a container and in equilibrium with its vapor is heated starting from room temperature. As the temperature is raised, liquid passes into the vapor phase, thus increasing the density of the latter, while the liquid itself undergoes expansion with an attendant decrease in density (Figure 6.1b). A point is eventually reached where the densities of the two phases become identical and the two phases merge into a single entity. The specific condition (Pc–Tc) at which this occurs is termed the critical
192
Mass Transfer: Principles and Applications
point of the system. Beyond it, i.e., above the critical temperature Tc, a substance can exist only as a vapor and no liquefaction can occur, no matter how high the pressure is raised. For water, this point is reached at a temperature of 374.4r C and a corresponding pressure of 219.5 atm. Note that while a substance can only exist as a gas above the critical temperature, its density is nevertheless high enough that it can also qualify as a quasi-liquid. This dual behavior has certain advantages, which are exploited in a process termed supercritical fluid extraction, which is taken up in Section 6.2.5. We now turn to the consideration of the equilibrium between liquid and vapor. The aim is to establish a quantitative relation for the curve C in Figure 6.1a, i.e., for the vapor pressure of the liquid in the interval between the triple point Tt and the critical temperature Tc. The starting point is given by the well-known Clapeyron equation, which is the thermodynamic expression of phase equilibrium for a pure substance: DH dP = dT TDV
(6.1a)
Here DH and DV denote the molar enthalpy and volume changes that occur during the passage from one phase to another. The equation is confined to pure substances, but is otherwise quite general and capable of expressing the transition between any two of the phases shown in Figure 6.1a. Thus, for a passage from the solid to the liquid phase, DH will represent the latent heat of fusion, while DV denotes the difference between liquid and solid molar volumes. The derivative dP/dT, which appears on the left side of Equation 6.1a, gives the slope at any point of the phase boundary curve A shown in Figure 6.1a. Equation 6.1a cannot be integrated in straightforward fashion since both DH and DV depend on temperature in a complex fashion. However, when one of the states is represented by the vapor phase, the exact Equation 6.1a can be simplified by introducing the following two approximations: 1. The molar volume of the vapor phase is much greater than that of the liquid or solid phase. Thus, Vv >> Vs,ᐉ
(6.1b)
DV =˙ Vv
(6.1c)
and consequently
2. At low pressures, it may be assumed that the vapor phase behaves ideally, so that
193
Phase Equilibria
Vv =
RT Po
(6.1d)
On substituting these two simplifying relations into Equation 6.1a and rearranging, we obtain 1 dP o DH = o P dT RT 2
(6.1e)
d ln P o DH =d(1 / T ) R
(6.1f)
or alternatively
Equations 6.1e and Equation 6.1f are known as the differential forms of the Clausius-Clapeyron equation. If we further assume that the latent heat of vaporization DH is constant over the interval in question, we obtain by integration log Po = A – B/T
(6.1g)
where A and B (= DH/2.302R) are constants. Expression 6.1g, known as the Clausius-Clapeyron equation, provides an excellent representation of the solid vapor pressure but is valid only over a limited temperature range of the liquid vapor pressure. It breaks down, in particular, near the critical point where vapor and liquid densities approach each other in magnitude. Various semiempirical modifications have been proposed as a result, among which the Antoine equation (1888) has proved to be particularly successful. It takes the form log Po = A – B/(T + C)
(6.1h)
where Po is the liquid vapor pressure in mmHg, T the temperature in degrees Celsius, and A, B, and C are empirical constants. Values of A, B, and C for some common organic liquids appear in Table 6.1. They have been computed from data measured up to several atmospheres and provide a precise representation of the vapor pressure over this range and beyond. To demonstrate the use of the Antoine equation, we consider the following, somewhat unusual case. Illustration 6.1: Maximum Breathing Losses from a Storage Tank During a rise in ambient temperature, solvent-laden air in the headspace of storage tanks expands and is partially expelled into the atmosphere through
194
Mass Transfer: Principles and Applications
TABLE 6.1 Antoine Constants for Various Liquids Substance Methyl chloride Methylene chloride Chloroform Carbon tetrachloride Acetone Diethyl ether Methanol Ethanol n-Hexane n-Octane Benzene Toluene o-Xylene Water
A
B
C
7.09349 7.40916 6.95465 6.87926 6.11714 6.92032 8.08097 8.11220 6.88555 6.91874 6.89272 6.95805 7.00154 7.96681
948.582 1325.938 1170.966 1242.021 1210.595 1064.066 1582.271 1592.864 1175.817 1351.756 1203.531 1346.773 1476.393 1668.210
249.336 252.616 226.252 226.409 229.664 228.799 239.726 226.184 224.867 209.100 219.888 219.693 213.872 228.000
a vent pipe. When the temperature drops, the process reverses itself and fresh solvent-free air enters the headspace. Subsequent cycles of rising and falling temperature cause a cumulative loss in solvent. An accurate calculation for this loss would require a knowledge of the time- and space-dependent concentrations and temperatures in the tank, and would thus call for the solution of PDEs (mass and energy balances) along with the appropriate equilibrium relation. The somewhat irregular geometry (tank and vent pipe) and the possibility of both conductive and free convective transport, plus uncertainties in the external heat transfer coefficient, make this a formidable problem to solve. In this first elementary treatment of this problem, these complications are avoided by confining ourselves to the calculation of the maximum loss that can occur in the course of a single temperature cycle. This is achieved by assuming that the tank contents are well mixed and in thermal and phase equilibrium at the maximum temperature attained in a cycle. The result is an enormous simplification of the problem because we are now dealing merely with algebraic expressions representing the vapor pressure of the system and the appropriate gas laws. Suppose that the stored liquid in question is benzene, and that the headspace of the storage tank is 100 m3. We assume that the temperature rises from 15 to 30r C in the course of a day and that, as a result, some 5% of the headspace air is ejected. The task is to calculate the maximum amount of solvent lost. We start by computing the vapor pressure at the maximum temperature of 30r C using the Antoine constants for benzene listed in Table 6.1. Thus,
195
Phase Equilibria
log P o = 6.89272 -
1203.531 30 + 219.888
and consequently Po = 119.3 mmHg Substituting this value into the ideal gas law, we obtain m=
M P oV RT
or m=
78(119.3 / 760)1.013 ¥ 10 5 ¥ 5 8.314 ¥ 303
and therefore m = 2.46 kg Although this amount represents a theoretical maximum, more-refined calculations have shown that these losses are indeed quite substantial and would in most cases be considered unacceptable. Provision is therefore often made to recover the escaping vapors by compression condensation or by adsorption, or to cover the tank by a floating top. An attendant benefit of this procedure is the avoidance of the adverse effect of such emissions on the environment.
6.2
Multicomponent Systems: Distribution of a Single Component
We take up the topic of multicomponent equilibria by drawing a distinction between systems in which several or all components are present in the two equilibrated phases, and those in which only one component plays a key role by distributing itself in significant amounts between the phases in question. Vapor-liquid equilibria of mixtures and other similar multicomponent systems involving the appearance of several solutes in each phase are the prime example of the former, while distributions of a single component occur in a number of different contexts, which we take up in turn below. They include the equilibrium of a single gas with a liquid solvent, or a solid (gas
196
Mass Transfer: Principles and Applications
absorption and adsorption), and the distribution of solutes between a liquid solution and an immiscible solvent (liquid extraction) or solid (liquid-phase adsorption). We note that although more than one component may be present in both phases, their appearance does not affect the distribution of the principal component under consideration. Thus, in gas absorption, solvent vapor is inevitably present in the gas phase but does not interfere with the distribution of the main solute in any way. Similarly, in liquid extraction, the two solvents may not be perfectly immiscible, but this does not significantly affect the distribution of the solute.
6.2.1
-Liquid Equilibria Gas-
Examples of gas-liquid equilibria abound both in the physical world surrounding us and within an industrial context. Gases of both a benign and toxic nature are taken up or released by bodies of water. The example of dissolved oxygen, which is essential to the sustenance of aquatic life, immediately comes to mind. On the industrial scene both valuable and objectionable gases are often selectively removed or recovered by gas absorption or gas scrubbing. We have already alluded to this process in Illustration 2.3 and Section 5.4, and more on this process appears in Chapter 8. The phase equilibrium between a gas and a liquid solvent is usually expressed in terms of the amount absorbed or liquid-phase concentration as a function of gas pressure. A diagram of this relation appears in Figure 6.2. The concentration of the dissolved gas is seen to increase with pressure and it does so indefinitely; i.e., no limiting saturation value is attained. This is in contrast to gas-solid and liquid-solid adsorption equilibria in which the solid surface ultimately becomes saturated with solute. An increase in temperature, on the other hand, diminishes the solubility of the gas, and hence its concentration. One notes in addition that at the lower end of these diagrams the plot becomes linear. The slope of this linear portion is termed the Henry’s constant H and the phase equilibrium in this range is said to follow Henry’s law, given by p = HC
(6.2)
Here p is the gas pressure usually expressed in kPa and C the concentration of the dissolved gas (mol/l or mol/m3). Henry’s constants at 25r C for some common gases are displayed in Table 6.2. The validity of Equation 6.2 for these gases extends to several atmospheres, and in the case of permanent gases, such as H2, O2, and CO2, to several tens of atmospheres. A good deal of useful information can therefore be gathered through the use of Henry’s law and the associated Henry’s constants. We demonstrate this with the following illustration.
197
Phase Equilibria
T1
Slope = Henry's constant
Pressure p
T1 > T2
Concentration FIGURE 6.2 Gas-liquid equilibrium isotherm.
TABLE 6.2 Henry’s Constants for Gases in Water at 25rr C Gas Hydrogen Helium Carbon monoxide Nitrogen Oxygen Carbon dioxide Methane Ethane Propane n-Butane
H (kPa m3 mol–1) 130 260 100 150 79 2.9 71 53 66 80
Illustration 6.2: Carbonation of a Soft Drink It is common practice in the soft drink industry to carbonate drinks by dissolving a fixed volume of carbon dioxide in the liquid, rather than by applying a prescribed pressure to the contents. That volume is set at 3 to 5 times the volume of the liquid contents. Consider a standard 1.5-l soft drink bottle with a headspace of 5%. The task is to calculate the pressure in the bottle after carbonation and the consumption of carbon dioxide in a plant bottling 10,000 containers per day. We assume a CO2 charge equal to 5 l. Taking account of the 5% headspace, and assuming a bottling temperature of 298 K together with a molar volume of STP of 22.4 l, this leads to a carbon dioxide volume of
198
Mass Transfer: Principles and Applications VCO2 = 5000 - 0.05 ¥ 5000 = 4750 l / m 3
(6.3a)
C = (4750/22.4)(273/298) mol CO2/m3
(6.3b)
or equivalently
We apply this value to Henry’s law (Equation 6.2) and use a Henry’s constant of 2.90 taken from Table 6.1 to obtain p = H ¥ C = 2.9(4750/22.4)(273/298)
(6.3c)
or p = 563 kPa To this value has to be added the initial air pressure of 100 kPa, which brings the total pressure in the container to slightly above 6.5 atm. To obtain this result in 10,000 bottles of 1.5 l each, one requires a CO2 volume of VCO2 = 10, 000 ¥ 1.435 ¥ 5 l
(6.3d)
where the headspace of 0.075 l has been subtracted from the total bottle volume of 1.5 l. The corresponding mass of CO2 in the carbonated drink ( mCO2 )d is given by ( mCO2 )d =
10, 000 ¥ 1.425 ¥ 5 (273 / 298) M 22.4
(6.3e)
where M = molar mass of carbon dioxide = 44. Consequently ( mCO2 )d = 128 kg
(6.3f)
The amount of carbon dioxide in the headspace is a small fraction of this value and is given by ( mCO2 )h = 10, 000
5.63 ¥ 10 5 ¥ 0.075 ¥ 10 -3 PV ¥ 44 M = 10, 000 8.314 ¥ 298 RT ( mCO2 )h = 7499 g = 7.5 kg
(6.3g) (6.3h)
Thus, a total of 135.5 kg of CO2 will be required in the daily operation of the plant.
199
Phase Equilibria 6.2.2
Liquid and Solid Solubilities
A second example of a binary system in which one component is considered to be confined to one phase only involves the solubility of liquids and solids in a solvent. The confined species here is the solvent, which is in contact with a second phase containing a pure liquid or solid. At equilibrium the solvent phase has become saturated with the dissolved species or solute and no further dissolution takes place. The concentration corresponding to this state is termed the solubility of the liquid or solid in question. The number of possible solute-solvent combinations is evidently quite large, and the corresponding number of required measurements infinite if temperature is considered an additional variable. It is customary therefore to deal with only a small number of solvents, principally water, and to perform measurements at a standard temperature of 25r C. Most reported data have been obtained within this framework. A listing of the solubility in water of a number of solutes, mostly organic in nature, appears in Table 6.3. Sodium nitrate and glucose show high values of close to 50%, as expected, while solubilities of DDT and mercury are measured in parts per billion. The latter are nevertheless sufficiently significant to be of environmental concern. The reader will also note the relatively high solubility of diethyl ether (~7.5%), which is generally thought of as insoluble. Unusually high values are also shown by chloroform and benzene. Some caution should therefore be exercised before declaring a solvent “insoluble” in water. The amounts dissolved may in fact be considerable, and their presence in discharged process water must be duly accounted for. This is illustrated in the following example. TABLE 6.3 Solubilities of Liquids and Solids in Water at 25rr C Substance
Solubility (g/l water)
Chloroform Carbon tetrachloride Diethyl ether n-Hexane n-Octane Benzene Toluene o-Xylene Naphthalene DDT Glucose Potassium chloride Sodium chloride Sodium nitrate Mercury
11 0.8 75 0.15 6.6 ¥ 10–4 1.8 0.52 0.18 3.3 ¥ 10–2 1.2 ¥ 10–6 820 360 360 940 3.0 ¥ 10–5
200
Mass Transfer: Principles and Applications
Illustration 6.3: Discharge of Plant Effluent into a River We consider here the case of process water saturated with benzene being discharged into a river. The question to be addressed is whether the diluting effect of the river flow is sufficient to reduce the effluent concentration to within permissible limits and, if not, how much of the offending substance has to be removed to meet environmental standards. A sketch depicting effluent and river flow is shown in Figure 6.3. Let us consider an effluent discharge of 150 l/min and a river flow that varies seasonably from 23,000 to 50,000 l/s. Note that since the regulatory limit has to be met at all times during the year, the lower summer flow rate of 23,000 l/s must be used. The standard used here is that of the U.S. Environmental Protection Agency, which has set the maximum permissible level of benzene in drinking water at 0.05 mg/l or 5 ppb. The effluent is assumed to be saturated with benzene at the solubility level of 1.8 g/l (1.8 ¥ 106 ppb) given in Table 6.3. We commence with a mass balance around the juncture of effluent and river flow shown in Figure 6.3 and assume the contents of the envelope to be well mixed and to have attained a steady state. Thus, Rate of benzene in – Rate of benzene out = 0 QeCe – (Qe + Qr)Cr = 0
(6.4a)
where the subscripts e and r refer to effluent and river, respectively, and Q denotes volumetric flow rates. Substituting the given data into this equation, we obtain
River
Envelope
Plant
FIGURE 6.3 Discharge of a plant effluent into a river.
Plant Effluent
201
Phase Equilibria (150/60)1.8 ¥ 106 – [(150/60) + 23,000]Cr = 0
(6.4b)
Solving for Cr yields a downstream river concentration of Cr =
4.5 ¥ 10 6 = 195 ppb 23002.5
(6.4c)
With the allowable concentration set at 5 ppb, the required fractional removal R is given by R = 1-
5 = 0.974 195
(6.4d)
In other words, slightly more than 97% of the benzene in the plant effluent will have to be removed to meet the aforementioned standard. It is likely that an adsorption purification process using activated carbon can be used to achieve this goal. Such a process is taken up in Illustration 6.4.
6.2.3
-Solid Equilibria: The Langmuir Isotherm Fluid-
We previously, in Section 6.2.1, considered the case in which a gas is absorbed into and comes into equilibrium with a liquid solvent. This process of absorption, in which the solute gas permeates the entire body of the liquid, differs from adsorption, which is essentially a surface phenomenon. Here the solute also penetrates the porous structure of the solid, and the process is therefore initially at least akin to absorption. Ultimately, however, the solute molecules come to rest on the walls of the porous structure and remain confined there in dynamic equilibrium with the surrounding pore space. Thus, while permeation of the solid structure does take place, the solute molecules are not uniformly dispersed but rather are localized on the internal surface of the solid matrix. We show this, as well as the differences between adsorption and absorption, in Figure 6.4. There is a further distinction to be made between the two processes. A liquid has in principle an unlimited capacity for dissolving a gas, although that capacity diminishes asymptotically as gas pressure is increased (see Figure 6.2). In adsorption, the surface area available for accommodating solute molecules is limited and finite. Here an increase in pressure or solute concentration will ultimately lead to complete coverage by a “monolayer” or saturation of the surface. On reaching this state, no further adsorption can take place. This is indicated by the asymptotic saturation capacity shown by the isotherm in the phase diagram of Figure 6.5. An exception occurs when the solute gas is within reach of a state of condensation. The solute may then form multiple adsorbed layers or multilayers and ultimately fill the entire pore space by condensation (“capillary condensation”). This less
202
Mass Transfer: Principles and Applications
a.
Solute Solvent or Carrier Gas
b.
Pore
Solid Matrix
FIGURE 6.4 (a) Absorption: dispersion of solute molecules throughout a liquid solvent. (b) Adsorption: localization of solute molecules on pore walls.
frequent case leads to inflecting isotherm curves and is shown in Figure 6.6. Most fluid-solid equilibria, however, lead to monolayer coverage and are well-represented by the isotherms shown in Figure 6.5. Amount Adsorbed X
Xsat
T1 Slope = Henry's constant
T 2 > T1
Concentration C or Pressure p FIGURE 6.5 The Langmuir adsorption isotherm.
203
Phase Equilibria
One of the earliest attempts to derive a theoretical expression for these isotherms, and to date also the most successful one, is that due to Langmuir. In this derivation, Langmuir postulated that the adsorption equilibrium was the result of two rate processes, equal in magnitude but opposite in direction: The rate of adsorption, which was taken to be proportional to solute pressure or concentration and the available free surface area, and a desorption rate, which varied directly with the fractional surface coverage. The result of equating these two rate expressions can be expressed, after some manipulation, in the following form: X=
a ¢p 1 + b ¢p
(6.5a)
X=
a ¢C 1 + b ¢C
(6.5b)
or
Here a¢ and b¢ are semiempirical constants, p and C are gas partial pressure and solute concentration, respectively, and X represents the amount adsorbed. For general engineering purposes, it is often more convenient to replace p and C by a single fluid-phase concentration Y, expressed in units of kg solute/kg inert gas, or kg solute/kg solvent. Equation 6.5a and Equation 6.5b can then be coalesced into a single expression of the form X=
HY 1 + bY
(6.5c)
where a¢ and b¢ are replaced by the new empirical constants H and b. The amount adsorbed X is generally expressed in units of kg solute/kg solid, or less frequently, as mol solute/g solid. Evidently, when dealing with pure solute gases, the fluid ratio Y can no longer be used and we must revert to Expression 6.5a. The need to do this rarely arises in practice because in most practical applications the gas phase contains an inert, nonsorbable component such as air. Let us now examine the asymptotic behavior of the Langmuir isotherm: At low values of the fluid-phase concentration Y, the term bY becomes small compared to 1, and the Langmuir isotherm approaches the limiting linear form X = HY YÆ0
(6.5d)
204
Mass Transfer: Principles and Applications
The slope of this line is often referred to as Henry’s constant, and Expression 6.5d as Henry’s law for adsorption, in analogy to the corresponding case of gas-liquid equilibrium (see Equation 6.2). At the other extreme of high values of Y, bY becomes the dominant factor and the Langmuir isotherm converges to the form XYÆ0 = H/b = XSat
(6.5e)
Both these limiting cases nicely accord with the features shown in Figure 6.5. We note that high values of H correspond to high adsorbent capacities, in contrast to gas absorption where large values of Henry’s constant are associated with low solvent capacities. Adsorption Henry’s constants are central to adsorptive purification processes of dilute streams and also reach, as will be seen in the next section, into areas of environmental concern. To acquaint the reader with their magnitude, we have compiled values of H on carbon for some important trace solutes in aqueous solution, which are displayed in Table 6.4. Of note here is the extremely high value for PCBs, which dominates the table. The reader should be reminded, however, that this is partly offset by the extremely low solubility of PCBs. Although the great majority of adsorbed solutes show Langmuir-type behavior, a considerable number of substances exhibit inflecting isotherms. This is particularly the case with vapors in the vicinity of saturation. Figure 6.6, which shows moisture isotherms on a variety of adsorbents, illustrates this type of behavior. Zeolitic sorbents are the only ones among them that display Langmuir-type behavior. They are most effective at low humidities where they show a substantial uptake of water. Silica gel and activated alumina have high uptakes at higher humidities, where they exceed zeolite capacities by factors of two or more. Carbon, because of its hydrophobic nature, has only a minimum affinity for water.
TABLE 6.4 Henry’s Constants for Aqueous Solutions on Carbon at 25rr C Solute
H (kg H2O/kg C)
Methyl chloride Methylene chloride Chloroform Carbon tetrachloride n-Pentane n-Hexane Benzene Styrene Chlorobenzene PCBs (upper limit)
6.6 14 74 360 2,200 10,400 400 600 500 1.5 ¥ 108
205
Phase Equilibria .50
x. kg H2O/kg dry solid
.40 Silica Gel .30
Zeolite .20 Alumina
.10
Carbon Silica Gel
0
0 10 20 30 40 50 60 70 80 90 100 Relative Humidity, %
FIGURE 6.6 Moisture adsorption isotherms.
In what follows, we use the tabulations of Table 5.4 to explore a particular and highly useful limiting case of the adsorptive purification of an aqueous solution. Illustration 6.4: Adsorption of Benzene from Water in a Granular Carbon Bed The purification of both potable and wastewater by adsorption is a widespread practice, which in the U.S. alone consumes over 100 million kg of activated carbon a year. Typically in such an operation, the water is passed through a fixed bed of the granular adsorbent, which becomes progressively saturated with the impurities. In the course of this process, a concentration profile develops within the bed, which takes the form of an S-shaped curve ranging in level from full saturation qs to essentially zero impurity content. This profile, which is shown in Figure 6.7a, progresses steadily through the adsorber until it reaches the end of the bed. An observer stationed at this position would at this point see the first traces of impurity break through. It would then rise in level, again in the form of an S-shaped curve, until the feed concentration YF is attained. This is, however, not allowed to happen and the operation is instead terminated when the effluent concentration reaches a prescribed maximum permissible level, YP . This level and the associated concentration breakthrough curve are shown in Figure 6.7b. The
206
Mass Transfer: Principles and Applications
a. Xsat Capacity X
Equilibrium
Actual
Distance z
b. YF Concentration Y
Actual
Equilibrium
YP Time t FIGURE 6.7 Adsorption in a fixed bed: (a) adsorbent concentration profiles; (b) fluid phase concentration breakthrough curve.
operation is continued by switching the feed stream to a second clean bed, held on hand while the spent adsorbent is either regenerated or replaced by a fresh charge of the material. Adsorption in a fixed bed is a complex system to model. Concentrations evidently vary with distance, and although they ultimately attain a steady form of distribution, they also vary with time. The model would consequently consist of two mass balances, one for the fluid phase and a second for the solid phase, and both of these would be partial differential equations in time and distance, which generally have to be solved numerically. To avoid this complication, a procedure has come into use in which mass transfer resistance is neglected and the two phases are everywhere assumed to be in equilibrium. The concentration then propagates in the shape of a rectangular front, shown in Figure 6.7 and denoted “Equilibrium.” The
207
Phase Equilibria
movement of this front and its dependence on flow rate and feed concentration can be analyzed by means of a simple cumulative mass balance, which takes the following form: YFvrf ACt = Amount introduced to time t
XFrb ACz Amount retained by adsorbent
+
YFrf ACz Amount left in fluid
(6.6)
Here v and AC are the fluid velocity and cross-sectional area of the bed, respectively, and rf and rb are the fluid and bed densities. The last term in this equation is generally negligible because the bulk of the impurity will reside in the adsorbent. It would otherwise not be a very efficient adsorbent. Equation 6.7a can then be recast in the form z/t =
rf v rb H
(6.7a)
where we have substituted Henry’s constant for the concentration ratio XF/ YF . Equation 6.7a can be used to calculate the time t it takes the front to reach a particular position or, conversely, the position attained after a prescribed time interval. These quantities are, by necessity, limiting lower values because full saturation will in fact be retarded by the mass transfer resistance. However, in many instances the fluid flow is sufficiently slow that local equilibrium is attained, or will be nearly attained, during the interval of contact. We make use of this fact in Illustration 6.6 to analyze the contamination of soil that results from polluted groundwater. This illustration addresses the problem of sizing a carbon bed to be used in the purification of a plant effluent. Our purpose here is best served by recasting Equation 6.7a in a form suitable for the calculation of bed requirements. This is done by first cross-multiplying the expression and then dividing and multiplying by the cross-sectional area AC. We obtain AC zrb (Wb )Min (Wb )Min 1 = = = AC vr f t G¥t vr f t H
(6.7b)
Minimum bed weight 1 = Weight of fluid treated H
(6.7c)
or equivalently
Thus, the larger the Henry constant H, the smaller the required bed size. Note, however, that this is a minimum requirement, since we have assumed the phases to be in equilibrium.
208
Mass Transfer: Principles and Applications
Let us see how this works out in practice. We refer to the preceding example of an aqueous plant effluent saturated with benzene, 97% of which has to be removed before being discharged. The rate of discharge was 150 l/min. Suppose that we wish to size a bed of granular carbon, which will stay on-stream for 6 months before breakthrough occurs. The amount of effluent treated in this period comes to G ¥ t = 150 ¥ 60 ¥ 24 ¥ 180 = 3.9 ¥ 107 kg
(6.7d)
Using H = 400 for benzene, listed in Table 6.4, we obtain from Equation 6.7d (Wb)Min = G ¥ t/H = 3.9 ¥ 107/400 = 9.8 ¥ 104 kg carbon
(6.7e)
Now, the bed density rb for granular activated carbon is, typically, of the order 500 kg/m3. If, therefore, a bed 3 m in diameter d is chosen, the packed height h of that bed is given by h=
(Wb )Min 9.8 ¥ 10 4 = = 28 m ( pd 2 / 4) ¥ rb ( p 32 / 4) ¥ 500
(6.7f)
Since adsorbent beds typically range up to 10 m in height, this figure is excessive. We therefore reduce the time on-stream to 1 month and arrive at the more reasonable bed height of approximately 4.5 m. This allows some slack for actual bed requirements, which will be somewhat higher because of the neglected mass transfer resistance.
Illustration 6.5: Adsorption of a Pollutant from Groundwater onto Soil Soils show a considerable sorptive affinity for pollutants that is principally brought about by the soil’s carbon content (a result of decaying organic matter). That content typically ranges from 1 to 2% of the total mass. Adsorptive capacities per unit weight are consequently some 50 times lower than the carbon values shown in Table 6.4, and this figure was used to compose the Table 6.5 listing of Henry’s constants for soils. We consider here again an effluent saturated with benzene and assume that seepage into the groundwater has occurred. The task will be to calculate the stretch of soil that will have been contaminated after 10 days of exposure. Groundwater velocity is set at 1 mm/s and soil density at 2500 kg/m3. Using a Henry’s constant of 0.54 given in Table 6.5, we obtain from Equation 6.7a z/t =
r f v 1000 10 -3 = = 7.54 ¥ 10 -4 m / s rb H 2500 0.54
209
Phase Equilibria TABLE 6.5 Henry’s Constants for Aqueous Solutions on Soil at 25rr C Solute
H (kg water/kg soil)
Methyl chloride Methylene chloride Chloroform Carbon tetrachloride n-Pentane n-Hexane Benzene Styrene Chlorobenzene PCBs, upper limit
0.033 0.071 0.37 1.8 11 52 0.54 3.0 2.5 7.3 ¥ 105
and consequently z = 7.4 ¥ 10– 4 t = 7.4 ¥ 10– 4 ¥ 3600 ¥ 24 ¥ 10 z = 640 m Comments: The reader is reminded that the results obtained in both Illustration 6.4 and Illustration 6.5 represent minimum values, i.e., minimum carbon bed requirements and minimum penetration into the soil. Because of the mass transfer resistance, the concentrations on the percolating fluid run ahead of the rectangular front shown in Figure 6.6a, and penetrate deeper into the solid matrix than predicted. The corrections that must be applied often amount to no more than 20 to 30% of the ideal length, which is therefore a highly useful engineering estimate for the situation at hand. Higher corrections are needed in cases involving large particles or high fluid velocity. Note that the rigorous PDE model would require, in addition to equilibrium data, the relevant transport parameter, i.e., the mass transfer coefficients within both the solid particle and the liquid. The solid-phase coefficient, in particular, requires fairly elaborate measurements and is usually unavailable to the general practitioner.
6.2.4
Liquid–Liquid Equilibria: The Triangular Phase Diagram
Liquid-liquid equilibria deserve our attention principally because of their widespread occurrence in industrial- and laboratory-scale extraction processes. They also play a role in assessing the effect of accidental spills of oil and organic solvents in lake and ocean waters. On the industrial scene, the most prominent applications both in scale and number are seen in the petroleum industry. Liquid extraction is used here
210
Mass Transfer: Principles and Applications
to separate petroleum fractions selectively and to purify or otherwise refine them. In the Edeleanu process, which is close to a century old, liquid sulfur dioxide is used to extract aromatics from various feedstocks. The removal of the ever-present sulfur compounds is accomplished by extraction with sodium hydroxide solutions. In addition, a wide range of organic solvents is used in the purification and refining of various lubricants. Considerable use of liquid extraction is also made in the metallurgical industry for the separation and refining of metals, and in the food industry for the extraction of oils and fats and other edible products. The pharmaceutical industry uses liquid extraction to recover their end products, such as penicillin, from the reaction mixture. In general, whenever dealing with heat-sensitive materials, extraction at low temperatures is often the process of choice. A number of the traditional solvents used in these processes, such as the chlorinated and fluorinated hydrocarbons, have in the last two decades come under increasing scrutiny and criticism because of health and environmental concerns. The effect of certain of these solvents on the ozone layer has received a good deal of publicity, as has their role as potential carcinogens. This has opened the door to the development of alternative processes, chief among them supercritical fluid extraction. We address this topic in some detail in Section 6.2.5. Liquid-liquid equilibria differ from the previous cases we have considered in that the two phases will, with an appropriate shift in the relative concentrations of the three components, merge into a single homogeneous phase. Consider, for example, the two “immiscible” solvents, benzene and water, to which the solute ethanol is added. Initially, at low solute concentrations, two distinct phases are maintained, with ethanol distributed between them in certain concentration ratios. As the ethanol content is increased, the two solvents begin to show greater mutual solubility. This trend continues until ultimately, at sufficiently high ethanol concentrations, the two phases coalesce into a single homogeneous phase. To obtain a valid representation of the entire domain of liquid-liquid phase behavior, it is necessary to take account of the concentrations of all three components. This is done by using the trilinear coordinate system, which leads to a construction known as a triangular diagram, shown in Figure 6.8. Each side of this diagram is scaled from 0 to 100%. The apexes of the triangle represent the pure components A, B, and C, respectively. C is usually taken to be the solute, and A and B represent the two mutually immiscible solvents. Any point on the side of the triangle denotes a two-component (binary) mixture, while the interior of the diagram represents the full complement of three-component (ternary) mixtures. Thus, the point G on the side AB represents 40% solute C and 60% solvent B, while the interior point M signifies a mixture containing 30% A, 40% B, and 40% C. Compositions are usually expressed as weight percent, or, less frequently, as mole percent. Liquid-liquid equilibria are determined experimentally by equilibrating the two phases having a total concentration M (Figure 6.9) and recording their compositions. These values are entered in the diagram and form the
211
Phase Equilibria
100
C
0
80 60
20 40
40% B E
40
%
20
A
60
M F
0 100
80
40% C
H
20 D
60
80
40
20
0
A
100
B
FIGURE 6.8 The triangular diagram.
Plait Point
C
Tie-Line
Solubility Curve P L M N
A
D
E
B
FIGURE 6.9 Representation of liquid-liquid equilibrium in trilinear coordinates.
end points of what is termed a tie-line, shown in Figure 6.9. There is in principle an infinite set of such tie-lines, only a few of which appear in the diagram. They are ordinarily not parallel and change their slope slowly with changing composition. As more solute C is added to such a mixture, the mutual solubility of the two solvents A and B increases until the tie-line end points merge at the point P, known as the plait point. The line connecting all these points and passing through P is known as the binodal or solubility curve and encloses all mixtures showing two-phase behavior. Compositions lying outside this solubility curve represent homogeneous, single liquid-phase solutions, while the end points D and E denote the mutual solubility of the two solvents. When these are completely immiscible, D and E coincide with the two apexes A and B.
212
Mass Transfer: Principles and Applications
Representation of liquid-liquid equilibria in ternary diagrams is widely used in the graphical solution of extraction problems. This topic is taken up and discussed in considerable detail in the next chapter. Occasions arise, however, when it becomes convenient to use an alternative representation in rectangular coordinates, known as a distribution curve. This diagram, shown in Figure 6.10, consists of a plot of the solute weight fraction in the two phases against each other. Its construction is accomplished by transferring the compositions represented by the tie-line end points to rectangular coordinate axes, as shown in Figure 6.10. Clearly, this type of representation provides only a limited picture of the entire domain of compositions. Neither of the two solvent weight fractions, for example, can be deduced. Various other constructional features of the triangular diagram, which will be taken up below, likewise cannot be translated into rectangular coordinates. The distribution diagram does, however, convey several key features of two-phase behavior. It shows the maximum solute concentration (xCB)Max beyond which no phase separation can take place, and it locates the plait point on the 45r diagonal, which denotes equality of phase concentrations. Compositions that lie above the diagonal are richer in solute content than those of the companion phase, while points below it denote a depletion in solute. The greater the distance from the diagonal, the greater the degree of enrichment or depletion. By noting these features we gain an immediate sense of the potential of a particular system for extractive enrichment. To quantify these properties, it is useful to define a quantity known as the distribution coefficient m, which equals the solute mole-fraction ratio in the two phases and is given by m=
xCB xCA
(6.8)
C
a.
b.
Slope m
xCB
M
M
P
E
E
R 45
R
A
P
B
xCA
FIGURE 6.10 Translation from trilinear to rectangular coordinates: (a) triangular diagram; (b) distribution curve.
213
Phase Equilibria
Values of m greater than unity denote solute enrichment in the B layer, and those less than unity denote enrichment in the solvent A. In the limit of low concentration, or infinite dilution of the B layer, the distribution curve becomes linear and the distribution coefficient itself attains a maximum value. This limiting coefficient, shown in Figure 6.10b, is akin to the Henry’s constants, which we have seen in gas-liquid and fluid-solid equilibria, and is sometimes denoted as such. An indication of its magnitude may be obtained from the low-concentration distribution coefficients listed in Table 6.6 for a number of systems comprising aqueous and organic solutions. Illustration 6.6: The Mixture or Lever Rule in the Triangular Diagram With this example, we wish to draw the reader’s attention to certain simple geometric constructions, which can be carried out in a triangular diagram to obtain important information in easy and rapid fashion. One such construction, sketched in Figure 6.11, leads to what is known as the mixture rule, or lever rule, for ternary liquid systems. Briefly stated, the rule asserts that the composition that results when two liquid solutions are mixed lies on a straight line connecting their compositions. Thus, if R kg of a mixture represented by point R is combined with E kg of a solution located at point E, the resulting composition F will lie on a straight line connecting points R and E. Furthermore, the location of F will be such that the line segments it defines stand in the ratio of the weights of the parent solutions, i.e., R EF = E RF
(6.8a)
TABLE 6.6 Low-Concentration Solute Distributions in Water–Organic Solvent Systems (25rr C) Mole% Solute Acetic acid
Acetone Methanol Ethanol
Solvent
Aqueous Phase
Carbon tetrachloride Hexane Toluene Chloroform Diethyl ether Benzene Toluene Chloroform Diethyl ether Toluene Hexane Benzene
5.088 14.810 7.850 16.07 1.519 4.067 5.945 4.187 1.382 4.621 30.11 0.994
Organic Phase 0.916 1.614 2.440 0.959 5.446 0.798 0.286 1.784 2.422 0.398 1.297 1.177
Distribution Coefficient 5.56 9.18 3.22 16.76 0.279 5.10 20.79 2.35 0.571 11.61 23.22 0.845
214
Mass Transfer: Principles and Applications
C
E F P
R
A
S
M
N
L K
B
FIGURE 6.11 The mixture rule in a triangular diagram.
We now proceed to present a proof of these statements. This is done by composing total and component mass balances for the mixtures and relating the resulting compositional changes to the line segments of Figure 6.11. Thus, for the total mass balance R+E=F
(6.8b)
where F = mass of final mixture, and for the component mass balance RxCB + ExCE = FxCF
(6.8c)
Eliminating F from these equations yields E xCF - xCD = R xCE - xCF
(6.8d)
where xCF will be located somewhere on the straight line connecting E and R. We now show that its location is such that it subdivides the line in the ratio given by Equation 6.8a. From the diagram it follows that xCF = FN , xCD = RM , xCE = EK
(6.8e)
E xCF - xCD SL RF = = = R xCE - xCF ES EF
(6.8f)
and consequently
Phase Equilibria
215
where the last equality follows from the similarity of the two triangles FPR and ESF. The proof is thus complete. Note that the closer the parent mixture F is to E, the more R is formed, and vice versa. Comments: It is seen from this discussion that the mixture or lever rule can be expressed both algebraically and in geometrical form. The algebraic version, given by Equation 6.8d, is the preferred tool for numerical calculation, while the geometrical construction of Figure 6.11 serves to provide a quick visual estimate of the quantities involved. Thus, if F lies midway between R and E, the two parent solutions will be equal in weight, and vice versa. It also follows that if an amount E with a composition located at the point E of Figure 6.11 is removed from the mixture, the point R representing the residue will lie on a straight line EF extended through F, and the above relationship (Equation 6.8f) will apply. The lever rule finds its most notable application in the use of tie-lines to establish the compositions and relative proportions of the two solvent layers in an extraction process. Suppose, for example, that two liquid solutions with overall composition represented by M in Figure 6.9 are contacted and allowed to settle into a two-phase equilibrium. The compositions will then be given by the tie-line end points L and N, and the relative amounts of L and N will be in the ratio MN / ML . Here again the geometrical construction serves to convey a quick visual notion of the events, which can then be followed up by actual algebraic calculations.
6.2.5
Equilibria Involving a Supercritical Fluid
In Section 6.1 we have drawn the reader’s attention to the existence of a threshold temperature known as the critical temperature, above which a pure substance can exist only as a single phase. That phase possesses characteristics of a dual nature: It behaves, on the one hand, like a dense gas that does, however, still have a sufficiently open structure to allow rapid passage of solute molecules by diffusion. The relatively short distance between neighboring molecules, on the other hand, allows it to attract and hold substantial amounts of solute material, thus acting for practical purposes as an efficient solvent. These dual features have led to the use of supercritical fluids (SCF) as solvents in a process known as supercritical fluid extraction (SCE). Its advantages over conventional liquid extraction are twofold: It shortens the required contact time because of the higher prevailing diffusivities, and it replaces costly and potentially harmful liquid solvents with inexpensive and benign gases such as carbon dioxide and the lower hydrocarbons. A number of commercial processes have been developed that make use of this new technology, and there is an ongoing intensive quest for new applications. To acquaint the reader with the key features of SCE, we display the supercritical region of interest (Figure 6.12) and a map of diffusivities in liquids
216
Mass Transfer: Principles and Applications
Pressure
Supercritical Fluid Region
Solid
Liquid
Gas
Temperature FIGURE 6.12 Temperature-pressure diagram for a pure substance and the region of SCE.
and supercritical carbon dioxide (Figure 6.13), which clearly shows the superior transport properties of the latter. The increased extraction power of carbon dioxide with temperature and pressure becomes evident in Figure 6.14. We note in particular that doubling the pressure from 70 bar (~70 atm) to 150 bar at temperatures slightly above critical increases the solute concentration in the extracting medium by well over an order of magnitude. The earliest indication of this property of SCF is to be found in the work of J.B. Hannay and J. Hogarth (1879), who reported that an increase in pressure of supercritical ethanol caused increased dissolution of certain inorganic salts such as potassium iodide, while conversely a relaxation in pressure resulted in the precipitation of the salts as “a white snow.” This early work was followed intermittently by a flurry of activity that intensified during the 1970s and 1980s, partly as a result of environmental concerns over the use of conventional solvents. Major commercial processes currently in use are the SCE of caffeine from coffee and tea, the SCE of spice aromas, and the fractionation and purification of polymers. Processes under investigation include the treatment of wastewaters, activated carbon regeneration, and the SCE of edible oils and therapeutic agents from plant materials. The scale of decaffeination processes is indicated by the extraction vessel shown in Figure 6.15, which measures about 2 m in diameter and 20 m in height. The operation is countercurrent, with CO2 passing upward and coffee discharged intermittently at the rate of about 5000 kg/h. Operating pressure is typically in the vicinity of 300 atm.
217
Phase Equilibria
10–2 Pressure (bar)
70 80 90
Diffusivity (cm2/s)
10–3
150
Saturated Vapor Critical Point Saturated Liquid
200
10–4
Typical Diffusivities of Solutes in Normal Liquids
10–5
0
20
40 60 80 Temperature (r C)
100
FIGURE 6.13 Comparison of diffusivities in supercritical carbon dioxide and normal liquids. (From McHugh, M. and Krukonis, V. Supercritical Fluid Extraction, 2nd ed., Butterworth-Heinemann, Boston, 1994. With permission.)
300
10.0 Concentration (Wt%)
150 120
1.0
Saturated Liquid
100 90
Critical Point 80
0.1
0.0
Saturated Vapor
0
10
70 bar
20 30 40 Temperature (r C)
50
60
FIGURE 6.14 Solubility of naphthalene in supercritical carbon dioxide. (From McHugh, M. and Krukonis, V. Supercritical Fluid Extraction, 2nd ed., Butterworth-Heinemann, Boston, 1994. With permission.)
218
Mass Transfer: Principles and Applications
FIGURE 6.15 Extraction vessel used in the Maxwell House® Coffee Company supercritical CO2 decaffeination plant in Houston, Texas. (From McHugh, M. and Krukonis, V. Supercritical Fluid Extraction, 2nd ed., Butterworth-Heinemann, Boston, 1994. With permission.)
Illustration 6.7: Decaffeination in a Single-Equilibrium Stage To gain an idea of the CO2 requirements in decaffeination, we consider a hypothetical process in which the carbon dioxide is circulated through the extraction vessel until it is in equilibrium with its charge of coffee. We term this contact an equilibrium stage, a concept that is discussed more fully in Chapter 7. The equilibrium distribution of caffeine under a particular set of conditions is shown in the log-log plot of Figure 6.16. The fitting of the data leads to the expression x = 1.24y 0.316
(6.9a)
where x and y are the weight percentages of caffeine in the coffee and the carbon dioxide. Suppose the requirement is to reduce the caffeine content from 1 to 0.05%, which is typical of commercial decaffeination processes. The task is to calculate the ratio G/S kg CO2/kg coffee required to achieve this reduction.
219
Caffeine Content in Coffee (Wt%), x
Phase Equilibria
0.7 0.5 0.3
0.1 0.001
0.005
0.01
0.02
0.05
Caffeine Content in CO2 (Wt%), y
FIGURE 6.16 Caffeine equilibrium distribution at 60˚C, 272 atm. (From McHugh, M. and Krukonis, V. Supercritical Fluid Extraction, 2nd ed., Butterworth-Heinemann, Boston, 1994. With permission.)
The carbon dioxide is assumed to be devoid of caffeine initially. The equilibrium content in the gas at the end of the operation is given by 1 0.051/ 0.36 1.24
(6.9b)
y* = 1.96 ¥ 10 -4%
(6.9c)
y* =
A caffeine mass balance for the process leads to the expression Rate of caffeine in – Rate of caffeine out = 0 S ¥ 0.01 – (Gy* + S ¥ 0.005) = 0
(6.10a)
and consequently G 0.0095 = S 1.96 ¥ 10 -4
(6.10b)
G = 45.9 kg CO2 / kg coffee S
(6.10c)
220
Mass Transfer: Principles and Applications
Comments: This is clearly an inordinate amount of CO2 required, brought about by what appears to be a rather unfavorable distribution of caffeine between the extracting gas and the coffee. That seeming drawback can be overcome by “staging” the extraction process, i.e., providing a continuous contact between the two phases as is done in commercial countercurrent operations. This type of operation is taken up in Illustration 8.4. It is shown there that the gas requirements can be considerably reduced by adopting this type of contact, a fact that has been a major contributor to the commercial success of the process.
6.2.6
Equilibria in Biology and the Environment: Partitioning of a Solute between Compartments
In biology and the environment, the equilibria of interest are those of a substance distributed or “partitioned” among the major compartments of the system. In biology we usually seek to establish the distribution of a substance between the circulating blood and the separate compartments of fat or lipids, muscle and bone. The substances in question can be toxic or benign (e.g., a drug). In the environment, the major compartments of interest are air, water, and soil, and the solute involved is usually toxic or objectionable. An interesting confluence of biology and the environment occurs in the exposure of animals to toxic chemicals contained in the air or in water. The question then becomes one of establishing equilibrium concentrations between environmental and body compartments. In fish, for example, the usual aim is to determine the distribution of the solute between water and animal fat. A description of this case is given in Illustration 6.8. The equilibrium concentrations between various compartments are usually taken to be in a constant ratio termed the partition coefficient K. Thus, for a substance distributed between blood and muscle, we have CB = K BM CM
(6.11a)
CB = KBMCM
(6.11b)
or
The relation is, in other words, a linear one, and the partition coefficient can be viewed as the equivalent of a Henry’s constant, relating the two concentrations in question. These concentrations represent hypothetical maximum levels, which may appear briefly during the initial period of exposure. Thereafter, metabolic processes and excretion intervene to reduce the concentrations to new steady-state values. These can still be substantial, as was shown in Illustration 5.7.
221
Phase Equilibria
Illustration 6.8: The Octanol-Water Partition Coefficient In environmental work, extensive use is made of a special K value, the octanol-water partition coefficient. It describes the distribution of a solute between octanol and water; i.e., it is defined by KOW =
Co Cw
(6.11c)
where KOW is in units of m3 water/m3 octanol. Octanol, or more properly 1-octanol, was chosen as a correlating substance because its carbon-to-oxygen ratio is similiar to that of lipids and, in general, mimics the dissolution of solutes in organic matter. KOC is also a direct measure of hydrophobicity, i.e., the tendency of a chemical to partition out of water, and is consequently an inverse measure of the solubility of a substance in water. The higher the KOC, the greater the effect of a chemical on an animal. A short list of KOC values for various substances appears in Table 6.7. The following serves as an example of the application of octanol-water partition coefficients: Suppose it is desired to estimate the effect on fish of the pesticide DDT dissolved in water. The lipid content of most fish clusters about a value of 4.8%. We can then define a fish-water partition coefficient KFW and relate it to KOC as follows: KFW = 0.048KOW
(6.12a)
This relation expresses the assumption that a fish is composed of 4.8% by volume octanol. Using the value for DDT listed in Table 6.7, we obtain
K FW =
CF = 0.0048 ¥ 1.6 ¥ 10 6 = 7.7 ¥ 10 4 CW
TABLE 6.7 -Water Partition Coefficients for Various Substances OctanolSolute n-Hexane Benzene Styrene Chloroform Carbon tetrachloride Chlorobenzene DDT Range of PCBs
KOC (m3/m3) 13,000 135 760 93 440 630 1.6 ¥ 106 104 to 108
(6.12b)
222
Mass Transfer: Principles and Applications
i.e., an almost 100,000-fold increase in concentration over that in the surrounding water. Since DDT solubility in water is 1.2 ¥ 10– 3 mg/l, the concentration in the fish rises to 7.7 ¥ 104 ¥ 1.2 ¥ 10– 3 = 92 mg/l, or approximately 1/10 g in a fish of 1-l volume. The reader is reminded that this is the maximum attainable in the absence of metabolic degradation. The steady-state bioconcentration factors (BCF), some examples of which appeared in Table 5.9, are considerably lower but still sufficiently high to cause concern.
6.3 6.3.1
Multicomponent Equilibria: Distribution of Several Components The Phase Rule
The reader will have noted that in the equilibria considered so far, temperature was assumed to be constant or fixed. The wider question of how many such variables have to be prescribed to define a particular state of equilibrium was not addressed. It was tacitly assumed that, once a temperature and the concentration or pressure in one phase was chosen, a unique composition in the second phase was automatically assured. This approach worked without difficulty in the simple equilibria we have considered so far, but becomes somewhat tenuous when more complex systems are to be dealt with. What is required here is a formalism that will tell us exactly how many variables have to be fixed to assure a unique state of equilibrium. That formalism is provided by the Gibbsian phase rule, which states that the number of variables F to be prescribed equals the difference of the number of components and phases C – P, plus 2. Thus, F=C–P+2
(6.13a)
F, which is also referred to as the degrees of freedom of the system, is a measure of the latitude we have in arbitrarily assigning values to the independent variables of the system. Let us see how this rule is applied in practice. Illustration 6.9: Application of the Phase Rule We start by examining several simple equilibria, which have been dealt with previously. 1. Pure Component Vapor-Liquid Equilibrium Here the phases number 2 and the components 1. Hence
223
Phase Equilibria F=C–P+2=1–2+2=1
(6.13b)
and we are allowed only one degree of freedom. Thus, if we choose for water a temperature of 100r C, a corresponding unique pressure of 101.3 kPa results, which is set by the system itself. Note that in the supercritical region only one phase exists and as a consequence arbitrary values can be assigned to both T and P. 2. The Triple Point Systems at the triple point contain three phases, solid, liquid, and vapor, all in equilibrium with one another. Consequently, F=C–P+2=1–3+2=0
(6.13c)
and the degrees of freedom vanish. Thus, we cannot, for example, prescribe a triple-point temperature and expect the system to respond with a particular triple-point equilibrium pressure. The system itself sets the values of both T and P, neither of which is controlled or set by the observer. 3. Binary Vapor-Liquid Equilibria Consider next a two-component liquid solution that is in equilibrium with its vapor. Here we have F=C–P+2=2–2+2=2
(6.13d)
Thus, we can fix, for example, temperature and the vapor composition, and expect the system to set its own values of liquid composition as well as total pressure. If, on the other hand, we choose to prescribe pressure and vapor composition, the system will respond with a particular temperature, i.e., its boiling point, as well as a particular liquid composition. A third possibility is to fix both temperature and total pressure, in which case the system will set its own values of both liquid and vapor composition. All three cases are encountered in practice, and are expressed in terms of appropriate phase diagrams, which are taken up below.
6.3.2
-Liquid Equilibria Binary Vapor-
In the phase equilibria considered so far, the principal focus has rested on the distribution of a single key component, usually referred to as the solute, between the constituent phases. Thus, in the gas-liquid and liquidsolid equilibria taken up in Sections 6.2.1 and 6.2.2, our concern was with only one of the components present, while the remaining bulk components, such as liquid solvent or solid adsorbent, were left out of consideration.
224
Mass Transfer: Principles and Applications
In vapor-liquid equilibria, all components participate in some measure in determining equilibrium behavior. No single substance dominates the picture, and none is relegated to the status of a passive constituent. Although these considerations apply to multicomponent vapor-liquid equilibria, our discussions here are confined for illustrative purposes to binary systems. These systems possess, as shown in Illustration 6.9, two degrees of freedom, and this fact has led to the development of several distinct phase diagrams. In these diagrams, which are discussed in detail below, either temperature or pressure have prescribed constant values, along with one of the phase compositions. Once these two variables are fixed, the system is uniquely defined and all other variables fall into place. The graphical representations that result all have their own distinct features, which are exploited in different ways to suit the needs of the user.
6.3.2.1 Phase Diagrams The principal phase diagrams used to describe binary vapor-liquid equilibria are three in number. In the first of these, total pressure and one of the compositions are the prescribed variables. This leads to the boiling-point diagram, shown in Figure 6.17a, and the compositional x–y diagram that appears in Figure 6.17c. When total pressure is replaced by temperature as the prescribed variable, a third type of diagram results: the vapor-pressure diagram, shown in Figure 6.17b. The boiling-point diagram of Figure 6.17a provides the best global representation of binary vapor-liquid equilibria. It consists of a plot of temperature against both the vapor and liquid compositions, expressed as mole fractions. The lens-shaped domain encompasses the two-phase region, while the spaces above and below the lens denote single-phase vapor and liquid behavior, respectively. Consider first a point P below the lens. This point lies entirely in the liquid region. The system is below the boiling point corresponding to the prescribed total pressure PT and the vapor phase is completely absent. If we next move up the vertical axis PQ, i.e., raise the temperature, a point A is eventually reached where the first bubble of vapor is formed. That point, which lies on the bubble-point curve, is in equilibrium with a vapor of composition A¢, which is richer in the component A than the bulk composition of the parent liquid. As more of the mixture is vaporized, more vapor forms at the expense of liquid, giving rise, for example, to the liquid composition corresponding to the point K and a vapor composition denoted by L. The line connecting K and L, and similar horizontal lines connecting points on the two curves, are termed tie-lines. They play the same role as the tie-lines we have seen in liquid-liquid equilibria and obey the lever rule we have derived in Illustration 6.6. Thus, the moles vapor V and the moles liquid L present in the twophase mixture stand in the ratio of the corresponding line segments; i.e., we have
225
Phase Equilibria
PT = Constant Vapor
a.
B.P. of B
B'
B K
Temperature T
Q
Dew Points yAvs. T
O
L
A
A' P
Liquid 0
B.P. of A
Bubble Points xAvs. T
Mole Fraction of xA, yA
1.0
T = Constant
b.
POA
PT vs. xA
Pressure POB
pA vs. xA
pB vs. xA Liquid 0
1.0
Mole Fraction xA
1.0 A'
c.
L yA = xA
Mole Fraction yA B'
PT = constant
0
B
K A Mole Fraction xA
1.0
FIGURE 6.17 Binary vapor-liquid equilibria of ideal systems: (a) boiling-point diagram; (b) vapor-pressure diagram; (c) x–y diagram.
226
Mass Transfer: Principles and Applications
V LO = L KO
(6.14)
Continuing our path along the PQ axis, a point B is eventually reached where the last drop of liquid is vaporized. Further increases in temperature result in superheated vapor. If the process is now reversed, i.e., the vapor mixture is cooled, all the phenomena reappear in reverse order. Condensation, for example, starts at point B, yielding the first drop of liquid “dew.” The upper curve of the lens where this occurs is consequently termed the dew-point curve. The reader will note the similarity of this diagram to the melting-point diagram for liquid-solid systems shown in Figure 2.9a. When temperature replaces total pressure as one of the prescribed variables, the result is the vapor-pressure diagram, examples of which are shown in Figure 6.17b and again in Figure 6.20b (see Section 6.3.3). The plot here is one of vapor pressure at constant T against one of the liquid mole fractions. Both the component partial pressures pA and pB and the total pressure PT are plotted and result in straight lines or curves, depending on whether the system is ideal or nonideal. Ideal behavior, and deviations from it, are taken up in greater detail in the next section. A third type of plot, the x–y diagram, is shown in Figure 6.17c as well as in Figure 6.20c (see Section 6.3.3). The plotted quantities here are the vapor and liquid mole fractions of a particular component, while total pressure is held constant at a prescribed level. These diagrams play a dominant role in the analysis of distillation processes and will be encountered in considerable numbers in the succeeding chapters. 6.3.2.2 Ideal Solutions and Raoult’s Law: Deviation from Ideality The prediction and, failing that, the correlation of vapor-liquid equilibria are topics of considerable practical interest. In particular, we wish to address the following question: Given a prescribed liquid composition and certain standard physical properties of a system, is it possible to predict the corresponding vapor composition? Evidently, if this could be done, an immense amount of experimentation could be dispensed with. It turns out that this is accomplished most easily if the system shows what is termed ideal behavior. Such ideal systems, although relatively rare in practice, serve as a convenient reference for vapor-liquid equilibria in general. This is reminiscent of the concept of an ideal gas, which provides a similar yardstick against which the behavior of gases in general can be measured. These two cases, although similar in the approach used, differ in some important aspects. For ideal gases, a total absence of intermolecular forces is assumed. Neither attractive nor repulsive forces are taken into account and collisions between molecules are taken to be entirely elastic in nature. These assumptions hold well at low pressures because of the large distances between particles and the vanishingly short time they spend in collision with each other. In liquids, the molecules are closely packed and in constant intimate contact with each
227
Phase Equilibria
other. To neglect intermolecular forces in this instance would be grossly unrealistic. What is done instead is to accept their existence and to assume that they are uniformly constant and independent of concentration. Thus, if in a binary solution a molecule A is replaced by a molecule B, the interaction between neighboring particles remains the same. This will clearly be the case only if the two species are similar in chemical structure and in size. The important consequence of this assumption is that the partial vapor pressure of a particular component is unaffected by the presence of other species and is subject only to its own molar concentration. Thus, if the mole fraction xA is doubled, the partial pressure pA of the component is similarly doubled. Continuing this process, a linear increase of partial pressure with mole fraction results until ultimately, at xA = 1, the partial pressure equals the full pure component vapor pressure PAo of the species. We can consequently write pA = xAPAo
(6.15a)
where the product xAPAo expresses both the linear increase in partial pressure with mole fraction and the ultimate attainment of the full vapor pressure PAo. This expression is known as Raoult’s law, and systems obeying it are said to be ideal solutions. Several important subsidiary laws flow from this relation. In the first instance, we can extend Raoult’s law to the second component of the binary mixture and obtain pB = xBPBo = (1 – xA)PBo
(6.15b)
Adding the two expressions then yields pA + pB = PT = xAPAo + (1 – xA)PBo
(6.15c)
where PT is the total pressure. All three of these expressions yield straight line plots of vapor pressure vs. liquid mole fraction, which are displayed in Figure 6.17b. Systems that obey these relations, i.e., ideal solutions, are relatively uncommon and are usually confined to neighboring substances taken from a homologous series, and to isomer and isotope mixtures. We address these in the context of the so-called separation factor of the system, which is taken up in a subsequent section. Deviations from ideal behavior occur when there is a marked difference in the molecular structure of the participating species. Typical combinations that give rise to nonideal behavior are pairs of polar and nonpolar substances, in which the attractive and repulsive forces vary with compositional changes. When repulsive forces predominate, the vapor pressures rise above the values predicted by ideal solution theory and we speak of positive deviations. Most vapor-liquid equilibria fall in this category. A predominance of
228
Mass Transfer: Principles and Applications
attractive forces, on the other hand, leads to a lowering of the vapor pressure, which is termed a negative deviation. The resulting nonideal vapor-pressure diagrams are displayed in Figure 6.18. We note two interesting limiting cases that arise in systems with both positive and negative deviations: For low concentrations of a particular component, its partial pressure becomes linear in the mole fraction of the solution in question. This, in essence, is a Henry’s-law-type relation; i.e., we can write
(pA )x Æ0 = H A xA
(6.16a)
A
a.
PAO
PT vs. xA
Raoult's Law
Pressure PBO
pA vs. xA
Henry's Law
pB vs. xA
0
1.0 Mole Fraction xA
PAO
b.
Raoult's Law
PT vs. xA
Pressure PBO
pA vs. xA
Henry's Law
pB vs. xA
0
1.0 Mole Fraction xA
FIGURE 6.18 Vapor pressure diagrams for nonideal systems: (a) positive deviations from ideality; (b) negative deviations.
229
Phase Equilibria and
(pB )x Æ0 = H B xB B
(6.16b)
where HA and HB are the Henry’s law constants for the two components in question. If, on the other hand, the mole fractions are allowed to tend to unity, the partial pressure will, in the limit, approach the values given by Raoult’s law. We have in this case
(pA )x Æ1 = xA PA o
(6.16c)
(pB )x Æ1 = xB PB o
(6.16d)
A
and
B
These two cases, which have been entered in the diagrams of Figure 6.18, provide useful approximations in the limit of low-solute concentrations or high-solvent content. 6.3.2.3 Activity Coefficients The reader will recall that deviations from ideal gas behavior are often expressed in terms of a correction factor referred to as a compressibility factor z; i.e., we write PV = z(Pr, Tr)RT
(6.17)
where Pr and Tr are the so-called reduced pressure and temperature, defined as the ratios of P and T to their critical counterparts PC and TC. In much the same way we can define correction factors g, termed activity coefficients, which describe deviations from Raoult’s law for ideal solutions. The resulting expression, sometimes referred to as extended Raoult’s law, has the form pA = gA(xA)xAoPAo
(6.18a)
pB = gB(xB)xBPBo
(6.18b)
and
where the correction factors are now functions of the binary mole fraction x. That functional relationship, expressed in the form of plots of ln g vs. xA,
230
Mass Transfer: Principles and Applications
Henry's Law
Henry's Law
ln g
gA
gB
Raoult's Law
Raoult's Law 0 0
xA
1
FIGURE 6.19 Activity coefficient for systems with positive deviations.
is shown in Figure 6.19. Note that in the limit of high-solvent content, ln g approaches zero, i.e., g Æ 1. At the same time, Equation 6.18a and Equation 6.18b revert to Raoult’s law. At the other end of the spectrum, i.e., at lowsolute content, the activity coefficients tend to constant limiting values and Henry’s law results, where H = g po. It is evidently of considerable interest to be able to predict activity coefficients without resorting to experimentation, and immense strides have in fact been made in recent decades to accomplish this goal. Among a number of promising approaches, an analytical expression known as the UNIQUAC equation (UNIversal QUAsi Chemical equation) has received the most widespread acceptance. In this model, the activity coefficient is decomposed into two constituents, one of which, termed combinatorial (C), accounts for molecular size and shape differences, while the other, denoted residual (R), expresses effects due to molecular interactions. Thus, ln g = ln gC + ln gR
(6.19)
It has become possible to express gC and gR in terms of group contributions due to molecular subunits such as CH3, CH2, CH2O, etc. This approach has led to the successful prediction of vapor-liquid equilibria of a large number of systems. There is evidently still an ongoing need for experimentation, but this requirement is now at a much more subdued level than would otherwise have been the case.
231
Phase Equilibria 6.3.3
The Separation Factor a: Azeotropes
A convenient and consistent measure of separation is provided by the socalled separation factor or relative volatility a, which is composed of the product of two mole-fraction ratios. These ratios are defined in such a way as to minimize changes in a with composition and are represented by the following expression a=
y (1 - x) x (1 - y )
(6.20a)
Here x and y refer to the more volatile component, i.e., the constituent with the higher pure-component vapor pressure or the lower boiling point. In general, the higher the value of a above unity, the greater the degree of separation or enrichment. The reader will have noted that any decrease in y/x toward 1 as y and x approach unity is neatly offset by the compensating ratio (1 – x)/(1 – y). Thus, if y = 0.99 and x = 0.98, for example, a will still be considerably above unity. a=
0.99 1 - 0.98 = 2.02 0.98 1 - 0.99
(6.20b)
Consequently, the use of a predicts, correctly, that there is still substantial separation to be obtained even when the mole fractions are near unity. The essence of the relative volatility is best understood by examining its effect on the x–y diagrams shown in Figure 6.17c and Figure 6.20c. It turns out that a bears a distinct and sensitive relation to the shape of these curves. The following features in particular stand out: 1. Separation factors greater than unity result in x–y curves that lie entirely above the 45r diagonal. The higher the value of a, the greater the distance between the two lines. This implies that separation becomes easier as the x–y curve bulges out and away from the diagonal. Systems with x–y curves close to the diagonal are by contrast difficult to separate. 2. Separation factors that are constant, or nearly so, result in symmetrical x–y curves. Larger variations yield asymmetrical curves, with some portions lying far above the diagonal while others are close to it. 3. When a = 1, vapor and liquid compositions become equal, i.e., x = y, and the corresponding mole fraction lies on the 45r diagonal. This condition is referred to as an azeotrope and is shown in Figure 6.20c. The x–y curves for such systems will inflect across the 45r line, with portions on either side of the azeotrope lying above and below the diagonal, respectively. The portion below the line yields enrichment in the less volatile component. Above the diagonal it is the more volatile component that is enriched.
232
Mass Transfer: Principles and Applications
Azeotropic behavior is a common occurrence in vapor-liquid equilibria (VLE). Approximately one-third of all systems listed in standard VLE handbooks exhibit azeotropes. In general, the more dissimilar the two components, the greater the likelihood that such mixtures will be formed. Combinations of polar-nonpolar substances and those with widely differing structural features are particularly prone to azeotropic behavior. Table 6.7, which lists some of the more conventional azeotropic pairs, conveys a sense of the degree of dissimilarity that leads to the formation of azeotropes. Several additional features of these systems are to be noted. First and foremost is the fact that mixtures that lead to azeotrope formation cannot be separated into their constituent components by simple distillation. This is best seen from the boiling-point diagram shown in Figure 6.20a, where we indicate the pathway that results from a process of repeated vaporization and condensation. Starting with a liquid feed at F, the mixture is brought to a boil at K and the first vapor (L) collected and condensed. The cycle of vaporization and condensation is then repeated until the azeotropic composition at A is reached. At this point no further enrichment by vaporization is obtained, as the compositions in the two phases are the same. The mixture continues to boil at a constant temperature, yielding a mixture of constant composition, until the liquid charge is exhausted. Azeotropic mixtures require special methods for their separation, which usually consist of adding a third component that has the ability to “break” the azeotrope. Perhaps the most famous case is that of ethanol-water, which has an azeotropic mole fraction in ethanol of 0.8943 at atmospheric pressure (Table 6.8). Here the added component is benzene and results, on distillation, in the recovery of pure ethanol and a ternary azeotrope containing benzene. That mixture, on condensation, results in two immiscible aqueous and organic layers, which are separated and further processed by distillation. We now turn to the question of the behavior of a for ideal liquid solutions. Here the Raoult’s law equations (Equation 6.15a and Equation 6.15b) provide a quick answer. Dividing the two expressions, we obtain in the first instance pA x A PA o = pB (1 - x A )PB o
(6.21a)
Replacing partial pressures by yPT yields y A PT x A PA o = (1 - y A )PT (1 - x A ) PB o and after some rearrangement,
(6.21b)
233
Phase Equilibria
B.P. of B K
a. Temperature T
L
B.P. of A
T vs. yA
M T vs. xA Azeotrope
F
0
Mole Fractions xA, yA
1
Azeotrope
b.
PT vs. xA
Total Pressure PT
PAO
PT vs. yA
PBO
T vs. xA 0
Mole Fractions xA, yA
1
1
c. Vapor Mole Fraction yA
Azeotrope
0
Liquid Mole Fraction xA
1
FIGURE 6.20 Azeotropic systems: (a) boiling-point diagram; (b) vapor-pressure diagram; (c) x–y diagram.
234
Mass Transfer: Principles and Applications
TABLE 6.8 Binary Azeotropes at 1 atm System Water (1)–Methanol (2) Water (1)–Ethanol (2) Water (1)–Propanol (2) Water (1)–i-Propanol (2) Water (1)–n-Butanol (2) Water (1)–Formic acid (2) Water (1)–Acetic acid (2) Water (1)–Dioxane (2) Water (1)–Tetrahydrofurane (2) Water (1)–Pyridine (2) Methanol (1)–Acetone (2) Methanol (1)–Methyl acetate (2) Methanol (1)–Ethyl acetate (2) Methanol (1)–Chloroform (2) Methanol (1)–Carbon tetrachloride (2) Methanol (1)–Hexane (2) Methanol (1)–Heptane (2) Methanol (1)–Benzene (2) Methanol (1)–Toluene (2) Ethanol (1)–Ethyl acetate (2) Ethanol (1)–Chloroform (2) Ethanol (1)–Carbon tetrachloride (2) Ethanol (1)–Hexane (2) Ethanol (1)–Heptane (2) Ethanol (1)–Benzene (2) Ethanol (1)–Toluene (2) Acetone (1)–Chloroform (2) Acetone (1)–Carbon tetrachloride (2) Acetone (1)–Carbon disulfide (2) Acetone (1)–Pentane (2) Acetic acid (1)–Octane (2) Benzene (1)–Cyclohexane (2)
a=
Azeotrope Mole Fraction x1 = y1
Temperature T, r C
— 0.1057 0.5680 0.3187 0.75 0.415 — 0.525 0.18 0.77 0.1980 0.3280 0.287 0.35 0.55 0.498 0.747 0.60 0.90 0.48
— 78.15 87.80 80.16 92.95 107.60 — 87.75 63.5 94.40 54.40 53.80 62.1 53.5 55.7 45 58.8 57.8 63.6 72.1 Yes Yes
0.345
58.0 Yes
0.445
67.8 Yes
0.3600 0.93 0.34 0.25 0.675 0.55
y A (1 - x A ) PA o = x A (1 - y A ) PB o
64.4 56.0 39.10 32 105.1 77.5
(6.21c)
Thus, for ideal solutions, a stands in the simple ratio of the vapor pressure of the more volatile component to that of its less-volatile counterpart. This ratio varies somewhat with temperature but the variation is not severe and is often accounted for by composing the arithmetic or geometric average of the two end values at x = 0 and x = 1. To provide the reader with a sense of the validity of Equation 6.21c, we have composed in Table 6.9 a comparison of calculated values with the experimental range of a values taken over the span of measured mole frac-
235
Phase Equilibria TABLE 6.9 Separation Factors for Some Near-Ideal Systems at 1 atm System
Experimental Range of a
Range of P1o/P2o
2.20–1.88 3.55–3.30 2.34–1.64 1.15–1.21 4.21–5.84 2.48–2.54 8.96–7.45 1.65–1.41 1.41–2.11 1.56–2.23 2.23–2.26
1.67–1.76 3.20–3.97 1.91–2.17 1.17–1.27 3.95–5.92 2.20–2.37 7.15–10.9 1.62–1.72 1.62–1.72 1.71–2.22 2.36–2.60
T, K
P1o/P2o
Homologues Methanol (1)–Ethanol (2) Methanol (1)–Propanol (2) Methanol (1)–i-Propanol (2) Ethanol (1)–i-Propanol (2) Ethanol (1)–n-Butanol (2) Ethanol (1)–sec-Butanol (2) Ethanol (1)–1-Pentanol (2) Formic acid (1)–Acetic acid (2) Chloroform (1)–Carbon tetrachloride (2) Acetone (1)–Methyl ethyl ketone (2) Benzene (1)–Toluene (2) Isotopes H2-HD C12O-C13O O16O16-O16O18 CH4-CH3D N14O-N15O H2O-HDO
20.4 68.3 69.5 90 109.5 373.1
1.73 1.0109 1.01 1.0025 1.032 1.026
tions. The systems involved are those that can be expected to behave ideally, i.e., members of a homologous series, isotope pairs, and the like. For isotope mixtures, experimental a values are rare and we have instead reported the vapor-pressure ratio, which for these substances is nearly constant and equal to the relative volatility. Illustration 6.10: The Effect of Total Pressure on a In principle, distillation can be carried out over a wide range of pressures, spanning the extremes of near-total vacuum and the critical point. While atmospheric distillation is the preferred mode of operation, reduced pressures offer the advantage of lower temperatures and energy requirements. They are often employed to avoid thermal degradation of heat-sensitive materials (ethylbenzene/styrene distillation) or are forced on the operator by the low vapor pressure of the charge (metal distillation). The drawbacks of this mode of operation are the obvious cost and inconvenience of a vacuum process and the lowering of material throughput. Distillation above atmospheric pressures is often employed with volatile charges containing dissolved gases and is routinely used in refinery operations. It shows superior throughput but has higher operating temperatures and energy requirements than atmospheric distillation. An important factor to be taken into account in any overall assessment is the effect of total pressure on the separation factor a. We can explore this
236
Mass Transfer: Principles and Applications
dependence for the simple case of ideal solutions by first drawing on Equation 6.21c a=
y1 (1 - x1 ) P10 = x1 (1 - y1 ) P2 0
(6.21c)
and then using the Clausius-Clapeyron equation (Equation 6.1g) to relate Po to T: log
P10 = (B2 - B1 ) / T + ( A1 - A2 ) P2 0
(6.22)
It is clearly seen from the latter that the vapor-pressure ratio and hence the separation factor both increase with a decrease in boiling point or total pressure. This result has sometimes been cast into a sweeping rule-of-thumb that low-pressure distillation leads to improved separation. Many nonideal systems follow this rule, but there are also numerous exceptions, particularly in the azeotropic category. Nevertheless, low-pressure distillation is a worthwhile alternative to explore, provided some low-pressure equilibrium data are available to confirm the expected results. Comments: Even ideal systems have been known to defy the rules. The isotope pair CH4–CH3D, for example, has a separation factor of 1.001 at approximately 100 mmHg, which rises to 1.0035 at 1 atm. This anomaly led to the suggestion that heavy water (D2O) might be produced economically by high-pressure distillation of liquefied natural gas, which contains the isotope CH3D. Because the capital cost of such a plant varies inversely with a – 1 (see Illustration 7.9), even small increases in a can be hugely beneficial. Some exploratory work took place in the 1960s, and although the results appeared promising, market forces intervened to bring the proceedings to a halt. The large-scale use of heavy water is nowadays confined to the CANDU nuclear reactor, which faces an uncertain future. Illustration 6.11: Activity Coefficients from Solubilities Activity coefficients are generally either determined from Equation 6.18a and Equation 6.18b using measured vapor- and liquid-equilibrium compositions or are estimated from the UNIQUAC equation mentioned earlier. A third method arises when the two components in question have low mutual solubilities. g values are then confined to the Henry’s law regions near x = 0 and x = 1 (Figure 6.19) and cease to exist outside those regions. This provides a way of calculating activity coefficients using classical chemical thermodynamics.
237
Phase Equilibria
Suppose an organic solvent with a low solubility is equilibrated with water. The aqueous phase will then contain small amounts of the solvent, while water will appear in similar amounts in the organic phase. Because the concentrations involved are vanishingly small, we can approximate the chemical potential of each major constituent by its pure component chemical potential mo (T.P). We can write: m H2O @ m oH2O (T .P) = m oH2O (T .P) + RT (ln g xs )H2O
(6.23a)
m org @ m org (T .P) @ m o org (T .P) + RT (ln g xs ) org
(6.23b)
and
This leads to the result g org @ 1 / ( xs )org
(6.23c)
g H 2O @ 1 / ( xs )H 2 O
(6.23d)
and
where xs represents the saturation solubility, expressed as a mole fraction. We illustrate these results by examining the system carbon tetrachloride–water. The solubility of CCl4 in water is listed in Table 6.3 as 0.8 g/l @ 800 ppm. The solubility of water in carbon tetrachloride is almost 10 times lower at 84 ppm. Converting to mole fraction, we obtain ( xs )CCl 4 @ 800(18 / 154)10 -6 = 9.4 ¥ 10 -5 and ( xs )H2O @ 804(154 / 18)10 -6 = 7.2 ¥ 10 -4 Taking the inverse of these results, we obtain for the activity coefficients: In the aqueous phase:
g CCl4 @ 11, 000
In the organic phase:
g H2O @ 1, 400
238
Mass Transfer: Principles and Applications
These are enormously high values, which indicate that the equilibrium vapor mole fraction will by far exceed that of the liquid (see Practice Problem 6.13). There is another simplification to be made: Since gxs is very nearly unity, partial pressures will be closely approximated by the pure component vapor pressures, which can be computed from the Antoine constants of Table 6.1. We have For the aqueous phase: pCCl 4 = ( g xs P o )CCl 4 @ P o CCl 4 = 86.8 mmHg For the organic phase: pH2O = ( g xs Po )H2O @ Po H2O = 23.6 mmHg The results for CCl4 are particularly noteworthy in an environmental context. The high partial pressure indicates that a water basin contaminated with carbon tetrachloride will quickly lose most of the contaminant to the atmosphere by evaporation. We return to this topic in Illustration 7.4.
Practice Problems 6.1. The Vapor Pressure of Ice and Snow Ice has a substantial vapor pressure, which causes it to evaporate at surprisingly high rates. Most of the disappearance of snow during a lull in precipitation is due to evaporation rather than melting. a. Suppose that a shallow puddle of water with a surface temperature of 20r C evaporates in 2 h during a dry windy day. How long would it take the same amount of ice at -5r C to evaporate under identical wind and humidity conditions? The vapor pressures of the water and the ice at their respective temperature are 17.5 and 3.0 mmHg. b. Estimate the rate of evaporation of ice. Answer: 11.7 h, 0.032 g/m2 s 6.2. Oxygen Content of Lake Waters Calculate the maximum total oxygen content in a lake containing 107 m3 water. Answer: 85.1 tons
239
Phase Equilibria
6.3. Water Intake of Fish The oxygen required by a 2.5-kg fish amounts to approximately 50 g/day. Calculate the minimum water intake by the fish to supply the necessary amount of oxygen. Answer: 4.1 l/min 6.4. Sea Salt by Evaporation Sea salt contains 454 mmol/kg NaCl and 9.6 mmol/kg KCl. What percentage of the water has to be evaporated for the first crystals of KCl to precipitate? The total solids content of sea water is approximately 2%. (Hint: Consult Table 6.3.) Answer: 57.1% 6.5. More about Adsorption: The Toth Equation Applied to Air Purification The Langmuir isotherm, while adequate for many purposes, has since its inception been superseded by more refined equations with a broader range of applications. One such equation is that due to Toth, which is given by X=
ap (b + p C )1/C
(6.24a)
Consider a factory air space of 105 m3, which is regularly contaminated with 10 ppm by volume of hydrogen sulfide, a toxic and foulsmelling gas. It is proposed to use adsorption to purify the air. Activated carbon does not lend itself to this purpose because of its low capacity, but the zeolite mordenite has a suitably high loading factor represented by the following Toth isotherm: X=
4.5675 p [0.3252 + p 0.2425 ]1/0.2425
(6.24b)
where p is in units of kPa, and q in mol/kg adsorbed. Calculate the minimum weight of mordenite required to purify the air. Answer: 561 kg 6.6. Ion-Exchange Resins The process of ion exchange relies on the use of synthetic organic resins, which carry ionic groups capable of exchanging cations or anions with similar species in an aqueous solution. The resins come in the form of small beads (2 to 3 mm) made up of a polymeric skeleton into which the ionic groups are introduced by suitable
240
Mass Transfer: Principles and Applications chemical reactions. In one version of this process, styrene is polymerized in emulsion to provide the resin matrix, which is then sulfonated, thereby introducing sulfonic acid groups –SO3–H+ into the polymer skeleton. We can describe this process in the following form: RSO3 - H + + M +
¨ RSO3 - M + + H + Æ
(6.25a)
The hydrogen ion of this group can be readily released and its place taken by another cation from a neighboring aqueous solution. Anion exchangers use amine groups R3N+OH– to affect a similar exchange of anions. Thus, - R3 N + OH - + A -
¨ - R3 N + A - + OH Æ
(6.25b)
Ion-exchange resins find extensive use in the deionization of water and in the recovery of valuable ions from aqueous solutions. In water-softening processes, for example, calcium ions contained in the hard water are exchanged for hydrogen ions released by the sulfonic acid groups, while the anions are replaced by hydroxyl ions provided by the amine groups. The net result is the replacement of the calcium salts by water molecules and an attendant softening of the process water. Ion-exchange resins behave in much the same way as adsorbents, with ion uptake increasing in proportion to the concentration in the contacting solution and ultimately leveling off at a saturation value when all ions in the resin have been exchanged. The phase equilibrium is consequently well-described by a Langmuir-type isotherm. To account for the ionic nature of the species, it is customary to express both resin loadings and aqueous concentrations as milliequivalents rather than as the actual weight of ions. Suppose that the uptake of copper ions Cu2+ by a particular resin is described by the Langmuir form X=
11.2 C 1 + 3.0 C
where C is in meq Cu2+/l and X in meq Cu2+/g resin. Use this equation to calculate the resin loading X for an aqueous solution containing 0.01 by weight of copper ions. Answer: 0.322 meq/g
241
Phase Equilibria
6.7. Special Types of Liquid-Liquid Equilibria Consider the following two cases: a. A solute distributes itself between two partially soluble solvents and is itself only partially soluble in one of these solvents. Draw the triangular diagram for this case and locate the plait point. b. A solute distributed between two partially soluble solvents reverses selectivity at some intermediate concentration level. Draw the distribution curve for this case and identify the corresponding behavior in vapor-liquid equilibria. 6.8. Decaffeination by Supercritical Extraction: The Freundlich Isotherm The data of Figure 6.16 showing the equilibrium distribution of caffeine between coffee beans and supercritical carbon dioxide can be fitted by a power relation termed the Freundlich isotherm: x = aym
(6.9a)
where x = kg caffeine/kg beans and y = kg caffeine/kg CO2. This relation, an empirical one, is often used to fit adsorption equilibria in the intermediate concentration range. Use the data of Figure 6.16 to derive the values for a and m. 6.9. Repartitioning of a Solute between Compartments A solute is partitioned among three compartments with volumes of V1 = 100, V2 = 50, V3 = 10 (arbitrary units) and partition coefficients of K12 = 10–2 and K13 = 10–3. Degradation is extremely slow and the system is considered to be at a quasi-equilibrium. If the concentration in compartment 1 undergoes a sudden increase from 10–3 to 10–2, what will be the ultimate new equilibrium concentrations, assuming no degradation takes place? Answer: C1 = 2.13 ¥ 10–3 6.10. Vapor-Liquid Separation Factors for Light and Heavy Water Monodeuterated water HDO has an abundance in natural water of approximately 600 ppm. One of the methods used in early attempts to separate the two isotopes was fractional distillation, for which the separation factor at 1 atm was found to be 1.026. Although this procedure was ultimately superseded by the more efficient chemical-exchange processes for larger-scale production of heavy water, distillation remains the separation method of choice for upgrading small amounts of heavy water that have been contaminated by atmospheric water vapor. Distillation is in this case carried out at reduced pressure to take advantage of the higher separation factor. Suppose we wish to carry out the distillation of H 2 O-HDO at ambient temperatures, i.e., at subatmospheric
242
Mass Transfer: Principles and Applications pressures. Given that the separation factor at 40r C is 1.056, calculate its value at a temperature of 25r C. Answer: 1.069
Note: The actual distillation process at high D2O concentrations involves the species HDO-D2O. Separation factors of this binary pair are nearly identical to those for H2O-HDO. 6.11. More on Nonideal Systems Consider the case of a nonideal liquid solution in which attractive forces outweigh the repulsive. Describe how this changes the diagrams shown in Figure 6.18 and Figure 6.20. 6.12. Steam Distillation It often happens, particularly in the food and pharmaceutical industries, that a heat-sensitive liquid has to be purified by distillation, or a dissolved substance has to be concentrated by boiling off solvent without risking thermal degradation. Vacuum distillation is one way of lowering the boiling point but suffers from low production rates and other disadvantages (see Illustration 6.10). A second method is steam distillation, which involves passing live steam through the solution and using it as a carrier gas to sweep off the evaporating liquid or solvent. The charge consists of partially condensed steam and a separate organic phase. The latent heat of vaporization is provided by external heating. a. Show that the normal boiling point is always less than 100r C and increases with time. b. Consider the steam distillation of a dilute solution of a heatsensitive substance in toluene. Estimate its initial boiling point and the initial steam consumption in kg steam/kg toluene. (Hint: Use Table 6.1.) Answer: a. 84.3r C, b. 0.24 6.13. Transfer of Pollutants from a Water Basin to the Atmosphere To obtain a sense of the magnification in concentration, which occurs when a sparingly soluble substance evaporates into the atmosphere, calculate the so-called K-factor, K = y/x, for carbon tetrachloride in water using the data given in Illustration 6.11. Answer: 8300
7 Staged Operations: The Equilibrium Stage
Chapter 6 has laid the groundwork for the topic to be taken up here by examining in considerable detail the various phase equilibria that enter into the formulation of an equilibrium stage. The equilibrium stage, also termed an ideal stage or theoretical stage, plays a central role in the analysis of an important class of mass transfer operations termed staged processes. In these operations, two phases are brought into intimate contact in a stirred tank or its equivalent and the desired mass transfer process is allowed to take place. The two phases are then separated, and the process is either repeated (multistage contact) or brought to a halt (single-stage contact). While there is only one mode of single-stage contact, multistage operations can be arranged in a variety of geometrical configurations. In co-current operations, the two phases move through the stages and cascade parallel to each other and in the same direction. When the phases move in opposite directions but still run parallel, we speak of a countercurrent operation. Finally, when the two phases move at right angles to each other, the process is termed a crosscurrent operation. These three modes are sketched in Figure 7.1. Analysis of these processes by the equilibrium-stage model proceeds in two steps. In the first step, the two phases are visualized as entering a stirred tank or its equivalent where they are allowed to come to equilibrium. The two phases are then conceptually withdrawn and separated, and the concentrations in each phase are calculated by means of appropriate mass balances and equilibrium data. We practice this step extensively in this chapter using both analytical expressions and specially designed geometrical constructions termed operating diagrams. In the second step of the process, the two phases are contacted only for a finite time interval leading to incomplete equilibrium. This step, which has to be carried out experimentally, reflects conditions that prevail in an actual operation. The resulting concentration changes, which differ from those attained at equilibrium, are cast in the form of a fractional approach to equilibrium or stage efficiency E. The value of this efficiency is then grafted onto the results of the first step to arrive at an estimate of the actual prevailing concentrations. The concepts we have just described are illustrated in Figure 7.2. Figure 7.2a represents an equilibrium stage in which G kg of a carrier gas containing 243
244
Mass Transfer: Principles and Applications
a. Phase I
Phase I
Phase II
Phase II
b. Phase I
Phase I
Phase II
Phase II
c. Phase I
Phase I
Phase II
Phase II
Phase II
Phase II
d. Phase I
Phase I
Phase II
Phase II
FIGURE 7.1 Staged operations: (a) single stage; (b) co-current; (c) countercurrent; (d) crosscurrent.
YF kg solute/kg carrier is contacted with L kg of a solvent carrying XF kg of the solute/kg solvent. The solute transfers from the gas to the liquid phase until equilibrium is attained. The phases are then withdrawn and separated, with their concentrations at their respective equilibrium values X and Y*. In Figure 7.2b, the same feed enters the stage but attains only partial equilibrium, with the exiting liquid concentration X¢ falling short of the equilibrium value X. We express this through the stage efficiency E by writing X¢ = EX
(7.1)
Thus, when E = 1, the fractional approach to equilibrium is 1, and equilibration is consequently complete. When E is zero, no transfer takes place and the concentration remains frozen at the level XF of the incoming feed.
245
Staged Operations: The Equilibrium Stage
a. YF , G
Y*, G
XF, L
X, L
YF , G
Y > Y*, G
XF, L
X' < X, L
b.
FIGURE 7.2 Staged contact of two phases: (a) equilibrium stage; (b) non-equilibrium or actual stage.
This chapter is divided into two parts: In the first, we take up the topic of equilibrium stages in their various configurations and apply them to a number of different mass transfer operations. The second part, which is less extensive, considers the effect of mass transfer resistance expressed through an appropriate stage efficiency.
7.1 7.1.1
Equilibrium Stages Single-Stage Processes
The single equilibrium stage is the key unit on which the more complex configurations such as the crosscurrent and countercurrent cascades are based. We use it here to introduce the reader to some basic notions of equilibrium stage processes and to make a first presentation of a key tool, the operating diagram. Figure 7.3 shows the flow diagrams for two single-stage processes. In Figure 7.3a, we display the streams entering and leaving a liquid phase adsorption stage. S and L represent the mass of solute-free adsorbent and solvent, and X and Y are the corresponding mass ratios in units of kg solute/ kg adsorbent and kg solute/kg solvent. Figure 7.3b shows a similar process of single-stage liquid extraction. The principal difference here lies in the
246
Mass Transfer: Principles and Applications
a. L, YF
L, Y1
S, XO
S, X1
F, xF
R, x1
b.
B, yO
E, y1
FIGURE 7.3 Single-stage equilibrium processes: (a) adsorption from a liquid solution; (b) extraction.
choice of units, with concentrations expressed as mass fractions x and y, and the capitalized symbols expressing the total mass of each phase entering and leaving. The symbol R denotes the raffinate, i.e., the solution being extracted, and E stands for the extract containing the bulk of the solvent and the extracted solute. Our considerations here are confined to finite amounts of both phases. The case where differential amounts of one phase are continuously withdrawn is taken up in Section 7.1.2. For single-stage operations, the following questions are to be answered: 1. With the amount and concentration of feed fixed, what is the amount of adsorbent or solvent needed to achieve a prescribed reduction in solute content? 2. Conversely, and with feed conditions again fixed, what is the concentration in the effluent if we use a given amount of adsorbent or solvent, with a known impurity level? When dealing with multistage operations, the number of questions escalates. We may then ask for the number of stages required to achieve a prescribed concentration change, for example, or the most economic use of adsorbent or solvent. These will be taken up at the appropriate time. Let us now consider the tools needed to answer the single-stage questions. In the first instance, we require a solute mass balance over the stage. For the adsorption process shown in Figure 7.3a, it takes the form
247
Staged Operations: The Equilibrium Stage Amount of solute in - Amount of solute out = 0 (LYF + SX0) (LY1 + SX1) =0
(7.2a)
Each term here is made up of the product of kg solvent L or kg adsorbent S, which do not change during their passage, and the concentrations X (kg solute/kg adsorbent) and Y (kg solute/kg solvent), which do. For the extraction process of Figure 7.3b, additional balances are required because we do not have a convenient constant “carrier” mass available. This is taken up in Illustration 7.2. The second tool required is a statement that the concentrations X1, Y1 leaving the stage are in equilibrium with each other. These values are obtained experimentally and are formally expressed by the relation Y*i = f(Xi)
(7.2b)
where the asterisk denotes equilibrium conditions. Laboratory data of Xi, Yi are not always easily expressed in simple analytical form, which leads to complications in attempting to solve Equation 7.2a and Equation 7.2b. This has led to the development of a graphical construction termed an operating diagram, which is shown in Figure 7.4. This diagram is in essence a graphical representation of both the material balance and the equilibrium relation (Equation 7.2a and Equation 7.2b). It displays in vivid form the interrelation of the operational variables and enables the analyst to make various calculations of interest in rapid fashion.
Operating Line Slope = – S/L
YF
Y
Equilbrium Curve Y* = f(X)
kg solute kg solvent Y1
Y1 '
XF
X1 X, kg solute/kg adsorbent
FIGURE 7.4 Operating diagram for single-stage equilibrium adsorption.
248
Mass Transfer: Principles and Applications
Illustration 7.1: Single-Stage Adsorption: The Rectangular Operating Diagram The first step in constructing the operating diagram is to plot the experimental equilibrium data obtained in the laboratory in the form of an equilibrium curve. This curve is shown in Figure 7.4 and is of the Langmuir form, where solid-phase concentration now appears on the abscissa instead of the ordinate as previously shown in Figure 6.5. This is done for greater clarity of construction. The second step is to represent the mass balance, Equation 7.2a, which is best achieved by rearranging it in the form -
Y - Y1 S DY = = F L DX X F - X1
(7.3)
This is the equation of a straight line termed the operating line, which has a slope of –S/L. In this equation, the amount of solvent L and the initial or feed concentrations XF, YF are known variables; the others are either prescribed or unknown. There are several features that the diagram conveys at a glance. For example, the steeper the slope of the operating line, the greater the amount of adsorbent used and hence the higher the fractional recovery of solute, here given by the ratio (YF – Y1)/YF . Note that when the amount of adsorbent becomes infinite, the recovery is not complete but instead stabilizes at the value (YF – Y1¢)/YF . This is because of the residual impurity level X0, which the incoming adsorbent carried with it. When an infinite amount of clean adsorbent is used, the operating line drops to the origin and recovery becomes complete. Suppose now that, with the feed condition YF, XF, and L known and the amount S prescribed, we wish to establish the resulting degree of recovery. This becomes a simple matter of locating the point (YF, XF) on the diagram and drawing a line of slope –S/L through it. Its intersection with the equilibrium curve determines the concentrations of the exiting streams, Y1 and X1, from which we can compute the recovery (YF – Y1)YF . If, on the other hand, recovery is prescribed and the unknown is the amount of adsorbent required, the procedure is reversed: A line is drawn through the two known points (YF, XF) and (Y1, X1) and the unknown S calculated from its slope æ S/L. Let us turn next to the extraction process shown in Figure 7.3b. We start by noting that in the case of mutually insoluble solvents, single-stage extraction can be analyzed in exactly the same fashion as the single-stage adsorption process described above. With A and B denoting the mass of raffinate and extract solvent x, the operating diagram becomes identical to that shown in Figure7.4, with the slope of the operating line now given by –B/A. In most practical cases, the raffinate and extract solvents will show some degree of mutual solubility, and the use of the X-Y diagram becomes less
249
Staged Operations: The Equilibrium Stage
appropriate. We must turn instead to the triangular diagrams for a full description of the extraction process. The initial tools are again two in number, i.e., a solute mass balance and a statement of solute equilibrium between the two liquids. Here, however, we encounter an unexpected difficulty: Both the amounts of raffinate and extract are new unknowns and require us to introduce two additional equations. One such equation is the total mass balance, which we did not require or have occasion to use in the adsorption process. A second component balance would complete our requirements, but the resulting escalation in equations is not welcome news. This complication is avoided by returning to our graphical tools and making use of some of the properties of triangular diagrams. One such property, stated in Illustration 6.6, was that when two solutions are combined, the resulting composition (F in Figure 6.11) is located on the straight line connecting the concentrations of the parent solutions (points R and E). This rule, which was not explicitly proved, springs from the requirement that the lever rule, Equation 6.8f, must hold for all three component substances. In other words, the extract-to-raffinate ratio E/R must be the same, irrespective of which component mass fraction is used in Equation 6.8f. The construction of Figure 6.11 shows that this is the case, and only the case, if F lies on a straight line connecting R and E. In other words, all three component balances are silent partners in the construction of Figure 6.11. The graphical construction consequently provides the additional component balance to satisfy the algebraic requirement we had confronted earlier. We amplify these points in the illustration that follows.
Illustration 7.2: Single-Stage Liquid Extraction: The Triangular Operating Diagram Consider the case of a feed with a composition located at F in Figure 7.5 being contacted with B kg of pure solvent, located at point B. M is the location of the mixture that results when F kg feed are contacted with the solvent, and RE represents the equilibrium tie-line. Composing total and component solute mass balances as previously stipulated, we obtain Rate in
Rate out
F+B=M=R+E
(7.4a)
xFF = xMM = xRR + yEE
(7.4b)
It is desired to calculate the equilibrium compositions that result, as well as the amounts of raffinate R and extract E produced. We first locate the composition xM of the mixing point M by eliminating total mass M from the left side of the two balances. Thus,
250
Mass Transfer: Principles and Applications C (Solute)
E'' Solvent-free E' Extract
D
Feed F Solvent-free R' Raffinate
Equilibrium Tie-Line
E
M
Operating Line G
R
A (Raffinate Solvent)
B (Extract Solvent)
FIGURE 7.5 Operating diagram for single-stage equilibrium extraction.
xM =
xF F F+B
(7.4c)
This composition is entered on the operating line connecting F and B. Next a tie-line is drawn through M to establish the raffinate and extract compositions at R and E. This requires some visual interpolation between neighboring tie-lines obtained from experimental equilibrium data and completes the first part of the task. The second part is accomplished by again eliminating M from the two balances, this time from the right side of Equations 7.4a and 7.4b. Thus, ( F + B)( x M - x R ) YE - x R
(7.4d)
( F + B)( yE - x M ) = F+B-E yE - x R
(7.4e)
E= and R=
Thus, the operating diagram, together with the two algebraic mass balances, has provided us with a complete answer to the problem. The reverse task, that of calculating the solvent requirement for a prescribed solute recovery, is solved by drawing both the tie-line (which is now known) and the companion operating line, and, from their intersection, establishing the value of xM. The solvent requirement is then obtained from the left side of the two mass balances as
Staged Operations: The Equilibrium Stage
B=
F( x F - x M ) xM
251
(7.4f)
Comments: Several additional interesting features may be deduced from the diagram: 1. Removal of the solvent from the raffinate and extract, which can (for example) be accomplished by distillation, results in the solvent-free compositions located at R¢ and E¢. These points lie on the straightline extrapolations of RB and EB , as required by the mixing rule. We note in addition that a maximum in the solute concentration results when the product extract is located on the tangent drawn through B to the solubility curve, leading to point Et. 2. An increase in the amount of solvent used results in a movement of the mixing point M toward G, while a reduction in solvent causes it to approach the point D. When M coincides with D, the amount of solvent is at a minimum and the amount of extract is infinitesimally small. This follows from the lever rule, Equation 6.8f. Under these conditions, any solvent present in the system resides entirely in the raffinate phase. Conversely, the point G represents the maximum amount of solvent we can use and is attended by an infinitesimally small amount of raffinate. Evidently, the actual amount of solvent will lie somewhere between the two extremes. Note that these two limiting values are established from the intersection of the operating lines with the solubility curve and do not require any tie-line data.
7.1.2
Single-Stage Differential Operation
A special type of single-stage contact arises when one phase, which is at all times fully equilibrated with its partner, is slowly withdrawn in infinitesimally small amounts while the second phase remains within the stage and undergoes a correspondingly slow change in concentration. This process is best visualized, and most easily implemented, in the case of distillation, which is then referred to as simple distillation. The equations to be used again involve integral mass balances, but they now contain an unsteady term to reflect the slow changes in the contents of the stage. Figure 7.6 shows the variables involved in a differential distillation process. For a binary system, they are four in number: the moles liquid in the still or boiler at any instant W and its mole fraction xB, the rate of vapor withdrawal D (mol/s), and the instantaneous vapor composition yD. The mass balances and the equilibrium relation y0* = f(xW) provide only three of the required equations. For the fourth we must draw on an energy balance. This stands to reason since the rate of vapor production D will evidently depend on the energy input to the system. The temperature of the still will then come into
252
Mass Transfer: Principles and Applications
D, yD
W, xW
Steam FIGURE 7.6 Differential or simple distillation.
play as a fifth variable, and must be accounted for by an appropriate equilibrium relation. This set of equations, which has to be solved numerically, yields the changes with time of the five variables in question. A reduced solution to the problem can be obtained if we eliminate time as a variable and establish the instantaneous relation between the state variables, for example, W = f(xW). This is still a highly useful result because it can tell us how much of a given initial charge must be distilled to obtain a desired enrichment xB. It also provides us with other items of interest and falls short only by failing to establish the full time dependence of the variables. Illustration 7.3: Differential Distillation: The Rayleigh Equation We start the derivation of the model by composing the unsteady integral mass balances for the system: Rate of moles in - Rate of moles out =
-D =
Rate of change of contents
d (W ) dt
(7.5a)
d (x W ) dt W
(7.5b)
and - yD D =
253
Staged Operations: The Equilibrium Stage This is supplemented by the equilibrium relation yD* = f(xW)
(7.5c)
To eliminate the time variable, we resort to a favorite trick of ours, one that is frequently used and should be part of the analyst’s tool box: The two mass balances are divided, thereby eliminating not only time as a variable but also the unknown distillation rate D. Thus,
yD =
d( xW W ) dW
(7.5d)
which can be combined with the equilibrium relation and expanded to yield
f ( xW ) = xW + W
dxW dW
(7.5e)
and consequently dxW dW = f ( xW ) - xW W
(7.5f)
Formal integration of this expression then leads to
ln
W = Wo
Ú
xW xW
o
dxW f ( xW ) - xW
(7.5g)
where the superscript o denotes the initial conditions. This expression is known as the Rayleigh equation and relates the amount W left in the still at any instant to its composition xW . Comments: We start by noting, as we have done on other occasions, that any of the variables appearing in Equation 7.5g may be regarded as an unknown. Thus, for a given boiler content W, the equation will yield the corresponding composition xW, and conversely we can calculate the fraction to be distilled 1 – W/Wo, by prescribing a desired enrichment (xW – xWo)/xWo. What is often overlooked is that the equilibrium relation f(xW) can also be established from experimental xW vs. W data. A particularly simple case arises when the f(xW)
254
Mass Transfer: Principles and Applications
is linear in xW, which holds at low values of the mole fraction x (Henry’s law region). We then have ln
W = Wo
Ú
xW
xW
o
dxW ( H - 1)xW
(7.6)
and consequently W Ê xW ˆ = W o ÁË xW o ˜¯
1/H -1
(7.7)
This expression can be exploited to derive isotope or isomer separation factors, which here equal the Henry constant. Suppose, for example, that 95% of the charge has been boiled off, i.e., W/Wo = 0.05, and the isotope has been depleted by 2%, i.e., xW/xWo = 0.98. Then H – 1 = a - 1 = ln 0.98/ln 0.05 and a = 1.0067. We can also use Equation 7.7 as an adjunct to the cumulative balances for the process, which were derived in Illustration 2.5 and which we repeat here. They are Wo = W + D¢
(2.15a)
xWoWo = xWW + xD¢D¢
(2.15b)
and
where D¢ = moles in the distillate receiver. These can be used to derive the composite distillate concentration xD¢, which prevails at any given instant. With W prescribed and the initial conditions known, we can calculate xW from Equation 7.7 and by substitution into Equation 2.15b arrive at a value for xD¢. Thus, with the exception of temperature and distillation rate D, both of which require an energy balance, we have managed to establish all pertinent variables of the system. The reader will find all these equations applied in Illustration 7.10 dealing with batch-column distillation. Illustration 7.4: Rayleigh’s Equation in the Environment: Attenuation of Mercury Pollution in a Water Basin We have shown in Illustration 6.10 that substances with low solubility in water, such as hydrocarbons, chlorinated organics, and mercury, can still have high partial pressures p because of their exceptionally high activity coefficients g. The relevant relation is given by the extended Raoult’s law, Equation 6.18a:
Staged Operations: The Equilibrium Stage
255
p = gxPo
(6.18a)
Po x PT
(7.8a)
which can be recast in the form
y=g
The group gPo/PT can be viewed as a partition coefficient K, which for the substances mentioned is generally quite high. The loss of even a small amount of solution by evaporation could thus be expected to result in a marked drop of pollutant concentration. This is small comfort for the environment as a whole since the toxic substances are merely transferred from one medium to another. Their fate nevertheless needs to be tracked. We consider here a body of water containing dissolved mercury at the saturation level and set ourselves the task of calculating the reduction in mercury content that occurs when 0.01% of the contents is evaporated. It is assumed that the vapor in question is at all times in equilibrium with a wellmixed liquid, i.e., that Rayleigh’s equation applies. The equilibrium relation (Equation 7.8a), which will be needed in the model, contains the activity coefficient g, which is not usually known or easily measured. The difficulty was circumvented in Illustration 6.10 by relating g to solubility xs, using the chemical potentials of the respective phases. We obtain mr (T1P) = mr (T1P) + RT ln g xs Mercury
(7.8b)
Saturated solution
and hence g = 1/xs
(7.8c)
Substitution into Equation 7.8a yields
yHg =
xHg Po Hg xs PT
(7.8d)
Here we must be careful to exclude the partial pressure of air from PT since the equilibrium involved is one of the binary Hg-H2O vapor in equilibrium with the liquid phase. We must therefore write
256
Mass Transfer: Principles and Applications
yHg =
x Hg
x Hg Po Hg Po Jg @ xs pHg + Po H2O xs P o H 2O
(7.8e)
where we have omitted mercury partial pressure since it is small compared to the full vapor pressure of water Po H2O . Substituting Equation 7.8e into the Rayleigh equation (Equation 7.5g) and integrating yields the following result: È Po Hg ˘ W x - 1˙ ln = ln Í o xo Î xs P Hw ˚ Wo
(7.8f)
The data to be introduced at this stage are as follows: Mercury solubility (Table 6.3): 3 ¥ 10–2 mg/l = 2.7 ¥ 10–7 mole fraction Mercury vapor pressure (25r C): 0.173 Pa Water vapor pressure (25r C): 3.17 ¥ 103 Pa Noting that W/Wo = 1 – (fraction evaporated) we obtain by substitution into Equation 7.8f 0.173 È ˘ ln(1 - 10 -4 ) = ln x Hg 1 ÍÎ 2.7 ¥ 10 -9 ¥ 3170 ˙˚ xs
(7.8g)
Taylor series expansion of the logarithmic term then yields ln (1 – 10–4) @ 10–4
(7.8h)
so that
ln
xHg xs
= -2.02
(7.8i)
and xHg/xs = 0.133
(7.8j)
Thus, nearly 87% of the original mercury has been transferred to the atmosphere, a phenomenal amount considering only 1/10,000th of the solution has evaporated.
Staged Operations: The Equilibrium Stage
257
Comments: It takes astuteness to overcome the difficulties and avoid the pitfalls of this problem. The fact that g is unknown and could not be located in the literature on vapor–liquid equilibria could have brought the proceedings to a halt. Instead, it had to be realized that g could be related to solubility (which is tabulated) and the relationship established by means of elementary thermodynamics. These are considerable leaps of thought. A second point concerns the calculation of yHg. The first instinct would be to use the conventional relation y = p/PT and set total pressure equal to 1 atm. This would have led to the wrong result since the partial pressure of air would have been included. It required some thought to realize that yHg refers to the system H2O-Hg, not H2O-Hg-air. It is of some interest to calculate the ratio or partition coefficient K = y/x, which is a measure of enrichment in the vapor phase. Drawing on Equation 7.8a, we have
K = y/ x =
Po Hg 1 1 0.173 = = 2 ¥ 10 4 -9 o o xs P Hg + P H2O 2.7 ¥ 10 0.173 + 3.17 ¥ 103
This value explains and confirms the astoundingly high depletion of mercury in the water basin.
7.1.3
Crosscurrent Cascades
The linkage of several single-stage contacts leads to a composite array termed a cascade. As mentioned earlier, the mode of contact in these configurations results in three distinct types of cascades: crosscurrent, cocurrent, and countercurrent. In the crosscurrent cascade, which is taken up here, the two phases enter and leave in directions that are, at least symbolically, at right angles to each other. This can take place in two different ways: In one mode of contact, the extracting agent, i.e., the solvent or adsorbent, is used in only one stage and is then removed for processing before being reused. This mode of contact, shown in Figure 7.7a for the case of adsorption, is sometimes and not very accurately referred to as co-current and has a high extraction efficiency, but also a high inventory. In the second mode of contact, the extracting agent is used repeatedly within the cascade before being withdrawn for regeneration. This type of configuration is shown in Figure 7.7b and has the advantage of low adsorbent or solvent inventory. The model equations for the case shown in Figure 7.7a are now three in number: one solute mass balance each for the two stages and a companion equilibrium relation. We have
258
Mass Transfer: Principles and Applications
a.
S1 X0 L Y0
Stage 1
S2 X0 L Y1
Stage 2
S1 X1
L Y2
S2 X2
b. S X0 L1 Y0
Stage 1
L1 Y1 L = L 1 + L2 Y= (L1Y1 + L2Y2)/(L1 + L2)
X1 L2 Y0
Stage 2
L2 Y2
S X2 FIGURE 7.7 Two modes of crosscurrent adsorption processes: (a) use of fresh adsorbent in each stage; (b) repeated use of the same adsorbent.
Balance on Stage 1 Mass of solute in - Mass of solute out = 0 (LY0 + S1X0) - (LY1 + S1X1) =0
(7.9a)
Balance on Stage 2 Mass of solute in - Mass of solute out = 0 (LY1 + S2X0) (LY2 + S2X2) = 0
(7.9b)
Equilibrium Relation Y* = f(X)
(7.9c)
Staged Operations: The Equilibrium Stage
259
Here again it is convenient to represent the equations in graphical form by means of an operating diagram in much the same way as was done in the case of single-stage operations. This is best done by rearranging the two mass balances into the following form: -
Y - Y1 S1 DY = = 0 L DX X 0 - X1
(7.9d)
-
S2 DY Y - Y2 = = 1 L DX X 0 - X 2
(7.9e)
and
Suppose now that the amounts of adsorbent S1 and S2 entering each stage have been prescribed and it is desired to determine the final effluent concentration Y2. The feed condition, comprising the impurity level in the incoming adsorbent X0, the feed concentration Y0, and the solvent content L, is known. The procedure for constructing the operating diagram, shown in Figure 7.8, is then as follows: 1. Locate the feed point (X0, Y0) in the diagram. 2. Draw a line of slope –S1/L through the feed point. Its intersection with the equilibrium curve fixes the concentrations (X1, Y1) leaving stage 1. 3. Draw a second operating line of slope –S2/L through the point (X0, Y1). Its intersection with the equilibrium curve defines the final impurity level Y2. It is clear from this construction that there exists an infinite number of combinations of S1 and S2 that will reduce the feed-solute level Y0 to Y2. It is also seen that if either S1 or S2 is set equal to zero, i.e., a single-stage contact is used, the resulting operating line, which extends from (X0, Y0) to (X2, Y2), will always have a slope –S/L greater than the combined slopes (S1/L + S2/ L) so that Ssingle stage > (S1 + S2)2-stage cascade i.e., the single stage always consumes more adsorbent for a given reduction in solute content than a two-stage arrangement. It follows that between the two extremes S1 = 0 and S2 = 0 there exists a combination S1 + S2, which represents a minimum total adsorbent inventory (ST)Min. This minimum amount can be determined by simple calculus for the case of linear equilibrium. We show this in the following illustration.
260
Mass Transfer: Principles and Applications Feed Point Stage 1 Slope = –S1/L
Y0
Y=
kg solute kg solvent
Equilibrium Curve Y* = f(X) Y1
Stage 2 Slope = –S2/L
Final Impurity Level Y2 X0
X2
X=
X1
kg solute kg adsorbent
FIGURE 7.8 Operating diagram for a two-stage crosscurrent adsorption process using fresh adsorbent.
Illustration 7.5: Optimum Use of Adsorbent or Solvent in Crosscurrent Cascades Consider a crosscurrent adsorption process in which the equilibrium is linear, a condition that holds at low solute level. We then have Xi = HYi H > 1
(7.10a)
where H is the Henry’s constant. Assume further that the adsorbent is initially clean, i.e., X0 = 0 (this is frequently the case). Substitution of Equation 7.10a into the two mass balances (Equation 7.9a and Equation 7.9b) then yields ÊY ˆ Y ST = S1 + S2 = HLÁ 0 + 1 - 2˜ Ë Y1 Y2 ¯
(7.10b)
The condition dST/dY1 = 0 is now used to establish the optimum intermediate concentration (Y1)opt, which will yield the minimum value of ST. We obtain dST/dY1 = Y0Y1–2 + Y2–1 = 0
(7.10c)
(Y1)opt = (Y0Y2)1/2
(7.10d)
and hence
261
Staged Operations: The Equilibrium Stage
In other words, the optimum solute level from the first stage that will minimize ST is the geometric mean of the concentrations entering and leaving the cascade. Let us see how this affects the amount of adsorbent to be used. Backsubstitution into the material balances (Equation 7.9a and Equation 7.9b) yields È Y0 ˘ S1 = HÍ - 1˙ 1/2 L ( ) Y Y Î 0 2 ˚
(7.10e)
È (Y Y )1/2 ˘ S2 = HÍ 0 2 - 1˙ L Î Y2 ˚
(7.10f)
Y0 Y0 (Y0Y2 )1/2 (Y0Y2 )1/2 = = (Y0Y2 )1/2 Y0Y2 Y2
(7.10g)
and
But
so that the bracketed terms in Equation 7.10e and Equation 7.10f are identical and consequently S1 = S2. Hence it is seen that in this case of a two-stage cascade with linear equilibrium, optimum operation calls for the use of equal amounts of adsorbent given by either Equation 7.10e or Equation 7.10f. It has been shown that this principle applies to any number of stages; i.e., the optimum use of adsorbent requires an equal division of that adsorbent among the stages of a crosscurrent cascade. The same principle applies to crosscurrent extraction of systems with mutually insoluble solvents. The solute recovery or removal that results in such cascades is depicted graphically in Figure 7.9. In this plot, m represents the distribution coefficient for extraction or Henry’s constant H for adsorption, E is the so-called extraction factor mB/A or HS/L, and Yn or xn is the effluent concentration from the nth stage of the solution being treated. Let us apply this plot to a specific extraction process. We consider 100 kg of a feed of 1% nicotine in water that is to be extracted in a three-stage crosscurrent cascade employing 50 kg kerosene in each stage. The distribution has a slight curvature, with m varying over the range 0.80 to 0.90. We choose a mean value of 0.85 and obtain the extraction factor: E = mB / A = 0.85
50 = 0.43 99
(7.11a)
Using Figure 7.9, this yields for solute-free kerosene (y0 = 0) the extraction ratio
262
Mass Transfer: Principles and Applications 1.0 0.6 0.4
E=0.1
0.2
0.2
0.3
x0 – y0/m Y0 – X0/H
0.4
0.06 0.04
0.5
0.6
0.02 0.01 0.006 0.004 1. 5
0.002
0.7 0.8 0.9 1. 1.1 0 1 1. .2 3
2. 0
0.0001
2.5 3.0
4
0.0006 0.0004
6
1
2
8 10 15
0 E=2
0.0002 0.0001
7
1.
R=
xn – y0/m
or
Yn – X0/H
0.1
3
4
5
6
7
8
9
10
N = Number of Ideal Stages FIGURE 7.9 Crosscurrent cascades using equal amounts of adsorbent or solvent.
xn = 0.34 x0
(7.11b)
xn = 0.34 ¥ 0.010 = 0.0034
(7.11c)
and consequently
The same value is obtained using the graphical construction of the operating diagram. Comments: The optimization problem considered indicates that the best way to operate a crosscurrent cascade is by equal subdivision of solvent or adsorbent. The reader should be aware, however, that the complete optimization of a plant must also consider the cost of the stages, the cost of solvent recovery, and the value of the extracted solute itself. Thus, in addition to optimum solvent use, we also need to determine the optimum number of stages, and this
Staged Operations: The Equilibrium Stage
263
requires bringing in all of the above-mentioned factors. Still, equal subdivision of solvent or adsorbent is a good policy to pursue and comes close to meeting the requirements of a global optimum for systems with linear distributions. When the equilibrium relation becomes nonlinear, the optimum policy begins to deviate from this norm and has to be determined anew, usually by numerical means. Illustration 7.6: A Crosscurrent Extraction Cascade in Triangular Coordinates We consider 1000 kg of a feed containing 50% by weight of acetone in water, which is to be reduced to 10% by extraction with 1,1,2-trichloroethane in a crosscurrent cascade; 250 kg solvent are to be used in each stage. Representative tie-line data are shown in Figure 7.10. Solution of this problem calls for the repeated application of the methods established for single-stage extraction in Illustration 7.2. We start by drawing a line connecting the solvent at B to the feed located at F, and follow this by locating the mixing point M, using Equation 7.4c. We obtain x M1 =
xF F 0.5 ¥ 1000 = 0.40 = F + B 1000 + 250
(7.12a)
The tie-line through this coordinate is shown in Figure 7.10 and yields raffinate and extract concentrations corresponding to the end points of the tie lines, i.e., x R1 = 0.35 and yE1 = 0.475. These values can then be used to calculate the amounts of raffinate and extract using Equation 7.4d and Equation 7.4e.
FIGURE 7.10 Operating diagram for Illustration 7.6.
264
Mass Transfer: Principles and Applications
E1 =
( F + B)( x M1 - x R1 ) yE1 - x R
=
(1000 + 250)(0.40 - 0.35) = 500 kg 0.475 - 0.35
R1 = F + B – E1 = 1000 + 250 – 500 = 750 kg The results of these calculations for four stages are given below: Stage
xM
1 2 3 4
0.400 0.262 0.159 0.0925
xR 0.35 0.223 0.134 0.075
yE
E
R
0.475 0.325 0.204 0.120
500 382 310 305
750 618 558 503
From this tabulation it emerges that three stages are too few and four stages too many to reduce acetone content in the raffinate to xR = 0.10. There are three alternatives we can pursue: 1. Use three stages and slightly more solvent per stage, determining the quantity to be used by trial and error until x R3 = 0.10. 2. Use four stages and slightly less solvent, again with a trial-and-error procedure. 3. Use four stages with the same amount of solvent and accept a lower acetone content of x R4 = 0.075 in the final raffinate. The last alternative is the most convenient, as well as the most practical, since the stage inefficiency will inevitably consume the margin provided by the fourth stage.
7.1.4
Countercurrent Cascades
The countercurrent cascade is the most popular among the various existing stage configurations. It combines economy of adsorbent or solvent consumption with a high recovery of solute, but pays for it in part with a greater number of stages than would be required in a comparable crosscurrent cascade. Perhaps its largest application apart from distillation operations occurs in the field of gas absorption, the flow sheet for which appears in Figure 7.11a. A corresponding countercurrent adsorption cascade is sketched in Figure 7.11b. The two assemblies are identical in concept but differ in the implementation of the countercurrent contact. Gas absorbers usually consist of vertical columns containing trays on which the two phases come into intimate contact. The gas enters from below through openings in the plate or tray and bubbles through the liquid, which flows across and down to the next tray. Displays of various types of trays are shown in Figure 7.12. Adsorption cascades in contrast consist of a series of stirred tanks from which the
265
Staged Operations: The Equilibrium Stage LS, XN + 1 GS, YN
a. Tray N LS, XN GS,YN – 1
Tray N – 1
Tray 2 LS, X2
GS, Y1
LS, X1
GS, Y0
Tray 1
b. L Y0 S Y1
Stage 1
Y1 X2
Stage 2
Y1 YN – 1 X3
Stage N
XN
L YN S
YN + 1
FIGURE 7.11 (a) Countercurrent gas adsorber and (b) countercurrent adsorption cascade.
two streams are withdrawn after allowing the two phases to separate by settling. In gas absorption, gas and liquid streams enter the bottom tray 1 and the top tray N at opposite ends of the cascade, carrying with them the solute concentrations Y0 and XN+1. They leave the same trays with concentration Y1 and XN. Note that the subscripts refer to the tray from which a particular stream exits, with the subscripts 0 and N + 1 representing imaginary stages numbered 0 and N + 1. Concentrations are expressed in mass ratios, and flow rates GS and LS in kg/s of solute-free carrier gas and solvent. Similar considerations apply to the adsorption cascade. Our tools again comprise mass balances and equilibrium relations, which are expressed graphically in the operating diagrams shown in Figure 7.13. They contain an operating line that represents the solute material balances and a staircase construction, which spans the interval between operating line and equilibrium curve and represents the various stages or trays. A material balance over the entire gas absorber leads to the equation
266
Mass Transfer: Principles and Applications
FIGURE 7.12 Types of trays: (a) bubble-cap tray: vapor rises through openings in the plate, reverses direction, and escapes through the slots of an inverted cup; (b) sieve tray; (c) valve tray: tray openings are adjusted by means of floating disks that rise and fall with the vapor flow rate.
Rate of solute in - Rate of solute out = 0 (LSXN+1 + GSY0) (LSX1 + GSYN) = 0
(7.13a)
Rearrangement then gives LS / GS =
YN - Y0 XN +1 - X1
(7.13b)
Usually in the design of countercurrent absorbers, the solvent rate LS and purity XN+1 as well as GS and Y0 are known, and the desired exit gas concentration YN is specified. Equation 7.13b can then be plotted in the operating diagram by drawing a line of slope LS/GS through the point (XN, XN+1).
267
Staged Operations: The Equilibrium Stage
a.
Y=
Y0
kg solute kg solvent
Operating Line Slope = S/L
"Pinch" Equilibrium Curve Y*= f(X)
1
Y1
Minimum Adsorbent Slope (S/L)min
2 Y2 YN – 1 YN
N
XN + 1 XN X=
b.
Y0 Y1
Y=
X2
X1
kg solute kg adsorbent
Operating Line Slope = LS/GS
kg solute kg carrier gas Y2
"Pinch" Equilibrium Curve Y*= f(X)
1
Minimum Solvent Slope (LS/GS)min
2
YN – 1 YN
N XN + 1 XN X=
X2
X1
kg solute kg solvent
FIGURE 7.13 Operating diagram for countercurrent cascades: (a) adsorption; (b) absorption.
Consider next a solute balance on a single stage, for example, tray 1. We obtain Rate of solute in - Rate of solute out = 0 (LSX2 + GSY0) (LSX1 + GSY1) = 0
(7.13c)
This equation can be represented in the operating diagram as follows: We locate the point (Y0, X1), where the abscissa value X1 is obtained from the intersection of the operating line with the horizontal ordinate value Y = Y0. We
268
Mass Transfer: Principles and Applications
next drop a vertical line from this point to the equilibrium curve Y* = f(X). The point of intersection will have the coordinates (Y1, X1), since these values represent the concentration levels leaving tray 1 and are known to be in equilibrium with each other. This is followed by drawing a horizontal line through (Y1, X1) all the way to the operating line. The point of intersection will have the coordinates (Y1, X2). This is shown by rearranging Equation 7.13c to read LS / GS =
Y1 - Y0 X 2 - X1
(7.13d)
which is the expression of a line of slope LS/GS that passes through the points (Y1, X2) and (Y0, X1). But Equation 7.13b, which has the same slope, also passes through the point (Y0, X1). The two lines (Equation 7.13b and Equation 7.3d) must therefore coincide, and we have established the first step of the staircase construction seen in Figure 7.13. This construction of alternating vertical and horizontal lines between operating line and equilibrium curve is continued until the known concentrations at the top of the column (YN, XN+1) are reached. A count is then made of the number of trays between gas inlet and outlet concentrations. That number represents the number of stage contacts required to reduce the feed concentration Y0 to the prescribed value of YN using a fixed solvent flow rate LS. A fractional step at the outlet end of the staircase is usually rounded off to one stage. We now note a number of features of this construction, which are of use in both engineering calculations and analysis. • The operating line in essence represents solute mass balances around a single stage or an aggregate of stages. Its coordinate points (Yj, Xj+1) establish the relation between concentrations entering a stage, while the equilibrium curve relates concentrations leaving a stage. • Reducing the amount of solvent LS (or adsorbent) lowers the slope of the operating line and simultaneously increases the number of stages required for a prescribed reduction in solute content. This process can be continued until the operating line intersects the equilibrium curve. At that point a “pinch” results at the high concentration end (Figure 7.13) yielding an infinite number of stages and a corresponding minimum flow rate of solvent or adsorbent. This is the lowest flow rate that will achieve the desired solute removal and is a useful limiting value to establish. Below that value, the prescribed effluent concentration YN can no longer be attained, even if an infinite number of stages were used. • An increase in solvent or adsorbent flow will reduce the number of contact stages and consequently lower the capital cost of the plant. This advantage is earned at the expense of an increase in operating costs occasioned by the higher flow of solvent or adsorbent. There consequently exists an optimum flow rate that will minimize the
Staged Operations: The Equilibrium Stage
269
combined operating and capital costs. That optimum can only be established with precision by a detailed economic analysis of the process. It has been found in such studies, however, that the optimum flow usually lies in the range 1.5 to 2 times the minimum value. That range is commonly used to establish the flow of solvent or adsorbent to be used, and hence the operating line, in preliminary designs of the process. • The reverse task to the design problem considered above, i.e., the prediction of the effluent concentration of an existing or hypothetical plant (number of stages N and feed conditions known) cannot be achieved in the same direct fashion. We must resort instead to a trialand-error procedure by drawing a series of parallel operating lines of known slope LS/GS or S/L until a staircase construction accommodating N stages reaches the known impurity level of the solvent or adsorbent. This presents no undue difficulties and can be accomplished quite rapidly. • The operating diagrams we have discussed are not only elegant in their simplicity but are also capable of conveying important information in rapid fashion. Thus, the effect of a change in flow rate, concentrations, or the number of stages can be quickly assessed, at least qualitatively, by visual inspection. Although in practice much of this work is now dealt with using appropriate computer packages, particularly in the case of multicomponent systems, the operating diagram remains unsurpassed in conveying the essence of staged operations and in providing a valuable educational tool. Illustration 7.7: Comparison of Various Stage Configurations: The Kremser-Souders-Brown Equation This example brings together the various stage arrangements discussed in the preceding sections and compares their performances. We consider an extraction process that is to be carried out, first in a single stage, and then for comparison in two-stage crosscurrent and countercurrent cascades. The two solvents involved are taken to be mutually insoluble, and the task is to determine the quantity of extraction solvent required per unit mass of raffinate solvent to reduce the solute content from a mass ratio of XF = 0.1 to X1 = 0.01. The distribution coefficient is constant at 3.0; i.e., the equilibrium is linear. We obtain the following results. 1. Single Stage The solute balance for this case is given by Mass of solute in - Mass of solute out = 0 AXF – (BY1 + AX1) = 0
(7.14a)
270
Mass Transfer: Principles and Applications
with Y1 given by the distribution coefficient m¢: Y1 = m¢X1
(7.14b)
Combining the two equations and rearranging yields B/ A =
X F - X1 0.1 - 0.01 = 3.3 = 3 ¥ 0.01 mX1
(7.14c)
and hence B = 3.3 kg solvent/kg raffinate solvent. 2. Two-Stage Crosscurrent Cascade Here we make use of the plot of Figure 7.9 to compute the solvent quantity, which is assumed to be divided equally between the two stages for optimum operation. We have for the ordinate value, assuming pure solvent y0 = 0, xn - y 0 / m X1 - Y0 / m 0.01 - 0 = = = 0.1 x o - y 0 / m X 0 - Y0 / m 0.1 - 0
(7.14d)
For N = 2, this yields the parameter value E = mB/A = 3.3
(7.14e)
B/A = 3.3/3.0 = 1.1
(7.14f)
and hence from Figure 7.9
which is the quantity of solvent used in each stage. Multiplying by 2 we obtain for the solvent total BTot = 2 ¥ 1.1 = 2.2 kg solvent/kg raffinate solvent
(7.14g)
3. Two-Stage Countercurrent Cascade Here we make use of the fact that for systems with linear equilibria, an analytical expression can be derived that relates the number of stages to the operating parameters. That expression is known as the Kremser-SoudersBrown equation (or Kremser equation for short), and is given by R= or in rearranged form
E n +1 - E E n +1 - 1
(7.15a)
271
Staged Operations: The Equilibrium Stage log[R(1 - 1 / E) + 1 / E] log E
N=
(7.15b)
A plot of Equation 7.15b appears in Figure 7.14. By suitably defining the parameters R and E the Kremser equation can be used for any countercurrent cascade involving linear-phase equilibria. These parameter definitions are listed in Table 7.1 and provide a convenient dictionary for use in a number of important operations.
1.0 0.8 0.6
E 0.3 0.5 0.6
0.4
0.7
0.3
0.8
0.2
0.9
0.1 0.08 0.06
0.95
0.04
1.0
0.03
R
0.02
1.05 1.1
0.01 0.008 0.006
1.2
0.004
1.3
0.003
E
0.002
0.001 0.0008 0.0006 0.0005
1
2
3
5.0 3.0 2.5 4.0
4 5 6
1.6 1.4 1.5 2.0 1.8
8 10
20
30
40 50
N = Number of Theoretical Stages FIGURE 7.14 Countercurrent cascade with linear equilibrium; graphical representation of the Kremser equation; for definition of the residue factor R and extraction ratio E, see Table 7.1.
272
Mass Transfer: Principles and Applications
TABLE 7.1 Operating Parameters for Use in the Kremser Plot R
E
Gas absorption
YN - HX N +1 Y0 - HX N +1
L HG
Y (gas) = HX (liquid)
Liquid extraction
X n - Y0 / m X 0 - Y0 / m
mB A
Y (extract) = mX (raffinate)
Liquid adsorption
YN - X N +1 / H Y0 - X N +1 / H
HS L
X (solid) = HY (liquid)
Solids leaching
YN - mX N +1 Y0 - mX N +1
S mL
Y (liquid) = mX (solid)
Operation
Equilibrium
The parameter R, which we term the residue factor, is a direct measure of the amount of residual solute leaving the cascade. The smaller the value of R, the lower the effluent concentrations YN or XN , and hence the higher the degree of solute recovery. The parameter E, on the other hand, is identical to the extraction ratio we have defined for crosscurrent extraction (Equation 7.11a) and varies directly with the amount of solvent or adsorbent used and its capacity. Large values of E lead to good recoveries and low effluent concentrations, both desirable features. With these definitions in place, we can calculate the solvent requirement for the two-stage countercurrent process. We have for the residue factor R R=
X 2 - Y0 / m 0.01 - 0 = = 0.10 X 0 - Y0 / m 0.1 - 0
(7.15c)
and hence a solute recovery r = 1 – 0.10 = 0.9 or 90%. The corresponding value of E, read from Figure 7.14, is 2.6. Hence E = mB/A = 2.6 and B/A = 2.6/3 = 0.87 Therefore, B = 0.87 kg solvent/kg raffinate solvent
(7.15d)
Staged Operations: The Equilibrium Stage
273
This example shows the distinct advantage that the countercurrent process holds, not only over the single-stage operation, which was expected, but also over its crosscurrent counterpart: Consumption by the latter is higher by a factor of 2.2/0.87 @ 2.5. The principal advantage of the crosscurrent cascade is that it is more easily adaptable to batch processing, whereas the countercurrent cascade is by necessity continuous. The Kremser plot, Figure 7.14, serves several additional useful purposes. We illustrate this with the following examples: Suppose that an existing gas absorber using clean solvent has its feed rate G doubled over the previous design value. A quick scan of the Kremser plot shows that to maintain the same effluent concentration YN or solute recovery as before, the solvent flow rate L would likewise have to be doubled. Similar considerations apply to adsorption, extraction, and leaching. Consider next the same unit subjected to a twofold increase in feed concentration Yo. If no remedial action is taken, the residue ratio YN/Yo will remain the same, but the effluent concentration YN will double. To bring it down to its previous value, solvent flow rate and hence E would have to be increased. The amount of adjustment needed can once again be determined quickly through the use of Figure 7.14. Finally, a closer examination of Figure 7.14 shows that at E values below unity, the plots veer off and asymptotically approach a constant value of R. This implies that we cannot, under these conditions, attain arbitrarily low effluent concentrations, no matter how high we set the level of solvent or adsorbent flow rate or indeed the number of stages. The value of E = 1 consequently represents an important watershed point, below which it becomes impractical or impossible to attain a desired goal. The reasons for this behavior are addressed more fully in Illustration 8.2. 7.1.5
-Thiele Diagram Fractional Distillation: The McCabe-
The operation of a conventional tray fractionation column, and the associated variables, is sketched in Figure 7.15. Although the process has most of the standard properties of a staged countercurrent operation we have seen before, it does display a number of new features that require special mention: • The feed to be fractionated, which can be a liquid, a vapor, or even a combination of both, enters the column at some central location rather than at one of the ends of the cascade as had previously been the case. This results in a division of the column into two parts, the rectification or enriching section above the feed tray, and the stripping or exhausting section below it. The upper section serves to enrich the vapor in the more volatile components, a portion of which is ultimately withdrawn as liquid “overhead product” or “distillate.” In the lower section, residual volatile components are progressively stripped off the liquid and conveyed upward as vapor, while the downward flow of liquid becomes enriched in the heavier or less-volatile components.
274
Mass Transfer: Principles and Applications Condenser qC J/s out
Distillate D XD HD
Reflux L0 x0 HL0
1
Rectifying (Enriching) Section
n
Ln Gn+1 xn yn+1 HLn HG,n+1
Feed F xF HF m
Stripping (Exhausting) Section Lm xm HL,m
Gm+1 ym+1 HG,m+1
Reboiler qB J/s in Residue W xW HW FIGURE 7.15 The fractionation column.
• The two streams entering the ends of the column are generated in separate vaporizers or “reboilers” and in condensers located at the two outlets. At the top, vapor leaving the column is condensed and returned in part to the column as “reflux,” while the remainder is withdrawn as distillate. At the bottom, the exiting liquid is partly revaporized in a reboiler and the vapor is diverted back into the column. The remainder of the stream is removed as “bottom product” or residue.
275
Staged Operations: The Equilibrium Stage
• In contrast to the processes we encountered previously, which were largely or entirely isothermal in nature, distillation has substantial heat effects associated with it. Consequently, we expect heat balances to be involved in modeling the process, as well as the usual mass balances and equilibrium relations. These balances are formulated entirely in molar units because the underlying equilibrium relations, such as Raoult’s law and its extension, or the separation factor a, are all described in terms of mole fractions. Thus, the flow rates L and G, which appear in Figure 7.16, are both in units of mol/s, enthalpies H in units of J/mol, and the liquid and vapor compositions are expressed as mole fractions x and y of a binary system. • Column operation is usually taken to be isobaric, so that temperatures within the column will vary and lie in the range between the boiling points of the overhead and bottom products. The appropriate equilibrium diagrams for this case are the boiling-point diagram (Figure 6.17a) and the x-y diagram (Figure 6.17c). The latter is used in the construction of the operating diagram that is taken up further on. 7.1.5.1
Mass and Energy Balances: Equimolar Overflow and Vaporization There are three balances for the binary system considered here: the total mole balance, the component mole balance, and the heat balance. It is customary to apply these in unison and in turn to three separate regions of the fractionation column. One set each is used to describe conditions above and below the feed tray, i.e., the rectifying and stripping sections. These balances are taken over the entire upper and lower portions and include the reboiler and condenser as well as the product stream. A third set of balances is applied to an isolated stage, the feed tray, and includes the flow rates and thermal condition of the incoming feed. Let us see how this works out in practice. For the rectifying section, we have Rate of total moles in - Rate of total moles out = 0 Gn+1 (Ln + D) =0
(7.16a)
Rate of component moles in - Rate of component moles out = 0 yn+1Gn+1 (xnLn + xDD) = 0 (7.16b) Rate of heat in - Rate of heat out Gn+1HG,n+1 - (LnHL,n + DHD + qC)
=0 =0
(7.16c)
where qC is the heat removed in the condenser. Elimination of D from the mass balances leads, after some rearrangement, to the following expression:
276
Mass Transfer: Principles and Applications
a.
G y1
1 2
L D x0=xD xD R= L D
x1 y2
yn
n
L xn
G yn+1
b. y1 y2
1 2 y* vs. x
y, yn+1 Vapor Mole Fraction
P
n
xD R+1
Slope= L = R G R+1
xF
x1
x0=xD
x, Liquid Mole Fraction FIGURE 7.16 Details of the rectifying (enriching) section: (a) flow diagram; (b) operating diagram.
Ln y - xD = n +1 Gn+1 xn - xD
(7.16d)
This is the operating line for the enriching section. It relates the vapor composition yn+1 entering a tray and that of the liquid leaving, xn, and has a slope equal to the ratio of liquid-to-vapor flow rates Ln/Gn+1. The corresponding operating line for the stripping section is given by
Staged Operations: The Equilibrium Stage y - xw Ln = m G n +1 y n +1 - x w
277
(7.16e)
where the bar is used to indicate the position below the feed tray to distinguish these quantities from their counterparts in the rectifying section. To this point it has been assumed that all quantities vary from tray to tray and that consequently 3(N + 2) balances will be required to describe the operation. Here N denotes the number of stages, with an additional 3 ¥ 2 equation needed to balance the flow of mass and heat about the condenser and reboiler. These have to be further supplemented by expressions relating each enthalpy to the key state variables x, y, and T. Evidently, we are dealing with a model of considerable complexity and dimensionality, which would require a numerical solution. We now introduce the reader to a concept that avoids this complication and drastically reduces the complexity of the model. We draw for this purpose on the heat balance, Equation 7.16c, and rearrange it to read H G , n +1 - H L , n Ln = 1Gn+1 qC / D + H D - H L ,n
(7.16f)
where qC is the condenser heat load in J/s. A first simplification comes about by noting that the sensible heat of the liquid on tray n, HL,n , is much smaller than the term qC/D + HD, which involves the latent heat of condensation. HL,n can, therefore, to a good approximation, be neglected in comparison to this term. If we make the further assumption that the substances have very similar molar latent heats of vaporization DHv , we can approximate the numerator by the relation H G ,n+1 - H L ,n =˙ DH v
(7.16g)
so that the ratio of flow rates becomes a constant for all trays of the enriching section. Similar arguments can be applied to the exhausting section, with the result that Ln = K1 Gn+1
(7.16h)
Lm = K2 G n+1
(7.16i)
278
Mass Transfer: Principles and Applications
Consider next a total mole balance about the nth tray: (Ln-1 + Gn+1) – (Ln + Gn) = 0
(7.16j)
If we now substitute Equation 7.16h into this relation, there results K1Gn + Gn+1 – K1Gn+1 + Gn = 0
(7.16k)
Gn+1 = Gn
(7.17a)
Ln–1 = Ln
(7.17b)
and consequently
and
We have, in other words, shown that if we assume latent heat to be the predominant thermal quantity in distillation and that this property comes close to being identical for the two components, the vapor and liquid flow can, for practical purposes, be considered constant in the rectifying section. A similar procedure applied to the stripping section leads to the conclusion that here also the flow rates will remain practically constant although different in value from those of the enriching section because of the intervening flow of feed. What we have just derived is referred to as the principle of equimolal overflow and vaporization. 7.1.5.2 The McCabe-Thiele Diagram One immediate consequence of the principle of equimolal overflow and vaporization is a drastic simplification of the operating lines (Equation 7.16d and Equation 7.16e). Whereas previously these expressions had to be plotted laboriously step by step from tray to tray, we are now dealing with a straight line that can be drawn easily, knowing only its slope and the location of one point or, alternatively, two points. The slope L/G of the enriching operating line is referred to as the internal reflux ratio. It is not a convenient quantity to deal with since it is usually neither known nor specified, nor can it be easily manipulated in actual column operations. A more suitable parameter, and one that is easily controlled by appropriate valve settings, is the external reflux ratio, or reflux ratio R for short. This quantity represents the ratio of liquid flow L returned to the column as reflux to the flow of distillate D withdrawn as product, and is given by R = L/D
(7.18a)
Thus, when R = 3, 3 moles of liquid product are returned to the column for each mole withdrawn.
Staged Operations: The Equilibrium Stage
279
We can now recast the operating line (Equation 7.16d) in terms of this new parameter R by using a set of revised mole balances around the envelope shown in Figure 7.16a. We have in the first instance Rate of total moles in - Rate of total moles out = 0 G – (L + D) = 0
(7.18b)
and obtain after combining this expression with Equation 7.18a: G = D(R + 1)
(7.18c)
The corresponding component mole balance is given by Gyn+1 – (Lxn + DxD) = 0
(7.18d)
or y n +1 =
D L xn + xD G G
(7.18e)
Consequently, using Equation 7.18a and Equation 7.18c yields y n +1 =
x R xn + D R+1 R+1
(7.18f)
This is the equation of a straight line with slope R/(R + 1), which has an intercept on the ordinate of xD/(R + 1) and passes as well through the point y = xD on the 45r diagonal. This point and the y-intercept, which are usually known or prescribed, permit easy construction of the operating line, as shown in Figure 7.16b. The concentration associated with the various trays can then be derived using the “staircase” construction we employed for the countercurrent gas absorber described in Section 7.1.4 and Figure 7.13a. Each point on the curve y* = f(x) represents the concentrations leaving a particular tray, (yn, xn), which are in equilibrium with each other, while those on the operating line relate the entering vapor composition to that of the exiting liquid. Let us next consider the corresponding balances around the exhausting section, shown in Figure 7.17a. Here there is no simple relation to the reflux ratio R, but the operating line (Equation 7.16e) is nevertheless considerably simplified because the flow rates are now constant throughout the entire section, although they differ in magnitude from those of the rectifying portion of the column. We have for the total and component mass balances, respectively,
280
Mass Transfer: Principles and Applications m m+1
L G Xm ym+1
a. yN Np G yW
L xN
W xW
b.
m
ym+1
m+1
y, Vapor Mole Fraction yN
N
yW Reboiler
xW xN
xm
x, Liquid Mole Fraction FIGURE 7.17 Details of the exhausting (stripping) section: (a) flow diagram; (b) operating diagram.
Rate of moles in - Rate of moles out = 0 L – (G + W ) = 0
(7.19a)
Staged Operations: The Equilibrium Stage
281
and Lx m - (Gy m+1 + Wx w ) = 0
(7.19b)
so that L W xm x G G w
(7.19c)
L W x x L -W m L -W w
(7.19d)
y m +1 = or alternatively y m +1 =
This is the equation for the straight operating line shown in Figure 7.17b, which has a slope of L / L - W and passes through the point y = x = xw on the 45r diagonal. If the vapor entering the column yw is in equilibrium with the residue composition xw, the reboiler can be taken to represent an additional equilibrium stage, and this is so indicated in the operating diagram of Figure 7.17b. Once the operating line is established, the usual staircase construction can be used to step off the number of stages, as shown in Figure 7.17b. It is not clear, however, how this is to be accomplished, because only one point, y = xw on the diagonal, is known or prescribed and we have no a priori knowledge of either a second point or the slope of the line. In other words, the equation for the stripping operating line, as it stands, contains too many undefined variables. Some reflection will show that this must indeed be so. This follows from the fact that the liquid flow will be influenced by what comes down from the feed tray, and we must consequently draw on an additional balance, performed around that tray. We first compose the total mole balance, and follow this with an energy balance around the feed tray. We obtain Rate in - Rate out = 0 ( F + L + G) – (G + L) = 0
(7.20a)
and FH F + LH L + GH G = GH G + LH L
(7.20b)
These two equations can be combined and rearranged to yield the expression
282
Mass Transfer: Principles and Applications L - L HG - H F = =q F HG - H L
(7.20c)
The ratio of enthalpy differences, which appears in this equation and which we have denoted q, represents the molar heat of vaporization of the feed divided by the molar latent heat of vaporization of the binary system, assumed to be constant. Suppose, for example, that the feed consists of either saturated vapor or saturated liquid. Then the value of q will be 0 or 1, respectively, and for a partially vaporized feed it will lie somewhere between these two limits. The quantity q is therefore a dimensionless measure of the thermal quality of the feed. It turns out that q also enters into the construction of the locus of the points of intersection of the two operating lines of the enriching and stripping sections. That locus is represented by the expression y=
x q x- F q-1 q-1
(7.20d)
which for a given q is the equation of a straight line of slope q/(q – 1) passing through the point y = x = xF. A series of such lines for various thermal conditions of the feed are shown in Figure 7.18. Proof of these relations is somewhat lengthy and can be found in standard texts. 7.1.5.3 Minimum Reflux Ratio and Number of Plates The reader will recall that in the discussion of the countercurrent gas scrubber, Section 7.1.4, we mention the limiting case that arises when the slope of the operating line and the associated solvent flow is progressively reduced until it intersects the equilibrium curve. This results in a condition termed a pinch and corresponds to a cascade with an infinite number of stages and a minimum solvent requirement. Any solvent flow rate below this value causes a rise in the effluent concentration and can therefore no longer meet the specified solute recovery. In distillation, the liquid reflux returned to the top of the column plays, in a sense, very much the role of a solvent. In the course of its downward flow, it dissolves residues of the heavy component contained in the vapor phase and thereby contributes to its enrichment in the lighter, more volatile component. A reduction of reflux, or of the reflux ratio, may therefore be expected to result in an increase in the required number of stages in much the same way as happens in the case of the gas scrubber. Ultimately, when the operating lines simultaneously intersect the equilibrium curve, a pinch results and the number of stages goes to infinity. This is shown in Figure 7.19a. The reflux ratio at which this occurs can be read from the intercept xD/(R + 1) and represents the minimum required to achieve the desired separation. Let us now proceed in the opposite direction and progressively increase the reflux ratio. Both the logic of the preceding argument and Figure 7.19
283
Staged Operations: The Equilibrium Stage
a.
FEED GF,yF,HGF F LF,XF,HLF
b.
L HL
G HG
L HL
G HG
Liquid Sat'd Below Liquid B.P. Liquid + Vapor
y, Vapor Mole Fraction
q–Lines
Sat'd Vapor
Superheated vapor
XW
XF
XD
x, Liquid Mole Fraction FIGURE 7.18 The feed plate: (a) flow diagram; (b) feed quality and the q-line.
indicate that this will lead to a decrease in the number of theoretical trays required. A limit is reached when no distillate is withdrawn and the entire overhead product is returned to the column as reflux. The operation is then said to be at total reflux. The reflux ratio becomes infinity, R = L/D = L/0 = •, and the operating line assumes a slope of 1; i.e., it coincides with the 45r diagonal. This is shown in Figure 7.19b. These two asymptotic cases are immensely useful in conveying to the analyst the lower limits of R and N, below which the desired separation will no longer proceed. In an actual operation, these values evidently must be exceeded and both R and N will assume finite values. The best or optimum value of R and N to be used will be determined by economic considerations, i.e., when the total cost consisting of fixed and operating costs is at a minimum. Let us see how this minimum comes about.
284
Mass Transfer: Principles and Applications
FIGURE 7.19 Two limiting conditions: (a) minimum reflux; (b) minimum number of trays.
Operating costs, consisting of condenser and reboiler loads as well as pumping costs, are at their lowest value when R is at a minimum. As R is gradually increased, these costs begin to rise in almost direct proportion and ultimately tend to infinity as R Æ •. There is consequently no minimum in this item. The fixed costs, on the other hand, are at first infinite at RMin because of the infinite number of trays required. They then sharply drop as R is slowly increased above its minimum value because the number of trays has now become finite. As this process is continued, however, the size and cost of the condenser, reboiler, and reflux pump begin to creep up, eventually overtaking the cost reduction occasioned by the decrease in the number of plates. The fixed costs consequently, and in contrast to the operating costs,
Staged Operations: The Equilibrium Stage
285
pass through a minimum and the sum of the two results in an optimum reflux ratio, ROpt. It has been found in practice that this optimum lies close to the minimum reflux ratio and is frequently, but not always, found in the range 1.2 to 1.5 times RMin. This set of values is invariably used in the preliminary design of fractionation columns. The reader is referred to Figure 8.2 for a similar optimization problem, which arises in the operation of gas scrubbers. Illustration 7.8: Design of a Distillation Column in the McCabe-Thiele Diagram The intent of this example is to acquaint the reader with the principal steps involved in designing a distillation column and to demonstrate their implementation by means of the McCabe-Thiele diagram. We start by listing the parameters, which in the usual course of the design are either prescribed or known a priori: 1. Feed rate F and composition xF 2. Thermal condition of feed 3. Distillate composition xD and bottoms composition xw 4. Reflux ratio, usually specified as a multiple of the minimum reflux ratio 5. Thermal condition of the overhead and bottoms product The parameters or quantities to be calculated are as follows: 1. Number of theoretical stages 2. Heat load for the condenser and reboiler 3. Recovery of overhead product We consider a hypothetical system with an x-y equilibrium relation as shown in Figure 7.20. The feed, entering at the rate of 10 mol/s, is known to have a composition xF = 0.38 and consists entirely of saturated liquid at its boiling point. Overhead and bottoms compositions are specified at xD = 0.92 and xw = 0.01, respectively. A value 1.5 times the minimum reflux ratio is to be used. The first step in the procedure is to establish the q-line. This is a straightforward matter because the feed consists of saturated liquid and the q-line is consequently vertical. In the second step, an operating line is drawn from distillate composition y = x = xD through the point of intersection of the q-line with the equilibrium curve, which results in a pinch and represents minimum reflux conditions. The intercept of this line on the ordinate is given by xD/(RMin + 1) and establishes the minimum reflux ratio. We have
286
Mass Transfer: Principles and Applications 1.0 0.9 0.8
q-line
0.7
y, Vapor Mole Fraction
1
y* vs. x
Min. Reflux
0.6
xD
3 4 Enriching operating line
5
XD R+1
0.5
2
6
0.4
Exhausting operating line
0.3
7
0.2 0.1 0
8
0
XW 0.1
ZF 0.2
0.3
0.4
0.5
0.6
0.7
0.8
0.9
1.0
x, Liquid Mole Fraction FIGURE 7.20 Operating diagram for Illustration 7.6.
xD = 0.575 RMin + 1
(7.21a)
and consequently RMin =
0.92 - 1 = 0.6 0.575
(7.21b)
The actual reflux ratio to be used is 1.5 times this minimum; i.e., R = 1.5 ¥ 0.6 = 0.9. We now repeat the second step, but this time draw the line through the new intercept, i.e., xD/(R + 1) = 0.92/(0.9 + 1) = 0.48. This is the actual operating line to be used in stepping off the number of theoretical trays. In step four, we start the staircase construction at the distillate composition y = x = xD and proceed downward, alternating between equilibrium curve and the enriching operating line. When the feed composition is reached, a crossover is made to the exhausting operating line, with the feed tray 5 straddling the q-line. The construction is then continued until we reach the bottoms composition y = x = xw = 0.01. This occurs after eight stages have been stepped off. Since the liquid bottoms product and the vapor returning to the column are usually at or near equilibrium, it is customary to consider
Staged Operations: The Equilibrium Stage
287
the reboiler an additional theoretical stage. The column will consequently comprise eight theoretical stages plus the reboiler. Let us next turn to the computation of condenser and reboiler heat loads. We assume that the relevant enthalpies have been computed and are given by HG = 50 kJ/mol, HL,D = 10 kJ/mol, HL,W = 12 kJ/mol To compute the heat loads, we require the vapor flow rates into the condenser and out of the reboiler. These are obtained by a series of total and component balances, starting with those taken over the entire column. Thus, Rate of moles in - Rate of moles out = 0 F – (W + D) = 0
(7.21c)
xFF – (xWW + xDD) = 0
(7.21d)
10 - (W + D) = 0
(7.21e)
0.38 ¥ 10 – (0.01 W + 0.92 D) = 0
(7.21f)
W = 5.93 mol/s and D = 4.07 mol/s
(7.21g)
and
or
and
from which
We then obtain from Equation 7.18c G = D(R + 1) = 4.07(0.9 + 1) = 7.73 mol/s
(7.21h)
Because the feed enters entirely as a liquid, the vapor flow rate will remain constant over the entire column, so that G = G . We consequently have for the heat loads qC = G(HG – HL,D) = 7.73 (50 – 10)
(7.21i)
qC = 309 kJ/s
(7.21j)
288
Mass Transfer: Principles and Applications
and qB = G( H G − H L ,w ) = 7.73(50 − 12)
(7.21k)
qB = 294 kJ/s
(7.21l)
The recovery r of overhead product is given by r=
x D D 0.92 × 4.07 = = 0.985 or 98.5% xF F 0.38 × 10
(7.21m)
Comments: This example was used to illustrate to the reader the use of the McCabe− Thiele diagram and the elegant and simple way in which it conveys the design information. In practice, the systems tend to be more complex than the simple binary example used here, and the computations are done using appropriate computer packages. Today, these packages are quite powerful and are able to handle mixtures of many components without recourse to the simplifying assumption of equimolal overflow and vaporization. The McCabe−Thiele diagram nevertheless remains a valuable tool for visualizing the principal features of the fractionation process and for providing the student an entry into the treatment of more complex systems.
Illustration 7.9: Isotope Distillation: The Fenske Equation Vapor−liquid equilibria of isomeric or isotopic mixtures perhaps come closest to showing perfect ideal behavior and a separation factor, which for all practical purposes remains constant over the entire range of compositions. Distillation is the most commonly used technique for the separation or enrichment of several important isotopes. Both C13 and O16O18 are produced by the low-temperature distillation of carbon monoxide and oxygen in small commercial installations. Although these processes are generally carried out in packed columns, all preliminary design questions are settled by deducing the number of theoretical plates for a required separation, starting with the minimum number needed to achieve the desired result. These values are then translated into packing heights using the concept of the height equivalent to a theoretical plate (HETP), which has been taken up in Chapter 5, Section 5.4. Suppose we wish to gain an idea of the requirements for distilling the isotopic pair C12O–C13O, for which the value of α is 1.01 (see Table 6.9) with the equilibrium curve very close to the diagonal, which represents total reflux conditions. Here, a graphical construction on the McCabe−Thiele diagram does not recommend itself, since the operating and equilibrium curves are
Staged Operations: The Equilibrium Stage
289
too close together to allow a precise determination of the number of theoretical plates. Fortunately, for systems with a constant separation factor and operating at total reflux, a simple analytical treatment is possible, which leads to a relation between the minimum number of plates, the separation factor a, and the product compositions. This expression, known as the Fenske equation, is derived as follows. We start by applying the definition of the separation factor, Equation 6.22a, to the reboiler and obtain yw x =a w 1 - yw 1 - xw
(7.22a)
At total reflux the operating line coincides with the 45r diagonal so that yw = xN. Equation 7.22a becomes xN x =a w 1 - xN 1 - xw
(7.22b)
A similar scheme can be applied to the Nth plate, yielding yN xN xw =a = a2 1 - yN 1 - xN 1 - xw
(7.22c)
Continuing the procedure up the column we ultimately obtain xw xD = a N +1 1 - xD 1 - xw
(7.22d)
or equivalently ln N +1=
xD 1 - x w 1 - xD x w ln a
(7.22e)
This is the expression due to Fenske. A further simplification results for separation factors close to 1, for then we have by a Taylor-expansion of the denominator ln a @ a – 1 a ª 1 and consequently
(7.23a)
290
Mass Transfer: Principles and Applications
N +1=
È x 1 - xw ˘ 1 ln Í D ˙ a - 1 Î 1 - xD x w ˚
(7.23b)
Let us apply this expression to the distillation of the carbon monoxide isotopes, with the aim of obtaining products of xD = 0.9 and xw = 0.1. We have N +1=
1 0.9 1 - 0.1 ln 1.01 - 1 0.1 0.1
(7.24a)
N + 1 = 439
(7.24b)
N = 438
(7.24c)
and therefore
or
Thus, a minimum of more than 400 theoretical plates is required to achieve the desired separation; this is an enormous number. Fortunately, high-efficiency packings are now available with equivalent heights HETP of the order of 1 cm. This limits the size of the column to heights that are not excessive and can be implemented in practice. Comments: One feature of isotope distillation that may have been noted by the reader is the extreme sensitivity of the number of plates N to the value of a. Suppose that we manage by some means — for example, by a change in operating pressure — to increase the separation factor of the CO isotopes from 1.01 to 1.02. This represents a rather modest increase of only 1% in the value of a, which would normally have no more than a marginal effect on N. For separation factors close to 1, however, the effect is dramatically enhanced as a result of the appearance of the term a - 1 in the denominator of Equation 7.23b. The seemingly insignificant change in a of only 1% translates here into a reduction of the number of plates from 438 to fully one half that value. This will evidently result in a considerable reduction in both the size and cost of the fractionation column. Any increase in a, no matter how small in appearance, is therefore welcome in isotope or isomer distillation, and methods for achieving this increase should be fully explored before settling on a particular process. Illustration 7.10: Batch-Column Distillation: Model Equations and Some Simple Algebraic Calculations Frequently, in the production of rare and valuable substances, the material flow is too small to make continuous distillation for the purpose of separation
Staged Operations: The Equilibrium Stage
291
or purification practicable. The intermediate or raw product is then accumulated and held in storage before being fed to the fractionation column in intermittent batches. The distillation process, which is now an unsteady one, can be carried out in two modes. In the first mode, we allow distillation to proceed without outside intervention and at constant reflux until a prescribed fraction of the charge has been boiled off or the still contents have been concentrated to some desired value. In the course of the process, both the instantaneous and cumulative distillation composition xD and xD¢, as well as the contents of the still, undergo a slow and continuous change. In the second mode of operation, which is more common, the reflux ratio is continually and automatically adjusted to maintain a constant xD. The boiler contents still change, as does the reflux ratio, but both the instantaneous and cumulative overhead compositions remain invariant with time. We now introduce two assumptions that allow us to draw on the principles and diagrams we have previously established and used to describe continuous distillation. The first assumption presumes that the liquid content of the trays, or hold-up as it is termed, is negligible compared to the still contents. This allows us, in any material balance performed over the column, to ignore the contribution due to hold-up. In the second assumption, we stipulate that the process is sufficiently slow that the system has time to adjust to a quasisteady state at any instant of the operation. This highly important assumption allows us to represent both modes of operation on a McCabe-Thiele diagram, which was originally derived for steady-state operations. The difference here is that instead of dealing with a single operating line, we now must deal with a continuous spectrum of such lines, which can, however, be accommodated on a single diagram. This has been done in Figure 7.21, which displays the two cases of constant and varying reflux we have described. The first case is displayed as follows: Case 1: Constant xD, Variable R 1. Minimum Reflux Ratio. Here we are dealing with a single operating line that extends from the desired overhead composition xD to the batch-feed composition denoted xF. The line is drawn through the points x = y = xD and xWo,y*W, as shown in Figure 7.21b. The minimum reflux ratio is then determined from the intercept xD/(RMin + 1). 2. Number of Theoretical Plates. An actual reflux ratio is set next, which leads to an operating line with intercept xD/(R + 1), as shownin Figure 7.21b. The number of theoretical plates is then stepped off between operating and equilibrium curves, as was done in the case of continuous fractionation, and yields a total of four stages between the composition xD andxWo. As the distillation proceeds, the reflux ratio is gradually increased to maintain a constant overhead composition, causing the bottoms mole fraction to diminish. The process can be
292
Mass Transfer: Principles and Applications
a. 1 3
y, Vapor Mole Fraction
2
1 2
XD R+1
Final Initial State State xW xD xW0
xD0
x, Liquid Mole Fraction
b. 1 2 3 4
y, Vapor Mole Fraction
2
3
4
XD R+1
Final State
xW
Initial State
xW 0
xD
x, Liquid Mole Fraction FIGURE 7.21 The two types of batch distillation processes: (a) varying distillate composition with constant reflux ratio; (b) varying reflux ratio with constant distillate composition.
stopped when a prescribed composition or recovery is reached, or it can be continued until the column is at total reflux. xW is then at its lowest point and fractional recovery at its maximum. We have reached the final state shown in Figure 7.21b. 3. Fraction Distilled and Recovery. Much of the time in actual operations, we wish to determine the fraction f = 1 - W/Wo that needs to be distilled to achieve a prescribed bottoms composition xW or recovery r defined as r | 1 – xWW/xWoWo = 1 – (1 – f)(xW/xWo). Although it is not immediately clear how we should proceed to obtain these quantities, a good way to start is by composing total and component material balances about the entire column. We have
293
Staged Operations: The Equilibrium Stage
Rate of moles in - Rate of moles out =
0-D=
d contents dt
d W dt
(7.25a)
d x W dt w
(7.25b)
and 0 - xD D =
These are the same equations, in form at least, as those we have seen in the Rayleigh distillation of Illustration 7.3. The difference here is that xD is not in equilibrium with xW but represents an independent entity set by the operator. Proceeding as in Illustration 7.3, the two equations are divided to eliminate D and dt, and we obtain, after some manipulation, the result
Ú
W
Wo
dW W = ln o = W W
Ú
xW
xW o
dxW xD - xW
(7.25c)
Because xD is the prescribed and constant overhead composition, Equation 7.25c can be immediately integrated to yield x - xW o W = D o W xD - xW
(7.25d)
After some rearrangement this becomes, for the volatile component, WoxWo
=
(Wo – W)xD
Initial
Moles
Moles
Distilled
+
WxW
(7.25e)
Moles Left Over
In other words, what we have derived here is nothing but a cumulative balance to time t of the volatile component, which could have been obtained directly by algebraic means. It can be rearranged to obtain the desired relation between fraction distilled f and recovery r in terms of the known values of xD and xWo This results in the following simple expressions:
294
Mass Transfer: Principles and Applications r = 1 - xW W / xW oW o = fxD / x w o or r = 1 - (1 - f )( xW / xW o ) = fxD / x w o
(7.25f)
Note that the first part of each expression represents the definition of r, and the second part comes from the cumulative balance (Equation 7.25e). Of the host of equations available, Expression 7.25f is by far the most fruitful and also the simplest to apply. It is quite generally valid, subject only to the condition that xW cannot fall below the minimum attained at total reflux. We demonstrate its use by returning to Figure 7.20 of Illustration 7.8 and use the same prescribed overhead composition xD = 0.92 and reflux ratio R = 0.9, but raise xWo to 0.55 so that exactly three plates are accommodated on the operating diagram. To obtain the maximum recovery possible under these conditions, we carry the process to total reflux and determine the corresponding xW. The reader will verify that if we step off three plates, starting at xD = 0.92 and using the diagonal as operating line, we obtain xW = 0.175. To calculate rMax, we first solve Equation 7.25f for fraction distilled f and then by backsubstitution for recovery r. This yields
f=
xW o - xW 0.55 - 0.175 = 0.503 = 0.92 - 0.175 xD - xW
(7.25g)
and by backsubstitution
rMax = f
xD 0.92 = 0.503 xW o 0.55
rMax = 0.84
(7.25h)
(7.25i)
Thus the maximum recovery we can achieve with three plates and a reflux ratio of 0.9 is 84%. Let us next turn to the second case shown in Figure 7.21a. Case 2: Constant R, Variable xD This case, which is less frequently used, differs from the previous process in several respects. We are here no longer dealing with a design problem, since both xD and xW vary continuously and cannot be prescribed by the analyst
295
Staged Operations: The Equilibrium Stage
as fixed design parameters. Rather than designing a column, we usually use the model equations to predict the performance of an existing or hypothetical unit with a given number of plates Np and a prescribed value of R. We start by establishing the operating line that will accommodate the existing number of plates and initial boiler composition xWo. This involves a trial-and-error procedure consisting of adjusting the operating line of constant slope R/(R + 1) until it accommodates exactly Np plates. xDo of this line is the initial composition that emerges from the column (Figure 7.21a). The operation continues, with overhead and bottoms compositions decreasing steadily, until a final prescribed bottoms composition xW is reached. The operational parameters for the entire process are then established as follows: 1. Fraction Distilled f. This item is obtained from Equation 7.25c, written in the form ln
W = ln(1 - f ) = Wo
Ú
xW
wW
o
dxW xD - xW
(7.26a)
Here we can no longer evaluate the integral analytically because both xD and xW vary in unrelated ways. Instead, values of xD and xW must be read off the operating diagrams in pairs and the integral determined graphically or numerically. This is tedious, but not overwhelmingly so. 2. Average Distillate Composition xD¢. This is a new item that must be addressed because the overhead composition is no longer constant. It is obtained from the same cumulative balance equation (Equation 7.25e) that was used to describe the previous case of constant xD. This equation applies here as well with xD¢ now taking the place of xD. Solving Equation 7.25e for xD¢, we have xD ¢ =
xW W o - xW W xW o - xW (1 - f ) = W o -W f
(7.26b)
where xW is prescribed, and f drawn from Equation 7.26a. Note that Equation 7.26b is identical to the cumulative composition we have derived for the simple batch still in Illustration 2.9. With both f and xW in hand, recovery r can then be calculated from Equation 7.25f. Let us return to the same example considered above, with xD and xWo set at 0.92 and 0.55, and Np at 3. Reflux ratio R is the same as before at 0.9 but is now kept constant. The aim is to calculate f and r for the same final bottoms compositions xW = 0.175 used previously.
296
Mass Transfer: Principles and Applications
We start by drawing a series of parallel operating lines and reading off values of xD and xW, which are used in the graphical evaluation of the integral in Equation 7.26a. The reader will verify that this leads to a value of -0.913 and hence a fraction distilled f of 0.60. The next step is to evaluate the cumulative distillate composition xD¢ at the end of the process. We have from Equation 7.26b xD ¢ =
xW o - xW (1 - f ) 0.55 - 0.15(1 - 0.6) = = 0.817 0.6 f
(7.26c)
Using this value in Equation 7.25f yields the final result
r=f
xD ¢ 0.827438 . o = 0 6 0.55 xW r = 0.89 or 89%
(7.26d) (7.26e)
Thus, although recovery has increased by 5%, the distillate composition is lower by more than 10% over the previous case. Evidently, these results can be manipulated in any number of ways by adjusting Np and R to achieve more desirable results.
7.1.6
Percolation Processes
Percolation processes refer to operations in which a fluid stream is passed through a bed of granular porous material and a transfer of mass takes place between the two phases. Such processes are seen in the purification of gases and liquids by adsorption and ion exchange, in the transfer of toxic substances from aqueous streams to surrounding soils or river beds, and in general whenever a fluid percolating through or over a mass of stationary porous solids exchanges material with it. In Illustration 6.4, we introduced the reader to the notion of applying equilibrium stage concepts to operations of this type. This is at first glance a startling approach because none of the processes that fall in this category remotely resembles a stirred tank or its equivalent. They are, in fact, distributed in both time and distance and generally require PDEs for a rigorous description of the events. It has been shown, however, that if flow is sufficiently slow, we can assume local equilibrium to be established, or at least closely approached, at any point of the system. The process can then be viewed as the composite of a continuous spectrum of equilibrium stages and, therefore, that an algebraic representation becomes possible. This was shown in Illustration 6.4 for the restricted case of a linear equilibrium described by an appropriate Henry’s constant.
297
Staged Operations: The Equilibrium Stage
We now extend this treatment to the more general case of a nonlinear equilibrium case of the Langmuir type. Composing a cumulative solute balance to time t, as was done in Illustration 6.4, we obtain =
YFGbACt
+
XFrbACz
eYFrfACz
Amount
Amount
Amount
Introduced
Retained by Solid
Left in Fluid
(7.27a)
which is identical in form to Equation 6.6a, but assumes a general nonlinear relation between qF and YF . Neglecting the last term, as before, we obtain after some rearrangement z/t =
Gb rb X F / YF
(7.27b)
where Gb is the mass velocity of the carrier fluid in kg/m2 s. When the solid phase already contains some solute at a concentration level q0, Y0, we can recast Equation 7.27b into the more general form z/t =
vr f Gb = rb DX / DY rb DX / DY
(7.27c)
where DX/DY = (XF – X0)/(YF – Y0) and v = superficial velocity of the fluid. An alternative form results if we solve Equation 7.27c for t and set z = L, where L is a particular position downstream from the inlet to the system: t=
rb DX / DY L vr f
(7.27d)
This confirms the intuitive notion that the greater the distance L and the greater the adsorptive loading DX, the longer it will take the solute front to reach position L. Conversely, the faster the fluid flow v, the shorter the time required for the solute to “break through” at position L. We can now construct a diagram that contains the equilibrium relation X* = f(Y) as well as an operating line, the slope of which equals the ratio DX/DY. This is shown in Figure 7.22 and leads to the two equivalent expressions: t=
rb DX / DY rL L = b ¥ (Slope of operating line) rf v rf v
(7.27e)
298
Mass Transfer: Principles and Applications
XF Slope = H
Capacity X
Slope = DX/DY
X0 Y0
YF
Y
Concentration Y FIGURE 7.22 Operating diagram for Langmuir-type isotherm.
The construction has the same attractive property as previous operating diagrams in conveying at a glance the manner in which the system reacts to changes in certain operating parameters. Thus, if the feed concentration is increased, DY will likewise increase, lowering the slope of the operating line, and thus leading to faster breakthrough. If, on the other hand, DX is increased, for example, through the use of a more efficient sorbent, the movement of the solute front will slow and breakthrough will occur much later. In typical water purification processes, rb/rf is of the order 1, v of the order 1 cm/s, and L ¥ slope of the order 107. The on-stream time is then of the order 107 s @ 100 days under equilibrium conditions. So far in our discussion, the movement of solute was assumed to be entirely in one direction, i.e., from the flowing fluid to the stationary solid. This is the case in adsorption processes or in the uptake step of ion-exchange operations. When the direction of transfer is reversed, we speak of desorption, regeneration, or, in the case of environmental systems, of clearance. The theoretical treatment here becomes more complex, and requires a more profound approach based on PDEs. We do not address this problem here and instead present the final result that emerges from that analysis for the case of complete desorption from a Langmuir-type isotherm under equilibrium conditions. The relevant equation is completely analogous in form to that for the adsorption step (Equation 7.27e), and reads t=
rb H r L Ê slope of equilibriumˆ L= b Á ˜ rf v r f v Ë curve at the origin ¯
(7.27f)
Staged Operations: The Equilibrium Stage
299
Thus, the only change that has occurred in passing from adsorption to desorption is the replacement of the slope of the operating line DX/DY by the slope of the equilibrium curve at the origin, i.e., the Henry constant. Let us now apply these two expressions to an environmental problem of interest. Illustration 7.11: Contamination and Clearance of Soils and River Beds When soils or sediments are exposed to contaminants contained in groundwater or in the river flow, an important question arises: What is the length of the recovery period required to restore the system to its original state once contamination has ceased? Equation 7.27e and Equation 7.27f provide some important guidelines that can be used to address this question. We start by noting that in the general case of a nonlinear equilibrium relation, the adsorption and desorption periods will always differ because of the different values of Dq/DY and H (Figure 7.22). Because the latter quantity is invariably the greater of the two, we conclude that for nonlinear isotherms the adsorption step will proceed at a faster pace than the corresponding desorption step. This difference becomes more pronounced, the steeper the equilibrium curve at the origin. Let us now turn to the case where the equilibrium is linear; i.e., the operation is entirely in the Henry’s law region. This is a common, although not exclusive, occurrence in environmental systems. Inspection of Figure 7.22 shows that in this case the two relevant slopes become identical; i.e., we have (DX/DY)ads = (DX/DY)des = H
(7.28)
This leads to the surprising but also reassuring conclusion that, for linear systems, the clearance period will always equal that for contamination. Long recovery times arise, but only as a consequence of long exposure times. The shorter the period of accidental contamination, the greater the prospects for a fast recovery. This agrees, of course, with our physical understanding of the process, but it requires the use of Equation 7.27e and Equation 7.27f to establish that the contamination and recovery periods are in fact identical.
7.2
Stage Efficiencies
We turn now to the consideration of the second aspect of the equilibrium stage, that of its efficiency. This is an area of much greater uncertainty than we have previously seen. Evidently, the efficiency of a stage will be affected in a complex manner by an array of variables whose precise influence on the operation is difficult to quantify. In the case of trays used in gas absorption and distillation, we must consider the vigor of gas–liquid contact, the
300
E = Fractional Overall Tray Efficiency
a.
Mass Transfer: Principles and Applications
1.0
= hydrocarbons = chlorinated hydrocarbons = hydrocarbons with furfural (extractive distillation)
0.8
aAv = relative volatility m'L = liquid viscosity of feed centipoises
At average tower temperature
0.6
0.4
0.2
0.1
0.2
0.4
0.6
0.8 1.0
2.0
4.0
6.0
8.0 1.0
b.
E = Fractional Overall Tray Efficiency
aAvm'L
1.0 0.6 0.4 0.2 0.1 0.06 0.04 0.02 0.01
= commercial hydrocarbon absorbers = laboratory hydrocarbon absorbers = laboratory absorption, Co2 = in water and glycerol = laboratory absorption of NH3 in water m = y*/x m'L = liquid vis, centip ML = mol wt of liquid rL = liquid density, lb/cu ft
0.006 0.004 0.06 0.1
0.2 0.4 0.6 1.0
2
4 6
10
20
40 60 100 200 400
1000 2000 4000
H'mL' rL FIGURE 7.23 O’Connell’s correlations for bubble-cap trays: (a) distillation; (b) absorption. (From O’Connell, H.E., Trans. Am. Inst. Chem. Engrs., 42, 741, 1946. With permission.)
rate of liquid and gas flow, the mechanical design of the trays themselves, as well as physical properties of the systems. For stirred tanks, the rate of stirring and the design of the stirring mechanism itself, the contact time allowed, and the physical properties of the systems all play a role. There are two ways out of this dilemma. We can draw on information provided by the equipment manufacturers, who frequently have test facilities available for determining stage efficiencies, or we can make use of rough correlations and guidelines for a first estimate in the preliminary design of these units.
301
Staged Operations: The Equilibrium Stage 7.2.1
Distillation and Absorption
Two classical empirical correlations due to O’Connell can be used to obtain a measure of the efficiencies of bubble-cap trays for distillation and absorption (Figure 7.23). The principal correlating parameters in both cases are the viscosity of the liquid mL, and the relevant equilibrium constants, a for distillation, and Henry’s constant H for absorption. High values of either of these variables adversely affect the tray efficiency. The correlation for distillation is based on limited data for systems of hydrocarbons and chlorinated hydrocarbons, that for absorption on the performance of hydrocarbon absorbers and the scrubbing of ammonia and carbon dioxide with water. mL¢ is in units of centipoises, H¢ in units of mole-fraction ratios, and rML is the molar density of the liquid solvent in lb mol/ft3. Note that gas absorbers generally have much lower plate efficiencies than distillation columns due primarily to their lower operating temperatures.
7.2.2
Extraction
The extraction of solutes in agitated vessels is, at the very least, on a par in complexity with that we have seen for gas-liquid contact on trays. Here again the mechanical design of the system, this time that of the impeller, enters the picture, as well as the physical properties to which we must now add the surface tension of the dispersed phase. As a result, no clear-cut correlation has emerged from the host of experimental studies reported in the literature. The studies do, however, provide some guidelines that we summarize for the convenience of the reader in Table 7.2. The parameter values listed represent “safe” lower limits designed to achieve stage efficiencies of more than 80%. Much lower values do materialize on occasion. Thus, contact times of as little as 1 minute have been known to result in efficiencies of more than 75%. The table is therefore to be regarded as providing a comfortable margin of safety for conservative first estimates.
7.2.3
Adsorption and Ion-Exchange
In mass transfer operations involving a solid porous phase, the resistance in the majority of cases resides predominantly in the solid phase. This brings TABLE 7.2 Conservative Parameter Values for Batch Extraction Efficiencies of E > 0.8 Residence Time Speed of Agitation
t > 25 min rpm > 200
302
Mass Transfer: Principles and Applications
about a considerable simplification in the estimation of stage efficiency, as neither the mechanical design nor the speed of agitation contributes significantly to the stage efficiency. A minimum rpm must, of course, be maintained to keep the slurry in suspension and keep the liquid film resistance within reasonable bounds. This is usually achieved at a level of 50 to 100 rpm. In principle, mass transfer in solid particles is distributed in both time and distance, calling for the use of a PDE (Fick’s equation) for a rigorous description of the process. In an elegant study conducted in the 1950s, it was shown by Glueckauf that the results of the formal treatment can be approximated by a volumetric solid-phase mass transfer coefficient, given by kS a( s -1 ) = 15
Ds R2
(7.29a)
where DS = solid phase diffusivity, R is the particle radius, and a = surface area per unit volume. Use of this transfer coefficient eliminates radial distance as a variable and results in a reduction of the model to the ODE level. We show in the next illustration how this reduced model can be applied to describe the efficiency of a liquid-solid contact in an agitated vessel. Illustration 7.12: Stage Efficiencies of Liquid–Solid Systems We start by noting that the use of a solid-phase mass transfer coefficient calls for a driving force based on the internal concentration X (kg solute/kg solid). A solute mass balance, performed about a single particle assumed to be a sphere, leads to the expression Rate of solute in - Rate of solute out =
rpkSaVP(X* - X) - 0 = r PVP
Rate of change in solute content d X dt
(7.29b)
where VP is the particle volume and rP its density. Introducing Equation 7.29a we obtain 15
DS 4 4 d pR 3 (X * - X ) = pR 3 X 2 3 dt R 3
(7.29c)
and after cancellation of terms and separation of variables q DS t dX 15 dt = X * 15 S22 t = ln R 0 X 0 X * -X * -X
Ú
Ú
(7.29d)
303
Staged Operations: The Equilibrium Stage Hence, 15
DS X* t = ln R2 X * -X
(7.29e)
and 1 - X/X* = exp(-15DSt/R2)
(7.29f)
Because X/X* is by definition the fractional stage efficiency E, we obtain the following relation between E and the contact time t: E = 1 – exp(-15DSt/R2)
(7.29g)
Comments: The success of Equation 7.29g in predicting stage efficiencies evidently hinges on how well we can estimate the solid-phase diffusivity DS. Although the complex interior geometry of porous particles makes this a difficult task, reasonable first estimates of DS can be made using a relation previously presented in Chapter 3, which is repeated here:
(DS ) eff =
De t
(3.13a)
Here e is the interior pore volume fraction, typically of the order 0.3 to 0.4, while the tortuosity t is often given a representative value of 4. Thus, with diffusivities in liquids being of the order 10–9 m2/s (see Chapter 3), we can expect (DS)eff to have a typical value 10–10 m2/s. We make use of these considerations in Practice Problem 7.10, which deals with the efficiency of a column adsorption process. In general, however, it is more fruitful to use Equation 7.29g to explore the effect of contact time t or particle radius R. Suppose, for example, that for a given process it is proposed to double radius R to improve the settling rate. We then have from Equation 7.29g 2
ÊR ˆ ln(1 - Enew ) = Á old ˜ ln(1 - Eold ) Ë Rnew ¯
(7.29h)
so that for Eold = 0.9, Enew drops to a value of 0.44. This is a drastic reduction in efficiency for a mere doubling of particle radius.
304
Mass Transfer: Principles and Applications
7.2.4
Percolation Processes
In our preceding discussion of this topic, we managed to reduce the underlying model, which consists of two PDE mass balances, to a simple algebraic cumulative balance joined to an appropriate continuous spectrum of equilibrium stages. When this restriction is removed and the mass transfer resistance is brought back into play, no alternative simplifications are possible and we must return to the full PDE model. This model has been solved for a number of different equilibrium relations, most notably the linear case expressed by X = HY. The results for the latter can be expressed in terms of the following two dimensionless parameters: Dimensionless Distance Z Z = kSa(z/v)
(7.30a)
rf t rb H
(7.30b)
Dimensionless Time T T = kS a
Solutions of the PDEs as a function of these parameters are given in Table 7.3 at concentration levels of 1% and 10% of the feed concentration at a distance z from the inlet. These tabulated values of Z and T can be used to calculate the time t it takes for a particular concentration level to reach the position z (for example, the outlet of an adsorber) or, conversely, to calculate the height of an adsorber or ion-exchange column needed for it to remain functional over a prescribed period t. TABLE 7.3 Parameters for Nonequilibrium Adsorption T Z 1000 800 600 400 200 100 80 60 40 20 10 8 6 5
1% of YF
10% of YF
900 700 520 330 150 70 52 37 22 7.8 2.5 1.2 0.38 0.10
950 740 550 360 170 83 65 48 30 13 5.0 3.5 2.2 1.6
Efficiency E = T/Z 1% of YF 10% of YF 0.9 0.88 0.87 0.83 0.75 0.70 0.65 0.2 0.55 0.39 0.25 0.15 0.063 0.020
0.95 0.93 0.92 0.90 0.85 0.83 0.81 0.80 0.75 0.65 0.50 0.44 0.37 0.32
305
Staged Operations: The Equilibrium Stage
The following example illustrates the use of the table. Suppose we are required to reduce the level of pollutant in water to 1% of its existing level. It is expected to keep the adsorber on-stream for 100 days before breakthrough at the 1% level occurs. What should the height of the unit be? Data:
H = 104
v = 1 cm/s
rf/rb ª 1
kSa is estimated from Equation 7.29a to be of the order 10–2 s–1. The corresponding values of dimensionless time and distance are T = 10 -2 ¥ 1 ¥
3600 ¥ 24 ¥ 100 = 8.64 10 4
Z (Table 7.3) @ 21 Consequently, z=
10 -2 v Z = -2 21 10 kS a z = 21 m
This is somewhat excessive, and would suggest the use of two 10-m columns in series. Note that when we deal with multicomponent systems, the substance with the lowest Henry constant breaks through first. It is this value of H that must then be used in computing dimensionless time T. Table 7.3 can also be used to calculate an efficiency for the percolation process sometimes referred to as bed utilization and defined as the ratio of the minimum mass of adsorbent required under equilibrium conditions to the mass used in the actual operation (Wm/Wa). This is shown in the Illustration that follows.
Illustration 7.13: Efficiency of an Adsorption or Ion-Exchange Column We start the procedure by composing the ratio of the dimensionless distance Z to dimensionless time T. We obtain in the first instance zrb kS a( z / v) Z = = H T kS a(r f / rb )(t / H ) vr f t
(7.31a)
We now multiply the numerator and denominator of this fraction by the cross-sectional area of the column AC. This has the effect of transforming the
306
Mass Transfer: Principles and Applications
ratio into an expression representing the actual mass of the stationary solid per mass of fluid treated, which we term Wa. ˘ È kg solid Z zrb AC H=Í = ˙ H = Wa H T vr f tAC Î kg fluid treated ˚ a
(7.31b)
But as seen in the last chapter, Equation 6.7c, the corresponding minimum mass Wm is given by the inverse of the Henry constant H. Hence, H = 1/Wm and we can write for the efficiency E of the process E=
Wm T = Wa Z
(7.31c)
Thus, the efficiency of a percolation process is given simply by the ratio of dimensionless time to dimensionless distance. For the process considered in the previous section, for example, we have T = 8.64 and Z = 21. Consequently, E=
8.64 = 0.41 or 41% 21
This implies that 59% of the adsorber is occupied by the mass transfer zone. As we move up the columns in Table 7.3, efficiency improves dramatically. At Z = 100, the efficiency becomes 70% and at Z = 1000, it becomes 90%, and the percentage of the bed occupied by the mass transfer zone drops to 30% and 10%, respectively. The penalty to be paid is an increase in bed height.
Practice Problems 7.1. The Operating Diagram Describe what is represented in an operating diagram. What is the meaning of an operating line or curve? How many operating lines are required in crosscurrent cascades, and how many in a countercurrent operation? What are the requirements for fractional distillation? 7.2. Single-Stage Adsorption: The Freundlich Isotherm The Freundlich adsorption isotherm is a special type of equilibrium relation of the general form:
Staged Operations: The Equilibrium Stage Y = mXn
307 (7.32a)
It is an empirical relation that does not converge to a saturation value at high loadings, nor does it yield the required Henry’s constant at low coverages. It does, however, in many cases provide an adequate description of adsorption or ion-exchange equilibria over an intermediate concentration range. Suppose that a particular liquid-solid system is described by the following Freundlich isotherm: Y = 8.91 ¥ 10–5 X1.66
(7.32b)
It is desired to reduce the impurity concentration in a given liquid from Yo = 9.6 units/kg solvent to 10% of this value in a single stage. Determine the minimum mass of adsorbent per 1000 kg solution required to accomplish this. Answer: 32.0 kg 7.3. Leaching of Solids: Extraction of Edible Oils Leaching involves the intimate contact of particular solids with an appropriate solvent for the purpose of removing undesirable components or recovering valuable materials contained in the solid. The phase diagram that describes this operation, displayed in Figure 7.24a, involves plots of dimensionless solid mass N against liquid mass fractions x and y in the pore space of the solid and the free liquid extract, respectively. We use the same symbols as used previously in extraction; i.e., B and C denote solvent and solute, and A is the solid component that here takes the place of the raffinate solvent. The liquid equilibrium compositions x and y are located as before, at the ends of a tie-line connecting the curves (N, x) and (N, y), which represent the solid content of the leached phase and residual particulate matter in the otherwise liquid extract phase. R and E denote the mass (B + C) of liquid leaving with the leached solid and in the liquid extract, respectively, and are subject to the same mixing or lever rules we established for triangular diagrams in Chapter 6 (Illustration 6.6). Suppose we wish to extract 1000 kg of an oil-bearing seed containing 20% by weight of oil with 400 kg solvent. The extract is assumed to be free of solids so that the (N, y) curve coincides with the abscissa (Figure 7.24b). The tie-lines are slightly sloped, indicating a higher oil content in the solid phase due to adsorption. Make the appropriate mass balances for this and construct an operating diagram that will yield the concentration of oil in the extract and the fractional degree of recovery. (Hint: Locate the mixing point M.) Answer: y = 0.275, r = 0.41
308
Mass Transfer: Principles and Applications
a. N vs. x
N kg A/kg (B + C)
F x
M Tie-Line y 0
Pure Solvent C
N vs. y
x, y, kg C/kg (B + C)
1
Pure Solute C
b. 2.0
N vs. x
N kg A/kg (B + C)
1.0
Tie-Lines
N vs. y
0
0.2
0.4
0.6
0.8
1.0
x, y, kg C/kg (B + C) FIGURE 7.24 Staged leaching process: (a) phase diagram; (b) phase diagram for oil-bearing seeds.
7.4. The Rayleigh Equation in Biotechnology: Ultrafiltration Ultrafiltration is a membrane process in which a solution containing a valuable solute such as a protein is concentrated by applying pressure to it and forcing the solvent across a semipermeable membrane, i.e., a membrane more permeable to the solvent than it is to the solute. Some of the latter will usually leak through as well; that is, the process is not 100% efficient. Efficiency is here defined as 1 – Cp/CR, where Cp is the concentration at any instant of the solution passing through æ the permeate æ and CR denotes the concentration in the enriched solution left behind, termed the retentate. In a test run of a batch ultrafiltration unit to determine leakage, it was found that the retentate concentration had doubled after 53.7% of the solu-
Staged Operations: The Equilibrium Stage
309
tion had passed through the membrane. Show in the first instance that the model is represented by the Rayleigh equation and then: a. Determine the efficiency of the process. b. Calculate the enrichment obtained, i.e., the ratio of final retentate concentration to the cumulative concentration of the permeate. Answers: a. 0.9; b. 14.5 Note: More about ultrafiltration appears in Chapter 8. 7.5. Countercurrent Washing of Granular Solids Consider the case of a steady flow of granular solids that emerges from a leaching operation with a fraction f of the final extract solution still adhering to it (f = mass of adhering solution/mass of solids). If the leached substance is considered sufficiently valuable, or conversely is too objectionable to leave behind, it may become necessary to wash the leached solids for further recovery of solute. A countercurrent stages operation has the advantage of providing continuity of operation while maximizing effluent concentration. Show that the Kremser equation applies and provide the pertinent expressions for residue factor R and extraction ratio E. 7.6. Design of a Countercurrent Cascade in the Linear Regime A gas scrubber is to be used to reduce solute content in a dilute gas feed entering at 104 kg/h to 1% of the incoming concentration. A solvent with a Henry constant of 0.1 kg/kg is available. a. What is the minimum solvent flow rate to be used? b. What is the actual solvent flow rate you would propose, given that the plate efficiency is 30%? 7.7. The Countercurrent Cascade in Triangular Coordinates Figure 7.25 displays the operating diagram in triangular coordinates for a countercurrent cascade. The point 0, which is located exterior to the diagram, is termed the operating point, to which all operating lines, such as R1E2 , R2 E3 , etc., converge. In a typical design problem, feed parameters xF and F, the amount and purity of solvent B, and the location of Ra, which defines the desired recovery, are known or prescribed. The task is then to establish the number of stages required to attain the reduction in solute content from the feed value xF to that of the exiting raffinate, xn. This can be done using the construction shown in Figure 7.25. Explain and justify the operating diagram, drawing on the mixing rule and appropriate mass balances. (Hint: Compose the differences of the streams Rm-1 – Em and show that they all yield the same value 0, which is called the operating point.)
310
Mass Transfer: Principles and Applications C
E1
F
R1 R2
0 Rn
Rm-1 Rm Rn-1
E2 E3
M
Em Em+1 En S
A
B
FIGURE 7.25 The countercurrent extraction cascade in triangular coordinates (see Practice Problem 7.7).
7.8. Effect of Feed and Reflux on Column Performance Consider the following changes in the operating conditions of the fractionation column designed in Illustration 7.8. a. Feed rate is doubled. b. Feed concentration fluctuates ±10%. c. The reflux rate is doubled. Which variables are affected by these changes? Which remain unchanged? Support your statements with actual calculations as far as possible. 7.9. The Use of Open Steam in Fractional Distillation When an aqueous solution is fractionated to give an organic component as the distillate and the water is removed as the residue product, the heat required may be provided by direct injection of steam at the bottom of the tower. The reboiler is then dispensed but this is done at the expense of a larger number of trays in the fractionation tower. Revise the normal McCabe-Thiele diagram to reflect this change in operating conditions. 7.10. Maximum Recovery in Batch Distillation A batch still with 10 theoretical plates is used to fractionate a binary mixture xWo = 0.4 with a = 2 into an overhead product of constant composition xD = 0.95. a. Calculate the maximum recovery. b. How would you proceed if the column, instead of having trays, contains a high-efficiency packing? (Hint: Use the Fenske equation.)
311
Staged Operations: The Equilibrium Stage
7.11. Total Boil-Up in Batch Distillation Derive an expression that will give the total amount of liquid boiled up in a batch still operating at constant overhead composition xD. (Hint: Make an unsteady balance over part of the still, then evaluate ÚGdt in terms of the varying bottoms composition and reflux.) Answer: GTot =
Ú
xW
wW o
W o ( x D - xW o )dxW R ˆ ( x D - xW )2 Ê 1 Ë R + 1¯
Note: The varying value of xW and matching reflux ratios have to be read off the McCabe-Thiele diagram. 7.12. Design of an Ion-Exchange Column A synthetic ion-exchange resin in bead form is to be used for collecting and concentrating the copper in a dilute waste stream. Velocity of the feed of concentration 13 meq/l is 4 cm/s, bed density rb = 1200 kg/m3, and the specific gravity of the solution can be set at 1.0. Laboratory equilibrium data are available and are as follows: meq Cu2+/l sol’n meq Cu2+/g resin
0.2 2.0
2.0 4.0
4.0 4.4
8.0 4.7
12 4.75
16 4.85
20 4.9
If the bed is to remain on stream for 10 h, what is the minimum height of the column required to treat the solution? Answer: 3.3 m 7.13. Adsorption Purification Revisited In Illustration 6.4 we addressed the problem of sizing a carbon bed for the removal of benzene from water. The calculations there are limited to determining the minimum requirements in the absence of transport resistance, i.e., under conditions of local equilibrium. We now wish to calculate the efficiency of the process by incorporating the effect of a mass transfer resistance. Carry over the pertinent variables from Illustration 6.4 and make use of Table 7.3 and the Glueckauf relation (Equation 7.29a). Assume D = 10–9 m2/s, R = 2 mm, e = 0.3, t = 4. Answer: 38% 7.14. Pollution from the Mist over Niagara Falls In a 1986 study of pollution in the Niagara Falls region it was found that an estimated 60 tonnes of PCBs, chloroform, and chlorobenzenes are released each year into the atmosphere from the mist over
312
Mass Transfer: Principles and Applications Niagara Falls. This is entirely due to the high fugacity (or activity coefficients) of these substances, which brings about a near quantitative transfer to the atmosphere when no more than a tiny fraction of the liquid has evaporated. We have shown this to be the case for mercury in Illustration 7.4 but have not established the time frame over which the event occurs. Consider the same process of evaporation of mercury, this time taking place from a droplet 1 mm in diameter. Mass transfer here is almost entirely liquid-film controlled, and a measured value of kL = 2.6 ¥ 10–5 m/s has been reported. Calculate the time required for the droplet to release 90% of its original mercury content. How does this compare with the lifetime of a droplet over Niagara Falls, given that the drag coefficient of a sphere in the turbulent regime is 0.44?
8 Continuous-Contact Operations
The various staged operations taken up in the previous chapter have several features in common: The two phases involved in the transfer of mass were brought together and mixed intimately in discrete stages, which took the form of stirred tanks or some equivalent device. As a result, the concentrations were generally distributed uniformly in space and any variations they underwent were with respect to time, and not with distance. The operations were not only allowed to go to equilibrium but were actively encouraged to do so by means of agitation and the provision of sufficient contact time. Any departures from equilibrium were lumped into an entity called the stage efficiency. An efficiency of 100% signified the attainment of complete equilibrium and values below that expressed varying degrees of non-equilibrium. Continuous-contact operations are diametrically different from staged operations in almost every aspect. The two phases are in continuous flow and in continuous contact with each other, rather than repeatedly separated and re-contacted in an array of stages. Second, the attainment of equilibrium is shunned. An active driving force is maintained at all times and its constituent concentrations vary continuously from the point of entry to the exit. The result is that the concentrations are now distributed in space and, assuming a normal steady-state operation, are invariant in time. Thus, while staged operations vary at most with time, but not at all with distance, the exact opposite holds in continuous-contact operations. A final difference concerns the equipment used in the two cases. Continuous-contact processes are generally carried out in empty or packed columns or in tubular devices of various configurations. Staged operations may use columns, but these are usually subdivided into discrete contact stages in the form of trays. More commonly, staged processes are carried out in agitated vessels of some type, which may be used singly or in suitable arrangements. In the following, we divide continuous-contact operations into two distinct categories. The first deals with classical packed-column operations in countercurrent flow. We revisit the packed-gas scrubber we first saw in Chapter 2 and provide a general survey of packed-gas absorption operations. Packedcolumn distillation is addressed next and, in a somewhat unusual departure from the norm, we reexamine coffee decaffeination by supercritical extraction. 313
314
Mass Transfer: Principles and Applications
The process involves a moving-bed configuration, which although superficially different from the conventions of packed column processes has identical operational parameters and can be analyzed by identical procedures. The second category involves membrane processes, a contemporary topic of considerable importance with the promise of a bright future. Among the subcategories considered here are reverse osmosis, hemodialysis, and membrane gas separation, and the text provides some useful relations to address problems in these areas.
8.1
Packed-Column Operations
Packed columns are used primarily in gas absorption and liquid extraction and in air-water contact operations such as humidification and water cooling, which we take up in Chapter 9. They are found less frequently in distillation operations where their use is confined mostly to small-scale processes involving high-efficiency packing. The analysis of packed-column operations has the same three basic goals we have seen in similar contexts, i.e., design, prediction of equipment performance, and, to a lesser extent, parameter estimation from experimental data. We may, for example, wish to calculate the height of a column required to achieve a certain degree of separation or level of purification. Or it may be required to assess the effects of changes in feed concentration or flow rate on column performance. In all these problems, the same basic model equations are applied and manipulated in appropriate ways to extract the desired information. The principal mathematical feature shared by all steady-state packedcolumn operations is the distribution of the concentration variables in space, principally in the direction of flow. The model must therefore be composed of mass balances taken over a difference element of each phase, which are then converted into ODEs and integrated to obtain concentration profiles and other useful information. Algebraic (integral) mass balances also appear and can often be combined with the ODE balances to obtain important results. We have already, in Illustration 2.3, alerted the reader to the existence of this multitude of mass balances, and we have occasion now to obtain a broader picture of their derivation and various applications. To do this, we return to the example of the gas scrubber taken up there and reexamine it in greater detail. Illustration 8.1: The Countercurrent Gas Scrubber Revisited The basic model equations for countercurrent continuous mass transfer are the differential mass balances over each phase, which had been derived in
315
Continuous-Contact Operations
Illustration 2.3 and the companion equilibrium relation (Equation 2.12f). They represent a complete model for the system and are reproduced below. Gas-Phase Mass Balance Gs
dY + KOY a(Y - Y *) = 0 dz
(2.12d)
Liquid-Phase Mass Balance Ls
dX + KOY a(Y - Y *) = 0 dz
(2.12e)
Equilibrium Relation Y* = f(X)
(2.12f)
Here X and Y are solute concentrations in units of kg solute per kg carrier or solvent, and the mass velocities Gs and Ls have units of kg (carrier or solvent)/m2 s. The two mass balances can be manipulated in a number of ways to yield specific results of interest. One such operation consists of subtracting Equation 2.12d and Equation 2.12e, which results in the elimination of the mass transfer terms. We obtain Gs
dX dY - Ls =0 dz dz
(8.1)
This equation can be integrated between different limits to yield the algebraic mass balances derived in Illustration 2.3 by performing integral solute balances over the column. They are (LsX2 + GzY) – (LsX + GsY2) = 0
(2.11a)
(LsX2 + GsY1) – (LsX1 + GsY2) = 0
(2.11b)
and
These two expressions are then recast in a form that makes them more suitable for graphical representation. We have termed these alternative formulations operating lines and reproduce them below. L Y - Y2 = s X - X 2 Gs
(2.11c)
316
Mass Transfer: Principles and Applications
and L Y1 - Y2 = s X 1 - X 2 Gs
(2.11d)
We soon show how these expressions can be used to arrive at a graphical solution of the model equation. The ODE mass balances (Equation 2.12d and Equation 2.12e) can also be tackled separately and in isolation by performing a formal integration. We obtain, for the gas-phase balance, Z=
Gs KOY a
Ú
Y1
Y2
dY Y -Y*
(8.2a)
where Z = height of the scrubber and KOY is an average overall mass transfer coefficient that is obtained by experiment. The integral on the right side is referred to as the number of transfer units (NTU) and the factor preceding it as the height of a transfer unit (HTU). Thus, Z = HTU ¥ NTU
(8.2b)
On the surface, we do not seem to have gained much by taking this step since the integral contains too many variables and therefore cannot be evaluated. Some thought will reveal, however, that the difference Y – Y* in the integrand can be read from a joint graph of the operating line and equilibrium curve. This is shown in Figure 8.1, where the difference in question is given by the vertical distance between the two curves. Let us note some features of this diagram. To begin, it has a familiar air to it. We in fact have seen an identical representation of the operating line and equilibrium curve in the operating diagram, dealing with a countercurrent staged cascade (Figure 7.14a). However, that diagram differs from Figure 8.1 because it uses the staircase construction to establish the number of stages required to achieve a desired separation. In the present case, graphical evaluation of the NTU integral takes the place of the staircase construction, while the HTU represents, in a sense, the inherent mass transfer resistance of the process and can therefore be viewed as the equivalent of a stage efficiency. Another feature that the two operations share is the existence of a minimum solvent flow rate. In both cases this flow leads to a pinch at the level of the feed concentration between the operating line and equilibrium curve. This has previously led to the number of stages going to infinity. The result here is similar: The NTU integral increases rapidly as we approach the pinch point and ultimately diverges to infinity. This leads to a column of infinite height Z. While operating costs are reduced with diminishing solvent flow
317
Continuous-Contact Operations
LS G S X 2 Y2
a. Xz+DzYz+Dz
z+Dz z Xz
Yz z
X 1 Y1 LS G S
b. Y Y1
"Pinch"
Operating Line Slope LS/GS
Equilibrium Curve Y*= f(X)
Slope (LS/GS)Min Y – Y*
Y2 0
X2
X1
X
FIGURE 8.1 The countercurrent packed-gas scrubber: (a) column variables; (b) operating diagram.
in both cases, the capital cost of the plant, i.e., the cascade or column, rises rapidly and goes to infinity when the minimum solvent flow rate is imposed. The design procedure for a packed-gas scrubber parallels that of the countercurrent staged cascade. We start by fixing the point (X2, Y2) representing the compositions at the top of the column. Y2 denotes the prescribed effluent concentration and X2 the purity of the solvent. A line of slope Ls/Gs is next drawn through that point and extended to the level of the feed concentration Y1. The slope Ls/Gs is usually set at a value in the range 1.2 to 1.5 (Ls/Gs)Min.
318
Mass Transfer: Principles and Applications
The vertical difference between the two graphs, the operating line and the equilibrium curve, are then used to evaluate the NTU integral. This can be done either graphically or numerically. Finally, the height of a transfer unit is established using the given carrier flow rate Gs and a volumetric mass transfer coefficient KOY a determined experimentally or drawn from existing correlations or tabulations (see Table 5.6). These values typically vary over the range 10 to 50 cm. With both HTU and NTU in hand, the height of the scrubber can then be determined using Equation 8.2b. Comments: Let us first return to the basic model equations (Equation 2.12d to Equation 2.12f). This model is quite general, and able to accommodate arbitrary equilibrium relations and system parameter values. Its solution, which is not undertaken here, must be implemented numerically and can be used both for design and prediction of scrubber performance and for parameter estimation. The reduced form of the solution we derived, which rests on the use of the operating diagram Figure 8.1b and Equation 8.2b, is not able to provide direct information on scrubber performance except by a process of trial and error. Suppose, for example, that we wish to establish the effluent concentration that results from doubling the feed rate, i.e., Gs, in an existing scrubber of height Z. The HTU value would first have to be modified to reflect the new flow rate, but more importantly, the upper limit of the NTU integral would have to be adjusted and the evaluation of the integral repeated by trial and error until the product of HTU and NTU exactly matches the given height Z of the scrubber. The numerical solution suffers from the same dilemma, but can be used, once it is properly programmed and in place, to carry out a wide range of repeated calculations with a minimum of effort. A second point of note concerns the solvent flow rates to be used. Low amounts of solvent carry the advantage of low solvent inventory but lead to greater scrubber heights, which in the limit of the minimum flow rate leads to an infinitely high tower. If, on the other hand, we allow an unbounded increase in solvent flow, column height and cost will be reduced to a minimum but operating costs will go to infinity. Between these two extremes there must be an optimum flow rate that will minimize the total expenditures composed of capital and operating costs. This situation is depicted in Figure 8.2, which shows a plot of total cost vs. solvent flow rate. That cost is made up of three component expenditures consisting of the cost of the column, the cost of the solvent, and the cost of pumping the solvent to the top of the column. The column cost starts at infinity when solvent flow is at a minimum, thereafter declines sharply, and ultimately levels off to a near-constant value. The pumping cost also starts at infinity because the column is infinitely high, then declines, passes through a minimum, and gradually increases, going to infinity again as the solvent flow rate becomes unbounded. The cost of the solvent shows a much simpler
319
Cost ($/year)
Continuous-Contact Operations
Total Cost
Solvent Cost
Column Cost Pumping Cost (LS)min (LS)opt
Solvent Flow Rate LS
FIGURE 8.2 The countercurrent gas scrubber cost vs. solvent flow rate.
relation to flow rate, rising almost in a straight line, with any departures from linearity resulting from volume discounts allowed for the solvent. The total cost curve that results from the three-component expenditures shows a minimum, which, as mentioned, lies in the typical range (1.2 to 1.5) (Ls/ Gs)Min. Illustration 8.2: The Countercurrent Gas Scrubber Again: Analysis of the Linear Case We consider here the case where both the operating line and equilibrium curves are linear, the latter represented by Henry’s law: Y* = HX
(8.3)
On introducing this relation into the NTU integral of Equation 8.2a, we obtain NTU =
Ú
Y1
Y2
dY = Y -Y*
Ú
Y1
Y2
dY Y - HX
(8.4a)
Drawing on the material balance (Equation 2.11a) to express X as a function of the gas-phase mass ratio Y yields NTU =
Ú
Y1
Y2
dY Y (1 - 1 / E ) + (1 / E )Y2 - HX2
(8.4b)
320
Mass Transfer: Principles and Applications
where E is the so-called absorption factor, equal to the ratio of the slopes of operating line to equilibrium line, L/HG. E has its counterpart in staged operations and is called the extraction ratio there. A standard evaluation of this integral yields NTU =
Y (1 - 1 / E ) + (1 / E )Y2 - HX2 1 ln 1 1 - 1 / E Y2 (1 - 1 / E ) + (1 / E )Y2 - HX2
(8.4c)
ln[ R(1 - 1 / E ) + 1 / E ] 1-1/ E
(8.4d)
or equivalently NTU = Here R is given by R=
Y2 - HX 2 Y1 - HX 2
(8.4e)
and in the case of pure solvent (X2 = 0) becomes a direct measure of the depletion Y2/Y1 in the solute content of the gas phase. It is identical to the residue factor previously defined for staged countercurrent processes (see Table 7.1), and a plot of it relating it to the absorption factor E and the number of transfer units appears in Figure 8.3a. The reader will note that the diagram is quite similar in appearance to the plot seen in Figure 7.15, which relates the number of stages in a countercurrent cascade to the same parameters. We now address a number of features that both plots have in common and that define the behavior of these linear systems. As briefly noted in Illustration 7.7, the parameter value E = 1 represents an important dividing line. Above it, the residue factor R converges asymptotically to a constant value with an increase in the number of transfer units. We cannot, in other words, absorb arbitrarily large fractions of the incoming solute by increasing solvent flow rate, as long as the value of E remains below unity. This becomes possible only when the absorption factor is greater than 1; that is, whenever the slope of the operating line exceeds that of the equilibrium line. The solute fraction remaining in the outgoing gas can now be made arbitrarily small by the simple expedient of increasing the solvent flow rate. A complete reduction to zero solute content, however, becomes possible only in the limiting case of an infinite flow rate of virgin solvent. A rational explanation of this behavior can be obtained by inspecting the pertinent operating diagrams, shown in Figure 8.3b. We note here that for E < 1, operating and equilibrium lines always converge and ultimately intersect in a pinch, making it impossible to set arbitrarily high solute recovery ratios. When E exceeds unity, the two lines diverge and no longer intersect except at the origin. It now becomes possible to fix the effluent gas
321
Continuous-Contact Operations
a.
1.0 0.8 0.6
E 0.3 0.3 0.5 0.5 0.6 0.6
0.4
0.7 0.7
0.3
0.8 0.8
0.2
0.9 0.9
Y1 – HX2
R=
Y2 – HX2
0.1 0.08 0.06
0.95 0.95
0.04
1.0 1.0
0.03 0.02
1.05 1.05 1.1 1.1
0.01 0.008 0.006
1.2 1.2
0.004 0.003 0.002
E 0.001 0.0008 0.0006 0.0005
1
2
3
4 5 6
1.3 1.3 1.4 1.4 1.5 1.5 1.8 1.81.6 1.6 2.52.0 2.0 5.0 5.0 2.5 3.0 3.0
8 10
20
30
40 50
NTU E>1
b.
Operating Lines
E=1 E 1. The NTU plot of Figure 8.3a can also be applied to other packed-column processes operating in the linear region. These include gas stripping and extraction, and require the pertinent parameters to be redefined to fit each new operation. This has been done in Table 8.1, which lists the different versions of R and E for each case. Comments: This brief analysis of gas absorption with systems obeying Henry’s law leads to some interesting conclusions. The lower solvent flow-rate limit here is no longer set by graphically locating the operating line, which causes a pinch. We make use, instead, of the criterion that the slope of the operating line must at least equal and preferably exceed that of the equilibrium line, i.e., Henry’s constant. This results in a quick and convenient resolution of the problem of finding the lower limit of the solvent flow rate. Illustration 8.3: Distillation in a Packed Column: The Case of Constant a at Total Reflux Packed-column distillation, while practiced much less frequently than gas absorption, still finds considerable use in medium- and small-scale applications. The model equations parallel those for the absorption case and result in the same HTU-NTU relations seen there, with mole fractions taking the place of mass ratios as the pertinent concentration units. We obtain Z = HTU ¥ NTU =
G KOY a
Ú
y1
y2
dy y * -y
(8.5a)
TABLE 8.1 Packed-Column Parameters in the Linear Region Process
R
E
Equilibrium Relation
Gas absorption
Y2 - HX 2 Y1 - HX 2
L/HG
Y = HX
Gas stripping
X1 - Y1 / H X 2 - Y1 / H
HG/L
Y = HX
Liquid extraction
X 2 - Y1 / m X1 - Y1 / m
mB/A
Y = mX
323
Continuous-Contact Operations and supplement this expression with the equilibrium relation given by y* = f(x)
(8.5b)
The operating lines needed for the evaluation of the NTU integral are identical to those established in Chapter 7 and can be seen in Figure 7.17 and Figure 7.18. Either graphical or numerical procedures can be used for this purpose. A case of special interest is that of a system with constant relative volatility a run at total reflux. The equilibrium relation is now given by y* =
ax 1 + x(a - 1)
(8.5c)
Because at total reflux the operating line coincides with the 45r diagonal, we have equality of the mole fractions, y = x, and Equation 8.5c becomes y* =
ay 1 + y(a - 1)
(8.5d)
Introducing this relation into the NTU integral yields NTU =
Ú
y2
Ú
y2
y1
dy ay -y 1 + y(a - 1)
(8.5e)
or equivalently NTU =
y1
1 + y(a - 1) dy y(a - 1)(1 - y)
(8.5f)
This expression can be evaluated analytically using the additional integration formula
Ú
dx 1 a + bx = - ln x( a + bx) a x
(8.5g)
Its application leads to the result NTU =
y (1 - y1 ) 1 - y1 1 + ln ln 2 a - 1 y1 (1 - y2 ) 1 - y2
(8.6)
324
Mass Transfer: Principles and Applications
This is a convenient expression to determine NTU and, from it, HTU values in laboratory experiments, which are usually run at total reflux. It also finds use in the distillation of closely boiling mixtures such as isomers or isotopes. Here a values are quite low and constant, and the operating line very nearly coincides with the 45r diagonal so that Equation 8.6 becomes a valid approximation of the actual number of transfer units. An example of its application in the distillation of isotopes is found in Practice Problem 8.5. Illustration 8.4: Coffee Decaffeination by Countercurrent Supercritical Fluid Extraction Section 6.2.5 introduced the reader to the concept of supercritical fluid extraction (SCE), and Illustration 6.7 provided a first simple example of its application by considering the single-stage extraction of caffeine from coffee beans using supercritical carbon dioxide. The amount of CO2 required in this elementary operation was calculated at 45.9 kg CO2/kg coffee, an inordinately high level. Commercial decaffeination processes use a countercurrent operation carried out in tall columns (see Figure 6.15), with the coffee beans entering at the top and discharged intermittently at the bottom. This process is close enough to a continuous operation to allow us to use the principles established for such an operation. The operating diagram for the process is shown in Figure 8.4. The equilibrium curve is drawn from the relation established in Chapter 6, i.e., x = 1.24y0.316
(6.9a)
% Caffeine in CO2, y
0.75
0.20 Equilibrium Curve
0.15
0.1
Bottom of Column
0
(S/G)min
Driving Force x – x*
0.05
0.1
Pinch (S/G) = 1/2(G/S)min
0.2
0.3
0.4
0.5
0.6
0.7
% Caffeine in Coffee, x FIGURE 8.4 Operating diagram for decaffeination.
0.8
0.9
1.0
Continuous-Contact Operations
325
The operating line will now be located below the equilibrium curve since the process is one of stripping or desorption, i.e., the reverse of that seen in gas absorption. The resistance here would evidently be in the solid phase, with the driving force given by the horizontal distance between operating line and equilibrium curve (Figure 8.4). We do not make use of the driving force in this illustration, but address instead the following problem: Suppose that the caffeine content is to be reduced from 1 to 0.05%, a typical goal in commercial decaffeination and one used in the single-stage extraction process in Illustration 6.7. We first wish to establish how much the CO2 consumption is reduced if we replace the single-stage process with a countercurrent mode of contact. Second, given a typical column height of 20 m, what would be the height equivalent to a theoretical stage, HETS? We start in the usual fashion: by first establishing the minimum amount of “solvent” CO2 required for the operation. The pinch here does not occur at the feed condition, as is usually the case, but much earlier at some intermediate point of the equilibrium curve. That point is located by drawing a tangent to the equilibrium curve starting from the point representing conditions at the bottom of the column (see Figure 8.4). If we now set the actual G/S ratio at twice the minimum amount, we obtain the following result: (S/G) = 1/2 (S/G)Max = Dy/Dx = 0.04/0.95
(8.7a)
The CO2 consumption, which is the inverse of this ratio, is then given by G/S = 0.95/0.04 = 23.8 kg CO2/kg coffee
(8.7b)
The number of stages between feed and effluent is obtained by the usual staircase construction and equals approximately four. The corresponding HETS value is then given by HETS =
Height of column 20 = = 5m Number of stages 4
(8.7c)
Comments: There are a number of features in this example drawn from industry that fall outside the conventional boundaries of textbook problems. The first item of note is the location of the pinch, which occurs at a point between feed and effluent conditions. The resulting minimum CO2 consumption is at the modest level of 11.9 kg CO2/kg beans. Even doubling that amount for actual operating conditions still yields a consumption that is less than that calculated for a single-stage contact (Illustration 6.7). This is a clear-cut vindication of the countercurrent mode of operation. The second feature of note is the small number of stages required (four), and connected to it, the inordinately high value of the height equivalent to
326
Mass Transfer: Principles and Applications
a theoretical stage (5 m). This was partly the result of the relatively generous amount of CO2 we allowed over and above the minimum required. If that number is reduced to 1.5 times the minimum, the number of stages rises to approximately 10, and with it comes a corresponding drop in the HETS to 2 m. It is likely that the actual column operation is in fact in the range of 1.2 to 1.5 times the minimum CO2 requirement and that the HETS is of the order of 1 m, a value much more in line with that expected in operations of this type. The reader is encouraged to examine these cases more closely by enlarging the relevant section of the operating diagram and stepping off the stages for each slope of the operating line.
8.2
Membrane Processes
The notion of separating substances by means of membrane barriers that allow the selective passage of one or more species to the exclusion of all others has both a powerful appeal and the appearance of an impossible dream. Consider the advantages of such a process compared to other operations: • Elimination of thermal energy as an operating expense • Ability to process heat-sensitive materials • No intrusion of solvents, which merely produce an enriched phase and require further processing • No necessity to regenerate or replace adsorbents or ion-exchange resins In fact, the only operating costs visible to the casual observer are conveying the fluids to and (usually) through the barriers and the ultimate disposal of the product stream. The age-old quest for such membranes accelerated in the first half of the 20th century but was initially plagued by a lack of suitable materials, low throughput rates and selectivity, and continuous problems with fouling and plugging. The advent of synthetic polymers brought about a wide new range of materials capable of being altered and modified to suit a particular application. Low throughput rates initially persisted but were overcome with the dramatic development in 1960 of high-flux cellulose acetate membranes by Loeb and Sourirajan. This event signaled the start of a burst of activity in the field of membrane development that continues undiminished to this day.
327
Continuous-Contact Operations 8.2.1
Membrane Structure, Configuration, and Applications
The basic structure of present-day membranes is illustrated in Figure 8.5. It consists of a selective polymeric film and a much thicker but more porous sublayer, which provides the necessary structural support but otherwise does not actively participate in the separation. Such membranes composed of a dual layer of different materials are referred to as anisotropic or asymmetric. The performance of a membrane process is influenced by a number of factors, chief among which are the physical structure of the membrane and the nature and composition of the feed. These factors can be used to order and classify the processes into subcategories, each with its own distinctive features. These categories have gradually assumed proportions that have turned them into self-contained operations in their own right. This is shown in Table 8.2, which summarizes the various subprocesses that have emerged, their relation to physical structure expressed through the membrane pore diameter, and the different applications that have come about as a result. Note the impressive range of both the physical parameters and the actual applications. Pore diameters vary over the span of six orders of magnitude capable of barring particles as small as sodium ions (3.7 Å) in reverse osmosis or bacteria with a diameter of 1 mm in microfiltration, while allowing free passage to water molecules. Intermediate-size particles such as proteins (100 Å) or viruses (1000 Å) can either be retained or allowed to permeate, depending on the requirements of the process. Although fairly distinct in their capabilities, these processes have several features in common . The membrane materials used are generally polymeric in origin and are extensions, both in mode of preparation and in composition, of the cellulose acetate membranes pioneered by Loeb and Sourirajan. Another common feature shared by most of the processes listed is the use of pressure as the driving force; the exceptions are the different forms of dialysis. Thus, in hemodialysis, concentration replaces pressure as the driving force, while electrodialysis is driven by an electrical potential. Less than 1 mm
Dense Skin Layers
About 0.1 mm
Porous Sublayer
FIGURE 8.5 The asymmetric membrane.
328
Mass Transfer: Principles and Applications
TABLE 8.2 Membrane Processes and Their Applications Process
Pore Diameter
Applications
NF Nanofiltration RO Reverse osmosis HD Hemodialysis
10 Å 2–30 Å Similar to RO membranes
ED Electrodialysis
Similar to RO membranes
GS Gas separation
Similar to RO membranes
UF Ultrafiltration
10–1000 Å
MF Microfiltration
0.1–10 mm
CF Conventional filtration
10–100 mm
High-flux desalination Desalination Removal of urea, creatinine, and other substances from urine Desalination in the range 500–2000 ppm salt content Recovery of H2 in ammonia plants, separation of N2 from air, sweetening of natural gas Separation of proteins and other macromolecules; treatment of process water and whey; clarification of fruit juices Removal of microorganisms from water and beverages, or product antibiotics Cell harvesting
Note: 1 nm = 10 Å = 10–3 mm.
Geometrical configurations of the membrane modules have passed through various stages of development from which two major contenders have emerged: In the spiral-wound configuration, membrane sheets flanked by two spacer-supported channels are wound around a central perforated collector tube, which receives the permeate (Figure 8.6). Feed enters axially through one of the channels and selectively permeates radially through the membrane into the second channel, which discharges the permeate into the collector tube. In the hollow-fiber configuration, a shell and tube arrangement is used in which the feed enters either through the membrane fibers (corefed) or is confined to the shell side (shell-fed). These flow geometries are illustrated in Figure 8.7. Let us now turn to a more detailed examination of these processes: Both nanofiltration (NF) and reverse osmosis (RO) draw on principles of osmosis for their implementation. The principal features of this phenomenon and its manifestation in reverse-osmosis operations are illustrated in Figure 8.8a. Consider a selective membrane, i.e., one that is freely permeable to water but much less so to salt, separating a salt solution from water, as shown in Part 1. In such an arrangement, water will flow from the pure-water side into the side less concentrated in water, i.e., the saltwater side. This process is referred to as normal osmosis. If, now, a hydrostatic pressure is applied to the salt side, the flow of water will be retarded, and if that pressure is sufficiently high, the flow will ultimately cease completely. At this point we will have reached what is termed osmotic equilibrium (Part 2), and the hydrostatic pressure associated with this state is referred to as the osmotic pressure. A further increase in applied pressure will act to reverse the flow from the
330
Mass Transfer: Principles and Applications
distribution of free volume or holes (see Chapter 3). The daily production of water using RO and NF amounts to approximately 1 billion gallons, of which 60% involves desalination of brackish and sea water. The remainder of the membrane capacity is in the production of ultrapure water for the electronics industry. Both hollow-fiber and spiral-wound configurations are employed, with pressures in the range 50 to 70 atm for sea water, and 15 to 20 atm for brackish water. Osmotic pressures for these feeds are in the range 1 to 20 atm and are listed, along with other items of interest, in Table 8.3. Gas separation and hemodialysis often employ membranes similar to those used in RO, but differ from them in several aspects. Neither involves osmotic pressure as a countervailing driving force. In gas separation, the partial pressure difference of the diffusing species acts as the driving potential, while in hemodialysis the concentration difference is across the membrane to provide the necessary impetus. Hollow fiber configurations are predominant in both applications. Membrane gas separation is a rapidly evolving technology, with a strong presence in hydrogen recovery from plant off-gases, and in the separation of nitrogen from air. Approximately 50% of all nitrogen used in ammonia synthesis and other applications is produced by membrane separation, the rest coming from the cryogenic liquefaction and distillation of air. Hydrogen recovery typically employs pressures as great as 150 atm on the feed or shell side of the module, with correspondingly small hollow-fiber diameters of 50 to 100 mm (Table 8.2). Nitrogen separation employs much lower feed pressures of only up to 10 atm, which can be easily accommodated in the bore-side of the hollow fiber module and can tolerate higher fiber diameters of up to 1 mm. Because of the extreme sensitivity of the separation process to small pinholes in the membrane, it has become customary to cover the basic fiber with a permeable defect-sealing layer of silicone rubber. We address questions of enrichment and selectivity attained in these processes in the next section. Hemodialysis is a special case of a wider class of operations covered by the umbrella term dialysis. It involves, as is shown in Figure 8.8b, the simultaneous permeation of solutes from the higher to the lower concentration side of the membrane while water passes in the opposite direction driven by the TABLE 8.3 Osmotic Pressures of Various Solutions at 25rr C Solute NaCl Sea water Brackish water Sucrose Dextrose Blood plasma and intracellular fluid (37r C)
Concentration, mg/l
Osmotic Pressure, atm
35,000 32,000 2,000–5,000 1,000 1,000 —
27 23 1–2.7 1.1 2 7.2
331
Continuous-Contact Operations
a.
Mechanical Pressure
Membrane
Seawater
Water
Membrane
Seawater
b.
DP
Seawater
Water
Water Flow
(1) Osmosis
Osmotic Pressure
Membrane
Water Water Flow
(2) Osmotic Equilibrium
(3) Reverse Osmosis
Retentate Water or Solvent
Membrane
Water Principal Permeating Solute Sparsely Permeating Solute
Feed
Dialysate
FIGURE 8.8 (a) Principles of reverse osmosis; (b) principles of dialysis.
osmotic pressure difference of the two solutions. In hemodialysis, water flux is suppressed by using iso-osmotic solutions on both sides. The nonpermeating solution is referred to as the retentate and contains blood cells, proteins, and other valuable components of the blood. The stream carrying away the toxic solutes, which have permeated through the membrane, is termed the dialysate or permeate. The use of hollow-fiber membranes in the dialysis of blood is now widespread and serves close to 1 million patients worldwide involving over 100 million procedures a year. The device, often referred to as an artificial kidney, is illustrated in Figure 8.9. In it, a saline solution with an osmotic pressure nearly equal to that of blood is supplied to the shell
332
Mass Transfer: Principles and Applications
Monitor
Dialyzer
Effluent
Dialysis Solution
Pump
FIGURE 8.9 The hemodialyzer. (From Matsuura, T., Synthetic Membranes and Membrane Separation Processes, CRC Press, Boca Raton, FL, 1990. With permission.)
side of the module while the blood is pumped countercurrently through the core side of the hollow-fiber module. The device contains several thousand fibers in a 5-cm-diameter tube with a total membrane area of 1 to 2 m2. The cumulative area used worldwide for medical purposes exceeds that employed in all industrial applications. Ultrafiltration (UF) is commonly used to strip smaller-sized molecules such as salts and sugars along with water from solutions containing valuable macromolecules. The most prominent applications that have emerged in recent times are the concentration of automotive paint in process rinse water and the concentration of valuable proteins in whey, the supernatant liquid produced in cheese manufacture. In both cases the application of UF technology not only helps to recover valuable materials but also eliminates a bothersome disposal problem. The extension of the process to the treatment of other waste streams has been hampered by the tendency of the membrane to accumulate retained macromolecules at the surface, often in the form of adhering gel layers. This concentration polarization, as it is termed, which arises in all liquid-phase membrane processes but is most marked here, can be partially overcome by membrane modification, repeated cleaning, or the use of high fluid velocities. It remains, however, a serious impediment to the flourishing of UF technology. Its likely future course will be an incremental improvement through the development of membranes that discourage the adhesion of gel layers. UF has a potentially huge market in the treatment of wastewaters such as those that arise in the pulp and paper industry but must await a solution of the problem of concentration polarization.
333
Continuous-Contact Operations 8.2.2
Process Considerations and Calculations
The engineer dealing with membrane processes is confronted with the usual set of tasks associated with operations of this type. In the area of design, we wish to establish the type of membrane and the total area required for a specified separation or production rate. Conversely, for a given unit, real or imaginary, we would want to project performance or product concentration and recovery. Finally, it is often desirable to establish the effect of operating parameters such as feed composition, module geometry, or applied pressure on process performance. We provide some guidelines for dealing with these tasks, aided by the survey of fiber size and operating pressure given in Figure 8.10. Membrane processes in general involve concentration changes in at least two directions, axial and lateral or radial, and therefore inevitably give rise, at least in principle, to PDEs. When both solute and water transport is involved, the equations will be two in number and they will also be coupled. Rigorous numerical solutions of these models were established in the 1970s and 1980s but are generally shunned by process engineers because of their complexities. Certain simplifying assumptions can be introduced that reduce the models to the ODE or even algebraic level while providing reasonably valid estimates of the answers being sought. In all these endeavors, rigorous or approximate, transport parameters play a key role and must be addressed first. They are dependent on a number of variables, including flow conditions, membrane and module geometry, and the specific membrane process being addressed. Thus, the flow can be 50–100mm diameter
High P gas separation and RO. Shell-side feed. 30–150 atm
300–400mm diameter
Medium P gas separation. Bore-side feed. 7–10 atm
500–2000mm diameter
Hemodialysis. Bore-side feed. 1–1.4 atm
FIGURE 8.10 The principal types of hollow-fiber membranes.
1000–3000mm diameter
Ultrafiltration. Bore-side feed. 1.7–3.5 atm
334
Mass Transfer: Principles and Applications
TABLE 8.4 Membrane Transport Characteristics Type of Process and Geometry Reverse osmosis spiral wound Reverse osmosis hollow fiber Gas separation hollow fiber
Flow Regime Laminar (Entry region) Turbulent (Shell-side fed)
Controlling Resistance Core-side fluid
Solute Transport Coefficients
d Sh = 2.12Ê Re Sc ˆ Ë L¯
Type of Model 1/ 3
PDE
Shell-side fluid
k ~ 10–5 – 10–6 m/s
PDE
Laminar
Membrane
Permeabilities
ODE
Hemodialysis hollow fiber
Laminar (Entry region)
Core-side fluid
d Sh = 1.86Ê Re Sc ˆ Ë L¯
1/ 3
Reverse osmosis hollow fiber (bore-side fed)
Laminar (Entry region)
Core-side fluid
d Sh = 1.86Ê Re Sc ˆ Ë L¯
1/ 3
Ultrafiltration hollow fiber
Laminar/ turbulent
Core-side fluid and gel layer
d Sh = 1.86Ê Re Sc ˆ Ë L¯ Sh = 0.23 Re0.8 Sc1/3 (Turbulent)
ODE
PDE
1/ 3
PDE or ODE
Note: Water permeability for contemporary RO membranes is in the range Pw = 10–7 to 10–8 mol/m2sPa.
laminar or turbulent, involve gases or liquids, or take place in hollow-fiber or spiral-wound geometries. We have listed some of these features and the resulting transport parameters in Table 8.4. We note, first of all, that transport resistance is on the fluid side in most cases; the main exception is gas permeation, which, because of the much higher diffusivities involved, is controlled by the membrane resistance. When fluid flow is laminar on the core side, mass transport will be in the entry region (see Chapter 5). This is reflected by the Sherwood number tabulated in Table 8.4. Transport coefficients on the shell side are subject to some uncertainty, which is indicated by listing a suggested range of values. Finally, we note that some of the models can be reduced to the ODE level. This occurs primarily as a result of the absence of water flux and the prevailing resistance residing in an entry-region boundary layer (hemodialysis), or in the membrane itself (gas separation). In the illustration that follows, use is made of these and other simplifications to provide the reader with a set of tools for the preliminary analysis of membrane processes.
335
Continuous-Contact Operations
Illustration 8.5: Brian’s Equation for Concentration Polarization Concentration polarization, which has briefly been mentioned in our previous discussions, arises in all processes involving the passage of water or some other solvent through the membrane wall. The resulting flux will initially lead to a depletion of water and a consequent rise in solute concentration in the vicinity of the wall. This sets in motion a countervailing diffusion of solute back into the core fluid, which is exactly balanced by the rate at which solute is transported to the wall by the permeating water. We have indicated these opposing flows and the resulting concentration profile in Figure 8.11, where Cb, Cw , and Cp are solute concentrations in the bulk fluid, at the wall, and in the permeate, respectively. Note that simultaneously, and in conjunction with this process, an entry-region development of the concentration profile takes place, which is described by the Levêque-type transport relations given in Table 8.2. This local balance of solute transport was first described by Brian in analytical form as follows: Rate of transport of Rate of back = solute by water flux diffusion of solute JwC – JwCp = D
dC dx
(8.8a)
where Jw is the volumetric flux in units of m3/m2 s and x is the distance in the direction of water flux. Note that both C and x increase in the same Membrane Cw Cb Water Flux Back Diffusion
Cw
Cb Cp = 0
x
Feed Flux FIGURE 8.11 Concentration polarization.
Permeate
336
Mass Transfer: Principles and Applications
direction so that Fick’s law takes a positive sign. This expression can be integrated over the boundary layer thickness Dx, which yields
Ú
Cw
dC = C - Cp
Cb
Ú
Dx
0
J w dx D
(8.8b)
or ln
(Cw - Cp ) (Cb - Cp )
= J w Dx / D
(8.8c)
where the right side can be viewed as a Peclet number, given that Jw has the units of velocity. Recognizing that the ratio D/Dx defines the mass transfer coefficient kc, Equation 8.8c can be recast in the form Cw - Cp Cb - Cp
= exp( Jw / kc ) = exp( Pe)
(8.8d)
which is the expression derived by Brian. The ratio Cw/Cb is a measure of solute accumulated at the membrane wall and is termed the concentration polarization modulus ECp. We have occasion to use this equation in the illustration that follows, and in a modified and revealing form in Practice Problem 8.6. Illustration 8.6: A Simple Model of Reverse Osmosis We set as our task here the replacement of the rigorous PDE model of reverse osmosis by a simple and approximate treatment, which makes use of certain empirical findings. Given the uncertainty of the parameters used in even the most rigorous models, this is no more than what good engineering sense dictates. Our starting point is the basic flux equation for water transport through membranes driven by hydrostatic and osmotic potentials, a process alluded to in Chapter 1 (see Table 1.2). We have Nw/A = Pw(Dp – Dp)
(8.9a)
where Nw is the molar transmembrane water flux (mol/s) and Pw is the water permeability in mol/m2 s Pa. A range of values for Pw is given in Table 8.4. The osmotic pressure p is a colligative property, i.e., a property that depends on the particle molarity and is for infinitely dilute solutions given by the van’t Hoff equation:
337
Continuous-Contact Operations
(8.9b)
p = CnpRT
where C = molar concentration and np = number of particles formed on dissociation. This equation holds well for the dilute solutions involved in nanofiltration and for brackish water. Even for sea water, with Cnp ~ 103 mol/m3, it predicts an osmotic pressure of p = 103 ¥ 8.31 ¥ 298 = 2.48 MPa = 24.6 atm, compared to an experimental value of 23 atm (Table 8.3). We adopt this equation to replace osmotic pressure by concentration and make the further assumption that the osmotic pressure in the permeate is zero, i.e., that the membrane is 100% effective in rejecting salt and the bulk concentration Cb is constant, as was deduced in Illustration 5.2 for laminar entry region flow. We can then combine the two equations and factor out the constant Cb to obtain Ê C ˆ N w / A = Pw Á Dp - Cb np RT w ˜ Cb ¯ Ë
(8.9c)
This expression opens a way to introduce Brian’s equation (Equation 8.8d) to eliminate the unknown polarization modulus Cw/Cb. We have È Ê J ˆ˘ N w / A = Pw ÍDp - Cb np RT expÁ w ˜ ˙ Ë kc ¯ ˙˚ ÍÎ
(8.9d)
and noting that the volumetric flux Jw (m3/m2 s) equals 1.8 ¥ 10-6 times the molar flux Nw/A (mol/m2 s), we obtain the following expression in the single variable Jw: È Ê J ˆ˘ J w = 1.8 ¥ 10 -6 Pw ÍDp - Cb np RT expÁ w ˜ ˙ Ë kc ¯ ˙˚ ÍÎ
(8.9e)
This is a non-linear equation in which Jw must be solved numerically. We can use this equation to estimate water flux Jw drawing on kc values given in Table 8.4 or those for the Peclet number Jw/kc listed in Table 8.5. Let us TABLE 8.5 Experimental Membrane Process Parameters Process Reverse osmosis Ultrafiltration Gas separation
ECp = Cw/Cb
Pe
Ee
1–1.5 70–150 ~1
0.3–0.5 5–10 3 ¥ 10–3 to 7 ¥ 10–2
> f
(8.14c)
343
Continuous-Contact Operations
we speak of the process as pressure-ratio limited. Conversely, if the pressure ratio substantially exceeds a, i.e., f >> a
(8.14d)
the process is said to be in the selectivity-limited region. Let us consider these two cases, and the information and lessons to be drawn from them. 1. Pressure-Ratio-Limited Region We start by noting that gas permeation is driven by a concentration or partial pressure difference across the membrane, i.e., it is a process based on diffusion, and not on D’Arcy-type bulk flow. For diffusion to take place, the feed partial pressure must be higher than that on the permeate side; i.e., we must have pF > pP
(8.15a)
or equivalently in terms of mole fraction y or total pressure P yFPF > yPPP
(8.15b)
As a consequence of this inequality, the enrichment attained will generally be smaller than the total pressure ratio and can at most equal it; i.e., we must have
E=
y P PF < y F PP
(8.15c)
and in the limit ( E )Max =
yP PF = =f yF PP
(8.15d)
This limiting value corresponds to the situation in which the partial pressures on either side of the membrane have attained equality, and diffusion has ceased. Note that while partial pressures are now equal, the total pressures on either side are not, nor are the corresponding mole fractions. The enrichment given by Equation 8.15d represents the maximum value of E attainable, irrespective of the selectivity of the membranes involved. In other words the process is now dependent on f only and is consequently in the pressure-ratio-limited region, with a resulting enrichment given by Equation 8.15d. This condition arises when a exceeds f by a factor of more than 5.
344
Mass Transfer: Principles and Applications
2. Selectivity-Limited Region When the pressure ratio is very large, it ceases to be a limiting factor and the process becomes solely dependent on the membrane selectivity a. The enrichment E will in this case no longer be dictated by the value of f but must instead be extracted from Equation 8.14a. We obtain by simple rearrangement
E=
y 1P a = y1F 1 + y1F (a - 1)
(8.16)
which is entirely analogous to the enrichment obtained in vapor-liquid equilibria. This condition holds when f exceeds a by a factor of more than 5.
Comments: The limiting expressions (Equation 8.15d and Equation 8.16) are invaluable in arriving at a first assessment of gas-separation processes. Suppose, for example, that a = 5, which is a typical membrane selectivity for the separation of nitrogen and oxygen. Then in any practical operation, the pressure ratio will be in excess of a and the operation will consequently take place in the selectivity-limited region. The maximum enrichment of nitrogen attainable is then given by (Equation 8.16)
( EMax ) =
a 5 = = 1.2 1 + y1F (a - 1) 1 + 0.79(5 - 1)
(8.17)
This is still a respectable value and has led to the large-scale adoption of the membrane process for the separation and enrichment of air. The limiting expressions laid down above are also helpful in setting limits on the usefulness of enhancing membrane selectivity. This comes about as a result of the high cost of compressing feed gas to very high pressures or drawing a hard vacuum on the permeate side, which limits practical pressure ratios f to the range 10 to 50. Suppose, for example, that a value of f = 10 is chosen. Then a membrane selectivity of 50 will locate the process in the pressure-ratio-limited region with the enrichment factor given by E = f, independent of a (Equation 8.15d). Any further increases in membrane selectivity will therefore have no effect on the performance of the process under these conditions.
345
Continuous-Contact Operations
Practice Problems 8.1. The Operating Line in a Gas Scrubber Explain the meaning and consequences of the following special cases of an operating line for a gas scrubber: a. The line is vertical. b. The line is horizontal. c. The line is curved. d. The line is displaced parallel to itself and away from the equilibrium curve. e. The line lies below the equilibrium curve. What is the effect on NTU in cases a, b, and d? 8.2. The Effect of Feed Flow Rate in Gas Absorption Analyze how an increase in the gas flow rate would affect the performance of an existing absorber. 8.3. The Effect of Packing Size in Gas Absorption Qualitatively plot the component and total costs that are affected by packing size in a gas absorber. (Hint: Use Figure 8.2 as a guide.) 8.4. Packed Column Liquid Extraction in the Linear Regime An aqueous solute is to be extracted in a packed column using an organic solvent with a distribution coefficient of 1.5. The raffinate concentration is to be reduced tenfold from 0.1 to 0.01 wt ratio and it is proposed to use a solvent ratio 1.5 times the minimum required. The entering solvent is essentially solute free and HTU is initially set at 4 m. Such high HTU values of several meters are not unusual in liquid-extraction applications. Establish the required height of the extraction column. Answer: 11.2 m 8.5. Another Look at Isotope Distillation An isotope pair with a separation factor of 1.01 is to be separated into overhead and bottoms product with compositions of 0.99 and 0.10 mole fraction, respectively, by distillation in a packed column. A particular high-efficiency packing has been touted by its manufacturer as having HTU values of no more than 3 cm. The facility considering the process is, for various reasons, constrained to column heights of no more than 10 m. Will the process meet this requirement? 8.6. Concentration Polarization, Peclet Number, and Enrichment Factor Show that Brian’s equation (Equation 8.8d) can be recast in the form
346
Mass Transfer: Principles and Applications
ECp =
Cw exp( Pe) = Cb 1 + Ee [exp( Pe) - 1]
(8.8d)
where Pe = JDx/D is the flux Peclet number, and Ee is an enrichment factor defined by the ratio Cp/Cw . Table 8.5 conveys an idea of the magnitude of these parameters for various membrane processes. 8.7. The Effect of Pressure in Reverse Osmosis Typical sea water desalination plants using reverse osmosis produce 30 to 50 gfd of water [gal (U.S.) per square ft per day] (1 gfd = 4.72 ¥ 10–7 m3/m2 s). Suppose it is decided to double the operating pressure from 50 to 100 atm. Will the production rate increase by less or by more than a factor of 2? Assume 100% salt rejection. 8.8. The Effect of Feed Rate and Water Salinity in Reverse Osmosis Consider the process described in Illustration 8.6. Using the numerical parameter values cited there determine: a. The effect of halving salinity on Jw . b. The effect of doubling the shell-side feed rate on the same quantity. (Hint: Consider the effect on v in turbulant flow.) Answer: a. Jw = 8.9 ¥ 10–5 m3/m2 s 8.9. Concentration of an Isotonic Saline Solution Isotonic saline is an NaCl solution that has the same osmotic pressure as blood. It is used in medical treatments, for example, to make up fluid loss, and also as the extracting fluid on the dialysate side of an artificial kidney. Calculate the concentration of this solution. (Hint: Consult Table 8.3.) Answer: 0.141 molar 8.10. Performance of a Hemodialyzer Use the following data to calculate the urea concentration exiting from a hemodialyzer with a total surface area of 1 m2 and 100 hollow fibers of length L = 17 cm. Urea diffusivity D = 2 ¥ 10–5 cm2/s Urea inlet concentration CBi = 100 ppm Blood flow rate QB = 1 cm3/s (total) Answer: 560 ppm
347
Continuous-Contact Operations
8.11. Effect of Membrane Resistance: The Wall Sherwood Number For the hemodialyzer of Practice Problem 8.10, calculate the percent resistance in the membrane wall, using the wall Sherwood number defined in Illustration 5.1. Answer: 5.1% 8.12. The Hemodialyzer Derive the solution (Equation 8.13b) describing the performance of a hemodialyzer. (Hint: Start with a differential balance for the dialyzer to obtain the effluent blood concentration, and use this value for the balance over the blood compartment.) 8.13. Performance of a Membrane Process in Gas Separation The membrane selectivity for the removal of CO2 from natural gas is of the order 20. For a feed containing 5% CO2, give an approximate evaluation of the enrichment attainable using a pressure ratio of 20.
9 Simultaneous Heat and Mass Transfer
Our treatment so far has made occasional reference to heat transfer, primarily to draw the reader’s attention to the analogies that exist between the transport of heat and mass. For example, in Chapter 1 we highlighted the similarities between the rate laws governing convective and diffusive heat and mass transfer. The analogy between the two phenomena when dealing with co-current or countercurrent operations has been brought out on several occasions, notably Illustration 8.7. We now turn our attention to processes where heat and mass transfer occur in unison. This is far from an unusual event, but it raises the complexity of the underlying model, a fact that persuaded us to defer its consideration to the final chapter. Simultaneous heat and mass transfer occur in a natural way whenever the transport of mass is accompanied by the evolution or consumption of heat. An important class of such operations, and one that occupies a considerable portion of this chapter, involves the condensation of water vapor from an airstream and the reverse process of evaporation of liquid water into air. There are a host of important operations in which this type of transfer occurs. The humidification and dehumidification of air, often identified with air conditioning, is practiced within domestic, commercial, and industrial contexts. Process water that was used in a plant for cooling purposes is often cycled through a cooling tower, where it is contacted in countercurrent flow with air and undergoes evaporative cooling before being returned for reuse. The drying of solids, an important class of operations in its own right, also draws on the principles that underlie the transport of water between its liquid phase and air. Indeed, the air-water system and the temperature and concentration changes that arise in air-water contact are of such importance in the physical sciences that they have led to the construction of psychometric or humidity charts. These charts summarize in convenient fashion the thermal and concentration variables relevant to operations involving the air–water system. In the illustrations and practice problems that follow, we use these charts repeatedly to establish parameters of interest in various operations based on the air–water system.
349
350
Mass Transfer: Principles and Applications
Simultaneous heat and mass transfer also occurs in exothermic or endothermic heterogeneous reacting systems and in the absorption or adsorption from concentrated gas streams. These topics are addressed in separate illustrations but we retain the air–water system as the central theme of this chapter.
9.1 9.1.1
The Air–Water System: Humidification and Dehumidification, Evaporative Cooling The Wet-Bulb Temperature
We start our deliberations by examining the events that occur when a flowing gas comes in contact with a liquid surface. The reader will be aware from personal experience that this process results in a drop in the temperature of the liquid, often referred to as evaporative cooling. The chill we experience when wind blows over our perspiring bodies is one manifestation of this effect. Let us assume that both the water and the air are initially at the same temperature. During the first stage of evaporation, the energy required for the process, i.e., the latent heat DHv , will come from the liquid itself, which consequently experiences a drop in temperature. That decline, once it is triggered, will cause a corresponding amount of heat transfer to take place from the air to the water. At this intermediate stage, the latent heat of vaporization is provided both by the liquid itself and by heat transfer from the warmer gas. As the liquid temperature continues to drop, the rate of heat transfer accelerates until a stage is reached where the entire energy load is supplied by the air itself. A steady state is attained in which the rate of evaporation is exactly balanced by the rate at which heat is transferred from the gas to the liquid. The liquid is then said to be at its “wet-bulb temperature,” Twb, and the corresponding air temperature is referred to as the “dry-bulb temperature,” Tdb. The difference (Tdb – Twb) constitutes the driving force for the heat being transferred from the gas to the liquid. This is indicated in Figure 9.1, which also shows the associated humidities of the air, Ywb (kg H2O/kg air), the saturation humidity prevailing at the surface of the liquid, and Ydb, the humidity in the bulk air. The wet-bulb temperature and its associated saturation humidity play a central role in humidification and dehumidification, in water cooling operations, as well as in drying processes. These are taken up in subsequent illustrations. The relation among Twb, Ywb, and the system parameters is established by equating the rate of heat transfer from air to water to the rate of evaporation, i.e., the rate at which moisture is transferred from the water surface to the air. Thus,
351
Simultaneous Heat and Mass Transfer Effective Gas Film Water Drop Twb Tdb Sensible Heat
Temperature
Twb Ywb
Vapor Heat Ydb
Humidity
FIGURE 9.1 Temperature and humidity distribution around a water drop exposed to a flowing airstream.
Rate of evaporation = Rate of heat transfer kYA(Ywb – Ydb)DHv = hA(Tdb – Twb)
(9.1a)
where kY is the mass transfer coefficient in units of kg H2O/m2 s DY. Canceling terms and rearranging we obtain Ywb - Ydb h =Twb - Tdb kY DHv
(9.1b)
where the difference Tdb – Twb is referred to as the wet-bulb depression. We note from Equation 9.1b that the humidity of the air Ydb can, in principle, be established from measured values of Tdb, Twb, and Ywb, the latter being obtained from the relation
Ywb
(P ) = P - (P ) o H 2O
Tot
wb o H 2O
MH2O wb
Mair
(9.1c)
where PHo2O is the vapor pressure of water, available from tables, and M = molar mass. Tdb is measured by exposing a dry thermometer to the flowing air, while Twb is obtained in similar fashion using a thermometer covered with a moist wick. More recent devices for measuring Y rely on changes in electrical properties of the sensor element with the moisture content of air. Both wet- and dry-bulb properties appear in the humidity charts that are taken up shortly.
352 9.1.2
Mass Transfer: Principles and Applications The Adiabatic Saturation Temperature and the Psychrometric Ratio
Before addressing the properties and construction of the humidity charts, we consider a small variation on the simple contact of water with flowing air, which led to the wet-bulb conditions. In this modified arrangement, shown in Figure 9.2, a stream of air is humidified in contact with constantly recirculated water. Both the water and the exiting gas stream attain adiabatic saturation temperature, Tas, which is lower than the dry-bulb temperature of the entering air because of evaporative cooling. If care is taken to introduce the make-up water at the same adiabatic saturation temperature, and the datum temperature is set at Tas, a simple energy balance will yield Rate of energy in – Rate of energy out = 0 [Cs(Tdb – Tas) + YdbDHv] – [Cs(Tas – Tas) + YasDHv] = 0
(9.2a)
which on rearrangement leads to the expression Yas - Ydb C =- s DHv Tas - Tdb
(9.2b)
where Cs is the specific heat of the air, also termed humid heat, in units of kJ/kg dry air. Plots of this equation appear in the humidity charts discussed in the next illustration. The striking similarity between the adiabatic saturation and wet-bulb relations, Equation 9.2b and Equation 9.1b, led to a detailed examination of the ratio of the two slopes, h/kYCs, also known as the psychrometric ratio. These studies culminated in the finding that for the water-air system, and only for that system, its value is approximately unity. Thus, Psychrometric Ratio h/kYCs ª 1
Inlet Gas
Outlet Gas
Y, Tdb
Yas, Tas
Makeup Water Tas Tas FIGURE 9.2 Flow sheet showing the attainment of adiabatic saturation conditions.
(9.2c)
353
Simultaneous Heat and Mass Transfer
This expression, known as the Lewis relation, when used to compare Equation 9.1b and Equation 9.2b, leads to the conclusion that the adiabatic saturation and wet-bulb temperatures are essentially identical. The Lewis relation has other important implications as well, as will become apparent in Illustration 9.4 dealing with the design of water-cooling towers. It is seen there that the underlying model equations can be enormously simplified by making use of the Lewis relation. Illustration 9.1: The Humidity Chart The psychrometric or humidity charts are displayed in Figure 9.3 and Figure 9.4 for the low and high temperature ranges shown. To familiarize ourselves with the properties of these diagrams, we start by defining and deriving a set of variables, which appear implicitly or explicitly in the two figures. Absolute Humidity Y This quantity was already referred to in connection with the wet-bulb temperature and is redefined here for convenience:
26
-30
-28
-30
-24
-25
-25 0.70
2
+0.
+0
0.005 0.82 0
.4 +0
-20
-20 0.72
-10 0.74
-15 0.76
y
dit
mi
Hu 80% ve i 70% t la 60% Re 50% 40% 30% 20%
.6
.8
+0
-15
10
5
0.006
Air 0 ry 8 1 D /kg 6 C kJ 4 e° n tur o 2 i a t r ra 0 pe em atu 2 nT t S -4 o a i at lpy -6 tur Sa tha -8 r n o E -10 lb Bu -10 -12 et W -15
0.007
0
0
. +1
5 0.78
0.004 0.003
10%
10 0.80
0.002
Moisture Content kg/kg Dry Air
-18
32 34 36 0.008
30
3 /kg
20
-22
-12
12
18
16
24
22
28
26
m Volume
14
-16
10
14
20
(9.3a)
%
8
18 pH2O 29 PT - p H2O
90
Y ( kg H 2O / kg dry air ) =
0.001 0.000 15 0.78
Dry-Bulb Temperature °C FIGURE 9.3 Humidity chart: low temperature range. (From Carrier Corporation. With permission.)
354
Mass Transfer: Principles and Applications
02 60 27 02 80 29 03 00 31 50 03 20
330
340
350
70
360 80
370
380 390
90
100
400 110
120 0.10
1.25
60
-7.0
-6.0
-5.0
ir A Dry 3/kg em olum 15 V 1. 1.10
1.05
0.04
Moisture Content kg/kg Dry Air
-2.0
-1.5
-1.5
-4.0
-2.0
0.95 -1.0
9% 8% 7% -3.0 6% 5% 4%
10
%
1.00
90 20
0.90
0.05
0.02 3% 2% 1%
0.01
0.85
20
-0.5
0.06
0.03
80 25
70 60 50
0.08
0.07
25% 20%
30%
-0.5
-1.0 Relativ e Hum idity
40%
70% 60% 50%
12 Enth a 0 13 lpy a 01 t 40 Satu 15 r 0 1 ation 60 kJ
10 0 11 01 30 /kg 20 We 18 Dry t Bulb 01 35 or Sa 90 Air turat 20 40 ion Tem 02 pera ture 10 90% 45 80%
21
-3.0
02
20
-4.0
23
02
1.20
40
25
0.09
30
40
50
60
70
80
90
100
110
0.00 120
Dry-Bulb Temperature °C FIGURE 9.4 Humidity chart: high temperature range. (From Carrier Corporation. With permission.)
where pH2O is the partial pressure of water vapor. Y appears as the right-hand side ordinate in the humidity charts. Relative Humidity RH To obtain a sense of the relative degree of saturation of the air, we define
355
Simultaneous Heat and Mass Transfer
%RH =
pH2O PHo2O
(9.3b)
100
where PHo2O is the saturation vapor pressure of water at the temperature in question. RH varies over the range 0% (dry air) to 100% (fully saturated air) and appears in the humidity charts as a set of parametric curves that rise smoothly from left to right. Dew Point Tdp This is the temperature at which moist air, cooled at constant PTot and Y, becomes saturated, i.e., attains 100% relative humidity. Its value is established by moving from the initial defining point of a given air–water mixture on the humidity chart along a horizontal line to the eventual intersection with the curve of 100% relative humidity. Humid Volume VH The humid volume of moist air is the specific volume in m3/kg dry air measured at PTot = 101.3 kPa (1 atm) and the temperature T of the mixture. Values of VH appear in the humidity charts as a set of lines of negative slope. Humid Heat Cs This quantity, which has already been encountered in connection with the adiabatic saturation temperature, is the specific heat of moist air expressed in units of kJ/kg dry air. Humid heat does not usually appear explicitly in the charts but is contained in the enthalpies shown there. It can be calculated from the following equation: Cs(kJ/kg dry air) = 1.005 + 1.88Y
(9.3c)
Enthalpy H With the humid heat in hand, we are in a position to formulate the enthalpy of an air–water mixture. With Tr chosen as the datum temperature for both components and adding sensible and latent heats we obtain H(kJ/kg dry air) = Cs(T – Tr ) + YDHvr Sensible heat
(9.3d)
Latent heat
where the datum temperature is usually set equal to 0r C for both liquid water and dry air.
356
Mass Transfer: Principles and Applications
Values of the enthalpies of various air-water mixtures are read from the left-hand oblique ordinate. Adiabatic Saturation Temperature Tas and Wet-Bulb Temperature Tdp Plots of the adiabatic saturation line, Equation 9.2b, appear in the humidity charts as lines extending from the abscissa to the 100% relative humidity curve. The point of intersection with that curve defines the wet-bulb temperature Twb, which is also the adiabatic saturation temperature Tas. Example This concrete example illustrates the various uses to which the humidity charts may be put: We choose moist air with a relative humidity of 25% and a (dry-bulb) temperature of 50r C and proceed to calculate various properties of interest using the chart shown in Figure 9.4. Absolute Humidity Y. This value is read from the right side rectangular ordinate, which yields Y = 0.0195 kg H2O/kg dry air
(9.4a)
Dew Point Tdp. We follow the horizontal line through the point Y = 0.0195, T = 50r C to its intersection with the 100% relative humidity curve and obtain Tdp = 24.5r C
(9.4b)
This corresponds to the temperature at which, on isobaric cooling of the moist air, the first condensation of water occurs. Wet-Bulb Temperature Twb. Here the procedure is to follow the adiabatic saturation line to its intersection with the 100% relative humidity curve. We obtain Twb = 30.4r C
(9.4c)
Note that the wet-bulb temperature is not identical to the dew point. Water Partial Pressure p H2O . This quantity can be obtained directly from the absolute humidity and Equation 9.3a. Solving it for pH2O yields
pH2O =
29 Y PTot 29 ¥ 0.0195 ¥ 101.3 = 2.09 kPa = 18 + 29 Y 18 + 29 ¥ 0.0195
(9.4d)
357
Simultaneous Heat and Mass Transfer
Humid Volume VH. The plots for VH are shown as steep lines of negative slope. The point Y = 0.1095, T = 50•C is located between the lines for VH = 0.90 and 0.95. Linear interpolation yields the value VH = 0.945 m3/kg dry air
(9.4e)
Enthalpy H. This value is read from the oblique left-hand ordinate of Figure 9.4 and comes to H = 103 kJ/kg dry air
(9.4f)
Water Removal. Suppose the air mixture considered here is to be cooled and dehumidified to T = 15r C and RH = 20%. The water to be removed can then be calculated as follows: (Y)initial = 0.1095
(Y)final = 0.0021
(9.4g)
Water to be removed: (Y)initial – (Y)final = 0.0195 – 0.0021 = 0.0174 kg H2O/kg air
(9.4h)
Alternatively, the result may be expressed in volumetric units by dividing by the humid volume of the original mixture: 0.0174/0.945 = 0.0184 kg H2O/m3 initial mixture. Water Removal Heat Load. In addition to the amount of water to be removed, an important parameter in the design of a dehumidification unit is the associated heat load. That quantity can be computed from the relevant enthalpies read from the humidity chart. We have for the case cited (H)initial = 103 kJ/kg dry air, (H)final = 20.3 kJ/kg dry air Heat removed = (H)initial – (H)final = 103 – 20.3 = 82.7 kJ/kg dry air
(9.4i) (9.4j)
Alternatively, using volumetric units Heat removed = [(H)initial – (H)final]/VH = 82.7/0.945 = 87.5 kJ/m3
(9.4k)
Illustration 9.2: Operation of a Water-Cooling Tower As previously mentioned, warm process water that was used in a plant for cooling purposes can be restored to its original temperature by contacting it with an airstream, which causes it to undergo evaporative cooling. The operation is generally carried out in cooling towers containing stacked pack-
358
Mass Transfer: Principles and Applications
ings of large size and voidage to minimize pressure drop. We propose here to model the operation of such a tower and, in the course of the model development, introduce the reader to some ingenious simplifications based on the Lewis relation (Equation 9.2c). As in all packed-column operations, the fundamental model equations consist of differential balances taken over each phase; the principal novelty here is the simultaneous use of mass and energy balances. The pertinent variables and the differential elements around which the balances are taken are displayed in Figure 9.5a. Water Balance over Gas Phase (kg H2O/ml s) This balance is no different from similar mass balances used in packed-gas absorbers and distillation columns (see Chapter 8) and takes the form Rate of water vapor in – Rate of water vapor out = 0 È GsY ˘ z Í ˙ – GSY z+ Dz = 0 N + ÍÎ avg ˙˚
[
]
(9.5a)
which upon introduction of the auxiliary mass transfer rate equation, division by Dz, and letting Dz Æ 0 yields the usual form of ODE applicable to these cases: Gs
dY - KY a(Y * -Y ) dz
(9.5b)
where Y* – Y is the humidity driving force. Water Balance over Water Phase This balance is omitted since the water losses are usually less than 1%. Gas Phase Energy Balance (kJ/m2 s) Here we must be careful to include both sensible heat transfer as well as the latent heat brought into the air by the water vapor. We obtain Rate of energy in – Rate of energy out = 0 ÈGs H + qavg ˘ z ˙ – Gs H z+ Dz = 0 Í H + D ÍÎ v Navg ˙ ˚
[
]
which, after applying the same procedure as before, yields
(9.5c)
359
Simultaneous Heat and Mass Transfer
a. Column Variables Water
Moist Air Y|z+∆z TG|z+∆z H|z+∆z Navg qavg
TL|z+∆z HL|z+∆z
Y|z TG|z H|z
TL|z HL|z
Water
z+∆z z
Moist Air
b. Operating Diagram
Air Enthalpy H
ibr
il qu
ium
%
00
=1
H eR urv
(Hout, TLin)
E
H*–H
(Hin, TLout)
Slope (LCL/G)min
C
ine gL n i t /G era Op pe LC L o l S
Water Temperature TL FIGURE 9.5 Variables and operating diagram for a packed cooling tower.
Gs
dH − Ua(TL − TG ) − ∆H v KY a(Y * −Y ) = 0 dz
(9.5d)
Here TL and TG are the water and air temperatures, respectively, and H equals the enthalpy of the moist air at a given point in the tower. Liquid Phase Energy Balance (kJ/m2 s) A completely analogous derivation to the gas-phase energy balance yields LCpL
dTL − Ua(TL − TG ) − ∆H v KY a(Y * −Y ) = 0 dz
(9.5e)
360
Mass Transfer: Principles and Applications where we have replaced the liquid enthalpy HL by CpL (TL – Tr ). The model is completed by adding the relevant equilibrium relation, which coincides with the 100% RH curve in the humidity charts and is also available in analytical form. Thus, for the equilibrium relation Y* = f(TL)
(9.5f)
Equation 9.5b, Equation 9.5d, Equation 9.5e, and Equation 9.5f together with the previously given expression for H (Equation 9.3d) constitute a set of five equations in the five state variables Y, Y*, TG, TL, and H. Although a numerical solution of these equations is today easily accomplished, early workers in the field had to cast about for alternative means of solving the model. To do this, they used the ingenious device of introducing the Lewis relation into the gas-phase energy balance, which has the effect of combining TG and Y into a single variable, the air enthalpy H. We sketch the procedure below, using interfacial values in place of Y* and TL to accommodate the film coefficients h and kY used in the Lewis relation. We use that relation to replace h by kYCs and obtain in the first instance Gs
dH - kY a (CsTi + DH v Yi *) - (CsTG + DH v Y ) = 0 dz
[
]
(9.5g)
where, as seen from Equation 9.3d, the bracketed terms ( ) represent enthalpies of air–water mixtures. We therefore can write Gs
dH - kY a( H i - H ) = 0 dz
(9.5h)
where Hi – H can be considered an enthalpy driving force, which replaces and combines the temperature and humidity driving forces in the original model. We now assume that the two-film theory can be applied to this system, with the result that Equation 9.5h can be cast in the form Gs
dH - KY a( H * - H ) = 0 dz
(9.5i)
where KYa is now the overall mass transfer coefficient and H* the gas enthalpy in equilibrium with the bulk water temperature TL. This equation is of the same form as gas-phase differential balances encountered in gas absorption and distillation, so that the design procedures used there can be replicated, provided an appropriate operating line can be constructed. That line is obtained from an overall two-phase integral heat balance and takes the form
Simultaneous Heat and Mass Transfer Gs(H1 – H) = LCL(TL1 – TL)
361 (9.5j)
for part of the column, and for the entire tower Gs(H1 – H2) = LCL(TL1 – TL2)
(9.5k)
The gas-phase energy balance (Equation 9.5i) can in turn be formally integrated to yield the familiar HTU-NTU relation:
Z=
Gs KY a
Ú
Hout
Hin
dH = HTU ¥ NTU H * -H
(9.5l)
The model is completed with the addition of the equilibrium relation: H* = f(TL)
(9.5m)
which is constructed from the 100% RH curve of the psychrometric charts. The original set of five equations, three of which are ODEs, have thus been reduced to the three relations (Equation 9.5k, Equation 9.5l, and Equation 9.5m). What is more, the set is now cast in the familiar form of an HTUNTU expression, joined to an operating line and equilibrium relation. The graphical procedure used to solve this much simpler set is outlined in Figure 9.5b and follows the usual routine of drawing an operating line, this one of slope LCL/Gs, through the point (H1, TL1), and evaluating the NTU integral using the enthalpy driving force read from the operating diagram. Note that it is now GMin, not LMin, which corresponds to an infinitely high tower. In Practice Problem 9.3, the reader is asked to apply this method to the design of a cooling tower.
9.2
Drying Operations
The drying of solids is a topic of considerable proportions that merits an entire monograph for its proper treatment. Our purpose here is to give the reader a brief survey of the operation and to provide practice in carrying out simple calculations. Drying can be carried out in a variety of physical configurations in which the solids can be stationary, conveyed on a moving belt, or allowed to tumble through an inclined rotary kiln. What these operations have in common is the use of heated air to assist in the drying process. When air passes through a stationary mass of solids, which may be contained in a set of perforated
362
Mass Transfer: Principles and Applications
trays or in a fixed bed or column, the process is referred to as through-flow drying. Cross-flow drying occurs when air passes through a perforated conveyor belt at right angles to the solids being conveyed. Rotary kilns, on the other hand, usually make use of a countercurrent mode of contact, with hot combustion gases flowing upward into the inclined kilns while the tumbling solids make their way downward in the opposite direction. The drying of solids in general is a highly complex process involving both heat and mass transfer. If the solid is porous, moisture content and the temperature will vary internally, as well as externally in the direction of airflow. Thus we could be dealing with at least two coupled PDEs (mass and energy balance) in time and two dimensions. Early studies of drying processes revealed that considerable simplifications result by recognizing three distinct drying periods, shown in Figure 9.6. During an initial adjustment period, the surface moisture quickly drops to the wet-bulb temperature. If the moisture content in the air is either negligible or otherwise constant due to steady-state conditions, the humidity driving force will assume a constant value Y* – Y and the drying process will consequently proceed at a constant rate. During this constant-rate period, as it is called, the process can be modeled algebraically if we assume negligible change in air humidity in the direction of flow, or by an ODE if the latter varies. Thereafter, the drying process becomes more complex as moisture removal now must take place from the interior porous structure and a continually receding water interface. A lengthy drying period results as the moisture becomes increasingly inaccessible. It is this interval, called the falling-rate period, that leads to the aforementioned PDEs. In the following illustration, which deals with the drying of a steamed activated carbon bed, we assume that the operation takes place entirely in the constant-rate period. This is based on the fact that carbon is a hydrophobic substance that allows little penetration of its porous structure by the condensate produced during the steaming process. In other words, the condensate is assumed to be present entirely as surface moisture, which is removed by a constant-rate drying mechanism.
Initial Adjustment
Rate of Drying
Constant Rate Solid Surface at Wet-Bulb T
Time FIGURE 9.6 The various drying periods.
Falling Rate Moisture Removal from Pores
Simultaneous Heat and Mass Transfer
363
Illustration 9.3: Debugging of a Vinyl Chloride Recovery Unit Vinyl chloride monomer (VCM) is a volatile substance (boiling point 14r C) used as a starting material for the production of polyvinyl chloride (PVC). It has been identified as a potential carcinogen, and occupational health regulations now call for an upper limit of 1 to 5 ppm VCM in factory air. A preferred method of air purification is to pass VCM-laden air through beds of activated carbon. These beds operate on a four-step cycle: 1. Saturation with VCM to 1 ppm breakthrough 2. Stripping of the adsorbed VCM with steam, which is subsequently condensed, leaving essentially pure VCM that is dried and recycled 3. Drying of the carbon bed with hot air 4. Cooling of the regenerated bed with cold purified air A dual-bed system is commonly employed, so that while one bed is “onstream,” the second bed can be regenerated and prepared for the adsorption step. The time period allowed for each step is typically as follows: 1. Saturation: 4 h 2. Steaming: 2 h 3. Drying: 1 1/2 h 4. Cooling: 1/2 h A schematic diagram of the cycle appears in Figure 9.7. A major producer of PVC experienced difficulties with a newly installed adsorption system. The unit performed satisfactorily with fresh carbon, but during subsequent cycling the VCM level in the effluent rose to unacceptable levels. Inspection of the beds after drying revealed considerable residual moisture. Inadequate drying during step 3 was therefore considered to be a possible reason for the malfunctioning of the bed. The total amount of condensate that needed to be evaporated was estimated at 100 kg. When queried about their choice of airblower and its delivery rate (0.1 kg/s at 49r C), plant personnel responded that it was based on the assumption that the condensate was at or near 100r C. This was a major conceptual error. Basic knowledge of the psychrometric chart should have led to the realization that evaporative cooling would reduce the temperature of the condensate well below 100r C, i.e., to the wet-bulb level. This in turn would dramatically reduce the evaporation rate since the vapor pressure, and hence the driving saturation humidity, is an exponential function of temperature. If we assume that the entire bed attains the wet-bulb temperature after a brief start-up period, the model reduces to an ODE, which must be complemented by a cumulative mass balance to determine the drying time. We consider instead a limiting version of the full model in which the exiting airstream is assumed to be fully saturated. This asymptotic case provides us
364
Mass Transfer: Principles and Applications Purified air
Bed 1
Dry clean bed Saturated bed
Air + VCM Bed 2 Steam
Moist air
Moist VCMfree bed
VCMloaded bed
Warm air
Warm bed
Moist bed
Cooled bed
Dried bed
Steam + VCM
Hot air
Cool dry air
FIGURE 9.7 Removal of VCM from air: operation of the adsorption purifier.
with an estimate of the minimum airflow rate required to evaporate the charge of 100 kg water in the assigned time of 1 1/2 h. Let us proceed along these lines. To obtain the minimum airflow rate we compose a cumulative water balance, which is given by Water removed Amount of by exiting gas = water to be in 1 1 2 hr evaporated Ywb(Gs)Mint = 100 kg
(9.6a)
from which, with t = 1 1/2 h = 5400 s, we obtain (Gs )Min =
100 1 = Ywb 5400 54 Ywb
(9.6b)
365
Simultaneous Heat and Mass Transfer TABLE 9.1
Minimum Air Flow Rates for Drying a Carbon Bed Containing 100 kg Moisture Air Temperature (°C) Ywb (kg H2O/kg air) (Gs)Min (kg/s)
25 0.006 3.1
50 0.013 1.4
75 0.021 0.88
100 0.028 0.66
125 0.038 0.49
The humidity chart, Figure 9.4, is now used in Equation 9.6b to establish values of (Gs)Min for various levels of incoming air temperature Tair . This is done in the usual fashion by first locating the incoming air temperature and humidity, assumed to be zero, on the chart, and then moving from that point upward and to the left along the adiabatic saturation line to a point of intersection with the 100% RH curve. The right-hand ordinate of that point yields the value of Ywb to be used in Equation 9.6c. The results obtained are summarized in Table 9.1. Examination of Table 9.1 shows that the air provided by the plant (Tair = 50r C, Gs = 0.1 kg/s) underestimated the minimum requirement by a factor of 14. Even at a temperature of 125r C, the minimum flow required was still five times that actually provided. Clearly, a combination of both higher temperature and greater blower capacity would be required to meet the drying specifications. A reasonable recommendation would be for a flow rate of 1 kg/s at 125r C at the point of delivery. This provides a safety factor of 2 over the tabulated (Gs)Min of 0.49 kg/s. Comments: Note here that we were able, without resorting to elaborate calculations, to pinpoint the cause of malfunction and to make realistic recommendations for its rectification. The rapid way in which this was achieved and the simple remedies proposed would please industrial clients who value quick results and simple solutions above all else. We should not be blind to the fact, however, that this success was based on a good understanding of the physical process involved. The situation required not so much an extensive expertise in drying operations, but rather the simple recognition that we were dealing with evaporative cooling. This realization led to a rapid resolution of the problem.
9.3
Heat Effects in a Catalyst Pellet: The Nonisothermal Effectiveness Factor
Illustration 4.9 considered the model that describes the isothermal diffusion and reaction in a catalyst pellet. Solution of that model yields the reactant concentration profile within the pellet, which is then converted by integration
366
Mass Transfer: Principles and Applications
into the so-called catalyst effectiveness factor E. Such isothermal effectiveness factors apply to small particles with high thermal conductivities and relatively low reaction rates. In general the heat of reaction, which is of the order of 100 kJ/mol, cannot be ignored, and the mass balance must then be complemented by an appropriate shell energy balance. That balance must consider the heat conducted in and out of the shell, as well as the heat generated or consumed within the pellet. We assume the same slab geometry and first-order reaction as before and consider the reaction to be exothermic, which is the more common case. The following formulation is then obtained: Rate of energy in – Rate of energy out = 0 ˘ È dT È dT ˘ ˙ =0 Í - k e A dz k A – Í e ˙ x + Dx ˙ Í dx x˚ Î Î+ kr (T )CA DH r ADx ˚
(9.7a)
Dividing by ADx and letting Dx Æ 0 we obtain the second-order ODE d 2T - kr (T )CA DH r / k e = 0 dx 2
(9.7b)
where ke is the effective thermal conductivity of the pellet. This expression is supplemented by the mass balance given in Illustration 4.9 in which the rate constant kr is now a function of temperature. We repeat it here for completeness: d 2C - kr (T )CA / De = 0 dx 2
(4.16b)
The two ODEs, which are coupled by the two state variables CA and T, generally have to be solved numerically. The resulting concentration profile CA(x) can then be integrated over the pellet volume Vp as was done in the isothermal case to obtain the nonisothermal effectiveness factor Eni:
Eni =
Ú
L
0
kr (T )CA ( x )dVp kr (T )CAVp
(9.7c)
where kr(T) is given by the familiar Arrhenius relation: kr(T) = A exp(-Ea/Rt)
(9.7d)
367
Simultaneous Heat and Mass Transfer
Here the reference state is taken to be the surface concentration CAS and the surface temperature Ts, i.e., the conditions that would prevail within the pellet in the absence of transport resistances. A typical, unscaled plot of Eni vs. the nonisothermal Thiele modulus is shown in Figure 9.8. Two additional parameters that contain the thermal factors make their appearance here: the Arrhenius number Ea/RTs, which contains the important activation energy Ea; and the dimensionless parameter b, which reflects the effect due to the heat of reaction and the transport resistances. For b = 0, i.e., for a vanishing heat of reaction or infinite thermal conductivity, the effectiveness factor reduces to that of the isothermal case. b > 0 denotes an exothermic reaction and here the rise in temperature in the interior of the pellet is seen to have a significant impact on Eni which may rise above unity and reach values as high as 100. This means that the overall reaction rate in the pellet is as much as 100 times faster than would be the case at the prevailing surface conditions. This is due to the strong exponential dependence of reaction rate on temperature, as expressed by the Arrhenius relation (Equation 9.7d). As expected, the effect varies directly with the heat generated (DHr) and inversely with the rate of heat removal. Thus, exothermicity, far from being undesirable, actually has a beneficial effect on catalytic conversion. We must guard, however, against an excessive rise in temperature, which might adversely affect catalyst structure, causing a decline or
M
H
Effectiveness Factor Eni
T T' L
b > 0 Exothermic
b = 0 Isothermal b < 0 Endothermic
Thiele Modulus [kr(T)L2/De]1/2 FIGURE 9.8 Nonisothermal effectiveness factor and its jump transitions (constant Arrhenius number).
368
Mass Transfer: Principles and Applications
even cessation of catalytic activity. The problem of estimating the maximum temperature that may occur in a catalyst pellet is addressed in Practice Problem 9.4. For endothermic reactions, b < 0 applies; DHr is now a positive number. The effectiveness factor is now below the value seen in the isothermal case, due once again to the dependence of kr on temperature. The effect is shown in the plots of Figure 9.8. An additional point needs to be noted in connection with the inflections shown by some of the effectiveness curves. It is seen that in this region of inflections E becomes a multivalued function of the Thiele modulus. The question then arises which of the three values actually materializes in practice. A mathematical analysis of such systems, which goes beyond the scope of this book, shows that of the three states, only the upper and lower ones are stable, and that a jump transition occurs from one to the other as one passes through this region. This transition occurs at different locations, depending on the direction from which the region is approached. Suppose, for example, that the Thiele modulus is gradually diminished, by reducing surface temperature Ts. Effectiveness then undergoes a gradual increase, reaches a maximum value M shown in Figure 9.8, and then begins a decline until the tangent point T is reached. Here the effectiveness factor experiences a sudden jump decrease to the lower value L, after which it continues a smooth decline with diminishing modulus value toward the limiting value of unity. A similar jump transition occurs when one approaches from the opposite direction, but this time it is a jump increase, and it occurs at a different location, from the tangent point T¢ to the location H. This phenomenon of obtaining different ordinate values, depending on the direction in which a curve is traversed, is referred to as a hysteresis effect, and the surface temperatures Ts at which the jump transition occurs are known as the ignition and extinction temperatures. In other words, when these temperatures are reached, the reaction rate either undergoes a sudden increase (ignition, point T¢) or it experiences a sudden drop (extinction, point T). These interesting features can be used to control the course of a particular catalytic reaction. Comments: Although the system we have considered here is a relatively simple one involving a first-order reaction, it has revealed the existence of some fascinating and exotic phenomena. Such phenomena are not limited to catalytic reactions but arise in other nonisothermal systems, for example, in continuous-flow stirred tank reactors, and even in isothermal systems. Their common feature is that the performance curve describing the system has to exhibit an inflection. Such inflections have also been observed in a biological context, where they play the role of a biological switch, which is activated in response to particular stimuli.
Simultaneous Heat and Mass Transfer
369
Illustration 9.4: Design of a Gas Scrubber: The Adiabatic Case In Illustration 8.1 and Illustration 8.2, we gave a detailed account of the characteristics and performance of a gas scrubber. The tacit assumption was made that the operation was isothermal and that the entire equilibrium curve applied to a single temperature, that of the incoming feed and solvent. Above concentrations of a few mole percent, heat effects make themselves increasingly felt and a corresponding shift in the equilibrium curve to lower gas solubilities takes place. In principle, the temperature rises in both phases, but due to the low volumetric heat capacities of the gas, temperature equilibration is rapid and the enthalpy change lies preponderantly in the liquid phase. This has led to the concept of an adiabatic equilibrium curve, which is constructed by using the predicted temperature rise in the liquid to calculate the local gas solubilities as a function of the solute concentration in the gas phase. The relevant equations for the construction of the adiabatic operating diagram, Figure 9.9a, are as follows: • The solute mass balance and the resulting operating line are unaffected by the heat effects and remain unchanged. We have, as before in the isothermal case, (Y1 – Y2)Gs = (X1 – X2)Ls
(9.8a)
• To calculate the temperature rise, we draw on an integral enthalpy balance over both phases (Figure 9.9b). Choosing as a reference state the temperature of the incoming solvent and setting Href = HL2 = 0, we obtain HL (kJ/kg solution) ¥ L (kg solution/s) = Gs (kg carrier/s)DHsol’n (kJ/kg solute) ¥ (Y – Y2)
(9.8b)
where the enthalpy of the liquid HL is given by the auxiliary relation HL = CL(kJ/kg K) ¥ (TL – TL2) – DHsol’n
(9.8c)
• Combining these equations, we obtain for the local temperature rise TL - TL,2 =
DHsol'n Gs X DHsol'n (Y - Y2 ) + Ls 1 + X CL CL
(9.8d)
where the factor X/(1 + X) is used to convert total liquid flow rate L to solvent flow rate Ls. To construct the adiabatic equilibrium curve, one chooses a pair of values (X, Y) on the operating line, calculates TL from Equation 9.8d, and with the
370
Mass Transfer: Principles and Applications
a. Operating Diagram Y Y1 Op
Y2
at er
ing
Lin
T'''
e
/G S LS e p tic o Sl diba rium A lib ui e Eq Curv T'
X2
X1
T''
X
b. Enthalpy Balance X2 Y2 T2 T2 HL2 HG2
T'
T'
T''
T''
T'''
T'''
X1 Y1 T1 T1 HL1 HG1
FIGURE 9.9 Adiabatic gas scrubber.
values (Y1, TL) in hand, establishes X from available equilibrium isotherms. X, Y* values obtained in this fashion determine a point on the adiabatic equilibrium curve. The remainder of the calculations proceed as in the isothermal case, i.e., the adiabatic operating diagram (Figure 9.9a) is used to compute NTU, which is then multiplied by HTU to obtain the design height Z = HTU ¥ NTU. Comments: Note the simplification that results from confining the heat effects to the liquid phase and assuming thermal equilibrium between the two phases.
Simultaneous Heat and Mass Transfer
371
Had this not been done, an additional enthalpy balance for the gas phase would have been required, and the concept of the adiabatic equilibrium curve would have been jeopardized. Once the temperature rise has been accounted for and used in the construction of the adiabatic equilibrium curve, the entire procedure reverts to the familiar territory of the isothermal case. The comfort and value of familiarity is not to be underestimated.
Practice Problems 9.1. Meteorology a. Using the humidity charts, and given a daytime temperature and relative humidity, indicate how you would proceed in order to predict whether dew will form. b. Again using the psychrometric charts, and assuming a strong wind to be blowing, indicate under what conditions frost may form, even though the temperature remains above 0r C. What is the maximum temperature that will allow this to happen? 9.2. Air Supply to a Dryer An air dryer requires 1 kg/min (dry base) of air at 80r C and RH = 20%. The available air is at 25r C and RH = 50%, and is to be brought to the desired conditions by direct injection of steam. What is the minimum rate at which steam must be supplied, given that its latent heat is 2450 kJ/kg? Answer: 0.08 kg/min 9.3. Design of a Cooling Tower Water is to be cooled from 43.3 to 29.7r C in a packed column using air entering countercurrently at 29.5r C and a wet-bulb temperature of 23.3r C. The water flow rate is 2.71 kg/m2 s and airflow is to be set at 1.5 times the minimum value. The overall mass transfer coefficient for the column is estimated at KYa = 0.90 kg/m3 s DY. Calculate the height of the tower. Answer: 6.6 m 9.4. Maximum Temperature in a Catalyst Pellet Derive an expression for the maximum possible temperature in a catalyst pellet. (Hint: Eliminate the reaction term by dividing mass and energy balances.)
Selected References
General Mass Transfer Texts The earliest major text on mass transfer process is: R.E. Treybal. Mass Transfer Operations. McGraw-Hill, New York, 1952. See also 3rd edition, 1979. More recent texts on mass transfer, often presented in combination with heat transfer, include the following: F.M. White. Heat and Mass Transfer. Addison-Wesley, Reading, MA, 1988. S. Middleman. Introduction to Mass and Heat Transfer. John Wiley, New York, 1997. E.L. Cussler. Diffusion: Mass Transfer in Fluid Systems. 2nd ed., Cambridge University Press, New York, 1997. H.D. Baehr. Heat and Mass Transfer (translated from the German). Springer, New York, 1998. A.F. Mills. Basic Heat and Mass Transfer. 2nd ed., Prentice Hall, Englewood Cliffs, NJ, 1999. Separation processes, which make extensive use of mass transfer concepts, are well presented in the recent text: J.D. Seader and E.J. Henley. Separation Process Principles. John Wiley, New York, 2000.
373
374
Mass Transfer: Principles and Applications
Transport Phenomena The classical text by Bird, Stewart, and Lightfoot (1960) has recently been updated: R.B. Bird, W.R. Stewart and E.N. Lightfoot. Transport Phenomena. 2nd ed., John Wiley, New York, 2000. Transport theory applied to biomedical and materials engineering is discussed in: D.R. Poirier and G.H. Geiger. Transport Phenomena in Materials Processing. Minerals, Metals and Materials Society, Warrendale, PA, 1994. R.L. Fournier. Transport Phenomena in Biomedical Engineering. Taylor & Francis, London, 1999.
Diffusion Authoritative compilations of solutions to Fick’s and Fourier’s equations can be found in the classical monographs: H.S. Carslaw and J.C. Jaeger. Conduction of Heat in Solids. Oxford University Press, Oxford, U.K., 1959. J. Crank. Mathematics of Diffusion. 2nd ed., Oxford University Press, Oxford, U.K., 1978. They include solutions of source problems. Diffusivities, permeabilities and solubilities in polymers are compiled in: J. Brandrup, E.H. Immergut, and E.A. Grulke, Eds. Polymer Handbook, 4th ed., John Wiley, New York, 1999. See also: J. Crank and G.S. Park, Eds. Diffusion in Polymers. Academic Press, New York, 1968.
Selected References
375
Tables of diffusivities in various solids and liquids, including metals, molten salts and semiconductors appears in Poirier and Geiger cited above. Similar information on diffusion in porous catalysts can be found in: C.N. Satterfield. Mass Transfer in Heterogeneous Catalysts. MIT Press, Cambridge, MA, 1970.
Diffusion and Reaction The twin topics of diffusion and reaction are taken up in most texts on reactor engineering, including: R.W. Missen, C.A. Mims, and B.A. Saville. Introduction to Chemical Reaction Engineering and Kinetics. John Wiley, New York, 1999. O. Levenspiel. Chemical Reactor Engineering. John Wiley, New York, 1999.
Phase Equilibrium There is a plethora of handbooks and other compilations of phase equilibrium of relevance to mass transfer operations. For gas, liquid and solid solubilities in water it is best to draw on environmental source books, among which the monumental treatise by Mackay et al. stands out: D. Mackay, W.-Y. Shiu, and K.C. Ma. Illustrated Handbook of PhysicoChemical Properties and Environmental Fate for Organic Chemicals. Vols. 1 to 5, Lewis Publishers, Boca Raton, FL, 1991−1997. The treatise also reports vapor pressures and bioconcentration factors of the cited substances. For vapor−liquid and liquid−liquid equilibria, the reader is referred to the equally monumental compilations: D. Behrens and R. Eckermann, Eds. Vapor−Liquid Equilibrium Collection (25 volumes). Liquid−Liquid Equilibrium Collection (5 volumes). DECHEMA Chemistry Data Series, DECHEMA, Frankfurt, 1977–1982.
376
Mass Transfer: Principles and Applications
Equilibria of relevance to supercritical fluid extraction can be found in: M. McHugh and V. Krukonis. Supercritical Fluid Extraction. 2nd ed., Butterworth-Heinemann, Oxford, U.K., 1994. Compilations of adsorption equilibria appear in: D.P. Valenzuela and A.L. Myers. Adsorption Equilibria Handbook, Prentice Hall, Englewood Cliffs, NJ, 1989. Equilibria involving metals and systems of metals can be found in: E. Brandes and G.H. Brooks, Eds. Smithell’s Metals Reference Book. 7th ed., Butterworth-Heinemann, Oxford, U.K., 1992.
Separation Processes Equilibrium stage separations with emphasis on distillation and gas absorption, are exhaustively treated in: E.J. Henley and J.D. Seader. Equilibrium Stage Separation Operations in Chemical Engineering. John Wiley, New York, 1981. See also the text on separation processes by the same authors cited above. The reader will find an up-to-date treatment of distillation in: J.G. Stichlmair and J.R. Fair. Distillation: Principles and Practice. Wiley/ VCH, New York, 1998. Treatments of liquid-liquid extraction appear in: R.E. Treybal. Liquid Extraction. 2nd ed., McGraw-Hill, New York, 1963. T.C. Lo, M.H.I. Baird, and C. Hanson, Eds. Handbook of Solvent Extraction. John Wiley, New York, 1983. and in: J. Thornton. Science and Practice of Liquid−Liquid Extraction, Vol. 1 and 2. Oxford University Press, Oxford, U.K., 1992.
Selected References
377
The definitive and up-to-date monographs on membrane separation are: T. Matsuura. Synthetic Membranes and Membrane Separation Processes. CRC Press, Boca Raton, FL, 1994. R.W. Baker. Membrane Technology and Applications. McGraw-Hill, New York, 2000. Fundamentals of adsorption, separation, and purification are discussed in a slim volume by the author: D. Basmadjian. The Little Adsorption Book. CRC Press, Boca Raton, FL, 1996.
Other The illustration and practice problems in Chapter 3, which deal with transport in plants, used the following as a source: P.S. Nobel. Biophysical Plant Physiology and Ecology. W.H. Freeman, San Francisco, 1987. See also by the same author: P.S. Nobel. Physicochemical and Environmental Plant Physiology. Academic Press, New York, 1999.
Appendix A1 The D-Operator Method
The basis of the D-operator method consists of replacing the operational part of a derivative, i.e., d/dx, by the operator symbol D, and treating that symbol as an algebraic entity. Thus, the second derivative is written in the form d Ê dˆ 2 Á ˜ + (D)(D) = D dx Ë dx ¯
(A.1)
d Ê dy ˆ 2 Á ˜ =D y dx Ë dx ¯
(A.2)
and in its full form
where D2y is considered to be the algebraic product of D2 and y. It follows that the quantity y can be separated from D2y by factoring it out, just as one would an algebraic quantity. Thus, the ODE d2y -y=0 dx 2
(A.3)
can be written in the equivalent form (D2 – 1)y = 0
(A.4)
D2 – 1 = 0
(A.5)
from which it follows that
with the solutions D1 = 1
D2 = 1
(A.6)
379
380
Mass Transfer: Principles and Applications
Equation A.5 is termed the characteristic equation of the ODE (Equation A.3) and its solution (Equation A.6) is referred to as the characteristic roots of the ODE. Consider now the general second-order ODE ayt + by¢ + cy = 0
(A.7)
Then it can be shown that its solution takes the form y = C1 exp(D1x) + C2 exp(D2x)
(A.8)
where D1 and D2 are the characteristic roots of the ODE, i.e., the solutions of the characteristic equation aD2 + bD + c = 0
(A.9)
When the roots are complex, the exponential terms in Equation A.8 are converted to a trigonometric form using Euler’s formula: eix = cox x + i sin x
(A.10)
We note in addition that the exponential terms can also be expressed in equivalent hyperbolic form and that, when the roots are identical, one of the two solutions is premultiplied by x. This follows from the appropriate theory. Table A.1 summarizes the results.
Appendix A2 Hyperbolic Functions and ODEs
TABLE A.1 Short Table of Hyperbolic Functions
sinh x =
e x - e-x 2
tanh x =
sinh x cosh x
cosh x =
e x + e-x 2
coth x =
cosh x sinh x
TABLE A.2 Solutions of the Second-Order ODE aytt ± by¢¢ ± cy = 0 Characteristic Roots 1. Distinct and real
2. Identical and real 3. Imaginary D1,2 = ±bi 4. Complex conjugate D1,2 = a ± bi
Solutions y = C1e
D1 x
+ C2 e
D2 x
or y = C1 sinh D1x + C2 cosh D2x y = C1eDx + C2xeDx y = C1 cos bx + C2 sin bx y = eax(C1 cos bx + C2 sin bx)
381
Subject Index
A
B
Absorption, see Gas–liquid absorption Activity coefficients, 229 calculation, from solubilities, 236 prediction, by UNIQUAC equation, 230 variation with concentration, 229 Additivity of resistances in carbon dioxide uptake by leaf, 119 in diffusion through composite cylinders, 9 in heat transfer, 26 in mass transfer, 26, 35 two-film theory and, 26, 27 Adsorption (see also Percolation processes) batch, of trace substance, 154 countercurrent cascade for, 265 crosscurrent cascade for, 257 desorption from bed in, 298 efficiency in single stage, 301 Freundlich isotherm for, 241, 306 Henry’s constants for, 204 Langmuir isotherm for, 201 minimum adsorbent inventory in, 260 minimum bed size in, 207 moisture isotherms in, 205 of vinyl chloride monomer, 363 single-stage, 247, 248, 306 Toth isotherm for, 241 Agitated vessels dissolution time in, 179, 187 efficiency of, 301, 302 mass transfer correlations for, 178 Air–water system enthalpy of, 355 humidity charts for, 353, 354 in drying operations, 361, 371 in water cooling, 357 Antoine equation, 193 table of constants for, 194 Artificial kidney, see Hemodialyzer Azeotropes, 231 diagrams for, 233 table of, 234
Batch distillation at constant overhead composition, 291 at constant reflux, 294 differential, 251 Rayleigh equation for, 252 recovery in, 293, 296, 310 separation factors from, 254 total boil-up in, 311 Bioconcentration factor (BCF), 182, 183, 187 Biology, Biomedical engineering, and Biotechnology bioconcentration, 182 blood coagulation, 37 controlled-release devices, 35, 90 diffusion in living cell, 128 diffusivities of biological substances in water, 97 drug administration, 86 effective therapeutic concentration (ETC), 35, 87 hemodialysis, 330, 332, 333, 334, 338, 346, 347 mass transfer in blood, 23, 185, 334 mass transfer in kidney, 185 mass transfer in leaf, 112, 119 nicotine patch, model for, 153 partition coefficients, 57, 220 pharmacokinetics, 85 protein concentration by ultrafiltration, 308 toxin uptake and elimination in animals, 180 vascular grafts, 23, 37 Blood and blood flow anticoagulant release into, 186 coagulation trigger in, 37 critical vessel diameter in, 185 determination by dye dilution, method of, 88 hemodialysis of, 330, 332, 333, 334, 338 isotonic solution for, 346 mass transfer between tissue and, 57
383
384
Mass Transfer: Principles and Applications
mass transfer coefficients in, 23 mass transfer regimes in, 185 osmotic pressure of, 229 Boundary and initial conditions for differential equations, 6, 69, 72, 75, 144, 151 Breathing losses in storage tank, 193 Buckingham p theorem, 166, 168
supercritical fluid extraction, 324 water cooling, 357 Controlled-release drug delivery, 35, 90, 186 Cooling tower design equation for, 361 operating diagram for, 359
C
D’Arcy’s law, 2 Dialysis, 330, 331 Diffusion and Fick’s law, 2 and reaction, in liquids, 140, 143, 150, 155 and reaction, in solids, 88, 89, 140, 144 equimolar counter, 18 from sources, 123 from spherical cavity, 8, 10 from well-stirred solution, 89, 138 in animal tissue, 139 in catalysts, 115, 141, 145 in cylinder, 136 in gases, 91, 117 in gas–solid reactions, 142 in hollow cylinder, 8 in leaves, 112, 119 in liquids, 95 in metals, 102 in plane sheet or slab, 67, 136 in polymers, 102 in porous media, 110, 115, 145 in semi-infinite medium, 83, 124, 125, 133, 135 in solids, 101 in sphere, 35 mechanisms of, 92, 95, 101, 102, 111 of dopant in silicon chip, 117 of solids in solids, 116, 120 steady-state multidimensional, 81 through stagnant film, 18, 34 transient, 121, 133 Diffusivities effective, in porous media, 110, 115, 302 equations for, 93, 96 in air, 92 in liquids, 95, 217 in metals, 96 in molten salts, 96 in polymers, 105, 118 in solids, 106, 116 in supercritical fluids, 217 in water, 97, 118 Knudsen, 111, 118 Dimensional analysis, 166
Carbon dioxide absorption in packed tower, 176 and global warming, 129 caffeine equilibrium in supercritical, 219 compensation of emissions by plant life, 120 emission from car, 120 in carbonation of soft drink, 197 in supercritical extraction of caffeine, 218 net global emissions of, 129 removal from natural gas of, 347 uptake by leaves, 119 Casting of alloys microsegregation in, 73 modeling of, 75 Rayleigh’s equation in, 78 Catalyst pellet design of, 143 diffusivity in, 115 effectiveness factor for, 147, 365 Raschig Ring form of, 154 reaction and diffusion in, 7, 143 temperature effect on performance of, 154, 365, 371 Coffee decaffeination, 218, 324 Compartments, 40, 241 in animals and humans, 51, 85, 187 in environment, 220 Concentration polarization Brian’s equation for, 335 in alloy casting, 73 in electrorefining, 98 in membrane separation, 332 in reverse osmosis, 335 Conduction of heat, 2, 3 Conservation laws continuity equation, 80, 89 generalized vectorial of mass, 79 Continuous-contact operations distillation, 322 gas absorption, 53, 314 liquid extraction, 322, 345 membrane processes, 326 minimum solvent requirement in, 317
D
385
Subject Index Dimensionless groups for mass and heat transfer, 159 Dissolution of solids, 179, 187 Distillation at total reflux, 322 batch (differential), 62, 251 batch-column, 290 construction of trays for, 266 continuous fractional, 273 effect of feed and reflux on, 310 Fenske equation for, 289 effect of open stream, 310 isotope, 288, 345 McCabe–Thiele diagrams for, 276, 278, 280, 285, 292 minimum number of trays for, 282, 284 minimum reflux for, 282, 284, 286 O’Connell’s correlation for tray efficiencies, 300 packed-column, 322 packing for, 174 recovery in, 288, 292, 293, 296, 310 steam, 242 Distribution coefficients in liquid–liquid equilibria, 213 D-operator method, 379 Driving force linear, 3, 5, 34 overall, 27 Drying air supply for, 262, 371 freeze, 155 of carbon bed, 362 of plastic sheets, 172 periods, 362 time of, 88, 362 with air blower, 31
E Effective therapeutic concentration (ETC), 35, 87 Effectiveness factors for catalyst particles, 115, 141 derivation, 147 plot as function of Thiele modulus, 147 use in design of catalysts, 147 Electrorefining of copper model, 100 size of plant, 118 Emissions concentration histories and profiles, 127 continuous, 124 effect of wind on, 131 from chimney, 153
from embedded sources, 10, 83, 84, 90 from plane source, 124 from point source, 123, 128 from solvent spill, 153 from storage tank, 196 instantaneous, 124, 128 into infinite medium, 123, 126 into semi-infinite medium, 125, 128 net global carbon dioxide, 129 table of solutions for concentrations of, 124 Enhancement factor in gas–liquid mass transfer with reaction, 152, 156 Environmental topics (see also Emissions) adsorption of pollutants in carbon bed, 205, 311, 362 attenuation of mercury pollution of water basin, 254 bioconcentration factors for toxins, 183 carbon dioxide uptake by plant life, 119 clearance of river bed and soils, 87, 299 DDT uptake by fish, 222 discharge of plant effluent into river, 200 evaporation of pollutant from mist over Niagara Falls, 311 evaporation of pollutant from water basin, 42, 242, 254 global warming, 112, 120, 129 Henry’s constants for adsorption of pollutants onto soil, 209 mass transfer between oceans and atmosphere, 36 mass transfer in leaf, 112 octanol–water partition coefficient, 221 partitioning, 220, 225 pollutant release from buried dumps, 83, 84 pollutant release from groundwater onto soils, 208 reaeration of river, 47 uptake and clearance of toxins in animals, 180 Error function table of numerical values of, 126 table of properties of, 126 ETC, see Effective therapeutic concentration Eutectic, 89
F Fenske equation, 289 Fermi problems, 31, 33, 117 Fick’s equation, 67, 121, 131 Fick’s law, 2 Film theory, 14, 24
Film thickness effective, 14, 35 estimation of, 22 in entry region, 162, 164 Fish bioconcentration in, 183 uptake of toxin by, 183, 221 water intake by, 239 Fourier’s law, 2 Freeze-drying of food, 155
G Gas–liquid absorption, Gas scrubbing adiabatic, 369 countercurrent, continuous contact, 314 countercurrent, staged, 265 countercurrent, with linear equilibrium, 270, 309 design of packed columns for, 317 diameter for packed column, 187 Henry’s constants for, 197 HETP for, 176 Kremser equation for staged and linear equilibrium, 270 mass balances in, 53 mass transfer coefficients for packings used in, 175 minimum solvent requirements in, 267, 317 NTUs for linear equilibrium, 320, 321 O’Connell’s correlation for plate efficiencies in, 300 operating diagram for countercurrent, 267, 317, 321 optimum packing size for, 345 optimum solvent flow rate for, 319 trays for, 266 use of reactive solvent in, 151 Gas–solid reactions and diffusion, 142 Glueckauf equation, 302 Gradient-driven processes, 2, 33 Graetz problem for mass transfer, 70, 81
H Hatta number, 152 Heat exchangers, 88, 338 Heat transfer additivity of resistances in, 26 analogy to mass transfer, 14, 28, 159, 338 convective, 3, 16, 26, 159 Helium, underground storage of, 10, 84 Hemodialyzer, 330, 332 analogy to external heat exchange, 341
calculation of performance, 338, 346, 347 mass transfer coefficient for, 341 Henry’s constants for absorption equilibria, 197 for adsorption from water onto soil, 209 for gas–water equilibria, 197 in Langmuir isotherm, 203 Henry’s law, 196 HETP (height equivalent to a theoretical plate), 176, 290 estimation of, 176 HETS (height equivalent to a theoretical stage) in coffee decaffeination, 325 HTU (height of a transfer unit), 316, 345, 361 Humidity absolute, 353, 356 and humid heat, 355 and humid volume, 355, 357 charts, 353, 354 relative, 354
I Ice, evaporation of, 155 Ideal solutions, 226 Raoult’s law for, 226 table of separation factors for, 235 Intalox Saddles, 174, 175 Ion-exchange (see also Percolation processes) Efficiency of column, for linear equilibrium, 305 equilibrium isotherm for, 241 minimum bed size for, 311 structure of resins for, 239 Isotonic solution, 346 Isotopes CH4–CH3D, 236 C12O–C13O, 288 distillation of, 288, 345 H2O–HDO, 235, 241 separation factors for, 235 use of Fenske equation in distillation of, 288
K Kremser or Kremser–Souders–Brown equation, 269, 272
L Laminar boundary layer, 13 Laminar flow
Subject Index entry (Lévêque) region for mass transfer in, 162, 185 fully developed region for mass transfer in, 162, 185 mass transfer coefficients for, 162, 164 release of a substance into, 70, 80 Langmuir isotherm, 201 Laplace’s equation, 81 Leaching countercurrent staged, 270 Kremser equation for stage calculations in, 272 of oil-bearing seeds, 140, 307 of ore, 154 phase diagram for staged, 308 Lewis relation, 353 Linear driving force, 3, 16 Linear phase equilibria countercurrent cascades of systems with, 267, 309 gas scrubbing in systems with, 272 Kremser equation for staged operations with, 270 minimum solvent or adsorbent inventory for crosscurrent cascades with, 260 NTUs for systems with, 320, 321 Liquid–liquid extraction calculations in triangular diagram for, 213, 249, 263 continuous contact with linear equilibrium, 345 countercurrent cascade for, 270, 309 crosscurrent cascade for, 261, 263 distribution coefficients for, 213 efficiency in, 301 Kremser equation, use in, 270 minimum solvent inventory in, 260 operating diagrams for, 249, 263 phase equilibria, for, 210, 212, 213, 241 single-stage, 249 Log-mean differences, 9, 17, 34 Loop of Henle, 185
M Mass balances classification of, 49, 51 cumulative, 51, 62, 76, 135, 293, 295 differential, 50 integral, 50, 53 setting up of, 39, 53 steady-state, 41, 53 unsteady, 41, 50, 53 unsteady differential, 51, 67
387 Mass transfer analogies with heat transfer, 14, 28, 73, 185, 340, 341 by diffusion, see Diffusion convective, 15, 70, 87 driving force for, 15 film theory for, 15 rate laws for, 2, 3 resistance to, 3 simultaneous with heat transfer, 349 Mass transfer coefficients conversion of, 17, 21 definitions of, 17 estimation of, 22, 31 film, 15 for adsorption, 302 for column packings, 175 in agitated vessels, 177 in blood flow, 23, 185, 334 in kidney, 185 in laminar flow around simple geometries, 163 in laminar tubular flow, 162, 164 in membrane processes, 35, 334 in toxin uptake and clearance in animals, 183 in turbulent flow around simple geometries, 171, 172 in turbulent tubular flow, 171 overall, 25 units of, 16, 21 volumetric, 48, 55, 177, 181 Materials science topics binary liquid–solid equilibria, 74, 78, 89 casting of alloys, microsegregation in, 73 diffusion in metals and molten salts, 96, 106, 116, 120 diffusion in polymers, 102, 105, 118 doping of silicon chips, 117, 154 eutectic, 89 gas–solid reaction with diffusion, 142 membranes, separation by, 326 membranes, structure of, 327 Sievert’s law, 106 transformer steel, manufacture of, 138 McCabe–Thiele diagram in batch fractionation, 292 in continuous fractionation, 285 location of feed plate in, 286 minimum number of plates from, 284 minimum reflux ratio from, 284 q-line in, 283 Membranes asymmetric, 327 hollow-fiber, 328
388 Loeb–Sourirajan, 326 permeabilities in, 334 spiral-wound, 328, 329 structure of, 327 Membrane gas separation, 330 nitrogen production by, 344 pressure ratio, 342 pressure ratio limited, 343 selectivity, 342 selectivity limited, 344 Membrane processes, 326 for removal of CO2 from natural gas, 347 hollow-fiber dimensions for, 333 mass transfer coefficients for, 334 table of, 328 Models, information from, 64 Moisture adsorption isotherms, 205 Momentum transport, 5 Moving boundary problems and freeze-drying of food, 155 and reacting particle, 142 shrinking core model for, 148
N Newton’s viscosity law, 2, 5 NTU (number of transfer units), 316, 345, 361 plot for calculation of, 321
O O’Connell’s correlations for tray efficiencies, 300 Ohm’s law, 3, 12 Operating diagrams for continuous contact operations, 317, 345 for countercurrent cascades, 267 for crosscurrent cascades, 260, 263 for fractionation (McCabe–Thiele), 276, 278, 280, 286, 292 for percolation processes, 298 for single-stage operations, 247, 250 for supercritical extraction, 324 Osmosis, 331 equation for, 3 Osmotic pressures, table of, 330
P Packaging materials, design of, 108, 118, 120 Packings for packed-column operations, 174 Pall Rings, 174, 175, 176 Partial differential equations how to avoid, 57, 60, 73, 142, 155, 336, 340
Mass Transfer: Principles and Applications setting up of, 66 vectorial form of, 79 Partitioning blood-tissue, 57 in biology and environment, 220, 241, 255 octanol–water partition as measure of, 221 Peclet number, 159, 170, 336, 338, 345 Percolation processes, 296 as staged operation, 296 bed size for, actual, 305 bed size for, minimum, 207, 305, 311 efficiency of, 305 in adsorption from groundwater onto soil, 298 in clearance of soils and river beds, 298 parameters for design and analysis of, 303 Permeability, 61, 103, 334 Phase diagrams for binary liquid–solid systems, 74 for binary vapor–liquid systems, 225, 228, 233 for liquid–liquid systems, 209, 241 for pure substances, 191 in triangular coordinates, 212 lever rule in, 213, 226 Pharmacokinetics, 85 Phase equilibria binary liquid–solid, 74, 78 binary vapor–liquid, 224 fluid–solid, 201 gas–liquid, 196 Henry’s constants for, 196, 197, 209, 230 in supercritical CO2, 217, 219, 324 liquid–liquid, 209, 241 of water vapor on adsorbents, 201 Phase rule, 222 Photosynthesis, 119 Poiseuille equation, 2 Pollutants adsorption onto soils, 208 clearance from river beds and soils, 299 emissions from sources, equations for, 124 evaporation from water basins, 42, 237, 254 removal by adsorption in carbon beds, 205, 311, 362 solubilities in water of, 199 Psychrometric charts, 353, 354 Psychrometric ratio, 352
Q Quasi-steady-state assumption, 57, 60, 142, 155, 340
389
Subject Index
R Raoult’s law, 226 Raschig Rings, 154, 174 Rate laws, tables of, 2, 3 Rayleigh equation determination of separation factor from, 254 in batch distillation, 252 in casting of alloys, 78 in environment, 254 in ultrafiltration, 308 Reactive solvent, selection of, 151 Reflux ratio, 278 Relative volatility, see Separation factors Reverse osmosis (RO) concentration polarization in, 335 effect of pressure in, 346 effect of salinity in, 346 flux Peclet number for, 336, 338 hollow-fiber modules, 329 mass transfer coefficients for, 334 production rates of water by, 338 simple design equation for, 336
S Schmidt number, 158 Sea water desalination of, 328, 336 osmotic pressure of, 230 sea salt from, 239 Separation factors (relative volatility), 232 effect of total pressure on, 236 for ideal solution, 235, 241 for liquid–solid systems, 79 table of, 235 Shape factors in 3-D diffusion, 83, 84 Shear rate, 185 Shear stress, 5 Sherwood number, 158, 159, 171, 178, 347 Sievert’s law, 106 Silicon diffusivity in solids, 116 doping of chips, 117, 154 use in manufacture of transformer steel, 138 Solubilities of liquids and solids in water, table of, 199 Solubility of gases in water, table of, 197 Solution mining, 186 Stage efficiencies, 299 in adsorption, 301 in distillation, 301 in gas–liquid absorption, 300
in liquid–liquid extraction, 301 in percolation processes, 304 Staged operations, 243 co-current, 244 countercurrent, 244, 264 crosscurrent, 244, 257, 263 differential, 251 efficiencies of, 244 single-stage, 245, 249 with linear equilibria, 260 Stanton number, 158, 170 Supercritical fluid (SCF), 215 caffeine extraction with, 219, 324 carbon dioxide as, 217 diffusivities in, 217 equilibrium relation, for caffeine extraction with, 219, 241 region of existence, 216 solubility of naphthalene in, 217 Supercritical fluid extraction (SCE), 192, 210, 215 applications, 216 decaffeination by, 219, 324 operating diagram for, 324 plant, at Houston, Texas, 218 size of extraction vessel, 218
T Temperature adiabatic saturation, 352, 356 critical, 191 dew-point, 355, 356 dry-bulb, 350 effect on catalyst effectiveness factor, 365 effect on gas absorption, 368 maximum in catalyst pellet, 371 wet-bulb, 350, 356 Thiele modulus, 146 Triangular diagram, 209, 212 Turbulent flow mass transfer coefficients in, 171, 172 Two-film theory, 24
U Ultrafiltration, 332, 334 protein concentration by, 308
V van’t Hoff equation, 336 Vector operators in formulation of conservation laws, 79 table of, 82
390
Mass Transfer: Principles and Applications
W
Z
Washing of granular solids, 309 Water purification by activated carbon, 205, 311 by ion-exchange, 240, 311 by reverse osmosis, 331, 334, 336
Zero gradients, 6