JSPS/NUS Joint Seminar on Analytical Chemistry : proceedings ; Singapore, 21 - 23 March 1988 9789814434508 9814434507
The JSPS/NUS Seminar on Analytical Chemistry is part of an ongoing exchange programme to promote direct contact between
197 91 11MB
English Pages 349 [368] Year 1990
Amperometric sensors based on biocatalyst electrodes / Mitsugi Senda, Tokuji Ikeda and Toshiyuki Osakai --
Retention prediction of substituted phenols in reversed-phase HPLC / S.F.Y. Li and H.K. Lee --
Ultratrace metal analysis in sea water by inductively coupled plasma atomic emission spectrometry / Hiroki Haraguchi and Tasuku Akagi --
Liquid membrane as a separation tool --
a review / M.S. Uddin --
Nondestructive spectrochemical analysis / Yohichi Gohshi --
Analysis of diatomic photoelectron spectra / S.Y. Lee --
Nonionic surfactant in solvent extraction of metal chelates / H. Watanabe [and others] --
The application of infra-red spectroscopy and optical microscopy in the failure analysis of plastics / K.Y. Ng --
Trace iron in wallpaper and other building materials / H.W.K. Ong --
Ion channel sensors / Yoshio Umezawa and Masao Sugawara --
PIXE in analytical chemistry / K.F. Mok and S.M. Tang. Some applications of synergistic extraction to analytical chemistry / Hideo Akaiwa and Hiroshi Kawamoto --
FPLC analysis of fetal calf serum / W.K. Teo [and others] --
Potentiometric detection in flow analysis / N. Ishibashi and T. Imato --
X-ray photoelectron spectroscopy and thermogravimetry of electroconducting polymers / H.S.O. Chan and M.Y.B. Teo --
Some new aspects of ion-selective electrodes in nonaqueous solutions / K. Izutsu and T. Nakamura --
Quantitative determination of organic volatiles of fresh orange fruit juice by headspace capillary gas chromatography / O.L. Lum, M.K. Wong and C.K. Lee --
Mole sensitivity and its periodicity in graphite-furnace atomic-absorption spectrometry / E. Iwamoto and T. Kumamaru --
Cybernetics and analytical chemistry / H. Gunasingham and M.L. Wong --
Thermal decomposition of 1-nitropropane and N-propyl nitrite --
analysis of products by photoelectron spectroscopy / W.S. Chin, C.Y. Mok and H.H. Huang. Catalytic-kinetic methods of analysis for traces of elements / T. Kawashima and S. Nakano --
Deterioration of paint due to alkali in cement / H.W.K. Ong and S.C. Lee --
A new type of photo-excitable ion and enzyme sensors / Tetsuo Osa and Jun-ichi Anzai --
Glass transition temperature determined by dynamic thermal mechanical methods / Wayne W.Y. Lau --
Surface reaction studies by pulsed field desorption mass spectrometry / G.K. Chuah --
Utilization of platinum thin ring electrodes as HPLC detector and in anodic stripping voltammetry / S.B. Khoo and B.T. Tay --
Microfabrication of biosensor / Eiichi Tamiya and Isao Karube --
Fast atom bombardment mass spectrometric studies on the in vivo phosphorylation state of rabbit skeletal muscle glycogen synthase / S.G. Ang.
Recommend Papers
![ESOP '88: 2nd European Symposium on Programming Nancy, France, March 21–24, 1988 Proceedings [1 ed.]
3540190279, 9783540190271](https://ebin.pub/img/200x200/esop-88-2nd-european-symposium-on-programming-nancy-france-march-2124-1988-proceedings-1nbsped-3540190279-9783540190271.jpg)


![TAPSOFT '87: Proceedings of the International' Joint Conference on Theory and Practice of Software Development Pisa, Italy, March 23–27, 1987 [1 ed.]
3540176608, 9783540176602](https://ebin.pub/img/200x200/tapsoft-87-proceedings-of-the-international-joint-conference-on-theory-and-practice-of-software-development-pisa-italy-march-2327-1987-1nbsped-3540176608-9783540176602.jpg)


File loading please wait...
Citation preview
PROCEEDINGS
JSPS/NUS JOINT SEMINAR ON ANALYTICAL CHEMISTRY
This page is intentionally left blank
PROCEEDINGS zyxwvutsrqponmlkjihgfedcbaZY
JSPS/NUS JOINT SEMINAR ON ANALYTICAL CHEMISTRY Singapore
2123 March 1988
EDITOR: S B KHOO Department of Chemistry National University of Singapore
JSPS: JAPAN SOCIETY FOR THE PROMOTION OF SCIENCE NUS: NATIONAL UNIVERSITY OF SINGAPORE zyxwvutsrqponm
\v>
World Scientific zyxwvutsrqponmlkjihgfedcbaZYXW Singapore • New Jersey • London • Hong Kong
Published by zyxwvutsrqponmlkjihgfedcbaZYXWVUTSRQPONMLKJIHGFEDCBA
World Scientific Publishing Co. Pte. Ltd. P O Box 128, Fairer Road, Singapore 9128 zyxwvutsrqponmlkjihgfedcbaZYXWVUTSRQPONMLKJI USA office: 687 Hartwell Street, Teaneck, NJ 07666 UK office: 73 Lynton Mead, Totteridge, London N20 8DH zyxwvutsrqponmlkjihgfedcbaZYXWVU
JSPS/NUS JOINT SEMINAR ON ANALYTICAL CHEMISTRY Copyright © 1990 by World Scientific Publishing Co. Pte. Ltd. All rights reserved. This book, or parts thereof, may not be reproduced in any form or by any means, electronic or mechanical, including photocopying, recording or any information storage and retrieval system now known or to be invented, without written permission from the Publisher. ISBN 981020017X
Printed in Singapore by JBW Printers and Binders Pte. Ltd.
V
JSPS/NUS JOINT SEMINAR ON
ANALYTICAL CHEMISTRY zyxwvutsrqponmlkjihgfedcbaZYXWVUTS 21 23 MARCH 1988 DEPARTMENT OF CHEMISTRY NATIONAL UNIVERSITY OF SINGAPORE ORGANIZED BY
JAPAN
SINGAPORE Organizing Committee:
Dr Yoshio Umezawa
Dr H Gunasingham (Chairman)
Professor of Chemistry
Dr S B Khoo
Hokkaido U n i v e r s i t y
Dr E T Kang
S a p p o r o , J a p a n
Dr P W Chow Dr H K Lee Dr B T T a y ( S e c r e t a r y ) Dr S G Ang ( T r e a s u r e r ) Dr G K Chuah (all from t h e National U n i v e r s i t y of Singapore)
This page is intentionally left blank
\
vii Foreword by Associate Professor Sim Keng Yeow Acting Head, Department of Chemistry National University of Singapore
The holding of the JSPSNUS Seminar on Analytical Chemistry on 2123 March 1988 at the NUS marks another important milestone in the JSPSNUS Scientific Cooperation Programme. This is the second of the ongoing series of chemistry seminars to be jointly organised by Japanese and Singaporean chemists, the first of which on Physical Organic Chemistry was held in Tokyo from 29 August to 1 September 1986. Analytical chemistry has always been the bridge linking the three other traditional areas of chemistry. It is also the field of chemistry which has the largest number of practitioners and the history of the practice of analytical chemistry in Singapore, which precedes educational and research activities in any other field of chemistry, can be traced to as far back as 1885. Since the early 1980s the government, in its efforts to upgrade and restructure economic activities, has encouraged the fostering of a strong R & D culture. With increased support from funding agencies, research activities in analytical chemistry have expanded tremendously during the past decade. It is therefore appropriate and significant that the second seminar of this series, and the first to be held here, should focus on the analytical field. It serves as a timely boost for our analytical chemists from NUS and other organisations to interact and learn from our Japanese counterparts. Such seminars which allow more chemists from our two countries to interact and which could lead to more collaborative work are most welcome and are to be encouraged. The organisers are to be congratulated for having arranged a splendid broad spectrum programme to cater for the interest of most participants. The success of holding a Seminar of this nature is due to many.
VIII
I would like to acknowledge the generous financial support from the JSPS, the LEE Foundation and several instrument companies in Singapore and the hard work put in by all members of the local organising committee as well as Professor Y Umezawa. The publication of the Proceedings of the Seminar is a testimony of their dedication and tireless efforts.
ix CONTENTS zyxwvutsrqponmlkjihgfedcbaZYXWVUTSRQPONMLKJIHGFEDCBA
Monday, 21 March 1988
Amperometric sensors based on biocatalyst electrodes zyxwvutsrqponmlkjihgfedcbaZYXWVUTSR 1 Mitsugi Senda*, Tokuji Ikeda and Toshiyuki Osakai Retention prediction of substituted phenols in reversedphase HPLC S.F.Y. Li*andH.K. Lee Ultratrace metal analysis in sea water by inductively coupled plasma atomic emission spectrometry Hiroki Haraguchi* and Tasuku Akagi
19
35
Liquid membrane as a separation tool — A review M.S. Uddin
49
Nondestructive spectrochemical analysis Yohichi Gohshi
60
Analysis of diatomic photoelectron spectra S.Y.Lee
61
Nonionic surfactant in solvent extraction of metal chelates H. Watanabe*, T. Saitoh, Y. Kimuraand T. Kamidate
70
The application of infrared spectroscopy and optical microscopy in the failure analysis of plastics K.Y.Ng Trace iron in wallpaper and other building materials H.W.K.Ong
79 89
Tuesday, 22 March 1988 Ion channel sensors Yoshio Umezawa*andMasao Sugawara
95
PIXE in analytical chemistry K.F. Mok and S.M. Tang
110
Some applications of synergistic extraction to analytical chemistry Hideo A kaiwa * and Hiroshi Kawamoto
119
X zyxwvutsrqponmlkjihgfedcbaZYXWVUTSRQPONMLKJIHGFEDCBA
FPLC analysis of fetal calf serum W.K. Teo, K.C Loh*, W.K. Neo and G.S. Yap
130
Potentiometric detection in flow analysis N. Ishibashi* and T. Imato
150
Xray photoelectron spectroscopy and thermogravimetry of electroconducting polymers H.S.O. Chan*andM.Y.B. Teo
169
Some new aspects of ionselective electrodes in nonaqueous solutions 184 * and T. Nakamura K. hutsuzyxwvutsrqponmlkjihgfedcbaZYXWVUTSRQPONMLKJIHGFEDCBA Quantitative determination of organic volatiles of fresh orange fruit juice by headspace capillary gas chromatography O.L. Lum *, M.K. Wong and C.K. Lee
199
Mole sensitivity and its periodicity in graphitefurnace atomic absorption spectrometry E. Iwamoto*and T. Kumamaru
209
Cybernetics and analytical chemistry H. Gunasingham*andM.L. Wong Thermal decomposition of 1nitropropane and Npropyl nitrite — analysis of products by photoelectron spectroscopy W.S. Chin *, C Y. Mok and H.H. Huang Catalytickinetic methods of analysis for traces of elements T. Kawashima* and S. Nakano
215
219 234
Wednesday, 23 March 1988 Deterioration of paint due to alkali in cement H.W.K. Ong*andS.C Lee
255
A new type of photoexcitable ion and enzyme sensors Tetsuo Osa* and Jun-ichi Anzai
268
Glass transition temperature determined by dynamic thermal mechanical methods Wayne W.Y. Lou
275
zyxwvutsrqpo
XI
Surface reaction studies by pulsed field desorption mass spectrometry G.K. Chuah
284
Utilization of platinum thin ring electrodes as HPLC detector and in anodic stripping voltammetry S.B. Khoo*andB.T. Tay
298
Microfabrication of biosensor Eiichi Tamiya and Isao Karube Fast atom bombardment mass spectrometric studies on the in vivo phosphorylation state of rabbit skeletal muscle glycogen synthase S.G. Ang
318
328
This page is intentionally left blank
xiii zyxwvutsrqp
Introductory Remarks by Yoshio Umezawa Professor of Chemistry Hokkaido University, Sapporo, Japan
The present proceedings are the concrete output of the JapanSingapore bilateral seminar on Analytical Chemistry which was held on March 21 through 23, 1988 at the National University of Singapore (NUS). At this occasion, I would like to express our deep gratitude to the Japan Society for the Promotion of Science for the generous financial support for this seminar and for the expense of the publication of this proceedings. The planning of this seminar was initiated by Prof. Ang Kok Peng of the National University of Singapore and Prof Michinori Oki of the University of Tokyo. The discussion was continued until they reached the conclusion that the location is in Singapore, and the topic is on analytical chemistry. At that stage, Prof. Oki, the University of Tokyo, asked me to organize the seminar from the Japanese side. The remaining problem for us was when to hold the seminar. Prof. Ang proposed mid December, 1987 for the time of the seminar, which did not meet with the convenience of the Japanese side. After some more correspondence between Prof. Ang and myself, we finally picked up March 21, and 22 as the time of the seminar. Meantime, the business for organizing the seminar from the Singapore side was taken over by Dr. Hari Gunasingham owing to the retirement of Prof. Ang from the University. After all, 24 leading analytical chemists from Japan and Singapore have agreed to participate in this JSPSNUS Seminar on analytical chemistry. We discussed the state of the art progress and future directions of Analytical Chemistry. The organizers of this seminar, Dr Gunasingham and myself have
xiv tried to cover broad spectra of this discipline, such as electrochemical analysis, spectrochemical analysis, separation science, bioanalysis and environmental analysis. Specialists from both countries were requested to give 25 minute talk each on their own topics, which was followed by sufficient discussions. The discussions were focused on the general access of information for the state of the art concept and technology for new analytical methodologies. Also, future directions of analytical science were discussed. By doing so, various research trend of analytical chemistry in both countries were realized, which will be beneficial for researchers of both countries to promote Joint projects and mutual exchanges on bilateral basis. The seminar was initially planned to be held for two days, but it was extended to another half day until March 23. Observers of about 30 were also present from other tertiary institutions such as Singapore Polytechnic, Nanyang Technological Institutions; Singapore Institute of Standards and Industrial Research, Department of Scientific Services and Industries. Finally, on behalf of all the participants from Japan, I would like to express our hearty thanks to the National University of Singapore for hosting this bilateral seminar. Also, the great effort and precise arrangement made by the organizer of the seminar, particularly Dr. Hari Gunasingham and other faculty members of the Chemistry Department are highly appreciated.
xv
ACKNOWLEDGEMENTS zyxwvutsrqponmlkjihgfedcbaZYXWVUTSRQPONMLKJIHGFEDCBA
This Seminar is sponsored by: (1) (2) (3) (4) (5) (6)
Japan Society for the Promotion of Science Lee Foundation Wenard Instrumentation (S) Pte Ltd Rank O'Connor's Schmidt Scientific (Pte) Ltd Hewlett Packard Singapore Pte Ltd
Madam Hee Wai Lan, Madam Toh Soh Lian, Madam Leng Lee Eng, Madam Irene Teo and Mr Philip Chua have given invaluable assistance in proofreading the retyped manuscripts. Also, on behalf of the Organizers, I would like to thank everybody who, in one way or another, has helped to make this Seminar a success.
Editor
This page is intentionally left blank
1 zyxwvutsrqp
AMPEROMETRIC SENSORS BASED ON BIOCATALYST ELECTRODES zyxwvutsrqponm Mitsugi Senda*, Tokuji Ikeda (Department of Agricultural Chemistry, Kyoto University, Kyoto 606), and Toshiyuki Osakai (Department of Chemistry, College of Liberal Arts, Kobe University, Kobe 657)
Abstract Amperometric sensors based on the biocatalyst electrode (that is, the redox enzymemodified electrode where the electrode functions as an electron acceptor (for oxidation of substrate) or donor (for reduction) of redox reaction catalyzed by the enzyme) has high capabilities. A variety of dehydrogenases as well as oxidases can be used as biocatalyst. Presence of an electron transfer mediator between the electrode and the redox center of activer enzyme is useful to accelerate the bioelectrocatalysis at the electrode. Two types of biocatalyst electrode with entrapped mediator were designed. Glucose oxidase, gluconate dehydrogenase, alcohol dehydrogenase (NAD), and diaphorase plus dehydrogenase (alcohol, lactate etc) electrode sensors were studied. Also, sensors based on the amperomeric (or voltammetric) ionselective electrode were designed. An amperometric urea sensor based on enzymeimmobilized ammonium ionselective electrode was constructed and examined. In the last decade considerable progress has been made in the studies on the redox enzymemodified electrodes, in which the electrode functions as an electron acceptor or donor of redox reaction catalyzed by the enzyme, usually immobilized on electrode surface. Enzymemodified electrodes of this kind are characterized by its bioelectrocatalysis nature electrode process conjugated with
2 zyxwvutsrqponmlkjihgfedcbaZYXWVUTSRQPONMLKJIHGFEDCBA biocatalysis and hence appear to be very promising for such novel applications as sensors, reactors, and fuel cells (for reviews see [13]). These enzymemodified electrodes may be called briefly the enzyme electrode or in more general terms the biocatalyst electrode. Of primary importance in the biocatalyst electrodes is the problem of the electron transfer between the electrode and the redox center of active enzyme. There are two modes of the electron transfer; direct transfer and indirect transfer through mediating redox couple, the mediator. Most of the known bioelectrocatalytic systems involve the electron transfer through mediator. In this paper we discuss the designs and characteristics of the biocatalyst electrodes (with entrapped mediator) and their applications to amperometric sensors. The problem of the direct electron transfer between the electrode and the enzyme will be discussed briefly. Also, amperometric sensors based on enzyme modified ionselective electrodes will be discussed. ^t. Electrode Process at Biocatalyst Electrodes Figure 1(A) shows a scheme of the enzyme electrode or the biocatalyst electrode where the electrode functions as an electron acceptor of redox enzyme immobilized on the electrode surface, E / E ., for oxidation of a substrate, S, to a product, P. In most of the enzymeimmobilized electrodes, however, it has been shown experimentally that the direct electron transfer between the electrode and the enzyme (the redox center of active enzyme) is not easy or hardly possible to take place rapidly. Then the presence of an electron transfer mediator, M^VII ., which acts as an electron ox red shuttle to provide redox coupling between the electrode and the redox center of active enzyme, as shown schematically in Figure 1(B), is useful to accelerate the electron transfer at the electrode. 2. Glucose Oxidase Electrode with Entrapped Mediator Let us take glucose oxidase (GOD) as the representative enzyme
3 zyxwvutsrqp
to design the biocatalyst electrode with mediator. For this enzyme a variety of redox couples such as benzoquinones (BQ/BQH 0 ), naphthoquinones (NQ/NQBL), ferricinium ions (Fee /Fee) as well as oxygen ( 0 2 / H 2 0 2 ) are known to work satisfactorily as an mediator[3]). Usually the mediator is added into the analyte solution. However, it is desirable to immobilize or entrap not only the enzyme but also the mediator in the immobilizedenzyme layer, referred to as the enzyme layer ( e . l ) in the following, attached on the electrode surface, so that we can use the biocatalyst electrode without addition of external mediator into solution. For this purpose two types of enzymemodified electrode were designed.
Figure 1
Biocatalyst electrodes. (A) Direct electron transfer and (B) mediated electron transfer between the electrode and the enzyme.
Filmcoated Glucose Oxidaseimmobilized Mediatormixed Carbon Paste Electrodes (Filmcoated GODMCPE): pBenzoquinone (BQ), a mediator, was mixed with graphite powder and paraffin liquid to prepare a benzoquinonemixed carbon paste electrode (BQCPE) and glucose oxidase was immobilized on the electrode surface by coating the e . l . with a nitrocellulose film or a dialysis membrane, referred to as the semipermeable membrane (s.m.) in the following. This filmcoated GODBQCPE [4,5] worked satisfactorily as a biocatalyst (GOD) electrode to oxidize catalytically Dglucose in solution without
4 zyxwvutsrqponmlkjihgfedcbaZYXWVUTSRQPONMLKJIHGFEDCBA addition of external mediator; BQ molecules in the BQCPE dissolves into the e . l . , participating there in mediating the electron transfer between the electrode and the enzyme. BQ is supplied to the e.l. from essentially infinite BQ reservoir of the BQCPE to make up the loss due to the small leakage of BQ through the s.m. and the concentration of BQ in the e . l . , C B Q > reaches a steadystate value which should be determined by the concentration of BQ in the BQCPE, ntgQt and the permeability of the s.m. to BQ. Experimental results showed that the steadystate C R O increased with increasing m BO a n d t h a t t h e c a t a t y t i c current, measured at +0.5V v s . SCE (that is, in the limiting current range), increased with increasing m RQ but approached a saturation value for m B Q larger than, e.g. 20%(w/w) for a particular filmcoated GODBQCPE, in agreement with eqs.l and 2 below. Dependence of the limiting current on the concentration of Dglucose, C . , in solution was also proved to follow eqs.2 with 3 below. Filmcoated Glucose Oxidaseimmobilized Porous (Metal Gauze) Electrodes with Mediator Reservoir (Filmcoated GODMGEM): Glucose oxidase was immobilized on one face of a gold gauze electrode, pbenzoquinonemixed paste, a mediator reservoir, was attached to the other face of the electrode, and the surface of the e . l . toward the solution was covered with a polymer film. Also, the mediator reservoir was replaced by air(0«) with a hydrophobic, oxygen permeable film attached to the other face of the platinum gauze electrode. These filmcoated GODAuGEBQ and GODPtGEair(0 2 )[5]) were proved to work satisfactorily as a biocatalyst electrode to catalytically oxidize Dglucose in solution without addition of external mediator or in the absence of oxygen in solution, indicating that the mediator was supplied from the reservoir(BQ) or air(0 2 ) to the e . l . through the pores of the gauze electrode. Experimental results obtained with these electrodes were well explained by the theoretical equations below. The catalytic current at a filmcoated GODPtGEair(02) increased by replacing air by oxygen gas, indicating that the enzymatic reaction does not yet reach the
5 zyxwvutsrqp
saturation value with respect to the oxygen concentration in the e . l . under the usual experimental condition. Theory of Limiting Current: The scheme of electrode process at a filmcoated GODmodified electrode with an entrapped mediator is illustrated in Figure 2. The substrate S, product P, oxidized mediator R f . reduced mediator M , are transferred in the e . l . by diffusion ox red •* accompanied with enzyme reaction. M , is converted to M by releasing n electrons at the electrode surface, giving the current as a function of the potential applied to the electrode, whereas S is supplied to and P is removed out of the e . l . zyxwvutsrqponmlkjihgfedcbaZYXWV
0)
O to e"
x=0
x=l
Figure 2 Scheme of the electrode process
by diffusion through the s.m.(coating film). It can be shown [58] that the limiting current I is expressed by zyxwvutsrqponmlkjihgfedcbaZYXWVUTSRQ
h = W
?/
< * + < K l ? / 1 C s > + < K 2 V * C M> >
(1)
where I f is the apparent maximum current which corresponds to max the maximum enzyme reaction rate in the e . l . (and is dependent on the concentration of immobilized enzyme in the e . l . , [ E ] , the thickness of the e . l . , 1, the apparent maximum enzyme reaction rate constant, k ', and the surface area of electrode, A; ImAJ=nFME]lk J), *V
6 zyxwvutsrqponmlkjihgfedcbaZYXWVUTSRQPONMLKJIHGFEDCBA and K2f the apparent Michaelis constants for S and M /respectively, (here the "apparent" means "corrected for concentration polarization due to diffusion in the e . l . " ) , C_ the concentration of S in the e . l . s at x = 1, and *C M the total (that is, MQx + M r e d ) concentration of mediator. At sufficiently large value of the mediator concentration, K< l$ w e n a v e that is, (K2t/f*CM^zyxwvutsrqponmlkjihgfedcbaZYXWVUTSRQPONMLKJIHGFEDCBA
h - W
V + < K l' / l c 3> > ^
Usually the e . l . is covered by the s.m., so that I r = nFA P m ( m C s ( \
/b) )
(3)
where P is the permeability of the s.m. (coating film) to S, m C the concentration of S in solution just outside the s.m., b the distribution coefficient of S between the e . l . and the solution. 3. Amperometric Sensors Based on Biocatalyst Electrodes Electrochemical analytical methodology comprises two methods; (a) the currentmeasuring method (amperometry, including most of voltammetric methods ^ in this definition) and (b) the potential measuring method (potentiometry). Therefore, theoretically there are two types of sensors based on the biocatalyst electrodes, that is, amperometric (or voltammetric) sensors and potentiometric sensors. Here we shall discuss the amperometric sensors based on the biocatalyst electrodes (with mediator). Let us take again the GOD electrode with mediator as the representative biocatalyst electrode and discuss some important factors which determine the characteristics of the amperometric sensors based on biocatalyst electrodes. Calibration Curves: When the concentration of mediator entrapped in the e . l . is so large that K 2 ^* C M Kj) and (b) the diffusion in the s.m. (eq.3), and when P is very small, for example, (k ^[EJlb/Kj'P ) » 1, the equation of I is reduced to
h - n F A V c s
that is, the current is controlled solely by the permeability of the s.m to analyte. Representative calibration curves that were obtained with three different filmcoated GODBQCPE's are shown in Fig. 3[5,7]. These results indicate that the filmcoated glucose oxidase electrodes can be designed to make glucose sensors for use at from low to high concentration range by the choice of P , K . f [E]l, and K / (and K 2 7*C M if necessary). Designing a glucose sensor capable of monitoring the glucose level in blood directly (without dilution) is feasible. Choice of the coating film (the s.m.) is important in designing filmcoated enzyme electrode sensors. It not only concerns with immobilization or entrapping of enzyme (and mediator) but also protects the enzyme from undesirable contaminations. It must be permeable for the substrate (and product) but is preferably as notpermeable as possible for the mediator. When P is so small that
8 zyxwvutsrqponmlkjihgfedcbaZYXWVUTSRQPONMLKJIHGFEDCBA
eq.4 is valid, the response of the enzyme electrode sensor becomes very stable, controlled only by diffusion across the s.m. and independent of the immobilizedenzyme reaction (the reaction rate parameters, pH, the life time e t c . ) , though in the cost of decreased sensitivity (the decreased slope of calibration curve) and prolonged response time (see below).
fflmCoattd GODOSOpfl) j * * \ B0(30%)CPri zyxwvutsrqponmlkjihgfedcbaZYXWVUTSRQPONMLKJIH
ISO
1 50
^
/
S
te£
50 I00 Cgfc/mmol dm"*
»50
Figure 3. Dependence of the limiting current obtained with three different filmcoated GODBQCPE's on the concentration of Dglucose in 0.2 M acetate buffer(pH 5.0); A, nitrocellulose film of 5Qum; B and C, dialysis membrane of 50 and 10(Jum thickness, respectively. The current was measured at 0.5V v s . SCE at 25°C. Response Time: The response time of filmcoated enzyme electrodes is determined by (a) diffusionenzyme reaction process of substrate and mediator in the e . l . and (b) diffusion process of substrate in the s . m . [ 7 ] . In most of the electrodes the thickness of the e . l . is much smaller than the thickness of the s.m., 1 ; then the respose time is practically determined by the diffusion process in the s.m.;
9 t« n, = 4 l m 2 /7T 2 D c ! m s.m. m s.m.
(5)
where D is the diffusion coefficient of substrate in the s.m. s.m. Enhanced Sensitivity: Sensitivity of enzyme electrode sensors can greatly be enhanced by substrate amplification; the substrate of the first enzyme is regenerated by the second enzyme (for review, see ref. [9]). Wasa et al.[10] have designed a Dglucose6P dehydrogenase (G6PDH) and diaphorase(DIAPH) co immobilized platinum electrode, which has exhibited very high sensitivity to detect NAD+ (and NADH) in the presence of hexacyanoferrric ion and Dglucose6P, a reductant for chemical amplification. Miki et a l . f l l ] have successfully constructed a very sensitive (down to nM order) NAD+ (and NADH) sensor based on a G6PDHDIAPHcoimmobilized Vitamin K«mixed CPE in the presence of Dglucose6P (see below). Gleria et al. [12] have developed an amperometric immunoelectrode based on a GOD electrode with a ferrocenedrug complex as mediator. The principle of the assay is: binding of the ferrocenedrug complex by antibody inhibits its ability to act as a mediator in the GOD electrode, and thus the catalytic current is greatly reduced. This can be reversed by adding a nonlabeled drug (that is, analyte) that competes for the available antibody binding sites. Effect of Oxygen: Biocatalyst electrodes with entrapped mediator does not need oxygen as reagent (or external mediator) to produce the current response. This is in contrast to, for example, conventional Dglucose sensors now available in market, which are mostly based on oxidase immobilized oxygen or hydrogenperoxide electrode. When ( K 2 r /* C M)
(1.3)
where | y , > is the initial vibrational wavefunction with energy E, on the ground electronic potential energy surface, andJLIf, is the, possibly coordinate dependent, electronic transition dipole moment. Finally, the Fourier transform energy E = hto + E,, and the time dependent wavepacket is given by | ^ ( t » = e i M t / ^ > ,
(1.4)
where M is the excited state Hamiltonian for nuclear motion. The overlap of the evolved state with the initial state is the autocorrelation function. C(t) £ < f | ^ ( t ) > .
(1.5)
According to eq. (1.2), the Fourier transform of the autocorrelation function leads to the total cross section. Conversely, if the cross section is measured, the inverse Fourier transform of eq. (1.2) yields the autocorrelation function
63 zyxwvutsrqp
( dE e~ i E t / "zyxwvutsrqponmlkjihgfedcbaZYXWVUTSRQPONMLKJIH 2. (U) ) . (1.6)
C(t) =
The evolved state | 0 ( t ) > samples the excited state potential energy surface, therefore the autocorrelation function would contain information about the sampled regions of the surface, as well as yielding the dynamics on the surface. The focus of this paper is on the short time dynamics, and a harmonic method that uses both the magnitude and the phase of the autocorrelation function is proposed to determine the geometry of the excited state surface. Theory We consider a diatomic molecule of reduced mass jLt , with harmonic ground and excited state surfaces, labelled j and e respectively. Assuming that the molecule is initially in the ground vibrational state, it can be shown [5] that the harmonic autocorrelation function can be expressed in terms of its modulus |C(T)( and phase U)(T) : C(T) = |C(T) f exp{ilf(T)}
,
(2.1)
where r7- «/* c
l N
=
(1
"
a
}
f 41/4
(1 2TCOS4TTT +T) , Al x exp J o(;
[
+ T£ )(1 COS2TTT) I v
' i zyxwvutsrqponmlkjihgfedcbaZYXW
'
1 2fCos2irT + f2
J ,
(2.2)
and ^p(T) = j tan 1 f f Sin4irT 1 f2 Cos4*tT
^ ( 1 f) Sin2TT
( 2 3 )
2
i Zf cos2tr + f
64 zyxwvutsrqponmlkjihgfedcbaZYXWVUTSRQPONMLKJIHGFEDCBA
Here,
T = U/et/2ir ,
(2.4)
( 2 5 ) I (we/fa)g + 1 } • •f = H/ W g " 1 }zyxwvutsrqponmlkjihgfedcbaZYXWVUTSRQPONMLKJIHGF
and
ozyxwvutsrqponmlkjihgfedcbaZYXWVUTSRQPONMLKJIHGFE to - On the other hand, it there is bond e
s
shortening, A o 6
7
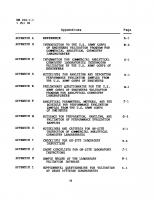
Figure 5. Structure of receptors as model channels. (1) valinomycin, (2) bis[(benzo15crown5)4 f methyl] pimelate, (3) bis[(12crown4)methyl] methyldodecyl malonate, (4) 4,7diphenyll,10phenanthroline, (5) 2 (5 chloro2pyridylazo)5diethylaminophenol, (6) 3(2pyridyl)5,6bis(4sulfophenyl)l,2,4triazine. These results show that the channel opening for permeation of marker ions is due to the receptor which selectively interact with sodium ions and that the information transduction into the change in the membrane permeability is quantitatively made by increasing concentration of sodium ions. Consequently, the sensor has its potential for detection of electroinactive sodium ions in solutions. The degree of amplification of this type of sensor can be evaluated in the similar way as described above for the receptorfree molecular
103 zyxwvutsrqp
assembly, where the maximum number of active sites for binding sodium ions is a half of that of the membrane molecules deposited, because in the present case the 1:1 molar ratio of the lipid and the receptor was employed for the LB film membrane. The degree of amplification thus obtained for some receptorincorporating LB membranes based ionchannel sensors are given in Table 1. /I
0.8
0 0.2
E (vs. S C E ) / V
Figure 6, Cyclic voltammetric detection of 1 mM Fe(CN) 4 6 ions as the marker ion with (1) an uncoated GC and (12),(3) with a Na ion stimulated ionchannel sensor. Concentration of a stimulus (NaCl) : (1) 2 mM, (2) 0 mM, (3) 2 mM. Supporting electrolyte: 10 mM (CH 3 ) 4 NC1. Figure 7. Concentration dependence of the Na+ ion stimulated ionchannel sensor on detection of 1 mM Fe(CN)A 4 (as 6 a lithium salt) as the marker ion in 10 mM (CH3)4NC1 solution. (a) AnzyxwvutsrqponmlkjihgfedcbaZYXWVUTSRQPONMLKJIHGFEDCBA ion-channel sensor based on bis(12crown4) incorporating didodecyl phosphate; (b) An ionchannel sensor based on the receptorfree didodecyl phosphate.
104 zyxwvutsrqponmlkjihgfedcbaZYXWVUTSRQPONMLKJIHGFEDCBA 3.
Lipid Bilayer Membranes
3.1 Proteinpendant Liposomes and Ionselective Electrodes [10].
It has been known in biochemistry and well understood recently that the antigen/antibody/complement reaction triggers thezyxwvutsrqponmlkjihg formation of "channellike" holes across the liposome membrane. This phenomenon is not exactly the one what is called "ionchannel" in the biological definition, but could be regarded as a model system for it. The immunological sensitization of the liposome membrane surface can be made by different two methods: (1) incorporation of lipid haptens as liposome constitutes and (2) chemical binding of protein antigens on the surface of liposome (Figure 8). w antibody
protein
/ ^**^iiierabr«i* 'f S — S attack complex
©
/ I b)
^ r \ ( £ ?
\ © © Figure 8. Immnological sensitization of the liposome membrane surface by different two methods, (a) Lipid haptens can be liposome constituents by themselves; (b) Protein antigens are chemically bonded on the membrane surface. Figure 9. Schematic diagram for the formation of "channellike" holes across the liposome membrane. The immuno reaction triggers the formation of the holes which capable entrapped fluoride anions flow through the hole.
105 zyxwvutsrqp
The formation of "channellike" holes across the antigenincorporating or pendant liposome membrane enables entrapped marker ions, fluoride ions in the present case, flow through the hole. The fluoride ion release is specific for the antibody in the presence of complement and monitored by means of thinlayer potentiometry, i.e. a combination of F ionselective electrode and a silver chloride coated silver plate electrode. Schematic representation of the formation of "channellike" holes across the proteinpendant liposomes are shown in Figure 9. Human IgG antibody was attached covalently to the surface of liposomes. (DTPdipalmitoylphosphatidylethanolamine, chloresterol and dimyristoylphaosphatidylcholine in the molar ration of 0.06: l : l ) b y the use of a crosslinking reagent Nhydroxysuccinimidyl 3(2pyridyldithio) propionate. By the use of this IgG pendant liposomes, the antigen/antibody/complement reaction triggers the release of the marker F ions entrapped in the interior of the liposome vescicles, which can be used as a much amplified measure of the concentration of IgG antigen at given amounts of complement and IgG antigen by monitoring the marker ions with a thinlayer potentiometry.
Shown in Figure 10 is the dependence of the extent of the marker ion release on the concentration of IgG antibody at given amounts of complement and IgG antigen. Using Figure 10 as a calibration curve, one can determine the antihuman IgG antibody 3 1 level of 2 x 10 through 2 x 10 mg/ml. This method has a great advantage with respect to the signal amplification. Although the final signal output is obtained as the released marker ion concentration of about 10 M level, the ultimate detection limit of the analyte itself is by far lower than this, e.g. 10 M level of human IgG. This concludes that the builtin amplification factor for sensitivity enhancement of the present approach is extremely great such as zyxwvutsrq n
10 fold amplification. Table 2 summarizes the amplification factors, defined as, amp.factor= (monitoring ion concentration)/(detection limit of analyte) for several different immuno systems [1013].
106 zyxwvutsrqponmlkjihgfedcbaZYXWVUTSRQPONMLKJIHGFEDCBA
30!
20 zyxwvutsrqponmlkjihgfedcbaZYXWVUTSRQPONMLKJIHGFEDCBA
10
101
102
103
104
JO5
AntiIgG antibody concentration/mg ml"1
Figure 10. Effect of anithuman IgG antibody concentration on the release of marker ions through the IgG pendant liposome membranes upon complement mediated immunoreaction. Complement, 100 times dilution with GVB++; incubation, 37°C for 1 h . 2+
3
Figure 11: Effect of added Cu ion (10 M) as a stimulus on the release of F ions from bathophenanthroline incorporated liposomes. The difference in amplification factors depending upon each immuno system may be due to the different values of binding constants for antigen/antibody complexes. 3.3 Hydrophobic Chelates Incorporating Liposomes and Metal Ion Stimulus f!41 Not only immuno systems, but also similar approach can be made with inorganic metal complex systems. We have incorporated into the liposome membrane some hydrophobic chelate(ligand) compounds as model receptors towards specific metal ions as stimuli. With a specific interaction of this stimulus with the model receptor in the lipid
107 zyxwvutsrqpo bilayer membrane, membrane permeability to some appropriate marker ions is changed probably due to some electrostatic interactions. Figure 11 shows the effect of added Cu(II) ion as a stimulus on the release of F
ions from bathophenanthroline incorporated liposomes.
As clearly seen in this figure, the F ion release is triggered b y an added Cu(II) ion stimulus. receptors,
stimulus,
Table 3 summarizes the kinds of model
detection
limit,
amplification
factors
selectivity data with the abovementioned approach.
Table 2 .
Amplification factors examined for various immuno systems
detection analyte
limit
ganglioside
10~ U M
monitoring a) ion '
TPA
b)
amplification factor
10'
15
( 1 0 ~ mol) human IgG
10" 10 M
10*
( 1 0 ~ 1 4 mol) human IgG
10 1 0 M
10"
( 1 0 ' 1 4 mol) £DNPcapPE C
10" 8 M
TPA +
b )
10^
12
(10" mol)
4
+
a) 10 M; b) TPA : tetrapentylammonium cation; c ) £ ( dinitrophenylaminocaproyl) phsphatidylethanolamine
and
108 zyxwvutsrqponmlkjihgfedcbaZYXWVUTSRQPONMLKJIHGFEDCBA
Table 3: Some/receptor/liposome/stimulus systems for signal transduction and amplification receptor stimulus*'
detection amplification selectivityzyxwvutsrqponmlkjihgfe ' limit factor Co 2+ Cu 2+ Ni 2+
4
Cu 2+
10*5 M
7.7
1 0.26
0.13
5
Cu 2+ ,Co 2+
1 0 5 M
25.8
1 0.96
0.01
6
Cu 2+
1 0.06
0
7
Cu 2 +
1
0
0
-•
®
s®/
> E o
Glycine (130 ul)
ul; coil length and diameter, SMj: 38 cm x 0.5 mm i . d . , MjlV^: 90 cm x 0.5mm i . d . , M2D: 30 cm x 0.5 mm i.d. Flow Jtitration of metals or ligands A cuprie ionselective electrode and a cuprie ion buffer were used for determination of various kinds of metals. Nitrilotriacetic acid(NTA) was used as the ligand of the cuprie ion buffer. An addition of a different metal ion M from the cuprie ion to the buffer stream results in increase of the free cuprie ion concentration. The cuprie ionselective electrode detects the increase of the free cuprie ion concentration, which leads to the determination of the sample metal M. An example is shown in Figure 6. By this method, cadmium and other several heavy metal ions were determined with almost the same sensitivity [13]. When triethylenetetramine (trien) is used for the ligand, different slopes of. calibration curves were observed for different sample ions. This is understood by considering a very high stability constant of the Cutrien complex, compared to the complexes
158 zyxwvutsrqponmlkjihgfedcbaZYXWVUTSRQPONMLKJIHGFEDCBA
of other metals with trien. The high stability constant of the Cu complex brings about a contribution of another ion M to the electrode potential.
5.0 x 10~3 M ZnCNOg^
1x10"* M NTA
>
E
ml/min
Figure 6 Flow diagram for analysis of metal ions M + and calibration peaks for zinc ion. Sample volume, 100 jul, coil length and diameter, SM: 20 cm x 0.5 mm i . d . , MD: 235 cm x 0.5 mm i.d. 2+ 2+ 2+ Separate determination of mixed metals (Cu , Zn , Ni etc.) was possible by a combination of chromatographic separation of metals with the proposed flow method. Determination of calcium in the presence of magnesium was performed by use of a combination of the CuEGTA (ethyleneglycol bisdiaminoethyletherN,Ntetra acetic acid) buffer with the cupric ionsensitive electrode as shown in Figure 7.
159 6.0x10° M C»(NOj), ml/min 5.0x 10*2 M EGTA 5.0x 10"2 M Cu EGTA
zyxwvutsrqponmlkjihgfedcbaZYXWVUT
zyxwvutsrqponmlkjihgfedcbaZYXWVUTSRQPONMLKJ
Figure 7 Flow diagram for selective analysis of calcium ion and calibration peaks for calcium ion in the presence of magnesium ion. Sample volume, 160 Ail, coil length and diameter, SM: 40 cm x 0.5 mm i . d . , MD: 70 cm x 0.5 mm i.d. Determination of water hardness (total concentration of calcium and magnesium) was successfully conducted by use of the CuEDTA buffer adjusted at pH 910 as shown in Figure 8. 5.0x10" s M Ca(N0 3 ^ 6.0x10T5 M Mg(N03>2
1.0x10 ~*MEDTA Buffer sola L 5.0x10' 5 MCu(NO 3 ) 2 (09| (PH:8.9)
ml/min C a 2 > Q 2 + (200 ul)
10 mln.
Figure 8 Flow diagram for analysis of calcium and magnesium ions and calibration peaks for calcium and magnesium ions. Sample volume, 200 Ad, coil length and diameter, SM: 45 cm x 0.5 mm i . d . , MD: 380 cm x 0.5 mm i.d.
160 zyxwvutsrqponmlkjihgfedcbaZYXWVUTSRQPONMLKJIHGFEDCBA Flow titrations of oxidative or reductive chemical species The Fe(II)Fe(III), Ce(III)Ce(IV) or another potential buffer system could be used as redox potential buffers with an oxidationreduction potential electrode (ORP electrode) for redox titration. Determinations of dichromate, hydrogen peroxide and Lascorbic acid were performed by using the redox potential buffer Fe(II)Fe(III). Determination of concentrated aqueous solution of hydrogen peroxide is shown in Figure 9. 9.86MHP2
7*1
5.93 0.40 M Fe(ll) 0.40 M Fe(lll) I ^ | 2.0 M H2S04
a97
co
1.98 ORP electrode
ml/min
ii 1IL
IW zyxwvutsrqponmlkjihgfedcbaZ
ul, coil length and diameter, SM: 40 cm x 0.5 mm i . d . , MD: 235 cm x 0.5 mm i.d. The buffer Fe(II)Fe(III) is of relatively weak oxidizing power and showed no reaction with hydroxylamine and hydrazine. The more powerful buffer, Ce(III)Ce(IV), was effective for these samples.
161 zyxwvutsrqpo
As shown in Figures 10 and 11, highly sensitive determinations of bromate and residual chlorine were achieved by using the Fe(II) Fe(III) redox potential buffer containing NaBr and NaCl, respectively.
6 x 10"6M zyxwvutsrq 0.01M Fe 3 + - 0.01M Fe 2 +
U l
ml / mln
Figure 10 Flow diagram for analysis of bromate and calibration peaks for bromate. Sample volume, 140zyxwvutsrqponmlkjihgfedcbaZYXWVUTSRQPONMLKJ ml, coil length and diameter, SM: 50 cm x 0.5 mm i . d . , MD (R.T.) : 160 cm x 0.5 mm i.d. 8 X 10"" M zyxwvutsrqponm 3+ 2+ 0.7 0.01 M Fe 0.01 M Fe 0.3 M KCI 0.5 M H 2 S0 4
p
0.7
ml/min
S
1 x 10"6 M
R.T. ORP electrode
t
Residual chlorine
Figure 11 Flow diagram for analysis of residual chlorine and calibration peaks for residual chlorine. Sample volume, 140 jul, coil length and diameter, SM: 50 cm x 0.5 mm i . d . , MD(R.T.):90 cm x 0.5 mm i.d.
162 zyxwvutsrqponmlkjihgfedcbaZYXWVUTSRQPONMLKJIHGFEDCBA
In these analyses, large and transient potential changes due to intermediates produced by the reaction of the sample with the buffer are used for detection [14, 19]. 3 4 The Fe(CN) 6 Fe(CN) 6 potential buffer was used for determination of reducing sugars such as glucose [17] and maltose [15], as shown in Figure 12.
1 x 10'4M CFe(CN)633' 1 x l(f 4M CFe(CN)6]4" zyxwvutsrqponmlkjihgfedcbaZYXWVUTSRQP !r"85Xf]r25t! zyxwvutsrqponmlkjihgfedcb
LR:C,JlCCj ml/min t Reducing sugar 2.0 x 10~5 M
1.5 x 1 P + M n+ > M (n + 1) + +
(1) (2) Q
( 3 )
where Red and Ox are the reactants of a redox reaction and P and Q
235 zyxwvutsrqpo
are the reaction products. When an ion M^n+ ^+ acts as a catalyst, this ion accelerates the formation of the products and is reduced to a lower valent Mn . If Mn produced is oxidised again to M^nzyxwvutsrqponmlkjihgf ' by reaction (3), the oxidation of Red to P is catalyzed by a minute amount of M*n+ ' + . (If Mn+ produced by reaction (2) remains unchanged during the reaction, the formation of P should be terminated stoichiometrically sooner or later by the consumption of + n+ M (n+ ) ) I t i s jjgQ t r u e £ r o m reaction (3) that M can be determined as well as NT , being oxidised by the oxidant Ox. The role of the oxidant Ox is to cycle the catalyst, and H„0 2 , C10„ . IO and dissolved 0« are generally used for the catalytic procedures using the redox reactions. Although these oxidants could be oxidised Red (usually organic compounds) to P, the rate of oxidation of Red is very slow, while the oxidation of Mn+ to MTn ' is very fast. The possibility for further increase in sensitivity of the catalytic reaction is the application of activators. By definition an activator for a catalytic reaction does not catalyze the indicator reaction (reaction (1)), but increases its rate in the presence of a catalyst [ 4 ] . Some examples of activators used in the catalytic methods are listed in Table I. This paper describes the catalytic determinations of copper(II) [14], chromium (III) [15] and manganese(II) [8] by the oxidative coupling reaction of 3methyl2benzothiazolinone hydrazone (MBTH) with N, Ndimethylaniline (DMA), on the basis of this principle. Principle of the Methods In the presence of the oxidizing agents such as H 2 0 2 and/or dissolved O^, MBTH reacts with DMA to form 3methyl2 benzothiazolinone 4 (dimethylamino)phenylhydrazone, which is probably oxidized to a blueviolet dye, 4(3methyl2 benzothiazolidenehydrazone) 2,5cyclohexadienelyledenedimethy lammonium. The dye has an absorption maximum at 590 nm in an
236 zyxwvutsrqponmlkjihgfedcbaZYXWVUTSRQPONMLKJIHGFEDCBA alkaline solution. The coloration of MBTH with DMA is catalyzed by trace amounts of copper, chromium and maganese, respectively. Table I
Activators Used in the Catalytic Methods of Analysis zyxwvuts
Activator
Catalyst
Reaction System
Ref.
Sulfosalycilic
V(IV,V)
AA - DMA - BrO -
5
acid o-Phenanthroline
2,2' -Bipyridine
Mn(II)
I0
4"
6 7
MBTH - DMA - 0 2
8
9
Fe(II,III)
p-Anisidine - DMA
Mn(II)
Tiron - H 2 0 2
7
MBTH - DMA - 0 2
8
Cu(II)
MBTH - DMA - H O
Acetic Acid
Fe(II,III)
Tiron
Co(II)
Ammonia
Cu(II)
EDTA
Sulfanilic acid Tiron - H 2 0 2
Cr(III)
-H2°2
10 PPDA - DMA - H 2 0 11 12 PPDA - H 2 0 2 13 PPDA - DMA zyxwvutsrqponmlkjihgfedcbaZYXW - HO
MBTH - DMA - H O
14
MBTH - DMA - H ^
15
AA : 4aminoantipyrine, DMA : N,Ndimethylaniline, Tiron : l,2dihydroxybenzene3, 5disulfonic acid, PPDA : Nphenylpphenylenediamine, MBTH : 3methyl2benzothiazolinone hydrazone. In the copper catalyzed reaction, the divalent copper Cu(II) acts as a catalyst and the reduced copper Cu(I) produced during the redox reaction is oxidized again to Cu(II) by hydrogen peroxide. As a result of the regeneration of Cu(II), the rate of coloration increases catalytically with increasing concentration of copper. The coloration is also catalyzed by Cr(III) in the presence of hydrogen peroxide and ethylenediamineN,N,N ? ,N f tetraacetic acid (EDTA) as an
237 zyxwvutsrqpo
activator. In this case, the Cr(III)EDTA complex is thought to be a very effective catalytic species, because the complex catalyzes the decomposition of hydrogen peroxide [16, 17]. The rate of coloration by dissolved oxygen is accelerated by trace amount of manganese in an alkaline solution. The manganesecatalyzed reaction does not occur when dissolved oxygen is replaced by nitrogen gas. According to the literature [18, 19], the catalytic reaction of manganese on a redox reaction involves the oxidation of Mn(II) to Mn(III) and/or Mn(IV) by dissolved oxygen in the alkaline solution. However, the main species of oxidized manganese seems to be Mn(IV) under the experimental conditions. Thus the reaction steps of the system probably: MBTH MBTH Mn(II)
+ DMA + 0 2 » P (4) + DMA + Mn(IV) > P + Mn(II) (5) + 0 2zyxwvutsrqponmlkjihgfedcbaZYXWVUTSRQPONMLKJIHGFEDCBA > Mn(IV) (6)
where P is the blueviolet dye. Reaction (5) is much faster than reaction (4). Mn(II) produced by reaction (5) is oxidized again to Mn(IV) by reaction (6) and it accelerates the formation of P. Determination of Copper[141 Experimental Procedure To 20 25 ml of a sample solution ( ^
^ f o C O "
001 400
500
Temperature IK I
500
Temperature [ K ]
Figure 4 (a, b) Temperature dependence of the concentrations of surface species observed during the decomposition of CH3OH on a Ru surface (c) for comparison: temperature programmed desorption spectroscopy[9] shows that CO desorbs thermally at the same temperature as peak maxima of CO+ in Figure 4b.
293 zyxwvutsrqpo
3.2 VARIATION OF REACTION TIME: CHD2OH/RHODIUM zyxwvutsrqponmlkjihgfedc Figure 5 shows the results of varying the reaction time. A steady electrical field of 5 V/nm was applied during these measurements. Methyld 2 alcohol, CHD2OH (MSD Isotopes, 98.6 atom%D), was used and the rhodium emitter was kept at room temperature. The surface concentrations of the different species built up in the reaction time t R are plotted as a function of t R .
02
0.5
1
2
reaction time [ ms. Figure 5
Dependence of the ion intensities with reaction time. F D = 24 V/nm, F R = 5 V/nm, F n = 29 v/nm, T = 298 K, p = 1.3 x 10 Pa
294 Different time dependencies are exhibited by the various ions. For 100 MS / zyxwvutsrqponmlkjihgfedcbaZYXWVUTSRQPONMLKJIHG
O)
3 10° o o " *
1
.2 10"1 Z3
s / \
o»
CH30
o
c o o
,
£ 10'3 c c o u
^ 0 H 2
/ 4
10"
01
ja c_
3 10"5
/
" / /
^ * *
^Z^ SS^ Ss^ // V ^ O ^
/
I
C0H
Ss
10"6
0.1
10 time (ms)
100
1000
Figure 6: Numerically calculated curve when there i s no 1 , . _zyxwvutsrqponmlkjihgfedcbaZY MM 1 400 s blocking of s i t e s . zyxwvutsrqponmlkjihgfedcbaZYXWVUTSRQP k, = 10 s 1 1 0 s k Q = 50000 s" , k. = 80000 s" 4 u 3 5 Pressure = 1.3 x 10 Pa, number of sites = 100
296 With the used set of rate constants, CHLO and CHLO increase linearly with time whereas the CO concentration initially shows a quadratic time dependence. The quadratic time dependence of the final product only occurs if k^k^ is more than 100. At longer times, the quadratic dependence changes over to a linear dependence. The pressure used in this computation is 1.3x10" Pa so that a monolayer coverage would be attained only after 10 s. Therefore, saturation of the surface is not observed. The computed curves fit quite well with the experimental results MS £ t R