High Performance and Power Efficient Electrocardiogram Detectors (Energy Systems in Electrical Engineering) 9811953023, 9789811953026
This book details the characteristics of an ECG signal through the functionality and electrical activity of the human he
128 97 8MB
English Pages 211 [206] Year 2022
Preface
Acknowledgements
Contents
About the Authors
1 Introduction
1.1 Development of Implantable Cardiac Pacemaker System
1.2 Need and Motivation
1.3 Identifying the Research Problem
1.4 Introduction to Electrocardiography
1.4.1 Basic Introduction to Heart
1.4.2 Functions of the Human Heart
1.4.3 Overview of Implantable Cardiac Pacemaker System
1.4.4 Electrocardiogram Signal Characteristics
1.4.5 Parameters of ECG Signal
1.4.6 Common Noises in an ECG Signal
References
2 Existing Methods to Evaluate Pacemaker Device Performance
2.1 Algorithmic Structures of Different ECG Detection and Data Compression Techniques
2.2 Databases to Benchmark ECG Detection Algorithm
2.3 Evaluation and Comparison of ECG Detection and Data Compression Techniques
2.4 Discussion: Challenges and Gaps
2.5 Summary
References
3 ECG Signal Denoising Techniques for Cardiac Pacemaker Systems
3.1 ECG Signal Denoising
3.1.1 Criterion to Select Wavelet Transform for ECG Signal Analysis
3.1.2 Criterion for Selecting Wavelet Filter Bank Architecture
3.1.3 Simulation Results and Performance Evaluation of the Proposed Modified 3.1 Wavelet Transform-Based Wavelet Filter Bank
3.2 Demand-Based Wavelet Filter Bank
3.2.1 Criterion to Select Wavelet Decomposition Level
3.2.2 Wavelet Thresholding Techniques
3.2.3 Simulation Results and Performance Evaluation of the Proposed Demand-Based Wavelet Filter Bank
3.3 Summary
References
4 ECG Signal Detection and Lossless Data Compression Techniques for Implantable Cardiac Pacemaker Systems
4.1 ECG Signal Detection
4.1.1 Simulation Results and Performance Evaluation of the Proposed Soft-Thresholding-Based QRS-Complex Detection Technique
4.1.2 Dynamic Dual Thresholding-Based ECG Signal Detection
4.1.3 Simulation Results and Performance Evaluation of the Proposed Dynamic Dual Thresholding-Based ECG Signal Detection Technique
4.1.4 Adaptive Thresholding-Based ECG Signal Detection Technique
4.1.5 Simulation Results and Performance Evaluation of the Proposed Adaptive Thresholding-Based ECG Signal Detection Technique
4.2 Lossless Data Compression
4.2.1 Simulation Results and Performance Evaluation of the Proposed RLE-Based Lossless Data Compression Technique
4.2.2 LZMA-Based Lossless Data Compression Technique
4.2.3 Simulation Results and Performance Evaluation of the Proposed LZMA Lossless ECG Data Compression Technique
4.2.4 Biorthogonal 3.1 Wavelet Transform-Based Lossless ECG Data Compression Technique
4.2.5 Simulation Results and Performance Evaluation of the Proposed Biorthogonal 3.1 Wavelet Transform-Based Lossless ECG Data Compression Technique
4.3 Three-Tap Wavelet Filter Bank-Based Lossless ECG Data Compression Technique
4.3.1 Simulation Results and Performance Evaluation of the Proposed Three-Tap Wavelet Filter Bank Based on Lossless ECG Data Compression Technique
4.4 Summary
References
5 FPGA Implementation of Combined ECG Signal Denoising, Peak Detection Technique for Cardiac Pacemaker Systems
5.1 FPGA Implementation of an ECG Signal Detection Technique
5.2 Selection of Wavelet Transform
5.2.1 Energy and Shannon Entropy
5.2.2 Mutual Information and Relative Entropy
5.2.3 Cross-Correlation
5.2.4 Minimum Description Length (MDL)
5.3 Selection of Wavelet Filter Bank Architecture
5.4 ECG Signal Detection
5.5 Simulation Results
5.5.1 Input ECG Data
5.5.2 ECG Signal Denoising
5.5.3 ECG Signal Detection
5.6 Implementation of the ECG Signal Detector on FPGA
5.7 Summary
References
6 Digital ECG Signal Watermarking and Compression
6.1 Basics of ECG Signal Watermarking and Compression
6.2 ECG Signal Watermarking and Compression Technique
6.3 Performance Results
6.4 Discussion
6.5 Summary
References
7 Basic Formation on Wavelet Transforms
7.1 Wavelet Families, Coefficients and Their Shapes
7.2 Introduction to Wavelet Toolbox
7.2.1 Basic Introduction to Wavelet Families Using MATLAB®
7.2.2 ECG Signal Analysis Using Wavelet Toolbox
References
8 Conclusion and Future Work
Annexure A
Annexure B
Recommend Papers


![Renewable Energy: Accelerating the Energy Transition (Energy Systems in Electrical Engineering) [1st ed. 2024]
9819961157, 9789819961153](https://ebin.pub/img/200x200/renewable-energy-accelerating-the-energy-transition-energy-systems-in-electrical-engineering-1st-ed-2024-9819961157-9789819961153.jpg)


- Author / Uploaded
- Ashish Kumar
- Manjeet Kumar
- Rama S. Komaragiri
File loading please wait...
Citation preview
Energy Systems in Electrical Engineering
Ashish Kumar Manjeet Kumar Rama S. Komaragiri
High Performance and Power Efficient Electrocardiogram Detectors 123
Energy Systems in Electrical Engineering Series Editor Muhammad H. Rashid, Florida Polytechnic University, Lakeland, USA
Energy Systems in Electrical Engineering is a unique series that aims to capture advances in electrical energy technology as well as advances electronic devices and systems used to control and capture other sources of energy. Electric power generated from alternate energy sources is getting increasing attention and supports for new initiatives and developments in order to meet the increased energy demands around the world. The availability of computer–based advanced control techniques along with the advancement in the high-power processing capabilities is opening new doors of opportunity for the development, applications and management of energy and electric power. This series aims to serve as a conduit for dissemination of knowledge based on advances in theory, techniques, and applications in electric energy systems. The Series accepts research monographs, introductory and advanced textbooks, professional books, reference works, and select conference proceedings. Areas of interest include, electrical and electronic aspects, applications, and needs of the following key areas:
• • • • • • • • • • • • • • • • • • • • • • • • • • • • • • • •
Biomass and Wastes Energy Carbon Management Costs and Marketing Diagnostics and Protections Distributed Energy Systems Distribution System Control and Communication Electric Vehicles and Tractions Applications Electromechanical Energy Conversion Energy Conversion Systems Energy Costs and Monitoring Energy Economics Energy Efficiency Energy and Environment Energy Management, and Monitoring Energy Policy Energy Security Energy Storage and Transportation Energy Sustainability Fuel Cells Geothermal Energy Hydrogen, Methanol and Ethanol Energy Hydropower and Technology Intelligent Control of Power and Energy Systems Nuclear Energy and Technology Ocean Energy Power and Energy Conversions and Processing Power Electronics and Power Systems Renewable Energy Technologies Simulation and Modeling for Energy Systems Superconducting for Energy Applications Tidal Energy Transport Energy
Ashish Kumar Manjeet Kumar Rama S. Komaragiri •
•
High Performance and Power Efficient Electrocardiogram Detectors
123
Ashish Kumar School of Electronics Engineering Vellore Institute of Technology Chennai, Tamil Nadu, India
Manjeet Kumar Department of Electronics and Communication Engineering Delhi Technological University Shahbad Daulatpur, Delhi, India
Rama S. Komaragiri Department of Electronics and Communication Engineering School of Engineering and Applied Sciences Bennett University Greater Noida, Uttar Pradesh, India
ISSN 2199-8582 ISSN 2199-8590 (electronic) Energy Systems in Electrical Engineering ISBN 978-981-19-5302-6 ISBN 978-981-19-5303-3 (eBook) https://doi.org/10.1007/978-981-19-5303-3 © The Editor(s) (if applicable) and The Author(s), under exclusive license to Springer Nature Singapore Pte Ltd. 2023 This work is subject to copyright. All rights are solely and exclusively licensed by the Publisher, whether the whole or part of the material is concerned, specifically the rights of translation, reprinting, reuse of illustrations, recitation, broadcasting, reproduction on microfilms or in any other physical way, and transmission or information storage and retrieval, electronic adaptation, computer software, or by similar or dissimilar methodology now known or hereafter developed. The use of general descriptive names, registered names, trademarks, service marks, etc. in this publication does not imply, even in the absence of a specific statement, that such names are exempt from the relevant protective laws and regulations and therefore free for general use. The publisher, the authors, and the editors are safe to assume that the advice and information in this book are believed to be true and accurate at the date of publication. Neither the publisher nor the authors or the editors give a warranty, expressed or implied, with respect to the material contained herein or for any errors or omissions that may have been made. The publisher remains neutral with regard to jurisdictional claims in published maps and institutional affiliations. This Springer imprint is published by the registered company Springer Nature Singapore Pte Ltd. The registered company address is: 152 Beach Road, #21-01/04 Gateway East, Singapore 189721, Singapore
Ajnana TimirAndhasya JnanaAnjanaShalaakaaya Chakshurunmilitam Yena Tasmai Sri Gurave Namaha (Source: Upanishads)
Dedicated to Our Teachers who enlightened us through their Knowledge
Preface
This book details the characteristics of an ECG signal through the functionality and electrical activity of the human heart. This book provides a basic introduction and needs to develop implantable cardiac pacemaker systems and provides comprehensive details on ECG signal processing techniques useful for fast and accurate diagnosis of cardiovascular diseases. Characteristics and parameters of a typical ECG signal and various noises that can corrupt an ECG signal are discussed. Various challenges involved in different stages of signal acquisition, preprocessing, and detection of an ECG signal are discussed. A detailed survey of various ECG signal detection and data compression techniques is presented. This book, through detailed explanations, provides the reader with necessary information on ECG signal, ECG signal acquisition process, noise removal techniques, and the detection of ECG peaks. ECG signal denoising, wave detection, and lossless data compression techniques for cardiac pacemaker systems are studied. ECG signal denoising, ECG signal detection, and lossless data compression are discussed further. A detailed discussion of the proposed approaches and their theoretical backgrounds is presented. Various performance evaluation metrics, experiment results of the proposed combined ECG signal denoising, ECG signal detection, and lossless data compression are discussed. Finally, the FPGA implementation of a combined algorithm to denoise an ECG signal and detect an ECG signal for the cardiac pacemaker system is presented. The book contains • Detailed information on ECG signal • Details on various noises that corrupt an ECG signal • Introduction to wavelets and selection criteria of a wavelet to analyze ECG signal • De-noising techniques • ECG peak detection techniques • ECG data compression techniques
ix
x
• • • •
Preface
Realization of ECG signal detection algorithms in hardware Step-by-step details to design various filters in MATLAB Step-by-step details to design filter bank in MATLAB MATLAB programs.
Chennai, India Shahbad Daulatpur, India Greater Noida, India
Ashish Kumar Manjeet Kumar Rama S. Komaragiri
Acknowledgements
We thank our family members for rendering the unforgiving support while editing the work, the unsung “Heros” in our lives. Dr. Manjeet Kumar extends his sincere gratitude to the Vice-Chancellor, Head of the Department and Colleagues of the Department of Electronics and Communication Engineering at Delhi Technological University. Dr. Rama Komaragiri would like to extend his sincere gratitude to the Chancellor, Vice-Chancellor, and his Colleagues from the Department of Electronics and Communication Engineering of Bennett University, Greater Noida. Dr. Ashish Kumar extends his sincere gratitude to the Chancellor, VIT Management, the Vice-Chancellor, the Pro Vice-Chancellor, Dean School of Electronics Engineering and Colleagues from the School of Electronics Engineering from Vellore Institute of Technology. We would like to thank the staff at Springer Nature, in particular Ms. Kamiya Khatter and Dr. Karthik Raj, for their help and support in producing the book.
xi
Contents
1 Introduction . . . . . . . . . . . . . . . . . . . . . . . . . . . . . . . . . . . . . . . 1.1 Development of Implantable Cardiac Pacemaker System . . . . 1.2 Need and Motivation . . . . . . . . . . . . . . . . . . . . . . . . . . . . . 1.3 Identifying the Research Problem . . . . . . . . . . . . . . . . . . . . 1.4 Introduction to Electrocardiography . . . . . . . . . . . . . . . . . . . 1.4.1 Basic Introduction to Heart . . . . . . . . . . . . . . . . . . . 1.4.2 Functions of the Human Heart . . . . . . . . . . . . . . . . . 1.4.3 Overview of Implantable Cardiac Pacemaker System . 1.4.4 Electrocardiogram Signal Characteristics . . . . . . . . . . 1.4.5 Parameters of ECG Signal . . . . . . . . . . . . . . . . . . . . 1.4.6 Common Noises in an ECG Signal . . . . . . . . . . . . . . References . . . . . . . . . . . . . . . . . . . . . . . . . . . . . . . . . . . . . . . . .
. . . . . . . . . . . .
. . . . . . . . . . . .
1 1 2 3 4 4 5 6 8 9 10 13
2 Existing Methods to Evaluate Pacemaker Device Performance . 2.1 Algorithmic Structures of Different ECG Detection and Data Compression Techniques . . . . . . . . . . . . . . . . . . . . . . . . . . . 2.2 Databases to Benchmark ECG Detection Algorithm . . . . . . . 2.3 Evaluation and Comparison of ECG Detection and Data Compression Techniques . . . . . . . . . . . . . . . . . . . . . . . . . . . 2.4 Discussion: Challenges and Gaps . . . . . . . . . . . . . . . . . . . . 2.5 Summary . . . . . . . . . . . . . . . . . . . . . . . . . . . . . . . . . . . . . . References . . . . . . . . . . . . . . . . . . . . . . . . . . . . . . . . . . . . . . . . .
....
15
.... ....
15 31
. . . .
. . . .
32 37 41 42
... ...
49 51
...
51
...
55
3 ECG Signal Denoising Techniques for Cardiac Pacemaker Systems . . . . . . . . . . . . . . . . . . . . . . . . . . . . . . . . . . . . . . . . . . . . 3.1 ECG Signal Denoising . . . . . . . . . . . . . . . . . . . . . . . . . . . . . 3.1.1 Criterion to Select Wavelet Transform for ECG Signal Analysis . . . . . . . . . . . . . . . . . . . . . . . . . . . . . . . . . . 3.1.2 Criterion for Selecting Wavelet Filter Bank Architecture . . . . . . . . . . . . . . . . . . . . . . . . . . . . . . . .
. . . . . . . . . . . .
. . . .
. . . . . . . . . . . .
. . . .
xiii
xiv
Contents
3.1.3 Simulation Results and Performance Evaluation of the Proposed Modified 3.1 Wavelet Transform-Based Wavelet Filter Bank . . . . . . . . . . . . . . . . . . . . . . . . . . . 3.2 Demand-Based Wavelet Filter Bank . . . . . . . . . . . . . . . . . . . . 3.2.1 Criterion to Select Wavelet Decomposition Level . . . . . 3.2.2 Wavelet Thresholding Techniques . . . . . . . . . . . . . . . . 3.2.3 Simulation Results and Performance Evaluation of the Proposed Demand-Based Wavelet Filter Bank . . . 3.3 Summary . . . . . . . . . . . . . . . . . . . . . . . . . . . . . . . . . . . . . . . . References . . . . . . . . . . . . . . . . . . . . . . . . . . . . . . . . . . . . . . . . . . . 4 ECG Signal Detection and Lossless Data Compression Techniques for Implantable Cardiac Pacemaker Systems . . . . . . . . . . . . . . . . 4.1 ECG Signal Detection . . . . . . . . . . . . . . . . . . . . . . . . . . . . . . . 4.1.1 Simulation Results and Performance Evaluation of the Proposed Soft-Thresholding-Based QRS-Complex Detection Technique . . . . . . . . . . . . . . . 4.1.2 Dynamic Dual Thresholding-Based ECG Signal Detection . . . . . . . . . . . . . . . . . . . . . . . . . . . . . . . . . . 4.1.3 Simulation Results and Performance Evaluation of the Proposed Dynamic Dual Thresholding-Based ECG Signal Detection Technique . . . . . . . . . . . . . . . . . 4.1.4 Adaptive Thresholding-Based ECG Signal Detection Technique . . . . . . . . . . . . . . . . . . . . . . . . . . . . . . . . . . 4.1.5 Simulation Results and Performance Evaluation of the Proposed Adaptive Thresholding-Based ECG Signal Detection Technique . . . . . . . . . . . . . . . . . 4.2 Lossless Data Compression . . . . . . . . . . . . . . . . . . . . . . . . . . . 4.2.1 Simulation Results and Performance Evaluation of the Proposed RLE-Based Lossless Data Compression Technique . . . . . . . . . . . . . . . . . . . . . . . . 4.2.2 LZMA-Based Lossless Data Compression Technique . . . 4.2.3 Simulation Results and Performance Evaluation of the Proposed LZMA Lossless ECG Data Compression Technique . . . . . . . . . . . . . . . . . . . . . . . . 4.2.4 Biorthogonal 3.1 Wavelet Transform-Based Lossless ECG Data Compression Technique . . . . . . . . . . . . . . . . 4.2.5 Simulation Results and Performance Evaluation of the Proposed Biorthogonal 3.1 Wavelet Transform-Based Lossless ECG Data Compression Technique . . . . . . . . . 4.3 Three-Tap Wavelet Filter Bank-Based Lossless ECG Data Compression Technique . . . . . . . . . . . . . . . . . . . . . . . . . . . . . 4.3.1 Simulation Results and Performance Evaluation of the Proposed Three-Tap Wavelet Filter Bank Based on Lossless ECG Data Compression Technique . . . . . . .
. . . .
56 68 72 72
.. .. ..
73 74 77
.. ..
79 80
..
81
..
86
..
88
..
90
.. ..
92 96
.. ..
97 97
..
99
. . . .
. . 100
. . 102 . . 104
. . 106
Contents
xv
4.4 Summary . . . . . . . . . . . . . . . . . . . . . . . . . . . . . . . . . . . . . . . . . . 106 References . . . . . . . . . . . . . . . . . . . . . . . . . . . . . . . . . . . . . . . . . . . . . 108 5 FPGA Implementation of Combined ECG Signal Denoising, Peak Detection Technique for Cardiac Pacemaker Systems . . . . . . . . . 5.1 FPGA Implementation of an ECG Signal Detection Technique . . . . . . . . . . . . . . . . . . . . . . . . . . . . . . . . . . . . . . . 5.2 Selection of Wavelet Transform . . . . . . . . . . . . . . . . . . . . . . . 5.2.1 Energy and Shannon Entropy . . . . . . . . . . . . . . . . . . . . 5.2.2 Mutual Information and Relative Entropy . . . . . . . . . . . 5.2.3 Cross-Correlation . . . . . . . . . . . . . . . . . . . . . . . . . . . . . 5.2.4 Minimum Description Length (MDL) . . . . . . . . . . . . . . 5.3 Selection of Wavelet Filter Bank Architecture . . . . . . . . . . . . . 5.4 ECG Signal Detection . . . . . . . . . . . . . . . . . . . . . . . . . . . . . . . 5.5 Simulation Results . . . . . . . . . . . . . . . . . . . . . . . . . . . . . . . . . 5.5.1 Input ECG Data . . . . . . . . . . . . . . . . . . . . . . . . . . . . . 5.5.2 ECG Signal Denoising . . . . . . . . . . . . . . . . . . . . . . . . . 5.5.3 ECG Signal Detection . . . . . . . . . . . . . . . . . . . . . . . . . 5.6 Implementation of the ECG Signal Detector on FPGA . . . . . . . 5.7 Summary . . . . . . . . . . . . . . . . . . . . . . . . . . . . . . . . . . . . . . . . References . . . . . . . . . . . . . . . . . . . . . . . . . . . . . . . . . . . . . . . . . . .
. . . . . . . . . . . . . . .
. . . . . . . . . . . . . . .
113 114 115 115 116 116 117 119 120 120 120 124 124 127 127
6 Digital ECG Signal Watermarking and Compression . . . . . 6.1 Basics of ECG Signal Watermarking and Compression . . 6.2 ECG Signal Watermarking and Compression Technique . 6.3 Performance Results . . . . . . . . . . . . . . . . . . . . . . . . . . . 6.4 Discussion . . . . . . . . . . . . . . . . . . . . . . . . . . . . . . . . . . 6.5 Summary . . . . . . . . . . . . . . . . . . . . . . . . . . . . . . . . . . . References . . . . . . . . . . . . . . . . . . . . . . . . . . . . . . . . . . . . . .
. . . . . . .
. . . . . . .
131 131 134 137 141 145 145
7 Basic Formation on Wavelet Transforms . . . . . . . . . . . . 7.1 Wavelet Families, Coefficients and Their Shapes . . . . 7.2 Introduction to Wavelet Toolbox . . . . . . . . . . . . . . . . 7.2.1 Basic Introduction to Wavelet Families Using MATLAB® . . . . . . . . . . . . . . . . . . . . . . . . . . 7.2.2 ECG Signal Analysis Using Wavelet Toolbox . References . . . . . . . . . . . . . . . . . . . . . . . . . . . . . . . . . . . .
. . . . . . .
. . . . . . .
. . . . . . .
. . . . . . .
. . . . . . .
. . 111
. . . . . . . . . 147 . . . . . . . . . 148 . . . . . . . . . 178 . . . . . . . . . 178 . . . . . . . . . 178 . . . . . . . . . 187
8 Conclusion and Future Work . . . . . . . . . . . . . . . . . . . . . . . . . . . . . . 189 Annexure A . . . . . . . . . . . . . . . . . . . . . . . . . . . . . . . . . . . . . . . . . . . . . . . . . 191 Annexure B . . . . . . . . . . . . . . . . . . . . . . . . . . . . . . . . . . . . . . . . . . . . . . . . . 193
About the Authors
Ashish Kumar received the B.Tech. degree in Electronics and Communication Engineering from Kurukshetra University, India, in 2012, the M.Tech. degree in VLSI Design from Galgotias University, Uttar Pradesh, India, in 2015, and the Ph.D. degree from the Department of Electronics and Communication Engineering, Bennett University, Greater Noida, India, in 2020. Since 2020, he has been an Assistant Professor in the School of Electronics Engineering, Vellore Institute of Technology, Chennai, India. He authored many research articles in reputed international journals and conferences. His research interests include biomedical systems design, signal analysis, healthcare assistive techniques, and low-power biomedical system design. Manjeet Kumar received a B.Tech degree in Electronics and Telecommunication Engineering from Kurukshetra University, Kurukshetra, India, in 2008, an M.Tech. degree in Signal Processing from Guru Gobind Singh Indraprastha University, Delhi, India, in 2011, and a Ph.D. degree from the Department of Electronics and Communication Engineering, Netaji Subhas Institute of Technology (NSIT) Delhi, affiliated to University of Delhi, India, in 2017. He served as Assistant Professor in the Department of Electronics and Communication Engineering, Bennett University, Greater Noida, from June 2016 to July 2020. From July 2020, he is working as Assistant Professor in the Electronics and Communication Engineering department at Delhi Technological University, Delhi. He has authored over thirty-five research articles and twenty conference papers in reputed international journals and conferences. He also served as a reviewer in many International Journals. His research interests include Signal Processing, Biomedical Signal Processing, the Internet of Medical Things, Image Processing, Fractional Systems, Optimization Algorithms, and Artificial Intelligence in Healthcare. He was awarded the “Commendable Research Award” in 2021 by Delhi Technological University, Delhi, India. His last five-year citations are 1071 with h-index 21 and i-10-index 33.
xvii
xviii
About the Authors
Rama S. Komaragiri received a Ph.D. from the Department of Electrical Engineering and Information Technology, TU Darmstadt, Germany, in 2006. From 2006 to 2009, he worked as a System Expert at Qimonda Technologies GmbH, Dresden, Germany. From 2009 to 2016, he was with the Department of Electronics and Communication Engineering, NIT Calicut, where he has been an Associate Professor since 2012. Since 2016, he has been a Professor and Head of the Department of Electronics and Communication Engineering at Bennett University, India. His research interests include biomedical systems, MEMS/NEMS sensors, semiconductor device modeling and simulation, and low-power CMOS VLSI circuit design.
Chapter 1
Introduction
Abstract A cardiac pacemaker is a device that treats cardiac dysrhythmia by rapidly tracking the heart rate and rhythm of a subject. Cardiac pacemakers deliver rhythmic electric stimulus in a controlled manner to the heart to maintain the heartbeat. The ability to deliver a periodic and administrated electric stimulus made the implantable and wearable cardiac pacemakers a reality in today’s globally emerging world of healthcare devices. Different researchers have not only made the heavy pacemakers undergo a physical change in terms of reduction in size and weight but also economical and within reach to many, thus being a lifesaver. A discussion on the functionality of the human heart through its electrical activity is presented in this chapter. Also, the characteristics and parameters of a typical ECG signal and various noises that corrupt an ECG signal are discussed. Keywords Cardiac pacemaker · Human heart · Electrocardiogram · Cardiovascular system · Sino-atrial (SA) node · Atrioventricular (AV) node · Noises
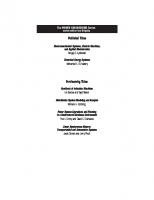
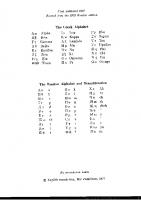
1.1 Development of Implantable Cardiac Pacemaker System John Hopps and Wilfred Bigelow developed the first cardiac pacemaker in 1950. The ability to deliver a periodic and administrated electric stimulus has made implantable and wearable cardiac pacemakers a reality in today’s globally emerging world of healthcare devices. Different researches advanced the yesteryear pacemakers by reducing the size and weight and making them economical and within reach of many, thus making the pacemaker a lifesaver. Miniaturization of transistors and increasing circuit density resulted in a significant improvement in pacemakers. The evolution of the pacemaker system is shown in Fig. 1.1 (Mulpuru et al. 2017). A cardiac pacemaker is a device that tracks human heart rhythm and heart rate to treat cardiac dysrhythmia. Cardiac pacemakers provide an electrical stimulus in a controlled manner to the heart to maintain the pace of the heart. The market share of pacemaker products is increasing rapidly and is estimated to expand at a compound annual growth rate of 3.4% from 2020 to 2030, as shown in © The Author(s), under exclusive license to Springer Nature Singapore Pte Ltd. 2023 A. Kumar et al., High Performance and Power Efficient Electrocardiogram Detectors, Energy Systems in Electrical Engineering, https://doi.org/10.1007/978-981-19-5303-3_1
1
2
1 Introduction
Fig. 1.1 Historical overview and evolution of cardiac pacemakers
Fig. 1.2 Market share of leading pacemaker products
Fig. 1.2 (CNBC.com). Nowadays, pacemakers are efficient, miniature, lightweight, programmable, and energy-efficient. Miniaturization results from the new archetype of these implantable/wearable devices with higher circuit density. The advent of modern technological breakthroughs and inventions has left behind all the lacunas like single-chamber, asynchronous, non-programmable pacing. Pacemakers are versatile and can be implanted in a physician’s office to make the therapy unique to human needs.
1.2 Need and Motivation The heart is a vital organ in the human body, and it is an undeniable fact that one needs a healthy heart. The structure and working of a human heart are very complex. Millions of patients use personal medical devices which can analyze health conditions. Personal medical devices collect medical data, which is then transmitted to medical personnel to provide necessary medical care. One such personal medical device is a cardiac pacemaker. A pacemaker is an artificial heart implanted into
1.3 Identifying the Research Problem
3
a subject’s body. This device usually detects and monitors the heartbeat of a subject. Necessary care is provided to the patient on receiving abnormal signals from the pacemaker. In this way, a pacemaker helps maintain a person’s heart beating rate in a safe range. Once the pacemaker is implanted into a human body, the pacemaker is expected to operate for several years without any maintenance, like replacing the battery (Sanders and Lee 1996). The challenge here is developing a self-effacing, patient-friendly electrocardiogram (ECG) device to monitor ECG data continuously. The next level challenge for such devices is low weight, tiny with an extended battery life (or better, an energy harvesting device), requiring substantial hardware integration and performing complex mathematical analysis on signals and data.
1.3 Identifying the Research Problem Medical expenditures are increasing rapidly with the fast growth in the world population. In Europe, one-third of the people will be over sixty-five years by 2035. China and India are the other countries facing the fastest-growing aging problem. Over onethird of the world’s elderly population lives in China and India, and this proportion is envisaged to be beyond 40% by 2030 (Poon et al. 2011). Healthcare has become an indispensable agenda for both individuals and governments. The World Health Organization’s latest reports purport that dealing with the aging population is necessary (Aging-WHO, World Health Statistics 2017). The present healthcare systems are facing more significant challenges while handling the healthcare problems of the aging population. Accordingly, spotting human diseases in a cost-effective, welltimed, and precise fashion has taken center stage (Banerjee and Gupta 2015, Zhang et al. 2017a, b, Zhang et al. 2017a, b, and Yang et al. 2016). Electrocardiogram (ECG) monitoring thus became a norm because of its supremacy in diagnosing heart-related diseases and making its way into the health sector through research (Zou et al. 2015). The present medical fraternities still use conventional ECG equipment with multiple electrodes for ECG data acquisition. The conventional ECG equipment has twelve electrodes and suffers from efficient handling capabilities. As the equipment has portability limitations, the subject’s activities are measured only during data collection, thus making continuous patient monitoring tedious. The standard ECG acquisition devices are expensive and need an experienced medical practitioner to acquire data from a subject, limiting home use and increasing the frequency of hospital visits. Frequent visits to a medical facility have severe limitations like irregular health monitoring, increased discomfort and burden on the medical facility, and causes physical hardship to the subjects. Hence, a simple, portable, reliable, and long-term ECG signal monitoring system is required (Liu et al. 2011). Many long-term ECG signal monitoring approaches have been proposed during the last few decades. An ECG signal monitoring system based on system-on-chip is discussed in (Buxi et al. 2012) requires significant power and hardware resources as it transmits raw ECG data. Hence, a joint strategy for ECG signal denoising, ECG detection, and data compression is required.
4
1 Introduction
1.4 Introduction to Electrocardiography Human life is changing rapidly due to fast industrial and economic growth, affecting the nervous system and sentiments of human behavior. The most common effects of lifestyle change are increased cardiac diseases, one of the major causes of human deaths in developing countries in the past two decades. The human heart is a vital organ that circulates blood throughout the body. Numerous diseases related to the heart have various causes, but all can be diagnosed by observing and conjecturing ECG. In this chapter, to understand the functionality of a human heart, its structure and functionality are first discussed. Then the electrical equivalence of the heart functionality during a heartbeat, a cardiac pacemaker with its structure, and ECG characteristics are discussed.
1.4.1 Basic Introduction to Heart The cardiovascular system generally consists of three interrelated components: heart, blood, and blood vessels. The cardiovascular system, also known as the circulatory system, is the body’s blood transportation system. The heart, blood vessels, and blood are the primary structures that make this possible. The heart pumps the blood to move nutrients through the blood vessels to nourish and remove the body’s metabolic wastes. The heart has two pathways: the pulmonary and systemic pathways. These pathways form a closed circulatory system. A human heart is an involuntary muscular organ that works somewhat independently from the nervous system. A human heart has four hollow chambers. The blood is oxygenated by the lungs when the right side of the heart pushes blood into the pulmonary circuit. The left side of the heart then pumps the oxygenated blood into the body. The circulated blood then returns to the heart through the systemic pathway. A human heart is shown in Fig. 1.3, consisting of two atria: the upper chambers, two ventricles, and the lower chambers. The left and right sides are divided by the septum. The human heart comprises three layers of tissues: the endocardium, myocardium, and pericardium. The conductive pathway in a heart has four main stations through which the heart senses electrical impulses and directs the heart to keep beating. The four components of the conductive pathway are the sino-atrial (SA) node, atrioventricular (AV) node, the bundle of HIS, and the Purkinje fibers. SA node, also known as the pacemaker, is located in the right atria. SA node initiates an electrical stimulus and passes it onto the next relay station. The AV node is located between the right atria and the right ventricle on the back wall of the heart. The electrical signal is then transmitted to the next relay station, the bundle of HIS, located in the heart’s septum. The Purkinje fibers spread the electrical charge throughout the myocardium, generally referred to as the cardiac muscle, and cause the heart to contract; atrias first, then the ventricles.
1.4 Introduction to Electrocardiography
5
Fig. 1.3 Internal structure of a human heart
1.4.2 Functions of the Human Heart Atria and ventricles contract in a steady rhythm known as the heartbeat. In one cycle, represented by a heartbeat, blood from tissues and lungs flows into the atrias and then into the ventricles. Valves inside the heart are called the interatrial septum. The interventricular septum helps keep the blood on the left and right sides from mixing. Two valves between the atrias and ventricles prevent backward blood flow into the atria. The tricuspid valve opens into the right ventricle, and the bicuspid valve opens into the left ventricle. Strong and thin tissues called chordae tendineae hold the valves in place during the forceful contraction of the ventricles. Blood leaving the ventricles passes through two valves known as the pulmonary and aortic valves. Heart muscles called myocardium are arranged in a unique pattern to pump blood more efficiently. Three layers of myocardium wrap around the lower part of the heart, twisting and tightening in different directions to push blood through the heart. When special cells called pacemaker cells generate electrical signals inside the heart, the heart muscle cells called myocytes contract as a group. The right half and left half of the heart are analogus to a dual pump system. On the right side of the heart, deoxygenated blood from the body’s tissues flows into the right atrium through large veins called superior and inferior vena cava. The blood moves then into the right ventricle, which contracts and sends blood out of the heart to the lungs together with oxygen and gets rid of carbon dioxide. On the left side of the heart, oxygen-rich blood from the lungs flows into the left atrium through the pulmonary veins. The blood then moves into the left ventricle, which contracts and sends blood out of the heart to feed the cells and tissues through the aorta. The first branches of the aorta are the coronary arteries, which supply the heart
6
1 Introduction
muscle with oxygen and nutrients. Arteries that branch from the middle and lower parts of the aorta supply blood to the rest of the body (Maynard 1960).
1.4.3 Overview of Implantable Cardiac Pacemaker System A cardiac pacemaker is a valuable device in treating cardiac dysrhythmia by rapidly tracking a human heart’s heart rate and rhythm. A cardiac pacemaker delivers rhythmic electric signals in a controlled manner to the heart to maintain the heartbeat. The main components in a pacemaker system are (Wong et al. 2004): pacing leads and a pacemaker device, as shown in Fig. 1.4. The pacing lead is a flexible insulated electrical connector that connects the human heart and a pacemaker device. An electrode tip, electrode, conductor, and insulation are four major components in a pacing lead. A typical pacing lead is shown in Fig. 1.5. The electrode tip is inserted into the heart through a vein. The electrode tip and the electrode are used to exchange information between the heart and pacemaker to access the heart’s health condition. The electrode also carries impulses between the pacemaker device and the heart. A conductor coil delivers pacing pulses to the heart, and an insulator isolates the conductor from the heart walls. A pacemaker device is the decision-making device in a cardiac pacemaker. Singlechamber pacemakers, dual-chamber pacemakers, and Biventricular pacemakers are the different types of pacemakers available today, as shown in Fig. 1.6 (Kruse and
Fig. 1.4 Cardiac pacemaker system
Fig. 1.5 Basic components of a pacemaker’s pacing lead
1.4 Introduction to Electrocardiography
7
Fig. 1.6 Different types of implantable cardiac pacemakers
Redmond 2012). A single-chamber pacemaker has one lead positioned into the atria or ventricle, most commonly found in patients with sinus node disease. In a dual-chamber pacemaker, one lead is placed in the right atria and right ventricle. Patients with a heart block most commonly use dual dual-chamber pacemakers. Biventricular pacemakers have three leads positioned into the right ventricle, left ventricle, and left atria. Biventricular pacemakers are most common in subjects with heart failure. The main components of a pacemaker device, as shown in Fig. 1.7, are an integrated circuit and battery. The integrated circuit contains all the necessary circuitry required to operate the device, track the heart rate, and deliver rhythmic electric signals on demand (Stotts et al. 1989). The integrated circuit mainly contains an ECG detector, a counter, a comparator, and a pulse generator. The block diagram of a typical cardiac pacemaker circuit is shown in Fig. 1.8. Fig. 1.7 Pacemaker device with its main components
8
1 Introduction
Fig. 1.8 Block diagram of a cardiac pacemaker
1.4.4 Electrocardiogram Signal Characteristics The conduction system of a heart controls the generation and propagation of electrical signals or action potentials that cause the heart muscles to contract to pump blood. The electrical activity of a heart is measured by placing electrodes at specific points on the skin from which a compost recording is produced in the form of a graph. This recording is known as an electrocardiogram or, most famously, ECG. A tracing of the electrical activity of a heart resulting from the propagation of many action potentials is shown in Fig. 1.9 (Chan-Dewar 2012). In a healthy heart, each beat starts in the right atrium with an action potential signal from the SA node, also known as the heart’s natural pacemaker. The signal spreads across both atria, causing the muscles to depolarize and contract. On the ECG, the atrial depolarization is represented by the P-wave. The period of conduction that follows atrial systole and precedes ventricle contraction is depicted on the ECG by the PR segment, a flat line that follows the P-wave. When the signal leaves the atria, it enters the ventricle via the atrial ventricular (AV) node located in the interatrial septum. The signal then enters the bundle of HIS and spreads through the bundle branches and the Purkinje fibers along the ventricle walls. As the signal spreads through the ventricles, the contractile fibers depolarize and contract rapidly, including ventricle systole. The QRS-complex in an ECG signal represents rapid ventricular depolarization. Atrial repolarization also co-occurs, but the QRS-complex conceals any atrial activity. Finally, as the signal passes through the ventricles, the ventricular wall starts to relax and recover, a state described as ventricular diastole. The dome shape T-wave on the ECG marks the ventricular repolarization. On the ECG, the ST-segment depicts the period when the ventricles are depolarized. The QT-interval represents the time taken by the heart to depolarize and repolarize the ventricles. The sequence of events described above and the associated ECG trace repeat every heartbeat.
1.4 Introduction to Electrocardiography
9
Fig. 1.9 Generation of ECG wave during a cardiac cycle
1.4.5 Parameters of ECG Signal The cardiac cycle refers to the electrical and mechanical events generated in every heartbeat. Each ECG representation of the cardiac cycle consists of waves, segments, and intervals, as shown in Fig. 1.10. There can be six waves on an ECG: P-wave, Q-wave, R-wave, S-wave, T-wave, and sometimes U-wave. All these six waves appear with positive and negative deflections. Segments are the flat isoelectric lines between the waves. Intervals include both waves and segments. ECG paper is divided into large squares that are 5 mm wide and further divided into smaller squares that are 1 mm wide. A standard ECG is recorded at a speed of 25 mm/s. The vertical axis of an ECG measures the heart’s electrical activity’s amplitude, whereas the horizontal axis measures time. P-wave of an ECG corresponds to atrial depolarization and is best observed in lead II and lead V 1. The P-wave duration ranges from 0.06 to 0.10 s, and the amplitude is less
Fig. 1.10 Graphical representation of a typical ECG signal
10
1 Introduction
than 0.25 mV. A QRS-complex represents ventricular contraction. A QRS-complex consists of Q-wave, R-wave, and S-wave. A Q-wave represents the depolarization of the interventricular septum. A Q-wave is the first negative deflection after the P-wave. The Q-wave duration is less than 0.04 s, and the amplitude of the Q-wave is less than 20% of the corresponding R-wave amplitude in leads III, AVF, V 5, and V 6. Q-wave usually is absent in leads V 1 to V 4. R-wave corresponds to the depolarization of the apex and lateral walls of the ventricles. R-wave is the first positive deflection after P-wave. S-wave corresponds to the depolarization of the base of the ventricle. S-wave is the second negative deflection of the QRS-complex or the first negative deflection after the R-wave. R-wave duration ranges from 0.08 to 0.12 s and the amplitude ranges from 1–1.5 mV. The R-wave amplitude in leads V 1 and V 2 are smaller than the S-wave amplitude. When an ECG record is observed using leads V 3 and V 4, the amplitude of an R-wave is almost equal to that of an S-wave. In the leads, V 5 and V 6, the amplitude of the R-wave is greater than the amplitude of the S-wave. T-wave corresponds to ventricular repolarization. A T-wave is an asymmetrical wave. The T-wave duration ranges between 0.13 and 0.30 s, and the amplitude is less than one-third of the corresponding QRS-complex. U-wave is seldom found in a normal ECG and corresponds to the repolarization of the papillary muscle and repolarization of the Purkinje fibers. The amplitude of the U-wave is less than one-quarter of the corresponding T-wave. U-wave is best observed when the heart rate decreases in hypokalemia and needs to be observed using leads V 1 and V 2. The two segments of significant importance in an ECG are the PQ-segment and ST-segment. The PQ-segment duration ranges from 0.06 to 0.10 s, and the duration of the ST-segment ranges from 0.05 to 0.15 s. There are four intervals on an ECG: PR-interval, ST-interval, QT-interval, and RR-interval. PR-interval corresponds to atrioventricular conduction and extends from the beginning of the P-wave until the beginning of the QRS-complex. PR-interval typically ranges from 0.12 to 0.20 s. The PR-interval gets prolonged with atrioventricular blocks and is shortened in wolf Parkinson’s white syndrome. ST-interval extends from the beginning of the ST-segment till the end of the T-wave. Characteristic patterns appear in ischemic heart disease. The QT complex represents ventricular depolarization and repolarization. The duration of a QT-interval extends from the beginning of the QRS-complex to the end of the T-wave. The typical duration of QT-interval ranges between 0.35 and 0.45 s. RR-interval is between successive R-waves of the QRS-complexes used for heart rate calculation (alilamedicalmedia.com). Different parameters of the average ECG signal are shown in Table 1.1.
1.4.6 Common Noises in an ECG Signal Like any other electric signal, the ECG signals are contaminated by various noises. Before processing an ECG signal, all noises need to be filtered. The most significant noises that corrupt an ECG signal are (Friesen et al. 1990):
1.4 Introduction to Electrocardiography
11
Table 1.1 Characteristics of a typical ECG signal ECG parameter Normal duration Normal amplitude
Remarks
P-wave
110 ± 20 ms
0.25 ± 0.05 mV
Increment and decrement in amplitude indicate hypokalemia and hyperkalemia, respectively
QRS-complex
100 ± 20 ms
1.60 ± 0.5 mV
An increment in amplitude indicates cardiac hypertrophy
R-wave
–
1.60 ± 0.5 mV
–
Q-wave
–
0.25 times that of the R-wave –
T-wave
–
0.5 mV
Indicates the possibility of a myocardial infraction
PR-interval
120–200 ms
–
Time is taken by the electrical signal to travel from the atria to the ventricle
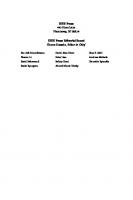
1. Power line interference: noise arises due to the interference from the 50-60 Hz power line with the ECG signal. Power line interference introduces a signal with almost a constant amplitude at the powerline frequency. The frequency of the powerline is country-specific, which is 50 or 60 Hz. The effect of power line interference on an ECG signal is shown in Fig. 1.11a. 2. Electrode contact noise: an improper contact between the electrode and skin introduces electrode contact noise. As shown in Fig. 1.11b, electrode contact noise is characterized by a baseline shift in the ECG signal. 3. Motion artifact: motion artifact is a type of noise caused by the patient’s physical movement, which can introduce a baseline shift in the ECG signal as large as 500% of the peak-to-peak of the ECG signal. The effect of motion artifact on ECG signal is shown in Fig. 1.11c. 4. Muscle contraction: the motion of muscles in contractions and expansions introduces noise in a frequency range of 0 Hz to 10 kHz to the ECG signal. Figure 1.11d shows that muscle contraction introduces frequency distortion to an ECG signal. 5. Baseline drift: baseline drift is a form of noise that occurs primarily due to the respiration of a subject resulting in an addition of 0.15–0.3 Hz frequency components to the ECG signal. The effect of baseline drift on an ECG signal is shown in Fig. 1.11e. 6. Instrumentation noise: due to the ECG signal’s electrical nature, it is prone to noise due to interference from other electronic devices due to improper shielded equipment. An ECG signal corrupted with instrumentation noise is shown in Fig. 1.11f.
12
1 Introduction
Fig. 1.11 Typical noise effect examples, a power line interference, b electrode contact noise, c motion artifacts, d muscle contraction, e baseline drift, f instrumentation noise, and g electrosurgical noise
References
13
Fig. 1.11 (continued)
7. Electrosurgical noise: noise introduces a sinusoid of frequency in the range 100 kHz to 1 MHz with an amplitude of almost 200% peak-to-peak amplitude of the ECG signal. As shown in Fig. 1.11g, electrosurgical noise completely distorts the features of an ECG signal.
References Aging. In: World Health Organization. http://www.who.int/topics/ageing/en/,2016 Available https://www.cnbc.com/2018/03/29/spinal-cord-stimulation-market-grows-as-way-totreat-chronic-pain.html. Last accessed on 14th Jan 2022. Available https://www.alilamedicalmedia.com/. Last accessed on 14th Jan 2022 Banerjee A, Gupta SK (2015) Analysis of smart mobile applications for healthcare under dynamic context changes. IEEE Trans Mob Comput 14(5):904–919 Buxi D, Berset T, Hijdra M, Tutelaers M, Geng D, Hulzink J, van Noorloos M, Romero I, Torfs T, van Helleputte N (2012) Wireless 3-lead ECG system with on-board digital signal processing for ambulatory monitoring. In: Biomedical circuits and systems conference (BioCAS), 2012 IEEE. IEEE, pp 308–311 Chan-Dewar F (2012) The cardiac cycle. Anaesth Intensive Care Med 13(8):391–396 Friesen GM, Jannett TC, Jadallah MA, Yates SL, Quint SR, Nagle HT (1990) A comparison of the noise sensitivity of nine QRS detection algorithms. IEEE Trans Biomed Eng 37(1):85–98 Kruse J, Redmond C (2012) Detecting and distinguishing cardiac pacing artifacts. Analog Dialogue 46(11):1–6 Liu X, Zheng Y, Phyu MW, Zhao B, Je M, Yuan X (2011) Multiple functional ECG signal is processing for wearable applications of long-term cardiac monitoring. IEEE Trans Biomed Eng 58(2):380–389 Maynard DM (1960) Circulation and heart function. The Physiol Crust 1:161–226
14
1 Introduction
Mulpuru SK, Madhavan M, McLeod CJ, Cha YM, Friedman PA (2017) Cardiac pacemakers: function, troubleshooting, and management: part 1 of a 2-part series. J Am Coll Cardiol 69(2):189– 210 Poon CC, Liu Q, Gao H, Lin WH, Zhang YT (2011) Wearable intelligent systems for e-health. J Comput Sci Eng 5(3):246–256 Sanders RS, Lee MT (1996) Implantable pacemakers. Proc IEEE 84(3):480–486 Stotts LJ, Infinger KR, Babka J, Genzer D (1989) An 8-bit microcomputer with analog subsystems for implantable biomedical application. IEEE J Solid-State Circuits 24(2):292–300 World Health Statistics (2017) World Health Organization, Geneva, Switzerland Wong LS, Hossain S, Ta A, Edvinsson J, Rivas DH, Naas H (2004) A very low-power CMOS mixedsignal IC for implantable pacemaker applications. IEEE J Solid-State Circuits 39(12):2446–2456 Yang Z, Zhou Q, Lei L, Zheng K, Xiang W (2016) An IoT-cloud based wearable ECG monitoring system for smart healthcare. J Med Syst 40(12):286 Zhang Y, Qiu M, Tsai CW, Hassan MM, Alamri A (2017a) Health-CPS: healthcare cyber-physical system assisted by cloud and big data. IEEE Syst J 11(1):88–95 Zhang Y, Chen M, Huang D, Wu D, Li Y (2017b) iDoctor: Personalized and professionalized medical recommendations based on hybrid matrix factorization. Futur Gener Comput Syst 66:30–35 Zou Y, Han J, Xuan S, Huang S, Weng X, Fang D, Zeng X (2015) An energy-efficient design for ECG recording and R-peak detection based on wavelet transform. IEEE Trans Circuits Syst II Express Briefs 62(2):119–123
Chapter 2
Existing Methods to Evaluate Pacemaker Device Performance
Abstract With the alarming rise in deaths due to cardiovascular diseases (CVD), the present medical research scenario emphasizes techniques and methods to detect CVDs. As the world health organization adduced, technological proceeds in cardiac function assessment have become the nucleus and heart of all leading research studies on CVDs. Electrocardiogram (ECG) analysis is the most functional and convenient tool used to test the range of heart-related irregularities. Most of the approaches present in the literature on ECG signal analysis consider noise removal, rhythm-based analysis, and heartbeat detection to improve the performance of a cardiac pacemaker. Advancements in ECG segment detection and beat classification have a limited evaluation and still require clinical approvals. This chapter discusses approaches and techniques to implement an on-chip ECG detector for a cardiac pacemaker system. Moreover, different challenges regarding the ECG signal morphology analysis deriving from the medical literature are extensively reviewed. Keywords Cardiovascular diseases · Electrocardiogram · Cardiac pacemaker · ECG signal · QRS-complex · ECG databases Recent developments in health monitoring and assisting technologies like cardiac pacemakers have paved a path for less complex and cost-effective implantation practices and procedures. A prolonged battery usage, enhanced device care, security, and better and more reliable clinical results and conclusions have made these devices dependable. The present study reviews such enriching contributions and innovative studies done recently and in the past.
2.1 Algorithmic Structures of Different ECG Detection and Data Compression Techniques In the last few decades, rapid growth in cardiac pacemakers can be attributed to biomedical signal processing algorithms and CMOS IC design. The circuit design efforts of biomedical CMOS ICs paved the path to implementing complex signal analytical algorithms to detect ECG signal features more accurately. Various © The Author(s), under exclusive license to Springer Nature Singapore Pte Ltd. 2023 A. Kumar et al., High Performance and Power Efficient Electrocardiogram Detectors, Energy Systems in Electrical Engineering, https://doi.org/10.1007/978-981-19-5303-3_2
15
16
2 Existing Methods to Evaluate Pacemaker Device Performance
approaches in the literature presented methods to increase the accuracy of wave detection, strategies to increase the efficiency of the wave detection algorithms, and reduce the effect of various noises present in an ECG signal. Pan et al. (1985) developed the first real-time QRS-complex detection algorithm based on time-domain analysis of an ECG signal. ECG signals from the Massachusetts Institute of Technology and Boston’s Beth Israel Hospital (MIT-BIH) arrhythmia database are used as input signals (Moody and Mark 1990). ECG signals are denoised using bandpass filters. The bandpass filters are realized by cascading lowpass and highpass filters. The fiducial points, P-wave, QRS-complex, and Twave, are detected by finding the maximum value of the square of the slope of the denoised signal. Using time-domain-based algorithms, extracting useful information from ECG signals by removing noises using a bandpass filter is inefficient as the bandpass filters degrade the detection accuracy. Approaches based on ECG morphology (Hu et al. 1993; Strintzis et al. 1992; Lee et al. 2013; Acharya et al. 2017; Kiranyaz et al. 2016), time-domain (Zhou et al. 2011), time-frequency domain (Li et al. 1995; Kadambe et al. 1999; Afonso et al. 1999; Dinh et al. 2001; Kumar et al. 2018a, b; Sharma et al. 2015; Sahambi et al. 1997; Tripathy and Dandapat 2017; Rakshit and Das 2017; Sharma et al. 2018; Milchevski and Gusev 2017; Ma et al. 2016; Sutha and Jayanthi 2018; Junior et al. 2016; Tzabazis et al. 2018; Zidelmal et al. 2012; Azmoudeh and Cvetkovic 2014), and genetic algorithm (Pławiak 2018; Vafaie et al. 2014; Pasolli and Melgani 2015; Kumaravel and Nithiyanandam 1998; Poli et al. 1995), adaptive filtering based techniques Chiarugi et al. (2007), Farhang-Boroujeny (2013), Sharma and Sunkaria (2018), are some ECG signal detection techniques that provide high detection accuracy. The morphology-based ECG signal detection methods use approaches based on artificial neural networks. Time-frequency domain-based ECG signal detection methods use wavelet transform, filter banks, and nonlinear transform approaches. Techniques like wavelet transform and genetic algorithms are used to improve ECG signal detection accuracy (Meyer et al. 2006; Yücelba¸s et al. 2018). Predominantly ECG signal detection uses techniques based on ECG signal enhancement (Vullings et al. 2011; Rhyne 1969; Martin-Clemente et al. 2011; Martinek et al. 2015) and pattern classification (Banerjee and Mitra 2014; Barro et al. 1998; Bono et al. 2014, Sannino and De Pietro 2018; Satija et al. 2018; Zhai and Tin 2018). An overview of some of these approaches is presented in Kohler et al. (2002), Elgendi et al. (2014), Kumar et al. (2018a, b). Various ECG detection algorithms are summarized in Table 2.1 (Kadambe et al. 1999). As shown in Table 2.1, ECG signal detection algorithms based on wavelet theory provide a high detection accuracy of 0.99 with a medium hardware complexity compared to other techniques. The wavelet transform-based ECG signal detection technique is considered one of the most efficient techniques (Kadambe et al. 1999) and further developed in this work. The proposed implementation of a cardiac pacemaker shown in Fig. 2.1a uses a wavelet decomposer (Rodrigues et al. 2005) and a wavelet-based QRS-complex detector. A QRS-complex detection block, which includes a generalized likelihood ratio test (GLRT) (Mallat 1989) and threshold function, is shown in Fig. 2.1b. The wavelet decomposer consists of a dyadic wavelet transform-based filter bank, as shown in Fig. 2.2 (Kay and Gebriel 2003), and a QRS detection block containing
2.1 Algorithmic Structures of Different ECG Detection …
17
Table 2.1 Comparison of different published ECG detection algorithms Method
Algorithm
Technique
Hardware complexity
Detection performance
Time-domain
Filtering
Bandpass filtering
Simple
0.96–0.98
Medium
0.95–0.97
Complex
0.99
Digital filtering Adaptive filtering Derivative-based
–
First derivative The first and second derivative
ECG morphology Time-frequency domain
Artificial neural network
Artificial neural network
Hilbert transform
Hilbert transform
Complex
0.95
Empirical mode decomposition
Empirical mode decomposition
Complex
0.95–0.98
Wavelet transform
Haar
Medium