Growth Dynamics of Conifer Tree Rings: Images of Past and Future Environments (Ecological Studies, 183) 3540260862, 9783540260868
Each tree ring contains an image of the time when the ring formed, projected onto the ring's size, structure, and c
127 115 13MB
English Pages 372 [362] Year 2005
Recommend Papers


- Author / Uploaded
- Eugene A. Vaganov
- Malcolm K. Hughes
- Alexander V. Shashkin
File loading please wait...
Citation preview
Ecological Studies, Vol. 183 Analysis and Synthesis
Edited by M.M. Caldwell, Logan, USA G. Heldmaier, Marburg, Germany R.B. Jackson, Durham, USA O.L. Lange, Würzburg, Germany H.A. Mooney, Stanford, USA E.-D. Schulze, Jena, Germany U. Sommer, Kiel, Germany
Ecological Studies Volumes published since 2001 are listed at the end of this book.
E.A. Vaganov M.K. Hughes A.V. Shashkin
Growth Dynamics of Conifer Tree Rings Images of Past and Future Environments
With 178 Figures and 22 Tables
1 23
Prof. Dr. Eugene A. Vaganov V.N. Sukachev Institute of Forest Russian Academy of Sciences Siberian Branch Academgorodok, Krasnoyarsk 660036, Russia Prof. Dr. Malcolm K. Hughes Laboratory of Tree-Ring Research University of Arizona W. Stadium #105 Tucson, AZ 85721, USA Dr. Alexander V. Shashkin V.N. Sukachev Institute of Forest Russian Academy of Sciences Siberian Branch Academgorodok, Krasnoyarsk 66036, Russia
ISSN 0070-8356 ISBN-10 3-540-26086-2 Springer Berlin Heidelberg New York ISBN-13 978-3-540-26086-8 Springer Berlin Heidelberg New York
This work is subject to copyright. All rights are reserved, whether the whole or part of the material is concerned, specifically the rights of translation, reprinting, reuse of illustrations, recitation, broadcasting, reproduction on microfilm or in any other way, and storage in data banks. Duplication of this publication or parts thereof is permitted only under the provisions of the German Copyright Law of September 9, 1965, in its current version, and permissions for use must always be obtained from Springer-Verlag. Violations are liable for prosecution under the German Copyright Law. Springer is a part of Springer Science+Business Media springeronline.com © Springer-Verlag Berlin Heidelberg 2006 Printed in Germany The use of general descriptive names, registered names, trademarks, etc. in this publication does not imply, even in the absence of a specific statement, that such names are exempt from the relevant protective laws and regulations and therefore free for general use. Editor: Dr. Dieter Czeschlik, Heidelberg, Germany Desk editor: Dr. Andrea Schlitzberger, Heidelberg, Germany Cover design: design & production GmbH, Heidelberg, Germany Typesetting and production: Friedmut Kröner, Heidelberg, Germany 31/3152 YK – 5 4 3 2 1 0 – Printed on acid free paper
Preface
This is an expanded, enhanced, and updated version of “Growth and Structure of Tree Rings of Conifers” by E.A. Vaganov and A. Shashkin, a book that was published in Russian. Since the publication in 1976 of Harold Fritts’ seminal work “Tree Rings and Climate”, there has been a massive growth in the application of the techniques of dendrochronology in a wide range of scientific fields. Work flowing directly from that of Fritts has recently been extremely prominent in the study of the climate of recent centuries on a global scale; and other applications of dendrochronologyy have made significant impacts on, for example, disturbance ecology. In several recent cases, dendrochronologists have detected, and sought to explain, marked changes in the climate control of tree-ring growth in recent decades on very large spatial scales. These changes have important consequences for the projection of the role of forests in the global carbon cycle in coming years. Although these applications have, from the beginning, been conducted on a rigorously quantitative basis and informed by an appreciation of the biology and ecology of the trees involved,they have been limited until the last few years by the almost complete lack of relevant process-based models.In this book,the reader is introduced to an attempt to fill this gap. This is not a text on tree biology, nor is it intended as a review of recent developments concerning the vascular cambium. Readers wishing to pursue these topics will find that a number of volumes in the “Springer Series in Wood Science” are of interest (Carlquist 2001; Larson 1994; Schweingruber 1993; Roberts et al. 1988). Basic ideas concerning the nature and environmental control of the process of tree-ring growth are introduced here, exclusively for conifers. This is, however, done only to the extent necessary to explain the development, testing, and application of the simulation models described in this book. The reader is introduced to one family of process-based models of the environmental control of tree-ring growth, whose most distinguishing features are an emphasis on cambial dynamics and the modeling of intra- and inter-annual variability in tree-ring growth.
VI
Preface
We have been greatly aided by numerous colleagues and institutions, both in the writing of the original Russian volume and in the development of this expanded and modified English language version. E.A.Vaganov is grateful for the generous support of the Alexander Von Humboldt Foundation, from which he received a research award in 2003, and to the Max-PlanckGesellschafts Institute for Biogeochemistry in Jena, Germany, where he held the award. He also acknowledges the generous support of the Ministry of Science and Education of the Russian Federation (grant 2108.2003.4, supporting scientific schools). M.K. Hughes acknowledges the support of the Laboratory of Tree-Ring Research, University of Arizona. Erena Mikhina, Olga Sidorova, and Anastasiya Zelenova worked long and hard on the preparation of the manuscript and its many figures, tables, and references; and we are greatly indebted to them. The members of the Spring 2004 Graduate Class in “Dynamics of Tree-Ring Formation” at the Laboratory of Tree-Ring Research, University of Arizona, were a gracious and constructive “test audience”. Kevin Anchukaitis, Franco Biondi, David Meko, Thomas Swetnam, and Frank Telewski made a number of valuable suggestions. We have been sustained in the task of preparing this volume by the support and encouragement of ErnstDetlef Schulze, Director of the MPI for Biogeochemistry in Jena, and Galina Vaganova, Maria and Mark D’Alarcao, and Rachel Hughes.
Krasnoyarsk and Tucson July 2005
E.A. Vaganov M.K. Hughes A.V. Shashkin
Contents
1
Introduction and Factors Influencing the Seasonal Growth of Trees . . . . . . . . . . . . . . . . .
1.1 1.1.1 1.1.2 1.2 1.3 1.4 1.5 1.6 1.7
Introduction . . . . . . . . . . . . . . . . . . Perspective . . . . . . . . . . . . . . . . . . . The Structure of This Book . . . . . . . . . . The Environment and Tree-Ring Formation Internal Factors . . . . . . . . . . . . . . . . Physical–Geographical Factors . . . . . . . . Soil Factors . . . . . . . . . . . . . . . . . . Weather Factors . . . . . . . . . . . . . . . . Conclusions and Discussion . . . . . . . . .
2
Tree-Ring Structure in Conifers as an Image of Growth Conditions
2.1 2.2 2.2.1 2.2.2 2.2.3 2.3 2.4 2.4.1 2.4.2 2.4.3 2.4.4
. . . . . . . . .
. . . . . . . . .
. . . . . . . . .
. . . . . . . . .
. . . . . . . . .
. . . . . . . . .
. . . . . . . . .
. . . . . . . . .
1 1 2 2 3 12 15 19 19
. . . . . . . . . . . . . .
21
Introduction . . . . . . . . . . . . . . . . . . . . . . . . . The Structure of Conifer Tree Rings and its Measurement Measurement of Tree-Ring Width . . . . . . . . . . . . . Measurement of Wood Density Within Tree Rings . . . . Measurement of Radial Tracheid Diameter Within Tree-Rings (Tracheidograms) . . . . . . . . . . . Influence of Internal Factors on Tree-Ring Structure in Conifers . . . . . . . . . . . . . . . . . . . . . . . . . . Influence of External Factors on Tree-Ring Structure in Conifers . . . . . . . . . . . . . . . . . . . . . . . . . . Light (Intensity and Photoperiod) . . . . . . . . . . . . . Temperature . . . . . . . . . . . . . . . . . . . . . . . . . Water . . . . . . . . . . . . . . . . . . . . . . . . . . . . . Some Other Factors . . . . . . . . . . . . . . . . . . . . .
. . . . . . . . .
1
. . . . . . .
21 22 24 28
. .
33
. .
38
. . . . .
40 43 45 47 53
. . . . .
VIII
2.5 2.5.1 2.5.2 2.6 2.7
3
3.1 3.2
Contents
Deriving Chronologies for Parameters of Tree-Ring Structure . . . . . . . . . . . . . . . . Variability of Radial Cell Sizes, Cell Wall Thickness, and Wood Density Within Tree Rings . . . . . . . . Acquisition and Statistical Characteristics of “Cell Chronologies” . . . . . . . . . . . . . . . . Long-Term Relations Between Different Anatomical Characteristics of Tree Rings . . . . . . Conclusions and Discussion . . . . . . . . . . . . .
. . . . .
58
. . . . .
58
. . . . .
60
. . . . . . . . . .
64 69
Seasonal Cambium Activity and Production of New Xylem Cells . . . . . . . . . . . . . . . . . . . . . . .
71
3.8
Introduction . . . . . . . . . . . . . . . . . . . . . . . . . . Seasonal Activity of Cambium and Xylem Differentiation (Basic Definitions) . . . . . . . Methods for Studying Seasonal Kinetics of Tree-Ring Growth and the Formation of Their Structure Cell Organization of the Cambial Zone . . . . . . . . . . . Seasonal Activity of the Cambial Zone (Basic Quantitative Results) . . . . . . . . . . . . . . . . . A Phenomenological Approach to the Description of the Observed Patterns of Cambial Activity . . . . . . . . Control of the Important Kinetic Parameters of the Cambial Zone for Cell Production . . . . . . . . . . Conclusions and Discussion . . . . . . . . . . . . . . . . .
. .
101 103
4
Radial Cell Enlargement . . . . . . . . . . . . . . . . . . . .
105
4.1 4.2 4.3
Introduction . . . . . . . . . . . . . . . . . . . . . . . . . Cell Expansion and Associated Processes . . . . . . . . . Methods to Study the Kinetics of Cell Enlargement and the Main Results . . . . . . . . . . . . . . . . . . . . Results Confirming the Relationship Between the Rate of Division and Tracheid Expansion . . . . . . . Direct Comparison of Radial Growth Rate and Radial Tracheid Dimension . . . . . . . . . . . . . . High Frequency Variations of Radial Tracheid Dimension in Conifers . . . . . . . . . . . . . . Indirect Evidence for a Relationship Between the Rate of Cell Division in the Cambial Zone and Cell Expansion
. . . .
105 106
. .
106
. .
111
. .
111
. .
112
. .
122
3.3 3.4 3.5 3.6 3.7
4.4 4.4.1 4.4.2 4.4.3
.
71
.
72
. .
74 78
.
81
.
89
Contents
4.5
IX
4.6
Some Consequences of the Relationship Between Growth Rate and Radial Tracheid Dimension . . . Conclusions and Discussion . . . . . . . . . . . . . . . . . .
128 131
5
Cell Wall Thickening . . . . . . . . . . . . . . . . . . . . . .
135
5.1 5.2
. . . . . .
135
. . . . . .
136
. . . . . .
139
5.5
Introduction . . . . . . . . . . . . . . . . . . . . . Seasonal Course of Cell Wall Thickening (Process and Basic Results) . . . . . . . . . . . . . Formation of Compression Wood in Experiments with Inclination . . . . . . . . . . . . . . . . . . . Relationship Between Radial Tracheid Dimension and Cell Wall Thickness . . . . . . . . . . . . . . Conclusions and Discussion . . . . . . . . . . . .
. . . . . . . . . . . .
143 147
6
Environmental Control of Xylem Differentiation . . . . . .
151
6.1 6.2
151
6.6
Introduction . . . . . . . . . . . . . . . . . . . . . . . . . . . Conceptual Scheme of the Environmental Control of Xylem Differentiation . . . . . . . . . . . . . . . . . . . . Tree-Ring Formation Under Strong Temperature Limitation (Northern Timberline) . . . . . . . . . . . . . . . . . . . . . “Differential Tracheidograms” in the Analysis of Weather Conditions Within a Season . . . . . . . . . . . . Tree-Ring Anatomy as an Indicator of Climate – Seasonal Growth Relations in a Monsoon Region – an Example of Growth Limitation by High Temperatures and Intra-Seasonal Drought . . . . . . . . . . . . . . . . . . Conclusions and Discussion . . . . . . . . . . . . . . . . . .
7
Modeling External Influence on Xylem Development . . . .
189
7.1 7.2
Introduction . . . . . . . . . . . . . . . . . . . . . . . . . . . Statistical Models in Dendroclimatology and Dendroecology: Their Advantages and Limitations . . . Mechanistic (Simulation) Models of Xylem Development . . Wilson and Howard’s Computer Model for Cambial Activity Stevens’s Model with Slight Modifications . . . . . . . . . . The Vaganov–Shashkin Simulation Model of Seasonal Growth and Tree-Ring Formation . . . . . . . .
189
5.3 5.4
6.3 6.4 6.5
7.3 7.3.1 7.3.2 7.4
152 154 169
173 186
191 200 200 207 208
$
7.4.1 7.4.2 7.4.3 7.5 7.6 7.6.1 7.6.2 7.6.3 7.6.4 7.6.5
7.7 8
8.1 8.2 8.3 8.4 8.4.1 8.4.2 8.4.2.1 8.5
8.6
8.7
8.8
Contents
Growth Rate Dependence on Current Climatic Conditions Modeling of Cell Growth Within the Cambial Zone and Production of New Xylem Cells . . . . . . . . . . . . . Calculation of Radial Tracheid Dimension and Cell Wall Thickness . . . . . . . . . . . . . . . . . . . Description of Model Parameters . . . . . . . . . . . . . . An Example of Model Application . . . . . . . . . . . . . . Tree Growth and Formation of Annual Rings Near the Polar Timberline . . . . . . . . . . . . . . . . . . Examples of Modeling of Seasonal Growth and Formation of Tree Rings in the Middle Taiga Zone . . Simulation of Annual Tree Growth and Tree-Ring Formation in Trees Growing in the Steppe Zone . . . . . . Seasonal Growth and Formation of “False Rings” Modeled in Conifer Trees Growing in a Semi-Arid Climate Modeled Differences in Growth Response to Soil Moisture and High-Temperature Limitation of Conifer Species Growing in a Monsoon Climate . . . . . . . . . . . . . . . Conclusions and Discussion . . . . . . . . . . . . . . . . .
.
211
.
214
. . .
216 218 220
.
220
.
223
.
226
.
232
. .
236 243
Simulation of Tree-Ring Growth Dynamics in Varying and Changing Climates . . . . . . . . . . . . . .
245
Introduction . . . . . . . . . . . . . . . . . . . . . . . . . . . Time-Dependent Changes in Response of Growth Rate to Climatic Variations . . . . . . . . . . . . . Application of the Vaganov–Shashkin Simulation Model to a Wide Range of Species and Site Conditions . . . Parameters of the Model and Its Relation to Species, Age and Site Characteristics . . . . . . . . . . . . . . . . . . Age . . . . . . . . . . . . . . . . . . . . . . . . . . . . . . . . Species and Site Characteristics . . . . . . . . . . . . . . . . An Example from an Extreme Environment . . . . . . . . . Examples of the Simulation of Tree-Ring Growth Dynamics in Temperature-Limited Conditions Under Projected Climate Scenarios . . . . . . . . . . . . . . Examples of the Simulation of Tree-Ring Growth Dynamics in Temperature-Limited and Low Precipitation Conditions Under Projected Climate Scenarios . . . . . . . Examples of the Simulation of Tree-Ring Growth Dynamics in Water-Limited Conditions Under Projected Climate Scenarios: Comparison of Two Species . . . . . . . Simulation of Longer-Term Variations
245 246 249 252 252 253 254
257
262
266
Contents
XI
8.12
in Tree-Ring Dynamics in Dry Conditions . . . . . . . . . On the Use of Forward and Inverse Models in Climate Reconstruction . . . . . . . . . . . . . . . . . . On the Use of the Forward Model in the Interpretation of Empirical–Statistical Reconstructions . . . . . . . . . . Simulation From Local and Regional to Hemispheric Scale: Projections For the Future . . . . . . . . . . . . . . . . . . Conclusions and Discussion . . . . . . . . . . . . . . . . .
. .
277 278
9
Eco-Physiological Modeling of Tree-Ring Growth . . . . . .
281
9.1 9.2 9.2.1 9.2.2 9.2.3 9.2.4 9.2.5 9.3
. . . . . . .
281 284 285 288 290 292 294
9.4 9.5
Introduction . . . . . . . . . . . . . . . . . . . . . . . Description of the Eco-Physiological Model . . . . . Microclimatic Data . . . . . . . . . . . . . . . . . . . Soil Water Balance . . . . . . . . . . . . . . . . . . . . Photosynthesis . . . . . . . . . . . . . . . . . . . . . Growth Dynamics . . . . . . . . . . . . . . . . . . . . The Allocation of Assimilates . . . . . . . . . . . . . Determination of Quantitative Values of Coefficients and Parameters . . . . . . . . . . . . . . . . . . . . . Examples of Model Applications . . . . . . . . . . . . Conclusions and Discussion . . . . . . . . . . . . . .
. . . . . . . . . . . .
295 296 305
10
Epilogue . . . . . . . . . . . . . . . . . . . . . . . . . . . . .
307
References . . . . . . . . . . . . . . . . . . . . . . . . . . . . . . . . . .
311
Subject Index . . . . . . . . . . . . . . . . . . . . . . . . . . . . . . . .
343
Taxonomic Index . . . . . . . . . . . . . . . . . . . . . . . . . . . . . .
353
8.9 8.10 8.11
. . . . . . .
. . . . . . .
. . . . . . .
.
270
.
271
.
275
Table of Symbols
Symbols describing environmental factors T W P E STHAW
Temperature Soil water content (absolute and relative) Precipitation Solar irradiation Depth of soil thawing layer
Symbols describing the anatomy of tree rings N LT DR DT DL V LW AW AC AL MW ρW ρX
Total number of cells in annual file of tracheids; or annual xylem increment in the number of tracheids Width of tree rings measured parallel to tracheid file direction Radial size of tracheid (radial tracheid dimension) Tangential size of tracheids Size of lumen Rate of radial enlargement (dDR/dt) Cell wall thickness Cell wall area (cross-sectional area occupied by cell wall) Cell cross-sectional area Area of lumen (inner area surrounded by cell wall) Mass of cell wall Density of all wall material Density (specific gravity) of wood
XIV
Table of Symbols
Symbols describing the processes of wood formation t τ Nc Ne Nt Nm j MI M C
RSPL RSPN
G(t) gT gW gE
Time Time interval Number of cells in the cambial zone Number of cells in the zone of radial enlargement Number of cells in the zone of cell wall thickening Number of cells in the zone of tracheids that have completed the differentiation process (mature cells) Distance (position) of a xylem mother cell (dividing) in the cambial zone from the initial Mitotic index (ratio of number of cells in mitosis to total number of cells in the dividing population) Length of time for mitosis, process ending in the production of two new daughter cells from one mother cell in the cambial zone Cell cycle (sometimes the term mitotic cycle is used): time between completed cell divisions In the case of all potentially existing dividing cells (the real meristem), the relationship between MI, M and C is described as: MI = (ln2M)/C (Ivanov 1974) Specific growth rate (linear scale) within cambial zone, inversely related to C (RSPL = 1/C) Specific growth rate of cell production [RSPN = (1/N Nc)/(dN/d N t)] For the meristem, RSPL and RSPN are the same if the size of xylem mother cells before division is constant throughout the cambial zone Calculated growth rate Partial growth rate due to temperature Partial growth rate due to soil water content Partial growth rate due to solar irradiation
Terms describing the three major processes of cell differentiation tGS tS tP tE
Length of growing season (includes tS, tP, tE; therefore tGS > tP, tE) Period of swelling in the cambial zone Period of new cell production by the cambial zone Period of enlargement from the first to the last tracheids formed
1 Introduction and Factors Influencing the Seasonal Growth of Trees
1.1 Introduction 1.1.1 Perspective Our aim in this book is to introduce the way of thinking about the environmental control of tree-ring variability in conifers that is expressed clearly in its title: “Growth dynamics of conifer tree rings: images of past and future environments”. In particular, each ring contains an image of the time when the ring formed, projected onto the ring’s size, structure and composition. The lens through which this projection occurs is the vascular cambium, the site of development of each year’s ring. We focus on its dynamics. Our particular perspective comes from our chosen task – the extraction of an image of past environments, especially climate variability, from the incomparable natural archives that tree rings offer. The emphasis on variability leads naturally to a dynamic rather than a static view of climate/tree-ring interactions. In order to best use our understanding of the environmental control of tree-ring variability, simulation models have been developed. The aim is to capture those features of the system under investigation that are essential for the description of the behavior of interest, no more and no less. Our specific objective is to simulate the interannual and decadal variability of conifer tree rings as it is driven by climate variability. We do this by focusing strongly, and uniquely, on the direct environmental control of cambial activity, without any explicit treatment of photosynthesis, respiration, and transpiration. This may seem a radical, perhaps even extreme, approach to the readers of this series, who are especially aware of the complexities of ecological systems and the many physical, biophysical, and biological processes that may be linked to any particular phenomenon in myriad modalities.We hope to convince the reader that, even so, this strategy has merit. Process-based simulation modeling should be viewed as an addition to the dendroclimatologists’ already versatile toolkit. The mainly inductive empiri-
2
E.A. Vaganov, M.K. Hughes, and A.V. Shashkin
cal–statistical approach used in this field has helped change the way we think about environmental variability on multi-year timescales and large spatial scales, up to global. It can be complemented and enhanced by the application of understanding derived from experimental–deductive work more focused on daily to seasonal timescales at cellular and even biochemical levels.We recognize that we risk double jeopardy, both for trying to combine these ways of studying nature, and for perceived inadequacies from the point of view of either group of specialists. This will be a price worth paying, if those focused only on the history of large-scale climate variability gain some appreciation for the nature of the natural archive they depend on and its meaning for their interpretations, and those focused on the precise mechanisms of environmental control of xylogenesis are introduced to the many phenomena at larger scales that dendroclimatology reveals.
1.1.2 The Structure of This Book The main factors affecting the seasonal growth of trees are introduced in this chapter. In Chap. 2, the reader is introduced to the idea of the tree ring’s size and internal structure as an image of the growth conditions that existed at the time it was formed. The processes of ring development are set in a kinetic, seasonal context in Chaps 3, 4, and 5, which deal with the production, expansion, and maturation of xylem cells, respectively. A conceptual scheme for the environmental control of xylem differentiation is described in Chap. 6. This leads, in Chap. 7, to a discussion of modeling of external influence on treering structure and, in particular to a description of the Vaganov–Shashkin (VS) model. The VS model is characterized by a strong emphasis on cambial activity, as if directly influenced by the external environment. Examples of the application of the VS model designed to illustrate its potential in tackling some pressing scientific questions are given in Chap. 8. An expansion of this modeling approach designed to explicitly include the influence of the canopy and the forest stand is described in Chap. 9. The Epilogue (Chap. 10) contains some parting thoughts.
1.2 The Environment and Tree-Ring Formation The formation of annual rings in woody plants, as well as the formation of annual and growth layers in “recording structures” of other organisms (Mina and Klevezal 1970), is an outcome of the seasonal periodicity of growth processes. The growth of a woody plant represents an increase in the weight and volume of the whole plant or its parts as the result of the formation of new cells and the increase in their size (Reimers 1991). The seasonal periodicity or
Introduction and Factors Influencing the Seasonal Growth of Trees
3
rhythm of biological processes in a woody plant is determined by regular environmental fluctuations associated with the annual cycle. The expression of these seasonal rhythms depends on the species of woody plant and the local conditions where the plant is growing. Zones of formation of new cells in plants are called meristems. Apical meristems (meristems of shoots and roots) provide growth in height and length of the underground parts. Tree stems and roots increase in thickness as the result of the production of wood and bark cells by lateral meristems. There is a genetic relationship between apical and lateral meristems because the lateral meristem or cambium is a product of the apical meristem and consists of cells retaining the potential to proliferate (Zimmermann and Brown 1971). There is also a functional relationship, as demonstrated by the coordination of the processes of growth of different parts of a woody plant in the seasonal rhythm (Sinnot 1963; Kramer and Kozlowski 1983; Kozlowski and Pallardy 1997). Growth hormones are the mediators of this coordination. Their balance, together with assimilates and other nutritious substances, is important for the dynamics of growth processes and the formation of the cell structures of the tissues and organs of the plant (Kozlowski 1968; Philipson et al. 1971; Savidge 1996).
1.3 Internal Factors We will limit our discussion to those internal factors whose influence on the dynamics of seasonal growth in woody plants has been established convincingly by experiment and observation. The genetic nature of the plant is one of the major factors. Investigating seasonal growth of 18 tree species during one growing season in Denmark, Ladefoged (1952) noted precise differences in phenology, the timing of bud opening, and the initiation of meristem activities in the shoots, stems and roots between different species (Fig. 1.1). He found a difference of three weeks in the date of initiation of new wood cell production amongst the conifer species he observed. The first divisions of lateral meristem cells in spruce (Picea sitchensis) stems are observed in the third ten-day period of April, in stems of a Scots pine (Pinus sylvestris) right at the beginning of May, and in stems of European larch (Larix decidua) only in the middle of May. The data by Henhappl (1965), who studied seasonal growth of seven species of conifers and 11 deciduous species near Freiburg, Germany, during three years, show that initiation of cell division in conifers ranged over 40 days. The earliest was Scots pine (P. sylvestris), the latest white pine (P. strobus). The length of the growth season varied from 104 days in European larch (L. decidua) to 137 days in fir (Abies alba). Cambial initiation begins below the expanding/enlongating buds and the wave of activation propagates basipetally, so that the cambium at the base of
4
E.A. Vaganov, M.K. Hughes, and A.V. Shashkin
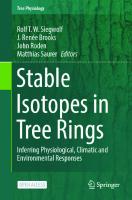
Fig. 1.1. Timing of onset of cambial activity in conifers and angiosperms in relationship to temperature and precipitation in Denmark.1 At the bud base, 2 at breast height, 3 roots 10 cm deep and 1.5 m from the stem, 4 bud opening. Notice the time-lag between cambial activity in the branch and the root. This is possibly due to regulation through growth hormones (Ladefoged 1952)
the tree is the last to divide and differentiate (Zimmermann and Brown 1971; Kramer and Kozlowski 1983; Kozlowski and Pallardy 1997). Then, in the fall, the reverse process begins when the oldest cambial tissues (at the base of the tree) become dormant first and the process propagates acropetally back to the base of the apical meristems of the crown. Differences between species are found not only in the timing of the initiation and termination of cell divisions in meristems, but also in the seasonal dynamics of growth. Ladefoged (1952) divided tree species into three groups on the basis of qualitative analysis of growth–rate curves: (1) with a growth rate maximum in the first third of the season, (2) with a more symmetrical curve of growth rate, (3) with uniform growth rate during the growing season. Similarly, in the Moscow region, Scots pine (P. sylvestris), European fir (A. alba), and European larch (L. decidua) demonstrate a distinct growth maximum in the first half of the season, while birch (Betula pendula) shows a uniform distribution of growth rate throughout the season (Smirnov 1964; Vaganov et al. 1975). The distribution through the season of the rate of growth is related to the characteristics of the species. For example, analysis of the sea-
Introduction and Factors Influencing the Seasonal Growth of Trees
5
Fig. 1.2. Types of variation of height growth during the vegetation period in the northern and southern pine ecotypes. Two northern pines have preformed shoots and one shootforming period in a year. The southern pines have periodic shoot growth. 1 Pinus strobus L. (North Carolina), 2 P. resinosa Ait. (North Carolina), 3 P. resinosa Ait. (New Hampshire), 4 P. strobus L. (New Hampshire), 5 average for all southern pines, 6, 7 frost-free period in New Hampshire and North Carolina, accordingly (Kramer and Kozlowski 1983)
sonal dynamics of growth of different species of pines (P. strobus and P. resinosa) in the forests of the south- and northeastern United States reveals that northern ecotypes have an “explosive” character of seasonal growth rate change, whereas southern ecotypes have a more uniform distribution of growth rate during the season (Fig. 1.2; Kramer and Kozlowski 1983). This difference exists because the northern ecotypes have preformed shoots (limited growth) and only one period of shoot formation per year, whereas continuing periodic growth occurs in the southern ecotypes. Spurr and Barnes (1980) report differences in seasonal dynamics of growth rate (“explosive” or uniform) between P. rigida, P. densiflora, and P. banksiana. The seasonal growth of shoots and needles (foliage), through the hormonal control of cambial activity, is of central importance to the character and distribution of the seasonal growth rate of stem wood (see reviews in Kramer and Kozlowski 1983; Zimmermann 1964; Zimmermann and Brown 1971; Barnett 1981; Savidge 1996). It is through this means that the processes of development of various tissues and organs are coordinated within the annual cycle, in a manner that varies from species to species. This is illustrated vividly by species-specific patterns of coordination of growth of aboveground (shoots) and underground (roots) parts of woody plants (Fig. 1.3; Lyr et al. 1974). Not only do the maximum increments vary between species, but so do the beginning, ending, and duration of the linear growth of shoots and roots. The coordination of the seasonal dynamics of growth of the various parts of woody plants results in allometric relations between them during the growth and development of the woody plant and the stand (Utkin 1982; Terskov and Vaganov 1978; Vaganov 1981; Utkin et al. 1996).
6
E.A. Vaganov, M.K. Hughes, and A.V. Shashkin
Fig. 1.3. Schematic diagram of annual root growth (1) and growth of the aboveground part (2) in some tree species in 1963, Eberswald, Germany. The arrows show the beginning and the end of growth (Lyr et al. 1974)
Age is also a major internal factor connected with the genotype and influencing the seasonal dynamics of growth processes in woody plants. There is a very wide range (30-fold or more) of maximum longevity in tree stems according to species (Table 1.1), across several major taxa of conifers. The association between longevity and adversity may be seen in situations where conditions are generally limiting to growth, so that the longest-lived species in semi-arid regions may typically be found in the most extreme locations within such regions (Schulman 1958). This is seen most dramatically in the five-needle pines of western North America (e.g. P. longaeva, P. aristata, P. bal-
Introduction and Factors Influencing the Seasonal Growth of Trees
7
Table 1.1 Maximum ages of conifer species used in dendrochronology. (Modified from Brown 1994). All ages are from cross-dated samples reported at http://www.rmtrr. org/oldlist.htm,with the exception of Sequoia sempervirens,which is derived from a ringcount. and the following species, which are from cross-dated samples reported elsewhere: Austrocedrus chilensis and Larix decidua (International Tree-Ring Data Bank), Pinus sylvestris (http://www.botanik.uni-bonn.de/conifers/pi/pin/sylvestris.htm), Juniperus phoenicea (R. Touchan, personal communication), Larix cajanderi (M. Naurzbaev, personal communication) Species
Age (years)
Location
>4,000 years Pinus longaeva
4,844
Nevada, USA
>3,000 years Fitzroya cupressoides Sequoiadendron giganteum
3,622 3,266
Chile California, USA
>2,000 years Juniperus occidentalis P. aristata Sequoia sempervirens P. balfouriana
2,675 2,435 2,200 2,110
California, USA Colorado, USA California, USA California, USA
>1,000 years J. scopulorum P. flexilis Thuja occidentalis Taxodium distichum P. albicaulis Pseudotsuga menziesii Larix cajanderi Lagarostrobus franklinii
1,889 1,670 1,653 1,622 1,267 1,275 1,216 1,089
New Mexico, USA New Mexico, USA Ontario, Canada N. Carolina, USA Idaho, USA New Mexico, USA Yakutia, Russia Tasmania, Australia
>500 years Pinus edulis Larix decidua Picea engelmannii Austrocedrus chilensis Pinus ponderosa Araucarua araucana L. siberica L. lyalli P. sylvestris Abies magnifica var. shastensis P. sibirica P. strobiformis J. phoenicea Picea glauca
973 932 911 850 843 834 750 728 711 665 629 599 526 522
Utah, USA France Colorado, USA Chile Utah, USA Argentina Mongolia Alberta, Canada Sweden California, USA Mongolia New Mexico, USA Jordan Alaska, USA
>300 years Picea abies P. rubens
468 405
Germany New Hampshire, USA
8
E.A. Vaganov, M.K. Hughes, and A.V. Shashkin
fouriana, P. flexilis, P. albicaulis) and in other conifers, such as species of Juniperus and Sabina in central Asia and species of Austrocedrus and Araucaria in South America. These species are able to survive under conditions where they have few if any competitors and have characteristics of special value for surviving harsh and extremely variable environments, such as anatomical adaptations for an enhanced role of needles as storage organs (Connor and Lanner 1990) and the retention of needles for as long as 30 years (LaMarche 1974a). This has important consequences for the effect of the annual cycle and interannual variability on the formation of wood. The interannual variability of ring widths is greatest near the lower elevational limits of these species and is smallest at the upper limit, where there are very strong correlations between succeeding ring widths (LaMarche 1974b; Hughes and Funkhouser 2003). The maximum ages of all of these species are greater than 1,000 years, and in the case of P. longaeva approach 5,000 years. Similarly, the longest-lived larch species in the forest-tundra of Siberia, Larix cajanderi, is found at the northern timberline in the particularly extreme subarctic climate of northern Yakutia.Arno and Hammerly (1984) have described the larches of northern and elevational timberlines as trees that are able to grow in very extreme environments as a result of their deciduous habit, which lessens the effects of severe winters on the plant. This too has important consequences for the dynamics of wood formation in relation to the annual cycle and results in ring-width series where there is almost no persistence, that is, no correlation between one year’s ring width and the next. There are, however, several very long-lived (multimillennial) tree species that are not found at the extreme limits of tree growth. These are members of the families Taxodiaceae or Cupressaceae, such as Taxodium distichum, Sequoia sempervirens, and Sequoiadendron giganteum in North America, Fitzroya cupressoides in South America, and Cupressus species in eastern Asia. These species share several characteristics. Several of them first establish as pioneers, requiring mineral soil exposed by fire (S. giganteum) or neotectonic activity (F. cupressoides), and then reach great heights within a few centuries, obviating competition for light. All show a very strong taper in stem width near the base and usually a very parallel form of the stem above this zone, resulting in characteristic vertical patterns of ring width. As in the case of the long-lived pines of North America, they all produce wood that is extremely resistant to pests and pathogens and so may better survive repeated insult, such as lightning or wind damage. These species demonstrate a variety of “strategies” for longevity that are intimately associated with the interaction of the environment, including the annual cycle and the seasonal dynamics of wood formation. All of these long-lived species, however, provide excellent opportunities for future research on the relationship between the age of the cambium and the precise seasonal dynamics of wood formation, since it is possible to collect materials of a vast range of cambial ages from their stems and branches.
Introduction and Factors Influencing the Seasonal Growth of Trees
9
In the analysis of age changes, it is necessary to distinguish the age of a tissue or organ from that of the tree as a whole. For example, a tree at the age of 500 years has cambium aged about 500 years at the bottom of a trunk and aged 20–50 years in the upper part of the crown. The scheme in Fig. 1.4 shows that the actual age of cambium differently integrates the influences of internal and external factors, and this in turn is reflected in anatomical changes in the wood and tissue cells formed. As the actual age of the cambium increases from pith to bark, tracheid length, cross-sectional cell diameter, and production of resin ducts increase; and the width of annual rings and the percentage of late wood decrease (Vysotskaya and Vaganov 1989; Wimmer 1994). The wood cells made by young cambium have smaller radial sizes, a smaller cellwall thickness, and a lower wood density, as well as more earlywood and less latewood (Telewski and Lynch 1991). The contrast between earlywood and latewood is also not as large, especially in wood density (Savva et al. 2002a,b). Similar changes are found in all woody plants and are associated with the phenomenon of “juvenile wood” (Fig. 1.5; Zobel and Jett 1995). Young cambium is characterized by high activity, resulting in the production of more
Fig. 1.4. In a series of cross-sections from various heights in the stem, a distinction can be made between endogenous and exogenous influencing factors. Type 1 From the pith to the stem periphery. An ageing cambium experiences a variety of ecological conditions. Type 2 Parallel to the youngest tree ring. A cambium with physiological varying ages (above young, below old) experiences the same ecological conditions. Type 3 Parallel to the pith. Physiologically young cambium experiences a variety of ecological conditions (Duff and Nolan 1953; Smith and Wilsie 1961)
10
E.A. Vaganov, M.K. Hughes, and A.V. Shashkin
Fig. 1.5. Dependence of radial cell sizes on age of tree rings of pine growing in moist (1) and dry (2) sites (Vysotskaya and Vaganov 1989). This corresponds to series type 1 in Fig. 1.4
Fig. 1.6. Tree-ring width profiles for the years 1981–1987 along a spruce stem in northern Germany. Narrow rings are common in parts of the tree which grow the least (stem base, 20 m). These series corresponds to type 2 in Fig. 1.4. (Krause and Eckstein 1992)
Introduction and Factors Influencing the Seasonal Growth of Trees
11
new wood cells and wider annual rings than those produced by older cambium (Fig. 1.6). A typical example of the age changes in the main characteristics of wood is shown in Fig. 1.7. The dynamics of annual ring width and the width of the zones of early and late wood correspond to the so-called “curve of biological growth” or “curve of the grand growth period” (Shiyatov 1970, 1973a, 1986). Smaller relative changes are typical of tree-ring density (Braeker 1981). Carrer and Urbinati (2004) raise the interesting possibility that at least some of these changes and the strength of each tree’s climate signal, may vary according to the capacity to support greater height growth by producing tracheids with larger lumina.
Fig. 1.7. Age changes in tree-ring width, early- and latewood width, maximum and minimum density in a Larix sibirica Ldb. tree
12
E.A. Vaganov, M.K. Hughes, and A.V. Shashkin
1.4 Physical–Geographical Factors Among these factors, the most essential are regional climatology and relief. For example, there are strong gradients of average summer, winter, and annual temperature and precipitation along the Yenisei meridian in central Siberia (Fig. 1.8). As a result of these macro-climatic patterns, the duration of the growth season of trees extends from 35–40 days at the polar limit of forest (about 71° North) up to 95–105 days in the forest-steppe zone (51–52° North; Vaganov et al. 1999). An even longer period of seasonal tree growth is observed in the subtropical zone – up to 150–160 days (Vaganov and Park 1995). When tropical conditions exist with very small seasonal fluctuations of temperature, in an optimal zone for growth and with sufficient humidity, growth continues throughout the year. Within a particular region, the timing of the beginning of the growth of woody plants and its duration varies according to elevation (Lobzhanidze 1961). This may be seen most clearly in mountain regions. In the case of European larch (L. decidua) at three different altitudes in the mountains of Tyrol, Austria (Tranquillini 1979), the greatest distinctions in growth are observed
1.8. Dependence of a long-term summer an average annual (2), winter (3) temperaees as well as annual (4), mmer (5), and winter m precipitation on latip e along the Enisey rridian in central e eria. Columns Meaeed duration of treeg growth season
Introduction and Factors Influencing the Seasonal Growth of Trees
13
Fig. 1.9. Rate of radial growth in young larch trees and extent of phases of tree-ring formation at different elevations (700 m, 1,300 m, 1,950 m) in the Tirol mountains (Austria). S Cell swelling, D cell division in cambial zone, EW earlywood formation, LW latewood formation (Tranquillini 1979)
Fig. 1.10. Frequency distribution of average lifespan of spruce needles in northern Germany. The age of the needles increases as the elevation increases. 1–4 Regions from lower to higher elevations (Wachter 1985)
in terms of the beginning of cambial activation and cell divisions (Fig. 1.9). At the bottom of the mountains the growth begins at the end of April, whereas at 1,950 m above sea level meristem activity begins in the second half of June, i.e. more than 1.5 months later. These data also show that the termination dates of radial growth at all three elevations are similar. Therefore the growing season is shorter and the absolute tree-ring width smaller at the higher elevations. These results demonstrate the importance of the beginning of the growth sea-
14
E.A. Vaganov, M.K. Hughes, and A.V. Shashkin
son for growth and its integral outcomes, namely shoot lengthening and wood increment. In most conifers, growth rate and intensity of divisions in meristems are greatest in the first half of the season (Larson 1994). This is connected with the active production of growth hormones and a high concentration of assimilates (Sudachkova 1977). The unavoidably shorter seasonal growth duration in conifers at high elevations can be partially compensated by the retention of previous years’ needles and the associated increase in photosynthetic efficiency. The number of years for which needles are retained in a spruce, for example, differs according to the elevation at which the trees grow (Fig. 1.10). Local relief has a strong influence on the thermal regime (Gates 1980), so that eastern and southern slopes receive markedly more solar energy than western and northern slopes. This may result in very different seasonal courses of growth in shoots and stems of nearby woody plants of the same species (Fig. 1.11). As in the case of elevation differences, the main differences related to aspect result from differing initial dates for the growth season, for example, the later beginning of growth in trees on north-facing slopes.
Fig. 1.11. Comparison of growth in the roots and shoots of two mountain pines with snow coverage and ground temperature on two sites during the 1978 season. The growing period lasted around 4.0 months on the more favorable eastern slope and only around 2.5 months on the cool northern slope. 1 East-facing slope, 2 north-facing slope (Turner and Streule 1983)
Introduction and Factors Influencing the Seasonal Growth of Trees
15
1.5 Soil Factors We will consider only the major factors influencing tree growth, namely the temperature and water regime of the soil, its composition (mechanical, chemical, texture, etc.), and its content of mineral elements. The seasonal dynamics of temperature in the upper layers of the soil are closely related to air temperature (Russel 1955; Pozdnyakov 1986; Zhang et al. 2000, 2001). These relationships may be strongly modified by the development of the forest floor and vegetation cover, which modify heat exchange and thus the gradient between air temperature and soil temperature. The influence of the soil thermal regime on woody plant growth may be seen clearly when permafrost soils are present. Moss cover interferes with heat exchange between air and soil, and so the boundary of the permafrost rises and suppresses growth both of the root system of trees and of other plant parts (Pozdnyakov 1986). When the forest floor or vegetation cover is disturbed (usually by fire), the seasonal warming of the upper soil layers of soil increases, the permafrost boundary recedes, and tree growth processes become more active. For example, after fire, larch tree-ring growth increases as the result of the degradation of the moss layer and improved soil thermal regime (Fig. 1.12). Growth is considerably suppressed in the pre-fire period, when thick moss cover allows the permafrost boundary to come close to the surface, and it sharply accelerates in the first post-fire years (Arbatskaya 1998).
Fig. 1.12. Average pre- and post-fire response of larch radial growth for multiple trees and fires on permafrost (north taiga, Siberia). 1 Direct measurements, 2 smoothed curve (Arbatskaya 1998)
16
E.A. Vaganov, M.K. Hughes, and A.V. Shashkin
The seasonal warm-up of soil depends on its mechanical composition. Obviously, light sandy soils can get warm faster and to a greater depth than heavy clay. The mechanical composition of soil largely influences the mobility of moisture (Russel 1955; Spurr and Barnes 1980). The increase in field moisture capacity of soils (in a series from sandy soil to loam/sandy loam to clay) is accompanied by an increase of wilting point humidity (Table 1.2). Therefore in the seasonal cycle of growth, the reserves of water accessible to woody plants can vary over a wide range, depending on the timing and intensity of precipitation and transpiration The seasonal and intra-seasonal changes of transpiration play an important role in growth processes because they drive water movement, bringing mineral nutrients to assimilating tissues. Transpiration is largely limited by soil moisture content (Fig. 1.13). Several authors have emphasized the acceleration of radial growth observed when the water table falls in marshy conditions (Melekhov and Melekhova 1958; Efremov 1987; Konstantinov 1981; Schultness 1990). This response to drying can be quite fast (Fig. 1.14), but can be extended for some decades (Efremov 1987). The detailed study of variability in radial increment in wet conditions due to water table fluctuations and the weather conditions of single seasons testifies that the direct influence of water regime changes is to a greater extent supplemented by an indirect one, namely by acceleration of the decomposition of organic substances and mineralization of the drier layers of soil cover and peat soil (Vaganov and Kachayev 1992). The response of growth acceleration at the expense of additional mineral assimilation follows with some delay in time. Not surprisingly, much attention has been given to the effect of fertilization on tree growth and tree ring formation (Spiecker 1987, 1991; Buzykin 1977; Beets et al. 2001; Makinen et al. 2002). The outcomes varied over a wide range: from absence of response, up to practically direct connection with the growth rate change, depending upon the dosage of the introduced fertilizers.
Table 1.2 The field capacity, wilting point and available water in certain American soils (Russell 1955; 1 inch/foot = approx. 8.3 cm/m) Soil
Field capacity (oven dry weight)
Permanent wilting point (oven dry weight)
Available water (inch/ foot)
Yuma sand Delano sandy loam Fresno sandy loam Salinas fine sandy loam Wooster silt loam Aiken clay loam Gila clay
4.8 9.1 11.1 28.2 23.4 31.1 30.4
3.2 4.2 3.1 20.0 6.1 25.7 16.0
0.3 0.8 1.3 1.3 2.9 0.7 2.4
Introduction and Factors Influencing the Seasonal Growth of Trees
17
Fig. 1.13. Impact of soil moisture on transpiration intensity of young oak trees. 1 Quercus alba L., 2 Q. minor, 3 Q. marilandica, 4 Q. rubra L., 5 Q. falcata. Arrow shows wilting point (Kramer and Kozlowski 1983)
Fig. 1.14. Response of Pinus sylvestris smoothed ring-width and height increment to drainage of bog substrate (9, 11 site identifiers; Efremov 1987)
18
E.A. Vaganov, M.K. Hughes, and A.V. Shashkin
For example, the outcomes of a four-year experiment on the effect of a single application of extra nitrogen phosphorus and potassium (in 1970) on the course of radial growth of a pine stand on sandy soil in the Middle Angara valley (southern taiga) are shown in Table 1.3. Only additional nitrogen accelerates radial growth within the first period of years. Obviously, the additional mineral supply has a stimulating influence on woody plant growth only in those conditions where the particular element is at a minimum and essentially limits the processes of growth (Pechman 1960; Schulze et al. 1995). So, in larch stands in Middle Yakutia, nitrogen is the main limiting soil factor for
Fig. 1.15. Effect of fertilizers on tree-ring width (a) and on radial size and cell wall thickness (b) of spruce trees growing on the soils poor in nitrogen, Germany. Radial tracheid size: 1 >15 µm, 2 16–30 µm, 3 31–45 µm, 4 46–60 µm. The arrows show the time of fertilizing (redrawn with changes from Von Pechman 1960)
Introduction and Factors Influencing the Seasonal Growth of Trees
19
Table 1.3 Change in stand diameter increment (%) in response to fertilization on a southern taiga P. sylvestris stand (Buzykin 1977) Treatment
1969
1970
1971
1972
1973
Total incremental change
Control N, P, K N, P N, K P, K N P K
0 0 0 0 0 0 0 0
0 3 1 7 –6 10 –1 5
0 4 4 15 –2 14 –7 0
0 47 42 45 1 49 –7 9
0 19 17 32 –3 28 –9 2
0 73 64 99 –10 101 –24 16
growth and accumulation of organic mass in stands (Schulze et al. 1995). The data in Fig. 1.15 show that the application of nitrogen to compositionally poor mineral soil produces a practically instantaneous response in growth acceleration and changes the characteristics of the tree rings that are being formed in a spruce. Ring width, earlywood width, and latewood width increase and cell wall thickness in latewood decreases.
1.6 Weather Factors The weather conditions of single seasons may be summarized as the seasonal course of temperature and the intra-seasonal distribution of precipitation. These features determine the beginning dates of cell divisions in meristems, the growth rate in single intervals of a season, growth termination dates, and the overall seasonal course of the growth curve (Lobzhanidze 1961; Smirnov 1964; Kramer and Kozlowski 1983; Fritts 1976; Fritts et al. 1991). Temperature may be considered as the most important single factor in the initiation of meristem growth activity (Larson 1994). At the same time, low soil humidity can cause an earlier end of growth in a season (Smirnov 1964; Fritts 1956, 1976), or at least the onset of latewood formation (Zahner 1968b). A combination of temperature and humidity changes in particular intervals of a season produces acceleration or deceleration of growth processes (Vaganov et al. 1985; Schweingruber 1996; Horacek et al. 1999; Brauening 1999) and largely determines the overall result – the size and internal structure of the annual ring formed in that year. More detailed consideration of the influence of weather conditions on the seasonal growth of woody plants may be found in later chapters.
20
E.A. Vaganov, M.K. Hughes, and A.V. Shashkin
1.7 Conclusions and Discussion We described the aim of this book as “to introduce the way of thinking about the environmental control of tree-ring variability in conifers that is expressed clearly in its title: Growth dynamics of conifer tree rings: images of past and future environments”. In particular, we noted that this is not a textbook of tree developmental biology, but rather an exposition of the thinking behind the simulation models of conifer tree-ring growth described in later chapters. In that thinking, a central role is accorded to the vascular cambium. The brief analysis in this chapter has shown that the seasonal growth of woody plants depends on both internal and external factors. During seasonal growth, the genetic features of different species of woody plants and their age come into play. The processes of production and differentiation of cells in apical and secondary meristems are coordinated. Their intensity is influenced by a complex of more or less stable operating factors, such as geographical position, climate, and soil, as well as variable factors, such as weather conditions, moisture in soil, and mineral supply. The spectrum of factors influencing growth in woody plants is no doubt wider than considered by us here. Further discussion may be found in a number of more general books (Fritts 1976; Hughes et al 1982; Schweingruber 1988, 1996; Cook and Kairiukstis 1990; Bitvinskas 1974; Antanaitis and Zagreev 1981; Shiyatov 1986; Vaganov et al. 1985, 1996d). We have limited our discussion to the illustration of the influence of major factors so as to help the reader understand approaches to modeling seasonal growth and tree-ring structure, and realizing these as algorithms and computer programs.
2 Tree-Ring Structure in Conifers as an Image of Growth Conditions
2.1 Introduction Direct observations of long-term environmental changes in natural ecosystems are extremely rare, and so it is necessary to use indirect indicators, or natural archives, of information about past environments. These include marine, lacustrine and terrestrial sediments, geomorphological features, speleothems, annual layers and other features associated with ice sheets and glaciers, and annual layers produced by living organisms such as corals and tree rings (Bradley 1999). Of the natural archives relevant to timescales from seasonal to several centuries, tree rings are probably the best understood, in the sense that their strengths and weaknesses have been thoroughly explored during the past several decades (Fritts 1976; Hughes et al. 1982; Cook and Kairiukstis 1990; Schweingruber 1996; Vaganov et al. 1996a, b; Jones et al. 1998; Hughes 2002). As a result of their annual resolution and broad geographic distribution, it has been possible to subject the fidelity of tree rings as climate recorders to many thousands of objective tests by comparison with instrumental meteorological data. The accumulation of this mass of empirical experience has contributed to the development of the theoretical and methodological foundations of dendrochronology. A widely accepted set of procedures has been established, such as the selection of sites, species, trees and tree-ring variables to be sampled, cross-dating for chronological control, replication and standardization for noise reduction (Fritts 1976; Shiyatov 1986; Schweingruber 1988, 1996). These procedures differ radically from those used to measure forest growth, because the aim is different. Here the objective is to derive a reliable quantitative history of past environment, usually climate, not to derive a measure that is representative of the ecosystem itself. As with other natural archives, the use of tree rings in this way depends on the principal of uniformitarianism, which is the basis, for example, of all earth science. It is essentially the assumption that all the factors that controlled the formation of the
22
E.A. Vaganov, M.K. Hughes, and A.V. Shashkin
archive in the distant past are known to the scientist interpreting it. Some of the most common practices specific to the use of tree rings as natural environmental archives are practicable because many trees may be sampled at any one location and multiple sites in a region, permitting the strengthening of a common external signal at the expense of tree-specific or site-specific noise by massive replication. This is based on the assumption that all trees in a stand, or even in a wider region, are subject to the same climate variability from year to year, and that most non-climatic factors influencing tree-ring formation are most likely to be specific to the individual stem, tree or stand. While tree rings are integrated records of the influence of environmental conditions, their anatomical characteristics record growth rate changes produced by these changing conditions (Yatsenko-Khmelevsky 1954; Vaganov et al. 1985, 1996b; Schweingruber 1988, 1996). Tree rings not only integrate the outcomes of the growth process, but also register the process itself.As a result, the internal structure of a tree ring contains information on environmental conditions at seasonal, or even finer, timescales. So, in this chapter, we will consider the features of conifer tree-ring structure, quantitative methods for the investigation of that structure (Sect. 2.2), and the major factors influencing variability in tree-ring growth and structure (Sects. 2.3–2.4). We go on to discuss how to derive chronologies of various tree-ring parameters (chronologies are means of many detrended time series) in Sect. 2.5 and to examine the relationships between the different parameters (Sect. 2.6). Readers familiar with the measurement of tree-ring widths, densities, and micro-anatomical features may wish to pass over Sects. 2.2.1, 2.2.2, and 2.2.3, respectively.
2.2. The Structure of Conifer Tree Rings and its Measurement The microscopic structure of conifer wood consists of two types of cells: parenchyma, which have an oval or polyhedral shape with approximately identical dimensions in three directions, and strongly elongated tracheids (Borovikov and Ugolev 1989; Fahn 1990). Tracheids make up more than 90 % of timber volume (Table 2.1). The parenchyma cells, rays, and resin ducts vary from 5 % to 10 % in various species. Tracheids are organized in rather regular files or rows extending through a part of one or several tree rings (Bannan 1955, 1957). The tracheids of earlywood formed at the beginning of a growing season have large radial sizes and smaller, thinner cell walls. Then, the first tracheids of the transition zone are formed, where the radial size of cells and thickness of their cell walls changes considerably. Finally, the latewood tracheids are formed, with small radial sizes and greater cell wall thickness. This is the basic pattern of the internal cell structure of conifer tree rings.
Tree-Ring Structure in Conifers as an Image of Growth Conditions
23
Table 2.1. Content of different elements in conifer wood (% of total wood volume; Borovikov and Ugolev 1989) Genus
Tracheids
Rays
Resin ducts
Wood parenchyma
Pinus Picea Larix Pseudotsuga Juniperus Sequoia
91.0–94.0 92.5–95.0 89.0 92.5 91.7 91.2
5.3–8.4 5.0–7.2 10.0 7.3 6.3 7.8
0.5–11.0 0.2–0.3 0.1 0.2 – –
– Scarce 0.9 Scarce 0.2 1.0
Given this basic structure as seen in transverse section, we will consider what quantitative structural measurements may be made of conifer tree rings (Fig. 2.1): 1. Tree ring width (LT) 2. Number of cells in a radial file within a tree ring (N) N 3. Radial size of cells ( radial diameter; DR) 4. Cell wall thickness (LW) 5. Density of wood estimated using the relationship of the area of cell wall to the cross-sectional area of a tracheids (ρX).
Fig. 2.1. Cross-section of wood: LT tree-ring width, DL radial cell lumen, LW double cell wall thickness
24
E.A. Vaganov, M.K. Hughes, and A.V. Shashkin
The connection between these different characteristics may be presented as (Vaganov 1996a): N
LT = ∑ DRi
(2.1)
i =1
where i is the serial number of a cell in a file and N is the number of cells in the given tracheid file of a tree ring. N
U X = UW ∑ 2 LiW ( DRi + DT − 2 LiW ) /( DRi DT )
(2.2)
i =1
where ρW is the specific gravity of the cell wall, DT is the tangential size of a cell, the average value of which varies slightly within a ring (Vysotskaya et al. 1985; Borovikov and Ugolev 1989). Thus, tree ring width is a derivative of two main characteristics, and density of three:
LT = f ( N , DRi )
U X = f ( N , DRi , LiW ) 2.2.1 Measurement of Tree-Ring Width It is a rather simple task to measure the width of conifer tree rings when they have clear boundaries, each representing an arc whose radius is large relative to the ring width. It is more difficult to do this when the ring boundaries have strong curvature, as for example, close to branch traces, and is extremely problematic when the curvatures of the early and late boundaries are not parallel. Poorly defined ring boundaries with weak contrast between latewood and the succeeding earlywood may be characteristic of certain taxa, for example Agathis australis (kauri pine) in New Zealand (LaMarche 1982), or of many taxa in regions with weak seasonality. They may also result from the growth conditions of a particular year in species where ring boundaries are generally clear. For example, frost damage near the early or late boundary may obscure it, or extremely harsh conditions may result in a ring with only two or three cells in each radial file (a “micro-ring”). Such harsh conditions may also result in a ring being absent on the radius to be measured, or around a large fraction or all the circumference at that height above ground, or even on all wood available from that tree. To further complicate matters, intra-seasonal dynamics may result in “false rings”. For example, a severe drought in the growing season may cause the untimely onset of latewood formation, which may be followed by the production of earlywood cells when rain returns (see below). In most cases, such false rings may be identified anatomically, as the return to earlywood cells is gradual, not sharp as in the annual ring boundary.
Tree-Ring Structure in Conifers as an Image of Growth Conditions
25
In order to best deal with these problems, it is essential that the wood be surfaced very well, so that the individual tracheids may be seen. It is also extremely important that cross-dating be conducted with the wood under the microscope. Cross-dating is the process of massively replicated patternmatching of ring features (including but not limited to ring width), to unambiguously assign each ring to a specific year, first with reference to its neighbors in the stand and then with reference to calendar years. Only by careful cross-dating can missing rings be identified. Also, cross-dating often helps in the diagnosis of false rings and the discovery of micro-rings, when the dendrochronologist returns to the microscope to find the cause of a phase shift in the ring pattern of a sample relative to the rest of a collection. There are two main methods of cross-dating in widespread use. In most laboratories in North and South America, cross-dating is done without first measuring ring widths. Only some aide-memoire of the strong features of ring pattern is needed – usually the skeleton plot as developed by Andrew Ellicott Douglass in the early decades of the twentieth century (Stokes and Smiley 1968). This permits the simultaneous comparison of several samples’ ring patterns. After resolving anomalies due to missing and false rings, the calendar year assignment of each ring is marked permanently on the wood by a special code of pinholes for decades, half-centuries and centuries, as well as missing and micro-rings. The ring widths are then measured, with each width assigned to a known calendar year, and the measurements are subjected to rigorous statistical quality control designed to identify errors in both crossdating and measurement. It is also common practice to remove markings from some samples so that they may be dated independently by another dendrochronologist. When practiced by an experienced worker, this method can be extremely rapid and has the very strong advantage that the scientist is in intimate contact with the wood at every stage of dating. In other laboratories, for example many in Europe, ring widths are measured first and patterns of ring width compared graphically and/or statistically to identify anomalies such as unusual phase shifts, which may then be resolved, as in the Douglass skeleton plot method, by reference to the wood (Baillie and Pilcher 1973). The same statistical quality control as in the Americas is then often applied to the dated ring-width series. There are two main types of measurement system in use for ring widths, regardless of whether the rings have already been dated, or the measurement is part of the dating procedure. In one type, a stage carrying the wood is moved under a microscope or a camera with a macro-lens (Fig. 2.2).When the operator sees a ring boundary coinciding with cross-hairs in the microscope field of view, or a mark on a video screen if a camera is used, a button is pressed to send the measured ring width to a computer. The precision of the measurement device is commonly 0.01 mm or 0.001 mm, but this cannot always be applied to the measurements themselves. This is because the specific track along which measurements are made is determined by the opera-
26
E.A. Vaganov, M.K. Hughes, and A.V. Shashkin
Fig. 2.2. Device for measuring and processing tree-ring width data: 1 stereomicroscope, 2 a specimen table with precision feed providing a linear sample displacement to 0.001 mm, 3 computer for compiling and processing data
tor, bearing in mind irregularities such as branch traces and resin ducts. The first widely used version of this approach based on a personal computer was developed by Robinson and Evans (1980) and there have been many refinements since (Vaganov et al. 1983; Schweingruber 1988; Rinn 1996), especially those based on linear optical scales so that the precision and accuracy of the measurement is independent of the translation mechanism used to move the wood sample. In the other type of ring-width measuring system, software is used to derive ring widths, and perhaps other variables, from a digital image of the wood surface. In the simplest cases, a track is drawn across the image and peaks in the intensity profile along that track are identified as ring boundaries. Ring width is the distance between successive boundaries. Of course, the reliability of the measurement series depends on the relationship between the pixel size of the image and the width of the smallest rings, which can be as small as 20–30 µm. A further approach is to take the differential of the intensity profile, but care must be taken to know which peaks are produced by the earlywood–latewood transition and which by the ring boundary. Image-pro-
Tree-Ring Structure in Conifers as an Image of Growth Conditions
27
cessing algorithms adapted from, for example, remote-sensing applications, have been used to identify ring boundaries reliably in many conifer species and to measure ring widths and other properties not only along a single track, but using the whole area of a defined region of interest – for example the whole width of an increment core (Conner et al. 2000).
Fig. 2.3. Processing of initial tree-ring width series: a tree-ring width (TRW) series (tree JAH081), b TRW indices for JAH081 after age trend removal, c individual series after “prewhitening”, d mean site chronology (Vaganov et al. 1996d)
28
E.A. Vaganov, M.K. Hughes, and A.V. Shashkin
Raw ring widths are rarely used in the dendroclimatological literature. Rather, the large effects of tree age and size are removed from the ring-width time-series for each sample, usually in an entirely empirical manner, so as to produce dimensionless indices. Then, a mean of these is taken, perhaps using a method that reduces the influence of outliers, and some corrections may be made to account for the changing number of samples available for different periods. The resulting time-series of ring-width indices is a representation of the common pattern of variability shared by the sampled trees. It may also be considered as a representation of ring width that is independent of tree age, size, stand position, and disturbance, and so maximizes external environmental influences. Although these methods are subject to constant revision and improvement, a good general introduction is given in Cook and Kairiukstis (1990). A typical example of standardization of ring-width measurements is shown in Fig. 2.3.
2.2.2 Measurement of Wood Density Within Tree Rings The methodological foundations of wood microdensitometry of tree rings were established by Polge (1966, 1969). Lenz et al. (1976) made many refinements of the procedures first proposed by Polge (1966, 1969). Parker and Henoch (1971) reported the first quantitative application of X-ray microdensitometry to conifer tree rings for dendroclimatology and Schweingruber et al. (1979) explored the application to density data of the multivariate statistical tools developed by Fritts (1976). There are two main stages, namely obtaining radiographs of the wood samples and measuring the optical density of the radiograph. This is then used to derive the specific gravity of the wood by using the simple curvilinear relationship that exists between the optical density of the radiograph and the specific gravity of the wood for a given thickness of the wood specimen and settings of the X-ray generator and the geometrical relationship of the source, the sample, and the X-ray film (Polge 1966). Although this procedure is, in principle, simple, great care must be taken at each stage of the preparation of the sample, the production of the radiograph, and its analysis (Figs. 2.4, 2.5, 2.6, 2.7). Thin laths are cut, usually to a standard thickness between 0.8 mm and 1.2 mm, using a special two-bladed saw. Not only is it important that the thickness be consistent along the length of the lath, but also that the cut surface is precisely perpendicular to the long axes of the tracheids. It is often necessary to make several laths from a single increment core, each overlapping the next, but cut at a slightly differing angle so as to maintain the perpendicularity to the tracheid long axes. It is necessary to remove mobile substances that may be Xray opaque by boiling in organic solvents or water. Finally, because water is strongly opaque to X-rays, the moisture content of the wood must be
Tree-Ring Structure in Conifers as an Image of Growth Conditions
29
Fig. 2.4. Plan of radiation chamber. The radiation chamber is separate from the preparation and control rooms (Schweingruber 1988)
reduced to approximately 8–9 % by weight before radiography (Lenz et al. 1976; Schweingruber 1990). The radiographs are produced by exposure of the wood laths, along with a secondary density standard, placed directlyy on single-sided X-ray film with a fine-grain emulsion. The secondary standard is a step-wedge of a plastic with the same ratios of carbon, hydrogen and oxygen as wood. It may be calibrated against a primary standard in the form of a step-wedge of paper produced from the timber under investigation, whose density has been determined by the standard gravimetric–volumetric method. The precise spectrum and intensity of X-rays used is determined by the voltage (typically 8–10 kV) and current (typically 16–20 mA) used and by the window through which the Xrays pass on leaving the source. These settings produce soft X-rays similar to those used in medical applications. These provide the greatest contrast on the radiograph between the least and most dense zones (Polge 1966). Two main approaches are in use to optimize the geometry of the X-ray system. In one, Xraying of wood samples is done in a specially equipped room (Fig. 2.4) with a
30
E.A. Vaganov, M.K. Hughes, and A.V. Shashkin
Fig. 2.5. The relationship between the radiographic–densitometric and volumetric– gravimetric densities. Differences according to species and whether or not mobile materials such as resin and heartwood substances have been extracted (Schweingruber 1988)
significant distance between the X-ray source and the samples and film (2.53.0 m). As a result, the X-rays arriving at the top surface of the wood are almost parallel to one another, reducing parallax problems that would cause the radiograph to be fuzzy rather than clear. The same objective may be achieved by passing the X-ray beam through a long slit and passing a stage carrying the sample, standard step-wedge, and film under the beam at constant speed. In this case, a special room is not needed, as the source and samples need only be a few centimeters apart, although the system must be encased in lead to protect the operator. Such an arrangement can produce geometry equivalent to having a distance of 27 m between the source and the subject (Milsom and Hughes 1978). It is, however, necessary to ensure that the speed of translation is constant and that the output of the X-ray source does not vary. A correctly prepared radiograph will provide a very sharp picture of
Tree-Ring Structure in Conifers as an Image of Growth Conditions
31
Fig. 2.6. Densitometer DENDRO 2003 (Walesch Electronics). The image of the radiograph is displayed on the large circular screen and its optical density is measured along a segment of the diameter of this screen, parallel to the ring boundary. These results are then converted to specific gravity and recorded as various ring width and density variables by the attached computer
the transverse view of the sample, with the same level of detail as may be seen on a properly surfaced wood sample; that is, the individual tracheids should be visible. It should not be possible to differentiate the sapwood and heartwood, because water has been removed; and there should be no patchiness associated with mobile substances such as resin. The optical density of the radiograph is measured using a microdensitometer specifically adapted for use with radiographs of wood (Fig. 2.6). First, the known density values of the step-wedge standard are used to calibrate each radiograph in terms of specific gravity. Then the track to be analyzed is chosen and the density profile of a belt along that track is obtained as a line of detectors traverses the image. It is essential that this line of detectors be held parallel to the ring boundaries if the density profile is not to be smeared (Fig. 2.7). As the peak value of density in the latewood (“maximum latewood density”) is of particular interest and as it may be reached in only one or two latewood tracheids, it is important that the spatial resolution of the densitometer along the long axis of the tree-ring sample be as small as possible, ideally 10 µm or less. This is the approximate diameter in the radial direction of a latewood tracheid. The density profiles are displayed on the computer (Fig. 2.7b) and recorded in a format suitable for further processing and analysis. A tree-ring density profile has both regular elements and features specific to each year. For a quantitative evaluation of these constituents, the following quantitative parameters are used: minimum
32
E.A. Vaganov, M.K. Hughes, and A.V. Shashkin
Fig. 2.7. Orientation and optical slit sizes (width 20 µm) for X-ray film scanning (a) and resulting curve of density (b) with marks of different density threshold values (Schweingruber 1988)
Tree-Ring Structure in Conifers as an Image of Growth Conditions
33
earlywood density, maximum latewood density, and mean density. The density of earlywood is calculated on a segment of the curve located below some empirically selected density level (for example 0.5 g/cm3 or 0.6 g/cm3; Fig. 2.7b). In a similar way, the density of latewood (a segment of the curve above the density level of 0.5 g/cm3 or 0.6 g/cm3) is also calculated. The widths of these two zones are also recorded. It can be demonstrated that, using the appropriate precautions, X-ray microdensitometric measurements reproduce precisely those made gravimetrically–volumetrically (Fig. 2.5). Progress has been made recently with reflected-light microscopy to produce data closely analogous to those derived from X-ray microdensitometry (Sheppard and Graumlich 1996). This has the great potential advantage of removing the need for, and errors associated with, cutting laths normal to the tracheid direction, thus greatly simplifying the process.
2.2.3 Measurement of Radial Tracheid Diameter Within Tree-Rings (Tracheidograms) Files of tracheids in tree rings represent regular variations in cell dimension and wall thickness. Their variability reflects the influence of internal and external factors on the seasonal growth of trees (Larson 1964; Richardson 1964; Fritts 1976; Ford et al. 1978; Melekhov 1979; Vaganov et al. 1985; Filion and Cournoyer 1995; Jardon et al. 1995a, b; Vaganov 1996a, b). Thus, it is valuable to have measured profiles of cell dimensions across tree rings. Most simply, such measurements may be made on thin cross-sections of wood (stained by safranin and set in glycerin jelly or balm) using transmitted light microscopy at a magnification of 250 to 400. A measuring microscope with an accuracy of 0.5 µm in the translation direction of the sample will accelerate measurement. Good optics permit the use of ambient light and more simply prepared samples, for example those prepared by careful polishing of the transverse surface, or cutting with a microtome or very sharp razor. In order to combine the advantage of a measuring microscope for capturing primary data with the advantage of a computer for their accumulation and analysis, a device was constructed at the Institute of Forest in Krasnoyarsk (Vaganov et al. 1979, 1983, 1985). Rather as in a ring width-measuring machine, the operator identifies the boundary between two adjacent cells (the middle lamella) and the linear movement of the sample between two consequent boundaries thus indicated corresponds to the radial size of a cell (Fig. 2.8). The development of image analysis software has permitted the development of systems for the semi-automatic measurement of the anatomic elements of wood (Jagel and Telewski 1990; Park 1990, 1993; Munro et al. 1996; Fig. 2.9). In addition to the sizes of cells and thickness of cell walls, such characteristics as the lumen area, cell wall area, and its perimeter (Jagel and
34
E.A. Vaganov, M.K. Hughes, and A.V. Shashkin
Fig. 2.8. Scheme of the automated setup for measuring and processing data on radial cell sizes within tree-rings (tracheidogram): 1 monitor showing microscope view, specimen table with precision sample translation, 2 computer and printer, 3 typical recording tracheidogram (Vaganov et al. 1985). Each peak represents a tracheid and its diameter is proportional to the radial dimension of the tracheid
Telewski 1990) are measured. The main problem is in getting surfaces or thin sections of sufficiently high quality. When this is done successfully, it is possible to obtain precise measurements of the cell characteristics from an image of the surface (Fig. 2.10; Munro et al. 1996). One problem is that, in such images, the change in image intensity from wall to lumen is not as sudden as might be wished. It turns out that it is not possible to apply the same threshold value to the determination of wall versus lumen in both earlywood and latewood, for example. This creates serious problems for approaches based on
Tree-Ring Structure in Conifers as an Image of Growth Conditions
35
Fig. 2.9. Image analysis system for tree rings (Sheppard and Graumlich 1996)
transforming the image into a binary (black and white) one. Munro et al. (1996) approached this problem by permitting the operator to change the threshold value interactively (Fig. 2.10, upper panel). It was then possible to make repeatable measurements of cell size and double cell-wall thickness in rings of giant sequoia (Sequoiadendron giganteum), as indicated in the lower panels of Fig. 2.10. Files of tracheids in a single tree ring, no less than in different tree rings, contain varying numbers of cells. Therefore there is a problem in the comparative analysis of micro-anatomical features. This problem is solved by means of normalization (standardization) of the number of cells to some standard number (in practice for narrower rings 15 cells, for broader rings 30). The procedure of standardization is done in such a way as not to deform the curve of variability of the cell sizes (Vaganov et al. 1985; Vaganov 1990). The normalization “compresses” or “stretches” the initial “tracheidogram” on an abscissa (number of cells), leaving its ordinate unchanged – the radial cell size. Thus, N, each cell is in the measured sequence (DRi ), where i is the series 1, 2, … N repeated k times (where k is the number of cells in the standard tracheidogram), and then in the new sequence the sizes of cells are averaged in blocks of N cells. The resulting normalized tracheidograms for the several files of cells measured in an individual tree ring may be averaged to produce a mean tracheidogram. This normalization also allows a structural comparison of rings with different numbers of cells. New possibilities arise from the combination of cell dimensions and wood density measurements. This follows from the simple relationship between measured density and calculated cell area (compare with Eq. 2.2):
36
E.A. Vaganov, M.K. Hughes, and A.V. Shashkin
Fig. 2.10. Measurements off anatomicall tracheid h d characteristics h using an image analysis l system: a enlarged wood micro-section and line of scanning, b, c measurement results of one tracheid file (b measurement of radial cell size, c measurement of cell wall thickness). The insert in a shows wall threshold selection as described in the text (Munro et al. 1996)
Tree-Ring Structure in Conifers as an Image of Growth Conditions
37
Fig. 2.11. Inter-annual variability of biomass of single tracheid in the early- (1, EW) W and latewood (2, LW) W of tree-rings in larch trees growing near the polar timber line in northcentral Siberia. Multiyear variations are emphasized in the heavier lines showing 11point running means (Silkin and Kirdyanov 1999)
M W = U X DR DT
(2.3)
where MW in this case is mass of cell wall per linear unit (in micrograms). Silkin and Kirdyanov (1999) measured the density profiles and cell dimension for wood samples of larch (Larix sibirica) and then calculated wall mass per 1 mm of cell length using Eq. 2.3. The chronology of cell mass shows high variability and very similar average data of cell mass for early- and latewood tracheids (Fig. 2.11). If it is assumed that the length of early and late wood tracheids does not differ significantly (Benthel 1964; Skene 1969; Sastry and Wellwood 1971), then the mass of each cell (mass of cell walls) in earlywood and latewood seems to be the same, on average. This gives new opportunities for dendrochronology to reveal the influence of external factors on the accumulation of biomass in wood during a single season and on longer timescales.
38
E.A. Vaganov, M.K. Hughes, and A.V. Shashkin
2.3 Influence of Internal Factors on Tree-Ring Structure in Conifers There is not an unambiguous answer to the question of the degree to which the growth rate of trees (tree-ring width) is under the control of internal (genetic, age, etc.) factors. For example, while there are many reports indicating that, for the majority of situations, the age–growth curves of individual trees correspond to the so-called biological growth curve (Terskov et al. 1981; Shiyatov 1986), there is at least an equal volume of reports that there are significant differences of individual age curves from the biological growth curve (Fritts 1976; Schweingruber 1988; Cook and Kairiukstis 1990). This may be produced by local environmental conditions or by interactions with neighbors during stand development. Mikola (1950) showed that the concavity of the growth curve may be directly related to the density of the forest stand. Naurzbaev et al. (2004) showed that the parameters of growth curves decreased with increasing latitude and elevation in two larch transects, suggesting a temperature-dependence of these parameters. The structure (density of wood, size of cells, other characteristics) of tree rings is also under the control of internal factors (Chavchavadze 1979; Zobel and van Buijtenen 1989; Zobel and Jett 1995). This noticeable genetic control is even exhibited in phenological development. So, ecotypes of European spruce (Picea abies) that are distinguished by earlier or later opening of buds and main shoot growth show differences in tree-ring wood density (Worral 1970). That is, the timing of the opening of buds is a part of the genetic control of wood structure. For 150-year-old spruce trees, it has been shown that late-opening bud ecotypes have lower wood density (Mergen et al. 1964; Birot and Nepveu 1979). For Douglas-fir (Pseudotsuga menziesii), those ecotypes which commence latewood formation earlier and have a longer growing season also produce denser wood (Vargas-Hernandez 1990). Other research on Douglas-fir shows that early bud opening is associated with higher wood density in tree rings (McKimmy 1959; Kennedy 1970). The data for two kinds of pines (Pinus taeda, P. elliottii) show that wood density is negatively correlated with the start date of cell divisions in the lateral meristem and the date of transition to the formation of latewood and is positively correlated with the date of growth cessation (Vargas-Hernandez and Adams 1994). The existence of species-specific relationships between tracheid formation and the growth of certain other plant parts supports the case for a strong genetic control of tracheid formation in both earlywood and latewood. Mitchell (1961) found a relationship between growth of the terminal shoot and the transition to latewood formation in Douglas-fir. Integrating the data on seasonal growth of conifers in the Moscow area showed that earlywood tracheids in Scots pine (P. sylvestris) are formed during growth of the main
Tree-Ring Structure in Conifers as an Image of Growth Conditions
39
Fig. 2.12. Bars showing growth period of needles, shoots and treering formation of pine (a) and spruce (b): 1 growth of terminal shoot, 2 increment of fresh needle mass, 3 increment of dry needle mass, 4 formation of xylem elements in the tree-ring. Circles mark the time of maximum relative growth rate, crosses mark the excess of relative growth rate of dry needle mass increment over fresh. Periods of tracheid formation in the early (a), transitional (b), and late (c) wood zones (Vaganov and Terskov 1977)
shoot and in European spruce (Picea abies) they form during needle growth (Smirnov 1964; Vaganov and Terskov 1977; Fig. 2.12). In jack pine (Pinus banksiana), the first latewood tracheids are formed within three weeks of completion of height growth (Kennedy 1969). Therefore ecotypes from a milder climate adapted to a longer season finish terminal growth later and form tree rings with lower density. For a quantitative evaluation of the influence of genetic factors, the value of heritability (h2) is used, which is the ratio of genotypic variability to phenotypic variability. For example, for Douglas-fir, low values are obtained for wood density (h2 values of 0.2, 0.3; Vargas-Hernandez 1990; Vargas-Hernandez and Adams 1994). In contrast, the density and ratio of early- and latewood have a close connection, so that the percentage of latewood closely correlates with density for the majority of coniferous species (Pereligin 1969; Poluboyarinov 1976; Zobel and Jett 1995). The range of values of heritability (h2) obtained for different kinds of conifers is great: from 0.15 to 0.92 (Goggans 1962; Nicholls et al. 1964, 1980; Kennedy 1966). There have also been attempts to evaluate heritability values for other anatomical features of tree rings. Van Buijtenen (1965) showed significant genetic control of tracheid diameter and cell wall thickness for several conifer species in North America. In loblolly pine (P. taeda), h2 = 0.84 for latewood
40
E.A. Vaganov, M.K. Hughes, and A.V. Shashkin
cell wall thickness and h2 = 0.13 for earlywood cell wall thickness. For Caribbean pine (P. caribaea), similar values of heritability were found for early- and latewood cell wall thickness (h2 = 0.50; Barnes et al. 1983). There is also evidence for strict genetic control of radial tracheid dimensions in European spruce (Picea abies; Boyle et al. 1987). It has been suggested that the significant differences found between heredity values for clones of European spruce (P. alba) are connected with differences in the architecture of the cell walls (Kennedy 1966). Unfortunately, work on the evaluation of the relative influence of genetic and external factors has largely been done on young trees or for the tree rings of juvenile wood (Zobel and Jett 1995). This limits the relevance of these findings to tree-ring chronologies constructed using ring-width measurements, characteristics of wood density, sizes of cells, and cell wall thickness (Vaganov et al. 1985, 1996b; Schweingruber 1988).
2.4 Influence of External Factors on Tree-Ring Structure in Conifers It is necessary to consider the influence of external factors on each of the parameters of tree-ring structure (LT, N, N DR, LW, ρx; Sect. 2.1) separately and in combination. The width of a tree ring (and the number of cells, which is strongly correlated with it; Gregory 1971; Vaganov et al. 1985, 1992) has been a subject of dendrochronological research since the early twentieth century. Many papers and a number of monographs have dealt explicitly with the influence of external factors on variability in tree rings (Fritts 1976, 1991; Hughes et al. 1982; Schweingruber 1988, 1996; Cook and Kairiukstis 1990; Shiyatov 1986; Vaganov et al. 1996b, c). A broad spectrum of external factors, such as temperature and moisture availability, wind, fires, insect outbreaks, industrial pollution, snow avalanches, forest management, and many others, have been considered. The broad use of tree-ring chronologies in ecology at various spatial scales, climatology and hydrology, as well as human history, has promoted the development of the theoretical and methodological fundamentals of dendrochronology and dendroecology (Fritts and Swetnam 1989; Schweingruber 1996). For example, Fritts et al. (1965), examined ring-width variability along a vegetation gradient in the semiarid southwestern United States. They identified patterns of variability in tree-ring width connected with a gradient of dryness, increasing inter-annual variability in precipitation, and an increase in the proportion of the year for which moisture was the limiting factor for ring-width growth (Figs. 2.13, 2.14): 1. Tree-ring width decreases proportionately as total precipitation decreases. 2. The correlation between tree-ring width series from different parts of a tree, and between trees, increases as total precipitation decreases over most
Tree-Ring Structure in Conifers as an Image of Growth Conditions
41
Fig. 2.13. Schematic diagram of the relationship between precipitation and temperature, plant hydration, physiological processes, and formation of a narrow ring in a dry climate (Fritts 1976)
of the vegetation gradient, but then decreases rather dramatically in the immediate neighborhood of the lower forest border. 3. The decrease in correlations near the lower forest border results from an increased frequency of missing rings at the most extreme levels of moisture deficit. 4. Inter-annual variability in precipitation increases as the total precipitation decreases (with decreasing elevation); and so the inter-annual variance of the ring-width series is greatest in the lower part of the gradient where there is least precipitation. Fritts (1976) used a conceptual scheme (Fig. 2.13) of the influence of moisture deficit on the formation of narrow rings in trees to explain these observed patterns. The physiological mechanisms known to cause increased water stress in the tree and to decrease hormone production and the produc-
42
E.A. Vaganov, M.K. Hughes, and A.V. Shashkin
Fig. 2.14. The relationship between the statistics of a time-series of tree rings along changing altitude profiles, beginning at the lower, arid timber line of the south-western United States. For details see text (Fritts et al. 1965)
tion of assimilates are aggregated. Finally these mechanisms result in reduced formation of new xylem cells and hence a narrow ring is produced. The patterns shown in Fig. 2.14 have rather general applicability to the variability of tree-ring width along an environmental gradient of a factor limiting growth. A similar scheme may be devised for temperature (Vaganov 1996a; Shashkin and Vaganov 2000). Minimum tree-ring width, maximum dispersion (inter-annual variance), sensitivity, and percentage of missing rings are observed in trees growing at polar or upper timber lines (Shiyatov 1986; Vaganov et al. 1996b). The external factors essentially influence the size of cells, thickness of cell walls, and finally the density of tree rings. We will now consider some results
Tree-Ring Structure in Conifers as an Image of Growth Conditions
43
illustrating the effects of physical and biological external factors on the formation of wood in conifer trees.
2.4.1 Light (Intensity and Photoperiod) Even if we may reasonably assume that temperature and water availability have direct effects on cambial activity, in the case of light the effect is undoubtedly indirect, being mediated through the photosynthetic tissues. The control of growth by light intensity and photoperiod (day-length) has been examined in several monographs and textbooks (Alexeev 1975; Howe et al. 1995; Kozlowski and Pallardy 1997). It is not possible here to review much of the work in which the effect of light on the height or diameter growth (and tree-ring width) of trees was studied. We will briefly consider some results concerning the influence of light intensity and photoperiod on the anatomy of conifer tree-rings. Richardson (1964) showed a clear positive effect of light intensity and daylength on tracheid cell wall thickness and mean lumen diameter in xylem formed in stems of Sitka spruce (Picea sitchensis) seedlings (Fig. 2.15). Larson
Lux, L. I
Fig. 2.15. The influence of light on anatomical characteristics of seedlings of Sitka spruce (Picea sitchensis) and pine (Pinus radiata): a effect of light intensity (L.I.) on cell wall thickness (means of four spruce seedlings), b effect of daylength (D.L.) on cell wall thickness (means of 27 spruce seedlings), c (see page 44)
44
E.A. Vaganov, M.K. Hughes, and A.V. Shashkin 2-year Sitka spruce
1-year Pinus radiata
Fig. 2.15. c effect of D.L. on radial lumen diameter (means of 12 spruce and 18 pine seedlings; Richardson 1964)
Table 2.2. Mean radial diameter of tracheid produced in apical stem segments (from Larson 1962). LD Long day, SD short day Diameter (µm) Experiment 1 LD–M LD–L SD
(during active needle growth) 15.2 14.5 11.3
Experiment 2 LD–M LD–L SD
(at the termination of needle growth) 14.0 13.5 7.0
Needle length (cm)
14.1 11.7 8.0
(1962, 1964) showed an obvious effect of photoperiod on anatomical characteristics of tracheids in xylem formed in loblolly pine (Pinus resinosa) seedlings. He found that, on a long day, the formation of larger tracheids was associated with greater needle length (Table 2.2.). He showed that this effect was clearly photoperiodic rather than simply photosynthetic. Day-length influences wood density by controlling the formation of earlywood and latewood cell types through the types of cambial derivatives, rather than the width of the xylem increment (Waisel and Fahn 1956). The growth and formation of earlywood was resumed if the trees were returned to the long daylength condition (Wareing and Roberts 1956).
Tree-Ring Structure in Conifers as an Image of Growth Conditions
45
2.4.2 Temperature Dendrochronologists have made many investigations of the effect of temperature on radial tree growth and wood density (Fritts 1976; Hughes et al. 1982; Schweingruber 1996). Significantly less data are available for the temperature effect on the anatomical features of tree rings. Much of the relevant research was conducted on trees growing at high latitudes where temperature is presumably a leading limiting factor. Some research concerning anatomical structure was made on seedlings in controlled conditions. There are some common findings: 1. Temperature is the most important factor for growth initiation in boreal and temperate climates (Creber and Chaloner 1984; Iqbal 1990). At high latitudes, growth (new cell production) ceases in about the middle of August and the duration of the season of wood production is mainly determined by the starting date of cambial activity (Mikola 1962). Leikola (1969) showed that a 0.5 °C deviation in the mean April–May temperature caused significant shifts in the starting date of cambial activity. For the Siberian Subarctic, we found early summer (mid-June to mid-July) temperature and snow melt timing to be very important for the variation in radial growth of larch trees (Hughes et al. 1999; Vaganov et al. 1999; Kirdyanov et al. 2003). Wood production ceases at a much higher temperature than is necessary for its initiation (Denne 1971a). 2. At high latitudes, tree-ring width variations correlate well with average summer (June–August) temperature, but maximum density shows a significant correlation with temperature for a larger part of the growing season – for example, May–September (Fig. 2.16; Briffa et al. 1990, 1992a, 1998; D’Arrigo et al. 1992).A longer growing season due to high temperature will definitely increase the percentage of late wood in tree rings (Larson 1964). 3. Denne (1971a), in experiments with Scots pine (P. sylvestris) seedlings, showed that a temperature increase from 17.5 °C to 27.5 °C produced only a 10 % increase in tracheid diameter. Contrary to this, we found a significant increase of tracheid diameter in the earlywood of larch tree rings near the northern timber line associated with a long-term summer temperature increase (Vaganov 1996b). Note that these effects of early summer temperature on earlywood tracheid diameter occur in the temperature range 5–14 °C. In more southerly sites where the early summer temperature was higher (between 12 °C and 19 °C), the effect of temperature on tracheid diameter was diminished because the temperature was no longer in the range where it was clearly limiting (Vaganov 1996b). Under conditions close to optimal temperature (as in Denne’s experiments), the limiting effect of temperature on tracheid diameter is probably small. 4. Temperature and tracheid wall thickness were inversely correlated in several conifer species (Wodzicki 1971). Similar data were obtained by Antonova and Stasova (1993, 1997). This contradicts results from maxi-
46
E.A. Vaganov, M.K. Hughes, and A.V. Shashkin
Fig. 2.16. Results of a regression analysis to determine the pattern of growth response in Scots pine (from northern Fennoscandia) to temperature in the months September (in year t-1) to October (in year t-0).Values plotted are coefficients from multiple regression analysis of tree-ring maximum latewood density (left) and ring widths (right) in relation to instrumentally recorded temperatures in the region. Two periods were used for the analysis to examine the stability of the relationships: 1876–1925 (dotted lines) and 1926–1975 (solid lines). In addition to the monthly climate variables, the ring-width values from the two preceding years (t-1, t-2) are also included to assess the importance of biological preconditioning of growth in one summer by conditions in preceding years. The analysis shows that maximum latewood density is increased by warm conditions from April to August of year t-0; and a similar, but less strong signal is found in tree-ring widths. Growth in the previous year is also important (Briffa et al. 1990; reprinted by permission from Nature, copyright 1990, Macmillan]
mum latewood density, which is mainlyy determined by cell wall thickness (see Chap. 5). At the upper elevation or northern timber lines, rings with thin-walled cells in the latewood (so-called “light rings”), are produced by a cold autumn or sharp cooling at the end of summer (Fig. 2.17; Filion et al. 1986; Schweingruber 1993). Many of the contradictions in publications on the effect of temperature on tracheid dimensions (diameter, wall thickness) are caused by other uncontrolled but important external factors, such as water supply or light intensity, and by uncertainties in the ranges of strong limitation of one factor and alteration of the limit by another factor. For example, Denne (1971a) chose a temperature range which is close to optimal for growth. Thus there is no pronounced effect of temperature on anatomical structure. In the case of
Tree-Ring Structure in Conifers as an Image of Growth Conditions
47
Antonova and Stasova (1993, 1997), there was no control of the soil water content during the production and formation of latewood tracheids. Hence the apparent negative effect of temperature could come from its indirect effect on water loss from soil due to increased evapotranspiration.
2.4.3 Water The availability of soil water may affect the growth rate and formation of wood, both at long timescales and within a season (Zahner and Oliver 1962; Kozlowski 1968; Creber and Chaloner 1984; Brauning 1999). For example,
48
E.A. Vaganov, M.K. Hughes, and A.V. Shashkin
pine in marshy conditions forms not only narrower tree rings, but rings with smaller absolute size and proportion of latewood (Fig. 2.18). In periods of suppressed growth, a tree ring may have only one or two cells of earlywood and one small-sized thin-walled latewood cell. Considerable variability of cell
Fig. 2.18. Cross-sections of pine wood (Pinus sylvestris) from different site conditions: a peatland, b forest–steppe transition zone, c enlarged micro-section fragment showing formation of false ring in the latewood (reprinted by permission from Schweingruber 1993)
Tree-Ring Structure in Conifers as an Image of Growth Conditions
49
Fig. 2.19. Micro-sections of Pinus ponderosa wood (a) from the semi-arid zone and (b) from a relatively moist site (reprinted by permission from Schweingruber 1993)
size and cell wall thickness may occur within wide tree rings grown in favorable conditions.“False” rings may be produced when small, thick-walled cells are seen at the beginning of the latewood zone and are followed by larger, thin-walled cells (Fig. 2.18). The formation of “false” rings is a common phenomenon when intra-seasonal droughts occur in a precisely designated rainy season, as seen, for example, in the mountains of the American southwest (Fig. 2.19). The layer of larger cells is produced in response to the arrival of the rains at the northern fringes of the Mexican monsoon in early July. However, during certain years, the trees can completely stop growth in the “pre-summer” drought period; and in such a case a “false” ring identified on anatomical features does not differ from the annual ring. An integrated view of tree-ring structure may be gained by plotting frequency distributions of the radial sizes of tracheids (Vaganov et al. 1985; Vysotskaya et al. 1985; Vysotskaya and Vaganov 1989). Pines growing in moist, moderately moist, and dry conditions (Fig. 2.20) show characteristic changes in frequency distributions. Pines from moist conditions have a weakly negatively skewed distribution (a preponderance of large cells), whereas those from moderately moist conditions show a bimodal distribution, which is even more pronounced in the case of trees from dry conditions. As the water deficit increases, the relative number of small tracheids increases and the average value and mode of their sizes decreases. Asymmetric and bi-modal curve distributions can be described as the sum of two normal distributions (DuninBarkovski and Smirnov 1955): − 1 f ( x) = v1 e V 1 2S
( x − d1 )2 2V 12
+ v2
1
V 2 2S
−
e
( x − d 2 )2 2V 22
,
(2.4)
50
E.A. Vaganov, M.K. Hughes, and A.V. Shashkin
Fig. 2.20. Frequency distribution of the tracheid radial dimensions in Pinus sylvestris tree rings from the hydric (1), mesic (2), and xeric (3) sites. See text for futher explanation (Vaganov et al. 1985)
Fig. 2.21. Cell size of latewood (tracheid radial dimension) vs cell size of earlywood in pine tree-rings from the hydric (1), mesic (2), and xeric (3) sites (Vaganov et al. 1985)
where f( f x) is the density probability, d1, d2, Ç1 and s2 are respectively the mean sizes and standard deviations of “contributing” distributions, and n1 and n2 are the relative shares in the common distribution of cells with large (earlywood) and small (latewood) sizes. If we designate A1 and A2 as appropriate amplitudes for the “contributing” distributions, then for the normalized curve distribution n1 and n2 are proportional to the product of early- and latewood. Therefore on the diagrams indicating the connection between the mean sizes of cells in “contributing” distributions, the measurements for tree rings in pine trees from conditions with different moisture levels are divided into pre-
Tree-Ring Structure in Conifers as an Image of Growth Conditions
51
Fig. 2.22. Time-lag between minimum soil water potential (b) and minimum tracheid diameters (a) in spruce tree rings on a “Parabraunerde” site during the summer drought in 1976 (Wilpert 1991)
cise groups (Fig. 2.21). These groups show that, with the increase in moisture deficit, the mean size of earlywood cells decreases as it does in latewood. The dispersion of the cell sizes in latewood increases. The reduction of tracheid sizes in connection with water stress within a growing season was explicitly investigated by Wilpert (1990, 1991). Measuring the water potential of soil and the dynamics of seasonal growth of tree rings in European spruce (Picea abies), he showed precisely that the decrease in the tracheid radial sizes was produced by an intra-seasonal drought (decrease in water potential; Fig. 2.22). In fact, there is a broad range of water potential val-
52
E.A. Vaganov, M.K. Hughes, and A.V. Shashkin
ues over which tracheid radial diameters do not vary significantly, but below some critical value of water potential there is an accelerating decline in cell sizes (Fig. 2.23). This is described by a curvilinear equation which seems to be very similar to those obtained in direct measurements (Kramer and Kozlowski 1983).
Fig. 2.23. Relation between soil water potential (2) and tracheid diameter (1). a Single year (1976) at a “Pseudogley” site. b Nonlinear regression of all data on the “Parabraunerde” site (Wilpert 1991)
Tree-Ring Structure in Conifers as an Image of Growth Conditions
53
2.4.4 Some Other Factors Ionizing radiation is one of the factors rendering the strongest effect on the structure of tree rings in growing trees (Musaev 1993, 1996; Kozubov and Taskaev 1994). The 1986 emergency at the Chernobyl nuclear power station provided a unique opportunity to study the response of woody plants to different doses of irradiation (depending on distance from the station; Fig. 2.24). Lethal damage to cells is observed at high doses, first of all in the cambial zone and in other meristems; and there are signs of various kinds of anatomical anomalies in the structure of tree rings (Fig. 2.25). It is possible to classify and recognize the most frequent anatomical anomalies on wood cross-sections:
Fig. 2.24. The typical anatomical structure of pine tree rings formed after the Chernobyl atomic power station emergency. The open arrow shows a visible disturbance in tracheid structure. The thin arrows indicate tree-ring boundaries (Musaev 1996)
Fig. 2.25. The most typical radiation-related disturbances in tracheid file structure of tree rings: a interruption of file, b dichotomous files, c included file. Growth from pith to bark is indicated by arrows (Musaev 1996)
54
E.A. Vaganov, M.K. Hughes, and A.V. Shashkin
(1) interrupted files indicating loss of cambial initials, (2) dichotomous rows created at the expense of the increase in a number of initials by means of pseudo-transverse division, (3) built-in short rows derived by division of xylem mother cells of limited potential. Formation of large cells at the expense of suppression of the last divisions of xylem mother cells before exit to the zone of enlargement is also quite frequent. Musaev (1996) analyzed in detail the frequency of such anatomical disturbances in annual tree-rings for 1986 (the year of the April emergency) according to distance from the station. The normal, or “background” frequency of each type of disturbance was about 10 %, but their frequency in tree rings near the station rose to 40–45 %. At the distance from the station where the dose of ionizing irradiation was 2–3 times, less the frequency decreased to 20 %; and at the distance of 30 km from the station it did not differ much from the normal frequency (Fig. 2.26).
Fig. 2.26. Frequency of anatomical disturbances of tracheid files in trees at different distances from Chernobyl atomic power station (AS) in 1986 (a) compared with 1985 (b). For a, b, c, see Fig. 2.25 (Musaev 1996)
Tree-Ring Structure in Conifers as an Image of Growth Conditions
55
Musaev (1993, 1996) considered anomalies in tracheid anatomy in tree rings from different parts of the stem (Fig. 2.27) and showed that cell damage in tree rings formed in 1986 near the top of the stem is further from the beginning of the ring than in the lower parts of the stem. This results from more intensive production of cells at the beginning of the season in the upper part of the stem. Comparing tracheidograms with the climatic data, Musaev reconstructed the seasonal dynamics of annual ring growth in 1986 and found when the activity of the emitted radioactive isotopes produced maximal disturbance of the xylem cell-growth process. Defoliation is an important biotic factor influencing the structure of annual rings (whether artificial or by insects; Vaganov and Terskov 1977; Vaganov et al. 1979; Schweingruber 1979; Jardon et al. 1994b; Filion and Cournoyer 1995). For the first year of damage, the width of the tree ring
Fig. 2.27. Dynamics of cell size in 1986 tree ring near Chernobyl (1 km). The arrows show initial disturbances in tracheid files. 1–6 Sample positions in stem and roots (Musaev 1996)
56
E.A. Vaganov, M.K. Hughes, and A.V. Shashkin
decreases and cells with thin walls are formed in the latewood zone. The sizes of the cell lumina (i.e. internal empty spaces of cells) decrease, as does treering density (Fig. 2.28). The next year, the ratio between the size of earlywood and latewood shifts strongly towards latewood (Vaganov and Terskov 1977). Then recovery to a normal level of the anatomical characteristics of tree rings (size of cells, cell wall thickness) accelerates, with recovery of tree-ring width (Fig. 2.29). It is possible to classify the influence of defoliation on tree-ring structure as indirect, operating through the level of growth hormones and assimilates.
Fig. 2.28. Wood micro-section of Larix laricina with tree-rings formed in the indicated insect attack years (a; Jardon et al. 1994b) and microscopic illustration (b, enlarged 200¥) of tree rings in a larch showing anomalous anatomical properties as the result of damage done by larch bud moth. 1 Tree-ring sequence with one probable attack phase, 2 tree-ring sequences with two probable attack phases (Schweingruber 1996)
Tree-Ring Structure in Conifers as an Image of Growth Conditions
57
Fig. 2.29. Variation in cell lumen diameter and ring width at two study sites between 1939 and 1955 (North Quebec, Canada): 1 tree-ring width, 2 mean lumen diameter (Filion and Cournoyer 1995)
58
E.A. Vaganov, M.K. Hughes, and A.V. Shashkin
2.5 Deriving Chronologies for Parameters of Tree-Ring Structure 2.5.1 Variability of Radial Cell Sizes, Cell Wall Thickness, and Wood Density Within Tree Rings The main patterns of variability of cell wall thickness and wood density within tree rings are best considered for separate files of tracheids (Fig. 2.30). In the earlywood zone, where the radial sizes of tracheids exceed 30 µm, the cell wall thickness is small (ⱕ2 µm) and is practically independent of variations in the radial size of cells. This may be seen especially well in ponderosa pine (Pinus ponderosa; Fig. 2.30b). In the first half of the tree ring in the given
Fig. 2.30. Variability of radial tracheid size (1), cell wall thickness (2) and wood density (3) within a tree ring of Siberian larch (a) and ponderosa pine (b)
Tree-Ring Structure in Conifers as an Image of Growth Conditions
59
year, a downturn in the sizes of cells (i.e. formation of “false” rings) is observed, while the cell wall thickness hardly changes at all. In the second half of the season with the beginning of a transition zone of tracheid formation (in larch from 14–15 cells, in ponderosa pine from 37–40 cells), the radial size of cells decreases in a stable way and the cell wall thickness increases up to a certain limit, and then for the last cells to the boundary of the tree ring again decreases. A typical set of relationships may be seen in the diagram of the radial size of cells versus cell wall thickness (Fig. 2.31). The relation of cell wall thickness to the radial size of a cell shown here is probably generally applicable. The zone of the tree ring, for which the cell wall thickness only weakly depends on the size of the tracheids, is formed right at the beginning of the growing season. It can be rather broad, but can involve only two or three cells (as may be seen in the diagram for a larch tree ring). In the latter case, these cells hardly differ from those in the transition zone. As the density of wood is a derivative of change in the radial tracheid size and cell wall thickness, its changes within a tree-ring can differ little from the character of the changes of these parameters. For example, in larch tree-ring density, the cell wall thickness reaches its maximum in the 18th cell, while
Fig. 2.31. Relationship between radial cell size and cell wall thickness in tree rings of Siberian larch (a) and ponderosa pine (b). Broken lines indicate general form of relationships. See text for further explanation
60
E.A. Vaganov, M.K. Hughes, and A.V. Shashkin
Fig. 2.32. Micro-section and the corresponding densitogram of pine (Pinus sylvestris) from the lowlands of Northern Germany (Schweingruber 1996)
maximum density is seen in the 23rd. In most conifers, density and cell wall thickness do not reach a maximum in the last cells of the ring, but more often in the middle of the latewood zone. The diagrams of cell size versus cell wall thickness show that cells with radial sizes between 20 µm and 25 µm have the highest density. Numerous examples are given as densitometric curves (Fig. 2.32).
2.5.2 Acquisition and Statistical Characteristics of “Cell Chronologies” The use of the variability of tree-ring width in dendrochronology is based on two main principles (Fritts 1976): (1) the synchronicity of inter-annual variability of tree-ring series from different trees in a stand, (2) the stability of the response of trees to external effects (climate) during the greater part of their life. Tree-ring width is the characteristic of tree growth that integrates external effects for the whole season. The synchronicity of inter-annual changes in increment between single trees suggests that the common component of response considerably exceeds the individual (Cook and Kairiukstis 1990). This common component is an integral of changes taking place in different intervals of the season, affecting differing components of ring size and struc-
Tree-Ring Structure in Conifers as an Image of Growth Conditions
61
ture. Therefore it may reasonably be assumed that the parameters of tree-ring structure dependent on seasonal growth kinetics will also show synchronicity of inter-annual changes. Densitometric methods provide convincing evidence that the parameters of tree-ring density (especially maximum density) are dendrochronological characteristics, i.e. their inter-annual variability is rather synchronous in different trees in a stand and even within a region (Parker and Henoch 1971; Polge and Keller 1969; Schweingruber et al. 1979; Schweingruber 1987, 1988, 1996). Figure 2.33 shows an example of good synchronism among individual curves of maximum wood density of tree-rings in larch (Larix sibirica) trees at one site in subarctic Siberia (Kirdyanov and Zakharjewski 1996). If the common variations in growth rate during a season predominate over the individual ones, it is reasonable to expect that interannual variations in tracheid dimensions will also be synchronous in tree rings of different trees at one site. We will consider this issue further. The procedure for compiling “cell chronologies” differs a little from that for tree-ring width or maximum density. This is because tracheidograms of separate cell files even inside one annual ring (and tree rings of one year of formation in different trees), contain differing numbers of cells. Therefore, at the first stage, all measured tracheidograms are standardized to a standard number of cells (see Sect. 2.2.1). Statistical evaluations have shown that, to get reliable data on the variability of cell sizes within tree rings, it is necessary to measure five or six files (Vaganov et al. 1985). Then, after standardization of numbers of cells, for each tree-ring the measurements of different files are averaged, giving a mean tracheidogram for that ring in that tree. Then, as the number of cells in normalized tracheidograms is identical in different trees
Fig. 2.33. Annual variability of maximum latewood density in tree rings of Siberian larch for individual samples (1) and the average for the site (2)
62
E.A. Vaganov, M.K. Hughes, and A.V. Shashkin
and in different years of growth, it is possible to construct a “cell chronology” for inter-annual variability of the sizes of cells for this or that item (for example, from the first to the 15th cells in a standardization to 15 cells). So, the variability of conditions right at the beginning of a growing season characterizes the size of cells 1–2, in earlywood it characterizes the size of cells 4–5, in the transition zone cells 9–10, and in the latewood zone cells 12–13. A time-series of one of these (for example the mean cell size for cells 1–2) for all samples for each year represents a “cell chronology” (Vaganov et al. 1994, 1996 c). For example, individual “cell chronologies” are shown in Fig. 2.34 for latewood of Siberian spruce (Picea obovata) from the northern limit of distribution close to the Norilsk region. The individual chronology shows good synchronicity (72 %) until 1978. After that the synchronicity decreases sharply, owing to the heavy influence of pollution from the Norilsk metallurgical plant. The main statistical characteristics of “cell chronologies” and tree-ring width chronologies are compared in Table 2.3. The sites where the trees for measurement were selected are located at the northern tree limit and at various distances to the south of it. The standard deviations of inter-annual variations in cell size in the different zones of the tree ring are proportionately less than in chronologies of tree-ring width. However coefficients of correlation of individual chronologies with mean chronologies are high and differ little from those for typical tree-ring chronologies. There is no pattern in the variability of mean cell size, for example, in the earlywood or latewood zones according to latitude. In fact, the statistical parameters of “cell chronologies”
Fig. i 2.34. Individual di id l cell ll chronologies h l i for f cell ll sizes i in i the h latewood l d off individual i di id l samples l of Siberian larch (1) and the average for the site (2). The vertical broken line indicates 1978. See text for further discussion
Tree-Ring Structure in Conifers as an Image of Growth Conditions
63
Table 2.3. Statistical characteristics of larch cell chronologies. EW Earlywood (positions 4–5 in tree ring), TZ transitional zone (positions 9–10), LW latewood (positions 12–13), TRW chronology of tree-ring width Chronology identifier and variables
Mean cell size (µm)
Standard deviation
Coefficients Variation
Sensitivity
Correlation of individual sample with mean chronology
Polar timber line IKO EW 45.3 TZ 30.2 LW 16.3 TRW index
5.29 6.01 2.54 0.35
0.117 0.199 0.156 0.350
0.107 0.224 0.176 0.450
0.77 0.77 0.74 0.79
GKA EW TZ LW TRW index
42.0 27.4 16.7
4.65 4.70 2.65 0.39
0.110 0.171 0.159 0.390
0.090 0.176 0.135 0.490
0.69 0.66 0.64 0.76
ALL EW TZ LW TRW index
45.5 30.8 16.4
3.06 5.63 2.58 0.31
0.069 0.182 0.157 0.310
0.064 0.183 0.161 0.370
0.67 0.74 0.81 0.83
250 km to the south of polar timber line (KUR) EW 50.1 6.20 0.124 TZ 26.5 5.26 0.198 LW 19.2 3.17 0.166 TRW index 0.32 0.320
0.130 0.234 0.156 0.400
0.77 0.76 0.75 0.74
500 km to the south of polar timber line (KHL) EW 46.8 5.80 0.124 TZ 25.6 5.26 0.205 LW 15.0 2.59 0.173 TRW index 0.28 0.280
0.134 0.252 0.157 0.300
0.68 0.65 0.76 0.72
show that the cell sizes in annual rings of different trees of one site change rather synchronously. This suggests an important role for environmental variations (usually climatic) in controlling such structural parameters. The data in the table testify either that cell sizes are under more rigid control by internal factors than the production of cells during a season and, therefore, the width of an annual ring, or they depend on a kinetic parameter of seasonal formation of a tree ring that changes less than the production of cells during the growing season.
64
E.A. Vaganov, M.K. Hughes, and A.V. Shashkin
2.6 Long-Term Relations Between Different Anatomical Characteristics of Tree Rings The patterns seen in the variability of the radial sizes of tracheids, their cell wall thickness and wood density inside separate annual rings are also seen in the long-term variability of these parameters. The relationship between treering width and the number of cells in files (Fig. 2.35) is most clear and may be considered as a straight line. It shows that the increase in annual increment is mainly determined by increased cell production in the cambial zone during the growing season. The straight-line relationship between the width of annual rings and the number of cells is characteristic of all conifers without exception and of a broad spectrum of ecological conditions. Deviations from it, as a rule, testify to gross infringements of the structure of annual rings and are observed with extreme damage, such as produced by high doses of ionizing radiation or damage of cambial cells by frost (“formation of frost rings”; Glerum and Farrar 1966; Fritts 1976; Schweingruber 1996). The total annual production of cells for a season (and the mean rate of production of cells during a season) influences other quantitative parameters of tree-ring structure. This may be seen in the case of a typical example of treering width, cell size, and maximum wood density variations in larch and spruce at the northern limit of their distribution (Fig. 2.36). For rather wide
Fig. 2.35. Cell number vs tree-ring width of Siberian larch (1) and Scots pine (2) in the southern taiga
Tree-Ring Structure in Conifers as an Image of Growth Conditions
65
Fig. 2.36. Relationship between tree-ring width and cell size in the early- (a) and latewood (b) and between tree-ring width and maximum wood density (c) of a Siberian larch tree growing at the polar timber line
rings (with an increment more than 0.5–0.6 mm) the correlation of the radial cell sizes in earlywood and latewood with tree-ring width is practically absent. However, if the growth rate decreases (narrow rings formed), cell sizes in earlywood and latewood, and maximum wood density, decrease. The lower limit for the size of cells in earlywood and latewood of larch, for example, is approximately 8 µm, the mean size of a cell in the cambial zone. Maximum density decreases to a limit of 0.45 g/cm3, corresponding to a minimum cell wall thickness of about 1.5 µm.
66
E.A. Vaganov, M.K. Hughes, and A.V. Shashkin
The comparison of the long-term variability in cell sizes with both minimum and maximum density also shows interesting outcomes that confirm the relationship between these parameters of tree-ring structure (Table 2.4, Fig. 2.37). For example, the standard deviation of wood-density chronologies appears not to be higher than that for cell chronologies. The dynamics of earlywood cell sizes show changes that are inverse to those in minimum density (Fig. 2.37). In contrast, the size of cells in latewood has a positive association with changes in maximum density. The data in Table 2.5 show that the relationships between cell size and wood density in annual rings of larch trees are stronger than in the annual rings of spruce trees. The observed relationship in the long-term variability of in cell size and wood density can be explained using the diagrams of cell size and cell wall thickness (Fig. 2.38). It can be seen that, for earlywood and transition zone cells, changes in cell wall thickness are inversely proportional to cell size. Such relationships may be approximated by a negative exponential curve. The second part of the diagram describes changes in cell wall thickness and latewood cell size. The relationship between parameters is positive and close to linear. When recalculated as density, the maximum wood density values correspond to maximum sizes of cell wall thickness, but with cell sizes between 15 µm and 25 µm. Therefore minimum wood density is negatively correlated with earlywood cell sizes; and maximum density shows significant correlation (especially when smoothed) with latewood cell sizes (Table 2.5). Seasonality modifies the diagram of relationships between cell size and cell wall thickness. For narrow tree rings (low rate of production of cells) the maximum cell wall thickness is lower than for wide
Table 2.4. Inter-annual variability of cell sizes (µm) and density (g/cm3) in conifer wood at a site in the northern taiga of central Siberia Chronology
Average value Standard deviation
Coefficient Variation
Sensitivity
Larch earlywood Cell size Minimum density
43.5 0.245
5.38 0.026
0.124 0.107
0.130 0.099
Larch latewood Cell size Maximum density
16.7 0.796
2.75 0.081
0.165 0.102
0.156 0.108
Spruce earlywood Cell size Minimum density
39.9 0.315
2.95 0.029
0.074 0.083
0.057 0.077
Spruce latewood Cell size Maximum density
21.0 0.715
3.22 0.049
0.153 0.069
0.145 0.069
Tree-Ring Structure in Conifers as an Image of Growth Conditions
67
Fig. 2.37. Variability of representative site chronologies of radial cell sizes (1) and wood density (2) in tree rings. a Cell size of earlywood and minimum density of Siberian spruce from the northern taiga, b cell size of earlywood and minimum density of Siberian larch from forest-tundra, c cell size of latewood and maximum density of Siberian larch from the forest-tundra. Smoothed curves are also given
68
E.A. Vaganov, M.K. Hughes, and A.V. Shashkin
Table 2.5. Correlation between radial tracheid sizes and wood density in inter-annual variability of tree-ring structure indices in conifer wood at a site in the northern taiga of central Siberia Index Raw data Smoothed data
Earlywood Larch
Spruce
Latewood Larch
Spruce
–0.753** –0.872**
–0.259* –0.722**
0.309* 0.698**
0.169 0.236*
Wood density, g/cm3
Cell wall thickness, µm
* significant at P