Geohazards and Disaster Risk Reduction: Multidisciplinary and Integrated Approaches 3031245407, 9783031245404
This book provides a comprehensive and multidisciplinary approach to addressing geohazards, with topics such as social v
304 9 15MB
English Pages 502 [503] Year 2023
Preface
Acknowledgments
Contents
Part I: Geohazards and Disaster Prevention: Approaches and Case Studies
Chapter 1: Social Vulnerability and Geohazards: Review and Implications
1.1 Introduction
1.2 Extreme Geohazards: Mechanism and Characteristics
1.2.1 Flood Due to Extreme Water Events
1.2.2 Earthquake
1.2.3 Landslide
1.2.4 Sinkhole (Natural and Anthropogenic)
1.2.5 Subsidence
1.3 Societal Impacts of Geo-Disasters
1.3.1 Before Disaster
1.3.1.1 Perception of Disaster Risk
1.3.1.2 Disaster Preparedness
1.3.1.3 Responses to Warning Communication
1.3.2 During Disaster
1.3.2.1 Housing and Homelessness
1.3.2.2 Residence in Areas at High Risk of Disaster Effects
1.3.2.3 Financial Effects
1.3.3 After Disaster
1.3.3.1 Difficulty of Obtaining and Receiving Aid
1.3.3.2 Lack of Access to Housing
1.3.3.3 Stress Associated with Lack of Resources
1.3.3.4 Greater Prevalence of Distress and Depression
1.3.3.5 Posttraumatic Stress
1.3.3.6 Physical Health and Health Problems
1.4 Case Studies of the Social and Economic Impact of Geo-Disasters
1.4.1 Hurricane Katrina (Levee System Failure): New Orleans Case Study
1.4.1.1 During Disaster (from Perspectives of Damage, Evacuation)
1.4.1.2 After Disaster (from the Perspective of Posttraumatic Stress)
1.4.2 Socioeconomic Impacts of Haiti Earthquake
1.4.2.1 Shelter
1.4.2.2 Impact on the Economy
1.4.2.3 Impact on Education
1.4.3 The Economic Loss due to Newcastle Earthquake
1.4.4 Sinkholes
1.5 Discussion on Differential Impacts of Geohazards in Social Vulnerability
1.6 Conclusion and Recommendation
References
Chapter 2: Representations of Catastrophe Victims in Journalistic Narration: L´Aquila Earthquake of 2009
2.1 Introduction
2.2 Semantic Evolution of the Word ``Victim´´
2.3 Representation of Victims as Martyrs: The Case of L´Aquila Earthquake
2.4 Conclusion
References
Chapter 3: Perception of the Self-Exposure to Geohazards in the Italian Coastal Population of the Adriatic Basin
3.1 Introduction
3.2 Methods
3.2.1 Study Areas
3.3 Data Collection
3.4 Data Analysis
3.5 Results and Discussion
3.5.1 Influence of Personal Factors and Climate Risk Awareness on the Perception of Self-Exposure to Geohazards
3.5.1.1 Lignano Sabbiadoro (Friuli-Venezia Giulia Region)
3.5.1.2 Montemarciano (Marche Region)
3.5.1.3 Brindisi (Puglia Region)
3.5.2 Influence of the Proximity to the Coast on the Perception of Self-Exposure to Geohazards
3.5.2.1 Lignano Sabbiadoro (Friuli-Venezia Giulia Region)
3.5.2.2 Montemarciano (Marche Region)
3.5.2.3 Brindisi (Puglia Region)
3.5.3 Overview on Factors Influencing the Perception of Self-Exposure to Geohazards Along the Italian Adriatic Coasts
3.6 Conclusions
References
Chapter 4: Urban Transformation, Collective Memory, and Disaster Preparedness: A Case from Turkey
4.1 Introduction
4.1.1 Urban Transformation and Disaster Management
4.1.2 Disaster Preparedness
4.1.3 Past Experiences and Collective Memory of Disasters
4.1.4 The 1999 Marmara Earthquake
4.1.5 Earthquakes in Balkesir
4.1.6 Research Question and Method
4.1.7 Findings of Household Characteristics
4.1.8 Findings Related to Disaster Preparedness
4.2 Conclusion
References
Chapter 5: Perceptions and Practices of Disaster Governance in Countries with Long History of Centralized Administration: A Ca...
5.1 Introduction
5.2 Literature Overview
5.2.1 Disaster Management and Preparedness
5.2.2 The Role of Local Governments/Municipalities in Disaster Preparedness
5.3 Research Methods and Techniques
5.3.1 Purpose and Problem of the Research
5.3.2 Research Method and Process
5.4 Findings
5.4.1 Risk Analysis: ``It Has a Cost´´
5.4.2 Database on Disadvantaged Groups: ``I Don´t Think We Have a Healthy Data´´
5.4.3 Information on Disaster Material Requirements: ``We Provide Whatever Assistance Is Requested from Us´´
5.4.4 Awareness-Raising Activities: ``A New Generation Is Coming with Its Consciousness Right Now´´
5.4.5 Disaster Response Plan: ``That Plan Will Come from AFAD and We Will Be Involved in It´´
5.4.6 Disasters and Inter-Institutional Cooperation: ``We Mobilize Very Well When Necessary´´
5.4.7 The Central Role of AFAD: ``We Learned This on August 17th´´
5.4.8 Cooperation with Civil Society: ``Let Me Be Clear, NGOs Are Not Very Active´´
5.5 Discussion and Conclusions
References
Chapter 6: Reducing the Risk from Asbestos in the Built Environment During Natural Hazard Events
6.1 Introduction
6.2 Types of Asbestos
6.3 Sources of Asbestos
6.4 Uses of Asbestos
6.5 Asbestos as a Hazard
6.6 Reducing the Asbestos Threat from Earthquakes, Cyclones, Floods, and Tsunamis
6.6.1 Elements of Disaster Risk Management
6.6.2 Preparedness and Risk Reduction
6.6.3 Asbestos-Aware Response and Recovery
6.7 Conclusions
References
Part II: Climate Change Perspectives
Chapter 7: Communicating Weather Risk in the Twenty-First Century: Approaches Using Video Games and Virtual Reality
7.1 Introduction
7.2 Data and Methodology
7.3 Results
7.4 Discussion
7.5 Conclusions
Appendix
References
Chapter 8: Assessing Coastal Flood Impact on Buildings: A Climate Change Perspective from the Developing Nation
8.1 Understanding the Impact of Changing Climate on Coastal Flooding
8.2 Assessing Coastal Flood Impact: A Perspective from a Developing Nation
8.2.1 Climate Change and Disaster Mitigation Policy of the Government
8.2.2 Challenge in Estimating Coastal Flood Impact in a Data-Scarce Region
8.3 Multivariate Building Damage Assessment Model for Vernacular Buildings
8.3.1 Research Methodology
8.3.2 Results and Discussion
8.3.3 Analysing Spatial Damage Post-Cyclone Yass
8.4 Conclusion
References
Chapter 9: Coping with Disasters: What Place Names Can Tell Us About Anthropocene and Climate Change
9.1 Nomina Sunt Consequentia Rerum: A Name, A Destiny
9.2 An Ethnographic Case: La Saxe
9.3 Recurring Events
9.4 Saints and Holy Places
9.5 Conclusions
References
Chapter 10: Climate Change and the Rising Disaster Risk in Africa
10.1 Climate Change
10.1.1 Climate Change Mitigation
10.1.2 Adaptation
10.1.3 Loss and Damage
10.2 Disaster Risk
10.3 Climate Change´s Impacts on Disaster Risk in Africa
10.3.1 100 Years of Climate-Related Disasters in Africa: 1920-2019
10.3.2 The ENSO Events: 1920-2019
10.3.3 ENSO and the Anthropogenic Changing Climate
10.3.4 Neo-normal Disaster Risk Paradigm
10.3.4.1 Being Overtaken by Events
10.3.4.2 Heightened Vulnerability, Exposure and Dwindling Coping Capacities
10.3.4.3 Neo-normal Disaster Risk Paradigm: A Prophecy Comes True
10.3.5 Re-conceptualising Resilience in Neo-normal Disaster Risk Paradigm
10.3.6 Re-politicising CCA and DRR to Counter Neo-normal Disaster Risk Paradigm
10.4 Conclusion
References
Chapter 11: Water and Geohazards in Lower Casamance: Risk Perception and Prevention Strategies of the Populations in the Baïla...
11.1 Introduction
11.2 Study Area
11.3 Data and Methods
11.3.1 Choice of Villages for the Survey
11.3.2 Choice of the Population to Be Interviewed and Analysis of the Research
11.4 Results and Discussion
11.4.1 Risks in the Baïla Marigot Basin
11.4.1.1 Perceptions of Variations in the Precipitation Regime
11.4.1.2 Perceptions of Water Storage and Quality Characteristics in the Baïla Marigot
11.4.1.3 Perceptions of Degradation of Other Natural Resources and Other Constraints in the Baïla Marigot Basin
11.4.2 Strategies and Action Plans for Prevention and Preparedness of Local Communities
11.4.2.1 Strategies for Dealing with Climate Risks in the Area
11.4.2.2 Water Resources Management Strategies in the Area
11.5 Conclusion
References
Chapter 12: The Risk of Marine Erosion in Tunisian Beaches: A Retrospective Reading for a Prospective Vision
12.1 Introduction
12.2 Beaches that Apparently Nothing Predisposed to Important Marine Erosion
12.3 A Risk Not Limited to Managed Coasts and Perceived for More than a Century
12.3.1 Various Evidences and Indicators
12.3.2 What Conclusions?
12.4 An Inexorable Growing Risk, Especially Since the 1980s
12.4.1 A Growing Human Responsibility
12.4.2 An Erosion at Rapid Pace
12.5 The Documents Do Not Reveal Everything and Can Sometimes Mislead
12.5.1 The Corniche Beach of Bizerte
12.5.2 The Case of the Skanès Coast
12.6 A Negative Assessment at Different Levels: Beaches Often Unarmed to Face the Challenges of the Future
12.6.1 With Regard to the General State of the Beaches
12.6.2 With Regard to the Evolution of the Occupation of the Coast and the Attitude of Officials and Decision-Makers
12.6.2.1 About Coast Occupation´s Evolution and Decision-Makers´ Attitude
12.6.2.2 Delay in Soft Protection Methods´ Adoption and Prospective Approaches
12.7 Conclusion: Tunisia´s Sandy Beaches Leave Weak in the Fight Against the Predicted Sea-Level Rise
References
Chapter 13: African Indigenous Understanding of Climate Change and Disaster Risk Nexus
13.1 Indignity and the Science
13.2 Indignity and Climate Change Discourses: Global Perspectives
13.2.1 Indigenous Observations of Changing Climate
13.2.2 Indigenous Resilience Practices
13.2.3 Credibility of Indigenous Knowledge
13.2.4 Integrating Indigenous Knowledge Systems and the Science
13.2.5 Challenges in Integrating Indigenous and Scientific Knowledge
13.3 African Indigenous Narrative on Climate Change and Disaster Risk Nexus
13.3.1 The Weather Is out of Mezzan (Balance or Equilibrium)
13.3.2 ``We Are So Tired´´
13.3.3 More Months of Droughts than Rainfalls
13.3.4 Extreme Rain or Dryness
13.3.5 Superficial Rains
13.3.6 Humankind Disturbs God and Ancestors
13.4 Indigenous Management of Risk of Climate Change and Variability
13.4.1 Predicting Climate Hazards
13.4.2 African Indigenous Resilience Wisdom for Managing Climate Crisis
13.4.2.1 Kulang´s Resilience Model
13.4.2.2 El majel: A Coping Mechanism to Extreme Weather Events in Tunisia
13.4.2.3 Diversifying Livelihood Options
13.4.2.4 Collective Resilience
13.4.2.5 Resilient Infrastructure
13.5 Conclusion
References
Part III: Resilience and Disaster Preparedness
Chapter 14: Building Resilience in Times of New Global Challenges: A Focus on Six Main Attributes
14.1 Introduction
14.2 Analysis of Resilience Attributes
14.2.1 Safety
14.2.2 Robustness
14.2.3 Adaptive Capacity
14.2.4 Sustainability
14.2.5 Governance
14.2.6 Anamnesis
14.3 Conclusions
References
Chapter 15: Community Resilience Through Recovery: Capacity Building and Sustainability
15.1 Introduction
15.2 Relationship Between Community-Based Recovery and Resilience
15.3 Influential Factors in Community Recovery and Subsequent Trends
15.4 Communities´ Recovery Experiences in GEJET
15.4.1 Influential Factors in GEJET Recovery
15.5 Recovery Operations and Activities
15.5.1 Damage Reduction Measures
15.5.1.1 Miyagi Prefecture
15.5.1.2 Iwate Prefecture
15.5.2 Community Activities in Affected Areas
15.5.2.1 Miyagi Prefecture
15.5.2.2 Iwate Prefecture
15.6 Recovery Trends
15.7 Opportunities and Challenges of GEJET
15.8 Conclusions and Recommendations
References
Chapter 16: Community Resilience Through Local Action: AKAH´s Winter Preparedness and Avalanche Readiness Programme
16.1 Introduction
16.2 The Aga Khan Agency for Habitat (AKAH)
16.3 Snow Avalanche: Dominant Winter Hazard
16.4 AKAH´s Winter Preparedness and Avalanche Readiness Programme
16.5 Programme Framework
16.5.1 Pre-Avalanche Season
16.5.1.1 Identifying and Prioritising Avalanche-Prone Settlements
16.5.1.2 Village Disaster Management Plan (VDMP)
16.5.1.3 Community Emergency Response Team (CERT)/Volunteers
16.5.1.4 Community Awareness and Education
16.5.1.5 Emergency Communication
16.5.1.6 Weather Monitoring Posts (WMPs)
16.5.1.7 Capacity Building and Drills
16.5.1.8 Stockpiles
16.5.1.9 Mitigation Projects
16.5.1.10 Self-Evaluation Exercise
16.5.2 During an Avalanche Season
16.5.2.1 Weather and Avalanche Advisory Service
16.5.2.2 Monitoring of WMP Performance
16.5.3 Post-Avalanche Season
16.5.3.1 Reflection and Learning
16.6 Recommendation and Conclusion
References
Chapter 17: Civic Resilience: Botanical Gardens in North America, Birth, Development, and Environmental Awareness
17.1 Introduction: Origins of the `Columbian Exchange´
17.2 Botanical Gardens
17.3 The Network
17.4 Botanical Gardens in New York
17.5 Botanical Gardens and the City
17.6 The Botanical Garden: An Urban Artwork
17.7 Actions in the Garden
17.8 Some Experiences, in Europe and America
17.9 Conclusion
References
Chapter 18: Measuring Willingness to Pay for Community-Based Resilience Training in the Southeast USA
18.1 Introduction
18.2 Review of Economic Analyses of Community-Based Resilience Programs
18.3 Why Use Contingent Valuation for Valuing Community-Based Resilience Programs
18.4 Contingent Valuation Estimation and Design
18.5 Estimation Strategy for WTP
18.6 Parameter Estimates for Explanations of Being WTP
18.7 WTP Estimates and Aggregation
18.8 Discussion
18.9 Conclusion
Appendix
References
Chapter 19: Where There Is Smoke: Normalizing Community Preparedness and Geohazard Resilience: A Wildfire Perspective
19.1 Introduction
19.1.1 The Big Picture: The Sendai Framework for Disaster Risk Reduction
19.2 Some Theory of Motivation
19.2.1 Importance of the Social Microclimate
19.2.2 Dependent Others
19.2.3 The Awareness-Preparedness Gap
19.3 Giving People Time: Workplace Leave
19.4 Giving People Money: Financial Incentives and Awards
19.4.1 Rewarding Best Practice
19.4.2 Fire-Safe Seminars
19.4.3 Value Adding
19.4.4 Insurance Premiums
19.4.5 Civic Awards: From Individuals to Whole Towns
19.4.6 Farmers
19.5 The Social Microclimate
19.6 Decision-Making, Adaptive Rewards, and Dynamic Risk Assessment (DRA)
19.6.1 In Summary
References
Chapter 20: Istanbul Resilience Approach Against Earthquake
20.1 The Authenticity of Modern-Day Is the Urban Life
20.2 Urban Resilience Characteristics
20.3 What Is Urban Resilience?
20.4 When Does Earthquake as a Natural Event Turn into Disaster?
20.5 lstanbul and Earthquake
20.6 Some Projects and Implementations for Istanbul Against Earthquake
20.7 Istanbul Must Foster Its Resilient Ability, Capability, or Capacity
20.7.1 Check the Earthquake Realities of Istanbul
20.7.2 Check the Potential Secondary Hazards and Disaster Risk Dynamics Related to Earthquake
20.7.3 Check the Urban Resilience Characteristics of Istanbul for Earthquake Threat
20.8 Istanbul Resilience Approach Against Earthquake
20.9 Istanbul Sustainable Resilience Strategy Against Earthquake
References
Part IV: Pandemic, Vulnerabilities and Ethics
Chapter 21: The Covid-19 Protection Index (CPI) as a Way to Identify Vulnerabilities and Disparities Across Brazilian Territor...
21.1 Introduction
21.2 Methodology
21.3 CPI Applications
21.3.1 Mapping the Vulnerable Regions
21.3.2 Simulating the Pandemic in Unequal Territories
21.3.3 Territorial Vulnerabilities and Covid-19 Vaccination
21.4 Final Considerations
Supplementary Material
References
Chapter 22: The Social Vulnerability Index: A Literature Review
22.1 Introduction
22.2 Case Studies on the Construction of a Social Vulnerability Index on National and Local Scales
22.3 Case Studies on Social Vulnerability to Climate Change and Natural Hazards
22.4 Case Studies on the Social Vulnerability Index to COVID-19
22.5 Brief Concluding Remarks
References
Chapter 23: Geoethics, Environmental Law and the Necessary Dialogue Between Knowledges
23.1 Introduction
23.2 Towards a Definition of Geoethics
23.3 Geoethics, Morality and Environmental Law
23.4 Anthropocene and Ecological Humanism
23.5 The Contribution of Geoethics
23.6 The Necessary Interaction Between Disciplines
23.7 Geoethics and Law
23.8 Conclusions
References
Recommend Papers


![Disaster Risk Reduction and Resilience [1st ed.]
9789811543197, 9789811543203](https://ebin.pub/img/200x200/disaster-risk-reduction-and-resilience-1st-ed-9789811543197-9789811543203.jpg)

![Disaster Management and Risk Reduction: Multidisciplinary Perspectives and Approaches in the Indian Context: Proceedings of NERC 2022 [1 ed.]
9789819963959, 9789819963942](https://ebin.pub/img/200x200/disaster-management-and-risk-reduction-multidisciplinary-perspectives-and-approaches-in-the-indian-context-proceedings-of-nerc-2022-1nbsped-9789819963959-9789819963942.jpg)
![Disaster Management and Risk Reduction: Multidisciplinary Perspectives and Approaches in the Indian Context: Proceedings of NERC 2022 [1 ed.]
9789819963942, 9789819963959](https://ebin.pub/img/200x200/disaster-management-and-risk-reduction-multidisciplinary-perspectives-and-approaches-in-the-indian-context-proceedings-of-nerc-2022-1nbsped-9789819963942-9789819963959.jpg)
![Disaster Risk Reduction for Resilience: Disaster Risk Management Strategies [1st ed. 2022]
9783030721954, 9783030721961, 3030721957](https://ebin.pub/img/200x200/disaster-risk-reduction-for-resilience-disaster-risk-management-strategies-1st-ed-2022-9783030721954-9783030721961-3030721957.jpg)

File loading please wait...
Citation preview
Advances in Natural and Technological Hazards Research
Sebastiano D’Amico Francesco De Pascale Editors
Geohazards and Disaster Risk Reduction Multidisciplinary and Integrated Approaches
Advances in Natural and Technological Hazards Research Volume 51
The book series entitled Advances in Natural and Technological Hazards is dedicated to serving the growing community of scholars, practitioners and policy makers concerned with the different scientific, socio-economic and political aspects of natural and technological hazards. The series aims to provide rapid, refereed publications of topical contributions about recent advances in natural and technological hazards research. Each volume is a thorough treatment of a specific topic of importance for proper management and mitigation practices and will shed light on the fundamental and applied aspects of natural and technological hazards. Comments or suggestions for future volumes are welcomed.
Sebastiano D’Amico • Francesco De Pascale Editors
Geohazards and Disaster Risk Reduction Multidisciplinary and Integrated Approaches
Editors Sebastiano D’Amico Department of Geosciences University of Malta Msida, Malta
Francesco De Pascale Department of Foreign Languages, Literatures and Modern Cultures University of Turin Turin, Italy
ISSN 1878-9897 ISSN 2213-6959 (electronic) Advances in Natural and Technological Hazards Research ISBN 978-3-031-24540-4 ISBN 978-3-031-24541-1 (eBook) https://doi.org/10.1007/978-3-031-24541-1 © The Editor(s) (if applicable) and The Author(s), under exclusive license to Springer Nature Switzerland AG 2023 This work is subject to copyright. All rights are solely and exclusively licensed by the Publisher, whether the whole or part of the material is concerned, specifically the rights of translation, reprinting, reuse of illustrations, recitation, broadcasting, reproduction on microfilms or in any other physical way, and transmission or information storage and retrieval, electronic adaptation, computer software, or by similar or dissimilar methodology now known or hereafter developed. The use of general descriptive names, registered names, trademarks, service marks, etc. in this publication does not imply, even in the absence of a specific statement, that such names are exempt from the relevant protective laws and regulations and therefore free for general use. The publisher, the authors, and the editors are safe to assume that the advice and information in this book are believed to be true and accurate at the date of publication. Neither the publisher nor the authors or the editors give a warranty, expressed or implied, with respect to the material contained herein or for any errors or omissions that may have been made. The publisher remains neutral with regard to jurisdictional claims in published maps and institutional affiliations. This Springer imprint is published by the registered company Springer Nature Switzerland AG The registered company address is: Gewerbestrasse 11, 6330 Cham, Switzerland
Preface
The term “geohazard” is a widely used term for scientists, authorities, and practitioners, indicating the natural processes occurring in the environment that constitute a damaging event for people. The entire world’s population is exposed to geohazards in different ways and degrees. Although in human history geohazards have caused many casualties, economic loss, and damage to cultural heritage, the culture of risk prevention is not yet widespread among the world’s population. In fact, disaster risk reduction (DRR) activities should focus on enhancing capacities, strategies, and action plans in terms of prevention and preparedness of local communities. Therefore, this book hosts several chapters that, through an integrated and multidisciplinary approach, investigate geohazards and disaster prevention presenting new approaches and case studies (Part I), new climate change perspectives (Part II), relationships between resilience and disaster preparedness (Part III), and the connections between pandemics, different types of vulnerability, and ethics (Part IV). On a global scale, there is no country that is immune to natural events; in particular, these events turn into disasters when they cause serious repercussions on the population, both in terms of human and economic losses, and contribute to a worsening of the quality of life. The scientific community has made considerable efforts to evaluate the causes and effects of these events on the environment and the population, while the competent authorities, in order to address and/or minimize the negative impacts of natural events, have invested significant financial resources (De Pascale et al. 2019). A theme dealt with in several chapters is that of the perception of risk. From some studies on the perception of volcanic risk in New Zealand, conducted by Paton et al. (2000), it emerged that, although the probability and intensity of the eruption effects remain constant, the continuous population growth and economic development in the surrounding area increase vulnerability and, consequently, the risk. However, again according to Paton et al. (2000), public perception may not reflect this process. The perception of risk is a highly interpretative and dynamic process; it requires v
vi
Preface
more intellectual judgment and is not necessarily correlated with worry, which tends to refer more to emotional reactions (Sjöberg 2006). The perception of risk is a cognitive process present in several daily activities that orient the behavior of people with respect to the impact of uncertain events (Crescimbene et al. 2015). Pidgeon et al. (1992) defined perception of risk as personal beliefs, attitudes, judgments, and feelings, as well as the broader social or cultural values that individuals adopt toward risks and their benefits. To correctly assess the risk, it is not enough to know the hazard, an intrinsic characteristic of the territory, but it is also necessary to estimate the vulnerability, which is another prevailing theme in this volume. Social vulnerability refers to the processes by which people could potentially be harmed by the normal environmental phenomena of floods, storms, extreme temperatures, fires, and droughts. It is also conditioned by factors that are difficult to translate into quantitative terms: culture, historical memory, relations between actors, power relations, economic and political interests, and, indeed, the perception by citizens (De Pascale et al. 2019). For example, climate change alone cannot cause or increase disasters. There must be vulnerabilities. Even where climate change exacerbates risks, we can choose to remediate vulnerability to avoid disasters. There is a need to integrate the full range of risk management approaches from improved preparedness and response to long-term disaster risk reduction. Indeed, a holistic approach recognizes that climate change adaptation and mitigation responses are closely linked and involve multiple sectors, stakeholders, and the socio-economic environment. The enhancement of community resilience also requires the use of scientifically sound information, and this volume aims to be an important reference point in the field of disaster studies for scientists and professionals. References Crescimbene M, La Longa F, Camassi R, Pino NA (2015) The seismic risk perception questionnaire. In: Peppoloni S, Di Capua G (eds) Geoethics: the role and responsibility of geoscientists. Geological Society, London, Special Publications, pp 419–427 De Pascale F, Antronico L, Coscarelli R (2019) La percezione del rischio idrogeologico in Calabria: il caso studio della Costa degli Dei. Archivio di Studi Urbani e Regionali 50:124, 171–199 Paton D, Smith LM, Johnston D (2000) Volcanic hazards: risk perception and preparedness. N Z J Psychol 29(2):86–91 Pidgeon N, Hood C, Jones D, Turner B, Gibson R (1992) Risk perception. In: Royal Society Study Group (ed) Risk analysis, perception and management. Royal Society, London, pp 89–134 Sjöberg L (2006) Worry and risk perception. Risk Anal 18(1): 85–93. DOI: 10.1111/ j.1539-6924.1998.tb00918.x Msida, Malta Turin, Italy
Sebastiano D’Amico Francesco De Pascale
Acknowledgments
We are grateful to all the authors for their close cooperation while preparing their contributions. We also gladly acknowledge all the referees, belonging to a number of research institutions located worldwide. Their careful reading and constructive suggestions contribute to the standard of the final versions of each manuscript collected in this book. Special thank go to Annette Buettner, Daniel Jagadisan, Lara Glueck, and all the editorial staff for their professional assistance and technical support during the entire publishing process. Sebastiano D’Amico Francesco De Pascale
vii
Contents
Part I
Geohazards and Disaster Prevention: Approaches and Case Studies
1
Social Vulnerability and Geohazards: Review and Implications . . . Boo Hyun Nam, Shinwoo Choi, Timothy Copeland, and Yong Je Kim
2
Representations of Catastrophe Victims in Journalistic Narration: L’Aquila Earthquake of 2009 . . . . . . . . . . . . . . . . . . . . . . . . . . . . . Marianna Boero
3
4
5
6
Perception of the Self-Exposure to Geohazards in the Italian Coastal Population of the Adriatic Basin . . . . . . . . . . . . . . . . . . . . . Cristina Casareale, Eleonora Gioia, Alessandra Colocci, Noemi Marchetti, and Fausto Marincioni Urban Transformation, Collective Memory, and Disaster Preparedness: A Case from Turkey . . . . . . . . . . . . . . . . . . . . . . . . Fahri Çaki and Alper Uzun Perceptions and Practices of Disaster Governance in Countries with Long History of Centralized Administration: A Case Study of Balikesir Municipalities, Turkey . . . . . . . . . . . . . . . . . . . . Fahri Çakı and Alper Uzun
39
49
73
89
Reducing the Risk from Asbestos in the Built Environment During Natural Hazard Events . . . . . . . . . . . . . . . . . . . . . . . . . . . . 115 Charles Kelly and David Hodgkin
Part II 7
3
Climate Change Perspectives
Communicating Weather Risk in the Twenty-First Century: Approaches Using Video Games and Virtual Reality . . . . . . . . . . . . 135 Jase Bernhardt ix
x
Contents
8
Assessing Coastal Flood Impact on Buildings: A Climate Change Perspective from the Developing Nation . . . . . . . . . . . . . . . 147 N. Aishwarya, H. A. Bharath, and D. Sutapa
9
Coping with Disasters: What Place Names Can Tell Us About Anthropocene and Climate Change . . . . . . . . . . . . . . . . . . . 165 Elisabetta Dall’Ò
10
Climate Change and the Rising Disaster Risk in Africa . . . . . . . . . . 181 Gatkuoth Kai Bol and Dewald van Niekerk
11
Water and Geohazards in Lower Casamance: Risk Perception and Prevention Strategies of the Populations in the Baïla Marigot Basin (Casamance, Senegal) . . . . . . . . . . . . . . . . . . . . . . . . 211 Cheikh Faye and Cheikh Abdou Aziz Sy Sadio
12
The Risk of Marine Erosion in Tunisian Beaches: A Retrospective Reading for a Prospective Vision . . . . . . . . . . . . . . 233 Ameur Oueslati
13
African Indigenous Understanding of Climate Change and Disaster Risk Nexus . . . . . . . . . . . . . . . . . . . . . . . . . . . . . . . . . 269 Gatkuoth Kai Bol and Dewald van Niekerk
Part III
Resilience and Disaster Preparedness
14
Building Resilience in Times of New Global Challenges: A Focus on Six Main Attributes . . . . . . . . . . . . . . . . . . . . . . . . . . . 293 Maurizio Indirli, Ruben Paul Borg, Antonio Formisano, Lucia Martinelli, Anna Marzo, Francesco Romagnoli, and Fabio Romanelli
15
Community Resilience Through Recovery: Capacity Building and Sustainability . . . . . . . . . . . . . . . . . . . . . . . . . . . . . . . . . . . . . . 321 Zhila Pooyan and Akihiko Hokugo
16
Community Resilience Through Local Action: AKAH’s Winter Preparedness and Avalanche Readiness Programme . . . . . . . . . . . . 345 Deo Raj Gurung, Rukhshona Saratbekova, Sayed Ahmad Sahim, Khwaja Momin Walizada, Sher Wali, Deedar Karim, Rahim Dobariya, and Nusrat Nasab
17
Civic Resilience: Botanical Gardens in North America, Birth, Development, and Environmental Awareness . . . . . . . . . . . . 365 Flavia Schiavo
Contents
xi
18
Measuring Willingness to Pay for Community-Based Resilience Training in the Southeast USA . . . . . . . . . . . . . . . . . . . . . . . . . . . . 387 Wesley Wehde
19
Where There Is Smoke: Normalizing Community Preparedness and Geohazard Resilience: A Wildfire Perspective . . . . . . . . . . . . . 409 Rachel Westcott
20
Istanbul Resilience Approach Against Earthquake . . . . . . . . . . . . . 427 Betül Ergün Konukcu
Part IV
Pandemic, Vulnerabilities and Ethics
21
The Covid-19 Protection Index (CPI) as a Way to Identify Vulnerabilities and Disparities Across Brazilian Territories . . . . . . 459 Bruna Gaudencio Guimarães, Maira Begalli, Patrícia Magalhães, Pamela M. Chiroque-Solano, Maria Carolina Maziviero, and José Paulo Guedes Pinto
22
The Social Vulnerability Index: A Literature Review . . . . . . . . . . . 483 Francesco De Pascale
23
Geoethics, Environmental Law and the Necessary Dialogue Between Knowledges . . . . . . . . . . . . . . . . . . . . . . . . . . . . . . . . . . . . 497 Livio Perra
Part I
Geohazards and Disaster Prevention: Approaches and Case Studies
Chapter 1
Social Vulnerability and Geohazards: Review and Implications Boo Hyun Nam, Shinwoo Choi, Timothy Copeland, and Yong Je Kim
Abstract Vulnerability assessment associated with natural hazards is a complex process that needs to account for multiple dimensions of vulnerability, including both physical and social factors. Physical vulnerability is a function of the intensity, magnitude, and frequency of the hazard, the degree of physical protection provided by the natural and built environment, and/or the resistance levels of the exposed elements. On the other hand, social factors such as preparedness and institutional and non-institutional abilities for handling natural hazards events are also important elements for a society’s vulnerability to natural hazards. Social vulnerability refers to the underlying factors leading to the inability of people, organizations, and societies to withstand impacts from the natural hazards. The concept of social vulnerability has been used widely to understand individuals’ and groups’ vulnerability in terms of preparing and recovering from natural disasters. Geohazards, such as earthquake, landslide, sinkhole, land subsidence, coastal erosion, etc., are not the only natural hazards with large uncertainties at the extreme end of the hazard spectrum and with potentially large impacts on humanity. Increasing global resilience and reducing the disasters induced by the occurrence of extreme hazards at an acceptable economic cost requires a solid-scientific understanding of B. H. Nam (✉) Department of Civil Engineering, Kyung Hee University, Yongin-si, Gyeonggi-do, Republic of Korea e-mail: [email protected] S. Choi School of Social Work, Texas State University, San Marcos, TX, USA e-mail: [email protected] T. Copeland Department of Civil, Environmental, and Construction Engineering, University of Central Florida, Orlando, FL, USA e-mail: [email protected] Y. J. Kim Department of Civil and Environmental Engineering, Lamar University, Beaumont, TX, USA e-mail: [email protected] © The Author(s), under exclusive license to Springer Nature Switzerland AG 2023 S. D’Amico, F. De Pascale (eds.), Geohazards and Disaster Risk Reduction, Advances in Natural and Technological Hazards Research 51, https://doi.org/10.1007/978-3-031-24541-1_1
3
4
B. H. Nam et al.
the hazards: from understanding of the physics of different geohazards, their analysis and monitoring, through interpretation, modeling, hazard assessment, and forecasting of single or concatenated events, to delivery of the scientific forecasts to disaster management authorities. However, the detrimental impact of specific types of geohazards on vulnerable and marginalized groups has not been studied further. The proposed book chapter will review and investigate implications of social vulnerability to different geohazards. It can be hypothesized that social vulnerability is likely to vary with the type and mode of the geohazard, the rate of onset of the geohazard, the velocities, the area affected, and the geohazard’s temporal persistence in the environment. First, the book chapter will present how the concept of social vulnerability can be applied to expand our understanding on the specific geohazards’ socio-economic impact. Additionally, the book chapter will cover the literature that examined the differential impacts of geohazards on various groups within our society caused by the differences in socioeconomic status (SES). Last, the chapter will present specific domestic and international case studies to illustrate examples of geohazards and introduce the detrimental socio-economic impacts on the given community. Examples include, but not limited to, sinkholes in central Florida, land subsidence in South Korea, earthquakes in California, and more. Keywords Geohazards · Social vulnerability · Global resilience · Disasters
1.1
Introduction
Geohazards, such as floods, earthquakes, tsunamis, sinkhole, and landslides have caused and are increasingly causing significant loss of life and property. These losses predominately occur during extreme, high impact events. The scale of these geo-disasters caused by geohazards is illustrated in the long-lasting societal and economic impacts that come as a result of recent extreme events. To reduce geo-disasters induced by extreme hazards in a cost-effective manner and increase global resilience to geohazards, there needs to be a solid-scientific understanding of these hazards. Due to a growing population expanding into hazardous areas, there has been a rapid increase in the loss of life and property as a result of natural hazards, particularly geohazards. Cities, especially in areas that experience high levels of poverty and vulnerability, are sprawling into hazardous areas, resulting in people working and living in poorly constructed buildings. All people living in hazardous areas are considered part of a vulnerable population; however, the social impacts of this type of exposure tend to disproportionately fall on those in society-minorities. Often, these groups are the least prepared for an emergency and have less access to resources to adequately prepare for geo-disasters. Another contributing factor is the tendency to live in substandard housing in high-risk locations while also lacking the knowledge or connections necessary to access resources to speed up the recovery process (Dunning and Durden 2011; National Research Council 2006).
1
Social Vulnerability and Geohazards: Review and Implications
5
The effects of geo-disasters can be long-lasting and disruptive while threatening the well-being and safety of individuals, families, and communities (Gillespie and Danso 2010). Unfortunately, proper disaster response and recovery requires a vast amount of financial and community resources, which are not always sufficient in meeting the needs of those most vulnerable. The impact of disasters can be felt community-wide, but socially vulnerable populations tend to be disproportionately impacted by altered community fabric, economic hardship, and compromised mental and physical health (Bergstrand et al. 2015). The term social vulnerability can be defined as people’s “capacity to anticipate, cope with, resist and recover from the impacts of a natural hazard” (Wisner et al. 2004). This differs from one’s physical vulnerability which focuses on the susceptibility to biological changes, such as physiological functioning and anatomical structure, and instead focuses on vulnerability to behavioral changes. There is an array of social factors that disproportionately impact an individual or communities’ level of social vulnerability during a disaster (Benevolenza and DeRigne 2019; Singh et al. 2014). During and after a disaster, individuals living with physical or mental health challenges, immigrants, older or dependent adults, children, refugees, and people living in poverty are among the most socially vulnerable (Amaratunga and O'Sullivan 2006; McDermott et al. 2016; Peek and Stough 2010). These individuals tend to be less equipped for emergencies making them more likely to be displaced from their home, separated from family members, or require assistance to meet basic needs after disasters strike (Rufat et al. 2015; Vu and Vanlandingham 2012). Socially vulnerable populations also experience some disproportionate risks during the disaster recovery stage as well. Some of these risks include experiencing disproportionate amounts of abuse and neglect, mental health pathology (i.e., posttraumatic stress symptoms (PTSS) and depression) and have a higher chance of contracting diseases as a result of poor living conditions (Amaratunga and O'Sullivan 2006; Boscarino et al. 2014; Gutman and Yon 2014; Jia et al. 2010; Kouadio et al. 2012; La Greca et al. 2019; Parkinson and Zara 2013). Much of the previous research and literature on social vulnerability during disasters were focused on hurricane survivors. One of these studies, conducted after Hurricane Katrina, found that mental and physical health symptoms among Vietnamese immigrants were significantly higher 1-year post-disaster than they were pre-disaster (Vu and Vanlandingham 2012). Another study found that in China after the 2008 Sichuan earthquake, older adults were 14.5% more likely to demonstrate PTSS than younger adults (Jia et al. 2010). Previous literature has consistently observed that children show higher-risk levels for experiencing post-disaster physical and mental health impairments than adults based on an association with their dependence on caregivers, having fewer coping resources, and a developing brain (Becker-Blease et al. 2010; Goldmann and Galea 2014; Rufat et al. 2015). Being that individuals with inadequate socioeconomic resources are more likely to be living in polluted, low-lying areas prior to disaster, they are at a disproportionate risk of experiencing malnutrition, physical injury, and waterborne and respiratory diseases when compared to those with greater economic means (Keim 2011; Zoraster 2010). It has also been found that collapse of healthcare
6
B. H. Nam et al.
infrastructure, inability to access basic needs, and lack of insurance contribute to the high mortality rates of socially vulnerable disaster-affected populations (Curtis et al. 2007; Smiley et al. 2018; Zoraster 2010). One example of this was demonstrated after Hurricane Katrina where mortality rates were the highest among those living in poverty and older adults (Zoraster 2010). Over the past 20 years, the idea of social vulnerability has started to gain significant attention. Further research is needed to understand the factors that increase the level of risk for individuals, families, and communities living in disaster-affected regions (Bergstrand et al. 2015). Exploring these factors further can enhance recovery and response practices to better serve socially vulnerable populations throughout all phases of a disaster. In this paper, we have reviewed and investigated implications of social vulnerability to different geohazards in four sections. The first section we summarize mechanisms and characteristics of different geohazard types to expand our scientific/ engineering understanding of those geohazards. The second presents the concept of how social vulnerability can be applied to expand our understanding on geohazards’ socioeconomic impact. The third chapter will present specific international and domestic case studies that illustrate examples of geohazards and introduce the detrimental socioeconomic impacts on a community. The last chapter will discuss the differential impacts of geohazards to our society caused by the differences in socioeconomic status (SES).
1.2
Extreme Geohazards: Mechanism and Characteristics
This section summarizes mechanism and characteristics of different types of extreme geohazards that create the physical and social impacts to a community. By scientific understanding, engineering design and mitigation measures can be improved to reduce the social vulnerability of geohazards.
1.2.1
Flood Due to Extreme Water Events
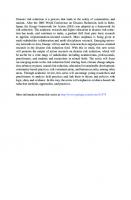
The US national planning scenarios mainly focus on earthquakes and hurricanes as natural hazards. An important addition would be large-scale flood events. This is an important addition, in part, because from 1960 to 2005 27% of all property loss and 17% of fatalities from natural hazards have been due to floods (CEMHS 2020). Events such as hurricanes or large-scale storms often cause geosystem failures due to overloading. Specifically, a levee is like a wall that contains or hold back water, and it can fail due to breach. A breach creates an opening for water to flood through. There are three failure mechanisms of levee breach (see Fig. 1.1), explained below.
1
Social Vulnerability and Geohazards: Review and Implications
7
Fig. 1.1 Overview of main levee failure mechanisms
Foundation failure: A breach caused by surface erosion or subsurface failure. These are often accompanied by levee boils or sand boils. Boils indicate instability that can lead to internal soil erosion of the levee foundation, sinking of the levee, or, according to some engineers, piping (progression of internal soil erosion through levee system) that undermines the levee. Erosion and damage: Erosion of the surface of the levee caused by winds and water. This is worsened by new or already existing damage to the levee. The less surface protection, the more likely erosion will occur. Trees and floating objects also cause erosion and damage of levee. Overtopping: This is one of the major causes of levee failure. This is created when flood water levels are higher than the levee or high winds create a storm surge that causes waves to crash over the levee. This can lead to surface erosion of the levee or create a full-on breach. Levees received significant public attention after the Hurricane Katrina levee failure, in New Orleans. There were over 50 levee breaches that resulted in the submerging of 80% of the city. Most levee breaches were due to overtopping while others failed due to water passing underneath the levee causing the levee wall to shift. Over 1464 people died following these breaches. Further information will follow in Sect. 1.5.
1.2.2
Earthquake
Earthquakes are the result of sudden movements in the cracks of the Earth’s crust, called faults. This sudden movement releases stored energy in waves that spread through the Earth causing the ground to shake. Earthquakes are a risk for about 75 million Americans. Earthquakes are the costliest natural hazards in the United States. The Northridge, California earthquake in 1994 had a magnitude of 6.7 and killed 33 individuals, injured 9000, and displaced over 20,000 people. A repeat of earthquakes like the 1906 San Francisco
8
B. H. Nam et al.
The upper level of Interstate 880 in Oakland, California, U.SA., collapsed during the Loma Prieta earthquake (M=6.9) on October 17, 1989. 41 people were killed
This business in Seattle was heavily damaged during the Nisqually, Wash., earthquake (M=6.8) on February 28, 2001. About 400 people were injured
Building collapse in Paso Robles, Calif., during San Simeon, Calif., earthquake (M=6.5) on December 22, 2003. 2 people were killed
Fig. 1.2 Example photos of earthquake damages (photos from USGS 2006)
earthquake or the 1811–1812 could cause damage estimated over $500 billion. According to the Federal Emergency Management Agency, FEMA, the estimated cost for future yearly earthquake losses in the USA will be around $5.6 billion a year (GAO 2007). Below are examples of infrastructure damages due to earthquakes in California; see Fig. 1.2. There are two plates in California, the Pacific Plate and the North American Plate. The Pacific plate includes most of the Pacific Ocean and the California Coastline. The North American Plate consists of parts of the Atlantic Ocean and most of North America. The primary boundary between these plates is the San Andreas Fault, created by several small faults, like the Hayward Fault. It is more than 650 miles long and has a depth of at least 10 miles (USGS 2013). The Pacific plate grinds past the North American plate. The San Andreas Fault adapts to this movement. This adaptation causes tiny shocks, earth tremors, and strains that produce earthquakes when released.
1.2.3
Landslide
It is important to understand the potential landslide hazard when moving to hilly or mountainous terrain and how to plan for them. Planning includes proper land-use, new construction techniques, and infrastructure created to reduce the costs of landslides. Landslides are essentially the movement of a mass of rocks, debris, or earth down a slope. There are five modes of slope movement: falls, topples, slides, spreads, and flows (see Fig. 1.3). Landslides usually have multiple causes that increase the effects of down-slope forces, decreased strength, or increased strength. Slope movement occurs when the forces going down slope are stronger than the material that the slope is made
1
Social Vulnerability and Geohazards: Review and Implications
(a) rockfall type
(d) translational type
(g) earth flow type
(b) topple type
(e) lateral spread type (a liquefiable layer underlies the surface layer)
9
(c) rotational landslide type
(f) debris flow type
(f) debris avalanche type
Fig. 1.3 Failure mechanisms of landslide (Highland and Bobrowsky 2008) (figures from USGS 2018)
of. Sometimes landslides are caused by things like water level changes, water infiltration, earthquakes, or a combination of factors. Landslides occur underwater and on land. Landslides underwater, called submarine landslides, cause tsunamis that can damage coastal areas. In the USA up to 50 people are killed by landslides each year, compared to worldwide death toll of thousands each year (Highland and Bobrowsky 2008; USGS 2018). Most deaths were caused my falling rocks, debris, or volcanic debris. In Montecito, Santa Barbara County, California, a landslide, caused by debris, resulted in 23 deaths, 167 injuries, and more than 400 homes damaged. The debris was triggered by heavy rain falling on steep hillsides, burned in the Thomas Wildfire.
10
1.2.4
B. H. Nam et al.
Sinkhole (Natural and Anthropogenic)
Natural Karst Sinkholes In karst areas, sinkholes are common. There are six classifications of sinkholes based on the combinations of two groups (Beck 2012; Gutiérrez et al. 2014; Waltham and Fookes 2003). A subsidence and collapse sinkhole meets two criteria: (1) the type of material, cover, bedrock, or caprock that is affected by erosion/deformation processes and (2) the subsidence mechanism, collapse and suffusion (or sagging) of the substratum that occurs. Unlike other sinkholes, Florida sinkholes have a unique formation process in which they are composed of sandy cover soils, cohesive soils, and weathered limestone. Groundwater tends to be shallow, and the groundwater discharge and recharge is common. This unique formation, along with groundwater flow, causes erosion, a major mechanism of sinkhole creation. There are three kinds of sinkholes in Florida, dissolution, cover subsidence, and cover-collapse (Tihansky 1999). Dissolution sinkholes usually occur in mantled karst areas that contain bedrocks that are shallow. In a dissolution sinkhole, rainwater and runoff flow through the cracks of bedrock, dissolving it. Subsidence sinkholes and collapse sinkholes are shown in Fig. 1.4. Subsidence sinkholes can be found in permeable, non-cohesive soils, like sand. Collapse sinkholes can be found in areas with cohesive and impermeable soils. According to a research study, covercollapse sinkholes are frequent in areas that contain an overburden thickness of 60 m
Winter Park, FL (May 1981)
Fig. 1.4 Sinkholes in Florida and formation mechanism (modified from Tihansky (1999), photo from USGS)
1
Social Vulnerability and Geohazards: Review and Implications
11
Fig. 1.5 Photographs of urban road sinkholes that were due to an underground void in the area: (a) Seokchon Station in Seoul, Korea (August 2014), and (b) Incheon, Korea (July 2014) (modified from Nam et al. 2018)
and significant clay contents (Sinclair and Stewart 1985). In recent research, it is clear that researchers have strived to explore the hydrogeological (Nam et al. 2020; Xiao et al. 2016; Perez et al. 2016) and geo-mechanical mechanism (Soliman et al. 2019, Nam and Shamet 2020, Shamet and Nam 2021) of sinkhole formation. In addition, the sinkhole susceptibility modeling and mapping has been studied (Kim and Nam 2018; Kim et al. 2020). Urban Sinkholes Metropolitan cities, like Tokyo or Seoul, have experienced ground collapse and/or sinkholes in the road (Nam et al. 2018). Underground construction and infrastructure are excessive in these cities. When cities age, so do their underground infrastructure. With age, the structural conditions become poor. An example of poor conditions include leakage of water and sewage pipelines that cause soil loss creating underground cavities. When the cavities grow and move toward the ground surface, the ground collapses or a sinkhole happens, Fig. 1.5. These events cause death and damage.
1.2.5
Subsidence
A land subsidence occurs when there is a sudden sinking of the Earth’s surface from the removal or displacement of subsurface earth materials. Subsidence ranges from small, local collapses to regional surfaces. The causes of land subsidence include oxidation of soil or peat, dissolution in limestone aquifers, wetting of soils with little moisture and low density, compaction, liquefaction, subterranean mining, and fluid withdrawal, like groundwater or petroleum. More than 17,000 square miles in 45 States have been affected by subsidence (Galloway et al. 1999). In California, the largest cause of subsidence is due to excessive ground water pumping causing compaction of receptive aquifer systems. In fact, over 5200 miles of land is affected by subsidence in the San Joaquin Valley in California; Fig. 1.6 shows the land surface in 1925 and a man standing for
B. H. Nam et al.
12 Approximate 9-m subsidence in the San Joaquin Valley, California from 1925 to 1977 due to groundwater pumping. (from Galloway et al. (1999), photo from USGS)
Photos showing the flood and subsidenceinduced damages in Miami Beach, FL, U.S.A. (Wdowinski et al., 2020) Fig. 1.6 Example photos of land subsidence and building damages
comparison, in 1977. The second largest cause of subsidence in California is oxidation of soils. Subsidence caused by decomposition of soil is also a major cause of subsidence in Florida, specifically in the Everglades. In addition, in coastal areas, subsidence is a problem along with rising sea levels. In the past 10 years, coastal communities in southeast Florida have had an increase in flooding, causing problems with property, commerce, and quality of life. This increase in flooding can be attributed to global, regional, and local processes that are affecting elevation differences between coastal communities and the sea level. In a research article, researchers monitored subsidence in coastal areas in southeast Florida, using Interferometry Synthetic Aperture Radar. They did this to evaluate how local subsidence is contributing to increased coastal flooding (Wdowinski et al. 2020). Their results indicate that subsidence occurs in localized area (64 years) respondents (Table 3.3), young and adults
Meteorological Climatological Hydrological Geological Climate risks are becoming more important than others in your territory Strongly 1 (3.3%) 0 (0.0%) 1 (3.3%) 1 (3.3%) disagree Disagree 0 (0.0%) 0 (0.0%) 2 (6.7%) 0 (0.0%) Undecided 1 (3.3%) 4 (13.3%) 5 (16.7%) 2 (6.7%) Agree 4 (13.3%) 2 (6.7%) 7 (23.3%) 1 (3.3%) Strongly agree 1 (3.3%) 1 (3.3%) 4 (13.3%) 0 (0.0%) Total 7 (23.3%) 7 (23.3%) 19 (63.3%) 4 (13.3%) Gender Male 5 (17.2%) 3 (10.3%) 9 (31.0%) 2 (6.9%) Female 2 (6.9%) 4 (13.8%) 10 (34.5%) 2 (6.9%) Total 7 (24.1%) 7 (24.1%) 19 (65.5%) 4 (13.8%) Age Young 0 (0.0%) 2 (6.7%) 3 (10.0%) 0 (0.0%) (18–34 years) Adult 6 (20.0%) 5 (16.7%) 16 (53.3%) 4 (13.3%) (35–64 years) Elderly 1 (3.3%) 0 (0.0%) 0 (0.0%) 0 (0.0%) (>64 years) Total 7 (23.3%) 7 (23.3%) 19 (63.3%) 4 (13.3%)
Environmental/ biological 0 (0.0%) 2 (6.7%) 2 (6.7%) 0 (0.0%) 0 (0.0%) 4 (13.3%) 3 (10.3%) 1 (3.4%) 4 (13.8%) 0 (0.0%) 4 (13.3%) 0 (0.0%) 4 (13.3%)
Geophysical 2 (6.7%) 1 (3.3%) 1 (3.3%) 1 (3.3%) 0 (0.0%) 5 (16.7%) 2 (6.9%) 2 (6.9%) 4 (13.8%) 2 (6.7%) 2 (6.7%) 1 (3.3%) 5 (16.7%)
What are the main hazards (not only climate related) in your territory?
0 (0.0%)
0 (0.0%)
0 (0.0%)
0 (0.0%)
0 (0.0%) 0 (0.0%) 0 (0.0%)
0 (0.0%) 0 (0.0%) 0 (0.0%) 0 (0.0%) 0 (0.0%)
0 (0.0%)
Technological/ anthropogenic
30 (100.0%)
2 (6.7%)
22 (73.3%)
6 (20.0%)
15 (51.7%) 14 (48.3%) 29 (100.0%)
5 (16.7%) 8 (26.7%) 9 (30.0%) 5 (16.7%) 30 (100.0%)
3 (10.0%)
Total
Table 3.3 Cross table between the perception of the most relevant hazards affecting the Municipality of Lignano Sabbiadoro related to the perception of the importance of climatic risks, gender, and age. Frequencies (percentages) of the answers are indicated
56 C. Casareale et al.
3
Perception of the Self-Exposure to Geohazards in the Italian. . .
57
seem to perceive more hydrological hazards (10.0% and 53.3%, respectively), but youngers give to climatological and geophysical hazards the same importance (6.7%), while adults perceive geological and geophysical hazards as less important than climatological and meteorological ones. Elderly respondents only perceive geophysical hazards (3.3%), with the same intensity of climatological ones. Such outcome corroborates the findings in previous studies which see age linked to experience as influencing perception (Wachinger and Renn 2010). As a matter of fact, Lignano Sabbiadoro residents have a low-medium probability of experiencing an earthquake and a higher possibility of experiencing flooding (Table 3.1).
3.5.1.2
Montemarciano (Marche Region)
Examining the perception towards the climatic crisis and the hazards insisting in the territory, results show that a large part of the respondents in Montemarciano is undecided (48.0%) whether climate risks are becoming more important than others in their local area (Table 3.4). Among these, the majority believes that the most threatening hazards are hydrological (36.0%) and, less importantly, environmental/ biological (18.7%). Nonetheless, hydrological hazard is the most perceived also within those who strongly disagree/disagree (5.4%) and those who agree/strongly agree (24.0%) with the growing importance of the climate risks. However, compared to the former, these latter respondents are more prone to consider relevant also all the other hazards. On the contrary, geological hazard seems to be equally perceived (4.0%) among both the concordant and the discordant opinions on the climate risks. Such outcomes suggest that the respondents that are not aware of the climate crisis are consequently reluctant to link climate change with their second order effects, such as climate-related geohazards. This is consistent with the results of comparable studies carried out both in Italy (Gioia et al. 2021) and in other countries (Whitmarsh 2008; Damm et al. 2013). When considering the influence of gender on the importance attributed to local hazards, the respondents of Montemarciano reported a rather varied a picture (Table 3.4). Hydrological hazards tend to receive more consensus compared to other geohazards regardless of gender, though geological and geophysical hazards received more preferences by females (9.3% and 8.0%, respectively) than from males (4.0% and 1.3%, respectively). It might be interesting to observe that gender seems to influence the perception of meteoclimatic hazards, as males tend to give more relevance to meteorological hazards than to climatological ones compared to females. Results from Montemarciano appear to confirm that gender plays a role in risk perception, though it might be tempered by other personal factors. For instance, similar to the respondents from Lignano Sabbiadoro, the common high rate of the hydrological hazards might be due to a significant exposure to such threats, as it has already been cleared out that the effect of gender might be overruled by past experiences (Wachinger and Renn 2010). With regard to age (Table 3.4), it is possible to observe that young respondents (18–34 years) perceive geological (5.3%) and geophysical hazards (4.0%) more than
Meteorological Climatological Hydrological Geological Climate risks are becoming more important than others in your territory Strongly 0 (0.0%) 1 (1.3%) 2 (2.7%) 1 (1.3%) disagree Disagree 0 (0.0%) 1 (1.3%) 2 (2.7%) 2 (2.7%) Undecided 4 (5.3%) 6 (8.0%) 27 (36.0%) 4 (5.3%) Agree 1 (1.3%) 3 (4.0%) 8 (10.7%) 0 (0.0%) Strongly agree 2 (2.7%) 5 (6.7%) 10 (13.3%) 3 (4.0%) Total 7 (9.3%) 16 (21.3%) 49 (65.3%) 10 (13.3%) Gender Male 6 (8.0%) 7 (9.3%) 27 (36.0%) 3 (4.0%) Female 1 (1.3%) 9 (12.0%) 22 (29.3%) 7 (9.3%) Total 7 (9.3%) 16 (21.3%) 49 (65.3%) 10 (13.3%) Age Young 1 (1.3%) 3 (4.0%) 10 (13.3%) 4 (5.3%) (18–34 years) Adult 5 (6.7%) 9 (12.0%) 31 (41.3%) 4 (5.3%) (35–64 years) Elderly 1 (1.3%) 4 (5.3%) 8 (10.7%) 2 (2.7%) (>64 years) Total 7 (9.3%) 16 (21.3%) 49 (65.3%) 10 (13.3%)
Environmental/ Biological 0 (0.0%) 1 (1.3%) 14 (18.7%) 3 (4.0%) 7 (9.3%) 25 (33.3%)
13 (17.3%) 12 (16.0%) 25 (33.3%)
7 (9.3%) 12 (16.0%) 6 (8.0%) 25 (33.3%)
Geophysical 0 (0.0%) 1 (1.3%) 3 (4.0%) 0 (0.0%) 3 (4.0%) 7 (9.3%)
1 (1.3%) 6 (8.0%) 7 (9.3%)
3 (4.0%) 4 (5.3%) 0 (0.0%) 7 (9.3%)
What are the main hazards (not only climate related) in your territory?
2 (2.7%)
1 (1.3%)
1 (1.3%)
0 (0.0%)
1 (1.3%) 1 (1.3%) 2 (2.7%)
0 (0.0%) 0 (0.0%) 1 (1.3%) 1 (1.3%) 2 (2.7%)
0 (0.0%)
Technological/ Anthropogenic
75 (100.0%)
14 (18.7%)
41 (54.7%)
20 (26.7%)
38 (50.7%) 37 (49.3%) 75 (100.0%)
3 (4.0%) 36 (48.0%) 13 (17.3%) 21 (28.0%) 75 (100.0%)
2 (2.7%)
Total
Table 3.4 Cross table between the perception of the most relevant hazards affecting the Municipality of Montemarciano related to the perception of the importance of climatic risks, gender, and age. Frequencies (percentages) of the answers are indicated
58 C. Casareale et al.
3
Perception of the Self-Exposure to Geohazards in the Italian. . .
59
climatological ones. On the contrary, climatological hazards are more perceived by adult (35–64 years) (12.0%) and elderly (>64 years) (5.3%) respondents. Furthermore, geophysical hazards seem not to be perceived at all by elderly and very little by adults (5.3%). Therefore it is possible to assume that age and individual experience influence hazards perception, as for instance in the case of climatological hazards, an older age corresponds to a longer exposure to the induced changes on the local area, thence a higher awareness (Ayal and Leal Filho 2017).
3.5.1.3
Brindisi (Puglia Region)
Examining the relations between the perceived more recurring hazards and the importance of climate change over other risks in the local area (Table 3.5), results appear to confirm that in Brindisi the perception of hydrological and climatological hazards is higher than other hazards, and, as in Montemarciano, the majority of the respondents are undecided about the importance of climate change over other risks (46.2%). This situation seems to suggest that hydrological hazards could be associated with climatological ones, but it is not clear whether they are considered consequences of climate change. Geological and geophysical hazards are always overcome by other types of hazards. Overall, the perception of climate change impacts is highly associated with hydrological events and little associated with geological and geophysical hazards. This result seems to support the idea that respondents in Brindisi mainly identify the climate crisis with hydrological, climatological, and environmental/biological hazards and not also with meteorological phenomena or geological and geophysical events. The cross-tabulation reporting the influence of gender on the perceived local hazards shows a significant difference in the expressed preferences (Table 3.5). In terms of most perceived hazards in the local area, males appear to rank first climatological hazards (22.2%), then hydrological (20.9%), and environmental/ biological (13.2%). Conversely, females seem to give primary importance to hydrological hazards (28.6%), followed by climatological (22.2%) and environmental/ biological (17.6%) ones. It also appears that males tend to perceive similarly the first two hazards, while females provide a smaller gap between the second two. This suggests that though climatological and hydrological hazards remain the highest concern for all the respondents, the relative importance seems to be indeed influenced by gender. An analogous situation emerges in the case of the remaining geohazards. In this case, though hydrological hazards outnumber all the others for both genders, males tend to notice geological hazards more significantly compared to females, who conversely indicate more frequently geophysical ones (3.3% for females, 0.0%, for males). Overall, it might be significant to observe that geophysical hazards received the least preferences from both genders (cumulative 3.3%). The presented outcomes appear to confirm the suggested hypothesis that, as already emerged in Lignano Sabbiadoro and Montemarciano, gender significantly influences the perception of local hazards (Ho et al. 2008; Lindell and Hwang 2008; Goldsmith et al. 2013; Keul et al. 2018; McDowell et al. 2020).
Meteorological Climatological Hydrological Geological Climate risks are becoming more important than others in your territory Strongly disagree 1 (1.1%) 0 (0.0%) 0 (0.0%) 0 (0.0%) Disagree 0 (0.0%) 2 (2.2%) 1 (1.1%) 0 (0.0%) Undecided 5 (5.5%) 19 (20.9%) 20 (22.0%) 1 (1.1%) Agree 0 (0.0%) 13 (14.3%) 15 (16.5%) 3 (3.3%) Strongly agree 3 (3.3%) 6 (6.6%) 9 (9.9%) 1 (1.1%) Total 9 (9.9%) 40 (44.0%) 45 (49.5%) 5 (5.5%) Gender Male 7 (7.7%) 20 (22.0%) 19 (20.9%) 4 (4.4%) Female 2 (2.2%) 20 (22.0%) 26 (28.6%) 1 (1.1%) Total 9 (9.9%) 40 (44.0%) 45 (49.5%) 5 (5.5%) Age Young (18–34 years) 3 (3.3%) 13(14.3%) 11 (12.1%) 0 (0.0%) Adult (35–64 years) 6 (6.6%) 25 (27.5%) 32 (35.2%) 4 (4.4%) Elderly (>64 years) 0 (0.0%) 2 (2.2%) 2 (2.2%) 1 (1.1%) Total 9 (9.9%) 40 (44.0%) 45 (49.5%) 5 (5.5%)
Environmental/ Biological 0 (0.0%) 1 (1.1%) 10 (11.0%) 11 (12.1%) 6 (6.6%) 28 (30.8%) 12 (13.2%) 16 (17.6%) 28 (30.8%) 9 (9.9%) 18 (19.8%) 1 (1.1%) 28 (30.8%)
Geophysical 0 (0.0%) 0 (0.0%) 2 (2.2%) 1 (1.1%) 0 (0.0%) 3 (3.3%) 0 (0.0%) 3 (3.3%) 3 (3.3%) 3 (3.3%) 0 (0.0%) 0 (0.0%) 0 (3.3%)
What are the main hazards (not only climate related) in your territory?
2 (2.2%) 6 (6.6%) 0 (0.0%) 8 (8.8%)
2 (2.2%) 6 (6.6%) 8 (8.8%)
0 (0.0%) 0 (0.0%) 5 (5.5%) 1 (1.1%) 2 (2.2%) 8 (8.8%)
Technological/ Anthropogenic
29 (31.9%) 57 (62.6%) 5 (5.5%) 91 (100.0%)
43 (47.3%) 48 (52.7%) 91 (100.0%)
1 (1.1%) 3 (3.3%) 42 (46.2%) 30.8%) 17 (18.7%) 91 (100.0%)
Total
Table 3.5 Cross table between the perception of the most relevant hazards affecting the Municipality of Brindisi related to the perception of the importance of climatic risks, gender, and age. Frequencies (percentages) of the answers are indicated
60 C. Casareale et al.
3
Perception of the Self-Exposure to Geohazards in the Italian. . .
61
Examining how age influences the perception of hazards among respondents, it is possible to observe a trend similar to Lignano Sabbiadoro between age groups (Table 3.5). Specifically, young respondents (18–34 years) perceive more climatological (14.3%) and hydrological (12.1%) hazards, but they do not consider geological hazards at all. Adults (35–64 years) prefer hydrological hazards (35.2%) over the others. Elderly people (>64 years) equally perceive climatological and hydrological (2.2%), while geological and environmental/biological (1.1% each) hazards are less perceived. As for youngers, they seem to have no perception of geophysical hazards. Overall, hydrological hazards are highly perceived, while geological and geophysical hazards are scarcely perceived. Results in Brindisi reinforce the evidence emerged from Lignano Sabbiadoro and Montemarciano, confirming that regardless of age, hydrological and climatological hazards are more perceived than the others and the geological and geophysical hazards are barely perceived. This might be due to the direct experience of floods of Brindisi respondents. Indeed, 5.6% of the population lives in areas subject to hydrological risk, and the frequency of adverse events might have blurred the influence of age towards hazard perception (Liu et al. 2018).
3.5.2
Influence of the Proximity to the Coast on the Perception of Self-Exposure to Geohazards
3.5.2.1
Lignano Sabbiadoro (Friuli-Venezia Giulia Region)
In Lignano Sabbiadoro most of the respondents who live closest to the coast believes that the main threatening hazard in their area is hydrological (10.7%), followed by climatological (6.7%) and geophysical (6.7%) (Fig. 3.2a and Table 3.6). Moving away from the coast, the hydrological hazard strengthens (25.0% of the choices for both who lives at 200–1000 m and at more than 1000 m from the coast), while climatological and geophysical hazards lose their importance and are replaced by meteorological, geological, and environmental/biological ones (respectively, 14.3%, 7.1%, and 7.1% at more than 1000 m). This suggests that the close proximity to the coast might weaken the perception of the risk posed for instance by storms, landslides, and pollution, in favor of threats more contingent such as coastal floods, coastal erosion, or sea level rise. As a matter of fact, in Lignano Sabbiadoro, even the inhabitants who declared to live at more than 1 km far from the coast are located in a flat peninsula surrounded by the Adriatic Sea, the Marano lagoon, and the Tagliamento river mouth (Fig. 3.1a). Additionally, as reported in Table 3.1, the probability of earthquakes is medium-low. In this geographic context, among the geohazards, the citizens are indeed exposed only to the hydrological one, which is accordingly the most recognized. Yet, an outwardly change in the living location seems to affect the geohazards perception (Miceli et al. 2008).
62
C. Casareale et al.
Fig. 3.2 Map of the three buffer zones, namely, 0–200, 200–1000, and >1000 m, and the related hazards perception for the Municipality of Lignano Sabbiadoro (a), Montemarciano (b), and Brindisi (c)
3.5.2.2
Montemarciano (Marche Region)
In Montemarciano most of the respondents who live closest to the coast believe that the main threatening hazard in their area is hydrological (9.7%), followed by all the other hazards with equal percentages (1.3%) (Fig. 3.2b and Table 3.6). As we move away from the coast, similar to Lignano Sabbiadoro, the hydrological hazard strengthens, with 22.7% of the choices for who lives at 200–1000 m and 33.3% for who lives at more than 1000 m from the coast. Moreover, a specific upward trend can be noted for climatological (1.3%–9.3%–10.7%), environmental/biological (1.3%–12.0%–20.0%), and, even if less distinctly, for geological (1.3%–6.7%– 5.3%) hazards. On the other hand, the trends for meteorological, geophysical, and
Meteorological How far do you live from the coast? Lignano 0–200 m 1 (3.6%) Sabbiadoro 200–1000 m 2 (7.1%) >1000 m 4 (14.3%) Total 7 (25.0%) Montemarciano 0–200 m 1 (1.3%) 200–1000 m 4 (5.3%) >1000 m 2 (2.7%) Total 7 (9.3%) Brindisi 0–200 m 1 (1.1%) 200–1000 m 4 (4.5%) >1000 m 4 (4.5%) Total 9 (10.1%) 2 (7.1%) 2 (7.1%) 1 (3.6%) 5 (17.9%) 1 (1.3%) 5 (6.7%) 1 (1.3%) 7 (9.3%) 0 (0.0%) 1 (1.1%) 1 (1.1%) 2 (2.2%)
0 (0.0%) 2 (7.1%) 2 (7.1%) 4 (14.3%) 1 (1.3%) 9 (12.0%) 15 (20.0%) 25 (33.3%) 4 (4.5%) 8 (9.0%) 16 (18.0%) 28 (31.5%)
0 (0.0%) 0 (0.0%) 0 (0.0%) 0 (0.0%) 1 (1.3%) 0 (0.0%) 1 (1.3%) 2 (2.7%) 2 (2.2%) 1 (1.1%) 5 (5.6%) 8 (9.0%)
6 (21.4%) 12 (42.9%) 10 (35.7%) 28 (100.0%) 11 (14.7%) 29 (38.7%) 35 (46.7%) 75 (100.0%) 15 (16.9%) 29 (32.6%) 45 (50.6%) 89 (100.0%)
1 (3.6%) 1 (3.6%) 2 (7.1%) 4 (14.3%) 1 (1.3%) 5 (6.7%) 4 (5.3%) 10 (13.3%) 1 (1.1%) 2 (2.2%) 2 (2.2%) 5 (5.6%)
2 (7.1%) 2 (7.1%) 1 (3.6%) 5 (17.9%) 1 (1.3%) 7 (9.3%) 8 (10.7%) 16 (21.3%) 5 (5.6%) 12 (13.5%) 22 (24.7%) 39 (43.8%)
3 (10.7%) 7 (25.0%) 7 (25.0%) 17 (60.7%) 7 (9.3%) 17 (22.7%) 25 (33.3%) 49 (65.3%) 7 (7.9%) 16 (18.0%) 20 (22.5%) 43 (48.3%)
Total
Environmental/ Technological/ Climatological Hydrological Geological Geophysical biological Anthropogenic
What are the main hazards (not only climate related) in your territory?
Table 3.6 Cross table between the perception of the most relevant hazards affecting the three municipalities related to the proximity to the coast. Frequencies (percentages) of the answers are indicated
3 Perception of the Self-Exposure to Geohazards in the Italian. . . 63
64
C. Casareale et al.
technological/anthropogenic are undefined. This suggests that the hydrological hazard is a widely perceived threat, specifically related to coastal floods and erosion for the inhabitants close to the coast and extended to alluvial floods for the inhabitants of the inland areas. These latter citizens seem more sensitive to the risk posed by landslides, probably because they live in the hilly areas of the municipality (Ho et al. 2008). Additionally, even if the probability of earthquakes for the municipality is medium-high (Table 3.1), the perception of geophysical hazard seems restricted to the middle range, perhaps because the inhabitants are here less conditioned by the surrounding coast and hills. This could indicate that the close proximity to the coast might affect the perception of the risk posed by geohazards.
3.5.2.3
Brindisi (Puglia Region)
In Brindisi most of the respondents who live closest to the coast believe that the main threatening hazard in their area is hydrological (7.9%), followed by climatological (5.6%) and environmental/biological (4.5%) (Fig. 3.2c and Table 3.6). As we move away from the coast, similar to the other study areas, they all increase their percentage, and the climatological hazard becomes the first choice replacing the hydrological (24.7% and 22.5%, respectively). Moreover, a slight upward trend can be noticed in all the other hazards, except for technological/anthropogenic (2.2%– 1.1%–5.6%). This suggests that the proximity to the sea influences risk perception so much that, already at 1000 m from the coastline, the importance of the hydrological hazard, mainly related to coastal floods and coastal erosion, is replaced by the climatological hazard, mainly related to rising temperatures and changes in rainfall patterns (Milfont et al. 2014). Minor but still noteworthy effects seem to have the coast for the other geohazards. However, while approximatively the 5.6% of the population is exposed to low, medium, or high hydrological hazard, only the 0.02% of the population is exposed to geological hazard, and the probability of earthquakes for the municipality is low (Table 3.1). Therefore, unlike the other study areas, in Brindisi, the close proximity to the coast might influence the perception of the risk posed by geohazards over the climatological ones, but moving farther away the latter regain importance. This could be due to the difference in total area and population characterizing such municipality (332.98 km2 and 87,141 citizens), compared to Lignano Sabbiadoro (15.71 km2 and 6948 citizens) and Montemarciano (22.31 km2 and 9872 citizens). Indeed, a substantial part of the population does not live close to the coast where the effects of climate change are already part of everyday life (Milfont et al. 2014).
3
Perception of the Self-Exposure to Geohazards in the Italian. . .
3.5.3
65
Overview on Factors Influencing the Perception of Self-Exposure to Geohazards Along the Italian Adriatic Coasts
The previous discussion explored some of the factors that might influence the perception of the personal exposure of the local populations to geohazards. The focus was placed on three case studies distributed along the Italian coasts of the Adriatic Sea, in the context of climate change. The investigation allowed to uncover some relevant outcomes. The first common trait among the involved municipalities concerns climate change itself (Tables 3.3, 3.4 and 3.5). Indeed, the respondents appear to share a significant uncertainty on whether risks related to climate change are gaining relevance in their area. This seems to suggest that there is still some hesitation in recognizing the alterations induced by the ongoing climate crisis at the local level. Such outcome seems confirmed when looking closely to the mentioned hazards, especially the geohazards (Table 3.7). Indeed, in this case the perception of the growing importance of climate change appears to be associated with a higher sensibility toward hydrological hazards, whereas the relation with the others is not clear nor defined. Hence, it might be assumed that the nexus between climate change and some frequent, fast-onset, local hazards (i.e., hydrological hazards) is quite consolidated, while it is still necessary to foster the acknowledgment of some second-order events related to climate change (e.g., geological hazards). Nevertheless, in general terms the perception of the growing local relevance of climate change seems to influence also the perception of the personal susceptibility to geohazards. Similarly, the role of gender appears to play a role in the perception of geohazards, though the effect is not clear (Table 3.7). Indeed, the relative importance attributed to geological and geophysical hazards appears to consistently vary among male and female respondents. Though it is not possible to outline a definite association between gender and such hazards, female respondents appear to be slightly Table 3.7 Overall trends in the association among perceived self-exposure to geohazards and potential influencing factors Influencing factors Growing importance of climate risks compared to other risks in local area Gender
Geohazard Hydrological Strongly and positively associated Not associated
Age
Scarcely but positively associated
Distance
Scarcely associated direction not clear
Geological Scarcely associated
Geophysical Scarcely associated
Associated, direction not clear Scarcely associated, direction not clear Scarcely associated, generally directly
Associated, direction not clear Scarcely associated, direction not clear Scarcely associated, generally inversely
66
C. Casareale et al.
favoring geophysical hazards. On the contrary, gender does not appear to influence the perception of hydrological hazards, as both male and female respondents consistently reported their presence. The effect of age appears even more challenging. Indeed, respondents belonging to different age groups tended to provide different views on the relevance of geohazards. Nonetheless, it was not possible to identify a clear and uniform trend. Additionally, in this case, the responses significantly varied across the municipalities (Tables 3.3, 3.4, and 3.5), suggesting a prominent role played by other contextual factors (e.g., previous experience) in influencing the perception of geohazards. Lastly, distance appears to indeed influence the perception of local hazards, though it seems that such relation might be particularly complex and place-related. In relative terms, geohazards apparently lose relevance while moving away from the coast, in favor of other hazards, depending on the studied area (Fig. 3.2 and Table 3.6). In general, such outcome suggests that sea-related phenomena (e.g., coastal erosion, coastal floods) might exert a crucial effect on local populations. When restricting the analysis to geohazards, hydrological hazards showed a slight consolidation while moving inland (Table 3.7). Similarly, geological and geophysical hazards seemingly tended to be increasingly acknowledged with the growing distance from the coast, though it was not possible to outline a common and robust trend. Hence, this appears to confirm that local communities might be commonly responsive to hydrological hazards, whereas other contextual factors (e.g., previous experiences, as mentioned above) might be pivotal in shaping the perception of other geohazards.
3.6
Conclusions
The effects of the changing climate are already visible in the increasing frequency and magnitude of local events, such as flooding and landslides. Consequently, it is essential that the local population is aware of what they are exposed to, especially when living close to areas prone to peculiar hazards, such as near the coasts. Against this background, the susceptibility of the Italian peninsula and islands results particularly significant (Orombelli and Pranzini 2020). This study explored the characteristics that possibly constitute factors increasing or decreasing the perception of self-exposure to geohazards in the coastal population of three municipalities, Lignano Sabbiadoro, Montemarciano, and Brindisi, respectively, located in Northern, Central, and Southern Adriatic, analyzing the variation of perception considering climate risk awareness, personal factors, namely, gender and age, and the proximity to the coast. Results from the three municipalities provided interesting considerations. Overall, hydrological hazards are considered the most affecting all the three coastal municipalities, especially compared to other geohazards. It appears significant that
3
Perception of the Self-Exposure to Geohazards in the Italian. . .
67
in general terms the uncertainty regarding the climate crisis is strong. Yet, there is a feeble association between low climate risk perception and perceived highly impacting geohazards, thus suggesting that the actual local effects of climate changes might not be commonly recognized. The role of gender and age in influencing perception appears more evident when considering other natural hazards, whereas it is seemingly invalidated by past experiences for geohazards. As a final result, the more we move farther away from the coast, even at small distances such as 1000 m, the more the perceived geohazards shift from those specifically related to the coast to those more contingent to the respondents. Despite the significant feedback, the magnitude of collected questionnaires limits the representativeness of the outcomes strictly to the respondents. Consequently, future studies might extend the involvement to a broader portion of the local populations, in order to gain an overall view on a specific municipality. Alternatively, further focus might be put on specific groups of stakeholders, such as the most socially or economically vulnerable to geohazards. In general terms, it might also be relevant to adopt different means to deliver the questionnaires, in order to reach those who might not be comfortable with online surveys or who might not access specific websites. Additionally, future research could cover a wider geographical area, especially in the nearby coastal sections, as it might be interesting to evidence the local factors potentially determining in altering (or normalizing) the perception of bordering communities. Nevertheless, the observed diversity of perception in the three municipalities provides important hints for decision-makers, fundamental for a multi-hazard approach to disaster risk reduction, even at a sub-municipal scale or within the immediate surroundings of the studied areas. It should be considered that the climate crisis is not fully recognized as a driver of geological events as much as for hydrological ones, and in general people have a limited perception of geohazards, except for hydrological hazards. Personal characteristics, namely, gender and age, and proximity, influence the perception of self-exposure to geohazards, but the positive or negative weight of these factors in shaping perception varies locally. Therefore, decision-makers should consider the specific personal and geographic characteristics as pivotal when planning for disaster risk reduction strategies. Acknowledgments This research was funded by the EU Italy–Croatia Interreg program through the RESPONSe project (ID 10046849).
References Agenzia per la Coesione Territoriale (2014) Rapporto di Istruttoria per la Selezione delle Aree Interne. Regione MARCHE Akşit B, Karanci AN, Dirik G (2005) Impact of a community disaster awareness training program in Turkey: does it influence hazard-related cognitions and preparedness behaviors. Soc Behav Pers Int J 33:243–258
68
C. Casareale et al.
Alexander D (1985) Culture and the environment in Italy. Environ Manag 9:121–133. https://doi. org/10.1007/BF01867112 Alvioli M, Melillo M, Guzzetti F et al (2018) Implications of climate change on landslide hazard in Central Italy. Sci Total Environ 630:1528–1543. https://doi.org/10.1016/j.scitotenv.2018. 02.315 Antronico L, Coscarelli R, De Pascale F, Muto F (2017) Geo-hydrological risk perception: a case study in Calabria (Southern Italy). Int J Disaster Risk Reduct 25:301–311. https://doi.org/10. 1016/j.ijdrr.2017.09.022 Antronico L, De Pascale F, Coscarelli R, Gullà G (2020) Landslide risk perception, social vulnerability and community resilience: the case study of Maierato (Calabria, southern Italy). Int J Disaster Risk Reduct 46:101529. https://doi.org/10.1016/j.ijdrr.2020.101529 Armaş I (2008) Social vulnerability and seismic risk perception. Case study: the historic center of the Bucharest Municipality/Romania. Nat Hazards 47:397–410. https://doi.org/10.1007/ s11069-008-9229-3 Armaş I, Avram E (2009) Perception of flood risk in Danube Delta, Romania. Nat Hazards 50:269– 287. https://doi.org/10.1007/s11069-008-9337-0 Avvisati G, Bellucci Sessa E, Colucci O et al (2019) Perception of risk for natural hazards in Campania Region (Southern Italy). Int J Disaster Risk Reduct 40:101164. https://doi.org/10. 1016/j.ijdrr.2019.101164 Ayal DY, Leal Filho W (2017) Farmers’ perceptions of climate variability and its adverse impacts on crop and livestock production in Ethiopia. J Arid Environ 140:20–28. https://doi.org/10. 1016/j.jaridenv.2017.01.007 Barredo JI (2007) Major flood disasters in Europe: 1950-2005. Nat Hazards 42:125–148. https:// doi.org/10.1007/s11069-006-9065-2 Blöschl G, Hall J, Viglione A et al (2019) Changing climate both increases and decreases European river floods. Nature 573:108–111. https://doi.org/10.1038/s41586-019-1495-6 Brody SD, Highfield WE, Wilson M et al (2017) Understanding the motivations of coastal residents to voluntarily purchase federal flood insurance. J Risk Res 20:760–775. https://doi.org/10.1080/ 13669877.2015.1119179 Burningham K, Fielding J, Thrush D (2008) “It’ll never happen to me”: Understanding public awareness of local flood risk. Disasters 32:216–238. https://doi.org/10.1111/j.1467-7717.2007. 01036.x Calandra LM (2012) Rischio, politica, geografia: il caso del terremoto dell’Aquila. In: Andrea Di Somma VF (ed) L’analisi del rischio ambientale. Lalettura del geografo, L’Aquila, Italy, pp 125–140 Cendrero A, Forte LM, Remondo J, Cuesta-Albertos JA (2020) Anthropocene geomorphic change. Climate or human activities? Earth’s Fut 8. https://doi.org/10.1029/2019EF001305 Cerase A, Crescimbene M, La Longa F, Amato A (2019) Tsunami risk perception in southern Italy: first evidence from a sample survey. Nat Hazards Earth Syst Sci 19:2887–2904. https://doi.org/ 10.5194/nhess-19-2887-2019 Comegna L, Picarelli L, Bucchignani E, Mercogliano P (2013) Potential effects of incoming climate changes on the behaviour of slow active landslides in clay. Landslides 10:373–391. https://doi. org/10.1007/s10346-012-0339-3 CRED General classification schemes (2021). https://www.emdat.be/classification. Accessed 20 Oct 2021 Damm A, Eberhard K, Sendzimir J, Patt A (2013) Perception of landslides risk and responsibility: a case study in eastern Styria, Austria. Nat Hazards 69:165–183. https://doi.org/10.1007/s11069013-0694-y Denscombe M (2009) Item non-response rates: a comparison of online and paper questionnaires. Int J Soc Res Methodol 12:281–291. https://doi.org/10.1080/13645570802054706 DPC (2021) Classificazione sismica. https://rischi.protezionecivile.gov.it/it/sismico/attivita/ classificazione-sismica. Accessed 23 Oct 2021
3
Perception of the Self-Exposure to Geohazards in the Italian. . .
69
Esteban M, Takagi H, Mikami T et al (2017) Awareness of coastal floods in impoverished subsiding coastal communities in Jakarta: Tsunamis, typhoon storm surges and dyke-induced tsunamis. Int J Disaster Risk Reduct 23:70–79. https://doi.org/10.1016/j.ijdrr.2017.04.007 Gariano SL, Guzzetti F (2016) Landslides in a changing climate. Earth Sci Rev 162:227–252. https://doi.org/10.1016/j.earscirev.2016.08.011 Gariano SL, Rianna G, Petrucci O, Guzzetti F (2017) Assessing future changes in the occurrence of rainfall-induced landslides at a regional scale. Sci Total Environ 596–597:417–426. https://doi. org/10.1016/j.scitotenv.2017.03.103 Gioia E, Casareale C, Colocci A et al (2021) Citizens’ perception of Geohazards in Veneto Region ( NE Italy ) in the context of climate change. Geosciences 11. https://doi.org/10.3390/ geosciences11100424 Giovannetti E, Pagliacci F (2017) Natural disasters as stress-tests for housing systems. Vulnerability and local resistance to the 2012 earthquake in Italy. Reg Sci Policy Pract 9:231–249. https://doi. org/10.1111/rsp3.12110 Goldsmith RE, Feygina I, Jost JT (2013) The gender gap in environmental attitudes: a system justification perspective. In: Research, action and policy: addressing the gendered impacts of climate change. Springer, New York, pp 159–171 Gong W, Juang CH, Wasowski J (2021) Geohazards and human settlements: lessons learned from multiple relocation events in Badong, China – Engineering geologist’s perspective. Eng Geol 285:106051. https://doi.org/10.1016/j.enggeo.2021.106051 Gravina T, Figliozzi E, Mari N, De Luca Tupputi Schinosa F (2017) Landslide risk perception in Frosinone (Lazio, Central Italy). Landslides 14:1419–1429. https://doi.org/10.1007/s10346016-0787-2 Gugg G (2022) Ordinary life in the shadow of vesuvius: surviving the announced catastrophe BT extraordinary risks, ordinary lives: logics of precariousness in everyday contexts. In: Świtek B, Abramson A, Swee H (eds) . Springer, Cham, pp 249–275 Guzzetti F (2000) Landslide fatalities and the evaluation of landslide risk in Italy. Eng Geol 58:89– 107. https://doi.org/10.1016/S0013-7952(00)00047-8 Halpern-Felsher BL, Millstein SG, Ellen JM et al (2001) The role of behavioral experience in judging risks. Health Psychol 20:120–126. https://doi.org/10.1037/0278-6133.20.2.120 Harvatt J, Petts J, Chilvers J (2011) Understanding householder responses to natural hazards: flooding and sea-level rise comparisons. J Risk Res 14:63–83. https://doi.org/10.1080/ 13669877.2010.503935 Heitz C, Spaeter S, Auzet AV, Glatron S (2009) Local stakeholders’ perception of muddy flood risk and implications for management approaches: a case study in Alsace (France). Land Use Policy 26:443–451. https://doi.org/10.1016/j.landusepol.2008.05.008 Ho MC, Shaw D, Lin S, Chiu YC (2008) How do disaster characteristics influence risk perception? Risk Anal 28:635–643. https://doi.org/10.1111/j.1539-6924.2008.01040.x IPCC (2019) Climate change and land: an IPCC special report on climate change, desertification, land degradation, sustainable land management, food security, and greenhouse gas fluxes in terrestrial ecosystems Istat (2017) Superfici esposte a rischio idrogeologico. https://dati.istat.it/Index.aspx?DataSetCode= DCCV_CARGEOMOR_COM. Accessed 23 Oct 2021 Keul AG, Brunner B, Allen J et al (2018) Multihazard weather risk perception and preparedness in eight countries. Weather Clim Soc 10:501–520. https://doi.org/10.1175/wcas-d-16-0064.1 Lefever S, Dal M, Matthíasdóttir Á (2007) Online data collection in academic research: advantages and limitations. Br J Educ Technol 38:574–582. https://doi.org/10.1111/j.1467-8535.2006. 00638.x Lindell MK, Hwang SN (2008) Households’ perceived personal risk and responses in a multihazard environment. Risk Anal 28:539–556. https://doi.org/10.1111/j.1539-6924.2008.01032.x Liu D, Li Y, Shen X et al (2018) Flood risk perception of rural households in western mountainous regions of Henan Province, China. Int J Disaster Risk Reduct 27:155–160. https://doi.org/10. 1016/j.ijdrr.2017.09.051
70
C. Casareale et al.
McDowell CP, Andrade L, O’neill E et al (2020) Gender-related differences in flood risk perception and behaviours among private groundwater users in the Republic of Ireland. Int J Environ Res Public Health 17. https://doi.org/10.3390/ijerph17062072 Messeri A, Morabito M, Messeri G et al (2015) Weather-related flood and landslide damage: a risk index for Italian regions. PLoS One 10:1–17. https://doi.org/10.1371/journal.pone.0144468 Miceli R, Sotgiu I, Settanni M (2008) Disaster preparedness and perception of flood risk: a study in an alpine valley in Italy. J Environ Psychol 28:164–173. https://doi.org/10.1016/j.jenvp.2007. 10.006 Milfont TL, Evans L, Sibley CG et al (2014) Proximity to coast is linked to climate change belief. PLoS One 9:3–10. https://doi.org/10.1371/journal.pone.0103180 Minnaar L, Heystek J (2016) Online surveys as data collection instruments in education research: a feasible option? South Afr J High Educ 27:162–183. https://doi.org/10.20853/27-1-233 Nicholls RJ, Lowe JA (2004) Benefits of mitigation of climate change for coastal areas. Glob Environ Chang 14:229–244. https://doi.org/10.1016/j.gloenvcha.2004.04.005 Orombelli G, Pranzini E (2020) Considerations on coastal protection and management. Rend Lincei Sci Fis Nat 31:365–368. https://doi.org/10.1007/s12210-020-00912-y Plapp T, Werner U (2006) Understanding risk perception from natural hazards: examples from Germany. In: RISK21 - coping with risks due to natural hazards in the 21st century. Taylor & Francis, London, pp 101–108. https://doi.org/10.1201/9780203963562-12 Raška P (2015) Flood risk perception in Central-Eastern European members states of the EU: a review. Nat Hazards 79:2163–2179. https://doi.org/10.1007/s11069-015-1929-x Reynaud C, Miccoli S (2018) Depopulation and the aging population: the relationship in Italian municipalities. Sustainability 10(4):1004 Rianna G, Reder A, Mercogliano P, Pagano L (2017) Evaluation of variations in frequency of landslide events affecting pyroclastic covers in Campania region under the effect of climate changes. Hydrology 4. https://doi.org/10.3390/hydrology4030034 Romano B, Zullo F (2014) The urban transformation of Italy’s Adriatic coastal strip: fifty years of unsustainability. Land Use Policy 38:26–36. https://doi.org/10.1016/j.landusepol.2013.10.001 Salvati P, Bianchi C, Fiorucci F et al (2014) Perception of flood and landslide risk in Italy: a preliminary analysis. Nat Hazards Earth Syst Sci 14:2589–2603. https://doi.org/10.5194/nhess14-2589-2014 Sangelantoni L, Gioia E, Marincioni F (2018) Impact of climate change on landslides frequency: the Esino river basin case study (Central Italy). Springer, Dordrecht, The Netherlands Siegrist M, Gutscher H (2006) Flooding risks: a comparison of lay people’s perceptions and expert’s assessments in Switzerland. Risk Anal 26:971–979. https://doi.org/10.1111/j. 1539-6924.2006.00792.x Spence A, Poortinga W, Pidgeon N (2012) The psychological distance of climate change. Risk Anal 32:957–972. https://doi.org/10.1111/j.1539-6924.2011.01695.x Tekeli-Yeşil S, Dedeoǧlu N, Braun-Fahrlaender C, Tanner M (2010) Factors motivating individuals to take precautionary action for an expected earthquake in Istanbul. Risk Anal 30:1181–1195. https://doi.org/10.1111/j.1539-6924.2010.01424.x Terpstra T (2011) Emotions, trust, and perceived risk: affective and cognitive routes to flood preparedness behavior. Risk Anal 31:1658–1675. https://doi.org/10.1111/j.1539-6924.2011. 01616.x Teti V (2017) Quel che resta. L’Italia dei paesi, abbandoni e ritorni. Donzelli Editore, Rome Tiranti D, Cremonini R (eds) (2019) Landslide hazard in a changing environment. Front Media, Lausanne Wachinger G, Renn O (2010) Risk perception and natural hazards. CapHaz-Net WP3 Report, Stuttgart
3
Perception of the Self-Exposure to Geohazards in the Italian. . .
71
Wachinger G, Renn O, Begg C, Kuhlicke C (2013) The risk perception paradox-implications for governance and communication of natural hazards. Risk Anal 33:1049–1065. https://doi.org/10. 1111/j.1539-6924.2012.01942.x Wasowski J, Lamanna C, Casarano D (2010) Influence of land-use change and precipitation patterns on landslide activity in the Daunia Apennines, Italy. Q J Eng Geol Hydrogeol. https://doi.org/10.1144/1470-9236/08-101 Whitmarsh L (2008) Are flood victims more concerned about climate change than other people? The role of direct experience in risk perception and behavioural response. J Risk Res 11:351– 374. https://doi.org/10.1080/13669870701552235 Zabini F, Grasso V, Crisci A, Gozzini B (2021) How do people perceive flood risk? Findings from a public survey in Tuscany, Italy. J Flood Risk Manag 14:1–20. https://doi.org/10.1111/jfr3. 12694
Chapter 4
Urban Transformation, Collective Memory, and Disaster Preparedness: A Case from Turkey Fahri Çaki
and Alper Uzun
Abstract Among many other factors, disasters are one of the main elements of urban transformation processes. As in the case of Turkey, it is observed that the ongoing academic, political, and popular debates in the context of reducing the destructive effects of natural disasters in developing countries mostly revolve around a vague concept of “urban transformation.” In such countries, urban transformation is mostly understood and practiced as effort to change physical environment, especially to renew the existing building stock and legislation. Although these dimensions are undoubtedly very important, the mind sets of urban population regarding disaster awareness and precocious measures remain relatively neglected. The disaster risk reduction paradigm, which replaces the traditional disaster management approach focusing on post-disaster response, emphasizes the importance of risk analysis and prevention activities, on the one hand, and suggests focusing on increasing the capacity for disaster preparedness and on improving resilience of cities on the other hand. Therefore, the concept of disaster preparedness requires transformation of disaster-related mind sets both in urban transformation processes in general and in disaster risk reduction paradigm in particular. In the literature, there is a widespread agreement on the role of preparedness to reduce impacts of hazards and disasters and to improve resilience of societies. Disaster preparedness is supposed to be done by all segments of society, including public authorities, local communities, NGOs, individuals, and households. Several studies, however, report relatively low levels of disaster preparedness even in areas disposed to disasters. This trend raises the question of why people are so careless for preparedness. In other words, which factors determine people’s motivation to take or not to take precocious measures against disasters? In this context, previous literature discussed the role of many factors including socio-demographic F. Çaki (✉) Faculty of Arts and Sciences, Department of Sociology, Balikesir University, Balıkesir, Turkey A. Uzun Faculty of Arts and Sciences, Department of Sociology, Balikesir University, Balıkesir, Turkey Department of Geography, Balikesir University, Balikesir, Turkey © The Author(s), under exclusive license to Springer Nature Switzerland AG 2023 S. D’Amico, F. De Pascale (eds.), Geohazards and Disaster Risk Reduction, Advances in Natural and Technological Hazards Research 51, https://doi.org/10.1007/978-3-031-24541-1_4
73
74
F. Çaki and A. Uzun
characteristics, structural/geographical variables, and psychosocial factors. However the role of past disaster experiences and collective memory is poorly discussed by the previous literature with a few exceptions. By addressing to the great 1999 Marmara Earthquake and the continuing ones in and around Balıkesir city of Turkey, this chapter aims to discuss if past disaster experiences make a difference in terms of actual preparedness actions and if collective memory really matters. Thus, the main question of this research is the following: Within the 20 years since the great Marmara Earthquake experience in 1999, has the Turkish society, specifically households of Balıkesir, made any sensitivity and progress towards being more prepared for disasters? In order to explore this research question, a cross-sectional, cluster sampling, face-to-face household-based survey was conducted in Balıkesir between June and September 2018. The questions to measure households’ disaster preparedness are designed in four basic dimensions: (1) knowledge and skills dimension, (2) planning within the family, (3) physical protection measures, and (4) preparedness for supplies. The findings show that the practice and understanding of disaster preparedness at the level of households are not significantly strong among Balıkesir residents and that past experiences do not make significant difference to motivate them. The chapter ends with a suggestion of two particular factors to account for this finding. Keywords Urban transformation · Disaster risk reduction · Preparedness · Past disaster experiences · Collective memory · Balıkesir
4.1
Introduction
The perception that natural disasters are occurring with more frequent and more destructive effects on the earth is becoming widespread. “What is a disaster?” Contrary to how simple it sounds like, this question is not easy to answer. According to the World Health Organization (WHO), “a disaster is an event that disrupts normal conditions of existence and causes suffering exceed the adaptive capacity of society” (WHO/EHA 2002: 3). Accordingly, disasters are events with devastating effects. In this respect, natural disasters are undoubtedly the primary areas of interest of natural and health sciences. Disasters are also social-cultural events (Aguirre 2002). Perceptions, attitudes, and behaviors towards disasters change as social life changes. As a matter of fact, according to Quarantelli (2001), historically, ideas about disasters have gone through three important stages. Traditionally, disasters have the characteristics of the supernatural. They were characterized as Acts of God “with the implication that nothing can be done about their occurrence.” As a second stage, the development of science as a new source of knowledge has changed people’s perception of disaster. Accordingly, disasters were increasingly seen as “Actions of Nature.” However, more recently, opinions about why disasters occur have undergone a change again, increasingly being replaced by the notion that disasters are caused by the Actions of Men and Women rather than the Actions of Nature.
4
Urban Transformation, Collective Memory, and Disaster Preparedness: A. . .
75
Therefore today, after a disaster, people point to other people as responsible for the disaster. Government officials, other politicians, local administrators, businessmen, operators, contractors, construction firms, and even most of society as a whole are held directly or indirectly responsible for disasters. Most of the work on disasters in recent years has focused on vulnerable groups of people and the locations of where they live in. This focus specifically targets cities. As the world becomes gradually more urban, the interest in risks and hazards associated with cities is increasing. It is accepted that actions to reduce disaster risks will be better shaped by understanding the urbanization process and its consequences. It can be argued that urbanization and disaster risks are in mutual interaction. While disaster risks affect urbanization processes, urbanization processes can also affect disaster risks. As a matter of fact, it is observed that global concerns about the effects of urbanization on disaster risk and the effects of climate change are increasing. Considering the development processes of urbanization and population growth rate, it is predicted that, by 2050, two-thirds of the world’s population will live in cities. Indeed, the location of cities is an important variable in terms of exposure and vulnerability to general disasters. Many cities, especially in developing countries, are located in areas that are naturally exposed to climate-related shocks and crises, such as deltas, coasts, and river basins. In addition, many city centers in many countries, including Turkey, are located along earthquake fault lines. It is clear that locations of cities remain to be an important aspect of their overall hazard and risk profiles. Along with the nature of urbanization, social aspects of disasters create a new set of vulnerabilities that transcend the urban location. As a matter of fact, the effects of the vulnerabilities and crises that arise with the nature of urbanization are not evenly distributed among different groups of people (Friend and Moench 2013). Therefore, cities are often associated with a high degree of inequality in access to assets and benefits, shaped by political and economic structures and processes. Changing demographics is an important part of urbanization patterns. The growth of cities is directly dependent on population growth and people’s movements, but also on constraints and pressures on rural livelihoods. Migration to cities takes places in many different forms besides permanent and sedentary migration, sometimes as a seasonal movement or in response to certain shocks. While there are many drivers of rural-urban migration, concerns are rising that future migration will be shaped by rural areas that force people to look for work in growing cities and the effects of climate change on rural livelihoods (Foresight: Migration and Global Environmental Change 2011). New populations absorbed into cities through rural-urban migration are often found in areas that are hazardous either by nature or as a result of patterns of urban expansion. Therefore, in the context of cities, disasters, disaster risks, and related vulnerabilities need to be considered together with both the locations of cities and models/processes of urbanization.
76
4.1.1
F. Çaki and A. Uzun
Urban Transformation and Disaster Management
As in Turkey, “urban transformation” has been hotly debated among urban scientists and practitioners all over the world for a long time. Almost all cities of Turkey, as in other developing countries, suffer from various urban problems including disaster distress. Although there is widespread consensus that “radical” transformations are needed in this framework, the complex nature of rapid urban expansion makes it difficult to answer the questions of how to ignite and maintain sustainable urban transformations. In Turkey, where post-disaster intervention and recovery activities are traditionally dominant, urban transformation remains on the agenda with its dimensions of the physical environment, institutional structures-routines, and financial cash flows. In fact it is fair to say that urban transformation in Turkey has turned into a mechanism of earning money. It largely focuses on the renewal of the existing building stock according to the new earthquake regulation. Reducing disaster risks and improving resilience of cities have to be one of the most important dimensions of urban transformation. Despite recent academic interest, this dimension of urban transformation remains relatively weak in developing countries like Turkey. However, reducing disaster risks and improving resilience of cities are directly related to high preparedness capacity for disasters. In general, preparedness is a multi-level process requiring precautious actions by individuals/households, communities, NGOs, local and national governments, and even global actors. In this research, preparedness actions of households will be explored in terms of the impacts of past experiences/memory of disasters. In this context, the findings of a field study regarding disaster preparedness will be shared. The research consists of two main parts. Firstly, some analyses on the concept of disaster preparedness and its links with past experience and collective memory will be presented. Secondly, some basic information on the 1999 Marmara Earthquake will be presented. Finally, findings regarding the actual preparedness actions of Balıkesir households will be shared as a contribution to the understanding of the determinants of disaster preparedness.
4.1.2
Disaster Preparedness
The conclusive goal of disaster management is, on the one hand, to eliminate threats, hazards, and risks as much as possible and, on the other hand, to reduce the vulnerabilities of people at all levels (individual, family, organization, community, nation) and increase their resilience (Dynes 2002). Disaster management includes a series of processes as activities to be carried out before the disaster occurs (mitigation and preparedness) and activities to be carried out after the disaster occurs (response and recovery) (Sutton and Tierney 2006: 3).
4
Urban Transformation, Collective Memory, and Disaster Preparedness: A. . .
77
Top-down or bottom-up approaches can be used in disaster risk reduction processes. As a matter of fact, as Alexander (2005), who advocates the democratization of disaster management, remarked, it is not possible to deal effectively with risks and emergencies without strong local organizations. It is possible to understand preparedness as measures that allow different units of analysis, such as households, organizations, communities, and societies, to respond effectively and recover quickly when disasters occur. Preparedness studies also aim to ensure that the necessary resources are available to respond effectively in the event of a disaster and that those who have to respond to disasters know how to use these resources. Democratizing disaster management requires the active participation of households and local communities in the process. In emergency times, experts recommend that individuals/households should be self- sufficient for at least 3 days following a disaster (Russell et al. 1995). The reason behind this is that it takes some time for local/national government and disaster-relief organizations to mobilize resources to an affected area. Thus, individual/household preparedness measures can ensure a proper response to natural hazards. These preparedness measures may include things like stockpiling of food and water, having a first aid kit in the home, or having a family evacuation plan. In terms of preparedness, households can reduce the risk of loss of life and injuries as well as minimize damage to the property by taking such measure before a disaster occurs (van der Keur et al. 2016; Shreve and Kelman 2014). No matter how important individual/household preparedness is, several studies report relatively low levels of disaster preparedness even in areas disposed to disasters (Adiyoso and Kanegae 2014). This fact makes it vital for academicians, for field workers, as well as for decision-makers to better understand what determines the motivation of people to take precautionary actions before a disaster occurs. The literature usually examines the determinants of individual/household preparedness in terms of socio-demographic characteristics, structural/geographical variables, and psychosocial factors. In terms of demographic factors, variables such as age, gender, marital status, having children living in the home, and family members in need of special care are considered to be linked with degree of preparedness. In terms of socio-economic factors, variables such as homeownership and financial power to purchase the technical or structural building retrofitting or to buy disaster insurance are believed to be associated with degree of preparedness. Similarly, structural/geographical variables such as duration of residence in the community are believed to affect local knowledge on the environment, disaster awareness, and preparatory activities (Tanaka 2005; Baker 2011; Lindell and Hwang 2008). Finally, psychosocial factors including hazard awareness, risk perception, self-efficacy, and knowledge are thought to affect preparedness behaviors of individuals/households (McNeill et al. 2013; Paul and Bhuiyan 2010; Paton and Johnston 2001; Lindell and Whitney 2000). In this context, one possible source of motivation is considered to be educational (formal and/or informal) programs and emergency trainings that are developed to raise awareness and promote self-reliance and household preparedness actions. However, contrary to expectations, several studies have documented the failure of
78
F. Çaki and A. Uzun
such programs and trainings to motivate people for protective actions (Baker 1980; Sims and Baumann 1983; Paton and Johnston 2001).
4.1.3
Past Experiences and Collective Memory of Disasters
Another important source of motivation that is commonly highlighted by the literature is past experiences of disasters. Theoretically, past experiences of disasters may determine preparedness by increasing risk perception or knowledge about the disturbing consequences of a disaster. In fact, several studies have shown that people who have experienced disasters such as floods (Lawrence et al. 2014), earthquakes (Tekeli-Yeşil et al. 2010), and hurricanes (Sattler et al. 2000) are more likely to take protective actions for future disasters. Of course, not every person/household has to experience and survive a disaster in order to be motivated for preparedness. Nevertheless, based on the existing literature, it is reasonable to expect that those who had such a past experience would be sufficiently motivated for precautionary measures. Here the question is: how realistic is this expectation? In other words, do past experiences of disasters promote the degree of preparedness? As explained below, this chapter intends to investigate this question in the context of Balıkesir city of Turkey, where many disasters take place both in the past and at the present time. At this point, before proceeding forward, it is necessary to highlight that past experiences impact people’s memory. The memory of the disaster is thought to create risk awareness in those who have been previously affected (Monteil et al. 2020). Experiencing a disaster can be elaborated in terms of either at individual level or collective level. Although the literature largely emphasizes the impact of past experience and memory at the individual level, collective experiences and memory are equally important. Few scholars have explored how disasters create a collective memory and have argued that the link between risk perception and memory of disaster is not straightforward (Le Blanc 2012; Wachinger and Renn 2010; Wachinger et al. 2013). In general many scholars accept the concept of “memory” as a social construct. This means, as Legg (2007: 459) argues, that “collective memory is a narrative that excludes rival interpretations and is thus haunted by the potential to remember differently or to refuse to forget.” Therefore, a community (and /or its different segments) holding a past experience of disaster may construct similar or different patterns of remembering or forgetting of that past experience. Considering the fact that Turkish society, specifically the Marmara Region including Balıkesir city, has experienced a very destructive experience of earthquake in 1999, this collective memory should lead to a better shaped pattern of urbanization, and it should extensively motivate the residents of this region. The information below will justify this expectation.
4
Urban Transformation, Collective Memory, and Disaster Preparedness: A. . .
4.1.4
79
The 1999 Marmara Earthquake
Turkey stands out as a country with high earthquake risk due to its young formation and tectonic structure. The current earthquake risk differs from region to region due to the tectonic structure (Özkul and Karaman 2007). Turkey is located in the Mediterranean, Alpine-Himalayan seismic belt, which is one of the most active seismic zones on earth (Ergünay 1999). The North Anatolian Fault Line, the East Anatolian Fault Line, and the West Anatolian Fault Line are important fault lines in the country, and they are the areas where most of earthquake events take place. Among Turkey’s cities, İzmir, Muğla, and Balıkesir are the provinces where earthquake events come about the most. On August 17, 1999, at 03:02 local time, Marmara earthquake, with the epicenter of Gölcük, at 40.70 north latitude and 29.91 east longitude, with a magnitude of Mw 7.6 and lasting 45 s, affected the entire Marmara region and was felt not only in Kocaeli but also in many other cities spreading from Ankara to İzmir. It was determined by the investigations that the focal depth of the earthquake was 17 km and a fault movement of around 120 km with right-slip fault occurred. After the main seismic wave, a large number of aftershocks with magnitudes of 4.0–5.0 occurred. According to official information, 17,480 people died, 23,781 people were injured, 505 people were disabled, and 285,211 houses and 42,902 workplaces were damaged. In the Parliamentary Research Report published in 2010, the death toll was updated as 18,373. According to unofficial information, however, there were more than 65,000 deaths and more than 100,000 severe and mild injuries. In addition, approximately 600,000 people were left homeless, with 133,683 collapsed buildings. Approximately 16,000,000 people were affected by the earthquake at different levels. For this reason, it is one of the most important events that deeply affected Turkey’s recent history. The earthquake is one of the biggest earthquakes of the last century in terms of both its size, the extent of the area it affected, and the material losses it caused. The fact that the earthquake occurred in the Marmara Region, the most important industrial region of Turkey, and affected a very wide geography, caused great distress including the economy of the country (Özmen 2000) (Map 4.1).
4.1.5
Earthquakes in Balıkesir
Balıkesir is one of the Turkish cities where disasters occur the most in terms of both frequency and types. Earthquake is the most common type of disaster in Balıkesir as it is in Turkey. According to the data of TABB, a total of 205 natural disasters occurred in Balıkesir between 1923 and 2018. In terms of the number of occurrences among these events, 85 earthquakes, 40 heavy rains, 31 severe winds, 14 extreme snow loads, 13 fogs, 8 floods, 5 lightning strikes, 4 landslides, 2 rock falls, 2 droughts, and 1 flood occurred within the aforementioned time period.
80
F. Çaki and A. Uzun
Map 4.1 Active fault map of Turkey quoted from Uzun and Oğlakcı (2019)
Although there was no death, injury, or damage to the buildings, the 1999 Marmara Earthquake was felt in Balıkesir as well. In addition, many low-intensity earthquakes are experienced almost every day in Balıkesir. For example, according to the data provided by BDTIM (2022), out of the latest 500 earthquakes in and around Turkey, a total of 95 earthquakes with a magnitude of ≤ Mw 4.9 were experienced in Balıkesir between 28 March 2022 and 6 June 2022. In a sense, earthquake reminds itself almost every day to the residents of Balikesir.
4.1.6
Research Question and Method
Both the 1999 Marmara Earthquake in general and frequently occurring small experiences of local earthquakes in Balıkesir are supposed to create a collective memory of disaster among the residents of Balıkesir city. Based on the above conceptual framework, the main question of this research is the following: Within the 20 years since the great Marmara Earthquake experience in 1999, has the Turkish society, specifically households of Balıkesir, made any sensitivity and progress towards being more prepared for disasters? In other words, to what extent the collective memory of the 1999 disaster experiences have positively improved the preparedness actions of the residents in the city? Within the framework of this main research question, a cross-sectional, cluster sampling, face-to-face household-based survey was conducted in Balıkesir between June and September 2018. The data collection tool is a disaster preparedness questionnaire developed by the authors. The survey intends to explore key information required to understand level of disaster preparedness of Balıkesir people. The
4
Urban Transformation, Collective Memory, and Disaster Preparedness: A. . .
81
study questionnaire had been prepared in Turkish, and the final questionnaire was piloted and tested by the authors on potential participants and revised accordingly. A disaster preparedness questionnaire collected information from four main areas. These included (1) sociodemographic status; (2) disaster risk perceptions; (3) level of actual disaster preparedness; and (4) social capital of households. Level of actual disaster preparedness was questioned in four categories: (1) preparedness in the context of knowledge and skills; (2) preparedness in the context of planning; (3) preparedness in the context of physical protection measures, and (4) preparedness in the context of material supply. Answer options for each question were categorized into a Likert scale with 5 point ratings (1 = Yes, 2 = certainly, 3 = no, 4 = certainly no, 5 = no answer). Data was collected using a cluster sampling method. The survey was conducted with a total of 1139 households at the summer of 2018, taking into account the district populations and their ratios in the total population in 12 districts of Balıkesir, which has a total population of 1,204,824 as of 2017. The research report with all its dimensions was published in Çakı (2020). Here only related findings are shared. A representative from each household of the sample was invited to participate in the survey. All respondents were ensured that they had the right to leave the study anytime and all questionnaires were anonymous. Survey was filled out by one of the ten trained research team members. Each survey took about 25–30 min to complete. All data were double-entered and descriptive statistics were calculated for the questionnaire items. All statistical analysis was conducted with SPSS, version 16.0. Additionally, 14 hypotheses were tested but are not included here. Ethics approval was obtained from the Survey and Behavioral Research Ethics Committee of Balıkesir University. Written consent forms were signed by all respondents.
4.1.7
Findings of Household Characteristics
First, it is useful to highlight some characteristics of the households who participated to the survey. In this context, type of residence area of the household, total monthly income of the household, the city where the household is originally from, number of households with persons in need of special care, and home ownership status of the households are selected because they are considered to impact preparedness. As Table 4.1 shows, 62% of the households live in urban areas of Balıkesir. The great majority has a monthly income of only 3500 TL or less (in 2018). Only a small portion of the households (16.7%) are originally out of Balıkesir, the rest are originally from Balikesir. The ratio of households who have a person in need of special care is around 7%. The majority of the households own their houses, mostly apartments.
82
F. Çaki and A. Uzun
Table 4.1 Household characteristics Type of residence area of the household Urban area Rural area Total Total monthly income of the household 10,001–15,000 + TL 7501–10,000 TL 5001–7500 TL 3501–5000 TL 2501–3500 TL 1601–2500 TL 801–1600 TL 0–800 TL Total Where the household is originally from From Balıkesir Not from Balikesir Total Households with/without persons in need of special care Households with persons not in need of care Households with persons in need of care Total Home ownership status of households Tenant Owner Publicly owned lodging Other Total
4.1.8
Frequency
%
703 432 1135
62.1 37.9 100
28 39 83 206 214 284 203 57 1114
2.5 3.5 7.4 18.3 19 25.2 18 5.1 100
936 189 1125
82.54 16.67 100
1043 83 1126
92.63 7.37 100
216 876 7 29 1128
19.1 77.4 0.6 2.6 100
Findings Related to Disaster Preparedness
Questions measuring the preparedness attitudes and behaviors of households against disasters were designed in four basic categories. Some remarkable points according to the findings obtained within the framework of these categories are described below. 1. Preparedness in the Context of Knowledge and Skills The first dimension of preparedness is to have some basic knowledge and skills. Of course, these knowledge and skills are multidimensional and diverse. However, in this research, information on issues such as warning systems, postdisaster gathering places, first aid, shutting down potentially dangerous
4
Urban Transformation, Collective Memory, and Disaster Preparedness: A. . .
0.40% 40.40%
59.30%
0.10%
86.90%
13.00% 0.00%
83
26.40%
73.60%
31.90% 22.80% 45.40% 1.90%
49.50% 48.50%
0.10% 30.60% 0.10% 0.00%
24.00% 14.50%
69.30% 75.90% 85.50%
Fig. 4.1 Preparedness for disasters/knowledge and skills
installations, and emergency numbers were selected as indicators of the aforementioned knowledge and skills. Accordingly as the Fig. 4.1 shows: • Most of the households do not know whether there is any warning system against natural disasters in their neighborhood (85.5%). • Most of them do not know what the natural disaster warning signals mean (76%). • Most of the household members do not know where to gather in the event of a disaster (74%). • However, most of the households know how to turn off the valves of services such as electricity, water, and natural gas (87%). • Most of them know the emergency numbers from which they can request help in case of a disaster (69.3%). Considering those findings, it can be concluded that people of Balikesir are significantly deprived of some of the information they would need in the event of a disaster. 2. Preparedness in the Context of Planning Another dimension of being prepared is the planning of possible disaster situations within the family. The findings regarding this issue show that the households of Balıkesir are quite inadequate in terms of planning for a possible disaster (see Fig. 4.2). In fact:
84
F. Çaki and A. Uzun
0.20%
18.80%
81.00% 32.60%
5.00%
62.40%
0.30%
0.00%
0.10%
35.10%
17.60%
22.00%
64.50%
82.30%
78.00%
Fig. 4.2 Disaster preparedness/planning
• The rate of those who attended any meetings/trainings about preparedness is only 18.8%. • The rate of those who make any planning within the family for disaster situations is 22%. • The rate of those who set a common meeting place for family members in case of a disaster is 17.6%. • The rate of those who identify a relative outside of the neighborhood they live in as their contact person is 35%. • The rate of those who attend a joint training/meeting with the residents of the neighborhood about possible disasters is 19%. It is understood from these data that most of the households are poorly prepared in terms of planning. 3. Preparedness in the Context of Physical Protection Measures Another dimension of preparedness against possible disasters at the level of households is to take physical protection measures for the dwelling. These measures may include actions such as protecting important documents (deed, passport and identity card, etc.), securing items that can topple in the house, and insuring the residence against disasters. However, Balıkesir households do not seem well prepared in this respect either. Thus: • The rate of those who take precautions regarding important documents (deeds, passports, identity cards, etc.) is only 30.5%. • The rate of those who take precautions against the things that can topple in the dwelling they live in is 25%. • The rate of those who insure their houses against natural disasters is 38.6% (see Fig. 4.3).
4
Urban Transformation, Collective Memory, and Disaster Preparedness: A. . .
0.10%
85
30.50%
0.40%
69.40%
25.00%
0.40%
74.60%
38.60%
61.10%
Fig. 4.3 Disaster preparedness/physical protection
43.90% 56.10%
17.70% 82.30%
13.70% 86.30%
Fig. 4.4 Disaster preparedness/equipment supply
Although it is a legal obligation to insure residences, especially against earthquakes, it is understood that this issue is neglected by the majority of households. 4. Preparedness in the Context of Material Supply Another dimension in the context of disaster preparedness is the supply of materials that will be needed in case of a disaster. These materials commonly include things such as first aid kit, bug-out bag, and water and food products that are stocked for renewal at regular intervals. According to the findings related to this issue, Balıkesir households do not seem to be in good status in this respect either. Thus: • 82% of the households have not prepared a bug-out bag. • 86.3% of the households have not stocked basic foodstuff and water. • Only 44% of the households prepared a first aid kit (see Fig. 4.4).
86
4.2
F. Çaki and A. Uzun
Conclusion
It has been established by the already existing literature that previous disaster experience and collective memory usually positively influence preparedness actions of individuals/households. The findings of this research, however, contradict with the results of such previous studies. When the findings are evaluated in general, it can be said that the understanding and actual practice of preparedness for disasters at the household level do not find reciprocity among the residents of Balıkesir despite the painful experiences in and around its surroundings. Although this general result coincides with the results of another research conducted by AFAD (2014), which is partially similar to this study, the influence of previous disaster experience and collective memory on preparedness actions remains uncertain. Then it is worth asking how the limited influence of this variable can be explained. In our view, two factors play significant roles here. The first one is about the link between financial power and memory building on past experiences of disasters. As commonly accepted, preparedness actions usually require financial power that would affect memory building. Memory building might be a coping strategy to face the trauma of past experiences. It can be built upon either remembering or forgetting. If a household does not have this power enough, then forgetting instead of remembering past experience might better serve its needs. As the data of this research on household characteristics indicates, the great majority of the households (around 85%) earned less than 3500 TL per month. This was equivalent to 562 $ in 2018 when the survey carried out. Thus, middle or lower classes as collective entities may find it more useful not to remember the past even if disasters like earthquakes remind themselves to the residents on a daily basis as what is the case in Balıkesir. Therefore, even memory building of disasters requires empowerment of vulnerable people. The second factor, in our view, concerns falsely constructed understanding of urban transformation, which is dominantly practiced and advocated by public authorities, businessmen, and the media. The concept of urban transformation is largely understood in Turkey as the efforts of replacing old legislation and old building stock with newly constructed ones. No doubt, such efforts are parts of the disaster risk reduction and preparedness. However, urban transformation also requires a radical change in the mind sets of urban population regarding disaster awareness and precocious measures. Urban residents have to be more motivated for such a change in order to avoid or limit destructive impacts of disasters. Thus, more research is needed to understand the determinants of motivation for disaster preparedness and to explore the complicated links among motivation, intention, and action. Acknowledgment The authors thank TÜBİTAK for supporting the project numbered 116 K208, which is the data source of this chapter.
4
Urban Transformation, Collective Memory, and Disaster Preparedness: A. . .
87
References Adiyoso W, Kanegae H (2014) The role of Islamic teachings in encouraging people to take tsunami preparedness in Aceh and Yogyakarta Indonesia. In: Shaw R (ed) Recovery from the Indian Ocean Tsunami: a ten-year journey. Springer Japan, Tokyo, pp 259–278 AFAD (2014) Türkiye Afet Farkındalığı ve Afetlere Hazırlık Araştırması. AFAD, Ankara Aguirre B (2002) Can sustainable development help us? Int J Mass Emerg Disasters 20:111–125 Alexander D (2005) An interpretation of disaster in terms of changes in culture, society and international relations. In: Perry RW, Quarantelli EL (eds) What is a disaster? New answers to old questions. Xlibris Press, New York Baker EJ (1980) Coping with hurricane evacuation difficulties. Florida Sea Grant College Conference Report No. 33: Hurricane and Coastal Storms, Gainesville, FL Baker EJ (2011) Household preparedness for the aftermath of hurricanes in Florida. Appl Geogr 31(1):46–52. https://doi.org/10.1016/j.apgeog.2010.05.002. Accessed 25 March 2018 BDTIM (Bogaziçi Unıversity Kandilli Observatory and Earthquake Research Institute Regional Earthquake-Tsunami Monitorıng and Evaluation Center) (2022) Türkiye ve Yakın Çevresindeki Son Depremler Son 500 Deprem. http://www.koeri.boun.edu.tr/scripts/lst0.asp. Accessed 10 June 2022 Çakı F (ed) (2020) Doğal Afetler ve Yerel Topluluklar Balıkesir Örneğinde Sosyal Bir İnceleme. Nobel Yay, Ankara Dynes RR (2002) The importance of social capital in disaster response. University of Delaware Disaster Research Center, Preliminary Paper #327. http://www.udel.edu/DRC/prepapers.html. Accessed 29 April 2019 Ergünay O (1999) Afet Yönetimi Nedir? Nasıl Olmalıdır? Türk Psikoloji Bülteni, Deprem Özel Sayısı, pp 110–118 Foresight: Migration and Global Environmental Change (2011) Final Project Report. The Government Office for Science, London Friend R, Moench M (2013) What is the purpose of urban climate resilience? Implications for addressing poverty and vulnerability. Urban Clim 6(2013):98–113 Lawrence J, Quade D, Becker J (2014) Integrating the effects of flood experience on risk perception with responses to changing climate risk. Nat Hazards 74(3):1773–1794. https://doi.org/10.1007/ s11069-014-1288-z. Accessed 22 March 2018 Le Blanc A (2012) Remembering disasters: the resilience approach. J Art Theory Pract 14:217–245 Legg S (2007) Reviewing geographies of memory/forgetting. Environ Plan A 39(2):456–466 Lindell MK, Hwang SN (2008) Households’ perceived personal risk and responses in a multihazard environment. Risk Anal 28(2):539–556. https://doi.org/10.1111/j.1539-6924.2008.01032.x. Accessed 25 March 2018 Lindell MK, Whitney DJ (2000) Correlates of household seismic hazard adjustment adoption. Risk Anal 20(1):13–26. https://doi.org/10.1111/0272-4332.00002. Accessed 25 April 2022 McNeill IM, Dunlop PD, Heath JB, Skinner TC, Morrison DL (2013) Expecting the unexpected: predicting physiological and psychological wildfire preparedness from perceived risk, responsibility, and obstacles. Risk Anal 33(10):1829–1843. https://doi.org/10.1111/risa.12037. Accessed 22 April 2019 Monteil C, Simmons P, Hicks A (2020) Post-disaster recovery and sociocultural change: rethinking social capital development for the new social fabric. Int J Disaster Risk Reduct 42:101356 Özkul B & Karaman E (2007) Doğal Afetler Için Risk Yönetimi. In: TMMOB Afet SempozyumuKongre Sempozyum Bildiriler Kitabı, Ankara, pp 5–7 Özmen B (2000) 17 Ağustos 1999 İzmit Körfezi Depreminin Hasar Durumu (Rakamsal Verilerle), TDV/DR 010-53, Türkiye Deprem Vakfı Paton D, Johnston D (2001) Disasters and communities: vulnerability, resilience and preparedness. Disaster Prev Manag 10(4):270–277. https://doi.org/10.1108/EUM0000000005930. Accessed 15 February 2019
88
F. Çaki and A. Uzun
Paul BK, Bhuiyan RH (2010) Urban earthquake hazard: perceived seismic risk and preparedness in Dhaka City, Bangladesh. Disasters 34(2):337–359. https://doi.org/10.1111/j.1467-7717.2009. 01132.x. Accessed 15 February 2019 Quarantelli EL (2001) Statistical and conceptual problems in the study of disasters. Disaster Prev Manag 10(5):325–338 Russell LA, Goltz JD, Bourque LB (1995) Preparedness and hazard mitigation actions before and after two earthquakes. Environ Behav 27(6):744–770. https://doi.org/10.1177/ 0013916595276002. Accessed 18 February 2018 Sattler D, Kaiser CF, Hittner JB (2000) Disaster preparedness: relationships among prior experience, personal characteristics, and distress. J Appl Soc Psychol 30(7):1396–1420 Shreve CM, Kelman I (2014) Does mitigation save? Reviewing cost-benefit analyses of disaster risk reduction. Int J Disaster Risk Reduct 10(Part A):213–235. https://doi.org/10.1016/j.ijdrr.2014. 08.004. Accessed 18 May 2022 Sims JH, Baumann DD (1983) Educational programs and human response to natural hazards. Environ Behav 15(2):165–189. https://doi.org/10.1177/0013916583152003. Accessed 5 March 2019 Sutton J, Tierney K (2006) Disaster preparedness: concepts, guidance, and research. Natural Hazards Center Institute of Behavioral Science University of Colorado, Boulder, CO. http:// www.colorado.edu/hazards. Accessed 22 April 2018 Tanaka K (2005) The impact of disaster education on public preparation and mitigation for earthquakes: a cross-country comparison between Fukui, Japan and the San Francisco Bay Area, California. USA. Appl Geogr 25(3):201–225. https://doi.org/10.1016/j.apgeog.2005.07. 001. Accessed 15 March 2022 Tekeli-Yeşil S, Dedeoğlu N, Tanner M, Braun-Fahrlaender C, Obrist B (2010) Individual preparedness and mitigation actions for a predicted earthquake in Istanbul. Disasters 34(4):910–930 Uzun A, Oğlakcı B (2019) Turkey’s earthquake history and institution based earthquake reduction policies and strategies. In: Farabollini P, Lugeri FR, Mugnano S (eds) Earthquake risk perception, communication and mitigation strategies across Europe. IL Sileno Edizioni, Lago van der Keur P, van Bers C, Henriksen HJ, Nibanupudi HK, Yadav S, Wijaya R, Jaspers F (2016) Identification and analysis of uncertainty in disaster risk reduction and climate change adaptation in South and Southeast Asia. Int J Disaster Risk Reduct 16(208–214). https://doi.org/10. 1016/j.ijdrr.2016.03.002. Accessed 5 May 2022 Wachinger G, Renn O (2010) Risk perception and natural hazards. CapHaz-Net WP3 report. DIALOGIK Non-Profit Institute for Communication and Cooperative Research, Stuttgart Wachinger G, Renn O, Begg C, Kuhlicke C (2013) The risk perception paradox–implications for governance and communication of natural hazards. Risk Anal 33(6):1049–1065 WHO/EHA (2002) Disasters & emergencies definitions training package. WHO/EHA Panafrican emergency training Centre, Addis Ababa
Chapter 5
Perceptions and Practices of Disaster Governance in Countries with Long History of Centralized Administration: A Case Study of Balikesir Municipalities, Turkey Fahri Çakı
and Alper Uzun
Abstract Causing major disruptions, disasters threaten more than ever the whole world, especially urban areas, where more than half of the world’s populations live in today. Influenced by several recent international initiatives, such as United Nations’ International Strategy for Disaster Reduction (ISDR), The Hyogo Framework for Action 2005–2015, and The Sendai Framework for Disaster Risk Reduction 2015–2030 (SFDRR), there has been a growing awareness and consensus on the need in risk reduction, prevention, and climate adaptation. Such initiatives highlight the importance of efforts of reducing disaster risks and building a “culture of prevention,” as part of sustainable development. This reflects a paradigm shift in the mindset from disaster response to disaster reduction and preparedness. This shift also necessitates a fundamental change from centralized disaster management to decentralized disaster governance that is supposed to involve partnerships of all stakeholders including local communities, governments, private sector, civil society organizations, etc. In order to fasten and facilitate the process of disaster reduction and preparedness, the literature usually focuses on the skills of “capacity building” of local governments. But is it really mainly a matter of capacity building? This paper finds this view simplistic and instead argues that disaster governance may hardly take place in some countries like Turkey even if they hold high skills of capacity building. Putting financial barriers aside, countries that already have a decentralized form of administration, theoretically, may easily adapt to this shift. However many countries, including Turkey, hold a long history of centralized administration that makes it quite difficult for them to adapt to this new paradigm of disaster governance
F. Çakı (✉) Faculty of Science and Arts, Department of Sociology, Balıkesir University, Balıkesir, Turkey A. Uzun Faculty of Science and Arts, Department of Sociology, Balıkesir University, Balıkesir, Turkey Department of Geography, Balikesir University, Balikesir, Turkey © The Author(s), under exclusive license to Springer Nature Switzerland AG 2023 S. D’Amico, F. De Pascale (eds.), Geohazards and Disaster Risk Reduction, Advances in Natural and Technological Hazards Research 51, https://doi.org/10.1007/978-3-031-24541-1_5
89
90
F. Çakı and A. Uzun
no matter how often and how severely they face disasters. Given that, it becomes important to examine how such countries deal with the principal of disaster governance in terms of disaster reduction and preparedness. To explore this question, this chapter discusses the results of a qualitative study looking at the relationships of Balikesir municipalities with other local stakeholders. The data comes from in-depth interviews with ten mayors and high-rank officials. The main findings are the following: the perceptions and behaviors of municipalities towards natural disasters generally remain focused on post-disaster response. Disaster risk and vulnerability analyses are not performed. Target audiences of awareness trainings are limited to students. The concept of preparedness is not widely internalized because local knowledge actors are not allowed to be actively involved in planning processes. It is concluded that a history of centralized administration along with strong national security concerns are the main reasons behind relatively poor performance of disaster governance. However, municipality authorities have a high belief in the response capacity of the state institutions and social solidarity in the events of disasters. Keywords Disaster risk reduction · Preparedness · Disaster governance · Balikesir municipalities
5.1
Introduction
Disasters can cause serious economic damage to local communities, regions, countries, and even the entire globe, causing the death and/or injury of tens of thousands of people (and plants and animals), and devastating buildings, infrastructure, and the environment in rural and urban residential areas. According to the EM-DAT of CRED, in 2019 a total of 389 disasters linked with natural phenomena took place around the world. In those events, nearly 24,000 people lost their lives, 94 million got affected, and an estimated amount of US$ 122 billion damage happened (CRED 2020). On the other hand, there is a growing belief that natural disasters are increasing in the world compared to the past (Titko and Ristvej 2020). However, the impacts of disasters do not occur in the same strength and intensity for every social group/community in social life. As UNDRR points out, impacts are often much greater among the most vulnerable groups—people living in poverty, the unemployed and underemployed, persons with disabilities, women and girls, displaced persons and migrants, young people, indigenous peoples, and older adults. In the aftermath of a disaster, these people “. . .may be caught in protracted cycles of unemployment and underemployment, low productivity and low wages and are particularly vulnerable to extreme weather [events]” (UNDRR 2019: 147). Considering these aspects, it is clear that disasters are social-cultural events as well as physical events. Along with social change, disaster perceptions and attitudes and behaviors towards disasters also change. Although social scientists approach disasters from different perspectives, they mostly tend to see disasters as a result of certain factors that are generally linked to
5
Perceptions and Practices of Disaster Governance in Countries with. . .
91
hazards and risks. Most of events of natural disasters are believed to be due to global climate change. According to the World Economic Forum, “among the highest impact risks of the next decade, infectious diseases are in the top spot, followed by climate action failure and other environmental risks; as well as weapons of mass destruction, livelihood crises, debt crises and IT infrastructure breakdown” (2021: 7). The experiences of COVID-19 pandemic have drawn attention to pandemics (biological threats/biological natural disasters) and their impacts on various specific groups as well as on the general public (Cugat and Narita 2020; ILO 2020). For example, in a collection of essays, the World Economic Forum (2020) explores challenges and opportunities for strengthening preparedness and resilience in the post-COVID world. Accordingly, a disaster may have natural causes or man-made causes. In a sense, the existence and emergence of these sources of danger cannot be prevented. However, the existence or emergence of these sources of danger is not the direct cause of disasters. Disasters are the devastating effects that occur as a result of inability to respond effectively and adequately to these hazards. If sufficient and appropriate response capacity is developed against the said destructive effects, harms (physical, social, or economic) can be prevented to occur; therefore, the destructive dimensions of disaster events can be completely or partially eliminated. This leads to looking at disasters as something manageable. The ultimate goal of disaster management is, on the one hand, to detect threats, dangers, and risks in advance and to eliminate them as much as possible with appropriate measures, and on the other hand, to increase the resilience of the analysis unit at all levels (individual, family, organization, community, and nation) by reducing their vulnerabilities. The fact that natural disasters mostly occur in a local and regional area prompts the relevant literature to consider the active participation of local governments and communities in disaster mitigation, prevention, and preparedness processes. As a matter of fact, the top-down central management approach in the past has now been replaced by a decentralized disaster management approach in which local governments and communities play an active role. In this context, municipalities are one of the most important local actors in the process of creating a resilient society/community and in the preparedness process. Municipalities are expected to be the pioneers of community-based disaster governance by playing the most active roles before, during, and after the event in the context of probable and real disasters in their regions. But to what extent do municipalities actually play this role? Do local governments have a strong agenda and appropriate mitigation, prevention, and preparedness strategies to “decontaminate” their cities? To what extent do municipal administrations use the principle of governance in risk management and disaster preparedness processes? These questions are especially important for the Turkish society, which has suffered the painful losses caused by the 1999 Marmara Earthquake. This chapter aims to explore how the perceptions, attitudes, and behaviors of municipal administrations look like in contemporary Turkey, in the case of Balıkesir, within the conceptual framework of disaster-resilient society, preparedness, and community-
92
F. Çakı and A. Uzun
based disaster management, which stand out as parts of the main themes of contemporary disaster research.
5.2 5.2.1
Literature Overview Disaster Management and Preparedness
Disasters arise as a result of the inadequacy of the appropriate and effective response capacity to dangers/hazards, risks, and vulnerabilities. In this case, if the said response capacity is sufficiently developed, the consequences of hazards and risks in disasters can be prevented, and therefore the destructive dimensions of disaster events may be completely or partially eliminated. In this logical framework, it is seen that the concept of disaster management has gained importance in order to increase the response capacity in question. Accordingly, disaster management includes a series of processes as activities to be carried out before, during, and after disasters occur. The ultimate goal of disaster management is, on the one hand, to eliminate threats, hazards, and risks as much as possible, and to reduce the vulnerabilities and increase resilience of analysis units at all levels (individual, family, organization, community, nation). Disaster preparedness is also “an important element of the disaster risk management (DRM) that can also contribute to achieving the sustainable development goals” (Titko and Ristvej 2020: 2). Disaster management processes are generally handled in four stages: (a) mitigation, (b) preparedness, (c) response, and (d) recovery (Sutton and Tierney 2006: 3). As Bello et al. (2021) state, these stages are closely interrelated and “must be set within a conducive institutional, political, normative and financial environment that permits the allocation of the necessary resources and the appropriate definition of roles and responsibilities” (p. 8). Among these stages, the preparedness process “intersects with both of these two areas, serving as a temporal connector between the pre-impact and post-impact phases of a disaster event” (Sutton and Tierney 2006: 3). As a special type, pandemic preparedness include the need to increase overall public health funding, strengthen the public health workforce, eliminate barriers to access, improve data systems, address disparities, improve communication, and improve coordination across global, national, local, and regional authorities. For this reason, preparedness is seen as a very important process in the formation of disaster-resilient communities (Kirschenbaum 2004; Sutton and Tierney 2006; Espina 2015). In order to become resilient, a society or a community “must identify the disaster risks that it faces and then design and implement measures for reducing those risks (by means of, for example, infrastructure upgrades, land use planning and financial protection measures)” (Bello, Bustamante and Pizarro (2021:8). Preparedness is the measures that enable different units of analysis such as households, organizations, communities, and societies to respond effectively and recover quickly when disasters occur (Kirschenbaum 2004; WHO/EHA 2002).
5
Perceptions and Practices of Disaster Governance in Countries with. . .
93
According to FEMA’s definition, preparedness is “the leadership, training, readiness and exercise support, and technical and financial assistance to strengthen citizens, communities, state, local, and tribal governments, and professional emergency workers as they prepare for disasters, mitigate the effects of disasters, respond to community needs after a disaster, and launch effective recovery efforts” (www.fema. gov, Accessed 21 January 2018). It also requires measures against spread of misinformation (Cheng and Luo 2020; Hutchinson 2020). In short, preparedness is a concept that expresses how well equipped and ready individuals and organizations are to respond to negative environmental threats (Perry and Lindell 2003). Preparedness studies also aim to ensure that the necessary resources are available to respond effectively in the event of a disaster and that those who have to respond to the disaster know how to use these resources (Sutton and Tierney 2006). In many studies, it has been tried to determine the factors that facilitate disaster preparedness. Personal/individual, institutional, community (Sagala et al. 2009), social, and environmental factors (Tekeli-Yeşil et al. 2010) are the factors highlighted in this context. Individual factors include three basic belief systems (preparedness, danger, and personal beliefs) that have been found to affect preparedness behavior (Becker et al. 2013). In explaining each of these belief systems, Becker et al. (2013) emphasized that danger beliefs are equated with risk perception. The default risk level influences how people think about disaster preparedness. Preparedness beliefs focus on the meaning of preparedness, while personal beliefs explain people’s understanding of the effects and ways of coping with disasters. The literature similarly shows that personal experience with a danger has a positive effect on behavior (Norris et al. 1999). The level of effectiveness of the preparedness response to disasters may differ from society to society and according to the analysis unit. According to Barton, “the sources of effectiveness lie at the individual level (motivation, skill), at the group and organizational level (cooperation, leadership, resources), at the community level (inter-organizational coordination, technical and social skill of leadership, capacity to mobilize resources), and social leadership at higher levels (in state and national government, in large corporations, in large voluntary organizations, in professional and intellectual communities providing knowledge to guide policies.) At each level there can be activity or passivity, cooperation or non-cooperation, knowledge or ignorance, and ability or inability to bring resources to the problem (Barton 2005: 131). As it can be understood from the information presented above, there are various analysis units in disaster preparedness research and guidance services. The smallest unit of analysis among these is households. Just like the understanding that “every disaster is local,” preparedness begins at home with some simple steps that can be taken to improve life safety, property protection, and survival from dangerous events. While some households can prepare for disasters, it is clear that many other families lack the necessary funds and resources. This makes them more vulnerable to the destructiveness of disasters. For households, vulnerability is related to income, education, ethnicity, age, and linguistic isolation. Other axes of
94
F. Çakı and A. Uzun
stratification also play a role in making households more or less vulnerable and preparing them for disasters (Perry and Lindell 2006). Apart from households, communities and organizations are other prominent analysis units in disaster preparedness research and guidance services. Accordingly, for an effective disaster management, communities and organizations, as well as households, should be committed to disaster preparedness activities (Sutton and Tierney 2006: 14). A community is a social unit that may or may not be associated with a local political jurisdiction. The boundaries of a community may be represented by settlements or organizations with common ethnic origin, interest-based associations, or other social groups. However, community is often used to mean the local political jurisdiction (municipal government, district governorship, etc.) responsible for emergency preparedness, emergency warning and notification, emergency response, and recovery (Sorensen and Rogers 1988).
5.2.2
The Role of Local Governments/Municipalities in Disaster Preparedness
We have mentioned above the widespread belief that natural disasters are increasing in the world. This opinion is also strong in relation to cities and fragile communities in them. Indeed, many disaster researchers point out that the number of vulnerable people and communities to disaster risks continues to increase in most cities (Niekerk 2005; GTZ 2002; UNDP 2004). Of course, not every community is vulnerable to the same degree. The difference lies in the fact that some communities have to face more dangers that expose them to property damage, loss of life, or injury more than others. Therefore, the more exposed a community is to hazards, the higher its vulnerability (Cannon 1994). There is no doubt that central governments have a major role in disaster management. However, many disaster researchers are skeptical of the capacity and effectiveness of the centralized approach in disaster management, and instead emphasize the need and benefits of local governments and local community-based disaster management with a decentralized approach. Local governments are defined as “systems of special geographical units that have definite borders, a legal identity, an institutional structure, generally defined powers and duties in their statutes, and have a degree of financial and other forms of autonomy” (Mphaisha 2006). In general, decentralization involves “authority being spread out from a smaller to a larger number of actors” and the shift from a central authority to a less central one (Pollitt 2005: 373). Decentralization can be implemented in an administrative, political, and financial context. According to Ile (2009), the general idea behind decentralization is that the national government alone cannot fulfill all the functions and powers required by legislation. Proponents of decentralization hope that this understanding will give birth to the process of governance, not administration, and
5
Perceptions and Practices of Disaster Governance in Countries with. . .
95
they attribute various benefits to it. Decentralization is argued to be beneficial, for example, as it helps strengthen quiet communities by giving them the power to make their own decisions and provides opportunities for community members to manage disasters using their own strategies (Patterson et al. 2009). It is assumed that most of the general arguments supporting decentralization also apply to disaster management. Thus, decentralization is believed to increase participation, capacity, communication, and coordination between sectors and levels of management. These features are believed to have an impact on vertical disaster management cooperation as well. Increasing local capacity is critical in providing many local services and reducing losses (Toya and Skidmore 2013). Local government can also increase local disaster management capacity (Rumbach 2016), facilitate preparedness, and increase public participation in disaster planning by incorporating local information and increasing local control over resource expenditure (Escaleras and Register 2012; Garschagen 2015). Inspired by decentralization, community-based disaster management puts members of the local community at the center of managing the community’s risks. This approach encourages the participation of non-governmental and community-based organizations operating within the community and sometimes other outside community organizations (Sahoo 2005; GTZ 2002; Scott and Tarazona 2011). Therefore, this approach requires the active participation of community members in decisions that affect community life (Sahoo 2005). Many international programs and agreements too, such as the 2030 Agenda for Sustainable Development, the Sendai Framework, the Paris Agreement, the Addis Ababa Action Agenda of the Third International Conference on Financing for Development, and the New Urban Agenda adopted by the United Nations Conference on Housing and Sustainable Urban Development (Habitat III), support this approach. Some researchers (Cannon 1994; Sahoo 2005; Pillay 2001) point out that the lack of community involvement in disaster risk reduction efforts will result in ignoring local community knowledge and strategies for disaster emergency survival. Community involvement ensures transparency and creates a space for responsibility sharing (Meshack 2004; Sahoo 2005). Responsibility sharing facilitates a more sustainable use of scarce resources, thereby helping disaster mitigation and preparedness, as well as increasing community capacity. Local government is believed to contribute to good disaster governance through building local capacity and bringing local perspectives and knowledge through the involvement of local actors. Similarly, the activities of local governments and civil society actors are believed to facilitate context-specific risk management solutions that are specifically tailored to the specific needs, aspirations, and capabilities of local communities (Garschagen 2015). Responding to disasters and reducing their risks requires local capacity within and outside local governments (UNDP 2015). Decentralized systems “prepare for and respond to disasters more effectively relative to more centralized systems” (Ainuddin et al. 2013: 51). It is seen that the literature attaches great importance to the active participation and responsibility sharing of local governments and communities in disaster reduction, prevention, and preparedness processes. Undoubtedly, municipalities are
96
F. Çakı and A. Uzun
among the key actors in this context. The fact that municipal administrators come to power with the votes of the local people for certain periods and are mostly elected from among the candidates coming from the local people leads them to establish closer ties with the local people and to better know the local capacities as well as the local problems and needs. In addition, in terms of their personnel, technological equipment, infrastructure tools, and financial power, municipalities have the potential to be the most effective actors in risk analysis, prevention, preparation, and response activities related to disasters and emergencies in their regions. Municipalities, which have close relations with local people and resources, have a high capacity to use local information for effective disaster prevention and preparedness activities and adapt them to local threats and vulnerabilities. After all, disasters are mostly local. For all these reasons mentioned above, municipalities are expected to be the pioneers of community-based disaster governance by playing the most active roles before, during, and after probable and real disasters in their regions. The insights above might be theoretically correct. But to what extent do municipalities actually play such a role? Are local governments developing appropriate mitigation, prevention, and preparedness strategies to make their cities “disasterfree”? To what extent do municipal administrations use the principle of governance in risk management and disaster preparedness processes? Most importantly how cultural/historical backgrounds of a given country affect the desirability and/or applicability of community-based disaster governance? The research outlined below presents and discusses findings regarding such questions.
5.3 5.3.1
Research Methods and Techniques Purpose and Problem of the Research
Turkey has been a disaster-intense country. Between 1923 and 2018 Turkey has experienced 1903 earthquakes, 1281 landslides, 430 strong winds, 80 hail, 72 floods, 125 droughts, 721 extreme snowfalls, 445 avalanches, 696 floods, 352 rockfalls, 240 lightning strikes, 3 dust storms, 227 fogs, 754 heavy rains, and 127 collapses (Uzun 2020: 102). Apparently earthquakes seem to be the most striking threat for almost the whole country because Turkey is located in the Mediterranean, AlpineHimalayan seismic belt, which is one of the most active earthquake zones on earth (Ergünay 2009). Undoubtedly, the most painful earthquake experience took place in 1999 in the Marmara Region with a result of 17,480 deaths and 43,953 injuries along with about 600,000 people becoming homeless (Altun 2018: 6). This experience should have been a milestone not only for the region but also for the whole country. Has Turkish society experienced a significant transformation in disaster perceptions, attitudes, and behaviors after this big event? As stated above, municipalities are one of the most important actors in the process of building a resilient society/ community and in the preparedness process. In Turkey metropolitan and district municipal governments are elected for a period of 5 years by the votes of the local
5
Perceptions and Practices of Disaster Governance in Countries with. . .
97
people and are expected to produce solutions to the problems and needs of the local community. The expectations of local communities from the municipalities are very high in the disaster preparedness and post-disaster response processes. Additionally, municipalities are the most trusted institution among Turkish local people (Çakı et al. 2019: 923). Due to this trust and their supposedly key role, to what extent do municipal administrations more specifically use the principle of governance for processes of disaster resiliency and preparedness, which stand out as main themes of contemporary disaster research? Do municipalities have strong agendas and work programs to improve disaster awareness and preparedness in local communities in terms of disaster governance? The main purpose of focusing on these questions is to improve our knowledge and understanding on how municipalities react against likely natural disasters and to discuss the desirability and/or applicability of community-based disaster governance within the context of countries holding a long history of centralized government tradition. However, different strategies (quantitative or qualitative research) on different social actors such as individuals, households, local and central governments, and non-governmental organizations can be designed and implemented for such a purpose. This research, shaped by the questions above, adopted the strategy of choosing one of the provinces that stand out in terms of natural disaster risks and designing the research within the framework of the local administrators of that province. In this context, the research has chosen Balıkesir, one of the provinces where the risk of many natural disasters, especially earthquake and flood, is intensely felt, as a case study.
5.3.2
Research Method and Process
In order to reach its goals, this research adapts a qualitative method which refers to the attitudes and strategies followed in qualitative research aimed at understanding how people understand, experience, interpret, and produce the social world (Sandelowski 2004: 893). Qualitative research is based on an interpretative approach. According to this approach, social phenomena are those that are constantly constructed and that are constantly being constructed by the mutual interaction of individuals and groups. The interpretative approach focuses on the meaningful social actions of people and assumes that social phenomena are constructed in people’s world of meaning, in the process of interaction that takes place among people. Among the research techniques of the qualitative research method, in-depth interview was chosen for data collection. In-depth interview is an interview technique used when it is desired to gather information about the thoughts, opinions, and experiences of the people rather than the superficial information about the research problem. In in-depth interviews, it is tried to obtain very detailed information about
98
F. Çakı and A. Uzun
the experiences, views, thoughts, and beliefs of the participants by interviewing a small number of people. Whether or not information about all the details and dimensions of the research subject is obtained during the interview reflects the depth of the interview (Kümbetoğlu 2005: 81). In the research process a semi-structured interview form was used. It included four main topics: (a) awareness of local natural disasters (4 questions), (b) awareness-raising activities (2 questions), (c) other prevention and intervention activities (5 questions), and (d) perceptions of trust (4 questions). So a total of 15 open-ended questions were included in the form. Of course, many drilling questions were also asked when appropriate. The interviews were recorded on a voice recorder and then transcribed. Interviews were carried out in durations varying between 30 and 60 min. The sample group of the research consists of a total of ten administrators, including the mayors of Balıkesir Metropolitan Municipality and five district municipalities, and the relevant unit managers. While using the interview data, information on the gender, age, and job position of the participants were not included in case it might lead to the guessing of the identities of the municipal administrators.
5.4
Findings
As a result of the classification and analysis of the interview data, we have organized the findings under eight subheadings as described below.
5.4.1
Risk Analysis: “It Has a Cost”
We first wanted to specifically ask the municipal administrators whether any risk analysis, which is an important part of the disaster reduction management (Titko and Ristvej 2020; UNDRR 2019), is carried out in their provinces/districts. Many chose to dismiss this question. A few of them directly admitted that they have not done any risk analysis. The following quote is an example: If we say that we have done a risk analysis yet, we would not be speaking correctly. I’m not so sure about a risk analysis study (in the previous period too), but there are studies that have been done. Of course, as you know, first of all, Balıkesir is an important area under the first degree earthquake belt, which is affected by a fault line in an existing business, especially in the Karesi region. Apart from this, we cannot say that it is a natural disaster, but we have a geography that can have problems with rain water. Apart from this, there is no situation that we foresee as a natural disaster (in our district). (Interview #3)
Earthquake risk is a widely known disaster risk in Balıkesir. However, it is seen that municipal administrators generally tend not to accept the existence of disaster risks other than earthquakes, since they do not carry out serious risk analysis actions. It can be thought that the narrowed understanding of “disaster” in the minds of
5
Perceptions and Practices of Disaster Governance in Countries with. . .
99
municipal administrators has an effect on this. As political actors, municipal administrators may also show this tendency “politically.” Another reason why such studies have not been done so far is the “cost,” as can be seen from the excerpt below. Municipal administrators argue that it is almost impossible with their current budgets to carry out routine responsibilities, let alone risk analysis actions. In the coming period, we will make an effort to make our district as prepared as we can, by having a risk analysis done in our district... As you know, last year, serious water cuts caused serious grievances of people due to the explosion of the main pipes, which caused at least as serious a problem as a natural disaster. We looked at the way to fix them. Another important issue for us is that a rainwater transmission line should be built in order to prevent rain floods. But here, too, the rainwater pipeline is the responsibility of the district municipality for our district, and it has a cost of about three to four times the budget of our municipality. We are working on it now. How can we get around this? At least in the main arteries, we can do it in the next 5 years (we wish). (Interview #2)
Undoubtedly, cost and budget possibilities are undeniable realities. In addition, determining the priorities well and using the budget in a rational and responsible manner should be among the sensitivities of the municipal administrations.
5.4.2
Database on Disadvantaged Groups: “I Don’t Think We Have a Healthy Data”
An important aspect of disaster preparedness is of course having a database on and intervention action plan for vulnerable/disadvantaged people including the handicapped, the poor, the sick, the elderly, the immigrants, etc. Through such a database and action plan, intervention may take place faster and more effectively in case of a disaster (Sutton and Tierney 2006: 6). We asked the municipal administrators if they had any database and any intervention action plans for such social groups in order to reach the disadvantaged groups in their provinces/districts quickly in case of a disaster and meet their needs. Almost all of the administrators said that such a database is not available to them: Not as far as I know, but it is an important issue, for the first time, thank you for drawing attention to it, but we do not have such data, I do not think that we have a healthy data. (Interview #6)
Another municipality administrator states that he does not have numerical data on disadvantaged social groups, but points out that what the institution will do in case of a possible disaster has already been planned:
100
F. Çakı and A. Uzun
We do not have numerical data like this. In a project called TAMP,1 such plans are already being prepared in the Marmara region through AFAD.2 They form some working groups with the data they need. In these working groups, they have different duties such as funeral services, burial services, and rescue services. In other words, AFAD units are already doing the general analysis in the Marmara region. There is such a list of stakeholders. This is called TAMP. In this TAMP, everyone’s duties are clear, they are related to logistics, funeral, rescue, so we do not have our own plan, we only share the data we have with the AFAD region. (Interview #1)
Exceptionally, a municipal administrator states that they have numerical data on disadvantaged social groups, but they do not make an intervention action plan for them: We have numerical data, these numbers are available in Cultural and Social Affairs. We have a center there called ALGEM, we already have a sociologist there. From personal care services to the elderly, trainings, social market, etc., I am trying to explain that numerical data are much healthier there. Addresses and information about the elderly, disabled young people, the disabled and poor families are all available. But I don’t think there is an action plan for such a disaster situation. (Interview #4)
Although all of the municipal administrators we interviewed specifically stated that they adopted the concept of “social municipality,” it is of course a contradiction that almost no municipality has up-to-date databases and an intervention action plan for the vulnerable/disadvantaged social groups within the borders of their province/ district. This contradiction becomes even more striking when considering the fact that municipalities can/do employ sociologists, psychologists, and social workers. Thus, it is possible for each municipality to obtain up-to-date data on vulnerable/ disadvantaged individuals within its borders. However, they generally tend to see this outside of their responsibilities.
5.4.3
Information on Disaster Material Requirements: “We Provide Whatever Assistance Is Requested from Us”
In a disaster, it is necessary to save a large number of human lives and to provide treatment for injured people as soon as possible, and to meet the vital and basic needs of citizens such as shelter, nutrition, heating, protection, security, and psychological support. In this context, all of the municipal administrators to the questions we asked about the types and numbers of materials that would be needed in case of a disaster stated that these data were provided by AFAD (Directorate for Disaster and Emergency Cases) and that the municipalities provided assistance from their own bodies upon the request of AFAD. A typical response in this context is:
1
TAMP is acronym for Turkish Disaster Intervention Plan. AFAD is acronym for Directorate for Disaster and Emergency Cases. It was established by the central government after the 1999 Marmara Earthquake. It is affiliated to the Governorships of every single city.
2
5
Perceptions and Practices of Disaster Governance in Countries with. . .
101
There is AFAD, it is affiliated to the Governor’s Office, because they have more data. In the event of a disaster, under their coordination, the Municipality, Provincial Health Directorate, National Education and other institutions take action depending on the direction of AFAD. So I don’t know what their data, resources and priorities are. We only have commitments with AFAD; we provide personnel or support for equipment, vehicles, dozers, carriers, fire extinguishers, whatever. In the event of a disaster, the personnel or equipment supports of the metropolitan and district municipalities are coordinated from the same place, in such a case you cannot separate them. (Interview #7)
Here, it is understood that the municipalities are assigned under the coordination of AFAD and that other state institutions provide support and service in line with this system. In our meetings with AFAD, it was confirmed that disaster response work is organized within the framework of TAMP (Turkish Disaster Intervention Plan), which involves a total of 26 service groups—including municipalities and provincial directorates of Ministry of Health, Ministry of National Education, Ministry of Family and Social Policies, Provincial Directorate of Security, etc.—working all together with a division of task under the coordination of AFAD. This division of task among the stakeholders is determined directly by the state. Although it theoretically involves the participation of NGOs too, in practice they are allowed to play a very limited role. What is important here is that the centralized character of disaster management through AFAD makes all institutions including municipalities reduce their share of responsibility for disaster mitigation and preparedness process. We will come back to this point in the conclusion section.
5.4.4
Awareness-Raising Activities: “A New Generation Is Coming with Its Consciousness Right Now”
In Turkey, interventions to be implemented after emergencies and taking measures to reduce disaster damages are more prevalent than taking measures to reduce the damages of major disasters, whether natural, technological, or human-induced, with advance planning (Erkal and Değerliyurt 2009: 162). However, in order to prevent life-threatening risks in disasters, pre-disaster preparation, information, and awareness-raising activities are of great importance (Sutton and Tierney 2006: 6). Disaster awareness actions can increase the preparedness level and level of resilience against disasters (Titko and Ristvej 2020: 4). Thus we asked the municipal administrators whether they had done any awareness-raising activities to prepare local people in their provinces/districts for disasters. Almost all of the municipal administrators stated that they have done some disaster-oriented activities, but they also felt the need to emphasize the limitations of these activities. Conferences and talks are held from time to time. Of course, it is not correct to say that this is enough. It is always necessary to educate people and raise awareness, and it is necessary to carry out trainings one-to-one until it touches the individual. In a sense, such trainings are ritual things that institutions do to fulfill their duties. (Interview #6)
102
F. Çakı and A. Uzun
Another municipality administrator stated that training and awareness-raising activities for disasters are only carried out in schools, and that there is no comprehensive work for the community. In his words: “There is no campaign, but we are doing this in schools, in cooperation with AFAD” (Interview #9). Almost all of the municipality administrators mentioned the inclinations carried out by the Fire Department in the context of awareness raising activities. For example, two different municipal administrators made the following statements similar to each other: There is no special study we have done so far. We know the work of our fire department in this regard. Our fire department goes to first aid training and conducts emergency and fire drills in different areas, in buildings. If you ask what you are doing as a municipality, there is no special activity that we do exactly. But when different units of our state ask for help, we mobilize about them. So let me say in a nutshell. Everything in the regulations regarding this is done completely, and as a fire department, our fire department operates in all schools, especially in the 4th and 8th grades of primary school, in order to provide all information about natural disasters. In other words, we gather those students in all schools in the last year of primary school and in the last year of secondary school and carry out awareness raising activities. We continue in this way with the logic that students can also inform their family members. We provide continuous education to the new generation. (Interview #4) Our Municipality’s Fire Brigade Department and AFAD Provincial Directorate carry out continuous activities on both earthquake disaster awareness and fire awareness and fire prevention services for primary and secondary schools throughout the academic season. Last year, we reached a total of 130 thousand students at schools. . . . So, this new generation is coming with its consciousness right now. We are much more active in terms of preventive services. In other words, that new generation is now at the middle, high school, and university levels, so they are much more conscious of basic information, both fire and disaster, since they come with this information. (Interview #1)
As it can be seen, the main target group of disaster awareness-raising activities in the local community is limited to youth (students). This can be read as an indication that the municipalities do not have such an agenda directly, and that there is no hope for the adult and elderly population in a sense. As a matter of fact, some municipal administrators admit that there is no awareness-raising effort for the local community, but they also feel the need to complain about the indifference of the community. As in this quote: Preparation is entirely AFAD’s duty, of course. Naturally, since they have the responsibility, they only give us directions, so we apply them anyway. Apart from that, we provide training on fire and first aid. But since we have an institutional structure, we do not have any problems, but when the business returns to the public, there is a lot of deficiency. Now, for example, if we make and distribute brochures, how many people do you think would read them? . . . Everyone is on social media, telephone or television, serials. . . Unfortunately, we have a great lack there. If we make a brochure and distribute it, what percentage will read it? I don’t think most of them will read it. But it could be through social media. For example, now young people make short videos, interesting videos, that may be a bit absurd that you can remember, but it may be interesting, without exaggerating it, that type of awareness can be made. This is how I think. (Interview #3)
From all the data on the subject, it is concluded that municipalities carry out “some training activities” within the scope of raising disaster awareness, but these activities are carried out with a narrow audience (usually students), with a narrow content
5
Perceptions and Practices of Disaster Governance in Countries with. . .
103
(usually on fire), and are not systematic and sufficient. This can be read as another indicator of the fact that municipalities’ disaster management understanding still focuses on post-disaster response activities rather than pre-disaster mitigation and preparedness activities, and they see the preparedness process as the responsibility of AFAD, not theirs.
5.4.5
Disaster Response Plan: “That Plan Will Come from AFAD and We Will Be Involved in It”
In the event of a disaster, the first responders are the ones closest to us. The help from the central government may take quite a time due to the lack of sufficiently reliable information, breakdown in the infrastructure, heavy traffic problems, etc. Besides family members and neighbors, municipalities are among the local actors who can make the first response in case of a disaster. In order to play this role of first responders, municipalities are supposed to have done some special preparations suitable to the conditions and needs of their local communities. Thus it was necessary for us to ask if they had any special preparation other than what provincial directorate of AFAD had to offer. As one might guess, all of the municipal administrators stated that they did not have any special preparations and that they would fulfill the duties and services to be given to them in line with the “Turkish Intervention Disaster Plan” coordinated by AFAD: We are included in AFAD’s system, because in line with the demands given to us by AFAD under the coordination of AFAD. . . . Meetings are held once a month and we participate in them. We do whatever we are asked to do. They ask us to buy body bags, we buy them. They ask us to buy hard hats, we do so. We are asked to send food here and there, so we do. In other words, these are all things under the coordination of the Governor’s Office. We provide the necessary supplies. (Interview #1)
The purpose of the Turkish Disaster Intervention Plan (TAMP) is to define the roles and responsibilities of the service groups and coordination units that will take part in disaster and emergency intervention activities, and to determine the basic principles of intervention planning before, during, and after disasters. Here, other institutions, including municipalities, become a part of this intervention within their own share of tasks (AFAD 2013). A municipal administrator describes their role in this process as follows: In this regard, there are authorities and responsibilities that our ministries assign us all within the framework of AFAD. Of course, this is renewed every year on paper. We meet once a year. After the meeting, how to do a special study on this, workshops are held for them, everyone shares their duties in the assembly areas, and the duties of the municipalities were communicated to those friends two years ago. It hasn’t been done for the last three years, but we all know what we’re going to do. (Interview #8)
Another municipality administrator, when asked about the disaster intervention plan, summarized his roles as “that plan will come from AFAD and we will be included in
104
F. Çakı and A. Uzun
it.” Therefore, municipalities seem to agree that disaster mitigation, preparedness, and response activities are carried out with coordinated cooperation between state institutions.
5.4.6
Disasters and Inter-Institutional Cooperation: “We Mobilize Very Well When Necessary”
It is of vital importance that all stakeholders work and cooperate in harmony in all stages of disaster management (Sutton and Tierney 2006: 9). For a good quality of preparedness, institutional channels of communication and cooperation must be established between public bodies and the community (Bello et al. 2021; ECLAC 2019). Although some cooperation and mutual work is emphasized, many municipal administrators do not think that these works are of sufficient quantity and quality. A district mayor explains his opinion on this issue as follows: Of course, district municipalities work actively with the district governorship; we do many works through the district governorship, including natural disasters. There is no interinstitutional disconnect in Balıkesir. There is a harmonious work between institutions. But, of course, it is not possible to say that all works are being done, sir. Now, as you know, as the Turkish nation, as you just mentioned, we take our precautions when we experience a natural disaster. We experience disasters, after a while we forget. After forgetting, we continue on our way as if it will never happen. Of course, institutions do not forget about them, institutions take their precautions and do their work. But it is not possible to say that we, as institutions, are doing enough work. And we need to make our work more visible so that the nation can see it more. (Interview #9)
By using a funeral metaphor, another municipality administrator emphasizes that the planning and coordination between institutions is not very functional. According to him, even though there is chaos on the surface, things are being settled somehow, including disaster response: I just came from a funeral. While we are still burying the body, we do not know who will do what. Put it here, put it there, it’s happening somehow, as long as there’s no clutter, we’ll sort it out somehow. So no matter how much you plan ahead, like the mess at the funeral, it happens eventually. (Interview #1)
One of the issues identified as a common point of view among municipal administrators is that municipal administrators highly trust on the selfless attitudes and behaviors of the Turkish/Balıkesir people for extraordinary situations including natural disasters. Accordingly, even though municipalities do not have any preparations at the moment, they are confident that everyone will do their part during a disaster. We, as Balıkesir, are very good in that regard. So it’s like this: we have a highly educated proportion of population, it’s really high. Our people are conscious and respectful to each other. For that reason, I think Balıkesir is more advantageous than any other province in Turkey. In other words, God forbid, if it were a total problem like a disaster, we would give
5
Perceptions and Practices of Disaster Governance in Countries with. . .
105
each other the same help as the city that started the Kuvva-i Milliye movement.3 So we mobilize very well when necessary. (Interview #3)
It is understood that municipalities assign a passive role to themselves in all pre-disaster and post-disaster mitigation, preparedness, and response processes. In other words, municipalities have a tendency to reduce their role in these processes to providing materials, tools, personnel, and services that will be requested from them under the coordination and instructions of AFAD, instead of carrying out mitigation and preparedness activities by researching/taking into account the special situations and needs of their local communities. It is also clear that municipal administrators find the quality and quantity of cooperation among stakeholder institutions not sufficient and satisfying. Despite this fact, what makes them feel confident is their trust on the strength of social solidarity among the Turkish/Balıkesir people for extraordinary situations including natural disasters. A high sense of social solidarity is obviously a big advantage. But is it appropriate for institutions to lean on such an advantage? No doubt, the lifetime of such an advantage may not be permanent. On the other hand, the central role of AFAD may be subject to different views as seen in the opinions of the municipal administrators differ. While some have internalized this situation, others may look at it more critically as shown below.
5.4.7
The Central Role of AFAD: “We Learned This on August 17th”
Those who internalize the passive role of municipalities in disaster management processes in line with AFAD’s coordination and instructions, see the August 17, 1999, Earthquake experience as the legitimating basis of their thoughts. According to them, the difficulties experienced as a society in this experience necessitated the implementation of disaster management under the coordination of an organization such as AFAD. The following quote explains this way of thinking: As the Fire Brigade Department, we have duties related to extinguishing services, rescue services and logistics services. Apart from this, machinery stocks, personnel groups and working groups of units such as Water Affairs, Highways and Forestry Affairs are formed in each institution. Everyone in their working groups is integrated into the AFAD system, and when there is an incident or a disaster, they already establish a communication center in terms of logistics. AFAD calls the relevant units here itself. In other words, it does not call and use such an unnecessary crowd or intervention and situation when there is no need. The general system in Turkey is this; we learned it on August 17th. At that time, fire brigades, civil defense directorates, private organizations, private companies, associations became such a mess that they could not use us properly. After that, there was a planning in this structuring, because it is also necessary to manage it besides explaining the disaster risk.
3
Kuvva-i Milliye movement is the starter of the country’s independence from occupying powers. It is accepted that the movement first started in Balikesir by the mobilization of the Balıkesir inhabitants.
106
F. Çakı and A. Uzun
Now, let me give you an example: the last time there was an earthquake in Ayvacık, our closest one, we did not go anywhere, we did not move. Why? Because AFAD Regional Directorate asked us only to set up tents and stoves in terms of logistics. We were included in that system and went that day and did what was necessary. Being there all the time is also a problem, because you have to provide logistics for the staff you send. The system working through this AFAD is much healthier. (Interview #4)
A municipality administrator, who is critical of the AFAD-based conduct of disaster management, especially in terms of preparedness activities, evaluates the issue in the context of “appointed officials and elected ones”: This work is being done not with the elected, but with the appointed officials. In other words, the governor is in charge of this business. But the governors are appointed and work only for a few years in a particular district; then they go somewhere else. Thus, sustainability is lacking. It is the same for deputy governors. It is necessary to carry out this work with resident actors. (Interview #2)
As it can be seen, some municipal administrators are satisfied with the fact that disaster management is based on AFAD (governorship), while others think that it would be more appropriate to be municipality-centered instead. A third, more synthetic approach is that it would be appropriate for AFAD to remain at the center, but municipalities should also take a more active role in the current situation. A municipal administrator describes this position as follows: Municipalities are really important places where the citizens can reach very easily and who can deal with the problems of the citizens. But the places where citizens can reach very easily are deformed in some matters very easily. I am of the opinion that AFAD, now working under the Governor’s Office, fully complies with the rules. There may be some problems caused by the constant replacement of AFAD employees, but when it comes to municipalities, AFAD may become obsolete in some respects. In my opinion, the center should be under the Governor’s Office, but municipalities should take a more active role in this regard. Unfortunately, municipalities in Turkey are being stretched a little as well as being overburdened in many issues. (Interview #8)
These interview data clearly indicate that municipal administrators do not agree on who should be the key actor in matters of disaster management. While some find the centralized organization quite appropriate, others think that municipalities have to be at the heart of disaster management. This disagreement can be interpreted as a sign for why municipalities hold themselves back from taking more active roles in disaster mitigation and preparedness processes. In a sense they follow the following logic: If I am not in a position of decision-making, then I would do only what I am asked to do, nothing more.
5.4.8
Cooperation with Civil Society: “Let Me Be Clear, NGOs Are Not Very Active”
Article 41 of the Municipal Law No. 5393 says that the Municipal Strategic Plan “is prepared by taking the opinions of universities and professional chambers, if any,
5
Perceptions and Practices of Disaster Governance in Countries with. . .
107
and relevant non-governmental organizations, and enters into force after it is approved by the municipal council.” This shows that local governments should act in cooperation with NGOs/voluntary organizations as well as with other public institutions and organizations. As one of the actors that municipalities are expected to cooperate with, NGOs have entered a development process in Turkey since the 1980s, in parallel with the development in the world, and have emerged as an important actor of social change. NGOs represent the “organizational field” that operates in a wide range from voluntary organizations working in different fields from think tanks, social movements, citizenship initiatives, non-governmental organizations to trade unions, and professional chambers. It is accepted that NGOs can have an important function in preventing the loss of life and property damages that may be caused by disasters (Messer 2003: 43). In this direction, we asked the municipal administrators what was their status of working and contacting with NGOs regarding disasters. Thus, we aimed to understand the way municipalities view cooperation with NGOs. All municipalities stated that they have some contacts and work with NGOs: Of course, we cooperate with NGOs on various issues, and protocols are signed. (Interview #5) There are NGOs that we cooperate with, but there is no NGO that we cooperate with on natural disasters. Of course, the Red Crescent is a very important unit of Turkey, an important organization. It is indeed a huge gain for Turkey. . . . Now, these NGOs can make a difference according to the type of natural disaster. The Red Crescent is a unit that works actively on this issue after natural disasters. But from the point of view of earthquakes, the chamber of geological engineers, the chamber of civil engineers and the professional chambers should also work actively on this issue. (Interview #7)
However, some municipal administrators emphasize that NGOs in Balıkesir are not very active: There are not many NGOs in Balıkesir. There are about 4-5 associations on this subject; search and rescue association or other issues. We generally work with them in terms of trainings. After all, they generally have to be integrated into AFAD’s system, because when such a situation occurs, everyone cannot actually be found in the incident area as they know it. Now, you are guided through the AFAD system according to the control of the region where it is needed, but let me be clear here, non-governmental organizations are not very active. (Interview #1)
It is also possible to observe that municipalities differ from each other in terms of the level of cooperation with NGOs in disaster preparedness processes. Some seem to be friendlier, while others are more distant. For example, one of the municipal administrators stated that disaster awareness-raising activities should generally be carried out by NGOs as follows: Disaster awareness raising is a work that non-governmental organizations have to carry out. This issue is on the agenda of our city council. It is currently being worked on to conduct studies on this type of training. Let’s see how it will take shape in the coming days. ... It is an issue that should be included in all non-political, non-governmental organizations. Along with the duties assigned by them, our municipality will also take its responsibilities in this regard. (Interview #4)
108
F. Çakı and A. Uzun
On the other hand, a municipality administrator who is distant to cooperating with NGOs in the disaster preparedness process argues that these processes should not be multi-headed: Question: Are there any NGOs you cooperate with in disaster preparedness processes? - Just have one, that’s enough. These things should not be multi-headed anyway. We have AFAD, we have The Red Crescent, that’s enough. (Interview #1)
Our quantitative research findings too revealed that households also do not trust NGOs much in terms of getting accurate information and help. The above quotes show that at least some municipal administrators have a distrust and skepticism towards NGOs. This fact too requires some explanation. Why distrust and skepticism are common among both households and municipality administrators? We will come back to this question in the conclusions section.
5.5
Discussion and Conclusions
Before discussing the findings, it is useful to summarize them first. • Many of the municipal administrators preferred to ignore the question of whether risk analysis is carried out in their provinces/districts. A few of them directly admitted that they did not have such a work. Municipal administrators argue that it is almost impossible with their current budgets to carry out routine responsibilities, let alone risk analysis studies. Therefore, municipal administrators explain their inability to take any preventive measures, such as the improvement of streams against the risk of flooding, with the claim that the municipal budget does not allow for such initiatives. • Almost no municipality has up-to-date databases and an intervention action plans for the vulnerable/disadvantaged social groups within their provincial/district borders. Instead, municipal administrators draw attention to the fact that what institutions will do in the event of a possible disaster has already been planned. • All municipal administrators state that data is provided by AFAD on the types and numbers of materials that will be needed in case of a possible disaster, and municipalities provide assistance from within their own structure upon the request of AFAD. • Municipalities do not seem to have any serious and tangible activities to create disaster awareness raising in their local communities. Almost all of the municipal administrators mentioned the trainings conducted by the Fire Brigade in the context of awareness-raising activities. It has been stated that information and awareness-raising activities for disasters are carried out only in schools, and there is no comprehensive activity for the society. Therefore, the main target group of disaster awareness-raising activities in the local community is limited to youth (students). While some municipal administrators admit that there is no awarenessraising effort for the local community, they also feel the need to complain about the indifference of the community.
5
Perceptions and Practices of Disaster Governance in Countries with. . .
109
• All of the municipal administrators stated that they did not have any special preparations and that they would fulfill the duties and services to be given to them in line with the “Turkish Disaster Intervention Plan” under the coordination of AFAD. • In case of natural disasters, municipal administrators highly rely on the selfless attitudes and behaviors of the Turkish/Balıkesir people for extraordinary situations. Thus trust in the strength of social solidarity seems to lead to a weaker level of disaster preparedness and risk reduction activities. • In general, municipalities assume a passive role in all mitigation, preparedness, and response processes before and after disasters. In other words, municipalities tend to limit their role in these processes to providing materials, tools, personnel, and services that will be requested from them under the coordination and instructions of AFAD, instead of carrying out mitigation and preparedness activities themselves by investigating/taking into account the special situations and needs of their local communities. • All municipalities state that they have some contacts and works with NGOs, but they think that NGOs in Balıkesir are not very active. While some are more willing to cooperate with NGOs, some are more distant. It can be concluded that Balıkesir municipalities have a shallow and ambiguous understanding of disaster and have focused their disaster management completely on post-disaster response. There are no serious and concrete activities and efforts of Balıkesir municipalities in terms of disaster mitigation and preparedness. They see disaster management as the duty and responsibility of AFAD within the body of the Governorate, and they consider their own role in this process to be only about meeting the instructions and demands from AFAD. In this respect, Balıkesir municipalities do not seem to be focused on any mitigation and preparedness effort that can meet the expectations and needs of the local communities although they are the institution that local communities trust the most. Those findings are clear indications of a centralized disaster management, not disaster governance. Then it is necessary to ask why municipalities hold themselves back from taking more active roles in terms of disaster mitigation and preparedness in spite of the facts that they have more human and material resources compared to other institutions, that local communities have high expectations from them, and that scientists warn about a much stronger earthquake disaster than the 1999 Marmara Earthquake experience. Of course there is no simple answer to this complicated question. We can first look at the political position of municipalities. Municipalities are political actors seeking public attention and approval. The fact that elected municipal governments feel obliged to turn to high-visibility services in order to rewin the vote of people limits their roles and services in the context of disaster management. Investment in disaster mitigation and preparedness (such as risk analysis actions, generating up-to-date databases and intervention action plans for the vulnerable social groups, carrying out serious and tangible disaster awareness raising activities) usually is not as visible as constructing buildings, renovating sidewalks, holding
110
F. Çakı and A. Uzun
public concerts, opening big parks, etc. Municipalities want to use their budget for visible actions so that voters can see and appreciate them. Thus, it is usually a matter of priorities rather than budget problems. In order for the process to be reversed, the consciousness and preferences of the urban voters must change; and the municipal administrators must be forced to take real and serious actions instead of ostensible ones in urban areas. Apart from political position of municipal governments, the centralized character of disaster management through AFAD in Turkey might be considered to be the most important factor leading to this result. There is a large literature emphasizing the long history of central government in Turkey. For example, by considering Turkey as representing a centralist/statist model, Özerdem and Jacoby argue that in natural disaster management, the political elites “imposed fully institutionalized and extremely strict restrictions on the third sector,” that “there is a general fear in the state about the politicization of humanitarian aid,” and that “the weakness of civil society is caused by the pressure of the state” (Özerdem and Jacoby 2006: 99–107; see also Jalali 2002). Therefore, the state is seen as the main responsible actor for the failure of disaster governance to develop in Turkey. This trend is quite common. According to this trend, “centralized and unsuccessful disaster management practices” arising from the relationship between “strong and ruthless state tradition” and “weak civil society” create security gaps against disasters (Aydıner and Özgür 2014: 400). Such analyses point out that one of the most important problems in disaster governance processes in Turkey is distrust between relevant actors. Accordingly, on the one hand, the society has lost trust in the state, and on the other hand, the state has an insecure attitude towards some segments of the society, as well as non-governmental organizations. This mutual distrust limits the development possibilities of disaster governance. As a matter of fact, trust-based relationships are seen as critical for effective emergency response, including disasters (Janssen et al. 2010; Kapucu and Garayev 2011; Longstaff and Yang 2008). The lack of trust or skepticism on civil society may or may not have legitimate roots depending on the history and social structures of a given society. Sandoval and Voss (2016) draw attention to the fact that each society should be based on its own socio-cultural and historical conditions in disaster governance. Because, according to them, “there is no ‘one size fits all’ approach to disaster governance. Instead, there is a need to historicize and contextualize governance practices to reduce the occurrence of disasters or, if they are unavoidable, at least reduce their effects” (Sandoval and Voss 2016: 114). In parallel with these views, it is often argued that good governance regarding disasters depends on the local context, cultural, and historical conditions (Kieger 2013; Dahiya 2012). In our view, the centralized character of disaster management and the narrow roles of municipalities in this regard are closely related to perceptions of civil society. Whether the state is willing to build a “strong civil society” can be determined by many factors. The state’s historically peaceful relationship with its own social structure may make it willing to pave the way for civil society. An opposite type of relationship may lead the state to an oppressive and restrictive
5
Perceptions and Practices of Disaster Governance in Countries with. . .
111
attitude on civil society. On the other hand, especially in developing countries such as Turkey, the facts that some NGOs are supported by Western states and organizations and that such NGOs work in harmony with their interests (Özerdem and Jacoby 2006: 19) may lead some states to skeptical, selective, distrustful, and/or inhibiting attitudes towards NGOs in their countries. NGOs, about which such perceptions are formed, may be exposed to an insecure and distant relationship not only by the state, but also by the potential buyers of their services—local communities. This is exactly what happens in Turkey. As of today, both the state and the society prefer to display a selective and cautious attitude towards NGOs. Instead of evaluating this situation as “fear of civil society,” it would be more accurate to think that security concerns reorganize the state-civil society relations in Turkey, as it has been effective all over the world, especially since 11/2001. It is a fact that some terrorist organizations such as PKK and FETO establish many NGOs to work for their goals in disguised forms. This fact generates a general skepticism on NGOs. On the other hand NGOs in Turkey easily become politicized and turn into tools of intervention in the political system rather than serving the society. In addition, NGOs in Turkey like many other developing countries have structural problems such as transparency, abuse, and corruption. Considering all those features of and perceptions on NGOs, Turkey has chosen a centralized way of disaster management instead of governance. As a central institution, AFAD takes the leading role in this process. Under structural authority of AFAD, municipalities, as well as other institutions are enforced to play a secondary role while NGOs are usually given a decorative role. In sum, this research has tried to show that local governments are insufficient to draw the necessary lessons from their past experiences of serious disasters (e.g., the 1999 Marmara Earthquake), and that the ongoing structural conditions and security concerns in developing countries such as Turkey limit the desirability and applicability of decentralized approaches in terms of disaster risk management in general and preparedness in particular. Of course this research is a case study; its findings and conclusions are limited to Balıkesir provinces/districts. Therefore, it is not fair to claim that they can be generalized for the whole country. Undoubtedly, there is a need for more research with new designs both in Balıkesir and in Turkey as well as other developing countries. Acknowledgment The authors thank TÜBİTAK for supporting the project numbered 116 K208, which is the data source of this chapter.
References AFAD (2013). Türkiye Afet Müdahale Planı (TAMP). https://www.afad.gov.tr/upload/Node/2419/ files/Afet_Mud_Pl_ResmiG_20122013.pdf. Accessed 13 September 2017 Ainuddin S, Aldrich DP, Routray JK, Ainuddin S, Achkazai A (2013) The need for local involvement: decentralization of disaster management institutions in Baluchistan, Pakistan. Int J Disaster Risk Reduc 6:50–58. https://doi.org/10.1016/j.ijdrr.2013.04.001
112
F. Çakı and A. Uzun
Altun F (2018) Afetlerin Ekonomik ve Sosyal Etkileri: Türkiye Örneği Üzerinden Bir Değerlendirme. Turk J Soc Work 2(1):1–15 Aydıner T, Özgür H (2014) Yönetişim ve Doğal Afetler: Türkiye’de Doğal Afet Yönetişimi Ne Kadar ve Hangi Biçimde Mümkün? In: Genç FN (ed) Kamu Yönetiminde Değişim Kayfor XII Bildiriler Kitabı. ISBN: 978-975-8254-538 Barton AH (2005) Disaster and collective stress. In: Perry RW, Quarantelli EL (eds) What is a disaster? New answers to old questions. Springer, New York Becker JS, Paton D, Johnston DM, Ronan KR (2013) Salient beliefs about earthquake hazards and household preparedness. Risk Anal 33(9):1710–1727 Bello O, Bustamante A, Pizarro P (2021) Planning for disaster risk reduction within the framework of the 2030 agenda for sustainable development. Project documents (LC/TS.2020/108), Santiago, Economic Commission for Latin America and the Caribbean (ECLAC) Çakı F, Uzun A, Özkan A (2019) Doğal Afetlere Hazırbulunuşlukta Yerel Topluluk Liderliğinin Sınırları: Muhtarlar Üzerine Bir İnceleme. Papers of idRc2019, International Resilience and Disasters Congress: From Risk to Resilience. June 26–28, 2019, Eskişehir Technical University. ISBN 978-605-031-286-7 Cannon T (1994) Vulnerability analysis and the explanation of ‘natural disasters’. In: Valley A (ed) Disasters, development and environment. Wiley, Chichester Cheng Y, Luo Y (2020) The presumed influence of digital misinformation: examining US public’s support for governmental restrictions versus corrective action in the COVID-19 pandemic. Online information review. 2 December 2020. https://www.emerald.com/insight/content/ doi/10.1108/OIR-08-2020-0386/full/html. Accessed 13 April 2022 CRED (Centre for Research on the Epidemiology of Disasters) (2020) EM-DAT International Disaster Database [online]. https://www.emdat.be/. Accessed 13 April 2021 Cugat G, Narita F (2020) How COVID-19 will increase inequality in emerging markets and developing economies. IMFBlog. 29 October 2020. https://blogs.imf.org/2020/10/29/howcovid-19-will-increaseinequality-in-emerging-markets-and-developingeconomies/#:~:text= The%20crisis%20now%20puts%20much,gap%20between%20rich%20and%20poor.&text= COVID%2D19%20is%20expected%20to,on%20vulnerable%20workers%20and%20women. Accessed 14 April 2022 Dahiya B (2012) Cities in Asia, 2012: demographics, economics, poverty, environment and governance. Cities 29:S44–S61. https://doi.org/10.1016/j.cities.2012.06.013 ECLAC (Economic Commission for Latin America and the Caribbean) (2019) Planning for sustainable territorial development in Latin America and the Caribbean (LC/CRP.17/3), Santiago Ergünay O (2009) Doğal Afetler ve Sürdürülebilir Kalkınma, Deprem Sempozyumu, 11–12 November 2009. Abant İzzet Baysal Üniversitesi, Bolu Erkal T, Değerliyurt M (2009) Türkiye'de Afet Yönetimi (Disaster management of Turkey). Doğu Coğrafya Dergisi 14(22):147–164 Escaleras M, Register CA (2012) Fiscal decentralization and natural Hazard risks. Public Choice 151(1):165–183. https://doi.org/10.1007/s11127-010-9740-4 Espina E (2015) A social cognitive approach to disaster preparedness. Philipp J Psychol 48(2): 161–174 Garschagen M (2015) Decentralizing urban disaster risk management in a centralized system? Agendas, actors and contentions in Vietnam. Habitat Int 52:43. https://doi.org/10.1016/j. habitatint.2015.08.030 German Technical Cooperation (GTZ) (2002) Disasters: a challenge for developing countries and development cooperation: disaster risk management working concept: the German Technical Cooperation. http://www2.gtz.de/dokumente/bib/02-5001.pdf. Accessed 20 June 2016 Hutchinson A (2020) Twitter adds new labels on potentially harmful COVID-19 misinformation in tweets. Social Media Today. 11 May 2020. https://www.socialmediatoday.com/news/twitteradds-new-labels-on-potentially-harmful-covid-19-misinformation-in-t/577714/. Accessed 13 April 2022
5
Perceptions and Practices of Disaster Governance in Countries with. . .
113
Ile I (2009) Managing intergovernmental relations: a case review of intergovernmental relations systems in Nigeria and South Africa. VDM Verlag Dr. Muller Aktiengesellschaft & Co. KG, Saarbrucken ILO (International Labour Organization) (2020) Youth and COVID-19: impacts on jobs, education, rights and mental well-being. Survey Report 2020. 11 August 2020. https://www.ilo.org/global/ topics/youth-employment/publications/WCMS_753026/lang%2D%2Den/index.htm. Accessed11 April 2022 Jalali R (2002) Civil society and the state: Turkey after the earthquake. Disasters 26(2):120–139 Janssen M, Lee J, Bahrosa N, Cresswell A (2010) Advances in multi-agency disaster management: key elements in disaster research. Inf Syst Front 12:1–7 Kapucu N, Garayev V (2011) Collaborative decision-making in emergency and disaster management. Int J Public Adm 34(6):366–375 Kieger K (2013) The limits and variety of risk-based governance: the case of flood management in Germany and England. Regul Gov 7(2):236–257 Kirschenbaum A (2004) Generic sources of disaster communities: a social network approach. Int J Sociol Soc Policy 24(10/11):94–129 Kümbetoğlu B (2005) Sosyolojide ve Antropolojide Niteliksel Yöntem ve Araştırma. Bağlam, İstanbul Longstaff PH, Yang S (2008) Communication management and trust: their role in building resilience to “surprises” such as natural disasters, pandemic flu, and terrorism. Ecol Soc 13(1):3 Meshack MV (2004) Potential and limitations of stakeholders’ participation in community-based projects: the case of Hanna Nassif roads and drains construction and maintenance, vol 26. University College of Lands and Architectural Studies, Dar es Salaam, p 61 Messer NM (2003) The role of local institutions and their interaction in disaster risk mitigation: a literature review. Food and Agriculture Organisation, Rome Mphaisha CJJ (2006) Local government capacity for poverty alleviation. Unpublished paper presented at VLIR conference. UWC, Cape Town Niekerk D (2005) A comprehensive framework for multi-sphere disaster risk reduction in South Africa. School of Government Studies, University of the North-West University, Potchefstroom Norris FH, Smith T, Kaniasty K (1999) Revisiting the experience-behavior hypothesis: the effects of hurricane Hugo on Hazard preparedness and other self-protective acts. Basic Appl Soc Psychol 21:37–47 Özerdem A, Jacoby T (2006) Disaster management and civil society earthquake relief in Japan, Turkey and India. I.B. Tauris, New York Patterson O, Weil F, Patel K (2009) The role of community in disaster response: conceptual models. Popul Res Pol Rev 29:127–141 Perry RW, Lindell MK (2003) Preparedness for emergency response: guidelines for the emergency planning process. Disasters 27(4):336–350 Perry RW, Lindell MK (2006) Emergency planning. Wiley, New York Pillay P (2001) South Africa in the 21st century: key social economic challenges. Friedrich Ebert Stiftung, Johannesburg Pollitt C (2005) Decentralization. A central concept in contemporary public management. In: Ferlie E, Lynn LE Jr, Pollitt C (eds) The Oxford handbook of public management. Oxford University Press, New York, NY, pp 371–397 Rumbach A (2016) Decentralization and small cities: towards more effective urban disaster governance? Habitat Int 52:35–42. https://doi.org/10.1016/j.habitatint.2015.08.026 Sagala S, Okada N, Paton D (2009) Predictors of intention to prepare for volcanic risks in Mt Merapi, Indonesia. J Pac Rim Psychol 3(2):47–54 Sahoo N (2005) Decentralising disaster management. Observer Research Foundation. South Asia Politics 4(7):1–9
114
F. Çakı and A. Uzun
Sandelowski M (2004) Qualitative research. In: Lewis-Beck M, Bryman A, Liao TF (eds) The Sage Encyclopedia of social science research methods. Sage, Thousand Oaks, CA, pp 893–894 Sandoval V, Voss M (2016) Disaster governance and vulnerability: the case of Chile. Politics Gov 4(4):107–116. https://doi.org/10.17645/pag.v4i4.743 Scott Z, Tarazona M (2011) Global assessment report on disaster risk reduction: study on disaster risk reduction, decentralization and political economy. UNDP, New York Sorensen JH, Rogers GO (1988) Local preparedness for chemical accidents: a survey of U.S. communities. Ind Crisis Q 2:89–108 Sutton J, Tierney K (2006) Disaster preparedness: concepts, guidance, and research. Natural Hazards Center Institute of Behavioral Science University of Colorado, Boulder, CO. http:// www.colorado.edu/hazards. Accessed 22 April 2018 Tekeli-Yeşil S, Dedeoğlu N, Tanner M, Braun-Fahrlaender C, Obrist B (2010) Individual preparedness and mitigation actions for a predicted earthquake in Istanbul. Disasters 34(4):910–930 Titko M, Ristvej J (2020) Assessing importance of disaster preparedness factors for sustainable disaster risk management: the case of the Slovak Republic. Sustainability 12:9121. https://doi. org/10.3390/su12219121 Toya H, Skidmore M (2013) Natural disaster impacts and fiscal decentralization. https://core.ac.uk/ download/pdf/6350227.pdf. Accessed 22 April 2018 UNDP (United Nations Development Program) (2004) Reducing disaster risk: a challenge for development: a global report. http://www.planat.ch/fileadmin/PLANAT/planat_pdf/alle/R02 85e.pdf. Accessed 20 June 2019 UNDP (United Nations Development Program) (2015) Strengthening disaster risk governance. https://www.undp.org/content/dam/undp/library/crisis%20prevention/disaster/Strengthening% 20Disaster%20Risk%20Governance-Full-Report.pdf. Accessed 22 April 2018 UNDRR (United Nations Office for Disaster Risk Reduction) (2019) Global assessment report on disaster risk reduction. UNDRR, Geneva Uzun A (2020) Türkiye’de ve Balıkesir’de Doğal Afetler. In: Çakı F (ed) Doğal Afetler ve Yerel Topluluklar. Nobel Yay, Ankara WHO/EHA (2002) Disasters & emergencies definitions training package. WHO/EHA Pan African Emergency Training Centre, Addis Ababa Updated March 2002 by EHA World Economic Forum (2020) Challenges and opportunities in the post-COVID-19 world. May 2020. http://www3.weforum.org/docs/WEF_Challenges_and_Opportunities_Post_COVID_19. pdf. Accessed 10 April 2022 World Economic Forum (2021) The Global Risks Report 2021, 16th edn. ISBN: 978-2-94063124-7
Chapter 6
Reducing the Risk from Asbestos in the Built Environment During Natural Hazard Events Charles Kelly and David Hodgkin
Abstract Asbestos, in its natural state in the ground, poses a minimal risk to humans. This chapter discusses the nature of the risk which develops when Asbestos is mined, processed, and used and then subject to damage from hazards such as earthquakes, cyclones, floods, or tsunamis. The chapter explores how the presence of Asbestos-containing products, principally used for construction, and damage to the built environment by these hazards can significantly increase the threat from Asbestos to human health, with a high level of delay in negative health outcomes following even slight exposure. The chapter discusses current practice to address the Asbestosdisaster risk in relief and recovery, noting that these efforts may face challenges with funding and sustainability beyond the initial disaster response. The chapter outlines a process to address the Asbestos-disaster risk in preparedness and risk reduction, with an emphasis on raising awareness as to the nature of, and measures to address, this risk. The chapter concludes with a set of criteria for identifying where Asbestosdisaster risk reduction efforts should be targeted and calls for further work to reduce the risk from Asbestos as a result earthquakes, cyclones, floods, or tsunamis. Keywords Risk · Asbestos · Natural hazards · Disasters · Built environment
6.1
Introduction
Asbestos is a term used to describe a group of six naturally occurring minerals. These minerals form long crystalline fibers that have high tensile strength; conduct electricity and heat poorly; do not expand when wet; are fire, heat, and corrosion resistant; are generally cheap to extract and process; and combine easily with other
C. Kelly (✉) Independent Scholar, Seattle, WA, USA D. Hodgkin Shelter and Settlements, Miyamoto International, Yogyakarta, Indonesia e-mail: [email protected] © The Author(s), under exclusive license to Springer Nature Switzerland AG 2023 S. D’Amico, F. De Pascale (eds.), Geohazards and Disaster Risk Reduction, Advances in Natural and Technological Hazards Research 51, https://doi.org/10.1007/978-3-031-24541-1_6
115
116
C. Kelly and D. Hodgkin
construction materials. As a result, in many ways Asbestos can be seen as an ideal building material. It is because of this that it has had a centuries-long use in manufacturing, construction, and other sectors (Selikoff and Lee 1978). At the same time, however, the WHO International Agency for Research on Cancer has concluded that all forms of Asbestos are carcinogenic, directly causing mesothelioma and cancer of the lung, larynx, and ovary, and linked to cancer of the pharynx, stomach, and colorectum (World Health Organization 2012). This has led to global efforts to ban its use.1 The World Health Assembly requested WHO to carry out a global campaign for the elimination of all Asbestos-related diseases (World Health Organisation 2018). Of particular concern is the latency of Asbestos health impacts, which can manifest decades after even limited exposure (Frank and Joshi 2014). From a disaster risk management perspective, materials including Asbestos provide a peculiar challenge. When not disturbed, that is not broken up or otherwise removed from the containment in which it is used, Asbestos poses minimal immediate threat. However, when disturbed, for instance, being broken up when buildings are damaged during an earthquake or when flood-damaged buildings are deconstructed, fine Asbestos fibers can be released into the environment and pose a significant risk from inhalation, ingestion, or physical contact. Where the funds and means are available, this risk can be minimized through containment, removal, and disposal programs. These programs are based on appropriate training, the use of personal protection equipment, constructing containment structures around areas where Asbestos is being removed, and continuous dampening prior to eventual safe burial to reduce the risk of airborne Asbestos dust (Shelter Centre and ProAct Network 2015). Unfortunately, these approaches are complex, expensive, difficult, and often impractical to implement, in every country after a disaster, due to the sheer scale of contamination, lack of resources, and focus on immediate lifesaving measures. The result is that search and rescue efforts, clearing debris, and removing damaged or destroyed buildings and Asbestos-containing equipment may expose assistance providers and the disaster-affected populations to a high level of exposure to Asbestos in the environment which may then continue for decades until, if ever, adequate cleanup measures are undertaken. The aftermath of a series of earthquakes in late 2018 in and around Lombok, Indonesia, is a case in point. The earthquakes led to damage to, or destruction of, over 300,000 houses. According to the Indonesian Bureau of Statistics, more than 29% of houses in the most heavily affected district of Northern Lombok used Asbestos-cement roofing (Indonesian Bureau of Statistics 2018), which was left broken into small pieces and littered across the entire affected area. This problem
1
See International 20 October 2021
Ban
Asbestos
Secretariat,
http://www.ibasecretariat.org/.
Accessed
6
Reducing the Risk from Asbestos in the Built Environment During. . .
117
was then significantly exacerbated by the extensive use of heavy equipment to crush and level building debris to clear the way for reconstruction. This demolition work led to the circulation of Asbestos in the air during building clearance. It also created a longer-term presence on the ground of small broken pieces of Asbestos cement left from the clearing work (Hodgkin 2020). As a result, those affected by the disaster experienced an additional risk from Asbestos at the time of the disaster and then again during deconstruction and debris removal and now face a continuing longer-term risk from the Asbestos contamination in their surrounding environment. Dealing with the risk posed by Asbestos post-disaster rests on two approaches: (1) reducing the presence of Asbestos before a disaster and (2) managing Asbestos in a safe manner after a disaster. While programs reducing the presence of Asbestos (often referred to as remediation) are common in a number of countries, the discussion in this chapter focuses specifically using the presence of earthquake, cyclone, flood, or tsunami hazards as a way to prioritize awareness of the risk posed by Asbestos and in planning risk reduction efforts.
6.2
Types of Asbestos
The name “Asbestos” is a commercial and legal term encompassing six unique minerals from two distinct silicate mineral groups, serpentine and amphibole. The two groups are easily differentiated by their fibrous structures as serpentine (chrysotile) is curly stranded whereas amphiboles are straight and rod like (Kamp and Weitzman 1999). The serpentine mineral group includes only one form of Asbestos, chrysotile (white Asbestos), with three almost indistinguishable polytypes. Chrysotile Asbestos comprised more than 90% of global Asbestos production since 1990 (LaDou et al. 2010). The amphibole mineral group includes further five distinct mineral forms of Asbestos: • • • •
Amosite (brown Asbestos), mostly mined in Africa Crocidolite (blue Asbestos), mostly mined in Australia Tremolite (sometimes known as green Asbestos) mostly mined in India Actinolite and anthophyllite, rarely mined commercially
All amphibole Asbestos are now rarely mined specifically on a commercial scale but still may occur as contaminants in products such as talcum powder and vermiculite. It is important to note that much commercial claim has been made about the safety of chrysotile (white Asbestos). While amphibole-type Asbestos are generally considered more hazardous, and more commonly banned, scientific reviews by the WHO International Agency for Research on Cancer have concluded that “Cacogenic risks [from Asbestos] apply to [all] these six types of fibres wherever they are found” and “All forms of Asbestos pose grave dangers to human health. All are proven
118
C. Kelly and D. Hodgkin
Table 6.1 Major Asbestosproducing countries—2020
Country Brazil China Kazakhstan Russia Zimbabwe Total
Production (metric tons) 71,200 120,000 227,000 720,000 8000 1,100,000
human carcinogens. There is no continued justification for the use of Asbestos. Its production and use should be banned worldwide” (World Health Organization 2012).
6.3
Sources of Asbestos
Selikoff and Lee (1978) provide a historical summary of the minerals covered under the general name of Asbestos. Their work notes the use of Asbestos in what is now Finland 2500 years ago, mentions of Asbestos by Greek historians before Christ, and use during the Roman Empire. Selikoff and Lee (1978) indicate that large-scale mining and use of Asbestos in manufacturing did not increase significantly until the latter part of the nineteenth century. Major mining areas emerged in Australia, Brazil, Canada, China, Cyprus, Greece, Kazakhstan (for a while the Soviet Union), Italy, Russia (for a while, the Soviet Union), Rhodesia (later Zimbabwe), and South Africa (Selikoff and Lee 1978, and Virta 2006).2 Extraction and use of Asbestos increased during and after the Second World War. Global production of Asbestos peaked in 1977, at 4.8 million metric tons, dropping to 2.2 million metric tons in 2003 (Virta 2006). While Canada led the world in Asbestos production for decades, by 2020, as indicated in Table 6.1, production was largely limited to five countries and had dropped to approximately 1.1 million metric tons (USGS 2021).
6.4
Uses of Asbestos
Asbestos has many uses, from chemical filters to vehicle brake pads, numerous insulation applications, through to reinforcement for a wide range of products used in construction. The Minnesota Department of Health lists 19 categories and 2
Small levels of production occurred in other countries, but the information available suggests the cited countries have been the most significant producers over time, even as some, e.g., Australia, Canada, have stopped production at present.
6
Reducing the Risk from Asbestos in the Built Environment During. . .
119
69 specific uses of Asbestos (Department of Health n.d.). The Asbestos Awareness web site’s Asbestos A–Z Database lists 60 specific uses of Asbestos and provides details of the items identified (Asbestos Awareness n.d.). Ingham states that Asbestos-cement products consume “70% of world Asbestos production. The range of products includes reinforcing for; wall and roof sheet (corrugated and flat), roof tiles, . . . sewerage pipe, and pressure pipe,” reinforcing for glues and tanking compounds used in a range of applications such as fastening PVC flooring, waterproofing roofs, and water tanks (Ingham 2013:126). Virta (2006) states that “The low cost of Asbestos-cement products, their durability and effectiveness, and the relatively unsophisticated technology required to produce Asbestos-cement products were major factors leading to the widespread use of Asbestos cement, particularly for developing countries with limited mineral and monetary resources” (Virta 2006:15). In addition, though to a lesser extent, Asbestos is used in construction for a wide range of insulation applications such as in pipe lagging, hot or cold water storage, ovens and heaters, as well as loose fluff wall and ceiling insulation. Though the volumes of Asbestos used in these applications are significantly lower, the risk posed can be significantly higher from loose friable Asbestos applications. The primary interest of this paper is in Asbestos-containing materials which are used in construction, particularly in low-cost, simple housing construction, including: • • • • • •
Asbestos-cement roofing sheets Asbestos-composite wallboard Asbestos-containing water and sewage pipes Sprayed Asbestos-containing fire protection Ceiling and floor tiles Asbestos-based pipe insulation and fire-retardant textiles use with, for instance, heating boilers • Loose fluff insulation
The first two, roofing and wallboard, have a significant durability advantage over metal roofing or wood walls in tropical climates due to the low likelihood of rotting and low long-term maintenance costs. Table 6.2 lists the major primary users (96% of Table 6.1 production) of Asbestos fibers in 2020 (USGS 2021). The full range of Asbestos use at the county level is difficult to identify or quantify, as noted by Virta (Virta 2006:15). Although, as stated earlier, more than a vast majority of Asbestos use is in reinforced cement building products, the countries in Table 6.2 also likely use Asbestos in items such as brake shoes, Asbestos fabric, and other historical uses, for domestic consumption and, in some cases, for export. In India, 90% of Asbestos used is reported to be manufactured into Asbestoscement sheets (Peopels Training and Research Centre 2017:32). Kazan-Allen (2020) reports that 90% of imports of Asbestos into Indonesia were used for construction materials. On the order of 80% of Asbestos imported to Sri Lanka is used for roofing sheets (Colombo Gazette 2016). Similar data for other major users was not available,
120
C. Kelly and D. Hodgkin
Table 6.2 Major Asbestos use countries
Country India China Russia Uzbekistan Indonesia Sri Lanka Vietnam Thailand Bangladesh Kazakhstan Total
Use, 2020 (metric tons) 310,000 243,000 126,000 117,000 86,200 48,200 36,400 35,000 28,900 25,700 1,056,000
but, as noted above, a significant part of the Asbestos used is likely to be incorporated into Asbestos-cement products (Ingham 2013). While Asbestos-cement construction materials have advantages in tropical environments, not all tropical countries have used Asbestos widely. For instance, a survey in Fiji did not observe Asbestos-containing products present in 3600 houses assessed. In the Republic of the Marshall Islands, a survey of over 4600 houses found only 1 with Asbestos-containing materials (PacWaste n.d.). In sum, Asbestos has been used for centuries, but most industrial uses have been in the last 150 years. Production has dropped significantly since 1977. Currently there are five major producing and ten major using countries. While Asbestos has been used as a component in many materials, Asbestos mixed with cement, and particularly for roofing and wall panels, has been a significant part of all Asbestosbased use.
6.5
Asbestos as a Hazard
While in the ground, Asbestos does not pose a significant hazard. The mineral becomes an active hazard when fibers become active in the environment, far more so when airborne. Asbestos fibers becoming airborne may happen during mining, transport, processing, or the manufacturing of products which contain Asbestos fibers. Asbestos fibers can also become active in the environment, during construction and maintenance or as a result of damage to Asbestos-containing products such as Asbestos-cement roofing and wall sheets. The threat posed by Asbestos can also arise from Asbestos released from clothing which has been contaminated during direct exposure to Asbestos from any of the activities noted above (Frank and Joshi 2014). As a result, the Asbestos hazard exists not only where Asbestos initially becomes airborne but also in locations where persons initially exposed to Asbestos fibers may travel, e.g., from a factory using Asbestos to living quarters.
6
Reducing the Risk from Asbestos in the Built Environment During. . .
121
Health risks associated with Asbestos exposure generally include reduced lung function and consequent physical disability, with other negative outcomes including skin abnormalities, specific types of cancers, and issues with the gastrointestinal and pro-pharyngeal body systems (Frank and Joshi 2014:259). A particular challenge with Asbestos as a hazard is that most associated health impacts involve decadeslong delay between exposure and the presentation of significant symptoms. Also of concern is that many of the health risks associated with Asbestos, such as mesothelioma, are fatal with no known cure (Frank and Joshi 2014). This delay means that exposure may occur long before the person exposed is aware of the impact of the hazard and long after mitigation measures should have been taken. The delayed onset of symptoms poses an additional significant challenge in the humanitarian context, where the rush to address urgent and immediate lifesaving measures may override less apparent long-term risks such as that posed by Asbestos. This may be true both for the affected community and for those coming to assist. Significantly, there has been no minimal safe level of exposure established below which negative health outcomes do not occur. Exposure to a single fiber can be sufficient to cause Asbestos-related diseases such as mesothelioma (Frank and Joshi 2014:260). As a result, when dealing with Asbestos abatement or processing Asbestos-contaminated disaster debris, no level of airborne Asbestos fibers is considered acceptable. Meeting this standard requires a level of control over the handling of Asbestos-containing products and protection of workers and downwind populations which are as rigorous as would be used to deal with highly toxic chemicals. Meeting this standard in the immediacy and sheer scale encountered in humanitarian crisis poses an even more significant challenge. The chronic nature of Asbestos health outcomes, and the delay with which these outcomes can occur, can be particularly challenging in societies without strong social safety nets, worker safety systems, and extensive healthcare services capable of long-term care for those with chronic diseases. The delayed onset of Asbestosrelated illnesses poses a challenge in risk communication and the uptake of risk reduction measures. This is especially true where the persons are already coping with the impacts of a large-scale crisis and are at risk from other, more immediate potential threats, for instance, food insecurity or living in a flood or landslide zone. Remediation, that is, the safe removal and disposal of Asbestos, has been initiated in a number of countries. However, the cost of remediation is not insignificant.3 The procedures involved, including personal protective equipment and sealing areas where Asbestos is removed, safe transport systems, and appropriate disposal sites are complicated, require significant training and enforcement, and are therefore often procedurally demanding. The risks posed by Asbestos have now been recognized in a significant number of countries, leading to a complete ban in at least 67 countries, with a range of
3 Cost estimates of $12.86/ft2 (.09m2) to $24.97/ft2 (.09 m2) are reported for the United States in test cases of total demolition (2009 USD) (Wilmoth et al. 2009).
122
C. Kelly and D. Hodgkin
Table 6.3 Major Asbestos-using countries and earthquake, cyclone, flood, and tsunami hazards Order of use in 2020 (USGS 2021) 1 2 3 4 5 6 7 8 9 10
Country India China Russia Uzbekistan Indonesia Sri Lanka Vietnam Thailand Bangladesh Kazakhstan
Hazard present Earthquake Cyclone X X X X X X X X X X X X X X
Flood X X X X X X X X X X
Tsunami X X X X X X X X
restrictions in many others (Frank and Joshi 2014:261). The International Ban Asbestos Secretariat4 leads efforts to, as the name suggests, ban Asbestos. At the same time, while the production and use of Asbestos was, in 2020, on the order of 23% of peak levels, over 1 million tons were still being processed into products, primarily Asbestos-cement products, based on Ingham (2013). In addition, while the global use of Asbestos may be reducing, this is not true for all countries, and, in most countries, little has or is being done to reduce the accumulated volume of Asbestos in the built environment, much of it incapsulated in aging buildings. As a result, the scope of the Asbestos hazard and the number of people who could be exposed to Asbestos post-disaster continue to increase. The presence of hazards which damage the built environment, particularly earthquakes, cyclones (typhoons, hurricanes), floods, and tsunamis, increases the risk of releasing Asbestos. As indicated in Table 6.3, each of the top ten Asbestos-using countries is subject to two or more of these hazards. Table 6.3 does not include countries which have had significant use of Asbestos, but no longer produce Asbestos-based materials used in construction. As a result, while Table 6.3 indicates countries where Asbestos-related risks are increasing due to more use of Asbestos, a significant number of countries also face a significant risk from past Asbestos use. An additional consideration is that countries which use Asbestos may face challenges in enforcing building codes, use of codes which do not adequately consider the impacts of storms or earthquakes, or both. As a result, there is an increased risk of the release of Asbestos at events which have lower intensity than if more hazard-appropriate codes existed or were enforced. Clearly, not all parts of the countries in Table 6.3 or former Asbestos-using countries, are subject to earthquakes, cyclones, flooding, or tsunami or that Asbestos products are present in the zones where these hazards exist. Risk mapping, looking at (1) the presence and scale of use of Asbestos, (2) earthquakes, cyclones, flooding, or 4
http://www.ibasecretariat.org/. Accessed 20 October 2021
6
Reducing the Risk from Asbestos in the Built Environment During. . .
123
tsunami impact zones, (3) likely damage from possible hazard events, and (4) the levels of social and economic vulnerability, is essential to identifying where work to reduce Asbestos-related risk is needed and the priority of this work. A partial example of this type of effort has taken place in the South Pacific. The State of Asbestos in the Pacific (PacWaste n.d.) provides an assessment of Asbestos presence in residential and non-residential locations in the Cook Islands, Fiji, Federated States of Micronesia, Kiribati, Nauru, Niue, Palau, Republic of Marshal Islands, Samoa, Solomon Islands, Tonga, Tuvalu, and Vanuatu. While, in theory, more detailed mapping of the presence of Asbestos in hazard zones could be done for each country, this would likely only be needed for larger countries such as the Solomon Islands or Vanuatu where information about Asbestos use in specific locations across the country may be necessary to compare local risks. The data in the report allows for a ranking of countries in terms of risk and the identification of several as having a relatively low Asbestos presence and thus low risks. In fact, data from PacWaste was used following the Cyclone Gita in Tonga to identify Asbestos as a significant issue in disaster debris management (WWF US 2018). In summary, Asbestos is a significant health risk when humans are exposed, through mining, processing, and handling Asbestos-based products. This risk involves both very low thresholds of exposure and a considerable delay before damage to health is evident (Frank and Joshi 2014). (Apart from the release of Asbestos in extreme events, research is also needed in releases through normal degradation of Asbestos-containing products.) Asbestos production has decreased significantly from a peak in 1977. Yet, as of 2020, ten countries were using over 1 million metric tons of Asbestos per year. Despite long-term reductions in the production of Asbestos, continued mining and manufacturing of Asbestos-based products and the historical high level of use of Asbestos created a significant and compounding threat from this mineral. Earthquakes, cyclones, floods, and tsunamis which damage buildings and other infrastructure can be expected to lead to a release of Asbestos fibers if Asbestos has been used in construction, even decades ago. With the exception of the South Pacific, only limited information is available on the presence of Asbestos-based materials in earthquakes, cyclones, flood, and tsunami hazard zones. Each of the ten countries listed in Table 6.3 as currently using Asbestos has two or more of these hazards present, leading to a significant threat from Asbestos fiber releases when these hazard events occur.
124
6.6 6.6.1
C. Kelly and D. Hodgkin
Reducing the Asbestos Threat from Earthquakes, Cyclones, Floods, and Tsunamis Elements of Disaster Risk Management
The conceptual process of reducing disaster risk is based on four core components (adapted from Office for Outer Space Affairs n.d., and Royal Institution of Chartered Surveyors 2009): • Risk reduction, often based on an assessment of risk and bridging between disaster response and development interventions, where development interventions should, implicitly, reduce risks and response includes risk reduction. • Preparedness, including early warning, focused on planning for the best possible response to a disaster once it occurs and (in some circumstances) including actions to reduce the need for response (implicitly reducing risks). • Response, ranging from actions to avoid damage immediately before a disaster (e.g., evacuation) to lifesaving actions and what may be called life-sustaining actions (e.g., providing food, shelter, water, etc.) during and after a disaster where disaster survivors do not have access to these basic needs. • Recovery, a process which begins during the response and continues for years to re-establish normal society. Recovery should include risk reduction, to build back in a way that reduces the potential for disasters in the future.
6.6.2
Preparedness and Risk Reduction
This section combines preparedness and risk reduction for two reasons: 1. Reducing risks and preparing to manage Asbestos after a disaster are unlikely if the at-risk populations are not aware of the risk posed. In practice, it is the same awareness raising about Asbestos which is necessary for preparedness and risk reduction work, so these efforts should be combined. 2. The assessment of the scale and scope of possible Asbestos risk, when combined with earthquake, cyclone, flood, and tsunami hazards, is needed for both preparedness (identifying where specific Asbestos-and-other-hazard overlaps exist) and risk reduction (identifying where to prioritize risk reduction). In this sense, combining risk reduction and preparedness reduces the workload in each area. The first step in disaster-related Asbestos risk reduction and preparedness is a risk assessment covering the 1. Risks (hazard recurrence and scope of vulnerability/damage) from natural hazards that may cause building damage, such as earthquakes, volcanic eruption,
6
Reducing the Risk from Asbestos in the Built Environment During. . .
125
cyclones, tornados, floods, landslides, liquefaction, tropical storms and strong winds, and tsunamis 2. Presence and type of Asbestos-containing products and how they can be released in the case of one of the natural hazards covered in the assessment. A lower level of assessed disaster-related risk does not automatically mean that the overall Asbestos risk itself is low. This assessment only refers to the release of Asbestos following a disaster which damages the built environment. The type of Asbestos, the manner of use, the level of human contact, age of the material, and other factors may create a high level of risk from Asbestos independent of other hazards. In conflict-prone areas, an additional risk assessment and preparedness/response strategy may be required to assess the potential hazard caused by damage to buildings containing Asbestos. At the time of writing this chapter, the conflict in Ukraine presents significant risk of exposure to Asbestos (Ukraine Environmental Study Group 2022). Countries are currently being encouraged to develop disaster risk assessments,5 although the scale of these assessments can vary from very local to very broad in detail. Taking a page from the PacWaste effort (PacWaste n.d.), an initial step can be to do a census of the type and location of Asbestos products. As stated previously, the vast majority of Asbestos is used for reinforcing in construction materials; therefore, much of this data may be readily available from construction census and/or building approval data (as was found in Indonesia during the Lombok response). This information can then be overlain with risk information for natural hazards. Additional overlays such as poverty and house, land, and property rights may then provide further guidance as to quality of construction and therefore vulnerability of buildings to hazards. Results of the disaster-Asbestos risk assessment have a number of uses. First, once identified, this risk can be easily incorporated into national and provincial preparedness and contingency planning processes. Second, as noted above, the assessment results can then be used to develop specific Asbestos preparedness plans, including preparing teams and capacities to manage Asbestos-associated disaster debris. Third, assessment results can be used to develop prioritized risk reduction plans to reduce the presence of Asbestos-containing materials starting with the locations of highest risk. This effort may be similar to normal Asbestos remediation efforts but expand into (1) raising awareness at all levels as to the risk posed by Asbestos, particularly in the case of earthquakes, tsunami, and similar events, (2) improving access to alternative materials with which to replace Asbestos-containing materials, (3) providing financial support for a replacement process, and (4) training and providing long-term support to teams which would do the replacement work and assure safe disposal of any Asbestos-containing materials collected. 5
See Words into Action guidelines: National disaster risk assessment https://www.undrr.org/ publication/words-action-guidelines-national-disaster-risk-assessment, Accessed 15 November 2021.
126
C. Kelly and D. Hodgkin
An example of this type of effort comes from Indonesia. The Indonesian Shelter Coordination Support Team (ISCST) was able to get Asbestos banned in the Central Sulawesi Province, and Indonesian Ban Asbestos Network6 managed to get its use banned in West Java Province. The Indonesian Shelter Coordination Support Team also produced guidelines on Asbestos for Aid Agencies, to protect their staff and those they are assisting. These guidelines have been adopted by the Indonesian Humanitarian Country Team (HCT) as minimum guidelines for all HCT members and by the Ministry of Social Affairs for all organizations working under the auspices of the National Protection and Displacement Cluster. In addition, the ISCST produced videos, posters, and flyers ready for rapid deployment in future disasters to explain the risk. The complexity of developing risk reduction plans should not be underestimated, particularly where Asbestos use remains legal with more than the content of this chapter needed to address all the relevant challenges. This said, work to replace Asbestos-containing materials can be combined with other risk reduction measures such as structural reinforcement, strengthening roof structures, and raising and relocating buildings, usually part of earthquake, cyclone, flood, and tsunami risk reduction measures. Finally, but certainly not least, the risk assessments can support efforts to engage in a significant level of awareness raising, and what could be called marketing and sales, to convince at-risk populations that reducing or banning the use of Asbestos and changing to other materials is a good idea and that improving encapsulation can be done safely and is important for the safety of their family. Removal and replacement is also a good idea, particularly if undertaking renovations. But it is essential that trained professionals utilize the correct safety procedures and safety equipment. Such an effort would be needed for: • Preparedness, to ensure those at risk can safely manage Asbestos-containing materials after a disaster • Risk reduction, to assure understanding of the risk posed by Asbestos and creating a willingness to reduce the Asbestos-disaster risk despite inconveniences involved A final challenge in reducing the risk of the presence of Asbestos-containing materials in earthquake, cyclone, flood, and tsunami hazard zones is prioritizing where these efforts should begin. Two negative, two positive, and two scaling criteria are proposed for use in this targeting process: • Negative – Where Asbestos use continues and any of the above identified potential hazards (e.g., earthquakes) are likely
6
http://inaban.org/
6
Reducing the Risk from Asbestos in the Built Environment During. . .
127
– Where Asbestos has been used on a significant scale and any of the above potential hazards (e.g., earthquakes) are likely – Where building quality and building code enforcement are low • Positive – Where Asbestos remediation measures are already underway and likely to continue – Where earthquake, cyclone, flood, and tsunami risk reduction measures are underway and which would reduce the presence of Asbestos in the normal course of effort • Scaling – The level of damage to the built environment from earthquakes, cyclones, floods, or tsunamis over the next 30 years, based on the expectation (a) that Asbestos-based building materials will remain largely in a functional state (i.e., not replaced) for this period and (b) that disasters during this period will cause significant damage to Asbestos-containing materials – The number of persons at risk from one or more of the four hazards (earthquake, cyclone, flood, and tsunami) where Asbestos-containing materials have been used, with the greater at-risk population, the greater need of risk reduction Resources available in developing the chapter did not allow for a global level assessment of where Asbestos preparedness and risk reduction should be targeted based on these criteria. However, based on the State of Asbestos in the Pacific report (PacWaste n.d.), Asbestos-disaster risk preparedness and risk reduction would be needed for only a few of the South Pacific. In contrast, the ongoing use of Asbestos in the countries in Table 6.3 suggests they could be a focus of risk reduction efforts. What is unknown from the available research is the level of Asbestos-disaster risk in countries where Asbestos has been, but is not longer, used. Identifying these countries and assessing levels of risk related to earthquakes, cyclones, floods, and tsunamis are a critical next step in reducing the risk posed by Asbestos during earthquakes, cyclones, floods, or tsunamis.
6.6.3
Asbestos-Aware Response and Recovery
Awareness of Asbestos as a significant post-disaster issue has increased in the international humanitarian assistance community in recent years. The response to Asbestos as part of relief and recovery after Cyclone Idai and other disasters was discussed at the Asbestos and Humanitarian Response—A Life-Threatening Humanitarian Challenge session during the 2020 Humanitarian Networks and Partnerships Week (UNEP/OCHA Joint Environment Unit 2020).
128
C. Kelly and D. Hodgkin
Experiences in managing Asbestos in countries which have banned or restricted the use of Asbestos and have undertaken Asbestos removal programs have been transformed into guidance for use in humanitarian assistance operations. A sample of this guidance, from UNEP/OCHA Joint Environment Unit (2020), includes: • Asbestos Essentials: Equipment and Method sheets (Health and Safety Executive UK 2017) • Review of Asbestos Management Practices in Disaster Planning (Government of Australia 2017) • Disaster Waste Management Guidelines (UNEP/OCHA Joint Environment Unit 2011) • A Brief Guide to Asbestos in Emergencies: Safer Handling & Breaking the Cycle Shelter Centre and the ProAct Network (2015) With the fast pace of relief and recover operations, this type of guidance needs to be incorporated into pre-disaster planning and training and the localization of operational capacities. In addition, experts are available after disasters through the UN system to assess Asbestos risks and develop management plans. Frustratingly, engaging such consultants to support post-disaster management of Asbestos can be long and cumbersome. As a result, building capacities in disaster-prone areas to properly manage Asbestos before a disaster is a critical requirement to address the problem postdisaster. Although guidance and technical support on safely managing Asbestos after a disaster is available, the actual management of Asbestos in the humanitarian response confronts several challenges. First is the cost and availability of international standard PPE for teams dealing with Asbestos, estimated at $7 to $15 per day per person (UNEP/OCHA Joint Environment Unit 2020). In addition, there are costs associated with the packaging and transport and (in some cases) paying for placing Asbestos-containing materials in a disposal site. Overall, the cost of addressing Asbestos after a disaster can be significant when compared to the funding which might be available. This is often because humanitarian operations usually receive significantly less than identified funding requirements. As an example, funding for UN-managed humanitarian operations from 2011 and 2020 ranged from 52% to 65% of funding requested. On average, between 2016 and 2018, 10% of appeals received 25% or less funding, with more funded above 25% in 2019, with one third of appeal receiving less than 25% funding in 2020 (Development Initiatives 2021). In addition, funds for humanitarian response are commonly constrained to actions that address urgent lifesaving needs. The delayed onset of Asbestos-related illnesses makes it difficult for humanitarian donors to prioritize this issue over more apparent and immediate needs such as food, water, and shelter. On the other hand, the much larger pool of development funds often stipulate that they are not to be used for humanitarian response and require much longer lead times to access. This funding gap between the Humanitarian Purse and the Development Wallet is a continual challenge in funding risk reduction and the transition from short-term life-saving relief to the more complex and expensive recovery.
6
Reducing the Risk from Asbestos in the Built Environment During. . .
129
Inadequate funding leads to difficult decisions as to what available funds should be spent on. The relative high cost and further-in-the-future impact of managing Asbestos mean it is likely not prioritized in the face of more immediate lifethreatening requirements. Even if funding were to be available, many humanitarian agencies do not have dedicated capacities to deal with the complexities of managing Asbestos. As well, the threat posed to agency staff from Asbestos and cost associated with reducing this threat further exacerbate funding issues. While humanitarian assistance programs may form and train teams to manage the Asbestos hazard after a disaster, the sustainability of these teams is often an issue. This is particularly the case where: • No Asbestos remediation programs exist in the country, creating a gap in the long-term institutional basis for the work of the teams, particularly in countries where Asbestos has been deemed to be safe and continues to be legal for sale with no safe disposal requirements that may otherwise support or maintain the investment in training up mediation teams • Asbestos management is not clearly integrated under one of the Clusters7 or similar structures used to guide and coordinate humanitarian assistance. Although often of significant concern to Clusters such as Shelter and Health, coordination of Asbestos mitigation and cleanup activities often lands at the feet of the Early Recovery Cluster which is generally implemented through a series of sub-topical coordination working groups, focused on issues to which multiple agencies are responding and therefore require enhanced coordination, such as rubble clearance, waste management, building inspections, etc. Without multiple agencies focusing on Asbestos, there is often little pressure to form a working group dedicated to the issue. • Cleanup and disposal efforts often also encounter significant regulatory hurdles such as mismatched or unclear laws on safe removal, mediation, transport, and disposal, on which to base their work. • Programs may also face a lack of approved PPE, authorized transport vehicles, or officially designated and/or appropriate Asbestos disposal sites. There may be limited or no awareness on the part of the disaster affected or those managing relief and recovery of the risk posed by Asbestos. In fact, unless both survivors and assistance providers are aware of the Asbestos risk, it will be hard to implement successful risk reduction efforts. This problem can be further exacerbated by past or active (mis)information campaigns by pro-Asbestos lobby groups, directly countering the public education and awareness campaigns from humanitarian actors. A lack of awareness amongst humanitarian responders is often further exacerbated by the high turnover in the humanitarian sector, a boom-and-bust industry with relatively few positions in most agencies funded beyond the immediate response.
A “Cluster” is a part of the humanitarian assistance coordination system, with each Cluster focusing on a specific sector or post-disaster intervention, e.g., shelter, health, or education.
7
130
C. Kelly and D. Hodgkin
This means that many new staff lack awareness of Asbestos as a continuing and growing issue of concern across the sector. Unsurprisingly, local staff newly engaged in countries where Asbestoscontaining products are still legal for sale often have little or no awareness or understanding that such products pose a significant threat. New staff brought in as surge capacity from the Global North may be from countries where Asbestos was banned as long ago as the early 1980s. As a result, they may have little knowledge or experience of Asbestos risk in their lifetime and may not imagine that the reinforced cement products around them would or could contain Asbestos. And, as in the Lombok case, efforts at speeding recovery by bulldozing damaged buildings containing Asbestos can greatly increase the scale of contamination in areas where survivors were living (Hodgkin 2020). Such actions which do not consider the Asbestos risk not only significantly worsen this risk and contribute to greater potential negative outcomes over the long term; they also significantly increase the challenge for effective cleanup and mitigation. Finally, awareness building and operational plans need to strongly encourage a rebuilding process which does not use Asbestos-based products. This includes three significant challenges: (1) tackling the tendency for households to reuse broken and damaged sheeting that they still see as a valuable resource, in emergency, temporary, or permanent reconstruction; (2) convincing both government and non-government humanitarian actors to ban the use of new Asbestos materials in all their emergency and transitional relief programs; and (3) tackling the desire to use new Asbestoscontaining products in permanent reconstruction programs. The last two of these steps can face significant challenges in countries where Asbestos-containing products are still legal for sale and where Asbestos suppliers view the reconstruction efforts as a major business opportunity. Marketing campaigns on the benefits of Asbestos-reinforced building products after disasters highlight the low cost, high strength, light weight, heat and rain resistance, ease of construction, and relative safety (in the moment of a disaster) of reinforced cement products. As demonstrated in the Lombok case, pressure to move forward in recovery and quickly remove debris and damaged buildings may lead to an unintended, and significant, increase in the risk from Asbestos. In most cases, this risk will be borne by those who have just experienced a disaster, and/or are responding to it, and thus add to the long-term impact of this disaster.
6.7
Conclusions
This chapter has provided an overview of the risks posed by Asbestos-containing materials (particularly construction materials) when they are subject to damage or destruction following earthquakes, cyclones, floods, or tsunamis. As Asbestos production and use continue, these risks are increasing. There also is a significant risk from Asbestos in countries which had used but no longer use Asbestos for
6
Reducing the Risk from Asbestos in the Built Environment During. . .
131
construction as Asbestos-containing materials can be expected to not degrade quickly under natural conditions. The chapter identifies how the Asbestos-disaster risk can be managed in the disaster relief and recovery phases, but also highlights that these efforts may require long-term commitments that are not easy to sustain in some countries. The chapter closes with a description of how a reduction of the risk posed by Asbestos after a disaster can be addressed through preparedness and risk reduction, including the important requirement to raise awareness of at-risk populations as to the need to reduce the long-term threat from Asbestos-containing materials. Going forward in addressing the Asbestos-disaster risk requires (1) risk assessments overlapping earthquake, cyclone, flood, or tsunami hazards and Asbestosbased product use, (2) raising awareness of the threat posed by Asbestos, and (3) prioritizing where to intervene based on six criteria defining the size of the population at risk and whether efforts are underway to reduce the risk from Asbestos release during disasters. Enough is known about the risk from Asbestos alone and the combined Asbestosdisaster risk. Action is needed to reduce this risk using the approaches and processes set out in this chapter.
References Asbestos Awareness (n.d.) Renovating? Go slow. Asbestos is a no go. https://Asbestosawareness. com.au/asbestos-products-database/product-list/. Accessed 18 Oct 2021 Colombo Gazette (2016) Production of asbestos to be banned in Sri Lanka from 2024. https:// colombogazette.com/2016/09/07/production-of-asbestos-to-be-banned-in-sri-lanka-from-2024/ . Accessed 19 Oct 2021 Department of Health (n.d.) Common asbestos-containing products. State of Minnesota. https:// www.health.state.mn.us/communities/environment/Asbestos/products.html. Accessed 18 Oct 2021 Development Initiatives (2021) Chapter 2 in global humanitarian assistance report 2021. https:// devinit.org/resources/global-humanitarian-assistance-report-2021/chapter-two-humanitarianand-wider-crisis-financing/. Accessed 14 Oct 2021 Frank A, Joshi T (2014) The global spread of Asbestos. Ann Glob Health 80(4):257 Government of Australia (2017) Review of asbestos management practices in disaster planning. https://www.Asbestossafety.gov.au/sites/asea/files/documents/2018-01/ASEA_Reports_Asbes tos_and_disaster_planning_Jan18.pdf. Accessed 16 Oct 2021 Health and Safety Executive UK (2017) Asbestos essentials: equipment and method sheets. https:// www.hse.gov.uk/Asbestos/essentials/index.htm. Accessed 16 Oct 2021 Hodgkin D (2020) Personal conversation Indonesian Bureau of Statistics (2018) Ingham J (2013) Chapter 6 - Concrete products. In: Ingham J (ed) Geomaterials under the microscope. Academic Press, Amsterdam, pp 121–127. https://doi.org/10.1016/B978-0-12407230-5.50014-5. Accessed 19 Oct 2021 Kamp DW, Weitzman SA (1999) Occasional review: the molecular basis of Asbestos induced lung injury. Thorax 54(2):638–652 Kazan-Allen L (2020) Asbestos profile. International Ban Asbestos Secretariat, Indonesia. http:// ibasecretariat.org/search_item.php?l0=8+56+934 &l1=9+29+368&l2=10+22+468&l3=11+1
132
C. Kelly and D. Hodgkin
6+139&l4=12+298+674&l5=14+389+1055&l6=15+817+1215&l7=16+32+405&f=prof_ indonesia.php. Accessed 19 Oct 2021 LaDou J, Castleman B, Frank A, Gochfeld M, Greenberg M, Huff J, Joshi T, Landrigan P, Lemen R, Myers J, Soffritti M, Soskolne C, Takahashi K, Teitelbaum D, Terracini B, Watterson A (2010) The case for a global ban on Asbestos. Environ Health Perspect 118(7):897 Office for Outer Space Affairs (n.d.) Risks and disasters. UN-SPIDER knowledge portal. https:// www.un-spider.org/risks-and-disasters. Accessed 13 June 2022 PacWaste (n.d.) The state of asbestos in the pacific, secretariat of the pacific regional environment program. https://www.sprep.org/attachments/pacwaste/The_State_of_Asbestos_in_the_Pacific. pdf. Accessed 18 Oct 2021 Peopels Training and Research Centre (2017) India: national asbestos profile. http://ibasecretariat. org/india-final-nap-25-4-17.pdf. Accessed 19 Oct 2021. Occupational and environmental health network India Royal Institution of Chartered Surveyors (2009) The built environment professions in disaster risk reduction and response, a guide humanitarian agencies. Max Lock Centre, University of Westminster, London Selikoff I, Lee D (1978) Asbestos and disease. Academic Press, New York. https://wwwsciencedirect-com.proxyau.wrlc.org/science/article/pii/B9780126360509500064?via%3Dihub. Accessed 20 Oct 2021 Shelter Centre and ProAct Network (2015) A brief guide to asbestos in emergencies: safer handling & breaking the cycle. https://gisf.ngo/wp-content/uploads/2016/04/2074-Shelter-Centre-andPro-Act-Network-A-Brief-Guide-to-Asbestos-in-Emergencies-Safer-Handling-and-Breakingthe-Cycle.pdf. Accessed 16 Oct 2021 Ukraine Environmental Study Group (2022) Ukraine, environment and humanitarian assistance session 10 May 2022, Humanitarian Networks and Partnerships Weeks UNEP/OCHA Joint Environment Unit (2011) Disaster waste management guidelines. https://www. unocha.org/publication/disaster-waste-management-guidelines. Accessed 16 Oct 2021 UNEP/OCHA Joint Environment Unit (2020) Asbestos and humanitarian response – a lifethreatening humanitarian challenge, session summary, humanitarian networks and partnerships week, asbestos and humanitarian response – a life-threatening humanitarian challenge (Co-Authored by the Environment Community of Practice, Global Shelter Cluster). https:// eecentre.org/resources/Asbestos-and-humanitarian-response-a-life-threatening-humanitarianchallenge/. Accessed 16 Oct 2021 USGS (2021) Advance data release of the 2020 annual tables. https://prd-wret.s3.us-west-2. amazonaws.com/assets/palladium/production/atoms/files/myb1-2020-asbes-adv.xlsx. Accessed 18 Oct 2021 Virta R (2006) Worldwide asbestos supply and consumption trends from 1900 through 2003. Circular 1298. U.S. Geological Survey. https://pubs.usgs.gov/circ/2006/1298/c1298.pdf. Accessed 18 October 2021 Wilmoth R, Drees L, Kominsky K, Shaul G, Cox D, Eppler D, Barrett W, Hall F, Wagner J (2009) Comparison of the alternative Asbestos control method and the NESHAP method for demolition of Asbestos-containing buildings. US Environmental Protection Agency, Washington, DC World Health Organization (2012) Asbestos (Chrysotile, amosite, crocidolite, tremolite, actinolite and anthophyllite). International Agency for Research on Cancer (IARC) Working Group on the Evaluation of Carcinogenic Risks to Humans. Arsenic, Metals, Fibres and Dusts. Lyon (FR): International Agency for Research on Cancer. IARC Monographs on the Evaluation of Carcinogenic Risks to Humans, No. 100C World Health Organization (2018) World health association resolution 60, 26 World Wildlife Fund/US (2018) Debris management considerations cyclone Gita – Tonga, 21 February 2018. https://envirodm.org/cms/wp-content/uploads/2018/02/GRC_Request_ Tonga-Debris_Feb-2018_Final.pdf. Accessed 10 Nov 2021
Part II
Climate Change Perspectives
Chapter 7
Communicating Weather Risk in the Twenty-First Century: Approaches Using Video Games and Virtual Reality Jase Bernhardt
Abstract Despite great advances in forecast accuracy and warning lead time in recent years, effective communication of risk from weather hazards to impacted individuals remains a challenge. One way to evaluate and improve public scientific literacy is to leverage engaging technologies such as virtual reality (VR). A VR simulation of a tropical cyclone (TC) landfall was developed for use in two separate studies to evaluate whether it could help convince individuals to evacuate in a hypothetical TC. The first study, conducted on a college campus with mainly younger participants, revealed that the VR simulation did in fact encourage individuals to take the TC more seriously. A follow-up survey, however, found that for a sample of mainly older participants, many of whom were directly impacted by TC Sandy, the VR discouraged evacuation in the hypothetical landfall scenario. The results of those two studies indicate that while VR may be useful in aiding TC hazard communication, more research is needed to better understand how best to leverage the technology, especially when considering different demographic groups. Keywords Scientific communication · Weather risk · Video games · Virtual reality · Immersive technology
7.1
Introduction
Weather forecasters face dual challenges when serving the public. Predicting future weather conditions has always been recognized as a scientific problem, given uncertain initial conditions and an incomplete understanding of the atmosphere’s governing equations. However, in recent years, increasing attention has been paid to how effectively weather forecasts are conveyed to the public. Despite clear gains in
J. Bernhardt (✉) Department of Geology, Environment and Sustainability, Hofstra University, Hempstead, NY, USA e-mail: [email protected] © The Author(s), under exclusive license to Springer Nature Switzerland AG 2023 S. D’Amico, F. De Pascale (eds.), Geohazards and Disaster Risk Reduction, Advances in Natural and Technological Hazards Research 51, https://doi.org/10.1007/978-3-031-24541-1_7
135
136
J. Bernhardt
the accuracy of hazardous weather forecasts (e.g., National Hurricane Center 2021a), it is more difficult to ascertain whether public understanding has made commensurate gains. Yet, in seeking to reduce risk from weather-related geohazards, the efficacy of a weather forecast is limited by its reception from the public. For example, even a perfect forecast for a hazardous weather event such as a tropical cyclone can be seen as ineffective if recipients do not properly act on it to reduce personal vulnerability. Further compounding the disconnect between a weather forecast and its interpretation are the innumerable personal factors which control personal decision-making. Age, previous experience with hazardous weather, political identity, and primary language spoken are just a few of the many characteristics that cause individuals to act upon hazardous weather alerts in starkly contrasting ways (e.g., Schumann et al. 2018; Ngo et al. 2020). While there is no single method for gaining a full understanding of this multifaceted issue, simulations offer one promising approach. Simulations allow a researcher to place study participants in a controlled but realistic environment, resulting in authentic responses to the hazardous weather faced and an objective way to measure the efficacy of the hypothetical weather forecasts and alerts provided. In the following case study, I discuss how this approach was leveraged to gain insight into behavioral responses to a key weather hazard occasionally impacting the Northeastern United States, tropical cyclones (TCs). TCs are among the costliest and deadliest geohazards globally (World Meteorological Organization 2021). They typically form in lower latitude regions of global oceans, particularly in the Northern Hemisphere, and frequently impact adjacent land areas. TCs are a multifaceted hazard, bringing serious threats from water, wind, and even tornadoes. TC forecasts have experienced marked improvements over time, especially their tracks. Moreover, given the slow forward motion of TCs, on average 10 to 15 knots when in and near the tropics (Atlantic Oceanographic and Meteorological Laboratory 2021), there is often sufficient advance notice of an impending storm. Yet convincing impacted individuals to evacuate from the path of a TC remains fraught with difficulty, owing to the complexity of such a decision. A variety of deeply personal factors can influence willingness to leave. Further compounding these issues for a place like New York is the infrequency with which TCs strike, and even when one does strike, it can be dismissed as a single, anomalous event. Such is the case for Long Island, New York, an area that experienced severe impacts from TC Sandy in 2012, but otherwise has not been directly impacted by a TC at hurricane strength since 1985 and a storm at “major hurricane” strength (sustained winds of at least 96 knots) since 1938. In any given year, however, a major hurricane could make landfall on Long Island, and when it does happen, it could “result in a catastrophic natural disaster” (Shepard et al. 2012). Thus, it is imperative to understand how people on Long Island will respond in that hypothetical situation. Leveraging a virtual reality (VR) simulation of a TC landfall provided a means for doing so in a realistic way.
7
Communicating Weather Risk in the Twenty-First Century: Approaches. . .
7.2
137
Data and Methodology
In 2017, a VR simulation of a Category 3 TC landfall was developed (a link to the non-VR, YouTube video version is included in the appendix). TCs are assigned a category on the Saffir-Simpson scale, based on maximum sustained wind speed, varying from Category 1 (the weakest) to Category 5 (the strongest). TCs of Category 3 strength or greater (sustained winds of at least 96 knots) in the North Atlantic and East Pacific Oceans are frequently referred to as “Major Hurricanes,” given their ability to inflict substantial damage when impacting land. A Category 3 TC was selected because climatologically it was the strongest type of storm that has ever been observed to strike Long Island. The simulation, which lasted around 75 seconds, depicted landfall in a low-lying residential coastal community, of which there are many on Long Island. Participants stood in the family room of the first floor of a standard suburban home (Fig. 7.1a). While viewers were unable to physically change their position in it, they were able to move their head around, both vertically and horizontally, to view the full scale of storm hazards in the immersive environment. Throughout the experience, simulation users saw and heard strong winds, torrential rain, lightning, and sirens. Moreover, those heavy winds blew debris into the room’s window, smashing it open, and then proceeded to blow household objects around, such as knocking a television over (Fig. 7.1b). In addition to hazardous wind, the power of storm surge was also demonstrated in the VR simulation (Fig. 7.1c). Storm surge is the excess water rise caused by TCs, and other storms, on top of the normal astronomical tides (National Hurricane Center 2021b), due to their strong winds and low pressure. Wind speed is often the most-discussed aspect of TCs and determines its Category; however, storm surge is frequently deadlier. Storm surge can rise many feet above normal tidal levels, causing catastrophic
Fig. 7.1 Screenshots of various stages of Category 3 tropical cyclone landfall virtual reality simulation (a–d). Image source: Bernhardt et al. (2019), their Fig. 1
138
J. Bernhardt
flooding of coastal locations, and may extend well inland. Throughout the simulation, the water outside of the home consistently rose due to the storm surge, and towards the end, it flooded the home and completely submerged the participant (Fig. 7.1d).
7.3
Results
The VR simulation developed was used for two pilot studies involving field surveys in 2017 and 2018, with the goal of understanding how the simulation impacted behavioral response. For the first study, undertaken in fall 2017 and described in Bernhardt et al. (2019), 124 individuals were randomly selected from Hofstra University’s student center, over several sessions, and split into two even groups (i.e., 62 in each). Both groups received basic information about a hypothetical TC landfall, including the forecast track and wind speeds. Only one group, however, was shown the VR simulation, in an attempt to isolate its impacts on individual risk perception and resultant actions. It was found through Likert-scale questions that participants who experienced the VR were more likely to report that they would evacuate and take other preparedness measures (Fig. 7.2). Importantly, qualitative
Fig. 7.2 Behavioral intentions, in response to Likert-style questions, where 1 is very unlikely and 5 is very likely, of 124 individuals surveyed. Image source: Bernhardt et al. (2019), their Fig. 4
7
Communicating Weather Risk in the Twenty-First Century: Approaches. . .
139
responses also indicated that those viewing the VR took the storm surge threat more seriously. The second, follow-up, study was conducted in Long Beach, New York, in 2018 and is presented for the first time in this chapter. Long Beach is a small, densely populated city located on a barrier island immediately south of Long Island. Being situated on a barrier island just above sea level, Long Beach is exceptionally vulnerable to storm surge flooding from both TCs and non-tropical storms. During Sandy, which struck the Northeast United States in October 2012, Long Beach sustained extensive damage, including the destruction of its boardwalk and damage to many homes and businesses. When this study was conducted in early 2018, it was hypothesized that while Sandy was over 5 years in the past, its extensive impacts would still be well recalled and thus influence hypothetical actions in a future TC landfall. Previous experience with a weather hazard, however, has conflicting effects on risk perception, and some studies have shown there is insufficient evidence to support the idea that individuals and organizations will be more prepared for a severe weather event after already facing one (e.g., Keul et al. 2018; Zhang and Maroulis 2021). In February–April 2018, researchers visited a local coffee shop and public library, both in Long Beach, to replicate the Bernhardt et al. (2019) study on Hofstra’s campus, but for individuals living in Long Beach, many of whom were directly impacted by Sandy’s hazards in 2012. Based on that survey audience, it was thought that much like the Hofstra campus study, individuals viewing the VR simulation would be significantly more likely to take the hypothetical TC seriously than those not seeing it. However, that was not the case in the Long Beach survey (Fig. 7.3b, below the Hofstra results in Fig. 7.3a, for comparison), as the VR was shown to be a less effective risk communication tool for that audience. For example, in the campus survey, in four of the five Likert-scale questions regarding behavioral intentions in the hypothetical TC, those viewing the VR were significantly more likely to take preparedness actions in response to the storm. For the Long Beach survey, though, there were only significant differences between two of those five questions. Further, in both surveys, a dichotomous, “yes or no” question was posed, simply asking if participants would evacuate from the predicted TC or not. A strong majority of respondents in the Hofstra study said yes, 55 of 62 viewing the VR and 45 of the 62 who did not. That result showed most individuals found a Category 3 TC to be sufficient for warranting evacuation, but the VR simulation provided extra assistance in conceptualizing and acting on the risk. Conversely, in the Long Beach survey, participants viewing the VR were less likely to say that they would evacuate, with 73.3% saying they would evacuate, while 81.0% of those not seeing the VR reported the intention to evacuate. The fact that participants experiencing the VR in the Long Beach study took the projected TC less seriously seemed counterintuitive, especially when compared to the opposing and more expected result in the analogous survey on Hofstra’s campus. Further investigation, though, revealed multiple explanatory factors for the apparent discrepancy. As expected from a college campus, the Hofstra survey sample skewed younger, as 80.6% of the individuals were under the age of 25 (Bernhardt et al.
140
J. Bernhardt
Fig. 7.3 Comparison of Likert-scale question results in the (a) Hofstra survey and (b) Long Beach survey (b) Fig. 7.4 Long Beach survey results for age range versus evacuation intention (“Yes” or “No”)
2019). In the Long Beach survey, meanwhile, participants tended to be older, with only 17.6% under the age of 25 and 35.3% over the age of 60. The Long Beach study further demonstrated the importance of age to evacuation intention (Fig. 7.4). In that survey, all 9 of the respondents under the age of 25 (100%) stated they would evacuate from the hypothetical TC, but the percentage willing to evacuate dropped with each successive age group (25–40; 41–60; >60), with only 61% of the individuals over the age of 60 stating they would evacuate. Additionally, prior experience with TCs also likely played a similar role in reducing perception of risk (Fig. 7.5). In the Hofstra survey, 71.8% of the participants reported having previously experienced a TC (Bernhardt et al. 2019), while in Long Beach, that number was 78.0%. In the latter study, much like older age, previous experience was shown to reduce willingness to evacuate. Of the Long Beach individuals surveyed who mentioned previous experience with a TC, only 69.2% said they would
7
Communicating Weather Risk in the Twenty-First Century: Approaches. . .
141
Fig. 7.5 Long Beach survey results for previous TC experience versus evacuation intention (“Yes” or “No”)
evacuate, while 100% of those without previous experience said yes. Clearly, further investigation of the underlying demographics of each survey group helped explain why they showed opposing results, that is, why VR encouraged individuals in the Hofstra study to take the projected TC seriously but discouraged those in the Long Beach study.
7.4
Discussion
The divergent results across the two studies and their demographic groups indicate that much nuance must be used when understanding how novel technologies can be applied to the problem of weather hazard risk communication. When initially framing this line of inquiry, it was hypothesized that a VR simulation could be a useful asset in real-time warning communication, by providing a short, dramatic, immersive, and easily relatable demonstration of a TC’s many hazards. It was thought, therefore, that including the VR simulation with an advisory message 2 to 3 days in advance of a predicted TC landfall would help convince individuals to evacuate. The findings of the first study at Hofstra University, which matched that scenario, were encouraging, as those viewing the simulation were significantly more likely to report the intention to evacuate and take other preparedness measures in response to the hypothetical threat. Supporting that conclusion were qualitative responses containing several comments about the water in the simulation being frightening and helping to motivate action, especially when it rose to the viewer’s eye level. That result in particular underscored the potential VR holds for enhancing scientific literacy of weather hazards while also motivating appropriate action in real time. The findings from the Long Beach survey, meanwhile, force a more rigorous evaluation of VR’s value in conveying weather hazard risk, as the simulation may have made individuals less likely to take a TC seriously. Factors such as the realism of the simulation, the viewer’s previous experience with the hazard being shown, and other personal characteristics, all seem to influence risk perception. Regarding the accuracy of the VR simulation, if it is found to be unrealistic by a user, the simulation might cause them to ignore it as a risk communication tool or perceive less risk from a TC landfall. To the first point, in the VR experience developed for this project, the power did not go out. One participant in the Long Beach study mentioned this in qualitative feedback, implying that would be a reason to not worry as much about the storm. Further comments from that study were critical of the lack of other people in the simulation, as there were no family
142
J. Bernhardt
members, neighbors, or first responders in it, and additional individuals pointed out the inability to physically move and attempt to escape as unrealistic. Previous experience with a TC was also shown to be an important driver of behavioral response in the two surveys. Particularly for the Long Beach participants, Sandy represented a catastrophic event, as their homes and neighborhoods endured extensive flooding while also sustaining wind damage. Nevertheless, all those individuals physically survived Sandy, so the notion of another TC, especially in a hypothetical sense, may not have been sufficient to motivate evacuation, even with the scenario being enhanced by a VR simulation. For those never impacted by a TC, or not significantly affected (i.e., not forced to evacuate), though, the VR can be instrumental in conveying the dangers of a TC. The efficacy of an immersive simulation is especially apparent in that case, as it can resonate more strongly than a standard video or simple text description of a TC’s hazards. In addition, to further enhance its value, future simulations should also be more localized. For instance, if the survey were to be repeated in Long Beach, the VR simulation could depict the City of Long Beach Boardwalk and Beach Park, which would be a recognizable landmark for local residents. Damage to the boardwalk and beach in the simulation could elicit a more emotional response, potentially triggering flashbacks to Sandy and compelling participants to take the present hazard more seriously. Intentionally forcing such a response, however, can be morally ambiguous. During the two studies, in Long Beach especially, several participants asked to remove the VR headset prior to the simulation concluding. The stated reason was because the VR experience, primarily the water rising and sounds of the storm, did in fact trigger flashbacks to Sandy, resulting in sudden fear. This finding poses a difficult question for hazard researchers and communicators. In order to better understand risk perceptions and motivate protective actions during a storm event, is it ethical to intentionally frighten individuals by attempting to elicit a deep emotional response rooted in past dangerous interactions with that hazard? Coming to terms with this conundrum will be of utmost importance as immersive technology, including VR and other tools such as augmented reality (AR), becomes more lifelike and realistic. Beyond the moral quandaries surrounding the application of immersive technology to hazard communication, deeply held personal convictions should also be considered. Several such factors emerged during the Long Beach study in particular. In the Hofstra survey, when explaining their resistance towards evacuating, participants primarily cited technical information. A lack of specific information about evacuation routes and precise wind speeds, confusion over the forecast map and TC category, and imprecise timing of the event were among the limitations mentioned. In the Long Beach study, while those issues were mentioned by some, the single greatest concern brought up was mistrust – of actors including governmental authorities, the news media, and meteorologists. The inclusion of VR, being a relatively novel and untested technology, may have helped bring rise to those barriers to action mentioned, especially given the older skew of the population, where feelings of distrust may be most acute. This conclusion further cautions against the appropriateness of using VR and similar tools in hazard communication for all audiences, unless it is done so intentionally. One way of doing so could be asking local
7
Communicating Weather Risk in the Twenty-First Century: Approaches. . .
143
authorities and civic associations, who might be viewed as more trustworthy, to leverage VR as part of a suite of risk communication tools. That strategy builds upon the findings of Ploran et al. (2018), who also studied hurricane evacuation decisionmaking in Long Beach. The Ploran et al. study determined that local informational sources, such as police officers, fire departments, and community organizations, would likely be the most persuasive sources of information in future storms. Beyond distrust, other factors revealed as deterrents to evacuation in the Long Beach study included concerns about whether a storm shelter could accommodate people with disabilities and the presence of pets in a household. All of those factors can be challenging to overcome when working to change behavioral outcomes in a hazard. They do, however, motivate an expansion of VR into the realm of video games. The combination of immersive VR and an interactive game could result in a powerful tool for outreach and potentially real-time hazard awareness too. The video game approach could reduce the uncertainties arising from the present studies, particularly limitations involving hazard realism and personal relatability to the simulation. In the future, a VR TC simulation could allow for several personalization options to increase its authenticity. Users could select a simulation location most impactful to them, whether it be a beach, their own neighborhood, or somewhere else. Moreover, they could choose a personal avatar (i.e., character), specify other members of their household (or pets) who should be included in the scenario, and also be allowed to physically evacuate from the location, if they so choose. Those enhancements would be expected to provide more authentic reactions and follow-up survey responses when investigating hypothetical behavioral responses to a hazard and also potentially resonate more in advance of an actual hazard. The former has already been successfully demonstrated in Bernhardt et al. (2020), where a VR video game of a rip current was created. In that simulation, participants were trained in how to swim in the ocean and wave for help in the game and then unexpectedly placed in a rip current. Most participants were able to apply that training in escaping the rip current and reported that physically taking the action in the game was meaningful in teaching them what to do in that hazard. It stands to reason, therefore, that asking participants in a VR TC landfall video game to take similar risk avoidance actions would result in a more memorable lesson. While there are undoubtedly more complexities in reducing TC risk than rip current risk, the flexibility of the video game approach permits both the researcher and the user to tailor the experience to a preferred location and type of TC.
7.5
Conclusions
The pilot studies described in this chapter demonstrate, in a preliminary way, that while VR simulations can potentially be an asset in conveying risk from TCs, there are several key caveats when deploying them. When surveying a younger audience at Hofstra University, VR was shown to be effective in helping participants to take a hypothetical TC landfall more seriously. When that same survey was replicated with
144
J. Bernhardt
an older demographic in Long Beach, however, efficacy of the VR in communicating risk decreased substantially. The reduced effectiveness is hypothesized to have been caused by (1) the direct impacts of 2012 TC Sandy in Long Beach, which counterintuitively lowered fear of a future storm, and (2) increased distrust of information and authorities in the older population. Moreover, in both studies, issues with the simulation’s realism, and highly personal factors such as having dependents to care for, also limited willingness to evacuate in a hypothetical TC landfall. These findings confirm the long-standing notion that individual risk perception is complex and multifaceted. Although all factors influencing risk communication and how individuals act on hazard threats cannot be controlled, the immersive nature of VR shows promise in resonating on a personal level with at least some individuals, particularly younger ones. A VR simulation could further be enhanced by personalization options to make it more relatable and memorable. Last, to overcome the obstacles found in the Long Beach study, it is clear that the way in which a VR hazard outreach tool is framed and presented is crucial to its success with more hesitant populations. For example, asking local officials, friends, and family to share a simulation within their personal networks could be most effective for leveraging VR to help build community-level resilience. Future research can utilize methods including surveys and interviews to confirm and refine such applications of VR simulations to hazard risk reduction. Acknowledgments The work described in this chapter would not have been possible without the devotion of Jackson Snellings in developing the tropical cyclone virtual reality simulation. Further assistance was also provided by Alexander Smiros. Last, several undergraduate research assistants supported collection of the survey data, including Angela Rienzo, Ivan Bermejo, Carys Swan, James Eager, Kaitlyn Shire, Sally Roscoe, and John Van Fossen.
Appendix Link to low-resolution YouTube version of the VR simulation used for the studies: https://youtu.be/5VMCNWpuBdM
References Atlantic Oceanographic and Meteorological Laboratory (2021, October 31) Frequently asked questions. https://www.aoml.noaa.gov/hrd-faq/#avg-forward-speed Bernhardt J, Snellings J, Smiros A, Bermejo I, Rienzo A, Swan C (2019) Communicating hurricane risk with virtual reality: a pilot project. Bull Am Meteorol Soc 100(10):1897–1902 Bernhardt J, Dusek G, Hesse A, Santos W, Jennings T, Smiros A, Montes A (2020) Developing a virtual reality video game to simulate rip currents. J Vis Exp (JoVE) 161:e61296 Keul AG, Brunner B, Allen J, Wilson KA, Taszarek M, Price C et al (2018) Multihazard weather risk perception and preparedness in eight countries. Weather Clim Soc 10(3):501–520
7
Communicating Weather Risk in the Twenty-First Century: Approaches. . .
145
National Hurricane Center (2021a, October 31) Forecast verification. https://www.nhc.noaa.gov/ verification/verify5.shtml National Hurricane Center (2021b, October 31) Glossary of terms. https://www.nhc.noaa.gov/ aboutgloss.shtml Ngo CC, Poortvliet PM, Feindt PH (2020) Drivers of flood and climate change risk perceptions and intention to adapt: an explorative survey in coastal and delta Vietnam. J Risk Res 23(4):424–446 Ploran EJ, Trasciatti MA, Farmer EC (2018) Efficacy and authority of the message sender during emergency evacuations: a mixed methods study. J Appl Commun Res 46(3):291–322 Schumann RL III, Ash KD, Bowser GC (2018) Tornado warning perception and response: integrating the roles of visual design, demographics, and hazard experience. Risk Anal 38(2): 311–332 Shepard CC, Agostini VN, Gilmer B, Allen T, Stone J, Brooks W, Beck MW (2012) Assessing future risk: quantifying the effects of sea level rise on storm surge risk for the southern shores of Long Island, New York. Nat Hazards 60(2):727–745 World Meteorological Organization (2021) WMO atlas of mortality and economic losses from weather, climate and water extremes (1970–2019). WMO, Geneva. WMO-No. 1267, https:// library.wmo.int/doc_num.php?explnum_id=10989 Zhang F, Maroulis S (2021) Experience is not enough: a dynamic explanation of the limited adaptation to extreme weather events in public organizations. Glob Environ Chang 70:102358
Chapter 8
Assessing Coastal Flood Impact on Buildings: A Climate Change Perspective from the Developing Nation N. Aishwarya, H. A. Bharath
, and D. Sutapa
Abstract Coastlines have played an instrumental role in the progression of human settlement due to various economic and ecological benefits. However, the rapidly changing climate is foreboding for both coast and coastal settlements. The rising frequency of coastal extremes, such as flooding from tidal anomalies and storm surges, hampers coastal sustainability causing rampant damage to the built infrastructure. Developing countries with relatively higher mean sea levels, a large density of marginal population along the coastline and limited ability to curb disaster risks face the overbearing consequences of climate change. Regardless of this, the coastal areas remain a primary source of livelihood for marginal communities living around the coast, preventing them from relocating to a safer place. Thus, adaptation to climate change seems to be the most viable option to ensure a region’s resilient development. In the absence of a climate-resilient strategy, the reoccurring floods will continue to undermine the local economy from the recursive damage. The chapter provides a comprehensive summary of the challenges encountered in developing a planned adaptation strategy within a resource-crunched region in India. The planned strategy aims at reducing the residential building damage within the coastal region of West Bengal, India. The study reviews the government’s existing climate change mitigation policies, brings out the limitation in assessing coastal flood impact and suggests spatial intervention for estimating residential building damage using GIS. Keywords Coastal flood impact · Damage cost · High tide flooding · Probabilistic damage assessment · Vernacular buildings
N. Aishwarya · H. A. Bharath (✉) Ranbir and Chitra Gupta School of Infrastructure Design and Management, Indian Institute of Technology Kharagpur, Kharagpur, West Bengal, India e-mail: [email protected] D. Sutapa Architecture, Town and Regional Planning, Indian Institute of Engineering Science and Technology Shibpur, Howrah, West Bengal, India © The Author(s), under exclusive license to Springer Nature Switzerland AG 2023 S. D’Amico, F. De Pascale (eds.), Geohazards and Disaster Risk Reduction, Advances in Natural and Technological Hazards Research 51, https://doi.org/10.1007/978-3-031-24541-1_8
147
148
8.1
N. Aishwarya et al.
Understanding the Impact of Changing Climate on Coastal Flooding
Coastal regions are dynamic areas bounded by the sea on one side and fertile floodplains on the other. They turn out to be a rich source of ecological benefits, food products and competing economic opportunities (Creel 2003). About 50% of the global population is expected to shift within a 100 km radius of the coasts by 2030, and 83% of these are low-lying coastal settlements (settlements below the projected sea-level rise), expected to emerge within the developing countries. Coastal areas of Bangladesh, India, Iran, Maldives and Sri Lanka are said to envisage the highest coastal densities in coming years up to 2060 (Nicholls 2003; Neumann et al. 2015; Nguyen et al. 2016). Irrespective of the numerous benefits, the coastal habitats are also exceptionally exposed to coastal hazards such as coastal flooding, erosion of the coastline, saltwater intrusion, cyclones, tsunamis and coastal inundation (Ehsan et al. 2019). The anthropogenic forcing has further amplified the sensitivity of coastal regions, with global warming being the primary cause behind the thermal expansion of seawater and the melting of polar ice caps. The resultant swell in the ocean is reciprocated by the mean sea-level rise (MSL) and unprecedented variation in the tidal water range (Fig. 8.1). Henceforth, the low-lying coastal area inundations have become repeated phenomena with the rising frequency of tidal anomalies and storm surges, creating havoc among the coastal communities (Small and Nicholls 2003; Neumann et al. 2015; Oppenheimer et al. 2019). Moreover, the coastal flood vulnerability of a region is considerably influenced by local variation in MSL known as the relative sea-level rise (RSLR). The RSLR around South and Southeast Asia is relatively high based on its local terrain, water mass balance between land and ocean, micro-climatic behaviour and several other static conditions (Becker et al. 2019; IPCC 2019; Kirezci et al. 2020). An anomalous high tide during cyclonic storms causes prolonged inundation of the coastal region. A tidal wave is divided into (a) an astronomical tide and (b) a surge component. The surge component is typically high during a storm due to the
Fig. 8.1 A rise in the tidal water range with increasing MSL (Mubarok 2020)
8
Assessing Coastal Flood Impact on Buildings: A Climate Change. . .
149
added meteorological effect; when paired with a spring tide, it can have devastating consequences on coastal settlements. The coastal defense structure such as embankments and dikes is built to prevent such incidents from probing further inland, but the growing intensity of floods is likely to incapacitate their effectiveness. Ever since its first impact assessment report (IPCC 1990), the IPCC has expressed serious concerns regarding climate change patterns and coastal sustainability. It has reported an anticipated rise in the coastal flood frequency due to increased MSL. Even under the most restrained climate scenarios, an inevitable rise of up to 40 cm in global sea level is expected by the year 2100, exposing 94 million people living within low elevation coastal settlements (IPCC 2007). Similarly, floods due to anomalous high tides are projected to grow about 26 times per year by 2035, affecting 170 coastal communities (Spanger-Siegfried 2017). The coastal flood impact on developing nations will be asymmetrically large due to higher exposure causing widespread damage to infrastructure and livelihood (Dasgupta et al. 2009; Barbier 2015; Parvin et al. 2016). Ninety-two percent of the global population under severe threat of 1 in the 100-year flood are located in South and East Asia, primarily China (329 million) and India (225 million) (Rentschler and Salhab 2020). Also, 60% of the population residing in the low elevation coastal zone of South Asia is rural and underequipped to invest in climate-resilient infrastructure on its own (Barbier 2015).
8.2 8.2.1
Assessing Coastal Flood Impact: A Perspective from a Developing Nation Climate Change and Disaster Mitigation Policy of the Government
The year 2020 observed a steep rise of 26% and 23% in storm surges and floods against the annual average from previous years, respectively (CRED 2021). Although the reported number of deaths and mass causalities had declined, the year 2020 was estimated to bear the highest economic loss due to disasters in comparison to the last two decades, which is around 151.6 billion USD (CRED 2021). The Emergency Events Database (EMDat) has also ascertained the incompetency of preparedness schemes such as early warning systems (EWS) and structural measures for disaster resilience in reducing the exacerbating loss due to failure of built infrastructure (EMDAT 2020). Therefore, global frameworks such as Hyogo and Sendai have always prioritised disaster damage reduction as a critical objective for disaster risk resilience (DRR) (UNISDR 2005; UNDRR 2015). It stresses the importance of strengthening the local capabilities of developing states in channelising proactive adaptation mechanisms for combating losses due to climate extremes.
150
N. Aishwarya et al.
Fig. 8.2 Scope for planned adaptation
In alignment with the global initiatives, the Government of India (GoI) in its 12th five-year plan has prioritised DRR over relief and recovery. The National Action Plan on Climate Change (NAPPC), launched in 2008, identified the coastal region as an area of high vulnerability (Pandve 2009; MoHFW 2018) and focused on proactive adaptation and mitigation for their inclusive development. A proactively planned adaption would mean optimum use of scarce resources by developing local-level interventions considering the long-term impact of coastal flooding (Engle 2011; Narendr et al. 2020). The vast coastline of India comprising 3288 fishing villages is a hotspot for 95% of total climate extremes occurring in the country. The coastal regions around the Bay of Bengal account for about 60% of the total deaths from the inundation of low-lying areas (Murty and Flather 1986). Rural India accounts for 41% of the total global population (Lee and Kind 2021). The proliferating density in rural areas is comparable to some of the western megacities. However, meeting urban density requirements does not guarantee adequate physical and social infrastructure for climate change resilience; rather, it often burdens the local ecology beyond repair (Singh et al. 2018; Mohanty and Wadhawan 2021). For instance, Fig. 8.2 is relatable to a scenario of most of the Indian coastal villages that face disparity due to their remoteness, absence of constructive policies for tertiary sources of livelihood and dearth of structural or non-structural measures of disaster resilience.
8
Assessing Coastal Flood Impact on Buildings: A Climate Change. . .
151
The NAPCC policies for rural settlements were majorly dedicated to employment generation and agricultural schemes (Patra 2016). The National Disaster Management Plan 2019 for coastal flood mitigation was confined to agendas on EWS, coastal zone regulation and coastal forest management, failing to comprehend the immediate need for minimising disaster losses that are crippling the socio-economic structure, making disaster recovery nearly impossible (GOI 2019). Ironically, disaster resilience has not been able to embrace the rift between the needs of urban and rural settlements. For instance, during flooding, residential housing damage is a major setback for rural communities, with numerous rendered homeless postdisasters. Contradicting urban areas, rural houses are typically made in vernacular style architecture using local materials that fail to withstand the aggravating stress from hazards. The loss incurred due to floods in India accounted for 4.7 million USD between 1953 and 2016, including 1.2 million housing stock (CWC 2019). The Indian state of West Bengal reported 40% of the total housing damage incurred in the country over the past seven decades (CWC 2019). It is essential to reveal that the loss statistics are related to pluvial or fluvial flooding, emphasising the lack of vigilance for coastal flood impact scenarios. Hence, the loss of rural housing due to coastal flood extremes can be redirected as one of the most vicious impacts of rising sea levels.
8.2.2
Challenge in Estimating Coastal Flood Impact in a Data-Scarce Region
Direct contact of buildings to floodwater results in both direct and indirect damage. Direct damage includes up-front loss of building fabric, building interior and elements (Merz et al. 2010; Pistrika et al. 2014). Direct damage also has an induced effect on the socio-economic well-being of the community, classified as indirect damage. Hence the damages that occurred due to floods are both tangible and intangible. Moreover, the damage intensity is positively correlated to flood intensity, i.e. the flood depth around the building, the duration of inundation, the flow velocity or the level of floodwater contamination. Hence, direct damage to buildings can be significantly reduced by precluding floodwater contact or enhancing flood endurance. Building damage assessment is carried out using deterministic (empirical, synthetic) (Scawthorn et al. 2006; Thieken et al. 2008; Merz et al. 2010; Jongman et al. 2012; Penning-Rowsell et al. 2014) and probabilistic approaches (van de Lindt and Taggart 2009; Deniz et al. 2017; Nofal et al. 2020). An empirical approach is based on post-disaster damage observations made through visual surveys and interviews. The assessment involves collecting significant data points specific to the flood character to ascertain the accuracy of the derived stage-damage curves (Davis and Skaggs 1992; Islam 1997). In the absence of field data, synthetic data can also be generated by collecting ‘what if’ responses of the vulnerable groups with a recent
152
N. Aishwarya et al.
flood experience. However, the synthetic data approach requires skilled interviewers and, similar to the empirical, is unable to comprehend the uncertainties of the estimation procedure (Jongman et al. 2012; Nofal et al. 2020). Moreover, the deterministic approaches do not provide the scope for exploring the durational impact of flooding which is a significant character of slow rising coastal flooding. Probabilistic damage assessment over deterministic is a resource-efficient approach for identifying uncertainties and damage range values of a flood event in absence of primary data. The resultant damage function known as fragility curves is developed by correlating hazard character (depth, duration in case of floods) to the probability of exceeding a predefined damage stage (DS). The predefined damage stage corresponds to the degree of damage that a building may endure when in direct contact with floodwater. The DS values are usually obtained from the field study or experimental data. The DS of a building component will largely depend upon its material resistance against flood. Hence it can be chosen as a parameter for deciding optimal compensation for building damage post-flooding, promoting speedy recovery. The building level damage assessments are reasonably accurate but entail detailed information that is difficult to procure given the region-specific data requirements (Ludtke et al. 2019). Hence, the absence of region-specific damage curves and the inability of foreign curves to be adopted for indigenous building typologies restrain the resource-constrained developing countries from probing further beyond assessing regional exposure and vulnerability (Nofal and van de Lindt 2020; Malgwi et al. 2021). As discussed earlier, the coastal village in developing countries is predominated by vernacular or traditional housing. The buildings are functional, constructed of locally available material (mud and bamboo in this case) and technique that makes them cost-effective. But at the same time, the buildings are also susceptible to aggravating hazard risks due to floods (Moles et al. 2013). Similar is the case of Sagar Island, located between 21.6276oN to 21.8842oN and 88.0408°E to 88.1278°E (Fig. 8.3) in South 24 Parganas district of West Bengal. The landform was originally a part of Sundarbans Forest that was cleared in the mid-1800s for cultivation. Henceforth, the island has been rapidly growing in population and movement of climate refugees from the adjacent drowning landforms making it the largest habited region in the Sundarbans. The population recorded by the census in 2011 was 212,037, among which about 75% of households live in vernacular housing typologies, extremely sensitive to climate extremes (Census 2011; Narendr et al. 2021). The traditional technique followed by the islanders is called wattle and daub construction, where a bamboo frame is filled with cob and later mud-plastered to obtain a finished wall. These buildings are generally constructed on a shallow foundation raised by a one to two feet high mud plinth. The World Bank has reported the recurring loss of housing in the region due to rising instances of floods (World Bank 2014). In the last 3 years, Sagar has experienced consecutive surges from severe to very severe cyclones (YAAS (2021), Aamphan (2020) and Bulbul (2019)), causing extensive damage to its built infrastructure.
8
Assessing Coastal Flood Impact on Buildings: A Climate Change. . .
153
Fig. 8.3 Damage matrix
The government under its Sustainable Urban Habitat Action Plan (SUHAP) and Technology Sub-Mission is willing to invest in sustainable approaches that ensure climate-sensitive and eco-friendly housing design (Yojana 2015). However, the viability of such projects requires a sound justification guaranteeing local-level applicability. Since most of the government compensation in the past varied based on the housing typology and damage state (partially or fully damaged) of the building, they were unsuccessful in ensuring ‘building back better’ (BBB) that is certainly a pressing priority for proactive adaptation to climate change. Flood damage assessment is the preliminary step towards understanding the local impact level of flood reoccurrence in a region. It rationalises the performance of the existing build-environment during disasters and also helps in estimating monetary compensations (Pistrika et al. 2014; Shrestha et al. 2021), therefore providing a ground for informed decision-making before investing in flood resilience.
8.3
Multivariate Building Damage Assessment Model for Vernacular Buildings
Based on the concept of Source–Pathway–Receptor–Consequence (Kandilioti and Makropoulos 2012; Narayan et al. 2014) that essentially highlights the connection between the flood origin and character to its implication on the element at risk, the proposed method evaluates the sensitivity/damage of vernacular buildings from slow-rising coastal inundation that does not have a wave effect. The research method
154
N. Aishwarya et al.
Fig. 8.4 Building damage assessment method
described in Fig. 8.4 has been exercised on Sagar Island, West Bengal, which has no preliminary data in terms of existing damage curves for the residential land use or building type. The remoteness of the location and its troubled connectivity to mainland India prevented the collection of empirical data, especially during natural calamities, thereby proving the probabilistic damage assessment method best suited for the area.
8.3.1
Research Methodology
The primary step in the damage assessment process involved the identification of prominent building types along with basic details about the layout and building envelope (structure, material) (Fig. 8.5). Once the typology is identified, a thorough review of the literature is required to understand the damage behaviour of buildings during floods. The review is also to identify existing damage curves that can be used for defining the damage state of buildings. The next step was about selecting a building specimen that is a representative sample for all buildings belonging to a particular category. The adopted building specimen was divided into damageable components, say plinth, floor, column, wall plaster, doors, and windows for a component-wise damage assessment. The damage level for a building component was assumed to be normally distributed along its cross section, and each of them was assigned a damage threshold (lower and upper bound) considering its minimum and maximum endurance to flood, respectively. This endurance value was taken to be the same as the material resistance used for its
8
Assessing Coastal Flood Impact on Buildings: A Climate Change. . .
155
Fig. 8.5 Building typology data collected at Sagar Island Table 8.1 Damage table Threshold Min Depth Max Depth Avg Depth (μ) SD Depth (σ) Min Duration Max Duration Avg Dur (μ) SD Dur (σ ) Cost (Rs)
(1) 0.01 0.3 0.155 0.0725 2 38 20 9 4306
(2) 0.3 0.45 0.375 0.0375 2 38 20 9 822.5
(3) 0.45 2.1 0.225 0.1125 24 48 36 6 2000
(4) 0.01 2.1 1.055 0.5225 2 38 20 9 11,341
(5) 0.45 2.1 1.275 0.4125 2 38 20 9 15,968
(6) 0.45 1.8 1.125 0.3375 24 48 36 6 2000
(7) 1.05 1.65 1.35 0.15 24 48 36 6 3500
1, brick and mud plinth; 2, mud floor; 3, bamboo column; 5, mud wall; 6, wooden door; 7, wooden window
construction. The flood threshold for each construction material given in Table 8.1 was obtained from a thorough review of articles published on experiment research (Islam 1997; Forster et al. 2008; Bui et al. 2017; Englhardt et al. 2019). Later the damage behaviour of the wall was broken into five stages using a ‘damage matrix’. The damage matrix assesses the combined effect of flood depth and duration on each of building components based on their values given in Table 8.1. Hence, the five stages of damage matrix are the minimum and maximum flood values along with their mean and two standard deviations computed using Eqs. (8.1) and (8.2), respectively. The minimum threshold is said to be exceeded when the component comes in direct contact with the floodwater. X min þ X max 2 X max - X min σ= 4
μ=
PðDSi Þ = ΣP½F ðx, yÞ > Ri ]
ð8:1Þ ð8:2Þ ð8:3Þ
156
N. Aishwarya et al.
DC =
n X
a . CC i
ð8:4Þ
i=1
Fr ðxÞ = P½DC > C t ] = nf =N
ð8:5Þ
where μ = Mean resistance, σ = Standard deviation; DC = damage cost of entire building, CC = cost of individual component, n = number of components in the building, a = loss percent of the component, P(DSi) = Probability of a component to be in a Damage State (DS), P(F = x, y) = Probability that flood character has a value x (depth), y (duration), Ri = Component resistance (value of i varies from 1 to 7), nf = no. of failed simulations, N = total number of simulations, Fr(x) = Fragility function, Ct = damage cost stage (value of t varies from 0 to 5). The damage behaviour of components is computed in the matrix using logical insights based on literature (BMTPC 2010; Shah et al. 2013; Mohd et al. 2016). The hypotheses considered in the process are as follows: (i) failure of each component is independent of the other; (ii) when both depth and duration are zero, no significant damage is said to occur; and (iii) when either depth or duration is zero, no significant damage is said to occur. The damage behaviour of a component due to both depth and duration action of the flood is represented as the damage ratio (0 to 1) in the matrix; the ratio is suggestive of the repair cost of the component. The repair cost was obtained as per the West Bengal schedule of rates. Following the development of the matrix, Monte Carlo simulations were used to determine the flood probability in the region. A thousand simulations were run for both depth and duration values individually while considering the maximum endurance of material used for construction. The simulation results along with the damage matrix were used to determine component-wise DS. Equation (8.3) describes the probability of a component to lie within a damage state (DS) given that its resistance has been exceeded. Once the damage state of all the components within a building is determined for a given flood probability, Eq. (8.4) is used to calculate the total damage cost of a building. The total damage cost is a summation of the replacement cost of individual building components multiplied by their loss ratio. Finally, the total DC range obtained for building specimens is divided into five classes and represented by a three-dimensional axis using Eq. (8.5).
8.3.2
Results and Discussion
Figure 8.6 represents the primary housing typology identified in the region. The Census (2011) ascertains the use of mud, unburnt bricks, polythene sheets, wood, thatch, etc., as typical housing materials on Sagar Island. Therefore, the building specimen adopted for the study resembles the most commonly occurring single-story housing of 30 sq. m area with 2.1 m height up to lintel. The previous studies on damage estimations of mud buildings have primarily used empirical methods for assessment (Shah et al. 2013; Mohd et al. 2016). The researchers, based on their field
8
Assessing Coastal Flood Impact on Buildings: A Climate Change. . .
157
Fig. 8.6 Predicted flood map during cyclone Yaas
observations, have often reported material behaviour as the most significant character affecting flood vulnerability of mud buildings. However, this linkage between building vulnerability and material behaviour was rarely justified in terms of damage curves. Most of the existing damage curves demonstrate flood depth as the principal propagator of building damage (Khairul et al. 2022), which is not true, especially in the case of mud housing that is largely affected by the duration of standing water (Thieken et al. 2005; BMTPC 2010). This is because it is difficult to gain insight regarding flood duration simply through field data collected in a post-flood scenario (Nofal and van de Lindt 2020). Therefore, presenting a distorted image of flood action makes the existing curves unsuitable to be used for estimating the repair cost of a building. Unlike the previous univariate approach, the proposed method has a more comprehensive outlook on damage assessment. It delivers a cumulative and standardised method for repair cost assessment by analysing the impact of both flood depth and duration on buildings using the probabilistic technique. The severity of flood and remoteness of Sagar Island have been the major hindrance in the collection of field data, thus the development of stage damage curves. Due to the unavailability of stage damage curves, damage matrices were seen as the best-suited alternative to define DS in this case. They illustrate the damage behaviour that each building component is likely to suffer. The behaviour for every component of their cross section was taken to be similar. This would mean that each component may respond similarly once the water crosses the lower bound and till it
158
N. Aishwarya et al.
Fig. 8.7 Location of Sagar Island
reaches the final stage of absolute failure. Figure 8.7 has been provided as the visual interpretation of the damage matrix. Each peak in the figure corresponds to the damage ratio of damage percent that the component may endure once the comparable depth-duration is reached. The range of replacement cost under each stage of building damage has been categorised for ease in issuing compensations. The stages, namely, DS0, DS1, DS2, DS3, DS4, and DS5, will require 0, 15%–35%, 26%–46%, 50%–60%, 60%–98%, and 100% compensation of their total building cost. Figure 8.8 is the fragility curve expressing the probability of failure of mud building along with their DS within 1000 flood simulations.
8.3.3
Analysing Spatial Damage Post-Cyclone Yass
The relevance of this method was tested through spatial application for cyclone Yaas that occurred on May 26, 2021. The intuitive hazard scenario for cyclones was created using a Digital Surface Model (DSM)-based enhanced bathtub model (Williams and Luck-Vogel 2020). The flood threshold point for the region was marked when water exceeds the high water line (HWL). The spatial location of HWL was delineated using the guidelines by the Indian space agency (ISRO 2014). The elevation of HWL was fixed at 5.02 meters, which is the long-term mean of high
8
Assessing Coastal Flood Impact on Buildings: A Climate Change. . .
159
Fig. 8.8 Damage stage for Kutcha buildings in Sagar Island
water in the region. The mean high water value is subtracted from the sum of astronomical tide and surge value reported during Yaas to estimate flooding over HWL or the flood threshold. The flood threshold value obtained was used for making binary classification of DSM as flooded and non-flooded zones. Identification of flooded zone using binary classification leads to an overestimation of inundated areas. The enhanced bathtub model, hence, used for the analysis involves terrain attributes such as surface runoff coefficient and slope and elevation values to reduce overestimation in the predicted map. The DSM and land use map of the region were extracted using the HWL boundary. A ‘flow feasibility map’ was generated by dividing slope (from DSM) and surface runoff coefficient (from land use map). A higher cell value in the feasibility map indicated a smoother flow due to a gentler slope and minimum surface resistance. Inundation pockets from the flow feasibility map are segregated using a flood threshold value. The pixel value at each inundation level is converted into a point vector to establish a channel flow from the (point vectors on) HWL using the least-cost technique. The resultant ‘least cost’ map generated uses the most feasible pixel to connect the HWL boundary to inundation pockets. Finally, a flood mask is generated by analysing the surface runoff to identify the most convenient area for water retention. The flood mask is multiplied by the DSM to obtain pixel-wise inundation/flood values (Fig. 8.6). The sensitivity of the receptor or the building specimen here was already defined in the last section using Eqs. (8.4) and (8.5). The fragility curves were compared with
160
N. Aishwarya et al.
Fig. 8.9 Building damage stage map for Sagar Island
deterministic outcomes (flood depth at the various pixels) from the flood exposure model and flood duration values to identify the actual damage stage or amount of replacement cost required (Fig. 8.9). The duration of flooding value was taken as 24 hours based on the reports from Indian Meteorological Department (IMD) and local newspaper. It can be inferred from Fig. 8.9 that the spatial location of a building is a critical aspect governing its vulnerability to coastal floods. The mud building located in areas with a flood depth up to 4 m was likely to fall in DS4 category needing 60 to 98% of the total building cost as repair compensation. Nearly 12% of buildings in the region have landed in the above-mentioned category. The rest of the 2%, 14% and 3% of the buildings belonged to DS3, DS2 and DS1 categories requiring 50%–60, 26%–46% and 15%–35% of their total building cost as remuneration from cyclone Yaas. It is important to note that the replacement cost value does not include the labour and maintenance costs. The other limitation of the assessment is building components, for instance, walls are composite in nature (made of two or more materials). Therefore their behaviour may deviate from Table 8.1 in a given situation.
8
Assessing Coastal Flood Impact on Buildings: A Climate Change. . .
8.4
161
Conclusion
The accelerated trend of climate change is adding an unprecedented threat to coastal communities within developing countries. Apart from being densely populated coastlines, Southeast Asia also reports an elevated trend in the SLR that can have devastating effects on the coastal settlements. Climate change mitigation requires the development of planned adaptation strategies to minimise future challenges such as loss of infrastructure and build environment. The chapter details the policy and resource constraints in assessing flood damage to residential buildings in rural areas. It demonstrates the viability probabilistic over resource-intensive methods using a study of Sagar Island West Bengal. The proposed strategy is hassle-free and hence can be easily replicated in areas having no history of field survey data. The method can be used as an incentive for informed decision-making (damage compensation in this case) and accomplishing the DRR goals. The article also promotes inclusivity by integrating the concern of socially backward and disintegrated areas.
References Barbier EB (2015) Climate change impacts on rural poverty in low-elevation coastal zones. Estuar Coast Shelf Sci 165:A1–A13 Becker M, Karpytchev M, Papa F (2019) Hotspots of relative sea-level rise in the tropics. In: Venugopal V, Sukhatme J, Murtugudde R, Roca R (eds) Tropical Extremes. Elsevier, Oxford, pp 203–262 BMTPC (2010) Guidelines improving flood resistance of housing. Retrieved 10 July 2021 from https://bmtpc.org/DataFiles/CMS/file/ Bui QB, Grillet AC, Tran HD (2017) A bamboo treatment procedure: effects on the durability and mechanical performance. Sustainability 9(9):1444 Census (2011) Census of India. Minist. Home Aff. Gov. India. Retrieved 10 July 2021 http://www. censusindia.gov.in CRED (2021) Disaster year in review 2020: global trends and perspectives. CRED Crunch Newsletter, Issue No. 62. Retrieved 10 July 2021 https://reliefweb.int/report/world/ Creel L (2003) Ripple effects: population and coastal regions. Population Reference Bureau, Washington, DC, pp 1–7 CWC (2019) Water and related statistics. Water Resources Information Systems Directorate, New Delhi Dasgupta S, Laplante B, Meisner C, Wheeler D, Yan J (2009) The impact of sea level rise on developing countries: a comparative analysis. Clim Chang 93(3):379–388 Davis SA, Skaggs LL (1992) Catalog of residential depth-damage functions used by the army corps of engineers in flood damage estimation. Army engineer inst for water resources Alexandria va Deniz D, Arneson EE, Liel AB, Dashti S, Javernick-Will AN (2017) Flood loss models for residential buildings, based on the 2013 Colorado floods. Nat Hazards 85(2):977–1003 Ehsan, S., Begum, R. A., Nor, N. G. M., & Maulud, K. N. A. (2019). Current and potential impacts of sea level rise in the coastal areas of Malaysia. In IOP Conf Ser Earth Environ Sci, 228, 1, 012023 IOP Publishing EMDAT (2020) EM-DAT The International Disaster Database. https://www.emdat.be/ Engle NL (2011) Adaptive capacity and its assessment. Glob Environ Chang 21(2):647–656
162
N. Aishwarya et al.
Englhardt J, de Moel H, Huyck CK, de Ruiter MC, Aerts JC, Ward PJ (2019) Enhancement of large-scale flood risk assessments using building-material-based vulnerability curves for an object-based approach in urban and rural areas. Nat Hazards Earth Syst Sci 19(8):1703–1722 Forster AM, Medero GM, Morton T, Buckman J (2008) Traditional cob wall: response to flooding. Struct Surv 26:302 GOI (2019) National Disaster Management Plan, 2019. MHA GOI. Retrieved 10 July 2021 https:// ndma.gov.in/sites/default/files/PDF/ndmp-2019.pdf IPCC (1990) Climate change the ipcc scientific assessments Retrieved 10 July 2021 https://www. ipcc.ch/site/assets/uploads/2018/05/ipcc_90_92_assessments_far_full_report.pdf IPCC (2007) Climate change 2007: synthesis report. Intergov. Panel Clim. Chang. Retrieved 10 July 2021 https://www.ipcc.ch/site/assets/uploads/2018/02/ar4_syr_full_report.pdf IPCC (2019) Special report: the ocean and cryosphere in a changing climate. Intergov. Panel Clim. Chang. Retrieved 10 July 2021 https://www.ipcc.ch/srocc/ Islam KM (1997) The impacts of flooding and methods of assessment in urban areas of Bangladesh, Doctoral dissertation, Middlesex University. Retrieved 10 July 2021 https://eprints.mdx.ac.uk/ 9602/ ISRO (2014) Shore line change atlas of the Indian coast, vol. 5. Retrieved from https://vedas.sac. gov.in/vedas/downloads/atlas/ Jongman B, Kreibich H, Apel H, Barredo JI, Bates PD, Feyen L et al (2012) Comparative flood damage model assessment: towards a European approach. Nat Hazards Earth Syst Sci 12(12): 3733–3752 Kandilioti G, Makropoulos C (2012) Preliminary flood risk assessment: the case of Athens. Nat Hazards 61(2):441–468 Khairul IM, Rasmy M, Ohara M, Takeuchi K (2022) Developing flood vulnerability functions through questionnaire survey for flood risk assessments in the Meghna Basin, Bangladesh. Water 14(3):369 Kirezci E, Young IR, Ranasinghe R, Muis S, Nicholls RJ, Lincke D, Hinkel J (2020) Projections of global-scale extreme sea levels and resulting episodic coastal flooding over the 21st century. Sci Rep 10(1):1–12 Lee YF, Kind M (2021) World social report 2021: reconsidering rural development. United Nations, New York Ludtke S, Schroter K, Steinhausen M, Weise L, Figueiredo R, Kreibich H (2019) A consistent approach for probabilistic residential flood loss modeling in Europe. Water Resour Res 55(12): 10616–10635 Malgwi MB, Schlogl M, Keiler M (2021) Expert-based versus data-driven flood damage models: a comparative evaluation for data-scarce regions. Int J Disaster Risk Reduct 57:102148 Merz B, Kreibich H, Schwarze R, Thieken A (2010) Review article “Assessment of economic flood damage”. Nat Hazards Earth Syst Sci 10(8):1697–1724 Mohanty A, Wadhawan S (2021) Mapping India’s Climate Vulnerability A district level assessment. CEEW. Retrieved 10 March 2022 https://www.ceew.in/sites/default/files/ceew-study-onclimate-change-vulnerability-index-and-district-level-risk-assessment.pdf Mohd T, Saraf MHM, Pin SFC, Hasbullah MN, Nordin TE, Ismail D (2016) The degree of housing damage model for a flood affected area. MATEC Web Conf 66:00074. EDP Sciences MoHFW (2018) National action plan for climate change & human health. GOI. Retrieved 10 July 2021 https://ncdc.gov.in/WriteReadData/l892s/27505481411548674558.pdf Moles O, Islam MS, Hossain TR, Podder RK (2013) Improvement of vernacular housing for disaster prone areas in Bangladesh: a six year experience. In: Correia M, Carlos G, Rocha SCS (eds) Vernacular Heritage and Earthen Architecture. CRC Press, Boca Raton, FL, pp 683–688 Mubarok MWS (2020) Sea-level rise and coastal flooding of australia climate crisis. Medium. Retrieved 30 October 2021 from https://wahyusyafiul.medium.com/sea-level-rise-and-coastalflooding-of-australia-climate-crisis-a7619e16f499
8
Assessing Coastal Flood Impact on Buildings: A Climate Change. . .
163
Murty TS, Flather RA (1986) The storm surges problem in the Bay of Bengal. J Coast Res 16:149– 161 Narayan S, Nicholls RJ, Clarke D, Hanson S et al (2014) The SPR systems model as a conceptual foundation for rapid integrated risk appraisals: lessons from Europe. Coast Eng 87:15–31 Narendr A, Das S, Shivamurthy V, Aithal BH (2020) Adaptive capacity assessment for a flood vulnerable region through land use modelling and socio economic and physical indicators. J Environ Inform Lett 3(2):107–119 Narendr A, Vinay S, Aithal BH, Das S (2021) Multi-dimensional parametric coastal flood risk assessment at a regional scale using GIS. Environ Dev Sustain 24:1–29 Neumann B, Vafeidis AT, Zimmermann J, Nicholls RJ (2015) Future coastal population growth and exposure to sea-level rise and coastal flooding-a global assessment. PLoS One 10(3): e0118571 Nguyen TT, Bonetti J, Rogers K, Woodroffe CD (2016) Indicator-based assessment of climatechange impacts on coasts: a review of concepts methodological approaches and vulnerability indices. Ocean Coastal Manag 123:18–43 Nicholls RJ (2003) Case study on sea-level rise impacts. In OECD Workshop on the benefits of climate policy: improving information for policy makers, vol 9, pp 69–86 Nofal OM, van de Lindt JW (2020) Minimal building flood fragility and loss function portfolio for resilience analysis at the community level. Water 12(8):2277 Nofal OM, van de Lindt JW, Do TQ (2020) Multi-variate and single-variable flood fragility and loss approaches for buildings. Reliab Eng Syst Saf 202:106971 Oppenheimer M, Glavovic B, Hinkel J, van de Wal R, Magnan AK, Abd-Elgawad A et al (2019) Sea level rise and implications for low lying islands, coasts and communities. In: Micheal O et al (eds) IPCC special report on the ocean and cryosphere in a changing climate. Cambridge University Press, Cambridge Pandve HT (2009) India's national action plan on climate change. Indian J Occup Environ Med 13(1):17 Parvin GA, Shimi AC, Shaw R, Biswas C (2016) Flood in a changing climate: the impact on livelihood and how the rural poor cope in Bangladesh. Climate 4(4):60 Patra J (2016) Review of current and planned adaptation action in India. CARIAA. Retrieved 10 July 2021 https://www.iisd.org/system/files/publications/idl-55866-india.pdf Penning-Rowsell E, Priest S, Parker D, Morris J, Tunstall S, Viavattene C et al (2014) Flood and coastal erosion risk management: a manual for economic appraisal. Routledge, New York Pistrika A, Tsakiris G, Nalbantis I (2014) Flood depth-damage functions for built environment. Environ Process 1(4):553–572 Rentschler J, Salhab M (2020) People in Harm's way: flood exposure and poverty in 189 countries. The World Bank, Washington, DC Scawthorn C, Flores P, Blais N, Seligson H, Tate E, Chang S et al (2006) HAZUS-MH flood loss estimation methodology. II. Damage and loss assessment. Nat Hazards Rev 7(2):72–81 Shah A, Khan HM, Qazi EU (2013) Damage assessment of flood affected mud houses in Pakistan. J Himal Earth Sci 46(1):99 Shrestha BB, Kawasaki A, Zin WW (2021) Development of flood damage assessment method for residential areas considering various house types for Bago Region of Myanmar. Int J Disaster Risk Reduct 66:102602 Singh C, Rahman A, Srinivas A, Bazaz A (2018) Risks and responses in rural India: implications for local climate change adaptation action. Clim Risk Manag 21:52–68 Small C, Nicholls RJ (2003) A global analysis of human settlement in coastal zones. J Coast Res 19: 584–599 Spanger-Siegfried E (2017) When rising seas hit home: hard choices ahead for hundreds of US coastal communities. Union of Concerned Scientists, Cambridge, MA Thieken AH, Müller M, Kreibich H, Merz B (2005) Flood damage and influencing factors: new insights from the August 2002 flood in Germany. Water Resour Res 41(12):W12430
164
N. Aishwarya et al.
Thieken AH, Olschewski A, Kreibich H, Kobsch S, Merz B (2008) Development and evaluation of FLEMOps–a new flood loss estimation model for the private sector. WIT Trans Ecol Environ 118:315–324 UNDRR (2015) Sendai framework for disaster risk reduction 2015–2030, UNDRR. Retrieved July 10, 2021, from https://www.undrr.org/publication/ UNISDR (2005) Hyogo framework for action 2005–2015: Building the resilience of nations and communities to disasters, UNISDR. Retrieved 10 July 2021 from https://www.unisdr.org/ files/1037_hyogoframeworkforactionenglish.pdf van de Lindt JW, Taggart M (2009) Fragility analysis methodology for performance-based analysis of wood-frame buildings for flood. Nat Hazards Rev 10(3):113–123 Williams LL, Luck-Vogel M (2020) Comparative assessment of the GIS based bathtub model and an enhanced bathtub model for coastal inundation. J Coast Conserv 24(2):1–15 World Bank (2014) Building resilience for sustainable development of the Sundarbans: strategy report. Retrieved 10 July 2021 from https://documents1.worldbank.org/curated/en/8793514682 59748207/pdf/880610REVISED00ns000Strategy0Report.pdf Yojana PMA (2015) Housing for all (urban), scheme guidelines 2015. Report. Ministry of Housing and Urban Poverty Alleviation, Government of India. Government of India
Chapter 9
Coping with Disasters: What Place Names Can Tell Us About Anthropocene and Climate Change Elisabetta Dall’Ò
Abstract This contribution is based on a series of questions and reflections, both of a theoretical and methodological nature, which have guided my post-doctoral research on Anthropocene, climate change and environmental disasters on the Italian Alps and which concern local linguistic, toponomastic and memory-related aspects of disasters and places. Is there a ‘language of places’, a ‘local language’ that defines the specific context of environmental risk, catastrophe, hazards and disaster? Are there ‘local’ terms, inscribed in the territory, in the memory (and in local culture) to define those ‘disasters’ and catastrophes of which we have a specific local memory, linked to the places where they occurred? And again, do specific relations based on the ‘memory’ between places and disastrous events exist? Toponymy teaches us that. The focus will be on the Mont Blanc area, a French-speaking land on the Western Alps characterized by a huge variety of extreme natural phenomena: avalanches, landslides and flooding, events that are becoming increasingly frequent due to the consequences of climate change (e.g. extremes, heatwaves) and which people will have to cope with. Some ancient place names in this region have maintained a significance related to local ‘natural risks’ as potential disasters or already happened disasters and catastrophes. The whole Alpine region is described, named and ‘recognized’ throughout a large variety of toponyms that communities have created on purpose to mark out places, to protect them, to exploit them but also to avoid them. Although language and landscape are the sound and visual background around which the experience and perception of a place are articulated, place names constitute a class of words, or names, long neglected in the anthropological debate. From its beginnings, cultural and social anthropology has paid great attention to the study and comparison of terminologies and classes of names related to the kinship and classification of the natural and plant world while neglecting those related to place names, which have long remained the prerogative of ‘pure’ linguistic studies.
E. Dall’Ò (✉) Department of Cultures, Politics and Society (CPS), University of Turin, Turin, Italy © The Author(s), under exclusive license to Springer Nature Switzerland AG 2023 S. D’Amico, F. De Pascale (eds.), Geohazards and Disaster Risk Reduction, Advances in Natural and Technological Hazards Research 51, https://doi.org/10.1007/978-3-031-24541-1_9
165
166
E. Dall’Ò
The ‘words of others’, the ‘names of others’, question the anthropologist on the ‘sense of the places’ that they inhabit and by which they are at the same time inhabited. Names, wrote Carlo Levi, mean something: there is a magical power in them; a word is never a convention or a breath of wind, but a reality, a thing that acts. Anthropology can help us, also by questioning the ‘names of others’, to enhance local knowledge about climate and the environment and to propose novel solutions to the current challenges. Keywords Sense of the places · Social vulnerability · Coping · Disasters · Anthropocene
9.1
Nomina Sunt Consequentia Rerum: A Name, A Destiny
The ancient Romans used the locution nomen omen to indicate how the destiny (originally of a person) was inscribed in the name, and so too the supreme poet Dante, in the Vita Nuova, reminds us, quoting Justinian,1 how nomina sunt consequentia rerum, or how names are consequent to things. And this is true also, and above all, for a special class of words: place names. Place names, or toponyms, are the result of a process of continuous exchanges and relations between the environment and those who have inhabited and lived in it. They tell of what has been, what still is, but also of what no longer is or no longer has been because the passage of time, environmental and climatic changes or cultural and social changes have erased its traces. Toponyms can also tell us something about the ‘destiny of places’ and their—and our—future. Place names carry with them memories, but they also bear witness to the oblivion and loss of meaning to which they are subject by their very nature as ‘products’ of human culture. A place, through the name it has been given, is able to connect several perceptive, cognitive and linguistic dimensions within itself. The perception of a place, the ‘physicality of a landscape’, its linguistic expression and its ‘imaginary extensions’ should no longer be thought of a priori as independent albeit interacting factors (Tallè 2016), but as an experience, even an embedded one, of ‘being in’ a place, a multiple correspondence of meanings and senses, a reciprocal interaction between natural phenomena, environment, culture and language. Although language and landscape are the sound and visual background around which the experience and perception of a place are articulated, place names constitute a class of words, or names, long neglected in the anthropological debate. From its beginnings, cultural and social anthropology has paid great attention to the study and comparison of terminologies and classes of names related to the kinship and classification of the natural and plant world (Lévi-Strauss 1966) while neglecting
1
con ciò sia cosa che li nomi seguitino le nominate cose, sì come è scritto: «Nomina sunt consequentia rerum», Vita Nuova XIII, 4.
9
Coping with Disasters: What Place Names Can Tell Us About Anthropocene. . .
167
those related to place names, which have long remained the prerogative of ‘pure’ linguistic studies (Jones 2016). The ‘words of others’, the ‘names of others’, question the anthropologist on the ‘sense of the places’ that they inhabit and by which they are at the same time inhabited. Quoting Carlo Levi, words mean something: there is a magical power in them; a word is never a convention or a breath of wind, but a reality, a thing that acts (Levi 1945). In the last 20 years, in contrast to the theoretical proposals of contemporary anthropology centred on flows, non-places (Augé 2009) and globalization, the debate has been enriched by an ethnography attentive to places and landscapes, and the symbolic and social relevance of place names in different cultural contexts has been realized. The anthropological approach can help us also by questioning the ‘names of others’, to enhance local knowledge about climate and the environment and to propose novel solutions to the current challenges. The ecological knowledge contained in place names, if brought to light, can alert us to critical events in specific places, can warn us of certain risks and can remind us that extreme events always have a return time that escapes human memory. As Van Aken argued, the intimate cultural relationship that defines our atmospheric involvement has also settled into the words. The words with which we denote the weather have always been models for defining the experience of our social time, and the language itself is profoundly ‘atmospheric’ (Van Aken 2020); in the same way, place names tell us something about climatic knowledge and record traces of events that have affected local communities over time (disasters). In the Anthropocene,2 a juncture of prevailing economic globalization and planetary ecological crisis, those landscapes, places and territories in which ethnographic practice has always taken place, have thus returned to the research agenda from a different perspective: no longer ‘natural frames’ of the ethnographic enterprise, but social and symbolic constructs that are protagonists of social life on a local scale. For all indigenous, aboriginal and First Nations peoples, names of places are essential communicative tools; for these communities the names given to features in
2 The first attempt to include the Anthropocene among the geological eras, as the last drift of the Quaternary period, was made by Paul Crutzen and Eugene Stoermer (Crutzen and Stoermer 2000) who observed that since the industrial revolution, man has so profoundly transformed the Earth’s atmosphere by producing greenhouse gases and, in particular, CO2, that we must speak of a new era. This hypothesis, developed and formulated on the basis of a specific disciplinary reflection (atmospheric chemistry), was immediately placed in dialogue and dialectic with all the knowledge concerning humanity, involving history, as well as biology, economics and, of course, anthropology. The concept of the Anthropocene, while not finding a unanimous consensus among scholars and researchers dealing with environmental and ecological-political issues (Iovino 2020), has nevertheless initiated a dense debate on our ‘species impact’ on the planet and a series of interesting and promising critiques. These include Moore’s Capitalocene thesis, which argued that capitalism does not ‘have’ an ecological regime, but in fact ‘is’ an ecological regime, in the sense that capitalism is founded—also—on the subordination of nature in the broader sense, human and non-human, to the needs of wealth production and accumulation (Moore 2016).
168
E. Dall’Ò
the landscape help them to share traditional ecological knowledge (Berkes 1999) even in times of crisis. To do ethnography on communities, places and their related names can certainly enlarge the horizons of knowledge and the meanings of the discipline, for example, by focusing on some crucial and urgent themes, like disasters and the ecological and environmental emergencies (Dall’Ò 2019). In some regions of the world, as, for example, in the Andean regions of Bolivia (Boillat et al. 2013) or among Australia’s Aboriginal peoples (Koch and Hercus 2009) or even among Kaluli people in Papua New Guinea (Feld 1996), it is now common occurrence for the traditional ecological wisdom embedded in indigenous place names to be valorized and drawn upon in contemporary efforts to build sustainable and resilient communities. This has been particularly effective where communities and their landscapes have been threatened by environmental change (Jones 2016; Inglis 1993). Knowledge and understanding of places and the events that occur there (e.g. floods, rockfalls, overflows, river floods) are not learnt by local communities as phenomena separate from culture, reserved for ‘science’, but as a common heritage. On the contrary of what happens in Western societies, where the environmental threat is no less serious, but where traditional ecological knowledge has been seen as a poor relation to modern scientific data, and place names have lost their original meaning (Jones 2016; Radding and Western 2010). The environmental value inscribed in the ancient Alpine place names has been scarcely investigated, and its usefulness for the reconstruction of historical landscapes has not yet been exploited. Even less has their value for the present been recognized. Yet, by valuing the traditional ecological knowledge that place names contain, a dense body of ecological and climatic information that we have so far not exploited could become available to us again. Considering the study of toponymy in the Alps, and in the West in general, as a way to better understand the ecological wisdom of ancient mountain communities, would allow us to exploit it to implement the response to contemporary environmental challenges. Thus toponyms emerge to be like the most formalized and crystallized part of a ‘“local communicative competence’, and native knowledge, which plays a strategic role in connecting, even historically, human interactions with the environment. Toponyms are also ‘proper nouns’ of place, and, like proper nouns of person, they refer to a unique and only one subject: a referent. Modern linguistic theory attributes great importance to the aspect of proper nouns for whose meaning is ‘semantically undetermined’. In The Savage Mind, LéviStrauss noticed how proper names were a ‘special class of words’ possibly to become for the ethnographer an integral part for his research (Lévi-Strauss 1966). While the main focus of Lévi-Strauss’ interest was on kinship and totemic classification—which led him to reflect on those proper names of persons that are composed of animal and plant names or that come from kinship/relationship terms— he had already revealed, through his studies, an interchangeability or possibility of exchange and interaction between proper names and common names which might work in the case of toponyms as well. Indeed, Lévi-Strauss pointed out that the difference within them was not only of a linguistic nature, but rather cultural, ‘in the
9
Coping with Disasters: What Place Names Can Tell Us About Anthropocene. . .
169
way each culture shapes the real and through the variety of limits it [. . .] assigns to the work of classification’. In the same way, place names play a key role in the classification and meaning of the real and its relations to the environment. For LéviStrauss, the attribution of a name is the last act of a procedure of classification and signification carried out in a ‘space’, in a society of ‘named places’, which are real points of reference as between people within a group. If place and person names seem to be the point of semantic intersection between zoological and botanical ethno-taxonomies, ethno-geographies and so on and cover some peculiar features, then place names related to environmental hazards and disasters can indeed be considered as part of a system (or an ecosystem), a paradigm, through which and within which to read the territory and the environment (Dall’Ò 2019). The understanding of a vocabulary, if ‘shared’ by its community, has many chances of survival, and, if we consider the ‘natural’ risks and dangers that characterize a specific territory, this relationship appears even more essential. According to the cases and the languages we are dealing with, we can find less or more semantic transparency,3 in the sense of a greater or lesser flow of meanings. If this transparency and intelligibility are lost for historical, political or other reasons, the consequences can sometimes be dramatic. Losing the ability to ‘understand’, to ‘decipher’ the meaning of a name, in this case a place name, entails risks; by losing the memory of places, one also loses the ability to remember and understand the natural phenomena that characterize these territories. Place names can provide clearly marked points of reference in space, hubs, passages or boundaries that limit areas of different characteristics. All these features produce a dense weave that brings together social relations, historical memory and territory. During the time I spent in the field conducting my research, I was able, on several occasions, to collect some particularly illuminating examples of the relationship between place names and disaster memory.
9.2
An Ethnographic Case: La Saxe
Climate change and its consequences for Alpine communities have become a reference model, on a local scale, for talking about long-term disasters. In particular, with the melting of glaciers and permafrost (the permanently frozen layer of soil that holds mountain slopes together) due to global warming, we are witnessing complex scenarios of change and loss: from the loss of biodiversity—flora and alpine fauna (Losapio et al. 2021)—to soil impoverishment, to extreme climate events, such as water bombs, droughts, landslides, floods, overflows, which become more frequent
3
The Italian linguist Maurizio Gnerre claimed that transparency is a sign of continuity within humans, the world of non-humans living and the places where all humans and non-humans live, starting from water courses (Gnerre 2013).
170
E. Dall’Ò
year by year and which are progressively eroding the territory and generating far-reaching consequences on the communities that have to cope with them. The Valley of Aosta is characterized by a typical alpine landscape with arduous and steep mountainsides, and it is subject to several types of natural phenomena of erosion, flooding and avalanche. Names of places coined by speakers of old FrancoProvencal dialect, the language of the ancient inhabitants of the Valley of Aosta, which were planted on the landscape between ca. 550 and ca. 1100 A.D. survive albeit often in changed forms. The case of the Mont de La Saxe landslide concerns the dangerous mass of landslides on the two slopes of the mountain of the same name and the containment works—the rampart, the bypass of the Dora torrent from Val Ferret and the rockfall tunnel—built to protect the hamlets on the two slopes of the mountain: Entrèves to the east, and La Palud to the west, both tourist resorts with a high level of tourist traffic, located close to the municipality of Courmayeur and the Mont Blanc massif.
The M. de La Saxe landslide (east)
9
Coping with Disasters: What Place Names Can Tell Us About Anthropocene. . .
171
The M. de la Saxe rockfall barriers (west)
As the ancient place names suggest, and as it still partly appears today, the area must have had an aspect characterized by the presence of watercourses and marshy areas: ‘Entrèves’ is a very common place name in the Valley of Aosta and specifically indicates a place at the confluence of two watercourses: from the Latin Inter aquas, between [the] waters, where ève in francoprovençal—the Valle d’Aosta local patois—means water. In this case, the ‘waters’ are those of the Dora of Val Vény and the Dora of Val Ferret. La Palud instead derives its name from the Latin palus, meaning marsh, and owes its origin to a marshy area, probably drained in past times and today completely built up. The place name ‘Saxe’ is also interesting and revealing. It derives from the Latin saxum, stone, plural saxa, and gave its name to this small hamlet. The mountain of La Saxe has the appearance of a large, round, stony, barren boulder and is characterized by the phenomena of the crumbling of the slopes and the detachment of rock that had probably already taken place in Roman times. An ancient place name (Saxe), therefore, which in addition to describing its morphological—and perhaps phenomenal—characteristics, reveals its clear Roman origins. The area has been known since ancient times for the availability of precious metals and minerals, and in Roman times the presence of mines was a widespread feature. Today, one street, the ‘rue Trou des Romains’ (Street [of the] Hole of the Romans), is named after the characteristic appearance of the entrance to the ancient mines. It was along this street that, in 1927, during construction work, a Roman incineration tomb was discovered, which, thanks to the objects found inside, can be dated between the end of the first century BC and the middle of the following century. In fact, the tomb had yielded various ceramic materials, including an oil lamp and a precious and significant armilla (i.e. a bracelet) made of soapstone, a typical jewel of the Gallic Alpine parures. On the basis of the clearly Latin origin of the name of the village and on the basis of the chronicles by the historian Strabo on the fantastic gold mines coveted by the Romans—the well-known ‘aurifodinae’,
172
E. Dall’Ò
silver-lead mines probably already known and exploited by the Salassi natives before Rome and hypothesized to be in the area of Mont de La Saxe—it is very likely that a small settlement arose here as a result of the coexistence of Romans (mostly military) and the local population. The Mont de La Saxe area is currently in the news because of a major landslide phenomenon, which affects both4 the eastern and western sides of the mountain of the same name and has caused a series of difficult to manage and sometimes dramatic consequences in recent decades. The landslide on the western side is sadly known for a serious accident that cost the life of a French motorist in 2011, who was run over and killed by the detachment of a boulder that fell to the valley on the state road that connects the town of Courmayeur to the Mont Blanc tunnel. The road, Valle d’Aosta’s Statale 26, is the only alternative to the motorway to reach the tunnel and is, as we can imagine, a fundamental passage for the international movement of people, vehicles and goods from one country to another. The first rockfall officially dates back to the fatal accident on 2 January 2011, but unofficial information suggests that similar incidents, without consequences, have been occurring since the late 1990s, when a number of boulders broke loose from the eastern face of the mountain and rolled down into the valley, crossing the main road and ending up in the gardens and private plots of land of some houses located immediately below the road. In an interview,5 a local administrator recounted how, ‘inexplicably’, the locals had never alerted the authorities to these ‘dangerous finds’: ‘in La Saxe we had to intervene in two different cases, it was an impressive job, humanly very heavy for me. . . We had to clean up the slope along the main road, we had planned it, with the thawing and everything else, and we had to evacuate the inhabitants of the houses below, that was also planned. . . meetings, explanations, with people telling you that they have lived here for years and nothing has ever happened, and then you find out that boulders had already been found on all sides and that nobody had said anything’. In spite of the evident ‘risk’ and in spite of an increase in the number of detachment episodes in recent years due to an ever-increasing climatic instability involving the whole area subject to the landslide and accentuating the phenomenon, the population concerned had never felt the need to ‘alert’ the competent bodies in order to ‘protect themselves’ or their houses. One resident of the area ‘at risk’ said in an interview that ‘nothing has ever happened where I live, the rocks never reached the houses, they stopped much earlier or crumbled. They made a mess to evacuate everyone, but there was no need to do so’. Although the preparatory phase had been carefully planned, with planned evacuations and the creation of a replacement road system for the inhabitants of the
4
The landslide on both sides of the La Saxe mountain threatens the hamlets of Entrèves and La Palud, as well as the main road linking the village with the Mont Blanc tunnel and the village centre a little further down the valley. 5 Field interview with a local administrator P. D.
9
Coping with Disasters: What Place Names Can Tell Us About Anthropocene. . .
173
isolated villages, the greatest difficulties, says the mayor, came from the community of residents: ‘It was all very complicated to manage, and you go a bit by nose, because nobody tells you what to do. You plan everything [. . .] You get the impression that people don’t want to be rescued, they take a step backwards [. . .] if a catastrophic event happens, people welcome you with open arms, because they are in a state of need, but if you prevent it, you create annoyance, people see it as an intrusion’. As regards the eastern side, according to a study by IRPI,6 the Italian Research Institute for Hydrogeological Protection, this landslide is currently one of the most critical active landslide phenomena in the Italian Alps. Since 2009, the rock face has been constantly monitored by a network of four separate and independent systems that transmit data on the movement of the landslide in real time to the technicians of the regional government in Aosta, the main town, and is under observation by engineers and geologists from every corner of the world. When, in April 2014, the La Saxe landslide, which had already been in action for about 15 years, was suddenly and abruptly reactivated, causing thousands of cubic meters of rocks and earth to plunge down into the valley, the ‘great emergency’ was triggered: the fear of a sudden and very large collapse was so real that about one hundred people were evacuated from the two hamlets, who had to abandon their homes for a month and stay in a structure made available by the Courmayeur municipality. The La Saxe scenario more than 7 years after the crisis scenario, from a geological and physical point of view, appears unchanged. The detachments have come to a standstill, almost stopping completely during the construction of the rampart. The much-anticipated disaster did not occur. And this supported the current opinion that the work was an ‘exaggerated’, useless or harmful measure. The feared collapse did not occur, so there was no reason to intervene so heavily. That’s right, there was no collapse. At least not yet. According to studies conducted by the research team7 of the University of Milan-Bicocca (Crosta et al. 2011), led by Professor Crosta, it is not possible to predict what will happen in the short term. The landslide could ‘remain asleep’ (like a volcano) for decades, or it could awaken and run downstream in a few weeks, or worse, suddenly. What is certain is that climatic instability, climate change, makes collapse scenarios even more unpredictable. For example, it is now more difficult to calculate the amount and distribution of rainfall in the area, a phenomenon to which the landslide—which is periodically drained—is very sensitive. The landslide is a ‘vital element’ and reacts as such. ‘Water is essential: snow has a certain function. . . as does ice, or the intensity of rain. We can’t yet calculate the impact of a prolonged drought like this summer, or of a water bomb on Mont de La Saxe. With climate
6
http://www.irpi.cnr.it/project/la-saxe/ The team is part of the Department of Environmental and Land Sciences and Earth Sciences of the University of Milan-Bicocca. 7
174
E. Dall’Ò
change taking place, everything becomes less predictable, and yes, the risks of landslides are certainly increasing too’.8
9.3
Recurring Events
Remaining in the Mont Blanc area, where avalanches and landslides are very common, especially in winter, we can observe the presence of some other toponyms which we could define as ‘predictive’ of the phenomena which designate them, such as Lavanche, Lavanchey and Lavancher. In the patois, the French dialect of Valle d’Aosta, the word Lavèntsé means ‘the place where an avalanche slides’. The name lavèntse, avalanche, comes from Latin labina, landslide, landslip, from which the Italian term slavina derives.
Lavancher Hamlet in Morgex
8
Interview with Professor G. Crosta on 12 July 2017
9
Coping with Disasters: What Place Names Can Tell Us About Anthropocene. . .
175
Lavanchey Hamlet in Val Ferret
On the French side of Mont Blanc, in the Haute Savoie, the toponyms lavencher, lavanchy, lavanche and lavancheret are very common, and also the patronymic Lavanchy is widespread. In January 2021, following a thermal anomaly (sudden rise in temperature), an avalanche broke loose and fell on the village of Lavacher, whose name, as we can guess, records the occurrence of avalanche events, causing significant damage to the most recently built dwellings and sparing older ones. This phenomenon in itself is not unusual: almost every year a snow slide pours down the valley along a canyon; what appears abnormal is the period in which it happened (in January temperatures are normally well below zero) and the intensity of the phenomenon. As early as 1999, an enormous snow mass fell in the same area causing a victim and several injured. 40 acres of wood have been destroyed together with most of the more recent buildings. What happened in 1999, instead, due to a climate anomaly (an earlier daily snow melting followed by a refreezing of water at night) is that a very fast channel of slide, similar to a bob rink, was shaped. The avalanche, passing through it, accelerated reaching the frightening speed of 200 hundred km/h. It was not the snow but the powerful blow to slope down the village, cutting down two houses
176
E. Dall’Ò
while some other 20 buildings were damaged. Experts from the regional administration ascertained that the surface damaged by the effects of the aerosol was three times more extended than that one covered by the avalanche trail. The aerosol damaged and destroyed the most recent houses, which had been built during the economic boom period and located outside the perimeter of the ancient historical village. The oldest core of this village, the centre, whose houses had been built during the Middle Ages, suffered no damage in spite of the unusual strength of the aerosol. Glaciologists consider this fact as proving that the old dwellers of this area drew on the information of such prodigious data bank of people’s experience (Cerutti 2001). An atmospheric and climatic knowledge inscribed in names, in place names, perpetuated and improved from generation to generation that helped them to choose for their village a safer site that in no way could have been stroked either by the huge snow fall or by its devastating blow.
Lavancher Avalanche (2021)
Lavancher is a typical case in which a toponym records the geo-climatic memory of a rather habitual event by becoming fixed in the historical memory of the area. For hundreds of years, the inhabitants of this area had witnessed avalanches and had built and planned the life of their community, pastures and agricultural activities on the basis of the specific morphology of these places also based on meteorological and climatological observation. Although the Lavancher avalanche is a recurring event, to which the Alpine peoples even gave a place name in the past, and although this phenomenon still occurs with some regularity and causes damage, it seems to have left little trace in recent generations. Given the climatic unpredictability of the present time which characterizes the Mont Blanc area and which makes forecasts of snowfall, temperature variations and permafrost thawing uncertain, to name but a few, this area is nowadays much more exposed to the risks of events such as the avalanches of 2021 and 1999 and the consequences for inhabitants and their infrastructures.
9
Coping with Disasters: What Place Names Can Tell Us About Anthropocene. . .
177
It is no coincidence that near Lavancher, in an area of ancient debris and flooding, there is a municipality called Ruine. The words Rovéna, Rovine, Ruines and Rovinal come from Latin ruina (‘overthrow, ruin’), indicating a caving ground in presence of water, and are common toponyms in the Aosta Valley. The inhabitants have lost the memory of natural accidents in this area—due to the long return times of extreme weather events and to the linguistic opacity of older toponyms—and therefore do not consider the link with the original meaning of its name.
9.4
Saints and Holy Places
As the ancient maps and charts in the local archives record, some of the toponyms in this area are based on religious signs and symbols linked to the land by stone cuts or the use of apotropaic symbols, used to protect the house from disasters. These symbols, which have marked the area like a constellation, are evidence and memory of the historical interaction between ‘the sacred’ and the need to deal with vulnerabilities and risks. Rocks, slabs, wayside shrines and crosses, which especially in the past were used as markers of alertness and danger in the territory, are now becoming increasingly obscure (opaque) and only in a few cases survive while maintaining a sense of ‘sacred places’. It seems interesting to note that some ancient maps mark the use of the toponym ‘Bois banal’, banished forest (from Old French banir ‘to summon, to banish’), referring to a forest where access, grazing and wood gathering were forbidden. The role of these forests seemed to protect the villages below from the risk of avalanches and at the same time prevent excessive land consumption. Similar to what we know happened in Oceania, where some forests were declared ‘tapu’, sacred, taboo. Popular cults, pilgrimages and sacred spaces often reveal mechanisms through which communities protect and sacralize places and space. As Fabietti revealed, a ritual is always and in any case a way of relating to objects, spaces, places, materials: all things that make religious experience extremely concrete. These things, artefacts, even brute matter such as the earth of rocks, are what sometimes ‘precipitates’ the sense of religious practice, where the rite (gesture, prayer and vocation, handling elements of various kinds) makes religion, that is, makes it ‘concrete’, comprehensible and communicable to the very eyes of those who identify with it (Fabietti 2014). In this context, the approximately eight hundred chapels in the Valle d’Aosta built in the villages constitute a particularly significant heritage. After the Council of Trent, in relation to the Catholic Church’s need to affirm, in contrast to the Reformed Church, the legitimacy of the cult of the Virgin Mary and the saints but also in relation to the changed social and demographic conditions, there was a real proliferation of foundations, constructions and dedications of small sacred buildings, chapels, oratories and shrines dedicated to the Virgin Mary and the saints. Through these intercessors, communities invoked divine protection against disastrous events such as floods, avalanches and landslides. The local religious architectural heritage is
178
E. Dall’Ò
very rich, with numerous votive buildings, often located on the edge of inhabited centres, or near streams, avalanche gullies, or along landslide paths, or at the foot of glaciers. Very common, and very old, in particularly inaccessible places and along the steepest slopes of the Valdigne, in the Mont Blanc area, is the dedication of sanctuaries and chapels to Saint Defendente, a martyr saint of the Theban Legion, venerated throughout Italy as a protector against wolves and fires and in the Alpine valleys above all as a protector against avalanches, landslides and floods. On 2 January, the liturgical feast day of Saint Defendente, an evocative rite still takes place in Elevaz, above the municipality of Pré Saint Didier, in the Mont Blanc area, to invoke divine protection against avalanches. The saint of the Theban Legion was also venerated at Entrèves and also at the foot of Mont Blanc; at the base of the Brenva glacier in Val Vény stands the sanctuary of Notre-Dame de la Guérison, dedicated to the Virgin Mary. The first signs of worship date back to the sixteenth century, when a cross was placed on the spot where the sanctuary now stands, in a place called Berrier, a place name that in patois means rock, stone. Mountain dwellers used to stop there to pray and to invoke protection from avalanches, and the place became known as La Croix du Berrier. Interesting evidence of this interweaving of the sacred, death, devotion and protection from natural hazards are certainly the ex-votos: figurative chronicles, sometimes surprisingly detailed and circumstantial, which allow us to reconstruct the dynamics of certain events and disastrous phenomena that occurred over time. Paintings, canvases and objects depicting scenes of saints and Marian apparitions in the act of diverting watercourses and melting avalanches to protect villages and travellers are common. The Virgin’s thaumaturgical fame has made this sanctuary a very popular place of worship and the destination of hundreds of special ex-votos that completely cover its interior walls. Most of these were donated by mountaineers who, thanks to the intercession of the Madonna, managed to escape ‘certain death’. It is interesting to note that the Italian word superstite, which comes from the Latin superstes, refers to the one who survived, but also to the witness, in this case the witness of divine mercy. In the shrine there is, among other things, a silver model of the sledge of the first Italian expedition to the North Pole, led by Luigi Amedeo di Savoia, which reached the highest Arctic latitude of 86° 33′ 49″ on 25 April 1900. The veterans brought it as a gift on their return from the extreme parallel to NotreDame de la Guérison, invoked as a protector during the dangerous expedition. The sacred place, here, this ‘frontier’ between the glacier (a dangerous, uncertain, threatening place) and society (the place of the living, of activities, of culture) connects and reconnects the local meanings—historical and anthropological—of religious experience with the practices through which religion is ‘made’.
9
Coping with Disasters: What Place Names Can Tell Us About Anthropocene. . .
9.5
179
Conclusions
A central theme for anthropology dealing with disasters is that of invisibility, invisibility that does not only refer to the inability to ‘see with one’s eyes’ a threat but concerns the impossibility of having a cognitive perception of it, similar to what we have seen happen with ancient place names, which while recording the memory of an event are no longer useful for communities involved. Also the scientific and media narratives on the effects of climate change are dealing with invisibility: the ‘great derangement’ or ‘blindness’ that Amitav Ghosh (2017) warns us about is echoed by the intrinsic invisibility of the very object of our research which, perhaps precisely because it is ‘global’, seems not only to escape an overall view but also to evade any attempt to grasp it. Climate change is not a one-off event; it does not manifest itself as an upheaval of the present, but is rooted in deep time (McPhee 1981). Although climate change generates evident impacts and consequences, its characteristic of being an event of long duration, i.e. articulated on time scales that go beyond the limits of our existence, eludes immediate perception: the melting of Arctic glaciers, the extinction of exotic species, changes in the composition of the atmosphere, the flow of sea currents, the disappearance of coral reefs—these are phenomena that are beyond our perceptive reach, and however much we are told and described about them, we do not have the capacity to imagine them, to make them real. The Anthropocene, Haraway notes, is real, as are its implications, including the current ‘immense, irreversible destruction’ that is taking place not only for the eleven billion people who will inhabit our planet by the end of the twenty-first century but also for a whole host of other creatures (Haraway 2015). On a local scale, in mountain contexts, where the history of climate and place is rooted in the memory of the lived territory—even in that of place names—we have the opportunity to give voice to traditional knowledge, knowledge which can also tell us something about the climate of the past, about vulnerability and about how the inhabitants coped with it. Not only that, but we have the opportunity to question these place names, to make them less opaque and to use them to learn how to read and to understand the territory and the challenges of the present.
References Arias-Maldonado M (2020) Bedrock or social construction? What Anthropocene science means for political theory. Anthr Rev 7(2):97–112 Augé M (2009) Nonluoghi. Introduzione a una antropologia della surmodernità. Elèuthera, Milano Barca S (2018) L’Antropocene: una narrazione politica, “IAPh Italia”. http://www.iaphitalia.org/ stefania-barca-lantropocene-una-narrazione-politica/ Berkes F (1999) Sacred ecology: traditional ecological knowledge and resource management. Taylor and Francis, London Boillat S, Serrano E, Rist S, Berkes F (2013) The importance of place names in the search for ecosystem-like concepts in indigenous societies: an example from the Bolivian Andes. Environ Manag 51(3):663–678. https://doi.org/10.1007/s00267-012-9969-4
180
E. Dall’Ò
Cerutti AV (2001) Meteorologic situation, elevation of the iso-therm 0 °C and the avalanches in the Western Alps during February, Geografia Fisica e Dinamica Quaternaria, V Crosta G, Broccolato M, Cancelli P, Tamburini A, Alberto W (2011) Tecniche di rilievo e monitoraggio della frana di Mont de La Saxe (Courmayeur, AO). “Innovazione tecnologica nell'ingegneria geotecnica” Associazione Geotecnica Italiana, 625–632 Crutzen PJ, Stoermer EF (2000) The Anthropocene. In IGBP Global Change Newsletter, p. 41 Dall’Ò E (2019) I draghi delle Alpi. Cambiamenti climatici, Antropocene e immaginari di ghiaccio, pp. 177–197, in Gugg G, Dall’ÒE, Borriello D (a cura di), Disasters in popular cultures, Il Sileno Edizioni, Rende Dall’Ò E (2021) Cambiamenti climatici, ghiacciai, pandemie. L’importanza di uno sguardo multidisciplinare tra dati climatici, zoonosi e pandemie, “AM Rivista della Società italiana di antropologia medica” n° 51, giugno 2021 Douglas M (1996) Rischio e colpa. Bologna. Il Mulino. Ed or. [1992], Risk and blame. Essays in cultural theory, Routledge, London-New York Douglas M, Wildavsky A (1982) Risk and culture: an essay on the selection of environmental and technological dangers. University of California Press, Berkeley Fabietti U (2014) Materia sacra. Corpi, oggetti, immagini, feticci nella pratica religiosa. Raffaello Cortina editore, Milano Feld S (1996) Waterfalls of song. An acoustemology of place resounding in Bosavi, Papua New Guinea. In: Feld S, Basso KH (eds) Senses of place, School of American Research, Santa Fé, pp 91–135 Ghosh A (2017) La Grande Cecità. Il cambiamento climatico e l’impensabile. Neri Pozza Editore, Vicenza Gnerre M (2013) La saggezza dei fiumi: miti, nomi e figure dei corsi d'acqua amazzonici. Meltemi, Roma Haraway D (2015) Anthropocene, Capitalocene, Plantationocene, Chthulucene: making kin. Environ Humanit 6:159–165 Hulme M (2009) Why we disagree about climate change? In: Rowcliffe N (ed) The carbon yearbook: the annual review of business and climate change. ENDS, London Inglis JT (1993) Traditional ecological knowledge: concepts and cases. Canadian Museum of Nature, Ottawa, ON Iovino S (2020) Il chewing gum di Primo Levi. Piccola semantica della resistenza al tempo dell’Antropocene. MLN 135(1):231–254 Jones RLC (2016) Responding to modern flooding: old English place-names as a repository of traditional ecological knowledge. J Ecol Anthropol 18:9 Koch H, Hercus L (2009) Aboriginal placenames: names and re-naming the Australian landscape. Australian National University, Canberra Levi C (1945) Christ stopped at Eboli. Penguin, London Lévi-Strauss C (1966) The savage mind. The University of Chicago Press, Chicago, IL Ligi G (2009) Antropologia dei disastri. Roma, Laterza Losapio, et al. (2021) Front Ecol Evol, 29 January 2021 https://doi.org/10.3389/fevo.2020.616562 McPhee J (1981) Basin and range, “annals of the former world”. Farrar, Straus & Giroux, New York Moore JW (2016) Anthropocene or Capitalocene?: nature, history, and the crisis of capitalism. PM Press, Oakland Radding L, Western J (2010) What’s in a name? Linguistics, geography, and toponyms. Geogr Rev 100:394–412 Tallè C (2016) Sentieri di parole. Lingua, paesaggio e senso del luogo in una comunità indigena di pescatori nel Messico del Sud. SEID Editori, Firenze Tilley C (1993) Space, place, landscape and perception—phenomenological Perspectivesx. In: Tilley C (ed) Phenomenology of landscape: places, paths and monuments. Berg, Oxford, pp 7–34 Van Aken M (2020) Campati per aria. Eleuthera, Milano
Chapter 10
Climate Change and the Rising Disaster Risk in Africa Gatkuoth Kai Bol and Dewald van Niekerk
Abstract Climate-related disasters have been on the rise in Africa. Amidst changing climate, when a climate-related disaster strikes, media, scientists, practitioners and policy makers alike are quick to attribute such an event to climate change, even in absence of scientific evidence. Yet, in an increasingly urbanized world, it becomes extremely difficult to delineate development-induced vulnerability and influence of climate change. Furthermore, making political statement and decision without evidence politicises climate change, and this does not only undermine effective management of disaster risk but also impedes countering climate change itself. Marked by exponential rise in Earth’s surface temperature since 1850, climate change has been a subject of intense debates in recent years. Anthropogenic greenhouse gases— mainly carbon dioxide, water vapour, methane (CH4), nitrous oxide, chlorofluorocarbon and ozone—have created imbalance in earth’s energy equilibrium. This is because, on one hand, the gasses trap infrared heat from the earth’s surface in the atmosphere while, on the other, allow the planet earth to receive more solar energy than it emits. Climate change sceptics do not agree and have asserted that greenhouse gases are not enough to cause climate change and that the increase in solar output has been the major contributing factor for the rise in global temperature. Others are sceptical of the existence of climate change itself. However, there is overwhelming evidence that climate change is due to anthropogenic greenhouse gases’ concentration in the atmosphere. Similarly, there is no evidence that climate change is due to increased solar output. Instead solar output has remained fairly the same since 1880. Consistent with climate change, climate hazards have increased fivefold between 1970 and 2010. However, it is argued that the most recent rise, globally, in climaterelated hazards might be due to natural climate variability. Yet, it becomes
G. K. Bol (✉) · D. van Niekerk African Centre for Disaster Studies, Unit for Environmental Sciences and Management, North-West University, Potchefstroom, North-West, South Africa © The Author(s), under exclusive license to Springer Nature Switzerland AG 2023 S. D’Amico, F. De Pascale (eds.), Geohazards and Disaster Risk Reduction, Advances in Natural and Technological Hazards Research 51, https://doi.org/10.1007/978-3-031-24541-1_10
181
182
G. K. Bol and D. van Niekerk
increasingly difficult to distinguish between climate-related disasters attributable to climate change versus natural climate variability. Similarly, distinction has to be made between development-induced vulnerability and climate change. In an attempt to understand climate change-disaster risk nexus, interest in event attribution science has witnessed unprecedented growth. A study on attribution of climate change to the severe urban flooding in Dakar in 2012 generated mixed, yet important views among the respondents. Other studies conducted in Africa could not yield conclusive results. Whereas it is extremely difficult to relate events to climate change, lack of data in many African countries further contributes to poor understanding of climate change-disaster risk nexus. This chapter will examine disaster risk-climate change nexus in Africa and analyse trends in disaster risks amidst changing climate, based on available disaster statistics for the last century (1920–2019). In the wake of politicisation of climate change, where almost every single climate event is blamed on climate change, the authors will analyse disaster events in juxtaposition with climate change data and assess other non-climatic factors such as developmentinduced risks and vulnerability to make informed analysis on climate changedisaster risk nexus in Africa. Keywords Climate change · Disasters · Africa
10.1
Climate Change
Chaos and ingenuity best describe life and survival of humankind on the planet earth over the past millennia. Amidst turbulent climate and geological processes (Burroughs 2005; Brown 2001), species that existed since the beginning of life on earth 600 million years ago had to grapple with treacherous environmental conditions (Burroughs 2005), as many had undergone extinctions due to climate change or geological processes (Desonie 2008). Due to the latest sudden rise in the earth’s surface temperature since the 1880s, fears abound of prospect of another extinction of species on earth (IUCN 2019). The sudden and ongoing warming of global climate is engendered by increase in anthropogenic greenhouse gases in the atmosphere (IPCC 2012, 2015, 2018). The anthropogenic climate change, particularly greenhouse effect, has been subject of intense debates since the 1990s (Desonie 2008). There are still those (sceptics) who question the notion that the unprecedented warming of the earth’s surface temperature was due to anthropogenic influence. In contrast they (sceptics) argue that the current warming was due to increased solar output (Emanuel 2016; Pittock 2009). However, this argument was found to be unsubstantiated as there is existing evidence that proved that variations in solar output do not explain the ongoing unprecedented warming (Emanuel 2016). Whereas there was evidence that variations in solar outputs had caused climate change in the past, this does not seem to explain the current warming, and in contrary, there has been slight decrease in solar output since the 1980s (Emanuel 2016) (Fig. 10.1).
10
Climate Change and the Rising Disaster Risk in Africa
183
Fig. 10.1 Temperature vs solar activities. Source: NASA. The graph compares changes in global surface temperature, depicted in red, with amount of solar energy Earth receives, depicted in yellow, since 1880 through 2020. The lighter and thinner lines show the level of yearly solar variation, and the thicker yellow line shows the average 11-year Sun’s natural cycle
The solar output, as can be seen from the above graphical presentation, despite small ups and downs, followed the Sun’s 11-year natural cycle. In the same graph, the Earth’s surface temperature has been on the rise (NASA 2021) despite normal solar output. Conversely, as can be observed from the graphical presentation above, there was a decrease in global temperature between 1964 and 1975 that made the sceptics of the anthropogenic-induced warming to euphorically believe that the decreased temperature during that period contradicted the case for anthropogenicinduced warming (Spier 2008, in Baum et al. 2012). Yet the decrease in the temperature in that period was due to increase in level of sulphur in the atmosphere as a result of rapid industrialization following World War II (Stern 2005 in Baum et al. 2012). Cognisant of the warming climate and related impacts, a number of measures have been formulated. Founded in 1992 and comprised of 197 parties, the United Nations Framework Convention on Climate Change (UNFCCC) was established to support global response to combating climate change (United Nations 1992). This was followed by Kyoto Protocol with the aim to stabilise concentration of atmospheric greenhouse gases to level that is not dangerous to climate systems (United Nations 1998). Despite the successes made in implementation of the Kyoto Protocol,
184
G. K. Bol and D. van Niekerk
the Protocol faced serious setbacks as some of the high emitters such as the United States were not signatories (Viola 2016). Another major setback was exemption of developing countries from the emission caps (Viola 2016). Conscious of the flaws associated with the implementation of the Kyoto Protocol, in 2015, the Paris Agreement on Climate Change was signed by the United Nations Member States, with the aim to undertake efforts to limit average global temperature’s increase to 1.5 °C above pre-industrial levels and, at worst, restrain the increase in the global average temperature to 2 °C above pre-industrial levels (United Nations 2015a). By 2021, one hundred ninety-four (194) member states of the United Nations plus (1) the European Union ratified the Paris Agreement (United Nations 2021). The Paris Agreement recognises the need for effective and progressive responses to the imminent threat posed by anthropogenic climate change (United Nations 2015a) and calls for urgent actions that will lead to attainment of a net-zero emissions by 2050 (United Nations 2021). Attaining a net-zero emission means that no additional emissions of the greenhouse gases will be accumulated in the atmosphere as the continued limited emissions of greenhouse gases are to be absorbed by the climate systems (Pontoire 2020). However, achieving net-zero emissions would require that countries commit to submit and implement, every 5 years, Nationally Determined Contributions (NDCs) (United Nations 2015a). The NDCs are twofold. Firstly, countries are to communicate NDCs that should outline how they will mitigate anthropogenic climate change, towards the path of net-zero emission by 2030 (United Nations 2021). Secondly, countries are also required to implement their NDCs every 5 years, to build resilience to climate change (Pontoire 2020). While the Paris Agreement has been described as “substantial beginning toward a net-zero world” (United Nations 2021), it has potential flaws (Viola 2016). Viola summarised the key flaws. First, the NDCS are voluntary, and each country may decide not to report its NDCs as there are no accountable mechanisms that can be applied to compel a party to commit to NDCs. Second, even at an unlikely scenario that the NDCs were fully implemented, average global temperature would still increase by 3 °C. Third, the agreement did not make strong reference to ending fossil fuel subsidies and effectively avoided mentioning establishment of national taxes on carbon to fasten transition to low-carbon economy. Fourth, an initial version of the accord that had proposed to reduce total emission of greenhouse gases between 70% and 90% was replaced with rather loose and reluctant clause—“as soon as possible”. Fifth, emerging middle-income countries reject the notion of transferring resources to poor countries. Sixth, the agreement lacks robust reporting system as some countries argue that imposing a monitoring and reporting system would be an invasion of sovereignty. And, seventh, although the agreement committed developed countries to provide finances for adaptation and mitigation, there is some level of vagueness to what this constitutes as the agreement could not further define what that means, Viola concludes. The vagueness in defining the climate finance would mean that developed countries will then define at their own terms what constitutes a good project and then decide whether to finance it or vice versa (Stensrud 2016).
10
Climate Change and the Rising Disaster Risk in Africa
185
Despite its shortcomings, the Paris Agreement is better than no agreement (Clemencon 2016). Therefore, the need to restraining the increase in average global temperature (AGT) and attaining net-zero emission is welcome and urgent. However, in order to achieve the net-zero emissions of greenhouse gases and build resilience to anthropogenic climate change, substantial investments and implementation of climate change mitigation and adaptation to the impacts of anthropogenic climate change are prerequisite to achieving the goal of the Paris Agreement (United Nations 2015a).
10.1.1
Climate Change Mitigation
Climate change mitigation refers to actions that reduce or prevent emission of greenhouse gases (UNEP n.d.), either by reducing sources of the gases or by enhancing the sinks that absorb the gases (NASA n.d.). Climate change mitigation is a key aspect of the Paris Agreement, which is a critical pathway to attaining the net-zero emissions (United Nations 2021). The Paris Agreement, unlike the Kyoto Protocol that put burden of reduction of emissions of GHGs to the developed nations—rightly so because they are mainly responsible for the anthropogenic greenhouse gases’ concentration in the atmosphere—requires all parties whether developed or developing to develop their emission reduction ambitions (United Nations 2015a). Whereas inclusion of the developing countries in the emission caps is important to ensure proportional responsibility sharing in mitigating impacts of climate change, this aspect of the Paris Agreement makes climate change process very political—fitting countries in global north and south against each other. The countries of the “global north are seen to be pushing for climate change agenda to discourage fossil fuel producing countries, mostly in the ‘global south’ from using their fossil fuel to develop their economies” (Clemencon 2016). After polluting the world and impoverishing the colonised others, particularly in Asia and Africa (Merchant 2021), the countries in the greater north remain unaccountable for their colonial past (Beslik 2019).
10.1.2
Adaptation
Climate change adaptation refers to actions that strengthen resilience and reduce vulnerability to climate change (United Nations 2015a) and involves adjusting to actual or expected future climate (NASA n.d.). Ongoing climate change adaptation discourses have generated intense discussions among academics and policy makers alike. Arguably, adaptation being wrongly driven by political elites and natural sciences missed out the people (Pelling 2011). Instead, it needs to be re-politicised to become apolitical, transformational and multidisciplinary (Klepp and Chavez-Rodriquez 2018). Observations such as those expressed by Pelling and
186
G. K. Bol and D. van Niekerk
Chavez-Rodriquez are informed by current top-down and reductionist’s approaches to climate change adaption that are being perceived to assume what the “people” want, including by negotiating on their behalf in global discourses. As the elites monopolise climate change discourses, they then frame adaption in relation to vulnerabilities from political lenses—by framing all vulnerabilities as climatechange driven, even though they could be driven by other socio-economic factors (Klepp and Chavez-Rodriquez 2018). Such dangerous misrepresentation and politicisation of adaption mean that other drivers of vulnerabilities are left unattended. Further politicisation of adaptation is also observed in the global north-global south divides with regard to the climate change politics. On one hand, adaptation is heavily favoured by developing countries, mainly from the global south, while on the other hand, industrial countries, mainly from the global north, are expected to lead in mitigation by reducing their emission targets (Newell and Bulkeley 2010) and to take responsibility for contributing to paying adaptation costs in developing countries (United Nations 2015a). As stipulated in the Paris Agreement, developed nations are committed by the agreement to pay 100 billion United State Dollars to developing countries (United Nations 2015a). However, developed nations, despite making commitments for financing mitigation and adaptation in developing countries, have “failed to help poor countries fight climate change, as the rich nations missed the 100 billion deadline” (Harvey 2020). Where some funds were provided, they were largely misallocated and implemented as per the donors’ terms (Sikhakhane 2019). Another characterisation of the north-south divides is the use of “vulnerability” against developing countries to adopt developed nations’ narrative on climate change. Vulnerability, from the perspectives of the developing countries mostly, those generating fossil fuel, is perceived as a tool being used by the developed nations to force developing nations to abandon fossils fuel, with pretext that “climate change will affect vulnerable and poor nations the most” (IPCC 2012). As such, “the west is now using climate change to make Asia and Africa once again carry the white man’s historical burden” (Merchant 2021). Merchant’s concerns are shared among many developing countries who fear that the countries in the global north, having technology, will soon transition towards cleaner future—forcing the countries in the global south, particularly those with huge untapped hydrocarbon, to abandon fossil fuel and put their “development objectives in jeopardy” (Jakob and Steckel 2014). Unless there are incentives that propel developing countries to do otherwise, the developing countries will engage in anything, whether it generates tons of CO2 or vice versa, to address immediate needs of their populations and ensuing vulnerabilities (International Energy Agency 2010). Whereas developing countries could leapfrog certain technologies towards sustained growth, however the cost-benefit of such leapfrogging must be in the favour of the developing country; otherwise, it will not be adopted, for example, electric cars, which are expensive and do not serve the immediate needs of the poorest. Besides mitigation and adaptation politics, the success of the Paris Agreement will be determined by not only regularly updating and implementing the NDCs but
10
Climate Change and the Rising Disaster Risk in Africa
187
also an agreement on loss and damage emanating from the impacts of climate change.
10.1.3
Loss and Damage
The Warsaw International mechanism for loss and damage arising from anthropogenic climate change’s impacts, including extreme climate events and slow-onset impacts, was set up to address impacts of the anthropogenic climate change in developing countries (United Nations 2015a). The agreement was reached in Warsaw, Poland, in 2013 by the parties to the UNFCC. The agreement recognises that loss and damage arising from adverse impact of climate change may not be addressed by adaptation actions (United Nations 2014). Furthermore, the Paris Agreement recognises the adverse impacts of climate change and need to reduce loss and damage arising from the climate change (United Nations 2015a). However, industrial nations during Paris Agreement negotiation ensured that inclusion of loss and damage in the Paris Agreement implied no liability to them nor holding them accountable for the damage or potential compensation to the developing countries (United Nations 2015a). As such, the “Paris Agreement failed to meet the people test as it shies away from addressing justice to those affected by climate change and, instead, reinforces the “no basis for any liability or compensation” (Stensrud 2016), even when more developing countries have reportedly been bearing the brunt of impacts of climate change, driven mainly by the developed countries (IFRC 2020). Paradoxically, some developed nations are seen pushing for climate change agenda while behind the scene are involved in dubious fossil fuel business, as being witnessed in Mozambique (Cholteeva 2020). This moral dilemma in responding to climate change (Bunzl 2015) in an unequal world (Newell and Bulkeley 2010) would likely leave developing countries with no other options but engaging in risky endeavours to do what the early industrial nations did—by polluting their parts (Merchant 2021). Among the developing countries, the current impacts of climate change are not as bad as prevailing underdevelopments and related crises. Certainly, if one were to be given a choice either to die instantaneously or 50 years later, the latter will prevail. As required by the Paris Agreement, the emission reduction will significantly impact fossil fuel countries who “risk losing entire swathes of their economies’ production capacities, and thus their wealth” (Robinson et al. 2021). Armed with high-tech technologies, developed nations are set to develop green energy sources, electric vehicles inter alia, for imports and exports. Consequently, developing fossil fuel-producing states would find it difficult to sell their fossil fuel supplies since they do not produce fossil fuel-consuming vehicles and technologies. Hence, they will be forced to stop their oil production. Consequently they will depend perpetually on their new masters—the greener nations to imports green technologies, which are very expensive compared to fossil fuel sources (International Energy Agency 2010).
188
G. K. Bol and D. van Niekerk
This perception may be one of the most dividing realities that would undermine the gains made in climate change processes and ultimately derail the world order. Without frankly discussing these perceptions and fears through a transparent dialogue on the loss and damage, three possible avoidable scenarios abound. Scenario I—two worlds apart. The developing nations, mostly the fossil fuelproducing states in one side, engaging in fossil fuel production and redoubling their efforts to advance fossil fuel-consuming technologies to power their economic developments. On the other side of the spectrum, developed or early industrialised nations engraving in their “greener and healthier” development and encouraging trade among themselves. There may also be hybrid situation in which some industrial or developing nations joining the either side of the bipolar world. Scenario II—Abandoning climate change process. With either world deeply entrenched in its world view, there is a risk of a bitter divorce and desolations of the climate change agreements. The world would be set to freely dive into unstoppable climate crisis. Scenario III—Survival of the fittest. At this stage the world order that humanity has been investing in for considerable amount of time may be grossly undermined. At such a stage of disunity, the strongest would manipulate the weak, including possibility of returning to world wars, colonisation or vice versa. All the scenarios are akin to “fog is democratic” where a bystander, a producer or profiteer, all will be affected sooner or later (Beck 1992: 36). Hence, making climate change a political game fitting developing countries against those in developed countries or the global north and global south further complicates finding workable solutions for the climate crisis (Newell and Bulkeley 2010). While focusing on who pays in financial terms as per responsibility in emission is important, however, it also raises a similar question on who pays in failure to govern risk, for example, marginalising section of communities—making them vulnerable to disasters (Newell and Bulkeley 2010). Blame games aside, developed nations should show moral responsibility to lead the world by stopping carbon emission and financing mitigation and adaptation as well as losses and damage in developing countries. Developing countries must do their parts, including using petrodollars to quickly transition to greener future and demonstrating use of petrodollars responsibly and stopping oil curse. Both the developed and developing countries must engage in an inclusive and risk-informed development and effective disaster risk management efforts to counter the growing climate and disaster risk.
10
Climate Change and the Rising Disaster Risk in Africa
10.2
189
Disaster Risk
Disaster risk is a function of hazard, exposure, vulnerability and lack of coping capacity (UNDRR 2017). If the four elements (hazard, exposure, vulnerability and lack of coping capacity) interact, they could potentially cause loss, injury or damage to life, livelihoods or asset, a system, a community or a society in a given period of time (UNDRR 2017). This characterisation of disaster risk is not a complete departure from the early concept of risk. Early definition of risk puts emphasis on “perception of loss potential associated with interrelationship between among humans and between humans and their natural (physical), biological, technological, and behavioural environments—precisely described as interactions between humans and risk environment” (Hood and Jones 2004). There is a great deal of detail and simplicity, albeit, to some extent, complexity in the earlier definition of risk. The natural, biological, technological and behavioural elements signify hazard in the risk environment. However, this classification can also become complex as behavioural element of the risk environment could represent exposure, vulnerability and coping capacity. Similarly, the interaction between behavioural and technological elements could also produce a hybrid hazard (socio-technical). Whereas it may appear straightforward, the financial element of the risk environment may not only represent vulnerability and coping capacity but also exposure. The element of risk environment is worth explaining to better understand the disaster risk context. First, the hazard. Hazard can be a “process, phenomenon or human activity that causes loss of life, injury or other health impacts, damage to property or social and economic disruption or environmental degradation” (UNDRR 2017). Precisely, hazard is a “phenomenon or circumstance capable of or perceive to cause harm or costs to human society or environment” (Hood and Jones 2004). Hazards can be natural (physical), technological, behavioural (terrorism), biological and technological (Hood and Jones 2004) or broadly as anthropogenic and natural or further divided into geological (geophysical), hydro-metrological, biological, environmental and technological (UNDRR 2017). Whereas social hazards such as burglary and terrorism were articulated in Hood and Jones’ Hazards category, UNDRR excludes hazards arising of “human behaviour such as conflict or related social instability, which should be determined by national legislations or subject to interpretation by the international humanitarian laws” from the list of hazard-causing disasters (UNDRR 2017). However, the exclusion of social hazards from the list of hazards in the Sendai Framework portrays a rather political interpretation of risk, which undermines scientific autonomy. While the exclusion of some hazards tends to respect boundary of institutions dealing with conflict, it does not cause harm in any way to include social hazards as they, in principle, cause harm and cost to societies. A word of caution in interchangeably interpreting hazards and disasters. Hazards are not disasters; hazards are inevitable but they do not necessary lead to harm or cost to a society. Exposure, if combined with vulnerability or coping capacity, may determine whether or not hazards may result in harm. Exposure is a condition of
190
G. K. Bol and D. van Niekerk
people, infrastructure, housing, production capacities and other tangible human assets located in hazard-prone areas (UNDRR 2017). Hazard exposure may not result in harm or cost to a society. In a situation where people and assets are exposed to hazards, it may be dependent on level of vulnerability and coping capacity for the exposed to experience harm or a disaster. Vulnerability refers to “conditions, determined by physical, social, economic and environmental factors or processes which increase susceptibility of individual, a community, assets or systems to impacts of hazards” (UNDRR 2017). The opposite side of vulnerability is resilience, which refers to “the ability of a system, community or society exposed to hazards to resist, absorb, accommodate, adapt to, transform and recovery from effect of a hazard in a timely and efficient manner, including through preservation and restoration of essential basic services and functions through risk management” (UNDRR 2017). In a broader sense, some component of resilience may include coping capacity. Coping capacity encompasses ability of people, systems or organisations to manage adverse conditions, risk or a disaster. Coping capacities include awareness, resources and leadership for risk management during peacetime, during emergency or in an event of a disaster (UNDRR 2019). Over the years, international efforts have been undertaken to address the elements of the risk environment to build resilience, i.e. reducing exposure and vulnerability and strengthening coping capacities. In 1979, the United Nations established International Framework of Action for the International Decade for Natural Disaster Reduction (IDNDR) (UNDRR 2019). The successes of the IDNDR would result in the Yokohama Plan of Action for a Safer World (1994–2004); Hyogo Framework for Action: Building Resilience of Nations and communities to disasters (2005–2015); and the Sendai Framework for Disaster Risk Reduction (2015–2030). The Sendai Framework for Disaster Risk Reduction broadens scope of hazards in natural, technological and biological categories and places greater emphasis on small, large, slow or sudden-onset disasters (United Nations 2015b). The Sendai Framework’s expansion of hazards and recognition of systemic nature of risks within the context of development are key to strengthening coherence among Sendai Framework and the other post-2015 frameworks. The other post-2105 frameworks include the Paris Agreement on Climate Change and Sustainable Development Goals. Whereas the Sendai Framework has adequately addressed most of the hazards, it is widely criticised of choosing politics over science when it comes to climate change. Its exclusion of climate change from the disaster risk management process in pretext of avoiding political boundary missed an opportunity in addressing vulnerability in a comprehensive manner (Kelman 2015).
10
Climate Change and the Rising Disaster Risk in Africa
10.3
191
Climate Change’s Impacts on Disaster Risk in Africa
Africa was chosen for this study for several reasons. First the authors are seasoned experts in disaster risk management who have been implementing disaster risk management programmes on the continent for decades. By virtue of their work on the continent, the authors found it easier to limit the study to Africa as they would find it easier to access wide ranges of data in comparison to the other continents. Second, observing first-hand the rising disaster risk across the continent, the authors took keen interest in understanding the drivers of the rising disaster risk as they observed what they referred to as a “neo-normal disaster risk paradigm” in Africa. The neo-normal disaster risk paradigm is referred to, by the authors, as a state of affairs in which occurrence of disaster events appears to be “normal” in a sense that rising disaster risks and associated disasters appear to be a normal part of daily life in many African communities. In the neo-normal disaster risk paradigm, disaster risk has been on the rise. However, actions to address the rising risk are undertaken as if everything is normal. The authors, then, interrogate the extent to which climate change might have been driving the rising risk on the continent. Across the continent, disasters related to weather and climate have been on the rise (African Union 2020). Similarly, globally, climate-related disasters have also been on the rise since 1970 (UNDRR 2019). Whether the changing trends of climate-sensitive disasters can be attributable to anthropogenic climate change or vice versa has generated important scientific debates. Despite the rise in AGT, increase in exposure of people and assets to hazards in recent years is argued to be the main cause of increasing disaster trends and impacts (Visser et al. 2014). It is argued that the most recent rise, globally, in climate-related hazards such as head waves, cyclones, droughts, floods and wildfires among others might be due to natural climate variability (IPCC 2015). However, it becomes increasingly difficult to distinguish between climate-related disasters that might be attributable to anthropogenic climate change and those that might be blamed on natural variability. In an attempt to address the growing concerns over the influence of anthropogenic climate change on climate-sensitive disaster risks, interest on event attribution science has witnessed unprecedented growth (Seneviratne and Zwiers 2015). Consequently, a number of event attribution studies in Africa have been undertaken in recent years. In Senegal, a study on attribution of anthropogenic climate change to the severe urban flooding in Dakar in 2012 was conducted and generated mixed, yet important views among the respondents (Young et al. 2019). When asked on the possible attribution of anthropogenic climate change to the flooding, majority of the respondents believed that the flooding was due to anthropogenic climate change. However, other respondents cautioned that attributing a single event to anthropogenic climate change may be difficult (Young et al. 2019). Similar study on influence of anthropogenic climate change on the Ethiopia’s severe drought in 2015 could not establish a link (Philip et al. 2018). What then is driving the rising disaster risk on the continent over the past decades?
192
10.3.1
G. K. Bol and D. van Niekerk
100 Years of Climate-Related Disasters in Africa: 1920–2019
The past 100 years in Africa witnessed increased climate-related disasters (Université catholique de Louvain 2020). Climate change and development-linked factors are seen as major drivers engendering the rising disaster trends (African Union 2020). However, distinguishing development-induced risks from anthropogenic climate change risks is key to understanding impacts of climate change on the rising climate hazards and related disasters in Africa. Yet, obtaining comprehensive data to inform such analysis is extremely difficult, particularly in Africa (African Union 2020). Across the continent there is a widespread inadequate data collection and management capacity in many African states (African Union 2020). Where such data exist, it is usually incomplete and may be difficult to make significant scientific conclusions. Nonetheless, ongoing efforts by the African Union and United Nations Office for Disaster Risk Reduction in supporting member states in Africa to report on the Sendai Monitoring online platform are making significant improvement in reporting by the member states. While improvement in reporting in the Sendai Monitor has been observed, most data related to disaster losses remain, to large extent, incomplete (African Union 2020). However, for the purpose of this analysis, some international databases that store significant amount of data on disaster losses and climate change were consulted. The data for climate-related disasters and average global temperature for the past 100 years covering 1920–2019 has been obtained from EMDAT and NASA databases. The 100-year data was classified into 10 decadal time series for ease of analysis. In tandem with the decadal time series, AGT for the similar period has been presented in adjacent column. The decadal time series and AGT on one hand and the climate disaster events and resultant impacts on the other hand were then analysed in juxtaposition (Table 10.1).
Table 10.1 Analysis of climate-related disasters in tandem with AGT in Africa (1920–2019) Decadal time series 1920–1929 1930–1939 1940–1949 1950–1959 1960–1969 1970–1979 1980–1989 1990–1999 2000–2009 2010–2019
Average global temperature (AGT) -0.23 -0.12 0.04 -0.04 -0.03 0.04 0.25 0.39 0.59 0.80
Climate hazard/related disasters in Africa 2 0 11 7 58 84 173 264 609 544
Mortalities 27,000 0 500,165 879 3853 120,745 557,699 9072 10,590 33,648
Source: EMDAT: 1920–2019 (Université catholique de Louvain 2020)
Affected people 0 0 0 0 10,645,539 28,297,390 92,050,877 105,924,246 147,302,398 164,897,781
10
Climate Change and the Rising Disaster Risk in Africa
193
Inferring from the data captioned above, the decade 1920–1929, which was the coolest decade in the series, recorded only 2 disasters that gave rise to 27 mortalities. The mortalities were mostly in Cabo Verde and Algeria. Interestingly, no climaterelated disaster was recorded during the decade 1930–1939, despite it being warmer than its predecessor. Other reasons for the lack of record may be due to historical events such as the Great Depression and World War II (WWII). Similarly, the lack of records might have been equally due to, perhaps miraculously, hazards that occurred during the decade had not necessary resulted in disasters. The first 50 years (1920–1969) of the 100-year period under consideration witnessed highly variable climate, with sudden rise in AGT occurring every other two decades. For example, the first two decades (1920–1929 and 1930–1939) were the coolest period of the 100-year period. However, following the end of these coolest decades, the AGT jumped exponentially high by the decade 1940–1949. Furthermore, the two decadal series that followed (1950–1959 and 1960–1969) recorded a sudden and significant decrease in AGT. By the end of the first 50 years (1920–1969) that witnessed significant variations in AGT, the last five decades (1970–2019) that followed consistently recorded upward AGT. During the last five decades of the 100-year period under consideration, three important characteristics have been observed. First, the AGT increased exponentially from 0.4 °C in the decade 1970–1979 to 0.25 °C in the decade 1980–1989. Similarly, the decade 1990–1999 further recorded increased AGT by 0.39 from 0.25 °C in the successor decade. The last two decades (2000–2009 and 2010–2019) were the hottest decades in the series. Second, climate hazards and disasters during the last five decadal time series increased exponentially—with the highest hazards/disasters recorded during the decade 2000–2009. Third, there was significant reduction in disaster mortalities, particularly during the last three decades of the last 50 years in the series. However, the decade 1980–1989 witnessed the worst disaster mortalities ever recorded on the African continent. From the decade 1990–1999 onward, Africa witnessed more disasters, albeit fewer mortalities and more people affected, which continued to grow by a large margin every decade that follows. As can be observed from the tabular analysis presented above, the earliest decades witnessed fewer disaster events but more mortalities. The number of affected people in the earliest decades was not available; perhaps this could explain that such an indicator was not included in the earlier indicators. Conversely, the latest and the warmest decades recorded more disasters that have affected more people and, notwithstanding, fewer mortalities. The difference between fewer events resulting in more mortalities in the earlier decades and more events ensuing to fewer mortalities towards the end of the 100-year period could be due to increased awareness and better management of disasters during the latest decades (UNDRR 2019). However, some cautions ought to be taken when making interpretations on disaster losses in relation to intensity of hazards. Minor hazards may result in a disaster with massive loss of lives and assets. Yet a stronger hazard may create fewer losses when exposure is minimal. By virtue of population density crowded in areas prone to hazards, unregulated urbanisation is seen as a major risk driver. This
194
G. K. Bol and D. van Niekerk
Fig. 10.2 Comparative analysis of the climate-related disasters in Africa against AGT (1920–2019). Source: NASA (2021) and Université catholique de Louvain (2020). The blue colour represents the average global temperature (AGT), and the brown colour represents the climaterelated disasters during the period 1920–2019
situation can be best illustrated with Cyclone Idai that made landfall in Mozambique, Zimbabwe and Malawi in March 2019 and Cyclone Kenneth that followed 2 weeks later in Mozambique, in April 2019. Beira, a city so important not only to Mozambique but to the countries in southeastern Africa, due to its important port facilities, suffered colossal damage when the city was hit by Cyclone Idai. The cyclone also induced major disasters in Zimbabwe and Malawi. In Mozambique alone, over 600 people were reported dead (Emerton 2020), and several hundreds more were unaccounted for. The economic losses were estimated in billions of US dollars, and the social impacts were immeasurable. Several years later, innocent bystanders who were victims of the Cyclone Idai disaster were still languishing in displaced camps and may never return to normalcy or to what they would call a home. After Cyclone Idai in Mozambique, 2 weeks later, Cyclone Kenneth hit Mozambique again. The intensity was felt more in rural areas, coincidentally with less population density. By comparison, Kenneth was the strongest cyclone that ever made landfall on the African continent. Yet the death tolls and other related losses were far fewer than losses from the Cyclone Idai. Thus, it can be argued that high population density and vulnerable assets exposed to hazards can create severe disasters, sometime with fairly less severe hazards. Further analysis of the occurrences of disasters induced by climate hazards in Africa is presented below (Fig. 10.2). By contrast, and despite some downward movements in average global temperature during the first half of the 100-year period, climate hazards remained stable and, to some extent, variable. During the period 1920 to 1960, climate-related disasters remained significantly low, despite sudden rise in global temperature in 1941 as well as abrupt rise of disasters in 1940. Surprisingly, while AGT was reducing during the period 1964–1968, albeit some minor variability, climate-related disasters were on the rise during the same period.
10
Climate Change and the Rising Disaster Risk in Africa
195
The rise in climate-related disasters was attributed to El Nino Southern Oscillation (ENSO) episodes during that period (NOAA 2021). Since 1977, AGT consistently moved upwards as well as climate-related disasters that followed the similar trend, albeit zigzag motion. Similarly, the sharper rise in climate-related disasters in 1986–1987 was attributable to ENSO, one of the strongest since 1940 (NOAA 2021). In the same vein, notable increase in climate disasters from 1993 through 2010 was in line with frequent occurrence of ENSO episodes (NOAA 2021). As it can be observed from the AGT-climate-related disaster nexus in the graph captioned above, disasters did not necessarily follow the rise in AGT; instead, at some instances, disasters moved towards opposite direction. For example, from 1990 to 1992, there was sharp decline in disaster events, yet AGT was exceedingly increasing. Similarly, there was opposite direction movement of disaster events in 2013 and 2014, respectively, before the number of disaster events could skyrocket in 2015/2016 and 2017/2018, respectively. The rise in climate-sensitive disasters in 2015/2016 corresponded with 2015/2016 ENSO (African Union 2020).
10.3.2
The ENSO Events: 1920–2019
The occurrences of climate-related disasters were mainly driven by El Nino Southern Oscillation (ENSO). The fewer and weaker the ENSO events, the fewer the climaterelated disasters. Similarly, the stronger and more frequent the ENSO episodes, the higher the increase in frequency of climate-related disasters (Fig. 10.3). The first 40 years of the 100 years under consideration were characterised by fewer ENSO events. That seems to explain the flattening of the climate-related disasters’ occurrences between 1920 and 1940. However, the strongest ENSO episode in 1940 resulted in sudden rise in number of climate-related disasters, particularly in Western Africa (Université catholique de Louvain 2020). The climate-disaster curve flattened again despite fewer ups and downs from 1941 to 1960. This was partly due to five weak ENSO episodes recorded during the 10-year period. By the end of 1964, the number of ENSO became more frequent as a result of two strong ENSO episodes in 1986/1987 and 2015/2016, respectively. Despite being
Fig. 10.3 ENSO timelines: 1920–2019. Source: National Oceanic Atmospheric Administration (NOAA 2021) and Australian Bureau of Meteorology (2021). The bars represent ENSO episodes. The thicker the bar, the stronger the ENSO episode
196
G. K. Bol and D. van Niekerk
weaker, the ENSO episode in 1984 resulted in 300,000 mortalities and over 7.7 million people affected in Ethiopia. The World Vision put the death tolls to an estimated one million mortalities (Reid 2018). By contrast, Ethiopia was hit by stronger ENSO episode in 1986/1987 with resultant death tolls estimated at 367, and over seven million people were affected, a much lower impact than the impact of previous but weaker ENSO episode in 1984. This seems to suggest that the 1984 catastrophic famine, despite having been exacerbated by droughts, was mainly made possible by the conflict that hindered humanitarian access to the drought-affected populations (Reid 2018). Similar strong ENSO episode that hit the African continent in 2015/2016 resulted in lesser mortalities. In Ethiopia, only 100 mortalities were recorded. This was far lesser than previous stronger ENSO episodes in 1940 and 1987/1988, respectively. The reduction in losses could be attributed to increased improvements in early warning systems (Mera 2018) and improved risk protection measures (Hallegatte 2014).
10.3.3
ENSO and the Anthropogenic Changing Climate
ENSO naturally occurs between 3 and 8 years (Desonie 2008) or 3 and 5 years (Giddens 2009) and has been a cause of many climate events over millennia (Contescu 2012). However, in recent years, ENSO episodes have increased in frequency (NOAA 2021). The last 30 years of the 100-year period witnessed increased frequency of ENSO events. In Ethiopia, all droughts were ENSO driven and have continued to become increasingly frequent, albeit weaker (Mera 2018). Nevertheless, there is no established scientific correlation yet between ENSO occurrences and anthropogenic climate change (Contescu 2012). However, future ENSO events under high concentration of greenhouse gases in the atmosphere may increase further in frequency and magnitude (NOAA 2021). While the influence of anthropogenic climate change on the frequency of the occurrences of ENSO episodes cannot be ruled out, the rise of climate-related disaster events in Africa towards the end of the 100-year period was likely due to increased exposure as a result of increased population and urbanisation. Urbanisation and population growth on the continent were on the rise since the 1950s (OECD 2020). By 1950, only 27 million African lived in urban centres; however, by 2010, the African urban population has grown to 567 million (OECD 2020). Yet by 2050, the urban population in Africa is projected to double (OECD 2020). The comparative diagram by OECD patently explained the Africa’s urbanisation dynamics (Fig. 10.4). The urbanisation and population growth in poorly planned settlements are expected to further worsen hazards’ exposure. The Africa Biennial Report 2015–2018 highlighted substantial increase in hazard exposure in most African regions (African Union 2020). The rise in climate hazards coupled with growing pests’ infestations, epidemics, industrial accidents and unregulated urbanisation and development (African Union 2020) seems to have a combined devastating impact
10
Climate Change and the Rising Disaster Risk in Africa
197
Fig. 10.4 Africa’s urbanisation trends—1950–2010. OECD/SWAC 2018, Africapolis (database): Geopolis 2018
(IFRC 2020). Coupled with increase in population density and widening inequalities, “more people and development itself will be exposed to climate hazards” (IFRC 2020). Consequently, disaster risks will become more multidimensional and overlapping as witnessed with COVID-19, desert locust infestation and flood—all occurring simultaneously in one area (IFRC 2020), hence creating a complex neo-normal disaster risk paradigm.
198
10.3.4
G. K. Bol and D. van Niekerk
Neo-normal Disaster Risk Paradigm
Neo-normal disaster risk paradigm summarises contemporary and complex realities in managing risks in an increasingly complex world and in African context. The neo-normal disaster risk paradigm is characterised by being overtaken by events, heightening vulnerability and increasing hazard exposure amidst dwindling coping capacities. In the neo-normal disaster risk paradigm, the “dormancy of risk is over, the invisible hazards are now visible” (Beck 1992). Beck listed the most precarious ones. They are the “transformation of forest into skeletons, inlands waterways and seas crowned with foams, animal bodies smeared with oil, erosions of buildings and artistic monuments by pollutions, the chain of toxic accidents, scandals and catastrophes” among others (Beck 1992: 55). Beck was describing a far better risk situation than the neo-normal disaster risk paradigm characterising postmodern society. In his time, Beck was concerned of pollution and industrial accidents. Today, industrial accidents and pollution still exist, albeit some improvements. However, the assertion that Beck was describing a better situation than today was due to the fact that more disaster events and associated losses are being recorded and more nature is being destroyed in an alarming rate. Since the 1990s, over 420 million hectares of forest have been lost through other land uses (FAO 2020). Recent disasters in Africa are some of the worst events never recorded on the African continent. How one would wish getting Beck’s insight after having seen half a million dead humans laying bare in Haiti in 2010 or the victims of Cyclone Idai being flushed by heavy debris several miles from Mozambique to mix with corpses of similar victims from Zimbabwe and other many examples of human misery in postmodern society. In his conversation with Culver in 2011, Beck was asked by Culver: “are we yet in risk society now”? (Culver et al. 2011). His response was that “we were in a stage where risk has escaped the control of institutions” (Culver et al. 2011).
10.3.4.1
Being Overtaken by Events
In the neo-normal disaster risk paradigm, it is not only a question of addressing “prevention of new risks, reducing existing risks, managing residual risks and building resilience” (United Nations 2015b) but a choice between prioritising responding to ongoing events and coming back later to respond to disaster risk in peacetime. Yet there may never be “peacetime” as the space between recoveries from one disaster event to another has been significantly narrowing in recent years. In 2020 alone, many countries witnessed, albeit simultaneously, COVID-19, flooding and desert locust infestations. In some countries, there was confluence between COVID-19, flooding or drought and desert locust invasion, which further compounded vulnerabilities and systemic risk (IFRC 2020). Hence “understanding the degree of cascading risk and developing ways to isolate, measure and manage or
10
Climate Change and the Rising Disaster Risk in Africa
199
prevent systemic risk is becoming challenging” (Gordon 2020). A systemic risk refers to cascading events with domino effects across different sectors or territories and has potential consequences to result in existential threat or an entire system collapse (Silmann et al. 2022). The COVID-19 pandemic has helped in understanding systemic risk. For example, COVID-19, a virus that was first reported in Wuhan, quickly spread across the world and cascadingly become not only a health system disaster but economic and socio-economic catastrophe. COVID-19 also confluence with cyclones, flash flooding and other sudden-onset events that created mass population moments further quickened spread of the virus among the vulnerable population (African Union 2021a, b). Similarly, COVID-19 diverted attention and resources that would have been, otherwise, used for responding to other disasters (African Union 2021a, b). Rooted in inherent systemic inefficiencies underpinning risk management in many African states, being overtaken by disaster events in cyclic passion is increasingly becoming normal. Further compounding this behaviour is habitual failures of hindsight (Toft and Reynolds 2005). One of the reasons that engrain cyclic failure in learning from past events is profound failure in undertaking comprehensive disaster forensic to inform post-disaster recovery investment and rebuilding of better and resilient society that is better prepared and resilient to future risks and uncertainties. Other factors motivating this habitual failure of hindsight include erroneously adopting irrelevant strategies for addressing complex risks of the twenty-first century (Beck 1992). A case in point, believing in disaster management funds to respond to future disasters without investing in understanding, reduction and mitigation of risks over time does not only perpetuate risk but “sanitising the world of hazards” (Toft and Reynolds 2005). These traditional and erroneous strategies rooted in pre-industrial societies are irrelevant in postmodern society (Beck 1992).
10.3.4.2
Heightened Vulnerability, Exposure and Dwindling Coping Capacities
Owing to increased disaster events, socio-economic resilience of communities has been weakened if not completely eroded as the gaps between different events don’t allow for full recovery because of “short recovery intervals and large financial gaps” (Pardo 2021). To depict this situation, the African risk profile will be discussed. The risk profile is presented according to the Regional Economic Communities (REC), the regional organisations which form the building block of the African Union. These include East African Community (EAC), Economic Community of Central African States (ECCAS), Economic Community of West African States (ECOWAS) and Intergovernmental Authority on Development (IGAD), Arab Maghreb Union (UMA) and other North African states that are not members of UMA, and Southern African Development Communities (SADC) (Fig. 10.5). The methodology that informed the map was adopted from Index for Risk Management (INFORM). The INFORM methodology categorises risk into five:
200
G. K. Bol and D. van Niekerk
Fig. 10.5 African disaster risk profile. Source: Toft and Reynolds 2005’s Africa Biennial Report on DRR (2020)
Fig. 10.6 Hazards and exposure. Very low = 0.0–1.4, low = 1.5–2.6, medium = 2.7–4.0, high = 4.1–6.0, very high = 6.1–10.0
very low risk (0.0–1.9), low risk (2.0–3.4), medium risk (3.5–4.9), high risk (5.0–6.4) and very high risk (6.5–10.0). Analysing from the statistics captioned above, the overall risk index for the continent ranges from 4.8 to 5.4 during the 4-year period. In average the risk profile stands at 5.15. This indicates that Africa has a high-risk profile. In addition, exposure, vulnerability and lack of coping capacity are also high (Fig. 10.6). The overall continental exposure to hazards, as it can be observed from the above diagram, ranges from 4.0 to 5.0 during the 4-year period—implying high exposure (Fig. 10.7). The continent’s vulnerability ranges from 5.0 to 5.5, falling within the threshold of high vulnerability index. The high vulnerability index seems to be a strong factor underneath rising disaster events on the continent (Fig. 10.8). The overall lack of coping capacity for the continent is high.
10
Climate Change and the Rising Disaster Risk in Africa
201
Fig. 10.7 Vulnerability. Very low = 0.0–1.9, low = 2.0–3.2, medium = 3.3–4.7, high = 4.8–6.3, very high = 6.4–10.0
Fig. 10.8 Lack of coping capacity. Very low = 0.0–3.1, low = 3.2–4.6, medium = 4.7–5.9, high = 6.0–7.3, very high = 7.4–10.0
Rising inequalities, brought about by development or what Beck referred to as reflexive modernity, further add more complexities and induce vulnerabilities, particularly in urban areas. By reflexive modernity, Beck meant to sketch what he referred to as manufactured uncertainties which he depicted as by-products of radical modernisation (Culver et al. 2011). For example, in an attempt to create better housing and cities, inadvertently this creates congestion and invasion of more nature as population moves to the centre to access service. According to Beck, “environmental problems are not just environmental problems; they are induced by institutions of modernisation” (Culver et al. 2011). This is true of the current urbanisation dynamics. Current and future urban development trends tend to promote rural-urban migration as governments, inadvertently, or perhaps deliberately, place most of the critical services, including health services, water and hygiene and sanitation facilities, education services and other important needs, in urban centres. Likewise, new concepts such as “smart cities or resilient cities” point to future trends that build on
202
G. K. Bol and D. van Niekerk
the current urbanisation practices, which amplify rural-urban migration—further widening inequalities and vulnerability. Consequently, the villages are forced to move to cities, further driving the rural migrants to further vulnerability. In response to the pressure, urban slums grow as more people live in congested spaces— facilitating poor hygienic conditions (Srivastava 2020). Therefore, resilience measures must first address these inequalities and development-engendered vulnerability to reduce exposure and prevent development-induced vulnerability, for example, by ensuring balance in access of services by both urban and rural populations.
10.3.4.3
Neo-normal Disaster Risk Paradigm: A Prophecy Comes True
The neo-normal disaster risk paradigm, in the context of “risk society”, is a prophecy that has come true. The risk society theory postulates the notion of “modernity” as a profound social transformation from industrial society to risk society or “simple to reflexive modernity” (Beck 1992; Walker 2004). Industrialisation, in the view of risk society, was meant to create wealth; it turns out it is killing nature, and worrisomely, the risks produced in late modernity surpass wealth and cause irreversible damage as industrialisation becomes reflexive in its transitions to modernity (Beck 1992). In reflexive modernity era, hazards become increasingly reflexive in process of modernisation and defy the attempts by governments and the elites to control them (Beck 1992). Importantly, Beck’s concern of industrialisation that is generating wealth in expense of risk is not only a true reflection of climate change today but an appealing reality that must be used to inform loss and damage negotiations—in which the industrial nations trench in to defy their rightful roles. Recent events such as chemical accidents in Lebanon, wars and flooding across the globe have not only reignited the debates about the risk society theory but have propelled the paper to one that is highly cited in academic literature (Culver et al. 2011). Resonating with Beck’s risk society debates, Perrow, in his book Normal Accidents: Living with High-risk Technologies, contends that technological risks are multiplying. He emphasised that as “technology develops, as wars increase, as human invade nature, there is a tendency of creating complex systems and organisations that increase risks to operators, passengers, innocent bystanders and future generations” (Perror 1999). Perrow’s list of high-risk technologies resonates with Beck’s reflexive modernity as the duo inclined towards socio-technical hazards and risks. Perrow’s list of high-risk technologies includes dams, nuclear plants, aircrafts and airports among others. In his opinion, Perrow’s high-risk technologies are highly coupled, inevitable and even normal (Perror 1999). Perrow’s analysis of normality, coupling or redundancy is highly relevant concepts to today’s neo-normal disaster risk paradigm. By uncoupling and introducing redundancy in designs and ensuring equity and fairness in development endeavours, the neo-normal disaster risk paradigm can be uncoupled and de-normalised. By uncoupling the neo-normal disaster risk paradigm, development must build resilience (redundancy) and ensure no one is left behind. Similarly, while in agreement
10
Climate Change and the Rising Disaster Risk in Africa
203
with “reflexive modernity” and “normal accidents” debates, there is a need to clarify that “modernity” in itself is not evil; what is evil is modernity that is not riskinformed.
10.3.5
Re-conceptualising Resilience in Neo-normal Disaster Risk Paradigm
Contemporary measures being put in place to respond to the neo-normal disaster risk paradigm are too little, too fragmented, too late and too insufficient to counter the risk (IFRC 2020). In Africa, despite major progress being made by African governments, the continent’s risk profile has remained high. Over the years, significant improvements have been made in building institutions. Many African states, albeit having so many competing priorities, are making investments on resilience building (African Union 2020). However, resilience initiatives are largely reactive in nature, a situation likened to an army that prefers to wait an enemy force to attack first rather than confronting the enemy from afar. In so doing, the army digs itself in defensive positions. Taking defensive position represents a metaphor that is akin to a tortoise retreating its head to its shelf as it senses danger—hence a hunter would comfortably collect the tortoise as it could not see its predator. To further demonstrate the contemporary resilience challenges, a study undertaken by the AU Commission on the status of multi-hazard early warning system in Africa found a shocking decline in weather and climate observational stations, which are very critical for early warning, early actions and disaster preparedness and response. The diagram below depicts the rate of decline (Fig. 10.9). The decline in observational weather stations was mainly due to challenges relating to maintenance of equipment, especially in remote areas. However, investments are being made to modernise the hydro-meteorological observational networks. Such services are highly critical for resilience building and implementation of effective early warning systems (African Union 2021a, b). In addition to establishing agile early warning systems, governments would need to invest in sustainable and innovation solutions and resilience measures that generate dividends. An effective resilience action must have triple dividends: (1) prevents and reduces disaster risks and losses, (2) generates economic benefits and (3) promotes environmental well-being (Surminski and Tanner 2016). Converting risk-prone areas into development and investment opportunities can contribute to unlocking economic potential through increasing land value and more investment (Surminski and Tanner 2016). In addressing resilience in the neo-normal disaster risk paradigm, the disaster risk management and/or climate change community and, by extension, the larger development community must review implementation of resilience concepts such as mainstreaming of disaster risk reduction (DRR) and climate change adaptation (CCA) in development programmes. Over the years similar applications and
204
G. K. Bol and D. van Niekerk
Fig. 10.9 Fully operational hydro-meteorological observation stations per 1,000,000 km2. Source: Status of Multi-Hazard Early Warning System in Africa -African Union (2021)
practices for mainstreaming the duo in development processes have continued for years if not decades, yet disaster losses continue to rise and undermine development gains. Development projects, for purposes of meeting policy requirements for securing financing, would tick boxes to meet the “mainstreaming” per se. As in production markets, some products have 10 or even 20 or more years of warranty, development projects must incline towards this practice if they have to achieve resilience. That way, a development project may not close until the warranty period expired. A paradigm shift is, therefore, needed to re-politicise disaster risk governance arrangements to make them robust enough to respond to the current risk management context (Gordon 2020), including inter alia development of new political instruments that make CCA and DRR mandatory for any development project or programme and ensure enforcement thereof.
10
Climate Change and the Rising Disaster Risk in Africa
10.3.6
205
Re-politicising CCA and DRR to Counter Neo-normal Disaster Risk Paradigm
The most effective way to reduce growing climate risks and tame the neo-normal risk paradigm in Africa is to reduce vulnerability and exposure through effective CCA and DRR actions that are synergistically implemented, inclusive and tailored to address root causes of vulnerability, including exposure (IFRC 2020). Two hypothetical projects have been illustrated in the next paragraph to further emphasise this point. Project A was a road construction project that was the only lifeline for several rural centres whose livelihoods and survivals were mainly dependent on the road. Conversely, the areas were rich in minerals and contributed to 50% of the growth domestic products (GDP) of the entire nation. This project took into account CCA and was considered climate-proof. Two years later, a 7.2 magnitude earthquake on Richter scale hit the area causing complete damage to the road and cutting off the rural centres. The population suffered high fatalities due to delayed response as the road was completely damaged. The emergency operations and direct economic losses emanated from the disaster were estimated to be 10 billion USD. Yet, the country was dependent on external debt to finance emergency operations and recovery efforts, to the tune of 1 billion USD. The country also lost 75% of its GDP, making it one of the poorest. Due to rising poverty, crime rates increased exponentially. Citizens had to leave in poor hygienic conditions, and the country witnessed one of the worst cholera outbreaks that killed 1200 people. Project B was undertaken in a separate country in one of the dry lands of Africa. Due to frequent droughts, there was chronic water crisis in the countries’ ten villages at its northern border. To mitigate the effects of droughts, ten water pumps were constructed in the ten villages. To be “fair”, each village was assigned one water pump. The population of the villages was not used as a criterion for allocation of the water pumps. According to the national census that was conducted 3 years earlier, one of the villages had catchment population of 15,000. The governance arrangement in the villages is done in such a way that each village is led by a Chief. The ten Chiefs report to the overall Chief who has overall oversight for the ten villages. The national government coordinated the implementation of the project with the overall Chief. The team had ensured that the pumps were built within the water table and as per the assessment. The construction of the pumps also took into account future climate change predictions. Coincidentally, the overall Chief comes from the smallest village with a population of only 300 people. As days passed by, the village with the population of 15,000 was undergoing violent conflicts due to competition over limited water facility, which the community experienced for the first time. In order to find solutions to the conflict, the villagers contemplated and realised that their village, despite it having the largest population, was given only one pump. Yet the village with the smallest population, where the overall Chief lived, had one pump that was fairly enough for them. The village with the largest population was angry and had to plan
206
G. K. Bol and D. van Niekerk
an attack on the paramount Chief for being unfair. The fighting ensued and the peaceful villages joined the either side of the two fighting villages. The conflict displaced several thousands of people, mostly women, children and elderly to a nearby town where they were kept in displacement camps, unfortunately, located in flood-prone area. A flash flood occurred, killing 350 of them and further displacing the entire population. Back home, the fighting continued for years until the entire area villages were abundant and the water pumps were left desolate and later worn out due to lack of maintenance. The key message emanating from the two projects is that CCA or DRR actions that do not take into account other risks are as worst as the vulnerability they tend to address—hence, they instead induce disasters. Oftentimes CCA and DRR actions focus on physical risks and do not consider conflict sensitivities. Learning from the two projects, even if DRR and CCA were to be fully incorporated in development processes, without considering other social vulnerabilities and conflict sensitivities, development project will still create new risks and disasters. In the project B, CCA was fully incorporated in the design of the water pumps; however, the project disregarded potential unintended consequences that later culminated in destruction of social cohesion of peaceful communities. The two projects captioned above further emphasised the need to ensure better integration and collaborations between CCA, DRR and peace building stakeholders. Present-day institutional settings for CCA and DRR further complicate strengthening synergies as they are positioned in separate institutions with no or little coordination. This disintegration means that CCA and DRR have been implemented separately and “both have failed to reduce vulnerability” (Thomalla et al. 2006). In the words of Antonio Guterres “If I had to select one sentence to describe the state of the world, I would say we are in a world in which global challenges are more and more integrated and the responses are more and more fragmented, and if this is not reversed, it’s a recipe for disaster” (Gordon and Williams 2020). The World Disaster Report 2020 put it precisely that “the conversations are in silos—they use different terminology, attend different events and develop parallel frameworks—resulting to different priorities being developed; different conclusions being drawn; and different areas being perceived as someone else responsibility” (IFRC 2020). In fact, CCA in actual sense means climate disaster risk reduction. As such CCA actions can be delivered by the broader DRR actions (Booth 2020). Whereas this seems a reasonable technical recommendation, institutional politics may render consideration of CCA as a component of DRR a nonstarter. Instead many institutions are increasingly placing DRR as a component of climate change adaptation. This implies that all hazards are seen as climate change induced. This does not only portray negligence in understanding broader mandate of disaster risk reduction but a dangerous politicisation of CCA and DRR, and perhaps, a daring attempt in overselling climate change narrative (Storch 1999). For example, project A has illustrated that even if all climate risks are accounted for in a development programme, the resilience of such investments cannot be guaranteed if all other risks are not factored in the programmes.
10
Climate Change and the Rising Disaster Risk in Africa
207
Hence, a re-politicised CCA and DRR governance, where CCA and DRR are structured under integrated disaster risk management, would ensure comprehensive and coordinated implementation of disaster and climate risk reduction programmes, including coordinated implementation of the post-2015’s agenda: Sendai Framework for Disaster Risk Reduction, Paris Agreement and Sustainable Development Goals, to build resilient societies.
10.4
Conclusion
This chapter examined rising disaster risks in Africa and the role anthropogenic climate change might have played in the rising disaster risks on the continent. A 100-year disaster statistics in Africa covering the period 1920–2019 was analysed in juxtaposition with average global temperature for the same period. The rising climate-related disasters in Africa are mainly driven by ENSO episodes that have increased in recent years. While the influence of climate change on the frequency in the occurrences of ENSO episodes cannot be ruled out, the rise in the climate-related disaster events in Africa towards the end of the 100-year period is likely due to increased exposure as a result of increased population growth, which is being characterised by rapid and unregulated urbanisation. In recent years, nearly all the deadliest disaster events since 2015 in Africa have occurred in urban areas. With the growing population density and widening inequalities, more people will be vulnerable and exposed to climate hazards as disaster risk will become multidimensional and overlapping as witnessed with COVID-19, desert locust infestation and flood, all occurring simultaneously in one area (IFRC 2020), hence creating a complex neo-normal disaster risk paradigm. Neo-normal disaster risk paradigm is characterised by being overtaken by events amidst heightened vulnerability, hazard exposure and dwindling coping capacity. Inexcusably, the current resilience measures are inadequate; hence, a paradigm shift is required to embracing and investing in resilience actions that yield triple dividends to tame the neo-normal disaster risk paradigm characterising disaster risk management in Africa.
References African Union (2020) Biennial report on the programme of action for the implementation of the sendai framework for disaster risk reduction 2015–2030 in Africa. African Union, s.l. African Union (2021a) Situational assessment of impact of COVID-19 in Africa. African Union, s.l. African Union (2021b) State of multi-hazard early warning systems in Africa. African Union, Addis Ababa Baum SD, Haqq-Misra JD, Karmosky C (2012) Climate change: evidence of human causes and arguments for emissions reduction. Sci Eng Ethics 18(2):393–410 Beck U (1992) Risk society: towards a modernity. Sage, London
208
G. K. Bol and D. van Niekerk
Beslik S (2019). Medium. [Online] Available at: https://medium.com/in-search-of-leverage/5reasons-why-the-paris-agreement-is-a-joke-and-how-we-can-fix-it-4b636409bb05 [Accessed 5 September 2021] Booth L (2020) Simulating synergies between Climate Change Adaptation and Disaster Risk Reduction stakeholders to improve management of transboundary disasters in Europe. Int J Disaster Risk Reduct 49(101668):2–9 Brown N (2001) History and climate change: an eurocentric perspectives. Routledge, London Bunzl M (2015) Uncertainty and the philosophy of climate change. Routledge, London Burroughs WJ (2005) Climate change pre-history: the end of the reign of chaos. Cambridge University Press, Cambridge Cholteeva Y (2020) VERDIT. [Online] Available at: https://www.offshore-technology.com/ features/uk-to-end-support-for-oil-and-gas-overseas-except-in-mozambique/, [Accessed 7 September 2021] Clemencon R (2016) The two sides of the Paris climate agreement: dismal failure or historic breakthrough? J Environ Dev 25(1):3–24 Contescu L (2012) 600 million years of climate change: a critique of the Global Warming Hypothesis from a time-space perspective. [Online] Available at: https://geoecomar.ro/ website/publicatii/Nr.18-2012/01_lorin_BT.pdf, [Accessed 04 April 2021] Culver L et al (2011) Revisiting risk society: a conversation with ulrich beck. UK Federal Ministry of Research, s.l. Desonie D (2008) Climate change: causes and effects of climate change. Chelsea House, New York Emanuel KA (2016) Climate science and climate risk: a primer. [Online] Available at: https://news. mit.edu/2018/mit-professor-kerry-emanuel-writes-new-primer-understanding-climate-sci ence-0122 [Accessed 02 April 2021] Emerton, R. 2020. Emergency flood bulletins for Cyclones Idai and Kenneth: A critical evaluation of the use of global flood forecasts for international humanitarian preparedness and response. Elsevier, 50(101811) FAO (2020) The state of the world’s forests 2020: forests, biodiversity and people. FAO, s.l. Giddens A (2009) Politics of climate change. Polity, Malden Gordon M (2020) Why do we need a new view to understand the systemic nature of risk? UNDRR, s.l. Gordon M, Williams S (2020) Shifting the paradigm: introducing the global risk assessment framework (GRAF). UNDRR, s.l. Hallegatte S (2014) Natural disasters and climate change: an economic perspective. Springer, New York Harvey F (2020) The Guardian. [Online] Available at: https://www.theguardian.com/environ ment/2020/dec/09/rich-failing-help-fund-poor-countries-climate-fight-warns-un-chief-antonioguterres. [Accessed 5 September 2021] Hood C, Jones DKC (2004) Accident and design: contemporary debates in risk management. Taylor and Francis, London IFRC (2020) World disasters report 2020: tackling the humanitarian impacts of the climate crisis together. IFRC, s.l. International Energy Agency (2010) International energy agency. [Online] Available at: http:// www.globalbioenergy.org/uploads/media/1009_IEA_-_Energy_poverty.pdf. [Accessed 5 September 2021] IPCC (2012) Managing the risks of extreme events and disasters to advance climate change adaptation. IPCC, s.l. IPCC (2015) Climate change 2014 synthesis report. IPCC, s.l IPCC (2018) Global warming of 1.5°C: an IPCC special report on the impacts of global warming of 1.5°C. IPCC, s.l IUCN (2019) Species and climate change. IUCN, s.l. Jakob M, Steckel JC (2014) How climate change mitigation could harm development in poor countries. WIREs Clim Chang 5(2):161–168
10
Climate Change and the Rising Disaster Risk in Africa
209
Kelman I (2015) Climate change and the sendai framework for disaster risk reduction. Springer, Issue 6, pp 117–127 Klepp S, Chavez-Rodriquez L (2018) A critical analysis of climate change adaptation discourses, policies and practices. Routledge, New York Mera G (2018) Drought and its impacts in Ethiopia. Elsevier, Issue 22, pp 24–35 Merchant M (2021) Open media network. [Online] Available at: https://openthemagazine.com/ columns/climate-colonialism/. [Accessed 5 9 2021] NASA (2021) NASA global climate change. [Online] Available at: https://climate.nasa.gov/causes/ . [Accessed 04 April 2021] NASA (n.d.) Responding to climate change. [Online] Available at: https://climate.nasa.gov/ solutions/adaptation-mitigation/. [Accessed 02 May 2022] Newell P, Bulkeley H (2010) Governing climate change. Routledge, Oxon NOAA (2021) National Oceanic and Atmospheric Administration (NOAA). [Online] Available at: https://www.climate.gov/enso. [Accessed 11 September 2021] OECD (2020) Africa’s urbanization dynamics 2020: africapolis, mapping a new urban geography. [Online] Available at: https://www.oecd-ilibrary.org/development/africa-s-urbanisation-dynam ics-2020_b6bccb81-en;jsessionid=-naAXvTJgD5p1C4wdg5HSnqK.ip-10-240-5-84 [Accessed 28 August 2020] Pardo M (2021) Prevention Web. [Online] Available at: https://www.preventionweb.net/news/ disasters-after-disasters-short-recovery-intervals-and-large-financial-gaps-small-island?utm_ source=PreventionWeb&utm_campaign=d0e253b816-PreventionWeb+Newsletter%3A +Knowledge+base+highlight&utm_medium=email&utm_term=0_b. [Accessed 7 September 2021] Pelling M (2011) Adaptation to climate change: from resilience to transformation. Routledge, London Perror C (1999) Normal accidents. Princeton University Press, Princeton Philip S et al (2018) Attribution analysis of the ethiopian drought of 2015. J Clim 31(6):2465–2486 Pittock AB (2009) Climate change: the science, impacts and solutions, 2nd edn. Csiro Publishing, Collingwood, VIC Pontoire M (2020) The race to zero emissions, and why the world depends on it. [Online] Available at: https://news.un.org/en/story/2020/12/1078612. [Accessed 02 May 2022] Reid K (2018) World vision. [Online] Available at: https://www.worldvision.org/disaster-reliefnews-stories/1980s-ethiopia-famine-facts. [Accessed 11 September 2021] Robinson L, Tahmasebi A, Plant M (2021) Centre for global development. [Online] Available at: https://www.cgdev.org/blog/four-challenges-fossil-fuel-producing-countries-low-carbon-transi tion. [Accessed 5 September 2021] Seneviratne SI, Zwiers F (2015) Attribution and prediction of extreme events: editorial on the special issue. Elsevier Sikhakhane J (2019) The conversation Africa. [Online] Available at: https://theconversation.com/ in-haiti-climate-aid-comes-with-strings-attached-108652. [Accessed 7 September 2021] Silmann J et al (2022) Briefing note on systemic risk. International Science Council, pp 1–35 Srivastava R (2020) Managing urbanisation, climate change and disasters in South Asia. Springer, New Delhi Stensrud AB (2016) Adapting to what? The neoliberal politics of climate change and alternative forms of governance in the Andes. Oslo Academy of Global Governance, s.l Storch HFG (1999) Anthropogenic climate change. Springer, Tokyo Surminski S, Tanner T (2016) Realising the ‘triple dividends of resilience’: a new business case for disaster risk management. Springer, London Thomalla F et al (2006) Reducing hazard vulnerability: towards a common approach between disaster risk reduction and climate adaptation. Blackwell Publishing, Garsington Toft B, Reynolds S (2005) Learning from disasters: a management approach, 3rd edn. Palgrave Macmillan, Eastbourne
210
G. K. Bol and D. van Niekerk
UNDRR (2017) United Nations office for disaster risk reduction. [Online] Available at: https:// www.undrr.org/terminology. [Accessed 10 September 2021] UNDRR (2019) Global assessment report on disaster risk reduction. United Nations, s.l. UNEP (n.d.) United Nations environment programme. [Online] Available at: https://www.unep. org/explore-topics/climate-action/what-we-do/mitigation. [Accessed 02 May 2022] United Nations (1992) United Nations framework convention on climate change. s.n., s.l. United Nations (1998) Kyoto protocol to the United Nations framework convention on climate change. United Nations, s.l. United Nations (2014) Report of the conference of the parties on its nineteenth. United Nations, s.l. United Nations (2015a) Paris agreement. United Nations, s.l. United Nations (2015b) Sendai framework for disaster risk reduction 2015–2030. United Nations, s.l. United Nations (2021) Climate action. United Nations, s.l. Université catholique de Louvain (2020) EM-DAT - International database. [Online] Available at: https://www.emdat.be/. [Accessed 10 September 2021] Viola E (2016) The structural limits of the Paris Agreement and the need of a global coalition for deep de-carbonization. Oslo Academy of Global Governance, s.l. Visser H et al (2014) On the relation between weather-related disaster impacts, vulnerability and climate change. Springer Walker C, Broderick J (2004) Th civil contingencies ACT 2004: risk, resilience and the law in the United Kingdom. Oxford University Press, Oxford Young, H. R., Cornforth RJ, Gayu AT, Boyd E 2019. Event attribution science in adaptation decision-making: the context of extreme rainfall in urban Senegal, climate and development. Taylor and Francis, 11(9)
Chapter 11
Water and Geohazards in Lower Casamance: Risk Perception and Prevention Strategies of the Populations in the Baïla Marigot Basin (Casamance, Senegal) Cheikh Faye and Cheikh Abdou Aziz Sy Sadio
Abstract Community resilience is the ability of people exposed to disasters, crises and underlying vulnerabilities to anticipate, prepare for, reduce the impact of, cope with and recover from the effects of shocks and stresses without jeopardising their long-term prospects. The perception of risk is influenced by the way signals about the impacts of events are collected, selected and interpreted. Empirical evidence suggests that significant differences in risk perception occur within the non-expert population itself, as well as between experts and the non-expert population. The article seeks to examine the perception of water-related risks and adaptation strategies developed by populations in the Baïla backwater basin (in Casamance in Senegal). The methodology used is based on field surveys administered to local populations and interviews administered to resource persons in the Baïla backwater basin. The results showed, based on information collected in the field, that the climatic situation in the area has been characterised, since the 1970s and 1980s, by a rainfall deficit (despite a slight increase since the 2000s) to which is added a demographic explosion which led to intensive mobilisation of available water resources. Thus, surface and underground water resources are subject to severe degradation due to climate change and increased needs. According to the populations, the random rainfall and insufficient precipitation have had a drastic impact on the availability and quality of water resources, which has also led to problems of groundwater recharge, the drop in the piezometric level, the decrease in runoff, the silting up of the basins and the disappearance of several flush water basins. Added to this are the constraints of salinisation, acidification, silting and iron toxicity. Faced with the continuous deterioration of their living conditions, the local populations have developed various adaptation strategies such as the appropriate C. Faye (✉) · C. A. A. S. Sadio Department of Geography, U.F.R. Sciences and Technologies, Assane Seck University of Ziguinchor, Geomatics and Environment Laboratory, Ziguinchor, Senegal e-mail: [email protected]; [email protected] © The Author(s), under exclusive license to Springer Nature Switzerland AG 2023 S. D’Amico, F. De Pascale (eds.), Geohazards and Disaster Risk Reduction, Advances in Natural and Technological Hazards Research 51, https://doi.org/10.1007/978-3-031-24541-1_11
211
212
C. Faye and C. A. A. S. Sadio
choice of sowing dates, suitable varieties, favourable times for weeding and the supply of fertilisers, the construction of anti-salt dykes, hydro-agricultural developments and the use of tillers and tractors. Keywords Geohazards · Water resources · Perception · Strategies · Baïla marigot
11.1
Introduction
A risk is a “possibility, probability of a fact, of an event considered as an evil or a damage” (Le petit Larousse 2017). In the common sense, risk generally refers to insecurity, whether social, health, economic, political or physical (Metzger and D’Ercole 2011). Because of its nature of connoting a negative or damaging event, Beck (2001) refers to risk as “a future that must be prevented from happening”. The entire world population is exposed to geohazards in different ways and to different degrees. Despite the history of geohazards causing numerous casualties, economic losses and damage to cultural heritage, the culture of risk prevention is not yet widespread among the world population. Man tries in every way to protect himself from risk. To do this, he studies it rationally. They identify it, analyse it, establish its probability of occurrence as accurately as possible and try to foresee its consequences in order to protect themselves from it, to try to reduce it and to manage its possible occurrence (Verlynde 2018). Traditionally, risk is considered as ‘the probability of damage occurring given the interactions between physical damage processes (hazards) and settlement factors (vulnerability)’ (Pigeon 2002). There are several types of risk, including climate change, which can cause floods, droughts, heat waves, cyclones or wildfires. In this context of climate change, extreme events are likely to occur more regularly, some with increased intensity (Becu et al. 2017). Faced with these consequences, a significant number of human systems and some ecosystems, such as coastal areas or wetlands (Nicholls et al. 1999), have significant degrees of vulnerability and exposure to climate change (IPCC 2014). This is evidenced by extreme weather events in recent years (such as floods, droughts, heat waves, cyclones or wildfires) (Verlynde 2018). Climate change therefore brings with it a global risk that can reinforce the hazards and the systemic nature of the risks, particularly for coastal risks of marine submersion (Bailly et al. 2016). Coastal areas, in particular low-lying coasts, are strongly affected by the risks of coastline recession and flooding (Kruel 2016). The challenge is not only to fight against the risk on a technical level but also to reduce vulnerabilities through territorial adaptation policies. In recent years, the climate has been subject to shifts in climatic calendars, changes in the amount of water received annually and more pronounced and frequent periods of drought (Dugué et al. 2012). The impact of this change in climate is all the greater because the populations are also experiencing other changes in their environment, notably the degradation of various water sources, deforestation, the destruction of the vegetation cover and the degradation of soil fertility. Thus, the
11
Water and Geohazards in Lower Casamance: Risk Perception and. . .
213
current climatic conditions compromise the availability of water resources, the development of economic activities and environmental sustainability. Declining water resources are the most exposed to the impacts of climate variability (PANA 2008; Boko et al. 2012). This situation makes socio-economic activities vulnerable. Many economic activities are highly sensitive due to their hydro-climatic requirements (Djohy and Edja 2018). Under these conditions, the decrease in rainfall on a seasonal scale and the increase in the duration of dry seasons (Boko et al. 2012) constitute a major constraint for livestock farming (Brooks 2006) and market gardening development (Zoundjè et al. 2013). Given the adverse effects of climate variability on water resources, we hypothesised that people’s activities would also be affected by the new hydro-climatic conditions. Overall, Senegal has sufficient water resources to feed the population (Faye and Dieye 2018; Faye et al. 2019). The diversity of water resources makes it possible to exploit surface water or groundwater (CONGAD 2009). However, Senegal experienced a period of drought during the 1970s which led to a drop in groundwater levels and thus disrupted water resources in the North, the Sahel, and in the South, Casamance (Faye et al. 2017). In Senegal, although the water crisis is most often linked to the absolute scarcity of physical availability, it also has its origins in poverty, inequality and inequitable power relations, as well as in inadequate water management policies that aggravate scarcity (Bohbot 2008). It has become clear that only a new form of water management can guarantee sustainability between supply and demand or between available resources and needs (Diouf 2013). This water scarcity also has its origins in conflicts such as the one in Casamance. Casamance is indeed the scene of one of the oldest conflicts in Africa, a struggle that has been raging since December 1982, when members of a separatist movement took to the maquis following the repression of a march for independence. Although Casamance is the rainiest region in the country, it is not spared from the problems of drinking water supply in some of its localities, including the Baïla marigot basin. Today, the distribution of drinking water is far from covering all the villages of the commune and all the needs of the population. This state of affairs plunges the communes of the Marigot de Baïla basin into a situation where certain villages suffer from a lack of water and a deficit of hydraulic infrastructures, aggravated above all by the Casamance conflict. This study therefore analyses the perception of water-related risks and the prevention strategies developed by the populations in the Baïla marigot basin.
11.2
Study Area
The Baïla backwater, a wetland of capital importance and forming part of the three main backwaters on the right bank of the lower Casamance, is one of the largest tributaries of Casamance. It is also one of the most important backwaters in lower Casamance with its watershed covering approximately 1635 km2 from Karthiack to a 110 km long watercourse from Alacounda to the Gambian border to Karthiack. Its
214
C. Faye and C. A. A. S. Sadio
Fig. 11.1 Presentation of the Baïla marigot basin and the survey villages. Source: Google Earth pro. Projection: WGS84, UTM, Zone28N
basin is located between 12°47 and 13°13 North latitude and 15°55 and 16°32 West longitude (Sadio 2019; Sadio and Faye 2021). Now with the effects of climate change, most of its main course is subject to marine influence. This backwater constitutes an area of capital importance because of its significant hydrological potential, biological diversity, hydro-agricultural developments which have been carried out there but also the importance of its watershed which crosses nine municipalities in the department of Bignona (Fig. 11.1). The Baïla backwater is absolutely full of water all year round. During the rainy season, the water course increases its height to reach its maximum level in August and September and gradually decreases as one progresses through the winter season. Its main characteristic lies in its ability to be a large reservoir of water for Casamance during the high water period (Malou et al. 1984). The population of this area is mainly made up of Diola whose main economic activity remains agriculture, rainfed rice growing in particular.
11
Water and Geohazards in Lower Casamance: Risk Perception and. . .
11.3
215
Data and Methods
Primary and secondary data collection was used for this research. The primary data collection was done mainly on the basis of field surveys. This work consisted in sending a questionnaire to households in the Baïla backwater basin. Secondary data was obtained from hydraulic structures and publications.
11.3.1
Choice of Villages for the Survey
The surveys carried out in the villages along the Baïla backwater allowed us to learn and collect data to characterise the risks in the Baïla backwater basin. The surveys in the villages along the backwater were carried out on both banks (left and right) of the backwater, with the aim of ensuring a good network of the study area but also to have good representativeness. The first criterion is the proximity of the village to the backwater: this criterion allowed us to see the level of influence of certain villages over the backwater through agricultural activities, fishing but also the exploitation of salt with a level significant salinity of the backwater. The second criterion relates to the large number of households in the village: this criterion allows us to identify the villages which have the greatest number of users of the water resource of the backwater but also the presence of socio-economic activities which use water. Finally, the ultimate criterion is the intensity of the use and exploitation of backwater in the village: this criterion allowed us to have an idea of the dependence of certain villages on backwater waters, their level of exploitation but also the activities carried out along the backwater. In view of these three predetermined criteria, a number of seven villages was retained on the list (Fig. 11.1 and Table 11.1).
Table 11.1 Sample size according to selected villages Localities Baïla Badiana Karthiack Thiobon Dianki Balandine Diounoung Total
Populations 1530 1764 2517 2107 2520 240 266 10,944
Number of households 280 195 309 245 348 48 44 1469
Number of households to be interviewed in each village 42 29 46 37 52 7 7 220
% of sample size 19 13 21 17 24 3 3 100
216
11.3.2
C. Faye and C. A. A. S. Sadio
Choice of the Population to Be Interviewed and Analysis of the Research
Thus, for the choice of the population to be interviewed, we deemed it necessary to carry out a “household survey” following a sampling by quotas. The number of households in seven villages is 1469. To determine the size of the sample, a sampling rate or a representative sample of 15% of the number of households in the seven villages selected for the surveys was selected. So to know the number of households to be interviewed in each village (for the seven villages selected), a quota or stratified sample was chosen. This method consists in finding in the sample the same proportions for each of the strata according to the characteristics chosen for the study of the target population. The surveys took place between June and September 2017. The present study is part of a larger research aimed at exploring the perception related to water by the inhabitants living in the Baïla marigot. The research was organised in two phases using a combination of techniques: questionnaires and semistructured interviews. The questionnaire was administered to local populations directly in the field, while the interview guides were given individually to resource persons. The main data collected in the survey was compiled and analysed using Sphinx software which is considered to be a proven tool widely used for systematic and reliable statistics in the social sciences.
11.4
Results and Discussion
11.4.1
Risks in the Baïla Marigot Basin
11.4.1.1
Perceptions of Variations in the Precipitation Regime
The results of the analysis of the data collected show that people have recognised the changes in rainfall patterns and the associated risks for three decades (equivalent to the early 1980s). Table 11.2 shows the perception of the local populations about the character of the onset of the wintering season. The results show that 52.3% of the respondents admit to a late start to the rainy season, while only 12.7% consider it to be early and 29.6% consider it to be stable. Respondents report that the abundance of rain has gradually decreased over the seasons since the 1970s, which correspond to a climatically dry period. The rainy season starts later and later than in the past. Thus Table 11.2 Characteristics of the start of wintering in the area
Start of wintering No response Early Stable Tardif Total obs.
Nb. cit. 12 28 65 115 220
Freq. 5.5 12.7 29.6 52.3 100
11
Water and Geohazards in Lower Casamance: Risk Perception and. . .
217
Table 11.3 Months of onset of wintering in the area
Month of rain onset No response May June July Total obs.
Nb. cit. 2 17 58 143 220
Freq. 0.9 7.7 26.4 65.0 100
Table 11.4 Duration of wintering in the area
Duration of rains No response Two months Three months Four months Five months or more Total obs.
Nb. cit. 2 4 60 121 33 220
Freq. 0.9 1.8 27.3 55.0 15.0 100
Table 11.5 Amount of rainfall during the rainy season in the area
Rainfall intensity No response High quantity Low quantity Average quantity Total obs.
Table 11.6 Rainiest month during the rainy season in the zone
Rainiest month July August September Total obs.
Nb. cit. 1 67 68 84 220
Nb. cit. 1 71 148 220
Freq. 0.5 30.5 30.9 38.2 100
Freq. 0.50 32.3 67.3 100
the rainy season, which used to start in May, now begins in the first week of July, as indicated by 65% of respondents (Table 11.3). Only 7.7% indicate an early start in May and 26.4% in June. Due to the late start of the rains, they are of low quantity, are unevenly distributed in time and space and have a shorter duration (Table 11.4). In addition, the end of the rainy season is earlier than the beginning. Indeed, 55% of respondents indicated a rainy season duration of around 4 months and 27.3% for only 3 months. Only 15% of respondents indicated a duration of 5 months or more. For the amount of rainfall received, the perceptions of the populations surveyed remain very variable (Table 11.5) and range from 38.2% for average rainfall, 30.9% for low rainfall and 30.5% for high rainfall. Variability is also noted in the wettest month during the rainy season (Table 11.6), with a maximum generally noted in September (according to 67.3% of respondents) and August (32.3% of respondents), a period that coincides with the risk of flooding and submersion of crop fields.
218 Table 11.7 Lack of water for family market gardening activities in the area
C. Faye and C. A. A. S. Sadio Water for market gardening No response Yes No Total obs.
Nb. cit. 15 115 90 220
Freq. 6.8 52.3 40.9 100
The study shows that the late onset and early cessation of the rains is the most important risk for the farmers surveyed. In addition, the delay of the first useful rains, the strong wind at the beginning of the season, the prolonged dry spells, the irregularity of the rains and their inadequacy, the shortening of the rainy season and flooding are of great concern. Thus, 52.3% of the people interviewed stated that they did not have enough water to carry out their family market gardening activities (Table 11.7). The diversity of climatic risks in the Marigot de Baïla basin is thus noted. This shortening of the rainy season confirms the studies conducted by Sarr et al. (2015) in the Tillabéry area (Niger) and Akponikè et al. (2010) in West Africa, which showed that more than 90% of the people surveyed felt that the length of the rainy season had become shorter over time in these areas. Also, Guibert et al. (2010), in a study in northern Benin (Sudanian zone), revealed that recent climate changes felt by farmers are irregular rainfall, shortening of the growing season and occurrence of strong winds and excessive heat. Some authors have addressed these risks in a global manner, speaking sometimes of a disruption of the rainy season, sometimes of greater irregularity of rainfall and sometimes of a greater frequency of pockets of drought during the vegetation cycle in Burkina (Ouédraogo et al. 2010). Other authors have reported erratic rainfall and decreasing rainfall in the semi-arid zone of Zimbabwe (Moyo et al. 2012). The manifestations of climate variability in the Baïla marigot basin are similar to those observed in West Africa (EPER 2009; Tidjani et al. 2016). Reductions in rainfall compared to the years before 1970 and in the length of the rainy season have led to a general decline in ecosystem productivity (IPCC 2007). In the context of Senegal, this situation will certainly contribute to accelerate the degradation of water resources already weakened by recurrent droughts. Analysis of rainfall data (Ozer et al. 2005; Ali and Lebel 2009) reveals a contradiction between farmers’ perceptions and what rain gauges collect. Indeed, farmers’ perception supports a rainfall deficit in monthly and annual totals since the end of the 1970s, whereas rain gauge data indicate a recovery in rainfall from the 1990s. This difference between perception and observation can be explained by the fact that farmers, marked by the negative effects of the high rainfall variability of recent years, did not perceive the improvement in rainfall conditions in agricultural seasons (Nassourou et al. 2018). The month of August after 1990 is rainier but still marked by an increase in dry spells compared to the average, which is detrimental to water resources. In addition, there is intra- and inter-annual variability in rainfall events (Abdou 2012; Ozer et al. 2009). The effects of this variability can be seen in the disruption of the water cycle at the local level.
11
Water and Geohazards in Lower Casamance: Risk Perception and. . .
11.4.1.2
219
Perceptions of Water Storage and Quality Characteristics in the Baïla Marigot
The populations interviewed perceive various effects of changes in rainfall on the state of water resources. With the onset of the rainy season, the presence of rainfall leads to an increase in water in the marigots in the area (Table 11.8). This increase is noted either in the middle of the rainy season (according to 39.1% of respondents), at the end of the rainy season (according to 34.6%) or at the beginning of the rainy season (according to 26.4%). This increase in water in the marigots in the area is done either by discharging water into the cultivation area (according to 60.9% of respondents) or by increasing the volume of water in the marigots (according to 75.5% of respondents) (Table 11.9). This increase in water in the marigots leads to overflowing of water from the marigot into the cultivation areas during high water periods (according to 50.5% of respondents) (Table 11.10) and has negative effects on agriculture in the area, as stated by 85.4% of respondents (Table 11.11). The early end of the rains, prolonged dry spells, the delay of the first rains and flooding are perceived by producers as major risks in most studies in these areas, whereas the phenomenon of strong winds at the beginning of the season is rarely Table 11.8 Increase in water levels in the marigots in the area
Increase in water At the beginning of the rainy season In the middle of the rainy season At the end of the rainy season Total obs.
Nb. cit. 58 86 76 220
Freq. 26.4 39.1 34.6 100
Table 11.9 Characteristics of the increase in water in the zone’s marigots Characters By discharging water into the cultivation area By increasing the volume of water in the marigots Total obs. Table 11.10 Overflow of marigot water into cultivation areas during high water
Water overflow No response Yes No Total obs.
Table 11.11 Effects of this increase in water in the marigots on agriculture in the area
Effects on agriculture No response Yes No Total obs.
Nb. cit. 134 166 220
Nb. cit. 4 111 105 220
Nb. cit. 5 118 97 220
Freq. 60.9 75.5
Freq. 1.80 50.50 47.70 100
Freq. 2.2 85.4 43.1 100
220
C. Faye and C. A. A. S. Sadio
Table 11.12 Time of year when water begins to recede in the marigot in the area
Decrease of the water in the marigot No response At the end of the rainy season One month after the end of the rains Two months after the end of the rains Three months after the rainy season Total obs.
Table 11.13 Changes in water quality in the area
Change in water quality No response Yes No Total obs.
Table 11.14 Sources of water quality change in the area
Origin of the change No response Overuse of pesticides Saltwater intrusion Total obs.
Table 11.15 Degradation of water resources in the area
Degradation of water resources No response Yes No Total obs.
Nb. cit. 33 31 38 74 44 220
Nb. cit. 15 124 81 220
Nb. cit. 57 132 105 220
Nb. cit. 11 143 66 220
Freq. 15.0 14.1 17.3 33.6 20.0 100
Freq. 6.8 56.4 36.8 100
Freq. 25.9 60.0 47.7
Freq. 5.0 65.0 30.0 100
mentioned (Guibert et al. 2010), even though it constitutes a major risk for crop growth, especially at the young plant stage. In addition, longer and more frequent pockets of drought sometimes jeopardise the availability of water in the Baïla marigot and surrounding basins. According to the surveys, water begins to diminish in the Baïla marigot just at the end of the rainy season (according to 14.1% of respondents), 1 month later (17.3%), 2 months later (33.6%) or even 3 months or more (20.0%) after the end of the rainy season (Table 11.12). This situation has resulted in the reduction of the number of basins (or lowlands) with flush water (shallow water table) in favour of intermediate water basins (medium deep water table) and the conversion of intermediate water basins into deep-water basins (deepwater table) (Jahiel 1996; Tidjani et al. 2016). Respondents perceive various effects of changes in rainfall on water quality, as evidenced by 56.4% of respondents (Table 11.13). Among other changes in water quality in the area (Table 11.14), respondents point to the overuse of pesticides (60%) and the intrusion of salt water (47.7%). Taking all these factors into account, a degradation of water resources in the area was noted by 65% of respondents (Table 11.15), a degradation that resulted from natural factors (according to 44.6%
11
Water and Geohazards in Lower Casamance: Risk Perception and. . .
221
Table 11.16 Causes of water resource degradation in the area
Causes of degradation No response Natural factors Anthropogenic factors Both at the same time Total obs.
Nb. cit. 49 98 51 46 220
Freq. 22.3 44.6 23.2 20.9
Table 11.17 Gradual decrease of cultivated land in the area
Decrease in cropland No response Yes No Total obs.
Nb. cit. 11 176 33 220
Freq. 5.0 80.0 15.0 100
Table 11.18 Gradual decline of plant species in the area
Decrease in plant species No response Yes No Total obs.
Nb. cit. 10 174 36 220
Freq. 4.6 79.1 16.4 100
of respondents), anthropogenic factors (23.2%) and a combination of both (20.9%) (Table 11.16).
11.4.1.3
Perceptions of Degradation of Other Natural Resources and Other Constraints in the Baïla Marigot Basin
Since the drought of the 1970s, the irregularity and insufficiency of rainfall have led to problems of groundwater recharge, a drop in the piezometric level from year to year, a reduction in runoff, the silting up of basins and the disappearance of several basins with outcropping water. It has also led to a gradual reduction in the area’s cultivated land (according to 80% of respondents) and plant species (according to 79.1% of respondents) in the Baïla marigot basin (Table 11.17). This degradation of natural resources is partly due to intense salinization of the backwater and a lack of rainwater (Table 11.18). Overall, the four main constraints linked to climate variability noted by respondents are, in order of importance (Table 11.19), salinisation (75% of respondents), acidification (59.6%), silting (21.8%) and iron toxicity (21.8%). According to respondents and in order of importance (Table 11.20), the dangers and threats to wetlands in the Baïla marigot basin consist of salinization (77.7% of respondents), acidification (60.9%), extension of cultivated land (30%), siltation (27.7%) and degradation of plant cover (23.6%). As a result of the changing climatic conditions and the continued degradation of natural resources, 30.9% of the respondents indicated the impact of the degradation of water resources on the economic situation
222
C. Faye and C. A. A. S. Sadio
Table 11.19 Other constraints related to climate variability in the area
Constraints related to variability No response Salinisation Silting Acidification Iron toxicity Other Total obs.
Table 11.20 Dangers and threats to wetlands in the area
Dangers and threats to the wetland No response Salinisation Silting Acidification Degradation of vegetation cover Expansion of cropland Other Total obs.
Nb. cit. 16 171 61 134 52 66 3 220
Freq. 7.3 77.7 27.7 60.9 23.6 30.0 1.4
Table 11.21 Degradation and impacts on the economic situation in the area
Impacts on the economic situation No response Yes No Total obs.
Nb. cit. 97 68 55 220
Freq. 44.1 30.9 25.0 100
Table 11.22 Current economic situation in the area
State of the current economic situation No response Downward At the average On the rise Total obs.
Nb. cit. 19 165 48 131 48 2 220
Nb. cit. 130 26 48 16 220
Freq. 8.6 75.0 21.8 59.6 21.8 0.9
Freq. 59.1 11.8 21.8 7.3 100
in the area (Table 11.21), a degradation which, according to 11.8% of the respondents, leads to a decline in their economic situation (Table 11.22). These results are in line with those of Sarr et al. (2015) and Nassourou et al. (2018), who showed that the climatic impacts include lower yields, lower soil fertility, more frequent seedling loss, food insecurity and crop lodging. These perceived impacts are also in line with the results obtained by Alhassane et al. (2013) who indicate that the risks of seedling loss have become more frequent in recent years. These results are consistent with the findings of other studies. For example, Faye et al. (2017) in their study showed that the drought has led to silting of the lowlands which reduces their depth and impacts on water storage and transfer conditions. This results in an early drying up of the lowlands and ponds with a reduction in annual
11
Water and Geohazards in Lower Casamance: Risk Perception and. . .
223
rainfall totals and the duration of the rainy season. The results of the SenagrosolConsult (2009) study show that the drought has led to a drop in water table levels and consequently to the early drying up of some wells in the dry season, as noted in the Niayes, the Groundnut Basin, the Tambacounda region and Casamance. This decline in water resources noted in the Baïla marigot basin is also confirmed by the DGPRE (2014), which estimates that the evolution of water resources in the groundnut basin has been marked since the end of the 1960s by a continuous decline in water tables and an almost permanent drying up of continental valleys. The same is true of Cissé (2019), in his dissertation in the Commune of Mangagoulack, who shows that the area is facing real problems of access to water due to the phenomenon of salinisation and privatisation of the sector, among others. In the Baïla marigot basin, the decrease in flows, the silting up of basins and the disappearance of several basins with outcropping water, to which are added the constraints of salinisation, acidification, silting up and iron toxicity (Sadio 2019; Sadio and Faye 2021), further complicate water resource management. Poor access to drinking water and sanitation, the endemicity of waterborne diseases, water pollution, etc. are all permanent pressures that contribute to the impoverishment of households and hinder the development of the Baïla marigot area, as noted by Cissé (2019) in Mangagoulack. Faced with the continuous deterioration of their living conditions in the current context of climate variability, local populations have developed various adaptation strategies.
11.4.2
Strategies and Action Plans for Prevention and Preparedness of Local Communities
11.4.2.1
Strategies for Dealing with Climate Risks in the Area
Adaptation strategies are developed by respondents, particularly farmers, both to prevent risks and to manage the impacts of climate variability and change (Table 11.23). Faced with climatic uncertainties (particularly the early end of the rains, which is the main agro-climatic risk), farmers mainly use short-cycle varieties (39.6%), crop diversification (61.4%), the introduction of new varieties (52.3%), the
Table 11.23 Traditional water resource management strategies in the area
Traditional strategies No response Adoption of short-cycle varieties Crop diversification Reduction of the sowing period Introduction of new varieties Direct seeding Other Total obs.
Nb. cit. 19 87 135 113 115 96 6 220
Freq. 8.6 39.6 61.4 51.4 52.3 43.6 2.7
224 Table 11.24 Modern water resource management strategies in the area
C. Faye and C. A. A. S. Sadio Modern strategies No response Hydro-agricultural developments Anti-salt dams Tillers Tractors Other Total obs.
Nb. cit. 16 154 193 10 2 12 220
Freq. 7.3 70.0 87.7 4.6 0.9 5.5
reduction of the sowing period (51.6%) and the practice of direct seeding (43.6%) (Table 11.23). Changing sowing dates and combining crops are other forms of adaptation that are possible solutions to risks such as early season winds, prolonged dry spells and delayed first rains. Tillage (weeding and ploughing) and pest control are also strategies in case of dry spells. The use of organic fertiliser, animal husbandry, mulching in crop fields and the use of chemical fertilisers, which are still underdeveloped, are being promoted to combat the general decline in crop soil fertility. Manure is mainly applied in the dry season, depending on its availability, to rainfed fields. Surveys of farmers indicate that mulching and chemical fertilisers are used to improve yields. As rainfed crops are no longer able to ensure food security due to frequent water deficits, people have chosen as an adaptation strategy to grow vegetable crops (cabbage, lettuce, tomato, cassava, sweet potato, etc.) in the basins where the soil is of better quality and access to water is relatively easier. This adaptation contributes to food diversification and is an additional source of income for the farmers in addition to reducing the dependence of agricultural productivity on the rainy season. In the face of climatic uncertainties, the populations surveyed who practice agriculture adopt modern strategies and conservative and regulatory attitudes, enabling them to limit their dependence on rainfall (Table 11.24). Thus, 87.7% of the populations surveyed perceive the construction of anti-salt dams as an appropriate response to the increasingly uncertain rainfall conditions. With the shortening of the rainy season, 70% of respondents say they have been forced to carry out hydroagricultural development. The use of power tillers (4.6% of respondents) and tractors (0.9%) is also noted by respondents as an alternative. To deal with the decrease in arable land, which is constantly increasing in the face of climatic risks in the Baïla marigot basin (Table 11.25), the populations interviewed recommend reforestation of the mangrove (according to 70.9% of the populations interviewed), the construction of anti-salt dykes (65.9%), a change in the cropping system (27.3%) and desalination of rice fields at the beginning of the winter season (14.1%). As for increasing agricultural yields, the people interviewed propose, as solutions, increasing productivity (according to 44.6% of the people interviewed), recovering abandoned plots (35.9%) and combating silting (35.5%) and salinisation (33.2%) (Table 11.26).
11
Water and Geohazards in Lower Casamance: Risk Perception and. . .
225
Table 11.25 Recommended solutions to address the decline in arable land in the area Recommended solutions No response Construction of salt dams Change of cropping system Desalination of rice fields at the beginning of the winter season Reforestation of the mangrove Total obs. Table 11.26 Recommended solutions to cope with rising yields in the area
Recommended solutions No response Increased productivity Recovery of abandoned plots Combating silting Combating salinisation Other Total obs.
Table 11.27 Wetland rehabilitation and conservation actions in the area
Rehabilitation and safeguard actions No response Hydro-agricultural developments Anti-salt dams Reforestation Protection of flora Wildlife protection Other Total obs.
Nb. cit. 21 145 60 31 156 220
Freq. 9.6 65.9 27.3 14.1 70.9
Nb. cit. 74 98 79 78 73 17 220
Freq. 33.6 44.6 35.9 35.5 33.2 7.7
Nb. cit. 12 115 164 141 49 37 5 220
Freq. 5.5 52.3 74.6 64.1 22.3 16.8 2.3
Stone barriers, hedgerows and other sustainable land management measures not only increase the yield of all cereals but also constitute actions to rehabilitate and safeguard wetlands in the Baïla marigot basin (Table 11.27). According to the populations interviewed and in order of importance, the anti-salt dams are the most cited safeguard and rehabilitation actions (with 74.6%), followed by reforestation (64.1%) and hydro-agricultural development (52.3%). The protection of fauna (16.8%) and flora (22.3%) are among the actions to safeguard natural resources.
11.4.2.2
Water Resources Management Strategies in the Area
For the satisfaction of water uses, taking into account the different constraints and climatic risks, and in relation to water resources in the Marigot de Baïla basin (Table 11.28), wells are, according to the respondents, the most widely used structures for domestic water supply (according to 82.3% of respondents), market
226
C. Faye and C. A. A. S. Sadio
Table 11.28 Types of water use and types of water resources in the area Types of water use No response Flush water bowls Well Drilling Other Total obs.
Drinking water Nb. cit. Freq. 2 0.9 0 0.0 165 75.0 155 70.5 4 1.8 220
Domestic water Nb. cit. Freq. 2 0.9 7 3.2 181 82.3 94 42.7 2 0.9 220
Table 11.29 Types of water for livestock watering in the area
Livestock watering No response Well Water points (springs) Drilling Pasture wells Total obs.
Table 11.30 Impacts of the strategies on the preservation of water resources in the area
Impacts of these strategies No response Yes No Total obs.
Water for market gardening Nb. cit. Freq. 5 2.3 2 0.9 178 80.9 24 10.9 11 5.0 220 100
Nb. cit. 4 151 199 9 26 220
Nb. cit. 18 100 102 220
Freq. 1.8 68.6 90.5 4.1 11.8
Freq. 8.2 45.5 46.4 100
gardening (80.9%) and drinking (75%). Borehole water is also used very heavily for drinking (70.5%), moderately for domestic use (42.7%) and only slightly for market gardening (10.9%). Domestic uses (3.2%) and market gardening (0.9%) are also users of water from the outcrop tanks, although the proportions are very low. Livestock are watered using different types of water resources (Table 11.29). It is carried out from water points (springs) (according to 90.5% of respondents), wells (68.6%), grazing wells (11.8%) and boreholes (4.1%). The impacts of the strategies on the preservation of water resources in the Baïla marigot basin were noted by 45.5% of respondents (Table 11.30). If the drop in the water table and the silting up of water points are the most tangible manifestations of climate variability, the promotion of integrated water resource management appears to be one of the adaptation actions promoted. Supplementary irrigation, the provision of water extraction equipment at sites where the water table is relatively deep and the rehabilitation of silted-up sites are the main strategies for adapting to climate variability. However, in the application of their adaptation strategies, the populations of the Baïla marigot basin encounter many difficulties, particularly in the fight against the degradation of water resources (Table 11.31). These include the lack of financial (78.2% of respondents) and
11
Water and Geohazards in Lower Casamance: Risk Perception and. . .
Table 11.31 Difficulties encountered in combating water resource degradation in the area
Difficulties encountered No response Lack of financial means Lack of technical means Other Total obs.
Table 11.32 Level of satisfaction with the distribution or procurement of drinking water in the area
Quality of management resources No response Yes No Total obs.
227
Nb. cit. 23 172 83 4 220
Nb. cit. 6 139 75 220
Freq. 10.5 78.2 37.7 1.8
Freq. 2.7 63.2 34.1 100
technical (37.7% of respondents) resources. The breakdown of water point drainage equipment is an obstacle to the effective implementation of modern water access techniques. Rural populations do not generally know how to repair the equipment installed in the event of a breakdown, which hinders the effectiveness of the work. As a result of these difficulties, the level of satisfaction with the distribution or acquisition of drinking water remains low, with only 22.3% of respondents being satisfied (Table 11.32). Despite the implementation of central or popular strategies by the population in order to reduce or even definitively resolve the problem of access to drinking water and to establish optimal community management of the water resource in the commune, much of it remains ineffective in the face of the scale of the damage, which is consistent with the studies by Sadio (2019), Cissé (2019) and Sadio and Faye (2021). Manifestations of the effects of climate variability have negative consequences for the state of water resources and food security. This situation calls for careful consideration of the promotion of sustainable strategies for adaptation to the effects of climate variability. Adaptation strategies to climate variability may be effective in the short term, but some can be disastrous in the medium to long term (Tidjani et al. 2016). Water is an important factor in the hydrological environment and is one of the most direct and important factors in climate change. The results of this study showed that climate change has altered the hydrological environment of the area, increasing the vulnerability of ecosystems and human societies. The global importance of water resources management has increased over the past 20 years, and integrated water resources management initiatives have promoted public participation and community involvement. Yet few studies have examined views on water management and community engagement, despite the paucity of public perceptions of the water environment (in Casamance). Here, we undertook a survey to assess people’s perceptions of the effects of natural hazards on water management in the Baïla marigot basin. The results of this survey identified the importance of local freshwater bodies to communities, highlighting the value people place on water resources for a range of ecosystem services they provide.
228
C. Faye and C. A. A. S. Sadio
Limitations in the distribution methods of this survey are generally based on the distributional limitations of the survey: (1) some socio-economic groups and individuals may have been inadvertently excluded from the survey and the results presented may not be representative of these excluded communities; and (2) individuals who have already shown active interest in water management and water-related community engagement activities may be over-represented (Rolston et al. 2017). Despite these limitations, a number of key findings were obtained that can be used to inform such engagement initiatives in the future.
11.5
Conclusion
The analysis of perceptions of water-related risks and prevention strategies developed by the populations in the Baïla marigot basin revealed that the cumulative rainfall, the start and end dates and the duration of the rainy season have been modified through a delay in the onset of the rainy season, an early cessation of the rain and the frequency of drought phases. This situation mainly affects climatedependent activities (such as agriculture and livestock breeding) but also the availability of natural resources (such as water resources). According to the population, the random nature and lack of rainfall have had a significant impact on the availability and quality of water resources. In addition, the lack of rainfall has also led to problems in recharging the water table, a drop in the piezometric level, a reduction in runoff, the silting up of basins and the disappearance of several basins with outcropping water. In response to this variability of rainfall and the decline in water resources, the populations have resorted to adaptation measures in almost all areas of production, according to their means and with the support of the state and development partners. The use of this kind of information would enable farmers to optimise their agricultural practices through appropriate choices of sowing dates, adapted varieties and the right times for weeding and fertiliser application. This will also allow the adoption of new techniques to reduce the impact of water deficits on the growth and development of rainfed crops in the Sahel. Although some of these strategies are effective in the short term (construction of anti-salt dams, hydroagricultural developments, use of power tillers and tractors), their adaptation remains limited by material, financial and technical constraints. These constraints are also linked to access to information. The need to make these adaptation strategies more accessible and easily achievable will certainly contribute to making the effects of these practices more sustainable on the one hand and facilitate their dissemination on the other. On this basis, the lack of access to drinking water and the food insecurity of households living in the Baïla marigot basin linked to climate variability could be overcome.
11
Water and Geohazards in Lower Casamance: Risk Perception and. . .
229
References Abdou AA (2012) Perceptions et stratégies d’adaptation au changement climatique des populations dans les cuvettes oasiennes de Gouré. Mémoire de Master II en Milieux et Sociétés des Espaces Arides et. Aménagement Développement, Université Abdou Moumouni de Niamey (Niger), Semi-Arides, 81 p Akponikè PBI, Peter J, Euloge KA (2010) Farmers’ perception of climate change and adaptation strategies in Sub-Saharan West-Africa; 2nd international conference: climate, sustainability and development in semi-arid regions, August 16–20, Fortaleza - Ceará, 15 p Alhassane A, Salack S, Ly M, Lona I, Traoré SB, Sarr B (2013) Évolution des risques agroclimatiques associés aux tendances récentes du régime pluviométrique en Afrique de l’Ouest sahélo-soudanienne. Sécheresse 24(2):282–293 Ali A, Lebel T (2009) The sahelian standardized rainfall index revisited. Int J Climatol. doi: https:// doi.org/10.1002/joc, pp 1–13. Published online in Wiley Inter Science. http://WWW. interscience Bailly G, Rulleau B, Rey-Valette H (2016) Apport des consentements à payer et de leur spatialisation à l’étude de l’acceptabilité des politiques d’adaptation à la montée du niveau de la mer liée au changement climatique. Géographie, Économie, Société 18:387–408 Beck U (2001) La société du risque. Sur la voie d’une autre modernité, Paris, Aubier, Flammarion, 521 p Becu N, Amalric M, Anselme B, Beck E, Bertin X, Delay E, Long N, Marilleau N, Pignon Mussaud C, Rousseaux F (2017) Participatory simulation to foster social learning on coastal flooding prevention. Environ Model Softw 98:1–11 Bohbot R (2008) L’accès à l’eau dans les bidonvilles des villes africaines Enjeux et défis de l’universalisation de l’accès (Cas d’Ouagadougou) Mémoire. Université Laval, Québec, p 264 Boko M, Kosmowski F, Vissin WE (2012) Les En-jeux du Changement Climatique au Bénin: Pro-gramme pour le Dialogue Politique en Afrique de l’Ouest. Konrad-Adenauer-Stiftung, Cotonou, Bé-nin, p 65 Brooks N (2006) Changement climatique, sécheresse et pastoralisme au sahel: Note de discussion pour l’Initiative Mondiale sur le Pastoralisme Durable, WISP, 12 p Cissé A (2019) Problématique de l’accès et de la gestion communautaire de la ressource en eau dans la commune de Mangagoulack (région de Ziguinchor). Mémoire de Master, UASZ, 135 p CONGAD (2009) Livre bleu « L’eau, la vie, le développement humain » Rapport pays: Sénégal, Document de consultation fourni par Senagrosol Consult, 72 p DGPRE (2014) Plan d’action de gestion intégrée des ressources en eau (PAGIRE) projet de mise en œuvre du PAGIRE dans le bassin arachidier (PAGIRE-BA) étude d’évaluation et de suivi des ressources en eau de surface, R3- rapport sur la modélisation des ressources en eau et les normes de conception des ouvrages Diouf E (2013) Ouvrage hydrauliques et modèles de gestion de l’eau dans le bassin de fleuve Casamance, Thèse, Université Paris Ouest-Nanterre de la Défense, 308 p Djohy GL, Edja AH (2018) Stratégies d’adaptation des éleveurs et maraîchers à la variabilité climatique. Ann UP Série Sci Nat Agron 8(2):83–91 Dugué MJ, Delille H, Malgrange S (2012) Caracté-risation des stratégies d’adaptation au changement climatique en agriculture paysanne: Etude de ca-pitalisation réalisée sur les terrains de coopération d’AVSF. Agronomes et Vétérinaires sans fron-tières, Lyon, p 150 EPER (2009) Changements climatiques au Niger, 10p. http://www.brotfueralle.ch Faye C, Dieye S (2018) Valorization of water resources in Senegal for economic, social and sustainable development. Afr J Environ Sci Technol 12(12):449–460 Faye W, Orange D, Kane A, Niang A, Minea I (2017) Impacts de la variabilité climatique et de la pression démographique sur les ressources en eau du bassin de Thysse Kaymore (SaloumSénégal). Lucrările Seminarului Geografic Dimitrie Cantemir 44:109–124 Faye C, Gomis EN, Dieye S (2019) Current situation and sustainable development of water resources in Senegal. Ecological Engineering and Environment Protection 1:5–16
230
C. Faye and C. A. A. S. Sadio
Guibert H, Ulrich CA, Dimon RO, Dedehouanou H, Vissoh PV, Vodouche SD, Tossou RC, Agbossou EK (2010) Correspondance entre savoirs locaux et scientifiques: perceptions des changements climatiques et adaptations. ISDA, Montpellier, 28–30 Juin, 10 p IPCC (2007) Climate change 2007: synthesis report. In: Core Writing Team, Pachauri RK, Reisinger A (eds) Contribution of Working Groups I, II and III to the Fourth Assessment Report of the Intergovernmental Panel on Climate Change. IPCC, Geneva, Switzerland, 104 pp IPCC (2014) Changements climatiques 2014: Rapport de synthèse, Contribution des Groupes de travail I, II et III au cinquième Rapport d’évaluation du Groupe d’experts intergouvernemental sur l’évolution du climat [Sous la direction de l’équipe de rédaction principale, R.K. Pachauri et L.A. Meyer], Genève, Suisse, 161 p Jahiel M (1996) Phénologie d’un arbre méditerranéen acclimaté au région tropicale, le dattier au Sud du Niger et son appropriation par la société Manga, thèse de doctorat, Académie de Montpellier, Université de Montpellier II, Sciences et techniques de Languedoc, 138 p Kruel S (2016) The impacts of sea-level rise on tidal flooding in Boston, Massachusetts. J Coast Res 32(6):1302–1309 Le petit Larousse (2017) Great French dictionary in French with encyclopedia. Internet key for 2017 edition expired 1-1-2019 fyi. Get French news at FRANCEINFO.COM. Collins has a new French-English dictionary Malou R, Saos JL, Lienou G (1984) Caractérisation des relations eaux de surface-eaux souterraines en milieu tropical sec: exemple du bassin de la Nema (Sine-Saloum), CRH, 46 p Metzger P, D’Ercole R (2011) Les risques en milieu urbain: éléments de réfléxion, EchoGéo, No. 18, disponible sur. http://echogeo.revues.org/12640 Moyo M, Mvumi BM, Kunzekweguta M, Mazvimavi K, Craufurd P, Dorward P (2012) Farmer perceptions on climate change and variability in semi-arid Zimbabwe in relation to climatology evidence. Afr Crop Sci J 20(2):317–335 Nassourou LM, Sarr B, Alhassane A, Traoré S, Abdourahamane B (2018) Perception et observation: les principaux risques agro-climatique de l’agriculture pluviale dans l’ouest du Niger. VertigO - la revue électronique en sciences de l'environnement 18(1). https://doi.org/10.4000/ vertigo.20003 Nicholls RJ, Hoozemans FMJ, Marchand M (1999) Increasing flood risk and wetland losses due to global sea-level rise: regional and global analyses. Global Environ Change 9(Suppl 1):69–87 Ouédraogo M, Dembélé Y, Somé L (2010) Perceptions et stratégies d’adaptation aux changements des précipitations: cas des paysans du Burkina Faso. Sécheresse 21(2):87–96 Ozer P, Bodart C, Tychon B (2005) Analyse climatique de la région de Gouré, Niger oriental: récentes modifications et impacts environnementaux. Cybergeo: Revue Européenne de Géographie 308:1–24 Ozer P, Hountondji Y-C, Laminou O, Manzo O (2009) Evolution des caractéristiques pluviométriques dans l’est du Niger de 1940 à 2007. Geo-Eco-Trop 33:11–30 PANA (2008) Convention-cadre des Nations Unies sur les changements climatiques: Programme d’Ac-tion National d’Adaptation aux changements cli-matiques du Bénin (PANA-Bénin), MEPN, Coto-nou, 81 p Pigeon P (2002) Réflexions sur les notions et les méthodes en géographie des risques naturels, Annales de Géographie, numéro spécial, n° 627–628, pp 452–470 Rolston A, Jennings E, Linnane S (2017) Water matters: an assessment of opinion on water management and community engagement in the Republic of Ireland and the United Kingdom. PLoS One 12(4):e0174957 Sadio CAAS (2019) Etude hydrologique des zones humides en basse Casamance à partir de l’exemple du marigot de Baïla. Mémoire de Master, UASZ, p 141 Sadio CAAS, Faye C (2021) Variation pluviométrique et ressources en eau: quelle perception des populations dans le bassin du marigot de Baïla ? In T Sané, EHB Diéye, AH Dia, L Descroix, BA Sow, P Diédhiou et al. Vulnérabilité des sociétés et des milieux côtiers et estuariens d’Afrique de l’Ouest, Actes du Colloque international LMI-PATEO – UASZ, tenu à l’Université Assane Seck de Ziguinchor (Sénégal) du 19 au 22 novembre 2019, 135–146
11
Water and Geohazards in Lower Casamance: Risk Perception and. . .
231
Sarr B, Sanoussi A, Mohamed L, Salack S, Timothée O, Sébastien S, David AG (2015) Adapting to climate variability and change in smallholder farming communities: a case study from Burkina Faso, Chad and Niger. J Agric Ext Rural Dev 7(1):12 Senagrosol-Consult (2009) Environnementale stratégique des activités relatives à la promotion de l’irrigation dans les Niayes, le Bassin arachidier élargi à la région de Tambacounda et la Casamance. Rapport final, 191 p Tidjani AD, Abdou AA, Faran M, Amadou O, Amoukou I, Ozer P, Bouzou I, Ambouta KJ-M (2016) Perceptions de la variabilité climatique et stratégies d’adaptation dans le système oasien de Gouré (Sud-est Niger). Agron Afr 28(2):25–37 Verlynde N (2018) De la perception du risque d’inondation aux propositions d’adaptation en territoire de côtes basses densément peuplées: le cas de la communauté urbaine de Dunkerque. Géographie. Université du Littoral Côte d’Opale, 2018. Français. ffNNT: 2018DUNK0500ff. fftel-02085107f Zoundjè F, Donou B, Ogouwalé R, Yabi I, Ogouwalé E (2013) Vulnérabilité de la production maraîchère a la Variabilité hydro-climatique saisonnière dans la Commune d’Adjohoun (Bénin, Afrique de l’ouest): 549-554. In: Boko M, Vissin EW, Afouda S (eds) Climat Agriculture, Ressources en Eau d’hier à demain. Actes du XXVIème Col-loque de l’AIC, Cotonou
Chapter 12
The Risk of Marine Erosion in Tunisian Beaches: A Retrospective Reading for a Prospective Vision Ameur Oueslati
Abstract Low coasts, especially sandy beaches, are the spaces that have, so far, attracted the most numerous and dense human concentrations and managements in Tunisia. They also correspond to the coasts that have suffered the heaviest damage from marine erosion. This paper tries to come back on the main ideas developed by previous works concerning the characteristics, trends, and factors of beach erosion. The period considered spans about a century and a quarter of a century and should make it possible to identify lessons and evolutionary trends for better understanding and use of these coasts. Based on such evolution and lessons, we try a classification of the different coasts containing beaches according to the risk of marine erosion in the current state and its consequences. The classification also considers the future implications of the current dynamics without losing sight of the potential vulnerability to the announced acceleration of the sea-level rise in the context of climatic change. Keywords Tunisia · Coasts · Beaches · Marine Erosion · Retrospective · Prospective
12.1
Introduction
Beaches occupy a privileged place in the Tunisian coastal landscape, as they stretch along 550 km long. However, they are not everywhere relayed by dune fields. These take on a certain importance only along some 130 km of coastline (Oueslati et al. 2015). Sandy beaches also correspond to the type of coasts, which have attracted the most numerous and dense managements and are the most affected by the risk of marine erosion. This has caught the attention of several researchers (Paskof 1985;
A. Oueslati (✉) Faculty of Human and Social Sciences, University of Tunis, Tunis, Tunisia © The Author(s), under exclusive license to Springer Nature Switzerland AG 2023 S. D’Amico, F. De Pascale (eds.), Geohazards and Disaster Risk Reduction, Advances in Natural and Technological Hazards Research 51, https://doi.org/10.1007/978-3-031-24541-1_12
233
234
A. Oueslati
Oueslati 1993; El Arrim 1996; Zeggaf Tahiri 1999; Khali 2001; Brahim 2001; Oueslati 2004, 2010; Bou Nouh 2010; Louati and Zargouni 2013; Marzougui and Oueslati 2017; Amrouni et al. 2019) as well as different departments responsible for land use planning and coastal protection mainly the Agency for Coastal Protection and Management (APAL). Its causes are both natural and human. However, an increasingly dominant responsibility is attributed to man’s activity. The most delicate situations characterize the most anthropized sites. Unfortunately, this has increased over time and appears through repeated human interventions that have not always considered the requirements of a balanced evolution of beaches. This paper aims to review the characteristics of the evolution over more than a century and its lessons. It also aims to retrace the main trends of the recent evolution and tries to draw attention to aspects still absent or poorly represented in the literature while they can be of great importance for understanding the risk of marine erosion and the challenges that beaches could face, mainly in the context of the predicted sea-level rise. Finally, we will try to draw up the current state of the various beaches and their classification by considering their situation facing a risk which will increase with the announced sea-level rise. The results are based on previous publications and on various iconographic documents and official archives, often still little or not exploited. However, an undeniable place will be given to the contribution of direct observations in the field allowing data which escape the most commonly used documents (Fig. 12.1).
12.2
Beaches that Apparently Nothing Predisposed to Important Marine Erosion
Given the configuration of the coast to which they belong and the geology and the topography of the land bordering them, the beaches of Tunisia should not experience important marine erosion. They are often lodged at the bottom of gulfs, bays, and creeks, which generally constitute environments more favorable to the accumulation processes than to the wave’s destructive action. In addition, the capes and promontories which frame them are often made of rocks that release sandy material. On the other hand, the bathymetry and marine hydrology are often weak over long coastal segments, especially on the country’s eastern side and its southern part. Even on the northern facade, characterized by its relatively important bathymetry and its exposure to the strongest and most frequent winds in Tunisia, the waves are most often less than three meters in height, a value that is only exceeded during some storms. In the Gulf of Tunis, waves are only 1.5 to 2.5 m high in 6% of the cases observed, and waves greater than 2.5 m can miss several years in a row, as was the case, for example, during the period 1971–1980. Along the eastern coasts, the most frequent waves between Kelibia and Nabeul or at Sousse are, respectively, 0.70 m and 0.40–0.60 m high (Allenbach 1979; Italconsult 1973). Further south, wave energy
12
The Risk of Marine Erosion in Tunisian Beaches: A Retrospective. . .
235
Fig. 12.1 Location of areas and localities mentioned in the text. 1. Tabarka; 2. El Ghirane; 3. Bizerte; 4. Rass Jebel-Beni Ata; 5. Raf Raf; 6. Ghar El Melh; 7. Utica; 8. Foum El Oued; 9. New mouth of Wadi Majerda; 10. North suburbs of Tunis; 11. Hammam Lif; 12. Sidi EjjehmiSoliman; 13. Korbous; 14. Kelibia; 15. Nabeul; 16. Hammamet; 17. Hergla; 18. Sousse; 19. Skanès;
236
A. Oueslati
is weakened in the shores preceded by extensive shallows occupied by important seagrass beds as in large part of the Gulf of Gabès and its islands. The beaches of Tunisia should not also experience significant marine erosion because they receive a dense network of wadis known for their great erosive activity. This is favored first by the rainfall regime, which often leads to torrential, violent, and aggressive flows. It is also favored by the great extension of soft or mixed geological formations and the large areas which have suffered from land clearing and soil loosening works. In such a context, even the most modest wadis can have a high solid load on the occasion of certain rainfall events (Oueslati 1999). Therefore, the situation does not seem, in its natural state, to disadvantage the beaches in terms of sediment supply. However, some exceptions must be noted. They concern the lowest islands as well as the Sahel coast, devoid of a significant hydrographic network. They also concern part of the eastern coast of Cap Bon peninsula, the Gulf of Hammamet, and some segments of the Gulf of Gabès coast because the wadis do not always reach the sea. Some of them empty part of their load into coastal sebkhas, especially those blocked by a relatively thick barrier beach. Be that as it may, wadis brought have long influenced the behavior of different parts of the coastline. They were sometimes sufficient to push back the shore over long distances. The most expressive illustrations are associated with Wadi Miliane and Wadi Majerda, Tunisia’s most important exoreic rivers. The displacement of the shore has sometimes been done over several kilometers since antiquity. In the case of Wadi Majerda, this is witnessed by the position of Utica ruins. The port of this ancient city, which continued to function under the Roman occupation, is now more than ten kilometers inland (Jauzein 1971; Paskof 1985). However, significant illustrations even exist at the mouths of modest rivers, especially in coasts characterized by weak bathymetry. The wadis brought have sometimes led to alluvial fans or plains, sometimes extensive and well-marked in the coastal landscape. This is the case for wadis which open into the lacustrine system of Bizerte (Oueslati 1995). It is also the case at the mouth of the wadis Chaffar and Lben in the Gulf of Gabès or the wadi El Fjé, even more modest, which open into Boughrara bay, opposite Jerba Island. In this last case, large alluvial fans, particularly well-marked in the coastal landscape and on aerial photographs or satellite images, are much more recent. They have appreciably been confirmed, thanks to the large sediment volumes during the two major pluviometric events of autumn 1969 and January 1990 (Kouka 2015). As for the sediment contribution from the open sea, we do not have precise information. However, observations made on some beaches after intense storms brought quite interesting data. This was the case, for example, in the beaches of Sousse the day after the strong storm that occurred in March 2012. Beaches that have lost a large part of their substance or have been totally eroded were naturally
Fig. 12.1 (continued) 20. Monastir; 21. Khnis-Sayada; 22. Rass Eddimess: 23. Mahdia; 24. Chebba; 25. Melloulèche; 26. Sfax; 27. Kerkena I.; 28. Chaffar; 29. Skhira; 30. Bou Said; 31. Oudhref; 32. Gabès; 33. Zarrat; 34. Jorf; 35. Jerba I.; 36. Rass Errmal; 37. Boughrara; 38. Dhar Ghannouche; 39. Zarzis
12
The Risk of Marine Erosion in Tunisian Beaches: A Retrospective. . .
237
reconstituted. Several of them found their initial width by July of the same year. This reconstitution can not be explained by terrigenous or by lateral sedimentary inputs, because the small wadis that flow on this coast are strongly managed and the region had not recorded significant rains between March and July. On the other hand, these beaches are cut off from the neighboring coasts by various obstacles drawn upon the path of the littoral drift. A large part of the sediment was actually pushed from the open sea, consequently to the destabilization of the seabed sediments caused by significant destruction, during the storm, of the marine vegetation (Oueslati 2016).
12.3 12.3.1
A Risk Not Limited to Managed Coasts and Perceived for More than a Century Various Evidences and Indicators
Despite the unfavorable natural context for important marine erosion, as demonstrated above, several beaches have lost an important part of their natural substance or have completely disappeared even in sheltered sites of area characterized by shallow water and weak wave’s energy. This began to occupy an important place in the scientific literature in the last quarter of the twentieth century and was often treated as if it was a new phenomenon. Moreover, protection efforts within the framework of major interventions supervised by the state began after the 1980s following the heavy damage caused by strong storms that occurred in January 1981 in the Gulf of Tunis and on the coast of Sousse (Fig. 12.2). However, the problem has started for over a hundred years as evidenced by different documents. Among the last are postcards which circulated during the first half of the twentieth century, in the 1920s and even the 1900s. Some of these photos show beaches that have become very narrow and sometimes crossed by many alignments of wood groins (Fig. 12.3). The same idea is found in various archival
Fig. 12.2 (a and b) Hammam Lif beach, in the Gulf of Tunis: the situation the day after the storm of January 1981 and the situation today (photos, Ameur Oueslati). The breakwaters shown were installed in the 1980s and correspond to the first intervention by heavy protection structures in Tunisia. The arrow indicates the same trees
238
A. Oueslati
Fig. 12.3 One of many postcards from the first half of the twentieth century showing the narrowing of the beaches in the northern suburbs of Tunis and the wood groins (the original photo is owned by the author)
documents and in newspaper articles. Certain archives like those of the municipalities of the northern and southern suburbs of the city of Tunis evoke damage mainly in the occasion of storms like that of January 1951. Other documents from the same archives indicate that the recourse to wood groins, for example, had already been practiced at least since 1916 (Khali 2001). For its part, the press has often mentioned the problems facing seafront properties. This has become quite frequent especially since the period between the two world wars. Some articles also reveal an important perception of the problem by the local population and report that petitions have been addressed on various occasions to the authorities, by the dwellers of the shores at risk (Khali 2001). Everything indicates that it is in the oldest developed coasts that the manifestations of beach erosion were the first. This is valid even in the shores with little exposure and coasts preceded by a low bathymetry as in the city of Sfax (Fig. 12.4). The most eloquent illustrations, however, belong to the suburbs of Tunis. The aforementioned documentation only provides information on shores that were the first to attract managements. This could suggest that erosion is caused by man. However, the observations that we have been able to make on coastal segments different by their location and their management indicate that the phenomenon is also part of a natural trend. In the region of El Ghirane west of Bizerte, for example, a blockhaus dating from the period of the Second World War (Fig. 12.5) has been for several years, before the recent appearance of second homes in the area, directly beaten by the waves and completely surrounded by marine water during storms. However, when it was set up, it must have occupied a position behind the beach in the middle of the dunes that border it (Paskof 1985; Oueslati 2004). It should be
12
The Risk of Marine Erosion in Tunisian Beaches: A Retrospective. . .
239
Fig. 12.4 Sidi Mansour coast; North Sfax; photo taken by low tide. Part of the dwellings is yet abandoned (example indicated by the white arrow) (photos, Ameur Oueslati, Nov. 2017)
Fig. 12.5 Blockhaus at El El Ghirane, annexed to the foreshore area. It owes its conservation to the fact that it rests on a resistant substratum. Originally, it must have been in the dune area. (photo Ameur Oueslati, July 2015)
noted in passing that in the coastal segments devoid of resistant bedrock, constructions of the same type have often been annexed to the sea and are sometimes found several decameters in front of the shore. Some of the most eloquent examples can be found on the coast of Sousse (Oueslati 2004). In other cases, also away from
240
A. Oueslati
Fig. 12.6 South to Melloulèche (between Mahdia and Sfax): the importance of marine erosion sometimes forced the displacement of coastal tracks. However, the coast is characterized by the weakness of its bathymetry and still away from seafront managements (photo, Ameur Oueslati, Nov., 2017)
managed areas, one can see on the foreshore outcrops of materials that were originally deposited behind the border dune. The latter is in such situations always truncated by an active cliff. This indicates a migration of the entire coastal sedimentary prism. Illustrations have been described between Soliman and Sidi Rais in the bay of Tunis and at various points on the eastern coast of the Cap Bon peninsula (Oueslati 2004). Expressive examples are also found further south, in coasts much less exposed to swells and in environments, like the Gulf of Gabès, logically unfavorable to significant marine action. This is the case, for example, in a large part of the coast between Chebba and Sfax, especially south of Melloulèche (Fig. 12.6). Here, the shore recedes everywhere, sometimes at a rapid speed as indicated by the repeated displacement of the coastal track and the state of the vegetation frequently severely bare at the top of the beach. Significant illustrations also exist in the beaches, often narrow and discontinuous, in the coast which stretches south of Mahares to the surroundings of Skhira (Fig. 12.7), in the coast situated between Bou Said (Fig. 12.7) and Ouedhref north of Gabès as well as in the southwestern part of the peninsula of Jorf, in most of the coast of the Kerkena archipelago, and on the marine face of Slob Echchergui near the Libyan border (Fig. 12.8). All these beaches are still away from managements that could disrupt the coastal dynamics. In addition, they are frequently preceded by a very low bathymetry and sometimes by important shoals.
12
The Risk of Marine Erosion in Tunisian Beaches: A Retrospective. . .
241
Fig. 12.7 The state of the coast at Bou Said (South Skhira), in an area far from all human intervention. The beach has become very narrow, the foredune is truncated and its vegetation bare (photo Ameur Oueslati, Oct. 2018)
Fig. 12.8 On the eastern face of the Slob Echchergui (near the Libyan border), an area equally far from all human interventions, beaches are undergoing a severe erosion. As in the case of the coast of Melloulèche, the state of the vegetation and a coastal track give the measure (photo Ameur Oueslati, Nov. 2017)
12.3.2
What Conclusions?
The above may authorize some essential conclusions. On the one hand, beach erosion is part of a natural trend since its effects manifest even in areas away from direct or indirect human intervention. Man has in reality only accentuated a phenomenon already operating in a natural state. On the other hand, the fact that this erosion began by attracting attention in the managed beaches testifies, in addition to the vulnerability of these milieus, to the importance of waterfront managements as benchmarks and revealers of beaches’ actual condition. Indeed, the regressive trend of a beach often goes unnoticed in the absence of directly threatened properties. This can mislead planners; a wide beach is not necessarily immune to all risks.
242
A. Oueslati
The fact that beaches are endangered in their existence in the absence of human intervention must logically be seen as an essential sign of a change in environmental conditions since these forms are, by definition, the result of dynamics in which the accumulation processes predominate. In any case, the sediment inputs must exceed the volume of the outputs. Such situation which prevailed in the past seems to be over along the major part of the Tunisian coasts. This would confirm the idea, known since the 1980s (Bird 1983), of a shift from a situation of abundance to a situation of sediment scarcity on coasts. However, the data available for the Tunisian coasts does not allow a clear opinion on the causes of such an evolution. The only indicators that can be mentioned with some certainty are related to the sea-level behavior and the stability of the coastal soil. The situation is most delicate in the fields that experience conjunction between the negative effects of the two factors. This is particularly the case in the Gulf of Gabès, especially in its northern half characterized by active subsidence that accentuates the impact of a sea-level rise recorded after antiquity and continues today (Oueslati et al. 1987; Slim et al. 2004). Such an idea is supported by the existence of numerous submerged ancient archaeological remains in this area. The submersion often exceeds 1 m and locally reaches 2 m, like in the Kerkena archipelago, while it is only 20–40 cm in the other parts of the Tunisian coasts considered as tectonically stable (Slim et al. 2004). The same idea is also supported by tide data, the compilation of which allowed to conclude to a relative positive sea level variation four times faster in the port of Sfax, situated in the Gulf of Gabès, than in the ports located further north (Pirazzoli 1986). This actually expresses the effect of the conjunction of the eustatic sea-level rise and subsidence (Oueslati 2021). We can then understand the rapid erosion of several beaches of the Gulf of Gabès and the coasts that extend it towards the border with Libya, evoked above, despite their location away from urbanized spaces and their belonging to shores sheltered and outstripped by weak bathymetries.
12.4 12.4.1
An Inexorable Growing Risk, Especially Since the 1980s A Growing Human Responsibility
In the first decades of the twentieth century, beach erosion attracted attention only on the shores of the northern suburbs of Tunis. These shores were the first to experience an increase in the number of built-up coastal areas. The time factor is important. In general, the manifestations of erosion are, in a given site, all the more apparent the older the management. This also consists of the first proof and manifestation of man responsibility in beaches’ erosion. The error came from the fact that buildings were often located very close to the sea, regardless of the width and the state of beaches. This led to disturbances in the sediment dynamics and the exchange between the different parts of the transverse profile of the beaches and the foredunes. Such a
12
The Risk of Marine Erosion in Tunisian Beaches: A Retrospective. . .
243
Fig. 12.9 Example of a foredune leveled to allow an open view on the sea; beach of the Ismail hotel in Tabarka (photo, Ameur Oueslati 2004)
dynamic is, as is well-known today, of capital importance for beaches’ balance and their adaptation to sea conditions. We also know the importance of the foredune mainly during the difficult moments that a beach can face, such as during storms. It constitutes a vital sedimentary reserve and acts as a screen against the strong waves and the flooding of the lowlands which relay it. Unfortunately, this has been very often overlooked. In addition, other weakening practices have been added over time. Even when it escaped the concrete, the foredune was sometimes razed just to allow the occupants of certain constructions to have a view of the sea (Fig. 12.9). The multiplication and densification of waterfront hard constructions can only accentuate marine erosion and extend it to increasingly long coastal segments. Such an evolution has been confirmed over the last decades, especially with the significant development of seaside tourism in the 1980s. Before that date, the perception of the seashores by the Tunisians was quite different. Many newspaper articles, sometimes dating from the beginning of the twentieth century, relate the attraction of Tunisians to the beaches (Oueslati 2004). But there was no obsession with building feet in the water. Except in the towns that have welcomed a large European community, the inhabitants have rarely opted for a permanent dwelling on the shore, even in coasts with extensive beaches. Rather, a significant distance was kept from the sea to avoid soil moisture and wind sand. Many expressive illustrations of the recent change in perception of the coast as a result of the development of tourism were described as well in small towns such in the Cap Bon peninsula (Korba, Menzel Temime, Tazarka, etc.) and in the Sahel (Rejiche, Salakta, etc.) as in large cities like Nabeul and Gabès (Oueslati 2004, 2010). The island of Jerba also offers a particularly expressive illustration. Its eastern coast, which is entirely made up of sandy beaches and expands over 40 km, remained almost deserted until the 1970s. The rare constructions that one found are some marabouts inherited from times of insecurity
244
A. Oueslati
experienced by the island. This coast’s first hotel (El Jazira) was built in 1958 (Paskoff and Miossec 1979) and will remain isolated until the 1970s. Today, apart from the spits of Rass Errmal and El Gastil, this coast is heavily occupied and counts hundreds of hotels. In fine, even in Tunis, a large part of the beaches, especially in the southern suburbs between Rades and Hammam-Lif, would have remained unbuilt, at least for a good portion of the twentieth century in the absence of the French colonization. In recent decades, practices that have harmed beaches and increased the risk of marine erosion have multiplied and diversified. The interventions which had the most impacts on the dynamics and the sediment budget took place both inland and on the shore. Inland, varied managements have reduced terrigenous inputs to the beaches. They consist of a multitude of dams as well as different water and soil conservation works in the watersheds of a large part of the exoreic wadis. Their consequences were felt most in the beaches of the northern and central parts of the Gulf of Tunis, which receive the two largest exoreic rivers. However, even in smaller streams on the east coast, the effects were sometimes startling. The situation at the mouth of Oued Chaffar south Sfax gives one of the expressive illustrations. The creation of a dam and the multiplication of obstacles in the watershed of this wadi have caused an unprecedented acceleration of the erosion of the beach (Fig. 12.10).
12.4.2
An Erosion at Rapid Pace
Many publications have tried to quantify the displacement of the shore consequently to marine erosion (El Arrim 1996; Louati and Zargouni 2013; Brahim 2001, Oueslati 2004; Bada 2017; Marzougui and Oueslati 2017; Amrouni et al. 2019). Much of the quantification results were based on documents of different dates (topographic maps, aerial photographs, and satellite images). Among the many values, we mainly consider in this work those obtained for long coastal stretches allowing to take into account different factors in action and those covering periods sufficiently long to reveal a clear evolution trend. However, the results obtained for specific short coastal segments or relatively short periods are sometimes significant. They deserve to be mentioned as they can reflect the specificities of some particular environments or the critical impact of specific management or events. The first quantification attempts, carried out until the last years of the twentieth century, did not always use methods and software allowing precise control of the margins of error in the results obtained. However, the available results are not devoid of interest with regard to the long periods often covered by the documents and the critical change experienced by some beaches. Four main coastal segments, containing long beaches, have been mainly concerned: the Gulf of Tunis, the Gulf of Hammamet, the eastern coast of the island of Jerba, and the coast of Mahdia. A first summary (Oueslati 2010) of the data obtained for the last three decades of the twentieth century confirms the general trend marked by the retreat of the shore. This was often done at a speed varying between 0.5 and 2 m/year and has sometimes
12
The Risk of Marine Erosion in Tunisian Beaches: A Retrospective. . .
245
Fig. 12.10 The state of the beach and the recent constructions a few hundred meters from the mouth of Oued Chaffar: the comparison of the photos is revealing as to the significant reduction in the width of the beach and the rate of the shore retreat (Photos, Ameur Oueslati)
reached 5 m/year. Higher values are reported by studies devoted to limited areas and over short periods. Most of them are in fact obtained for sites whose sedimentary dynamics have been brutally disturbed by port managements. The maximum value was recorded in contact with the fishing port of Ghar El Melh, in the north-western part of the Gulf of Tunis. The beach cut off from the inputs of the coastal drift retreated, from 1974 to 1976, from 90 to 100 m on a stretch of coast 560 m long (El Arrim 1996). Important values were also obtained for coasts which have suffered the effects of strong sea storms such as the beaches of the bay of Tunis following the storm of January 1981, mentioned above. A large part of the beaches, sometimes several decameters wide, but bordered by hard constructions, were washed away in the space of a few days. More recently, the quantification of shoreline mobility from cartographic, photographic, and imagery documents has benefited from increasingly sophisticated
246
A. Oueslati
computer tools and software. The results obtained are more precise and confirm the general trends identified by previous publications. However, they often report higher values suggesting an increase in the risk. A study (Bada 2017) covering the entire Gulf of Hammamet, the eastern side of the Cap Bon peninsula, and part of the Sahel coast has shown that a large part of beaches is eroding. Shoreline retreat has fluctuated through time but with a tendency for acceleration in urbanized areas. Shoreline retreat reached in different sites values between 4 and 6 m/year. The highest values were recorded in the beaches bordered by dense constructions or cut off from the contributions of the littoral drift. Other studies have been devoted to the beaches located on the front of the Oued Majerda delta and at the bottom of the bay of Tunis (Louati and Zagrouni 2013; Marzougui and Oueslati 2017). The results also confirm an accentuation of the rate of erosion, especially in the beaches bordered by hard buildings. They also confirm the extension of the risk in parallel with the extension of the building along the shore. Beaches that until recently had been spared this risk have sometimes become among the most vulnerable. This is particularly the case of the beach stretching between Sidi Ejjehmi and Soliman in the eastern part of the bay of Tunis. In its natural state, this beach corresponds to a united sediment cell and was largely outside waterfront managements until the 1990s. Since then, the situation has changed dramatically, and the area has quickly become one of the most threatened by marine erosion. The rate of the shoreline retreat over the last decade has often exceeded 4 m/year and sometimes reached 7 m/year. As we will see later, this erosion started with the first waterfront constructions and has been then accentuated by unsuited protective works. It should finally be noted that the results drawn only from cartographic, photographic, and imagery documents can sometimes be erroneous. A recent work (Amrouni et al. 2019) applying a photogrammetric assessment on documents covering a part of the Gulf of Hammamet for the period between 1887 and 2018 concluded to a regressive evolution accentuated by urbanization. The idea as such is in concordance with the results of previous works. However, some of the advanced values cannot convince, because, returning to the field truth, some of these values seem doubtful, even inconceivable. For example, we cannot admit that at the level of the central and southern parts of the town of Hergla, the shore was in 1887 behind the current one and that it has since moved over several decameters towards the sea. Quite simply because the morphology is that of a cliff more than 10 m high, cut in a Plio-Quaternary clay-sandy formation and crowned by a thick and resistant limestone crust. The land cannot gain ground over the sea when the shore corresponds to an active cliff. Likewise, in the northern part of the study area, the 1887 shore is placed by the authors in the sea more than 150 m ahead of the ramparts of the Medina of Hammamet, while none of the nautical charts of the end of the nineteenth century can confirm it. This Medina has long been known for its proximity to the shore; its ramparts also appear in contact or at a short distance from the sea on postcards and drawings dating from the beginning of the twentieth century. In fact, we are in the presence of one of the illustrations of the limits of the results obtained by works carried out on the basis of the only manipulation of documents, even if it is by sophisticated computer tools. Monitoring the evolution in
12
The Risk of Marine Erosion in Tunisian Beaches: A Retrospective. . .
247
the field always provides important additional information and can even lead to interpretations in total opposition to those based solely on documents. Some illustrations will be given through the following case presentation.
12.5
The Documents Do Not Reveal Everything and Can Sometimes Mislead
The results obtained thanks to the various documents mentioned above have allowed first insight as to the shore mobility. This is important for the assessment of risks due to marine erosion. However, it does not capture all the components of the problem. Indeed, the width criterion is not the only indicator of beach vulnerability. The thickness of sediments is also essential. On the other hand, the width observed in satellite images and aerial photos does not always reflect the width established by natural dynamics, especially in anthropized areas. This can be significantly changed by the owners of the waterfront properties. No less critical, the documents mentioned above do not always allow us to identify the effects of exceptional events. The vulnerability of beaches and the marine erosion risk are indeed often revealed during some storms. Finally, the documents do not show the behavior of the threatened property owners, which is essential for understanding the public’s perception of the risk. Hence, information accumulated through direct observations in the field over a sufficiently long period can help fill in such gaps and provide elements essential for assessing the risk in its various components. Unfortunately, the cases of beaches for which we have, in addition to the above results of the exploitation of documents, data acquired thanks to direct field observations over relatively long periods have remained few. Moreover, the protection works have, in many cases, interrupted the monitoring process. The use of hard structures has multiplied in parallel with the multiplication of sites concerned by the risk of erosion. It sometimes started at early dates, which makes the accumulated data just archival ones. Such an evolution applies to a significant part of the southern coast of the Sousse agglomeration and especially to a large part of the coast of Tunis. These coasts were, as evoked above, the first to undergo significant protection works after the damage caused by the exceptional storms of January 1981, so that the most recent photos showing their natural beaches date back to more than 30 years. The problem of information discontinuity due to protection works also arose, but at a more recent date, for several shores such as those of Kelibia, Mahdia, or Chebba and Sfax. In other situations, the natural dynamics of the beach was blurred by the backfill of the foreshore (Taparura Project in Sfax, Marina of Bizerte; Khnis-Ksibet El Mediouni coast near Monastir, Ben Ghayadha project in the south coast of Mahdia, etc.), the creation of waterfront roads (between Lamta and Eddimess in the Sahel), and the accumulation of dredging products (Radès-La Goulette, Sayada, etc.) or urban and industrial discharges (Sfax, Gabès, etc.). Nonetheless, beaches
248
A. Oueslati
where the monitoring of the evolution of the position of the shoreline is still possible or has continued to be possible until the very last few years exist yet. This is particularly the case in the towns of Tabarka and Bizerte, in the vicinity of Rass Jebel, in Raf Raf, on the coast of Nabeul-Hammamet, in Sousse North, in Mahdia North, in Chaffar situated south of Sfax, in Gabès, and in Jerba Island. In the following paragraphs, we present two cases belonging, respectively, to the country’s north facade and the east facade. These cases are also chosen for their expressiveness about the importance of the risks associated with marine erosion but also for the insights they can provide on certain phenomena and data that may escape work based on the interpretation of documents and that only repeated observation of the field could allow.
12.5.1
The Corniche Beach of Bizerte
This beach stretches between Cap Bizerte and the marabout of Sidi Salem over a length of about 4 km. It began to be occupied by waterfront constructions relatively early, under French colonization. However, a clear distinction must be made between its northern and its southern half. The northern sector contains the oldest managements and was the first to show the manifestations of wave destructions. This has been mentioned at least since the 1970s (Mathlouthi and Paskoff 1981; Oueslati 1993). A wall was built to protect the coastal road occupying the site of the foredune. Since then, and depending on the state of the sea, a beach rarely wider than 15 m has reconstituted or disappeared. The wall itself has given way and been rebuilt on various occasions. The last time this happened was in November 2019, following an ordinary storm. Near the Petit Mousse restaurant, in the southern part of this sector, dwellings dating from the colonization period have not benefited from protection which allows a better appreciation of the effect of marine erosion. All the constructions were severely damaged and have lost the entire beach to which they had come to seek proximity. In addition to the shore retreat revealed by various aerial photography missions, direct field observation concludes a vertical lowering of the beach surface, at least several decimeters. This is evidenced, for example, by the steps of the doors overlooking the sea, which have become perched. The owners then resorted to the construction of stairs, some of which in turn became perched (Fig. 12.11). One of these stairs is now suspended more than a meter and a half above the foreshore. Here, we have the expression of one of the crucial modalities of the beach regression that a work limited to the exploitation of documents does not allow detection or measure. The southern sector, up to the Ain Mariem hotel, is the one that attracts the most attention today because of the sudden change in the behavior of its beach. Safe from marine erosion until recently, this beach has been severely damaged and more and more aggressively attacked by waves. The signs of fragility first started in its northern part. Further south, the coast of the Residence of Ain Mariem has remained wide and thick until the middle of the first decade of this twenty-first century. Its
12
The Risk of Marine Erosion in Tunisian Beaches: A Retrospective. . .
249
Fig. 12.11 The situation at the Corniche de Bizerte, in the vicinity of the Petit Mousse restaurant: the state of the stairs, witnesses of the important lowering of the surface of the beach (Photo, Ameur Oueslati, April 2010)
width, which we measured on different occasions during the 1995–2005 period, has always varied between 70 and 90 m (Fig. 12.12a). Such situation was explained by the hydrographic context: mainly the existence, about 700 m offshore, of an important shoal (Bou Barrek) lying parallel to the coast and playing in a way the role of a natural submerged breakwater (Mathlouthi and Paskoff 1981). However, the persistence of a wide beach until very recently despite a multiplication of managements since the 1980s could also have links with the evolution undergone by the previous sector. The coastal drift, mainly directed towards the south, has long had an important contribution by the sediments torn from the beaches situated further north. The last having been completely eroded or almost, a new conjuncture took hold, so much so that we are in a situation which may, in a certain way, recall the phenomenon of sedimentary wagons. In any case, everything suggests that the risk of erosion has, over time, increased and moved towards the south in the whole Corniche beach. The big beneficiary is the beach of Sidi Salem located further to the south where it leans against the long jetty of the front port of Bizerte. The situation has deteriorated in this second sector, particularly since the beginning of the 2010s. Marine erosion has already washed away most of the beach, and the constructions overlooking the sea were sometimes severely damaged. Today, the Ain Mariem hotel and the Jalta one situated immediately north are protected by
250
A. Oueslati
Fig. 12.12 The evolution of the beach between Ain Mariem and Jalta hotels in the space of 20 years (1999–2019) (photos, Ameur Oueslati). (a) The beach in 1999; (b) disappearance of the beach and formation of a small cliff showing allogenic materials on the sand of the beach and the foredune; (c) the situation towards the end of a storm in November 2013; (d) the current situation; the place is given to protective structures
riprap dikes (Fig. 12.12d). Before the implantation of these structures, the waves have regularly, especially during storms like that of November 2013 (Fig. 12.12c), shaped small cliffs in the material occupied by the hotels and their external gardens (Fig. 12.12b). The sections reveal the witnesses of practices that have been condemned by various researchers long before the occupation of this part of the Bizerte coast. Indeed, everywhere the sections show the sand of the beach and the foredune covered by various and sometimes harmful materials (landfill products, remains of construction sites, etc.). We also guess that the beach and dune material was used in construction sites because the sections show the sand only over a minimal thickness. In contrast, the old aerial photographs and the morphology of the sectors still not yet built indicate undeniable foredune.
12.5.2
The Case of the Skanès Coast
This coast is comprised between the mouth of Oued Hamdoun and the Monastir peninsula. It is some 11.5 km long and corresponds to a bay occupied by sandy beaches relayed by a small dune field punctuated by palm trees. Until the 1980s, its
12
The Risk of Marine Erosion in Tunisian Beaches: A Retrospective. . .
251
dune space was exploited by vegetable gardens devoid of solid constructions. The former Presidential Palace, located at its eastern end, was the only significant building. Today, the major part of this coast is covered by hotels and various tourist facilities. On the eve of tourism development, the beach had a width varying from 20 to 90 m and was the most extensive in the central part of the bay. It enjoyed a sediment supply ensured mainly by a littoral drift that runs in two directions. The first runs East carrying a part that Oued Hamdoun brought. The second comes from the East and pushes the sediments torn from the cliff of Monastir. The foredune is modest by its height (2–4 m) but relatively wide (30–120 m) and forms a continuous ridge wellmarked in the landscape. It was not, however, a coast immune to erosion. In the early 1990s, different weakness forms or even shore retreats were already described, especially in the western sectors (Oueslati 1993). Among the indicators are remains of ancient constructions unearthed in the outer part of the beach. No less significant is that some palm trees were reached by the shoreline and sometimes surrounded by water during storms. In the area now occupied by the Chems hotel, the regressive trend of the coast appeared through a blockhaus inherited from the period of the Second World War. According to aerial photos of the 1974 mission, this blockhaus was separated from the sea by a 29.5 m wide beach. The observations and measurements we made directly in the field show that it began to be reached by storm waves since the mid-1990s. The beach was still 9.5 m wide in 1995 and disappeared by 2002. The blockhaus, then regularly scoured at its base, was already in 2004, tilted towards the sea. It has been intentionally destroyed later. The regressive trend in this western sector of the bay has also been attested by a diachronic analysis of different documents (Bada 2017). The shore receded at a speed of 0.7 m/year to 1.2 m/year between 1962 and 1996 and from 0.8 m/year to 1.2 m/year between 1996 and 2010. The situation has exceptionally deteriorated over the last decade, especially in the western sectors. Almost all of the beaches that have hosted hotels have lost most or all their natural material. Such evolution is due to the reduction of the sediment supply ensured by the coastal drift due to the construction of the dikes of the port of Sidi Abdelhamid basin on the west side and the installation of breakwaters and groins on the eastern side at the level of the presidential palace and the cliffs of the Monastir peninsula. However, the evil came mainly from the proliferation of hard seafront constructions which cut the beach from the dunes. To this were added the effects of other practices or of some natural events which cannot be grasped on photographic or imagery documents. This is mainly the case of works modifying the profile of the beach by an artificial redistribution of its sand. It is also the case for particular storms. Regarding the modification of the profile of the beach was sometimes practiced from the first days of hotel creation. The goal is to maximize the sandy surface made available to customers. This was done by leveling the foredune and spreading its material towards the sea. Such artificial widening of the beach can be misleading if one limits oneself to an analysis of the shoreline evolution on the basis of the documents. Moreover, a small dike (tabia) using the dune sand or allogenic material is generally created between the hotels and the beach and can be moved as the shore
252
A. Oueslati
Fig. 12.13 Reshaping of the beach at the Hotel Chiraz and the evolution after: 1. foredune in the initial state; 2. part of the beach and the foredune destroyed when the hotel was set up; 3. tabia; 4. initial width of the beach; 5. width of the beach obtained after leveling the foredune. The goal was to expand the beach surface offered to hotel guests. But the counterpart was a weakening of the beach. The 2017 photo testifies to this, a storm swept over the beach and forced the use of protection by a riprap dike (photos, Ameur Oueslati)
recedes. Such a practice permitted the expansion of the beach, but it has gradually reduced its thickness, making it increasingly vulnerable to erosion and submersion by waves. In other cases, the buildings have kept a certain distance from the sea, but the dune space that separates them from the beach has been leveled and transformed into gardens and areas to construct large swimming pools. Photos taken on various dates at the Chiraz and Houda hotel summarize some of such practices (Figs. 12.13, 12.14, and 12.15). As for storms, they have often revealed the real vulnerability of beaches and lead to changes that may escape works based solely on cartographic, photographic, or imagery documents. This is what happened, for example, when many rooms of the Miramar hotel were severely damaged, and the beach in front of them eroded (Fig. 12.13). But the coup de grace came with the storm of March 2012 (Oueslati 2016). The damage was numerous, especially in the western part of the bay. In the aftermath of this storm, the landscape was desolate: many felled palm trees, almost all of the constructions overlooking the beach were damaged and sometimes heavily scoured or demolished (Fig. 12.16), and the profile of the beach has been significantly lowered. At different points, the waves truncated the tabias and the ground on which they were built. Many sections show then a superposition of materials of different natures and origins spread over the local sand. Where the waves have advanced inside the hotel enclosures, they often unearthed a superposition of materials reminiscent of that mentioned in the case of the Ain Mariem hotel in
12
The Risk of Marine Erosion in Tunisian Beaches: A Retrospective. . .
253
Fig. 12.14 The evolution of the beach of the Houda hotel, between modifications by human intervention and progression of the effects of marine erosion (the palm tree is the same in the different stages)
Bizerte. Here too, the dune sand has been undoubtedly used in construction sites and replaced by imported soil and sometimes by landfill products. Thus, in addition to their interest in studying the risk of marine erosion, the sites of La Bizerte’ Corniche and Skanès provide data that cannot be revealed by works based only on cartographic, photographic, or imagery documents, such as some important characteristics of the managed area nature or the vertical lowering of the beach and its artificial widening. They also illustrate the possibility of abrupt change in the evolution of beaches that were believed to be unaffected by the risk of marine erosion. In addition, they clearly show that the risk of erosion does not always start
254
A. Oueslati
Fig. 12.15 Photos showing the same situations represented in the previous figure. The last photo shows, through the lower part of the same palm tree (indicated by a black dashed arrow), the importance of the vertical lowering of the beach (photos, Ameur Oueslati)
immediately after management that is not suited to the equilibrium of the beach. The problems can be postponed until a moment of disruption of balance. The latter can be natural, such as during heavy storms. It can also be part of the evolution of
12
The Risk of Marine Erosion in Tunisian Beaches: A Retrospective. . .
255
Fig. 12.16 One of the illustrations of the state of the beaches of Skanès coast in the aftermath of the storm in March 2012. 19 m is the width of the space that was part of the hotel enclosure before the storm. It corresponds to the distance which separated the felled palm tree (small dashed white arrow) from the sea. We also recognize the debris and the external limit (dark arrows) of a pool which was originally implanted at the expense of the inner part of the beach (photos, Ameur Oueslati, March 2012)
neighboring coastal segments which reflect the dynamic complementarily between the different parts of a given coastline. However, the acquisition of all of this data is important, even essential, for the assessment of the risk and the capacity of the beach to withstand the various hazards, especially in a conjuncture marked, as noted above, by an already favorable natural tendency to marine erosion and a conjuncture of a sea-level rise.
12.6
A Negative Assessment at Different Levels: Beaches Often Unarmed to Face the Challenges of the Future
The results of the evolution undergone by beaches for almost a century and a quarter are negative in large part of the Tunisian coasts. This first appears through the current state of these beaches. It also appears through the evolution of management
256
A. Oueslati
practices, decision-makers’ attitude, and the delay in new approaches in managing the risk of marine erosion. The situation is likely to become more complicated if we consider the ability to cope with the environmental changes announced for the future (Church et al. 2010). Several beaches are left weakened in the face of the challenges that the sea-level rise will impose.
12.6.1
With Regard to the General State of the Beaches
At the end of the evolution that has taken place since the beginning of the twentieth century, many beaches were severely weakened; others disappeared or lost most of their natural material (Fig. 12.17). This happened, in part, because of flaws in taking into account the interactions of beaches with the land that borders them (via coastal currents) or which surround them (via rivers). However, the most critical situations characterize the beaches of urban and tourist areas, mainly in the country’s north eastern and eastern parts. Building on the seafront without properly considering the requirements of the sediment dynamic within the beach and its complementarity with the foredune was the most fatal error. In addition to the accentuation of marine erosion, this has often resulted in ugly landscapes and sometimes in a degradation of the quality of beaches’ material. Hard protection structures that have increased since the 1980s are now one of the most striking landscape features in many coastal segments. They have, in many cases, accentuated the ugliness of landscapes, and some of them have aggravated the erosion problems. This is particularly the case with groins which have, like port jetties, disrupted coastal transit. The same type of disturbance was caused by the tombolos formed in the shelter of the breakwaters. As we will see later, the trend today is to remove this kind of structures from different sites. According to the observations we were able to carry out directly in the field until 2015 and their partial update from aerial photographs and Google Earth images, some 240 of the 550 kilometers of beaches in Tunisia are already concerned by the risk of marine erosion. About 20% of them have already lost all their original natural sand and have been the subject of numerous works of protection, most often by heavy structures. These are mainly beaches on the most highly urbanized coasts or tourist areas. Another third of the same 240 km is made up of beaches which already show different forms of weakness and have already been the subject of protection works, especially by private initiatives. Interventions by heavy defense works carried out by the state exist but they still located. However, given the rate of change due to erosion, larger protective interventions should not be long in coming, because the manifestations of the shore retreat are already recognizable even where the managements are very recent and have not yet taken over the entire shore. Considering the coastal segments that have just been the subject of managements and given the ongoing evolution of the occupation of the coasts, we should expect the list of risky beaches to continue to grow. The situation will only get worse as long as the recklessness and imprudences evoked above continue to recur. No less significant
12
The Risk of Marine Erosion in Tunisian Beaches: A Retrospective. . .
257
Fig. 12.17 The present state of Tunisia’s beaches. 1. Beaches in strong erosion with sometimes, especially in highly urbanized coasts, total disappearance of the original material; various hard protection structures. 2. Beaches already heavily developed; many forms of erosion; protective structures in the most affected sites. 3. Beaches under management; appearance of forms of erosion as managements increase; localized protection interventions, often by private initials. 4. Beaches being eroded in the absence of human intervention. 5. Thin beaches along soft or rocky low coasts; rapidly eroding in loose coasts. 6. Long beaches still largely sheltered from managements; however, forms of weakness are sometimes declared as soon as human intervention has taken place. 7. Beaches in progradation. 8. Beaches in temporary progradation. 9. Coasts with cliffs and rocky coasts, beaches enclosed in creeks and small bays where they escape erosion mainly where there are wadis. 10. Small cliffs with sometimes ephemeral beaches at the foot
also is the fact that erosion is observed, as demonstrated above, in many shorelines containing non-managed beaches. As for the beaches still relatively sheltered from the risk of marine erosion or which do not show signs of evident modifications, they mainly belong to the north coast, especially to the West of Bizerte and on the West side of the Cap Bon
258
A. Oueslati
peninsula. Most of them continue to benefit from significant sediment inputs due, as mentioned above, to their location around the mouths of wadis, in small bays, or in contact with cliffs and rocky coasts in a sandstone geological framework. The beaches in clear progradation concern a coastal linear of about thirty kilometers in length. They are found around the mouths of some wadis and in the distal part of spits such as that of Rass Rmal in Jerba or those of Bou Rmada and Nakta at the mouth of Oued Chaffar south to Sfax. They are also found at the jetties of some ports and in shores that benefit from a supply from the open sea. The last situation started to take on particular importance in the last two decades, mainly in the southern areas. The barrier islands of Dhar Ghannouche, which appeared recently between Jerba Island and Zarzis, are one of the most telling illustrations (Oueslati 2005; Masmoudi 2010; Akacha 2021). Other examples exist between the city of Gabès and the port of Zarrat; they can be noted on different Google Maps. It was interpreted as the counterpart of destabilization of the sediments consequent to the degradation of seagrass beds (Oueslati 2016) and seems hence to constitute a temporary situation. Among the various situations identified, it is in the most heavily managed beaches and already affected by the risk that the effects of the sea-level rise will be most felt. More and more, varied and costly protection works are to be expected. The situations will be further aggravated in the lower coasts devoid of dune fields and important wadis, so much so that on the whole it is in the gulf of Tunis and on the eastern side of the country that the beaches will suffer the most.
12.6.2
With Regard to the Evolution of the Occupation of the Coast and the Attitude of Officials and Decision-Makers
12.6.2.1
About Coast Occupation’s Evolution and Decision-Makers’ Attitude
The interventions and practices that triggered or worsened the erosion of beaches in Tunisia were initially done out of ignorance; the coastline was still very poorly managed, and no major diagnostic studies were available about the risk of marine erosion. But later, they took place in the framework of a certain stubbornness to ignore specialists’ advice and not trying to learn from past experiences. Several practices condemned as early as the 1980s and 1990s and sometimes even since the 1970s continued to be reproduced until the very last years. This is particularly the case for hard constructions on the beach and its dune. Moreover, until the last few years, we continued to encounter recent hard construction in clearly eroding coasts (Fig. 12.18). In some areas the occupation of the foredune continues to take place in the vicinity of buildings that have lost their beaches, that are in the process of erosion, or that have been the subject of significant protection works. Examples are numerous in big cities (Bizerte, Raf Raf, Tunis,
12
The Risk of Marine Erosion in Tunisian Beaches: A Retrospective. . .
259
Fig. 12.18 One of the many illustrations of perseverance in reproducing the same mistakes in the Kerkena archipelago. Appearance of hard constructions in a clearly eroding coast. The arrows indicate the same low wall, originally (in 1993) created as a protective structure (photos, Ameur Oueslati)
Kelibia, Nabeul, Sousse, Mahdia, Sfax, Gabès, etc.), but also in areas that still keep a rural character (the coast of Beni Ata near Rass Jebel, the coast between Melloulèche and Sfax, the coast of Kerkena archipelago, etc.). As for decision-makers and departments in charge of regional planning, we can first mention the lack of firmness in the application of the regulations in force. The law on the delimitation of the Public Maritime Domain (DPM) dates from the 1990s. However, we even continue to find very recent boundary markers very close to the sea, sometimes on the beach or in the intertidal area. This is all the more surprising as it applies even to land still sheltered from shore managements (Fig. 12.19). Moreover, since the promulgation of such law, large coast segments have seen a multiplication of hard constructions on the seafront, frequently on foredunes and sometimes on the internal part of the beaches. Demolitions have certainly taken place, but they have often remained limited to of the structures encroaching on the beach and the foredune. This is what we saw, for example, during interventions in some hotels of Sousse during the months of March and April 2022. In any case, the number of managements affected by such a measure remains insignificant compared to all those in an illegal situation. Moreover, encroachment on the beach and the DPM has even continued within the framework of large approved housing estates. The situation in the southern part of the city of Gabès provides one of the most glaring illustrations of the disconnect between the legal texts and their application. A large housing estate (Bou Chemmaoui on the advertising panel displayed until November 2017 at the entrance to the site) was built on the foredune and the internal part of the beach, in a particularly vulnerable coast (Fig. 12.20). This is indicated by vestiges of military structures (a blockhaus and a machine gun nest) inherited from the Second World War period and are now part of the intertidal zone. The state of waterfront dwellings also shows it in the neighboring coastal segments both on the Northside and on the Southside. Some of these dwellings are already subject to severe erosion while they are sometimes very recent.
260
A. Oueslati
Fig. 12.19 A very recent boundary marker of the Public Maritime Domain located in the intertidal zone (photo, Ameur Oueslati, Nov., 2017). It is already beginning to be dislodged by waves and is overtaken by seawater during storms, as the puddles visible on the track suggest. According to the DPM definition, it must be further inland!
Fig. 12.20 The northern end of the Bou Chemmaoui estate created at the expense of the dunes bordering the beach in a coast in clear erosion (Photos, Ameur Oueslati, Nov. 2021): 1. the northeastern part of the estate; 2. the foredune; 3a. blockhaus; 3b. machine gun nest; 4. recent dwellings but already exposed to the problem of marine erosion
12.6.2.2
Delay in Soft Protection Methods’ Adoption and Prospective Approaches
One of the most serious inconsistencies in the fight against marine erosion lies in the persistence in the use of methods which have revealed their limits and which have sometimes been criticized (Paskof and Clus-Aubry 2007). What happened, for example, in the beach of Sidi Ejjehmi-Soliman in the bay of Tunis gives one of
12
The Risk of Marine Erosion in Tunisian Beaches: A Retrospective. . .
261
the most expressive illustrations. To protect this beach as well as the village of secondary residence of Soliman Beach and the Solymar hotel, the choice was made on the technique of breakwaters. These allowed the appearance of tombolos, but has at the same time caused a degradation in the quality of the environment as well as a segmentation of the beach and deprived certain sectors from the littoral drift inputs. Immediately to the west of the precited village and hotel, the shore has receded at an average speed sometimes greater than 7 m/year (Marzougui and Oueslati 2017). The heaviest damage was recorded immediately west of the Hotel Solymar. The shore retreat resulted in the disappearance of a row of the lots and the outer street of an estate still in progress. In order to remedy the catastrophic situation, new measures were undertaken since 2018. They must lead to the removal of most breakwaters and to resort to a combination of different techniques: groins, riprap dikes, artificial replenishment, and reconstruction of the foredune. The works now complete, the site has changed in appearance. The wide sandy shore which attracted the housing estate of Sidi Ejjehmi, for example, has given way to a thick riprap dike (Figs. 12.21 and 12.22). All this happened while a few kilometers to the West, in Hammam Lif, breakwaters created in the mid-1980s caused great damage, mainly for the quality of the environment following the eutrophication of the water and the regular accumulation of large quantities of seagrass in the cells that separate the tombolos. This has even sparked many protests by the inhabitants. The disadvantages of the use of breakwaters were, in addition, revealed in other beaches like in Sousse and Mahdia and more recently in Jerba (Oueslati 2004). The risk of marine erosion has been, in addition to the aforementioned recklessness, complicated by a great delay in the use of soft protection methods and a lack in the recourse to managements that do not lead to important disturbances in the beach sediment dynamics. We think mainly to light constructions and soft protection solutions recommended for several years by numerous studies (Paskoff
Fig. 12.21 The culmination of the evolution in a part of the coast of Sidi Ejjehmi-Soliman over the past 12 years: the beach that attracted the housing estate was sacrificed. The same fate was reserved for the dunes which relayed it on the internal side (photos, Ameur Oueslati)
262
A. Oueslati
Fig. 12.22 The culmination of the evolution in a part of the coast of Sidi Ejjehmi-Soliman over the past 12 years: the beach that attracted the housing estate was sacrificed. The same fate was reserved for the dunes which relayed it on the internal side (photos, Ameur Oueslati)
1993; Paskof and Clus-Aubry 2007; Fema 2011). However, the country has undeniable patrimony in this area, unfortunately abandoned and sometimes forgotten. Archival documents from coastal municipalities as well as numerous postcards that circulated during the first half of the twentieth century bear witness to this. Photos taken in Bizerte show the alignments of small wooden rooms on the beach that served as showers or shelters for summer visitors. At Sidi Erraies, in the eastern part of the bay of Tunis, the beach was, until the 1980s, bordered by light constructions on stilts. Likewise, the use of wood groins was common in the beaches of the suburbs of Tunis, particularly in Rades and between La Goulette and CarthageKheireddine (Fig. 12.3). The remains of such groins were yet recognizable in the field until the 1990s. However, the most important light constructions are the famous rotundas which were one of the most characteristic features of the landscape of the shores of the northern suburbs of Tunis. Made of wood, they are set in the water and connected to the beach by suspended walkways (Fig. 12.23). Nowadays, we note a certain return to some past practices. This still however limited. Rare constructions reminiscent of rotundas are used here and there, as in the Bay of Skanès or JerbaZarzis. On the other hand, the strategic retreat principle is almost absent. If some hoteliers have agreed to cede land, it is because part of the buildings was severely damaged by the waves and became unprofitable. This was the case in the tourist area of Skanès following the storm of March 2012 (Fig. 12.24). Previously, the owner of the Jazira hotel, the oldest in the tourist area of Jerba, was forced to destroy the rooms closest to the sea. The delay was also obvious with regard to the artificial replenishment of beaches. However, this method has been mentioned and retained as one of the solutions in many studies. These were carried out at the request of the departments responsible for the management and development of the Tunisian coasts. Some of them date
12
The Risk of Marine Erosion in Tunisian Beaches: A Retrospective. . .
263
Fig. 12.23 One of many postcards from the first half of the twentieth century showing the rotundas (continuous arrows); here the situation of the northern suburbs of Tunis between Amilcar and Sidi Bou Said. The state of the waterfront construction attests to the age of the risk of marine erosion (dashed arrow) (the original photo is owned by the author)
Fig. 12.24 Willful destruction of buildings encroaching on the beach. Example in Skanès the day after the storm of March 2012 (photo, Ameur Oueslati, 2012)
back to the 1990s. Occasional attempts have been made here and there, most often by private initiatives and without prior study or follow-up. It is only in the last 5 years that significant interventions have taken place. The most important were
264
A. Oueslati
Fig. 12.25 Raf Raf beach, one of the rare beaches to have benefited from important artificial replenishment (the coast of Ejjehmi-Soliman in the Gulf of Tunis offers another significant example). This followed attempts at protection by hard structures. The photos also show the evolution of the situation since 1993. We recognize the same building (unfinished on the first two photos) that serves as a landmark. The rapid erosion is mainly due to the waterfront constructions all built on the foredune (photos, Ameur Oueslati)
undertaken in the beach of Raf Raf (Fig. 12.25) and in the beach of the coast extending between Sidi Ejjehmi and Soliman. In this second case, works were carried out, as mentioned above, parallelly to a breakwater removal. The beaches concerned have been greatly extended. A follow-up through observations and repeated measures will help to better understand their reactions to these new interventions. Finally, the only sensitive effort in soft protection was devoted to the regeneration of the foredune by the ganivelles method. This has been applied at several sites and has often given encouraging results. The first experience was carried out on Mahdia beach in the 1990s. But requiring a minimum of space, this technique is impossible in the beaches which need it the most because they have become very narrow and their foredune lies under the concrete.
12
The Risk of Marine Erosion in Tunisian Beaches: A Retrospective. . .
12.7
265
Conclusion: Tunisia’s Sandy Beaches Leave Weak in the Fight Against the Predicted Sea-Level Rise
This work considered the current state of the beaches along the Tunisian coasts as well as the trend which marked their evolution over a significant period, about a century and a quarter long. This is important for the definition of the aptitudes of these forms for management. It is also essential for the assessment of the risk of marine erosion and prospective approaches required by the announced environmental changes. It appears that, despite an unfavorable natural context for important marine erosion, Tunisia’s sandy beaches have lost an essential part of their substance since the beginning of the twentieth century. Some of them have been totally eroded. The evolution has often been measured in the framework of works based on exploiting topographic maps, aerial photographs, and satellite images. This allowed significant results, but these do not reflect the whole reality and are sometimes even misleading, because monitoring the situation by repeated observation in the field has shown that the countenance of the beach can change suddenly following exceptional natural events or following some specific human intervention. This can be of great importance for knowing the true condition of the beach and should help better predict its future evolution. Either way, the risk is greatest in the beaches cut off from their upstream and coastal transit or belonging to the coasts subject to the most numerous and dense waterfront managements. These are often both a cause and a victim. Several of them, including protection structures, are part of reckless practices that unfortunately have continued to be reproduced while their misdeeds have been known for several decades. The problems have also been accentuated by the lack of law enforcement and the delay in resorting to new beach management and protection methods. Only the technique of reconstituting the foredune has received some attention. But it is often impossible on the shores that need it the most because the natural beach has become too narrow and bordered by hard constructions. However, the country has an undeniable heritage in this area. A glimmer of hope seems to be announced with the adoption of the technique of artificial beach nourishment, which has just been applied to two quite extensive beach portions at Raf Raf and in Ejjehmi-Soliman coast. Despite everything, the general assessment remains negative. The damage, already heavy, may worsen when the newly managed beaches are added to the list of those which have reached the risk level. Indeed, the declaration of the last and the manifestation of its damage take some time. More and more beaches will call for protection or restoration interventions. In addition, the situation can only worsen further with the predicted sea-level rise. On the whole, the most worrying situations will be observed in beaches that do not benefit from significant sediment support and are bordered by continuous concrete and masonry buildings. In addition to the accentuation of the waves’ energy by their reflection, the last situation will not allow solutions to adapt the beaches to the new conjuncture. One of these solutions is landward migration.
266
A. Oueslati
References Akacha Z (2021) L’île de Jerba (Tunisie orientale): l’évolution récente de la position du rivage et la vulnérabilité à une élévation du niveau marin; Th. Univ. Tunis, 265p Allenbach M (1979) La zone littorale de la sebkha de Sousse ; une application des techniques de l’océanographie géologique; Th. spéc. géol. ; University of Nice; 193p Amrouni O, Hzami A, Heggy E (2019) Photogrammetric assessment of shoreline retreat in North Africa: anthropogenic and natural drivers. ISPRS J Photogramm Remote Sens 157:73–92 Bada D (2017) Les cellules sédimentaires du littoral entre Kelibia et Chebb (Tunisie): approche géomorphologique; The University of Tunis; 430p Bird ECF (1983) Factors influencing beach erosion and accretion: a global review. In: McLahan A, Erasmus T (eds) Sandy beaches as ecosystems. La Haye, pp 709–717 Bou Nouh A (2010) Nouvelles approches en matière de protection et de gestion du littoral en Tunisie. Méditerranée 115:45–53 Brahim F (2001) Le Sahel central et méridional: géomorphologie et dynamique récente du milieu naturel, doctorat de la faculté des Sciences Humaines et Sociales, Université de Tunis, 432 p Church JA, Woodworth PL, Aarup T, Wilson WS (2010) Understanding sea-level rise and variability. Wiley, 428 p El Arrim A (1996) Étude d’impact de la dynamique sédimentaire et des aménagements sur la stabilité du littoral du golfe de Tunis. Thèse de Doctorat, Faculté des Sciences de Tunis, 223 p Fema P (2011) Manual principles and practices of planning, siting, designing, constructing, and maintaining residential buildings in Coastal Areas (4 edn), vol I, 250p Italconsult (1973) Projet d’infrastructure touristique, contrôle de l’érosion marine. ONTT, Tunis, 187p Jauzein A (1971) Evolution récente du delta de la Medjerda; Les agents de la morphogenèse. Travaux du Laboratoire de Géologie de l’Ecole Normale supérieure 5:128–151 Khali A (2001) Les plages du golfe de Tunis de la Goulette à Hammam Lif: dynamique morphologique récente et apports des archives à la connaissance de leur évolution; DEA; Fac. Sc. Hum. Soc. ; University of Tunis; 125p Kouka M (2015) Le rivage de la petite Syrte: apport de la sédimentologie à l’étude de la progradation du rivage dans les environs de Gigthi (Tunisie méridionale), résultats préliminaires. Physio-Géo 9:1–16 Louati M, Zargouni F (2013) Le littoral entre lʼactuelle embouchure de l’oued Miliane et Soliman, Tunisie. Analyse de l’évolution du trait de côte par photo-interprétation et système d’information géographique. Géomorphol Relief Process Environ 19(2):209–224 Marzougui W, Oueslati A (2017) Les plages de la côte d’Ejjehmi-Soliman (golfe de Tunis, Tunisie) : exemple d’accélération de l’érosion marine dans une cellule sédimentaire artificiellement tronçonnée. Physio-Géo 11:20–41 Masmoudi S (2010) Evolution morphodynamique, sédimentologique et variation du niveau relatif de la mer de l’Holocène à l’Actuel: cas des côtes barrières de Jerba-Zarzis (Sud-Est tunisien). The University of Sfax, 377p Mathlouthi S, Paskoff R (1981) Modifications de la ligne de rivage dans la baie de Bizerte depuis un siècle. Rev Tun Géogr 7:91–103 Oueslati A (1993) Les côtes de la Tunisie; Géomorphologie et Environnement et Aptitudes à l’Aménagement. Publ. Fac. Sc. Hum & Soc.; Tunis, 387 p Oueslati A (1995) The evolution of low Tunisian coasts in historical times: From progradation to erosion and salinization. Quat Int 29-30:41–47 Oueslati A (1999) Les inondations en Tunisie. ORBIS, 206p Oueslati A (2004) Littoral et aménagement en Tunisie. Édit. Orbis Impression, Tunis, 534 p Oueslati A (2005) Sur la genèse de l’île de Dhar Ghannouche et la progradation des plages des segments côtiers voisins (littoral de Jerba-Zerzis; Sud-est de la Tunisie), Actes des JERN. Publications CGMED. Tunis, 9 p
12
The Risk of Marine Erosion in Tunisian Beaches: A Retrospective. . .
267
Oueslati A (2010) Plages et urbanisation en Tunisie: des avatars de l’expérience du xxe siècle aux incertitudes de l’avenir; Rev Méditerranée; N° 115, pp 103–116 Oueslati A (2016) La tempête du 10 mars 2012 sur la côte de Sousse-Skanès (Tunisie orientale), conséquences géomorphologiques et enseignements pour l’aménagement; livre collectif; edit. Robert S, Melin H (eds), pp 295–314 Oueslati A (2021) The lower coasts of the Gulf of Gabès and their wetlands (South-East Tunisia): a geoarchaeological study of the landscape evolution and human occupation in Late Holocene; Zeitschriftfür Geomorphologie, 21 p Oueslati A, Paskoff R, Slim H, Trousset P (1987) Déplacements de la ligne de rivage en Tunisie d’après les données de l’Archéologie à l’époque historique; Coll. C.N.R.S. Déplacements des lignes de rivage en Méditerranée, pp 67–85 Oueslati A, Labidi O, Elamri T (2015) Atlas de la vulnérabilité du littoral tunisien à l’élévation du niveau marin; Publ. Apal-Pnud, 67p Paskof R (1985) Les plages de la Tunisie. Editec C (ed), 198 p Paskof R (1993) Côtes en danger. Masson, Paris, 247 p Paskof R. & Clus-Aubry Ch. (2007). L’érosion des plages, les causes, les remèdes. Institut Océanographique; Paris-Monaco; 184 p Paskoff R, Miossec JM (1979) Evolution des plages et aménagements touristiques à Jerba (Tunisie): Le cas du littoral nord-est de l’île. Méditerranée 35:99–106 Pirazzoli PA (1986). Secular trends of relative sea level change indicated by tide-gauge records. J Coast Res Sp. Issue; N° 1; p. 1-26 Slim H, Trousset P, Paskoff R, Oueslati A (2004) Le littoral de la Tunisie: étude géoarchéologique et historique. CNRS, France, 308p Zeggaf Tahiri M (1999) Étude de l’impact des ouvrages de protection sur la dynamique sédimentaire du littoral du golfe de Tunis et des côtes nord de Mahdia. Thèse de Doctorat, Faculté des Sciences de Tunis, 140 p
Chapter 13
African Indigenous Understanding of Climate Change and Disaster Risk Nexus Gatkuoth Kai Bol and Dewald van Niekerk
Abstract Global climate has changed since 1850 due to anthropogenic emissions of greenhouse gasses that have resulted in widespread impacts on human and natural systems, including indigenous knowledge systems. Yet indigenous knowledge on climate change and disaster risk discourses has been largely excluded as governments prefer to embrace western-centric world view of risk and hazards. In addition, there has been a very limited research on incorporating community/indigenous perspectives on climate change issues. If these practices continued unchallenged, the risk of losing indigenous knowledge for disaster risk and climate change is high. Embracing indigenous knowledge is not only good for humanity, but also it empowers and increases participation of communities in decision-making. In Africa, policy statements on the need to embrace indigenous knowledge are not lacking, however, translating them into action has been limited, if not at all absence. Most disaster risk reduction and climate change policies, plans and strategies acknowledge indigenous knowledge. Some even go further in promoting research on indigenous and traditional knowledge. However, recent risk profiles developed by over 20 African countries largely ignored indigenous knowledge as a source of information leading to development of the risk profiles. Yet disasters occur at local level. It is, therefore, counterproductive to deal with a problem at an inappropriate level. It should be dealt with by local people and not bureaucrats imposing strange world views in expense of lived experiences. This habitual preference of western-centric world view of hazards and risks is not only dangerous but will unfortunately enforce disappearance of lived experience and perspectives informed by thousands of years of inherent African indigenous resilience knowledge, including ability to predict and interpret environmental changes and adjustment of cultural practices and ways of life along those changes. Whereas opponent of indigenous knowledge may question its validity and effectiveness, the fact is that knowledge of local or indigenous communities, particularly their extensive knowledge of the land, home territories and
G. K. Bol (✉) · D. van Niekerk African Centre for Disaster Studies, Unit for Environmental Sciences and Management, North-West University, Potchefstroom, North-West, South Africa © The Author(s), under exclusive license to Springer Nature Switzerland AG 2023 S. D’Amico, F. De Pascale (eds.), Geohazards and Disaster Risk Reduction, Advances in Natural and Technological Hazards Research 51, https://doi.org/10.1007/978-3-031-24541-1_13
269
270
G. K. Bol and D. van Niekerk
basic survival skills, has supported life for millennia and will continue to become the most essential tool in the changing climate. There is growing evidence that indigenous knowledge can challenge, concur or complement scientific knowledge on climate change and disaster risk nexus. There are solid examples that demonstrate that indigenous reports may be based on solid empirical data that western-centric scientific measurements may be inadequate to detect. In this chapter, the authors will extensively discuss African indigenous understanding of the climate change-disaster risk nexus, outline African indigenous coping mechanisms in a changing climate and attempt to make recommendations on integration of African indigenous practices and western science-based perspectives. Keywords Climate change · Disaster risk · African indigenous · Global perspectives · Scientific knowledge
13.1
Indignity and the Science
The word indigenous invites contrasting opinions that are quite difficult to reconcile among scientists and policy makers alike. Among the many, “indigenous” implies exclusion of other people as it denotes originality and making others feel barred (Royer 2016). In African context, characterisation of indigenous peoples on the basis of aboriginality—as per who had existed before colonisation—is a politically divisive issue ((ACHPR) 2006). Therefore, limiting the “indigenous” to those who had existed before the colonial era or those local people who were subject of colonial domination is difficult to apply in African context ((ACHPR) 2006). The ACHPR describes indigenous people as those whose cultures and ways of life depend on access and right to traditional lands and natural resources. This characterisation can also be problematic as many African peoples are seen as indigenous to Africa ((ACHPR) 2006). According to Nakashima et al., “indigenous” tends to apply to people with attachment to particular geography and conditions, i.e. bushmen, native, first people or ethnic minority inter alia (Nakashima et al. 2018). However, making distinction between indigenous people and minorities can be cumbersome as the concept of “indigenous”, in this context, seems to denote “marginalised”, “excluded”, hunters or pastoralists, among others ((ACHPR) 2006). Among the over 50 indigenous peoples in Africa listed by ACHPR—although the list is not exhaustive, many of whom are pastoralists and groups whose life is mainly dependent on traditional hunting ((ACHPR) 2006). Aside of what others would prefer to call indigenous people in Africa any name they may wish, a field ethnography undertaken by the authors found that the indigenous people across the continent were proud to be named as “indigenous”. However, in one of the ministerial sessions on Disaster Risk Reduction that the authors attended, inclusion of the word “indigenous” in the ministerial declaration nearly brought the meeting to a standstill. The term “indigenous” had to be removed
13
African Indigenous Understanding of Climate Change and Disaster Risk Nexus
271
from the declaration to keep the peace. One of the African countries argued that the term was divisive and could ignite conflict among their populations. Owing to the politicisation of the term “indigenous”, there seems to be a general preference of “traditional over the indigenous”. However, “traditional” is not free from misconception. The term “traditional” is used, arguably, to imply primitive (Royer 2016). Consequently, “traditional” may posit colonial characterisation of people and divide them on the basis of the “civilised” or “educated”, “city-dwellers” and “modern”, among others (Chirisa et al. 2018). Understanding from the current use of the term “traditional” or “indigenous”, it seems indigenous people are erroneously characterised as those who live in rural settings—yet “there are indigenous peoples living in cities too” (Nakashima et al. 2018). These debates may further distract attentions needed to bridge divides between the science and indignity. As a working definition, this paper adopts indigenous knowledge as local knowledge-based acquired through experience with and observation of environment and transfer from generation to the next through oral tradition (Spranza et al. 2010). Indigenous knowledge is time, place and culture specific (Spranza et al. 2010). It is broadly defined as a body of knowledge, practices and beliefs that are adaptive to contextual changes from generation to the next (Riedlinger and Berkes 2001). Indigenous knowledge is not a set of tools but a way of life (Kumar et al. 2015). The indigenous or traditional knowledge systems are widely practised and strongly relevant in “post-modern societies” and in many African communities. The African indigenous science and the way of knowing are so encompassing and holistic (Shizha and Emeagwali 2020). The science, people, spirituality, environment and anything that comes with it are inseparable (Chilisa 2012). Key principle underpinning African indigenous knowledge system is sustainability (Shizha and Emeagwali 2020). The African indigenous system is a large part of the continent heritage (Chizha 2016). From physics, engineering and architectural designing, medicine and metallurgy, among others, African science, as can be traced in ancient Nubia, Ethiopia, Egypt and Great Zimbabwe, gave rise to civilisation (Gumbo 2016). About 100,000 years ago, African scientists made world records in mixing paints out of several combinations, including iron oxides, animal fats and charcoal, among others (Shizha and Emeagwali 2020). The discovery of ceramics in ancient Nubia, construction of dams in Ethiopia, early writing in Great Zimbabwe and pyramid in Egypt are significant indicators of greatness of African indigenous science (Shizha and Emeagwali 2020). However, colonial legacy and imperialism have largely disregarded existing knowledge systems and left a stain that continues to undermine indigenous knowledge systems for times ahead (Chirisa et al. 2018). The imperial legacy that the indigenous people are dealing with emanated from the period of “Enlightenment”, also known as the “modernity project”, which had given rise to industrial revolution and dominance of western world views over the traditional/indigenous ways of knowing (Smith 1999). Smith summarised the colonial legacy, in reference to the Pacific, as “they came, they saw, they renamed, and they claimed” (Smith 1999: 80).
272
G. K. Bol and D. van Niekerk
When it comes to indigenous knowledge, particularly in African context, often, a “diffussionist hypothesis” positing African science as inferior and insignificant in terms of contributing to scientific knowledge has created dominant and false world view, sadly even among the African themselves (Gwekwerer 2016). Yet such narratives that were based on conclusions and studies by colonial anthropologists and pseudo experts with flawed world views about African science may be irrelevant, biased and colonial in their intention (Shizha and Emeagwali 2020). As Smith would argue, the colonial powers claimed land and destroyed indigenous knowledge systems (Smith 1999) by introducing western ways of knowing, a largely positivist and inductionist’s world view, in pedagogy and curriculum that made it difficult for the two ways of knowing to coexist (Gumbo 2016). Western society is economic and competition-driven which is characterised by knowledge that is comparable and measurable, while indigenous society gives primacy to shared knowledge and genealogical kinship (Gumbo 2016). Underpinned by the spirit of Ubuntu—“humanity towards others”, African knowledge system is deeply relational, caring, communal and intergenerational, hence, and unlike western knowledge, indigenous knowledge does not end in classroom (Gumbo 2016). The imposition of scientific world views that contravene local ways of knowing yields dividend in lack of invention in local technologies (Gwekwerer 2016). To revalue African indigenous systems, Gumbo advises “we must go to the basics—a soul searching journey that must start with refining, restructuring and re-developing curriculum and pedagogies that take into account indigenous science” (Gumbo 2016).
13.2
Indignity and Climate Change Discourses: Global Perspectives
The IPCC Assessment Report (AR5) unequivocally stated that global climate has changed since the 1950s due to anthropogenic emissions of greenhouse gasses that have resulted in widespread impacts on human and natural systems (IPCC 2015), including indigenous knowledge systems (Nakashima et al. 2018). Yet, the ongoing discourses on climate change and disaster risk nexus reject indigenous knowledge (Nakashima et al. 2018) even though the IPCC affirms that indigenous, local or traditional views on environment are key to adapting to climate change (IPCC 2015). Indigenous people have inherent resilience knowledge, including ability to predict and interpret environmental changes and adjust their cultural practices and ways of life along those changes (Kronik and Verner 2010). Indigenous resilience strategies are derived from indigenous ability to thrive rather than just overcoming challenges—and are complex interlink between spirituality, healing, culture and the environment (Chirisa et al. 2018). This indigenous resilience perspective is often missed out in western literatures that incorrectly project indigenous knowledge as irrelevant and indigenous people as vulnerable (Abegunde 2016). Many of these
13
African Indigenous Understanding of Climate Change and Disaster Risk Nexus
273
western scientists continue to typify indigenous knowledge as an “unintellectual”, yet like any other knowledge indigenous knowledge, even though largely unwritten, is passed from one generation to another through experience, rituals and storytelling and continuously evolves over time (Kronik and Verner 2010). Whereas the opponents of indigenous knowledge may question its validity and effectiveness, the fact is that the knowledge of local or indigenous communities, particularly their extensive knowledge of the land, home territories and basic survival skills, has supported life for millennia (Nakashima et al. 2018) and will continue to become the most essential tool in the changing climate (Forbes and Stammler 2016).
13.2.1
Indigenous Observations of Changing Climate
There is growing evidence that indigenous knowledge can challenge, concur or complement scientific knowledge on climate change and disaster risk nexus (Nakashima et al. 2018) and that indigenous practices have helped adapt to impacts of climate variability over the years (Abegunde 2016). Hence, there is a need for urgency to preserve these practices and ensure that they are integrated into mainstream climate change and disaster risk management policies before they risk being overshadowed not only by climate change itself (Krishna 2011) but dominance of sciencisation (Beck 1992). In Russian Arctic, an unusual change in weather and ecological responses such as later freezing in autumn, earlier thawing in spring and warmer winter that was characterised by heavy rainfalls was, according to local scientists, due to anthropogenic climate change; however, indigenous nomadic Nenets reindeer herders maintained that the changes in weather did not represent any abnormal pattern (Forbes and Stammler 2016). In Latin America and the Caribbean, indigenous knowledge has been confirmed to correspond with observed changes in precipitations and temperatures as measured by local weather stations (Kronik and Verner 2010). The star-gazing practised by the Andean potato farmers provided a mechanism for assessing levels of humidity in the upper atmosphere which was proven to be an indicator for El Niño (Orlove et al. 2002). Similarly, indigenous knowledge proved to be reliable than scientific observation in Arctic Canada (Weatherhead et al. 2010). The Inuit people in Arctic Canada observed unusual changes in weather that was making it difficult for them to predict weather, and upon reports, local scientists undertook the study to establish evidence of the unusual change in the weather, and the study found out that there was no evidence of the reported change contrary to the observation by the indigenous community—and after receiving contradictory outcome, a broadened scientific investigation was commissioned by the authorities that ultimately affirmed the Inuit’s observation (Weatherhead et al. 2010). During the Tsunami in Asia in 2004, the ocean and buffalos’ behaviours provided warning to Simeulue Islanders in Indonesia that enabled them to evacuate to nearby hills to escape the 2004 Indian Ocean Tsunami (Surminski et al. 2016). The
274
G. K. Bol and D. van Niekerk
indigenous knowledge was believed to have reduced the impacts of the disaster given the proximity of the island to the epicentre (Surminski et al. 2016). In Zimbabwe indigenous weather forecast of climate events in 2012/2013 was consistent with the scientific forecast—the only difference was that indigenous forecast could not precisely indicate the dates (Chirisa et al. 2018).
13.2.2
Indigenous Resilience Practices
In order to adapt to the changing climate, indigenous people in Niger Delta in Nigeria have practised planting cover crops such as watermelon to conserve the soil, zero tillage, mulching and use of soil manure, early planting of crops and use of drought-resistant crops among others, even at times when climate change was less understood by the scientists and policy makers (Nzeadibe 2012). Survival strategies such as keeping dry foods that are wrapped in polythene and buried underground (Tokalau 2018) especially during cyclone seasons become useful sources of food for communities after disasters. In Vanuatu, indigenous knowledge of tsunami warning saved lives as local people could measure recession of wave to indicate impending tsunami and issue warning for local to evacuate uphills for safety (Walshe and Nunn 2012). The relevance of such knowledge is being realised in recent years. Communities in Vanuatu have realised that “as the indigenous knowledge fades people suffer more causalities in recent years in comparison to the past years” (Walshe and Nunn 2012). Indigenous communities understand the changing climate, and their perception is not at all negative. In Bangladesh flooding is never perceived as a problem as it comes with blessings: it brings along alluvial soil that fertilises the farms, and it also comes with fish—so communities invent ways to live with it by developing structures that float over the water and live with the flood till the water level reduces (Kumar et al. 2015).
13.2.3
Credibility of Indigenous Knowledge
The indigenous observations and resilience practices captioned above are examples that exhibit indigenous reports may be based on solid empirical data (Orlove et al. 2002; Weatherhead et al. 2010) and that scientific measurements may be inadequate to detect what indigenous people may be experiencing (Nakashima et al. 2018). The need to embrace indigenous knowledge in climate change and disaster risk nexus is essential. The Paris Agreement on Climate Change “recognizes the need to strengthen knowledge, technologies, practices and efforts of local communities and indigenous peoples to addressing and responding to climate change, and further urges that adaptation measures should be based on and guided by the ‘best available science’, including traditional knowledge, knowledge of indigenous peoples and
13
African Indigenous Understanding of Climate Change and Disaster Risk Nexus
275
local knowledge systems” (United Nations 2015a). Furthermore, the Sendai Framework for Disaster Risk Reduction 2015–2030 recognises that indigenous peoples can provide important contributions to the development and implementation of disaster risk reduction policies, strategies, programmes and plans (United Nations 2015b).
13.2.4
Integrating Indigenous Knowledge Systems and the Science
Notwithstanding the acknowledgement, ongoing scientific discourses on climate change and disaster risk nexus and related policies have so far only managed to “recognise indigenous knowledge” but with no or little application in real world (Callaghan et al. 2019). As disasters occur at local level, it is counterproductive to rely on bureaucratic processes at national, regional and international level (Friis-Hansen 2017). Also, scientific approaches are universal in nature yet climate change is location specific; hence, narrow scientific methods and adaptation approaches that are not locally grounded are irrelevant (Chirisa et al. 2018). Therefore, a success of any national or regional and global policy depends on strong institutions at community level (FriisHansen 2017) and empowerment of people who understand their local realities better, rather than individuals sitting in high offices. Whereas climate change has also affected the indigenous knowledge itself, neither science nor traditional knowledge is adequate alone to address complexities in climate change (Riedlinger and Berkes 2001). However, what is surprising is that one knowledge seems to overstep its goals—the search of knowledge, to one of dominance and disempowering of other knowledge sources (Gaillard 2018). Improved dialogue between scientists and indigenous people could narrow gaps between science and indigenous knowledge and further strengthen knowledge on climate change. This is important because scientists record climate change while indigenous communities experience the weather and are able to make sense of the changes they observed (Riedlinger and Berkes 2001). In Benin, indigenous communities and scientists collaborated together to bridge gaps between scientific and indigenous knowledge (Chirisa et al. 2018) by combining local knowledge and experiences with scientific or computer-based tools, which was critical to understanding vulnerability (Koshy et al. 2014). Indigenous knowledge of observing changes in their environment combined with communication tools like Internet can advance knowledge of climate change and adaptive capacities (Callaghan et al. 2019). Inputs by scientists to the indigenous knowledge are important to address declining indigenous practices, rendered obsolete by the climate change (Callaghan et al. 2019) and dominance of sciencisation (Chizha 2016). In deconstructing the dichotomy between indigenous knowledge and science, Gaillard observed natural integration of indigenous and scientific knowledge by the
276
G. K. Bol and D. van Niekerk
Kankanaey community in the Philippines who used both knowledge in tandem (Gaillard 2018). Gaillard et al. witnessed community using signs of rain in indigenous observation and request meteorological observation for verification (Gaillard 2018). Respecting indigenous practices is a stepping point to better collaboration between scientific communities and indigenous people (Weir et al. 2020).
13.2.5
Challenges in Integrating Indigenous and Scientific Knowledge
The challenge in integrating science and indigenous knowledge remains lack of trust in indigenous knowledge for use in scientific and policy decisions (Riedlinger and Berkes 2001). Owing to the lack of trust and despite being proven tools to cope with climate change and disaster risk, indigenous knowledge and practices have been excluded (Crona et al. 2013) in policy discussions (Huda 2013). Whereas it is important to integrate indigenous resilience with western science, the usual inductionist’s approach of western science makes it extremely difficult for the two world views to coexist (Monica and Vieira 2020). Efforts to include indigenous people in global discourses such as SDGs, Paris Agreement and Sendai Framework have been gaining momentum (Nakashima et al. 2018). However, there are key challenges; it is not possible to ensure participation of indigenous people without first recognising their knowledge and practices (Monica and Vieira 2020). Another key challenge is that some indigenous people do not engage in discussions that explore indigenous knowledge for decision-making, arguing such dialogue is akin to telling them to continue to live in a stone age as they argue that indigenous knowledge is irrelevant in the twenty-first century (Callaghan et al. 2019). Another key challenge in integarting indigenous and scienfitic knowledge systems is the notation that western scientific world view holds the correct picture of the world, hence, undermining understanding of environmental changes by formulating irrelevant research tools and hypothesis (Riedlinger and Berkes 2001). Adopting hypotheses with such colonising approach that put western science as superior over indigenous resilience practices will antagonise any effort to integrate the two (Monica and Vieira 2020).
13.3
African Indigenous Narrative on Climate Change and Disaster Risk Nexus
African indigenous knowledge has been used in weather forecasting, assessment of vulnerability and adaptation to shocks (Shizha and Emeagwali 2020). Practices such as zero tilling, mulching, fallowing, agro-forestry and organic farming that are
13
African Indigenous Understanding of Climate Change and Disaster Risk Nexus
277
widely practised by indigenous communities in Africa are important climate mitigation activities that should be embraced to increase carbon sink (Spranza et al. 2010). Like other indigenous knowledge systems, African indigenous knowledge system has to grapple with growing sciencisation and neo-colonialisation of knowledge. With the advent of western civilisation that regarded anything indigenous as primitive and backward (Weir et al. 2020). Indigenous institutions including religion were disregarded and rendered evil. As post-colonial Africa was hoped to revisit and revitalise the indigenous institution (Chizha 2016), paradoxically, African governments and scientists continue to promote western-centric version of knowledge and civilisation (FieldData-Sousse-Tunisia 2021). However, the colonisation and neo-colonial expansionist tendency that still exist today have failed to completely erase African indigenous knowledge (Weir et al. 2020). By defying the past colonial attempts to erase it, the African indigenous knowledge continues to inform daily decisions, from time to cultivate, harvest, hunting, fishing, communal celebrations, to what to eat at what seasons. The African indigenous communities make such decision based on remarkable observations of weather patterns and nature. This paper highlighted few of these indigenous observations across the continent.
13.3.1
The Weather Is out of Mezzan (Balance or Equilibrium)
The weather is out of balance (mezzan) is a powerful and fundamental description of changing weather phenomena as observed by local people in Mediterranean climate in Tunisia. Western science calls this “climate change”, a rather diffused and illusive concept. Mezzan is an Arabic word meaning weight or balance. In the past, communities in rural Tunisia would experience all four seasons—winter, spring, autumn and summer. The weather could occur as per traditional calendar, and it was maintaining its normal equilibrium (mezzān). However, in recent times, something has changed—the weather was no longer normal, and it was becoming “strange and out of mezzan”. Instead of normal four seasons, there seems to have two clear seasons, which are winter and summer. As the weather lost its balance, droughts were becoming frequent and destructive. Due to frequent droughts, oases in Tunisia were drying up and significantly negatively affecting date and olive production. The changing climate was feared by the communities to have threatened the Tunisian crops that are such an important part of their cultural heritage, identity and pride. The observed weather conditions seem to have enabled unhindered extension of the Sahara Desert into northern Tunisia. The desert is moving northwards at 50 kilometres a year (FieldData-Sousse-Tunisia 2021). The farmlands are becoming desert in an unimaginable speed. Desertification further made it easier for
278
G. K. Bol and D. van Niekerk
flash flooding. In the past, communities in northern Tunisia never experienced flash flooding. However, in recent times, they have witnessed frequent and severe flash flooding with the most recent ones in Siliana, Bizerte, and in 2018 in Nabeul. Besides desertification, droughts and floods, sea-level rise has been threatening all coastal regions and tourism. The changing weather patterns are not only creating resentment of being out of balance but increasingly present an expression “we are tired” (FieldData-Gambella 2021).
13.3.2 “We Are So Tired” Climate change’s impact is being felt by the Anyuak and Nuer indigenous communities in Gambella region of Ethiopia. The two communities have observed unusual changes of weather in their homeland in recent years. In the Anyuak communities, Cwiir (summer), Ariea (spring), Orro (winter), Pïïdhö sometimes known as Døøy or Ngär guu (autumn) aren’t normal anymore. Conversely the Nuer, on the other hand, have four seasons Jɔm (winter), Mai (spring), Ruɜl (summer) and Tɔt (autumn). However, it is increasingly difficult to differentiate winter from spring and summer from autumn. One respondent noticed that their calendar has changed because “there are some changes happening in the world” (FieldData-Gambella 2021). The Anyuak community noticed that winds have become stronger as the wildfires are becoming prevalent. The Anyuak believes that the change in weather is due to deforestation, land degradation and extensive mechanised farming by the state investors. Besides winds and wildfires, the Anyuak, particularly those who live along the Baro River, have witnessed unprecedented flooding that has become prevalent in recent years. The Nuer are pastoralists and occupy grassland and swamps (toar). By virtue of their cattle rearing culture, the Nuer migrate to toar during winter and spring. They also plant crops in the toar during that period. In the past, the migration and cultivation in the toar could take place without any hindrance. The migration and the planting in the toar are not only for livelihoods purpose; they are events that are deeply enshrined in cultural heritage and peaceful coexistence. As local communities in Tunisia would describe the current state of climate today, “the weather is out of mezzan”; the Nuer observed that “ci hɔw ro gɜr” (implying that the climate has become irregular). The seasonal migrations have changed as one respondent put it: “we have to change directions of seasonal migration many times a year . . . we are so tired indeed” (FieldData-Gambella 2021). Another respondent further emphasised that “ten years ago, we could start cultivating our farms in early April or May, however these days planting seasons changed to June and July yet frequent droughts during the past three years meant the harvest could fail”. During drought periods, the Nuer communities would then return to toar for cultivation. However, the toar is drying up, and planting there is becoming increasingly unsustainable due to repeated droughts in recent years. Conversely, alternating floods and droughts made it difficult to plant in toar as floods and drought’s
13
African Indigenous Understanding of Climate Change and Disaster Risk Nexus
279
frequencies do not allow time for planting, maturing or harvesting crops. The impacts of alternating droughts and floods mean that the livestock options are narrowing. In order to cope with the irregular weather patterns, the Nuer of Ethiopia have reduced the number of cattle as the cattle are dying due to recurrent floods and droughts. New livestock options and coping capacities are being considered, including rearing of goats and migrating to cities for jobs.
13.3.3
More Months of Droughts than Rainfalls
A field ethnographic work among the Maasai in Kenya revealed the realities of changing Maasai homeland. The Maasai realised that there were more months of droughts than rainfalls (FieldData-Maasai 2021). In what is being accepted as normal, the raining seasons have shifted to January and February. In the past, January and February were dry and hot months in Maasai calendar. The new hot months become July and August and cold months starting from August to September. Droughts become dominant hazard that threaten Maasai livelihoods. The Maasai observes their traditional calendar that help them record weather events as well as predict future events. By observing their calendar, the Maasai recorded severe droughts, dating back to several decades. The Maasai observed that severe droughts follow a 10-year pattern. There was prolonged drought in 1984. During that period a lot of livestock was lost to the drought. In 1994, another drought followed with almost similar experiences of livestock losses. The same pattern was experienced in 2004. An almost severe drought was experienced in 2009 and 2014. The frequency of droughts is exemplified with another drought in 2017 which was not very bad, but still a lot of livestock was lost due to lack of pastures and water. The community is anticipating a bad drought in 2024. Some of the Maasai’s observations are consistent with the occurrences of El Niño Southern Oscillation (ENSO). In 1984/1985, Eastern Africa, including Maasai homeland, was hit by severe drought as a result of the El Niño episode. The impact of the drought was felt more in Ethiopia and Sudan, with Ethiopia alone having suffered 300,000 mortalities and over 7.7 million people affected (Université catholique de Louvain, 2020). The World Vision put the death tolls to an estimated one million mortalities, which was also made worst by the confluence between the drought and the conflict that was ranging at that time in Ethiopia (Reid 2018). Similarly 1994/1995, 2004/2005 and 2009/2010 witnessed ENSO episodes (NOAA 2021), which is in line with the Maasai’s observations.
280
13.3.4
G. K. Bol and D. van Niekerk
Extreme Rain or Dryness
In the West Cameroon region, the Widikum people experienced strange happenings in weather patterns in recent times as opposed to the past. In the words of a local community farmer, “our weather is changing these days and the impact of the changes are severely affecting the way we farm, grow crops, and even the harvest” (FieldData-Widikum-Cameroon 2021). As a common practice among the Widikum people, farmlands are prepared in December as planting starts in February when the first rains usually start falling. April and May were normally months of harvest. However, in recent times, by February, sometimes the first rains have not yet fallen or the rains could fall once and stop for a long time. As a result, the dry season extends to March and, at times, beyond March. And in case some people had planted according to the usual planting calendar, the crops risk drying up because of unfavourable weather conditions. “What we see now is either extreme rain or extreme rain dryness”, remarked one elder. The observations by indigenous people in Cameroon are echoed across the continent. In Benin, local community observed that the weather was getting too hot—and even when sitting under a tree, it would still be unbearable (Foguesatto et al. 2018).
13.3.5
Superficial Rains
In West Africa, in the context of Bobo-Dioulasso in Burkina Faso, pastoralists observe that the weather patterns have been changing and the changes are coming with strange happenings (FieldData-Bobou-Dioulassou 2021). “When rain falls these days, it is either too intense that it floods and washes away fertile topsoil that is protecting pasture, or it evaporates away after a short while because of intense heat”. These were words of local elders who participated in the interviews.
13.3.6
Humankind Disturbs God and Ancestors
Many African communities believe that the changing weather patterns were taking place because humankind is disobedient to God and the ancestors. Those who are converted to Christianity and Islam argue that the changes that they have been observing were prophesied in the Bible or Quran—arguing that the two Holy Books cited tsunamis, floods and earthquakes as warnings for the end times. The traditional African believers who maintain the knowledge of the land contend that the ancestors and God were not happy. “The ancestors are annoyed because we have destroyed their home—the forest”, emphasised an elderly respondent. Destruction of forests and use of chemical fertilisers on the land were among the most cited
13
African Indigenous Understanding of Climate Change and Disaster Risk Nexus
281
anthropogenic activities that angered the ancestors and God. This argument, particularly the human aspects of destroying the environment, resonates with scientific narratives underpinning climate change discourses today. The current climate change causation theory is that of “anthropogenity”, particularly the increase in greenhouse gasses in the atmosphere as a result of burning of fossils fuel and forests. Whereas climate scientists conclude that human activities upset the climate system, indigenous communities believe that human activities upset God and the ancestors. Consequently, the ancestors and God’s wrath engender irregular weather as a punishment to humankind. Although there seems to be an agreement in both arguments, particularly on the human cause of climate change, the two concepts are profoundly different and deeply philosophical. The western science does not appreciate any spiritual influence and relationship of weather, climate and God. Despite diversity, indigenous knowledge has common values—respect to the environment and elders and spirituality in relation to the land (Patrichia et al. 2013). The land provides indigenous people with the source of subsistence, space and spiritual wellbeing (Abegunde 2016). For indigenous people, destroying the land means destroying the ancestors—to them, the land is the heart and bodies of indigenous people (Monica and Vieira 2020). Unlike western view of resilience, indigenous resilience is not homogenous and does not fit in a single expert definition (Chilisa 2012).
13.4
Indigenous Management of Risk of Climate Change and Variability
There are rich and valuable indigenous resilience practices in Africa that have proven effective in responding to irregular weather patterns. Few of these practices are discussed below.
13.4.1
Predicting Climate Hazards
In his work among the Domboshawa people in Zimbabwe, Tanyanyiwa (2018) documented important indigenous practices among the community. His ethnographic work is summarised below. When the duck flops its wing repeatedly, rainfall is anticipated, and when the ducks are in restless motion, it signifies dryer conditions. In instances where large number of swallows fly chaotically, a heavy rain would soon follow. But when the swallows are flying high and in small number, a dryer weather condition is imminent. When a black crow crows very early in the morning as well as when tinkerbird sings in the morning, a very hot day is expected. Presence of dense and many spider’s webs is an indication of wet weather condition among the Domboshawa
282
G. K. Bol and D. van Niekerk
people. Other animals such as frogs’ croaking, termites stockpiling grass, ants or grasshoppers appearing in large number, cattle sniffing the air with head up and fish jumping into the air frequently, among others, are indication of wet weather conditions. Tanyanyiwa’s findings are common practices across Africa. In Tanzania, large flocks of swallows moving from south to north during September–November is an indication of onset of short rains, lasting 2–3 days (Radeny et al. 2019). Radeny further observed that appearance of an owl in the sky and ducks and chickens stretching their wings repeatedly are all indications of short rains. He further indicates that movement of black butterfly from south to north is an indication of rains and better season. Similarly, flying of white ants after a strong sunshine indicates proper rain season has started. It also indicates that there is enough moisture on the soil for planting to start. Presence of green grasshoppers in large number in the fields is an indicator of short rain. Presence of bees and locusts in large group is an indication of onset of long rains (Radeny et al. 2019). When temperature is hot, a rainy condition may be expected sooner or later. Conversely colder days indicate dry conditions. Like the Domboshawa people, temperature is a common indicator of weather phenomena across Africa. According to Radeny, among the Karamojong people in Uganda, high temperature towards the end of dry season is an indication of above normal rainfalls, whereas high temperature at night is an indication of possible rain in the following day. Ocurrence of strong wind and whirlwind signify onset of imminent rainfalls. Repeated lightning at evening times during dry seasons is an indication of short rainy season. End of rain season is signified by presence of mists in early morning, clearer sky at night, cold mornings and evenings, frequent drizzling and high frequency of lightning when it rains (Radeny et al. 2019). Radeny’s ethnographic work is further summarised henceforth. Celestial bodies are observed and provide indication for rain or dry spells. When the Sun has halo around it, there is likelihood of intense rainfalls. A very hot September and October signifies imminent rainfalls. An eclipse of the Sun is an indicator of more rain. Similarly when there is halo around the moon or when the moon is in its normal orientation, or when it appears in the first and last quarter or when there is no moon, there are chances of wet weather conditions. A presence of a ring around the moon is clear indication of a wet season. Conversely, when the moon is in tilted orientation or when in full orientation, dry weather condition is expected. When stars are plenty, the drought is expected and when they are few, rain is expected. In his field ethnography among the Borana, Radeny, 2019, found out that alignment of stars and moon allows them to predict weather conditions. When the moon aligns with seven stars during March (Biouttessa), a drought and famine are forecasted. When the alignment is observed in September (Birra), early onset of rain and late stop of rain are expected. Appearance of morning star in the east and west is a critical indicator for weather hazards. When it appears in the west 70 days after its appearance in the east, it is an indication of extreme drought. Conversely when the star appears in the east 7 days after its appearance in the west, it is an indication of
13
African Indigenous Understanding of Climate Change and Disaster Risk Nexus
283
normal rainfalls. If the same star is seen in the west 140 days after occurring from the east, it is a severe indicator of extreme drought in the future (Radeny et al. 2019). Wind is an important indicator of weather conditions among the indigenous people. It also bears resemblance with scientific narrative. According to Tanyanyiwa, among the Shona people, northerly wind becoming south-easterly indicates imminent rains. Presence of whirlwind in August is an indication of rains. Persistence of easterly wind is an indication of drought. A northerly wind in summer indicates rain is expected in days. A strong wind at time of expected rains disrupts rainfall. When westerly winds dominate, a good rainy season is expected (Tanyanyiwa 2018). Trees provide indigenous people with tools to detect hazards and observe weather conditions. The field ethnography undertaken to inform this paper affirmed that trees provide important forecast for weather conditions. In line with this finding, Radeny’s work among the Borana in Ethiopia confirmed that when acacia tortilis and aloe trees flower, a rain is expected in a month later and when fewer flowers blossom, a drought season is expected (Radeny et al. 2019).
13.4.2
African Indigenous Resilience Wisdom for Managing Climate Crisis
Africa abounds with indigenous wisdom and risk management philosophies that hardly make it to scientific journals nor in any way inform contemporary policy dialogues in many African states, in spite of their effectiveness in addressing risks and uncertainties underpinning modern societies. Urgency is the word that best describes documentation and need for archiving African indigenous resilience models as people who hold it are dying and as the language and practices are too disappearing so fast. Among the powerful African indigenous resilience model is Kulang’s Resilience Model.
13.4.2.1
Kulang’s Resilience Model
In coping with uncertain times, Kulang’s risk management paradigm is relevant to the contemporary societies. Kulang Toat, a man who once lived in today’s South Sudan in around the nineteenth century, invented a resilience model to cope with alternating hazards amidst uncertain futures. His home was situated in the Sudd region, one of the largest wetlands in the world and on the African continent. The Sudd region occupies a large expanse of land spanning five of the ten states of South Sudan. The region has diverse fauna and flora and is home to several unique indigenous species. Being a wetland, flood is a major hazard affecting the people’s lives and livelihoods. However, droughts also affect the region as its inhabitants mainly depend on rainfed agriculture. People in the Sudd region are mainly
284
G. K. Bol and D. van Niekerk
pastoralists and subsistent farmers. Kulang observed changing trends of droughts and floods with subsequent human tolls. During droughts and flood periods, cattle, the main sources of livelihoods, could die in massive number from the effects of the alternating hazards. Due to death of animals and failure of harvests, there were food crises and acute malnutrition and even famines. Observing from the repeated climate-induced crises, most often floods and droughts, Kulang devised a way out to cope with the risk and uncertainties. First, when a hazard—drought or flood—is forecasted, he could sell his cattle and keep the cash until the disaster is over. He would then buy new cattle when the conditions become favourable. He could do that repeatedly when droughts or floods are anticipated as this strategy had proven effective. This Kulang’s model may be akin to risk transfer practices today. However, this is more than just transferring risk to the market. It is also a way of protecting livestock from dying. Among the Nuer, a Nilotic section who lives in the Sudd region, cattle is sacred, and seeing them dying can be so disheartening to the cattle owner—and too selling them off is as painful as their death—but a better evil to accept as an extreme coping mechanism to disaster risk. Other Nilotic tribes who live in the Sudd region are Dinka and Shilluk, who also share similar cattle rearing and subsistent farming practices. For the Nilotic pastoralists, selling cattle off during crises is not only to ensure continuity, survival and resilient recovery after a disaster but also to rescue the cattle from humiliating death from ensuing danger to be posed by the climate hazards. Besides risk transfer strategies, Kulang then developed new ways of managing risks of flood and drought. Embedded in his world view, Kulang believed that no one could better understand the future than “Kuoth”(God) himself. However, he was clear that humankind could minimise the future impacts through investing in no-regret de-risking measures, which are also today commonly referred to as resilience, adaptation or disaster risk reduction interventions. In building resilience to uncertain futures and to ensure food security, Kulang had two farms. He had one farm in close proximity to the wetland and the other on the higher ground. In the Sudd regions, higher grounds are susceptible to droughts. In hindsight, Kulang would plant his two farms knowing one would fail and the other could succeed. He had a belief that if all succeed, he would produce enough food to cushion his family from droughts and floods for several years ahead. People who knew Kulang would argue that he never run out of food, despite several disasters. Deriving from the narratives of the people who knew him, Kulang was known as a glutton— meaning he liked food very much. If gluttony has to be associated with ability to cope with risks, ensure food security and better management of meagre resources during times of perils, then it is a character that is essential in the current climate crisis. Kulang’s model outsmarts some of the resilience and anticipation debates in risk management today. It is a concept that outweighs current recovery or “building back better” principles in modern-day’s disaster risk management practices. The exchange of cattle with cash with the aim to rebuy cattle aftershocks is a precious building back better option that must be harnessed. In light of the neo-normal disaster risk paradigm underpinning modern-day’s or post-modern society, Kulang’s
13
African Indigenous Understanding of Climate Change and Disaster Risk Nexus
285
resilience model may be one of the best ways out to cope, adopt, reduce impact of, respond to and recover from the climate-induced disasters.
13.4.2.2
El majel: A Coping Mechanism to Extreme Weather Events in Tunisia
Fast-approaching desert and reduced rainfalls are hallmarks of doomsdays among the Mediterranean North Africans. The local communities in Tunisia knew that the risk was coming and invented a way to live and cope with the risk of uncertain climate amidst monumental challenges of desertification. A fundamental discovery for humanity—“majel”—was invented. El majel is a water-harvesting technology that is locally built. The majel has wider open top and narrow bottom with a hole at the bottom. It is a flask-sharp-like object with a depth of 4 m–6 m or more. The majel practice is widely shared by many in Tunisia and has different names in different communities. The communities in southern Tunisia called it fasciah or el majel. A gutter which is made of plastic or iron is built to direct rainwater from the building roof to the majel. The magel is comprised of three parts. A watering can is the surface of the magel. The second component which is known as dakhla is the primary point from which the water enters, and the third component is kharja which absorbs excess water when the water exceeds capacity of magel. Water from magel is stored for use during summer and during times of droughts. This has proven an important adaptation and risk reduction practice for hundreds of years. Besides majel, other important traditional risk reduction measures in Tunisia include use of sand, hay and yeast to make a paste that is used for making roofs of houses for protection against heavy rains. Intersecting canals from homes is widely practised in rural Tunisia. Every house has a traditional open canal, and all the canals are connected to each other. When it rains, the water collected in the canals goes to the neighbouring farms to avoid floods. The villages would ensure adequate water for farming during dry seasons. However, this practice is at risk of fading way as modern underground water usage is being introduced (FieldData-Sousse-Tunisia 2021). The majel and canal digging practices are proven traditional practices that have demonstrated efficiency over the years in tackling droughts and floods. These are values and important heritages to protect and cost-effective African practices for tackling impeding climate crisis amidst the neo-normal disaster risk paradigm. Decision-making has to take into account these kind of practices, improve them and implement them where applicable as they are going to disappear with time. Tunisia is facing a critical time of water scarcity, and the government is struggling in finding solutions. The solution is already there if they can include this valued practice into their national strategy and policy (FieldData-Sousse-Tunisia 2021).
286
13.4.2.3
G. K. Bol and D. van Niekerk
Diversifying Livelihood Options
The Maasai in Kenya and many other communities in Africa share common risk reduction and adaptation practices such as diversification of livelihood option to cope with the impacts of climate change. Witnessing reduction in the number of livestock and increase in number of unhealthy people due to reduced food and nutrition security as a result of erratic climatic conditions, the Maasai whose livelihood is anchored in livestock, have resorted to agro-pastoralism to cope with the impact of climate change. Other members of the Maasai have sought alternative livelihoods as watchmen in nearby cities. The Maasai and many other pastoralist communities in Africa have also adopted rearing of sheep and goats and other drought-resistant ruminants. During times of crises and disasters, many communities have resorted to extreme coping measures to endure disaster impacts. Feeding on fish and resorting to hunting are some of the coping capacities indigenous communities in Africa have been embracing to withstand and build resilience to the climate change.
13.4.2.4
Collective Resilience
Like the Maasai, the Anyuak and Nuer in Ethiopia’s Gambella region have adopted traditional social safety net practices to cushion the most vulnerable section of their communities from impacts of disasters. Sharing during difficult times is key coping strategy among the indigenous people, not only in Africa but even in the Pacific (Nakamura and Kanemasu 2020). Indigenous experience of disasters has equipped them to continuously devise resilience measures in response to risks that affect them (Gaillard 2018). During times of drought and other large social disruptions, such times cement the resolve of the communities to hold one another’s hands by sharing meagre resources during the difficult times. Most of the African indigenous communities adopt social safety net practices by embracing togetherness, cooperation, unity and brotherhood. Community members would all move away from danger or risk and helped each other out. Those disadvantage members of the communities are lent cows or goats to feed from their milk until they are capable of getting on their own. Interestingly the lending does not have interests. Unlike current disaster risk financing mechanisms which are dominated by loan with interest, indigenous lending is interest-free. In comparison with the contemporary risk financing practices that are not sustainable as disaster risks continue to increase and countries continue to take disaster risk financing loans that put them in perpetual debts, these traditional risk financing practices need to be revisited and empowered.
13
African Indigenous Understanding of Climate Change and Disaster Risk Nexus
13.4.2.5
287
Resilient Infrastructure
In eSwatini, communities had to build in such a way that enable them to adapt to weather changes by using natural clay, mud or stones for the body of the houses and straws for building roofs of their houses. The science behind this includes the following: when the foundation of a house is made with stones, it allows the underground structure to breathe such that in the event of any underground movement of the earth, the structure resists any impact because it mimics nature rather than contradicts it. When the roof of a house is made with straws, it allows wind to flow through it naturally and prevents it from being an obstacle to wind flow which is why it is resistant to windstorms. Another science associated with this knowledge system is that communities’ use of wood fuel to cook in the same household where people also sleep. In building that way, the straw roof provides a smooth passage of smoke to naturally flow out without any obstacles. It also allows oxygen to flow in and out, hence providing adequate natural ventilation for the family. While discussion on climate-proof infrastructure is just taking course in modern days, “traditional housing has evolved and has been shaped by climatic conditions over millennia” (Chauhan and Sharma 2014).
13.5
Conclusion
This chapter discussed African indigenous understanding of climate change and disaster risk nexus. Powerful voices emanating from the African communities resonate with contemporary climate change discourses. They are explicit: “the weather is out of balance”. In adapting to unbalance weather patterns, they adopt important resilience model such as el magel, Kulang’s resilience model and resilient infrastructure, inter alia. Concepts such as Kulang’s Resilience Model and el magel would need to be further researched and piloted for use in other countries, including formalising them into mainstream policy agenda. Despite their validity and effectiveness in building community resilience to impact of climate change and disaster risks, indigenous resilience wisdom and philosophies are not being reflected in policy discourses. These spectacular African indigenous risk management solutions risk disappearance as those who hold the knowledge are fast disappearing. Other factors such as dominance of western science over the indigenous knowledge systems and practices and neo-colonisation of knowledge, by the African themselves, expedite force disappearance of the indigenous knowledge systems. This chapter calls for urgent recognition, inclusion and empowerment of the African indigenous knowledge and practices in policy formulation and implementation. A starting point in recognising and applying indigenous knowledge for decision-making requires research on indigenous knowledge systems. Approaches to such a research must adopt decolonising methodologies and embrace methodologies that are empowering, engaging, indigenous and participatory (Chilisa 2012).
288
G. K. Bol and D. van Niekerk
References Abegunde AA (2016) Local communities’ belief in climate change in a rural region of sub-Saharan Africa. Environ Dev Sustain 19(5):1489–1522. Springer African Commission on Human and Peoples’ Rights (2006) Indigenous peoples in Africa: the forgotten peoples? The African Commission’s work on indigenous peoples in Africa. African Commission on Human and Peoples’ Rights (ACHPR), Banjul Beck U (1992) Risk society: towards a modernity. Sage Publication, London Callaghan T et al (2019) Improving dialogue among researchers, local and indigenous peoples and decision-makers to address issues of climate change in the north. Ambio 49(6):1161–1178. Springer Chauhan S, Sharma A (2014) Incorporating traditional knowledge in post disaster recovery to integrate climate change adaptation and disaster risk reduction. In: Shaw R (ed) Disaster recovery: used or misused development opportunity. SEEDS India, Delhi, pp 265–286 Chilisa B (2012) Indigenous research methodologies. SAGE, London Chirisa I et al (2018) Africa’s dilemmas in climate change communication: universalistic science versus indigenous technical knowledge, vol 1. Springer, Cham Chizha E (2016) African indigenous perspectives on technology. In: Emeagwali G, Shizha E (eds) African indigenous knowledge and the sciences. Sense Publishers, Rotterdam, pp 47–62 Crona B et al (2013) Perceptions of climate change: linking local and global perceptions through a cultural knowledge approach. Climatic Change 119:519–531. Springer FieldData-Bobou-Dioulassou (2021) African Indigenous perspective on climate change and disaster risk nexus: interviews with 13 elders from Bobou Dioulassou in Burkina Faso [Interview] 16 Oct 2021 FieldData-Gambella (2021) Africa Indigenous perspectives on climate change and disaster risk nexus [Interview] 28 Sept 2021 FieldData-Maasai (2021) African indigenous perspectives on climate change and disaster risk Nexus: FGD with 13 Maasai Indigenous Group in Kenya [Interview] 13 August 2021 FieldData-Sousse-Tunisia (2021) African Indigenous perspectives on climate change and disaster risk nexus: Interviews with 13 communities elders and Imam in Sousse, Tunisia [Interview] 18 Sept 2021 FieldData-Widikum-Cameroon (2021) African indigenous perspective on climate change and disaster risk nexus: FDG with 7 elders from widikum community in cameroon [Interview] 24 Oct 2021 Foguesatto C et al (2018) Understanding the divergences between farmer’s perception and meteorological records regarding climate change: a review. Environ Dev Sustain 22:1–16. Springer Forbes BC, Stammler F (2016) Arctic climate change discourse: the contrasting politics of research agendas in the west and Russia. Polar Res 28(1):28–42. Taylor and Francis Friis-Hansen E (2017) Decentralised governance of adaptation to climate change in Africa. CABI, Wallingford Balay-As M, Marlowe J, Gaillard JC (2018) Deconstructing the binary between indigenous and scientific knowledge in disaster risk reduction: approaches to high impact weather hazards. Int J Disaster Risk Reduct 30:18–24. Elsevier Gumbo M (2016) Pedagogical principles in technological education: an indigenous perspectives. In: Emeagwali G, Sefa Dei GJ (eds) African indigenous knowledge and the sciences. Sense Publishers, Rotterdam, pp 13–32 Gwekwerer Y (2016) Schooling and the African child: bridging African epistemology and Eurocentric physical sciences. In: Emeagwali G, Sefa Dei GJ (eds) African indigenous knowledge and the sciences. Sense Publishers, Rotterdam, pp 33–46 Huda N (2013) Understanding indigenous people’s perception on climate change and climatic hazards: a case study of Chakma indigenous communities in Rangamati Sadar Upazila of Rangamati District. Bangladesh Nat Hazards 2013(65):2147–2159 IPCC (2015) Climate change 2014 synthesis report. IPCC, s.l
13
African Indigenous Understanding of Climate Change and Disaster Risk Nexus
289
Koshy K et al (2014) Climate and society. In: Climate in Asia and the Pacific, security, society and sustainability. Springer, Penang, pp 199–251 Krishna V (2011) Indigenous communities and climate change policy: an inclusive approach. In: Filho W (ed) The economic, social and political elements of climate change, climate change management. Springer, New Delhi, pp 27–46 Kronik J, Verner D (2010) Indigenous peoples and climate change in Latin America and the Caribbean. The International Bank for Reconstruction and Development/World Bank, Washington DC Kumar S et al (2015) Indigenous resilience and adaptation in high altitude arid zone. In: Nibanupudi RSHK (ed) Mountain hazards and disaster risk reduction. Springer, New Delhi, pp 177–197 Monica Y, Vieira LC (2020) Indigenous perspective of resilience: strength and adaptive strategies. In: Leal Filho W (ed) Good health and well-being, encyclopedia of the UN sustainable development goals. Springer, s.l., pp 415–457 Nakamura N, Kanemasu Y (2020) Traditional knowledge, social capital, and community response to a disaster: resilience of remote communities in Fiji after a severe climate events. Regional Environmental Change 20(23):1–14. Springer Nakashima D, Krupnik I, Rubis JT (2018) Indigenous knowledge for climate change assessment and adaptation. UNESCO and Cambridge University Press, Cambridge NOAA (2021) National Oceanic and Atmospheric Administration (NOAA). [Online] Available at: https://www.climate.gov/enso. Accessed 11 Sept 2021 Nzeadibe T (2012) Indigenous innovations for climate change adaptation in the Niger Delta region of Nigeria. Environ Dev Sustain 2012(14):901–914 Orlove B et al (2002) Ethnoclimatology in the Andes. Am Sci 90(5):428–435 Patrichia C et al (2013) Indigenous frameworks for observing and responding to climate change in Alaska. Climatic Change 120:557–567. Springer Radeny M et al (2019) Indigenous knowledge for seasonal weather and climate forecasting across East Africa. Climatic Change 156:509–526. Springer Reid K (2018) World vision. [Online] Available at: https://www.worldvision.org/disaster-reliefnews-stories/1980s-ethiopia-famine-facts. Accessed 11 Sep 2021 Riedlinger D, Berkes F (2001) Contributions of traditional knowledge to understanding climate change in the Canadian Arctic. Polar Record 37(203):315–328. Springer Royer M (2016) Climate change and traditional ecological knowledge. In: Climate, environment and Cree observations. Springer, s.l., pp 7–33 Shizha E, Emeagwali G (2020) African indigenous knowledge and the sciences: journeys into the past and present. Sense Publishers, Rotterdam Smith L (1999) Decolonising methodologies: research and indigenous peoples. University of Otago, Dunedin Spranza C et al (2010) Indigenous knowledge related to climate variability and change: insights from droughts in semi-arid areas of former Makueni District, Kenya. Springer, pp 295–315 Surminski S et al (2016) Realising the ‘Triple dividends of Resilience’: a new business case for disaster risk management. Springer, London Tanyanyiwa V (2018) Weather forecasting using local traditional knowledge (LTK) in the midst of climate change in Domboshawa, Zimbabwe, vol 2. Springer, Cham Tokalau J (2018) Indigenous knowledge systems and urbanization: relocation, planning and modern disasters. Palgrave, s.l. United Nations (2015a) Paris Agreement. United Nations, s.l. United Nations (2015b) Sendai framework for disaster risk reduction 2015–2030. United Nations, s.l. Walshe RA, Nunn P (2012) Integration of indigenous knowledge and disaster risk reduction a case study from Baie Martelli, Pentecost Island, Vanuatu. Int J Disaster Risk Sci 3(4):185–194 Weatherhead E et al (2010) Changes in weather persistence: insight from Inuit knowledge. Academia.edu Weir JK, Sutton S, Catt G (2020) The theory/practice of disaster justice: learning from indigenous peoples’ fire management. In: Lukasiewicz A, Baldwin C (eds) Natural hazards and disaster justice. Springer, Canberra, pp 299–317
Part III
Resilience and Disaster Preparedness
Chapter 14
Building Resilience in Times of New Global Challenges: A Focus on Six Main Attributes Maurizio Indirli, Ruben Paul Borg, Antonio Formisano, Lucia Martinelli, Anna Marzo, Francesco Romagnoli, and Fabio Romanelli
Abstract This work discusses the crucial concept of resilience in six specific paragraphs, starting from the grid of the main attributes (namely, safety, robustness, adaptive capacity, sustainability, governance, and anamnesis) proposed by Indirli (2019). This study found that two views were particularly challenging, however conflicting: the homeostatic approach (engineering resilience, e.g. oscillations around an initial steady state) or the autopoietic approach (ecological resilience, e.g. irreversible shifts towards a new situation). In fact, a reliable resilience’s assessment is fundamental when geohazards affect the environment, urban habitat, building construction, lifelines and heritage. The reason of this study is also due to the increasing ambiguity whereby the term is
M. Indirli (✉) ENEA-SSPT-MET-DISPREV, Research Centre of Bologna, Bologna, Italy e-mail: [email protected] R. P. Borg University of Malta, Msida, Malta A. Formisano University of Naples Federico II, Naples, Italy e-mail: [email protected] L. Martinelli MUSE-Science Museum, Trento, Italy e-mail: [email protected] A. Marzo ENEA-SSPT-MET-DISPREV, Research Centre of Bologna, Bologna, Italy e-mail: [email protected] F. Romagnoli Riga Technical University, Riga, Latvia e-mail: [email protected] F. Romanelli University of Trieste, Trieste, Italy e-mail: [email protected] © The Author(s), under exclusive license to Springer Nature Switzerland AG 2023 S. D’Amico, F. De Pascale (eds.), Geohazards and Disaster Risk Reduction, Advances in Natural and Technological Hazards Research 51, https://doi.org/10.1007/978-3-031-24541-1_14
293
294
M. Indirli et al.
frequently used in multidisciplinary fields, as engineering, social-economical/socialecological systems and disaster/risk assessment in case of catastrophic scenarios. Therefore, considering the urgent need of analysis tools to prevent/properly govern future crises, the authors intend to give a useful hint towards the adoption of resilient approaches. The original and captivating methodology developed here confirms and enhances the validity of the starting point cornerstones (modifying and fulfilling the initial definitions), in primis the relationship between the resilience’s main concept and its attributes. Hence, the final goal is to provide an effective framework to study, without rigidity, complex questions in times of new global challenges, as the combination of natural and anthropogenic hazards, with particular reference to geohazards and global warming. Thus, successful actions focused on risk mitigation (with a tight link to communication, dissemination and exploitation policies) can be implemented, aimed at enhancing consciousness about disasters, for a wide range of different organizations, from experts in risk management and preservation of environment/heritage to people and stakeholders concerned. The investigation carried out here has been supported interlacing a theoretical discussion with the analysis of specific case studies (e.g. the behaviour of buildings, infrastructure and heritage under earthquakes and volcanic eruptions). It is to be noted that this approach has been already adopted to evaluate the overall resilience of the Italian community during the first period of the COVID-19 pandemic. Such a tragic event has certainly been a very hard test, where resilience should be considered as a strategic indicator, proving that really short time to operate effective choices is available, being the humanity able or not to govern the next changes, hopefully towards enough resilient results. Keywords Disaster risk reduction · Geo-education · Geohazards · Resilience · Risk prevention
14.1
Introduction
Nowadays resilience is a crucial word, widely adopted by scientists of several disciplines as well by exponents of public or private organizations. The term resilience originated from the Latin classic culture (rĕsĭlīre: the act of rebounding, i.e. to rebound/recoil, from “re-” back + “salire” to jump, leap). Then, after passing almost forgotten through the Middle Ages, it was resumed in the modern times by intellectuals who were among the pioneers of the modern scientific method (as Francis Bacon) and, immediately later, by the positivist encyclopaedists. Specifically, the term resilience is present in the English language since the seventeenth century (McAslan 2010; Indirli 2019), denoting a rebound or bouncing reaction. In the twentieth century, its use spread out, starting from the Rankine’s quantitative definition in engineering, until to other elaborations coming from psychology, anthropology and ecology, the latter with the fundamental Holling’s (1973) contribution. He proposed a key definition of resilience, referring to any biological systems as “the ability of these systems to absorb changes of state variables, driving
14
Building Resilience in Times of New Global Challenges: A Focus on Six. . .
295
variables, and parameters, and still persist”. By this definition, every biological system can be considered as an ideal example of resilient system. In the last decades, the concept expanded quickly into engineering, social-economical/social-ecological systems, disaster/risk assessment, sustainability and adaptive capacity to cope with catastrophic scenarios (Hassler and Kohler 2014; McAslan 2010; Indirli 2019). The common perspective was focused on identifying thresholds or limits to systematic changes and targets that a system encompasses if exposed to any external shocks (Donghyun and Seul-Ki 2018). Based on this background, the concept of disaster resilience was proposed in the year 2009 according to the UN International Strategy for Disaster Reduction (UNISDR) (UNISDR 2009; Rochas et al. 2014). Bruneau et al. (2003) presented a conceptual framework to define seismic resilience of communities in addition to quantitative measures of resilience. The framework is based on complementary measures of resilience including the “Reduced failure probabilities”, “Reduced consequences from failures” and “Reduced time to recovery”. The framework also includes quantitative measures of the “ends” of robustness and rapidity and the “means” of resourcefulness and redundancy and integrates those measures into the four dimensions of community resilience (technical, organizational, social and economic). These are useful in quantifying the resilience assessment for various types of physical and organizational systems. Resilience can be summarized by three main definitions coming from different scientific fields: ecological, engineering and socio-ecological, sometimes also addressed as evolutionary resilience (Feofilovs et al. 2020). However, it is frequently used with increasing ambiguity about its properties and attributes. Indirli (2019) says about two views, particularly challenging but conflicting: the first, the “engineering resilience”, has been used to describe by quantitative means (i.e. with formulae) the behaviour of structures and materials in engineering, for instance, during a mechanical stress; later, the concept broadened to the measure of an infrastructure’s seismic resilience under a hazardous event; oscillations around the initial steady state and elasticity properties to “bounce-back” are crucial features of this homeostatic approach. The second, the “ecological resilience”, has been used to describe the ability of natural systems to absorb changes, for instance, the species persistence or probability of extinction; this approach (neither deterministic nor quantitative) points out the adaptive capability to challenge “irreversible shifts” towards a new equilibrium, evolutionary and “ductile” as autopoietic. Both these views are part of the ongoing debate; if embraced without rigidity, they are useful to study complex phenomena where the combination of natural and anthropogenic hazards is a crucial question, including global warming as well as epidemics/pandemics. The already cited starting point of Indirli (2019) considered indispensable a unifying framework regarding the resilience’s assessment. Therefore, he proposed to investigate some “nuclei for a pluralistic but holistic view of resilience”, which deconstruct the resilience concept into six main attributes, namely, safety, robustness, adaptive capacity, sustainability, governance and anamnesis (Table 14.1). The validity of the above said cornerstones, in primis the relationship between the resilience’s main concept and its attributes, has been confirmed and enhanced here, modifying and fulfilling the relative initial definitions. Hence, this approach can be considered a
296
M. Indirli et al.
Table 14.1 Nuclei for a pluralistic but holistic view of resilience (definitions from Indirli 2019) Attributes Safety Robustness Adaptive capacity Sustainability Governance
Anamnesis
Description Protection of life, heritage and assets from natural/ human-made disasters across climate/social changes Adequacy of structural/infrastructural systems to withstand actions related to their function/exposure Ability to respond successfully to new changes and recovery with acceptable consequences after catastrophic events Maintaining the natural/anthropogenic capital and fostering mature self-balanced environments Consensual and shared management of conflicts towards a new equilibrium before/throughout/after traumas/disasters Safeguarding and transmitting collective memory and cultural identity intact to posterity as a drop anchor for democracy
Target Multi-hazard combinations and maps Multi-level networks Social-ecological models Sustainability models Risk management
Preservation of tangible/intangible heritage
valid tool to assess resilience. In this chapter, the authors discuss the suitability of adopting a step further analysis in six sections, where the resilience’s cited attributes are analysed and better defined. The investigation has been supported interlacing a theoretical discussion with the analysis of specific case studies (e.g. the behaviour of buildings, infrastructure and heritage under earthquakes and volcanic eruptions). It is to be noted that this approach has been already adopted to evaluate the overall resilience of the Italian community during the first period of the COVID-19 pandemic (Indirli et al. 2021). In times of new global challenges to face various catastrophic events, a reliable resilience’s assessment is fundamental when geohazards (geomorphological, geological or environmental processes potentially dangerous for human life, health and property; see Bobrowsky 2013) affect the environment, urban habitat, infrastructure and heritage. In this case, it is very useful to develop and deploy the concept of multihazard (past/future) disaster scenarios (impact, occurrence, relationship, hierarchy and combination, from regional to local scales), considering their full range and avoiding omissions, finding common languages/tools to identify, profile, quantify hazards; this diagnosis should evaluate and combine all the different hazards, distinguishing short-term (earthquake, tsunami, landslide, volcanic eruption, flood, etc.) and long-term (maintenance, decay, tourism pressure, climate change effects, etc.) events. Therefore, both multi-hazard and resilience approaches can provide an effective and comprehensive description of the selected sites of interest, on the basis of an appropriate storage, classification, overlay and elaboration of the huge amount of information coming from multidisciplinary investigations (Indirli 2007). Moreover, successful actions devoted to risk mitigation (with a tight interaction with communication, dissemination, exploitation activities) can be implemented, with the aim to increase consciousness about disasters striking prone areas, for a wide range of various organizations, from experts in risk management and preservation of environment/heritage to people and stakeholders concerned.
14
Building Resilience in Times of New Global Challenges: A Focus on Six. . .
14.2 14.2.1
297
Analysis of Resilience Attributes Safety
In general terms, given a system (intended as a set of complex interacting components in a dynamic equilibrium), its ability to prevent or adapt to perturbations in order to maintain its attributes reflects its resilience. In this section, the attribute we are concerned about is safety. To ensure safety, the system must avoid failures and losses, as well as respond appropriately after an (hazardous) event. Thus, the safety of a “resilient system” could be measured by a metric based on a performance-based design (PBD) approach. This approach is usually adopted in earthquake engineering for the design of structures, where a system has to meet specific performance levels according to different demand levels and possess the following features (e.g. Bruneau et al. 2003): (a) reduced failure probabilities; (b) reduced consequences from failures, in terms of lives lost, damage and negative economic and social consequences; and (c) reduced time to recovery (restoration of a specific system or set of systems to their “normal” level of performance). Following the “seismic” side, lessons learnt from the largest earthquakes worldwide occurred during the last decade (e.g. the 2011 Tōhoku earthquake, 11/03/2011, M > 9) show that the performances of the standard probabilistic seismic hazard assessment (PSHA) are unsatisfactory, underestimating the magnitude of seismic events and their possible impacts. Therefore, the need for an appropriate hazard assessment is a pressing concern for seismologists, geologists, seismic engineers, etc.; it appears preferable to refer to a complementary scenario-based method based on a better integration of the available information (i.e. seismological, geological, geophysical and geotechnical data) about the site of interest with updated physical modelling techniques. A possible operative solution in a resilient oriented framework has been suggested by Rugarli et al. (2019), who tackled and discussed the seismic hazard case in detail, and worldwide examples of its application can be found in the volume recently edited by Panza et al. (2021). In addition, we wish to develop, for an area or for selected sites, the concept of multi-hazard scenarios, also in relationship with global warming (impact, occurrence, relationship, hierarchy, combination), by finding/utilizing common languages/tools. This evaluation should select and combine both short-term events (e.g. earthquakes, volcanic eruptions, floods, landslides, tsunamis, atmospheric pollution effects, war damage, anthropogenic accidents, mass events, acts of terrorism, etc.) and long-term events (e.g. extreme climate change effects, large-scale super eruptions and earthquakes, maintenance, decay, tourism pressure, etc.), which affect urban habitats, environment and heritage. Therefore, it is necessary and urgent to move towards multi-hazard analyses, since single hazard assessment methods need to be critically studied and implemented. A first overview on risk assessment procedures for natural hazards was developed in Indirli (2007), with a discussion about hazard identification and profile, inventory assets, estimate losses and mitigation options. A comparison of damage assessment
298
M. Indirli et al.
methodologies for different natural hazards can be found in Rossetto et al. (2010) and Vamvatsikos et al. (2010). A vivid example of multi-hazard analyses was carried out in the framework of the COST Action C26 “Urban habitat constructions under catastrophic events” (COST Action C26 2010a, 2010b), where the peculiar risky situation of the Neapolitan volcanic complex Summa-Vesuvius was taken as a paradigmatic reference case, with the following main objectives: to define qualitatively and quantitatively the exceptional volcanic actions due to a strong eruption (earthquake, pyroclastic flow and surge, tephra, lava flow, bombs and missiles, lahar and mudslide, tsunami) producing a combination of accelerations, vertical loads, horizontal dynamic pressure and impact on construction; to evaluate their effects on the urban environment (in the pilot area of Torre del Greco, Naples); and to propose mitigation interventions (Mazzolani et al. 2009). About multi-hazard scenarios, the research should provide modern and standardized procedures as an effective progress in the field. Unfortunately, the lack of a well-structured theoretical approach to the resilience assessment is undeniable, based on punctual quantitative data and widely accepted among the scientific community. Specifically, an emphasis should be put on safety measures also including the evaluation of the cultural/historical contest using various approaches (e.g. humanities/hard sciences, in situ/laboratory survey/testing, etc.), towards the realization and employment of specific procedures. Existing safeguard methodologies of heritage assets, exposed to multiple hazards, must be carefully investigated for developing cutting-edge integrated tools. Despite several years of research, current procedures/technologies still suffer from comprehensive validation and integration; this is the gap that a proper approach should aim to fill, focusing on preservation and safe fruition of a common good in the framework of resilient communities. A priority step towards safety is upgrading of local traditional consolidation/rehabilitation techniques with innovative/cost-effective materials/devices already available in various field of restoration (Best Available Technologies, BAT). Then, sustainable development should be indispensable for a wider application in any intervention (on systems/utilities) of goods/services that are safe, non-polluting, ecologically sustainable throughout their life cycle; conserving of energy/natural resources; conceived to be durable, repairable, readily recycled, compostable, easily biodegradable; economically efficient, using the lowest amount of material/energy; and healthful for workers, communities and consumers. The implementation of safe management models/governance systems for cultural heritage should involve a wide amount of subjects (both public entities and private actors) and population in general, interfacing with local cultures and their sense of belonging/identity. A major challenge in post-catastrophe/post-crisis scenarios is the integration between what was there and is no longer there, what was there and is still there, identical or changed and what is rebuilt to replace what is lost. Citizens and local stakeholders can make significant contributions to the setting up of a priority agenda. Therefore, the reconstruction process should include effective participatory mechanisms and multi-stakeholder governance structures. Moreover, because responses to disasters correlate to culture, culture must anticipate/prepare responses
14
Building Resilience in Times of New Global Challenges: A Focus on Six. . .
299
to catastrophes and raise awareness of local communities with regard to policies, plans, programmes and architectural interventions. In conclusion, we can update the definition of safety, always as an autonomous attribute of resilience (see Table 14.1), with the following sentence: it is related to the protection of life, heritage and assets from natural/human-made disasters across climate/social changes in the framework of multi-hazard scenarios, reducing failure probabilities, consequences from failures and time to recovery.
14.2.2
Robustness
In the recent times, natural and human-made disasters often cause extensive casualties and socio-economic losses, in particular in the developed countries and built-up territory. Therefore, the attention of the scientific community on the concept of robustness significantly increased when a resilience analysis of the urban areas is tackled. Robustness is a fundamental structural prerequisite to survive without failure over a time period (Beer and Liebscher 2008). It can be defined as the insensitivity of a structure to undergo local failure independently from the causes and probabilities of initial local failures (EN 1991-1-7 2006). In the past years, the structural robustness was assessed under either exceptional or normally random conditions. According to the first case, a construction can be considered as robust when either collapse is not sudden, or the resistance is not substantially lost, although the deformations exceed the serviceability level. Instead, in the second case, a robust system can withstand occasional or frequent changes of environmental conditions without noticeable effects on its serviceability limit state behaviour (Formisano et al. 2009; Formisano 2019). The structural robustness is achieved when the response is commensurate to different types of applied actions, i.e. loads exceeding the design ones, accidental loads or damage to members. New and existing structures can be exposed during their lifetime to extreme actions, due to both anthropogenic and natural hazards, often unaccounted or underestimated in the design phase, like earthquakes in non-seismic areas, large eruptions, unpredictable fires, great storms, weighty snow, explosions, terrorist attacks, vehicular collisions, accidental overload, aircraft impact and design/construction mistakes (Formisano 2019). Structural robustness can be achieved by (a) either preventing the action or increasing the occurrence probability; (b) protecting the building; and (c) reducing the sensitivity to disproportionate collapse (Blockey et al. 2002). This last case must be taken into account in the design process, and designers must certify that the crisis of any structural building component does not produce a total collapse. Moreover, any resulting local damage must be confined within the floors above and below that interested by the component failure. More in detail, a robust structure can redistribute loads when a load-bearing member suffers a loss of strength or stiffness, but exhibiting a ductile, rather than brittle, failure mode. A robust structure is not over-designed, but it can withstand
300
M. Indirli et al.
damage, thanks to its global structural behaviour and failure modes. In fact, the localized failure can be mitigated by the construction capability to redistribute the load elsewhere (Formisano 2019). Part 1–7 of Eurocode 1 (2006) defines robustness as “the ability of a structure to withstand events like fire, explosions, impact or the consequences of human error without being damaged to an extent disproportionate to the original cause”. This definition was later incorporated within other codes, such as the recent Italian technical standards (Ministerial Decree of Public Works (M. D.) 2008, 2018), but lacking effective criteria either in measuring robustness or assessing whether the structure robustness level is acceptable or not. Therefore, robustness is a structural property which mitigates the susceptibility of structures towards progressive collapse, which is caused by the disproportion between the initial damage and the resulting huge breakdown of either the structure or its large parts (Formisano 2019). When structural robustness is lacking, the final failure state, disproportionately greater than that originating the crisis, leads to the so-called progressive collapse; it can be defined as “the spread of an initial local failure from element to element resulting, eventually, in the collapse of an entire structure or a disproportionately large part of it” (ASCE 2002). Therefore, the progressive collapse mechanism, originated by the propagation of local damages, interests either a large percentage or the entire construction, which is so that the structural system cannot withstand the main structural loads. It occurs when possible abnormal loads trigger a disastrous mechanism like that of a row of dominos. A typical progressive collapse event was the failure of the Ronan Point apartment tower (year 1968); after this tragic circumstance, the UK Building Regulations introduced in 1970 the “Fifth Amendment”, providing indications to avoid progressive collapse. Later on, the terrorist attack on the Murrah Federal Office Building (year 1995), together with the World Trade Centre collapse (year 2001), gave a new interest towards this subject. In general, there are three alternative approaches to disproportionate collapse-resistant design: improved interconnection or continuity, notional element removal and key element design. Nowadays, a general standard code theory regarding the study of robustness and progressive (or disproportionate) collapse topics does not exist at all. About structural robustness, although qualitative study approaches are diffused, no general quantitative recommendations and criteria have been yet implemented to quantify structural assessment approaches under extreme or unforeseen events. Thus, in structures susceptible to progressive collapse, small events can have catastrophic consequences. For such reasons, the degree of “progressivity” of a collapse can be defined as the collapsed volume (or area) over the same quantity directly destroyed by the event (Formisano et al. 2015). More in detail, the term “progressive” refers to the type of the structural collapse behaviour. It can be propagated horizontally, from a structural bay to the adjacent ones, or vertically, i.e. when the collapse of a column interests the upper floors, leading to the so-called “pancake” collapse. The observer judges a collapse disproportionate when it is incongruent with the initial damage cause. This is merely an evaluation based on observations of the damage consequences resulting from the
14
Building Resilience in Times of New Global Challenges: A Focus on Six. . .
301
originating events, but does not describe the characteristics of the structural behaviour. For example, a collapse may be progressive, but not necessarily disproportionate, if it stops after an evolution through several structural bays. On the other hand, a collapse may be disproportionate, but not necessarily progressive if it is limited to a single structural bay. Starting from the above said statements, the research within this field should establish as a first step a reliable methodology for evaluating the performance of construction subjected to exceptional actions. In fact, the interest on the robustness assessment has been increasing a lot especially in the structural design field, firstly by solving an optimization problem. All variable parameters are commonly considered random quantities, used to evaluate the structural robustness in a probabilistic way. The optimization problem generally aims at achieving both an optimum mean and a minimum variance of the structural response with respect to input variations. Nevertheless, probabilistic approaches are often complicated to be used by designers. For this reason, a new procedure for robustness assessment has been conceived and applied to new structures in a semi-probabilistic manner and then deterministically to evaluate the seismic resistance of existing gravity-load designed buildings (Formisano et al, 2015). Such a method, framed within a performance-based approach, allows for the achievement of direct and indirect damages of buildings starting from their capacity curves evaluated through the pushover analyses (Formisano et al. 2015 and 2019). Finally, based on these analyses, appropriate robustness matrices of structural systems can be defined according to pre-determined performance targets. Studies on structural robustness under a Vesuvius large eruption can be found in De Gregorio et al. (2010), Faggiano et al. (2010), Zuccaro et al. (2010) and other papers of the COST Action C26 (2010a, 2010b). In conclusion, we can update the definition of robustness, always as an autonomous attribute of resilience (see Table 14.1), with the following definition: it is related to the adequacy of structural/infrastructural systems to withstand actions, under exceptional or normal conditions, related to their function/exposure, mitigating the susceptibility towards disproportionate or progressive collapse and surviving without failure over a time period.
14.2.3
Adaptive Capacity
The concept of adaptive capacity has been defined in different ways to cover many factors, referring to a wide amount of attributes and processes, without a general agreement among the researchers. Furthermore, there are contradictory definitions of vulnerability, exposure, sensitivity and adaptive capacity (Adger et al. 2004), which are frequently interdependent. Jakku and Lynam (2010; and references therein) illustrated several definitions of adaptive capacity in the literature (see Table 14.2). An updated ICCP’s definition of adaptive capacity is the following: it represents “the ability of systems, institutions, humans and other organisms to adjust to potential damage, to take advantage of opportunities, or to respond to consequences” (IPCC 2014).
302
M. Indirli et al.
Table 14.2 Different definitions of adaptive capacity (adapted from Jakku and Lynam 2010) Approach Resilience framework
Vulnerability assessment
Definition Adaptive capacity is “a component of resilience that reflects the learning aspect of system behavior in response to disturbance” Adaptive capacity relates to a system’s “ability to reorganize and renew itself in the face of change” Adaptive capacity is treated as synonymous to adaptability, which is defined as “the capacity of any human system from the individual to humankind to increase (or at least maintain) the quality of life of its individual members in a given environment or range of environments” Adaptive capacity is “the preconditions necessary to enable adaptation, including social and physical elements, and the ability to mobilize these elements. [. . .]. “It is represented by the set of available resources and the ability of the system to respond to disturbances and includes the capacity to design and implement effective adaptation strategies to cope with current or future events” Adaptability is defined as “the capacity of actors in a system to influence resilience”. The “collective capacity” of actors “determines whether they can successfully avoid crossing into an undesirable system regime or succeed in crossing back into a desirable one” Adaptive capacity is “the ability or capacity of a system to modify or change its characteristics or behavior so as to cope better with existing or anticipated external stresses”. “Adaptive capacity is a vector of resources and assets that represent the asset base from which adaptation actions and investments can be made” The IPCC defines adaptive capacity as “the ability of a system to adjust to climate change (including climate variability and extremes), to moderate potential damages, to take advantage of opportunities, or to cope with the consequences” The IPCC also views adaptive capacity as “the potential, capability, or ability of a system to adapt to climate change stimuli, their effects or impacts”
Adaptive capacity is “the ability of a system to change in a way that makes it better equipped to manage its exposure and/or sensitivity to climatic influences”
Reference Carpenter et al. (2001)
Fazey et al. (2007) Gallopin (2006)
Nelson et al. (2007)
Walker et al. (2004)
Adger et al. (2004)
Adger and Vincent (2005) IPCC (2001), Sect. 2.3
IPCC (2001), Sect. 2.3 Anticipating Effects of Climate Change Sect. 18.5.1. Vulnerability and Adaptive Capacity Preston and StaffordSmith (2009) (continued)
14
Building Resilience in Times of New Global Challenges: A Focus on Six. . .
303
Table 14.2 (continued) Approach Communitybased approach
Definition Adaptive capacity is “a critical aspect of resource management that reflects learning and an ability to experiment and foster innovative solutions in complex social and ecological circumstances” Adaptive capacity is “a specific application of community capacity to achieve a certain outcome”. In the context of climate change, adaptive capacity is “the collective ability of a group to adapt to and cope with climate change over time in a way that maximizes well-being” Adaptive capacity is “a set of characteristics that allows a given system to perceive change or threatening circumstances, evaluate them, decide on a solution path and both develop and adopt processes and tools to manage the risk, thereby maintaining itself throughout”
Reference Armitage (2005)
Mendis et al. (2003)
Wall and Marzall (2006)
Similar shocks can have different impacts in different environments. Therefore, adaptive capacity depends on several factors. Availability, access and distribution (from national to local level) of resources (natural, economic, social and human capital) and technological options are fundamental to face hazardous situations and cope with response strategies. Changes over time and across space, and variations from country to country, from community to community and among social groups and individuals are evident. The structure of institutions, effectiveness of decision criteria and ability of decision-makers to manage information are also critical. Adaptive capacity is dynamic and context specific. In addition, it is shaped by interdependent scales, occurring at various levels (geographic, ecological, social, political and economic), because different places are exposed to different hazards and climate change impacts. Moreover, adaptive capacity is a latent potential, because it can be explicated into actual adaptation only after the push of hazards and impacts; even if it has been developed at a certain level, still uncertainties in the response can still be seen. Adaptive capacity goes beyond the concept of coping ability. The latter is referred mainly to short-term adjustments (recovery measures), while the first is related to long-term effects (structural changes), differentiating recovery from mitigation (Jakku and Lynam 2010; Lorenz and Dittmer 2016; Yohe and Tol 2002; and references therein). A key category about adaptive capacity is the participation at local, regional and global processes; the lower it is, the lower prevention activities and adaptation developments to disasters are evident (Lorenz and Dittmer 2016; and references therein). Finally, in the way of Carpenter et al. (2001) and others, we prefer to define adaptive capacity as an autonomous attribute of resilience (see Table 14.1), with the
304
M. Indirli et al.
following definition: it is the ability of systems, institutions, humans and other organisms to modify themselves in order to recover (short term) with acceptable consequences after catastrophic events and respond successfully to new global changes (long term).
14.2.4
Sustainability
Sustainability and resilience represent complex concepts with different definitions depending on the areas of applicability. Their interrelationship is still widely discussed and the hierarchy among them not very well investigated (Indirli 2019). Dealing with disaster risk management, several points of convergence and divergence are evident, sometimes creating uncertainties towards the decision-making process (Lizarralde et al. 2015) within urban planning and infrastructural design (Roostaie et al. 2019). This aspect is critical for urban-scale policy makers to implement sustainable development pathways, facing the increase of severity of natural hazard events driven by climate change and world population growth (Feofilovs et al. 2020). This is the underlined reason why methodological approaches and strategic tools for sustainability and resilience assessment rose during the last decades (Roostaie et al. 2019), with a particular focus on urban policy planning, which is certainly a critical issue. Therefore, reasoning about an inclusive “Smart cities” approach is nowadays essential. It is in line with the UN’s Sustainable Development Goals-SDGs (Visvizi and Perez del Hoyo 2021), with the aim to enhance sustainable and resilient strategies against climate changes within the urban context. We might describe this approach as a combination of “networks of physical systems and human communities, capable of managing extreme events and able to survive and function under extreme stress” (Rus et al. 2018). The concept of sustainable development and sustainability relies on the Brundtland report discussed by the Prime Minister of Norway in 1987 at the United Nations’ Commission for Environment and Development. It is defined as the “. . . development that meets the needs of the present without compromising the ability of future generations to meet their own needs” (United Nations 1987). Such definition drafted the roadmap towards the 17 SDGs that the UN General Assembly agreed on in September 2015 (United Nations 2015). In addition, redefinitions of sustainable development concepts and sustainability were proposed depending on the type of emphasized research subject, e.g. human well-being, preservation and maintaining of natural and cultural resources, mitigating changes in biodiversity, heritage artefacts and intangible cultural traditions (Leach et al. 2010; Lew et al. 2016). By definition, we might say that the central idea of sustainability aims to reduce negative environmental impacts to avoid changes, while resilience is more connected to adaptation to change and thus including adaptive capacity. In this light, such concepts are also embedded within the Panarchy approach, which considers a series of interconnected (and thus complex) adaptation cycles at different scales (Garmestani et al. 2009). The Panarchy concept often relies to disasters
14
Building Resilience in Times of New Global Challenges: A Focus on Six. . .
305
Relationship between Sustainability and Resilience
Sustainability = Resilience
Sustainability
Resilience
Resilience
Sustainability
Resilience
Sustainability
Fig. 14.1 Different relationships between sustainability and resilience (reedited from Roostaie et al. 2019)
science. Based on this approach, it is interesting the vision proposed by Colocci (2020). He describes sustainability as “. . . the overall endeavour of human communities to promote a sound coexistence with the bio-physical systems, where flux of resources and information is bi-directional, addressing human needs while never exceeding natural capacities”; on the other hand, the same author defines resilience as a concept from which “. . . social-ecological systems should learn from the processes of the natural dynamics as well as they should prepare in advance in case of severe hazards”. It may be agreed that increasing the resilience of communities against disasters became paramount for sustainable development goals. In this way, resilience and sustainability can be considered complementary properties necessary to jointly enhance urban development (Feofilovs et al. 2020). Sustainability and resilience deal with a multidimensional/multifunctional evaluation depending on the defined objectives of specific disciplines. According to Roostaie et al. (2019), the tricky relationship between sustainability and resilience might be defined by four different relationships (Fig. 14.1). They can be considered as synonyms, a component embedding the other, separate and/or complementary conceptual objectives. Towards the implementation of risk reduction strategies coping with climate change and the increase of the magnitude and frequency of natural disasters, it is essential to promote a consistent yet integrated approach in order to (1) conserve future resources, (2) protect investment in sustainable structures and infrastructure, (3) ensure that sustainable developments continue to function for their designed life and continue to reap the benefits of sustainable design and (4) preserve the stability of social and economic networks within communities (Matthews et al. 2014; Roostaie et al. 2019). This background becomes essential to consistently integrate resilience assessment methods into building sustainability assessment frameworks to support strategic thinking and planning within the built environment. This approach can be made by providing policy makers or decision makers qualitative, semi-quantitative and quantitative tools capable of describing and optimizing the interrelationship between sustainability and resilience. Many research attempts started to face a comprehensive sustainability and resilience assessment (Jabareen 2013; Zanotti et al. 2020; Keith et al. 2020). Several researchers defined the link between sustainability and urban resilience by environmental adaptation (Zanotti et al. 2020). Specifically, the UK government merged the
306
M. Indirli et al.
sustainability concept within urban resilience and adaptability strategic planning (Thompson and Beck 2014). The assessment methodology proposed by Roostaie and Nawari (2021) aims to incorporate each concept’s most common principles to more effectively cope with natural hazards and climate change effects. This method defines design indicators and sustainable design principles to explore and identify the interdependence of sustainable and resilient design factors. The study of Mallick (2021) integrates the Prediction-Adaptation-Resilience (PAR) approach with SDGs for better urban resilience and sustainable urban management using an indicatorbased conceptual framework. The conceptual approach proposed by Feofilovs and Romagnoli (2021) is based on complex system theory (i.e. System Dynamics). Such approach provides a dynamic assessment of urban resilience to natural hazards by defining an urban resilience index embedding the sustainability aspect more in improving environmental performances within the urban system. There are several ongoing discussions on how to consider the concept of sustainability, embedded within a larger resilience definition. Sustainability is usually defined through three main pillars: environmental, social and economic considerations. On the other hand, resilience is generally described as the ability of a system to absorb impacts, recover and adapt following persistent stress or a disruptive event. Based on the latest conceptualization, resilience can be considered as a property of a complex system and indeed may be counter to sustainability goals (Borg 2019); for instance, efficiency reduces diversity and redundancy; therefore, both of these are key features of resilience. High-density urban areas are suitable to promote more efficient energy distribution, waste management and communications, but are more vulnerable to extreme actions, such as flooding, because they are less diverse and have less redundancies (Elmqvist 2017). The differences and synergies between sustainability and resilience need to be explored first to be further applied in resilient policy and practice. In conclusion, given the complexity of the different definitions of sustainability and resilience, their assessment methodologies and potential applicability, it is challenging to define a one-size-fits-all framework that can fully integrate the two concepts. When incorporating resilience standards into the sustainability agenda, there is a need to tailor and customize the potentially applicable strategies based on the nature of development scenarios, location, climate and natural hazards to which the area is prone. It is of utmost importance to actively integrate and engage different stakeholders to create a consistent roadmap towards sustainable and resilient urban planning and development in light of the 2030 Agenda for SDGs. In this way, the synergetic cooperation among urban planners, policy makers, urban researchers and local administrators could be enhanced for better urban resilience and sustainable development. This process is essential to provide local administrators and policy makers the key for sustainable and affordable smart city development (Mallick 2021). Finally, we prefer a certain dependence of the first (sustainability) on the second (resilience), as an attribute. In conclusion, sustainability regards the preservation of the natural/anthropogenic capital, mitigating changes in biodiversity, heritage artifacts and intangible cultural traditions and fostering mature self-balanced environments.
14
Building Resilience in Times of New Global Challenges: A Focus on Six. . .
14.2.5
307
Governance
The term governance is used in political science to describe the multitude of actors and processes that lead to collective binding decisions (Van Asselt and Renn 2010). It should be considered a multi-level activity done internationally transcending national frontiers. It represents the decision-making among all the actors involved in a collective problem that leads to creating, reinforcing or reproducing social norms, laws, policies and institutions. In this framework, the state is not the only, single most important actor, but the decisions are implemented in complex networks and processes. In a normative use, the notion of governance refers to a model or framework for organizing and managing society. Therefore, governance has become in the last decades a wider concept, in order to respond to new challenges such as worldwide threats; increased globalization; urgency of stronger international cooperation; quick societal changes, including the increased citizen’s engagement; rise of nongovernmental organizations (NGOs); and changing role of the private sector. The culmination of all these factors led to the need for a new legitimate form of governance, taking into account the augmented complexity of policy issues (Finkelstein 1995; Hermans et al. 2012; Hufty 2011). Governance is the umbrella under which Disaster Risk Reduction (DRR) takes place (DRR terminology in UNISDR 2009). The United Nations Development Programme (UNDP) definition states that “governance is the exercise of political, economic and administrative authority in the management of a country’s affairs at all levels. It comprises mechanisms, processes and institutions through which citizens and groups articulate their interests, exercise their legal rights, meet their obligations and mediate their differences. Governance encompasses, but also transcends, government. It encompasses all relevant groups, including the private sector and civil society organizations” (UNDP 2010). Principles of reliable (“good”) governance, fundamental for an effective DRR, include accountability, efficiency, responsiveness and broad participation. Moreover, communication, openness and transparency are central to the governance process and key at all stages. The catastrophic impact of disasters is not due only to natural causes. Human acts and decisions also trigger disasters. Therefore, Disaster Risk Governance (DRG) refers to the way in which the public authorities, civil servants, media, private sector and civil society coordinate at national, regional and community levels to manage and reduce disaster and climate-related risks (UNDP 2013). The notion of risk governance has been coined only recently. It is an emerging concept that aims to provide an approach for how to deal responsibly with public risks, involving the translation of the substance and core principles of governance to the context of risk-related decision-making. In fact, risk governance pertains to the various ways in which several actors, individuals and public/private institutions deal with risks surrounded by uncertainty, complexity and ambiguity. Risk governance comprises and extends the three conventionally identified elements of risk analysis: risk assessment, risk management and risk communication. It should be taken into account the complex web of actors, rules, conventions, processes and mechanisms
308
M. Indirli et al.
concerning how risk information is collected, analysed and communicated, together with the way to make decision by the management, considering the interests and perspectives of various actors and stakeholders (Hermans et al. 2012; IRGC 2005; Van Asselt and Renn 2010). The crucial role of risk governance is also focused on the Hyogo Framework for Action 2005–2015 (UN-ISDR 2005). In Europe, the White Paper (CEC 2009) set clear regional policy guidance on reducing climate-related risks as a central issue. The Council of Europe also encouraged the indispensable interaction between decision-makers and scientists to enhance Climate Change Adaptation (CCA) and DRR. Such need should be reflected on a consistent identification of the risks and DRR, an analysis of the governance structure and recommendations for the enhancement of good practices in regional and international organizations (ISDR/Eur-opa/ Council of Europe 2011). However, the European Commission employed risk governance, risk identification, assessment, management and communication still in a traditional manner rather than as an alternative paradigm. The positivistic and quantitative risk paradigm (Knight, 1921) has been and still is the dominant way of conceptualizing, assessing and managing risks; it lies on the statement that it is possible to recognize with precision risk from uncertainty, where the first is measurable by using the formula risk = chance x effect, while uncertainty is immeasurable and not calculable. Knight’s concept of risk focuses on the probability of events and the magnitude of specific consequences. Following this classical risk approach, two phases are distinguished and ideally institutionally separated: risk assessment (identification and evaluation of risk) and risk management (taking measures to control risks deemed unacceptable). Anyway, risk governance involves the recognition that uncertainty and risk cannot be easily distinguished, as assumed in the positivistic risk paradigm. In some cases (e.g. car accidents), when risks are simple (i.e. calculable and relatively easy to manage), existing risk assessment tools and risk management approaches suffice. On the contrary, in many other contexts, risks cannot be classified as simple. They are not confined to national borders or a single sector and do not fit the linear, mono-causal model of risk. Such risks are complex (multi-causal) and surrounded by uncertainty and/or ambiguity. Due to complexity, it is impossible to achieve complete deterministic knowledge of cause-effect relationships (Hermans et al. 2012). For several years, a serious attention missed about risk governance’s meaning and use. This situation changed after the foundation of the International Risk Governance Council (IRGC) in 2003, a private, independent, not-for-profit organism. The IRGC Risk Governance Framework describes the fundamental principles and concepts for managing risks marked by complexity, uncertainty and ambiguity (IRGC 2018). The idea of risk governance can be explained with a set of principles: (a) communication and inclusion, (b) integration and (c) reflection. In times of new global challenges, proper communication is crucial to make citizen groups more resilient. Risk communication, in fact, is not just a matter of simple real-time exchange of information, advice and opinions between experts or officials and people who face a threat (hazard). Rather, it is a complex relation
14
Building Resilience in Times of New Global Challenges: A Focus on Six. . .
309
between those who know (experts), those in charge (authorities) and those affected. Here, trust plays a crucial role. Citizens’ trust towards the preparedness of institutions to manage crisis (being these natural disasters, health emergencies or terrorism) is the most important variables in effective communication management (Longstaff and Yang 2008). Particularly challenging is the communication management of hazards which present more “non-technical” (ethical, moral, economic) rather than “technical” issues (Sandman 1989). Paradigmatic are the cases of technology transfer when new products of innovations enter in the citizens’ everyday lives, such as the locations of incinerators which has led to the NIMBY movements (Hermansson 2007), the oppositions to the releases in the environment/on the market of genetically modified products (Martinelli et al. 2013) and the nowadays hesitancy/opposition to the vaccination to prevent the SARS-CoV-2 spread (Dror et al. 2020). Risk communication has been initially (and still is) intended in terms of “deficit models”, i.e. the assumption that educating (or providing notions) and persuading the public, often considered incapable of understanding and interpreting science, could result in citizens’ trust (Simis et al. 2016). Such approach, however, has been questioned by empirical research because there are often various, conflicting risk perspectives to be questioned, about whose knowledge and information should be shared, including all various actors in the decision-making process, increasing the level of trust (Svalastog et al. 2014). Inclusion means that different stakeholders should play a key role in pre-assessing the risk, with the right to participate in the evaluation of the risks affecting themselves. Inclusion does not necessarily lead to more widely accepted decisions or reduce the societal conflict. Indeed, participation procedures themselves sometimes become a crucial source of conflict, which should be accepted and addressed. Integration refers to the need to collect and synthesize all relevant knowledge and experience from various disciplines and various sources, especially when complex and/or ambiguous risks are concerned. Multidimensional risk(s)-benefit(s) evaluations are required with a holistic approach, avoiding a counterproductive separation between risk assessment and risk management. Reflection means that a critical outlook should be always maintained among actors and institutions involved; risk governance cannot be considered a simple routine activity among technocratic entities, differing from the traditional, positivistic approach due to the difficult issues of uncertainty, complexity and ambiguity (Hermans et al. 2012). In conclusion, governance pertains to a shared risks assessment and management among all the actors involved, taking into account factors as uncertainty, complexity and ambiguity, towards a new equilibrium before/throughout/after traumas/disasters.
310
14.2.6
M. Indirli et al.
Anamnesis
In disaster risk, local authorities address mitigation and prevention, in increasing preparedness of the community. Knowledge and memory of past events are key in preparing efficient prevention strategies and strengthening the community’s resilience. Cultural memory studies arose at the beginning of the twentieth century, with Maurice Halbwachs’ works on mémoire collective (Halbwachs 1950; Marcel and Mucchielli 2010). The complex issue of cultural memory is remarkably interdisciplinary. It is argued that remembering disasters may help in building risk awareness and therefore avoiding new disasters or, at least, anticipating and mitigating risks. Le Blanc (2012) affirms that this disaster memory can be territorialized through physical material traces of catastrophes, including urban ruins and memorials, intended to reach a large audience. However, the process of giving materiality to memory and more generally recalling disasters is very complex, subtle and political; whereas the conventional risk management practices led to debatable choices in terms of disaster memory, the resilience approach might consist in a renewed method, more appropriate to the complexity and the subtlety of collective memory (Halbwachs 1950). Le Blanc (2012) discusses how the paradigm of disaster resilience can reorient urban planning policies with the aim to mitigate various types of risks, thanks to a mindful action on heritage and conservation practices. Resilience is defined as the “capacity of a social system to proactively adapt to and recover from disturbances that are perceived within the system to fall outside the range of normal and expected disturbances” (Comfort et al. 2010). Resilience relies strongly on the perception of risk (Slovic et al. 1985) and the memory of catastrophes. Halbwachs (1950) argues that states, regions and municipalities have been giving territorial materiality to collective memory for centuries. This tendency considerably increased in the second half of the twentieth century (Choay 1996; Jeudy 2001), in particular with regard to the memory of disasters: as when important traces of catastrophes, such as urban ruins, have been preserved; as these were expected to maintain some awareness and therefore foster urban resilience. Berlin’s Gedächtniskirche is considered as an example of this approach (Robin 2001). Le Blanc (2010) speaks about preserved urban ruins as efficient tools of territorial resilience, with these massive monuments resulting in effective discontinuity marks in an urban landscape, generating powerful emotions. Cases in point are the preserved ruins of two churches: the previous Chiesa Madre, now Earthquake Memory Museum, at Santa Margherita Belice, Sicily, (Italy), destroyed by the 1968 seismic event (Fig. 14.2a), and Madonna delle Grazie (Fig. 14.2b), intended to maintain the memory of the 1976 earthquake in Gemona, Friuli (Italy). Yet, Le Blanc argues that, in spite of preserved traces of catastrophes and various warnings and heritage policies, there are numerous examples of risk mismanagement and urban tragedies (Le Blanc 2012). When resilience is exploited as a guiding concept, the results of these failed risk mitigation policies and irrelevant disaster memory processes might change.
14
Building Resilience in Times of New Global Challenges: A Focus on Six. . .
311
Fig. 14.2 (a) The Chiesa Madre of Santa Margherita Belice, completely destroyed by the 1968 Belice earthquake, now hosts the Earthquake Memory Museum (Museo della Memoria 2021). (b) The restored ruins of the Madonna delle Grazie Church (plant: left; portal, right), completely destroyed by the 1976 Friuli earthquake (Cragnolini 2012)
Resilience effectively deals with the complexity of temporal and spatial scales and with partly emotional and qualitative processes. This approach fits the issues of urban memory management (Le Blanc 2012). Resilience might help emphasize the complexity and the subtlety of remembrance messages, leading to alternative methodologies better adapted to the diversity of risks, places and actors. However, besides an assigned territorial materiality, memory is often symbolically and politically framed and interpreted. Vale and Campanella (2005) outline this political aspect of remembrance and resilience; Le Blanc (2012) considers that resilience and the territorialization of memory are not ideologically neutral, but urban risk mitigation may be; he notes that memory (being materialized or immaterial, territorial or oral, creating multiple and complex links between people and their territory) might be the best way to overcome the disaster and re-establish the complexity of place. A real resilience is achieved when the complexity of urban space (a dynamic way to live together, the actual sharing of the city’s material and immaterial assets) is recovered. Disaster management authorities and city managers need to adopt renovation and reconstruction policies that improve local resilience through the revival of collective
312
M. Indirli et al.
memories. Aslani and Hosseini (2019) presented a new method to evaluate the impacts of identity and collective memory (CM) on social resilience, applying this approach to Bam (Iran), in the aftermath of the 2003 earthquake; during the reconstruction, the authors argue that little was done to preserve both the identity and CM; they relied on grounded theory to assess the social resilience, referring to key concepts and core categories on a local level. They concluded that identity and CMs diminished gradually, as the intangible needs of local residents were neglected during the Bam reconstruction (Aslani and Hosseini 2019). Through history, Constantinople maintained greater diversity of insurance strategies than many other historical and contemporary urban centres, due to its heavy investment in military infrastructure and systems for supplying, storing and producing food and water (Barthel et al. 2011). Citizens could receive seaborne goods from major granaries and at least four harbours. When trade networks broke down during sieges of the city, citizens relied on food cultivation within the defensive walls and fishing in the Golden Horn. Cycles of sieges, every 50 years on average, generated a diversity of social-ecological memories. This allowed knowledge, experience and practice of how to manage a local ecosystem, to be stored and transmitted in a community. Therefore, such memories persisted in multiple groups of society. This aspect was considered in part as a response to the collapse of long-distance, seaborne grain transport from Egypt and food production; transports were decentralized into smaller subsistence communities, selling surplus to the markets, with Constantinople becoming more self-reliant on regional ecosystems (Barthel et al. 2011). Borg et al. (2016) review the effects of the 1908 Messina earthquake on the local community and the Maltese experience of this seismic event, relying on the communication published in Malta immediately after the catastrophe. The authors analyse the experience based on first-hand sufficiently detailed accounts of the disaster. The reports influenced the community’s CM, providing information on the building deficiencies and damage, limitations of communication infrastructure during that period, limits to timely emergency response to support the population and emergency action at the beginning of the twentieth century. Lamond and Bhattacharya-Mis (2014) discuss the complexity of recurring changes in the natural environment and their impact on the dynamic urban built environment setting, in specific the primary physical impact by means of water ingress to normally dry areas or evacuation from the push of high velocity flood water. The research speaks about a constant change in the level of exposure and vulnerability of the surrounding built environment, as a result of the memory stored within the system, partly due to repeated impacts of flood events. The enhancement of the resilience against such irregular changes should consider the interactions and feedbacks within the built environment, on a scenario-specific basis, reflecting the antecedent memory inside the system. However, it still remains a crucial challenge to direct the attributes of physical memory within the built environment, maintaining the system functionality improving its specific resilience. Again, Lamond and Bhattacharya-Mis (2014) propose a framework to identify the system potential
14
Building Resilience in Times of New Global Challenges: A Focus on Six. . .
313
vulnerability by developing resilience with special reference to flood-induced physical memory. It is argued that all steps of a restoration process are critical in the understanding of the structural behaviour of cultural heritage buildings. Key themes such as anamnesis, diagnosis and analysis are critical in approaching the analysis of historical constructions, through material characterization, structural modelling, monitoring, rehabilitation and repair (SAHC 2016). Wilson (2015) says that the resilience concept is rapidly emerging as a research topic, gaining importance especially the “social resilience”. However, Wilson notes that, due to the relative novelty of the research field, discussions about processes of social resilience are not yet fully developed, in particular with regard to how the inbuilt memory of a local community helps shape resilience pathways (social memory). The focus of the discussion is on the interlinkages between social memory and community resilience, analysing the importance of rites, traditions and social learning processes in shaping community resilience and vulnerability. Nemeth and Olivier (2017) also note that the memories of a devastating event, together with the lingering willingness to help others, are powerful forces that coalesce to change collective behaviour and therefore create CM. In conclusion, we can update the definition of anamnesis, always as an autonomous attribute of resilience (see Table 14.1), as the safe-guarding and transmitting collective disaster memory (material or immaterial, territorial or oral) and cultural identity intact to posterity as a drop anchor for social well-being and democracy.
14.3
Conclusions
This chapter has been conceived to discuss the suitability of the tool developed in Indirli (2019) to evaluate the resilience based on the six attributes described in Table 14.1. Thanks to the discussion developed by the authors of the present study, the validity of the initial cornerstones, in primis the relationship between the resilience’s main concept and its attributes, has been confirmed and enhanced, modifying and fulfilling the initial definitions (final results in Table 14.3, differences in bold). Hence, this original and captivating methodology, conceived to provide an effective framework to study, without rigidity, complex questions as the combination of natural and anthropogenic hazards, with particular reference to global warming, can be considered an effective framework to assess resilience, to be adopted in times of new global challenges. Of course, it is easier to apply this analysis case by case. In fact, this approach has been already adopted, in parallel with this theoretical discussion, to basically evaluate the overall resilience of the Italian community during the first period of the COVID-19 pandemic (Indirli et al. 2021). Such a tragic event, which has certainly been a very hard test for our whole planet, is one of the examples of the tragic events that the humanity is expected to face in the future. Analysis tools to prevent/properly govern the future crisis are urgent. With our study we wish to have given a useful
314
M. Indirli et al.
Table 14.3 Reviewed nuclei for a pluralistic but holistic view of resilience (in bold the integrated definitions) Attributes Safety
Robustness
Adaptive capacity
Sustainability
Governance
Anamnesis
Description Protection of life, heritage and assets from natural/ human-made disasters across climate/social changes in the framework of multi-hazard scenarios, reducing failure probabilities, consequences from failures and time to recovery Adequacy of structural/infrastructural systems to withstand actions, under exceptional or normal conditions, related to their function/exposure, mitigating the susceptibility towards disproportionate or progressive collapse and surviving without failure over a time period Ability of systems, institutions, humans and other organisms to modify themselves in order to recovery (short term) with acceptable consequences after catastrophic events and respond successfully to new global changes (long term). Preservation of the natural/anthropogenic capital, mitigating changes in biodiversity, heritage artifacts and intangible cultural traditions and fostering mature self-balanced environments Consensual and shared risks assessment and management of conflicts towards among all the actors involved, taking into account factors as uncertainty, complexity and ambiguity, towards a new equilibrium before/throughout/after traumas/disasters. Safe-guarding and transmitting collective disaster memory (material or immaterial, territorial or oral) and cultural identity intact to posterity as a drop anchor for social well-being and democracy
Target Multi-hazard combinations and maps
Multi-level networks
Social-ecological models
Sustainability models
Risk management
Preservation of tangible/intangible heritage
hint towards the adoption of resilient governance in times of new global challenges and to evaluate if we are homeostatic or autopoietic.
References Adger N, Vincent K (2005) Uncertainty in adaptive capacity. C R Geoscience 337:399–410 Adger WN, Brooks N, Bentham G, Agnew M, Eriksen S (2004) New indicators of vulnerability and adaptive capacity. Tyndall Centre for Climate Change Research, technical report 7, January 2004 Armitage D (2005) Adaptive capacity and community-based natural resource management. Environ Manag 35(6):703–715 ASCE (2002) Minimum design loads for buildings and other structures. American Society of ASCE, Washington DC
14
Building Resilience in Times of New Global Challenges: A Focus on Six. . .
315
Aslani F, Hosseini KA (2019) Evaluation of the impacts of identity and collective memory on social resilience at neighborhood level using grounded theory. SAGE J. https://doi.org/10.1177/ 1206331219886256 Barthel S, Sörlin S, Ljungkvist J (2011) Innovative memory and resilient cities: echoes from ancient Constantinople, the urban mind, cultural and environmental dynamics. In: Sinclair P, Herschend F, Isendahl C, Nordquist G (eds) Studies in global archaeology 15. Uppsala University Press, Uppsala, Sweden Beer M, Liebscher M (2008) Designing robust structures – a non linear simulation based approach. Comput Struct 86:1102–1122 Blockey D, Agarwal J, Pinto T, Woodman NJ (2002) Structural vulnerability, reliability and risk. Prog Struct Eng Mater 4:203–212 Bobrowsky PT (2013) Encyclopedia of natural hazards. In: Bobrowsky PT (ed) Part of the encyclopedia of earth sciences series book series (EESS). Springer, Dordrecht Borg RP (2019) Introduction: Sustainability & Resilience in the built environment, proceedings of SBE 19 Malta international conference, 21–22 November 2019, Malta, isbn 978-99957-1-6127, ISBN 978-999571-613-4 (ebook) Borg RP, D’Amico S, Galea P (2016) The Messina earthquake, 1908: the Maltese experience. In: D’Amico S (ed) Earthquakes and their impact on society. Publisher Springer Natural Hazards, Springer International Publishing, Cham. https://doi.org/10.1007/978-3-319-21753-6_22 Bruneau M, Chang SE, Eguchi RT, Lee GC, O’Rourke TD, Reinhorn AM, Shinozuka M, Tierney K, Wallace WA, Von Winterfeldt D (2003) A framework to quantitatively assess and enhance the seismic resilience of communities. Earthquake Spectra 19:733–752 Carpenter S, Walker B, Anderies J, Abel N (2001) From metaphor to measurement: resilience of what to what? Ecosystems 4:765–781 CEC (2009) Commission of the European Communities. White paper: adapting to climate change: towards a European framework for action, COM (2009) 147 final, Brussels, Belgium. https:// eur-lex.europa.eu/legal-content/EN/TXT/PDF/?uri=CELEX:52009DC0147&from=EN Choay F (1996) L’allégorie du patrimoine. Seuil, Paris, France Colocci A (2020) Modelling disaster risk reduction: decoding social-ecological interactions to foster transformative adaptation, PhD thesis, 2020 Comfort L, Boin A, Demchak CC (eds) (2010) Designing resilience. Preparing for extreme events. University of Pittsburgh Press, Pittsburgh, Pennsylvania, USA COST Action C26 (2010a) Proceedings of COST action C26 final international conference on urban habitat construction under catastrophic events, Naples, 16–18 September 2010, M. Byfield, G. De Matteis, D. Dubina, B. Faggiano, M. Indirli, A. Mandara, F.M. Mazzolani (chair), E. Mistakidis, J.P. Muzeau, F. Wald (eds) COST Action C26 (2010b) Final report of COST action C26 final international conference on urban habitat construction under catastrophic events, Naples, 16–18 September 2010, M. Byfield, G. De Matteis, D. Dubina, B. Faggiano, M. Indirli, A. Mandara, F.M. Mazzolani (chair), E. Mistakidis, J.P. Muzeau, F. Wald (eds) Cragnolini S (2012) Pictures of the restored ruins of Santa Maria delle Grazie, Gemona, Italy. In glemone.it https://www.glemone.it/archivio/monumenti_storici/madonna_grazie.htm De Gregorio D, Faggiano B, Formisano A, Mazzolani FM (2010) Air fall deposits due to explosive eruptions: action model and robustness assessment of the vesuvian roofs. Proceedings of COST action C26 final international conference on urban habitat construction under catastrophic events, Naples, 16-18 September 2010, M. Byfield, G. De Matteis, D. Dubina, B. Faggiano, M. Indirli, A. Mandara, F.M. Mazzolani (chair), E. Mistakidis, J.P. Muzeau, F. Wald (eds) Donghyun K, Seul-Ki S (2018) Measuring changes in urban functional capacity for climate resilience: perspectives from Korea. Futures 102:89–103 Dror AA, Eisenbach N, Taiber S, Morozov NG, Mizrachi M, Zigron A, Sela E (2020) Vaccine hesitancy: the next challenge in the fight against COVID-19. Eur J Epidemiol 35(8):775–779 Elmqvist T (2017, June 15). Sustainability and resilience differ. Nature 546:352 (Correspondence, T. Elmqvist, Stockholm Resilience Centre, Stockholm University, Stockholm, Sweden)
316
M. Indirli et al.
EN 1991-1-7 (2006, January) Actions on structures – part 1–7: general actions – accidental actions. European Committee for Standardization, Brussels, Belgium Faggiano B, Nigro E, De Gregorio D, Zuccaro G, Cacace F (2010) Volcanic actions and their consequences on structures. Proceedings of COST action C26 final international conference on urban habitat construction under catastrophic events, Naples, 16–18 September 2010, M. Byfield, G. De Matteis, D. Dubina, B. Faggiano, M. Indirli, A. Mandara, F.M. Mazzolani (chair), E. Mistakidis, J.P. Muzeau, F. Wald (eds) Fazey I, Fazey J, Fischer J, Sherren K, Warren J, Noss R, Dovers S (2007) Adaptive capacity and learning to learn as leverage for social-ecological resilience. Front Ecol Environ 5(7):375–380 Feofilovs M, Romagnoli F (2021) Dynamic assessment of urban resilience to natural hazards. Int J Disaster Risk Reduct 62:102328 Feofilovs M, Romagnoli F, Campos JI, Gotangco CK, Josol JC, Jardeleza JMP, Litam JE, Abenojar K (2020) Assessing resilience against floods with a system dynamics approach: a comparative study of two models. Int J Disaster Resil Built Environ 11(5):615–629 Finkelstein LS (1995) What is global governance? Glob Gov 1(3):367–372 Formisano A (2019) Robustness and progressive collapse of new and existing city structures. In: Resilience and sustainability of cities in hazardous environments. GVES, Napoli - New York. isbn 978-88-903183-1-3 Formisano A, Mazzolani FM, Marzo A (2009) Robustness based design of new and existing steel structures. Proceedings Behaviour of Steel Structures in Seismic Areas, STESSA 2009, August 12, 2009, Philadelphia, USA Formisano A, Landolfo R, Mazzolani FM (2015) Robustness assessment approaches for steel framed structures under catastrophic events. Comput Struct 147:216–228 Gallopin G (2006) Linkages between vulnerability, resilience, and adaptive capacity. Glob Environ Chang 16:293–303 Garmestani AS, Allen CR, Gunderson L (2009) Panarchy: discontinuities reveal similarities in the dynamic system. Ecol Soc 14(1):15 Halbwachs M (1950) La mémoire collective, Les Presses universitaires de France, PUF, Paris, France, 1967, XII edition Hassler U, Kohler N (2014) Resilience in the built environment. Build Res Inf 42(2):119–129 Hermans MA, Fox T, Van Asselt MBA (2012) Risk governance. In: Roeser S, Hillerbrand R, Sandin P, Peterson M (eds) Handbook of risk theory, epistemology, decision theory, ethics, and social implications of risk. Springer Science + Business Media, Berlin Hermansson H (2007) The ethics of NIMBY conflicts. Ethical Theory Moral Pract 10(1):23–34. https://doi.org/10.1007/s10677-006-9038-2 Holling CS (1973) Resilience and stability of ecological systems. Annu Rev Ecol Systemat 4(1): 1–2 Hufty M (2011) Investigating policy processes: the governance analytical framework (GAF). In: Wiesmann U, Hurni H et al (eds) Research for sustainable development: foundations, experiences, and perspectives. Geographica Bernensia, Bern, pp 403–424 Indirli M (2007) Overview on risk assessment approaches for natural hazards. Proceedings Workshop of EU Project COST Action C26 Urban Habitat under Catastrophic Events, Prague, Czech Rep, 30–31 March 2007 Indirli M., 2019. An historical flight and some open questions towards a pluralistic but holistic view of resilience. Geographies of Anthropocene, Special Issue: Earthquake risk perception, communication and mitigation strategies across Europe, 2, 2, Il Sileno Edizioni, 195 Indirli M, Di Maio V, Martinelli L (2021) An analysis of Italian resilience during COVID-19 pandemic: first phase from January to June 2020. Geographies of Anthropocene, Monograph volume. https://www.ilsileno.it/edizioni/ebooks/ IPCC (2001) Intergovernmental panel on climate change. Climate change 2001: impacts, adaptation and vulnerability. Summary for policy makers. World Meteorological Organization, Geneva IPCC (2014) Intergovernmental panel on climate change. Fifth assessment report-synthesis report (AR5-SYR): climate change 2014, Annexes, Glossary
14
Building Resilience in Times of New Global Challenges: A Focus on Six. . .
317
IRGC (2005) Risk governance. Towards an integrative approach. IRGC, Geneva. https://www.irgc. org/risk-governance/irgc-risk-governance-framework/ IRGC (2018) International risk governance council. IRGC guidelines for the governance of systemic risks in systems and organizations in the context of transitions. International Risk Governance Center (IRGC), Lausanne. https://irgc.org/risk-governance/systemic-risks/guide lines-governance-systemic-risks-context-transitions/ ISDR/Eur-opa/Council of Europe (2011) ISDR/United Nations International Strategy for Disaster Reduction, Eur-opa Major Hazards Agreement, Council of Europe. Climate Change Adaptation and Disaster Risk Reduction in Europe, a Review of Risk Governance, June 2011. https://www. preventionweb.net/files/submissions/20591_governanceccriskeurope.pdf Jabareen Y (2013) Planning the resilient city: concept and strategies for coping with climate change and environmental risk. Cities 31:220–229 Jakku E, Lynam T (2010) What is adaptive capacity? CSIRO (the Commonwealth Scientific and Industrial Research Organization) report, climate adaptation National Research Flagships, February 2010 Jeudy H-P (2001) La machinerie patrimoniale. Sens & Tonka, Paris, France Keith M, O’Clery N, Parnell S, Revi A (2020) The future of the future city? The new urban sciences and a PEAK urban interdisciplinary disposition. Cities 105:102820 Lamond JE, Bhattacharya-Mis N (2014) Towards an integrated framework for building resilience using flood memory in built environment. Proceedings of Conference Urban Sustainability and Resilience (USAR), November 2014 London, UK Le Blanc A (2010) The conservation of traumatic urban ruins: an ambiguous marker of urban history. L’Espace géographique 39(3):253–266 Le Blanc A (2012) Remembering disasters: the resilience approach. hal.archives-ouvertes.fr: 00719057. https://hal.archives-ouvertes.fr/hal-00719057 Leach M, Stirling A, Scoones I (eds) (2010) Dynamic Sustainabilities: technology, environment, social justice. Routledge Lew AA, Ng PT, Ni CC, Wu TC (2016) Community sustainability and resilience: similarities, differences and indicators. Tourism Geogr 18(1):18–27 Lizarralde G, Chmutina K, Bosher L, Dainty A (2015) Sustainability and resilience in the built environment: the challenges of establishing a turquoise agenda in the UK. Sustain Cities Soc 15: 96–104 Longstaff PH, Yang S-U (2008) Communication management and trust: their role in building resilience to “surprises” such as natural disasters, pandemic flu, and terrorism. Ecol Soc 13(1): 3. [online] http://www.ecologyandsociety.org/vol13/iss1/art3/ Lorenz DF, Dittmer C (2016) Resilience in catastrophes, disasters and emergencies, socio-scientific perspectives. In: Maurer A (ed) New perspectives on resilience in socio-economic spheres. Springer VS Mallick SK (2021) Prediction-Adaptation-Resilience (PAR) approach-A new pathway towards future resilience and sustainable development of urban landscape. Geogr and Sustain 2:127–133 Marcel J-C, Mucchielli L (2010) Maurice Halbwachs’s mémoire collective. In Cultural memory studies. An international and interdisciplinary handbook, published by De Gruyter 2010, Erll A., Nünning A. (eds) Martinelli L, Karbarz M, Siipi H (2013) Science, safety and trust: the case of transgenic food. Croat Med J 54:91–96. https://doi.org/10.3325/cmj.2013.54.91. http://www.cmj.hr/2013/ 54/1/23444254.htm Matthews EC, Sattler M, Friedland CJ (2014) A critical analysis of hazard resilience measures within sustainability assessment frameworks. Environ Impact Assess Rev 49:59–69 Mazzolani FM, Indirli M, Faggiano B, Formisano A, De Gregorio D, Zuccaro G (2009) Catastrophic effects of a vesuvian eruption on the built environment. Proceedings of PROTECT2009 – II international workshop, performance, Protection & Strengthening of structures under extreme loading, Hayama, Japan, August 19–21, 2009
318
M. Indirli et al.
McAslan A (2010) The concept of resilience, understanding its origins, meaning, and utility. Torrens Resilience Institute, Adelaide Mendis S, Mills S, Yantz J (2003) Building community capacity to adapt to climate change in resource-based communities. Report from the University of Saskatchewan and University of Manitoba, prepared for the Prince Albert model Forest, Prince Albert, Canada Ministerial Decree of Public Works (M. D.) (2008) New technical codes for constructions (in Italian). Official Gazette of the Italian Republic published on 2008 January 14th, Rome Ministerial Decree of Public Works (M. D.) (2018) Updating of technical codes for constructions (in Italian). Official Gazette of the Italian Republic published on 2018 January 17th, Rome Museo della Memoria (2021) The memory museum at Santa Margherita Belice, Sicily (Italy). http:// retemusealebelicina.it/museo-della-memoria/ Nelson D, Adger W, Brown K (2007) Adaptation to environmental change: contributions of a resilience framework. Annu Rev Environ Resour 32:395–419 Nemeth DG, Olivier TW (2017) Innovative approaches to individual and community resilience, from theory to practice. Academic Press, eBook ISBN: 9780128039137 Panza GF, Kossobokov V, Laor E, DeVivo B (2021) Earthquakes and sustainable infrastructure, 1st edn. Elsevier, p 672 Preston B, Stafford-Smith M (2009) Framing vulnerability and adaptive capacity assessment. CSIRO (the commonwealth scientific and industrial research organization) working paper no. 2, climate adaptation national research flagships Robin R (2001) Berlin chantiers. Essai sur les passés fragiles. Stock, Paris Rochas C, Kuzņecova T, Romagnoli F (2014) The concept of the system resilience within the infrastructure dimension: application to a Latvian case. J Clean Prod 88:358–368 Roostaie S, Nawari N (2021) The DEMATEL approach for integrating resilience indicators into building sustainability assessment frameworks. Build Environ 207:108113 Roostaie S, Nawari N, Kibert CJ (2019) Sustainability and resilience: a review of definitions, relationships, and their integration into a combined building assessment framework. Build Environ 154:132–144 Rossetto T, Kappos AJ, Kouris LA, Indirli M, Borg RP, Lloyd TO, Sword-Daniels V (2010) Comparison of damage assessment methodologies for different natural hazards. Proceedings of COST action C26 final international conference on urban habitat construction under catastrophic events, Naples, 16–18 September 2010, M. Byfield, G. De Matteis, D. Dubina, B. Faggiano, M. Indirli, A. Mandara, F.M. Mazzolani (chair), E. Mistakidis, J.P. Muzeau, F. Wald (eds) Rugarli P, Amadio C, Peresan A, Fasan M, Vaccari F, Magrin A, Romanelli F And Panza GF (2019) Neo-Deterministic Scenario-Earthquake Accelerograms and Spectra: a NDSHA approach to seismic analysis, Chapter 6 in “Engineering dynamics and vibrations: recent developments”, Jia, J. and Paik, J.K., Eds., pp. 187–241, CRC Press Boca Raton, Florida, USA. isbn 978-1-4987-1926-1. https://doi.org/10.1201/9781315119908-6 Rus K, Kilar V, Koren D (2018) Resilience assessment of complex urban systems to natural disasters: a new literature review. Int J Disaster Risk Reduct 31(1):311–330 SAHC (2016, 13–15 September) Structural analysis of historical constructions. Anamnesis, diagnosis, therapy, controls. Proceedings of SAHC2016, the 10th international conference on structural analysis of historical constructions, Van Balen K. and Verstrynge E. (eds), Leuven, Belgium Sandman PM (1989) Hazard versus outrage in the public perception of risk. In: Covello VT, McCallum DB, Pavlova MT (eds) Effective risk communication. Contemporary issues in risk analysis, vol 4. Springer, Boston, MA. https://doi.org/10.1007/978-1-4613-1569-8_6 Simis MJ, Madden H, Cacciatore MA, Yeo SK (2016) The lure of rationality: why does the deficit model persist in science communication? Public Underst Sci 25(4):400–414 Slovic P, Fischhoff B, Lichtentein S (1985) Characterizing perceived risk. In: Kates RW, Hohenemser C, Kasperson JX (eds) Perilous Progress: managing the hazards of technology. Westview, Boulder, pp 91–125
14
Building Resilience in Times of New Global Challenges: A Focus on Six. . .
319
Svalastog AL, Allgaier J, Martinelli L, Gajovic S (2014) Distortion, confusion, and impasses: could a public dialogue within knowledge landscapes contribute to better communication and understanding of innovative knowledge? Croat Med J 55:54–60. http://www.cmj.hr/2014/55/1/24 577828.htm Thompson M, Beck M (2014) Coping with change: urban resilience, sustainability, adaptability and path dependence. In: Future of cities: working paper. Foresight, Government Office for Science, London, UK UNDP (2010) United Nations development Programme, bureau for crisis prevention and recovery. Disaster risk reduction, governance and mainstreaming, October 2010. https://www. preventionweb.net/files/17429_4disasterriskreductiongovernance1.pdf UNDP (2013) United Nations development Programme, empowered lives, resilient nations. Issue brief: disaster risk governance, crisis prevention and recovery, January 2013. https://www1. undp.org/content/dam/undp/library/crisis%20prevention/disaster/issue_brief_disaster_risk_ reduction_governance_11012013.pdf UNISDR (2009) United Nations Office for disaster risk reduction. Terminology on Disaster Risk Reduction (DRR), published by the United Nations international strategy for disaster reduction, UNISDR, Geneva, Switzerland, 2009. https://www.undrr.org/publication/2009-unisdr-terminol ogy-disaster-risk-reduction UN-ISDR (2005) United Nations-International Strategy for Disaster Reduction. Building the resilience of nations and communities to disasters world conference on disaster reduction, 18–22 January 2005, Kobe, Hyogo, Japan; Geneva: United Nations International Strategy for Disaster Reduction. https://www.undrr.org/publication/hyogo-framework-action-2005-2015building-resilience-nations-and-communities-disasters United Nations (1987) Report of the world commission on environment and development our common future. In UN. https://doi.org/10.9774/gleaf.978-1-907643-44-6_12 United Nations (2015) United Nations general assembly, New York. Transforming our world: the 2030 agenda for sustainable development A/RES/70/1 Vale JV, Campanella TJ (2005) In: Vale LJ, Campanella TJ (eds) The Resilient City. How modern cities recover from disaster. Oxford University Press, New York, USA Vamvatsikos D, Kouris LA, Panagopoulos G, Kappos AJ, Rossetto T, Lloyd TO, Stathopoulos T (2010) Structural vulnerability assessment under natural hazards: a review. Proceedings of COST action C26 final international conference on urban habitat construction under catastrophic events, Naples, 16–18 September 2010. M. Byfield, G. De Matteis, D. Dubina, B. Faggiano, M. Indirli, A. Mandara, F.M. Mazzolani (chair), E. Mistakidis, J.P. Muzeau, F. Wald (eds) Van Asselt MBA, Renn O (2010) Risk governance. J Risk Res 14(4):431–449 Visvizi A, Perez del Hoyo R (2021) Chapter 1 - sustainable development goals (SDGs) in the smart city: a tool or an approach? (an introduction). In: Visvizi A, Pérez del Hoyo R (eds) Smart cities and the un SDGs. Elsevier Walker B, Holling CS, Carpenter S, Kinzig A (2004) Resilience, adaptability and transformability in social-ecological systems. Ecol Soc 9(2):5 Wall E, Marzall K (2006) Adaptive capacity for climate change in Canadian rural communities. Local Environ 11(4):373–397 Wilson GA (2015) Community resilience and social memory. Environ Values 24(2):27–257 Yohe G, Tol RSJ (2002) Indicators for social and economic coping capacity-moving toward a working definition of adaptive capacity. Glob Environ Chang 12:25–40 Zanotti L, Ma Z, Johnson JL, Johnson DR, Yu DJ, Burnham M, Carothers C (2020) Sustainability, resilience, adaptation, and transformation: tensions and plural approaches. Ecol Soc 25(3):4 Zuccaro G, Cacace F, Nardone S (2010) Human and structural damage consequent to a sub-Plinian like eruption at Mount Vesuvius. Proceedings of COST action C26 final international conference on urban habitat construction under catastrophic events, Naples, 16–18 September 2010, M. Byfield, G. De Matteis, D. Dubina, B. Faggiano, M. Indirli, A. Mandara, F.M. Mazzolani (chair), E. Mistakidis, J.P. Muzeau, F. Wald (eds)
Chapter 15
Community Resilience Through Recovery: Capacity Building and Sustainability Zhila Pooyan and Akihiko Hokugo
Abstract This proposal is about community resilience through recovery focusing on capacity building to improve local-level preparedness based on Great East Japan Earthquake and Tsunami (GEJET) experiences. The topic is based on this idea that a sound recovery plan should enhance the local level’s ability and capacity in confronting geohazards’ damages and consequences. This brings about more efficient use of time and sources; thereupon any practice and activity in post-event could improve the response capacity and adaptability of affected communities. According to Sendai Framework for Disaster Risk Reduction (2015–2030), to recover from the effects of a hazard in a timely and efficient manner is an indication of being resilient. The objectives of this proposal are, first, to find out how the recovery process could stimulate affected communities to move toward disaster risk reduction and preparedness. Recovery plan could facilitate the local-level participation and support bottom-up approaches. Such approaches strengthen self-reliance and efficiency at the local level. Second is to find out the opportunities and challenges of resilient-based recovery for affected communities. Although resilient-based recovery brings opportunities like capacity building and damage reduction for affected communities, some challenges might arise due to pre-event trends or national recovery policies. The proposal is based on undertaken studies in three affected areas including Ogatsu district in Ishinomaki city in Miyagi Prefecture, Otsuchi district in Otsuchi town in Iwate Prefecture, and Unosumai district in Kamaishi city in Iwate Prefecture. All studied areas have undergone much damage due to GEJET. The method of this proposal includes four sections. First is discussing community-based recovery, how pre-event trends affect recovery, what upcoming trends might appear during recovery, and how communities
Z. Pooyan (✉) Independent Researcher, Tehran, Iran A. Hokugo Graduate School of Engineering & Research Center for Urban Safety and Security, Kobe University, Kobe, Japan © The Author(s), under exclusive license to Springer Nature Switzerland AG 2023 S. D’Amico, F. De Pascale (eds.), Geohazards and Disaster Risk Reduction, Advances in Natural and Technological Hazards Research 51, https://doi.org/10.1007/978-3-031-24541-1_15
321
322
Z. Pooyan and A. Hokugo
could manage toward resilience. This section’s information is based on current literature reviews on community-based recovery. Second is studying community’s recovery in case studies to find out what actions have been taken by affected communities to improve their response capacity and also the measures that have been implemented by national and regional governments that assist local communities in moving toward resilient recovery. The activities of local communities include volunteers’ activities, considerations for rescue and relief by local level, and supporting affected people in post-event. The measures taken by the government include damage reduction through preparations for evacuations, and seawall construction after GEJET. This section’s information is based on field visits and studies and interviews with community leaders and also with regional authorities. Third is discussing the opportunities and challenges brought to communities through recovery. Both opportunities and challenges are explained, and their interrelations and interactions are discussed. This section’s information is based on previous sections’ information. Fourth, conclusions on community recovery are made. In this section important matters such as how resilience contrasts with vulnerability, how resilience considerations should be included in recovery policies, and how GEJET lessons could be applicable in other experiences are presented and explained. Keywords Community resilience · Recovery · Capacity building · Sustainability · Great East Japan Earthquake and Tsunami
15.1
Introduction
The Great East Japan Earthquake and Tsunami (GEJET) that occurred on March 11, 2011, in Tohoku region (north eastern of Japan) was the most powerful earthquake in Japan and the fourth most powerful earthquake in the world since 1900 (https://en.wikipedia.org/wiki/2011_Tohoku_earthquake_and_tsunami n.d.). The Iwate, Miyagi, and Fukushima prefectures were the worst affected by this event. The multi-hazard characteristic of the GEJET made it one of the scare cases in the world as it has caused much damages including human loss, structural and infrastructural damages, and environmental devastation. The GEJET and other similar disasters that have been occurring around the world indicate the importance of damage reduction, capacity building, and preparedness at national and local levels to create resilient communities. If local level takes required steps toward being prepared, then post-event response could be done much effectively; thereupon, sustainable results could be achieved. While during recovery, damage reduction efforts are taken by national level to improve resistance and persistence toward potential hazards, local level could raise its response capacity to hazards’ impacts and continue its functions despite being affected. This indicates that communities could strengthen their adaptability to hazards’ consequences through recovery; thereupon, they can resume their activities in post-event in a proper manner. Therefore, it is of high importance to recognize the opportunities
15
Community Resilience Through Recovery: Capacity Building and Sustainability
323
and challenges that affected communities confront during recovery to distinguish the appropriate procedure that should be taken in recovery to achieve resilience. This chapter examines how the GEJET recovery process has stimulated affected communities to move toward disaster risk reduction and preparedness. Recovery plans can facilitate local-level participation and support bottom-up approaches. Such approaches strengthen self-reliance and efficiency at the local level. While resilientbased recovery brings opportunities like capacity building and damage reduction, some challenges have been aroused due to pre-event trends or national recovery policies. So, it is important to identify the opportunities and challenges that have appeared during recovery in affected communities. The studied areas are in Miyagi Prefecture, Ishinomaki city, and its related districts and also in Iwate Prefecture, Kamaishi city, and its related towns and districts. The chapter is organized as follows. First, the relationship between communitybased recovery and resilience and how pre-event and post-event trends in recovery could affect communities in moving toward resilience are explained to find out what upcoming trends might appear during recovery and how communities could manage themselves. Then, community recovery experiences in GEJET, influential factors in GEJET recovery, recovery operations and activities including damage reduction measures and community activities in affected areas, and recovery trends are explained. Next, opportunities and challenges for affected communities are presented; conclusions and recommendations are also presented.
15.2
Relationship Between Community-Based Recovery and Resilience
In this section the relationship between community-based recovery and achieving resilience is discussed. For this purpose, it is required to know how communitybased recovery could result in resilience or in other words how achieving resilience requires local-level participation. Disaster recovery planning is the differential process of restoring, rebuilding, and reshaping the physical, social, economic, and natural environment through pre-event planning and post-event actions (Planning for Post-Disaster Recovery: Key Concepts and Issues that Should Inform Practice 2016). So, the recovery process is influenced by pre-event and post-event trends, and consequently affected communities have to deal with preexisted or emerged issues during recovery. Each of the mentioned trends could smooth or create obstacles in the recovery path of communities. According to United Nations Disaster Risk Reduction, recovery is the restoring or improving of livelihoods and health, as well as economic, physical, social, cultural, and environmental assets, systems, and activities of a disaster-affected community or society, aligning with the principles of sustainable development and “build back better,” to avoid or reduce future disaster risk (United Nations Office for Disaster Risk Reduction n.d.). Build back better is the use of the recovery, rehabilitation, and
324
Z. Pooyan and A. Hokugo
reconstruction phases after a disaster to increase the resilience of nations and communities through integrating disaster risk reduction measures into the restoration of physical infrastructure and societal systems and into the revitalization of livelihoods, economies, and the environment (United Nations Office for Disaster Risk Reduction n.d.). Therefore, resilience is the main topic in disaster risk reduction, and the main objective of recovery is creating resilient communities. Based on “Sendai Framework for Disaster Risk Reduction 2015-2030” (SFDRR), resilience has been defined “The ability of a system, community or society exposed to hazards to resist, absorb, accommodate to and recover from the effects of a hazard in a timely and efficient manner, including through the preservation and restoration of its essential basic structures and functions” (Sendai Framework for Disaster Risk Reduction (2015–2030) 2015). In Priority 4 of the SFDRR, recovery is an opportunity to build more resilient societies, and hence strengthening disaster preparedness and response, promoting public awareness through local communities, and the establishment of area-based support systems have been stated (Sendai Framework for Disaster Risk Reduction (2015–2030) 2015). Resilience is the capacity to absorb severe shock and return to a desired state following a disaster. It involves technical, organizational, social, and economic dimensions, and it is promoted by governments, individuals, organizations, and business actions (Schwab 2014). Affected local communities’ role in recovery is vital, and community participation is a cornerstone of the recovery process since a principal resource available for recovery is the affected people themselves and their local knowledge and expertise. Communities’ participation ensures that they regain access to viable sources of livelihood, economic infrastructure, and social services that are comparable to or better than those available prior to the disaster. Incorporating local knowledge and expertise into recovery and ensuring community ownership of it ensure the longterm success of the recovery and lead to sustainable solutions which result in resilience (Disaster Recovery Framework Guide, Revised version: Global Facility for Disaster Reduction and Recovery (GFDRR) 2020). Resilience helps a community to respond to and recover effectively from specific events; it preserves resources for future generations, and it also ensures that the present resources and opportunities that exist for current generations do not lose through poor preparation for adverse events (Schwab 2014). Resilient-based recovery assists communities in withstanding an extreme event without suffering devastating losses and without requiring a great deal of outside assistance. Consequently, the affected communities survive and continue to function, and instead of demanding outside assistance, they proactively protect themselves against hazards, build self-sufficiency, and become more sustainable. A resilience community not only establishes well-designed engineering systems but also well-managed ecosystems and well-informed and active citizenry. Such extensive scope indicates that resilient recovery should be the continuum of pre-event preparedness, emergency response, short-term recovery, and long-term recovery to include various dimensions thoroughly (Disaster Recovery Framework Guide, Revised version: Global Facility for Disaster Reduction and Recovery (GFDRR) 2020).
15
Community Resilience Through Recovery: Capacity Building and Sustainability
325
Resilient recovery could help to ensure not only a recovery plan better suited to the needs of the community but also assures that local communities have access to information to identify their risks and vulnerabilities and can express their concerns to authorities; thus, it has bilateral benefits for national and local level: • Government and recovery authorities understand the status of the affected population. • Disaster-affected people learn what to do to be safe, what types of recovery programs exist, and where to seek assistance. • Communities are prepared for future disasters to protect people and assets. • Awareness on risk reduction measures such as constructing in low-risk locations using disaster-resilient construction practices is raised. • People are informed about grievance redressal mechanisms so they know how to file their concerns over the recovery approach and work. • Information about the funding sources to the affected communities is conveyed. • Feedback from beneficiaries and disaster-affected communities concerning complaints, suggestions, and gaps in coverage are facilitated (Engaging Local Actors in Disaster Recovery Framework: Global Facility for Disaster Reduction and Recovery (GFDRR) 2019).
15.3
Influential Factors in Community Recovery and Subsequent Trends
Community recovery is influenced by different factors arising from pre-event and post-event conditions. The conditions lead to resilient or non-resilient recovery, and consequently different trends emerge (Fig. 15.1). Pre-event and post-event factors can be considered as opportunities or challenges which means that they can support or impede resilient recovery simultaneously. Each group of factors are interdependent as they influence each other; also both groups are interrelated which means any change in pre-event situation affects post-event and vice versa. Pre-event period is the appropriate time during which communities can think about their foreseeable recovery needs following a disaster and plan in advance to improve their health, safety, and welfare necessities and also take appropriate steps to mitigate potential damages before a disaster happens through identifying capacities and weaknesses. Although there is no doubt that some decisions and actions, and some types of planning, must inevitably await the outcome of a disaster in order to focus appropriately on the problem created, pre-event recovery encompasses a range of policies and actions that can be taken in advance to support national and local levels to build back stronger, faster, and more equitably when disasters strike. The influential factors in community recovery in pre-event include: • Economic situation • Social development
326
Z. Pooyan and A. Hokugo
Fig. 15.1 Influential factors in community recovery and their outcomes
• Communities’ power • Vulnerable population • Cultural and natural environment attractions The mentioned factors are interdependent, and any change in each of them affects others too. Economic fluctuations influence social development and living conditions. Wherever social and economic situations are better, it is expected that communities have more opportunities in undertaking preparedness activities such as holding training and drills through simulating actual conditions and provide examples of good practice and lessons learned. This is an opportunity to develop policies on coordination mechanisms and support the establishment of similar recovery planning frameworks at the community level (Building Back Better 2018). Besides, communities can support vulnerable populations in ordinary time and help them in times of disaster. Cultural and natural environment attractions influence the economic and social situation, and potential disaster damages to them could be
15
Community Resilience Through Recovery: Capacity Building and Sustainability
327
unrecoverable. Each of these factors can strengthen or diminish communities’ ability in moving toward resilient or non-resilient recovery. Communities can save lives, prevent injuries, and protect property from potential damage as a result of smart decisions made through deliberative decision-making in pre-event (Schwab 2014). The post-disaster period can be an important time to promote damage reduction through rebuilding or relocation more sustainably with higher standards of disaster resilience and to achieve favorable results. Also, it provides the central means for public deliberation to help generate new ideas, elaborate and refine recovery project proposals, and assess alternative recovery strategies (Schwab 2014). The influential factors in community recovery in post-event include: • • • • •
Level of damages Population decline Immigration Investment opportunities Jobs and employment
Levels of damages especially in case of major or catastrophic disasters can pose specific challenges in recovery as they cause simultaneous trauma for affected communities and also unexpected situations for national level. Consequently, taking time to plan during these high-pressure and time-compressed conditions can be very difficult. Also, it could impede community participation as they could not put their input in post-event recovery sufficiently. High volumes of damages especially to structural and infrastructures can increase human loss and even make living and working more difficult, upon which population can decrease due to disruptions in living and working conditions. Also, immigration in post-event due to poor living and working conditions leads to population decline as younger people might prefer to move to other locations looking for jobs and better living conditions. Population decline might prevent resuming some activities in post-event that result in job decline and intensifies immigration. Investment opportunities in post-event can attract financial and other resources to create jobs and improve the general conditions, and also, it contributes to long-term recovery. But such opportunities are influenced by damage levels as higher damages might reduce investment opportunities in hazard-prone locations. If jobs and employment can resume in post-event, then livelihood recovery, which is very influential in preventing population decline and accelerating recovery pace is achieved. However, resuming jobs and activities depends on the level of damages and living conditions in post-event. As it was mentioned, pre-event and post-event factors are interrelated as pre-event conditions affect post-event situations and post-event modifications change the potential conditions in future disasters. Both groups are determinant in adopting recovery procedures and the relevant trends that emerge. Resilient-based and nonresilient-based recovery are the outcomes of pre- and post-event trends and their consequences so that affected communities become self-reliant in withstanding potential disasters or return to pre-event conditions; thereupon, vulnerability reshapes. Each recovery procedure has characteristics through which their
328
Z. Pooyan and A. Hokugo
subsequent trends appear. This indicates that the recovery characteristics specify the outcome of recovery the process; therefore, the recovery process is the reflection of pre- and post-event conditions. Resilient-based recovery originates in pre-event and focuses on risk reduction and preparedness, so it is rather operative and considers longer-term recovery along with short-term recovery. The characteristics of resilient-based recovery are: • • • • • •
Proactive Indigenous based Participatory Innovative Comprehensive Help of supporters, government officers, and specialists
Resilient-based recovery considers top-down and bottom-up approaches simultaneously that leads to strengthening self-reliance and perseverance. The subsequent trends in pre-event proceed with identifying hazards and potential disasters, planning for recovery, disaster preparedness, and empowering communities and in post-event proceed with evaluating damages, developing damage reduction policies, reviving economy, and improving social development. Resilient-based recovery outcomes result in: • Damage reduction: through considering risk reduction and disaster preparedness to create safer and more resilient environments. • Capacity building: through utilizing indigenous sources, supporting community participation, and developing innovative methods. • Sustainability: through considering longer-term recovery requirements and being applicable in similar situations. Non-resilient recovery concentrates on the post-event phase and encompasses short-term recovery and rather continues pre-event patterns. The characteristics of non-resilient-based recovery are: • • • • • •
Reactive Outside based Unilateral Uncreative Incompatible No support and innovation
Non-resilient-based recovery is based on top-down approach and consequently does not consider long-term recovery and rather concentrates on short-term recovery. The subsequent trends in pre-event proceed with short-term recovery and disregarding preparedness, follow top-down approaches thereupon, and attenuate communities’ power and in post-event proceed with resuming pre-event patterns, due to no preparedness encounters with time and financial constraints, and risk reduction could not be achieved. Non-resilient-based recovery outcomes result in:
15
Community Resilience Through Recovery: Capacity Building and Sustainability
329
• Reshaping vulnerability: through disregarding damage reduction in advance and focusing on outside sources instead of indigenous ones. • Centralization: through following top-down approaches and no participation by local level; thereupon, repetitive patterns emerge that are usually incompatible. • Unsustainability: through considering only short-term recovery and neglecting longer-term consequences of post-event recovery; also, no support and initiative. It should be pointed out that in different recovery experiences, a combination of both types of recovery might exist as the type and characteristics of recovery bond to administrative, political, economic, and social conditions, but recovery results and consequences indicate its direction and trends.
15.4 15.4.1
Communities’ Recovery Experiences in GEJET Influential Factors in GEJET Recovery
In this section, influential factors in recovery of GEJET, recovery operations and activities including damage reduction measures, and communities’ activities are explained; thereupon, recovery trends are extracted. For this purpose, first studied areas are introduced, then disaster damages and consequences are presented, and influential factors are specified. Case studies include in Miyagi Prefecture in Ogatsu district of Ishinomaki city, in Iwate Prefecture in Otsuchi district of Otsuchi town, and Unosumai district of Kamaishi city, Yamada town, and Miyako city. Disaster-affected areas have beautiful scenery and landscape with rich nature; their main economic activities include agriculture, forestry, and fisheries. Before GEJET, Miyagi Prefecture was producer of rice and livestock, and Iwate Prefecture was producer of Japan’s beef and broiler chickens. Ishinomaki city, Otsuchi district, Yamada town, and Miyako city economies are based on commercial fishing, agriculture, and food processing, and Ogatsu district is the producer of Ogatsu stone. The population of affected areas had been decreasing before GEJET which led to an aging population. It should be pointed out that the affected communities have been struggling with economic recession before GEJET. GEJET caused extensive damages in affected areas; the earthquake triggered powerful tsunami waves. The deaths were 19,747 (5145 in Iwate Prefecture and 10,567 in Miyagi Prefecture), and 2556 people are missed (1111 people in Iwate Prefecture and 1217 people in Miyagi Prefecture) (Status of Reconstruction and Reconstruction Efforts in GEJET 2022). Ishinomaki city, Kamaishi city, Otsuchi town, and Yamada town were among the places with most deaths (https://en. wikipedia.org/wiki/2011_Tohoku_earthquake_and_tsunami n.d.); in Miyako city tsunami waves may have reached heights of up to 40.5 meters (https://en. wikipedia.org/wiki/2011_Tohoku_earthquake_and_tsunami n.d.). In Ishinomaki city about 46% of the city was inundated by the tsunami (https://en.wikipedia.org/ wiki/Ishinomaki n.d.); in Ogatsu district, buildings located in the central part
330
Z. Pooyan and A. Hokugo
including town office, elementary and junior high schools, fishery union buildings, stores, and many others were wiped out by the tsunami (Cover Story: Lessons from Disasters 2013). In Kamaishi city, Otsuchi town, and Miyako city, designated evacuation sites and schools were inundated, tsunami obliterated harbors and low-lying areas, and consequently many areas were inundated. Also, the tsunami completely wiped out sea farm industries and most fishing ships fleeted (https://en. wikipedia.org/wiki/Kamaishi,_Iwate n.d.; https://en.wikipedia.org/wiki/Otsuchi, _Iwate n.d.; https://en.wikipedia.org/wiki/Miyako,_Iwate n.d.). Due to GEJET high level of damages especially to the commercial section, population immigrated. Salarymen and shopkeepers who lost their business moved to other areas; damages to harbors and ocean fisheries made crew members change their occupations and seafarers switched their jobs, but most of them moved out seeking other places to work; such a trend has declined fishery of affected areas. Population decline has been a serious threat for the sustainability of affected towns and districts since the social cores of such locations disappear. Investment opportunities have relied mainly on attracting large central enterprises based on economic growth myths, which have no support for local small and medium enterprises. There are various influential factors in community recovery as economic recession of affected communities, preexisted job shortages and immigrations, weak structures and vulnerable communities, and majority elder population in pre-event; also unexpected scale of disaster, extensive damages, limited sources of local level, deficiencies in preparedness, and livelihood problems in post-event are the influential factors in post-event.
15.5 15.5.1
Recovery Operations and Activities Damage Reduction Measures
Considering the tremendous damages by GEJET, pondering about evacuation information in advance such as routes and holding drills is necessary, and establishing guidance systems and disseminating appropriate information and seawall construction have been considered.
15.5.1.1
Miyagi Prefecture
Evacuation routes are being developed on steep slopes in affected areas (Fig. 15.2) since during the disaster, people had to use ladders to set up against the stonewall at the back of their houses (Interview with Michiyo Sato 2017). Tsunami evacuation towers have been constructed in different locations in order to be usable in potential future hazards. Such places have user guidance and need to be introduced and instructed to local residents (Pooyan and Hokugo 2017) (Fig. 15.3).
15
Community Resilience Through Recovery: Capacity Building and Sustainability
331
Fig. 15.2 Evacuation routes in Miyagi Prefecture
Fig. 15.3 Evacuation tower in Miyagi Prefecture
Information on evacuation such as communication methods on disaster-related information has been developed to be prepared for disaster evacuation before
332
Z. Pooyan and A. Hokugo
disaster strikes. Disaster prevention administrative radio receivers were installed in temporary and public housings1. After the GEJET, house receivers have been installed in temporary housings that are useful for communicating information on evacuation (Interview with Hiroshi Miura 2017). In areas where tsunami did not occur, evacuation manuals and information about evacuation routes have been distributed through disaster prevention maps (Interview with Akinari Abe 2017). Evacuation training is conducted in tsunami-affected areas as, in some areas, they are held several times per year. Evacuation drills are organized in temporary shopping centers (located in disaster risk areas) once a year, and shopkeepers train on how to evacuate by following escape routes through slopes (Interview with Michiyo Sato 2017). Seawall construction is required to proceed with the recovery plan of affected areas; in some affected villages, community leaders had to persuade residents with a seawall plan (Interview with Hiroshi Miura 2017). Also, there have been oppositions with such constructions as some residents think that such constructions do not match their towns and villages and reduce the natural beauty and scenery of their environment (Interview with Hiroshi Tokumizu 2017).
15.5.1.2
Iwate Prefecture
Disaster evacuation drills are conducted by municipalities of affected areas. The department of Disaster Prevention Awareness of Iwate Prefecture has tried to improve the method of disaster evacuation drills as a major goal and encouraged more local residents to participate in such drills, also conducting drills between multiple municipalities instead of holding in only one domain that means the drill holds beyond the border. So, the basic law has been amended and this idea has been included. The prefectural government sponsors the drill and has asked each municipality to cooperate with them, so it coordinates the government, community, and individuals’ participation. In this way, public aid, community aid, and individual aid are considered altogether in advance to get prepared in pre-event. The prefecture government has been holding drills beyond the border, for example, in 2012 such drill was conducted in Kamaishi city, in 2013 in Kuji city, and in 2017 in Morioka city. Another idea in disaster evacuation drills is foreign residents’ participation, and accordingly, a new goal has emerged, and developing new methods has been considered to improve evacuation methods (Interview with Iwate Prefecture Government 2018). Constructing seawalls and embankments to regulate water levels and prevent flooding in coastlines is another measure that has been implemented in affected areas (Fig. 15.4). Before GEJET the approved altitude of embankment height was six
Public housing is a type of apartment provided by the government for people who financially cannot afford housing by themselves. In Japan, public housing is provided after disasters such as the Southern Hyogo earthquake (1995) or GEJET (2011). Authors.
1
15
Community Resilience Through Recovery: Capacity Building and Sustainability
333
Fig. 15.4 Seawall construction in Iwate Prefecture
meters, and after that it has been elevated to 9.7 meters by landfilling project (Interview with Koe Abe 2018). If the same scale of tsunami as GEJET happens, the tsunami water is not expected to come over. Theoretically according to the recovery plan, the three meters higher landfilling is supposed to be safe, and the tsunami water will not reach according to new levee height. Based on recovery plan, the area between levee and houses will be waterproof. So, in such areas housing reconstruction is prohibited, and only commercial and industrial facilities are allowed to be constructed (Interview with Koe Abe 2018). In some other areas, embankments have not been built while such a situation might cause damages in case of potential disasters as they suffered from tsunami damages in GEJET. Relocations and preventing housing construction in highly dangerous areas are another damage reduction measure, but on the other hand, relocation to areas far from coastlines causes difficulties for fishermen. Also, by moving to other areas, the existent communities will change, and the previous patterns, relationships, and social ties change. This indicates that the previous solidarity and cooperation may not exist anymore. This matter is very important where many affected people lost their jobs and could not resume their job or find new ones in their own places, so they immigrated. Besides, in new communities, residents may not have the same
334
Z. Pooyan and A. Hokugo
locational dependency attitude which is important in development of newly shaped communities ((Interview with Akiko Iwasaki 2016) and (Interview with Community leaders in Kamaishi city 2016)).
15.5.2
Community Activities in Affected Areas
Local communities had to take steps in improving local capacities, self-help, disaster drills, or any other activity to integrate disaster awareness in daily life; also, experts, volunteers, and academicians supported local communities in rescue and relief, advising communities, and business reviving.
15.5.2.1
Miyagi Prefecture
The remaining population in affected areas after the disaster were few elderly people who could not participate actively, and consequently such communities did not prepare community-based recovery plans in order to discuss their ideas on recovery with authorities. In such cases the recovery plan rather focused on structural reconstruction than considering social aspects and urban planning issues (Interview with Hiroshi Tokumizu 2017). So, in such cases communities could not review the reconstruction plan, and authorities did not take the opinions of residents into consideration. No designated shelter has been considered before the event that caused difficulties for communities after the event. In Ogatsu district of Ishinomaki city, the development council was divided between two problems of the rainfall problem and conflicts (promotion of high hill transfer and promotion of local rebuilding). But later the Ogatsu General Branch developed the town development council and made cooperation with the people (Interview with Hiroshi Tokumizu 2017). But, the reconstruction plan from the Ogatsu General Branch was only about the relocation of a hill, so people decided to reconstruct by themselves. The local residents of six districts of the Ogatsu General Branch gathered, and they tried to prepare a reconstruction plan by themselves (Interview with Akinari Abe 2017). Also, in Ogatsu district the number of temporary houses has been limited; thereupon, the distribution has been done through lottery. So, those who could not obtain temporary housing immigrated to other areas which led to further decline of the community residents (Interview with Akinari Abe 2017). Community centers have been established in affected areas to revive marginal places that suffered much damage during GEJET. Namiita Lab and Onagawa Station are examples of these centers in Miyagi Prefecture. Namiita Lab Community Center is the project based in the village by the Pacific Ocean and has started its activity since 2013 (Good Design Award, Community Center (Namiita Lab), http://www.gmark.org/award n.d.). This village is composed only of a population aged over 60 years, and only ten dwellings remained after the GEJET. Before the earthquake,
15
Community Resilience Through Recovery: Capacity Building and Sustainability
335
Fig. 15.5 Namiita Lab, an established community center in Miyagi Prefecture
it was a beautiful area, but residents that included 17 households were damaged by the GEJET. The Namiita District Association formed the “Namiita Lab” with Tohoku University students and volunteers from Tokyo. It is a district that is struggling to increase the number of people who interact with the outside world (http://sakuranamiki.jpn.org/archives/11695.html n.d.). So, it is the project of revisiting otherwise disappearing knowledge and attraction of the marginal village, along with villagers and creative individuals, connecting the local and outsiders. It has been established to invite the guests from outside (Good Design Award, Community Center (Namiita Lab), http://www.g-mark.org/award n.d.). The Namiita Lab, constructed using local materials and applying the principles of universal design, won a Good Design Award in 2016. Equipped with spacious meeting rooms, restrooms, a shower and bath, a fully furnished kitchen, and bedrooms, the facility can be reserved for events or as lodging for hikers. The center also runs workshops at which local artisans teach participants how to make traditional Ogatsu slate crafts. Slate is used to make the elegant hand-carved inkstones for which the area is known—which are sold at the center—as well as roofing tiles and even tableware (Guide Book, Michinoku Coastal Trail 2020) (Fig. 15.5). Onagawa Station is a railway station on the Ishinomaki Line in Onagawa, Miyagi Prefecture, operated by East Japan Railway Company (JR East). The station building was destroyed by the GEJET in March 11, 2011 and in March 2015, the reconstructed Onagawa Station reopened. The new station building features an integrated community center and public bathing facility on the upper floors. This new station building is relocated and built approximately 150m inland from the old. The 3-story station building consists of the station, retail shops, and waiting areas on
336
Z. Pooyan and A. Hokugo
Fig. 15.6 Onagawa Station in Miyagi Prefecture
the first floor, a municipal hot spring facility on the second floor, and a viewing deck on the third floor. The design of the roof is based on an image of a bird with its wings spread soaring toward a bright future (Arch daily n.d.) (Fig. 15.6). After the GEJET, different groups of supporters, experts, academicians, government officers and volunteers from affected areas and also from outside helped affected people with rescue, evacuation, relief, setting up emergency shelters and later on, in different tasks during recovery. Academicians from different universities of Japan went to affected areas in Miyagi Prefecture to investigate about GEJET effects and also advised local communities about recovery (Interview with Junichiro Aoki and Takeichi Itou in Nammita Lab 2017); for example, they helped local communities in starting up new businesses (Interview with Hiroshi Tokumizu 2017). Volunteer students were dispatched to damaged areas and helped local communities in daily life tasks in temporary houses and also holding cultural festivals (Interview with Michiyo Sato 2017).
15.5.2.2
Iwate Prefecture
Local communities had to protect themselves and, in some areas, people fled to mountains. Considering the weather conditions, they had to warm themselves, so people made some cottages, and, in some places, the electricity was available, and even people set up field restrooms. Although the situation was very difficult, people tried to help each other, and community leaders tried to provide food and distribute it while they themselves were injured and tired (Interview with Akiko Iwasaki 2016).
15
Community Resilience Through Recovery: Capacity Building and Sustainability
337
Budget restrictions have been an issue for affected communities; for example, dredging rivers is very important, but the budget has not been enough; many financial sources are necessary ((Interview with Akiko Iwasaki 2016) and (Interview with Community leaders in Kamaishi city 2016)). In addition, in some damaged areas, the residents were rather elderly people and needed more care and attention; such matter makes the recovery pace slower and takes longer time ((Interview with Akiko Iwasaki 2016) and (Interview with Community leaders in Kamaishi city 2016)). Elder population could not actively participate in recovery and even reconstructing their housing due to their health, and since their children immigrated to other places to work and live, even if they reconstruct their houses, it is not clear if their children would come back and live, so in that case there is no need to reconstruct because they can obtain public housing (Interview with Bureau of Coastal Broader Area Promotion 2018). Living in temporary houses for a long time is difficult considering matters such as warming or cooling; also these houses are next to each other and noise could be transferred easily (Interview with Akiko Iwasaki 2016). Since damages were various, recovery measures need to be in accordance with that, so affected communities had to choose different procedures in their recovery process. Some communities held monthly meetings and discussed about recovery plans, and the community secretariat delivered the community-formulated plan to related municipalities ((Interview with Akiko Iwasaki 2016) and (Interview with Yuji Sasaki 2016)). But some communities could not prepare a community-based recovery plan because the community center had been destroyed, so they had to prepare some place as a community center and set up the temporary community center and then hold meetings and exchange information (Interview with Akiko Iwasaki 2016). The influence of community bonds in normal times, for example, in local festivals or other activities, developed good relations; thereupon, local communities helped the management of emergency shelters even if they were not affected; for example, restaurant owners from undamaged areas came to help affected people with providing food. As a result, such communities can do well in case of future disasters for rescue and relief or managing emergency shelters (Interview with Kamaishi Local Autonomous Association Members 2018). Local communities asked television broadcasting companies to announce helping affected communities; thereupon, relief items were sent to affected areas, and later different programs have been produced and broadcasted about damaged areas, and due to such support, the communities could continue working and investigating reconstruction plan (Interview with Akiko Iwasaki 2016). Establishing public facilities after GEJET, as “Fureai” 2 centers where different age groups like children, adolescents, and also elderly people have access to various
2
Centers wherein people, especially elderly people gather to know each other and communicate and make friends. In Japan, different activities for elderly people are held in such centers; thereupon, they do not feel lonely. Authors.
338
Z. Pooyan and A. Hokugo
Fig. 15.7 Yamada town Fureai “Happy” Center in Iwate Prefecture
services such as library, sport activities, participating in community activities, and being the part of community planning and cooperation, is another example of community activities that can also raise public awareness and preparedness (Interview with Koe Abe 2018) (Fig. 15.7). Japan Ground Self Defense Force3 (JGSDF) did rescue people, but in some areas due to tsunami danger, people had to go to mountainous areas to escape from the tsunami and they had to stay in such places up to 5 days (Interview with Akiko Iwasaki 2016). Meanwhile, some supporters from other regions went and helped in rescue and relief. Volunteers helped children and elderly people to move on with their daily life and activities (Interview with Akiko Iwasaki 2016). In Japan, there are several types of certified experts for taking care of elderly people or small children or as a medical team. In Iwate Prefecture a new initiative has been started, and a group of certified experts was formed, and they were dispatched to disaster-affected areas. This team sometimes is sent to other prefectures to help in times of disaster. The idea of this initiative has been developed by Iwate Prefecture University academicians, and they cooperated in the developing process with the prefectural government (Interview with Iwate Prefecture Government 2018). The volunteers’ coordination and dispatching for disaster management are done by social welfare associations that are included in municipalities; these associations are in charge of social welfare and civil society. In Miyako city after GEJET, there were two types of volunteers’ operations; one of them was the establishment of a volunteer center and dispatching registered volunteers to affected areas and taking care of local people, and second operation was for disaster victims who had started to live in temporary houses. The second operation started 6 months after the tsunami (from September 2011), and major tasks were distribution of donated items from various parts of Japan and also participating in consultancy programs. The second operation has already been started for several years, but, since the recovery of
3
The JGSDF contributes to the protection of lives and property by conducting disaster relief operations, such as rescue or lifesaving operations as a result of large-scale accidents or domestic natural disasters (https://www.mod.go.jp/gsdf/english/dro/index.html n.d.).
15
Community Resilience Through Recovery: Capacity Building and Sustainability
339
GEJET is behind the schedule, thereupon, some operations have been added that is the establishment of community centers inside temporary housing camps to continue supporting and encouraging residents to move in temporary houses; also, volunteers hold various entertainment activities. Such activities support the software of recovery, and although some residents of temporary houses have already moved to permanent houses, supporting activities continue to create a friendly community. Due to different operations and situations, experts and specialists gave consultancy to social welfare associations (Interview with Miyako Social Welfare Association 2018). Volunteer fire corps or “Shobodan4” helped in different activities such as rescue and evacuation from damaged areas, and since they are part of community culture, their members are respected by local community as they help people in times of disasters which is something different from established formal organization that is based on payment system (Interview with Unosumai Shobodan 2018). In Kamaishi city, Shobodan started the rescue operation by themselves as due to high volumes of damages, the affected areas had been loaded with much debris, so JGSDF and other rescue teams could not enter into the damaged areas; thereupon, Shobodan took care of the area. They started with rescuing alive people as it was an urgent matter, and after that they were allowed to search for dead people; then, they transferred dead people’s bodies to designated centers jointly with JGSDF which was a major operation. In far and rather isolated areas, JGSDF could not enter early, and it even took several days, so Shobodan started rescue and relief by themselves. The JGSDF was a helpful counterpart for Shobodan as they not only provided food and water but also cooperated well and fulfilled their requests (Interview with Unosumai Shobodan 2018). After GEJET, resuming jobs and businesses was challenging due to problems such as loss of business counterparts; hence, in post-event some people had to suspend their business for a while, and during this period, they lost their counterparts. Lack of manpower due to population decrease and price increase of materials and damaged items due to the gap between supply and demand were other problems in resuming businesses. To help local industries, different programs were implemented to support them. One of the programs in supporting local businesses was arranging special events to introduce local business owners to potential counterparts; sometimes the local business owners are taken to Tokyo and other big cities to find new business counterparts. Another support project for local businesses was inviting experts from large corporations like Toyota or other famous corporations that are well-known for efficiency and improvement to increase the efficiency of local industries. Through such programs local industries can produce with higher quality, and considering the shortage of manpower in affected areas, such programs
Self-fire-fighting organization in Japan is called “Shobodan” or volunteer fire corps which is organized by local people and is based on the spirit that tries to defend the local community voluntarily from disaster impacts (Choi et al. 2004).
4
340
Z. Pooyan and A. Hokugo
have been planned to support local businesses, so even small industries and businesses can make high-quality productions. Inviting lecturers and holding various trainings to improve local knowledge on company management to meet the price increase as a problem have been another program. Also, encouraging innovation through introducing new types of highquality products and improving technological aspects of production is another project to support local industries in Iwate Prefecture. In addition, improving infrastructures through constructing new roads and highways that has shortened distances between affected towns and villages to urban areas has made selling local productions to urban consumers easier and also has decreased transportation costs which has created opportunities for local industries and businesses (Interview with Bureau of Coastal Broader Area Promotion 2018).
15.6
Recovery Trends
There are similarities and resemblances in recovery trends of affected communities in both prefectures; actions have been taken to plan in advance for potential disasters, enhancing local-level preparedness and capacity and taking initiatives and disaster countermeasures; also, some matters as top-down approaches and insignificant role of local communities in recovery are observed too. Pre-eventrelated trends include: Evaluation: to improve damage reduction and preparedness, evaluation has been done to prevent construction in high-risk-prone areas and think of measures to prevent previous harms. Disaster preparedness: improving residents’ knowledge and information on disaster preparedness has been considered after GEJET; therefore, different information on public awareness for disaster prevention has been made available in museums, cultural institutions, and other public places. In such places there are different sources, photos, movies, pamphlets, and display boards including information on March 11, 2011, the grassroots, participatory video recording/archiving project, “center for remembering 3.11,” and collection of open discussion/activity meetings, and also studies that can be utilized for education on disaster prevention are available to public to raise awareness and preparedness against disasters ((Interview with Iwate Prefecture Government 2018) and (Sendai Mediatheque n.d.)). Damage reduction: physical and non-physical measures have been taken to reduce potential damages in case of future events. While damage level is a function of event characteristics, considerations for evacuation and holding drills and relocations to safer areas contribute to less potential damages. Post-event-related trends include: Centralized: Local communities mention that the national and regional levels do not consider their demands in the recovery plan, so recovery activities implemented by communities are independent from national and prefectural levels’ plan (Interview with Hiroshi Tokumizu 2017); this trend led to incompatibility.
15
Community Resilience Through Recovery: Capacity Building and Sustainability
341
Time and financial constraints: The recovery of affected communities has delays due to various reasons such as tremendous damages, and also there are always unexpected matters in recovery. The prefecture level set recovery goals and decided on necessary matters without knowing about the recovery budget; when financial matters were arranged by national government and assigned to prefectures, the recovery goals had been already set up; thereupon, there are incompatibilities (Interview with Iwate Prefecture Government 2018). Affected communities mentioned that the allocated national budget for each prefecture is very limited, while very large financial sources are required. The recovery plan delays and financial problems led to longer staying in temporary houses than what had been considered. Some residents even if they receive a subsidy cannot afford reconstruction; for example, elderly people who have received subsidy, due to health problem, could not start reconstruction. Attenuated role of communities: Communities think that in making improvements or modifications due to GEJET, hardware and software should move together, realities and countermeasures must be considered, local disaster prevention capabilities are very important, and everything must be thought at small scale of area ((Interview with Akiko Iwasaki 2016) and (Interview with Community leaders in Kamaishi city 2016)). When changes are made during recovery, living and working patterns might change, and consequently communities change too. If local level’s comments and opinions are not taken into consideration, then the result of recovery will be inharmonious (Interview with Akiko Iwasaki 2016).
15.7
Opportunities and Challenges of GEJET
There are different opportunities and challenges in recovery of affected communities that represent strengths and constraints. Identifying opportunities and challenges is necessary as they are helpful in moving toward resilient recovery. Because of similarities between both prefectures’ recovery trends, there are some general challenges that have been observed in both prefectures, and each prefecture has some specific challenges too (Table 15.1). There have been opportunities in damage reduction, strengthening local communities, and improving self-reliance (Table 15.2).
15.8
Conclusions and Recommendations
As it was reviewed, affected communities’ recovery has been moved toward resilient-based recovery, while some indications of non-resilient recovery are observed too. Communities have been proactive and have applied their indigenous sources, have acted participatory, have used their innovation, and have had the help of supporters (in both prefectures) that are resilient recovery characteristics. But
342
Z. Pooyan and A. Hokugo
Table 15.1 Affected communities’ challenges in recovery Challenges High volumes of damages Relocations Large number of elderly people Immigration from affected areas Low power of communities Top-down approaches in recovery Difficulties of rescue and relief Local business decline Financial problems Nonsimultaneous movement of hardware and software in recovery Prolonging recovery Fisheries decline No designated shelter Rebuilding victims’ livelihood and revitalizing local communities Different procedures by local communities Land use controls
Miyagi * * * * * * * * * * * * * *
Iwate * * * * * * * * * * *
* *
Table 15.2 Opportunities for affected communities during recovery Opportunities Damage reduction opportunities Establishing evacuation routes Constructing evacuation towers Holding evacuation drills Reinforcing seawalls Relocations (prohibiting housing construction in dangerous areas) Strengthening local communities Establishing community centers Improving public disaster prevention awareness Supporting community participation Improving self-reliance Taking initiatives in evacuation drills or organizing volunteers Strengthening local industries and businesses Improving emergency response capacity at local level Reviving marginal and highly damaged areas than disappearing them
Miyagi
Iwate
* * * *
* * *
* * *
* * *
* *
* * *
being outside based in preparing recovery plans, being unilateral as top-down procedures, and in some cases being incompatible may lead to non-resilient recovery. Based on raised matters, the following recommendations are suggested. • Damage reduction measures must be based on indigenous resources and conditions; otherwise, they are not adaptable and might not be integrated in affected communities. Indigenous resources and methods are compatible with local
15
•
•
•
•
Community Resilience Through Recovery: Capacity Building and Sustainability
343
conditions; thus, using them improves local capacities in meeting needs and promoting efficiency. Local communities should be the focal point of recovery activities, while national and prefectural levels plan about recovery and the budget, but local level is the main source of information. Local communities are the principal consulting reference during recovery, and their collaboration with higher levels ensures the effectuality and continuance of recovery projects that leads to resilience. To increase local capability, capacity building endeavors during recovery should focus on self-dependency. Although there are more resources during recovery, any innovation or creativity should be comprehensible and appliable by local level. Otherwise, applying advanced knowledge and technology that is incomprehensible for local level leads to dependency and incompatibility. Recovery plans and projects must be based on a long-term view to achieve sustainable results. Long-term recovery requires a more comprehensive and inclusive viewpoint since the components’ interactions change during time periods. As some decisions in emergency response or short-term recovery should be taken immediately, they might lead to emerging trends which are not along with longer development and be rather short-term. Longer view leads to persistence that is one of the outcomes of resilient-based recovery. Recovery orientation should be toward keeping current trends. Although due to disaster damages and availability of new sources, modern ideas might be introduced and considered, recovery should proceed with current trends. The current trends are the continuation of pre-event trends which are based on environmental, economic, social, and cultural backgrounds and consequently are more consistent and better applicable. This matter is very important where there are environmental or cultural attractions and should be protected.
References Arch daily. http://www.archdaily.com Building Back Better, Achieving Resilience through Stronger, Faster and more inclusive Postdisaster Reconstruction, Global Facility for Disaster Reduction and Recovery (GFDRR), 2018 Choi Y, Hokugo A, Murosaki Y (2004, March) A Study on the Relation between the Roles of “Shobodan” and Local Community in Japan, A Case study of the Shobodan and the Local Community in Kobe City. In Proceedings of the Sixth Asia-Oceania Symposium on Fire Science and Technology, International Association for Fire Safety Science, Daegu, South Korea Cover Story: Lessons from Disasters, Leading Recovery, Public Relations Office, Government of Japan, Highlighting Japan, March 2013 Disaster Recovery Framework Guide, Revised version: Global Facility for Disaster Reduction and Recovery (GFDRR), Washington DC, USA, 2020 Engaging Local Actors in Disaster Recovery Framework: Global Facility for Disaster Reduction and Recovery (GFDRR), International Recovery Platform, 2019 Good Design Award, Community Center (Namiita Lab), http://www.g-mark.org/award (n.d.)
344
Z. Pooyan and A. Hokugo
Guide Book, Michinoku Coastal Trail, Ishinomaki (Kitakami, Kahoku, Ogatsu) Section, Namiita Lab Community Center and Boat House Namiita, February 2020., http://tohoku.env.go.jp/mct/ english/top/pdf/19_Ishinomaki_additional.pdf http://sakuranamiki.jpn.org/archives/11695.html (n.d.) https://en.wikipedia.org/wiki/2011_Tohoku_earthquake_and_tsunami (n.d.) https://en.wikipedia.org/wiki/Ishinomaki (n.d.) https://en.wikipedia.org/wiki/Kamaishi,_Iwate (n.d.) https://en.wikipedia.org/wiki/Miyako,_Iwate (n.d.) https://en.wikipedia.org/wiki/Otsuchi,_Iwate (n.d.) https://www.mod.go.jp/gsdf/english/dro/index.html (n.d.) Interview with Akiko Iwasaki, Houraikan Landlady in Kamaishi city, Iwate prefecture, November 2016 Interview with Akinari Abe, Representative of Community Reconstruction Working Group, Ogatsu, Miyage prefecture, January 2017 Interview with Bureau of Coastal Broader Area Promotion, Kamaishi City, Iwate prefecture, March 2018 Interview with Community leaders in Kamaishi city, Iwate prefecture, November 2016. River meeting Interview with Hiroshi Miura, Former Branch Manager, Ogatsu General Branch, Regional Division Takayuki, Ogatsu, Miyage prefecture, January 2017 Interview with Hiroshi Tokumizu, Ogatsu Rose Factory Garden Office, Ishinomaki city, Miyage prefecture, January 2017 Interview with Iwate Prefecture Government, General Disaster Prevention Bureau, Bureau of Disaster Recovery, March 2018 Interview with Junichiro Aoki and Takeichi Itou in Nammita Lab, Ogatsu, Miyage prefecture, January 2017 Interview with Kamaishi Local Autonomous Association Members, Iwate prefecture, March 2018 Interview with Koe Abe, Chairman of Yamada Chamber of Commerce, Yamada, Iwate prefecture, March 2018 Interview with Michiyo Sato, shop owner of Yaeochi store in Ogatsu, Miyage prefecture, January 2017 Interview with Miyako Social Welfare Association, Iwate prefecture, March 2018 Interview with Unosumai Shobodan, Unosumai district, Iwate prefecture, March 2018 Interview with Yuji Sasaki, Secretariat of Hashino district Community Center, Kamaishi, Iwate prefecture, November 2016 Planning for Post-Disaster Recovery: Key Concepts and Issues that Should Inform Practice, Principles for Preparing a Community’s Disaster Recovery Plan, Gavin Smith, American Planning Association, 2016 Pooyan Z, Hokugo A (2017) Community Challenges in Resilient Based Disaster Recovery of TOHOKU Region. Research Center for Urban Safety and Security, Kobe University, Japan Schwab JC (2014) Planning for Post-Disaster Recovery: Next Generation, American Planning Association Sendai Framework for Disaster Risk Reduction (2015–2030), The United Nations Office for Disaster Risk Reduction, Geneva, Switzerland, 2015 Sendai Mediatheque (n.d.). https://www.smt.jp/en/ Status of Reconstruction and Reconstruction Efforts in GEJET, Reconstruction Agency, February 2022 United Nations Office for Disaster Risk Reduction (n.d.). https://www.undrr.org/terminology/ recovery
Chapter 16
Community Resilience Through Local Action: AKAH’s Winter Preparedness and Avalanche Readiness Programme Deo Raj Gurung , Rukhshona Saratbekova, Sayed Ahmad Sahim, Khwaja Momin Walizada, Sher Wali, Deedar Karim, Rahim Dobariya, and Nusrat Nasab
Abstract Snow avalanche represents one of the dominant hazards across high mountain ranges in Central and South Asia in winter and spring seasons, resulting in loss of lives, assets and livelihood. The Aga Khan Agency for Habitat (AKAH) has prioritised 616 out of 2496 assessed settlements as high avalanche risk settlements, with over 40,000 people directly exposed across the AKAH programme areas in Afghanistan, Pakistan and Tajikistan. Between 2010 and 2021, 919 avalanche events and 362 fatalities were recorded, out of which 807 events and 109 fatalities were located in the AKAH programme areas. In response to the intense avalanche cycle in 2012, which took 148 lives across these 3 countries, FOCUS Humanitarian Assistance initiated the preparedness against avalanche hazard, which later became the AKAH’s Winter Preparedness and Avalanche Readiness Programme (WPARP),
D. R. Gurung (✉) Aga Khan Agency for Habitat, Dushanbe, Tajikistan e-mail: [email protected] R. Saratbekova Aga Khan Agency for Habitat, Khorog, Tajikistan S. A. Sahim · K. M. Walizada Aga Khan Agency for Habitat, Kabul, Afghanistan S. Wali Aga Khan Agency for Habitat, Islamabad, Pakistan D. Karim Aga Khan Agency for Habitat, Gilgit, Pakistan R. Dobariya Aga Khan Agency for Habitat, Mumbai, India N. Nasab Aga Khan Agency for Habitat, Islamabad, Pakistan © The Author(s), under exclusive license to Springer Nature Switzerland AG 2023 S. D’Amico, F. De Pascale (eds.), Geohazards and Disaster Risk Reduction, Advances in Natural and Technological Hazards Research 51, https://doi.org/10.1007/978-3-031-24541-1_16
345
346
D. R. Gurung et al.
a comprehensive multi-pronged programme, formally launched in 2017. WPARP became the AKAH flagship programme and ensured the avalanche-specific preparedness prior, during and after the avalanche season (November to March), with a positive outcome on the ground, as evident from the disaster and loss database. The comparative analysis of the avalanche events and fatalities in the AKAH’s operational and non-operational areas, and pre/post-WPARP years, indicates heightened preparedness, effective response and improved resilience. Despite the 578% increase in avalanche incidents in 2021 as compared to 2017, recorded fatalities were down by 12% in the AKAH programme areas and neighbourhood. Similarly, fatalities to event ratio, for the AKAH programme (7.4) and non-programme areas (0.4), shows a fewer number of fatal avalanche events in the programme area. The first-hand information from the ground serves as a testimony of enhanced community resilience brought about by the WPARP, directly contributing towards the first four of the seven targets of the Sendai Framework for Disaster Risk Reduction 2015–2030 (SFDRR) and indirectly contributes to central aspiration of the 2030 Agenda for Sustainable Development—“to leave no one behind”. Thus, WPARP demonstrates that financing local level interventions is key to achieving global commitments. Keywords Community resilience · Avalanche · Institutional preparedness · Risk anticipation · Prevention
16.1
Introduction
The term “resilience” is derived from the Latin word resilire (rĕsĭlĭo, rĕsĭlis, resilui, rĕsĭlīre; resilĭens -ĕntis), meaning the act of rebounding, i.e. to rebound/recoil, from “re-” back + “salire” to jump, leap (Indirli 2019; Klein et al. 2003). It is a multidimensional term having different connotation according to field of research (Indirli 2019; MacAskill and Guthrie 2014; Alexander 2013; Fleming and Ledogar 2008). Found for the first time in several Latin authors, the term “resilience” passed through medieval culture until intellectuals who strongly contributed to the birth of the modern scientific method (as Francis Bacon), nineteenth-century encyclopaedists, the Rankine’s quantitative definition in engineering and finally to psychology, anthropology and ecology, with the fundamental Holling’s contribution in 1973. In the last decades, the concept expanded quickly into social-ecological systems, disaster/risk assessment, sustainability, and adaptive capacity to cope with catastrophic scenarios. Nowadays, multidisciplinary scientists and representatives of public/private organisations largely use the term “resilience”, but with increasing ambiguity about its properties and attributes (Indirli 2019). The term is said to have made the transition from material science, psychology, ecology, social sciences, development aid and economics and study of organisation (Combaz 2014). The modern resilience has a root among psychologists and psychiatrists (Fleming and
16
Community Resilience Through Local Action: AKAH’s Winter Preparedness. . .
347
Ledogar 2008; Alexander 2013), used to describe differing degrees of psychological vulnerability to abrupt shocks (Alexander 2013). The concept of resilience entered the field of disaster risk management about three decades ago (Irajifar et al. 2013; Indirli 2019). Today the word “resilience” is widely used in disaster management, and it is mostly found in conjunction with the term “disaster”, as disaster resilience. The UNISDR definition of resilience is “The ability of a system, community or society exposed to hazards to resist, absorb, accommodate to and recover from the effects of a hazard in a timely and efficient manner, including through the preservation and restoration of its essential basic structures and functions” (UNISDR 2009). This paper presents the AKAH’s Winter Preparedness and Avalanche Readiness Programme (WPARP) as a case of multi-pronged programmatic approach to enhance the community resilience to avalanches. The paper elaborates how AKAH’s WPARP ensures sustained engagement to enhance four resilience capacities of the vulnerable communities (ESCAP 2018): anticipatory capacity, absorptive capacity, adaptive capacity and transformative capacity. The analysis of disaster and loss records of the recent past is presented as a first-hand data as a testimony of the positive impact on the ground.
16.2
The Aga Khan Agency for Habitat (AKAH)
The need for an integrated and holistic disaster risk reduction (DRR) programme to deal with increasing threat in the face of climate change is the premise on which the Aga Khan Agency for Habitat (AKAH) was founded in 2015. Five different organisations (Aga Khan Development Network, AKDN; Aga Khan Planning and Building Services, AKPBS; Focus Humanitarian Assistance, FOCUS; Prince Sadruddin Aga Khan Fund for the Environment, PSAKFE; Disaster Risk Management Initiatives, DRMI; and Programme Management Office, PMO) were integrated to establish AKAH—an apex agency to lead holistic approach to DRR and Climate Change Adaptation (CCA) programmes. Currently, AKAH is operational in five countries: Afghanistan, India, Pakistan, Syria and Tajikistan (Fig. 16.1), referred to as AKAH programme countries, and across specific target areas, referred to as the AKAH programme areas. AKAH aspires to ensure “safe and sustainable habitat in which communities, families and individuals can thrive” (AKAH 2017a). This goal is realised through ensuring safe physical setting for living, improved preparedness and effective response to cope with disaster, assuring also economic opportunities and access to social and financial services for development. It is delivered through four operational themes: Safety, Resilience, Services and Opportunities; the emergency management remains at the core of AKAH’s mission.
348
D. R. Gurung et al.
Fig. 16.1 Map showing AKAH countries in dark green colour
16.3
Snow Avalanche: Dominant Winter Hazard
The AKAH programme areas, being mostly located in the northern mountainous regions in Afghanistan, Pakistan and Tajikistan, experience heavy snowfall and regularly witness snow avalanches during winter and spring seasons. AKAH identified 616 high avalanche risk villages (217 in Afghanistan, 234 in Pakistan, and 165 in Tajikistan) out of 2496 assessed settlements, with over 40,000 people directly exposed to avalanche hazard. Through the AKAH avalanche inventory, 919 incidents and 362 fatalities were recorded between 2010 and 2021 in the AKAH programme areas and neighbourhood (Fig. 16.3a). Among the total fatalities, 299 were male and 63 were female. Of the total events, 86% occurred in the AKAH programme areas (Fig. 16.3b), and 89% of those events post-dated the AKAH’s WPARP. The total events increased, while fatalities declined over the decade (Fig. 16.4). The year 2012 was exceptional with 148 fatalities that catalysed the formulation of an avalanche preparedness strategy, which finally culminated in the set-up of the AKAH’s WPARP. Climate change is expected to aggravate the hazard situation, as warmer and wetter winter will increase the avalanche frequency as well as the intensity (Ballesteros-Cánovas et al. 2018). The increase in avalanche incidents was associated with the sharp rise in temperature in Pakistan (De Scally and Gardner 1994). Figure 16.2 shows the association between snow fall amount, temperature, rainfall and avalanche incidents (Figs. 16.3 and 16.4).
Community Resilience Through Local Action: AKAH’s Winter Preparedness. . .
16
349 8
35
30
25 6 20
4
10
Rainfall (mm)
# of Incident
15
5
0 2 -5
-10
-15 11-Nov-2020
01-Dec-2020
21-Dec-2020
10-Jan-2021
30-Jan-2021
19-Feb-2021
11-Mar-2021 31-Mar-2021
0 20-Apr-2021 10-May-2021
20
20
15
Temperature °C
5 10 0
-5
Snowfall & Snow Depth (cm)
15 10
5 -10
-15
0
Avg Snowfall
Avg Temperature
Avg Max Temperature
Avg Min Temperature
Avg Snow Depth
Fig. 16.2 Data from WMP maintained by AKAH indicates association between weather and snow data to avalanche events
16.4
AKAH’s Winter Preparedness and Avalanche Readiness Programme
The record snowfall and subsequent cycle of avalanches, with a widespread impact and fatalities across Central and South Asia in 2012 (see Box 16.1), signed the start of the current AKAH’s WPARP under FOCUS. The multi-pronged programme consisting of risk assessment, feeding into designing of village-level disaster management plan (VDMP) and implementation of series of community-based
350
D. R. Gurung et al.
Fig. 16.3 Bar graphs showing total avalanche and fatality counts by countries (a) and by programme area (b)
Fig. 16.4 A decade (2010–2021) long trend of avalanche (top), fatalities (middle) and ratio (bottom) using avalanche database from both AKAH programme areas and non-programme areas in the three countries
16
Community Resilience Through Local Action: AKAH’s Winter Preparedness. . .
Nov - Dec
Jan - Feb
Jan - Mar
Feb - April
Launch of Winter Preparedness
351
Phase 1: Planning
Early Warning and Preparedness
Phase 2: Preparedness
Weather Monitoring, Data Collection & Analysis
Phase 3: Alert
Response (Evacuation and SAR)
Phase 4: Response
Fig. 16.5 AKAH’s WPARP cycle outlining sequencing of multiple phases
interventions was formally launched across the avalanches-prone AKAH programme countries in 2017. The strategy (AKAH 2017b) puts its emphasis on the improved institutional and community preparedness for the avalanche season, starting from November to March, and articulates a sequence of activities implemented prior, during and after an avalanche season (Fig. 16.5). The operationalisation of the strategy is facilitated through the promulgation of relevant Standard Operation Procedures (SoPs) and a self-evaluation tool. The year 2017 is considered watershed year and separates the pre-programme and post-programme periods, respectively, for analysis and discussion. Box 16.1 On March 5, 2012, an avalanche destroyed the village of Dispay in the Shukai District of Badakhshan in Afghanistan, killing at least 50 people. A week later, on March 12, an avalanche buried 13 families in eastern Nuristan province in Afghanistan, killing at least 45 people. Following week, an avalanche hit the remote Qurqulti Village in Gilgit Baltistan in Pakistan, killing four family members and injuring three of them, on March 19. Five members of another family were killed on the same night in Wakht Village in Chitral in Pakistan, when an avalanche hit their house. Nearly 20 avalanches struck villages through Badakhshan, Tajikistan, in the last 2 weeks of March the same year (2012), damaging and destroying several houses and other facilities and killing at least 1 person and 50 cows.
352
16.5 16.5.1
D. R. Gurung et al.
Programme Framework Pre-Avalanche Season
The pre-emptive resource allocation and positioning of capacity enable an effective and timely response, which is critical to save lives. Therefore, the major thrust of AKAH’s WPARP is the ex-ante preparedness, as elaborated below.
16.5.1.1
Identifying and Prioritising Avalanche-Prone Settlements
High avalanche risk villages are identified using a HVRA framework, similar to the one adopted in Switzerland (Raetzo et al. 2002). HVRA is a critical, scientific process that serves as the foundation for AKAH’s DRR planning and programming, a multi-hazard framework implemented through a desktop-based assessment in conjunction with the community-level assessment. The settlement multi-hazard risk score is calculated on the basis of the exposure to hazard and vulnerability (AKAH 2020). As mandated by the SoP, HVRA is repeated every 3 years or immediately after an event, to ensure relevance to changing ground realities. Using the risk score, high avalanche risk villages are identified and prioritised in the AKAH’s WPARP.
16.5.1.2
Village Disaster Management Plan (VDMP)
In order to build up a good situational awareness of risk faced by the community, Village Disaster Management Plan (VDMP) is prepared in close coordination with the community leaders and members, including representatives from vulnerable groups. The document identifies and elaborates the community-level risk and reduction measures, including emergency management elements. The VDMP is used as a blueprint to define and implement current and future risk reduction measures. Out of 616 high avalanche risk villages, VDMPs have been developed for 514 (83.4%) settlements. VDMPs are printed in local languages and distributed to community leaders, members and volunteers. The communities are educated and trained to use the VDMP through annual awareness exercises and drills.
16.5.1.3
Community Emergency Response Team (CERT)/Volunteers
The role of the community volunteers is indispensable in building community resilience, to prepare for and respond to disasters (Brennan et al. 2005). A total of 1434 strong specialised teams with 26,314 trained volunteers (Fig. 16.6), out of which 37% (9856) are female, forms the force behind AKAH’s WPARP in these 3 countries. The Community Emergency Response Team (CERT) constitutes 65%
16
Community Resilience Through Local Action: AKAH’s Winter Preparedness. . .
353
Fig. 16.6 Pie chart showing teams (left) and team members (right)
Photo 16.1 AVPT members in Nishusp village in Tajikistan practising avalanche search and rescue
of the AKAH’s volunteers, and those specialised in avalanche emergencies are called Avalanche Village Preparedness Team (AVPTs, Photo 16.1) in Afghanistan and Tajikistan. There are 373 AVPTs with 3734 volunteers in these 2 countries, out of which 27% are women. These CERT and AVPT volunteers are trained on community-based disaster risk management (CBDRM), basic avalanche science, lifesaving survival techniques, first aid and search and rescue (SAR) techniques. In addition, AKAH has trained 7 Search and Rescue Teams (SARTs, Photo 16.2) with 106 members in these 3 countries, of which 29% are women. The SARTs are trained to the International Search and Rescue Advisory Group (INSARAG) standard and undergo regular practice sessions. It is an AKAH’s volunteer force in Pakistan, while
354
D. R. Gurung et al.
Photo 16.2 SART volunteers in Gerojoi village in Dushi district of Afghanistan during search and rescue simulation
they are on AKAH’s payroll in Afghanistan and Tajikistan. AKAH makes concerted efforts to make gender-friendly workspace by creating conducive environment and support systems for women to enrol. The contribution of trained volunteers represents a big part of the AKAH’s WPARP success (see Box 16.2). Box 16.2 On 3 April 2016, an evacuation of inhabitants from 3 at-risk houses by CERT and WMP volunteers took place in Shimshal village of Hunza, Pakistan; 25 lives were saved from an avalanche that struck early next morning at 5 AM, with the complete damage of one house and the partial damage of other two. Similarly, on 15 January 2019, the AVPT volunteers warned police officers in the Nivodak checkpoint of Khorog (Tajikistan) about a possible avalanche event, advising them to organise an evacuation. An avalanche occurred the same night, hitting and destroying the police base; fortunately, the timely action saved the lives of eight people. In Afghanistan, a timely rescue by SART volunteers saved five people of the Sarchashma village of Maimai district in Badakhshan, on 12 February 2020, when they were hit by an avalanche while fetching fodder.
16
Community Resilience Through Local Action: AKAH’s Winter Preparedness. . .
16.5.1.4
355
Community Awareness and Education
The awareness generation and education on preventive measures play a decisive role in reducing risk (Shaw et al. 2009). It should be considered a real “functional, operational, and cost-effective tool for risk management” (Torani et al. 2019), acknowledged as “a crosscutting issue to achieve the four priorities” of the SFDRR (Shiwaku and Shaw 2016). Informed and aware individuals and communities are better prepared and respond timely and appropriately. If well informed about appropriate actions against risk, children can respond promptly and appropriately (Nifa et al. 2017). Without awareness of risk and preparedness activities, communities will not invest on preparedness even when capacity for investment is there. Knowledge of risk and appropriate preparedness to deal with it motivate and nudge the communities. AKAH conducts community awareness sessions on avalanche and associated risk in avalanche-prone villages every year, before a hazard season. The community members are made aware of HVRA findings, basic avalanche science, avalanche preparedness and response, survival techniques, evacuation plan, early warning and appropriate action during emergencies. The awareness session is delivered using presentations, photographs and video clips (see Box 16.3), by training officers and geologists. Box 16.3 Pari Gul and First Aid is a 5-minute video clip in Urdu with English subtitles, developed by AKAH in Pakistan to educate community members on how to administer first aid in different emergency situations—wound opening, fracture, chocking and unconscious state.
16.5.1.5
Emergency Communication
“Emergency communication refers to communication in the context of emergencies, disasters, catastrophes, and other crises” (Allen 2017). Timely communication is vital for the effective response and recovery. As the AKAH programme areas are located in remote mountains, devoid of any mode of communication, AKAH has invested on establishing “fail-safe communication” in the form of two or more modes of communication in high-risk villages. AKAH has trained one member of the community to operate and for the system upkeep. To ensure communication between AKAH team and communities all around the clock, a radio operator is
356
D. R. Gurung et al.
Fig. 16.7 Daily call log (25 October 2021) of emergency communication system maintained by AKAH Afghanistan (left), and number of avalanche-prone villages by modes of communication across three countries
always on standby (24/7 all year long) in AKAH office premises. Daily communication is made between the AKAH radio operator and the trained community communication person, and call log is maintained (Fig. 16.7). Currently out of 616 avalanche-prone villages, 328 villages have a dual mode of communication, 256 villages have a single mode of communication, and 31 villages are without any communication mode (Fig. 16.7).
16.5.1.6
Weather Monitoring Posts (WMPs)
A direct correlation exists between weather and snowpack parameters with avalanche events (Peitzsch et al. 2021; Dreier et al. 2013; Castebrunet et al. 2012) with large amount of new snow associated with avalanche days (Dreier et al. 2013), as evidenced in Fig. 16.2. In absence of hydro-met stations at higher altitude in remote locations, AKAH installed 88 manual weather monitoring posts (WMPs) recording temperature, snowfall days, snow depth/thickness and rainfall in the last 24 hours. Of the total WMPs, only 17% are in elevation above 3000 masl (Fig. 16.8). These WMPs are managed by trained village volunteers, who feed a daily report of snow and weather parameters to the database focal at the AKAH Country Office who populates the centralised online database. The AKAH’s Avalanche Expert uses the daily local weather and snow report in conjunction with regional models, to forecast snowstorm and issue a weekly weather advisory bulletin.
16.5.1.7
Capacity Building and Drills
Experience has shown that the most effective risk reduction solutions are those implemented at the local level (Kusumasari 2010). Thus, the local capacity is indispensable to create a required ecosystem to enhance community resilience by breaking reliance and dependencies with external support systems. The AKAH’s WPARP has a strong focus on the capacity building of volunteers, communities and staffs. The teams are regularly trained on weather/snow observation and recording, search and rescue and first aid. In addition, village seminars and team drills on snow probing, evacuation, first-aid, search and rescue are regularly conducted. AKAH, in
16
Community Resilience Through Local Action: AKAH’s Winter Preparedness. . .
357
Fig. 16.8 Distribution of AKAN’s weather monitoring posts (WMPs) by elevation
Fig. 16.9 Numbers of staffs trained on ICS and EOC in these three countries
partnership with the Justice Institute of British Columbia (JIBC), has trained key staffs and volunteers on Incident Command System (ICS) and Emergency Operating Centre (EOC) to improve emergency response (Fig. 16.9).
16.5.1.8
Stockpiles
Stockpile is a cornerstone of the emergency preparedness. AKAH’s Stockpile Strategy outlines multi-tiered stockpile approach (Fig. 16.10) to improve coverages particularly in high-risk settlements. AKAH currently maintains two levels of
358
D. R. Gurung et al.
Fig. 16.10 Multi-tier stockpile approach adopted by AKAH
stockpiles: a community (village/cluster) level and an institutional (region/provincial/district) level, varying in size and management mechanism. The Institutional or Regional Stockpiles are large stockpiles established with the objective to cater to medium- or large-scale emergencies in a particular region/district. These stockpiles are owned and managed by the AKAH Country office and hence deployed at the discretion of Chief Executive Officer (CEO). The second set of stockpiles are the community stockpiles established to cater to local-level disasters affecting a village (or cluster of villages); they are typically owned and managed by the CERTs and local village leaderships. Currently, out of 616 high avalanche risk villages, 70% (434) villages have access to stockpiles within 12 hours of reach. The stockpile strategy is operationalised through SoP which defines quality and volume of contents, upkeep procedures and calendar and access procedures, in line with international humanitarian standards. Accordingly, the assessment, inventory and, if required, replacement/replenishment of stockpiles are done annually mostly under core funding.
16.5.1.9
Mitigation Projects
Mitigation is an action taken to reduce or eliminate the risk to people and property from hazards and their effects by managing probability and consequences (Bullock et al. 2013). AKAH has implemented in the field two types of mitigation interventions; they are avalanche terracing and snow glide tripod (Photo 16.3). The terrace, with a width measuring 1.5 times the avalanche depth, is constructed across the avalanche-prone slope to capture the avalanche mass, containing its progression further down into living areas. This measure, although simple and comparatively inexpensive, has proved successful in minimising the risk. These terraces have been further fortified by planting trees in some areas. In addition to minimising an avalanche risk, terraces resulted equally effective in minimising risk from rockfalls. AKAH repairs the damaged terrace after every avalanche incident. The installation of a snow glide tripod is another mitigation project mostly implemented in Pakistan,
16
Community Resilience Through Local Action: AKAH’s Winter Preparedness. . .
359
Photo 16.3 Avalanche mitigation interventions (terracing and snow glide tripod) implemented by AKAH Pakistan in Shershal village in district Lower Chitral
to prevent the release of snow mass and/or contain moving snow mass, by inducing surface roughness. Currently there are 59 mitigation sites across the 3 countries.
16.5.1.10
Self-Evaluation Exercise
A self-evaluation exercise is done twice: a pre-season assessment in October, followed by a post-season assessment in April. The pre-season self-evaluation exercise allows to identify existing gaps in the preparedness and work on it. It is done using a matrix scoring (from 0 to 3) 21 criteria covering 4 themes: Management, Risk Assessment and Planning, Knowledge and Education and Disaster Preparedness and Response, based on current arrangement status. Country-specific recommendations (short term and long term) are drawn out on the base of the findings of the pre-season self-evaluation exercise.
16.5.2
During an Avalanche Season
16.5.2.1
Weather and Avalanche Advisory Service
Starting in November up to March of the following year, an avalanche expert issues weekly a weather and avalanche advisory bulletin (Fig. 16.11) every Friday for the next 1 week, based on assessment using a global/regional weather model in conjunction with local weather and snow data. The forewarning is passed on to the
360
D. R. Gurung et al.
Fig. 16.11 Weekly weather and avalanche advisory bulletin (top) issued during the avalanche season and weekly WMP performance report (bottom)
communities and community volunteers through emergency communication channels and advised accordingly.
16.5.2.2
Monitoring of WMP Performance
The reporting of daily weather and snow data from the WMPs is the critical starting point for generating a weekly advisory and the subsequent action in the ground. Thus, the report on WMP performance (Fig. 16.11) is monitored and shared every week to the management. Any issue in reporting is immediately taken up and addressed in consultation with the WMP volunteers.
16
Community Resilience Through Local Action: AKAH’s Winter Preparedness. . .
16.5.3
Post-Avalanche Season
16.5.3.1
Reflection and Learning
361
A second self-evaluation exercise of the programme is done in early April, immediately after the end of an avalanche season in March, to reflect and learn from the season. The reflection is done in areas of four key themes as with pre-season self-evaluation template. A country-specific recommendation is drawn and followed up till the next avalanche season.
16.6
Recommendation and Conclusion
The decrease in fatalities even with an increase in events in the last decade serves as compelling first-hand evidence of the improved community resilience against an avalanche hazard, across the AKAH’s programme areas in Afghanistan, Pakistan and Tajikistan. Many of the fatalities were in non-residential areas, away from the villages, mostly while commuting between the villages. Twelve out of thirteen fatalities in Tajikistan occurred in activity areas, as locals were hit by an avalanche while on their way. Despite 578% increase in avalanche incidents in 2021 compared to 2017, fatalities recorded gone down by 12% in the AKAH programme areas and neighbourhood (Fig. 16.12). Fatalities to event ratio (event divided by fatalities) shows one death for eight events in the AKAH programme areas, while one death for one event in the non-programme areas. The same analysis for pre- and post-WPARP years in the AKAH programme areas shows 1 death for 2 events and 1 death for 14 events, respectively. This result shows fewer fatalities in the AKAH’s programme areas and in post-WPARP period, indicating that local-level interventions led by AKAH have effectively built the communities’ resilience, directly contributing to the first four targets of the SFDRR and indirectly to first three SDGs. While the programme has proved successful with first-hand evidence of positive impact on the ground, there is a need to integrate the avalanche preparedness into other local-level programmes such as School Safety Programme. Educating students on avalanche science, hazard and preparedness will better prepare future community members and leaders. There is a need to innovate and improve avalanche forecasting from regional to a more localised scale, to mobilise local-level preparedness. An integrated multi-hazard mitigation approach by combining structural and Eco-DRR solutions should be considered for a better result with multiple benefits. Over time government needs take over the programme as a part of its annual programme to ensure sustainability of the programme. The WPARP stands as the testimony that financing local-level interventions pays off in terms of saving lives through enhanced communities’ capacities: anticipation capacity, absorptive capacity, adaptive capacity and transformative capacity. The
362
D. R. Gurung et al.
Fig. 16.12 Event and fatalities statistics for AKAH programme and non-programme areas, and preand post-AKAH’s WPARP
investment on return for financing local-level interventions is in lives saved and should be increased if SFDRR and SDGs are to be met. Acknowledgement The AKAH’s emergency management activities, including Winter Preparedness and Avalanche Readiness Programme, owe a lot to the community volunteers who are an indispensable partner in this noble endeavour. They deserve utmost gratitude for their commitment. The community-based initiatives cannot sustain without support from the communities, a big part of AKAH’s interventions and deserving of gratitude. Driving the programme on the ground are the entire emergency management team members in these three countries, headed by CEO and ably supported by Head of Emergency Management Department. They deserve a big applause for being the big force behind the programme. The authors are highly obliged to the AKAH senior management and members of Executive Committee for guidance and support to design, develop and implement programmes and publish the work as book chapter. Finally, the programme would not sustain without core funding, and AKAH would like to greatly thank for the continuous support.
References AKAH (2017a) Aga Khan agency for Habitat, strategy 2018–2022, 2017 AKAH (2017b) AKAH winter preparedness and avalanche readiness strategy, 2017 AKAH (2020) AKAH standardized HVRA mapping strategy, 2020 Alexander DE (2013) Resilience and disaster risk reduction: an etymological journey. Nat Hazards Earth Syst Sci 13(11):2707–2716 Allen M (2017) The sage encyclopedia of communication research methods, vol 1–4. SAGE Publications, Inc, Thousand Oaks, CA. https://doi.org/10.4135/9781483381411
16
Community Resilience Through Local Action: AKAH’s Winter Preparedness. . .
363
Ballesteros-Cánovas JA, Trappmann D, Madrigal-González J, Eckert N, Stoffel M (2018) Climate warming enhances snow avalanche risk in the Western Himalayas. Proc Natl Acad Sci 115(13): 3410–3415 Brennan MA, Barnett RV, Flint CG (2005) Community volunteers: the front line of disaster response. J Volunt Adm 23(4):52 Bullock JA, Haddow GD, Coppola DP (2013) Mitigation, prevention, and preparedness. Introduction to Homeland Security 2013:435–494 Castebrunet H, Eckert N, Giraud G (2012) Snow and weather climatic control on snow avalanche occurrence fluctuations over 50 yr in the French Alps. Clim Past 8(2):855–875 Combaz E (2014) Disaster resilience: topic guide. GSDRC, University of Birmingham, Birmingham De Scally FA, Gardner JS (1994) Characteristics and mitigation of the snow avalanche hazard in Kaghan Valley, Pakistan Himalaya. In: Recent studies in geophysical hazards. Springer, Dordrecht, pp 197–213 Dreier L, Mitterer C, Feick S, Harvey S (2013) The influence of weather on glide-snow avalanches. In Proceedings, international snow science workshop, France, Grenoble (Vol. 2951) ESCAP (2018) Transformation towards sustainable and resilient societies in Asia and the Pacific Fleming J, Ledogar RJ (2008) Resilience, an evolving concept: a review of literature relevant to aboriginal research. Pimatisiwin 6(2):7 Indirli M., 2019. An historical flight and some open questions towards a pluralistic but holistic view of resilience. In Book: geographies of Anthropocene, special issue: earthquake risk perception, communication and mitigation strategies across Europe, 2, 2, Il Sileno Edizioni, 195 Irajifar L, Alizadeh T, Sipe N (2013, May) Disaster resiliency measurement frameworks: state of the art. S. Kajewski, K. Manley, K. Hampson. Presented at the world building congress, Brisbane, Australia Klein RJ, Nicholls RJ, Thomalla F (2003) Resilience to natural hazards: how useful is this concept? Global Environ Change B Environ Hazard 5(1):35–45 Kusumasari B (2010) 7. Local government capability in managing disaster: evidence from Bantul, Indonesia. Publication Series of UNU-EHS No. 14/2010, 77 MacAskill K, Guthrie P (2014) Multiple interpretations of resilience in disaster risk management. Procedia Econ Financ 18:667–674 Nifa, F. A. A., Abbas, S. R., Lin, C. K., & Othman, S. N. (2017, October). Developing a disaster education program for community safety and resilience: the preliminary phase. In AIP Conference Proceedings (vol. 1891, no. 1, p. 020005). AIP Publishing LLC Peitzsch EH, Pederson GT, Birkeland KW, Hendrikx J, Fagre DB (2021) Climate drivers of large magnitude snow avalanche years in the US northern Rocky Mountains. Sci Rep 11(1):1–13 Raetzo H, Lateltin O, Bollinger D, Tripet J (2002) Hazard assessment in Switzerland–codes of practice for mass movements. Bull Eng Geol Environ 61(3):263–268 Shaw R, Takeuchi Y, Rouhban B (2009) Education, capacity building and public awareness for disaster reduction. In: Landslides–disaster risk reduction. Springer, Berlin, pp 499–515 Shiwaku K, Shaw R (2016) Introduction: disaster risk reduction and education system. In: Disaster resilience of education systems. Springer, Tokyo, pp 1–10 Torani S, Majd PM, Maroufi SS, Dowlati M, Sheikhi RA (2019) The importance of education on disasters and emergencies: a review article. J Edu Health Promot 8:85 UNISDR (2009) UNISDR terminology on disaster risk reduction. United Nations Office for Disaster Risk Reduction, Report. Available at https://unisdr.org/files/7817_ UNISDRTerminologyEnglish.pdf, Accessed 19 July 2021
Chapter 17
Civic Resilience: Botanical Gardens in North America, Birth, Development, and Environmental Awareness Flavia Schiavo
Abstract The chapter explores from a historical perspective the birth of botanical gardens in North America, considered a significant part of the ecological network system and of the green and blue ‘infrastructure’. This important system opposes geographical risk, which must be organically dealt with in programmes, plans and strategies that protect the landscape, prevent risks, and strengthen short-, medium- and long-term actions, also involving local Communities, integrating the vision to the different scales of intervention and projects. The Botanical Garden, seen here as an ‘Open Work’, has an important role not only because it preserves botanical specimens that come from all over the world, but because it is part of the historical and cultural heritage and because it maintains large areas of ‘nature’ in the urban environment that influence the microclimate and the perception and enjoyment of the local landscape. An equally relevant aspect dealt with here is the role of botanical gardens in relation to the population. The garden is, in fact, an open museum that protects nature and the landscape by activating environmental awareness and widespread education in neighbourhoods and schools. Keywords Civic resilience · Botanical gardens · Development · Environmental awareness · North America
17.1
Introduction: Origins of the ‘Columbian Exchange’
The chapter discusses the spreading of botanical gardens in North America, considering them an important and resilient part of the green and blue, natural, and environmental system and of the cultural heritage. The green system, the green
F. Schiavo (✉) Department of Architecture, University of Palermo, Palermo, Italy e-mail: fl[email protected] © The Author(s), under exclusive license to Springer Nature Switzerland AG 2023 S. D’Amico, F. De Pascale (eds.), Geohazards and Disaster Risk Reduction, Advances in Natural and Technological Hazards Research 51, https://doi.org/10.1007/978-3-031-24541-1_17
365
366
F. Schiavo
and blue infrastructures, should not be considered exclusively as a ‘physical network’ but as a ‘civic network’ consisting of space and public policies, the actions of private individuals (common people and stakeholders), in the long period. Analysing botanical gardens, specific open green spaces, means exploring conflicts, urban resilience, civic empowerment processes, local best practices, economic and social phenomena. Botanical gardens, which produce ‘sustainable beauty’ and ‘civic beauty’, are social and environmental landmarks, that contribute to creating cultural crossovers, bringing the population together, proposing environmental awareness and training actions. When, between 1845 and 1849, the ‘Great Famine’ (potato famine) struck Ireland and many people set sail for America, few knew that their main source of food, the potato, had originated in America and had only reached Europe after 1492. This date was—for the increasing complexity of the ecological and environmental system—a fundamental historical threshold that opened a ‘new era’, which in short gave birth to a globalised and networked planet (Toussaint 1912). From the nineteenth century onwards, the history of relations between the New and Old World underwent a significant acceleration, when ‘migrations’ became a macro phenomenon: plants, animals and diseases (Diamond 2006, 2014), and a multitude of people moved (or were moved, as far as African Americans were concerned) from Europe, Asia and Africa to America. The exchanges between the two continents gave rise to a cognitive, geopolitical, but above all biological and environmental revolution, which had multiplying effects on the cultural, social, economic, ecological fields. In addition to potatoes, beans, some varieties of squash, cocoa, tobacco, and a large number of animals, microorganisms or edible products, such as solanaceae including tomatoes, or maize, biological migrations involved an enormous number of plants that, enriching the corpus of native species (on which the American Botanical Gardens still conduct considerable research and cataloguing and conservation work), became part not only of the agrarian and urban or botanical landscape, but of the American ‘Collections’, ‘Herbaria’ and ‘Botanical Gardens’. The discovery of the Americas ushered in what, in 1972, Alfred W. Crosby in The Columbian Exchange: Biological and Cultural Consequences of 1492, calls the ‘Columbian Exchange’, which influenced urban, agrarian and ‘semi-natural’ landscapes worldwide. Before 1492, the planet consisted of two separate worlds: the Americas on one side, Eurasia, and Africa on the other. Later the ‘barrier’ fell, and the mutual exchange of plants, animals and diseases began. The uninterrupted process of hybridisation shows how economic, political, and social history must consider the flow of living organisms, both plant and animal, as decisive. This vision includes in the large and small-scale narrative of the world (and European and US) identity, ecological thinking, which is just as important for understanding transformations as the thinking of intellectuals and politicians, including Thomas Jefferson, George Washington, Carl Marx, Frederich Engels and David Ricardo.
17
Civic Resilience: Botanical Gardens in North America, Birth, Development,. . .
367
The ‘cultural and environmental’ history prompts one to cross-reference sources and search the corpus of writings of American politicians (in this case) for ideas that went beyond the traditional model both sociologically and economically. An emblematic example is the work of Thomas Jefferson who, acting at the crossroad of ‘Reason’ and ‘Nature’, played a pivotal role in both the dissemination of botanical heritage, the promotion of an urban model integrated with agriculture, and the spread of parks, promoting an agrarian and partly anti-urban policy that moved criticism to the nascent industrial system. Although Alfred W. Crosby’s interesting volume does not deal with the interrelationship between Nature and Culture exhaustively, it helps to reflect on cultural and environmental issues and their long-term effects on the overall structure, exploring the macro phenomenon of biotic exchanges between America, Europe and Asia, to which the spreading of Botanical gardens in North America is closely linked (Gambino 2011). European and Asian migrations produced both an increasing contamination and hybridisation of the botanical heritage, and a very high level of erosion and erasure of indigenous1, North American and South American cultures. Not only the real and perceived landscapes, but also the ‘philosophy’ and symbolic system of those cultures crumbled. Moreover, American Indians and South Americans were not only decimated due to political choices, but also to pathogens against which the natives themselves were not immunised (e.g. smallpox or tuberculosis).1 The discovery of the Americas had triggered ambivalences, disadvantages, and advantages: in the interchange, both Europeans and Americans benefited from some botanical and zoological introductions; on the other hand, with the interaction between the continental systems, some pre-existing balances changed drastically. An example of the ‘plant community’ concerns the American forests (Lyons et al. 2014), an intensive agriculture developed in America since the sixteenth century, and the worldwide ‘little ice age’ (which occurred between 1500 and the following two hundred and fifty years), which can also be attributed to the decline of the Native Americans, the consequent reforestation (the natives through controlled fires created prairies, changing the composition of the forest systems), the decrease in CO2 emissions, and the reduction of the greenhouse effect, resulting in lower world temperatures. A further example is related to the presence of gardens, especially in the Mesoamerican area, destroyed by colonisers. Among them was one that integrated agrarian aspects with aesthetic and curative ones, in Tenochtitlan, today Mexico City. The populous city was surrounded by a lake where there were chinampas, floating gardens, which had transformed the marshes of Lake Texcoco into farmland. Rectangular in shape (about 9 m by 91 m), they were built on rafts made of woven wooden sticks. A layer of mud and soil about one metre high was placed on this floating base. The gardens were anchored by the flexible branches of some weeping willows and had a network of canals around them to allow the
1
See: Jared Diamond’s volume, Guns, Germs and Steel: The Fates of Human Societies, offers numerous insights and original interpretative perspectives.
368
F. Schiavo
passage of canoes, constituting an area of about 9000 hectares. They were planted with maize, beans, squash, tomatoes, peppers, and flowers, including species of recognised therapeutic virtues in a geographical area where phototherapeutic-based medical science had already developed greatly (Four String Farm 2014).
17.2
Botanical Gardens
Botanical gardens, born in Italy, initially frequented and appreciated only by scholars and botanists, acquired a different role over time, opening to visitors who could acquire a significant experience made of knowledge and beauty (the knowledge of plants and the beauty of nature). Botanical Gardens also allow to investigate the theme of botanical migrations: each garden, in fact, is a hybrid universe that welcomes plants, flowers, fruits, microorganisms from all over the world. According to the ‘democracy of nature’. The birth of botanical gardens in North America is linked to numerous phenomena: the transformation and exploration of a vast and wild territory, the evolution of garden design, the development of the discipline of botany and its dissemination. The design of gardens and orchards, places where science, culture, economy and productivity, conservation, biology, society, act together, was initially influenced by European culture. Some examples: Bacon’s Castle, in Virginia, 1665, one of the first gardens with a formal design; Bartram’s Garden, in Philadelphia, known as America’s Garden Capital, the oldest botanical garden (1728); Magnolia Plantation, in South Carolina; Middleton Place, in Charleston, the oldest landscape garden in the USA (designed between 1738 and 1755); the Japanese Tea Garden, in San Francisco, 1894, the oldest public Japanese garden in America. Between the sixteenth and seventeenth centuries, a number of botanical texts predating Linnaeus were published, and while the so-called ‘colonial garden’2 was developing many gardens used a classical language of European origin proposing techniques such as ars topiaria. At the same time, new visions advanced due to the direct intervention of certain politicians, including the aforementioned Jefferson who introduced the Palladian style for his villa at Monticello, and used the ‘English’ model for the park of the villa, adopting the Serpentine Style, developed by Lancelot Brown. The landscape style gave rise throughout the United States to non-formal parks, consisting of broad lawns, where irregular groups of trees or shrubs stood out, and ponds, surrounded by belts of trees. Some European texts, such as ‘The Gardeners
2
Colonial gardens enclose a wide variety of styles, depending on the original culture and the climatic conditions of the places where they were created. Nevertheless, some similarities can be detected: small green spaces with defined borders separating the garden from the pavements; integration of beauty and practicality. Organic and vernacular, they were not organised on geometric patterns and, especially at an early stage, native plants grew there.
17
Civic Resilience: Botanical Gardens in North America, Birth, Development,. . .
369
Dictionary’ (first ed. 1731) by Philip Miller, an important English botanist, were also consulted by Jefferson himself for practical purposes (e.g. crop rotations). It can be said that the birth of the ‘Botanical Garden’ in the United States is linked to the same act of birth of the Confederation. The founding fathers, George Washington, Thomas Jefferson, and James Madison shared the dream of a National Botanical Garden. In 1816, thanks to the establishment of the Columbian Institute for the Promotion of Arts and Sciences in Washington, DC, one botanical garden was founded whose explicit mission was to collect, cultivate and distribute native and non-native plants that could contribute to the well-being of the American people. That garden, established by Congress in 1820 and located west of the Capitol, operated until 1837. In 1842, the idea of a National Botanical Garden was revived when, after the ‘Exploring Expedition to the South Sea’ (the so-called Wilkes Expedition), a huge collection of plants taken from various parts of the world was brought to Washington, DC. Initially located in a greenhouse built in 1850, the plants were moved to a new structure on the site previously occupied by the garden of the Colombian Institute. The Botanical Garden, named the United States Botanic Garden, was moved to its current location in 1933, in a vast area that includes: the Botanical Conservatory, renovated between 1997 and 2001; the National Garden, opened in 2006; and Bartholdi Park, built in 1932. Commissioned by Congress, the Wilkes Expedition, named after its commander, explored in four years the lands outside the US bordering the Pacific Ocean, at that time known as the South Sea. The outcome of the expedition was both substantial scientific publications published in 19 volumes and a corpus of plant, animal and seed samples. These, used to propagate new marketable plant species, became a substantial part of the Smithsonian Institution’s holdings. In addition to the cartographic surveys, the expedition catalogued more than six thousand plant and bird species and more than 250 living plant species, which, planted in the aforementioned greenhouse, later became the nucleus of the United States Botanic Garden. The American Botanical Gardens came into being during a period of economic stability, when cities such as Chicago and New York were gaining prominence in western society. These Botanical Gardens were already part of a cultural infrastructure that saw the American Museum of Natural History (1869), the Metropolitan Museum of Art (1870), the Metropolitan Opera Company (1883), the New York Zoological Society (1895), and the New York Public Library (1895) spring up in cities like NY. Botanical gardens greatly developed after the publication of Linnaeus’ work (the classification, the application of binomial nomenclature and his ‘Systema Naturæ’ of 1735 and 1758). The ‘Linnean revolution’, together with the renewed culture of garden design, also had a considerable influence on the ‘geometry’ of botanical plantings and the organisation of scientific arrangements. Since the very beginning, botanical gardens manifested in the United States, more than in Europe, a dual mission beyond taxonomy and collection: on the one hand, the promotion of productive aspects (collecting and increasing knowledge for economic
370
F. Schiavo
development and the welfare of the population), and on the other hand, fostering the ideal (matrices) frameworks that had been the basis of the Constitution. In this sense, the American Botanical Garden is one of the visible representations of the Constitution. Thomas Jefferson was one of the promoters of American botany; he had such a keen interest in nature (Reps 1961; Cossu 2017), plants, and gardens that he created his own park at Monticello.3 Jefferson increased the exchange of plants with overseas collectors, not least because he was ambassador of the US Confederation in France. In addition to being President of the American Philosophical Society, he promoted agriculture as a productive sector, extolling its moral value, as well as the exploration of American impressive natural resources, he owned a herbarium, and sponsored various American expeditions, such as that of Lewis and Clark, part of a set of voyages and explorations committed to acquiring knowledge and gaining resources useful for colonising territories and crossing the ‘frontier’. The evolution and enrichment of the botanical heritage was accomplished, both on a large and small scale, through numerous levels: • External explorations and those undertaken within North America • Substantial acquisitions of botanical collections, from institutes or colleges, for the purpose of building herbaria • Educational travels to the Old World, to acquire the heritage of European botanical species • The wide-ranging and minute, but often very innovative and significant actions carried out by academic scholars active ‘in the field’ or by ‘amateur’ botanists Beyond this, the formation of the great colonial empires and the settlement of colonisers in America, South Africa and Australia aroused interest in exotic, especially tropical floras. A further relevant chapter in the history of American botanical gardens is related to the creation of herbaria. Collections of great interest combine several aspects, such as representation (starting from ancient miniatures), cataloguing systems, and sciences interconnected with botany (e.g. pharmacopoeia). From a specific kind of book, herbaria have evolved into a collection of plants and portions of them, dried and scientifically classified. There is currently a (online) macro-catalogue, the Index Herbariorium, which provides access to the data of some three thousand four hundred places where 350 million botanical specimens are preserved. Since its foundation the impressive programme of territorial explorations was promoted by the first director of the Botanic garden, in the Bronx, Nathaniel Lord Britton, enabling the garden to acquire many species from the western hemisphere, as well as ‘native’ American species, from 1840 to 1853 with the expedition from Mississippi to the Pacific Ocean; that of the Great Salt Lake; the Red River in
3
An estate conceived as a courtly landscape and agricultural park, in which aesthetics and utilitas had equal value, it was rich in orchards, vineyards and a productive vegetable garden where there were numerous edible species from Europe.
17
Civic Resilience: Botanical Gardens in North America, Birth, Development,. . .
371
Louisiana; or the one of the Pacific Northwest; and in 1897 to Montana, followed by those to the West Indies and South America (Brazil, Venezuela, Guana and the Andes). The Bronx Garden also increased its holdings with the purchase of several collections of American collectors who, from 1858 to 1888, had conducted an incomparable activity in plant knowledge in the western United States. There were also considerable exchanges between American and European collectors, and some financial contributions, e.g. that of Andrew Carnegie, were crucial for the acquisition of private herbaria, such as that of Otto Kuntze (an important German botanist) in 1907. Botanic gardens were thus essential in shaping the American ‘landscape’ and culture promoting cultural and natural interchange, as well as other processes and phenomena. Besides Jefferson, there were other leading figures like: Charles Willson Peale, painter, scientist, politician, and naturalist. He is credited with establishing one of the first national botanical museums in Philadelphia, which housed botanical, natural and archaeological collections, and a collection of stuffed birds, purchased by Peale himself. In addition to Peale, Benjamin Smith Barton was a well-known botanist, naturalist and the first professor of natural sciences in the United States at the University of Pennsylvania. Barton was an undisputed innovator (his work is based on the relationships among phenomena), and one of the first scientists to treat plant habitats in current, i.e. ‘phytogeographic’ terms. Participating in several explorations and fact-finding expeditions, he developed an interest in Native American culture, highlighting interrelationships with the environment and climatic variations. In contact with European botanical culture in 1803, Barton published Elements of botany, or Outlines of the natural history of vegetables, the first American handbook of botany. To these authors should be added a long list of men and women who carried out research and practice in the field, among them: Addison Brown and John Hendley Barnhart, botanist, and biographer of numerous colleagues. From 1907 (and for the next thirty years), he was appointed librarian of the NYBG (the Bronx Botanical Garden).4 As mentioned above, Jefferson’s role was also decisive in the introduction of certain species, among them the ficus, purchased in Marseilles, which was instrumental in the propagation (by cuttings) of the species in the United States. In his Garden book (1766–1824)5, a notebook-diary in which the actions and botanical notations made at the house in Monticello were recorded (Jefferson and Betts 1944), he reflects on the delicious flavour of the fig fruit, expressing not only his passion for agriculture and gardening but for the Myth of the Elsewhere that European culture still represented. During his stay in Europe, Jefferson visited France, Great Britain, Italy, Belgium, and the Netherlands, establishing many interpersonal relations. He was deeply impressed by the style of historic Italian and English gardens that
4 5
Barnhart (1909). True (1936).
372
F. Schiavo
expressed an innovative concept, close to Jeffersonian ideas: they were villas for everyone. The numerous cultural relations, the establishment of academies and botany courses, or the foundation of ‘Botanical Gardens’ and ‘Nature Museums’, established a ‘river’ that turned the first contacts into numerous rivulets that contributed to the construction of the American landscape, to the transformation of the European landscape, while the exchange of native botanical specimens began. From America came species such as Callicarpa americana, Diospyros virginiana and Calycanthus floridus, while in North America arrived seeds of some European plants, such as Helitropium arborescens, buttercups, cauliflowers, peas, broccoli or tulip bulbs.
17.3
The Network
From the second half of the nineteenth century, a system of ‘local’ networks started and spread globally, due to the increasing contacts among collectors and gardens and when Botanic gardens began to be founded in America. That phase was characterised by a ‘turning point’ in natural history studies. In 1859, in fact, Darwin published The Origin of Species, a work that made a strong mark on the scientific system. Many clubs and societies of natural sciences and botany sprang up during that phase, while the collection, even of amateur specimens, was encouraged by technological innovations and the development of the railway network, which allowed easier access to suburban areas. While many amateur botanists were members of the clergy, upper middle-class women could also devote themselves to this socially accepted discipline. Collectors, coming from a fairly broad social background, exchanged plant specimens and engaged in bilateral exchanges of dried specimens of non-native plant species, communicating by mail. The exchange of specimens was a complex but not exhaustive network on the macro phenomenon of botanical gardens and disciplinary progress. It was also an important method of communication between scientists and amateurs: not limiting themselves to the flow of vegetal ‘objects’, in fact, the members of the network exchanged ideas, reasoned about the attributions, nomenclature, diffusion and presence of species in the territory, in other words, they built the material landscape and the ‘discourse’ on the landscape. The prevalence of empiricism over theory in the American culture highlights how acting on the environment, often for productive purposes, led scientists to privilege the system of interrelationships among phenomena. The collections, therefore, were not just botanical lists, included in the chain of emerging capitalism, but they related to the vast geography, the different climates, the fertility of the pedos, the water system or the different communities settled. Phytogeography, climate and microclimate, landscapes, local cultures, all contributed to making American botanical gardens ongoing laboratories of experimentation among nature, knowledge, science, and ethnic cultures.
17
Civic Resilience: Botanical Gardens in North America, Birth, Development,. . .
373
Some of these gardens, which have now disappeared, should be mentioned in order to highlight the changing quality of the actions carried out in the urban and suburban areas of the Confederation of States and the nature of the aims of botanical gardens. Among them, New York Elgin Botanic Garden, founded in 1801, one of the first botanical gardens in the United States, in Manhattan, was on the site where the main Rockefeller Center building was built during the 1930s. Founded by David Hosack, the Elgin Botanic Garden was dismantled after a long period of neglect. The purpose of the garden was to collect and grow native plants, initially from the United States, that had medicinal or useful properties. By 1805, the garden was home to more than 1500 species that came from all over the world, including some rare specimens provided by Jefferson. In 1811 Hosack published a catalogue titled A Catalogue of Plants Indigenous and Exotic, cultivated in the Elgin Botanic Garden, in the vicinity of the city of New-York. The volume contained a preface and a list of plants, accompanied by an index in which the species were catalogued alphabetically according to common name, and not through the Linnean binomial used in the first part of the book. The park was enclosed by a high wall, and inside, in addition to two greenhouses, there was a collection of trees, plants and shrubs. The finances of the founder, David Hosack, were not enough to maintain the Elgin Botanic Garden, so he proposed its purchase by NY State so that its original role could be maintained. The garden was acquired by the State, and remained possession of NY State until it was placed under the direction of the College of Physicians and Surgeons, which later merged with Columbia University.
17.4
Botanical Gardens in New York
In NYC an important institution is the New York Botanical Garden (not the only New York botanical garden, another one is in Brooklyn). Located in the Bronx, covering 101 hectares, it was founded in 1891, largely through the efforts of Nathaniel Lord Britton, professor of botany at Columbia University, and his wife, Elizabeth Gertrude Knight, prominent botanist, and research pioneer. Inspired by the Kew Royal Botanic Gardens in London, visited by the Brittons on their honeymoon, the botanists began the process that led to the founding of the first garden in NYC. The richness of the botanical heritage, as well as the network of exchanges between botanical institutions and academies (Europe/America)6, which already characterised the disciplinary field, prompted Nathaniel and Elizabeth to start a
6 An example of such an exchange was the relationship between Joseph Hooker, one of the most important botanists of Victorian England, and Asa Grey, professor of natural history at Harvard, two authorities of the 19th century. Accessible through reading the correspondence that the botanists sent to each other, the exchange shows both insights into the progress of natural history studies and some scientific paradigms on the global distribution of flora, the analysis of it also based on the interpretation and reception of Darwin’s writings.
374
F. Schiavo
funding campaign by asking for support from magnates such as Andrew Carnegie, John Pierpont Morgan and Cornelius Vanderbilt II. The Botanical Garden was located in the Bronx and between 1870 and 1880, after Central Park (in Manhattan) and Prospect Park (in Brooklyn), many American cities were also acquiring public gardens on the initiative of some social reformers, urban planners and landscape architects, as well as some real estate speculators (Schiavo 2017). In 1887, J. Mullay, a journalist at the New York Herald published The New Parks Beyond the Harlem: Nearly 4000 Acres of Free Playground for the People in which, analysing the demand for parks in the city, he showed how public parks could be built in suburban areas now incorporated into the Great City of New York. The book set out a vision for the Bronx, a less desirable borough with a lower location rent than Manhattan, and rich in large estates of influential families. In 1884, New York State adopted Mullay’s ‘plan’, so when Nathaniel Lord Britton and Elizabeth Gertrude Knight sought a site for the Garden (Susan 2012), local government officials offered the two hundred and fifty acres of what had by then become the ‘Bronx Park System’ (which also included Bronx Park, opened around 1880). F. L. Olmsted and C. Vaux produced the first design for the Botanic Garden, but Vaux’s death in 1895 interrupted the design work, which was later taken over by Britton himself, assisted by Samuel B. Parsons Jr. and John Brinley. Opened to the public in 1900, the New York Botanical Garden in the Bronx was characterised by the policy of its first Director, Britton, who promoted a programme of botanical explorations that is still active today, with studies carried out initially in South America, with specific focus on the rainforests of the Atlantic coast of Brazil, in the foothills of the Andes, and in other continents. Today, the Bronx Botanical Garden is one of the leading centres of botanical and floristic research in the United States. It owns a plant collection of about 12,000 species from almost every part of the world; some specimens are displayed throughout the year in a winter garden covering almost half a hectare. The garden also houses one of the largest botanical libraries in the country and a herbarium of 5700 dried specimens. Various educational programmes, some involving the use of these facilities, are offered to the public (Holmgren et al. 1996; Lavoie 2013; Groom et al. 2014).
17.5
Botanical Gardens and the City
The United States is rich in botanical gardens and often the plants that are present and widespread even in urban areas, such as cherry trees, are evidence of passages, selections or political ties, such as those between America and Japan for many years in close relationship (the gift of cherry tree seeds dates back to 1912). An example of this relationship is the large number of cherry trees found in some botanical gardens and used as street trees in large cities, such as New York City or Washington, DC. Beyond the language barrier, in the Gardens every visitor can experience aesthetics, ideals and values communicated simply through the beauty of nature and the integration of native, naturalised and allochthonous plants into the botanical
17
Civic Resilience: Botanical Gardens in North America, Birth, Development,. . .
375
heritage. The Brooklyn Botanic Garden also has a history of pragmatic determination, which characterises the transformation of the US territory: the area of the Botanic Garden was, in fact, a dump. Its creation was decided in 1897, before the establishment of the Great New York (in 1898, with the unification of the Five Boroughs) and the Botanical Garden opened in 1911. It consists of a large area (21 hectares) and boasts a vast collection built up over time. As is always the case with botanical gardens, especially intra-urban ones, the Brooklyn Botanic Garden also played an important role by limiting land consumption, acting on the micro-climate, fighting geographical risk factors and protecting the landscape. The garden area, close to Prospect Park, the important urban park designed by F. Olmsted and C. Vaux (designers of Central Park), would become a busier area, both from a residential and a manufacturing point of view. The first director of the Brooklyn Garden was Charles Stuart Gager7, who also designed it. The original aim of the garden was to conserve native plants in an initial collection that was gradually enriched and supported by a new ‘design’ of the landscape architect Harold Caparn. The latter, who taught ‘Landscape architecture’ at Columbia University, together with Ferruccio Vitale and Charles Wellford Leavitt, established a ‘Degree programme’ for that branch of the discipline. The current mission of the Brooklyn Botanic Garden, shared with the other national gardens and conceived in full integration with the primary task of enriching the ‘collections’, is to connect people to the world of plants, an intent that guides the work of awareness, participation, and intervention, in line with the most progressive American culture.
17.6
The Botanical Garden: An Urban Artwork
The current purpose of American botanical gardens, common everywhere on the planet—to be a living museum that interacts with cities and informing residents and visitors about the irreplaceable importance of plants—has a substantial root in the ‘vision’ that Thomas Jefferson and George Washington themselves had already conceived more than two centuries ago. That vision was focused on the myth of progress which, taking its cue at an early stage from European ‘classicism’, aimed at the integration of production and welfare. Aim pursued between ideas and events, between aesthetics, culture, colonialism, external and internal migrations, definition
7 Charles Stuart Gager too contributed to the development of American gardens, and to the teaching of botany in the United States. He studied at Syracuse. He taught at Rutgers University, New York University, and directed the New York Botanical Garden in Brooklyn, where he remained for over thirty years. In addition to a number of systematic works, he published his findings on the effects of radium on plants. In contact with many other colleagues, including Nathaniel Lord Britton and his wife Elizabeth, Gager contributed to the consolidation of the discipline and the dissemination of ‘best practices’ that have increasingly seen botanical gardens establish themselves as urban players in the participation and the culture of sustainability.
376
F. Schiavo
of cultural and landscape identity, economics, conservation, and extension of the plant heritage, today understood from an ecological perspective. The current action of the Botanical Gardens in the country, while preserving the founding mission and the associated system of values and objectives, has taken on a leading role in the promotion of ‘best practices’ in strong connection with inhabitants and visitors, in other words, with the social and cultural aspect of the city (Jacobs 1992) (Vergou and Willison 2013). The original ‘mission’ of botanical gardens (from cataloguing, to scientific intentions, to fruition) has been transformed, also with reference to the mutation that museum structures have experienced in recent years. Museums are in fact elective places of cultural production and preservation focusing on: ‘culture’, its fruition, production, and communication. The material and cultural heritage; the role of people in a broad space of flows, in where individuals no longer access as ‘passive’ spectators, but as active participants and proponents. The original function of botanical gardens places knowledge and understanding of the plant world in relation to habitats and climate among their primary objectives. Between the useful and the symbolic, Gardens have collected, catalogued, organised the universe of plants with intents that over time have changed, specialised, and become more and more structured over time (Pignatti 2011). Nineteenth-century museums were founded on a traditional and largely outdated paradigm, and they envisioned a detachment between ‘work of art’ and ‘user’, nowadays seen more as a ‘participating witness’ and an ‘agent’ of that heritage. This leaves the boundary of the structure that houses it and ‘overflows’ into the city, overcoming even the important pedagogical function, today radically renewed. The ‘border’ that used to limit museums has disappeared, and not only because of the virtual accessibility to educational tools, images, and information about the collections, but because of the idea of network and system. This is also achieved through community ‘participation’ in urban governance and management, and through strengthening the interrelationship between structure and people and structure and city: the city as a whole is a heritage in itself. A Complex, alive and evolving organism, made up of history, memory, ideas, objects, practices, water, flora and fauna, subjects in action and mutual interrelation. If it is possible to consider Botanical Gardens as museums, it must be said that they are among the most atypical, vital and fragile of the existing ones. They are in fact ‘Open Works’ that, especially in this historical phase, express the values and critical issues the planet must face. These include geographical and environmental risks, in comparison with the persistence of certain energy consumption patterns; the climate issue; biodiversity; environmental sustainability; and finally, the integration of ‘differences’ (Rescha et al. 2016). Being a powerful ‘acclimatisation garden’ and a ‘bridge’ between places and cultures, the garden shows and teaches us how different species can ‘migrate’, ‘acclimatise’ and ‘share’ the same place. Thus, creating a joint and exemplary laboratory of experimentation and coexistence between biotic and cultural differences. In addition to its didactic and ‘natural’ value the botanical garden perhaps more than a garden, has a strong political, social, and symbolic role. Born from an intentional act, it tells us what passage, migration
17
Civic Resilience: Botanical Gardens in North America, Birth, Development,. . .
377
and integration among different but equal in value ‘beings’ are. It is also a place where one can explore and question the possible balance between a domesticated nature and ‘natura naturans’, considered in a more secular way. The Agora of Plants shows us how and what balance, mediation and conflict are in a space where there are limited resources and a remarkable biodiversity. In fact, the botanical garden potentially welcomes plants from all over the planet, organises, catalogues, conserves and protects them from a democratic viewpoint that goes beyond mere listing; it ‘resolves’ competitions, reflects on locations and origins, and explores symbiosis, going beyond the protection/valorisation binomial and transcending the simple aesthetic vision, enriched by a biological and cultural background. Visible and invisible life in botanical gardens tells, as previously mentioned, an ‘environmental bio history’, which contains economic and social ‘narratives’, through a pathway from which one can trace back to the cultural processes that promoted and accompanied the very birth of the garden. In addition to being a scientific apparatus, the botanical garden moves imagination and emotions, allows mediated access to distant geographic locations, causes a reduction in anthropocentric self-referentiality, limits land consumption in urban areas, acts on the microclimate, as well as on urban rent, on the perception of the urban landscape, interacts with performative actions on the local and global landscape, influencing even those aspects that, beyond mere perception, concern production systems and global and local economies. An organism of vast civic potential, one of the most significant urban public spaces in which the experience of sharing and sociality demands care for the place and the development of ‘strategies’ addressed to the natural system. The Garden, which stirs a deep emotion that one feels in front of nature, makes the dialogue between people and natural aspects real on an empirical level. This dialogue can activate environmental awareness and become a promoter of widespread ‘best practices’ on a territorial and urban scale, from neighbourhood to botanical garden networks, promoted on an international level; this because the Garden is an active institutional actor from a micro-local to a global scale (also by promoting the network of cooperation and exchange between botanical Gardens around the world). Botanical Gardens are an interface, therefore, both with the environmentally conscious culture of ‘city dwellers’ and with the environmentally conscious culture of ‘planet dwellers’. If properly managed and if in connection with the city and the territory, they activate a plurality of pathways: • For the interpretation of cultural and natural heritage, so that the visitor can develop ideas, concepts, projects • For science communication that aims at the spread of science among ordinary people, going beyond the mere knowledge of data, referring instead to key issues such as climate change seen from an inter- and trans-disciplinary approach • For evaluation and research, which aim to share and exchange experiences in order to understand the aims of the planned projects by providing training with pilot modules for educators
378
F. Schiavo
• For the social role as a vital element in the transformation of the botanical gardens’ task, also acting on inclusivity • For participatory approaches, previously conceived as passive processes, now differently intended, to give people a voice, offering content and implementing new skills, breaking down barriers between scientific institutions and people • For inquiry-based science education, focused on developing skills through practice, exploration, questioning, and as a tool for scientific literacy The Garden provides access to the botanical history of places, in comparative terms. By observing specific historical and environmental ‘photographs’—catalogues, annotated lists, the scientific heritages contained and incrementally constructed by Gardens and Herbaria—it is possible to reflect on the ‘flows’ and changes in the flora in urban and agricultural areas, making visible the ways in which botanical heritage is constructed, through the system of local flora, made up of allochthonous and autochthonous species, in relation to climate and geo-historical dynamics. The transit of some species from the Garden to the city shows, for example, how some introductions have become urban heritage, trees and shrubs that are now planted in avenues and public spaces, in some gardens and parks.
17.7
Actions in the Garden
Why call the Garden an open work? As U. Eco (1962) and R. Barthes (1967) state, the open work leads to and allows multiple interpretations, mediated by the ‘readers’ who, as conscious interpreters can participate in a network of relations and connections that gradually develop, generating a free and incremental response and a ‘productive programme’ in which work, and subjects are called upon to interact reciprocally. Stressing the integration between plants and cultural, anthropic, aesthetic and architectural elements in a botanical garden, it is useful to reflect on the transformation of the initial mandate, looking at the garden as a mirror of cultural evolution and as an opportunity to think about numerous topics, from the political to the social, from the environmental to the economic ones. Architecture in botanical gardens also represents the intimate dialogue between culture and nature. They play a symbolic role and reflect the evolution of current scientific paradigms interwoven with the very mission of the Garden. They also place designers before empathy, a fundamental requirement for designing a garden that sidesteps the rules of architecture and brings to an agreement with the mutable strategies of nature.
17
Civic Resilience: Botanical Gardens in North America, Birth, Development,. . .
17.8
379
Some Experiences, in Europe and America
At present, many botanical gardens act in a network, basing their actions on the ‘core concept’ of ‘biodiversity’, incorporating the directives of the Action Plan for Botanic Gardens in the European Union (Cheney et al. 2000), implemented by the BGCI, the Botanic Gardens Conservation International, an organisation representing botanical gardens in more than one hundred countries worldwide. Established in 1987 in the UK, the Action Plan aims at plant conservation, protecting biodiversity and empowering its members and the community. Its mission is to mobilise botanical gardens and involve partners in ensuring plant diversity for the well-being of people and the planet. The BGCI guidelines currently have a target year, 2050 while the plan is structured through leadership and sponsorship actions, the implementation of innovative and strategic projects, coordination, and development actions for plant conservation in botanical gardens and in a planetary society and provision of funding, defining general objectives that aim to establish a deep equal dialogue between culture and nature, between nature and people. Comparing the actions (education, dissemination, visitor involvement, interaction with the ‘city’) carried out by European and American gardens it is shown that, while sharing some common goals, there are different strategies for achieving shared objectives. In America, bottom-up initiatives are more rooted in common practice, and this entails both a greater capacity for proposals on the part of the inhabitants, and a greater capacity on the part of the institutions to promote and accommodate the emerging planning, learning from it, and encouraging reciprocal interaction. This provides feedback among different actors and increases the creative imagination of people who gain more confidence about the realisation of a proposal or a project. In the European context, the 2000 Action Plan for Botanic Gardens in the European Union (APBG) has outlined a renewed mission aimed at education, didactics, outreach and communication between people and botanical gardens, stating that botanical gardens are places where a new environmental culture is formed, addressing different subjects, from institutions to individuals, with a ‘lifelong learning’ approach. Although it proposes a strategic scheme structured in points (in this sense, too, the comparison with what has been implemented in some American cities, where the articulation is more fluid, becomes more stimulating), the Plan (APBG) is of considerable interest and lists more than thirty objectives, grouping the numerous functions of the Gardens into six main points and indicating the actions to be carried out. From promoting research, to facilitating access to information, to the protection of biodiversity seen in terms of conservation, according to a sustainable approach (Cinà and Di Iacovo 2015; Cinà 2016; Reynolds and Cohen 2016), seeking to involve, in addition to citizens and cultural operators, various economic and institutional players. An interesting point is the promotion and consolidation of the role of botanical gardens as major centres of ‘horticultural expertise’ and of cultural heritage and
380
F. Schiavo
tourism, showing how the polarising function of the Garden is deeply combined with a centrifugal function: fascinating place for tourists, ‘common good’ for citizenship (as well as visitors) it can indeed be understood as a place where a symbolic and planned imaginary is formed to be translated into actions at different levels. In this sense, the extent to which Gardens can act as cultural and participatory catalysts is evident, especially if guidelines are established in order to encourage visitors and citizens to become proponents. One of the six main functions, ‘Education, training and awareness’ is based on three basic, networked elements, ‘education, training and awareness’, the real change of certain behaviours in the population, which, in contact with the richness of the Garden, fascinated by its ecological beauty, involved in participatory projects, can discover, and strengthen their environmental awareness and their imaginative and planning ability. The Action Plan for Botanic Gardens has promoted in many European gardens various actions aimed at involving schools and inhabitants with methods that often attempt to go beyond traditional didactics. Through the upsidedown of conventional methods, knowledge is not directly transferred as a mere notion, but rather by activating an exchange based on play and experience. The emotion-based learning is recurrent, which is strongly induced in places such as the Gardens, where one has access to an engaging world that can be explored in ‘non-formal’ terms, through the emotional sphere of individuals, arousing empathy towards nature, which not only amazes but also takes on an active role that leads to changes in the way one observes and interacts with nature. Starting from such impact, the actions promoted can induce virtuous behaviours not directly related to the plant world, such as cycling to school, recycling waste, building objects from discarded elements, experimenting with alternatives regarding food (an aspect that is more developed in the United States). Observing and ‘cohabiting’ with plants allows the subjects involved to take a journey to distant and unknown places, to transform themselves into explorers who, by looking at the plant world, discover objects, actions, interactions, rituals that are formed around plants, including the culture of food that characterises the (in fieri and contaminated) identity of the contexts (Feuerbach 2017). Didactics based on emotions and empirical experiences lead to more in-depth skills that result in a greater ability to observe, recognise and be aware of the complex concepts of biodiversity and the environment. It is in this regard that The International Agenda for Botanic Gardens (Wyse and Sutherland 2000), the international ‘policy framework’ for botanical gardens aimed at the conservation of biodiversity, involving the public, emphasise how a garden can be an elective promoter of environmental protection and civic values. It is useful to point out some recurring themes, from food to climate, to the promotion of biodiversity, to the formation of environmental awareness. Objectives aimed at the involvement and training, conceived in ‘formal’ and ‘informal’ terms, and at the development of a ‘community’ consciousness based on experiences to be carried out not only in the Garden, but also in the urban environment. Such as the ‘Communities in Nature’ project, active in the UK, which aims to enhance the social
17
Civic Resilience: Botanical Gardens in North America, Birth, Development,. . .
381
role of gardens, to activate, with the local community, collective issues of social and environmental relevance, promoting ecological responsibility. The enhancement of the social and environmental role of the Garden conducted both through the identification of themes and a participatory approach shows how the nineteenth-century museum has been surpassed and rethought, renegotiating its relationship with society and the individuals that make it up. Society itself is conceived as a culturally heterogeneous system: the knot of ‘cultural diversity’ to which the biodiversity of the plant world, protected, promoted and truly accessible in the Gardens, corresponds, becomes a challenge for botanical gardens committed to pursuing the involvement of a human multitude that has a point of aggregation in the Gardens. This not only requires action on the physical ‘barriers’ of access to the heritage and a work aimed at involving a large group of people that is sometimes difficult to reach: welcoming people and making them feel respected is the first step in conveying a system of shared social and environmental values on a planetary dimension. These challenging goals push towards training programmes for new professional figures, able to interact with the public, through projects that intersect several levels, from universities to schools to the botanical gardens themselves. The twentieth century marked a turning point in museum didactics and in some of the regulations of gardens, while the reduction in public financial support prompted the development of entertainment activities, botanical exhibitions, music, theatre, or film, organised by the institution and with the participation of volunteers. This makes it clear how the objectives, themes and strategies, the paths developed and supported by the numerous workshops, have changed at the same time. Often held outdoors, they are intended to make nature known up close, addressing a broad audience, from children to senior citizens and tourists. In order to gain a comparative understanding of the two realities, the European and the American one, it is useful to explore some of the actions promoted by the American Public Gardens Association, which is far ahead in terms of participation and fund-raising. The Association launched, among many others, a project called ‘Engagement, Outreach, & Education’, which aims at the interconnection between the Botanic Gardens and the local community, involving people and supporting biodiversity and cultural and natural resilience. Empowering the community, welcoming its ideas and increasing its capacity for participation, has led to the launch of a number of projects. Among them, one carried out in Detroit since 2014, for young gardeners who cultivate vegetables within their neighbourhoods, introducing healthy eating behaviours and environmental awareness (WK Kellogg Foundation 2014). Challenges for future responsibilities in a changing world see Botanic Gardens as active focal points also for horticulture, an important area for plant conservation and biodiversity and for nutrition-related behaviour. Combining the ability to explore diversity in the plant world, the new idea of biodiversity conservation involves the integration of more traditional methods and new technologies, as well as the active involvement of citizens, engaged in monitoring, cultivating, new experimental teaching, and promoting specific actions and projects.
382
F. Schiavo
Science of and to citizens and citizens as ‘researchers’ (Kruger and Shannon 2000) is a vision that comes from viewing knowledge not as an elitist condition, and citizens not as passive subjects, but as subjects who, from their initial role as volunteers, become participating actors and co-authors in the processes of interpretation and monitoring, ‘bearers’ of nature in the city. Considering that in the relationship between local and global, residents have a special knowledge and a bond with the places. In this respect, the New York Botanical Garden in the Bronx (NYBG) has recently launched a project: ‘Citizen Science’, which relies on the contribution of volunteers working alongside with the technical and scientific staff. Participants are included in training courses, and they suggest and follow projects to acquire skills for the management of herbaria or botanical collections. The NYBG has launched the programme: #plantlove. A recent event featuring programmes, projects, and exhibitions to explore the connection between plants, the environment, and people. In parallel with Citizen Science, a Citizen Science Day was held on 13 April 2019 (repeated in 2020 and 2021) to raise awareness among volunteers about key issues, again focusing on experience and specific actions. In addition to the countless initiatives (such as: Earth Day Weekend, Brazilian Modern: The Living Art of Roberto Burle Marx, Annual New York City EcoFlora Conference, Chorus of the Forest, Kiku: spotlight on Tradition) promoted by the Bronx Botanic Garden, mention should be made of the Edible Academy. Opened in 2018 at the Botanical Garden and featuring a small park where edible plants are cultivated; it has one main objective: to promote healthy eating habits in the city. The issue concerns the entire United States, where awareness is fairly weak, there is a high rate of obesity and related diseases, and where there is poor access to fresh vegetables and fruit (Fraser et al. 2012). The borough where the NYBG is located, the Bronx, is one of the areas with the highest rate of food insecurity in the country, but as numerous studies have shown, children who grow and harvest their own vegetables are more likely to develop healthy behaviours and eat fresh vegetables and fruit. The principles learned in the Garden can result in long-lasting skills, not only for the residents involved in the district, but for the inhabitants of NYC as a whole. The building that houses the Edible Academy was designed by Cooper Robertson, using sustainable technologies, while the children’s gardening programme renews an existing plan established in 1956 to offer kids a chance to connect with nature. The new facility can accommodate one hundred thousand people a year and is supported by the City Public Administration and policies of the city, which are also aimed at putting the issue of food at the centre, together with health, management, and well-being. The Academy combines new technologies with traditional practices, using a vernacular architectural language, green roofs, geothermal wells, solar energy systems, composting. It consists of vegetable gardens, classroom buildings and kitchens, one of which can be set up on a covered terrace above the Bronx River and the Thain Family Forest, the largest remaining forest in NYC. There is also an
17
Civic Resilience: Botanical Gardens in North America, Birth, Development,. . .
383
amphitheatre that can host three hundred and fifty people and an educational greenhouse that provides the best climatic conditions for the seedlings before they are planted in the Garden.
17.9
Conclusion
As Simon (2010) reports, at the end of 2009, the National Endowment for the Arts published a data-rich report on museum attendance in the United States. This report shows that the audience in museums and art galleries has decreased. The predominant one is white and over-aged. Museum institutions, therefore, face a challenge: to convey civic and cultural content with effective communication techniques in a transformed world that confronts users, especially young people, with easier and more flexible forms of access and communication. How can a museum, in this case a Botanical Garden, relate to people? Involving people as ‘cultural participants’ and making the institution itself central to community life? The institution thus intended should: • ‘center itself’ on the audience, without disregarding its original task • conceive the idea that visitors construct their own meaning from their own cultural experiences, • conceive involvement projects together with the users, listening to them, establishing real feedback in the development of the projects themselves, creating a ‘design community’. A community botanical garden is a common good where visitors can imagine, invent, share, propose, interconnect. Participatory actions are not intended to replace traditional techniques, but to complement them, placing the institution and people on a horizontal level. Each Botanical Garden, therefore, should respond to visitors’ ideas and requests, involving them in the organisation of the institution, develop projects in which visitors can share ideas and connect with each other, offering experiences that can also be done at low cost, listen to and introject people’s stories and voices to increase relations and to convey the cultural and natural principles of the Gardens, understanding the vision of the users and their different interpretative perspectives, invite users to participate, plan explicit opportunities for dialogue and interpersonal exchange, think of spaces and creative and playful actions to share and produce knowledge, to discuss what cultural heritage is and what knowledge network is open and induced by botanical heritage. The model, which considers visitors as participants, collaborators, co-authors, is not based on a uni-directional idea, but is more centred on an empirical approach in which the interacting people themselves are called upon to propose, imagine and concretely perform, developing a new socially and ecologically sustainable behaviour.
384
F. Schiavo
Outside a corporate logic based on supply and demand or on simple, though very useful, educational workshops, the knot lies in the co-participation of inhabitants and visitors, both through virtual tools, but above all through the experience that—from the ‘thought’ about the Garden, from the visit to the Garden, from the reading of verbal or visual ‘texts’ (not only specialised but above all evocative, literary or cinematographic) and from the quality of the place itself, and from the actions promoted by the structure—can set off a system of bottom-up proposals in which citizens, individuals, inhabitants, visitors, producers, small local economies, schools, are real proponents of ideas, paths, projects. A system in which creative imagination, desires, visions of institutions and people can all converge towards common values. While finding the transformation of the gardens’ mission, linked to the dissemination and involvement of users, stimulating, it is worth reflecting on the subtle relationship between the accessibility and the preservation of cultural and ‘natural’ heritage. This leads to a critical attitude towards the most recent models. Starting from the concept of ‘care’, and aware that the Garden, as a unique map of the world, is priceless, it is important to prevent the access and dissemination project from being trivialised. In metaphor, the botanical Garden can be considered, like the whole Earth, a Temple. The sacred space of the temple is a common good that promotes conscious care that nurtures sacredness. Conscious care, if introjected, has civic, social, political, emotional value, not only with regard to the garden, but to the city and the planet. It is from such a circle that a deep-rooted awareness can arise that goes beyond the mere environmental component. And it is in this sense that the Botanical Garden, made of nature and steeped in the city, also has a political as well as a social function. It is, in fact, a specific form of Agora, the agora of plants, in which people and flora, people and fauna, people and Nature coexist in a mediated balance. The Botanical Garden has specific characteristics capable of inducing such fruitful interaction. Made of living matter that transforms itself, the Botanic Garden is a place of outdoor experience; in the urban context, it is a living place that ‘feels’ the presence of attentive and aware people, that perceives and lives the changing climate and seasons, that integrates a precious and common good, water, indispensable together with the other elements: air (wind), earth, fire (symbolised by the action of the sun and heat). Everything exists in and for plants which, unlike the works of art in museums, are not static artefacts, but live in their own, sometimes fragile, sphere of nature of which people are part. Seen in this light, the botanical garden, therefore, by offering us a gift—being a space of nature in the city—shows us the relationship between empathy and competition, accustoms us to ‘care’, leading us to observation and integration among differences. It thus pushes us towards an understanding of the ‘democracy’ of plants, offering us a cultural model, a lesson in civilisation in the natural world. The garden in this sense can teach us about the possible relationship with the environment and the landscape, not as something else, but as an intrinsic value within the community of people. It can show us what the relationship between people themselves might be,
17
Civic Resilience: Botanical Gardens in North America, Birth, Development,. . .
385
among difference, sharing, integration, between biological reason and historically rooted paths of culture.
References Barnhart JH (1909) Some American botanists of former days. Torreya 9(12) Barthes R (1967, trad. it. 1988) Il brusio della lingua. Saggi critici IV. Torino, Einaudi Cheney J, Navarro J, Wyse JP (eds) (2000) Action Plan for Botanic Gardens in the European Union, National Botanic Garden of Belgium. Volume 19, 2000 Cinà G (2016) Per una nuova alleanza città-campagna. Considerazioni sulla recente attività del gruppo “Sustainable food planning” dell’AESOP. Archivio di studi urbani e regionali, XLVII, n. 116, FrancoAngeli, Milano Cinà G, Di Iacovo F (2015) Integrating top-down policies and bottom-up practices, Urban and Periurban Agriculture: an Italian dilemma. Future Food J Food Agric Soc 3(1) Cossu M (2017) Il mito americano della Natura. Treccani, il tascabile. https://www.iltascabile.com/ scienze/mito-natura-america (access: Sept. 2019) Diamond J (2006) Armi, acciaio e malattie. Breve storia del mondo negli ultimi tredicimila anni. Torino, Einaudi Diamond J (2014) Collasso. Torino, Einaudi Eco U (1962) Opera aperta. Forma e indeterminazione nelle poetiche contemporanee, Milano, Bompiani Feuerbach L (2017) L’uomo è ciò che mangia. Bollati Boringhieri, Torino Four String Farm (2014) The Floating Gardens of the Aztecs. Heritage Farming. https:// fourstringfarm.com/2014/04/01/the-floating-gardens-of-aztecs/ (access: Jun. 2019) Fraser LK, Clarke GP, Cade JE, Edwards KL (2012) Fast food and obesity. A spatial analysis in a large United Kingdom population of children aged 13–15. Am J Prevent Med 42(5) Gambino M (2011) Alfred W. Crosby on the Columbian exchange. Smithsonian Magazine. https:// www.smithsonianmag.com/history/alfred-w-crosby-on-the-columbian-exchange-98116477/ (access: Jun. 2019) Groom QJ, O’Reilly C, Humphrey T (2014) Herbarium specimens reveal the exchange network of British and Irish botanists, 1856–1932. N J Bot 4(2) Holmgren PK, Kallunki JA, Thiers BM (1996) A short description of the collections of The New York Botanical Garden Herbarium (NY). Brittonia 48(3) (Jul–Sep) Jacobs J (1992) The death and life of great American cities, Vintage Books. Random House, New York Jefferson T, Betts EM (eds) (1944) Thomas Jefferson’s Garden Book 1766–1824. Kessinger Legacy Reprints, Philadelphia Kruger LE, Shannon MA (2000) Getting to know ourselves and our places through participation in civic social assessment. Soc Nat Resourc 13(5). https://www.tandfonline.com/doi/abs/10.10 80/089419200403866 (access: May 2019) Lavoie C (2013) Biological collections in an ever-changing world: herbaria as tools for biogeographical and environmental studies. Perspect Plant Ecol Evol Syst 15 Lyons PW, Leahy JE, Lindenfeld L, Silka L (2014) Knowledge to action: investigating implicit knowledge production models held among forest science researchers. Soc Nat Resourc 27(5). https://www.researchgate.net/publication/262575790_Knowledge_to_Action_Investigating_ Implicit_Knowledge_Production_Models_Held_Among_Forest_Science_Researchers (access: May 2019) Pignatti S (2011) Gli Orti Botanici Universitari. In: (a cura di) Capanna E, Malerba G, Vomero V, Museologia Scientifica Memorie, N. 7/2011, Musei Scientifici Universitari, Una grande risorsa culturale da valorizzare, Accademia Nazionale dei Lincei, Roma
386
F. Schiavo
Reps JW (1961) Thomas Jefferson’s Checkerboard Towns. J Soc Archit Hist 20(3) Rescha E, Bohnea AR, Kvamsdalb T, Lohnea J (2016) Impact of urban density and building height on energy use in cities, SBE16 Tallinn and Helsinki Conference, Build Green and Renovate Deep. 5–7 October 2016, Tallinn and Helsinki Reynolds K, Cohen N (2016) Beyond the Kale: Urban Agriculture and Social Justice Activism in New York City. University of Georgia Press, Georgia Schiavo F (2017) Piccoli giardini. Percorsi civici a New York City. Castelvecchi, Roma Simon N (2010) The Participatory Museum (book on line, open access) http://www. participatorymuseum.org/read/ (access: May 2019) Susan F (2012) Nathaniel Lord Britton Records (1875–1934). New York Botanical Garden, Retrieved 5 Toussaint A (1912) Europe et Amérique (Nord-Est): flores comparées comprenant tous les genres européens et américains, les espèces communes aux deux contrées, naturalisées et cultivées/par l’abbé Toussaint. Hermann, Paris True RH (1936) A Record of Thomas Jefferson’s Garden (1766–1824). Massachusett Historical Society, Philadelphia, American Philosophical Society Vergou A, Willison J (2013) Communities in Nature: Growing the Social Role of Botanic Gardens. Calouste Gubelkian Foundation, https://www.bgci.org/wp/wp-content/uploads/2019/04/ CommunitiesinNatureEvaluationReport.pdf (access: May 2019) WK Kellogg Foundation (2014) Edible Schoolyard New Orleans spreads its roots across the city educating children and families about healthy eating. W. K. Kellogg Foundation, https://www. wkkf.org/what-we-do/featured-work/edible-schoolyard-new-orleans-spreads-its-roots-acrossthe-city (access: May 2019) Wyse JP, Sutherland LA (2000) International Agenda for Botanic Gardens in Conservation, Botanic Gardens Conservation International, UK. https://www.bgci.org/files/All/Key_Publica tions/interagendaeng2580.pdf (access: Apr. 2019)
Chapter 18
Measuring Willingness to Pay for Community-Based Resilience Training in the Southeast USA Wesley Wehde
Abstract Community-based resilience programs are a key part of the United Nations Disaster Risk Reduction program. In general, the cost–benefit and economic analyses of such programs are conducted after the fact. Additionally, these analyses typically focus on more easily estimable costs and benefits related to infrastructure and less to quantifying the costs and benefits of “soft resilience” like individual training or preparedness. To address these limitations, a survey-based contingent valuation (CV) method is used which focuses on individual willingness to pay (WTP) for community-based resilience training. Specifically, a single-bound, dichotomous choice design was administered through an online survey to a sample of 667 residents of Tennessee, North Carolina, and Virginia. Preliminary estimates suggest a mean WTP for a five-week community-based resilience training between $42 and $135 per individual in a one-off payment. Individual factors such as perceptions of community resilience, and demographics such as income level and home location are associated with the likelihood of being willing to pay. When aggregating to the adult population of these states, the estimated value of the described program ranges between $183 million and $1.09 billion. The more conservative assumption that trained individuals provide value to their personal and professional networks results in a total value of the program between $1.22 and $3.93 million. Given the low cost of implementing such a program, even these lower total values suggest a high potential benefit–cost ratio. Policymakers in charge of improving disaster resilience and risk reduction may consider collaborative, community-based resilience training as both a publicly desired and cost-effective option. Keywords Community resilience · Disaster Risk Reduction · Willingness · Southeast US
W. Wehde (✉) Department of Political Science, Public Administration Program, Texas Tech University, Lubbock, TX, USA e-mail: [email protected] © The Author(s), under exclusive license to Springer Nature Switzerland AG 2023 S. D’Amico, F. De Pascale (eds.), Geohazards and Disaster Risk Reduction, Advances in Natural and Technological Hazards Research 51, https://doi.org/10.1007/978-3-031-24541-1_18
387
388
18.1
W. Wehde
Introduction
Community-based resilience programs are a key priority of the Sendai Framework for 2015–2030 and the United Nations Office for Disaster Risk Reduction (UNDRR). Under the Sendai Framework, disaster risk reduction measures to improve resilience should be collaborative with a primary role for government across levels, the private sector, and local stakeholders (UNDRR 2015). Evaluations of the framework in the scholarly and policy literature are extensive and generally positive, suggesting programs for disaster risk reduction and building community resilience have high benefit-to-cost ratios (Mechler 2016). In general, the cost– benefit and economic analyses of such programs are conducted after the fact. Additionally, these analyses typically focus on more easily estimable costs and benefits related to infrastructure and less to quantifying the costs and benefits of “soft resilience” like individual training or preparedness (Shreve and Kelman 2014; Mechler 2016). In order to address these limitations, a survey-based contingent valuation (CV) method, commonly employed in economics research, is used. This method focuses on individual willingness to pay for a described product, in this case a community-based resilience training program. Specifically, a single-bound, dichotomous choice (SBDC) online survey was administered to a sample of 667 residents of Tennessee, North Carolina, and Virginia. This method can be conducted prior to implementing a program, can focus on soft resilience benefits, and relies on community public perceptions in estimating value. Another benefit of this method is its relatively low cost. Preliminary estimates suggest a mean willingness to pay (WTP) for a five-week community-based resilience training between $42 and $135 per individual in a one-off payment. Individual factors such as perceptions of community resilience, and demographics such as income level and home location are associated with the likelihood of being willing to pay. When aggregating to the adult population of these states using the lower bound of mean WTP, the estimated value of the described program ranges between $183 million and $1.09 billion. However, considering the semi-private nature of the good, only a small number of the population will be trained, the total value may be much smaller. Under the assumption that trained individuals provide value to their personal and professional networks, a more conservative estimated value of the program ranges between $1.22 and $3.93 million. Given the low cost of implementing such a program, even these lower total values suggest a high potential cost–benefit ratio. Policymakers in charge of improving disaster resilience and risk reduction may consider collaborative, community-based resilience training as both a publicly desired and cost-effective option. In the following section, I first review existing economic analyses of community-based resilience programs. I then describe the contingent valuation (CV) method, including its strengths and weaknesses. This segues into a description of the specific survey instrument and CV experiment used. I then describe the results of this analysis,
18
Measuring Willingness to Pay for Community-Based Resilience Training. . .
389
focusing first on determinants of WTP and then on estimating reasonable bounds around the average WTP. Finally, I conclude with the limitations of this research and a discussion of policy implications and directions for future research.
18.2
Review of Economic Analyses of Community-Based Resilience Programs
A recent systematic review suggests disaster resilience programs benefits typically outweigh their costs (Mechler 2016). Ratios of benefits to costs depend highly on specific projects and contexts but Mechler (2016) suggests the average ratio, across a set of rigorous studies reviewed, is approximately four to one. Others have suggested higher ratios of $7 to $15 dollars saved for every $1 spent on disaster preparedness (Healy and Malhotra 2009). Thus, it is clear government investment in preparedness and resilience is highly effective at ultimately saving money and lives. Miao and co-authors (2018) note that, despite these patterns, local transit managers primarily adapt to extreme weather ex-post as opposed to ex-ante. It is also clear existing mitigation and ex-ante investments are inadequate; as Gall and Friedland (2020) point out, even if mitigation efforts save $6 for every $1 spent, far too few dollars are being spent on mitigation in the state of Louisiana to address current levels of disaster damages. Looking into cost–benefit analyses (CBA) of disaster resilience and reduction more specifically reveals a few key patterns. First, Shreve and Kelman’s (2014) assessment of these studies suggests CBA are most commonly done for flood risks at the community level, specifically. Some have started to examine the economic impacts of resilience and mitigation at the state level as well (Gall and Friedland 2020); however, broader analyses at a national level are the least common and primarily conducted on meteorological systems (e.g., Lazo et al. 2009). Educational costs and benefits were valued in two studies in Shreve and Kelman’s (2014) review through the post-disaster disruption and loss of education not through education to reduce risk and as a potential benefit (see Venton 2010; Mechler 2005). Both systematic reviews noted that programs related to soft resilience, that is not infrastructure based, remain under-valued and more difficult to study (Shreve and Kelman 2014; Mechler 2016). One study by Eucker et al. (2012) found that the creation of community groups, in the aftermath of disaster, increased resilience to both major and minor disaster. This “soft” resilience dimension was considered the foundation for the benefits provided from all other “hard” resilience interventions like direct provision of assets such as boats or new vegetable seeds. Previous research also suggests intersectoral collaboration, between nonprofits and government agencies, provides significant value in the disaster recovery process (Eller et al. 2018). While not explicitly quantified, Venton and Venton (2004) find that the creation of escape plans and subsequent education about the plans reduced the number of
390
W. Wehde
lives lost and injuries experience in the Dharbanga District of Bihar in India. Effects of training on empowerment and self-perception were also important. What evidence that exists for the benefits of disaster preparedness, including training and capacity building, Mechler (2016) deems to be of medium quality. Another limitation of existing CBA of disaster resilience and reduction efforts is a lack of consideration for distributional dimensions, equity and transparent and adequate stakeholder involvement (Kull et al. 2013). In the following section, I describe an approach to benefits estimation called contingent valuation that addresses many of these shortcomings.
18.3
Why Use Contingent Valuation for Valuing Community-Based Resilience Programs
Contingent valuation (CV) methods belong to a larger category of economic studies often called stated preference studies. These methods typically rely on surveys to value difficult-to-monetize goods or changes like certain policies or environmental goods (Boardman et al. 2017). Contingent valuation is a specific form of study, typically a survey, though contingent valuations can be conducted through interviews and focus groups as well. Contingent valuations can range in complexity from direct elicitation to complex experiments. These methods, as all do, have certain benefits but also certain drawbacks. Beginning with their drawbacks, many economists criticize the reliance on stated, as opposed to revealed preference. This criticism has been largely addressed by studies using CV methods as irrelevant where revealed preference either does not exist or is difficult to observe. Related to this stated preference drawback is that of the hypothetical nature of CV and survey methods (Champ and Bishop 2001). These methods rely on a description of a hypothetical good in order to elicit WTP. Due to being hypothetical the exact nature of the good is not known. Thus, researcher descriptions must be detailed enough to be realistic to respondents without being too vague, likely leading to overload and overestimates of respondent WTP (Morrison and Brown 2009). How respondents will hypothetically pay for the good in description is another important researcher choice. Payment vehicles should be realistic and respondents should believe their responses have a meaningful say in whether or not the good will be provided, that their input is consequential (Wehde et al. 2021). On the other hand, the benefits of CV methods are especially important for informing policy decisions and programs before they are implemented. These types of analyses can be used as inputs into decision processes as opposed to simply as evaluations of decisions already made. Contingent valuations studies can be adapted to elicit values for more than one potential hypothetical as well (Jones et al. 2018). Thus, this type of study can be used when there are many potential paths of action. Additionally, they are useful for public goods, often provided by government, where there is no market to observe preferences. Contingent valuation studies are also good for estimating both use and non-use value, which public goods
18
Measuring Willingness to Pay for Community-Based Resilience Training. . .
391
and programs often have (Jenkins-Smith et al. 2016). Use value comes from someone using a particular service or good while non-use value comes from any other avenue, often existence. Existence value is the idea that people value the existence of something, say a government program, even if they themselves do not personal benefit. These benefits also reveal why CV methods are especially useful for studying community-based resilience programs. These programs are often provided freely by governments, in collaboration with other actors, making market analyses inadequate. Additionally, these programs can vary widely in their level of community involvement and focus on training, preparedness, and infrastructure. Thus, there are many potential decisions to be made when designing community-based resilience programs; each of these decisions or dimensions could be systematically valued using these techniques (Carlson et al. 2019). Finally, these programs likely have use and non-use values. Certainly, individuals or communities who participate in them will benefit and likely assign them value. If this was the only avenue of value, then market analyses of existing programs offered, and their prices, by institutions of higher education, nonprofits and for-profit training companies would suffice. However, members of the community who do not participate may value them for their existence and how they improve the resilience of others. People outside a particular community may also value these programs for their increases in resilience as they relate to general altruistic preferences or even existence preferences for tourism or travel.
18.4
Contingent Valuation Estimation and Design
The data for this project come from an online survey of adult members of the public in three states: Tennessee, North Carolina, and Virginia. Respondents (n = 667) were contacted and recruited by Qualtrics with quotas for gender, age, and rural/ urban location. Location was used to ensure adequate representation of rural respondents which is an especially important element of vulnerability to natural hazards (Horney et al. 2013). Importantly, previous research has shown that online surveys using quota-based samples produce results, specifically in the context of CV studies, that are similar to phone, in-person, and mail surveys (Berrens et al. 2003; Li et al. 2004; Lindhjem and Navrud 2011). Table 18.1 presents descriptive statistics for the respondents for demographic and attitudinal variables. Approximately 14% of the sample is Hispanic; 81% is white and 53% is female. The average age is almost 48 years old and most respondents live in either a suburban (41%) or rural (33%) setting with the remaining 26% reporting living in an urban area. The average income is between $25,000 and $75,000 and the average education is between some college and no degree or an associates/2 year degree. The average respondent also reports a political ideology somewhere between middle of the road and slightly conservative.
392
W. Wehde
Table 18.1 Descriptive statistics Statistic Ideology Hispanic Education Income White Female Age Suburban Rural Experiences scale Connection & Caring Resources Transformative Potential Disaster Management Information and Communication Table 18.2 Willingness to pay question proportions
N 660 666 665 665 666 667 667 664 664 667 667 664 665 666 665
Mean 4.21 0.14 4.63 2.97 0.81 0.53 47.7 0.41 0.33 3.64 3.73 3.58 3.59 3.70 3.62
Yes: Free Yes: At reasonable cost Yes: At randomized cost
St. Dev. 1.85 0.35 1.86 1.78 0.39 0.50 17.5 0.49 0.47 1.77 0.89 0.86 0.88 0.89 0.87
N 666 666 667
Yes 0.49 0.34 0.22
Min 1 0 1 1 0 0 18 0 0 0 1 1 1 1 1
No 0.20 0.29 0.56
Max 7 1 8 7 1 1 93 1 1 8 5 5 5 5 5
Not sure 0.31 0.37 0.22
Table 18.1 also provides the distributions for natural hazard experiences and perceptions of community resilience. The mean of the experiences scale suggests the average respondent has experienced between 3 and 4 of the natural hazards possible. Each of the dimensions of disaster resilience was created by taking the average of the component survey measures for the dimensions as described in Pfefferbaum et al. (2015). The question wordings for the measures of disaster resilience, as well as the experiences scale, income, education, and ideology are in the Appendix. As Table 18.1 demonstrates, respondents rated relatively high levels of disaster resilience for their communities on average. The highest levels of resilience were found for the connection and caring dimension (Cronbach’s alpha = 0.90) followed by disaster management (Cronbach’s alpha = 0.88) and information and communication (Cronbach’s alpha = 0.84). Slightly lower levels of disaster resilience were observed for transformative potential (Cronbach’s alpha = 0.93) and resources (Cronbach’s alpha = 0.88). All five dimensions had high internal reliability as demonstrated by the various Cronbach’s alpha statistics. In Table 18.2, I present the distributions of the willingness to pay measures. Specifically, respondents were asked a series of three questions. The first stated: Researchers at universities across the region including East Tennessee State University in collaboration with state and local officials are working on building a Resilience Training Academy for members of the public such as yourself. This Training Academy would include
18
Measuring Willingness to Pay for Community-Based Resilience Training. . .
393
five weeks of training sessions in the evening, dinner provided at each session, which would seek to empower members of the public to be resilience leaders in their neighborhoods and communities. The training sessions would help participants define resilience and identify key vulnerabilities for improving resilience. Participants would be trained in skills such as survey design and data collection to track public preferences for resilience to disasters, geographic information systems software and techniques to conduct flood and other hazard risk analyses, grant-writing for resilience projects, as well as other valuable skills. Participants would also be offered networking opportunities to connect to relevant non-profits and community leaders in their areas. If this sort of training were available for free in your area, would you take part in in it?
Respondents were then asked, “If this sort of training were available in your area for a reasonable cost, would you take part in it?” Finally, the respondents were asked the specific valuation question which stated, “If this sort of training were available in your area for $(random number from uniform distribution between: $25–500) would you take part in it?” As Table 18.2 demonstrates, even if the training were offered freely less than half of respondents report a willingness to take part in the resilience training described. The proportion of yes responses decreases to approximately 34% of respondents willing to take part when asked if the training were offered at a reasonable cost. Finally, only 22% of those surveyed responded yes when presented with a random dollar amount between $25 and $500. Finally, after the valuation questions, respondents were asked, “On a scale from zero to 10, where zero means not at all certain and ten means completely certain, how certain are you that you would pay [dollar amount previously shown] for the fiveweek training program described?” This certainty question can be used to recode the valuation question to account for the possibility of hypothetical bias, as described in the previous section (Champ et al. 2009; Morrison and Brown 2009). Results from analyses using recorded valuations responses are available in the Appendix (See Appendix Fig. 18.5). Figure 18.1 plots the shown price of the Resilience Training against the probability that the respondent answered yes to the valuation question. Both other responses, “No” and “Not sure,” are coded as zero, providing a conservative estimate of WTP (Johnston et al. 2017). The figure demonstrates the key economic, negative relationship between price and willingness to pay for the good, providing an important validity check of the contingent valuation study. In the following section, I describe the empirical strategy used to estimate mean WTP estimates for the training.
18.5
Estimation Strategy for WTP
The first step in estimating willingness to pay is the fitting of a logistic regression model on the valuation question. This allows the researcher to estimate the probability of accepting the bid, that is paying the price assigned to the good, from which an individual willingness to pay function can be estimated. Linking functions which cannot take on negative values are often used, because of the assumption that WTP is a positive, non-zero value. The equation for estimating the probability to answer yes
394
W. Wehde
Fig. 18.1 Predicted probabilities (95% confidence intervals) of yes response to valuation question across range of training costs
to the estimation question, using a log-logistic distribution, comes from Bishop and Heberlein (1979) and is presented in Eq. (18.1) below: Py ðt Þ =
1 expð - α þ β lnðt ÞÞ
ð18:1Þ
Specifically, we estimate the probability to accept P yat bid, or price t. The values for α, the intercept, and β, the coefficient on the bid amount, are estimated using a logit model—following Aizaki et al. (2014) who apply the models of Carson and Michael Hanemann (2005) and Hanemann and Kanninen (1999)—with the following log-likelihood function from Eq. (18.2): lnL =
N [ X n=1
{ dn ln
}] } { 1 1 þ ð1 - dn Þ ln expð - α þ βt n Þ expð - α þ βt n Þ
ð18:2Þ
In Eq. (18.2), dn is equal to 1 for “yes” responses to the valuation question and equal to zero for “no” and “not sure” responses to the valuation question at price tn.
18
Measuring Willingness to Pay for Community-Based Resilience Training. . .
395
This functional form allows for researchers to include covariates, other than the randomized assigned price, to assess their relationship with the probability of responding “yes” to the valuation question. This is specified in the calculation of the α value as follows: α=γ þ
K -1 X
γk Xk
ð18:3Þ
k=1
where Xk, k = 1,. . .,K-1, are the individuals’ characteristics, γ k are the corresponding parameters that measure the effect of these characteristics on utility changes, and γ is the constant term. In the current study, Xk includes covariates for basic demographics such as age, sex, race, ethnicity, income, and education. I am also interested in how experiences with natural hazards and perceptions of community resilience may shape demand for community-based resilience training. Therefore, I estimate models that include measures of these concepts as covariates as well. Finally, having laid out how the logit model for the contingent valuation is set up to estimate individual willingness to pay functions, a summary measure must be calculated. This can either be a mean or median willingness to pay. For the purposes of this project, I calculate the adjusted, truncated mean WTP from Boyle et al. (1988) using the following equation: t max [
Z MeanWTP = 0
] 1 - F ðt Þ dt F ðt max Þ
ð18:4Þ
where F(t) is the cumulative log-logistic distribution function of the WTP and tmax is the highest bid in the survey. The truncated, adjusted mean is used because the absolute value of β, the coefficient on the bid amount, is less than zero and the predicted probability of responding “yes” never reaches zero, even at the maximum cost.
18.6
Parameter Estimates for Explanations of Being WTP
Figure 18.2 plots the model output for the relationships between demographic factors, and experiences with natural hazards, and the probability of responding yes to the valuation question. First, it is important to note the negative coefficient on the logged cost variable—reflecting the results of Fig. 18.1 and the economically expected relationship between cost and willingness to pay. Figure 18.2 also reflects economic logic regarding income—respondents with higher incomes are more likely to respond yes to the valuation question than those with lower incomes. Similarly, as education increases, so does the likelihood that an individual responds positively to the valuation question. On the other hand, being female, older, and living in a suburban or rural area (relative to those living in an
396
W. Wehde
Fig. 18.2 Model 2 marginal effects at mean independent variable values (95% confidence intervals)
urban area) are factors associated with a lower predicted probability of responding yes to the valuation question. The marginal effect at the mean for home location is largest with reductions in the predicted probability of responding yes to the valuation question being 0.13 and 0.12 for suburban and rural respondents, relative to urban ones, respectively. Importantly, having experience with more types of natural hazards is not associated with the likelihood of replying yes to the valuation question. Next, I estimated the same model as in Fig. 18.2 and included the perceptions of community resilience scales. These effects are visualized in Fig. 18.3. The substantive and statistical results from the demographic model remain in the demographic plus perceptions of community resilience model, as demonstrated in Fig. 18.3. Of the five dimensions of community resilience, two result in statistically significant marginal effects at the mean. First, the dimension Pfefferbaum et al. (2015) have named connections and caring is negatively associated with a “yes” response to the valuation question. This means respondents who more strongly agree with statements like “People in my community feel like they belong to the
18
Measuring Willingness to Pay for Community-Based Resilience Training. . .
397
Fig. 18.3 Model 3 marginal effects at mean independent variable values (95% confidence intervals)
community” and “People in my community help each other out” are less likely to be willing to participate in or pay for community-based resilience training. On the other hand, respondents who view their community has having transformative potential are more likely to respond yes to the valuation question. Measures in the transformative potential dimension include questions such as “My community looks at its successes and failures so it can learn from the past” and “My community has priorities and sets goals for the future.” Having examined what individual demographics and dimensions of community resilience perceptions are related to being willing to pay, the next section presents estimates of mean WTP and potential aggregation strategies for estimate overall benefits or value program.
398
18.7
W. Wehde
WTP Estimates and Aggregation
Using Eq. (18.4) and the results from the logit models presented in the previous section, as well as a model with no covariates (Model 1), mean WTP estimates were calculated and are presented in Fig. 18.4. The confidence intervals in Fig. 18.4 were estimated using the procedure proposed by Krinsky and Robb (1990). These estimates in Fig. 18.4 suggest the mean WTP ranges from just under $80 to over $135, depending on the covariates included in the model. Because the hypothetical bias is almost exclusively upward, respondents will report paying more than they would in an actual market, non-parametric estimates which are even more conservative were calculated. Specifically, I calculated the Kaplan–Meier mean estimate using the technique proposed by Kriström (1990). This estimation technique results in a mean WTP of $42.00. With that range of mean WTP estimates, one can aggregate up to a total potential value, or benefits, of the program. One important step in this process is aggregating to the appropriate population. For this project, there are a few potential relevant populations. The largest would be the entire populations of the three states sampled: Tennessee, Virginia, and North Carolina. One could also aggregate to just adult populations in these states or the proportion of the adult population in these states that would respond “yes” to the valuation question. These techniques are typically
Fig. 18.4 Truncated (at maximum bid), adjusted Mean WTP estimates with 95% confidence intervals
18
Measuring Willingness to Pay for Community-Based Resilience Training. . .
399
done for public goods that all could, potentially, benefit from. Using the total population as the basis for aggregation and the lowest mean WTP estimate from the nonparametric estimation, leads to a total value of almost $1.09 billion dollars. If we assume only adults can benefit, then we arrive at a total value of just over $847 million. Further, only 22% of respondents said yes to the valuation question, incorporating this information results in an aggregated value of $183 million. These numbers are calculated to illustrate the potential for high value if such a training could be made almost universally available, an unlikely feat. While the proposed community-based resilience training could be provided by the government, such as through local universities as the description states, it would not be a public good in that the benefits of its provision would be limited. However, for the proposed program, the question of exactly how many people would benefit is difficult to answer. First, one needs to determine how any individuals could participate in the program. This number could easily range from as low as 25 to 150 or more and also would depend on how frequently the program was offered. To be conservative, I will assume only 25 individuals can be trained at a time but the training will be offered quarterly. Thus approximately 100 individuals would be trained yearly through the proposed program. This number could be used to calculate the total possible value of the program yearly. However, training for communitybased resilience is designed to create positive externalities. Specifically, those who are trained would be able to provide indirect benefits to members of their communities or networks. Thus, we must estimate the size of individuals networks. Research comparing network estimation techniques on nationally representative samples of the US has found the average network size is approximately 291 people (McCarty et al. 2001). One could easily argue that positive externalities would only affect a smaller, more core network or that positive externalities could affect a larger, geographically situated neighborhood network. Thus, this average network size is used to estimate an aggregate value or benefit of the program, assuming it directly trains 100 individuals per year. Thus, we multiply the mean WTP ($42) by those trained (100) by the estimated average network size (291) to result in a lower bound estimate of just over $1.22 million per year. Using the highest mean WTP estimate, I find a potential total value of over $3.93 million per year. These estimates are much more conservative and realistic and therefore are significantly more useful for policy discussions, regarding a community-based resilience program such as the one described.
18.8
Discussion
The present study is subject to a few limitations that are important to note. First, the sample size, while larger than samples in many similar studies, is still relatively small. Thus, there is some uncertainty in the WTP measurements. Additionally, the study relies on a sample of only three states. It is unclear how the study’s results regarding mean WTP with a national sample or in other states might differ. The
400
W. Wehde
states chosen for this study experience most natural hazards present in the United States nor are they particularly extreme in their exposure, such as Gulf or West Coast states with higher levels of exposure. Thus, we might expect that these results would generalize well across the US or at least represent a conservative estimate. Members of the public in those more hazard-prone areas may be more or less willing to pay, on average. Future research can examine how larger and more diverse samples respond to WTP exercises for community-based resilience trainings such as this. Importantly, a good description was written to avoid potential cognitive overload to respondents and focus on specific, trainable skill sets. However, community-based resilience training is of course more complex than one paragraph of description can allow. Additionally, dinner for each session is included in the description to reduce the costs associated with individual participation. However, this means the value captured may be driven by these stated provided dinners, as much as any other attribute. Future research should experimentally manipulate the specified attributes to see which are most strongly driving valuations of the training program. Finally, this study took a WTP approach to valuing community-based resilience and resilience training. One alternative to this would be a willingness-to-accept (WTA) approach. This would be especially relevant in communities for which levels of resilience are relatively clear and thus changes from that baseline are simple to construct. This is especially relevant for high-resilience communities where shifts of resources away from resilience might actually be preferable. Having addressed these limitations, it is important to recognize the innovations this project represents in valuing resilience and resilience training. First, the use of stated preference, contingent valuation methods allows for greater understanding of the benefits of such a program before its implementation. Additionally, this study confirms and extends previous research demonstrating the significant value of investment in community resilience and pre-disaster training (Venton and Venton 2004; Mechler 2005, 2016; Eller et al. 2018). Costs of creating and offering such a program would likely be approximately $100–150K based on recent training costs estimates (Holtz-Eakin and Lee 2019; Freifeld 2020). Thus, the benefit-to-cost ratio ranges from 8.2 to 39.2 which is in line with estimates in published research of BCA (Shreve and Kelman 2014; Mechler 2016). Given the most conservative estimates are often preferred, a benefit–cost ratio of 8.2 is still substantial and is similar to estimates in highly cited research on disaster preparedness and resilience (Healy and Malhotra 2009; Mechler 2016). However, in line with Gall and Friedland (2020), even these levels of investment in resilience may be inadequate to address the needs of communities frequently and severely affected by natural hazards.
18.9
Conclusion
This research suggests there is increased demand for community-based resilience training from individuals who live in urban areas. This is important because urban areas often experience the most devastating effects of natural hazards. Additionally,
18
Measuring Willingness to Pay for Community-Based Resilience Training. . .
401
providing training opportunities in urban areas will be easier to reach larger populations. That is not to say that training is not valued in rural areas nor that they do not experience devastating effects. However, it may suggest that if resources are to be prioritized these programs can be offered in urban areas first. Additionally, communities that are future focused and have transformative potential will be most open to community-based resilience training. Communities that are more insular, with higher levels of connection and caring resilience may be less open to these sorts of training. Finally, this research demonstrates that there is significant public support for and willingness to pay for community-based resilience training, in general. If the program were offered freely, just under half of respondents reported being willing to participate with only 20% being entirely unwilling to participate. Our estimates suggest that mean WTP for a five-week community-based resilience training program ranges from $42 to just under $135. When using the most conservative aggregation process, assuming only participants and their direct networks benefit, the total value of the program ranges between $1.2 and $3.9 million, per year. This results in a benefit-to-cost ratio of 8.2 which is in line with previous research and suggests substantial room for investment in programs such as the one described. Even if start-up costs for the program are much higher, training programs, once established, are relatively easy and cost-effective to offer again in the future. Specifically, these sorts of programs have significant diminishing marginal costs for each additional training program offered. Community-based resilience training offers a low-cost, high-value policy option for increasing resilience and reducing natural hazards’ risks with substantial public support.
Appendix Experiences scale created by summing responses to the following question: Please select all of the following natural hazards that you have experienced. □ □ □ □ □ □ □ □
Flooding (1) Hurricanes (2) Extreme snow or ice storms (3) Drought (4) Extreme heat waves (5) Tornadoes (6) Wildfires (7) Severe thunderstorms (8) What is the estimated annual income for your household in 2019:
○ Less than $25,000 (1) ○ At least $25,000 but less than $50,000 (2) ○ At least $50,000 but less than $75,000 (3)
402
W. Wehde
Fig. 18.5 Mean WTP for Model 3 (all covariates) with dependent variable recoded to certainties of 70%, 80%, and 90%
○ ○ ○ ○
At least $75,000 but less than $100,000 (4) At least $100,000 but less than $125,000 (5) At least $125,000 but less than $150,000 (6) $150,000 or more (7) What is the highest level of education you have COMPLETED?
○ ○ ○ ○ ○ ○ ○ ○
Less than high school (1) High school/GED (2) Vocational or Technical Training (3) Some college; NO degree (4) 2 year degree/Associate’s degree (5) 4 year degree/Bachelor’s Degree (6) Master’s degree (7) PhD/JD (Law)/MD (8)
On a scale of political ideology, individuals can be arranged from strongly liberal to strongly conservative. Which of the following categories best describes your views? ○ Strongly liberal (1) ○ Liberal (2) ○ Slightly liberal (3)
18
○ ○ ○ ○
Measuring Willingness to Pay for Community-Based Resilience Training. . .
403
Middle of the road (4) Slightly conservative (5) Conservative (6) Strongly conservative (7)
Please rate your level of agreement or disagreement with the following statements: ORDER RANDOMIZED
Connections and caring scale items People in my community feel like they belong to the community. People in my community are committed to the well-being of the community People in my community have hope about the future. People in my community help each other out. My community treats people fairly no matter what their background is.
Resources scale items My community supports programs for children and families My community has resources it needs to take care of community problems (resources include, for example, money, information, technology. Raw materials, and services) My community has effective leaders People in my community are able to get the services they need People in my community know where to go to get things done
Transformative potential scale items
Strongly disagree (1) ○
Somewhat disagree (2) ○
Neither agree nor disagree (3) ○
Somewhat agree (4) ○
Strongly agree (5) ○
○
○
○
○
○
○
○
○
○
○
○
○
○
○
○
○
○
○
○
○
Strongly disagree (1) ○
Somewhat disagree (2) ○
Neither agree nor disagree (3) ○
Somewhat agree (4) ○
Strongly agree (5) ○
○
○
○
○
○
○
○
○
○
○
○
○
○
○
○
○
○
○
○
○
Strongly Disagree (1)
Somewhat disagree (2)
Neither agree nor disagree (3)
Somewhat agree (4)
Strongly agree (5) (continued)
404
W. Wehde
Transformative potential scale items My community works with organizations and agencies outside the community to get things done People in my community communicate with leaders who can help improve the community People in my community work together to improve the community My community looks at its successes and failures so it can learn from the past My community develops skills and finds resources to solve its problems and reach its goals. My community has priorities and sets goals for the future Disaster management scale items My community tries to prevent disasters. My community actively prepares for future disasters. My community can provide emergency services during a disaster. My community has services and programs to help people after a disaster.
Information and communication scale items My community keeps people informed (for example, via television, radio, newspaper, Internet, phone, neighbors) about issues that are relevant to them. If a disaster occurs, my community provides information about what to do.
Strongly Disagree (1)
Somewhat disagree (2)
Neither agree nor disagree (3)
Somewhat agree (4)
Strongly agree (5)
○
○
○
○
○
○
○
○
○
○
○
○
○
○
○
○
○
○
○
○
○
○
○
○
○
○
○
○
○
○
Strongly disagree (1) ○
Somewhat disagree (2) ○
Neither agree nor disagree (3) ○
Somewhat agree (4) ○
Strongly agree (5) ○
○
○
○
○
○
○
○
○
○
○
○
○
○
○
○
Strongly disagree (1) ○
Somewhat disagree (2) ○
Neither agree nor disagree (3) ○
Somewhat agree (4) ○
Strongly agree (5) ○
○
○
○
○
○
(continued)
18
Measuring Willingness to Pay for Community-Based Resilience Training. . .
Information and communication scale items People in my community trust public officials. I get information/communication through my community to help with my home and work life.
405
Strongly disagree (1) ○
Somewhat disagree (2) ○
Neither agree nor disagree (3) ○
Somewhat agree (4) ○
Strongly agree (5) ○
○
○
○
○
○
References Aizaki H, Nakatani T, Sato K (2014) Stated preference methods using R. CRC Press Boardman AE, Greenberg DH, Vining AR, Weimer DL (2017) Cost-benefit analysis: concepts and practice. Cambridge University Press Boyle KJ, Welsh MP, Bishop RC (1988) Validation of empirical measures of welfare change: comment. Land Econ 64(1):94–98 Berrens RP, Bohara AK, Jenkins-Smith H, Silva C, Weimer DL (2003) The advent of Internet surveys for political research: a comparison of telephone and Internet samples. Polit Anal 11 (1):1–22 Bishop RC, Heberlein TA (1979) Measuring values of extramarket goods: are indirect measures biased? Am J Agric Econ 61(5):926–930 Carlson D, Ripberger J, Wehde W, Jenkins-Smith H, Silva C, Gupta K, Jones B, Berrens R (2019) Benefit-cost analysis, policy impacts, and congressional hearings. J Benefit-Cost Anal 10(1): 65–94 Carson RT, Michael Hanemann W (2005) Contingent valuation. Handb Environ Econ 2:821–936 Champ PA, Bishop RC (2001) Donation payment mechanisms and contingent valuation: an empirical study of hypothetical bias. Environ Resour Econ 19(4):383–402 Champ PA, Moore R, Bishop RC (2009) A comparison of approaches to mitigate hypothetical bias. Agric Resourc Econ Rev 38(2):166–180 Eller WS, Gerber BJ, Robinson SE (2018) Nonprofit organizations and community disaster recovery: assessing the value and impact of intersector collaboration. Natural Hazards Rev 19(1):05017007 Eucker D, Bolte P, Fitri Rahmadana M (2012) The long road to resilience. Impact and cost-benefit analysis of community-based disaster risk reduction in Bangladesh. International Federation of Red Cross and Red Crescent Societies: Geneva, Switzerland Freifeld L (2020) Training industry report. Training Magazine. Available at https://pubs.royle.com/ publication/?m=20617&i=678873&p=24 Gall M, Friedland CJ (2020) If mitigation saves 6PerEvery 1 spent, then why are we not investing more? A Louisiana perspective on a national issue. Natur Hazards Rev 21(1): 04019013 Hanemann WM, Kanninen B (1999) The statistical analysis of discrete response CV data. In: Bateman IJ, Willis KG (eds) Valuing environmental preferences: theory and practice of the contingent valuation methods in the US, EU, and developing countries. Oxford University Press, New York, pp 302–441 Healy A, Malhotra N (2009) Myopic voters and natural disaster policy. Am Polit Sci Rev 103(3): 387–406
406
W. Wehde
Horney JA, Nguyen M, Cooper J, Simon M, Ricchetti-Masterson K, Grabich S, Salvesen D, Berke P (2013) Accounting for vulnerable populations in rural hazard mitigation plans: results of a survey of emergency managers. J Emerg Manag 11(3):205–211 Holtz-Eakin D, Lee T (2019) An analysis of federal training programs. American Action Forum Jenkins-Smith HC, Carlson D, Gupta K, Jones B, Ripberger J, Wehde W, and Berrens R (2016) Estimating non-use values for alternative operations of the Glen Canyon Dam: an inclusive value approach. Prepared for Department of Energy. Benefit-cost analysis, policy impacts, and Congressional hearings 93 Johnston RJ, Boyle KJ, Adamowicz W, Bennett J, Brouwer R, Cameron TA, Michael Hanemann W et al (2017) Contemporary guidance for stated preference studies. J Assoc Environ Resour Econ 4(2):319–405 Jones BA, Berrens RP, Jenkins-Smith H, Silva C, Ripberger J, Carlson D, Gupta K, Wehde W (2018) In search of an inclusive approach: measuring non-market values for the effects of complex dam, hydroelectric and river system operations. Energy Econ 69:225–236 Krinsky I, Leslie Robb A (1990) On approximating the statistical properties of elasticities: a correction. Rev Econ Stat 72(1):189–190 Kriström B (1990) A non-parametric approach to the estimation of welfare measures in discrete response valuation studies. Land Econ 66(2):135–139 Kull D, Mechler R, Hochrainer-Stigler S (2013) Probabilistic cost-benefit analysis of disaster risk management in a development context. Disasters 37(3):374–400 Lazo JK, Morss RE, Demuth JL (2009) 300 billion served: sources, perceptions, uses, and values of weather forecasts. Bull Am Meteorol Soc 90(6):785–798 Li H, Berrens RP, Bohara AK, Jenkins-Smith HC, Silva CL, Weimer L (2004) Telephone versus Internet samples for a national advisory referendum: are the underlying stated preferences the same? Appl Econ Lett 11(3):173–176 Lindhjem H, Navrud S (2011) Are Internet surveys an alternative to face-to-face interviews in contingent valuation? Ecol Econ 70(9):1628–1637 McCarty C, Killworth PD, Russell Bernard H, Johnsen EC, Shelley GA (2001) Comparing two methods for estimating network size. Hum Organ 60(1):28–39 Mechler R (2016) Reviewing estimates of the economic efficiency of disaster risk management: opportunities and limitations of using risk-based cost–benefit analysis. Nat Hazards 81(3): 2121–2147 Mechler R (2005) Cost-benefit analysis of natural disaster risk management in developing countries. Working paper for sector project. ‘Disaster Risk Management in Development Cooperation’, GTZ, Berlin Miao Q, Feeney MK, Zhang F, Welch EW, Sriraj PS (2018) Through the storm: transit agency management in response to climate change. Transp Res Part D: Transp Environ 63:421–432 Morrison M, Brown TC (2009) Testing the effectiveness of certainty scales, cheap talk, and dissonance-minimization in reducing hypothetical bias in contingent valuation studies. Environ Resour Econ 44(3):307–326 Pfefferbaum B, Pfefferbaum RL, Van Horn RL (2015) Community resilience interventions: participatory, assessment-based, action-oriented processes. Am Behav Sci 59(2):238–253 Shreve CM, Kelman I (2014) Does mitigation save? Reviewing cost-benefit analyses of disaster risk reduction. Int J Disaster Risk Reduc 10:213–235
18
Measuring Willingness to Pay for Community-Based Resilience Training. . .
407
United Nations Office for Disaster Risk Reduction (UNDRR). Sendai framework for disaster risk reduction 2015–2030. In: UN world conference on disaster risk reduction, 2015 March 14–18, Sendai, Japan. Geneva: United Nations Office for Disaster Risk Reduction; 2015. Available from http://www.wcdrr.org/uploads/Sendai_Framework_for_Disaster_Risk_Reduction_201 5-2030.pdf Venton CC, Venton P (2004) Disaster preparedness programmes in India: A cost benefit analysis. Humanitarian Practice Network (HPN) Venton CC (2010) Cost benefit analysis for community-based climate and disaster risk management: synthesis report. Tearfund, London Wehde W, Ripberger JT, Jenkins-Smith H, Jones BA, Allan JN, Silva CL (2021) Public willingness to pay for continuous and probabilistic hazard information. Natur Hazards Rev 22(2):04021004
Chapter 19
Where There Is Smoke: Normalizing Community Preparedness and Geohazard Resilience: A Wildfire Perspective Rachel Westcott
Abstract This chapter includes some of the author’s previously published original research. The opportunity to present this research in a different format to a new audience is welcomed, particularly given the urgent need to provide people with new preparedness tools. Given the extent and frequency of extreme weather events occurring almost as a global continuum, the more that can be done to mitigate risk and build resilience, the better. The need to equip people and communities with the confidence and ability to prepare and protect themselves and the people and places they hold dear, requires a suite of achievable, practical, and inexpensive options from which they can choose. Therefore, this chapter draws upon this author’s previously published and cited work that outlines preparedness and risk reduction strategies that have the potential not only to save physical lives, but as well reduce the psychological trauma, anguish and heartache that can destroy people years after the ravages of a disaster. The reference list below contains the original source of earlier publications. Keywords Wildfire · Preparedness · Mitigation · Fire-fitness · Resilience
19.1
Introduction
Climate change is the biggest public health risk of the twenty-first century. Severe weather events are the new normal—but we can save human life, reduce psychosocial trauma and everything that goes with it (including the massive costs) by normalizing preparedness in the community. Disaster Risk Reduction (DRR) practitioners can help by providing people with a range of practical strategies to normalize their preparedness, coupled with a basic understanding of the underlying etiology driving their decision-making. This facilitates achievement of desirable
R. Westcott (✉) Western Sydney University, Sydney, Australia e-mail: [email protected] © The Author(s), under exclusive license to Springer Nature Switzerland AG 2023 S. D’Amico, F. De Pascale (eds.), Geohazards and Disaster Risk Reduction, Advances in Natural and Technological Hazards Research 51, https://doi.org/10.1007/978-3-031-24541-1_19
409
410
R. Westcott
outcomes to change behavior and decision-making to favor more considered outcomes with less risk. Future natural hazards are likely to increase in severity and frequency due to climate change (Intergovernmental Panel on Climate Change (IPCC) 2021; Steffen et al. 2017). For this reason, a greater knowledge-base is urgently needed to shape policy for disaster preparedness and response (Gibbs et al. 2013). This chapter is based on research conducted in a bushfire (wildfire) at-risk regional area in southern Australia with recent and severe fire history. Data from 21 semi-structured interviews and nine focus groups conducted with natural hazard management professionals and volunteers, and community members from several groups (n = 104) were analyzed using theoretically-independent Thematic Analysis (TA). The need for practical answers to issues of public health policy and practice identified a pragmatic1 approach within a critical realist ontology2 and contextualist, experiential epistemology3 as the most appropriate framing for the study. Sequential data collection allowed the interview guides to be informed by earlier material and modified accordingly. This allowed cross-checking of meanings and in-situ member checking and data verification. The strategies and recommendations described are flexible, scalable, and adaptable to a universal all hazards approach: the basic principles of normalizing preparedness are readily translatable to become locally appropriate bespoke programs. In South Australia, all hazards are listed as animal and plant biosecurity, black system event, cyber crisis, extreme weather, flood, hazardous materials, human disease, rural fire, terrorism and urban fire. Further details of project method are available in Westcott et al. (2017b, 2020).
19.1.1
The Big Picture: The Sendai Framework for Disaster Risk Reduction
The Sendai Framework for Disaster Risk Reduction (SFDRR) 2015–2030, endorsed by the United Nations General Assembly in 2015, recognizes that combined, collaborative efforts of the State and other stakeholders—such as local government and the private sector—are required to achieve a substantial reduction in disaster risk. Preservation of human life, livelihoods and health, and of economic, physical, social, cultural, and environmental assets of persons, businesses, communities, and countries are objectives (United Nations Office for Disaster Risk Reduction 2015). 1 Pragmatic qualitative research in this study is the “intersection set” of description and interpretation: where description presents the experiences of the participants, interpreted by the researcher. 2 Ontology is concerned with the nature of reality. Critical realism sits partway between realism and relativism, and holds that reality can only be partially known. 3 Epistemology is concerned with the nature of knowledge. Contextualism sits partway between positivism and constructionism, holding that knowledge will be valid in certain contexts. It is experiential because it prioritizes participants’ perspectives and meanings within an interpretative framework.
19
Where There Is Smoke: Normalizing Community Preparedness and. . .
411
The SFDRR embraces human health and well-being, and articulates the importance of science and technology (Trogrlić et al. 2017). This includes connecting policy development and implementation with evidence and facilitating the transformation and transfer of research into practice. Three components of Sendai—health, economic development, and climate change—demonstrate how the boundaries between public health and environmental health are increasingly less distinct (Bambrick and Moncada 2015). Public health as a discipline has accordingly expanded beyond responding to specific events. Collaboration, capacity building and research need to be widespread and diverse to enable bottom-up innovation to meet top-down goals and ideals (Aitsi-Selmi et al. 2015; Blanchard et al. 2015). Beneath Sendai’s overarching principles, fire science explores an expanding spectrum of fire-related social, economic, physical, and agricultural sciences. This knowledge contributes to the successful and dynamic management of increasingly complex fire problems affecting human populations in a changing climate. Implementing Sendai has clear benefits including improved preparedness, and discerning ways to translate risk mitigation and reduction strategies into practical applications not only to curb human suffering but to empower people with renewed and enhanced resilience (Attorney-General’s Department 2014; McClean 2017; Raine 2017). The strategies described below are aligned with the SFDRR goals. They are designed to cultivate a culture of normalized preparedness in the context of potentially adverse impacts of geohazards on people, their property and livelihoods. Individuals, communities, groups of all kinds and businesses or institutions can learn to make preparedness as routine as buying the groceries or fuelling a car. In this chapter, this process is referred to as becoming fire-fit™ (Nogrady 2019; Westcott 2018). It is an active process—one of narrowing the awareness-preparedness gap (the mismatch between awareness and preventative action) and improving disaster literacy. It is a process of growth toward achieving a baseline of readiness and resilience acting as a springboard from which a series of preparedness goals can be planned and reached over a chosen timeframe. The rate of attainment is not necessarily linear, but continual improvement is the objective. The goals can be sequential; they can be modified, updated, or renegotiated as necessary. Eventually, they can become self-perpetuating (Westcott 2017b, 2018). Household levels of preparedness are generally and persistently low. Demands upon individuals, families, communities, and workplaces are high in the challenges of twenty-first-century life: fire-safe routines are frequently assigned a lower priority than other competing complexities of everyday life (Paton 2013; Paton and Johnston 2001; Ronan and Johnston 2005). The ability to navigate daily life within an environment of worsening and more frequent geohazards should be an adaptive public health and safety priority. Discerning how people and emergency managers can better equip communities to protect themselves and the things they hold dear, and practising considered, timely and safe action within and outside the fire season is a present-day imperative given the evidence-based predicted changes to near-future global weather events. The “new reality” of extreme weather requires prioritization
412
R. Westcott
of innovative preparedness initiatives (Beynon 2016; Lewis 2016; New Scientist 2013). Preparedness practitioners grapple with the fact that real-time media coverage of response to a geohazard event somewhere on the planet grabs the headlines. This is the “sexy” acute phase which in a large-scale incident dominates news bulletins for a short while, then disappears—but the recovery phase continues for years, or a lifetime. Public costs are enormous to the point of being prohibitive. Conversely, the costs of preparedness are vastly less. Being well-prepared reduces the adverse impact of hazards. Tragedy and trauma can be averted. People’s well-being is preserved, and resilience enhanced. The economy and the environment benefits. So—why do we not invest more robustly in preparedness? Preparedness is not glamorous. It is frequently overlooked with respect to funding opportunities or outcomes. Every year fire authorities plead with property owners to prepare for the upcoming season. Other than fire services’ community engagement staff and occasional community or municipal events or signage in the weeks leading up to the danger season, there are very few preparedness programs to help people become better prepared. They are told what they need to do, but not how to achieve it or how to integrate it into their daily lives. Many people find hazard preparedness too hard or too confronting, and just hope it does not happen to them. This is a fundamental obstacle to overcome by cultivating a culture of normalized preparedness with a preceding environment conducive to positive response choices. DRR practitioners have some of these answers.
19.2
Some Theory of Motivation
Every year media campaigns seem to be a variation on a theme—fear. Advertising agencies persist in using fear as a motivator, when “fear appeals” are well documented in the academic literature as unreliable, as their effect quickly plateaus and fades (So 2013; Tanner et al. 1989). Instead, people need to be motivated by something gainful—that their response choices are of value, are achievable and of long-term worth. Rather than frightening the target audience with fear tactics, protection motivation aligns with positive outcomes, promoting desirable response choices and adaptive rewards. Protection Motivation Theory (PMT) is preferred to fear appeals as the theoretical basis with which to achieve desirable response choices. Developed by Rogers in 1975 for the health promotion sector, PMT describes how individuals are motivated to react in a protective way toward a perceived threat. It can be applied to promote, teach and learn safer response choices in the context of natural hazards—to sustainably motivate behavior change by establishing a preceding environment that encourages safer choices (Rogers 1975; Westcott et al. 2017b). Rogers’ initial theory assessed threat appraisal and coping appraisal, to which he later added adaptive costs and maladaptive rewards (Rogers 1975, 1983) to better represent the reality of human nature. Threat appraisal defines an individual’s
19
Where There Is Smoke: Normalizing Community Preparedness and. . .
413
perception of the likelihood and severity of a threat, while coping appraisal expresses awareness of available mitigation options, and the individual’s belief in their own ability to implement those options—self-efficacy and self-trust (Eriksen and Wilkinson 2017). This provides the opportunity for strength-based assessment and problem-solving. Other authors have added prior experience when using PMT to assess preparedness in floods (Grothmann and Reusswig 2006). Westcott et al. (2017b) added the influence of the social microclimate and response choices— consistent with Rogers’ expected evolution of PMT and its continued relevance (Rogers 1983). In this context, understanding the inherent heterogeneity of the social microclimate and using that synergistically with complementary strategies to choose safe responses can lead to achieving positive outcomes with less cost, i.e., adaptive rewards. Shifting the emphasis from adaptive costs to adaptive rewards provides an unequivocal appreciation of the benefits of positive, adaptive actions through sound planning and decision-making that considers possible choices and actions more systemically is encouraged and favored over avoidable choices with greater maladaptive costs. Just as a major catastrophic event is often the result of a cascade of smaller, singular negative actions, errors or omissions (Reason 2000), so too a major positive outcome, such as saving human life, can arise from a more structured and learned decision-making process, including not just avoiding threat but arising from a summation of multiple smaller positive steps (Westcott et al. 2017a). Integral to this approach is the consideration of applying PMT in differing social microclimates, including those with dependent others and animals. Such an application can be beneficial across multiple groups, including emergency responders, and help to narrow the bushfire awareness-preparedness gap, with the ultimate aim of saving human life (Westcott et al. 2017b).
19.2.1
Importance of the Social Microclimate
The social microclimate is a versatile and potentially useful contributor to achieving improved preparedness. It affords an opportunity for near-simultaneous, synchronous education and training of different groups of people who upon dispersal take knowledge with them as they return to their core domestic unit. It can act as a bridge between the individual and the community and as a connector between groups. It has the potential to act positively as a unit of synergistic information processing that facilitates the acquisition and subsequent dissemination of knowledge predisposing to action. Individuals may belong to one or more social microclimate, with varying degrees of stability and dynamics. The ability to capture and summate knowledge acquired from multiple social microclimates can build a superimposed environment of fire-fitness—that is, individuals and communities able to intuitively exercise effective dynamic risk assessment, and choose an adaptive response pathway as the default option (Westcott 2018).
414
19.2.2
R. Westcott
Dependent Others
Social microclimates include dependent others—the very young, elderly, those with ill health or a disability. Animals also can be considered dependent others, and their welfare is frequently linked to human physical and psychological health (ChurHansen 2010; Cordaro 2012; Heath and Linnabary 2015). The role of assistance animals is increasingly well documented with respect to human well-being. For livestock farmers, an economic relationship does not exclude emotional attachment to livestock, and both are considerations when designing preparedness programs. (Chur-Hansen 2010; Westcott et al. 2017a, b). While the basic human urge to save a dependent other at the risk of personal safety may never be overcome, learned coping appraisals and adaptive responses, in combination with proactive preparedness routines as part of everyday living, aim to facilitate pre-hazard behaviors that overall reduce risk-taking while achieving a more effective response with less trauma and anxiety.
19.2.3
The Awareness-Preparedness Gap
Emergencies occur when people, property, the environment, and other assets intersect adversely with hazards. The magnitude of the awareness-preparedness gap can be overwhelming but responding safely and appropriately to a fire emergency is a realistically attainable goal. To overcome the potential for action inertia requires firefitness to be elevated to “business as usual” status, but there is no “one size fits all.” Whole-of-jurisdiction programs may fail or be suboptimal, which has happened in previous attempts to successfully apply discounts on insurance policies, for example, and has been asserted as a reason not to pursue financial incentives (El-Masri and Tipple 2002; Spence 2004). Strategies need to be bespoke, locally relevant, and shown to be achievable and rewarding. Not every program will suit every community. Individuals, families, workgroups, and communities need to take the action they know will work for them, rather than rely on top-down public policy to cultivate preparedness. Top-down policy may neither know nor understand the local nuances that can make or break a scheme of any kind. There will however be a point where top-down and bottom-up actions will meet, gaining momentum. The fulcrum thus formed enables leverage to build and improve preparedness programs with mutual benefit. Individuals, community groups, local, state, and federal governments, workplaces and policy developers can—as indicated by the SFDRR—all contribute to and promote this change, increasing the status of a culture of preparedness and firefitness; to make investment in resilience gainful. Wildfire is indiscriminate. It needs only the right conditions and an ignition trigger. In a changing climate, wildfire will become more widespread, and strategies described in this chapter will become increasingly relevant worldwide. With temperatures soaring as in parts of Europe in 2021 (Australian Broadcasting Corporation
19
Where There Is Smoke: Normalizing Community Preparedness and. . .
415
2021), communities unused to the conflagrations and confrontations of wildfire will need help to learn, adapt, and manage their responses to wildfire hazards as safely as possible. Community too is important. Social connectedness, common goals and self-empowerment can catalyze behavior change and reduce the negative outcomes of natural hazard emergencies (Gordon 2009; Kanakis and McShane 2016; Paton 2013; Paton and McClure 2013; Warrandyte Community Association 2013). Individuals, families, small businesses, and schools need to be equipped with sufficient, useful “tools in the toolbox” to remain safe. The old adage that “prevention is better than cure” has never been truer than in the DRR community. The critical challenge is to first defuse the potentially overwhelming nature of the preparedness task and to facilitate the transition from knowledge and understanding to intention and action. Breaking tasks down into manageable steps and writing a “bushfire survival plan” to reduce the need for strategic thinking when an emergency situation arises is one way to achieve the former, and is already actively encouraged by fire authorities as part of ongoing multi-media public outreach. In peacetime out of fire season, the “survival” plan can be adapted to become a “management” plan, that includes logistical details such as checking the width of access gates, maintaining driveways, water sources and fittings. However, an environment conducive to achieving effective action must necessarily occur before preparedness can be substantially realized. This requires a cultural, paradigm shift which itself can be created incrementally (Bambrick and Moncada 2015) via a foundation that preferences and facilitates routine, effective preparedness activities. Thus, commonly identified barriers to preparedness—lack of time, resources, knowledge, or information; the dangerous maladaptive response of “action inertia” (McNeill et al. 2015) or acting impulsively without even a brief dynamic risk assessment can be overcome. Improving preparedness for any geohazard requires two important commodities: time and money. So—among other things—aim to give people time and money. Strategies to achieve this can be grouped into four categories: (i) a new system of workplace leave (ii) an innovative regime of financial incentives for fire-ready properties, (iii) using the social microclimate to advantage, and (iv) applying the tools of dynamic risk assessment. The suite of strategies described below offers choices to allow the implementation of one or several options to normalize preparedness and build local resilience over the short, medium, and long terms.
19.3
Giving People Time: Workplace Leave
Normalized preparedness encompasses a range of preparedness activities that precede the threat of an anticipated geohazard event. These are ongoing, year-round actions and plans that enable people to respond appropriately and safely during the acute phase of preparedness immediately prior to an incident and a response. As local hazard seasons approach, preparedness activities shift up a gear—actions during the year have trained people psychologically to respond appropriately and
416
R. Westcott
proactively. They should have decided what they will do. Their management plan transitions to a survival plan. Modern weather forecasting provides accurate local information usually with a seven-day outlook to give advance warning of adverse conditions. So—assuming people are ready and sufficiently equipped—they may face the dilemma of what to do on a day of high hazard danger even if they have a well-written and practised plan. A myriad of commitments can present as obstacles, including the requirements of the workplace. Residents need time to enact the acute phase of their plans. For employees, an optional but formal contractual arrangement with employers could help overcome this difficulty. Fire Danger Leave (FDL) is proposed as a new workplace agreement between employers and employees, specifically for the purpose of putting their fire survival plans into action, whereby both parties negotiate substituting another type of leave or entitlement (such as recreation leave or overtime) with an agreed number of FDL days. Potentially, such a policy will encourage others (workmates, colleagues, other businesses and neighbors) to establish similar plans within their networks, promoting a culture of shared responsibility with mutual workplace and community benefits. This would help elevate a culture of preparedness to “business as usual” status. Instigating FDL is as simple as a conversation with an employer who understands the workplace is a dynamic environment able to adapt to the needs of workers and the workplace (as evident during the COVID-19 pandemic). Such flexibility should be advantageous to a business enterprise, meeting the business’s social responsibility to as a corporate citizen, caring for its employees and recognizing the impositions of a changing climate. FDL is not intended to replace leave already granted to employees who are emergency services volunteers for the purpose of participating in an emergency response. It may not be particularly useful to people who are self-employed, and as the climate warms, the number of dangerous days could outnumber the available days of leave. However, this proposal does recognize and proactively address the need to implement societal-wide changes required to prepare for the new normal of changing weather events.
19.4 19.4.1
Giving People Money: Financial Incentives and Awards Rewarding Best Practice
Prevention and preparedness initiatives are vastly less costly than response, relief and recovery operations (Attorney-General’s Department 2014). Over time, the costs of preparedness programs are offset by savings. A community proactively initiating a scheme of financial incentives could as well successfully apply for funding from government or the corporate sector.
19
Where There Is Smoke: Normalizing Community Preparedness and. . .
417
In combination with a suite of other initiatives, financial incentives can help achieve a societal shift toward establishing a routine culture of preparedness by implementing a system of rebates or discounts on insurance premiums, local government charges or other taxes, and by actively rewarding best practice. The key to success is to ensure programs are locally relevant and achievable. Residents who are well prepared should be recognized and acknowledged for their contribution to public health and the common good. A scheme rewarding excellence in preparedness and property management could be simply linked to an existing Local Government inspectorate authorized to issue notices or fines to property owners who fail to clean up and prepare their properties according to the most usual local geohazards. While an adversarial system has a place, arguably a rewards-based system of acknowledging best-practice preparedness could be more effective than simply the absence of a fine—the “carrot” is a more effective motivator than a “stick.” Financial rewards such as a discount on municipal charges may or may not be linked to civic awards (see below). Costs are offset by savings—given the higher cost of response and recovery after an emergency event, and the reduced cost of response in a well-prepared community. Where the number of properties to assess is very large, or the available staff to assess them small, owners could upload images of their preparedness efforts themselves, which also overcomes issues of privacy. Depending on local regulations, follow-up could be conducted with Unmanned Aerial Vehicles (UAVs), with the property owner’s consent.
19.4.2
Fire-Safe Seminars
Often people move to an area of higher geohazard risk for aesthetic or lifestyle reasons. Frequently they are unaware of the increased risks in their new location, and their associated community responsibilities. One proactive way to educate them for their own and the community’s safety would be to offer financial incentives linked to their attendance at community fire-safety information sessions. They could be encouraged to do so via an invitation accompanying their first Local Government rates notice, offering attendees a meaningful discount applied to the second year’s fees. To qualify for the discount, participation in a given number of fire information seminars would be required, which could be spread over a 12-month period for maximum opportunity for participation.
19.4.3
Value Adding
Value-adding to properties at point-of-sale by making bushfire compliance a desirable, marketable commodity is another financial incentive. This could be achieved by adding a notation on advertising material identifying “bushfire-safer properties” compliant with current relevant local Standards (Standards Australia 2009), and
418
R. Westcott
encourage others to similarly value-add. This strategy would need to be aligned with a formal system of assessing and identifying eligible properties. Qualifying properties not intended for sale could be promoted as exemplars of preparedness by displaying gateway signage, or participating in community “fire-ready” open days, similar to familiar “open gardens,” to share knowledge and educate others to achieve similar goals.
19.4.4
Insurance Premiums
To complement the initiatives outlined above, a sliding scale of insurance premium discounts and financial incentives linked to best-practice fire-fitness credentials is recommended. Following the 2019–2021 fires in southern Australia, rural insurance premiums more than doubled. These were assessed on geographical location only, without consideration to property preparedness, management, or infrastructure. Documentation identifying well-prepared properties could quite readily be provided to insurance companies, and property owners can use such documentation to negotiate a price on their policy premiums. This is part of a more holistic approach that recognizes individuals’ contribution to the common good as well as themselves and emphasizes the importance of local resilience practices. Fostering this paradigm promotes building preparedness as a routine behavior, and could encourage wider uptake of appropriate insurances, as well as assisting those for whom affording a policy is challenging. It could be argued “the rich get richer,” and those who can afford good preparedness measures will also pay less for their insurance. But these are medium to longer-term strategies to cultivate a culture of preparedness over time. Lower-income residents can still receive discounted premiums if they have implemented a plan to achieve good fire fitness. Self-responsibility and understanding of the impact good management and husbandry has in a broader societal context should be recognized. In recent Australian fire emergencies, uninsured landowners have occasionally been perceived as receiving Government relief benefits ahead of others who were fully insured (Pinery fire local recovery committee 2017, personal communication). Proactive, well-designed preparedness should be acknowledged as contributing to the common good in parallel to assisting those needing more help.
19.4.5
Civic Awards: From Individuals to Whole Towns
Give civic awards. Extending existing community achievement and award programs are another way to promote a culture of geohazard preparedness and safety and build strong relationships with emergency services. Make people feel good by recognizing their achievements and proactive plans and goals. Categories can include urban,
19
Where There Is Smoke: Normalizing Community Preparedness and. . .
419
peri-urban, rural, and broadacre properties, with awards for “most improved,” “best,” or “innovative.” Private properties, businesses, schools, other educational institutions and community groups or even whole towns could take part. Civic awards, such as “best prepared towns” could attract additional funding from government or corporate sources. Such initiatives can enhance community pride and collaboration and boost the local tourism industry and economy.
19.4.6
Farmers
Farmers are generally considered a resourceful and innovative group in society. Farming is hard work. Income is often sporadic and seasonal, and crops can thrive or fail according to the whims of the weather. Crop insurance is becoming more and more expensive. Farmers can of course take part in many of the strategies included above, but they may also benefit from incentives specific to their sector. Firebreaks have fallen out of favor, reducing the area of land available for cropping, and therefore income. But a small amount of economic loss could mean many people are safer, so farmers need incentives to put in firebreaks. Breaks could be expediently placed at boundaries with neighboring properties, doubling the effective area. Farmers can consider crop placement and planting around assets. In southern Australia, some farmers choose to plant deciduous European trees closer to their homes and valuable infrastructure, the aim being to damp down an approaching firefront with less flammable vegetation, providing some valuable time to control a blaze. Planting leguminous crops closer to infrastructure can be helpful as they burn slower and less hot than oilseed or some cereal crops. Livestock can be protected by leguminous or irrigated pasture, rather than place valuable breeding animals in an oil-seed crop stubble. Although crop rotation is an important consideration, planting more flammable crops further away from assets and animals could be helpful. Farming and agricultural groups should be encouraged to actively discuss and promote farm fire safety in this way. Again, best practice preparedness measures should be identified and rewarded.
19.5
The Social Microclimate
Use the social microclimate to advantage. Coordinate and synchronize the delivery of information so that two or more group members receive it in different locations but within a few days of each other. For example, in a small town, a fire-safe information day given to the local primary school and to local businesses within the same week. This is an efficient use of time and encourages conversations between members of various social groups, such as families, sporting clubs, or workgroups, with a probable synergistic effect as the information is processed and
420
R. Westcott
discussed by core group members, thus achieving more of the desired effect without additional inputs. School-aged children are likely to want to discuss information concerning geohazards with their parents. If the child and parent have received similar information close to simultaneously, productive discussions can ensue. The workplace has potential to become a key link in expanding bushfire awareness and survival—by training employees in positive adaptive decision-making and in dynamic risk assessment as an active process preferencing protective behavior in an emergency event.
19.6
Decision-Making, Adaptive Rewards, and Dynamic Risk Assessment (DRA)
In daily life, people decide on a course of action for a reason—which is often one of perceived net gain for themselves or their immediate dependent others in their social microclimate. Desirable behavior and the rewards of adaptive response should therefore clearly represent an appealing net gain—in addition to the ultimate aim of protecting and saving human life—and surpass any perceived benefit from impetuous or dangerous maladaptive choices. It is not possible to fully understand the impact or influence any given individual’s environmental or social microclimate has upon decision-making, yet planning and decision-making needs to preference desirable, safe behavior versus in-situ decision-making and maladaptive responses which could, and often do, lead to injury or even death (Cohen-Hatton and Honey 2015; Haynes et al. 2010). The observation of poor decision-making per se is an over-simplification, and arguably less helpful than attempting to elucidate the etiology of that decision (Shevellar and Riggs 2016). Understanding this will assist to identify and inform realistic and safer alternatives, and offer choices to help redirect dangerous, often spontaneous decision-making. Uncovering key reasons contributing to people making unsafe decisions in bushfire events has the potential to be translated across policy and different household contexts in bushfire at-risk communities, and across society more generally as the population health effects of climate change become more dominant. Emotions run high under the duress of a geohazard emergency. This is why it is so important to train people in dynamic risk assessment in peacetime, so that safer choices are more likely to become an intuitive reflex under pressure. An example might be a grandfather who lives 20 km away from his daughter and grandchildren, who are near a serious fire. His visceral reaction may be to jump in the car and drive through an extremely dangerous area to ‘rescue’ them, potentially putting himself and his family in great peril. The safe choice would be to ring the local emergency phone number and report the need for urgent assistance at the address in question, allowing emergency services to attend with the necessary resources.
19
Where There Is Smoke: Normalizing Community Preparedness and. . .
421
If people can learn to quickly recognize this normal, but dangerous, emotiondriven reaction, and consciously take one step back—dynamically risk assess—and appraise the situation in a rational manner to redirect and communicate information to the appropriate agency, risk is reduced and an appropriate response can be actioned rapidly. This is an example of coping appraisal within PMT, and an illustration of how adaptive rewards outweigh maladaptive rewards or costs. Subsequent trauma and anxiety can be reduced by understanding how the process of choosing adaptive rewards is an active behavioral choice favoring positive outcomes. Effective dynamic risk assessment and safe decision-making are functions of preparedness behavior being in place for preceding months. Knowing how to intuitively engage in DRA can significantly facilitate an accurate assessment of the ability to successfully implement mitigation activities. In the peacetime preparedness phase, DRA can assist people to realistically appraise their strengths and abilities; this is reviewed closer to times of perceived threat, and actively engaged as a process when threat is imminent. Teaching the basic principles of dynamic risk assessment in promotional material is an additional way to help avoid spontaneous and emotive reactions in favor of adaptive response. Proactively using DRA is demonstrated by organizations such as the Australian Red Cross, and St. John Ambulance Australia, in their publicly available website resources and posters, one of which depicts step-by-step life support actions according to the acronym, DRSABCD: Danger; Response; Send for help; Airway; Breathing; Circulation; Defibrillate (St John Ambulance Australia 2016). Similar “fire-safe” resources, displayed in parallel, could be adapted and developed by fire authorities’ campaigns to actively promote DRA, such as Assess the danger; Be smart, be safe; Consider the consequences; Decide and act, alongside hypothetical scenarios such as: What would your children do if you died trying to save the cat? This strategy sends a message of dynamic risk assessment that could resonate with a new or different group of people. It adapts an existing resource—thus doing more with the resources already to hand—and uses a principle already widely known in the public realm, particularly among people who are firstaid or workplace-safety trained. An example of a suitable slogan to build preparedness and encourage DRA includes Be fire-fit! Weekly is worth it! (Westcott et al. 2017a) which promotes the uptake of preparedness behaviors by showing that preparedness (fire-fitness) regularly (weekly) is beneficial (is worth it) (Westcott 2017a, b).
19.6.1
In Summary
Strategies to build a normalized culture of preparedness include: • Negotiating leave of absence with employers on high fire danger days with a new kind of workplace leave.
422
R. Westcott
• Give new residents easily accessible fire safety information and reward them for joining in. • Easily accessible locally applicable, bespoke financial incentives linked to Government charges or insurances. • Value-adding to properties demonstrating best practice. • Holding fire-ready open days. • Civic awards to publicly acknowledge best practice. • Review the use of firebreaks and crop types. Give farmers incentives to put in firebreaks, and think about crop placement. • Synchronous awareness programs in schools and the workplace. • Resource sharing with other agencies. • Maximize the potential of multiple social microclimates. • Learning dynamic risk assessment. These encourage medium to long term changes to public health and safety policy and bushfire preparedness behavior. They can be implemented quickly and costeffectively. Similarly, the process to redefine, demonstrate and establish the adaptive rewards of good decision-making and safe bushfire behavior requires the investment of longer-term strategic planning, assessment and re-assessment of initiatives to cultivate and maintain behavior change into the future. This requires active assessment of what precedes planning and preparedness, and could arguably lead to more enduring changes to levels of preparedness than the real but possibly shorter-lived “windows of opportunity” in the immediate post-event aftermath (Eriksen and Wilkinson 2017; Neale et al. 2016). In the short and long term, strategies to encourage voluntary participation in a growing culture of preparedness is likely to symbiotically converge with the adoption of positive, adaptive response choices, which in turn promote and motivate protective behavior. New, straightforward public policy can help achieve this so that effective fire-fitness becomes just another part of daily life.
References Aitsi-Selmi A, Egawa S, Sasaki H, Wannous C, Murray V (2015) The Sendai framework for disaster risk reduction: renewing the global commitment to people’s resilience, health, and wellbeing. Int J Disaster Risk Sci 6(2):164–176. https://doi.org/10.1007/s13753-015-0050-9 Attorney-General’s Department (2014) Productivity Commission inquiry into natural disaster funding arrangements (p. 14). Canberra: Australian Government Retrieved 28 April 2022 from http://www.pc.gov.au/inquiries/completed/disaster-funding/submissions/submissionstest/submission-counter/sub090-disaster-funding.pdf Australian Broadcasting Corporation (2021) Italy may have recorded Europe’s hottest temperature ever with Sicily’s 48.8C scorcher. https://www.abc.net.au/news/2021-08-12/sicily-record-heat48-8-degees-celsius-europe/100370738 Bambrick H, Moncada S (2015) From social reform to social transformation: human ecological systems and adaptation to a more hostile climate. In Health of People, Places and Planet:
19
Where There Is Smoke: Normalizing Community Preparedness and. . .
423
reflections based on Tony McMichael’s four decades of contribution to epidemiological understanding (pp. 353). ANU Press Beynon H (2016) Extreme weather the “new normal”. United Nations Office for Disaster Risk Reduction. Retrieved 12 September 2019 from https://www.unisdr.org/archive/49634 Blanchard K, Aitsi-Selmi A, Murray V (2015) The Sendai Framework on Disaster Risk Reduction: from science and technology to societal resilience. Int J Disaster Resilien Built Environ Chur-Hansen A (2010) Grief and bereavement issues and the loss of a companion animal: people living with a companion animal, owners of livestock and animal support workers. Clin Psychol 14(1):14–21 Cohen-Hatton SR, Honey RC (2015) Goal-oriented training affects decision-making processes in virtual and simulated fire and rescue environments. J Exp Psychol Appl 21(4):395–406. https:// doi.org/10.1037/xap0000061 Cordaro M (2012) Pet loss and disenfranchised grief: implications for mental health counseling practice. J Ment Health Couns 34(4):283–294. https://doi.org/10.17744/mehc.34.4. 41q0248450t98072 El-Masri S, Tipple G (2002) Natural disaster, mitigation and sustainability: the case of developing countries. Int Plan Stud 7(2):157–175. https://doi.org/10.1080/13563470220132236 Eriksen C, Wilkinson C (2017) Examining perceptions of luck in post-bushfire sense-making in Australia. Int J Disaster Risk Reduct 24:242–250. https://doi.org/10.1016/j.ijdrr.2017.06.017 Gibbs L, Waters E, Bryant RA, Pattison P, Lusher D, Harms L, Richardson J, MacDougall C, Block K, Snowdon E, Gallagher HC, Sinnott V, Ireton G, Forbes D (2013) Beyond Bushfires: Community, Resilience and Recovery – a longitudinal mixed method study of the medium to long term impacts of bushfires on mental health and social connectedness. BMC Public Health 13:1036. https://doi.org/10.1186/1471-2458-13-1036 Gordon R (2009) Community impact of disaster and community recovery. InPsych – Australian Psychological Society (April 2009) Grothmann T, Reusswig F (2006) People at risk of flooding: why some residents take precautionaryacton while others do not. Nat Hazards 38:101–120. https://doi.org/10.1007/ s11069-005-8604-6 Haynes K, Handmer J, McAneney J, Tibbits A, Coates L (2010) Australian bushfire fatalities 1900–2008: exploring trends in relation to the ‘Prepare, stay and defend or leave early’ policy. Environ Sci Pol 13(3):185–194. https://doi.org/10.1016/j.envsci.2010.03.002 Heath SE, Linnabary RD (2015) Challenges of managing animals in disasters in the U.S. animals (2076–2615), 5(2):173–192. https://doi.org/10.3390/ani5020173 Intergovernmental Panel on Climate Change (IPCC) (2021) Sixth Assessment Report. United Nations. https://www.ipcc.ch/assessment-report/ar6/ Kanakis K, McShane CJ (2016) Preparing for disaster: preparedness in a flood cand cyclone prone community. Austr J Emerg Manag 31(2):18–24 Lewis S (2016) Time to adapt: 2015’s record-breaking temperatures will be normal by 2030. Australian Broadcasting Corporation. Retrieved 12 September 2019 from http://www.abc.net. au/news/2016-11-07/record-breaking-temperatures-will-be-new-normal-by-2030/8001720 McClean D (2017) Global Platform stresses action on Sendai. United Nations Office for Disaster Risk Reduction. Retrieved 7 June 2018 from http://www.unisdr.org/archive/53459 McNeill IM, Dunlop PD, Skinner TC, Morrison DL (2015) Predicting delay in residents’ decisions on defending v. evacuating through antecedents of decision avoidance. Int J Wildland Fire 24: 153–161. https://doi.org/10.1071/WF12213 Neale T, Weir JK, McGee TK (2016) Knowing wildfire risk: Scientific interactions with risk mitigation policy and practice in Victoria, Australia. Geoforum 72:16–25. https://doi.org/10. 1016/j.geoforum.2016.03.008 New Scientist (2013) Wild weather: extreme is the new normal. Retrieved 12 September 2017 from https://www.newscientist.com/article/mg21729003-200-wild-weather-extreme-is-the-newnormal/
424
R. Westcott
Nogrady B (2019) Inside Australia’s plan to survive bigger, badder bushfires. MIT Technology Review. Retrieved 27 April 2022, from https://www.technologyreview.com/2019/04/24/10312 8/inside-australias-plan-to-survive-bigger-badder-bushfires/ Paton D (2013) Disaster Resilient Communities: developing and testing an all-hazards theory. J Integr Disaster Risk Manag 3(1):1–17. https://doi.org/10.5595/idrim.2013.0050 Paton D, Johnston D (2001) Disasters and communities: vulnerability, resilience and preparedness. Disaster Prev Manag 10(4):270–277. https://doi.org/10.1108/EUM0000000005930 Paton D, McClure J (2013) Preparing for Disaster: building household and community capacity. Charles C. Thomas Raine J (2017) Sendai framework for disaster risk reduction 2015–2030 – Australia’s approach. Commonwealth of Australia, Attorney-General’s Department, Canberra Reason J (2000) Human error: models and management. Br Med J 320(Mar 18):768–770 Rogers RW (1975) A protection motivation theory of fear appeals and attitude change. J Psychol 91:93–114 Rogers R (1983) Cognitive and physiological processes in fear-based attitude change: a revised theory of protection motivation. In: Caccioppo J, Petty R (eds) Social psychophysiology: a sourcebook. Guilford, pp 153–176 Ronan KR, Johnston DM (2005) Promoting community resilience in disasters: the role for schools, youth, and families. Springer US. https://doi.org/10.1007/b102725 Shevellar L, Riggs R (2016) Understanding resistance to emergency and disaster messaging. Austr J Emerg Manag 31(2):31–35 So J (2013) A Further Extension of the Extended Parallel Process Model (E-EPPM): implications of cognitive appraisal theory of emotion and dispositional coping style. Health Commun 28(1): 72–83. https://doi.org/10.1080/10410236.2012.708633 Spence R (2004) Risk and regulation: can improved government action reduce the impacts of natural disasters? Build Res Inform 32(5):391–402. https://doi.org/10.1080/ 0961321042000221043 St John Ambulance Australia (2016) DRSABCD Action Plan. St John Ambulance Australia. Retrieved 12 February 2017 from http://www.stjohnnsw.com.au/drsabcd-action-plan/ Standards Australia (2009) Australian Standard® Construction of buildings in bushfire prone areas. Council of Standards Australia, Sydney Steffen W, Hughes L, Alexander D, Rice M (2017) Cranking up the intensity: climate change and extreme weather events. Climate Council of Australia Tanner JF, Day E, Crask MR (1989) Protection motivation theory: an extension of fear appeals theory in communication. J Bus Res 19(4):267–276. https://doi.org/10.1016/0148-2963(89) 90008-8 Trogrlić RŠ, Cumiskey L, Triyanti A, Duncan MJ, Eltinay N, Hogeboom RJ, Jasuja M, Meechaiya C, Pickering CJ, Murray V (2017) Science and technology networks: a helping hand to boost implementation of the sendai framework for disaster risk reduction 2015–2030? Int J Disaster Risk Sci 8(1):100–105. https://doi.org/10.1007/s13753-017-0117-x United Nations Office for Disaster Risk Reduction (2015) Sendai framework for disaster risk reduction. United Nations Office for Disaster Risk Reduction. Retrieved 1 May 2018 from http://www.unisdr.org/we/coordinate/sendai-framework Warrandyte Community Association (2013) Be Ready Warrandyte. Government of Victoria. https://www.youtube.com/watch?v=jty_99L5eJA Westcott R (2017a, 4 July) How to become bushfire-prepared without really noticing: be fire-fit! Weekly is worth it! Bushfire and Natural Hazards Cooperative Research Centre. Retrieved 12 September 2018 from http://www.bnhcrc.com.au/resources/presentation-audio-video/3834 Westcott R (2017b) Narrowing the awareness-action gap: cultivating fire-fitness as a social norm through public policy initiatives. Austr J Emerg Manag 31(4):37–41. https://knowledge.aidr. org.au/resources/ajem-oct-2017-narrowing-the-awareness-action-gap-cultivating-fire-fitnessas-a-social-norm-through-public-policy-initiatives/
19
Where There Is Smoke: Normalizing Community Preparedness and. . .
425
Westcott R (2018) Advancing public health in the context of natural hazards: normalising preparedness within a framework of adapted Protection Motivation Theory. Thesis by Papers, Western Sydney University. Sydney. https://researchdirect.westernsydney.edu.au/islandora/ object/uws%3A49051 Westcott R, Ronan K, Bambrick H, Taylor M (2017a) Don’t Just Do Something. . . ..Stand There! Emergency Responders’ Peri-Incident Perceptions of Animal Owners in Bushfire [Original Research]. Front Veterin Sci 4(34). 10.3389/fvets.2017.00034 Westcott R, Ronan K, Bambrick H, Taylor M (2017b) Expanding protection motivation theory: investigating an application to animal owners and emergency responders in bushfire emergencies. BMC Psychol 5(1):13. https://doi.org/10.1186/s40359-017-0182-3 Westcott R, Ronan K, Bambrick H, Taylor M (2020) Natural Hazards and adaptive response choices in a changing climate: promoting bushfire preparedness and risk reduction decisionmaking. Social Sci Humanities Open 2. https://doi.org/10.1016/j.ssaho.2020.100065
Chapter 20
Istanbul Resilience Approach Against Earthquake Betül Ergün Konukcu
Abstract Cities are increasingly faced with complexities, uncertainties, local and global challenges. These problems make pressure on the life of cities and cause direct, indirect, tangible, and intangible damages to physical structure, natural environment, social fabric, cultural heritage, and economic situation of the cities. In order to make cities resilient against these pressures, it is substantial to improve skills to cope with these difficulties and strengthen the coping capacity of urban elements. Istanbul is one of the oldest cities in the world. The city, hosted many civilizations with its 8500-year history, has dealt with the earthquakes, epidemics, floods, fires, water shortages, economic crises throughout its historical process. Istanbul is still trying to struggle against the challenges based on natural events and climate change, the consequences of irresponsible urbanization, socio-economic and cultural stresses, and environmental problems. These challenges are significant barriers to carry Istanbul into the future as a resilient and sustainable city. One of the most noteworthy threats for Istanbul is an earthquake. Istanbul must build urban resilience by considering its capacity, capability, requirement, fragilities and limited sources against the potential earthquake for city’s sustainable resilience. During the building urban resilience process, it is important to develop city’s own resilience strategy. This resilience strategy must be framed to respect for humanitarian values and natural life. This resilience strategy must be shaped based on prioritizing disaster risk reduction studies in investment programs and implementation projects. This resilience strategy must be focused on raising quality of urban life within the framework of safe, livable, ecosensitive, equitable, inclusive visions and policies. This resilience strategy must be aimed for supporting economic growth, social progress, environmental protection, resource management, spare capacity for sustainable resilience. The goals of this strategy must be to supply affordable safe housing, increase the capacity, strengthen accessibility, make infrastructure systems functional, provide open space, protect natural resources and ecosystem services, preserve cultural heritage, support the continuity of critical facilities and services, be
B. Ergün Konukcu (✉) Istanbul Metropolitan Municipality, Istanbul, Turkey © The Author(s), under exclusive license to Springer Nature Switzerland AG 2023 S. D’Amico, F. De Pascale (eds.), Geohazards and Disaster Risk Reduction, Advances in Natural and Technological Hazards Research 51, https://doi.org/10.1007/978-3-031-24541-1_20
427
428
B. Ergün Konukcu
valid for fragility groups of society, give every citizen equal rights and opportunities, constitute spare capacity, bring urban stakeholders together, legislate the adequacy and applicability of laws, regulations, plans, develop alternative strategy, raise an awareness studies. The future of Istanbul depends on city leaders’ and citizen’s priorities, decisions, investment and implementation programs, urbanization approach and development goals determined by their awareness, perception, sensitivity. In other words, Istanbul’s future will be shaped mostly by Istanbulites and their choices. These choices will affect Istanbul’s urban resilience and its sustainability. This study reveals how “Istanbul Resilience Strategy” and “Sustainable Urban Resilience” should be against to earthquake. Keywords Urban resilience · Sustainability · Earthquake resilience · Earthquake resilience matrix · Earthquake resilience strategy · Istanbul
20.1
The Authenticity of Modern-Day Is the Urban Life
The Earth has changed a lot since the beginning of its existence more than 4.5 billion year. During its geological period, the Earth has managed to survive in spite of adverse impacts and strong effects of natural events such as earthquakes, volcanic activities, meteorites, and climate change. It has also achieved to revive the life despite of five mass extinctions by using its adaptative capacity, renewability characteristic, innate resilience ability. The Earth continues to change but the reasons are not only the results of natural events like previous times but also human effects as so in the last centuries. In other words, changes in earth are no longer just related with the nature. World life is changing because of people’s life choices, the results of human footprints on the environment, etc. At this point, some scientists have a consensus that the world has entered a new geological period called Anthropocene. Anthropocene is the era that irreversible human effects on earth such as destruction of nature and living spaces are changing and shaping our world from the beginning of this period approximately 200 years ago. For instance, the untouched regions of the earth are getting decrease during this process. At the same time boundaries between the settlements and natural areas have begun to disappear. Because of these reasons, it is critical and significant to take the necessary and related measures in order to reduce devastating effects of humankind on the earth immediately in this term when the population is increasing day by day in the urban areas of the world. The earth’s surface is mostly covered with 70% of water and the remaining 30% is the terrestrial part as land surface. According to the “Land in Numbers 2019,” only 1% of the land surface is being used as residential or urban areas by more than half of the world’s population now (UNCCD). It means that the urban areas already reside more than 55% of the world population and this percentage is projected to reach to 70% by 2050 (UN-Habitat 2017). Increasing rate of rapid urbanization with increasing population is one of the most important trend and pressure that shape today’s world and our future. Most cities try to cope with population burden. Because the
20
Istanbul Resilience Approach Against Earthquake
429
increasing population in the urban areas not only put great strains on systems functionality and services efficiency but also make serious pressure on cities limited capacity and resources. Besides the adverse impact of increasing population, cities with higher population are also threatened by disaster hazards. Most cities with more than 500,000 inhabitants experienced at least one catastrophe in their historical process and these cities are at high risk of exposure to one type of disaster hazard or more such as cyclones, floods, droughts, earthquakes, landslides, and volcanic eruptions in their future (UN 2018). According to the “Human Cost of Disasters” report, 7348 disaster events (flood, storm, earthquake, extreme temperature, landslide, drought, wildfire, volcanic activity, mass movement) were recorded between 2000 and 2019. During these throughout disasters process, over 4 billion people were affected, more than two million people died, and approximately US$ 2.97 trillion economic losses occurred (CREDUNDRR 2020). Disaster hazards based on natural events and climate change are impediments for the resilience and sustainability of the physical, social, economic, historical, and cultural structure of cities. However, cities do not only struggle against disaster risks. The consequences of irresponsible and rapid urbanization choices, socio-economic and cultural stresses as obstacles for development and environmental problems significantly force urban resilience. These urban challenges also threaten urban sustainability (Fig. 20.1) (Konukcu 2020). Making cities resilient and sustainable against to current, potential, anticipated, and evolving urban challenges is only achieved by reducing disaster risks, solving problems that hinder development, making preventive actions and adaptation activities for climate crisis, capacity increase practices, increasing the life quality for the urban dwellers and protecting the environment and ecosystem. The authenticity of modern-day is the urban life like in the future and urban life must be resilient. Consequently, cities need to build urban resilience to thrive in the face of the diversifying, differentiating, strengthening, changing, expected, and unforeseen challenges.
20.2
Urban Resilience Characteristics
Cities are now more densely populated and more increasingly and frequently faced with local and global challenges, complexities, and uncertainties. These pressures cause direct, indirect, tangible and intangible losses and damages on physical structure, natural environment, social fabric, cultural heritage and economic situation of the cities. To cope with these challenges, complexities, and uncertainties, cities must demonstrate resilient qualities. These qualities are defined as characteristics of resilient cities by 100 Resilient Cities (ARUP-TRF), UN-Habitat and World Bank (Fig. 20.2). By using these qualities cities can withstand negative conditions, survive in tough time, struggle against difficulties, respond to shocks and stresses, adapt
430
B. Ergün Konukcu
Fig. 20.1 Urban challenges (developing from Urban Challenges, Konukcu 2020) Fig. 20.2 Characteristics of urban resilience (ARUPTRF, UN-Habitat 2, WB)
more readily to innovations and changes and bounce back better, stronger and quickly to normal conditions after adverse impacts. Flexibility is the characteristic of “Flexible” cities for using in changing circumstances or sudden crisis to adapt new technologies or knowledge (ARUP-TRF 2018). It is achievable to find alternative ways to use resources, especially during a time of crisis for “Resourceful” cities (ARUP-TRF).
20
Istanbul Resilience Approach Against Earthquake
431
Integrated cities can gather all related stakeholders, systems, and actors such as distinct institutions, foundations, sectors, organizations, etc. to work together for making cities resilient (ARUP-TRF, UN-Habitat 2). If the city is a “Reflective,” the city uses past experience, knowledge and new information to make future decisions (ARUP-TRF, UN-Habitat 2, WB 2018). “Inclusive” cities attach great importance to broad consultation with all related and responsible city stakeholders including the most vulnerable groups in their decision-making processes (ARUP-TRF, UN-Habitat 2, WB). “Robust” cities aim for non-damaged physical assets and their functionality. Their systems are expected to be well-conceived, well-constructed and wellmanaged in order to respond to shock impacts (ARUP-TRF, WB). “Redundant” cities have spare networks or systems for continuity of services. It is essential because when the one of the services of “Redundant” city gets disrupted, city can provide its service by using another alternative (ARUP-TRF, WB). “Coordination” is another notable characteristic of resilient cities. Knowledge sharing, collaborative and strategic planning, and interoperability between urban systems are significant for these cities (WB). If the city gains “Persistent” characteristic of urban resilience, the city foresees the current and future shocks and stresses and then prepares itself by strengthening the city’s related functions and generating spare capacity for basic services (UN-Habitat 2). If you live an “Adaptable” city, your city is interested in current and future uncertainties as well as risks. The adaptable city offers alternatives to diversify services, functions, and processes for continuity to cope with challenges (UN-Habitat 2). The city having ability to transform for positive change is a “Transformative” city. It aims to create an ingenuity, innovative, risk-free system in order to continuity city’s functionality (UN-Habitat 2). The cities having, gaining, or developing these characteristics of resilience can cope with disruptive events such as challenges, shocks, stresses, complexities, uncertainties and build urban resilience for all city components, services and systems by using their ability, capability and capacity toward safe, livable, sustainable cities.
20.3
What Is Urban Resilience?
Cities must comprehend their limitations, potential adverse impacts of shocks and stresses, dependencies and interdependencies of challenges with a holistic perspective in a cause-and-effect relationship in order to build and increase their coping capacity. Coping capacity of cities are related to Urban Resilience. “100 Resilient Cities” explains “Urban Resilience” as a city capacity to survive, adapt, and grow no matter against to shocks and stresses they experience (100RC 2019). According to UN-Habitat, “Urban Resilience” is city ability to adapt and transform against to shocks and stresses toward sustainability (UN-Habitat 2).
432
B. Ergün Konukcu
Fig. 20.3 Challenges—acute shocks, chronical stresses
Shocks and stresses as disruptive events of cities’ daily life are not only resilience exam of the cities but also obstacles for urban sustainability. The dynamic and systematic processes of cities must learn how to deal with the adverse effects of shocks and stresses and how to adapt the changes in urban process. Urban Resilience is coping skill of cities against the current and potential acute shocks and chronical stresses (Konukcu 2020). Urban Resilience is a defense mechanism that is built on city’s current structure by taking lessons from its past, understanding its current situation well and anticipating its future (Konukcu 2020). Briefly, Urban Resilience is the city’s immunity against challenges (Konukcu 2020). The challenges sometimes interrupt and change the flow of daily life with shocks and sometimes make urban fabric vulnerable with stresses. The cities must develop immunity against diversifying, differentiating, strengthening, changing, expected, anticipated, or unforeseen acute shocks and chronical stresses (Fig. 20.3). Cities’ future cannot be abandoned to cities’ fate. Cities from all over the world are vulnerable at least one type of pressure of acute shocks and chronical stresses. As a result of the devastating effects of these challenges, lasting damage could occur to cities’ components, systems, sectors, and sustainability. One of the most destructive and deadliest challenges for cities is an earthquake. In the last 20 years, three mega-disasters occurred around the world. Mega disaster is related with the number of deaths. Disasters that cause more than 100,000 deaths are called mega-disaster. Two out of three mega-disasters occurred because of the
20
Istanbul Resilience Approach Against Earthquake
433
earthquake and the tsunami triggered by earthquake. One of them is the 2004 Sumatra Earthquake and Tsunami with 226,408 death and the other one is 2010 Haiti Earthquake with 222,570 death (CRED-UNDRR). According to the “Human Cost Disasters” report, total number of deaths because of the earthquake are 721,318 between 2000 and 2019. Earthquake is a natural event. How natural event turns into a disaster and why causes thousands of deaths are critical topics that need to be understood and then solved.
20.4
When Does Earthquake as a Natural Event Turn into Disaster?
If earthquake has a potential to cause any damages on city’s structures, it means that natural event turns into a threat to the city. The threat always includes the occurrence probability. When the threat occurs, the possibility of damages and vulnerabilities depend on resilience of city’s physical elements, natural environment, social fabric, economic structure, and cultural heritage (Fig. 20.4). Vulnerability, exposure, and threats always interact with each other in order to create risks for the cities. Risks with possible adverse impacts, potential consequences, and uncertainties must be reduced by using cities’ capacity, capabilities, and opportunities.
Fig. 20.4 Threat and resilience
434
B. Ergün Konukcu
Fig. 20.5 Earthquake turns into disaster because of human choices and priorities (Konukcu 2023)
For risk reduction, it is critical to understand how natural event turn into disaster in urban life or city management (Fig. 20.5). Earthquakes turn into disaster due to human choices and priorities. Because of the: • • • • • • • •
lack of economic resources insufficient institutional arrangement unplanned and irresponsible urbanization improper land use unplanned and unscheduled investments lifeline failure and deficiencies structural problems lack of awareness, “earthquakes” cause damages in urban areas (Fig. 20.5)
During the process of making cities more resilient, it is important to eliminate barriers. Barriers such as: • limited resources and capacities • deficiencies in control process (lack of monitoring and specialty) • indifference and indecisiveness (indifference to titles such as hazard, risk, and resilience) • lack of knowledge caused by insufficient information and inexperience • risk unaware politics during the decision-making processes • lacunae in law within the applicable legislations • lack of investment and incentive; prevent cities more stronger against to earthquakes (Fig. 20.5) To be more inclusive for citizens and develop participatory process in city management for the stakeholders are significant for making cities resilient. Because stakeholders have important responsibilities city’s process. During building resilience:
20
Istanbul Resilience Approach Against Earthquake
435
• Cities must be integrated to work together with all related stakeholders. • Cities must inform all kinds of stakeholders about their challenges, shocks, stresses, and related risks. • Stakeholders must be responsible for risk definition, analysis, prevention, reduction, or tracking process. • Stakeholders must take responsibility to prioritize policies, action plans, and implementations. • Stakeholders must involve in the decision processes. Cities must develop their stakeholder’s relationship. The relationship between cities and their stakeholders has an impact on the city’s resilience level. Without stakeholders’ participation, cities become more vulnerable. Cities have some problems under the stakeholder title such as: • • • • • •
lack of broad consultation lack of multifaceted dialogues noneffective delegation of authority unauthorized division of responsibility lack of coordination lack of collaboration (Fig. 20.5). Cities must overcome these problems about stakeholders’ relationship.
One of the most important driving forces that turn an earthquake into disaster is the cost of inaction. Not taking the necessary steps in urban resilience and sustainability makes cities more fragile and vulnerable against earthquakes. The cost of inaction on local and global scales forces the coping capacity of cities (Fig. 20.5). If an earthquake threatens urban areas, • • • • •
cities and citizens urban elements such as urban components, sectors, and systems ecosystems our future and our sustainability could be at risk and have a possibility to damage (Fig. 20.5).
After the determination of the underlying reasons for threats, barriers to solution, responsibilities to stakeholders, and things at risk, it is crucial to comprehend “why occur,” “how to prevent it,” and “how to predict it” (Fig. 20.6). Because an earthquake is no longer an event but a major threat to many cities and megacities. This threat can have devastating effects on lives, structures, environment, ecosystems, economy, social fabric, and cultural heritage if the city is not earthquake resilient. One of the most significant megacities threatened by the earthquake is Istanbul.
436
B. Ergün Konukcu
Fig. 20.6 Why occur? How to predict? How to prevent? (Konukcu 2023)
20.5 İstanbul and Earthquake Istanbul is located in one of the most seismically active regions of the earth. For this reason, the city has suffered damage due to earthquakes from 32 A.D. to 1894 again and again according to Ambraseys and Finkel (1991). Three of them, occurring in 1509, 1766, and 1894, respectively, seriously affected Istanbul and caused great losses around the city during the Ottoman period. 1509 Earthquake caused extensive damage to many mosques, buildings, and some parts of the city walls in Istanbul. Approximately 1000 houses were destroyed and 5000 people died around Istanbul (Ambraseys and Finkel 1991). In 1500, the city population was nearly between 100,000 and 120,000 (Koç 2010). In light of this information, 5% of the population of residents in Istanbul died due to the 1509 Earthquake. This earthquake likely triggered Tsunami. The waves that broke through the walls of Istanbul and Galata moved toward the streets of the city (Orgun 1941). Another destructive earthquake occurred in the east part of the Sea of Marmara in 1766. Not only many houses and public buildings collapsed but also The Ayvad Dam located north of Istanbul was damaged in İstanbul because of the 1766 Earthquake (Ambraseys and Finkel 1991). Third major earthquake took place in the Gulf of İzmit in 1894 and had adverse impact on İstanbul. The tsunami runup height after the 1894 Earthquake was less than 6.0 meters (Öztin and Bayülke 1991). Even the Karaköy and Azapkapı bridges were submerged (Batur 1994). In Yeşilköy, the sea ebbed firstly about ten minutes after the earthquake and then giant waves lashed the shore and reached up to three rows of houses and took the front row away (Batur 1999). On August 17, 1999, The Kocaeli Earthquake with a magnitude of 7.6 was not only devastating but also deadly earthquake for Istanbul in recent years. Despite the approximately 110 km epicenter distance, 3073 buildings suffered extensive
20
Istanbul Resilience Approach Against Earthquake
437
damage, 11,339 buildings had moderate damage and 454 people died and 1880 people were injured in İstanbul (Özmen 2000). Damages in Istanbul especially Avcılar and Büyükçekmece during the Kocaeli Earthquake in 1999 raised and improved the awareness of disaster risk management and since then several scientific and institutional studies have been conducted on the potential earthquake of Istanbul.
20.6
Some Projects and Implementations for Istanbul Against Earthquake
The first known study recognized JICA conducted after 1999 Kocaeli Earthquake by Istanbul Metropolitan Municipality (IMM) is “The Study on A Disaster Prevention / Mitigation Basic Plan in Istanbul including Seismic Microzonation in the Republic of Turkey.” Within the scope of this study seismic microzonation studies were done in order to reveal the basis of disaster risk plan for Istanbul. It is the first-ever loss estimation analysis in case of a possible earthquake for Istanbul and makes recommendations for making construction earthquake resilient JICA. After the JICA as a diagnosis study for Istanbul against to earthquake hazard, Earthquake Master Plan (EMP) was published with the participation of four universities, Boğaziçi University, Istanbul Technical University, Middle East Technical University and Yıldız Technical University by IMM as a road map for treatments to reduce earthquake risk in 2003. EMP suggests well-documented necessary precautions for earthquake in terms of the fundamental principles under the titles of urban planning, legal, financial, educational, social, risk and disaster management issues. Besides, EMP could be used as a social contract between IMM and central administration, local government, institutions, NGOs, and enterprises EMP. During JICA and EMP studies, the necessity of the detailed geoscientific characteristics identification of Istanbul was understood clearly. For this reason, Microzonation studies (MICRO) were conducted between 2006 and 2009 by IMM in order to assess hazards’ potential such as earthquake, tsunami, landslide, flooding, and liquefaction by comprehensive geological, geophysical, geotechnical, and seismological investigations using approximately 10,000 drilling and seismic measures for each 250 m grid in study area totally 700 km2 of Istanbul which covers about 70% of the urbanized area of the city (MICRO 2009). Another significant study “Updating Estimations Of The Probable Earthquake In Istanbul” was conducted by IMM and Kandilli Observatory and Earthquake Research Institute in 2009 in order to make estimations of earthquake damages such as physical risks, casualties and economic losses at urban scale by using ELER program (Earthquake Loss Estimation Routine) (IMM 2009). This study was updated in 2019 by IMM because the city continues to grow and building stocks have been changed due to the urban transformation and renovation projects in the past decade. According to IMM (2019), results, it is estimated that 26%, 13%, 3%, and 1% of buildings in Istanbul will be possibly damaged slightly, moderately,
438
B. Ergün Konukcu
heavily, and severely, respectively. It means that 17% of buildings in the city (that is approximately 194.000 buildings) have a possibility to damage more than moderate damage against to potential earthquake with a magnitude Mw = 7.5. The essential thing at this point is to determine the priority zones from within severely possible damaged areas for urban transformation or renovation studies to earthquake risk mitigation. To comprehend the priorities for risk reduction implementation and define Istanbul’s most earthquake-prone districts or sub-districts (neighborhood), Megacity Indicator System for Disaster Risk Management (MegaIST) is developed for Istanbul by IMM with EMI (Earthquakes and Megacities Initiative), Kandilli Observatory and Earthquake Research Institute (EMI), Karlsruhe University. MegaIST is a decision-maker tool used for good strategy formulation, essential action, resource and capacity increase, investment and incentive proposal, determination of priorities, and tracking progress to make city earthquake resilient. Physical risk (building damage, casualties, lifeline damage, road blockage, fire outbreak possibility), social vulnerability (health status, property ownership, education, urban belonging, demography, risk perception, mobility, economic condition, intrinsic value), urban seismic risk (physical risk and social vulnerability), coping capacity of IMM (rescue & relief, shelter placement capacity, lifeline service, debris removal) were calculated for every district and sub-district and assessed holistically by using Analytical Hierarchy Process and then each district and sub-district got risk values. According to the risk values, integrated and analytical decision support base maps have been developed as project deliverables (MegaIST 2018). One of the most considerable projects to create resilient areas against challenges with a life high quality is the “Urban Renewal Project for Bayrampaşa District.” Bayrampaşa is one of the earthquake-prone districts of Istanbul. A part of the Ismetpaşa Neighborhood approximately 80,000 m2 in Bayrampaşa was made resilient by using “Produce & Transfer & Evacuate” urban transformation model with this project (UTP 2019). Not only IMM as a local government but also ministries, government bodies, public organizations, NGOs, enterprises, universities, and institutes have conducted several projects, implementations, and studies to make Istanbul more stronger against earthquake hazards. ISMEP (Istanbul Seismic Risk Mitigation and Emergency Preparedness Project) is one of the best examples of risk mitigation studies in Istanbul. This study was conducted by IPKB (Istanbul Project Coordination Unit) under the Governorship of Istanbul. IPKB have retrofitted and/or reconstructed 1253 school buildings and 115 health facilities such as hospitals, polyclinics etc. (IPKB). Making transportation elements resilient against challenges is an important step for risk reduction. The General Directorate of Highways (GDH) under the Ministry of Transport and Infrastructure and Transportation Department of IMM carry on its studies with the aim of transportation resilience. Critical bridges and viaducts in Istanbul such as suspension bridges (15 Temmuz and Fatih Sultan Mehmet), Haliç Bridge, Mecidiyeköy Viaduct were retrofitted within this scope (Apaydın 2014).
20
Istanbul Resilience Approach Against Earthquake
439
Istanbul Gas Distribution and Trade Inc. (IGDAS) under the IMM set up the “Natural Gas Network Earthquake Risk Reduction System” in order to mitigate risk that causes secondary disasters by turning off gas flow immediately after an earthquake (Bıyıklıoğlu and Türkel 2014). AFAD (Disaster and Emergency Management Presidency as an agency under the Ministry of Interior) has conducted two important studies for Istanbul to build a disaster-resilient community. One of them is The Disaster Response Plan of Istanbul as known TAMP Istanbul and the other one is the Istanbul Disaster Risk Reduction Plan known as Istanbul IRAP. TAMP Istanbul is prepared as a system including public institutions, private sector, non-governmental organizations, universities, and institutes with an integrated planning approach and modular structure for reducing operational risks during a disaster (TAMP 2019). IRAP is designed as a sustainable plan, which defines requires implementation, individuals responsible, and responsibilities within the disaster risk management process by taking into account the possible adverse impacts of disaster (IRAP 2020). In addition to these studies, many remarkable research studies related to earthquakes have been conducted in Istanbul. These studies are generally grouped under the title of disaster risk reduction such as hazard analysis, risk identification and reduction, disaster prevention and emergency management, etc. However, only disaster risk reduction studies against earthquake are not sufficient and effective to make cities resilient and sustainable in today’s conditions. At this point, it is necessary to build earthquake resilience with dynamic and systematic processes for all city components, sectors, and systems.
20.7
Istanbul Must Foster Its Resilient Ability, Capability, or Capacity
Istanbul is the largest city in Turkey and one of the most significant “megacities” in the world with approximately 16 million inhabitants. The city is rich in cultural heritage due to its historical process because Istanbul was the capital city of Roman, Byzantine, and Ottoman Empires. Since the foundation of the Turkish Republic in 1923, Ankara is the capital city of Turkey, but Istanbul remains the focal point of economy, finance, culture, education, health, logistics, transportation, innovation, and technology. All these structures, connections, interactions, operations, and organizations of foci points are under the threat of the anticipated Istanbul Earthquake. There are approximately 1,166,330 buildings in Istanbul (IMM 2019). It is estimated that if the potential Istanbul Earthquake occurs, about 17% of buildings in Istanbul will be affected by the destructive impact of earthquake (IMM 2019). Regarding potential building damage, approximately 25 million tons of debris may occur and about 640,000 households with nearly 2,000,000 people may need emergency shelter. Expected earthquake losses to infrastructures in Istanbul are
440
B. Ergün Konukcu
calculated respectively like water line repair number in 463 points, waste water repair number in 1045 points, and natural gas repair number in 355 points (IMM 2019). Rapid urbanization with the pressure of population growth is one of the major forces shaping Istanbul’s past, today, and future. About a century ago, there were 806,863 people living in Istanbul in 1927 (URL-1). Its population has increased drastically since the middle of the twentieth century and reached approximately 16 million. Not only 16 million but also temporary visitors to Istanbul due to some reasons such as education, health, trade, and tourism are also under the threat of a potential Istanbul Earthquake. Besides earthquakes, this historical city has faced various challenges during its historical process. These challenges destroyed, harmed, damaged, and weakened Istanbul but the city has thrived to reach the present day by using its inherent resilience. Istanbul is still trying to cope with several acute shocks (landslide, flooding, storm, cyber attack, etc.) and chronic stresses (traffic, displaced population, drought, water and food dependency, urbanization, energy insecurity, climate change, environmental degradation, biodiversity loss, unemployment, etc.). Fundamental duty of Istanbulites is to protect Istanbul against the challenges and then bring the city to the future. The inherent resilience specialty of Istanbul is inadequate at this point. Istanbul must gain Urban Resilience capability, ability, and the capacity with systemic and dynamic processes. Because Istanbul is more densely populated, threatened by multi shocks and stresses and more interrelated with any sectors of other cities and countries than ever before. During building urban resilience process, it is crucial to check the realities of Istanbul, reveal the challenges of Istanbul, and examine the existence and the lack of urban resilience characteristics for Istanbul.
Fig. 20.7 Cities’ complex structures
20
Istanbul Resilience Approach Against Earthquake
20.7.1
441
Check the Earthquake Realities of Istanbul
Cities consist of complex components, sectors, and systems working in harmony with each other (Fig. 20.7). To protect the functionality of complex structures against earthquake, cities must understand the strengths and weaknesses of these urban structures comprehensively. The tangible and intangible realities of cities’ complex structures make cities resilient or vulnerable to earthquakes. Realities of Istanbul can be used as a guide for making Istanbul resilient through its urban resilience journey. The realities of Istanbul’s complex structure must be queried by considering the here below topics in order to comprehend which topics need to be created, developed, and strengthened against to potential Istanbul Earthquake. • The existence of hazard, risk, and vulnerability analysis against to earthquake. • Resilience of built environment with well-coordinated physical and socioeconomic planning. • Cyber safety for cyber attacks. • The strength, suitability, prevalence, capacity, and accessibility of the infrastructure (waterline, waste water, gas, electricity, technological network). • Protection of natural resources, ecosystems, biodiversity. • Supporting of fragile groups (disabled people, unemployment, refugees, asylum seekers, and migrants). • Comprehensive communication and its functionality and continuity. • Economic stability, diversity, business continuity, and market efficiency. • The existence of well-conceived, constructed, and manageable decision-making bodies. • Preservation of cultural heritage. • Food security, production, access, dependency, supply, and logistics. • Functionality, strength, continuity, and prevalence of the transportation network. • Functionality of critical services. • Diversity, supply, capacity, renewability, and logistics of energy resources. • Water security and access to alternative water resources, capacity, supply, and logistics of water resources. • The capacity, sufficiency, continuity, functionality, and durability of education and health facilities. • Sufficient open space capacity. • Local government’s financial capacity and the existence of funding sources. • Basic services (transportation, water, sanitation, energy) accessibility with an affordable price. • Building emergency funds, allocating capital, diverse revenue streams. • Efficient, continuous, and alternative operation of logistics and supply chains. • Social services (education, healthcare, and community facilities) accessibility. • Social protection for the poor, disabled, and other fragile and vulnerable groups. • Adequate and redundant institutional capacity. • Risk aware strategies and politics.
442
B. Ergün Konukcu
• The awareness and susceptibility of earthquake. • Reserve capacities and alternative strategies on functionality of connections, interactions, operations, and organizations. • Strong and sustainable connections, interactions, operations, and organizations.
20.7.2
Check the Potential Secondary Hazards and Disaster Risk Dynamics Related to Earthquake
Anticipated Istanbul Earthquake can also trigger potential secondary hazards such as tsunami, landslide, flooding, fire, epidemic illness, and industrial accidents. Istanbul must strengthen its complex structures not only for the earthquake but also against the adverse impacts of secondary hazards (Fig. 20.8). Tsunami is one of the most significant secondary hazards for Istanbul. Seventeen districts of Istanbul located at the northern coast of the Marmara Sea were studied against Tsunami hazard by IMM. By using 11 different tsunami sources related to seismic effects and 3 different tsunami sources depending on submarine landslides in the Marmara Sea, 44 different tsunami scenarios were modeled for Istanbul (URL-3). If the tsunami occurs in the Marmara Sea, some historical and cultural heritages such as Dolmabahçe Palace and The city walls, some of transportation lines such as the entrance of Eurosia Tunnel, some trade, industry and logistic facilities such as Ambarlı Botaş, Tuzla Shipyard and Haydarpaşa Harbour, some housing, recreation areas, fishing ports, piers will have the possibility of vulnerability and damage. Another secondary hazard for Istanbul is epidemic illness. Potential damage to water lines, wastewater lines, and water scarcity can trigger the epidemic illness progress after an anticipated Istanbul Earthquake. According to IMM (2019) study, it is estimated that more than 7450 people were seriously injured and more than 37,500 people needed definitive hospitalization due to the earthquake. The inpatient bed availability of public, university, private, and city hospitals in Istanbul is 46,382 in 2020 (URL-2). After a potential Istanbul earthquake, the anticipated number of seriously injured people and people needing treatment in hospital could force the existing health system besides the current inpatients. Moreover, the possibility of increased demand for hospital care because of epidemic illness can occur. The potential increase in demand could bring the functionality of the healthcare system to a standstill and reduce service quality. The functionality and the service quality of healthcare systems must be strengthened against earthquake. Structural and non-structural damages in hospitals caused by earthquake could increase the number of losses and prolong the recovery period after an earthquake. Industrial accidents are also a critical secondary hazard for Istanbul. It is stated in IMM (2009) study that about 400 structures containing flammable or explosive materials will be seriously damaged because of the earthquake. This study is assumed that at least 50% of these structures have a fire probability. Because of
Fig. 20.8 Secondary hazards and disaster risk dynamics must be considered during urban resilience process
20 Istanbul Resilience Approach Against Earthquake 443
444
B. Ergün Konukcu
this reason, fire is a critical secondary threat for Istanbul after an earthquake (IMM 2009). Besides secondary hazards, disaster risk dynamics have also deep adverse impacts on city resilience (Fig. 20.8). As disaster risk dynamics (Fig. 20.8): • Lacunae in law, risk unaware politics, and insufficient institutional arrangement are detrimental stresses of decision and implementation processes and these stresses reduce institutional resilience. • Climate change impacts, environmental degradation, contamination, pollution, food shortage and dependency, water security and dependency and natural resource depletion force adversely not only natural life but also daily life and reduce environmental resilience. • Unplanned and rapid urbanization, demographic structures, improper land use, infrastructure failure, security problems, and traffic are significant challenges for urban life and reduce urban life’s resilience. • Disinvestment, lack of incentives, complicated supply chain, economic crises, business discontinuity, and unemployment are important weak points for economic sustainability and reduce economic resilience. • Brain drain, poverty, injustice, forcibly displaced people, vulnerable cultural heritage, migration, shortcomings of education system, problems in healthcare systems affect unfavorably the social fabric and reduce social resilience. • Problems in access to technology and cyber attack create fragile areas in city information, communication, and technological systems and reduce technological resilience. These are all disaster risk dynamics of Istanbul that will make Istanbul’s complex structures more vulnerable and fragile when the earthquake hits the city.
20.7.3
Check the Urban Resilience Characteristics of Istanbul for Earthquake Threat
During the resilience journey, the existence or the lack of urban resilience characteristics are critical to making cities resilient or not. If the city has urban resilience characteristics, these characteristics are pulling city to thrive being resilient. To make Istanbul resilient against the earthquake, it is essential to examine whether Istanbul has urban resilience characteristics or not. If Istanbul uses its past experience, current knowledge, future foresight to make it resilient, Istanbul is a reflective city. If Istanbul considers broad consultation with all related actors and stakeholders including fragile groups, Istanbul is an inclusive city. If Istanbul works together with all responsible systems and sectors, Istanbul is an integrated city.
20
Istanbul Resilience Approach Against Earthquake
445
If Istanbul has well-conceived, well-constructed, and well-managed systems, Istanbul is a robust city. If Istanbul has spare capacity for functionality, Istanbul is a redundant city. If Istanbul has ability to adapt to changing circumstances, new technologies or knowledge, Istanbul is a flexible city. If Istanbul has capacity to find new resources or alternative ways to use resources, Istanbul is a resourceful city. If Istanbul offers alternatives to diversify services, functions, and processes for continuity to cope with challenges, Istanbul is an adaptable city. If Istanbul has ability to prepare itself for anticipated current and future shocks, Istanbul is a persistent city. If Istanbul has ability to transform for positive change, Istanbul is a transformative city. If Istanbul supports knowledge sharing, collaborative and strategic planning and interoperability between its systems, Istanbul is coordinated city. Lacking urban resilience characteristic or characteristics must be gained to urban components, sectors, and systems immediately to enhance Istanbul’s resilience. Because these characteristics support Istanbul to cope with, withstand, and struggle against earthquakes. “Resilience Characteristics Matrix” can be used to check if Istanbul has urban resilience characteristics or not (Fig. 20.9). Istanbul’s complex structures, earthquake, and potential secondary hazards and urban resilience characteristics must be assessed together in order to grasp the strengths, weaknesses, opportunities, and threats of city through the resilience. Earthquake Resilience Matrix can be used as a guide to understand Istanbul Earthquake resilience profile and how to foster the resilient ability, capability, or capacity of Istanbul (Fig. 20.10).
20.8
Istanbul Resilience Approach Against Earthquake
Istanbul needs to be more resilient and more sustainable ever than before. The aim of making Istanbul “Earthquake Resilient City” and “Sustainable City against to Earthquake” only comes true with a holistic resilient approach, an integrated assessment and a supra-disciplinary study. Istanbul is an earthquake-prone city. Earthquake threat to Istanbul is defined as one of the most destructive acute shocks for the city. Istanbul must develop a vision, which completely reflects the city needs for earthquake with a resilient approach. Istanbul’s vision against earthquake must be “Earthquake Resilient City” having the capacity, capability, and ability to withstand disruptive events and adverse impacts of earthquake. Earthquake resilience is a skill of cities to cope with earthquakes. This skill is improved through a dynamic and systematic process. The vision of “Earthquake Resilient City” must be organized around the principles of safety, livability, inclusivity, and functionality for Istanbul. Under the “Earthquake Resilience Vision,”
Fig. 20.9 Checklist between urban complex structure and urban resilience characteristics
446 B. Ergün Konukcu
Istanbul Resilience Approach Against Earthquake
447
Fig. 20.10 Earthquake Resilience Matrix
20
448
B. Ergün Konukcu
Fig. 20.11 Earthquake resilience vision
Istanbul must be a functional city, inclusive city, safe city, and livable city (Fig. 20.11). Istanbul must be more inclusive for the people living in the city against the earthquake threat. Inclusive city provides basic and social services equally to citizens. Being inclusive accepts that earthquake affects different groups at different scales and these different groups perceive earthquake differently. Istanbul must consider different stakeholders (decision makers, public institutions, private sector, community, academia, NGO), forcibly displaced people, fragile and vulnerable groups during the processes of strategy formulation, determination of actions and prioritization of implementation projects for “Earthquake Resilient City” (Fig. 20.12). Istanbul as an inclusive city must bring earthquake-related and responsible stakeholders together to comprehend clearly how they are positioned toward earthquake topics, to create broad consultation for experience share and to understand the lack of coordination of earthquake-related topics (Fig. 20.12). Istanbul hosts lots of people from all over the world who have been forced to flee their countries as a refugee, asylum-seekers, an immigrant, or came to the city for better education and job opportunities, etc. Istanbul as an inclusive city must protect them from adverse impacts of an earthquake. At this point, solidarity, risk awareness, and perception studies have critical importance (Fig. 20.12). Istanbul as an inclusive city must conduct projects for making fragile and vulnerable groups more resilient and more stronger against earthquake. Otherwise, these groups can trigger social vulnerability against earthquake (Fig. 20.12).
20
Istanbul Resilience Approach Against Earthquake
449
Fig. 20.12 Principle: inclusive city
Fig. 20.13 Principle: livable city
Livable city against earthquake is the focus to strengthen economy, city identity, and community. Making economy robust, building the city identity, protecting and supporting the fundamental rights of community against potential Istanbul earthquake are critical steps for “Earthquake Resilient City” (Fig. 20.13). Istanbul as a livable city must know how to avoid and respond to economic shocks and stresses. Istanbul needs a resilient economic system not only for absorbing adverse effects of economic pressures but also recovering quickly from economic crises. Economic diversity, strong city budget, strong local economy, international economic links, effective labor policy, employment, business
450
B. Ergün Konukcu
continuity, local business development, innovation, sustainable finance mechanism, investment, and incentives are significant dynamics for “Earthquake Resilient City” (Fig. 20.13). To make Istanbul economic resilient, Istanbul must thrive these dynamics in city’s economic structure. Istanbul as a livable city must have city identity as “Earthquake Resilient City.” Having such a city identity supports protecting city and embedding resilience thinking into city’s institutions and community. City identity is related to community participation, solidarity, social support, city belonging, and cultural heritage (Fig. 20.13). Istanbul as a livable city must be inclusive, equitable, and just for all its citizens as “Earthquake Resilient City” in order to strengthen social resilience. Security, power, dignity, right, and remedies are significant for these cities (Fig. 20.13). Functionality is one of the most significant indicators of urban resilience. If the city is “Earthquake Resilient City,” the city maintains functionality for all sectors and services after an earthquake. The principle of functionality has three themes as critical facilities, participation, and effective leadership (Fig. 20.14). Istanbul as a functional city must protect and support the functionality of critical facilities with spare capacity and alternative strategies not only for daily life but also in hard times. Especially the preservation of the critical facilities functionality hampers to occur other problems and challenges. To bounce back better from adverse impacts of earthquake in difficult times, the continuity of critical facilities services plays a significant role (Fig. 20.14). Istanbul as a functional city must encourage participation in governance process, risk awareness projects, risk monitoring actions, risk transfer implementations, knowledge and experience sharing studies. Broad consultation and integrated studies are crucial for this principle (Fig. 20.14).
Fig. 20.14 Principle: functional city
20
Istanbul Resilience Approach Against Earthquake
451
Fig. 20.15 Principle: safe city
Istanbul as a functional city can reach “Earthquake Resilient City” with effective leadership. This leadership must be built on strategic visions, mutual reliance, decisive leaders, decision-maker offices, inspiring goals, knowledge-based studies, and inclusive politics (Fig. 20.14). Safe city withstands, copes with, and struggles against earthquake and protects its urban components, systems, and sectors against the adverse impacts of earthquake (Fig. 20.15). Istanbul as a safe city must have resilient urban components against earthquake. Urban components include building environment, cyberspace, infrastructure, environment, social structure, community network, economic structure, governing structure, and cultural heritage. Affordable and safe housing, cyber security, strength, and functional infrastructure, sustainable environment, protection of social fabric, continuity in communication, strong economy, inclusive governing, preservation of cultural heritage are vital indicators for “Earthquake Resilient City” (Fig. 20.15). Istanbul as a safe city must protect and make strong urban sectors. Safe city must comprehend dependencies and interdependencies within urban sectors in detail. Urban sectors comprise of food systems, transportation and accessibility, solid waste, energy, local economy, water and sanitation, information and communication technology, finance, logistics and supply, education, health, and social protection. Because the links between urban sectors are the fragile points of “Earthquake Resilient City” journey and potential damage in any urban sector can impact other urban sectors adversely. For example, if the city is food-dependency city, a potential damage in logistics and supply chain sector due to earthquake could impact city’s food system negatively (Fig. 20.15). Because of this reason, Istanbul must strengthen not only urban sectors but also the links between them.
452
B. Ergün Konukcu
Istanbul as a safe city must support continuity of urban systems. Urban systems consist of connections, interactions, operations, and organizations both between urban components and between urban sectors, as well as between the urban components and urban sectors (Fig. 20.15). Any damage to urban systems can trigger various challenges and problems for city and it can make the city more vulnerable. One of the most significant fundamental causes to make Istanbul earthquake resilient is to make city sustainable. For this reason, Istanbul Resilience Approach must consider sustainability against earthquake.
20.9
Istanbul Sustainable Resilience Strategy Against Earthquake
Istanbul must be a “Sustainable City against Earthquake” for future generations. By considering the vision of “Earthquake Resilient City” with the principles of functional city, inclusive city, safe city and livable, “Sustainable Resilience Strategy” must be formulated for Istanbul. The sustainable resilience strategy must be framed by four topics: • • • •
Natural Life and Humanitarian Values Resilience Urbanization Sustainability
Under the topic of Natural Life & Humanitarian Values, the priority approach must be “Respect to Natural Life & Humanitarian Value” for all decisions, studies, plans, and implementations. Against the challenges, shocks, stresses, and uncertainties, Resilience must be the goal for the city. The projects related to risk reduction and increasing adaptive and absorbing capacity must be prioritized and initiated with suitable investment programs and incentives for making the city resilient. Urbanization process must be shaped around safe, livable, nature-conscious, equitable, and inclusive decisions. Sustainability must be another goal for the city with effective strategies. Sustainability process must include economic growth, social progress, environmental management with resource management, and reserve capacity (Fig. 20.16). By using the vision of “Earthquake Resilient City” and “Sustainable Resilience Strategy,” urban sustainability must be formulated for Istanbul. During building urban sustainability process, urban resilience dynamics and pile of challenges must be taken into consideration (Fig. 20.17). Not only earthquake threatens Istanbul with secondary hazards but also disaster risk dynamics weaken the city fabric. In addition to this, the potential disaster, exposure level, the possibility of vulnerability, global trends, and uncertainties make pressure on city’s complex structures. These are all threats to the sustainability of Istanbul (Fig. 20.17).
20
Istanbul Resilience Approach Against Earthquake
453
Fig. 20.16 Sustainable resilience strategy (developing from Sustainable Resilience Approach, Konukcu 2020)
Fig. 20.17 Urban Sustainability against earthquake threat
When Istanbul can build urban resilience against to earthquake by strengthening coping capacity with risk definition, risk prevention, risk reduction, awareness, perception, investments, incentives, adaptive capability, absorbing capacity,
454
B. Ergün Konukcu
transformative ability, capacity increase, resource management Istanbul withstands, copes with and struggles against the earthquake threat (Fig. 20.17). Actions, road maps, and implementations for urban sustainability for Istanbul must be defined with the urban resilience approach including vision of “Earthquake Resilient City,” strategy of “Sustainable Resilience Strategy,” challenges and urban resilience dynamics. Then related criteria, indicators, or indices must be systematized for Istanbul to build Sustainable Urban Resilience as a framework (Fig. 20.17). Sustainable Urban Resilience as a framework can be used to understand the risk profile of Istanbul and make more resilient and more sustainable against any challenges threatening Istanbul. Istanbul needs a “Sustainable Urban Resilience Framework” not only to cope with changing, diversifying, strengthening, evolving, anticipated, and unpredictable urban challenges but also to increase its capacity and produce alternative strategies. Istanbul’s actions and implementations against earthquake have been limited because of the cities’ other chronic, acute, evolving, and agenda challenges until today. Istanbul must foster actions and implementations for making the city more resilient and sustainable; otherwise, cost of non-action against earthquake will be destructive for the city. What should be made for Istanbul to be more resilient and sustainable against earthquake? Istanbul must comprehend the link between not only risk and resilience but also resilience and sustainability in order to understand how to run earthquake implementation projects. Istanbul must ensure coordination between governance and finance mechanism in order to make real earthquake-resilient projects. Istanbul must formulate city’s resilience-building strategies, actions, and implementations considering increasing city’s capacities with alternative strategies. During the building process of “Sustainable Resilience Strategy,” pile of challenges, risk-informed actions, community capacity increase, nature-based solution, humanitarian values and innovative entrepreneurship must be considered. “Sustainable Urban Resilience” as a framework for Istanbul must be shaped at system-based resilience and present a systemic approach and a dynamic process. “Sustainable Urban Resilience” as a framework for Istanbul must be sensitive to changing global trends, sensible to uncertainties, and responsive to chronic stresses and acute shocks. “Sustainable Urban Resilience” as a framework for Istanbul must be formulated with collective memories and aimed at physical, social, economic, environmental, and administrative resilience. Earthquake is one of the most destructive shocks for Istanbul. Istanbul’s future cannot be abandoned to Istanbul’s fate against the earthquake threat. By using vision of “Earthquake Resilient City” and “Sustainable Resilience Strategy,” “Sustainable Urban Resilience” as a framework for Istanbul must be formulated and implemented immediately. “Define the Challenge And Thrive It,” “Find the Barrier And Remove It,” “Anticipate the Future And Understand the Uncertainty,” and “ Comprehend the Capacity and Increase It” must be Istanbul Sustainable Resilience mottoes through Istanbul Sustainable Resilience journey.
20
Istanbul Resilience Approach Against Earthquake
455
References (100RC) 100 RESILIENT CITIES (2019) Resilient cities, resilient lives, learning from the 100 RC network. s.6 Ambraseys NN, Finkel CF (1991) Long-term seismicity of Istanbul and of the Marmara Sea region. Terra Nova 3:527–539 Apaydın NM (2014) Ulaşım Sistemindeki Güçlendirme Çalışmaları, Deprem Dergisi, İstanbul Teknik Üniversitesi Vakfı Yayını, Ekim – Aralık 2014, sayı 66 (ARUP-TRF) ARUP, The Rockefeller Foundation (2018) City resilience index, understanding and measuring city resilience. https://www.arup.com/perspectives/publications/research/section/ city-resilience-index Batur A (1994) Bir depremin yüzyıl dönümü. İstanbul Dergisi 10:24–33 Batur A (1999) Muharrem ayında bir salı günü, Cogito, Deprem Özel Sayısı, Sayı 20, 42–59. Yapı ve Kredi Yayınları, İstanbul Bıyıklıoğlu H, Türkel V (2014) IGDAS Natural Gas Network Earthquake Risk Reduction System. Secınd European conference on earthquake engineering and seismology, Istanbul. August 25–29, 2014 (CRED-UNDRR) Centre for Research on the Epidemiology of Disasters (CRED) & United Nations for Disaster Risk Reduction (UNDRR) (2020) Human Cost of Disasters İstanbul’un Olası Deprem Kayıpları Tahminlerinin Güncellenmesi İşi (2009) https://8luvomezzzsk. merlincdn.net/wp-content/uploads/2020/05/iSTANBUL-OLASI-DEPREM-KAYIPLARITAHMiNLERiNiN-GUNCELLENMESil_SONUC_RAPOR_2010.09.pdf İstanbul İli Olası Deprem Kayıp Tahminlerinin Güncellenmesi Projesi (2019) https://depremzemin. ibb.istanbul/calismalarimiz/tamamlanmis-calismalar/istanbul-ili-olasi-deprem-kayiptahminlerinin-guncellenmesi-projesi/ (IPKB) https://www.ipkb.gov.tr/en/what-is-ismep/b-component/ (IRAP) T.C. İçişleri Bakanlığı Afet ve Acil Durum Yönetimi Başkanlığı, İstanbul İl Afet Risk Azaltma Planı Hazırlama Kılavuzu (2020) Koç Yunus (2010) “Osmanlı Dönemi İstanbul Nüfus Tarihi”, TALİD Türkiye Araştırmaları Literatür Dergisi, C. 8, Sayı: 16, (MLA; TÜBİTAK-ULAKBİM: SBVT), s. 171–199 Konukcu BE (2020) Akut Şok ve Kronik Stresler Karşısında Kentsel Dayanıklılık & Sürdürülebilir Dayanıklılık Yaklaşımı. Resilience 4(2):323–345. https://doi.org/10.32569/resilience.796942 Konukcu BE (2023) Sürdürülebilir Kentsel Dayanıklılık, Doğa Olayları Karşısında Kentsel Dayanıklılık ve Sürdürülebilirlik. Anadolu Üniversitesi, Açıköğretim Öğrenci Kitapları (MegaIST) Megacity Indicator System for Disaster Risk Reduction (2018) https://depremzemin. ibb.istanbul/megaist/ (MICRO) Avrupa Yakası (2007) ve Anadolu Yakası (2009) Mikrobölgeleme Projeleri https:// depremzemin.ibb.istanbul/calismalarimiz/tamamlanmis-calismalar/istanbul-ilimikrobolgeleme-projeleri/ Orgun Z (1941) 1509 (Hicri 915) senesinde İstanbul’u baştan başa harap eden zelzele ve şehri tamir için alınan tedbirler. Arkitekt Neşriyatı, İstanbul Özmen B (2000) 17 Ağustos 1999 İzmit Körfezi Depremi’nin Hasar Durumu (Rakamsal Verilerle) (TDV/DR 010–53). Retrieved from: http://deprem.gazi.edu.tr/posts/download?id=43388 Öztin F, Bayülke N (1991) Historical earthquakes of İstanbul, Kayseri, Elazığ, in Proc. of the workshop on historical seismicity and seismotectonics of the mediterranean region, 10–12 Oct. 1990, İstanbul, Turkish Atomic Energy Authority, Ankara, pp. 150–173 (TAMP) T.C. İstanbul Valiliği İl Afet ve Acil Durum Müdürlüğü, İstanbul İl Afet Müdahale Planı (2019) (UN) The World’s Cities in 2018, Data Booklet. New York: UN DESA (2018) (UNCDD) United Nations Convention to Combat Desertification, The land in numbers 2019. Risks and opportunities. Bonn: UNCCD. s.3 (UN-Habitat2) United Nations Human Settlements Programme, City Resilience Profiling Tool. http://urbanresiliencehub.org/wp-content/uploads/2018/02/CRPT-Guide.pdf
456
B. Ergün Konukcu
(UN-Habitat) United Nations Human Settlements Programme, Trends in Urban Resilience (2017) URL-1 30.11.2021. retrieved from www.ibb.gov.tr/tr-TR/BilgiHizmetleri/Istatistikler/Documents/ demografi/t211.pdf URL-2 30.11.2021. retrieved from https://dosyasb.saglik.gov.tr/Eklenti/43399,siy2020-tur-260 52022pdf.pdf?0 (UTP) Urban Renewal Project for Bayrampaşa District, Directory of Urban Transformation, Istanbul Metropolitan Municipality (2019) www.ibbbayrampasadonusum.istanbul (WB) World Bank, City strength resilient cities programme (2018) http://documents1.worldbank. org/curated/en/996471525721935888/pdf/125991-WP-P150083-PUBLIC-CityStrength-Guide book-2018.pdf
Part IV
Pandemic, Vulnerabilities and Ethics
Chapter 21
The Covid-19 Protection Index (CPI) as a Way to Identify Vulnerabilities and Disparities Across Brazilian Territories Bruna Gaudencio Guimarães, Maira Begalli, Patrícia Magalhães, Pamela M. Chiroque-Solano, Maria Carolina Maziviero, and José Paulo Guedes Pinto
Abstract In Brazil, the Covid-19 pandemic spread across an extremely unequal and exclusory territory, disproportionately affecting the most vulnerable populations. In order to identify how living and habitability conditions and their overlap with
B. G. Guimarães (✉) · M. Begalli Universidade Federal do ABC, São Bernardo do Campo, Brazil P. Magalhães Universidad Complutense de Madrid, Madrid, Spain Instituto Tecnológico de Aeronáutica, São José dos Campos, Brazil Coordenação de Aperfeiçoamento de Pessoal de Nível Superior/Brazil (CAPES), Brasília, Brazil P. M. Chiroque-Solano Universidade Federal Rural do Rio de Janeiro, Nova Iguaçu, Brazil University of Lisboa, Lisboa, Portugal Coordenação de Aperfeiçoamento de Pessoal de Nível Superior/Brazil (CAPES), Brasília, Brazil Centre for the Research and Technology of Agro-Environmental and Biological Sciences, Institute for Innovation, Capacity Building and Sustainability of Agri-food Production (Inov4Agro), University of Trás-os-Montes and Alto Douro (CITAB-UTAD), Vila Real, Portugal M. C. Maziviero Universidade Federal do Paraná, Curitiba, Brazil Coordenação de Aperfeiçoamento de Pessoal de Nível Superior/Brazil (CAPES), Brasília, Brazil J. P. Guedes Pinto Universidade Federal do ABC, São Bernardo do Campo, Brazil Coordenação de Aperfeiçoamento de Pessoal de Nível Superior/Brazil (CAPES), Brasília, Brazil © The Author(s), under exclusive license to Springer Nature Switzerland AG 2023 S. D’Amico, F. De Pascale (eds.), Geohazards and Disaster Risk Reduction, Advances in Natural and Technological Hazards Research 51, https://doi.org/10.1007/978-3-031-24541-1_21
459
460
B. G. Guimarães et al.
gender, race, and class affect the impact of Covid-19 on certain social groups, the “Ação Covid-19” research group developed the Covid-19 Protection Index (CPI) as an alternative to the Human Development Index to measure inequalities in the context of the pandemic. Our aim was to examine specific territories (states, cities, and neighborhoods) and demonstrate how the spread of the SARS-CoV-2 virus could be associated with a socially exclusory model of territorial occupation, what regions and populations would be most severely affected, and who would suffer most if measures to mitigate the spread of the pandemic were not taken (potentially increasing these populations’ vulnerability). The CPI uses data from the Brazilian Institute of Geographical and Statistical Research (IBGE) to build fourteen variables classified along three dimensions: the urban surroundings of households (Urban Environment), the living standard inside households, and the human dimension. At all territorial scales, the CPI corresponded to actual Brazilian inequalities. The index was found to be negatively correlated to the number of cases and deaths at the beginning of the pandemic, giving us a good portrait of the pre-existing vulnerabilities to which populations are subject in Brazil. We also used the index as an input in a simulator developed by our research group to emulate the dynamics of the virus’s spread in different neighborhoods within a city. As expected, we observed higher infection curves for low CPI territories and flatter curves for high CPI neighborhoods. Furthermore, even among lower CPI territories we found important discrepancies, as some communities were able to organize themselves to protect the community from the virus even in the absence of public intervention measures. The CPI was also juxtaposed to vaccination rates in Brazil, where we found that the vulnerabilities pointed out by the CPI were maintained, reflecting the national vaccination program’s lack of prioritization of more vulnerable populations. The index was shown to be a good tool to identify vulnerable territories, and thus could be used to direct government action, pointing out those territories that should be prioritized not only in terms of the healthcare system but other interrelated matters, such as their environment, economy, demography, housing, and territorial infrastructure. Keywords Urban infrastructure · Living standard · Pandemic · Brazil · Vulnerability index
21.1
Introduction
The disease caused by the novel coronavirus, Covid-19, spread rapidly across the heterogeneous territory of Brazil starting in February 2020. After more than a year and a half of this global pandemic, the unequal and perverse impact of the disease in low-income communities has been well-established, especially within historically more vulnerable populations such as residents of slums and tenements,
21
The Covid-19 Protection Index (CPI) as a Way to Identify. . .
461
quilombolas,1 black and brown citizens, indigenous people, riverside dwellers, and the homeless population (Freitas et al. 2011). Brazilian territories are known to be extremely heterogeneous, ranging from full to no access to health services (Albuquerque et al. 2017), education (INEP 2019), urbanization (Costa and Monte-Mór 2002; Santos 1993), housing (PNAD 2019), and basic sanitation (Trata Brasil 2020). During crisis periods or following natural disasters, socially vulnerable populations are most often at the greatest risk (Neumayer and Plümper 2007; Hutchins et al. 2009; Quinn and Kumar 2014). Recent studies also indicate that these populations have disproportionately been negatively affected by the Covid-19 pandemic (ONS 2020; Tai et al. 2020, Abedi et al. 2020; Arndt et al. 2020; Thakur et al. 2020). In order to identify how living and habitability conditions, and their spatial overlap with gender, race, and class (Massey 1994), affect the impact of Covid-19 on certain social groups, the “Ação Covid-19” research group2 developed the Covid19 Protection Index (CPI). The CPI brings together a series of indicators in the scope of urban, housing, and social infrastructure to better identify those disparities among various localities and populations. Our aim was to examine specific territories (states, cities, and neighborhoods) and their relationship to infection and lethality rates resulting from the novel coronavirus. Using the CPI, we sought to demonstrate how the spread of the SARS-CoV-2 virus can be associated with a socially exclusory model of territorial occupation, what regions and populations3 will be more severely affected, and who will suffer more if measures to mitigate the spread of the pandemic are not taken (which can increase the condition of vulnerability). In Brazil, homeless people, residents of slums or tenements, quilombolas, black and brown populations, indigenous people, and riverside dwellers are widely recognized as vulnerable populations (Varanda and Adorno 2004; Coimbra Jr. et al. 2013; Chor and Lima 2005, Torres et al. 2003, Gonçalves and Domingos 2019). Most likely they are more susceptible to the consequences of the Covid-19 pandemic because of their territory’s pre-existing vulnerabilities. The Covid-19 pandemic created a very serious health, economic, political, and social crisis in Brazil, with a brutal worsening in living conditions, especially for the poorest and most vulnerable populations in the country. According to information gathered by the NGO Habitat para a Humanidade Brasil (2020), in 92% of the areas monitored, access to water was equal to or worse than before the pandemic, which means that there was no reinforcement or alternatives to reverse these difficulties. In addition, the study showed that evictions continued to occur during the pandemic. Many eviction threats related to
1
Descendants of runaway slave communities “Ação Covid-19” collective website: https://acaocovid19.org/ 3 Especially those who are victims of varied forms of violence and those that inhabit low-income territories (Corburn et al. 2020) 2
462
B. G. Guimarães et al.
infrastructure works and repossessions predate the pandemic. That means that while the vulnerability of low-income territories and precarious settlements predates the pandemic, they were also aggravated by it. Regarding the overlap between these spatial characteristics and race, the survey carried out by the Center for Operations and Intelligence in Health (NOIS) highlighted the impact of racial inequalities on Covid-19 mortality in Brazil. The data show that among hospitalized white patients, 62.07% managed to recover from the disease and 37.93% died. For the black and brown population, the outcomes are inverted: 54.78% died and 45.22% recovered. In fact, in large Brazilian cities such as São Paulo, Rio de Janeiro, and Manaus, the highest concentration of cases and deaths at the beginning of the pandemic occurred in neighborhoods with lower incomes, education, and access to sanitation services, and higher population densities, concentration of black residents, and female-headed households with monthly income of less than US$6504 (Instituto Pólis 2020; PrContraCovid 2020). Regarding gender, according to Maziviero and Marafigo (2020), even though men and women have been infected in the same proportion and women’s survival rates are significantly higher, the overlap of gender, race, and class on top of geographic distribution and habitability conditions reveals a deepening during the pandemic of vulnerabilities to which a large portion of female-headed households are already subjected. Women are also at the forefront of healthcare professions that deal with those infected by Covid-19. According to the International Labour Organization (ILO) (ILO—International Labour Organization 2018; ILO—International Labour Organization 2020), women represent 70% of the workforce in health services and the third sector. In Brazil, 85% of nursing technicians are women, according to the most extensive survey on the profession conducted in Latin America—the “Profile of Nursing Study” produced in 2013 by the Federal Council of Nursing (COFEN) in partnership with the Oswaldo Cruz Foundation (Fiocruz). In addition to the high risk of infection, these professionals face a high degree of stress, with massive physical and emotional costs. Indicators and indexes have been used extensively by researchers and policymakers to provide a better understanding of inequalities within the social structures of each territory. Indexes to measure social vulnerabilities are applied both to investment planning and for managing emergency situations in order to support the specific needs of different populations (Fatemi et al. 2017). In this sense, one of the indexes with wide applicability around the world is the Human Development Index (HDI). The HDI is important for a broad population diagnosis as it considers the life expectancy of individuals at birth, their access to education, and the Gross Domestic Product (GDP) in terms of per capita purchasing power parity. If used as the sole social variable, the HDI does not provide an accurate assessment of the spread of the
4
In 2021 the minimum monthly wage in Brazil was set at R$1,192.40. As of October 18, 2021, the exchange rate was US$1.00 = R$5.52.
21
The Covid-19 Protection Index (CPI) as a Way to Identify. . .
463
SARS-CoV-2 virus, as it lacks other significant and interdependent factors that reflect the wide diversity of various territories. Because of its vast extent and simplicity, the HDI cannot point out those human and environmental conditions that most affect vulnerable populations in the pandemic, such as the intersection between gender and race as a matrix for the reproduction and legitimization of inequalities. The “Ação Covid-19” research group developed the Covid-19 Protection Index to examine how habitability and living conditions affect the pandemic’s impact on particular social groups. To validate the index, we developed several analyses to compare CPI results with Covid-19 statistics, and also evaluated the CPI’s robustness through unsupervised machine-learning techniques. The fixed variables used to calculate the deterministic IPC value were chosen based on urbanistic models. In Brazil, the “peripheralization” of deaths from covid-19 revealed the vulnerability of our population and the severity of the situation. This is because the most harmed were people who live with worse sanitary conditions and have a much more fragile housing structure to be able to carry out preventive isolation or to deal with the situation of having cases in their own family. However, the vulnerability of some groups linked to the place they occupy in the territory is not new, but well debated in the field of Brazilian urban studies. Thus, the choice of variables comes from this theoretical framework on the uneven development of Brazilian cities, which includes the works of Maricato (1996), dos Santos (1993), Smolka and Cenecorta (2000), and Villaça (1999). This article’s main objective is to present the CPI’s potential as a tool for measuring the impact of the pandemic across different territorial levels and, by doing so, provide support for the formulation of specific public policies that could mitigate pandemic risks for vulnerable populations. The CPI has also been used as a parameter in the simulation software developed by the “Ação Covid-19” research group (Guedes Pinto et al. 2020; Magalhaes et al. 2020) that predicts the dynamics of coronavirus transmission in a given territory. In this model, the effective probability of virus transmission is linked to the CPI, and it was used to study the unequal spread of the virus in a city. Although we used the CPI to study at least four major Brazilian cities, in this paper we will provide detailed results for the city of Rio de Janeiro, which highlights the important potential for this index as an information and action tool to be used by the population and by public authorities.
21.2
Methodology
The CPI tool encompasses all territorial levels, so that it can be used for neighborhoods, districts, municipalities, and states. In the next section, all Brazilian municipalities and states are classified according to the CPI. In our case studies, analysis is focused mainly on the neighborhood level, where CPIs are more heterogeneous, as this allows correlations with indicators for Covid cases and deaths, which reflect inequalities.
464
B. G. Guimarães et al.
The CPI was initially developed based on the methodology of the Surroundings Index (S.I.), which consists of measuring territories’ infrastructure by using data gathered from census tracts (Ranieri and Begalli 2016) by the Brazilian Institute of Geographical and Statistical Research (IBGE). Fourteen variables were added to the CPI deterministic weighting system and were classified according to three dimensions: the urban surroundings of households (Urban Environment), the living standard inside households, and the human dimension. The 2010 Brazilian Demographic Census database (IBGE 2010), which collects socioeconomic data and other characteristics of the Brazilian population, was used as our credible source of data to calculate the CPI. The Demographic Census database is homogeneous and has nationwide coverage. Even though it was collected more than a decade ago, the data does not under-represent the country’s socioeconomic improvements since then, due to the fact that Brazil entered a so-called “lost decade”5 while the global economy continued to grow. Each of the fourteen variables that compose the CPI, presented in Fig. 21.1, was chosen in order to assess levels of inequality while also taking into account the presence or absence of basic public policies covering the territories. In the urban environment dimension, these indicators include road conditions and basic sanitation; the living standards dimension includes connections to water supply networks, number of people per household, and household income, among others; and finally, in the human dimension, indicators that directly impact the individual’s conditions were considered, such as race, literacy, and female-headed households. The process of developing the CPI also took into account the distribution of public and private health systems in Brazil, as well as the availability of health supplies such as intensive care units and respirators. The main obstacle we encountered here was the lack of a centralized database for the private health system, which has 47,058,401 beneficiaries (about 22% of the Brazilian population).6 Because the private health system covers almost one-fourth of the Brazilian population and the data is not centralized or available, we decided to not compute a health variable using only the data from the public health system, because this could provide a misleading CPI reading and would not adequately portray the vulnerability of some territories, directly impacting the indicator’s robustness. Each indicator value is available in the IBGE (2010) database, and for each indicator we created a value between 0 and 1 that corresponds to the percentage of households that meet that condition in the selected territory (census tract). For example, if for a given district in the city of Rio de Janeiro the water supply indicator
One indicator to support the “lost decade” epithet is that between 2011 and 2020 Brazil’s per capita Gross Domestic Product (GDP) declined 0.2% per year on average, while world’s wealth grew by 0.4% in the same period (FGV 2020). 6 According to data from the Beneficiary Information System (SIB/ANS/MS) collected in September 2020 5
21
The Covid-19 Protection Index (CPI) as a Way to Identify. . .
465
Fig. 21.1 Dimensions and indicators of the Covid-19 Protection Index (CPI). Source: Developed by “Ação Covid-19” research group
is 0.4, this means that according to the IBGE 40% of the households in that specific territory have access to water networks. The same logic applies to all indicators. The CPI is computed on two levels. The first level encompasses the broader dimensions, while the second level provides weights for each indicator. Specifically, we used a matrix with 14 indicators (columns) and computed each dimension i as the weighted sum of the indicator values times the wiji , for all Ji within dimension i. The output is a matrix with three dimensions, whose values are weighted by wi = 1/3 for all i describing the first level of the hierarchy system. In other words, the weight of each indicator is equal within each dimension, and the weight of each dimension is equal to the others. We did this as a preliminary approach to stress the relative importance of each form of deprivation in the final measure. The selection of weights reflects normative judgments related to the purpose of the measure. The robustness of the CPI was evaluated by comparing CPI values obtained using our deterministic method with two alternative values, called CPI′ and CPI″, which were calculated based on unsupervised machine-learning techniques, namely, Principal Components Analysis (PCA) and Factorial Analysis (FA). There was, respectively, a 4.7% and 6.8% disparity between the deterministic method and the machine learning techniques. Based on these indicators we verified that our CPI is effectively equivalent to the CPI values achieved using unsupervised machine-learning techniques. The principal component analysis was used only to validate the CPI values. Two methods were used as strategies to guarantee that the deterministic IPC value had
466
B. G. Guimarães et al.
Table 21.1 CPI interval bands
CPI score Above 0.8 0.7–0.799 0.6–0.699 0.5–0.599 Below 0.5
CPI band Very high High Medium Low Very low
Source: Developed by “Ação Covid-19” research group
equivalent results as other unsupervised machine learning/multivariate techniques. This analysis yields robust insights providing confidence in our methodology. To compute the index for every territorial level, we applied the average as an aggregation statistic, so that for each municipality we calculated the average of all neighborhoods, and for each state, we calculated the average of all municipalities. We created clusters of CPI values to classify territories by levels of vulnerability to Covid-19 and compared them. Thus, a scale with five bands was defined (Table 21.1) based on the HDI cutoff points.7
21.3 21.3.1
CPI Applications Mapping the Vulnerable Regions
As previously mentioned, the CPI is a tool to measure territorial inequalities and identify vulnerabilities, and it is especially accurate when used to conduct analyses within unequal municipalities. However, it is also interesting to observe the CPI on a broader scale, which reveals regional disparities in Brazil. In Fig. 21.2, we provide the CPI for each Brazilian state. At a first glance, the CPI corresponds to Brazil’s regional inequalities, with the states from the North and Northeast of Brazil historically being the less developed states as well as the states least protected against Covid-19, while the South and the Southeast regions are the most developed, and also the most protected against Covid-19. The North and Northeast regions are most represented in the lower positions in the ranking, while the other two regions rank highly, with states such as São Paulo and Rio Grande do Sul among the most protected. The CPI reveals inequalities between states and regions but expands upon the HDI indicators, as it considers the unequal levels of the urban environment and living standards, as well as human-related aspects.
7
According to UNDP Human Development Indices and Indicators (2018), HDI classifications are based on HDI fixed cutoff points, which are derived from the quartiles of distributions of the component indicators. The cutoff points are HDI of less than 0.550 for low human development, 0.550–0.699 for medium human development, 0.700–0.799 for high human development, and 0.800 or greater for very high human development.
21
The Covid-19 Protection Index (CPI) as a Way to Identify. . .
467
Fig. 21.2 Covid-19 Protection Index (CPI) by Brazilian state. Source: Developed by “Ação Covid19” research group, data available at: https://censo2010.ibge.gov.br/
Fig. 21.3 Covid-19 Protection Index (CPI) by Brazilian municipality in the North region. Source: Developed by “Ação Covid-19” research group, data available at https://censo2010.ibge.gov.br/
When the map scale is magnified to focus on municipalities, as shown in Figs. 21.3, 21.4, and 21.5, the CPIs become even more heterogeneous, and the regional disparities become more complex. Figure 21.3, which looks at municipalities in the North region, shows the lowest CPI. Figure 21.4 shows the Northeast and Center-West regions, with municipalities’ CPIs rated mainly low and medium. Figure 21.5 presents municipalities in the South and Southeast regions, with mostly high and very high CPIs.
468
B. G. Guimarães et al.
Fig. 21.4 Covid-19 Protection Index (CPI) by Brazilian municipality in the Center-West and Northeast regions. Source: Developed by “Ação Covid-19” research group, data available at https://censo2010.ibge.gov.br/
Fig. 21.5 Covid-19 Protection Index (CPI) by Brazilian municipality in the South and Southeast regions. Source: Developed by “Ação Covid-19” research group, data available at https:// censo2010.ibge.gov.br/
The CPI is an indicator that assesses the vulnerability of a given territory prior to the Covid-19 pandemic. Therefore, the CPI is a portrait of the pre-existing situation of vulnerability to which populations were subjected. Due to the fact that the spread of the coronavirus is dynamic, the CPI for a region can be improved through the use
21
The Covid-19 Protection Index (CPI) as a Way to Identify. . .
469
Fig. 21.6 Percentage of cases by Brazilian state capital, compared to Covid-19 Protection Index (CPI). Source: Developed by “Ação Covid-19” research group, data available at https://covid. saude.gov.br/
Fig. 21.7 Percentage of deaths by Brazilian state capital compared to Covid-19 Protection Index (CPI). Source: Developed by “Ação Covid-19” research group, data available at https://covid. saude.gov.br/
of masks, social-distancing measures, and other preventive measures, directly impacting pandemic statistics over time. To analyze how the coronavirus evolved in unequal territories, we compiled the cumulative number of new cases and deaths from Covid-19 over time for all Brazilian capitals, along with their CPIs, between March 2020 and December 2020. In Fig. 21.6, we show the number of new cases in relation to the total population for each Brazilian state capital on the vertical axis, and the CPI for each Brazilian state capital on the horizontal axis. In Fig. 21.7, we did the same, but using the number of new deaths in proportion to these cities’ populations. We show the results for every month from the beginning of the pandemic in March until December 2020. In both charts, it is possible to observe an indefinite relationship between both measures in March, then a non-linear negative correlation in the subsequent
470
B. G. Guimarães et al.
Fig. 21.8 Log-percentage of deaths by Brazilian state capital compared to Covid-19 Log-Protection Index (CPI). Developed by “Ação Covid-19” research group, data available at https://covid.saude.gov.br/
months—at least through June—and then afterwards an indeterminate relationship once more. To try to quantify the intensity of this correlation, Spearman’s8 correlation coefficients were calculated between the logarithm of the percentage of deaths/ cases by Covid and the logarithm of the CPI. The logarithm strategy was applied to linearize the relationship evidenced in our results (Figs. 21.8 and 21.9). The data for the first 2 months had no significant correlation. However, the data for both new cases and deaths related to Covid-19 were found to be negatively correlated to the state capitals’ CPI, at a 95% statistical significance (Table 21.2) for May and June. Because Spearman’s correlation is statistically significant for May and June 2020, we can affirm that because of the inverse correlation between CPI and Covid-19related cases and deaths, the CPI can be seen as a snapshot of the pre-existing situation of vulnerability to which populations were subjected. It is also important to point out that this negative correlation is only observed in these specific months. At the very beginning of the pandemic, in March and April 2020, the novel coronavirus was still starting to spread across Brazil, and so perhaps due to this the data did not provide statistically significant results.
8
Spearman’s correlation assesses how well the relationship between two variables can be described using a monotonic function. A negative Spearman correlation coefficient corresponds to a decreasing monotonic trend between X and Y.
21
The Covid-19 Protection Index (CPI) as a Way to Identify. . .
471
Fig. 21.9 Log-Percentage of cases by Brazilian state capital, compared to Covid-19 Log-Protection Index (CPI). Source: Developed by “Ação Covid-19” research group, data available at https://covid.saude.gov.br/ Table 21.2 Spearman’s correlation coefficient between the logarithm of the percentage of deaths/ cases by Covid and the logarithm of the CPI from March to June 2020. The significance level used was 95% Month March 2020 April 2020 May 2020 June 2020
Log % cases vs. log ipc 0.449 Non significant –0.638 –0.481
Log % deaths vs. log ipc Non significant Non significant –0.516 –0.452
Source: Developed by “Ação Covid-19” research group, data available at: https://covid.saude.gov. br/
In the following months9 (after June), the correlation was dissolute due to the complex dynamics of the virus’s spread in the country, which had different outcomes directly related to the population density and the implementation of different mitigation measures such as social distancing and the use of masks. In order to explore this nonlinear correlation between the spread of the virus and the CPI within municipalities, we used a multi-agent-based model to simulate virus dynamics, which will be presented in the next subsection.
9
A moment in time when, due to the lack of federal coordination, many states relaxed social distancing measures while others kept mitigation measures in place
472
21.3.2
B. G. Guimarães et al.
Simulating the Pandemic in Unequal Territories
The initial motivation to create the CPI was to fill a gap in a multiagent-model simulator developed by our research group (Guedes Pinto et al. 2020; Magalhaes et al. 2020). The simulator has been used as a tool to understand the dynamics of the spread of Covid-19, taking into consideration, along with other parameters, the singular vulnerability of a determined territory. In this simulator, named MD Corona, people are randomly distributed on a grid (see Fig. 21.10) where they also move randomly. The dynamics of virus transmission will depend on whether the interaction between two or more agents (infected, immune, or susceptible to infection) results in one agent infecting the other(s). In the current version of MD Corona (Fig. 21.10), the user has to select three parameters to simulate the curve of Covid-19 cases for a period of time in a given place. From a list we provide, the user searches for the Brazilian territory (neighborhood or city, by name) for which they want to run the simulation, and then transposes the information related to (1) the demographic density of the territory; (2) the CPI, which gives the probability of a person-to-person virus transmission in this location; and (3) the percentage of people who are practicing social distancing in this location. Despite being a multi-agent computational model and therefore inserted in the field of complex sciences, the simulator is a relatively simple software that contains epidemiological parameters that can be easily updated, and is readily accessible to the general public.
Fig. 21.10 MD corona simulator available for general public use. Source: Developed by “Ação Covid-19” research group available at https://acaocovid19.org/simulador/territorios
21
The Covid-19 Protection Index (CPI) as a Way to Identify. . .
473
The simulator was used to study the dynamics of the spread of the virus in the capital cities of Fortaleza, São Paulo, Rio de Janeiro, and Curitiba (Ação Covid-19 2020a–d), comparing poor and rich neighborhoods. All studies had similar results: areas with less protection for Covid-19, i.e., with a low CPI (such as slums), had steeper infection curves and needed to be more isolated to avoid the collapse of the health system. The conclusions of these studies were also used to support, on a scientific basis, the claim of several community leaders that public authorities should urgently transfer resources intended for the richest territories and apply them to the poorest areas to mitigate the deadly effects of the pandemic. In the particular case of the city of Rio de Janeiro, we developed a study in collaboration with the Observatório das Favelas (Slums Observatory NGO) (Teixeira et al. 2020) to forecast the advance of the pandemic in rich and poor neighborhoods across different city regions. We applied the Covid Protection Index (CPI) methodology, discussed in the previous section, to set up the model, and then ran simulations in order to better understand the dynamics of coronavirus infection in different territories. Examining the Rio de Janeiro CPI map (Fig. 21.11) provides some important insights about the spatial dimension of inequality that different regions had at the beginning of the pandemic. At a first glance, the spatialization of the CPI in the city of Rio de Janeiro revealed the deep socio-spatial inequalities in the city that the HDI did not reveal. The central neighborhoods and those closest to Guanabara Bay have high CPI values, while the more peripheral neighborhoods have lower ratings (particularly in the north and west areas, where there is a higher concentration of poorer communities, although slums are spread all over the territory of Rio).
Fig. 21.11 CPI by neighborhood in the city of Rio de Janeiro. Source: “Ação Covid-19” development based on the data from IBGE (2010)
474
B. G. Guimarães et al.
As we discussed above, the CPI is a static index that defines an initial condition, whereas the pandemic is dynamic and its spread can be slowed by effective mitigation measures. For example, the presence or absence of public support for more vulnerable regions with a low CPI can result in a decreasing or increasing transmissibility and mortality in those neighborhoods. To explore this dynamic of the pandemic in territories with diverse population densities and CPIs, we studied the spread of the virus using the MD Corona simulator. From the three parameters needed for the simulation—the population density, CPI, and social-distancing measures—only the latter was not provided for all territories. For the rich neighborhoods we established a history of social distancing over time by using Google’s Covid-19 Community Mobility Reports.10 For the poorer communities we established the history of social distancing based on the testimony of local association leaders (which revealed, e.g., the influence that the “negationist and anti-science” discourse of President Jair Bolsonaro had on those communities). The neighborhoods chosen to build a comparison between different regions of the city with high and low CPI were Botafogo (dense and very high CPI), Tijuca (dense and high CPI), Rocinha (super dense with very low CPI), Maré (super dense and low CPI), Manguinhos (not dense with very low CPI), and Cidade de Deus (dense and medium CPI). Due to its stochastic nature, the simulations are sensitive to the initial conditions, which can vary (e.g., in space). To account for this fluctuation, we ran 100 simulations for each scenario, and from the average results, we imitated the expansion of cases from the beginning of the pandemic until the month of the study (July 2020). One example of the output of the simulation can be found in Fig. 21.13 in the Supplementary Material. As expected, we observed higher infection curves for low CPI territories, and flatter curves for high CPI neighborhoods. However, even among lower CPI territories we found important discrepancies. For instance, the community of Maré performed better than Cidade de Deus in our simulations, even though the former is denser and had a lower CPI. In order to verify these findings, we compared the accumulated number of Covid19 cases obtained in our simulations with the ones published by seroprevalence surveys11 for the same neighborhoods. The results from the seroprevalence surveys indicated that Maré’s population had less contact with the virus than Cidade de Deus inhabitants. We can also compare the lethality rate among them. In Table 21.3, we can see that Cidade de Deus (with medium CPI) had the worst lethality numbers, worse than low and very low CPI neighborhoods. One explanation for this is the absence of public intervention measures in poorer communities in general. On the other hand, communities like Maré were able to organize themselves better than others like Cidade de Deus, according to local leaders’ reports. The community of Maré, along with other communities in Brazil,
10 11
https://www.google.com/covid19/mobility/ This survey provides the percentage of people in a given territory that had Covid-19.
CPI Band Very low Very low Low Medium High Very high Very high Very high
2.53%
5.82%
5.38% 12.50% 2.60% 3.88%
January 2020 8.11%
3.83%
9.76%
8.70% 12.50% 7.56% 4.10%
February 2020 7.89%
7.91%
9.27%
7.27% 29.17% 11.30% 5.10%
4.00%
March 2020 4.55%
Source: “Ação Covid-19” development based on the data from Data Rio (2021)
Barra Da Tijuca
Copacabana
Mare Cidade De Deus Tijuca Botafogo
Vidigal
Neighborhoods in Rio de Janeiro Complexo Do Alemao
11.20%
19.08%
24.28% 33.33% 12.46% 13.67%
22.50%
April 2020 23.08%
9.03%
13.97%
13.49% 36.11% 13.64% 6.93%
19.51%
May 2020 16.16%
3.33%
4.80%
6.54% 8.24% 5.63% 3.84%
8.70%
June 2020 5.43%
4.72%
6.46%
7.49% 18.18% 8.13% 4.79%
3.57%
July 2020 8.57%
3.00%
3.94%
5.52% 13.21% 5.62% 2.28%
5.00%
August 2020 9.64%
4.75%
6.67%
4.05% 3.00% 8.12% 4.46%
8.11%
September 2020 1.50%
Table 21.3 Covid-19 lethality by neighborhood in the city of Rio de Janeiro, from February 2020 to September 2020 and the months’ total accumulated average
21 The Covid-19 Protection Index (CPI) as a Way to Identify. . . 475
476
B. G. Guimarães et al.
had made important efforts to protect the community from the virus by informing residents of the importance of non-pharmaceutical measures (wearing masks, social distancing, good hygiene, etc.), distributing masks, and by providing food, thus allowing people to stay home despite an absence of measures by the state. One of the conclusions of this study is that certain measures to contain the pandemic resulted in raising the Covid-19 Protection Index of some communities to the level of wealthier neighborhoods such as Tijuca and Botafogo.
21.3.3
Territorial Vulnerabilities and Covid-19 Vaccination
As discussed in the previous sections, the CPI measures the condition of vulnerability that preceded the pandemic. We know that the risks of contagion and death due to Covid-19 were mitigated or potentialized as a result of the implementation of prevention measures. Nonetheless, as the Covid-19 vaccination process advanced, it once again revealed that inequalities and the inherent vulnerabilities among the territories remain, which can be seen in Fig. 21.12. In both charts in Fig. 21.12, we have two evident clusters. The first cluster is composed of Brazilian state capitals whose CPIs are mostly lower than 0.599 (low or very low), and also shows the lowest percentage for vaccinated population. The second cluster, composed of Brazilian state capitals with CPIs mostly over 0.600 (medium or high), shows the highest vaccination scores. Unfortunately, the territorial vulnerabilities pointed out by the CPI were maintained by the national vaccination program’s prioritization of certain populations. We should remember that Brazil has a universal healthcare system, which has been tasked with buying and allocating all the country’s Covid-19 vaccines. This example reveals the CPI’s potential to identify vulnerable territories and its utility in guiding government action, indicating which territories should be given priority access to Covid-19 vaccines in order to reduce the spread of the coronavirus. In this sense, the CPI can work as a companion to the HDI indicator, as it can better identify inequalities affecting transmission of Covid-19.
21.4
Final Considerations
The COVID-19 Protection Index (CPI) attempted to identify how living and habitability conditions and their spatial superposition with gender, race, and class affect the impact of Covid-19 across the Brazilian territory. In Brazil, the Covid-19 pandemic has more severely struck the poorest and most vulnerable populations in the country. This precariousness deepens when we look at data from the Brazilian Research Network on Sovereignty and Food and Nutritional Security, showing that
21
The Covid-19 Protection Index (CPI) as a Way to Identify. . .
477
Fig. 21.12 Percentage of vaccinated population by Brazilian state capital, compared to Covid-19 Protection Index (CPI) from January 27, 2021, to August 29, 2021 (left, first dose, and right, second dose). Source: Developed by “Ação Covid-19” research group, data available at https://qsprod. saude.gov.br/extensions/DEMAS_C19Vacina/DEMAS_C19Vacina.html. Note: Cluster analysis was based on Euclidean distance and the Ward method. This unsupervised machine learning classification technique was implemented via the hclust function, which develops a hierarchical cluster analysis using a set of dissimilarities for the n observations being clustered. This function is available in R 3.6 (R Core Team 2021). This particular cluster was only part of the output
55.2% of the Brazilian population suffered some type of food insecurity in December 2020, and 9% had nothing to eat for a day or more. Data shows that the worst cases/lethality were in neighborhoods with higher density populations and lower income, education, and access to sanitation services, as well as areas with a higher concentration of black residents and female-headed households. At this moment in time, when cities are resuming their activities, our study points out that this population still needs more care and attention from public policies, as they are exposed to greater risks from the pandemic. Using the CPI we were able to map out the pre-pandemic condition of vulnerability to the virus at every territorial level, considering three dimensions: the urban surroundings of households (Urban Environment), the living standard inside households, and the human dimension. The index was found to be robust as it reproduced Brazil’s regional inequalities; however, it is when we expand the CPI scale to the level of municipalities that smallscale heterogeneity shows up. We can see a correlation between state capitals with a lower CPI and a higher number of COVID-19 cases, but only between May and June—the period when the pandemic was spreading from a few cities to the entire country. With the advance of the virus throughout the country, the correlation dissolved, revealing the complex dynamics of the virus’s spread, which was also impacted by the population density within territories and the implementation of mitigation measures by government agencies. We also used the CPI as an input for our multi-agent-based model to simulate virus dynamics in various cities, comparing the spread in poor and rich neighborhoods. The results from all our studies pointed to a correlation between severe
478
B. G. Guimarães et al.
pandemic scenarios and dense territories with a low CPI—a correlation that could be reversed with social distancing practices. These results support demands by several community leaders for public authorities to focus their resources on the poorest territories in order to mitigate the deadliest effects of the pandemic. However, our simulations are based on the pre-pandemic vulnerability CPI, which can increase or decrease depending on what measures are taken to mitigate the virus, such as the use of masks, hygiene protocols, and support for socialdistancing practices. When we compared our predictions based on the MD Corona simulations with seroprevalence survey data for some communities in Rio de Janeiro, we showed that effective actions put in place by well-organized communities such as Maré could drastically reduce the harm caused by the virus. By providing information to residents and distributing food and masks, the Maré community was able to raise their Covid-19 Protection Index from “low” to the same CPI as wealthier neighborhoods. This delivers a clear message to public authorities that by acting in vulnerable territories with low and very-low protection to Covid-19, it is possible to reduce the dramatic effects of the pandemic. The CPI was also found to be a good tool to demonstrate some inequalities in the vaccination process. Although vaccinations are now advanced in Brazil, this process has reinforced the inherent vulnerabilities within the territories. When we compared the CPI for Brazil’s state capitals with the percentage vaccinated against Covid-19, we observed an inversion of priorities in the national vaccination program. The territories with lower protection against the spread of Covid-19 were not prioritized, leading to the lowest vaccination percentages—showing that the government only took into account the features of its healthcare system, disregarding other interrelated matters such as the environment, economy, demography, housing, and territorial infrastructure. The CPI was shown to be a powerful tool for mapping Brazil’s pre-existing vulnerability to Covid-19, as well as serving as an input for simulations to predict the spread of the virus at different territorial levels. We advocate its use as an important source of information for the population and public authorities, and to serve as a complementary guide of where to act in order to mitigate the most severe effects of the pandemic. Acknowledgments We thank the entire Ação Covid-19 research group named on the website, Fundação Tide Setúbal, UFABC, Fundação José Luiz Egydio Setúbal, CNPq—Conselho Nacional de Desenvolvimento Científico e Tecnológico; P. M. C. Solano benefitted from a scholarship from Fundação de Amparo à Pesquisa do Estado do Rio de Janeiro (FAPERJ E-26/200.016/2021. Registration n: 2013.00344.5). This work was supported by National Funds by FCT–Portuguese Foundation for Science and Technology, under the project UIDB/04033/2020 and by Coordenação de Aperfeiçoamento de Pessoal de Nível Superior/Brazil (CAPES)–Finance Code 001.
21
The Covid-19 Protection Index (CPI) as a Way to Identify. . .
479
Supplementary Material
Fig. 21.13 Covid-19 dispersive simulator graph with 100 simulations and infected average (%) per day for Botafogo neighborhood in Rio de Janeiro city. Source: Developed by “Ação Covid-19” research group
References Abedi V, Olulana O, Avula V, Chaudhary D, Khan A, Shahjouei S, Li J, Zand R (2020) Racial, economic, and health inequality and COVID-19 infection in the United States. J Racial Ethn Health Disparities 1–11. Available at https://doi.org/10.1007/s40615-020-00833-4. Accessed 20 Aug 2020 Ação Covid-19 (2020a) Um bairro, duas curvas: Entre Barra do Ceará e Meireles. Available at https://acaocovid19-homolog.web.app/fortaleza. Accessed 28 July 2020 Ação Covid-19 (2020b) Uma cidade, muitas curvas: entre Brasilândia, Sapopemba e Jardins. Available at https://acaocovid19-homolog.web.app/saopaulo. Accessed 28 July 2020 Ação Covid-19 (2020c) Um bairro, duas curvas: Copacabana entre o morro e o asfalto. Available at https://acaocovid19-homolog.web.app/copacabana. Accessed 28 July 2020 Ação Covid-19 (2020d) Flexibilização e Calamidade durante a Pandemia. Available at https:// acaocovid19-homolog.web.app/curitiba. Accessed 28 July 2020 Albuquerque VM, Viana ALD, Lima LD, Ferreira MP, Fusaro ER, Iozzi FI (2017) Desigualdades regionais na saúde: mudanças observadas no Brasil de 2000 a 2016. Ciência Saúde Coletiva 22(4):1055–1064. Available at: https://doi.org/10.1590/1413-81232017224.26862016. Accessed 3 Sept 2020
480
B. G. Guimarães et al.
Arndt C, Davies R, Gabriel S, Harris L, Makrelov K, Robinson S, Levy S, Simbanegavi W, van Seventer D, Anderson L (2020) Covid-19 lockdowns, income distribution, and food security: an analysis for South Africa. Global Food Secur 26:100410. Available at: https://doi.org/10.1016/j. gfs.2020.100410. Accessed on 3 Sept 2020 Brasil. Ministério do Planejamento, Orçamento e Gestão. Instituto Brasileiro de Geografia e Estatística. Pesquisa Nacional por Amostra de Domicílios (PNAD) (2019) Características gerais dos domicílios e dos moradores. IBGE, Rio de Janeiro. Available at https://biblioteca.ibge.gov. br/visualizacao/livros/liv101707_informativo.pdf. Accessed 13 Oct 2020 Brasil. Decreto n. 9.396 de 30 de maio de 2018 - Altera o Decreto n° 5.209, de 17 de setembro de 2004, e o Decreto n° 7.492, de 2 de junho de 2011, para reajustar valores referenciais de caracterização das situações de pobreza e de extrema pobreza e os de benefícios do Programa Bolsa Família. Available at http://www.planalto.gov.br/ccivil_03/_Ato2015-2018/2018/ Decreto/D9396.htm. Accessed 27 May 2020 Chor D, Lima CRA (2005) Aspectos epidemiológicos das desigualdades raciais em saúde no Brasil. Cad Saúde Pública 21:1586–1594 Coimbra CE Jr, Santos RV, Welch JR, Cardoso AM, Souza MC, Garnelo L (2013) The first national survey of indigenous people’s health and nutrition in Brazil: rationale, methodology, and overview of results. BMC Public Health 13:52 Corburn J, Vlahov D, Mberu B, Riley L, Caiaffa WT, Rashid SF, Ko A, Patel S, Jukur S, MartínezHerrera E, Jayasinghe S, Agarwal S, Nguendo-Yongsi B, Weru J, Ouma S, Edmundo K, Oni T, Ayad H (2020) Slum health: arresting COVID-19 and improving well-being in urban informal settlements. J Urban Health 97(3):348–357. Available at https://doi.org/10.1007/s11524-02000438-6. Accessed 1 Oct 2020 Costa HSM, Monte-Mór RL (2002) Urbanization and environment: trends and patterns in contemporary Brazil. Em: CNPD/ABEP/NEPO. Population and environment in Brazil. Campinas, Brasil Data Rio (2021) Instituto Pereira Passos. Dados individuais dos casos confirmados de COVID-19 no município do Rio de Janeiro. Available at https://www.data.rio/documents/PCRJ::dadosindividuais-dos-casos-confirmados-de-covid-19-no-munic%C3%ADpio-do-rio-de-janeiro-2/ about. Accessed 10 Oct 2021 dos Santos VG (1993) Razões da desordem. Rocco, Rio de Janeiro Fatemi F, Ardalan A, Aguirre B, Mansouri N, Mohammadfam I (2017) Social vulnerability indicators in disasters: findings from a systematic review. Int J Disaster Risk Reduct 22:219– 227. Available at https://doi.org/10.1016/j.ijdrr.2016.09.006. Accessed 11 Oct 2021 FGV—Fundação Getulio Vargas (2020) Década cada vez mais perdida na economia brasileira e comparações internacionais. Available at https://portal.fgv.br/artigos/decada-cada-vez-maisperdida-economia-brasileira-e-comparacoes-internacionais. Accessed 10 Apr 2021 FIOCRUZ. Fundação Oswaldo Cruz. A Gestão de Riscos e Governança na Pandemia por Covid-19 no Brasil. Available at https://portal.fiocruz.br/noticia/relatorio-da-fiocruz-discute-isolamentosocial-e-gestao-de-risco. Accessed 6 Oct 2021 Freitas DA, Caballero AD, Marques AS, Hernandez CIV, Antunes SLNO (2011) Saúde e comunidades quilombolas: uma revisão da literatura. Rev CEFAC 13:937–943 FUNDAJ. Fundação Joaquim Nabuco. Painel Fundaj Covid-19 em Pernambuco. Mapeamento da Covid-19. Available at https://www.fundaj.gov.br/index.php/area-de-imprensa/12025mapeamento-do-covid-19. Accessed 10 Oct 2020 Gonçalves RM, Domingos IM (2019) População ribeirinha no Amazonas e a desigualdade no acesso à saúde. Revista de Estudos Constitucionais, Hermenêutica e Teoria do Direito 11(1): 99–108 Guedes Pinto JP, Magalhaes P, Figueiredo GM, Alves D, Segura-Angel DM (2020) Local protection bubbles: an interpretation of the decrease in the velocity of coronavirus’s spread in the city of São Paulo MedArxiv [Preprint] 2020 medRxiv [Posted August 14, 2020] medRxiv 2020.08.11.20173039. Available at: https://www.medrxiv.org/content/10.1101/2020.0 8.11.20173039v1 Accessed 10 Nov 2020
21
The Covid-19 Protection Index (CPI) as a Way to Identify. . .
481
Habitat para a Humanidade Brasil (2020) Panorama Nacional: Monitoramento da atuação do poder público no contexto da pandemia da covid-19 a partir das evidências de grupos e comunidades. Available at https://habitatbrasil.org.br/wp-content/uploads/2020/08/Sistematiza%C3%A7%C3 %A3o_Nacional_Covid-2.pdf. Accessed 20 Oct 2021 Hutchins SS, Truman BI, Merlin TL, Redd SC (2009) Protecting vulnerable populations from pandemic influenza in the United States: a strategic imperative. Am J Public Health 99(suppl 2): S243–S248. Available at https://doi.org/10.2105/AJPH.2009.164814. Accessed 24 Oct 2020 IBGE. Instituto Brasileiro de Geografia e Estatística. Censo 2010. Available at http://www. censo2010.ibge.gov.br/. Accessed 10 May 2020 IBGE. Instituto Brasileiro de Geografia e Estatística. Projeção da população do Brasil e das Unidades da Federação. Available at https://www.ibge.gov.br/apps/populacao/projecao/. Accessed 11 June 2020 ILO—International Labour Organization (2018) Care work and care jobs for the future of decent work. Available at https://www.ilo.org/wcmsp5/groups/public/%2D%2D-ed_dialogue/%2D%2 D-sector/documents/briefingnote/wcms_741655.pdf. Accessed 26 Aug 2020 ILO—International Labour Organization (2020) COVID-19 and the health sector. Available at https://www.ilo.org/wcmsp5/groups/public/%2D%2D-ed_dialogue/%2D%2D-sector/docu ments/briefingnote/wcms_741655.pdf. Accessed 26 Aug 2020 Instituto Nacional de Estudos e Pesquisas Educacionais Anísio Teixeira (INEP). Censo Escolar, 2019. Available at http://portal.inep.gov.br/web/guest/resultados-e-resumos. Accessed 13 Oct 2020 Instituto Pólis. Contexto Territorial e Ação Coletiva no enfrentamento da Covid-19. Opera Mundi, 2020. Available at https://operamundi.uol.com.br/analise/65231/contexto-territorial-e-acaocoletiva-no-enfrentamento-da-covid-19. Accessed 1 Aug 2020 Magalhaes P, Guedes Pinto JP, Segura-Angel DM (2020) A multiagent coronavirus model with territorial vulnerability parameters. MedArxiv [Preprint] 2020 medRxiv [Posted 2020 Oct 28] medRxiv 2020.07.23.20160762. Available at: https://www.medrxiv.org/con tent/10.1101/2020.10.25.20218735v2. Accessed 15 Nov 2020 Maricato E (1996) Metrópole na periferia do capitalismo. Hucitec, São Paulo Massey D (1994) Space, place and gender. Polity Press, Oxford Maziviero MC, Marafigo A (2020) Como morrem os pobres: coronavírus afeta populações de forma desigual e perversa. Carta Capital, São Paulo, pp 1–5, 08 set 2020 Neumayer E, Plümper T (2007) The gendered nature of natural disasters: the impact of catastrophic events on the gender gap in life expectancy, 1981–2002. Ann Assoc Am Geogr 97(3):551–566. Available at: https://doi.org/10.1111/j.1467-8306.2007.00563.x. Accessed 3 Sept 2020 NOIS—Núcleo De Operações E Inteligência Em Saúde (2020) Análise socioeconômica da taxa de letalidade da COVID-19 no Brasil. Available at https://drive.google.com/file/d/1tSU7mV4 OPnLRFMMY47JIXZgzkklvkydO/view. Accessed 26 Aug 2020 ONS. Office for National Statistics. Coronavirus related deaths by ethnic group, England and Wales. Available at https://www.ons.gov.uk/peoplepopulationandcommunity/ b i r t h s d e a t h s a n d m a r r i a g e s / d e a t h s / a r t i c l e s / coronavirusrelateddeathsbyethnicgroupenglandandwales/2march2020to10april2020. Accessed 8 Oct 2020 PrContraCovid. Website Paraná Contra Covid. Available at https://sites.google.com/view/ prcontracovid. Accessed 1 Oct 2020 Quinn SC, Kumar S (2014) Health inequalities and infectious disease epidemics: a challenge for global health security. Biosecur Bioterror 12(5):263–273. Available at https://doi.org/10.1089/ bsp.2014.0032. Accessed 22 Oct 2020 Ranieri J, Begalli M (2016) O uso do Índice do Entorno (I.E.) e o Índice Paulista de Vulnerabilidade Social (I.P.V.S.) como ferramentas para a compreensão da complexidade de um território: estudo de caso do subdistrito do Riacho Grande. III Simpósio Nacional sobre Democracia e Desigualdades. Universidade de Brasília (UNB). Brasília
482
B. G. Guimarães et al.
R Core Team (2021) R: a language and environment for statistical computing. R Foundation for Statistical Computing, Vienna, Austria. https://www.R-project.org/ Santos M (1993) A urbanização brasileira. Hucitec, São Paulo, pp 63–72 Sistema de Informações de Beneficiários-SIB/ANS/MS. Dados Gerais. Available at https://www. ans.gov.br/perfil-do-setor/dados-gerais. Accessed 15 June 2020 Smolka M, Cenecorta AXI (2000) Los pobres de la cuidad y la tierra. El Colegio Mexiquense, Zinacantepec Tai DBG, Shah A, Doubeni CA, Sia IG, Wieland ML (2020) The disproportionate impact of COVID-19 on racial and ethnic minorities in the United States. Clin Infect Dis. Available at https://doi.org/10.1093/cid/ciaa815. Accessed 1 Oct 2020 Teixeira L, Braga A, Barbosa JL, Ação COVID-19. Mapa Social do Corona 04 - 2020 Proteção e vulnerabilidade ao COVID-19 no Rio de Janeiro. Available at http://of.org.br/wp-content/ uploads/2020/07/Mapa-Social-do-Corona-04.pdf. Accessed 4 Nov 2020 Thakur N, Lovinsky-Desir S, Bime C, Wisnivesky JP, Celedón JC, Health Equality and Diversity Committee of the American Thoracic Society (2020) The structural and social determinants of the racial/ethnic disparities in the U.S. COVID-19 pandemic: what’s our role? Am J Respir Crit Care Med. Available at https://pubmed.ncbi.nlm.nih.gov/32677842/. Accessed 15 Sept 2020 Torres HG, Marques E, Ferreira MP, Bitar S (2003) Pobreza e espaço: padrões de segregação em São Paulo. Estudos Avançados 17(47):97–128. Available at: https://doi.org/10.1590/ S0103-40142003000100006. Acessado em 22 de outubro de 2020 Trata Brasil. Instituto Trata Brasil. Ranking do Saneamento 2020. Available at http://www. tratabrasil.org.br/images/estudos/itb/ranking_2020/Relatorio_Ranking_Trata_Brasil_2020_ Julho_.pdf. Accessed 13 Oct 2020 United Nations Development Program. Human development indices and indicators 2018. Available at https://www.br.undp.org/content/dam/brazil/docs/RelatoriosDesenvolvimento/2018_ human_development_statistical_update.pdf. Accessed 18 Oct 2021 Varanda W, Adorno RCF (2004) Descartáveis urbanos: discutindo a complexidade da população de rua e o desafio para políticas de saúde. Saude Soc 13(1):56–69 Villaça F (1999) Uma contribuição para a história do planejamento no Brasil. In: Deak C, Schiffer S (eds) O processo de urbanização no Brasil. Edusp/Fupam, São Paulo
Chapter 22
The Social Vulnerability Index: A Literature Review Francesco De Pascale
Abstract This chapter provides a non-exhaustive review of the literature on the Social Vulnerability Index in order to share with Disaster Studies scholars and other professionals a general overview of the subject. This work analyzes selected case studies on the construction of a Social Vulnerability Index at national and local scales, and then specifically focuses on cases concerning social vulnerability to climate change, natural hazards, and COVID-19. Keywords Climate change · COVID-19 · Natural hazards · Disaster studies · Social Vulnerability Index
22.1
Introduction
The term “vulnerability” is used in various research contexts, such as food safety, natural hazards, disaster risk management, public health, global environmental change, and climate change (Füssel and Klein 2006). UNDRR (United Nations Office for Disaster Risk Reduction) defines vulnerability as “the characteristics and circumstances of a community, system or resource that make it susceptible to the harmful effects of a hazard” (UNISDR 2009, p. 30). This definition provides an important step forward in disaster research and leading to a more comprehensive understanding of the concept of vulnerability, in order to explain the social consequences of a disaster event, and questioning assumed conceptions of what constitutes a “natural disaster” (Carnelli and Frigerio 2016). The negative consequences of natural hazards are linked to the socio-economic characteristics of communities that possess different capacities to react and manage the effects of environmental events related to the hazard (Oliver-Smith 1996; Weichselgartner 2001; Cutter et al. 2003;
F. De Pascale (✉) Department of Foreign Languages, Literatures and Modern Cultures, University of Turin, Turin, Italy e-mail: [email protected] © The Author(s), under exclusive license to Springer Nature Switzerland AG 2023 S. D’Amico, F. De Pascale (eds.), Geohazards and Disaster Risk Reduction, Advances in Natural and Technological Hazards Research 51, https://doi.org/10.1007/978-3-031-24541-1_22
483
484
F. De Pascale
Wisner et al. 2004; Adger 2006). Social vulnerability can be seen as a set of overlapping, but differential dimensions (Alexander 1993; Cutter et al. 2003; Carnelli and Frigerio 2016) that vary significantly within communities across space and time. Two main methods have been developed to assess social vulnerability: a deductive approach that follows the main theoretical results and an inductive approach derived from statistical relationships that include a large set of variables (Yoon 2012). The deductive approach selects a limited number of variables to create a social vulnerability index based on a priori theory and knowledge provided by existing literature and research. There are variations in the extent to which a researcher can employ a deductive approach. By simply using variables identified in previous research, the deductive approach proceeds without any additional logic for selecting those variables. The inductive approach to creating a social vulnerability index (SoVI) is based on the selection of a wide range of variables that influence social vulnerability (Cutter et al. 2003). Although the inductive approach to the selection of variables also engages literature on vulnerability, it differs from the deductive approach by including all possible variables referenced in the literature to assess social vulnerability. In this context, this chapter will present a series of significant studies based on both deductive and inductive approaches, considering on national and local scales, their applications to specific cases on climate change and natural hazards. In addition, a brief analysis of the COVID-19 emergency that emerged in early 2020, and is still ongoing, will provide insights into social vulnerability related to the pandemic.
22.2
Case Studies on the Construction of a Social Vulnerability Index on National and Local Scales
Cutter et al. (2000) present a methodology through which it is possible to assess vulnerability in spatial terms using biophysical and social indicators. Vulnerable areas selected through the use of a geographical information system (GIS) are based on 12 environmental threats and 8 social characteristics of an analysis of Georgetown County, South Carolina, in the United States. The research explored the spatial aspects of vulnerability, highlighting how the impact of a disaster in areas with the highest biophysical risk, having greater protections and economic safety nets available, would be more resilient than the majority of residents of the county that are socially most vulnerable. The conceptual model of hazards-of-place vulnerability, already promoted by Cutter (1996), engaged in this research combines the traditional view of biophysical vulnerability with a social dimension and follows the following scheme: risk and mitigation interact to produce the potential for hazard, which is filtered through the social fabric that generates social vulnerability and the geographical context which produces biophysical vulnerability. The unique interactions
22
The Social Vulnerability Index: A Literature Review
485
between biophysical and social vulnerability contributes to the vulnerability of a particular place. Cutter et al. (2003), using a factorial analytic approach, proposed a normalized set of 42 variables, reduced to 11 independent factors to measure social vulnerability in the context of 3000 counties in the United States using data from 1990. Conclusive results indicate that overall scores were often different for each county, highlighting the interactive nature of biophysical and social vulnerability in which some components increase vulnerability while others mitigate the effects. Other researchers have borrowed Cutter’s Social Vulnerability Index (SoVI) to examine social vulnerability and risks of climate variability in areas of coastal erosion (Boruff et al. 2005), coastal flooding and storm surges (Rygel et al. 2006), hurricanes (Myers et al. 2008), and floods (Azar and Rain 2007; Fekete 2009). A similar approach combining physical and social vulnerability was adopted by Wu et al. (2002) in Cape May County, New Jersey, but applied to risks caused by both river flooding and coastal storm surges. The researchers selected nine variables based on factors such as age, sex, race, income, and housing conditions. This study illustrates that rising sea levels will significantly increase the county’s overall vulnerability and expose an increasing number of structures, properties, and people, particularly vulnerable subgroups, to the risk of flooding. An indicator-based approach is one of the best methods available to explore the concept of social vulnerability (Yoon 2012). The creation of a system of indicators to measure vulnerability is a very important development, which is useful for reducing the risk and vulnerability of societies. Due to the multidimensional nature of vulnerability, there is no single methodology to define it and reduce the concept to a single equation (Birkmann 2006; Yoon 2012). Vulnerability indices are most frequently characterized by the following indicators: age, disability, income, employment, race, family status, housing and infrastructure, and lifestyle (Clark et al. 1998; Chakraborty et al. 2005). Many studies attempt to synthesize these indicators and use factor analysis to group variables and measure similar phenomena (Cutter et al. 2003; Fekete 2009). After choosing relevant indicators, the index is composed simply by adding or averaging all components or assigning weights to each component, which requires subjective judgment by experts. According to Spielman et al. (2020), given the complexity of the index, the social vulnerability quantified in a single numerical index is a questionable epistemological position, since it is necessary to account for the multiple dimensions that characterize the index itself. According to the authors, the best way to proceed is to allow experts to build meaningful indicators by specifying specific weights for variables, without relying on statistical techniques such as principal component analysis (APC). Rygel et al. (2006) studied the potential exposure to a risk and the coping capacity within the geographical region of Hampton Roads, Virginia, in the United States, and adopted methods related to the study of the vulnerability of places. Some researchers deploy Pareto’s classification method to avoid assigning specific weights to indicators. The Pareto classification is a method of ordering cases based on multiple criteria, which has become popular in the context of genetic algorithms where it is applied because it often gives high marks to those cases that only score
486
F. De Pascale
high on one factor. Rygel et al. (2006) employ a technique based on the Pareto classification to a complex socio-economic landscape, exposed to storm surges associated with hurricanes. Indicators of social vulnerability to atmospheric and oceanic risks were developed, and an analysis of the main components was performed on the basis of the following indicators: poverty, sex, race and ethnicity, age, and disability. Overall social vulnerability was calculated by applying the Pareto classification to these main components. This study illustrates that it is possible to determine the relative vulnerability of places without the difficult and problematic practice of weighing various indicators. Fekete (2009) carried out a study concerning the development and validation of a map of social vulnerability linked to river flooding to which the counties in Germany are subject. His map is based on an index characterized by three main indicators: fragility, socio-economic conditions, and reference region. These indicators were identified through a factorial analysis of demographic variables selected and obtained by the federal statistical offices, which are updated every year. The vulnerability patterns detected by factorial analysis were verified using a second independent dataset that included a survey of families affected by the floods in three federal states. Using logistic regression, it was shown that the theoretically assumed vulnerability indications were correct and that the indicators are valid. Indeed, some social groups such as the elderly, those with economic problems, or urban residents have been shown to constitute the highest risk groups. de Oliveira Mendes (2009), inspired by the Social Vulnerability Index proposed by Cutter et al. (2003), extends the analysis of vulnerability to technological and social risks. Results confirm, as in Cutter et al.’s study (2003), the interactive nature of social vulnerability, as well as reflecting the widespread urbanization and industrialization patterns that characterize Portugal. Yoon’s study (2012) empirically compared the development of inductive and deductive indices and the methods of aggregating indicators in the assessment of social vulnerability to disasters related to extreme natural events in the Gulf of Mexico and Atlantic coastal areas of North America. The results concluded that coastal counties with greater social vulnerability are positively associated with the damage caused by disasters, while variations in the development of the index, using deductive and inductive measurement, produced different results. For the inductive approach, this study replicated the method used by Cutter et al. (2003) to select the variables of the social vulnerability index. For the deductive approach, this study engaged all the variables of the social vulnerability index used by Cutter et al. (2003), but produced a different index of social vulnerability in terms of blending conceptions of the vulnerabilities of a people and their place. This study demonstrated that the selection of social vulnerability variables and the combination of multiple methods are important in assessing social vulnerability. Social vulnerability is often “hidden” and complex, nested in various human and social aspects and closely linked to the place and environment being studied. A study by Frigerio et al. (2018) examined a space-time model of social vulnerability in Italy, and also considered the socio-economic factors that influence the way the Italian population reacts to catastrophic natural events. The authors identified 16 indicators that quantify social vulnerability, collected from data for the census
22
The Social Vulnerability Index: A Literature Review
487
years 1991, 2001, and 2011. The authors devised a social vulnerability index (SVI) for each year, using the results of the component analysis main and an additive method. Exploratory analysis of spatial data, including global and local autocorrelations, was used to understand spatial patterns of social vulnerability across the country. This research by Frigerio et al. (2018) shows how employment, age, education, and population growth represented the main indicators that characterize social vulnerability in Italy. An Indonesian study by Siagian (2013) aimed to quantify the social vulnerability of districts in this southeastern archipelago to natural hazards, determining their driving factors and mapping their variations. This research also employed the social vulnerability index (SoVI) approach adopted by Cutter et al. (2003). Findings suggest that there are three main drivers that influence social vulnerability in Indonesia: “socio-economic status and infrastructure,” “gender, age and population growth,” and “family structure.” Reckien’s study (2018) compares social vulnerability indices in New York City, New York, in the United States, considering a variation of indices built on weighted and unweighted additive models. Weighting was based on scientific assessment reports of the impacts of climate change experienced in New York City. In addition, the study calculated results of social vulnerability using input data based on area (person/km2) or on population (%). The study reveals notable differences between these indices, particularly when using different methods, but also when engaging different metrics as input data. The variable addition model has deductive advantages, while the variable reduction model is useful when the strength of social vulnerability factors is unknown. Results show that the use of area-based data seems preferable to population-based data when the differences are considered as measures of credibility and quality. Finally, a study by Kumar and Kumar Bhattacharjya (2020) constructed a map for the state of Uttarakhand, in northern India, that has been hit by disasters linked to extreme natural events and anthropogenic hazards. Social vulnerability was analyzed utilizing several factors: social, economic, physical, and environmental. Factors such as literacy, drug addiction, emigration, and unemployment, in addition to hydrological factors, played an important role in making hill districts more vulnerable. The authors determined that factors such as emigration, employment, and education had a great impact on vulnerability; therefore policy-makers need to find solutions to mitigate their impacts. On the other hand, for a better “visualization” of social vulnerability, it was found necessary to consider the importance and relevance of different factors in social and physical aspects and their inter-relations. Correlation between different factors should explain the impact of the natural hazard, and the Integrated Social Vulnerability Index (SoVIint) consists of various social, economic, and physical indicators, such as age (children or elderly), gender, disability, employment, housing characteristics, participation in government activities, participation in decision making, etc., that can offer researchers insights into vulnerabilities and resiliences. de Loyola Hummell et al. (2016) proposed a study on the replication of the social vulnerability index (SoVI) for Brazil and show how the SoVI concepts and
488
F. De Pascale
indicators have been adapted to this South American country’s situation. The starting point for the SoVI replica is the state of Paraná, one of the three states in Brazilia’s southern region. Once the city-scale replication for Paraná was successfully completed, the study was expanded to include all 5565 Brazilian cities. The study followed Cutter et al. (2003) study, and, using principal components analysis (PCA), 45 indicators of urban areas were reduced to 10 factors that explain about 67% of the variance in the data. Although several factors contribute to the increase in social vulnerability in each city, the overall results confirm the social and economic disparities between Brazilian regions and indicate a different vulnerability to natural risks on a local and regional scale. The SoVI analysis by Holand and Lujala (2013), inspired by the work of Cutter et al. (2003), presents a method for assessing social vulnerability to natural hazards in Norwegian municipalities. A large number of variables were used in the analysis; each variable measured an aspect of a municipality’s susceptibility to potential hazard. Using factor analysis, the information in the variables was reduced to fewer factors, and the socio-economic and environmental vulnerability scores for each Norwegian municipality were calculated. Resulting scores in the built socioeconomic and environmental vulnerability index were mapped for each municipality. By indicating municipalities with a high level of vulnerability, the method presented in this study provides a useful tool for identifying regions likely to face significant challenges involving large-scale extreme events. The results of this study can be used, for example, in planning mitigation efforts towards extreme weather events, which are likely to be more frequent and severe in the future due to climate change. The authors introduced new concepts to the ongoing discussion on vulnerability in Norway, such as the analysis of vulnerabilities arising from socioeconomic factors and the built environment, including measures that take into account the isolation and long travel distances between many Norwegian municipalities. Dwyer et al. (2004), in their study to establish the vulnerability to natural impacts of individuals within households in 224 surveyed district areas, 25 km north-east of Perth, Western Australia, identified thirteen socio-economic indicators and two hazard indicators. Indicators chosen for this study were selected through extensive literature reviews, discussions with researchers and with the aim of exploring quantitative methods to assess the vulnerability of individuals, within families to a natural risk. Other factors that contribute to an individual’s resilience were also considered in the study and included emotional and psychological capacity as well as their sense of community and other less tangible factors.
22
The Social Vulnerability Index: A Literature Review
22.3
489
Case Studies on Social Vulnerability to Climate Change and Natural Hazards
Conner’s (2005) study highlighted the contribution of local stakeholders to the early stages in identifying local attributes of vulnerability, adaptive capacity, and resilience to the impacts of climate change. The research was carried out in two coastal communities in Haida Gwaii (The Queen Charlotte Islands), British Columbia, Canada. It included community responses to local attributes of vulnerability and adaptability. Using a participatory approach, the author highlighted that some of the attributes that were initially thought contributing to increasing vulnerability were instead perceived by participants as factors to enhance community resilience. Ironically, other attributes, thought to strengthen community cohesion, were considered by participants as contributing to increasing vulnerability and decreasing community resilience. Aaron Kobina’s research (2016), at the University of Ghana, also adopted an integrated and participatory approach that included socio-economic and biophysical approaches to build a family vulnerability index in synchronization with other empirical studies, such as Opiyo et al. (2014) and by Hahn et al. (2009). The household vulnerability index was calculated using data collected from a survey carried out in two urban communities: Agbogbloshie and James Town in Accra, Ghana. The index was based on the sum of the indices of seven main components: socio-demographic profile, livelihood strategies, health, food, water and sanitation, and climate vulnerability. The results showed that Agbogbloshie families are more vulnerable to flooding than families residing in James Town. Among women householders, married and unemployed women were more likely to underestimate their vulnerability than unmarried and employed women. Among male heads of households, a correlation was found between their age and the underestimation of vulnerability. The report indicated that the probability of underestimating vulnerability to floods decreases with increasing age of the male householder to a turning point (45 years), beyond which the latter becomes more likely to underestimate vulnerability. A study by Brody et al. (2008) adds a spatial dimension to conceptual models on the perception of climate change in a survey carried out in the United States. In particular, GIS and spatial analysis techniques were used to map and measure physical risks associated with predicted climate change. Using existing spatial data, multiple measures of vulnerability to climate change were analyzed together with demographic, attitudinal, and social contextual variables collected by a representative national survey to predict and analyze variations in risk perception. Bivariate correlation and multivariate regression analyses were used to identify and explain the most important indicators that shape individual risk perception. Data analysis suggests that the relationship between actual and perceived risk is driven by specific types of physical conditions and experiences. Hinkel (2011) analyzed vulnerability to climate-related shocks in five districts in Malawi’s Shire River Basin in Sub-Saharan Africa. The analysis used an approach
490
F. De Pascale
that integrates biophysical and socio-economic indices. Statistical analysis was used to calculate an index concerning the adaptability, sensitivity, and exposure to climate impact for each of the five districts. These indices were aggregated to develop a vulnerability index, also differentiated by gender, for the districts under investigation. The results showed that Chikwawa, Machinga, and Blantyre appear to be more vulnerable to climate-related shocks than Mwanza and Zomba. Even the female subjects of the Chikwawa district appear to be more sensitive to the impacts of climatic risks. Research suggests that national adaptation strategies adopted by the government should be integrated into specific local adaptation actions. In particular, importance should be given to improving women’s well-being conditions through better access to goods and productive resources. The study by Letsie and Grab (2015), on the other hand, used quantitative secondary data, namely, data from the 2006 Lesotho (South Africa) census, district government records, and qualitative data such as interviews with families, to identify 27 indicators of social vulnerability to hazards natural in southern Lesotho. The methodology consisted of the analysis of the main components to generate a social vulnerability index for the region under study. The index scores were added together and mapped to quantify the spatial variability of social vulnerability. The study results showed a clustering of highly vulnerable communities in the rural highlands due to existing conditions of underdevelopment, poverty, and inaccessibility. Hahn et al. (2009) developed the Livelihood Vulnerability Index (LVI) to estimate vulnerability to climate change in the Mabote and Moma districts of Mozambique, in Sub-Saharan Africa. Researchers surveyed 200 families in each district to collect socio-demographic data, livelihoods, social networks, health, food and water security, disasters related to extreme natural events, and climate change. These components were developed after a review of the literature concerning studies on the Mozambican water sector, as well as on the practicality of collecting the necessary data through home surveys. Data was aggregated using a composite index and differential vulnerabilities were compared. The results suggest that Moma may be more vulnerable in terms of water resources, while Mabote may be more vulnerable in terms of socio-demographic structure. The authors highlight that this pragmatic approach can be used to monitor vulnerability and plan resources for assistance to the population. The Alam study (2017) evaluated the main vulnerability factors of coastal families in Bangladesh. The study uses the IPCC (Intergovernmental Panel on Climate Change) vulnerability framework and develops a weighted approach using the livelihood vulnerability index and climate change vulnerability index. The results reveal that livelihood vulnerability index and climate change vulnerability index differ between locations; however, a high index value for both measures indicates the high vulnerability of households’ livelihoods to climate change and the risks associated with extreme natural events. The main factors that influence the dimensions of vulnerability were livelihood strategies and access to food, water, and health facilities. These at-risk families are also vulnerable due to lack of livelihoods, which inevitably leads to a vicious cycle of poverty. The findings of this study are crucial for local policy-makers to formulate and implement effective strategies and
22
The Social Vulnerability Index: A Literature Review
491
programs to minimize vulnerability and improve local adaptation processes and livelihoods for such families across Bangladesh. Based on the Fifth Assessment Report on Climate Change of the IPCC (AR5), vulnerability factors can be processed as a result of the combination of the Global Sensitivity and Adaptability Indexes. On this basis, research was carried out as part of a European project called Life Master Adapt (MASTER ADAPT, 2018) in some target areas: the aggregation of cities north of Milan, in the Metropolitan city of Venice, in the Metropolitan network of Sassari, in the Metropolitan area of Cagliari, and in the Union of Municipalities of North Salento. The proposed assessment of the vulnerability and risks associated with climate change is based on several steps that involve the identification and selection of some indicators to be used as models to describe a phenomenon and/or specific characteristics of a system or a territory. The aim is to identify and evaluate the main factors and assets of the system most affected by climate change, and assess the sensitivity to the damage deriving from climate change and the ability to respond and adapt to such changes.
22.4
Case Studies on the Social Vulnerability Index to COVID-19
The COVID-19 emergency brought the world population into a state of emergency, one that is still ongoing. Emerging from Wuhan, China, in December 2019, the SARS-COV-2 coronavirus spread to all continents and as a result was declared a global pandemic by the World Health Organization (WHO) in 2020. The health emergency has seen the issuance by all governments of increasingly stringent rules aimed at containing the spread of the virus, and is having repercussions from a health and economic point of view. There are also significant repercussions in the social sphere with serious impacts for the sections of the global population who exist in conditions of need, poverty, and isolation. Following this emergency, the scientific community mobilized with the aim of identifying Indices of Social Vulnerability to COVID-19 to help the authorities to direct resources where they are most needed. Suárez Lastra et al. (2020) developed a municipal vulnerability index for COVID19 in Mexico. The index combines three dimensions of vulnerability: demographics, health, and socio-economic conditions. Each dimension is, in turn, described by various indicators relating to the type of vulnerability and exposure they reflect. Applying the index to the 2457 municipalities in Mexico, the authors examined the spatial distributions of both the factors that favor greater susceptibility to damage and their negative consequences for people. The resulting information facilitated science-based decision-making. The vulnerability index values were classified into four levels: Medium, High, Very High, and Critical. The results showed that while some places are highly vulnerable due to their demographic characteristics, others are highly vulnerable due to the absence of health infrastructure, their poor socioeconomic conditions, or a combination of two or more of the above specified
492
F. De Pascale
dimensions. Vulnerabilities of populations change from one place to another and from scale to scale and do not necessarily follow a homogeneous territorial model. Furthermore, the data showed that at the urban level there is a greater population in the areas of greatest vulnerability and that, both nationally and locally, the most vulnerable population is the most marginalized, due to their socio-economic status and their location with respect to health services. As regards health, in terms of health emergency, the most marginalized population will require specific policies and actions to have access to medical care and to cope with the disease in the event of contagion. This also means that specific policies will be needed to allow the population to recover from the negative economic effects generated by the pandemic. According to the Surgo Foundation study (2020), the impacts of COVID-19 on every community in the United States were not the same for every community. The “The COVID-19 Community Vulnerability Index (CCVI)” index—developed by the Surgo Foundation—identified which communities may need the most support, while the spread of COVID-19 is ongoing. Mapped at the county and state level, the CCVI aims to inform about planning and mitigation of COVID-19 in the United States.
22.5
Brief Concluding Remarks
Social vulnerability affects the ability to prepare for, react to, and recover from disasters. The identification of vulnerable populations and the factors that contribute to their vulnerability are essential for an effective reduction of the risk of disasters. In particular, the studies presented in this chapter showcase how social, cultural, institutional, and economic factors influence various indicators and components, depending on the approach used, which together constitute the indices being analyzed. These indices should be adopted by national and local governments to assess the vulnerable conditions of the population and, consequently, implement actions to prevent and mitigate the risks associated with extreme natural events and also with the spread of diseases. With regard to the ongoing COVID-19 health emergency, for example, the recent division into risk areas proposed by the Italian government in 2020, in harmony with the Istituto Superiore di Sanità, provided for the use of 21 indicators which, through a systemic and quantitative method, allowed the evaluation of the resilience capacity of the health system with respect to the territorial spread of infections linked to COVID-19 virus and its sub-variants. Although the latter is not defined as an index of social vulnerability, but focuses attention on resilience, it possesses all the requirements and characteristics of an index that also takes into account the conditions of systemic vulnerability that distinguish the various Italian regions. This is the case in the Calabria region which, despite having a low number of infections, was placed in the red zone due to the fragility of its health system and institutional vulnerability which, following the MOVE framework, is defined as the “potential for damage to governance,
22
The Social Vulnerability Index: A Literature Review
493
organizational form and function, as well as the formal / legal and informal / customary guiding rules” (Birkmann et al. 2013). Risk governance is linked to decisions and actions performed by formal stakeholders such as governments or different government institutions and informal stakeholders (individual families). This includes tasks on risk reduction, prevention, mitigation, and transfer and also disaster preparedness and management (Renn 2008). In summary, the assessment of the resilience and vulnerability of a system must also consider the institutional quality and specific governance of disaster reduction at the macro, meso, and microscale levels; otherwise the reduction of the risk of disasters cannot be implemented in a sustainable and effective way.
References Aaron Kobina C (2016) Household vulnerability and adaptation options in resource-poor communities in Accra, Ghana. Thesis, Faculty of Social Science, University of Ghana Adger WN (2006) Vulnerability. Glob Environ Chang 16(3):268–281 Alam GMM (2017) Livelihood cycle and vulnerability of rural households to climate change and hazards in Bangladesh. Environ Manag 59:777–791 Alexander DE (1993) Natural disasters. UCL Press, London; Chapman & Hall, New York, 632, pp Azar D, Rain D (2007) Identifying population vulnerable to hydrological hazards in San Juan, Puerto Rico. GeoJournal 69(1-2):23–43 Birkmann J (2006) Measuring vulnerability to natural hazards. UNU Press, Tokyo Birkmann J, Cardona OD, Carreño ML et al (2013) Framing vulnerability, risk and societal responses: the MOVE framework. Nat Hazards 67:193–211. https://doi.org/10.1007/s11069013-0558-5 Boruff BJ, Emrich C, Cutter SL (2005) Erosion hazard vulnerability of US coastal counties. J Coast Res 2005(215):932–942. https://doi.org/10.2112/04-0172.1 Brody SD, Zahran S, Vedlitz A, Grover H (2008) Examining the relationship between physical vulnerability and public perceptions of global climate change in the United States. Environ Behav 40(1):72–95. https://doi.org/10.1177/0013916506298800 Carnelli F, Frigerio I (2016) A socio-spatial vulnerability assessment for disaster management: insights from the 2012 Emilia earthquake (Italy). Sociologia Urbana e Rurale 111:22–44. https://doi.org/10.3280/SUR2016-111002 Chakraborty J, Tobin GA, Montz BE (2005) Population evacuation: assessing spatial variability in geophysical risk and social vulnerability to natural hazards. Nat Hazard Rev 6:1 Clark G, Moser S, Ratick S, Dow K, Meyer W, Emani S, Jin W, Kasperson J, Kasperson R, Schwartz H (1998) Assessing the vulnerability of coastal communities to extreme storms: the case of Revere, MA, USA. Mitig Adapt Strat Glob Chang 3(1):59–82 Conner TA (2005) Social vulnerability and adaptive capacity to climate change impacts: identifying attributes to two remote coastal communities on Haida Gwaii, British Columbia. Master’s thesis. University of Victoria Cutter SL (1996) Vulnerability to environmental hazards. Prog Hum Geogr 20(4):529–539 Cutter SL, Mitchell J, Sean Scott M (2000) Revealing the vulnerability of people and places: a case study of Georgetown County, South Carolina. Ann Am Assoc Geogr 90(4):713–737 Cutter SL, Boruff BJ, Shirley L (2003) Social vulnerability to environmental hazards. Soc Sci Q 84(2):242–261 de Loyola Hummell BM, Cutter SL, Emrich CT (2016) Social vulnerability to natural hazards in Brazil. Int J Disaster Risk Sci 7:111. https://doi.org/10.1007/s13753-016-0090-9
494
F. De Pascale
de Oliveira Mendes JM (2009) Social vulnerability indexes as planning tools: beyond the preparedness paradigm. J Risk Res 12(1):43–58. https://doi.org/10.1080/13669870802447962 Dwyer A, Zoppou C, Mielsen O, Day S, Roberts S (2004) Quantifying social vulnerability: a methodology for identifying those at risk to natural hazards. Geoscience Australia Record 2004/ 14 Fekete A (2009) Validation of a social vulnerability index in context to river-floods in Germany. Nat Hazards Earth Syst Sci 9:393–403. https://doi.org/10.5194/nhess-9-393-2009 Frigerio I, Carnelli F, Cabinio M et al (2018) Spatiotemporal pattern of social vulnerability in Italy. Int J Disaster Risk Sci 9:249–262. https://doi.org/10.1007/s13753-018-0168-7 Füssel H, Klein RJT (2006) Climate change vulnerability assessments: an evolution of conceptual thinking. Clim Change 75:301–329. https://doi.org/10.1007/s10584-006-0329-3 Hahn MB, Riederer AM, Foster SO (2009) The Livelihood Vulnerability Index: a pragmatic approach to assessing risks from climate variability and change—a case study in Mozambique. Glob Environ Chang 19(1):74–88 Hinkel J (2011) Indicators of vulnerability and adaptive capacity. Towards a clarification of the science-policy interface. Glob Environ Chang 21:198–208. https://doi.org/10.1016/j.gloenvcha. 2010.08.002 Holand IS, Lujala P (2013) Replicating and adapting an index of social vulnerability to a new context: A comparison study for Norway. Prof Geogr 65(2):312–328 Kumar D, Kumar Bhattacharjya R (2020) Study of integrated Social Vulnerability Index SoVIint of Hilly Region of Uttarakhand, India. Environ Climate Technol 24(1):105–122. https://doi.org/ 10.2478/rtuect-2020-0007 Letsie MM, Grab SW (2015) Assessment of social vulnerability to natural hazards in the Mountain Kingdom of Lesotho. Mt Res Dev 35(2):115–125. https://doi.org/10.1659/MRD-JOURNALD-14-00087.1 Myers CA, Slack T, Singelmann J (2008) Social vulnerability and migration in the wake of disaster: the case of Hurricanes Katrina and Rita. Popul Environ 29(6):271–291 Oliver-Smith A (1996) Anthropological research on hazards and disasters. Ann Rev Anthropol 25: 303–328. https://doi.org/10.1146/annurev.anthro.25.1.303 Opiyo FE, Wasonga OV, Nyangito MM (2014) Measuring household vulnerability to climateinduced stresses in pastoral rangelands of Kenya: Implications for resilience programming. Pastoralism 4:10. https://doi.org/10.1186/s13570-014-0010-9 Reckien D (2018) What is in an index? Construction method, data metric, and weighting scheme determine the outcome of composite social vulnerability indices in New York City. Reg Environ Change 18:1439–1451. https://doi.org/10.1007/s10113-017-1273-7 Renn O (2008) Risk governance: coping with uncertainty in a complex world. Earthscan, London Rygel L, O’sullivan D, Yarnal B (2006) A method for constructing a Social Vulnerability Index: an application to hurricane storm surges in a developed country. Mitigation Adapt Strateg Global Change 11(3):741–764 Siagian TH (2013) Social vulnerability to natural hazards in Indonesia: driving factors and policy implications. Nat Hazards 70:1603–1617 Spielman SE, Tuccillo J, Folch DC et al (2020) Evaluating social vulnerability indicators: criteria and their application to the Social Vulnerability Index. Nat Hazards 100:417–436. https://doi. org/10.1007/s11069-019-03820-z Suárez Lastra M, Valdés González C, Galindo Pérez M, Salvador Guzmán L, Ruiz Rivera N, Alcántara-Ayala I, López Cervantes M, Rosales Tapia A, Lee Alardin W, Benítez Pérez H, Juárez Gutiérrez MDC, Bringas López O, Oropeza Orozco O, Peralta Higuera A, Garnica-Peña R (2020) Índice de vulnerabilidad ante el COVID-19 en México. Investigaciones Geográficas. https://doi.org/10.14350/rig.60140 Surgo Foundation (2020) Covid-19 community vulnerability index. https://precisionforcovid.org/ ccvi. Accessed 31 October 2022 United Nations Office for Disaster Reduction (2009) UNISDR terminology on disaster risk reduction. Geneva, May 2009. Retrieved from http://www.unisdr.org/we/inform/terminology
22
The Social Vulnerability Index: A Literature Review
495
Weichselgartner J (2001) Disaster mitigation: the concept of vulnerability revisited. Disaster Prev Manag 10(2):85–95 Wisner B, Blaikie P, Cannon T, Davis I (2004) At risk: natural hazards, people’s vulnerability and disasters. Routledge, London Wu S, Yarnal B, Fisher A (2002) Vulnerability of coastal communities to sea-level rise: a case study of Cape May County, New Jersey, USA. Climate Res 22:255–270 Yoon D (2012) Assessment of social vulnerability to natural disasters: a comparative study. Nat Hazards 63(2):823–843 https://news.aag.org/2020/05/aag-newsletter-may-2020/
Chapter 23
Geoethics, Environmental Law and the Necessary Dialogue Between Knowledges Livio Perra
Abstract Can geoethics and, more generally, the activity of geoscientists contribute to the development of environmental law? First of all, the author reflects on geoethics and identifies its definition. He investigates the relation between geoethics, morality and environmental law. Later, he observes that the current era is called the Anthropocene. The behaviours of human beings affect the world in which we live. A new current of thought, which can be called Ecological Humanism, preaches a harmonious relation between man and nature. Attention is then focused on the contribution that geoethics can make. Geoscientists, due to their activity, are the first to observe the consequences of human activity on the environment and can suggest which are the virtuous behaviours. The author notes that in order to address complex problems, such as environmental issues, a dialogue between disciplines is needed. Finally, the author analyses how an interaction between geoethics and, more generally, geosciences and the legal world can take place. Complex questions require answers that go beyond the boundaries of the disciplines, and, for this reason, an adequate solution requires a joint effort of different disciplines. A possible solution to environmental problems may derive from the collaboration between geoethics, geosciences and law. Keywords Geoethics · Environmental law · Dialogue between knowledges · Morality · Anthropocene · Ecological humanism
L. Perra (✉) Dipartimento di Storia, Scienze dell’Uomo e della Formazione, Università degli Studi di Sassari, Sassari, Italy e-mail: [email protected] © The Author(s), under exclusive license to Springer Nature Switzerland AG 2023 S. D’Amico, F. De Pascale (eds.), Geohazards and Disaster Risk Reduction, Advances in Natural and Technological Hazards Research 51, https://doi.org/10.1007/978-3-031-24541-1_23
497
498
23.1
L. Perra
Introduction
Our world is affected by climate change and an environmental degradation that progressively advances. All governments are constantly looking for solutions to curb these phenomena. Geoethics, a recently born discipline, focuses on the enhancement and protection of the planet. It is a science of morality and studies the behaviours and good practices that govern the relationship between man and nature. It is not merely a sectoral discipline, but can provide an important contribution to other disciplines that have as their object the regulation of human behaviour. In particular, the author evaluates what advantages emerge from a connection between geoethics and environmental law. The main function of law is to regulate life in society and, specifically, human behaviour. Faced with the environmental problem, an effort by various disciplines is needed to understand the extent of the phenomenon and design effective solutions. The author’s goal is to demonstrate how an interaction between disciplines is essential in environmental matters. In particular, he examines the possible connection between geoethics and environmental law, evaluating the advantages that environmental protection could bring. Geoethics is a science of morality, and for this reason, attention must be paid to the relationship between geoethics, morality and law. Everything fits into a new phase that humanity is going through. The current era is defined as Anthropocene, and there is a current of thought that, aware of the effect of human actions on the environment, preaches a new relationship between man and nature and a harmony between all the entities that make up the planet. It can be called Ecological Humanism. Geoethics and, more generally, the activity of geoscientists can contribute to a new environmental law that manifests itself in different phases. When phenomena are analysed to obtain full knowledge, the contribution of all professionals who carry out their activities in close contact with nature is undoubtedly important. Law should consider in the production phase the norms of good practices and behaviours suggested by experts as environmentally friendly. In the phase of interpretation and application of the norms, it is important to use concepts that derive from the natural sciences and geoethics to give a reading that is oriented towards respect for the environment. In an era where every discipline is increasingly sectoral and perfects its knowledge, a connection of disciplinary knowledge is necessary. In order to give an effective response to environmental issues, one of the possible paths is the one that passes through the contribution of all the disciplines that deal with the various aspects connected to them. Collaboration between the different types of knowledge will help to understand the phenomena that threaten the existence of the planet and lead to the discovery of appropriate strategies and solutions to counter them. The author analyses the relationship between geoethics and environmental law. He investigates whether geoethics and, more generally, the activity of geoscientists can contribute to the development of environmental law. The first step is to identify the definition of geoethics. Later, he examines the relation between geoethics, morality and environmental law. This relation takes place in the current era, defined
23
Geoethics, Environmental Law and the Necessary Dialogue Between Knowledges
499
as Anthropocene. In this era, a new current of thought focused on the harmony of human beings with nature, called Ecological Humanism, develops. In order to devise solutions to environmental problems, it is necessary to make use of the knowledge from different disciplines. For this reason, it is useful to observe what are the degrees of connection between the different disciplines. Finally, the relation between geoethics and law and, in particular, in which phases a connection between them could take place are examined.
23.2
Towards a Definition of Geoethics
The term “geoethics” identifies a recent discipline. Francesco De Pascale, Valeria Dattilo, Francesco Nebbia and Alessandro Agus say: “[it] was founded in 1991 with the main objective of focusing on the enhancement and protection of the geosphere” (De Pascale et al. 2016, 277). It should be noted that: “the mission of Geoethics is in implementation of the values approach, values criteria in practice of geological exploration and mining activities, use of mineral resources and preservation of objects of inorganic nature (geo-heritage) as opposed to self-interest and (individual, corporate, state) mercantilism” (Nwankwoala 2019, 3). Geoethics is a science of morality that deals with regulating the relationships between human beings and inanimate nature (e.g. the exploitation of mineral resources) and can come to regulate human behaviour in such contexts (see Nwankwoala 2019, 3). It is a science in the making, and its subject has been extended in recent years to the “protection of the environment and the climate” (De Pascale et al. 2016, 277). Therefore, geoethics must be understood as the one who directs behaviour and, more generally, regulates the action of society in the face of environmental problems, contributing to the formulation of solutions that are compatible with the conservation of the territory (see Peppoloni 2011, 1; De Pascale et al. 2016, 277). The solutions to geoethical problems presuppose ethical choices, and with regard to the content of such solutions, it is necessary “to have time and collective common sense to determine the best option out of all available decisions for all interested parties” (Nwankwoala 2019, 4). Although geoethics can be considered a “challenge for professional deontology” (González and Martínez-Frías 2011, 10), it embraces a wider dimension and is not an exclusive prerogative of geoscientists. In particular, professional deontology is the ethics applied by a professional group (see González and Martínez-Frías 2011, 11), while geoethics, as moral science, characterizes a universal context. Borrowing the terminological choice of Francesco Viola (see Viola 1990, 75), which is inspired by the words of Hans Kelsen (see Kelsen 1982, 71), the term “moral” can be used to designate the object and the word “ethics” to designate the science that studies it. Geoethics can be defined as the science that studies the moral values underlying the geosphere and, more generally, respect for the environment.
500
23.3
L. Perra
Geoethics, Morality and Environmental Law
One of the most important functions of law is to “influence the behavior of its recipients; law serves (and seeks to ensure that) the subjects to which it applies do or do not do something” (Pino 2013, 145). It therefore guides human behaviour. Legal norms, understood as essential elements of law, perform this task. Could geoethics contribute to the process of creating legal norms? In order to answer this question, it is necessary to analyse the relationship between morality and the creation of norms, since geoethics is the science that deals with the ethics of the earth, or better the morality applied to issues concerning the earth. There is a series of relations between the creation of law and morality, which Giorgio Pino names “causal relations” (Pino 2016, 19). With this expression he wants to indicate: “the circumstance that moral considerations can influence the production of law, understood as the production of general and abstract norms, for example of legislative nature [. . .]” (Pino 2016, 19). This circumstance is explained in light of the fact that the law created by the Legislator, being created by individuals, becomes a vehicle of moral values and needs expressed by society (see Pino 2016, 19). Moral considerations are not the only element that comes into play. The Legislator’s activity is characterized by other factors, such as: “more strictly political considerations, negotiations and compromises between the groups that manage the production of legislation, vested interests” (Pino 2016, 20). The connection between morality and normative production raises some questions. The affirmation of moral values of the majority of the population in the law production, although widely shared by individuals, could lead to the detriment of the values and lifestyles of other individuals to whom they do not belong. This problem is obviated by applying the principle of damage, or offensiveness, and this occurs especially in criminal matters. In particular, some behaviours are not only sanctioned as they are contrary to morality, but also because they cause harm to other people (see Pino 2016, 20–21). In this sense, geoethics can make its contribution to the production of environmental legislation, bringing its moral values and contributing to the reflection that leads to the genesis of the norms that protect the environment. It is not just about moral values, but indications that trace the path to avoid the negative consequences to which the planet Earth is subjected and preventing possible environmental damage.
23.4
Anthropocene and Ecological Humanism
The current era is defined Anthropocene to indicate the era in which human activity affects the planet and its existence (see Crutzen 2006, 13–18). Human beings become aware of the impact of their actions on the environment and the possible damage that their conducts can cause. Governments are constantly looking for new
23
Geoethics, Environmental Law and the Necessary Dialogue Between Knowledges
501
solutions to protect nature. Some people change their lifestyles and habits in the name of eco-sustainability or to have with their actions a lower environmental impact. In particular, a new trend is growing and can be defined as Ecological Humanism. The Ecological Humanism was theorized by Henryk Skolimowski (see Skolimowski 1975, 1981, 53–89). It is a current of thought that redesigns the relationship between man and nature and conceives the world as the home of the human being, abandoning the idea of antagonism between man and nature and its submission to human needs. The world is seen in a new light: “it seems that we can now look at the whole evolutionary development of the Cosmos in a new way” (Skolimowski 1975, 4). This new way of thinking places nature on the same level with the human being and emphasizes the reciprocal balances that exist between the health of the planet and individuals’ life (see Skolimowski 1981, 54; Perra 2020, 229). In order to trace a phenomenon back to this current of thought, it is necessary to identify the characteristics of Ecological Humanism. Skolimowski (see Skolimowski 1981, 54–55) identifies three essential elements that characterize Ecological Humanism. These are: “the coming age is to be seen as the age of stewardship” (Skolimowski 1981, 54); “the world is to be conceived of as a sanctuary” (Skolimowski 1981, 54); “knowledge is to be conceived of as an intermediary between us and the creative forces of evolution” (Skolimowski 1981, 55). Various phenomena observed in different places can be traced back to this current of thought. An example comes from Andean neo-constitutionalism and the importance that is given to nature in the legal systems of Ecuador and Bolivia (see Perra 2020, 230). The indigenous movements have brought a different conception of the relationship between man and nature into political and legal debates which have resulted in an unprecedented production of environmental legislation, which could be defined as ecological. Nature is considered a subject by the legal system and its rights are affirmed (see Perra 2021, 27–28). Another phenomenon is the new category of biocultural rights. These rights are based on the traditional land administration of indigenous and tribal peoples. They are made up of lifestyles and the management of territories based on millenary practices, characterized by the cosmovision of indigenous peoples and the harmonious relationship between man and nature (see Perra 2021, 125). In a different way, there are various signs that suggest that there is a new phase, which can be defined Ecological Humanism, where Homo Ecologicus chooses to implement behaviours that have the least environmental impact, aware of the fact that the connection between human beings and nature depends on global health, the well-being of nature and all the beings that compose it, including the human species.
502
23.5
L. Perra
The Contribution of Geoethics
Geoethics was born in the arms of geoscientists. This aspect should not be underestimated. Due to their scientific and professional activity, they are the first to observe the environmental impact exerted by human activities and the consequences they bring to territories. This direct contact creates a particular awareness of the situation in which the geosphere is and of environmental damages, including those that develop silently diluted over time. By constantly observing this situation, geoscientists can identify trends and, in some cases, predict future developments in advance. Geoethics was born initially as a discipline of morality of the category of scientists who study the earth in its various forms and from different sector perspectives. The need that emerges, however, is not only and exclusively that of regulating one’s own conduct in carrying out one’s duties or in warning the general population about possible environmental drift. Geoethics loses the strictly sectoral connotation, to embrace the role of formulating moral values that can be applied to every sphere of interaction between man and nature. The values and principles enucleated can indicate the way forward to stem environmental problems. The study of the moral values underlying relations with the environment and the suggestion of virtuous conducts that reduce the environmental impact of human activities could contribute to legislative choices aimed at responding to the environmental emergency, which is growing exponentially day after day. Specifically, they are not mere conducts based on moral principles, based on some kind of theoretical speculation, but originate from empirical observation and reflection on the appropriate ways of interfacing with the world around us. Geoethics is not an end in itself, but becomes an additional tool for other disciplines that deal with environmental protection. The political and legal world can, through the contribution of the new geoethical discipline, enrich its decisions with contents and reflections, have a more complete cognitive framework, and design and devise new solutions on it.
23.6
The Necessary Interaction Between Disciplines
The term “discipline” identifies “an organizational category within scientific knowledge; it institutes the division and specialization of labor and responds to the diversity of fields covered by the sciences” (Morin 1994). In particular, as Angelo Vescovi points out: “discipline derives from the Latin discere with the meaning of learning. [. . .] It indicates a relationship, a negotiation, between the learner and the experience that surrounds him, the others” (Vescovi 2011, 1). Each discipline in dealing with a given phenomenon finds points of contact with other disciplines, which sometimes observe the same object from a different perspective. Nowadays, according to what Philip Langbroek, Kees van den Bos, Marc Simon Thomas, Michael Milo and Wibo van Rossum underline, it can be assumed that: “the position of legal studies has increasingly become part of a debate
23
Geoethics, Environmental Law and the Necessary Dialogue Between Knowledges
503
among legal scholars and their university colleagues in disciplines like economics, sociology, political sciences, psychology, history and linguistics” (Langbroek et al. 2017, 1). Each discipline abandons the position of sectoral autonomy to prefer an exchange with the others. Specifically, a single discipline is no longer to be understood as an island, but the exchanges of knowledge, methods and concepts go to fit into a design that sees disciplines as part of an archipelago. The relations between the disciplines can be traced back to four different categories (Rossi and Biondi 2014, 148–149): “multidisciplinary”, “pluridisciplinary”, “interdisciplinary” and “transdisciplinary”. In multidisciplinarity there is a path that is not always participatory between the disciplines, but at the same time a common goal is reached, thanks to the union of the single contribution of each discipline (see Rossi and Biondi 2014, 148; Rossi 2011, 44). In pluridisciplinarity, the disciplines cooperate. Although they pursue different ends, this relation underlines the connections that exist between them (see Rossi and Biondi 2014, 148). In interdisciplinarity there is not only a juxtaposition of different disciplines, but they interact and there are exchanges of ideas, contents, definitions and methods (see Rossi and Biondi 2014, 148). In this regard Sergio Rondinara states that: “interdisciplinarity is commonly understood as a “horizontal” approach between disciplines that allows a more adequate understanding of a given object whose study, due to its complexity, could hardly be grasped with a single disciplinary method” (Rondinara 2008, 63). The highest level of connection between disciplines is in transdisciplinarity. The reflections concerning the object of study go beyond the boundaries of each discipline involved. Disciplines are integrated, methods and knowledge are enriched by this interaction and, sometimes, new disciplines are born. The connections between disciplines are in such moments aimed at the pursuit of a common goal (see Marra Barone 2006; Rossi and Biondi 2014, 149). The connection between disciplines becomes necessary facing phenomena that require specific knowledge that go beyond the individual disciplinary fields to understand, study and make decisions to solve problems. The degree of connection between disciplines can be of a mere conceptual nature, but can also become deeper to the point of intersecting knowledges in order to have a complete picture of a phenomenon. The situation itself to be faced will bring the degree of union, cooperation and interaction between the disciplines. There are some issues, such as environmental ones, that require a broad-spectrum approach in order to lay the necessary knowledge bases and evaluate the feasibility and practicability of possible solutions.
504
23.7
L. Perra
Geoethics and Law
Taking into consideration geoethics and law, it is necessary to verify which interactions can be useful and to what extent. The relation between the two disciplines can be expressed on various levels: the level of understanding, the level of planning, the level of normative production and the level of interpretation and application. Law governs society, life in society, relationships between people and the environment where society is inserted. The level of understanding is the first essential phase for the law. In order to understand a phenomenon, it is necessary an analysis that includes aspects that are not always and only belonging to the legal world. In particular, there are phenomena, such as the Covid-19 pandemic or environmental issues, where to be aware of the extent of the phenomenon, its causes, possible remedies and actions to be taken, it is also necessary to rely on different scientific disciplines such as medicine, natural, economic and social sciences. Specifically in environmental matters, and in particular in cases in which environmental damage occurs or in the degradation of the planet, geoscientists’ knowledge can help to understand the phenomena, their genesis, their dangerousness, virtuous behaviours aimed at avoiding them, the possible remedies and their effectiveness. The union of concepts brought by the different disciplines, therefore, is useful for fully understanding some phenomena. The level of planning is essential to understand which public policies should be designed and which solutions are preferable to stem the problems that emerge over time. For example, during the Covid-19 pandemic, it has been necessary for politicians and jurists to evaluate the range of possible solutions to face the emergency with the help of a technical-scientific committee. Similarly, as regards the environmental problem, in order to devise the solutions and understand which is the most suitable one in terms of cost-benefit, it is necessary that jurists and politicians collaborate with geoscientists, who have the appropriate skills to understand which behaviours should be avoided, which solutions can be chosen and what could be the advantages. The level of normative production is the phase in which norms are produced. Often, it happens that in writing the norms it is necessary to resort to other knowledge, to other disciplines to incorporate the concepts. There are scientific concepts of other disciplines that are useful to integrate into normative texts. In environmental matters, it may be necessary to resort to the concepts enucleated by geoethics or other natural sciences in order to give consistency to the definitions and parts of them. The level of interpretation and application concerns a phase subsequent to the production of the norms. It consists of the moment in which the law is interpreted and applied to concrete cases. At this stage, the judges must use the legal norms present in the legal system to decide on the cases that are brought to their knowledge. When it is necessary to analyse the facts and there are technical-scientific issues to be understood to make
23
Geoethics, Environmental Law and the Necessary Dialogue Between Knowledges
505
decisions, technical advice is used. The judges make use of the activity of consultants, who, through the knowledge of their discipline, contribute to the explanation of the phenomena and help to create a full and complete knowledge of what happened. In environmental matters, geoethics and natural sciences can give their contribution to provide a correct reading of the facts, forming an adequate knowledge of phenomena, which may be useful for the subsequent and consequent decision of the judges. A connection between the various disciplines is necessary, as some situations are complex in themselves to the point of not being assimilable or manageable using only one of them as a reference. The more complex the situation becomes, the more there is a need for a higher interaction between disciplines. Human knowledge is not the prerogative of a single discipline, but it is distributed in the various disciplines. The collaboration between expert scholars in different sectors and disciplines help to have a complete view of the phenomena and observing them from different perspectives. The solutions to environmental problems, due to the complexity of the issues that are expressed on different levels, require a necessary integration between legal, economic, social and natural disciplines. It is useful in order to understand phenomena, the ways in which they could be contrasted and the decisions to make. Only a joint effort by all can lead to stemming the phenomena that threaten the health of the human species and the environment in which we live.
23.8
Conclusions
Geoethics, born as ethics of geosciences, extends its object over time to environmental issues and climate change. We live in an era that has been called Anthropocene. It means that we are in an era in which human action can influence the fate of the planet. Various countries are looking for solutions to put a stop to the environmental drift that inexorably threatens the health of the Earth and the existence of the human species and all the living beings that make up the planet. Environmental problems are complex. For this reason, it is necessary to devise solutions with the help of the knowledge of different disciplines. A viable path can be a connection between disciplines that allows a dialogue between knowledge. In this chapter, the author investigates whether geoethics and, more generally, the activity of geoscientists can contribute to the development of environmental law. Geoethics is a science of morality, and in this sense it can help identify virtuous behaviours. Law plays the important role of regulating life in society, and geoethics can help identify good practices and behaviours that need to be encouraged. Lawmakers can find inspiration from the broadening of the application of geoethics to all relations between man and nature. The connection between law and geoethics and, more generally, geosciences can contribute to understand phenomena, design effective environmental protection systems, produce and apply legal norms. In order to understand and contrast complex phenomena, a dialogue between disciplines is
506
L. Perra
needed. The knowledge from various disciplines can help to have a complete picture of the phenomena and to prepare suitable solutions.
References Crutzen PJ (2006) The “anthropocene”. In: Ehlers E, Krafft T (eds) Earth system science in the anthropocene. Springer, Berlin, pp 13–18 De Pascale F, Dattilo V, Nebbia F, Agus A (2016) Geoetica e bene comune nell’era dell’Antropocene. In: Commons/Comune: geografie, luoghi, spazi, città, AA. VV.; Società di Studi Geografici: Firenze, Italia. Memorie Geografiche, nuova serie 14, pp 277–286. Società di Studi Geografici. Society for Geographical Studies. Memorie Geografiche ed altre Pubblicazioni. The Memorie Geografiche and other Publications. Available online http:// www.societastudigeografici.it/memorie-geografiche/. Accessed 29/11/2021 González JL, Martínez-Frías J (2011) Geoética: un reto para la deontología profesional. Tierra y tecnología 40:10–14 Kelsen H (1982) Teoría pura del derecho, traducción de la segunda edición en alemán por Roberto J. Vernengo. Universidad Nacional Autónoma de México, México, D.F. Langbroek P, van den Bos K, Simon Thomas M, Milo M, van Rossum W (2017) Editorial methodology of legal research: challenges and opportunities. Utrecht Law Rev 13(3):1–8. Available online https://www.utrechtlawreview.org/articles/abstract/10.18352/ulr.411/. Accessed 29/11/2021 Marra Barone A (2006) Interdisciplinarità. Convergenza dei saperi sull’uomo e per l’uomo. Rivista digitale della didattica. Available online http://www.rivistadidattica.com/fondamenti/ fondamenti2.htm. Accessed 29/11/2021 Morin E (1994) Sur l’interdisciplinarité. Bulletin interactif du Centre International de Recherches et Études Transdisciplinaires (CIRET) (2). CIRET Centre International de Recherches et Études Transdisciplinaires. Available online https://ciret-transdisciplinarity.org/bulletin/b2c2.php. Accessed 29/11/2021 Nwankwoala HO (2019) Geoethics as an emerging discipline: perspectives, ethical challenges and prospects. Earth Sci Malays (ESMY) 3(1):1–8. Available online https://earthsciencesmalaysia. com/esmy-01-2019-01-08/. Accessed 29/11/2021 Peppoloni S (2011) Che cosa significa “Geoetica”? Dentro le parole, il senso dell’attività del geologo. Geoitalia 34:1–3 Perra L (2020) Le nuove sfide della democrazia: i diritti della natura nell’Umanesimo Ecologico. Polifonia—Revista Internacional da Academia Paulista de Direito (6):211–236. Academia Paulista de Direito. Sumário. Polifonia—Revista Internacional da Academia Paulista de Direito. Available online https://apd.org.br/sumario-6/. Accessed 29/11/2021 Perra L (2021) I sistemi di protezione ambientale di Ecuador e Bolivia e l’affermazione dei diritti della natura. Il Sileno Edizioni, Lago (CS), Italia. Volumi. Available online https://www. ilsileno.it/edizioni/ebooks/. Accessed 29/11/2021 Pino G (2013) Norma giuridica. In: Pino G, Schiavello A, Villa V (eds) Filosofia del diritto. Introduzione critica al pensiero giuridico e al diritto positivo. Giappichelli, Torino, Italia, pp 144–183 Pino G (2016) Diritto e morale. In: Bongiovanni G, Pino G, Roversi C (eds) Che cosa è il diritto. Ontologie e concezioni del giuridico. Giappichelli, Torino, Italia, pp 3–30 Rondinara S (2008) Dalla interdisciplinarità alla transdisciplinarità. Una prospettiva epistemologica. Sophia: Ricerche su i fondamenti e la correlazione dei saperi 61–70. Città nuova. Cultura e informazione. Available online https://www.cittanuova.it/ dallinterdisciplinarita-alla-transdisciplinarita-2/?ms=006&se=007. Accessed 29/11/2021
23
Geoethics, Environmental Law and the Necessary Dialogue Between Knowledges
507
Rossi PG (2011) Didattica enattiva. Complessità, teorie dell’azione, professionalità docente. Franco Angeli, Milano, Italia Rossi PG, Biondi S (2014) Interdisciplinarità. Educ Sci Soc (ESS) 5(1):147–153. Educational Sciences & Society. Available online https://riviste.unimc.it/index.php/es_s/article/view/934. Accessed 29/11/2021 Skolimowski H (1975) Ecological humanism. Gryphon, Lewes, Sussex, UK Skolimowski H (1981) Eco-philosophy: designing new tactics for living. Boston, MA, M. Boyars Vescovi A (2011) Cultura e interdisciplinarità: quali legami e quali opportunità. Formazione, lavoro, persona 1:1–6. Rivista Formazione, lavoro, persona. Cultura e interdisciplinaretà: quali legami e quali opportunità. Available online https://forperlav.unibg.it/index.php/fpl/ article/view/17. Accessed 29/11/2021 Viola F (1990) Il diritto come pratica sociale. Editoriale Jaca Book, Milano, Italia