Geochemistry of Geologic CO2 Sequestration 9781501508073, 9780939950928
Volume 77 of Reviews in Mineralogy and Geochemistry focuses on important aspects of the geochemistry of geological CO2 s
228 62 86MB
English Pages 553 [556] Year 2018
Reviews
Preface
TABLE OF CONTENTS
1. Geochemistry of Geologic Carbon Sequestration: An Overview
2. Natural Analogues
3. Thermodynamics of Carbonates
4. PVTX Properties of H2 0-C02-"salt" at PTX Conditions Applicable to Carbon Sequestration in Saline Formations
5. Experimental Perspectives of Mineral Dissolution and Precipitation due to Carbon Dioxide-Water-Rock Interactions
6. Molecular Simulation of C02- and C03-Brine-Mineral Systems
7. In situ Investigations of Carbonate Nucleation on Mineral and Organic Surfaces
8. Pore Scale Processes Associated with Subsurface C02 Injection and Sequestration
9. Carbon Mineralization: From Natural Analogues to Engineered Systems
10. Acid Gases in C02-rich Subsurface Geologic Environments
11. Geochemical Monitoring for Potential Environmental Impacts of Geologic Sequestration of C02
12. Multi-scale Imaging and Simulation of Structure, Flow and Reactive Transport for C02 Storage and EOR in Carbonate Reservoirs
13. Caprock Fracture Dissolution and C02 Leakage
14. Capillary Pressure and Mineral Wettability Influences on Reservoir C02 Capacity
15. Geochemistry of Wellbore Integrity in C02 Sequestration: Portland Cement-Steel-Brine-C02 Interactions
Recommend Papers
![Microalgae for Biofuel Production and CO2 Sequestration [1 ed.]
9781611226379, 9781616681517](https://ebin.pub/img/200x200/microalgae-for-biofuel-production-and-co2-sequestration-1nbsped-9781611226379-9781616681517.jpg)

![Experimental Study of Multiphase Flow in Porous Media during CO2 Geo-Sequestration Processes [1 ed.]
978-3-642-25040-8, 978-3-642-25041-5](https://ebin.pub/img/200x200/experimental-study-of-multiphase-flow-in-porous-media-during-co2-geo-sequestration-processes-1nbsped-978-3-642-25040-8-978-3-642-25041-5.jpg)


File loading please wait...
Citation preview
REVIEWS IN MINERALOGY AND GEOCHEMISTRY Volume 77
2013
Geochemistry of Geologic C0 2 Sequestration EDITORS Donald J. DePaolo Lawrence Berkeley National Laboratory Berkeley, California
David R. Cole
The Ohio State University Columbus, Ohio
Alexandra Navrotsky University of California Davis Davis, California
Ian C. Bourg
Lawrence Berkeley National Laboratory Berkeley, California ON THE FRONT COVER: The cover figure shows scC0 2 /brine distribution in a reservoir sandstone during drainage, as imaged using dynamic synchrotron X-ray microtomography at in situ PIT conditions. The sample is a micro-core obtained from the Domengine Formation, a potential carbon storage target in the Sacramento Basin; scCO, is shown in yellow and residual brine is shown in blue. The size of the rendered cube is 5 mm and the underlying image volume has a resolution of 4.43 microns. The dataset was collected at the Advanced Light Source (Beamline 8.3.2) by J . B . Ajo-Franklin and T-H. Kwon and processed/visualized by M. Voltolini.
Series Editor: Jodi J. Rosso MINERALOGICAL SOCIETY OF AMERICA GEOCHEMICAL SOCIETY
Reviews in Mineralogy and Geochemistry, Volume 77 Geochemistry of Geologic C 0 2 Sequestration ISSN ISBN
1529-6466
978-0-939950-92-8
COPYRIGHT 2 0 1 3 THE M I N E R A L O G I C A L S O C I E T Y OF A M E R I C A 3 6 3 5 CONCORDE PARKWAY, SUITE 5 0 0 CHANTILLY, VIRGINIA, 2 0 1 5 1 - 1 1 2 5 , U . S . A . WWW.MINSOCAM.ORG The appearance of the code at the bottom of the first page of each chapter in this volume indicates the copyright owner's consent that copies of the article can be made for personal use or internal use or for the personal use or internal use of specific clients, provided the original publication is cited. The consent is given on the condition, however, that the copier pay the stated per-copy fee through the Copyright Clearance Center, Inc. for copying beyond that permitted by Sections 107 or 108 of the U.S. Copyright Law. This consent does not extend to other types of copying for general distribution, for advertising or promotional purposes, for creating new collective works, or for resale. For permission to reprint entire articles in these cases and the like, consult the Administrator of the Mineralogical Society of America as to the royalty due to the Society.
Geochemistry of Geologic C02 Sequestration 11
Reviews in Mineralogy and Geochemistry
11
FROM THE SERIES EDITOR The IPCC's (Intergovernmental Panel on Climate Change) Fifth Assessment Report (AR5) released September 25, 2013 stated that humans are the 'dominate cause' of global warming and warned that continued emissions of greenhouse gases will cause further warming and changes in all aspects of the climate system. Increasing atmospheric CO, concentrations, in particular, are considered to be the largest contributor to the climate changes and warming trends observed. According to the IPCC, it is essential to curb the production and release of CO, and other greenhouse gases. How perfectly timed that this latest volume in the Reviews in Mineralogy and Geochemistry series is focused on geologic carbon sequestration, a method to contain CO, in the subsurface! Co-edited by Don DePaolo, Dave Cole, Alex Navrotsky, and Ian Bourg, this volume presents an extended review of the topics covered in a short course on Geochemistry of Geologic CO, Sequestration held at the Lawrence Berkeley National Laboratory (LBNL) in Berkeley, CA prior (December 7-8, 2013) to the American Geophysical Union's 46th Annual Fall meeting in San Francisco, CA. The course, and this volume, are also accompanied by session V017 at the AGU meeting. All supplemental materials associated with this volume can be found at the MSA website. Errata will be posted there as well. Todi T. Posso, Series Editor West Richland, Washington October 2013
PREFACE Global climate change with substantial global warming may be the most important environmental challenge facing the world. Geologic carbon sequestration (GCS), in concert with energy conservation, increased efficiency in electric power generation and utilization, increased use of lower carbon intensity fuels, and increased use of nuclear energy and renewable sources, is now considered necessary to stabilize atmospheric levels of greenhouse gases and global temperatures at values that would not severely impact economic growth and the quality of life on Earth. Geological formations, such as depleted oil and gas fields, unmineable coal beds, and brine aquifers, are likely to provide the first large-scale opportunity for concentrated sequestration of CO,. The specific scientific issues that underlie subsurface sequestration technology involve the effects of fluid flow combined with chemical, thermal, mechanical and biological interactions between fluids and surrounding geologic formations. Complex and coupled interactions occur both rapidly as the stored material is emplaced underground, and gradually over hundreds to 1529-6466/13/0077-0000S00.00
http://dx.doi.Org/10.2138/rmg.2013.77.0
thousands of years. The long sequestration times needed for effective storage, the large scale of GCS globally necessary to significantly impact atmospheric C 0 2 levels, and the intrinsic spatial variability of subsurface formations provide challenges to both scientists and engineers. A fundamental understanding of mineralogical and geochemical processes is integral to the success of GCS. Large scale experiments will be carried out and monitored in the next decade. This will provide a unique opportunity to test our knowledge of fundamental hydrogeology, geochemistry and geomechanics. This MSA volume focuses on important aspects of the geochemistry of geological C 0 2 sequestration. It is in large part an outgrowth of research conducted by members of the U.S. Department of Energy funded Energy Frontier Research Center (EFRC) known as the Center for Nanoscale Control of Geologic C 0 2 (NCGC). Eight out of the 15 chapters have been led by team members from the NCGC representing six of the eight partner institutions making up this center — Lawrence Berkeley National Laboratory (lead institution, D. DePaolo - PI), Oak Ridge National Laboratory, The Ohio State University, the University of California Davis, Pacific Northwest National Laboratory, and Washington University, St. Louis. The Volume Editors (DePaolo, Cole, Navrotsky and Bourg) are extremely grateful to the NCGC team members who contributed to this volume as well to the authors of the other 7 chapters who are experts in various aspects of the geochemistry of C 0 2 sequestration but external from the NCGC program. We thank the many scientists who contributed their time and effort to provide constructive reviews of the chapters, including J. Ajo-Franklin, M. Bickle, E. Boek, I. Bourg, W. Carey, A. A. Chialvo, C. Conaway, D. Cole, G. Dipple, W. Evans, C. Huber, J. Kaszuba, N. Kampman, S. Krevor, Y. Liu, A. Navrotsky, D. Rimstidt, B. Rotenberg, N. Sypcher, C. Steefel, T. Tokunaga, and H. Yoon. We are enormously indebted to Lisa Kelly and Sandy Chin at LBNL, who provided critical technical assistance in all stages of the volume's development as well as orchestrating the logistics for the accompanying short course. Dr. J. Alex Speer of the Mineralogical Society of America provided critical advice during the development stage of the volume and the planning of the short course. We especially acknowledge Dr. Jodi J. Rosso for her assistance and editorial work without which this volume would have never been possible. This volume and the accompanying short course were made possible by generous support from the Mineralogical Society of America, the Geochemical Society and the U.S Department of Energy, Office of Basic Energy Sciences, Geosciences Research Program (Dr. Nicholas Woodward, Program Manager). Donald J. DePaolo Lawrence Berkeley National Laboratory
David R. Cole The Ohio State University
Alexandra Navrotsky University of California Davis
Ian C. Bourg Lawrence Berkeley National Laboratory
iv
Geochemistry of Geologic C02 Sequestration 11
Reviews in Mineralogy and Geochemistry
11
TABLE OF CONTENTS Geochemistry of Geologic Carbon Sequestration: An Overview Donald J. DePaolo, David R. Cole INTRODUCTION MINERALIZATION OF C0 2 PROPERTIES OF C0 2 AND ( ()• BRIM ! MIXTURES MINERAL-FLUID REACTIONS MINERAL SURFACE ( III MISTRY LEAKAGE PATHWAYS AND ENGINEERING OPTIONS MONITORING AND VERIFICATION OF C0 2 STORAGE SUMMARY ACKNOWLEDGMENTS REFERENCES
Z
1 4 5 7 9 10 11 1 1 1 1 1 1
Natural Analogues Mike Bickle, Niko Kampman, Max Wigley
INTRODUCTION REVIEW OF NATURAL C0 2 ACCUMULATIONS Petrological studies of subsurface C0 2 -reservoirs The Colorado Plateau and southern Rocky Mountains C0 2 province NOBLE GAS STUDIES OF THE COLORADO PLATEAU AND SOUTHERN ROCKY MOUNTAINS C0 2 PROVINCE Noble gases and natural C0 2 reservoirs Noble gas solubility's and Henry's Law Solubility fractionation of gas compositions Terrestrial noble gas reservoirs and sources The Colorado Plateau and southern Rocky Mountains C0 2 fields FLUID-MINERAL REACTIONS AND REACTION RATES The Green River natural analogue SUMMARY AND FURTHER WORK ACKNOWLEDGMENTS REFERENCES v
15 17 17 22 26 26 26 28 29 31 38 39 64 65 65
Geochemistry
Ó
of Geologic C02 Sequestration
- Table of
Contents
Thermodynamics of Carbonates A. V. Radha, A. Navrotsky
INTRODUCTION SEQUENCES OF CARBONATE CRYSTALLIZATION Thermodynamics of prenucleation clusters Thermodynamics of metastable liquid precursors Mesocrystallization Amorphous carbonates: Energetics of the CaCO,-MgCO,-FeCO,-MnCO, system Nanophase carbonates and surface energies CRYSTALLINE DIVALENT CARBONATES Thermodynamics of rhombohedral and orthorhombic carbonates Calcite-aragonite phase transition at high pressure and orientational disordering in calcite at high temperature Vaterite BINARY DIVALENT METAL CARBONATE SYSTEMS CaCO,-MgCO, FeCO,-MgCO, CaCO,-MnCO, CaCO,-SrCO, Dolomite-type structures and energetics of order-disorder phenomena CdCO,-MgCO, CaMg(CO,) 2 - CaFe(CO,) 2 solid solution (dolomite - ankerite join) CARBONATE BEARING MULTICOMPONENT PHASES Thermodyanmics of hydrotalcite-type layered double hydroxides (LDH) Dawsonite type compounds MAl(OH) 2 CO, (M = Na, K, NH4) K 2 CO,-CaCO, double carbonates Rare earth oxycarbonates Thermodynamics of calcium silicate carbonate minerals A SUMMARY OF THERMODYNAMIC DATA FOR CARBONATE MINERALS CONCLUSIONS AND OUTLOOK ACKNOWLEDGMENTS REFERENCES
4
73 74 75 77 80 ...80 85 88 88 89 91 93 93 94 95 97 97 98 99 100 100 102 104 104 105 107 107 107 114
PVTX Properties of H 2 0-C0 2 -"salt" at PTX Conditions Applicable to Carbon Sequestration in Saline Formations Robert J. Bodnar, Matthew Steele-Maclnnis, Ryan M. Capobianco, J. Donald Rimstidt, Robert Dilmore, Angela Goodman, George Guthrie
INTRODUCTION SUMMARY OF AVAILABLE PVTX DATA AND EOS IU) CO.. H 2 0-"salt" H O ( (). vi
123 125 125 125 125 126
Geochemistry
of Geologic C02 Sequestration
- Table of
Contents
I U ) CO.. -suit" Models and EOS to estimate the PVTX properties of H 2 0-C0 2 -"salt" at CCS conditions PROTOCOL TO ESTIMATE FLUID PVTX PROPERTIES AT CCS CONDITIONS PVTX PROPERTIES OF H 2 0-C0 2 -"SALT" AT CCS CONDITIONS C0 2 -rock reactions EFFECT OF TRAPPING MECHANISM ON STORAGE VOLUMES Relationship between storage mechanism and storage security Applications to estimating required formation volumes GAPS IN KNOWLEDGE AND UNDERSTANDING CONCLUDING STATI MI M ACKNOWLEDGMENTS REFERENCES
3
126 128 130 134 137 141 144 144 147 147 148 148
Experimental Perspectives of Mineral Dissolution and Precipitation due to Carbon Dioxide-Water-Rock Interactions John Kaszuba, Bruce Yardley, Muriel Andreani
INTRODUCTION CARBON DIOXIDE IN A FLUID-ROCK SYSTEM Targets for modeling Fluid- and rock-dominated reaction systems Role of co-contaminants EXPERIMENTAL TECHNIQUES Materials for experimental apparatus Specific surface area measurements Batch reactors Mixed flow-through reactors Plug-flow/flow-through reactors pH measurements under GCS conditions CARBON DIOXIDE-WATER-ROCK INTERACTIONS IN RESERVOIR ROCKS AND CAPROCKS: EXPERIMENTAL PERSPECTIVES Olivine and pyroxene Feldspars Phyllosilicates Quartz Carbonates Sulfates Sulfides Iron oxyhydroxides Reservoir and cap rocks SUMMARY AND CONCLUSIONS DIRECTIONS FOR FUTURE WORK ACKNOWLEDGMENTS REFERENCES vii
153 154 155 156 158 158 158 159 161 162 162 163 164 164 168 169 173 173 174 176 178 178 179 180 181 181
Geochemistry
O
of Geologic C02 Sequestration
- Table of
Contents
Molecular Simulation of C0 2 - and CO,-Brine-Mineral Systems Laura M. Hamm, Ian C. Bourg Adam F. Wallace, Benjamin Rotenberg
INTRODUCTION CO,-BRINE-MINERAL SYSTEMS CO,-brine speciation Amorphous M ( n i C0 3 phases Crystalline carbonate phases Geochemical kinetics at M all CO,-water interfaces c o . BRIM: MIM RAI SYSTI MS C0 2 -brine two-phase systems C0 2 -brine-mineral systems with a single fluid phase C0 2 -brine-mineral systems with two fluid phases C0 2 clathrate hydrates FUTURE RESEARCH OPPORTUNITIES ACKNOWLEDGMENTS REFERENCES
7
189 190 190 192 194 198 202 202 208 209 214 217 217 218
In situ Investigations of Carbonate Nucleation on Mineral and Organic Surfaces James J. De Yoreo, Glenn A. Waychunas, Young-Shin Jun, Alejandro Fernandez-Martinez
INTRODUCTION 229 THERMODYNAMIC DRIVERS OF NUCLEATION 230 CLASSICAL NUCLEATION THEORY 231 Homogeneous nucleation 231 Heterogeneous nucleation 233 Deviations from a flat energy landscape: Cluster aggregation and size dependent a ..235 GISAXS MEASUREMENTS OF INTERFACE PRECIPITATION AND NUCLEATION RATES 238 GISAXS: from scattered intensity to interfacial energy 242 AFM OBSERVATIONS OF NUCLEATION AND GROWTH OF NEWLY FORMED PRECIPITATES 244 Ex situ AFM observations of GISAXS samples 245 CALCIUM CARBONATE NUCLEATION ON ORGANIC FILMS 247 IMPLICATIONS OF NUCLEATION INFORMATION ON GEOLOGIC CO, SEQUESTRATION 252 Precipitate/mineral interfacial energies 252 Location and topology of high-density nucleation and subsequent growth 253 Effects of solution composition on nucleation and growth rates 253 REFERENCES 255 viii
Geochemistry
Ö
of Geologic C02 Sequestration
- Table of
Contents
Pore Scale Processes Associated with Subsurface C0 2 Injection and Sequestration Carl I. Steefel, Sergi Möllns, David Trebotich
INTRODUCTION 259 Pore scale structure and C0 2 sequestration 260 Pore scale methods 261 Organization of chapter 262 PHYSICS OF SINGLE PHASE FLOW AT THE PORE SCALE 262 PHYSICS OF MULTIPHASE FLOW AT THE PORE SCALE 264 PHYSICS OF MULTICOMPONENT SOLUTE TRANSPORT AT THE PORE SCALE ..266 Advection 266 Diffusion 266 Electrochemical migration 267 Péclet number 267 Damköhler numbers 267 268 Upscaling of flow and transport processes to continuum scale parameters GEOCHEMICAL PROCESSES AT THE PORE SCALE 270 Mineral dissolution and precipitation reaction rates 271 PORE SCALE CHARACTERIZATION AND EXPERIMENTATION 273 2D backscattered electron mapping 274 3D microtomography (XCMT and FIB-SEM) 275 Small Angle Neutron Scattering 278 Nuclear Magnetic Resonance (NMR) and Magnetic Resonance Imaging (MRI) ....278 Micromodels 280 INCORPORATING MICROSCOPIC CHARACTERIZATION INTO NUMERICAL PORE SCALE MODELS 280 MODELING APPROACHES FOR THE PORE SCALE 281 Pore network models 284 Lattice Boltzmann method 285 Particle methods: Smooth particle hydrodynamics and moving particle 286 Direct numerical simulation 287 EMERGENT PROCESSES 288 Physical evolution of the pore space 288 Chemical evolution of the pore space: reactive surface area 292 C0 2 invasion 294 NEW DIRECTIONS 296 ACKNOWLEDGMENTS 297 REFERENCES 297
ix
Geochemistry
y
of Geologic C02 Sequestration
- Table of
Contents
Carbon Mineralization: From Natural Analogues to Engineered Systems Ian M. Power, Anna L. Harrison, Gregory M. Dipple, Siobhan A. Wilson, Peter B. Kelemen, Michael Hitch, Gordon Southam
INTRODUCTION FUNDAMENTAL PROCESSES OF CARBON MINERALIZATION Mineral dissolution C0 2 supply Carbonate mineral precipitation Implications for carbon mineralization NATURAL ANALOGUES High-temperature carbonate alteration of peridotite: listvenite and soapstone Shallow subsurface peridotite weathering and related alkaline springs Hydromagnesite-magnesite play as ENHANCED WEATHERING CARB ONATION AT INDUSTRIAL SITES Passive weathering and carbonation Accelerated carbonation BIOLOGICALLY MEDIATED CARBONATION Microbially enhanced mineral dissolution Carbonate biomineralization CARBON MINERALIZATION IN INDUSTRIAL REACTORS Process routes for carbon mineralization in industrial reactors Pre-treatment of minerals IN SITU CARBON MINERALIZATION MONITORING AND STABILITY CAPACITY AND RATES OF CARBON MINERALIZATION STRATEGIES Enhanced weathering Industrial waste carbonation Carbonate biomineralization Carbon mineralization in industrial reactors In situ carbon mineralization SUMMARY ACKNOWLEDGMENTS REFERENCES
IU
305 307 308 311 312 314 314 315 315 318 320 321 322 324 325 325 326 330 331 333 335 336 337 338 338 344 344 345 346 347 347
Acid Gases in C0 2 -rich Subsurface Geologic Environments Ariel A. Chialvo, Lukas Vlcek, David R. Cole
INTRODUCTION 361 Background on flue gas sources, composition, and C0 2 - acid gases co-injection... 361 Consequences of the presence of acid gases on water-rock geochemical reactions . 363 x
Geochemistry
of Geologic C02 Sequestration
- Table of
Contents
NEED FOR ACCURATE DESCRIPTIONS OF FLUID - FLUID INTERACTIONS Molecular modeling of C0 2 -X phase equilibria at CCUS relevant conditions Force fields for C0 2 -acid gas systems THE SIGNIFICANT ROLE OF C0 2 FLUID - MINERAL INTERACTIONS Coexistence of solvation and confinement phenomena Grand canonical molecular dynamics simulation of mineral confined fluids Confined fluids behave radically different from their bulk counterparts THE CRUCIAL ROLE OF (ACID GAS) C0 2 CONTAMINANTS Contrasting interfacial behavior of C0 2 -rich environments containing IK). SO.. I IS. or NO, species SUMMARY OF MOLECULAR-BASED OBSERVATIONS AND THEIR IMPLICATIONS IN MACROSCOPIC MODELING CONCLUDING REMARKS ACKNOWLEDGMENTS REFERENCES
11
366 366 368 378 378 380 383 384 384 389 391 391 391
Geochemical Monitoring for Potential Environmental Impacts of Geologic Sequestration of C0 2 YousifK. Kharaka, David R. Cole, James J. Thordsen, Kathleen D. Gans, R. Burt Thomas
INTRODUCTION FIELD AND LABORATORY METHODS GEOLOGIC STORAGE OF C0 2 C0 2 trapping mechanisms C0 2 injection into basalts and ultramafic rocks Sequestration of C0 2 in sedimentary basins POTENTIAL IMPACTS AND RISKS OF GEOLOGIC STORAGE OF CO, Environmental impacts Health and safety impacts GEOCHEMICAL TRACERS OF CO, FLOW AND LEAKAGE Deep subsurface monitoring for early detection: The Frio I Brine test Near surface monitoring: The ZERT site, Bozeman, Montana CONCLUDING REMARKS ACKNOWLEDGMENTS REFERENCES
IZ
399 401 402 403 404 404 414 415 415 416 418 419 422 423 423
Multi-scale Imaging and Simulation of Structure, Flow and Reactive Transport for C 0 2 Storage and EOR in Carbonate Reservoirs John P. Crawshaw, Edo S. Boek
INTRODUCTION MICRO-FLUIDIC EXPERIMENTS OF FLOW IN ETCHED MICRO-MODELS xi
431 433
Geochemistry
of Geologic C02 Sequestration
- Table of
Contents
Drainage and imbibition 433 Fractured media 434 High pressure studies 434 Reactive transport 436 Future research opportunities 436 MULTI-SCALE IMAGING OF STRUCTURE AND FLOW IN CARBONATE ROCKS...437 Macroscopic X-ray CT 438 Confocal Laser Scanning Microscopy (CLSM) 439 micro-CT 440 1 115 S I M 443 Future research opportunities 443 MULTI-SCALE SIMULATION OF FLUID FLOW AND TRANSPORT IN CARBONATE ROCKS 445 Fundamental aspects 447 Pore network models 447 Molecular Dynamics 447 Dissipative Particle Dynamics 448 Stochastic Rotation Dynamics (SRD) 450 Lattice Gas and lattice-Boltzmann models 451 Future research opportunities 455 CONCLUSIONS 455 ACKNOWLEDGMENTS 455 REFERENCES 455
I «3
Caprock Fracture Dissolution and C 0 2 Leakage Jeffrey P. Fitts, Catherine A. Peters
INTRODUCTION BIG PICTURE PERSPECTIVE OF CAPROCK PERFORMANCE BASELINE ASSESSMENTS OF CAPROCK DISSOLUTION POTENTIAL CAPROCK CHARACTERISTICS FLOW PATHS THROUGH CAPROCKS RELEVANT BRINE ACIDIFICATION PROCESSES PREDICTING THE EVOLUTION OF CAPROCK FLOW PATHS GEOCHEMICALLY-DRIVEN EVOLUTION OF FLOW PATHS CONCLUDING REMARKS ACKNOWLEDGMENT DISCLAIMER REFERENCES
xii
459 460 463 466 466 467 468 470 473 476 476 476
Geochemistry
I**
of Geologic C02 Sequestration
- Table of
Contents
Capillary Pressure and Mineral Wettability Influences on Reservoir C 0 2 Capacity Tetsu K. Tokunaga, Jiamin Wan
INTRODUCTION >c( () BRIM ! INTERFACIAL TENSION CONTACT ANGLE MEASUREMENTS Background Recent measurements WETTING 1 II MS CONFINED BY CO.. Background A DLVO model for aqueous films on mineral surfaces, confined by scC0 2 Experimental measurements of film thicknesses under controlled Pc CAPILLARY PRESSURE-SATURATION RELATIONS Background Recent capillary scaling tests of brine-scC0 2 drainage and rewetting in quartz sand SUMMARY AND RESEARCH NEEDS ACKNOWLEDGMENTS REFERENCES
I3
481 482 483 483 484 487 487 488 492 493 493 495 499 499 500
Geochemistry of Wellbore Integrity in C 0 2 Sequestration: Portland Cement-Steel-Brine-C0 2 Interactions J. William Carey
INTRODUCTION Geochemistry and wellbore integrity in C0 2 sequestration Leakage in wells Other research areas relevant to geochemistry and wellbore integrity CHARACTER OF THE WELLBORE ENVIRONMENT Construction and physical features Physical and chemical conditions at the wellbore Role of coupled processes CEMENT Background on Portland cement Thermodynamic properties of cement and model cement systems Solid solution in C-S-H crystal chemistry Chemical reactions of cement-C0 2 Field and experimental observations of cement-C0 2 reactions Reactive transport calculations of cement carbonation STEEL AND STEEL-CEMENT INTERACTIONS Corrosion reactions Role of Portland cement in corrosion Modeling of corrosion reactions xiii
505 505 506 507 508 508 510 510 511 511 511 513 514 515 520 523 523 524 526
Geochemistry
of Geologic C02 Sequestration
COUPLED PROCESSES Flow processes and multiphase behavior Reactive transport in well integrity Coupled geomechanics, flow and reaction Self healing and well integrity CONCLUSIONS AND FUTURE RESEARCH Future research directions ACKNOWLEDGMENTS REFERENCES
xiv
- Table of
Contents 527 528 529 532 533 534 535 535 536
1
Reviews in Mineralogy & Geochemistry Vol. 77 pp. 1-14, 2013 Copyright © Mineralogical Society of America
Geochemistry of Geologic Carbon Sequestration: An Overview Donald J. DePaolo Earth Sciences Division Lawrence Berkeley National Laboratory Mail Stop 74R316C Berkeley, California 94720, U.S.A. djdepaolo @ Ibl. gov
David R. Cole School of Earth Sciences The Ohio State University 125 South Oval Mall 275 Mendenhall Laboratory Columbus, Ohio 43210, U.S.A. cole. 618@ osu. edu
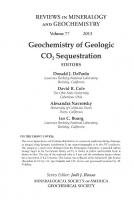
INTRODUCTION Over the past two decades there has been heightened concern about, and an improving scientific description of, the impacts of increasing carbon dioxide concentrations in Earth's atmosphere. Despite this concern, the global rate of addition of carbon dioxide to the atmosphere by the burning of fossil fuel, now approaching 10 Gton C/yr, continues to increase, and at an accelerating rate (Fig. la). Although many still hope and believe that carbon emissions can be arrested at near the current rates, and decreased over the remainder of the 21st century, there is as yet little evidence that this is going to occur. The driver for carbon emissions is a globally increasing demand for energy, and the fact that energy can be produced relatively inexpensively and with well-developed technology by burning coal, oil and natural gas. Given that the focus on fossil fuel energy is not lessening to an appreciable degree (Fig. lb), it is not only prudent, but necessary to have the technology to reduce the carbon emissions associated with fossil fuel burning. This reduction can potentially be accomplished with large-scale carbon capture and storage, where carbon dioxide would be captured from the flue gases of electric power generation facilities, purified, compressed, and injected underground as a supercritical fluid into porous geologic rock formations (Oelkers and Cole 2008). To be effective in reducing carbon accumulation in the atmosphere, this injected or "stored" C 0 2 must remain underground for thousands of years with only insignificant amounts of leakage back to the surface (Benson and Cook 2005). To date, a significant number of large C 0 2 injection demonstrations and more modest pilot tests have been linked to either Enhanced Oil (EOR) or Gas Recovery (EGR) operations such as at the Weyburn EOR site in Canada, the In Salah site in Algeria and the Cranfield EOR in Mississippi, USA (Crawshaw and Boek 2013, this volume). It is useful when thinking about this problem to recognize that the effect of burning fossil fuels is to take carbon from long-term geologic storage (as buried coal, oil and gas) and release it to the atmosphere. The idea of geologic carbon storage (GCS) is to reverse this process, 1529-6466/13/0077-0001 $05.00
http://dx.doi.org/10.2138/rmg.2013.77.!
2
DePaolo & Cole
Land-use change 1960
1970
1980
1990
2000
2010
Year
- Coal 43%
O O) Q.
Oil 34%
(/5 CO
Gas 18%
E
CD
OJ
o o
Cement 5% 1960
1970
1980
1990
2000
2010
Year Figure 1. (a) Total carbon emissions to the atmosphere f r o m fossil fuel burning and cement production, and f r o m land use change. Fifty years ago land use change was a large fraction of net emissions, but at present fossil fuel combustion is by far the largest contributor to excess carbon emissions to the atmosphere. (Figure reproduced f r o m Global Carbon Project (2012) Carbon budget and trends 2012 released on 3 December 2012. [www.globalcarbonproject.org/carbonbudget]. Data f r o m Le Quere et al. 2012.) (b) Total global carbon emissions f r o m burning fossil fuel and f r o m cement production, with breakdown by fuel type. Note that the proportion of the emissions coming f r o m coal combustion is increasing rapidly. (Figure reproduced f r o m Global Carbon Project 2012, Carbon budget and trends 2012. [www.globalcarbonproject. org/carbonbudget] released on 3 December 2012. Data f r o m Le Quere et al. 2012.)
returning the released carbon back to geologic storage. The nominal net rate at which C is transferred from geologic storage to the atmosphere by natural processes is about 0.03 Gt/yr (Morner and Etiope 2002). So the 1000 to 5000 GtC that may ultimately be released to the atmosphere over the next 300 years (cf. Archer et al. 2009) represents about 30,000 to 150,000 years of normal transfer. If and when this carbon is returned to geologic storage, it would be advantageous to have it remain stored for a similar amount of time. Consequently, the conversion of supercritical C 0 2 to more stable forms (bicarbonate ion dissolved in subsurface brine or carbonate minerals) is highly desirable.
Overview
3
The C 0 2 injected underground would be forced under pressure into the pore space of sedimentary rocks, pore space that was initially occupied by saline fluids (brine) (Fig. 2) or possibly brine/hydrocarbon mixtures in the case of EOR. The invasion process is complicated by the contrast in properties between supercritical C 0 2 and brine, and the fact that the two fluids are relatively mutually insoluble. In particular, scC0 2 has a density that is roughly 50 to 70% of that of typical brines, and a viscosity that is about 15 times lower (Benson and Cole 2008). To first order, C 0 2 behaves as a non-wetting fluid phase, which causes it to form bubbles in the pore spaces in contrast to brine, which tends to form thin films on the surfaces of mineral grains (Kim et al. 2012a). The issues that most researchers have focused on reflect the view that the injection process involves (effectively) two inert fluids, and the longer-term behavior is regarded as mostly determined by the difference in density, wetting properties, and the minor amount of mutual solubility (Doughty 2007; Lu et al. 2009; Bodnar et al. 2013, this volume; Tokunaga and Wan 2013, this volume). Injected C 0 2 tends to migrate upward within the porous, permeable rock formations into which it is injected, and hence it can only be kept underground if the porous rocks are overlain by impermeable rock layers (Fig. 2). In so far as the footprint of the C 0 2 plume injected from a single well could be about 100 km 2 in area, the requirement that the C 0 2 be "sealed" underground by impermeable layers is not trivial, but nevertheless appears to be achievable in many known geologic environments in the U.S. and elsewhere (DOE 2012). The question underlying the contributions in this volume is the degree to which geochemistry can affect the behavior of geologic sequestration systems. There are a number of ways in which chemical reactions between fluids, and between fluids and minerals, can modify expectations that might be derived from a view in which the physical properties of the fluids and medium were the primary controlling factors. Reactions between the fluids and minerals can help to immobilize the C 0 2 through mineralization, can change the properties of the rocks by dissolution and precipitation reactions, and can change the wetting properties of scC0 2 relative to brine. These interactions can have significant effects on the flow, transport and trapping of C 0 2 within rocks, and on the short- and long-term risks associated with escape
Figure 2. Schematic diagram of a carbon sequestration system shown as geologic cross section and illustrating the typical conditions and rock properties encountered. The transition of gaseous C 0 2 to supercritical C 0 2 typically occurs at depths of 1-1.5 km.
4
DePaolo & Cole
of C 0 2 from the intended storage formations. Understanding the fate of injected C 0 2 over the thousands of years required for effective storage amounts to a specialized reactive transport problem, one of a general type that has been recognized as important in many subsurface contexts (e.g., Steefel et al. 2005; Steefel et al. 2013, this volume). A major objective is to predict the transport and fate of the C 0 2 over thousands of years, which requires predictive knowledge of the geochemistry, hydrology and geology of the systems.
MINERALIZATION OF C 0 2 Supercritical C 0 2 at the pressure and temperature conditions typical of subsurface storage is soluble to a limited degree in water and saline brine (Fig. 3). This relatively small amount of dissolved C 0 2 transforms the brine into a carbonic acid solution with pH of about 3. The acidification of the brine can be represented as the reaction: C 0 2 + H 2 0 = H+(aq) + HC0 3 ~ (aq)
(1)
The acidified brine can react with (dissolve) silicate minerals in the rocks, which will act to neutralize the brine by reactions of the type: H+(aq) + CaAl 2 Si 2 O s + H 2 0 = Ca2+(aq) + Al 2 Si 2 0 5 (0H) 4
(2a)
In the presence of calcium carbonate there is also potential to remove some of the brine acidity: H + +CaC0 3 = Ca2+(aq) + HC0 3 " (aq)
(2b)
If there is sufficient carbonate present in the rocks, Equation (2b) will drive the brine pH to a value of roughly 4.6 to 5, at which point rapid neutralization will cease (e.g., Audigane et al. 2007; Bickle et al. 2013; Kaszuba et al. 2013). Equation (2a) represents a form of silicate rock "weathering," the same process by which weathering at and near the Earth's surface slowly removes C 0 2 from the atmosphere (Berner 2003; Power et al. 2013). The second part of the weathering cycle can also occur in underground reservoirs—the recombination of released divalent cations like Ca, Mg and Fe with dissolved C 0 2 to form solid carbonate minerals: Ca2+(aq) + HC0 3 ~ = CaC0 3 + H+(aq)
(3)
Summing Equations (1), (2a), and (3) results in the overall weathering reaction: C 0 2 + CaAl 2 Si 2 O s + 2H 2 0 = Al 2 Si 2 0 5 (0H) 4 + CaC0 3
(4)
In this example one mole of the silicate mineral anorthite is converted to kaolinite and calcite, and one mole of C 0 2 is removed from the atmosphere (or from the injected scC0 2 phase) and returned to long-term geologic storage as secondary calcite precipitated in the pore spaces of the host sandstone. The calcite precipitation reaction typically occurs at significant rates only when pH increases to about 8, which should occur in the subsurface once there has been sufficient silicate mineral dissolution (Eqn. 2a). A key issue is the extent to which the process represented by equation 4 is important for C 0 2 storage. The answer depends on the availability of divalent cations contained in silicate minerals and the kinetics of mineral dissolution, both of which depend on many other characteristics of the rocks and of the geometry of invasion of scC0 2 into the pore space (Audigane et al. 2007; Gaus et al. 2005; Xu et al. 2005; Kaszuba et al. 2013, this volume). The rate of mineral dissolution is determined by the extent of chemical disequilibrium between the fluids and the minerals, the accessible reactive surface area (RSA) of the minerals, the character of the mineral surfaces and whether those surfaces are affected by the presence of minor chemical constituents including organic material, the spatial distribution of the source of acidity (the scC0 2 ) and the minerals of interest, and transport of reactant and product species in the fluids (cf. Steefel et al. 2005; Molins et al. 2012; Bickle et al. 2013, this volume; Kaszuba et al. 2013, this volume).
Overview
5
Figure 3. Pressure and temperature dependence of the solubility of C 0 2 in in pure water (left) and in a brine with salt concentration of 200 g/1 (right). [Used with permission of Elsevier, from Gaus (2010).]
PROPERTIES OF CO, AND CO,-BRINE MIXTURES An important aspect of the feasibility of C 0 2 sequestration is the fact that C 0 2 gas transforms to a supercritical liquid with about 2/3 the density of water at relatively modest pressures and temperatures corresponding to depths in the Earth greater than about 1 to 1.5 km (e.g., Benson and Cole 2008; Bodnar et al. 2013, this volume). Potential underground storage reservoirs are relatively easy to reach by drilling, but the relevant geochemistry is at pressures greater than about 10 MPa and temperatures in the range of 40-100 °C. The transformation to a supercritical fluid decreases the volume of the C 0 2 by a factor of roughly 600, which is a huge advantage in pumping costs and storage space utilization underground. The solubility of C 0 2 in aqueous fluids is a function of pressure, temperature and fluid salinity. For typical subsurface brines with 10 to 25% salinity, the brine can dissolve up to about 0.5 to 1.5% C 0 2 on a molar basis, the smaller amount being associated with the higher salinity (Spycher and Pruess 2003; 2005; Bodnar et al. 2013, this volume). Water is much less soluble in scC0 2 ; typical water contents of scC0 2 under relevant conditions are only a few tenths percent (King et al. 1992). Supercritical C0 2 , as well as being somewhat less dense than brine, is also much more fluid-like; the viscosity being about 15 times lower than that of pure water (Lemmon et al. 2005). As C 0 2 is injected into brine-filled pore space, the small mutual solubility ensures that there will be two separate phases. The injection of a low-viscosity fluid into a pore network containing a higher viscosity fluid generates channeling and generally a geometrically complicated anastomosing pattern of fingers of C 0 2 within the brine on various scales (Saadatpoor et al. 2010; Reeves and Rothman 2012; Ellis and Bazylak2012). This complication is useful in that it tends to make the surface area of contact between brine and C 0 2 large (accelerating dissolution into the brine phase), and during imbibition also allows for some of the C 0 2 to be trapped in the pores as discrete, essentially immobilized, residual droplets. This same complication adds some uncertainty into predicting where injected C 0 2 will go, because the infiltration pattern is dictated largely by heterogeneity in the rocks, which can be characterized in general, stochastic terms, but is extremely difficult if not impossible to characterize in detail over large length scales. This complication also adds some substantial uncertainty to the application of reservoir flow and transport models, which assume that most properties (like C0 2 -to-brine ratio) are uniform over a volume element of the calculation domain of the numerical model, which for typical models could be 10's of cubic meters. In general it is also the case that water and brine wet (or adhere to) mineral surfaces much more strongly than scC0 2 (Espinoza et al. 2010). This property, if it were in fact strictly true,
6
DePaolo & Cole
has two implications. One is that as C 0 2 flows through pore networks it does not completely displace the preexisting brine. Instead, thin films of brine are left coating the mineral surfaces (Tokunaga 2012; Kim et al. 2012a; Hamm et al. 2013, this volume). If, as is the case near the injection well, the rock pore space is flushed many times with scC0 2 , eventually all of the brine will "evaporate" into the C0 2 phase, leaving a salt coating on the mineral grains (Giorgis et al. 2007; Pruess and Miller 2009; Kim et al. 2012c), possibly reducing permeability, a process referred to as "salting". On the other hand, there is evidence that the passage of C 0 2 through the system alters the mineral surfaces and hence their wetting properties, and in some cases mineral surfaces may become C0 2 -wet (Kim et al. 2012b). Ionic strength and temperature also affect the brine/C0 2 /mineral contact angles (Jung and Wan 2012; Fig. 4). The other consequence of the difference in wetting properties and the high C0 2 /brine interfacial tension (cf. Nielsen et al. 2012) is that high entry pressures are often required to displace brine during drainage, particularly in the case where pore apertures are small (Fig. 5). This latter effect also determines the extent to which C 0 2 droplets can be residually trapped in the pore 95° degrees, 5 M salt
100
Gas CO,
scCO,
90-
- Pressurization, 0M
80®
o
50
°
40
o
Pressurization, 1M
O Pressurization, 3M
•
70
O) « 60 -4—' 0 1
0
- Pressurization, 5M
J >
¿0 e •o
£ 30
A
20 0
5
i
I ?p *
A
A
A
41°degrees, 0 salt
A
I 10
20
15
25
Pressure [MPa]
Near 0° in air, 0 salt
Figure 4. Experimental data showing the effect of salinity and temperature on the wetting angle of C 0 2 bubbles in brine on the surface of mica. [Reprinted with permission from Jung and Wan (2012). Copyright 2012 American Chemical Society.]
Shale (H20
saturated)
Sandstone (C02
saturated)
Sandstone (H O saturated)
i h
h =
2y».CO2 COS(9)
T
Figure 5. Illustration of the controls on the column height of super critical C 0 2 that can be maintained under a shale caprock. The height "h" depends on the interfacial tension (y), the wetting angle (0), and the pore throat radii (K) as well as on the density contrast between scC0 2 and brine.
Overview
7
spaces, and is a key parameter in predicting the storage potential of underground reservoirs (Alkan et al. 2010; Doughty 2007).
MINERAL-FLUID REACTIONS The contrasts in properties, and the mixing behavior of scC0 2 and brine provide unusual conditions for water-rock interaction during C 0 2 injection and storage. In general, the rate and extent of mineral dissolution is dependent on the degree of under-saturation of the solution, and the kinetics of reaction. The latter is in turn dependent on the "reactive" surface area (RSA; Landrot et al. 2012) of the mineral grains and on the mechanism(s) of dissolution. The precipitation of secondary minerals, some of which may contain structural C 0 3 groups, also depends on solution saturation state, controls on nucleation sites and rates, and the nature of the pore space and mineral surfaces available for nucleation and growth. One special aspect of GCS mineral-fluid reaction is the fact that during the injection phase, brine is largely flushed from the pore space, which becomes filled with a high proportion of scC0 2 . However, if the brine is a strong wetting phase in comparison with scC0 2 , the mineral grains will remain coated with a thin brine film even though the pores are filled mostly with C0 2 . The brine films are expected to remain quite acidic as the dissolution of silicates (which tends to neutralize the film) will be balanced by diffusion of new C 0 2 from the bulk C 0 2 into the brine film. Dispersal of the dissolution products may also be retarded by transport within the brine film, so dissolution will be slowed due to higher saturation states maintained in the films. The amount and kinetics of mineral dissolution are major factors determining whether there will be a significant amount of mineralization of injected C0 2 . Modeling studies show a range of results. In some cases only a few percent of injected C 0 2 is converted to solid carbonate over 10,000 years (Audigane et al. ^ 2007; Bickle et al. 2013). In other cases, half S(0(V or more of the C 0 2 is converted to solid carCa + Mg + Fe / bonate in 1000 years (Zhang et al. 2013). The CO, /yS \ difference in outcome is mainly a function js of the sandstone mineralogy. Sands made / \ up predominantly of quartz and K-feldspar, / are poor in divalent cations, react slowly, / and therefore do not allow for much miner/ \ alization. At the other extreme, volcanogenic ¿s \ sands, which contain pyroxenes, amphibole, // mea / 5/Vtsst, \\ 1 and mafic-to-intermediate volcanic rock F ' 1»-v • fragments, have an abundance of divalent cations, and the minerals that contain them dissolve more rapidly than quartz and alkali feldspar (Zhang et al. 2013). Intermediate cases include relatively young sandstones with abundant high-Ca plagioclase feldspars (50% > Anorthite); an example is the lower horizon of the regionally extensive Mokelumne River Formation in the Sacramento Basin (Beyer et.al. 2013). The dependence of "reactivity" on sandstone mineralogy is illustrated in Figure 6. For this figure, it is assumed that essentially
Figure 6. Schematic illustration of the relationship between sandstone mineralogy, the capacity of the sandstone to convert C 0 2 to carbonate minerals via the weathering cycle reactions, and the rate at which the conversion occurs. Q = Quartz; F = Feldspar, L = volcanic lithic fragments. The contours are for the molar ratio of divalent cations to CO,, (Ca+Mg+Fe)/C0 2 , for sandstone with 10% by volume capillary-trapped C 0 2 . In quartz-rich rocks, there is little potential for conversion to solid carbonate, and the process is extremely slow. In rocks with more Ca-feldspar component, and especially in rocks with substantial proportions of andesitic volcanic fragments, there are abundant divalent cations and the weathering reactions are much faster.
8
DePaolo & Cole
all of the mineral dissolution takes place after injection has stopped and after there is re-entry of brine into the pore space until the residual C 0 2 saturation is reached. When the flow and imbibition processes are complete there may be 5 to 10% C 0 2 by volume in the rocks, or about 30 to 60 kg C0 2 /m 3 , which is equivalent to 700 to 1400 moles C0 2 /m 3 . If the rock matrix contains 10-20% of reactive, divalent cation- bearing minerals with typical density, then there are 1000 to 2000 moles of divalent cation available. If the dissolution rate is typical of pyroxene or plagioclase at 75°C, the release rate of cations is about 0.8 mol/m 3 /yr, which means that most of the C 0 2 could be combined with Ca, Mg and Fe within 1000 years, and perhaps all of it could be mineralized on a longer time scale (Zhang et al. 2013) The uncertainty in applying the above reasoning is whether the actual values of the dissolution rates can be estimated accurately. The typically used rate values result in a prediction of 10-50% mineralization. If the values are off by a factor of 3 to 10 in either direction, this represents the difference between complete mineralization and almost none. One of the difficulties in accurately estimating rock dissolution rates is in knowing the actual mineral surface area that is involved in the dissolution reactions at any time. There have been recent advances in coupling EM imaging and spectroscopy (e.g., FIB/SEM & EDS) with tomographic characterization of pore networks so that the phase-specific mineral surface area exposed to connected fluids can be accurately determined (Landrot et al. 2012). This analysis can be performed only on small volumes of rock of order 1 mm 3 . Dissolution rates may also be affected by coatings on minerals, including organic material, so overall there are still substantial uncertainties. In general, the precipitation rates of secondary carbonate minerals are substantially faster than the dissolution rates of the silicate minerals that must supply the cations. Growth rates of carbonate minerals at low oversaturations are approximately 10~s mol/nr/sec (Fig. 7), although at low oversaturations there are kinetic barriers to nucleation (De Yoreo et al. 2013, this volume; Hamm et al. 2013, this volume). Dissolution rates of silicate minerals are on the order of 10~10 mol/nr/sec or slower. However, it is likely that the surface area of dissolving minerals might be two orders of magnitude greater than that of the growing secondary minerals, so that ••1
i—i
ii
•mega Figure 7. Rate of calcite precipitation versus oversaturation, showing that the rate becomes quite low at very low oversaturations, a feature that is not captured well by reactive transport models that assume first order kinetics for this process. This figure shows curves representing both linear (first order) and quadratic (2 nd order) rate laws as well as a mechanistic rate law based on ion-by-ion growth models and presented in Nielsen etal. (2013).
Overview
9
the supply and consumption might be roughly equal. Most modeling studies have assumed that carbonate precipitation is very fast in comparison to silicate dissolution, faster than the time step in the numerical models (cf. Audigane et al. 2007; Xu et al. 2005). This means that the codes typically keep the fluids in equilibrium with respect to carbonate minerals. Although this is a reasonable first guess, there are enough questions concerning carbonate nucleation that this might not be a fully defensible assumption. The rate of nucleation and growth of secondary minerals might be less important than the location within the pore networks (Steefel et al. 2013, this volume). Secondary mineral growth in large pores probably does not affect the permeability of the rocks substantially, whereas growth in and near pore throats could have a large effect (Chaudhary et al. 2013). There is evidence that calcite nucleation is favored on some mineral surfaces as opposed to others (Fernandez-Martinez et al. 2013), so the relationship between pore-wall mineralogy and pore geometry is of interest. If pore throats are closed down during secondary mineral growth, it could also tend to increase the capillary trapping efficiency of the rocks. The foundational information that is necessary to understand and predict mineral-fluid interactions is of course the equilibrium thermodynamic properties of the minerals. Solubilities are relatively straightforward for common minerals, but it has been become increasingly evident that there are amorphous and partly crystalline phases in the carbonate system that can play an important role in the formation of secondary minerals (Forbes et al. 2011; De Yoreo et al. 2013, this volume). Sorting out the thermodynamics is an excellent starting point for predicting system evolution (Radha and Navrotsky 2013, this volume). In natural systems, however, no mineral is ever a pure phase, and there is much to be learned still about the effects of minor impurities on both mineral stabilities and kinetics (Nielsen et al. 2013).
MINERAL SURFACE CHEMISTRY The nature and behavior of mineral surfaces are a major factor in determining the performance of geologic sequestration systems. As noted above, coatings on mineral grains, brine films in contact with mineral surfaces, and wetting properties all contribute to the behavior of C0 2 -bearing brines interacting with storage and caprock lithologies. Chemical interactions with scC0 2 or acidified brine are likely to change the properties of mineral surfaces during and after C 0 2 injection. There is new evidence that wetting properties can change substantially after mineral surfaces are exposed to C0 2 -acidified brine (Kim et al. 2012b; Tokunaga and Wan 2013). Mineral surfaces also come into play in determining the characteristics of fluid phases within pores. New research suggests that adsorption on pore walls can densify the fluid phase to a substantial degree when the pore diameters are 10's of nanometers or smaller (Rother et al. 2012; Cole et al. 2010; Chialvo et al. 2012; Gruszkiewicz et al. 2012; Fig. 8). Indeed, there is general agreement that the collective structure and properties of bulk fluids are altered by confinement between two mineral surfaces or in narrow pores due to the interplay of the intrinsic length scales of the fluid molecular size and the length scale due to confinement (Gelb et al. 1999; Chialvo et al. 2013, this volume; Hamm et al. 2013, this volume). Other research is demonstrating that nanoporosity is a significant fraction of total porosity (Anovitz et al. 2013), and that mineral nucleation rates are modified in nanopores and on mineral surfaces with nanoscale roughness (Hedges and Whitelam 2012). Minor components of the fluid phases can also change the behavior of mineral surfaces. A small concentration of peptide-like inorganic molecules can accelerate calcite precipitation by more than an order of magnitude at low supersaturations (Chen et al. 2011; De Yoreo et al. 2013, this volume). The presence of other impurities, like Mg for example, markedly slows calcite growth rates as is well documented (cf. Nielsen et al. 2013).
10
DePaolo & Cole VTD:
32 °C 35 °C 50 °C
M -rttfT*
I -
-i
\Av \» Yi \
*
Figure 8. Excess sorption versus bulk fluid density for supercritical C 0 2 in silica nanopores. At 35 °C the fluid density is about 40% higher than that of bulk scCO, due to the presence of a dense absorbed phase on the pore walls. This excess sorption disappears at higher bulk fluid densities but is quite prominent when the density is in the range 0.4 to 0.6 c/cm 3 , which is fairly typical of sequestrations conditions. [Used with permission from Gruszkiewicz et al. (2012). American Chemical Society.]
Bulk fluid density /g-crrr With regard to geologic sequestration, an interesting question is whether mineral surfaces can be made more reactive rather than less, since the release of cations by mineral dissolution is required to mineralize injected C0 2 . The presence of small amounts of other acid gas components (like S0 2 ) could promote changes in wetting and phase behavior in pores (Chialvo et al. 2013, this volume) and variable rates of silicate mineral dissolution (Xu et al. 2007). Secondary gases are often available at capture facilities, particularly in the cases of natural gas separation facilities or post-combustion capture for power generation with high sulfur coal as the fuel stock. Additionally, the presence or absence of oxygen could affect the rates of oxidation-reduction reactions involving Fe-bearing minerals (Palandri and Kharaka 2005).
LEAKAGE PATHWAYS AND ENGINEERING OPTIONS Although C 0 2 storage is generally believed to be safe and secure under many conditions, there is still a need to accurately quantify the possibility that injected gas might return to the surface or enter shallow aquifers used for drinking water. One such scenario is the fracturing of overlying shale caprocks due to the overpressure needed to force C 0 2 into the storage formations (e.g., Zoback and Gorelick 2012; see, however, Juanes et al. 2012). Modeling studies have shown that the subsurface volume affected by increased pore pressure is much larger than the volume actually containing injected C 0 2 (Zhou and Birkholzer 2011), so it is likely that pore pressure increases could impact a large area, although it also true that this not a long-term problem because pressures return to normal within decades after injection stops. Caprocks or seals can also be heterogeneous with regard to permeability, and contain natural faults and fractures (Fitts and Peters 2013, this volume). Understanding whether these imperfections in the sealing formations are serious concerns involves both hydrology and geochemistry. One leakage pathway that has received considerable attention is wellbores, both the wells used for injection and existing and potentially unknown abandoned wells (Gasda et al. 2004; Celia et al. 2006; Nordbotten et al. 2009; Carey 2013). Most of the sedimentary basins of the U.S., for example, have hundreds to thousands of wells that were drilled over the last century or more, and not all of them are represented in databases (Zhang et al. 2011). The Casilica cement components are soluble in acidified bring so there is some concern that the C 0 2 flooded region near the injection wells could lead to enhanced permeability, especially in the annulus around the casing, and particularly at the interface between cement and surrounding rocks (Carroll et al. 2011; Newell and Carey 2012; Jun et al. 2013).
Overview
11
Subsurface pore space in the depth range where C 0 2 injection will be targeted contains microbial populations, although in general the nature of those populations is poorly known. Recent work has shown that the presence of microbial biomass, either living or dead, can accelerate the growth of carbonate minerals in oversaturated fluids (Cappuccio et al. 2011). This observation, and the more general observation that some organic molecules accelerate calcite growth (Chen et al. 2011; Hamm et al. 2013, this volume), leads to the idea that microbial populations could be manipulated to mitigate leakage along wellbores and in other circumstances (Armstrong and Ajo-Franklin 2011).
MONITORING AND VERIFICATION OF C0 2 STORAGE A critical issue in C 0 2 storage is in verifying the amount of C 0 2 injected and stored, and in monitoring the migration and fate of the C0 2 . The emphasis for these issues has been on geophysics (e.g., Daley et al. 2007), but there is also an important role for geochemistry as tracers of fluid-fluid interactions and fluid-rock processes (cf. Clark and Fritz 1997; Kharaka et al. 2013). Kharaka and Cole (2011) provide an excellent review of recent applications of geochemistry to C 0 2 injection experiments and specific examples are described by Kharaka et al. (2009). An example is the use of a gas concentration ratio (He/C0 2 ) that is sensitive to the mutual dissolution of C 0 2 and brine (Bickle et al. 2013, this volume). Dissolution of injected C 0 2 into brine also results in fractionation of C and O isotopes (Dubacq et al. 2012), and when this occurs during injection there is a possibility of kinetic isotope effects and also effects due to differing relative permeability between fluid phases. Dissolution and precipitation of minerals can also result in isotopic shifts in elements like Ca and Mg, and the isotopic composition of dissolved Sr and trace metal components may help track brine migration. Trace metals in overlying aquifer waters are also expected to be useful as sensitive tracers of upward migration of C 0 2 from storage formations, due to the acidification that the C 0 2 causes (Apps et al. 2010).
SUMMARY Geochemistry plays a significant role in many aspects of geologic carbon sequestration, from dissolution and precipitation of minerals in the reservoir and seal rocks, to modification of the properties of mineral surfaces and their effects on fluid flow and capillary trapping. The properties of supercritical C0 2 , brines, and their mixtures are also critical to designing, predicting the behavior, and monitoring sequestration systems and sites. In this volume, there are illustrations of many of the important geochemical challenges relating to carbon sequestration. The contributions also showcase modern techniques and approaches that are being employed to advance knowledge of these fluid-rock systems that may be critical to mitigation of carbon emissions.
ACKNOWLEDGMENTS This material is based upon work supported as part of the Center for Nanoscale Control of Geologic C0 2 , an Energy Frontier Research Center funded by the U.S. Department of Energy, Office of Science, Office of Basic Energy Sciences under Award Number DE-AC0205CH11231.
REFERENCES Alkan H, Cinar, Y, Ulker EB (2010) Impact of capillary pressure, salinity and in situ conditions on C 0 2 injection into saline aquifers. Transp Porous Med 84:799-819
12
DePaolo & Cole
Anovitz LM, Cole DR, Rother G, Allard LF, Jackson AJ, Littrell KC (2013) Diagenetic changes in macro- to nano-scale porosity in the St. Peter Sandstone: An (ultra) small angle neutron scattering and backscattered electron imaging analysis. Geochim Cosmochim Acta 102: 280-305 Apps JA, Zheng L, Zhang Y, Xu T, Birkholzer JT (2010) Evaluation of potential changes in groundwater quality in response to C 0 2 leakage from deep geologic storage. Transp Porous Med 82: 215-246 Archer D, Eby M, Brovkin V, Ridgwell A, Cao L, Mikolajewicz U, Caldeira K, Matsumoto K, Munhoven G, Montenegro A, Tokos K. (2009) Atmospheric lifetime of fossil fuel carbon dioxide. Ann Rev Earth Planet Sci 37:117-134 Armstrong R, Ajo-Franklin J (2011) Investigating biomineralization using synchrotron based Xray computed microtomography. Geophys Res Lett 38: L08406,doi:10.1029/2011GL046916 Audigane P, Gaus I, Czernichowski-Lauriol I, Pruess K, Xu TF (2007) Two-dimensional reactive transport modeling of C 0 2 injection in a saline Aquifer at the Sleipner site, North Sea. Am J Sci 307:974-1008 Benson SM, Cole DR (2008) C 0 2 sequestration in deep sedimentary formations. Elements 4(5):305-310 Benson SM, Cook P (2005) Underground Geological Storage. In: Carbon Dioxide Capture and Storage: Special Report of the Intergovernmental Panel on Climate Change (IPCC). Cambridge University Press, Interlachen, Switzerland, p 5-1 to 5-134 Berner RA (2003) The long-term carbon cycle, fossil fuels and atmospheric composition. Nature 426:323-326 Beyer JH, Ajo-Franklin JB, Burton E, Conrad M, Doughty C, Kneafsey T, Nakagawa S, Spycher N, Voltolini M (2013) "Geologic Characterization Based on Deep Core and Fluid Samples from the Sacramento Basin of California - an Update". CCUS 2013, Pittsburgh, PA., May Bickle M, Kampman N, Wigley M (2013) Natural analogues. Rev Mineral Geochem 77:15-71 Bodnar RJ, Steele-Maclnnis M, Capobianco RM, Rimstidt JD, Dilmore R, Goodman A, Guthrie G (2013) PVTX Properties of H 2 0-C0 2 -"salt" at PTX conditions applicable to carbon sequestration in saline formations. Rev Mineral Geochem 77:123-152 Cappuccio JA, Pillar VD, Xiao C, Ajo-Franklin CM (2011) Bacterial acceleration of CaC0 3 mineralization. Biophys J 100(3):487a Carey JW (2013) Geochemistry of wellbore integrity in C 0 2 sequestration: Portland cement-steel-brine-C0 2 interactions. Rev Mineral Geochem 77:505-539 Carroll SA, McNab WW, Torres SC (2011) Experimental study of cement - sandstone/shale -brine - C 0 2 interactions. Geochem Trans 12:9 Celia MA, Kavetski D, Nordbotten JM, Bachu S, Gasda SE (2006) Implications of abandoned wells for site selection. In: C0 2 SC 2006 International Symposium on Site Characterization for C 0 2 Geological Storage, March 20-22, 2006. Proceedings: Berkeley, CA, Lawrence Berkeley National Laboratory, p 157-159 Chaudhary K, Cardenas MB, Den W, Bennett PC (2013) Pore geometry effects on intra-pore viscous to inertial flows and effective hydraulic parameters. Water Resources Res 49:1149-1162, doi:10.1002/wrcr.20099 Chen C-L, Qi J, Zuckermann RN, De Yoreo JJ (2011) Engineered biomimetic polymers as tunable agents for controlling CaC0 3 mineralization. J Am Chem Soc 133:5214-5217 Chialvo AA, Vlcek L, Cole DR (2012) Aqueous C0 2 Solutions at silica surfaces and within nanopore environments: Insights from isobaric-isothermal molecular dynamics. J Phys Chem C 116:13904-13916 Chialvo AA, Vlcek L, Cole DR (2013) Acid gases in C0 2 -rich subsurface geologic environments. Rev Mineral Geochem 77:361-398 Clark ID, Fritz P (1997) Environmental Isotopes in Hydrogeology. CRC Press, New York. Cole DR, Chialvo AA, Rother G, Vlcek L, Cummings PT (2010) Supercritical fluid behavior at nanoscale interfaces: Implications for C0 2 sequestration in geologic formations. Philos Mag Special Issue on Layer Silicate Materials and Clays 90(17-18):339-2363 Crawshaw JP, Boek ES (2013) Multi-scale imaging and simulation of structure, flow and reactive transport for C0 2 storage and EOR in carbonate reservoirs. Rev Mineral Geochem 77:431-458 Daley TM, Solbau RD, Ajo-Franklin JB, Benson SB (2007) Continuous active-source seismic monitoring of C0 2 injection in a brine aquifer. Geophysics 72(5):A57-A61 De Yoreo JJ, Waychunas GA, Jun Y-S, Fernandez-Martinez A (2013) In situ investigations of carbonate nucleation on mineral and organic surfaces. Rev Mineral Geochem 77:229-257 DOE (2012) Department of Energy, Office of Fossil Energy, Carbon Utilization and Storage Atlas, The United States 2012, 4th edition Doughty C (2007) Modeling geologic storage of carbon dioxide: comparison of non-hysteretic and hysteretic characteristic curves. Energy Convers Manage 48:1768-1781 Dubacq B, Bickle MJ, Wigley M, Kampman N, Ballentine CJ, Lollar BS (2012) Noble gas and carbon isotopic evidence for C0 2 -driven silicate dissolution in a recent natural C 0 2 field. Earth Planet Sci Lett 341344:10-19 Ellis JS, Bazylak A (2012) Dynamic pore network model of surface heterogeneity in brine-filled porous media for carbon sequestration. Phys Chem Chem Phys 14:8382-8390
Overview
13
Espinoza DN, Santamarina JC (2010) Water-C0 2 -mineral systems: Interfacial tension, contact angle, and diffusion-implications to C0 2 geological storage. Water Resour Res 46:W07537; doi: 10.1029/2009WR008634 Fernandez-Martinez A, Hu Y, Lee B, Jun Y-S, Waychunas GA (2013) In situ determination of interfacial energies between heterogeneously nucleated CaC0 3 and quartz substrates: thermodynamics of C0 2 mineral trapping. Environ Sei Technol 47(1):102-109 Fitts JP, Peters CA (2013) Caprock fracture dissolution and C 0 2 leakage. Rev Mineral Geochem 77: Forbes TZ, Radha AV, Navrotsky A (2011) The energetics of nanophase calcite. Geochim Cosmochim Acta 75:7893-7905 Gasda S, Bachu S, Celia M (2004) Spatial characterization of the location of potentially leaky wells penetrating a deep saline aquifer in a mature sedimentary basin. Environ Geol 46:707-720 Gaus I (2010) Role and impact of C0 2 -rock interactions during C0 2 storage in sedimentary rocks. Int J Greenhouse Gas Control 4:73-89 Gaus I, Azaroual M, Czernichowski-Lauriol I (2005) Reactive transport modeling of the impact of C 0 2 injection on the clayey cap rock at Sleipner (North Sea). Chem Geol 217:319-337 Gelb LD, Gubbins KE, Radhakrishnan R, Sliwinska-Bartkowiak M (1999) Phase separation in confined systems. Rep Prog Phys 62:1573-1659 Giorgis T, Carpita M, Battistelli A (2007) Modeling of salt precipitation during the injection of dry C0 2 in a depleted gas reservoir. Energy Convers Manage 48(6):1816-1826 Gruszkiewicz MS, Rother G, Wesolowski DJ, Cole DR, Wallacher D (2012) Direct measurements of pore fluid density by vibrating tube densimetry. Langmuir 28:5070-5078 Hamm LM, Bourg IC, Wallace AF, Rotenberg B (2013) Molecular simulation of C0 2 - and C0 3 -brine-mineral systems. Rev Mineral Geochem 77:189-228 Hedges LO, Whitelam S (2012) Patterning a surface so as to speed nucleation from solution. Soft Matter 8:8624-8635 Juanes R, Hager BH, Herzog HJ (2012) No geologic evidence that seismicity causes fault leakage that would render large-scale carbon capture and storage unsuccessful. Proc Natl Acad Sei USA 109:E3623 Jun Y-S, Giammar DE, Werth CJ (2013) Impacts of geochemical reactions on geologic carbon sequestration. Envion Sei Technol 47:3-8 Jung JW, Wan J (2012) Supercritical C 0 2 and ionic strength effects on wettability of silica surfaces: equilibrium contact angle measurements. Energy Fuels 26(9):6053-6059; doi: 10.1021/ef300913t Kaszuba J, Yardley B, Andreani M (2013) Experimental perspectives of mineral dissolution and precipitation due to carbon dioxide-water-rock interactions. Rev Mineral Geochem 77:153-188 Kharaka YK, Cole DR (2011) Geochemistry of geologic sequestration of carbon dioxide. In: Frontiers in Geochemistry: Contributions of Geochemistry to the Study of the Earth. Harmon RS, Parker A (eds) Blackwell, p 135-174 Kharaka YK, Cole DR, Thordsen JJ, Gans KD, Thomas RB (2013) geochemical monitoring for potential environmental impacts of geologic sequestration of C0 2 . Rev Mineral Geochem 77:399-430 Kharaka YK, Thordsen JJ, Hovorka SD, Nance HS, Cole DR, Phelps TJ, Knauss KG (2009) Potential environmental issues of C 0 2 storage in deep saline aquifers. Geochemical results from the Frio-I Brine Pilot test, Texas, USA. Appl Geochem 24:1106-1112 Kim T-W, Tokunaga TK, Shuman DB, Sutton SR, Newville M, Lanzirotti A (2012a) Thickness measurements of nanoscale brine films on silica surfaces under geologic C0 2 sequestration conditions using synchrotron X-ray fluorescence. Water Resour Res 48:W09558, doi:10.1029/2012WR012200 KimY, Wan J, Kneafsey TJ, TokungaTK (2012b) Dewetting of silica surfaces upon reactions with supercritical C 0 2 and brine: pore-scale studies in micromodels. Environ Sei Technol 46(7):4228-4235 KimY, Han WS, Oh J, KimT, Kim J-C (2012c) Characteristics of salt-precipitation and the associated pressure build-up during C 0 2 storage in saline aquifers. Transp Porous Med 92:397-418 King MB, Murbarak A, Kim JD, Bott TR (1992) The mutual solubilities of water with supercritical and liquid carbon dioxide. J Supercrit Fluids 5:296-302 Landrot G, Ajo-Franklin J, Cabrini S, Yang L, Steefel CI (2012) Measurement of accessible reactive surface area in a sandstone, with application to C0 2 mineralization. Chem Geol 318-319:113-125 Lemmon EW, McLinden MO, Friend DG (2005) Thermophysical properties of fluid systems. In: Chemistry Web Book. NIST Standard Reference Database Number 69. Linstrom PJ, Mallard WG (eds) National Institute of Standards and Technology. Le Quere C, Andres RJ, Boden T, Conway T, Houghton RA, House JI, Marland G, Peters GP, van der Werf G, Ahlström A, Andrew RM, Bopp L, Canadell JG, Ciais P, Doney SC, Enright C, Friedlingstein P, Huntingford C, Jain AK, Jourdain C, Kato E, Keeling RF, Klein Goldewijk K, Levis S, Levy P, Lomas M, Poulter B, Raupach MR, Schwinger J, Sitch S, Stocker BD, Viovy N, Zaehle S, Zeng N (2012) The global carbon budget 1959-2011. Earth Syst Sei Data Discuss 5:1107-1157
14
DePaolo & Cole
Lu C, Han WS, Lee S-Y, McPherson BJ, Lichtner PC (2009) Effects of density and mutual solubility of a C0 2 -brine system on C0 2 storage in geological formations: "Warm" vs. "cold" formations. Adv Water Res 32(12):1685-1702 Molins S, Trebotich D, Steefel CI, Shen C (2012) An investigation of the effect of pore scale flow on average geochemical reaction rates using direct numerical simulation. Water Resour Res 48:W03527; doi: 10.1029/2011WRO11404 Morner N-A, Etiope G (2002) Carbon degassing from the lithosphere. Global Planet Change 33:185-203 Newell DL, Carey JW (2013) Experimental evaluation of wellbore integrity along the cement-rock boundary. Environ Sci Technol 47:276-282 Nielsen LC, Bourg IC, Sposito G (2012) Predicting C0 2 -water interfacial tension under pressure and temperature conditions of geologic C0 2 storage. Geochim Cosmochim Acta 81:28-38 Nielsen LC, De Yoreo JJ, DePaolo DJ (2013) General model for calcite growth kinetics in the presence of impurity ions. Geochim Cosmochim Acta 115:100-114 Nordbotten JM, Kavetski D, Celia MA, Bachu S (2009) Model for C 0 2 Leakage including multiple geological layers and multiple leaky wells. Environ Sci Technology 43:743-749 Oelkers EH, Cole DR (2008) Carbon dioxide sequestration: A solution to global problem. Elements 4:305-310 Palandri JL, Kharaka YK (2005) Ferric iron-bearing sediments as a mineral trap for C0 2 sequestration: iron reduction using sulfur-bearing waste gas. Chem Geol 217:351-364 Power IM, Harrison AL, Dipple GM, Wilson SA, Kelemen PB, Hitch M, Southam G (2013) Carbon mineralization: from natural analogues to engineered systems. Rev Mineral Geochem 77:305-360 Pruess K, Miiller N (2009) Formation dry-out from C 0 2 injection into saline aquifers: 1. Effects of solids precipitation and their mitigation. Water Resour Res 45:W03402; doi:10.1029/2008WR007101 Radha AV, Navrotsky A (2013) Thermodynamics of carbonates. Rev Mineral Geochem 77:73-121 Reeves, D, Rothman DH (2012) Impact of structured heterogeneities on reactive two-phase porous flow. Phys RevE 86: 031120, doi 10.1103/PhysRevE.86.031120 Rother G, Krukowski EG, Wallacher D, Grimm N, Bodnar RJ, Cole DR (2012) Pore size effects on the sorption of supercritical carbon dioxide in mesoporous CPG-10 silica. J Phys Chem C 116:917-922 Saadatpoor E, Bryant SL, Sepehrnoori K (2010) New trapping mechanism in carbon sequestration. Transport Porous Media 82(1):3-17 Spycher N, Pruess K, Ennis-King J (2003) C0 2 -H 2 0 mixtures in geological sequestration of C0 2 ,1: Assessment and calculation of mutual solubilities from 12 to 100°C and up to 600 bar. Geochim Cosmochim Acta 67:3015-3031 Spycher N, Pruess K (2005) C0 2 -H 2 0 mixtures in the geological sequestration of C0 2 . II. Partitioning in chloride brines at 12-100°C and up to 600 bar: Geochim Cosmochim Acta 69: 3309-3320 Steefel CI, Molins S, Trebotich D (2013) Pore scale processes associated with subsurface C 0 2 injection and sequestration. Rev Mineral Geochem 77:259-303 Steefel CI, Lichtner PC, DePaolo DJ (2005) Reactive transport modeling: An essential tool and a new research approach for the Earth sciences. Earth Planet Sci Lett 240:539-558 Tokunaga TK (2012) DLVO-based estimates of adsorbed water film thicknesses in geologic C 0 2 reservoir. Langmuir 28:8001-8009 Tokunaga TK, Wan J (2013) Capillary pressure and mineral wettability influences on reservoir C0 2 capacity. Rev Mineral Geochem 77:481-503 Zhang M, Bachu S (2011) Review of integrity of existing wells in relation to C 0 2 geological storage: What do we know? Int J Greenhouse Gas Control 5:826-840 Zhang S, DePaolo DJ, Xu T, Zheng L (2013) Mineralization of carbon dioxide sequestered in volcanogenic reservoir rocks. Int J Greenhouse Gas Control, in press Zhou Q, Birlholzer JT (2011) On scale and magnitude of pressure build-up induced by large-scale geologic storage of C0 2 . Greenhouse Gases-Sci Tech 1:11-20 Zoback MD, Gorelick SM (2012) Earthquake triggering and large-scale geologic storage of carbon dioxide. Proc Natl Acad Sci 109(26):10164-10168 Xu T, Apps JA, Pruess K (2005) Mineral sequestration of carbon dioxide in a sandstone-shale system. Chem Geol 217: 295-318 Xu T, Apps JA, Pruess K, Yamamoto H (2007) Numerical modeling of injection and mineral trapping of C 0 2 with H2S and S0 2 in a sandstone formation. Chem Geol 242:319-346
2
Reviews in Mineralogy & Geochemistry Vol. 77 pp. 15-71, 2013 Copyright © Mineralogical Society of America
Natural Analogues Mike Bickle, Niko Kampman, Max Wigley Department of Earth Sciences University of Cambridge Cambridge, CB2 3EQ, United Kingdom [email protected]
[email protected]
[email protected]
INTRODUCTION Geological carbon storage will require that less than ~0.01% of the mass of C 0 2 stored escapes per year if significant climatic impacts are to be avoided (Hepple and Benson 2005). This requires that the geological storage sites retain much of the C 0 2 for more than 10,000 years. Predicting the security of C 0 2 in storage sites for such time periods raises questions which relate to a number of poorly understood fundamental processes concerning fluid-rock interactions in the near subsurface of the Earth. Because many of these processes are sluggish it is not possible to predict their significance from observations on active injection experiments with durations of, at most, a few tens of years. Nor do these experiments yet sample the full spectrum of potential behavior of C 0 2 in storage sites. For these reasons it is useful to study sites where natural C 0 2 has been retained in geological strata for periods which range from tens of thousands to millions of years. Geological storage of C 0 2 will be mainly in depleted oil and gas reservoirs or saline aquifers at depths greater than about 800 m (DePaolo and Cole 2013, this volume). Under these conditions the C 0 2 will be in the denser supercritical state, but less dense than formation brines. As such it will tend to rise buoyantly and be retained by an impermeable caprock. A key concern is that the C0 2 , or C0 2 -charged brines will react with and corrode caprocks or faults and allow the C 0 2 to migrate upwards. C0 2 -rich waters are known to react with minerals but predicting the rates of fluid-mineral reactions at low temperatures is problematic (White and Brantley 2003) and the consequent changes in permeability of the caprocks or fault zones are uncertain (e.g., Gaus et al. 2005). However there are a series of other processes likely to act in C 0 2 storage reservoirs and the long-term fate of the C 0 2 will be governed by these and their complex interactions. Key processes which might increase the security of C 0 2 storage include 1) residual trapping of a fraction of the C 0 2 by surface tension as moving C 0 2 is replaced by brine, 2) solubility trapping by dissolution of C 0 2 in brine, which increases the density of the brine, stabilizing storage of the dissolved C 0 2 and 3) reactions between silicate minerals and C0 2 -charged brines which cause precipitation of carbonate minerals further stabilizing C 0 2 storage. The progress of these processes is represented schematically in Figure 1 (IPCC 2005) but, apart from structural and stratigraphic trapping, the rates and ultimate significance of these processes are poorly constrained. The uncertainty in the rates of these trapping mechanisms is due, in part, to the complexity of the processes within the storage reservoirs. Residual trapping and solubility trapping will both depend on the flow of the C 0 2 in the reservoir. Residual trapping takes place as brine replaces C 0 2 and therefore will only occur when the C 0 2 plume is mobile. Solubility trapping takes place by diffusion of C 0 2 into brines and this sluggish process will therefore be enhanced if the contact area between the C 0 2 and brine is increased by fingering of less-viscous C 0 2 and by flow in a heterogeneous reservoir, or by convective removal of the denser, C0 2 -saturated brine 1529-6466/13/0077-0002$ 10.00
http://dx.doi.Org/10.2138/rmg.2013.77.2
16
Bickle, Kampman,
Wigley
100 Structural &
% trapped
Figure 1. Schematic illustration of the magnitude of trapping mechanisms with time after (IPCC 2005). Note that the rates and ultimate significance of each of these processes, which are additional to structural and stratigraphie trapping, are very poorly constrained.
1 1
10 100 1,000 10,000 Time since injection stops (years)
below a C0 2 cap (e.g., Neufeld et al. 2010). Mineral trapping by precipitation of carbonates will be dependent on the rates at which the C0 2 dissolves in brines and the subsequent flow of the C0 2 -charged brines (reactions between supercritical C0 2 and minerals are much less studied). The fluid-mineral reactions may also alter the permeability structure of the reservoir. Dissolution of carbonates and Fe-oxyhydroxides by C0 2 -charged brines is rapid with fluid saturation observed to take place in days during injection experiments (e.g., Frio, Salt Creek) and even small changes in porosity may cause large changes in permeability in reservoir rocks. Conversely the more sluggish precipitation of carbonate may reduce permeabilities which might be critical in retarding C0 2 diffusion into caprocks. Natural C0 2 accumulations allow the operation of these processes to be observed over time periods comparable to those over which the C 0 2 needs to be stored. However, recovering useful information from such natural analogues for storage is challenging. Frequently access to samples of rocks or fluids is very limited and even when the C0 2 is exploited—as in the large accumulations in the Colorado Plateau—caprocks and fault zones are generally not cored. Since the rates of most of the geochemical interactions will depend on the flow paths of C 0 2 during filling and on the subsequent relative flows of C 0 2 and brine in the reservoirs, it is critical to be able to model the hydrology to be able to infer the rates of the processes. Interpretation of many of the geological analogues therefore depends on our ability to infer the nature and rates of past fluid-mineral interactions from the petrology and geochemistry of core samples with limited sampling of the fluid phases. This is a severe test of geologists' ability to infer past processes and particularly the impacts of past fluid-flows from the present record. The continual controversies over the genesis of igneous rocks, fluid flow in metamorphic rocks and chemical weathering reactions in the critical zone attests to the difficulty. However natural C0 2 accumulations are good examples on which to develop a reliable geological toolkit. It is possible to sample recent or even active systems and the economic interest in C 0 2 as a resource and in C0 2 storage allows recovery of fluids and drill core from selected natural analogues. A final caveat is that each potential geological reservoir may exhibit very different geochemical interactions reflecting the differing structure, size, flow paths and particularly lithologies of reservoir and caprock materials. The natural analogues studied also exhibit substantial diversity although it may not be possible to find an analogue for each potential reservoir. In this chapter we briefly review available natural analogues for C 0 2 storage and identify those likely to reward further study. We then review studies of noble gas concentrations and isotopic compositions in natural C 0 2 accumulations as these provide compelling evidence for the significance of dissolution of a substantial fraction of C 0 2 in formation brines. Finally a
Natural
Analogues
17
detailed case study of the leaking C 0 2 system at Green River Utah is presented as we have worked extensively on this system and it illustrates the richness and variety of the information that can be recovered as well as the complexities and ambiguities in the interpretations.
REVIEW OF NATURAL C 0 2 ACCUMULATIONS Natural accumulations of C 0 2 provide important constraints on subsurface fluid flow and the geochemical processes that sequester the gaseous and supercritical C 0 2 into fluids and minerals. The important questions that may be answered with observations from natural analogues include the nature, magnitude and rates of geochemical reactions that stabilize the C 0 2 in geological reservoirs including: C 0 2 dissolution into formation brines; acidity and solute buffering silicate dissolution reactions; and carbonate precipitation. The fluid-fluid and fluid-mineral reactions, and their long-term consequences for reservoirs, caprocks and fault zones can be assessed from petrological observations and from geochemical measurements on reservoir fluids and gases. Noble gas isotope measurements from reservoir fluids and gases are an important source of information on the fluid-fluid reactions (e.g., Dubacq et al. 2012) and the magnitude of C0 2 -dissolution in reservoir brines (e.g., Gilfillan et al. 2009). Spatial and temporal variation in fluid geochemistry preserves information on the rates of the fluid-fluid and fluid-mineral reactions (e.g., Kampman et al. 2009). The rates of the reactions can be constrained where information is available on mineralogy and mineral surface areas, and on groundwater hydrology, or from isotopic constraints on fluid flow rates (e.g., U-series, 234U/238U; Andrews and Kay 1982). Geochemical, mineralogical and petrophysical profiles through caprocks exposed to C 0 2 and C0 2 -charged brines can be used to reconstruct the impacts of the C0 2 , and when combined with advective-diffusive modeling or isotopic dating, used to constrain the rates of the alteration. Information about the mobilization and immobilization of potentially harmful trace elements (e.g., As, Pb, Cd) may also be gained from studying C0 2 -charged fluid geochemistry (e.g., Keating et al. 2010) and from geochemical profiles across fluid-mineral reaction fronts in exhumed C0 2 -reservoirs (e.g., Wigely et al. 2013b). Globally, there are numerous natural accumulations of C 0 2 in geological reservoirs, in a variety of geological environments (see reviews in Allis et al. 2001; Haszeldine et al. 2005; Pearce 2004, 2006). However, in most of these, the reservoirs are inadequately sampled, fluid and gas samples maybe unavailable and details of the age and hydrology of the reservoirs are limited. Petrological studies of reservoir rocks from exhumed or cored natural C 0 2 reservoirs provide an important basis for examining the long-term mineralogical, geochemical and petrophysical consequences of exposure to C0 2 -charged fluids and gases. Many of the early studies of natural C 0 2 accumulations focused on hydrocarbon gas reservoirs rich in C0 2 , for which core (and fluid samples) were available (e.g., Watson et al. 2004; Wilkinson et al. 2009b). Increasingly, studies have focused on the Colorado Plateau C 0 2 province where numerous large accumulations of pure C 0 2 (Allis et al. 2001) and exhumed C0 2 -reservoirs (Wigley et al. 2012) provide a natural laboratory from which fluid-fluid and fluid-rock interactions in reservoirs, faults and caprocks can be evaluated.
Petrological studies of subsurface C02-reservoirs Reservoir mineralogy and CO¡-fluid-mineral reactions. Petrological studies of natural C 0 2 reservoirs reveal a range of degrees of fluid-mineral reaction ranging from minor amounts of silicate (e.g., feldspar), phyllosilicate (e.g., chlorite) and carbonate mineral dissolution to complete dissolution of all reactive silicate mineral phases and the deposition of relatively insoluble Ca-Mg-Fe carbonate minerals, including ankerite, siderite and dolomite (Franks and Forester 1984; Watson et al. 2004; Wilkinson et al. 2009b; Heinemann et al. 2013), and dawsonite (Baker et al. 1995; Moore et al. 2005; Wilkinson et al. 2009b). The petrological
18
Bickle, Kampman, Wigley
consequences of exposure to C0 2 -rich fluids vary between sites as a result of differences in: primary reservoir mineralogy and mineral surface properties; reservoir hydrology; initial formation fluid solute, pH and redox chemistries; C 0 2 emplacement mechanism and rates; thermodynamic differences in C 0 2 and mineral solubility across the wide range of pressure temperature conditions experienced by natural C 0 2 reservoirs; and the slow reaction rates of natural fluids due to transport controlled weathering and the weathering of minerals close to thermodynamic equilibrium. Most studies have observed trapping of C 0 2 in carbonate minerals (Watson et al. 2004; Moore et al. 2005); however, the volumes deposited vary between sites and spatially within individual reservoirs due to: heterogeneities in primary reservoir mineralogies; heterogeneous fluid flow and reaction; the coupling of carbonate precipitation to the slow dissolution of silicate minerals close to thermodynamic equilibrium; and transport controls on C 0 2 and solute fluxes and mineral reaction rates. The mineralogy of carbonate cements formed in natural C 0 2 reservoirs varies from the relatively soluble pure calcite end-member to more insoluble Fe-Mg-Ca carbonate minerals, including ankerite, siderite and dolomite. The phase stability is governed by the thermodynamic considerations of pressure, temperature and solute chemistry and by the activities of constituent species in the fluid phase (see Radha and Navrotsky 2013, this volume). Calcite cements typically precipitate in reservoir sandstones poor in detrital Fe- and Mn-bearing minerals, or from fluids with high oxygen fugacities. In Fe-rich sediments, such as in red-bed aeolian sandstones, in contact with reducing formation fluids, the high activities of Fe 2+ and Mn 2+ in solution can lead to the formation of siderite [FeC0 3 ] and in the presence of Mg 2+ rich fluids, ankerite [Ca(Fe,Mg,Mn)(C0 3 ) 2 ] and/or dolomite [CaMg(C0 3 ) 2 ]. Predicting the stable carbonate phase in C 0 2 reservoirs is undermined by the limited experimental data on the kinetic growth, and thermodynamic stability, of the more complex Ca-Mg-Fe carbonate minerals, and such data is critically needed to enable accurate model predictions. The acid hydrolysis of silicate minerals in natural fluids is largely incongruent being balanced by the precipitation of clay minerals. The low solubilities of Al 3+ and Si0 2 at the temperatures and pressure conditions relevant to C 0 2 storage preclude significant mass transport of these constituents from the site of the dissolving silicate grain. The chemistry and mineralogy of the clay mineral precipitates is highly sensitive to temperature, fluid pH and solute activities. Experimental and model predictions include the growth of illite, illite-smecite and kaolinite minerals (e.g., Credoz et al. 2009; Kohler et al. 2009) and observations from natural accumulations support this (e.g., Moore et al. 2005; Wigley et al. 2012). The formation of dawsonite [NaAlC0 3 (0H) 2 ] is predicted from modeling studies (Hellevang et al. 2005; Xu et al. 2005) but its occurrence in natural C 0 2 accumulations is rare (e.g., Moore et al. 2005). The scarcity of natural dawsonite is likely the result of its limited phase stability (Benezeth et al. 2007) in carbon-rich alkaline fluids, and its subordinate stability to other aluminosilicate minerals (e.g., analcime; Kaszuba et al. 2005). The contrasting sets of observations gathered from natural C0 2 reservoirs are best illustrated by studies from two C0 2 -rich hydrocarbon gas accumulations; the Fizzy accumulation in the southern North Sea and the Ladbroke Grove accumulation in Southern Australia; and from observations from a pure C 0 2 accumulation at Springerville-St. Johns Dome, Arizona and a collection of exhumed C0 2 -reservoirs in central-eastern Utah. Markedly different degrees of fluid-rock reaction and C 0 2 mineralization are observed between these sites, reflecting differences in reaction duration, primary reservoir mineralogy and reservoir hydrology. FizTy accumulation, North Sea. Wilkinson et al. (2009a) investigated C0 2 -fluid-mineral reactions in aeolian sandstones of the Permian Rotliegend Group from the 2.3 km deep C0 2 rich hydrocarbon gas field of the "Fizzy" accumulation, southern North Sea. Here, hydrocarbon gas contains ~50 mol% C 0 2 and the gas occupies ~68% of the pore space, the rest being occupied by brine. The mineralogy was quantified in samples taken from a single core from
Natural
Analogues
19
both the gas and water legs of the reservoir and compared to core from similar intervals in the nearby, C0 2 -poor "Orwell" hydrocarbon gas field. The fields are located >150 km from surface outcrops of the Permian sediments on the surrounding continental margins and can be considered relatively hydrologically inactive. The reservoir rock contains corroded K-feldspar grains and volcanic rock fragments, but no detrital plagioclase or mica is present, limiting the availability of Ca 2+ and Mg 2+ . Wilkinson et al. identified small amounts of dolomite and dawsonite (0.4 ± 0.3 vol%) cement that had formed in the 50 Ma since the reservoir was first charged with C0 2 . Using sequentially extracted C- and O-isotopic compositions of the dolomite, Heinemann et al. (2013) estimated the amount of secondary dolomite precipitated from the C0 2 -charged fluid in that 50 Ma period was up to ~22% of the dolomite present in the reservoir, equating to sequestration of 11% ± 8% of the C 0 2 charge as dolomite. The authors concluded that the remaining 70-95% of the C 0 2 is present as a free phase, after tens of millions of years, and that mineral trapping is an unimportant process in such reservoirs. Ladbroke Grove field, Australia. (Watson et al. 2004) describe C0 2 -fluid-mineral reactions within the Ladbroke Grove hydrocarbon gas field, Otway Basin, southeastern South Australia. The hydrocarbon gas contains up to 57 mol% C 0 2 and significantly elevated HC0 3 ~ concentrations were observed in fluid samples from the gas leg. The reservoir rock is an early Cretaceous lithic-rich sandstone at a depth of ~3 km, and C 0 2 is thought to have migrated into the reservoir between 1 Ma and 4.5 ka ago. No information is available about the reservoir hydrology, but as an onshore reservoir, formation fluid flow rates may be influenced by contemporary groundwater recharge. The impact of the C 0 2 on reservoir mineralogy can be evaluated by comparison with samples from the neighbouring Katnook field, which contains low concentrations of C 0 2 gas (~1 mol%). In reservoir samples from Ladbroke Grove the C 0 2 charged fluids dissolved albite, volcanic rock fragments, chlorite and calcite resulting in an approximate doubling of porosity (from 7.5 to 16 vol%) and permeability (from 28 to 52 mD) relative to reservoir samples from the C0 2 -poor Katnook field. The C0 2 -charged fluids dissolved primary minerals, producing alkalinity and secondary precipitates via the reactions; 2NaAlSi 3 O g + 3H 2 0 + 2C0 2 -> Al 2 Si 2 0 5 (OH)4 + 4Si0 2 + 2Na + + 2HCO3
(1)
[Fe,Mg]5Al2Si3O10 (OH)8 + 5CaC0 3 + 5C0 2 ->
(2)
5Ca[Fe,Mg](C0 3 ) 2 + Al 2 Si 2 0 5 (0H) 4 + Si0 2 + 2 H 2 0 Products of the reaction included quartz, kaolinite, siderite and ferroan dolomite, with the ferroan carbonates occupying up to ~15 vol% of the reservoir samples and carbonate precipitation is most abundant close to the gas-water contact. The source of Ca 2+ and Fe 2+ for ferroan carbonate precipitation was the dissolution of poikiolitic calcite cement and chlorite. It is notable that the ingress of C 0 2 was relatively recent (about 5 ka to 1 Ma), meaning that significant reaction has occurred over relatively short timescales, and is in contrast to the observations of Wilkinson et al. (2009b) for samples from the Fizzy field. Thus, in the presence of a reactive reservoir mineralogy and under active hydrological conditions, significant reaction can occur in just a few thousands of years and can trap C 0 2 in a dissolved form and as secondary carbonate phases. Springerville-St. Johns Dome, USA. Moore et al. (2005) describe C0 2 -fluid-mineral reactions within the Springerville-St. Johns Dome C 0 2 field in eastern Arizona and western New Mexico, USA. The site is part of the wider Colorado Plateau C 0 2 province discussed in detail below (Fig. 2). At Springerville-St. Johns Dome >90% C 0 2 gas is trapped at depths 33 km 2 that record episodic C0 2 -leakage from the reservoir through local normal faults, with volumetric C0 2 -
20
Bickle, Kampman,
Wigley
% Natural C 0 2 Reservoirs (Major Fields) ^
Natural C 0 2 Reservoirs (Minor Fields)
* — C 0 2 Pipeline (flow: megatonnes/year) ••••...; Cenozoic Igneous Rocks Redrawn from Allis et al., (2001) & Gilfillan (2004)
100 km ' '
CHEYENNE SALT LAKE CITY. ; LU cn 5 d
# /
Farnham Gordon Ck D o m e p. / s"® Green Riveli?" '
/
\
* Paradox
Escalante
DENVER
Sheep 1 Mountain
Lisbon
COLORADO
CO Callum D o m e
'Me Elmòv Dome
\
^ Des Moines
PLATEAU
St Johns Dome PHOENIX
Bravo J \ / ' Dome ; . \ aLBUQUERG Estancia
^ LUBBOCK
Figure 2. The Colorado Plateau C 0 2 Province, is an extensive uplifted region covering portions of Utah, Colorado, Arizona and N e w Mexico, that contains abundant natural accumulations of C 0 2 . Some C 0 2 fields, notably Bravo Dome (NM), M c E l m o and Sheep Mountain (CO), Farnham D o m e (UT), Springerville (AZ), and Big Piney-LaBarge (WY) have been exploited for commercial purposes, mainly for enhanced oil recovery and dry ice production. The source of the C 0 2 is considered to be dominantly volcanogenic, juvenile C O , generated f r o m Cenozoic magmatic activity and mantle degassing (Gilfillan et al. 2008; 2009). The gas reservoirs, usually sandstone or dolomite, lie in four way dip closed or anticlinal structures with mudstone or anhydrite top seals. Fault seals are c o m m o n along the margins of the reservoirs (Allis et al. 2001; Shipton et al. 2004). The gases f r o m the fields can be > 98% C 0 2 with trace quantities of N , (4%), He (0.1-1%), Ar, and CH 4 . Redrawn after Allis et al. (2001).
leakage rates in the geological past that were significantly larger than leakage rates in the present day (Embid and Crossey 2009). U-Th ages of the travertines constrain the time of reservoir filling with C0 2 to prior to 350 ka, from local volcanic activity that ceased at ~308 ka (Embid and Crossey 2009). Successive pulses of C0 2 -leakge at 350-300, 280-200, and 10036 ka are thought to be related to groundwater flushing of the reservoir (Embid and Crossey 2009) and climate driven changes in fault hydraulic properties (see Kampman et al. 2012), highlighting the hydrologically active nature of the C 0 2 reservoir. Moore et al. (2005) describe core samples from the C0 2 -bearing siltstone and fine sandstone intervals, which are characterized by the dissolution of authigenic calcite cements (1-2 wt%) and detrital plagioclase (6-13 wt%) and K-feldspar (6-13 wt%) grains and by the forma-
Natural
Analogues
21
tion of dawsonite and kaolinite in intervals flushed by C0 2 -charged fluids. Flushing of these units by low pH C0 2 -charged fluids is thought to have dissolved feldspar grains and produced successive generations of dawsonite (5-17 wt%) and kaolinite (2-6 wt%) growth, as the phase stability varied with changing p C 0 2 and HC0 3 ~ concentrations, via the reaction NaAlSi 3 O g + H 2 0 + C 0 2 -> NaAlC0 3 (OH)2 + 3Si0 2
(3)
Dolomite is a relatively abundant phase (10 to 15 wt%) in the altered reservoir rock, fault conduits in the granitic basement are extensively dolomitized, and the modern C0 2 -charged formation fluids are supersaturated with respect to dolomite. However the extent to which dolomite growth is related to the C0 2 -charged fluids has not been evaluated directly. The reservoir lithologies and their petrophysical properties are highly heterogeneous and this is reflected in heterogeneous C0 2 -related fluid-rock reaction that likely reflects extensive variability in C 0 2 and groundwater flow. This site provides an intermediate case between those of the Fizzy and Ladbroke Grove accumulations. It highlights the important role that geological heterogeneity and fluid flow can have on controlling the fluid-rock reactions and C 0 2 mineralization. Implicationsforfluid-fluid and fluid-mineral reactions. These studies highlight important questions about the mechanisms that control C 0 2 dissolution and carbonate precipitation in natural C 0 2 reservoirs. In stagnant gas reservoirs such as the Fizzy field the fluid-mineral reactions may be strongly limited by the transfer of C 0 2 from the gas to the fluid phase. What physical processes control the flux of C 0 2 entering the reservoir fluid from the gas cap and what are the hydrological processes important for determining the volume of mineral contacted by the C0 2 -charged brine? Below the gas cap, a boundary layer will develop whose thickness is controlled by diffusive C 0 2 transport in the fluid phase and convective mixing of dense C0 2 -saturated fluid with the original brine (e.g., Neufeld et al. 2010). In layered geological reservoirs with high vertical porosity/permeability contrasts, lateral groundwater flow may limit downward propagation of the C 0 2 saturated front. This will depend on the ratio of the sinking rate of the C0 2 -saturated brines to lateral advection of the groundwaters. Replenishment of the reservoir by recharge with meteoric groundwater may sustain convective circulation of the C 0 2 saturated brines beneath the gas cap, or the convective processes may shut down in these old C 0 2 reservoirs. Model predictions of these processes are entirely untested. For the Fizzy accumulation little information is available on the 3D hydrology of the reservoir, making the significance of such processes difficult to assess. In such systems, pure C 0 2 (or brine saturated in C0 2 ) will precipitate carbonate minerals while reacting with silicates until either the silicate minerals are exhausted, or until the activity of C 0 2 in the aqueous phase is reduced such that the brine, silicate minerals, and carbonate minerals are all in equilibrium. Given the 50 Ma history of the Fizzy field it is likely that equilibrium, or some close to equilibrium (pseudo) steady state, has been attained. Did the reactions in the "Fizzy" field terminate because suitable silicate minerals were exhausted, or because a reduction in C 0 2 activity brought the silicates and dolomite close to equilibrium? Insufficient information is available on the compositions of the silicate minerals in this system and the thermodynamics of fluid-mineral equilibria to properly answer these questions. In these static reservoirs the reactions are likely limited by the availability of reactants, whereas in hydrologically active C 0 2 accumulations, and during the buoyant flow of supercritical C 0 2 in storage sites, the C0 2 -charged fluids are exposed to a large surface area of reacting minerals as they migrate through the reservoir. Observations from such flowing C 0 2 accumulations provide the most constraints on fluid-mineral reactions and reaction rates, where fluids and gases can be sampled along flow paths and the rates of fluid transport can be constrained from hydrological models or isotopic constraints. A number of such systems are available for study in the Colorado Plateau and southern Rocky Mountains region of the southwestern USA.
22
Bickle, Kampman, Wigley
These include the Springerville-St. Johns Dome accumulation in Arizona which is discussed above, and two other important sites; a collection of C 0 2 accumulations in the region of the San Rafael Swell, east-central Utah, including the leaking C 0 2 accumulation at Green River and the commercially produced Bravo Dome accumulation, north-eastern New Mexico. The Colorado Plateau and southern Rocky Mountains C 0 2 province In the Colorado Plateau and southern Rocky Mountains region, USA C 0 2 produced by Cenozoic magmatic activity has been stored securely in a variety of geological reservoirs for thousands to many millions of years (Fig. 2; Allis et al. 2001; Gilfillan et al. 2008). C 0 2 from several of these reservoirs is exploited for use in enhanced oil recovery (Allis et al. 2001) and therefore samples of C 0 2 gas and some core are available. Analyzes of surface travertine deposits (Embid and Crossey 2009; Kampman et al. 2012; Burnside et al. 2013) and the noble gas isotopic composition of the C 0 2 gas have put important constraints on the age of the accumulations (Ballentine et al. 2001) and C 0 2 mobility (Gilfillan et al. 2011) and C0 2 -iluid interactions (Gilfillan et al. 2008; Gilfillan et al. 2009; Dubacq et al. 2012; Zhou et al. 2012). However samples of the reservoir, caprocks and waters are not generally available, the exception being the active leaking system at Green River, Utah, where natural C0 2 -driven cold water geysers allow sampling at surface (e.g., Kampman et al. 2009) and a 2012 scientific drilling campaign has sampled core and fluids from the active reservoir. Exhumed CO¡-reservoirs of the Colorado Plateau, USA. Exhumed ancient C 0 2 reservoirs provide the best means of mapping large-scale patterns of fluid flow and fluidrock reaction, where the passage of the C0 2 -charged fluids is preserved as mineralogical and geochemical changes in the rock. The Jurassic red-bed Entrada and Navajo sandstones of Utah, south western USA, are bleached over large scales (tens of meters to tens of kilometers) by the passage of volatile rich diagenetic fluids which have dissolved Fe-oxides from the sediment bleaching them from red to white. These exposures allow mapping of the fluid flow pathways, and the assessment of lithologic versus hydrodynamic controls on fluid flow. Where mineralogical and geochemical measurements can be made as profiles across reactions fronts between the bleached and unbleached sediment the mechanisms controlling the fluid-mineral reactions and the propagation of the fronts, and the relative importance of fluid transport versus mineral surface reaction controlled mineral dissolution, can be assessed (Wigley et al. 2013a). The Entrada and Navajo Sandstones, and their regional equivalents, are high porosity/ permeability sandstone formations which cover large portions of the Colorado Plateau and they have been identified as important potential target C 0 2 storage reservoirs (e.g., Parry et al. 2007). Iron oxide dissolution during C02-injection experiments. The dissolution of Fe3+bearing oxide and oxy-hydroxide minerals is increasingly appreciated as an important geochemical buffer during the injection of C 0 2 into sandstone reservoirs (e.g., Kharaka et al. 2006a; Trautz et al. 2012; Rillard et al. 2013). Elevated concentrations of Fe 2+ have been observed in fluid samples from the Frio-I (Kharaka et al. 2006a,b) and Frio-II (Daley et al. 2007a,b) C 0 2 injection experiments and in numerous C 0 2 - E 0 R projects (e.g., Shevalier et al. 2009), within days of the break-through of C 0 2 and C0 2 -charged fluids at observation wells (see review by Kampman et al. 2013a). Dissolution of Fe-bearing minerals and the corresponding changes in the Fe 2+ content of the fluid account for much of the early pH buffering and generation of alkalinity in these fluids (Kampman et al. 2013a). The source of much of this Fe2+ is thought to be the acid-reductive dissolution of diagenetic Fe-oxyhydroxide grain coatings and disseminated cements (Kharaka et al. 2006a), where mineral dissolution and reduction of insoluble Fe 3+ to soluble Fe 2+ is driven by acidity generated from dissolved C 0 2 and fluid redox chemistry controlled by reduced species (e.g., CH 4 , H2S) already present in the formation fluids, following a reaction stoichiometry such as
Natural
23
Analogues
4Fe 2 0, + 15CO, + 6 H 2 0 + CH 4 -> 8Fe2+ + 16HCO^
(4)
Exhumed natural C 0 2 reservoirs in red-bed sandstones represent excellent analogues to this process, where the migration of the fluids can be mapped over meter to kilometer scales by mineralogical changes preserved in the rock. Red-bed sandstone bleaching, Utah. Much of the sandstone bleaching in the Jurassic sediments of Utah and in the wider Colorado Plateau region is localized to the crests of anticlines and this is attributed to the passage of buoyant hydrocarbon and CH 4 -rich fluids, which reduce Fe 3+ present as Fe-oxide grain coatings to soluble Fe 2+ and dissolves it from the rock (Beitler et al. 2003, 2005). Recently, bleaching in portions of the Jurassic Entrada and Navajo Sandstone in and around the San Rafael Swell, central eastern Utah, has been attributed to reactions driven by C0 2 -rich brines, containing quantities of dissolved CH 4 (Loope et al. 2010; Kettler et al. 2011; Wigley et al. 2012, 2013a,b; Potter-Mclntyre et al. 2013). San Rafael Swell C02 Province. The San Rafael Swell is comprised of an uplifted region formed by movement on a Laramide age basement fault, above which a ~75 km long monocline of Cambrian to Jurassic sediments was developed (Fig. 3). The Jurassic through to Permian sediments are exposed in the swell. The swell is bounded to the east by a leaking
Gordon Creek
W
'c Farnham Dome
CO 2 -SPRING OR GEYSER FAULT STUDY AREA UTAH
Southea: .Mounds Castle Dale
Woodside Geyser
Woodside Green River
Justenson Flats JQ Emery y
River
co2
seeps
Eardly Canyon
M
Tertiary
I
| Cretaceous
|
| Upper Jurrasic
W Lower Jurrasic 20 miles
[ U Triassic
Figure 3. The San Rafael Swell C 0 2 province showing the location of the major C 0 2 fields and the C 0 2 degassing springs and seeps.
24
Bickle, Kampman, Wigley
C 0 2 accumulation at Green River and on all sides by numerous large secure C0 2 -reservoirs including the Gordon Creek (Morgan and Chidsey 1991), Farnham Dome (Peterson 1954; Morgan 2007), Woodside (Osmond 1956), Emery (Campbell 1978) and Escalante (Allison et al. 1997) accumulations (Fig. 2). The majority of the reservoirs are located in the Jurassic Entrada and Navajo Sandstones, the Permian White Rim Sandstone and the overlying Kaibab and Moenkopi Formations, and in carbonate strata of the Pennsylvanian and Mississippian (Campbell 1978; Morgan and Chidsey 1991). The high 3 He and N 2 content of these gases has lead several authors to attribute their origin to mantle derived fluids, with inputs of radiogenic crustal-derived gases from the granitic basement rocks. Laterally extensive zones of bleaching are found in the Jurassic Navajo and Entrada sandstones exposed in the swell and along exhumed normal faults bordering the swell at sites like Green River. The region is also notable for its rich uranium reserves, predominantly hosted in Triassic strata of the Chinle Formation, and several authors have hypothesized that C 0 2 played a role in their emplacement (Garrels and Richter 1955; Gruner 1956; Morrison and Parry 1988). Entrada and Navajo Sandstone Bleaching: source fluids, petrology and large-scale fluid flow. Determining the composition of the fluid(s) responsible for these bleaching reactions in these now exhumed reservoirs is only possible by indirect means. The composition of the fluids can be inferred from the mineralogy and isotopic composition of the reaction products or from fluids trapped in these diagenetic minerals. Beitler et al. (2005) discuss the reaction products and textures found in bleached Navajo Sandstone attributed to buoyant hydrocarbon and CH 4 -rich fluids at sites across Utah. The alteration includes; patchy zones of quartz and calcite cement, dissolution of K-feldspar grains to generate grain coating illite and kaolinite, and high secondary porosity. The alteration is typically contained to structural highs and this is interpreted to reflect the passage of buoyant fluids, where the CH 4 content of the brines is sufficient to lower their density through hydrogen bond interactions. The carbonate cements typically contain isotopically light carbon (8 13 C caldte of - 3 to -15%o) and this is interpreted to reflect precipitation from fluids containing dissolved organically derived carbon (Beitler et al. 2005; Wigley et al. 2012). Wigley et al. (2012, 2013a) discuss the reaction products and textures found in bleached Entrada Sandstone associated with C0 2 -rich, CH 4 -bearing brines at Salt Wash Graben, Utah. The alteration includes; zones of ferroan dolomite and quartz cementation, especially localized to bleached faults and at reaction fronts, and dissolution of K-feldspar grains to generate graincoating and pore-filling kaolinite and illite, with an overall reduction in porosity. The alteration is typically localized towards the base of the sandstone formations and this is interpreted to reflect the passage of dense C0 2 -rich brines. The carbonate cements typically have relatively heavy C-isotope composition (813Cdotomite 0 to -3%o) and this is interpreted to reflect precipitation from fluids containing dissolved carbon derived from mantle or crustal derived C0 2 . Wigley et al. (2012) used Raman spectroscopic measurements of vapor bubbles in twophase water-gas fluid inclusions in diagenetic quartz and gypsum in bleached portions of the Entrada Sandstone at Green River to estimate the volatile composition of the bleaching fluid. Determining vapor bubble compositions in low temperature diagenetic fluid inclusions using Raman spectroscopy is complicated by mineral turbidity, the small size of the fluid inclusions and trapped vapor bubble, Brownian motion of the bubble and proximity to the fluidgas homogenization temperatures. Wigley et al. (2012) examined >120 fluid inclusions in quartz overgrowths and gypsum veins petrographically linked to the bleaching. The authors determined vapor bubble compositions in eight fluid inclusions; five bubbles contained pure C0 2 ( g ) and three contained C0 2 -CH 4 mixtures, up to 28 vol% CH 4(g) . The authors used microthermometry measurements of the ice melting temperatures in these inclusions to show that the trapped fluid was relatively saline (2.5-7.0 wt% NaCl equivalent), being enriched in brines derived from evaporites in the Paradox Formation, deeper in the basin. This is in contrast to
Natural
Analogues
25
the largely l s O-depleted meteoric fluids associated with hydrocarbon bleaching elsewhere, and this is reflected in the heavy O-isotopic composition of the carbonate cements at Green River. Potter-Mclntyre et al. (2013) examined similar zones of carbonate and Fe-oxide mineralization in an interval of the Navajo Sandstone exhumed in the Justensen Flats of the northern San Rafael Swell, ~40 km to the west of Green River. The authors investigated a 45 m by 5 m, laterally extensive "tongue" of bleached cross-bedded sandstone with an interior relatively depleted in Fe-oxyhydroxide, surrounded by a yellow-brown reaction front of carbonate and Fe-oxide cementation. The alteration and morphology of the bleaching is similar to that described by Wigely et al. (2012, 2013a). The authors attributed the dissolution of grain coating Fe-oxyhydroxide to the passage of CH 4 -bearing C0 2 -charged fluids. The bleaching was accompanied by K-feldspar dissolution and illite and kaolinite precipitation and the extensive precipitation of Fe-dolomite/ankerite and Fe-oxides at the surrounding reaction front. Similarly, Loope et al. (2010) examined bleaching and Fe-precipitation within the Navajo Sandstone near the southeast flank of the Escalante anticline, southern Utah, ~50 km south of the San Rafael Swell. The Escalante anticline holds an estimated 1.5 to 4 trillion cubic feet of gas (93%-99% C 0 2 , l % - 6 % N 2 , 0.4%-0.7% CH 4 ; Allison et al. 1997) within a 600-m-thick sequence of Permian strata, including the White Rim Sandstone and Kaibab Limestone, although C 0 2 gas shows were also observed in transmissive units in Triassic and Jurassic sediments in the overburden (Campbell 1978). To the southeast of the anticline, over a region extending some ~50 km, the Navajo Sandstone is bleached and Fe-mobilized during the bleaching is redeposited down-dip as pipe-like and spheroidal Fe-concretions and as Fe-rich calcite. Loope et al. (2010) attributed this alteration to the flow of meteoric fluids from recharge zones on the Aquarius Plateau that subsequently dissolved C 0 2 and CH 4 in the anticline, becoming dense, and bleached the Navajo Sandstone during their down-dip passage to discharge in the Colorado River. This alteration had previously been attributed to the passage of buoyant CH 4 -rich fluids (Beitler et al. 2003, 2005; Chan et al. 2011) and the concretions have been proposed as a potential analogue to hematite concretions (Martian "blueberries") imaged by the Mars rover Opportunity (Chan et al. 2004). The concretions have thick, iron oxide-cemented rinds and lightly cemented, iron-poor sandstone cores (Loope et al. 2010). Loope et al. (2010) attribute the formation of both the spheroidal and the pipe-like Fe-concretions to microbially mediated oxidation of precursor siderite-cemented concretions formed during C 0 2 - C H 4 bleaching of the sediment by flushing of the reservoir with oxygenated meteoric waters during exhumation. Loope et al. (2010) mapped asymmetric spheroidal concretion "comet tails" and groups of near horizontal, sub-parallel pipes and used their orientation to infer the flow direction of the C0 2 -charged groundwater, to the southeast. This alteration is similar to those documented at Green River and the San Rafael Swell described above, but the mineralization of the C 0 2 here is predominantly thought to be as siderite, as opposed to ferroan dolomite described in the sites above. These differences probably reflect differences in fluid geochemistry and a M g + , with some sites containing fluids dominated by Mg-rich basinal brines, and others dominated by dilute meteorically derived fluids. Parry (2011) used modeling to constrain the rates of formation of such concretions to ~2800-3800 cm _ 1 year _ 1 , depending on the relative rates of diffusive versus advective-diffusive solute transport. Such deposits provide invaluable evidence on the patterns of large-scale fluid flow, although the origin of the Fe-precipitates is still highly debated (Chan et al. 2011; Kettler et al. 2011). Such studies illustrate the wealth of information available f r o m exhumed reservoirs, but also the inherent complexities in interpreting exhumed systems where the composition of the altering fluids must be inferred by indirect means and were the mineralogy and geochemistry of the reservoir is altered by diagnetic and weathering reactions. This highlights the importance of collection core and subsurface fluid samples f r o m active C 0 2 reservoirs, such as those at Green River, where the mineralogy is preserved and measurements
26
Bickle, Kampman,
Wigley
on fluid geochemistry can be used to constrain and interpret the driving geochemical reactions. The discussion below covers recent scientific drilling at the Green River site and how measurements from reservoir rocks and caprocks, and fluid geochemistry, are being used to constrain the fluid-mineral reactions and fluid transport, to decipher their rates and controlling mechanisms.
NOBLE GAS STUDIES OF THE COLORADO PLATEAU AND SOUTHERN ROCKY MOUNTAINS C 0 2 PROVINCE Noble gases and natural C0 2 reservoirs The five noble gases helium (He), neon (Ne), argon (Ar), krypton (Kr), and xenon (Xe) collectively have twenty-two stable or long half-life isotopes between them. They are chemically inert and due to their volatile nature they have a strong tendency to partition into gas or fluid phases and can be used as tracers for the origin and the transport of fluids. The wider application of noble gases to problems in geological C 0 2 storage is reviewed in Holland and Gilfillan (2013). C 0 2 can be produced naturally within the crust from a number of sources including the thermal breakdown of marine carbonates, the diagenetic breakdown of carbonate cements, methanogenesis, microbial hydrocarbon degradation or hydrocarbon oxidation. C 0 2 can also be introduced to the crust from the mantle via the degassing of magma bodies or as a mobile supercritical volatile-rich fluid. Microbial activity and alteration of hydrocarbons typically produce gas accumulations that are rich in both C 0 2 and hydrocarbon gases such as CH4. Only the thermal decomposition of carbonate rocks and mantle volatile degassing can produce nearly pure C 0 2 accumulations. Distinguishing between these sources is an important aspect of interpreting the origin, age and evolution of natural C 0 2 reservoirs. Noble gas concentrations and isotope ratios in the natural C 0 2 reservoirs of the Colorado Plateau and the southern Rocky Mountains have been studied extensively to determine C 0 2 and groundwater sources and to constrain the noble gas geochemistry of the mantle C 0 2 source. Both element (e.g., C02/3He) and isotope ratios (e.g., 3He/4He) have been used to determine the origins of the natural C 0 2 and to infer its emplacement mechanism, and to constrain fluid-fluid and fluid-rock interactions that subsequently modify the C 0 2 and noble gas budget of the accumulations.
Noble gas solubility's and Henry's Law Physical processes such as gas dissolution and exsolution can modify the ratio of C 0 2 and noble gases in both the gas and water phases. This is because of the large difference in solubility between relatively soluble gases like C 0 2 and the highly insoluble noble gases, and the relatively large variation in solubility between the individual noble gases. The solubility contrast is such that upon degassing C0 2 -charged fluids quantitatively degas their dissolved light noble gas load, as the noble gases are far more soluble in the contacting gas phase. Conversely, during dissolution of C 0 2 from a free gas cap the light noble gases (e.g., He) behave conservatively, being retained in the gas phase as C 0 2 is lost to solution. In order to interpret measurements of gas and water C 0 2 and noble gas ratios we must first be able to constrain the theoretical solubilities of the dissolved species in each of the respective phases. The solubility of any gas in solution (e.g., C 0 2 , He) can be described by Henry's Law: Pl=KlXl
(5)
where pt is the partial pressure of gas i in equilibrium with a fluid containing xt mole fraction of i in solution and Kt is the Henry's constant for the species. Henry's coefficients vary with
Natural
27
Analogues
temperature and water salinity. Limited experimental data is available on the solubility of a pure noble gas phase in water (see review in Ballentine et al. 2002) and there is currently no published experimental data available on noble gas solubilities in gaseous or supercritical C0 2 . Such data is critically needed to facilitate the application of noble gases to the study and interrogation of fluid-fluid interactions in C0 2 -injection sites and natural C 0 2 reservoirs. The limited experimental data sets for pure noble gas solubilities in water provide a first order prediction of noble gas partitioning between geological fluids and gas but the application of noble gas solubilities in water to modeling their partition into supercritical C 0 2 is untested. Groundwaters and reservoir brines are moderate to high salinity fluids of variable ionic strength, which span a range of pressures and temperatures in geologic systems. Solubilities deviate from linearity (Eqn. 5) at higher pressures and in concentrated solutions due to intermolecular interactions and may be described by a modified form of Henry's Law that accounts for non- ideality in the liquid and gas phase. The modified equation becomes: ®,P,y= ,K,x,
(6)
where ; is the gas phase fugacity coefficient and y; is the liquid phase activity coefficient. From the virial theorem of statistical mechanics the relation between real molar volume and pressure can be defined as
\
m
m
m
J
where P is pressure, T is the temperature, R is the ideal gas constant and Vm the molar volume. B, C and D are first, second and third order empirical virial constants determined for each gas. Most systems can be described by the truncated second order form, with the third order expression required only to describe behavior at high pressures. The truncated gas phase fugacity coefficient can be derived as WP,T) =m Vm
C ( T ) + B (T)2 22
2Vm
(8)
where the virial coefficients can be estimated from P-V-T data and the fugacity coefficients calculated. Non-ideality in the liquid phase is difficult to determine using equations of state because of the complexity of solute/solute and solvent/solute interactions (see for example Dubacq et al. 2013). y is considered to be independent of pressure and deviation from ideality caused by temperature and electrolyte concentration is assessed from empirically derived data. For charged species in geological fluids this is typically done using chemical speciation codes that calculate activity coefficients in complex aqueous solutions using the law of mass action and experimentally determined equilibrium constants for the speciation reactions (e.g., PHREEQC; Parkhurst and Appelo 1999). Such codes are limited in their ability to model nonideality in high ionic strength solutions, which is an important issue for geological storage which involves C0 2 -fluid interactions in high ionic strength brines. The activity coefficient (y) of a neutral species, such as a dissolved noble gas, can be assumed to depend linearly on ionic strength such that; logy , = k j
(9) -1
where km is a Setschenow coefficient and I is the ionic strength of the solution (mol ). Setschenow coefficients for the noble gases have been determined empirically (Smith and Kennedy 1983). The solubility of the noble gases decreases with increasing salinity, but this salting out effect decreases with increasing temperature. The solubilities of the noble gases decrease with increasing temperature, until a minimum solubility is reached, with the gases becoming more soluble at higher temperatures. This
28
Bickle, Kampman,
Wigley
solubility minimum occurs at higher temperatures for individual noble gases as a function of increasing mass, ranging from ~35 °C for He to ~115 °C for Xe. The absolute solubility of individual noble gases also varies as a function of increasing mass, with Xe being ~10x as soluble as He at 25 °C. C 0 2 is ~90x more soluble than He at 25 °C and ~8x as soluble as Xe. This wide variation in solubility between the noble gases, and between the noble gases and C 0 2 makes solubility fractionation between geological fluids and gas an important indicator of physical processes. Solubility fractionation of gas compositions Progressive degassing of a liquid containing dissolved gases will lead to fractionation of the elemental gas ratios in the residual dissolved gas and the in the contacting gas phase due to solubility fractionation effects. As the degassing proceeds the least soluble gases will tend to be enriched in the gas phase (c.f. Holland and Gilfillan 2013). The equilibrium molar concentration of the gas in the gas phase ([;']g) is dependent on the gas/liquid volume ratio (V/Vg) and the initial molar concentration of gas in the liquid phase ([;]totai) related by:
_gU_
ti]
(10)
- X +l ysK-d such that as V-JVg —> 0, [¿]g —> [¿]total. For non-ideal gases and Henry's constant in units of molality, Equation (10) becomes; m
g
= r a
^ ^ 273—K'V
t o t a l
(id
where pi is the density of the liquid (g cm -3 ), T is temperature (K), Vgji is the gas or liquid volume (cm3) and K'd is the Henry's constant (kg atm mol -1 ). If the initial noble gas concentration in the liquid phase is known Equations (10) or (11) can be used to determine the volume of gas with which a liquid has equilibrated, by using only one noble gas concentration in the liquid phase (e.g., Zhou et al. 2005). In practice it is often difficult to assess the initial noble gas concentration in the liquid phase, and the relative fractionation between two different noble gases can be employed to determine the extent of the fractionation, such that;
i J_£
=
i
Vi
Kj y
v;
k,
-\L +1—
(12)
where \ilf\o is the initial ratio of two noble gases i and j in the groundwater and [;'//]g is the ratio in the gas phase. For small degrees of degassing the partitioning of the noble gases tends towards the equilibrium fractionation coefficient (a) for the system, which is determined by the Henrys' constants (Kl(i j}), liquid ( y . ) and gas (cj»,- -) phase activity coefficients for the and f 1 noble gas such that:
vi
[i/jio
yj_K'.
(13)
Progressive degassing of a fluid can lead to preferential striping of the insoluble noble gases from the liquid phase and their enrichment in the gas phase. Such degassing can be
Natural
Analogues
29
modeled as a Rayleigh type process and the ratio of noble gases \i/j\ in the depleted reservoir in the groundwater evolves as: i
=
i
1
0
The analogous Rayleigh equation for fractionation of the noble gas ratios during gas dissolution is thus: (15) iJi
LiJ
Such Rayleigh fractionation during gas dissolution can lead to extreme noble gas ratios during the long-term redissolution of noble gases into groundwaters and this is discussed in detail below. Terrestrial noble gas reservoirs and sources The noble gases distributed through the atmosphere, crust and mantle reservoirs on the Earth are derived from two principle sources: those originating during planetary accretion which are commonly known as 'primordial' noble gases (e.g., 3 He) and radiogenic noble gases generated by terrestrial radioactive decay processes (e.g., 4 He). The production of noble gases by radiogenic and nucleogenic processes in the crust is reviewed in Ballentine and Burnard (2002) and Ballentine et al. (2002) and only a brief discussion of the relevant decay series is included here. The radiogenic noble gases are produced primarily by radioactive decay ( 4 He, 40Ar, 86Kr, 131Xe, 132Xe, 134Xe, 136Xe) and nucleogenic reactions ( 21 Ne, 21 Ne, 22Ne, 3 He), although minor amounts are also generated in the atmosphere by cosmic ray spallation. The noble primordial gases and noble gases produced within the crust by radiogenic and nucleogenic processes are the most relevant to the study of subsurface systems, with the isotopes of He, Ne, Ar and Kr being the most studied and providing the most constraint on C 0 2 behavior in natural reservoirs (Fig. 4). Atmospheric reservoir. The Earth's atmosphere represents a relatively concentrated reservoir of noble gases. Because of their high volatility much of the primordial noble gas content of the mantle was out-gassed early in Earth's history (Farley and Neroda 1998), with much of the He being subsequently lost to space (Axford 1968). Surface waters derive their noble gas load from equilibration with the concentrated noble gas reservoir in the atmosphere (predominantly Ar and Ne with trace He, Kr and Xe). The absolute concentrations are controlled by the relative gas solubilities and the temperature and pressure of equilibration, and the isotope ratios are derived directly from the atmospheric ratios, with the exception of He-isotopes which are fractionated during dissolution (Benson and Krause 1980). For meteoric or surface derived groundwaters the fluid noble gas elemental and isotopic composition is expected to reflect air saturated water (ASW) (Ozima and Podosek 2002). This initial composition can be subsequently modified by the addition of 'excess air' trapped in soil and shallow sediments, additions of radiogenic and nucleogenic crustal noble gases and variable degrees of heavy noble gas enrichment due to addition of air trapped and adsorbed in/on old sediments (e.g., Torgersen and Kennedy 1999). This is most notable for Xe which is depleted in air by more than an order of magnitude relative to concentrations expected for planetary out-gassing, due to hydrodynamic loss (Porcelli et al. 2001) and sediment stripping of the atmosphere (Podosek et al. 1980). Ar represents ~1% of the atmosphere, which is dominated by radiogenic 40 Ar and comprises almost the entire inventory of 36Ar (Lee et al. 2006). The 40 Ar/ 36 Ar ratio of the atmosphere has evolved from the original solar ratio of mol/m 2 /s > Green River
-14 V 4x10
-25 AG r kJ/mol
Figure 20. Albite dissolution rates f r o m laboratory experiments by (Hellmann and Tisserand 2006) (left axis) at 150 °C and pH = 9.2 (open squares) compared with rates f r o m Green River (right axis) taking 1) surface p H measurements (filled circles) and 2) assuming C0 2 -saturated pH of 5.2 f r o m the Green River drillhole for upstream Small Bubbling spring with linear interpolation to surface p H value for downstream Torrey's spring (grey circles). Broken line shows calculated dissolution rates as a function of AG, f r o m the simplest transition state theory (Hellmann and Tisserand 2006).
Natural
Analogues
51
thickness of the formation (Fig. 15). Figure 20 illustrates how the AGr estimates would be altered by the extreme assumption that the waters at Small Bubbling spring, the upstream well of the section used to calculate reaction rate, were C 0 2 saturated and saturation decreased downstream at a rate proportional to the decrease in AGr so that the most distal spring, Torrey's spring, had a downhole pH equivalent to that measured at the surface. This would stretch the profile, as illustrated in Figure 20, but not change the fundamental observation that reaction rate was dependent on approach to equilibrium and that reaction rate varied relatively slowly with degree of disequilibrium in the close-to-equilibrium region of these natural samples. The uncertainty in AGr resulting from the pH measurements is of a comparable magnitude to the uncertainty introduced by using laboratory derived feldspar dissolution equilibrium constants to predict the position of thermodynamic equilibrium in natural systems. The wide compositional variability in feldspar (and other silicate mineral) solid solutions (e.g. Ca-Na-K contents and Al-Si ordering) results in a large thermodynamic range in mineral solubility, with the anorthite end-member being orders of magnitude more soluble than that of albite (e.g. Arnorsson and Stefansson 1999). In addition there are multiple complexities inherent in the measurement of silicate mineral equilibrium constants at low temperature that include; the difficulty in attaining equilibrium in the experiments, uncertainty in the presence and role of precursor species on the mineral surface, variation in Al-Si ordering, the complex speciation of Al at low and intermediate pH, and the role of complexing ions and ligands present in natural waters that are not accounted for in the laboratory experiments. Thus, thermodynamic equilibrium constants from different experiments are often applicable only to a very specific range of fluid compositions and conditions, and measurements at comparable thermodynamic conditions frequently do not agree. Further measurements of the silicate mineral thermodynamic constants are critically needed to accurately model fluid-mineral reactions in C 0 2 reservoirs. Several authors have emphasized that clay mineral precipitation rates are important in controlling silicate mineral dissolution rates (e.g., Maher et al. 2009; Zhu and Lu 2013). Since Al solubility is very small, clay mineral precipitation rates must essentially balance feldspar dissolution rates. The dissolved concentrations of Na, Al and Si in conjunction with the other cations will increase to a quasi-steady state at which the thermodynamic overstep of the clay mineral precipitation reactions will drive their precipitation at a rate which balances the thermodynamic understep of the feldspar dissolution reactions. Figure 21 illustrates the estimated rate of kaolinite precipitation as a function of AGr for both the measured pH at surface and the downhole value of 5.2, considered the minimum possible and almost certainly an underestimate for the more downstream sites. There is a general correlation between precipitation rate and AGr although the scatter in AGr probably reflects systematic uncertainties related to estimates of surface areas, mineral modes and fluid C 0 2 concentrations. It is clear that a more robust recovery of dissolution rates from the Green River analogue site would require a series of drill holes to recover core and fluids from the Navajo sandstone along the flow path. The Green River Drill Hole - revision of inferences from surface sampling. The drilling, coring and fluid recovery from the Green River Drill Hole in 2012 offered an important chance to test some of the inferences made from the surface sampling. This work will allow analysis of fluids sampled at pressure and a set of mineralogical and petrological measurements on core recovered from the Navajo sandstone at Green River, rather than inferring the Navajo sandstone properties from samples collected from more distal sites in the Paradox basin. The hole was drilled west of the Green River just north of the Little Grand Wash Fault and thus close to an inferred source of C0 2 . Much of the planned work on the drill core is yet to be completed at the time of writing. However important initial observations include 1) that the fluids are saturated or close to saturation with C 0 2 at hydrostatic pressures (Fig. 15, Kampman et al. 2013b) resulting in a maximum uncertainty in AG for the plagioclase dissolution reaction
52
Bickle, Kampman, 1x10
8x10
Wigley
-12
-13
.
-13
.
Kaolinite precipitation rate mol/m 2 /s
Surface pH pH = 5.2
Small Bubbling 6x10
4x10
Big Bubbling
-13
Side Seep 2x10
-13 • Pseudo Tenmile Torreys Tenmile Tumble -6 -4 -2 Chaffin Raneh
2
4 6 AGr (kj/mol)
8
10
12
14
Figure 21. Kaolinite precipitation rate versus degree of over saturation calculated f r o m stoichiometry of sampled fluids at Green River and estimates of clay mineral surface areas in the northern Paradox Basin by Zhu (2005). AG r calculated assuming surface pH measurements (black squares) and pH f r o m Green River Drillhole samples (grey squares). The latter almost certainly underestimates p H especially in the more downstream samples.
of ~ 20 kJ/mol, 2) the carbonate phases encountered in the drill core are predominantly Febearing dolomites rather than the calcites predicted to be precipitated by the modeling of the fluid, and 3) basal Carmel Formation caprock to the Navajo sandstones and intra-formational aquitards in the overlying Entrada sandstone are highly cemented by carbonate inferred to have been precipitated by C0 2 -rich fluids reacting with silicate minerals or degassing C 0 2 as a consequence of decompression (Kampman et al. 2013a). A further important observation made by Bickle and Kampman (2013) based on the C 0 2 contents of the sampled fluids, is that the mass of C 0 2 removed by flow along the Navajo sandstone is about 20x the rate of natural leakage at the surface from the fault system estimated by U-Th dating of travertines (Burnside et al. 2013). If similar amounts of C 0 2 are removed where the faults intercept the Wingate and White Rim sandstones, major aquifers below the Navajo sandstone, then only ~ 0.01% of the C 0 2 introduced at depth leaks at surface. Such a low surface leakage rate should be acceptable from geological storage sites (Hepple and Benson 2005). It should also be noted that the open abandoned drill hole at Crystal Geyser leaks C 0 2 at ~ 50x the natural leakage rate along the fault (Burnside et al. 2013). Surface exposures of bleached sandstones at Green River: a Palaeo-CO, reservoir? Occurrences of bleached sandstones in the Paradox Basin where the bleaching fluid is thought to have been caused by C0 2 -saturated brines are reviewed in the discussion of specific natural analogue sites above. At Green River the Entrada sandstone, part of the San Rafael Group, is exposed in the northern footwall of the Salt Wash Graben around its intersection with the Green River anticline (Fig. 12). Here the lower part of the Entrada sandstone is bleached white in marked contrast to the normal red sandstone (Fig. 22). The bleaching occurs in a broad domal structure which reaches ~ 20 m thick at the crest of the Green River anticline, extends to the limit of exposure of the Entrada sandstone a few hundred meters west of the anticline and dies out in a series of ~ 30 cm-thick fingers ~ 2 km east of the anticline (Fig. 23B). The bleaching probably also thins and dies out to the north but exposures are limited to short gulleys eroded into the east-west cliffs that expose the Entrada sandstone north of the Salt Wash Graben. The nearly continuously exposed upper contact of the bleached sandstone is sharp and cuts gently
Natural
Analogues
53
down the stratigraphy to the East (Fig. 22). Near the crest of the anticline a series of closely spaced fractures acted as a fluid pathway allowing the bleaching fluids to escape upwards (Fig. 22) and bleaching also extends laterally away from small vertical fractures which extend up from the main sub-horizontal bleaching front (Fig. 23A). Wigley et al. (2012, 2013a) argue that the bleaching is due to migration of C0 2 -charged brines away from the Salt Wash graben fault as discussed below and in the review on exhumed C 0 2 reservoirs above (Fig. 24). This allows us to study the petrography of the fluid mineral reactions in detail, put constraints on the rates of the reactions and examine the mobility of metals which might contaminate potable aquifers. Wigley et al. (2012) describe the petrological changes across from the red sandstones to the bleached sandstone. The Entrada sandstone is a fine to medium grained aeolian deposit which exhibits large scale cross-bedding. The unaltered sandstone is quartz-rich with ~ 12% K-feldspar, 4.5% plagioclase and carbonates comprising an Fe-poor calcite and dolomite post-dated by a ferroan dolomite. Grain coatings of hematite and goethite give the sandstone its characteristic red color and are coated in turn by illite-smectites, minor kaolinites and euhedral quartz overgrowths. In the bleached samples the iron oxide grain coatings have been removed which is reflected in a drop of total Fe from between 0.9 to 0.8 wt% in the unbleached sandstone to ~0.6 wt% in the bleached sandstone (Fig. 26). The bleached sandstones have less K-feldspar (3% vs. 6%) and more carbonate (10% vs. 5.3%) than the unbleached rock, and mixed Fe-Ti oxides in the unbleached samples have recrystallized to pure Fe or Ti oxides. In the fault zone (Fig. 22), presumed to be more intensely altered, K-feldspar is reduced to 2.7% and carbonates increase to 18%. The faults and fractures also contain narrow gypsum veins, occasional calcite veins and bands of coarse Fe-oxides which occasionally preserve pyrite cores. The continuity of the fracture-associated bleaching with the large scale bleaching and their similar petrological and stable isotopic compositions are consistent with both being caused by the same fluids. The nature of the fluids which cause bleaching in the Navajo sandstone is disputed. Chan et al. (2000, 2011) and Beitler et al. (2005) have argued for leaching of the Fe-oxide coatings by reduced fluids containing hydrocarbons, methane, organic acids or hydrogen sulfide. Kettler et al. (2011) and Loope et al. (2010) argue that bleaching in some of the localities described by Chan et al. (2000) was by C0 2 -charged brines. Of course bleaching is probably caused by different fluids in different places. Wigley et al. (2012) argue that the fluids responsible for the bleaching of the Entrada at Green River were C0 2 -charged for the following reasons: •
The bleaching is adjacent to a fault known to have been associated with C 0 2 escape for > 400 ka.
•
Bleaching is towards the base of the Entrada sandstone consistent with higher density of a C0 2 -charged fluid. It should be noted that in the outcrops reviewed by (Chan et al. 2011) they argue bleaching is by a lower-density fluid.
•
Fluid inclusions in the quartz overgrowths and gypsum veins petrographically linked to the bleaching contain C 0 2 and some contain minor CH4.
Calcite cements from the bleached Entrada sandstone have heavy 8 13 C and 8 l s O isotopic compositions compared with other bleached Jurassic sandstones from the Paradox basin but more comparable with those of the aragonite veins in the travertine mounds formed by the present-day C 0 2 geysers. Reaction stoichiometry and spatial distribution. Iron is soluble in relatively reduced fluids at lower pH values (Fig. 25). Wigley et al. (2012) calculated that a reductant was necessary to maintain relatively reducing conditions as hematite was dissolved, otherwise the fluid would
54
Bickle, Kampman,
Wigley
Fracture Swarm
C02-charged
Figure 22. View of large scale bleaching at crest of Green River anticline. Note 1) upwards escape structure associated with numerous fractures, 2) that the bleaching occurs along the base of the Entrada (the top of underlying Carmel Formation is exposed at about the level of the base of the cliff and 3) how the top of the bleached zone (horizontal contact) cuts down across the bedding. [Used by permission of the Geological Society of America from Wigley et al. (2012), Fig. IB.]
Diffuse Fingering
Figure 23. A) vertical aragonite and gypsum vein with bleaching of its wall rock and B) outcrop at Eastern limit where bleaching terminates as a series of bedding-unit confined fingers (outline of finger emphasized by dotted line).
Red Entrada sandstone
saitwash Fault
N&E
Fracture with marginal bleaching Vertical transport mainly by diffusion, low Pe, high N D Horizontal transport by advectlon, high Pe, low N D
Earlier position of front
Figure 24. Diagramatic illustration of inferred flow of C0 2 -charged brine away from fault at Salt Wash Graben. [Used by permission of Elsevier. Redrawn after Wigley et al. (2013a), Fig. 2A.] Flow is driven north and east by density contrast and regional hydraulic gradient in the Entrada sandstone.
Natural
Analogues
55
o
Eh volts -0.1
-
-0.2
3
4
4.5
p H
5
5.5
6
Figure 25. Stabilities of hematite and siderite in Eh-pH space redrawn from calculations using PHREEQC (Parkhurst and Appelo 1999) at a F e = 0.005, a C a = 0.01 and total C = 0.1 mol/L. Dotted lines contours of methane activities. Arrow shows path taken by fluid with initial pH = 3.5, Eh = 0.02 reacting with hematite. [Used by permission of the Geological Society of America. Redrawn after Wigley et al. (2012), Fig. 5.]
be rapidly oxidized and minimal hematite dissolution would take place. Since methane was present in the analyzed fluid inclusions this was implicated as the reductant and the calculated reaction trajectory in Figure 25 modeled with the stoichiometry 20Fe 2 0, + 5CH 4 + 64C0 2 + 19H 2 0 +11H +
(29) +
30Fe 2 +!OFeHCO, +59HCO with (c5C / dt) can be ignored and a solution to Equation (30) is of the form l)
0
(x • Haematite # mode
•
^ « (Pe = 3.5x10 ), N d = 2.6±0.2x10
7
Haematite Kr = 3.2x10"15 mol.m"2.s"1
1.0-
Transect 1 •
K-felds mode j* I
0.50 -
•
i
• *
Distance metres
i
61
Analogues
(Pe = 3.5x10" 5 ), ND = 1.0±0.3x10 7 K-feldspar Kr = 3.1x10"13 mol.m"2.s"1 Distance metres
i
I
0.5
i
1.0
i
1.5
Transect 3
Figure 31. Fits to reaction progress using Equation (42) to A) hematite and B) K-feldspar across horizontal Transect 1 where Pe is fixed at a low value, scaling distance is taken as 1 meter and mineral modes are normalized to zero in bleached and 1 in red sandstones. C) Fits to N d across horizontal Transect 2 and D) Fits to N d across horizontal Transect 3 hematite profiles given low Pe. E) Fits to Pe and N D to asymmetric bleached zone across Fracture 1 using Equations (42) and (43). Solid circles and dashed line fit are to west (upstream F i b ) and grey squares and solid line fit to east (downstream Fla). Mineral modes normalized as above and scaling distance is taken as 1 meter. F) Fits to N D to asymmetric bleached zone downstream in Fracture 2 assuming the Pe calculated from fracture 1. G) Photograph of Fracture 1 prior to sampling showing bleached zone and where F i b is profile upstream to west and F l a is the profile downstream to the east. Recalculated with distance scaling corrected after (Wigley et al. 2013a).
090/20
tub
Ilia®
I Fluid flow up vein
30 cm
62
Bickle, Kampman,
Wigley
The transformation to dimensionless variables is made by
,
x x =— h co0cpf t'=h
(38)
c-ceq
C'=-
Co— Ceq
¥o
_
¥e,
where h is an appropriate length scale, C 0 is the concentration of the component in the infiltrating fluid, Ceq is the concentration of the component in the fluid at equilibrium with the solid, \|/eq is the initial concentration of the reaction product in unreacted rock and \|/0 is the concentration of the reaction product in rock in equilibrium with the infiltrating fluid. Where the velocity of the reaction front is slow compared with that of the fluid, the term 0.5, the latter showing two sets of decomposition peaks in DSC curves. Although powder X R D confirms the amorphous nature over the entire composition range, 0 < x < 1, characterization by TGA/DSC coupled with FTIR suggests heterogeneous (pseudo two phase) behavior for samples with 0.5 < x < 1 (Radha et al. 2012). All these data support the coexistence of a mixture of A M C with an amorphous material with composition near x = 0.5 for Mg-rich bulk compositions with x > 0.5. The length scale of this phase separation may be higher than the coherent domain size and short range order interrogated by the X-ray pair distribution functions (PDF) as the PDF data are not conclusive in determining the existence of heterogeneity (Radha et al. 2012).
Thermodynamics
of
81
Carbonates
m Amorphous particles
Nucleatìon clusters
or á f k
©
3m y
Temporary Stabilization
Mesoscale assembly
Crystal with compie* shaps
\
Amplification
Dnented Attachement
Single crystal
Iso-oriented crystal
Masocrystal:
Fusion
Fusion
Figure 8. Schematic representation of (a) classical crystal nucleation and growth of a single crystal via primary nanoparticle, (b) single crystal formation from iso-oriented crystal due to oriented attachment of primary nanoparticles (c) mesocrystal formation either from a polymer or additive covered primary nanoparticles or directly from pure nanoparticle and (d) formation of amorphous particles and its transformation to complicated morphologies. Reprinted with permission from Colfen and Antonietti (2008). Copyright 2008 John Wiley & Sons. Table 2. Calorimetrie data for a m o r p h o u s carbonate phases and corresponding water content per M C 0 3 . Reproduced with permission of Elsevier Science f r o m Sel et al. (2012). Copyright © 2 0 1 2 Elsevier Science.
Amorphous MC03-hH20
Water f r o m T G A (n) (mol)
Enthalpy of Crystallization (AW ( ,, J (kJ/mol)
Ionic/crystal radius M 2 + (nm)
Refs.
MnC0 3 -»H 2 0 (AMNC)
1.2 ± 0 . 0 4
-32.44± 0.71
0.083 (0.097)
[1]
C a C 0 3 » H 2 0 (ACC)
1.13 - 1.58
-17 ± 1 to-24 ± 1
0.1 (0.114)
[2]
MgC0 3 -»H 2 0 (AMC)
1.28
-35.8 ± 1.2
0.072 (0.086)
[3]
FeC0 3 -»H 2 0 (AFC)
1.75
-37.8 ± 9 . 8
0.078 (0.092)
[4]
The values in () is crystal radius. References: [1] Radha and Navrotsky (in prep); [2] Radha et al. (2010); [3] Radha et al. (2012); [4] Sel et al. (2012)
T h e e n t h a l p i e s of c r y s t a l l i z a t i o n in t h e h o m o g e n e o u s r e g i o n v a r y r o u g h l y l i n e a r l y w i t h x a n d r a n g e f r o m - 1 0 . 6 ± 0 . 8 to - 1 6 . 9 ± 0 . 6 k J / m o l . I n t e r e s t i n g l y , t h e c r y s t a l l i z a t i o n e n t h a l p y measured for the biogenic spicule sample containing about 5 m o l % M g C 0 3 extracted f r o m C a l i f o r n i a p u r p l e sea u r c h i n l a r v a l s p i c u l e s ( - 1 3 . 3 ± 0 . 5 k J / m o l ) f a l l s in t h i s r e g i o n ( R a d h a et al. 2 0 1 0 ) . T h e o v e r l a i d h i s t o g r a m in F i g u r e 10 s h o w s t h e n u m b e r of r e p o r t e d b i o m i n e r a l s c o n t a i n i n g d i f f e r e n t a m o u n t s of M g ( A d d a d i et al. 2 0 0 3 ) . It c a n b e s e e n that t h e M g c o n t e n t in b i o m i n e r a l s v a r i e s b e t w e e n x = 0 a n d x = 0 . 3 c o i n c i d e s w i t h t h e l o w m e t a s t a b i l i t y p o r t i o n of t h i s r e g i o n ( 0 . 0 2 < x < 0 . 2 0 ) ( B e n i a s h et al. 1 9 9 7 ; A i z e n b e r g et al. 2 0 0 2 ; A d d a d i et al. 2 0 0 3 ) . T h i s o b s e r v a t i o n s u g g e s t s that t h e m a r i n e o r g a n i s m s m a y select t h i s s i n g l e - p h a s e l o w m e t a s t a b i l i t y p a t h w a y f o r c a l c i f i c a t i o n b y c o n t r o l l i n g t h e M g u p t a k e in t h e e a r l y s t a g e s of
82
Radila &
Naiirotsky
Figure 9. Energetic stabilities of different calcium carbonate phases with respect to calcite. The enthalpy values of vaterite and aragonite are taken from Wolf et al. (2000) and Wolf et al. (1996) respectively. Reprinted from Radha et al. (2010) with permission of the National Academy of Sciences, USA. Copyright © 2010 National Academy of Sciences, USA.
Phases Table 3. Experimental and computational energetic data on various CaC0 3 phases with respect to calcite. Modified from Wang and Becker (2012). ACC +26.6 +28.5
Disordered Vaterite
Ordered Vaterite
Aragonite
Method
Refs.
20.7
9.7
-3.0
M D simulations M D simulations
-4.8
M D Force fields
[1] [1] [2]
16.39 17.54 19.8
5.0 2.95 5.72 5.8
12.67
M D Force fields
[2]
8.6 0.996 12.69 12.19 -4.9 +9.3
DFT (DMol3) plane wave DFT (CASTEP) plane wave DFT (CASTEP) ultrafast pseudopotential DFT (VASP and GGA-PAW) DFT (SIESTA) linear scaling
[1] [1] [1] [1] [2]
Thermoanalysis Anhydrous ACC by calorimetry More disordered ACC by calorimetry Less disordered ACC by calorimetry Thermal analysis Dissociation reactions Calorimetric and Potentiometrie methods
[3] [4] [4] [4] [5] [6] [7]
+15.0 +14.3 +22.7 +17.2 +12.3 6.2 3.4
1.2 -0.4
[2]
References: [1] Wang amd Becker (2009, 2012); [2] Raiten et al. (2010); [3] Wolf and Gunther (20011; [4] Radha et al. (2010); [5] K o g a e t a l . (1998); [6] Plummer and Busenberg (1982); [7] Wolf et al. (1996, 2000)
biomineralization. An earlier study (Wang et al. 2009) suggests that the electrostatic potential around carboxyl groups in proteins regulates Mg uptake, probably by assisting the dehydration of the Mg 2 + ions, i.e., by assisting the kinetics of Mg 2 + incorporation. Calorimetric studies suggest that there is an additional thermodynamic driving force to the incorporation of Mg 2 + into biominerals. It is also interesting that the materials with x < 0.20 crystallize more readily than those with higher Mg content. The ability to tune crystallization rates on time scales of hours to days (rather than weeks to months) may be another reason organisms control the Mg content of the amorphous carbonate precursors to be in this range. The water content appears to influence the enthalpies of crystallization and hence the metastability of samples. The enthalpies of crystallization of more hydrated samples deviate
Thermodynamics
of
83
Carbonates
Biomineral composition
4) >
20
re ~ —
15
O) > a. re .c C LU
«
0
0.0
0.2
0.4
0.6
0.8
1.0
Mg/(Mg+Ca) Figure 10. Energetic stabilities of amorphous Ca^Mg^.COj-iiHjO (0 < .v < 1) phases with respect to calcite and magnesite. Open triangles are for homogeneous single phase region and filled triangles represent potentially heterogeneous two phase region. The inset is the histogram of number of binominals as function of their M g contents (Addadi et al. 2003). The values of disordered dolomite and dolomite are taken from Navrotsky and Capobianco ( 1987) and Chai et al. ( 1995). The number on each symbol is the water content of corresponding amorphous phase. Reprinted from Radha et al. (2012) with permission from Elsevier Science. Copyright © 2012 Elsevier Science.
from the linear trend to less exothermic enthalpies of crystallization in both regions, which indicates lower energetic metastability of more hydrated amorphous materials. The most hydrated samples occur at x = 0.47 to 0.51 and have the least exothermic enthalpies of crystallization in the whole system (see Fig. 10). The Mg/Ca ratio in this range is similar to that in dolomite. This suggests that this region, having lesser metastability, could be an amorphous precursor to dolomite formation. The more exothermic crystallization enthalpy of AMC compared to ACC suggests that AMC is more metastable than ACC. Nevertheless AMC is much more persistent, surviving for a year or more under ambient conditions without crystallizing (Radha et al. 2012). This may be a kinetic effect related to the difficulty of dehydrating the first coordination sphere of the Mg 2+ ion. The low temperature decomposition of AMC (432 °C) without any sign of crystallization indicates that AMC is thermally less stable than ACC (771 °C). Magnesite, the stable crystalline form of MgC0 3 , appears to form only under high temperature synthesis conditions either by hydrothermal methods or by reaction of MgO with C0 2 . Hence AMC does not appear to be a precursor phase to magnesite and the possible significance of AMC formation in carbonate mineralization under various conditions may require more detailed investigation. The energetics of the amorphous iron carbonate (AFC) precursor formed during siderite precipitation has been measured by high-temperature oxide-melt solution calorimetry (Sel et al. 2012). The synthesis, isolation and characterization of AFC require maintenance of anaerobic condition (in nitrogen glove box) to prevent Fe 2+ oxidation and probably for this reason there is not much report of synthetic AFC in the literature. Thermal decomposition of AFC on heating is complex and the oxide phases formed at the end of decomposition are different in inert and oxidizing conditions. In an inert Ar atmosphere, the DSC profile of AFC shows an endothermic
84
Radila &
peak near 120 °C due to dehydration and multiple thermal events at 160-325 °C due to simultaneous crystallization (exothermic) and decomposition (endothermic) of F e C 0 3 to FeO and C 0 2 . At higher temperature, FeO further reacts with C 0 2 (exothermic) to form F e 3 0 4 or F e 2 0 3 and CO gas. Thermal decomposition of AFC in air or oxygen leads to formation of hematite (Fe 2 0 3 ) (for more details, see Sel et al. 2012).
Nazirotsky 140 120 100 "o g 1 VI
•s a
80
• •
A
: •
•
A
A •
AHds (amorphous FeC0 3 .nH 2 0)
60 40 20 0 -20
AHds (amorphous FeC0 3 ) • •
A A
° A
O
[f>
è • A Calorimetric measurements have -40 been done on several freshly prepared io samples of AFC to minimize the effects 2+ 3+ of oxidation (Fe to Fe ), amorphous Time (h) (after synthesis) phase short range structure evolution, Figure 11. The ethalpies of drop solution AH i s data of and crystallization to siderite. The scatamorphous iron (II) carbonate (AFC) as a function of ter in the calorimetric data measured time after their synthesis for three different samples. within 8-9 h after the synthesis (see Fig. AH is (amorphous F e C 0 3 ) is for anhydrous sample cor11) is reasonable considering the sample rected for water determined from the TGA/DSC as handling challenges of these highly air physically absorbed water. Reproduced with permission of Elsevier Science from Sel et al. (2012). Copyright © sensitive samples. The exothermic crys2012 Elsevier Science. tallization enthalpy (-37.8 ± 9.8 kJ/mol) of AFC suggests that amorphous F e C 0 3 (AFC) precursor provides a low energy pathway for crystallization of siderite. AFC is energetically similar to amorphous M g C 0 3 (AMC) and more metastable than amorphous C a C 0 3 (ACC). AMC is more persistent than either ACC or AFC, despite being more metastable. This may relate to strength of hydration.
The crystallization energetics of amorphous manganese carbonate (AMNC) has been measured by acid solution calorimetry (Radha and Navrotsky 2013). XRD studies suggest that the dry AMNC slowly crystallizes to rhodochrosite, M n C 0 3 , after 40 days. The thermal decomposition reactions of AMNC are analogous to those of AFC. In oxidative conditions, M n C 0 3 undergoes decomposition with multiple steps and forms various high oxidation state phases such as M n 0 2 , M n 2 0 3 and M n 3 0 4 at different temperatures. In an inert atmosphere, it decomposes in a single step to MnO and C 0 2 . At higher temperature, the liberated C 0 2 if not flushed out, further reacts with MnO to form M n 3 0 4 and CO. Consequently, the TG-DSC profile of AMNC in argon first shows an endothermic DSC peak (30-200 °C) corresponding to dehydration. The DSC profile for the second step (200-420 °C) shows multiple thermal events with simultaneous crystallization (exothermic) and decomposition (endothermic) occurring at ~ 400 °C. The crystallization enthalpy for freshly prepared AMNC is -32.44 ± 0.71 kJ/mol. This exothermic crystallization of AMNC suggests that the amorphous phase is metastable and could provide a low energy pathway for crystalline rhodochrosite mineralization similar to other carbonate systems with Ca, Mg and Fe cations. The formation of common carbonates in natural environments occurs in far from equilibrium conditions and the various metastable amorphous and nanoparticulate precursor phases may control the mineralization process (Morse and Casey 1988). Calorimetric studies show that amorphous carbonate precursors provide a low energy crystallization pathway in the (Ca-Mg-Fe-Mn)-C0 3 system. To constrain the driving force for crystallization of carbonates in these systems, we compare the crystallization energetics of amorphous Ca, Mg, Fe and Mn carbonates in Table 2. The crystallization enthalpies become less exothermic with increase in
Thermodynamics
of
Carbonates
85
ionic radius of the cations. The ionic size driven crystallization enthalpy trend in (Ca-Mg-FeMn)-C0 3 system suggests that the crystallization of amorphous phases with smaller cations may be energetically more favored than that for larger cations. A study on patterns of structure property relationships in carbonate minerals reported many cation-size dependent phenomena in crystalline isostructural carbonates (Railsback 1999). The physical (hardness, and density) and spectroscopic (shifts in IR peak positions) properties of rhombohedral carbonates showed a linear dependency on the cation radius and degree of hydration. Such trends are mainly attributed to variation in metal-oxygen bond lengths (Railsback 1999). Geochemical properties such as solubility and distribution coefficients appear to be controlled by the degree of cationic fit in the crystal structure (Railsback 1999). The comparative study on amorphous carbonates illustrates the influence of cationic radius on thermodynamic properties of carbonate formation via crystallization processes. A critical understanding of these qualitative trends would help in developing a predictive capability for carbonate mineralization processes based on their physical properties Nanophase carbonates and surface energies Crystals of the same mineral grow into different shapes and morphologies under different synthetic and natural growth environments. Thermodynamic equilibrium under different conditions drives crystal growth to a minimum free energy state through wide combinations of crystal facets with different surface energies. These surface energies can be affected by the presence of inorganic, organic, and polymeric species in solution. In addition, deviations from equilibrium are common. A detailed discussion of the energetics of various carbonate crystal facets is beyond the scope of this review. When fine-grained carbonates are precipitated rapidly from aqueous solution at relatively low temperature, equilibrium among various growing faces may not be attained or maintained. The surface energies of phases can be determined by both computation and experimental techniques (see Tables 4, 5 and references therein). The computed surface energy values vary depending on the modeled crystal facet, the surface end groups, and the details of the calculation (see Table 4 and references there in). We concentrate here on surface energies measured by solution calorimetry on nanoparticle assemblages, having a range of particle sizes but a well-defined average surface area and showing some average distribution of exposed crystal faces determined by the precipitation conditions. Such materials may in fact be representative of many natural precipitation environments. Calorimetric studies have demonstrated that nanoscale intermediates can control phase formation and morphology by reversing the order of thermodynamic stability of polymorphs (Navrotsky 2004, 2009, 2011). These size induced crossovers in the free energies of the polymorphs at the nanoscale show a correlation between increasing metastability and decreasing surface energy (Navrotsky 2001, 2004). The free energy crossovers due to increasing specific surface area (decreasing particle size) combined with small energy differences between bulk polymorphs have been exhibited by several oxide systems including alumina, titania, zirconia iron oxides and manganese oxides (McHale et al. 1997; Ranade et al. 2002; Pitcher et al. 2005; Levchenko et al. 2006; Navrotsky et al. 2008, 2010; Radha et al. 2009). Calcium carbonate exists in five different crystalline polymorphs at ambient pressure as calcite, aragonite, vaterite (anhydrous phases), monohydrocalcite and ikaite (hydrated phases), in addition to various amorphous forms. Thermodynamic stability crossovers in calcium carbonate system at nanoscale regimes would have tremendous geologic and technological implications, including geological sequestration of C0 2 . Calcium carbonate precipitation in a geologic C 0 2 repository occurs in confined micro/nanopores of the sandstone aquifer and the stability crossovers could alter the dominant calcium carbonate phase precipitated under such conditions. Also the influence of the increased pressures, temperatures, and ionic strength of the environment could alter the precipitation pathway.
Radha & Navrotsky
86
Table 4. A summary of computed calcite surface energies. Reproduced with permission from Forbes et al. (2011). Copyright © 2011 Elsevier Science.
Calcite Crystal Face
Energy of hydrous surface (J/m2)
10l4
0.288
0.86
Kvamme et al. (2009)
0.232
0.863
Hwang et al. (2001)
0.387
0.59
Kerisit et al. (2003)
0.14
0.60
Duffy and Harding (2004)
0.16
0.59
de Leeuw and Parker (1998)
0.59
Titloye et al. (1998)
1.50
Kvamme et al. (2009)
1.37
Hwang et al. (2001)
IOTO
10l2
Energy of anhydrous surface (J/m2)
0.778
Reference
0.95
Kerisit et al. (2003)
1.23
Titloye et al. (1998)
0.75
0.97
de Leeuw and Parker (1998)
0.97
Titloye et al. (1998)
0.37 or 0.44*
1.06 or 1.25*
Duffy and Harding (2004)
0.75 or 1.06*
Bruno et al. (2008)
1120 0.43
2.62
Braybrook et al. (2002)
2.65
Massaro et al. (2008)
1.39
Titloye et al. (1998)
1.39
de Leeuw and Parker (1998)
* The lower value corresponds to a surface terminated by carbonate groups and the higher value is a surface terminated by calcium ions.
Table 5. A summary of measured calcite surface energies by different experimental methods. Reproduced with permission from Forbes et al. (2011). Copyright © 2011 Elsevier Science.
Surface energy (J/m2)
Method
0.085
Homogeneous nucleation
Sohnel and Mullin (1982)
0.064
Heterogeneous nucleation
Lioliou et al. (2007)
0.032-0.035
Heterogeneous nucleation on polymers
Dousi et al. (2003), Gomez-Morales et al. (2010)
0.033
Heterogeneous nucleation
Manoli and Dalas (2002)
0.23
Cleavage experiments
Oilman (1960)
0.347 ± 0.045
Cleavage technique
Gupta and Santhanam (1969)
0.32
Subcritical cracking
Roayne et al. (2011)
0.098
Contact angle measurements
Janczuk et al. (1986)
0.072
Contact angle measurements
Okayama et al. (1997)
0.54-0.76
Heat of immersion
Goujon and Mutaftschiev (1976)
0.762 ± 0.002
Heat of immersion
Wade and Hackerman (1959)
Reference
Thermodynamics
of
Carbonates
87
Surface energy data for calcite by both experimental and computational methods show a wide distribution covering several orders of magnitude (see Tables 4 and 5). Generally, calculated surface energies for other oxides agree with the measured values within 10-50%. Computed values are based on the ideal surface, while real surfaces have complex and heterogeneous structures with edge sites and defects (Navrotsky 2009,2011). It is possible that the less directly determined experimental surface energy values for calcite are low because they are derived based on classical homogeneous and heterogeneous nucleation theory, rather than measured directly (see Table 5). The initial solid formed may be different (e.g. prenucleation clusters leading to amorphous precipitates). The surface energy of such metastable precursor phases (ACC or vaterite) are expected to be lower than that of the stable calcite phase. Furthermore, the induction times used in the surface energy determinations may not correspond to those for the formation of calcite. A similar concern was raised earlier in deriving the interfacial surface tension of calcite based on nucleation experiments (Christoffersen et al. 1991). To determine the effect of particle size on thermodynamic stability in carbonate systems, the energetics of nanophase calcite and nanophase manganese carbonate phases were measured by acid solution and water adsorption calorimetric techniques (Forbes et al. 2011; Radha and Navrotsky 2013). A critical assessment of three different characterization techniques (XRD, TEM and BET methods) for particle size analysis for calcite phases suggests that the surface area measurement using the BET method is best suited for use in surface energy determination of calcite type structures (Forbes et al. 2011). The enthalpies of solution (AH so \) for the nanophase and bulk carbonate phases were measured by acid solution (5 M HC1) calorimetry. The surface energy for a given surface area is the excess enthalpy of nanophase with respect to bulk obtained after subtracting the contribution of adsorbed water from enthalpies of solution (AHso]n) and can be written as A H s o l - b u l k = A H s o l - c o n nano + S A
X J
2
where SA = surface area of nanocalcite (m /mol); y = surface enthalpy (J/m2) Solution enthalpies are corrected for physically (Ai/soi.COIi-physi) o r chemisorbed (AZisoi-con-chemi) water contents and plotted against the surface area obtained from BET analysis. The negative of the slopes of the linear fits give the surface enthalpies for hydrous and anhydrous surfaces. These surface enthalpy values are good approximations to the surface energy and surface free energy (surface tension) since the contribution of excess volume (PV term) and surface entropy (TAS term) are expected to be small (Navrotsky 2009). Figure 12 shows surface energy plots of hydrous and anhydrous surfaces of nanophase calcite and manganese carbonate. From the calorimetric data, the surface energies of hydrous and anhydrous surfaces are 1.48 ± 0.21 and 1.87 ± 0.13 J/m 2 for calcite (Forbes et al. 2011) and 0.64 ± 0.08 J/m 2 and 0.94 ± 0.12 J/m 2 for nano manganese carbonate (Radha and Navrotsky 2013). The measured values are generally larger than predicted from computational models (0.14 to 0.77 J/m 2 for hydrous and 0.59 to 2.65 J/m 2 for anhydrous surface) for idealized calcite surfaces (de Leeuw and Parker 1998; Titloye et al. 1998; Hwang et al. 2001; Braybrook et al. 2002; Kerisit et al. 2003; Duffy and Harding 2004; Bruno et al. 2008; Massaro et al. 2008; Kvamme et al. 2009) probably because the synthetic samples contain a range of planes and defect structures. Studies of surface energies for aragonite and vaterite phases are in progress. Given the small differences in energy between the polymorphs, there is a good possibility that stability crossovers of the nanoscale may exist for calcium carbonate system as well as for oxide minerals.
88
Radila &
Nazirotsky
Nano-calcite
Nano-MnC0 3 u 1"U-20 1o Ifl -22 '¡ji Ì -24 CL
ffl
IS •o 0J -26 Ì -28 u o IIfl -30
Surface energy (hydrous) = 1.48 ±0.21 J/m 2
O
Surface energy (hydrous) = 0.64 ±0.08 J/m 2
•
4000 Surface area (m /mol|
Surface area (m ,'moil
Surface energy (anhydrous) = 0.94 ±0.12 J/m 2
500
1000
1500
2 Surface area (m /mal]
2000
2
Surface area |m /riiol)
Figure 12. Surface energy plots of hydrous and anhydrous surfaces of nanophase calcite and manganese carbonate phases. Reprinted with permission of Elsevier Science from Forbes et al. (2011). Copyright © 2011 Elsevier Science.
CRYSTALLINE DIVALENT CARBONATES Thermodynamics of rhombohedral and orthorhombic carbonates Crystalline anhydrous metal carbonates, M(II)C0 3 exist either in rhombohedral (calcite type) or orthorhombic (aragonite-type) structure depending on the cation size (Reeder 1983). Divalent cations smaller than Ca2+ form rhombohedral carbonates with six coordinated cations, whereas cations bigger than Ca 2+ crystallize in the orthorhombic aragonite structure with nine coordinated cations. Ca2+ has an intermediate size and exists in both structural forms as calcite and aragonite in addition to a hexagonal vaterite phase (Reeder 1983; Ribbe et al. 1987). The calcite-type rhombohedral structure consists of alternate layers of Ca atoms (A) and carbonate ions (B/C) (Fig. 13). The flat carbonate ions in successive layers stack in reverse (ABAC) orientation to facilitate octahedral co-ordination of cation with six oxygens from different carbonate anions. Consequently, the rhombohedral unit cell parameter along the stacking direction is the height of six layers of carbonate ions. In the aragonite-type orthorhombic carbonate structure; the layer stacking is pseudohexagonal due to nonplanar metal layers having out of plane cation displacements (around ± 0.005 nm) and corrugated carbonate layers with reverse orientations (Speer 1983). This facilitates the formation of 9-coordinated metal cations having six M-O bonds with oxygens at the edges of 3 carbonate groups and three M-O bonds with three corner oxygens from three separate carbonate groups (see Fig. 13).
Thermodynamics
of
Carbonates
89
rmw Figure 13. The crystal structures of rhombohedral (calcite-type) and orthorhombic (aragonite-type) carbonates. From http://www.ciystal.unito.it/prtfreq/jmolJitml.
Figure 14 shows the free energy and the solubility data for some common divalent metal carbonate minerals as a function of cation radius (Railsback 1999). For rhombohedral carbonates, the thermodynamic stability generally increases (the free energy of formation from ions at 25 °C becomes more exothermic) with increase in cation radius, although calcite is an exception. The most common rhombohedral minerals, calcite (with largest cation, Ca2+) and magnesite (smaller Mg 2+ cation) have lower stability and hence are more soluble. The orthorhombic carbonates show a similar trend with phases having intermediate radius being thermodynamically more stable than the end members of the series, aragonite (CaC0 3 ) and witherite (BaC0 3 ). This trend in thermodynamic stability seems to have direct structural correlation with the cation coordination geometries. The distorted 6-fold and 9-fold coordination geometries due to poor fit of largest and smallest cations in the rhombohedral and orthorhombic structures lower the thermodynamic stability. The most abundant sedimentary carbonate minerals calcite (CaC0 3 ), aragonite (CaC0 3 ), magnesite (MgC0 3 ) and dolomite (CaMg(C0 3 ) 2 ) fall into the lower stability region relative to aqueous solution and hence are more reactive. The large cation aragonite carbonates are far less soluble. The ordered mixed cation carbonates, dolomite [CaMg(C0 3 ) 2 ], ankerite [Ca(Fe,Mg,Mn)(C0 3 ) 2 ] and alstonite [BaCa(C0 3 ) 2 ] are more stable than their respective end members. Calcite-aragonite phase transition at high pressure and orientational disordering in calcite at high temperature The calcite-aragonite equilibrium is temperature and pressure dependent and has been studied extensively due to its importance in petrology and geo-thermobarometry (Carlson 1983; Essene 1983). Though these phenomena become important at pressures and temperatures above those envisioned for C0 2 sequestration, they shed light on issues of structure and bonding relevant to carbonate behavior. Pressure extends the carbonate stability field to higher temperature by disfavoring C0 2 evolution. The pressure-temperature (P-T) calcite-aragonite equilibrium curve calculated using thermodynamic data from both direct and indirect free energy measurements (Redfern et al. 1989) shows a significant change in slope between low and high P-T regimes (see Fig. 15). These changes were initially attributed to a first-order phase transition within the calcite phase (Cohen and Klement 1973). However, comprehensive structural studies by high temperature XRD and neutron scattering indicated gradual orientation disordering in calcite leading to R3c to Rim transition (Markgraf and Reeder 1985; Dove and Powell 1989). A combined low temperature heat capacity and high-temperature transposed-temperature drop calorimetric study has been used to measure the energetic change associated with the
90
Radha
LEGEND
-75
_ ^
1
Qrlhorhombic .,-.'•: Win dov/
1
-•31 _=? i«à 2
Otavite Ankerite
-65
^
Hexagonal Cartjonatns Hydrous Carbonatas;
J=thom bohadra ohadra[ Carbii-a^s Window
c: _o „ ra " 9 - 7 0 E E
O ^
Gâspé/fs -30 4 I—
*
O - 1 0 Eo
cmrttí (MgCOg*3HgO) , r,
,
0 8
0.9
1.0
1.1
1,2
1.3
Cation Radius (A) Figure 14. The free energy and the solubility data for common divalent metal carbonate minerals as a function of cationic radius. ATsp is the solubility product, and represents the equilibrium constant for dissolution or precipitation. Originally published in Railsback (1999) and reprinted with permission. Copyright © 1999 by Springer Science.
R3m 1 2 00
400
200
10
Pressure
IS
20
k bar
Figure 15. The phase diagram of calcite-aragonite. Thick lines are the phase boundary calculated for the Ric to Rim disorder transition and thin lines are the experimental data (Jamieson 1953; Simmons and Bell 1963; Crawford and Fyfe 1964; Johannes and Puhan 1971; Zimmermann 1971; Cohen and Klement 1973; Irving and Wyllie 1973). Reprinted from Redfern et al. (1989) with permission. Copyright © 1989 by Springer Science.
Thermodynamics
of Carbonates
91
orientational order-disorder transition in order to understand its implication for the calcite/ aragonite phase boundary behavior (Redfern et al. 1989). The deviation of the calorimetrically measured enthalpy of high temperature calcite phase {Rim) between 973 K and 1325 K from the extrapolated low temperature phase (R3c) heat capacity data gives the enthalpy for the orientational order-disorder transition (6.9 ± 1.1 kJ/mol) (Fig. 16). The calculated phase diagram based on excess enthalpy analyzed by Landau theory for tricritical phase transition is in agreement with the experimental observations. This supports the change in slope of the calcite/aragonite phase boundary is due to the R3c to Rim transition in calcite.
Temperature
K
Figure 16. Calorimetrie data for the enthalpy of calcite between 9 0 0 K and 1350 K (solid line) plotted with extrapolated low temperature heat capacity (dashed line) data from Jacobs et al. ( 1981). Taken from Redfern et al. ( 1989) with permission. Copyright © 1989 by Springer Science.
Vaterite Vaterite is thermodynamically the least stable anhydrous polymorph of calcium carbonate under ambient conditions and is generally found in low temperature environments: biological systems, sediments, cements and as an intermediate phase during calcite synthesis (Plummer and Busenberg 1982; Mann et al. 1988; Friedman et al. 1993; Falini et al. 1998; Friedman 2005; Hu et al. 2010; Natoli et al. 2010). Vaterite transforms to calcite at room temperature on aging and on heating at 693-753 K. However, biomolecules or organic additive templates are shown to stabilize synthetic vaterite under ambient conditions (Pach et al. 1990; Kanakis and Dalas 2000; Kanakis et al. 2001; Lee et al. 2005; Han et al. 2006; Pouget et al. 2010). It is not clear whether such stabilization is purely kinetic or has a thermodynamic basis arising from adsorption of organics. Most vaterite samples are very fine grained (nanophase). There are reports of at least three different types of vaterite structures, (a) disordered hexagonal (P6 3 / mmc), (b) ordered superstructures (P6522) and (c) ordered orthorhombic (Pbnm) as shown in Figure 17 (Kamhi 1963; Medeiros et al. 2007; Wang and Becker 2009, 2012; Ren et al. 2013). The hexagonal structure of vaterite has alternate layers of Ca ions and carbonate ions similar to rhombohedral carbonates. However the carbonate layers in vaterite are disordered with C 0 3 planes orienting perpendicular to the 001 stacking direction. The presence of stacking faults and their ordering in the (001) plane could lead to superstructure formation. The formation of such superstructure established from ab initio calculations and molecular-dynamics (MD)
92
Radila &
Naiirotsky
Figure 17. Vaterite models with (a) rhombic (b) hexagonal and (c) ordered hexagonal crystal structures. Reproduced with permission from Ren et al. (2013). Copyright © 2013 Elsevier Science.
simulations (Wang and Becker 2009) is found to be consistent with NMR results (Michel et al. 2008). The ordered orthorhombic structure was proposed recently based on X-ray diffraction data and is 3 to 10 kJ/mol higher than calcite, and the experimentally measured values fall within the computed range (3.4 kJ/mol, (Wolf et al. 1996, 2000) and 6.2 kJ/mol (Plummer and Busenberg 1982). A possible reason for this difference in experimental values could be the existence of a variable degree of disorder in the experimental samples. The computed enthalpy of disordered vaterite is 11-14 kJ/mol above that of ordered vaterite and 16-21 kJ/mol higher than calcite (Wang and Becker 2009, 2012 and also see Table 3). In contact with aqueous solution, the initial vaterite phase is thought to evolve from an amorphous precursor (ACC) phase with orientationally disordered carbonate ions. The degree of disordering in vaterite seems to have a large effect on the relative stability of vaterite with respect to ACC, aragonite, and calcite as indicated by large differences in their energetics. The energy differences among the three ordered crystalline polymorphs (ordered vaterite, aragonite, and calcite) are found to be small (Plummer and Busenberg 1982; Wolf et al. 1996, 2000; Wang and Becker 2009, 2012; Raiteri et al. 2010). Small energy differences between ACC and disordered vaterite are also predicted (Koga et al. 1998; Wolf and Gunther 2001; Radha et al. 2010; Wang and Becker 2009, 2012) (Fig. 18).
152-304 kJ/mol
Figure 18. Enthalpies and activation energies for phase transitions among different calcium carbonate polymorphs with respect to calcite as reference (thin dashed line). Long, thick lines are experimental values, short, thick lines are theoretical calculations and the curved lines with arrows are the activation energy of the transition. Reproduced with permission from Wang and Becker (2012).
0 —
calcite
vaterite(ord)
amorphous
Thermodynamics
of
93
Carbonates
BINARY DIVALENT METAL CARBONATE SYSTEMS The binary carbonate systems (MCO3-NCO3) form solid solutions with calcite, orthorhombic and dolomite structures. They are completely or partially miscible. The miscibility depends on the differences between the cation sizes of the end members of the binary system for calcite-type structures (see Table 6) and on the temperature of formation. Thermodynamics of formation and mixing properties determines the phase formation in these binary systems. Calorimetric measurements of energetics have revealed interesting mixing behavior in some of the binary carbonate systems and are discussed below. Table 6. Cation size differences between the end members of the binary system Reproduced with permission from Reeder (1983).
Complete miscibility cation pairs
Limited miscibility cation pairs
M2+ - N2+
Ar (nm) in VI coordination
M 2+ - N2+
Ar (nm) in VI coordination
F e - Mg Ca-- Cd Mg - C o F e - Mn Mg - M n
0.006 0.005 0.003 0.005 0.011
Ca- Mg Ca - F e Ca- Mn Cd- Mg Ca-• Co Ca -Ni
0.028 0.022 0.017 0.023 0.026 0.031
CaC0 3 -MgC0 3 C a C 0 3 - M g C 0 3 is an important binary system in several geochemical settings involving sedimentary, metamorphic, marine, and mantle processes as well as in biological systems (Bischoff et al. 1983; Mackenzie et al. 1983). This binary system has limited miscibility with disordered rhombohedral C a C 0 3 - M g C 0 3 solid solution interrupted by the dolomite phase field around the midpoint composition and a miscibility gap in both the Mg-rich and Ca-rich regions (see Fig. 19) (Graf and Goldsmith 1955; Goldsmith and Heard 1961; Bischoff et al. 1983; Mackenzie et al. 1983; Walter and Morse 1984). Calorimetric studies of magnesian calcite and calcian dolomite have shown different energetic trends (Navrotsky and Capobianco 1987). In the Ca-rich region, Mg substitutes up to 25 mol% M g C 0 3 to form calcite-type solid solution in low-temperature inorganic and biogenic environments. The biogenic magnesian calcites seem to have greater local disorder and show subtle differences in their crystallographic parameters and vibrational spectra compared to their synthetic analogues (Bischoff et al. 1983). Several studies on magnesian calcites have reported lowering of stability and increase in reactivity with increase in Mg substitution (Bischoff et al. 1983; Mackenzie et al. 1983; Navrotsky and Capobianco 1987; Busenberg and Plummer 1989). However, the calorimetric measurements on synthetic magnesian calcites, Ca!_ x Mg x C0 3 for x < 0.12 show a small exothermic enthalpy of mixing (see Fig. 20) as opposed to the expected destabilization (hence positive heats of mixing) due to cation size mismatch (Navrotsky and Capobianco 1987; Chai et al. 1995). Gordon and Greenwood (1970) suggested positive deviations from ideal activity-composition relations and hence positive deviations in free energies at high temperature near 700 °C. The combination of positive excess free energies and negative enthalpy of mixing suggest the negative excess entropy of mixing for this system. This could probably associated with some sort of structural ordering such as clustering of Mg that produces a favorable lowering of the enthalpy but a loss of entropy in synthetic magnesian calcites equilibrated at 700 °C. The random stacking of Mg-
94
Radila &
Nazirotsky
— iQ) ci) CL E cu
60
Mol % MgC03 Figure 19. Schematic of C a C 0 3 - M g C 0 3 T-X diagram with open circles showing the Ca-rich dolomite region after Goldsmith and Heard (1961). Reprinted with permission from University of Chicago Press, USA. Copyright © 1961, University of Chicago.
Figure 20. Enthalpy of mixing calculated from calorimetric data in magnesiacn calcites ( C a ^ M g ^ C O , ) with a data fit using ideal mixing with equations A = X( 1-X) (-20.37 ± 13.39) (solid line) and A H ^ = X (1-X) [-25.65 ± 5.94 + (88.49 + 49.71)X] (dashed line). Reprinted with permission from Navrotsky and Capobianco (1987).
0.00
0.04
008
0.12
MgCOg rich layers between Ca layers rather than random substitution of Mg for Ca could also lead to energetically stable Mg-calcites. FeCO,-MgCO, The mixing of Fe2+ and Mg 2+ cations in octahedral sites is a common occurrence in sedimentary and metamorphic carbonate minerals. For FeC0 3 -MgC0 3 , the mixing property studies suggest the formation of a complete solid solution (Rosenberg 1963; Davidson 1994). The enthalpy of mixing for this system has been obtained by a two-step calorimetric method at 770 °C (Chai and Navrotsky 1996b). In the first step, sample was decomposed in an oxygen atmosphere and in the second step; the decomposed products (a mixture of MgFe 2 0 4 , spinel and MgO or hematite) were dissolved in lead borate solvent in air. The enthalpies of mixing for the FeC0 3 MgC0 3 system are slightly positive due to a slight mismatch in Fe 2+ and Mg 2+ sizes. Fitting
Thermodynamics
of Carbonates
95
experimental data with a regular solution model (Ai/juix = WX"FeXMg, where W = the interaction parameter, and XFe and XMg = mole fractions of FeC0 3 and MgC0 3 in the solid solution) gives the interaction parameter W as 4.44 ± 0.75 kJ/mol (see Fig. 21). The positive deviation of enthalpy from ideal mixing is a signature of probable low temperature exsolution. The phase diagram of FeC0 3 -MgC0 3 is derived from the Gibbs free energy of mixing by using a regular solution model and the ideal entropy of mixing (see Fig. 22). The miscibility gap and the spinodal curve suggest the complete solid solution in all geological environments for MgC0 3 -FeC0 3 system with possible exsolution at a very low critical temperature of about 267 K (Chai and Navrotsky 1996b).
Figure 21. Enthalpy of mixing for the F e C 0 3 - M g C 0 3 system with a fit using a regular solution parameter of 4.44 kJ/mol (solid line) and the dashed line is for ideal mixing. Reprinted with permission from Chai and Navrotsky ( 1996b). Copyright © 1996 Elsevier Science.
CaCO,-MnCO, The CaC0 3 -MnC0 3 (calcite( M g , F e ) C 0 solid solution rhodochrosite) binary system is a part of the rock-forming carbonate tetrahedron, but such carbonates are often s ¡3 found in association with other Mn S. S and Ca minerals. The minerals of this system, Mn-bearing calcites and kutnahorite with dolomite-type structure are found in deep-sea sediments (Pedersen and Price 1982). Thermodynamic studies by phase equilibrium and calorimetric methods showed positive excess X ÍFeCO,) Magnesite free energies (see Fig. 23) and complex Figure 22. Calculated phase diagram of the FeC0 3 -Mgendothermic and exothermic enthalpies C 0 3 system showing the solvus (solid curve) and the spiof mixing (see Fig. 24), which sugnodal (dashed curve). Reprinted from Chai and Navrotsky gest negative excess entropies of mix(1996b) with permission. Copyright © 1996 Elsevier Sciing supporting short range ordering ( ence. Goldsmith and Graf 1957; De and Peters 1981; Capobianco and Navrotsky 1987). For phase equilibrium calculations, the (Ca,Mn)C0 3 decomposition and Gibbs-Duhem relation were used to obtain the activity coefficients of MnC0 3 (Ymdcos) and CaC0 3 (yc a co3) as a function of composition X. The excess free energy of mixing at 700 °C is found to be positive (Fig. 23) and the enthalpy of mixing is asymmetric at 600 °C (Fig. 24). Addition of MnC0 3 destabilizes the calcite and CaC0 3 addition results in exothermic mixing with rhodochrosite without any kutnahorite as this temperature is above its stability field. This again supports negative excess entropies of mixing. The calculated and the experimentally determined solvi (De and Peters 1981) for this system are shown in Figure 25. The metastable solvus closes at 355 °C, whereas the experimental solvus extends to about 550 °C. The suppression of kutnahorite 3
96
Radha &
Navrotsky
Figure 23. Excess free energy for the calcite-rhodochrosite system as a function of composition at 700 °C. Reproduced with permission from Capobianco and Navrotsky (1987).
mol fraction M11CO3
Figure 24. Calorimetric data for 600 °C samples with least-square fit to the data. Reproduced with permission from Capobianco and Navrotsky (1987).
0,23
Q.dC
0-60
0.80
mol fraction MnCC»3
Figure 25. Phased diagram of calcite-rhodochrosite with experimental solvus (De and Peters 1981) and metastable solvus calculated from temperature-dependent excess-free-energy functions. Reproduced with permission from Capobianco and Navrotsky (1987).
fraction
MnCO;
Thermodynamics
97
of Carbonates
phase formation increases the solid solubility in this system. CaCO,-SrCO, The CaC0 3 -SrC0 3 system is an important component of solid-aqueous phase interactions in geochemistry and relevant for contaminant of migration (including that of radium) in the environment (Plummer and Busenberg 1987; Koenigsberger and Gamsjager 1990; Plummer et al. 1992). This system crystallizes in the orthorhombic aragonite structure. Thermodynamic data have been determined by solubility studies (Holland et al. 1963; Plummer et al. 1992) electrochemical (Casey et al. 1996b) and calorimetric measurements (Casey et al. 1996a). The calorimetric measurements show positive heats of mixing (Ai/juix) with a positive symmetric deviation that reaches a maximum value of 3.82 ± 0.94 kJ/mol at x = 0.5 (see Fig. 26). The A G ^ (0.0 < x < 0.9) of mixing for Ca (1 _ r) Sr r C0 3 solid solution by electrochemical measurements also shows a similar positive trend (+3.0 ± 1 . 6 kJ/mol at x = 0.7), which suggest small or zero excess entropy of mixing for this system (see Fig. 26).
t>
o
œ
2 solid solution (dolomite - ankerite join) Though there is no report of occurrence of pure ordered calcium iron carbonate, ankerite, CaFe(C0 3 ) 2 , but dolomite structured solid solution (Ca(Fe x Mg 1 _ x )(C0 3 ) 2 , 0 < x < 0.7) formed by partial substitution of Fe in Mg sites of dolomite is common in nature (Reeder 1983; Reeder and Dollase 1989; Davidson et al. 1993 and references therein). However, there are reports of existence of synthetic disordered CaFe(C0 3 ) 2 with calcite-type structure at 845 °C and 3 gPa, indicating the possibility of existence of an ordered CaFe(C0 3 ) 2 phase at lower temperature (Davidson et al. 1993). The calorimetrically measured enthalpy of formation of disordered CaFe(C0 3 ) 2 (6.98 ± 2.08 kJ/mol) (Chai and Navrotsky 1996a,b) agrees with that estimated from the solvus of the CaC0 3 -FeC0 3 system, 8.35 kJ/mol (Davies and Navrotsky 1983; Davidson et al. 1993). Increase in Fe content has opposite effects on stability of ordered and disordered phases. The ordered phase becomes more endothermic and hence less stable and the disordered ankerite becomes more exothermic and hence more stable with increasing Fe content (see Fig. 30). The enthalpy of formation of ordered dolomite CaMg(C0 3 ) 2 is -9.29 ± 1.97 kJ/mol. The enthalpy of disordering in dolomite (~ 25 kJ/mol) is larger than the disordering enthalpy in ankerite, CaFe(C0 3 ) 2 (~ 10 kJ/mol). These factors destabilize ordered CaFe(C0 3 ) 2 (Chai and Navrotsky 1996a,b).
Radha & Navrotsky
100 30.00-
20.00-
disordered
10.00-
partially disordered
-a £ e
0.00 -10.00
ordered
""1— 0.4 0.6 0.8 x in CaffcMgj .„HCCy.
—r~ 0.2
Figure 30. Enthalpy of formation of the ankerite solid solution. The circles are data from calorimetry, the squares are from lattice-energy calculations, the triangle is from (Navrotsky and Capobianco 1987), the inverted triangles are from (Holland and Powell 1990), and the diamond is calculated from the solvus. The Xs are for disordered phases calculated from solid-solution-mixing parameter (Davies and Navrotsky 1983). The Solid symbols indicate complete order; open symbols, complete disorder; and shaded symbols, partial disorder. Reprinted with permission from Chai and Navrotsky (1996a).
CARBONATE BEARING MULTICOMPONENT PHASES Thermodyanmics of hydrotalcite-type layered double hydroxides (LDH) Hydrotalcite-like compounds generally known as layered double hydroxides (LDH) are derivatives of the mineral hydrotalcite (Mg 6 Al 2 (0H) 16 (C0 3 )-4H 2 0). The structure is made up of positively charged mixed metal hydroxide layers and the interlayers of anions and water appear to influence the hydroxide layer stacking sequences (Bellotto et al. 1996; Cavani et al. 1991; Radha et al. 2005; Thomas et al. 2006). The composition is [M(II)1_tM"(III).t (0H) 2 ] t+ (A"-) t/ „-mH 2 0, where M(II) = Mg, Ca, Fe, Co, Ni, Cu, Zn; M" (III) = Al, Cr, Fe, Co and anions (A"~) = C0 3 2 - , Cl~, N0 3 ~, S0 4 2 - polyoxometallates, organic anions. The interlayer regions are labile and readily undergo intercalation/deintercalation reactions and ion exchange (Radha et al. 2005b, 2007). Hydrotalcite is white mineral containing Mg-Al cations with carbonate anions and often occurs with other minerals such as serpentine and calcite. The Ni bearing analogue, takovite [Ni 6 Al 2 (0H) 1 6 (C0 3 )4H 2 0], is found in karstic bauxites, with minerals such as carrboydite [(Ni10Cu4Al9(SO4)4(CO3)2(OH)43-7(H2O)], gaspeite [Ni0i6Mg0,3Fe2+0 !(C0 3 )] and in weathered Ni-sulfide deposits (Bish 1980). A summary of enthalpies of formation of LDH with different cations and anions, obtained from high temperature oxide melt solution calorimetry, is given in Table 7 (Allada and Navrotsky 2002; Allada et al. 2005a,b, 2006). The third law entropy based on low temperature adiabatic heat capacity measurements suggested that the entropy contribution (TAS term) in Mg-AlC 0 3 LDH is 2-3 kJ/mol at room temperature (Allada et al. 2005a) and is within the uncertainties of formation enthalpies. The formation energetics of LDH with respect to their single cation hydroxides and carbonates and water contents (see Table 7) show about 5 to 20 kJ/mol stabilization (Allada and Navrotsky 2002; Allada et al. 2005a,b, 2006; Mazeina et al. 2008). In Mg 1 _ r Al t (0H) 2 (C0 3 ) r/2 -mH 2 0, the enthalpies of formation from oxide and carbonate components change only slightly with variation in Al content (z) (Allada et al. 2005a), suggesting that the Mg/Al ratios are controlled by the activities of cations in solution and the pH rather than by big thermodynamic changes in the solid phase. Kinetic factors also
Thermodynamics of Carbonates
u O
Os o +1 +1 o 00 os
(N +1
»O m +1 +1 +1 O tm t>o O O O 00 1
° g
O +1 en rn mos i
loO -H +1 o00
rn -H +1 00 ,-H
,-H ,-H O -H -H -H +1 +1 +1 ,-H lo m Os rn m"vi
Tt t -H +1 00 os
O 00 -H +1 iO-H 00
\o o00 -H +1 00 1-H
O ffi 00 o o
O a00 o
O a (N O
O O a a 00 o o
O U ^ a o
O U ^ a o
^
CfiS
O +1 os t> Os Osl
+1 00 00 en
OCJ ^ a o ^
o
^
O U ^ a o ^
o
o
lO -H +1 loO 00
^
o
\o Tt +1 O Os "vi
^
O U ^ a o ^
o
O00 Orn \o in +1 +1 +1 +1 Os+1 +1 m O Ti- O ed "vi
m o Os +1 +1 o+1 Os o O t>o 00 Os o1
o -H +1 Oo m«ví
lo -H +1 O rn 00 O a c\ o O U ^ a o ^
o
t t t 1 1 o o o o o o U U U U U U
00 +1 in 00
O +1 00 Os "vi
101
00 00 +1 m00 00+1 Os "vi 00
OOs mos O +1 +1 Os +1 t o t>Os 00 osi oOs
os -H +1 ,-H 00 »o
00 m 00 o -H -H -H -H -H +1 +1 +1 +1 +1 os Os 00 m Tt O "vi t> o »o Tt
»o \o -H +1 O
lO
O ao t^ o ^
O U a o ^
os
o ac\ o
o oa O
o oa O
O U a o ^ < < iS 5!
O u a o
^
O U a o
o
o
^
o
Tt \o o -H +1 i-H
O -H +1 iO-H ^H
-H +1 00 i-H 00 m00
O +1 t 00 OOs
m lO -H +1 ,-H TIOS
Os O +1 tO rn os os
00 o +1 ot> rn
^H -H +1 O m
mO +1 OO o Tt
00 -H +1 os o rn m
,os_H O +1 rn "vi Tt
lO MD O +1 m rn 00 O
lO mO -H +1 00 O
lO lO Os -H +1 Os 00 t>
O 00 rn -H +1 mm O
00 MD O +1 Tt 00 Os
o O a a 00 O ^
O U a o
o
<