Epidemiologic Research on Real-World Medical Data in Japan: Volume 1 9811663750, 9789811663758
This book analyzes the development of medical big data projects in Japan.Japan is experiencing unprecedented population
183 93 3MB
English Pages 115 [116] Year 2022
Preface
Overview
Contents
Contributors
Abbreviations
List of Figures
List of Tables
Diagnosis Procedure Combination (DPC)
Development of a Casemix System and Its Application in Japan
1 Introduction
2 Basic Description of DPC
3 Application of DPC Data for Health Management
4 Conclusion
References
National Database of Health Insurance Claims and Specific Health Checkups of Japan (NDB)
The Present Status and Future Perspective of the National Database of Health Insurance Claim Information and Specified Medical Checkups of Japan (NDB)
1 Introduction
2 National Database of Health Insurance Claim Information and Specified Medical Checkups of Japan
2.1 Claims Data (Medical Fee Statements)
2.2 Specified Medical Checkup Data
2.3 Data Format and Quantity
3 Current NDB Utilization
4 Case Study
5 Comparisons with Other Countries
6 Conclusions
Surveillances for Non-communicable Complex Diseases by National Databases of Health Insurance Claims and Specific Health Checkups of Japan
References
Powerful Analytics Platform for National-Scale Database of Health Care Insurance Claims
References
Panoramic View of Diabetes from a Standpoint of the NDB (National Database)
Nephrology Research in the NDB
References
Medical Information Database Network (MID-NET)
Drug Safety Assessment and the MID-NET® (Japanese Medical Information Database Network)
1 Introduction
2 Safety Data Available for Drug Approval
3 PMDA’s Initiative to Utilize a Medical Information Database for Drug Safety Assessment
4 Establishment of MID-NET®
5 Quality Management of MID-NET®
6 Utilization and Characterization of MID-NET®
7 Challenges in the Secondary Utilization of Electronic Health Information for Drug Safety Assessment
References
A Solution to the Problem of Data Quality in MID-NET
1 Present Japanese EMR
2 Construction and Data of Standardized
3 Data Quality Management
Reference
Disease Registration Cohort Study with EMR (SS-MIX2)
Health Information Standards
1 Ministry Designated Standards
2 Images
2.1 Radiology Images
2.2 Other Images
3 Prescriptions
4 Laboratory Examination
5 Documents
6 Disease Classification
References
SS-MIX Structured Standardized Storage
References
Japan Diabetes Comprehensive Database Project Based on an Advanced Electronic Medical Record System (J-DREAMS)
1 Design of the J-DREAMS Project
2 Patient Data Registration and Data Collection
3 Variables
4 Follow-Up
5 Ethical Considerations
6 Overview of Data Collected and Problems to Be Overcome
7 Conclusion
References
Japan Chronic Kidney Disease Database: J-CKD-DB
1 Introduction
2 J-CKD-DB Project
2.1 Data Source
2.2 Inclusion Criteria and Data Elements
2.3 Method for Clinical Data Collection
3 Data Management
3.1 State of Standards in Hospitals
3.2 Laboratory Data Cleansing
4 J-CKD-DB and Its Extensions for Clinical Research
4.1 J-CKD-DB for Clinssical Research
4.2 Extensions and Enhancement of J-CKD-DB
5 Discussion
6 Conclusion
References
The Japan Medical Imaging Database (J-MID)
1 Background/Introduction
2 Description of Activity and Work Performed
3 Conclusion and Recommendations
Reference
Recommend Papers

![Epidemiologic Research on Real-World Medical Data in Japan: Volume 2 (SpringerBriefs for Data Scientists and Innovators, 2) [1st ed. 2022]
9789811916212, 9789811916229, 9811916217](https://ebin.pub/img/200x200/epidemiologic-research-on-real-world-medical-data-in-japan-volume-2-springerbriefs-for-data-scientists-and-innovators-2-1st-ed-2022-9789811916212-9789811916229-9811916217.jpg)

![Statistical Tools for Epidemiologic Research [1 ed.]
0199755965, 9780199755967](https://ebin.pub/img/200x200/statistical-tools-for-epidemiologic-research-1nbsped-0199755965-9780199755967.jpg)


![Issues in Medical Research Ethics [1 ed.]
9781789203745, 9781571816016](https://ebin.pub/img/200x200/issues-in-medical-research-ethics-1nbsped-9781789203745-9781571816016.jpg)
![Modelling Survival Data in Medical Research [4 ed.]
1032252855, 9781032252858](https://ebin.pub/img/200x200/modelling-survival-data-in-medical-research-4nbsped-1032252855-9781032252858.jpg)
![Data Privacy In European Medical Research: A Contemporary Legal Opinion [1st Edition]
3954665921, 9783954665921, 9783954666034](https://ebin.pub/img/200x200/data-privacy-in-european-medical-research-a-contemporary-legal-opinion-1st-edition-3954665921-9783954665921-9783954666034.jpg)
File loading please wait...
Citation preview
SpringerBriefs for Data Scientists and Innovators Naoki Nakashima Editor
Epidemiologic Research on Real-World Medical Data in Japan Volume 1
SpringerBriefs for Data Scientists and Innovators Volume 1
Editor-in-Chief Osamu Sudoh, Graduate School of Interdisciplinary Informatics, The University of Tokyo, Tokyo, Japan
This series presents concise summaries of cutting-edge research and practical applications in the area of big-data analysis, decision making and prediction. With “innovation” as a key word, the series aims for sharing new approaches and inspiring ideas of data analysis arising from different fields including social sciences, artificial intelligence, medical care, security, policymaking, urban planning, and more. The series aims to promote data sciences for new innovations such as the use of big data to find cutting-edge solutions for human society at large. Featuring compact volumes of 50 to 125 pages (approximately 20,000-45,000 words), Briefs allow authors to present their ideas and readers to absorb them with minimal time investment. Typical texts for publication might include: • A snapshot review of the current state of a hot or emerging field • A concise introduction to core concepts that students must understand in order to make independent contributions • An extended research report giving more details and discussion than is possible in a conventional journal article • A manual describing underlying principles and best practices for an experimental technique The standard concise author contracts guarantee that: • an individual ISBN is assigned to each manuscript • each manuscript is copyrighted in the name of the author • the author retains the right to post the pre-publication version on his/her website or that of his/her institution The publication of all volumes in SBDSI is to be done by a peer-reviewed process.
More information about this series at https://link.springer.com/bookseries/15750
Naoki Nakashima Editor
Epidemiologic Research on Real-World Medical Data in Japan Volume 1
Editor Naoki Nakashima Kyushu University Hospital Fukuoka, Japan
ISSN 2520-1913 ISSN 2520-1921 (electronic) SpringerBriefs for Data Scientists and Innovators ISBN 978-981-16-6375-8 ISBN 978-981-16-6376-5 (eBook) https://doi.org/10.1007/978-981-16-6376-5 © The Editor(s) (if applicable) and The Author(s), under exclusive license to Springer Nature Singapore Pte Ltd. 2022 This work is subject to copyright. All rights are solely and exclusively licensed by the Publisher, whether the whole or part of the material is concerned, specifically the rights of translation, reprinting, reuse of illustrations, recitation, broadcasting, reproduction on microfilms or in any other physical way, and transmission or information storage and retrieval, electronic adaptation, computer software, or by similar or dissimilar methodology now known or hereafter developed. The use of general descriptive names, registered names, trademarks, service marks, etc. in this publication does not imply, even in the absence of a specific statement, that such names are exempt from the relevant protective laws and regulations and therefore free for general use. The publisher, the authors and the editors are safe to assume that the advice and information in this book are believed to be true and accurate at the date of publication. Neither the publisher nor the authors or the editors give a warranty, expressed or implied, with respect to the material contained herein or for any errors or omissions that may have been made. The publisher remains neutral with regard to jurisdictional claims in published maps and institutional affiliations. This Springer imprint is published by the registered company Springer Nature Singapore Pte Ltd. The registered company address is: 152 Beach Road, #21-01/04 Gateway East, Singapore 189721, Singapore
Preface
This book is devoted to understanding how medical big-data projects are developing in Japan. Japan is the first country in global history to experience the aging society. Labor productivity has decreased accordingly without innovations to resolve this issue. Big-data analysis by Japanese medical Real-World Database (RWD) is one of the candidates for innovation to tackle the aforementioned issue. First, this book discusses the original Japanese system that generates medical RWDs, in the hospital medical records system, the nationwide standardized health checkup system, and the public medical insurance system in Japan to establish background knowledge for Japanese medical big-data analysis. The exhaustive data of 120 million citizens possibly constitutes as one of the largest medical data sets available worldwide, and analyzing these data is fascinating for data scientists, industries, and public all over the world. Next, the book introduces four representative big-data projects in the healthcaremedical field in Japan. Each project utilizes different data characteristics, but all projects are expected to be effective in changing the future of Japan. Readers can understand big pictures and concrete outcomes of the projects by themselves. Then, this book also explains the importance of creating information standards to maintain data quality and to analyze medical big data. Readers can self-analyze which standards are installed in which RWDs, how the standards are maintained, and what types of issues are prevalent in Japan. Pathology (phenotype) from RWD is extracted by the phenotyping method based on certain rules. This method is important for medical RWD analysis in any country and should be developed in each country because the method of analysis varies with each country. We hope this book contributes in establishing phenotyping rules in other countries. In observational studies involving the secondary use of RWDs, researchers or data scientists should consider special aspects of the analysis method. To improve the quality of big-data analysis, study design should be emphasized as an important part of the startup phase of research.
v
vi
Preface
Finally, this book describes the ethical process involved in big-data projects of medical RWDs in Japan. Regarding this issue, this book explains the “Next Generation Medical Infrastructure Act”, which was enforced in 2018 and will promote medical science and industries in Japan by utilizing data from medical RWD in Japan. Readers can analyze the following from the book: 1. The mechanisms involved in the generation of Japanese medical RWDs and the aspects or characteristics of the data. Subsequently, readers can understand how Japanese big-data analysis works in Japanese society. 2. The four representative big-data projects in Japan on a national scale, including each purpose, method, aspect, situation, and issue. 3. Basic technology issues (including ethics) and solutions in conducting Japanese medical RWD analyses. I appreciate the great efforts that the authors have made to publish this book in this critical state of the COVID-19 pandemic. Finally, my special thanks goes to Ms. Masako Ito for good management of all stages of the publishing process. Fukuoka, Japan July 2021
Naoki Nakashima
Overview
This book is devoted to developing an understanding of how medical big-data projects have developed in Japan. Japan was the first country in world history to experience an aging society. Medical costs have drastically increased, and labor productivity has fallen accordingly, in the absence of any innovation that could resolve these issues. Big-data analysis using medical Real-World Data (RWD) in Japan, may be a possible means for innovation, aimed at tackling these issues. The history of Japanese medical system, policy, and function is examined here so that foreign researchers can more easily understand them. Additionally, this book is also intended to provide a reference for Japanese researchers to be able to use to indicate their research methodology in their original articles so as to be able to avoid describing their practice at length in the context of a restricted word count. This book consists of a total of nine parts in Vol. 1 and Vol. 2 together, written by outstanding Japanese researchers. In this overview, I give an outline indicating each part.
Japanese Health Care and the Medical Information System Japanese Public Medical Insurance System First, the Japanese medical system, which generates RWD in the hospital Electronic Medical Records (EMR) systems, the Nationwide Standardized Health Checkup system (NSHC), and the public medical insurance system, is examined to establish the background information necessary to conduct big-data analysis of the Japanese medical system. This set of exhaustive data on 126 million citizens is possibly one of the largest medical data sets available in the world, and these data are a treasure for data scientists, industries, and the public all over the world due to Japan’s long history of a public medical insurance system covering all Japanese citizens.
vii
viii
Overview
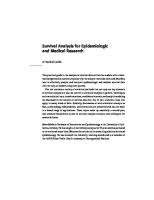
Fig. 1 Categories of Japanese public insurance system according to share of population insured
Japan’s public medical insurance system was launched in 1961. This system covered all citizens and allowed free access to any medical institution; it was cutting edge at the time, but it stills the two features mentioned as universal insurance and free access. However, there are many insurers in business in Japan (3,403 in 2018) to cover all Japanese citizens, although this total is less than the original number had been in 1961. Japanese insurers can be classified into three categories: insurance for the self-employed (1,878 insurers in 2018, matching the number of local governments, i.e., cities, towns, and villages), employee insurance (1,478 insurers in 2018), and insurance for those 75 years old or older (47 insurers in 2018, matching the number of prefectural governments)1 . At the end of March 2018, on a rough numerical basis, insurance for the self-employed covers 30 million people (24% of all citizens), employee insurance covers 78 million (62%), and insurance for those who are 75 years old or older covers 18 million (14%), reaching nearly the total number of citizens (126 million) (see Fig. 1)1 . Patient payment rates for medical expenses have been altered many times. At the present rate (in2019), citizens between 6 and 69 years old pay 30% of the cost, those under 6 years old or those between 70 and 74 years old pay 20%, and those over the age of 75 years pay 10% of the cost (however, if a 70-year-old or older person has an income comparable to the younger generation, he or she must pay 30% of the cost). For example, if a 50-year-old is receiving services, the provider collects 30% of the medical fee from the patient and 70% from the insurer.
Overview
ix
In Japan, medical services are provided by 8,324 hospitals (defined as medical institutions with 20 or more beds) and 102,396 clinics (medical institutions with less than 20 beds), 68,488 dental clinics as of May 20192 . 60171 dispensing pharmacies are also working as of March 20203 . In these institutions, 327,210 medical doctors; 104,908 dentists; 311,289 pharmacists; 1,218,606 nurses; 52,955 public health nurses; and 36,911 certified midwives were working in December 20184, 5 . Japanese medical costs have been increasing with the aging of its population. The costs reached JPY 43.6 trillion in 20196 , and this amount may continue to increase. This means that increasing the cost-effectiveness of medical services is an urgent national task.
Digitalization and Reuse of Insurance Claim Data and Health Checkup Data Insurance claims were processed on paper, from 1961 until the beginning of the twentieth century, so the data produced were little used or analyzed. Insurance claim data began to be digitized at the beginning of the twenty-first century, reaching up to a level of 99%, that is, almost complete digitization, at present (2021). All medical procedures covered by insurance are recorded in the claims data, allowing the insurers to evaluate what procedures were provided to which insured person by the medical institutions they visited. In 2003, a new payment system, called Diagnosis Procedure Combination (DPC), was put in place in all of the 82 university hospitals in Japan. DPC is a Japanese variant of the familiar Diagnosis Related Group/Prospective Payment System used in the United States. DPC is now applied in 1,730 hospitals (in almost all acute care hospitals) in Japan. In 2008, the NSHC was implemented as a duty of the insurer to detect and prevent non-communicable diseases (NCDs), such as diabetes mellitus, hyperlipidemia, dyslipidemia, and chronic kidney diseases (CKDs). The target age group for NSHC is 40- to 74-year-olds (54 million people in 2019). The number of NSHC examinees has been increased, from 38% in 2008 during the implementation to 57% in 20197 . The results of NSHC are shared with both the examinee (the insured) and the insurer. In 2015, the Ministry of Health, Labour and Welfare (MHLW) initiated a promotional plan called the Data Health (DH) plan, against the background of the progression of the digitalization of insurance claims and NSHC. The DH plan coordinates the population management process for the insured by insurers, matching personal claims data and NSHC data. In this program, insurers provide personal support services on the basis of the results of matching in order to reduce their risks. For example, if an insurer does not have both claim data and NSHC data, it should recommend the given insured person to undergo NSHC screening because
x
Overview
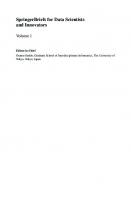
Fig. 2 Three important intervention points in the DH plan
the insurer does not know the individual’s precise health condition (intervention point 1 in Fig. 2). If the insurer does not have claims data but can obtain the results of an NSHC screening that shows hints of an NCD, the insurer should urge the insured to visit a clinic or hospital because this fact would imply that the insured had ignored the results of an NSHC screening (intervention point 2 in Fig. 2). Furthermore, if the insurer is able to obtain claims data reliably, but the results of the annual NSHC screening show no improvement or indeed are worse than those of the previous year, the insurer should intervene strongly through public care nurses to prevent serious complications from developing (intervention point 3 in Fig. 2). As noted above, MHLW began promoting nationwide population management using disease management methodologies for primary to tertiary prevention of NCD through the digitalization of insurance claim data and NSHC by public medical insurers soon after the turn of the twenty-first century. Since 2018, MHLW has been using a new carrot and stick policy called Support System for Insurer Efforts. With this system, MHLW imposes an economic penalty to insurers that have insufficient outcomes for their support of insured individuals with high risks. It is also planned that MHLW will provide an economic incentive for insurers with better outcomes from 2020.
Overview
xi
Japanese Electronic Medical Records In the analysis of medical RWD, electronic health record (EHR) data, which includes clinical outcome data such as lab tests and diagnosis data, are more useful than insurance claim data, which only shows the clinical procedures. However, EHR are not yet widely integrated in Japan; they remain distributed in several medical institutions as electronic medical records (EMR). EMR is limited to data from only those who had visited the given institution. The NSHC database includes healthy subjects, but these data are held separately by the 3,418 insurers and are not integrated, except in the form of an anonymous national data base (NDB), only available for secondary use. More on the NDB will appear below. All told, the digitization of medical records in Japan in 2017 was only 46.7% for hospitals and 41.6 % for clinics, although the number has gradually been increasing. There has been a recent tendency to establish standard data repositories outside of EMR for data for primary or secondary use by multiple institutions because it is too late and too difficult to standardize existing EMR. The standard Standardized Structured Medical Information eXchange version 2 (SS-MIX2), which is listed as an MHLW standard (see Part IV in Vol. 1), is used widely in Japan. At the end of March 2018, 1,360 hospitals had already installed SS-MIX2. It must be considered how to establish an integrated EHR system that can last a person’s lifetime and follow that person, and SS-MIX2 is a powerful candidate for the skeleton of such a system of Japanese EHR (see Part IV in Vol. 1). The idea of a Personal Health Record (PHR) is expected to gain greater currency in the near future and to become a main data source for EHR. As the smartphone gains greater and greater penetration, the PHR is expected to be a valuable tool for patient engagement. However, ideas around PHR are still in the research stage, and the PHR service model has not yet spread to Japan. Therefore, this book does not discuss it in detail. In 2018, six clinical associations in Japan, the Japan Diabetes Society (JDS), the Japan Association for Medical Informatics (JAMI), the Japanese Society of Hypertension, the Japan Atherosclerosis Society, the Japanese Society of Nephrology (JSN), and the Japanese Society of Laboratory Medicine, have recommended a configuration for PHR using standardized data item sets8, 9 . PHR can thus be expected to be seen as a tool of patient engagement and a powerful data source for EHR in Japan in the near future.
Japanese Big-Data Projects Based on RWD Next, we introduce three representative big-data projects in the Japanese fields of health care and medicine. Each project features different data characteristics, but each project is expected to be effective in changing Japan’s future. Readers can come to understand the big picture and develop the concrete outcomes of the projects by themselves (see Part IV in Vol. 2).
xii
Overview
Diagnosis Procedure Combination (Outline of Part I in Vol. 1) The first nationwide data-driven medical study (DDMS) in Japan was the DPC. The DPC, which was launched in 82 hospitals (mainly university hospitals) in 2003, was designed not only for use as a payment system but also for the creation of high-quality data sets to be used in analysis. Because diagnostic data directly decide payment of medical fees for inpatients in the DPC, the hospital is not able to upcode diagnoses (this would be fraud), which results in the registration of a precise diagnosis for each admission. Although the DPC was only used for inpatients, and some diseases were excluded (for example, psychiatric diseases), it eventually spread to 1,730 hospitals, including almost all acute care hospitals, and 7 million cases were registered in 2017. The DPC has already contributed to quality assessment and standardization in Japan’s acute-care hospitals (see Part I in Vol. 1).
National Database of Health Insurance Claims and Specific Health Checkups of Japan (Outline of Part II in Vol. 1) Each insurer must provide all claims data and NSHC data to MHLW. Then, MHLW matches and anonymizes them to establish the National Database of Health Insurance Claims and Specific Health Checkups of Japan (NDB). The NDB is only used for research purposes on an application–examination basis. The NDB features one of the world’s largest data sets, including all claim data matched with all NSHC data from the 126 million citizens of Japan. Although it has limitations (for example, it excludes those living on welfare—about 2 million citizens), it excludes disqualification data, such as death events. The NDB excludes outcome data, such as lab test result data, except for NSHC data. In all, it yields 2 billion cases and 40 billion data points each year. NDB has responded to requests from researchers since 2013 and helped produce research outcomes by extracting partial data sets. Recently, Dr. Naohiro Mitsutake of the Institutes for Health Economics and Policy established an analysis infrastructure using all claim data (10 billion cases and 200 billion data points over 6 years, 2009–2014), using an ultra-high-speed search engine developed by Prof. Masaru Kitsuregawa at Tokyo University. Using this infrastructure, for example, the author, at Kyushu University, is conducting an analysis of NDB while Prof. Yamagata and his colleagues at Tsukuba University are studying CKD and end-stage kidney diseases (see Part II in Vol. 1).
Overview
xiii
Medical Information Database Network (Outline of Part III in Vol. 1) The Medical Information Database Network (MID-NET) project is being implemented by the MHLW and the Pharmaceuticals and Medical Devices Agency to detect adverse drug events after marketing approval, using a pharmaco-epidemiology method, together. In other words, this is a Japanese version of the Sentinel initiative that is underway in the United States. In all, 23 hospitals part of 10 institutions (8 are university hospitals) have joined the project, providing real-time data for 4 million patients (diagnosis, results of lab tests, prescriptions, and claims data) through SS-MIX2 and the claims database. The MID-NET project spent more than 5 years on validating the data, and it can now boast of the data quality. The project was formally launched in 2018, after 7 years of preparations, to provide a system for use by medical researchers and pharmaceutical companies. The results are expected to include detection of serious adverse events of drugs, even if late, in the so-called long tail of cases (see Part III in Vol. 1).
Disease Registration Cohort Study with EDC from EMR (Outline of Part IV in Vol. 1) AMED (Japan Agency for Medical Research and Development), an important Japanese provider of medical grants since 2015, has activated a DDMS (including medical image analysis) and prospective disease registration research project conducted by clinical academic associations. This project is collecting and analyzing RWD from SS-MIX2, the claims database, and standard DICOM image data from clinical image databases connected to picture archiving and communication systems from multiple medical institutions. The J-CKD-DB project is a representative DDMS project that is being conducted by multiple medical institutions. It only uses clinical RWD, without adding any manual data input for research purposes to avoid burdening clinical sites. J-CKDDB is being led by JSN and has already collected more than 100 thousand cases of CKD (see Part IV in Vol. 1). The medical image DDMS coordinated by AMED includes radiology, pathology, gastrointestinal endoscopy, retina examination, and echogram images. These are to be used to develop AI that can support the interpretation of medical images by doctors. The Clinical Core Hospital Research Network project, launched by the MHLW as an AMED project in 2018, is intended to establish infrastructure for DDMS among 12 clinical core hospitals. Some research projects are using EMR for their data source, although they are aiming at prospective clinical research. For example, the template function in EMR is available for inputting clinical data, which are usually described with free text in EMR. Medical doctors can use template functions in their daily clinical work.
xiv
Overview
Fig. 3 Classification of clinical observational studies according to data characteristics
J-DREAMS (acronym for Japan Diabetes compREhensive database project based on an Advanced Electronic Medical Record System), which is being conducted by the National Center for Global Health and Medicine and JDS, is a typical example of this pattern (see Part IV in Vol. 1). For these prospective epidemiologic studies or registration cohort studies, SS-MIX2 is expected to be used as the source of data for EMR in dominant cases. Figure 3 shows the relations among different types of clinical observational study.
Importance of Data Quality in Big-Data Analysis Clinical Pathways (Outline of Part I in Vol. 2) After Nurse Karen Zander developed the clinical pathway in the 1980s, some Japanese hospitals put it in place for simple planning or for scheduling of medical service. At the end of the twentieth century, the Japan Society of Clinical Pathway (JSCP) began promoting the diffusion of outcome-oriented clinical pathways and continuing up to the present.
Overview
xv
In Japan, more than 2,000 hospitals (largely acute care hospitals), out of a total of 8,442, are already using clinical pathways. Using these clinical pathways, clinical outcome data are easily obtained from EMR as structured data, although such data is often described in free text as progress notes. Many of EMR packages already contain the clinical pathway function, however, there is no standardization among vendors at present. Therefore, the analysis of clinical pathways with multiple medical institutions can be difficult. Thus, in 2016, the JSCP and JAMI established a collaborative committee to standardize the clinical pathway system, and they initiated a model project called the ePath Project with four hospitals and four top EMR vendors in October 2018 until March 2021, funded by AMED (see Part I in Vol. 2).
Standard Codes (Outline of Part II in Vol. 2) This book also explores the importance of creating information standards to maintain data quality and to help analyze medical big data. The largest general issue for RWD is data quality. Before the analysis of RWD for secondary use, data cleansing (correction of duplicate data, location of missing or mixed data, assessment of outliers, and so on) must be undertaken. Furthermore, the MID-NET project found that data mapping to standard code is moving slowly or has even been incorrectly done, even in institutions that are using SS-MIX2. We expect that researchers and medical institutions will come to recognize the importance of data quality and try to increase it by conducting big-data analysis of medical data. However, we cannot expect that the data quality of DDMS will be perfect even after data management. It is also very important to develop methods to evaluate the data quality with exactness. For this book, Prof. Dongchon Kang of Kyushu University provided an overview of lab tests mapping between local codes and the standard JLAC10 codes, as well as to JLAC11, the next-generation version of JLAC10. The ICD10 and ICD11 standard codes for diagnosis are introduced, as well as HOT, the drug standard code (see Part II in Vol. 2). We also introduce a central management trial for the standard code (ICD10, JLAC10, and HOT) in multiple medical institutions (in other words, we review governance of standard codes) in the aforementioned MID-NET project with AMED funding (see Part II in Vol. 2). Readers can analyze which standards should be installed in which RWDs, how the standards should be maintained, and what types of issues are prevalent in Japan.
Data Quality and Phenotyping (Outline of Part III in Vol. 2) RWD often lacks data items for its analysis that would be critical for achieving goals. Japanese EMR and claims data do not have clinically appropriate phenotypes
xvi
Overview
as pathologies or diagnoses in databases. What does exist is only diagnosis for insurance reimbursement, and this is not a medically correct phenotype. Therefore, a methodology should be developed, to be called ePhenotyping, to detect or predict correct phenotypes from other data items (see Part III in Vol. 2). ePhenotyping would be very important for medical RWD analysis in any country, and it should be developed for each one because the medical system is different in each. We hope that this book can contribute to the establishment of ePhenotyping rules in Japan and other countries as well.
Data Analysis of Real-World Data (Outline of Part IV in Vol. 2) In observational studies involving the secondary use of RWDs, researchers and data scientists should consider the special aspects of their analysis methods. To improve the quality of their big-data analysis, their study designs should be emphasized during the initiation phase of research. For big-data analysis, adding to the knowledge of found by classical biomedical statistics, new analytical methodologies such as machine learning, that previously were not used for medical analysis, should be incorporated. Furthermore, it is impossible to design appropriate research plans without knowledge of the system and local operations in the clinical sites where RWD accumulate, and the results of analysis appropriately. Of course, it would be difficult for one person to have all of this knowledge, but at least one member on the project team should have expertise in each needed area, such that the team as a whole can cover all necessary knowledge to ensure a proper big-data analysis and produce papers for publication on a high level (see Part IV in Vol. 2).
Ethical and Other Issues of Data Regarding Secondary Data use in Japan (Outline of Part V in Vol. 2) Finally, this book describes the ethics of big-data projects using medical RWD. Before we begin clinical observational research projects, the revised Personal Information Protection Act of May 2017 should be understood, along with the simultaneously revised ethical guidelines for medical research. This book also explains the Next-Generation Medical Infrastructure Act, which came into law in May 2018 and promotes medical science and industries in Japan by allowing the use of medical RWD in Japan. Of course, regulations should be complied with, but the benefit for patients and citizens should be uppermost (see Part V in Vol. 2). Recently, the Internet of Things has extended a wide influence into daily life, and this implies that many devices in our lives are creating and accumulating digital data
Overview
xvii
on our daily vital signs and behavior. The processing and analysis of the explosively increasing amounts of health and medical data yielded by these remains an issue. Further, the increasing amounts of genetic information is producing the same effect. However, the present numbers of Japanese data scientist are apparently insufficient to tackle these serious issues, relative to the numbers in other countries. We should make haste to increase their numbers. Naoki Nakashima, M.D. Ph.D. Director/Professor Medical Information Center Kyushu University Hospital, Japan President of Japan Association of Medical Informatics [email protected]
References 1. MHLW: 22nd Medico-economical fact-finding surveillance. https://www.e-stat.go.jp/stat-sea rch/files?page=1&toukei=00450392&result_page=1 (article in Japanese, Retrieved on Aug 7, 2021) 2. MHLW: Dynamic Surveillance of Number of Medical Institutes. https://www.mhlw.go.jp/tou kei/saikin/hw/iryosd/m19/dl/is1905_01.pdf (article in Japanese, Retrieved on Aug 7, 2021) 3. MHLW: Dynamic Surveillance of Number of Dispensing Pharmacies. https://www.mhlw.go. jp/toukei/saikin/hw/eisei_houkoku/19/dl/kekka5.pdf (article in Japanese, Retrieved on Aug 7, 2021) 4. MHLW: Dynamic Surveillance of Numbers of Doctor, Dentist and Pharmacist. https://www. mhlw.go.jp/toukei/saikin/hw/ishi/18/dl/kekka.pdf (article in Japanese, Retrieved on Aug 7, 2021) 5. MHLW: Dynamic Surveillance of Numbers of Nurse, Public Nurse and Midwife. https://www. mhlw.go.jp/toukei/saikin/hw/eisei/18/dl/kekka1.pdf (article in Japanese, Retrieved on Aug 7, 2021 6. MHLW: Dynamic Surveillance of Medical Cost. https://www.mhlw.go.jp/stf/newpage_13214. html (article in Japanese, Retrieved on Aug 7, 2021) 7. MHLW: Dynamic Surveillance of Nationwide Standardized Health Checkup. https://www. mhlw.go.jp/content/12400000/000755573.pdf (article in Japanese, Retrieved on Aug 7, 2021) 8. N Nakashima, et al., Journal of Diabetes Investigation, 10 (3): 868–875, 2019 9. N Nakashima, et al. Diabetology International, 10 (2): 85–92, 2019
Contents
Diagnosis Procedure Combination (DPC) Development of a Casemix System and Its Application in Japan . . . . . . . . . Shinya Matsuda
3
National Database of Health Insurance Claims and Specific Health Checkups of Japan (NDB) The Present Status and Future Perspective of the National Database of Health Insurance Claim Information and Specified Medical Checkups of Japan (NDB) . . . . . . . . . . . . . . . . . . . . . . . . . . . . . . . . . . . . . . . . . . . 13 Naohiro Mitsutake Surveillances for Non-communicable Complex Diseases by National Databases of Health Insurance Claims and Specific Health Checkups of Japan . . . . . . . . . . . . . . . . . . . . . . . . . . . . . . . . . . . . . . . . . . . . . . . . . . . . . . . . . . . 23 Naoki Nakashima Powerful Analytics Platform for National-Scale Database of Health Care Insurance Claims . . . . . . . . . . . . . . . . . . . . . . . . . . . . . . . . . . . . . . . . . . . . . . 29 Kazuo Goda and Masaru Kitsuregawa Panoramic View of Diabetes from a Standpoint of the NDB (National Database) . . . . . . . . . . . . . . . . . . . . . . . . . . . . . . . . . . . . . . . . . . . . . . . . . . . . . . . . . . 33 Mitsuhiko Noda, Atsushi Goto, and Naohiro Mitsutake Nephrology Research in the NDB . . . . . . . . . . . . . . . . . . . . . . . . . . . . . . . . . . . . 35 Keiichi Sumida, Ryoya Tsunoda, Hirayasu Kai, Masahide Kondo, and Kunihiro Yamagata
xix
xx
Contents
Medical Information Database Network (MID-NET) Drug Safety Assessment and the MID-NET® (Japanese Medical Information Database Network) . . . . . . . . . . . . . . . . . . . . . . . . . . . . . . . . . . . . . 41 Mitsune Yamaguchi, Fumitaka Takahashi, and Yoshiaki Uyama A Solution to the Problem of Data Quality in MID-NET . . . . . . . . . . . . . . . . 51 Takanori Yamashita Disease Registration Cohort Study with EMR (SS-MIX2) Health Information Standards . . . . . . . . . . . . . . . . . . . . . . . . . . . . . . . . . . . . . . . 57 Michio Kimura SS-MIX Structured Standardized Storage . . . . . . . . . . . . . . . . . . . . . . . . . . . . 61 Michio Kimura Japan Diabetes Comprehensive Database Project Based on an Advanced Electronic Medical Record System (J-DREAMS) . . . . . . . 65 Takehiro Sugiyama and Kohjiro Ueki Japan Chronic Kidney Disease Database: J-CKD-DB . . . . . . . . . . . . . . . . . . 73 Mihoko Okada and Naoki Kashihara The Japan Medical Imaging Database (J-MID) . . . . . . . . . . . . . . . . . . . . . . . . 87 Daisuke Kakihara, Akihiro Nishie, Akihiro Machitori, and Hiroshi Honda
Contributors
Kazuo Goda The University of Tokyo, Tokyo, Japan Atsushi Goto Graduate School of Data Science, Yokohama City University, Kanagawa, Japan Hiroshi Honda Department of Clinical Radiology, Graduate School of Medical Sciences, Kyushu University, Fukuoka, Japan Hirayasu Kai Department of Nephrology, Faculty of Medicine, University of Tsukuba, Tsukuba, Japan Daisuke Kakihara Radiology Center of Kyushu University Hospital, Fukuoka, Japan Naoki Kashihara Department of Nephrology and Hypertension, Kawasaki Medical School, Kurashiki, Japan Michio Kimura Hamamatsu University School of Medicine, Shizuoka, Japan Masaru Kitsuregawa The University of Tokyo, Tokyo, Japan Masahide Kondo Department of Health Care Policy and Health Economics, Faculty of Medicine, University of Tsukuba, Tsukuba, Japan Akihiro Machitori Kohnodai Hospital, National Center of Global Health and Medicine, Tokyo, Japan Shinya Matsuda Department of Preventive Medicine and Community Health, School of Medicine, University of Occupational and Environmental Health, Kitakyushu, Fukuoka, Japan Naohiro Mitsutake Institute for Health Economics and Policy, Tokyo, Japan Naoki Nakashima Medical Information Center, Association of Medical Informatics, Kyushu University Hospital, Fukuoka, Japan
xxi
xxii
Contributors
Akihiro Nishie Department of Clinical Radiology, Graduate School of Medical Sciences, Kyushu University, Fukuoka, Japan Mitsuhiko Noda Ichikawa Hospital, International University of Health and Welfare, Chiba, Japan Mihoko Okada Institute of Health Data Infrastructure for All, Tokyo, Japan Takehiro Sugiyama Diabetes and Metabolism Information Center, Research Institute, National Center for Global Health and Medicine, Tokyo, Japan; Department of Health Services Research, Faculty of Medicine, University of Tsukuba, Ibaraki, Japan Keiichi Sumida Department of Nephrology, Faculty of Medicine, University of Tsukuba, Tsukuba, Japan; Division of Nephrology, Department of Medicine, University of Tennessee Health Science Center, Memphis, TN, USA Fumitaka Takahashi Office of Medical Informatics and Epidemiology, Pharmaceuticals and Medical Devices Agency, Tokyo, Japan Ryoya Tsunoda Department of Nephrology, Faculty of Medicine, University of Tsukuba, Tsukuba, Japan Kohjiro Ueki Diabetes Research Center, Research Institute, National Center for Global Health and Medicine, Tokyo, Japan Yoshiaki Uyama Office of Medical Informatics and Epidemiology, Pharmaceuticals and Medical Devices Agency, Tokyo, Japan Kunihiro Yamagata Department of Nephrology, Faculty of Medicine, University of Tsukuba, Tsukuba, Japan Mitsune Yamaguchi Office of Medical Informatics and Epidemiology, Pharmaceuticals and Medical Devices Agency, Tokyo, Japan Takanori Yamashita Medical Information Center, Kyushu University Hospital, Fukuoka, Japan
Abbreviations
ACD AI AMED AUC CDS CKD CP CSV CT DDMS DICOM DIR DPC DRG DRG/PPS EDC eGFR EHR EMR ESKD ETL GBDT GFR GPSP HELICS HIS HL7 CDA R2 ICD10 ICD11
Administrative Claims Data Artificial Intelligence Japan Agency for Medical Research and Development Area Under the Curve Clinical Decision Support Chronic Kidney Diseases Clinical Pathways Computerized System Validation Computed Tomography Data-Driven Medical Study Digital Imaging and COmmunications in Medicine Dose Index Registry Diagnosis Procedure Combination Diagnosis-Related Group Diagnosis-Related Group/Prospective Payment System Electronic Data Capture estimated Glomerular Filtration Rate Electronic Health Record Electronic Medical Records End-Stage Kidney Disease Extract/Transform/Load Gradient Boosting Decision Tree Glomerular Filtration Rate Good Post-Marketing Study Practice Health Information and Communication Standard Board Hospital Information System HL7 Clinical Document Architecture Release 2 International Statistical Classification of Diseases and Related Health Problems, 10th revision International Statistical Classification of Diseases and Related Health Problems, 11th revision xxiii
xxiv
ICMRA ICT IHE IHE PDI IHE XDS IHEP IRB IVD JADER JAHIS JAMI JCVSD J-DREAMS JDS JIRA JLAC10 JMDC J-MID J-QIBA J-RIME JRS JSCP JSDT JSLM KT LOINC MCDRS MDC MDC MERIT-9 MHLW MID-NET MIHARI MRI NCD NCD NCGM NDB NPU NRS NYHA OHDSI
Abbreviations
International Coalition of Medicines Regulatory Authorities Information and Communication Technology Integrating the Healthcare Enterprise IHE Portable Data for Images IHE Cross-provider Document Sharing Institute for Health Economics and Policy Institutional Review Board In Vitro Diagnostic Japanese Adverse Drug Event Report Japanese Association of Healthcare Information Systems Industry Japan Association for Medical Informatics Nationwide Japan Adult Cardiovascular Surgery Database Japan Diabetes compREhensive database project based on an Advanced electronic Medical record System The Japan Diabetes Society The Japan Medical Imaging and Radiological Systems Industries Association Japanese Laboratory Codes, Version 10 Japan Medical Data Center Japan Medical Imaging Database Japan’s Quantitative Imaging Biomarker Alliance Japan Network for Research and Information on Medical Exposures Japan Radiological Society Japanese Society for Clinical Pathway Japanese Society for Dialysis Therapy Japan Society of Laboratory Medicine Kidney Transplantation Logical Observation Identifiers Names and Codes Multi-purpose Clinical Data Repository System Major Diagnosis Category Medical Data Vision MEdical Record, Image, Text-Information eXchange Ministry of Health, Labour and Welfare Medical Information Database NETwork Medical Information for Risk Assessment Initiative Magnetic Resonance Imaging National Clinical Database Non-Communicable Disease National Center for Global Health and Medicine National Database of Health Insurance Claims and Specific Health Checkups of Japan Nomenclature for Properties and Units Numerical Rating Scale New York Heart Association Observational Health Data Sciences and Informatics
Abbreviations
OMOP PACS PHR PMDA PPV RCT RECORD RWMD SAERs SDMT SDV SOAP SS-MIX2 STROBE VPN XCA
xxv
Observational Medical Outcomes Partnership Picture Archiving and Communication Systems Personal Health Record Pharmaceuticals and Medical Devices Agency Positive Predictive Value Randomized Controlled Trial REporting of studies Conducted using Observational Routinely-collected health Data Real-World Medical Data Spontaneous Adverse Event Reports Standard Diabetes Management Template Source Document Verification Subject, Object, Assessment and Plan Standardized Structured Medical Information eXchange 2 STrengthening the Reporting of OBservational Studies in Epidemiology Virtual Private Network Cross-Community Access
List of Figures
Development of a Casemix System and Its Application in Japan Fig. 1 Fig. 2
Scope of DPC projects . . . . . . . . . . . . . . . . . . . . . . . . . . . . . . . . . . . . . . Structure of DPC code . . . . . . . . . . . . . . . . . . . . . . . . . . . . . . . . . . . . . .
4 5
The Present Status and Future Perspective of the National Database of Health Insurance Claim Information and Specified Medical Checkups of Japan (NDB) Fig. 1 Fig. 2 Fig. 3
Flow of claims data and specified medical checkup data to the NDB . . . . . . . . . . . . . . . . . . . . . . . . . . . . . . . . . . . . . . . . . . . . . . . Data format of medical fee statements . . . . . . . . . . . . . . . . . . . . . . . . . Time-based changes in the numbers and regional distribution of outpatients with allergic rhinitis . . . . . . . . . . . . . . . . . . . . . . . . . . . .
15 16 18
Surveillances for Non-communicable Complex Diseases by National Databases of Health Insurance Claims and Specific Health Checkups of Japan Fig. 1 Fig. 2
Fig. 3 Fig. 4 Fig. 5 Fig. 6
Combined results of sampling statistics of NCDs by the ministry of health, labour and welfare [4, 5] . . . . . . . . . . . . . . . . . . . . . . . . . . . . Single disease statistics for three NCDs (diabetes mellitus, hypertension, and dyslipidemia) show a total of 306 million affected Japanese adults; this number can be condensed to 102 million using a counting combination method with NDB . . . . . . . . . . A total of 27 classification patterns exist from level 0 to 2 . . . . . . . . . Annual changes in level 1 . . . . . . . . . . . . . . . . . . . . . . . . . . . . . . . . . . . Annual changes in level 2 . . . . . . . . . . . . . . . . . . . . . . . . . . . . . . . . . . . Comparison of numbers between 3 levels (0–2) and among 27 patterns . . . . . . . . . . . . . . . . . . . . . . . . . . . . . . . . . . . . . . . . . . . . . . . . . .
24
24 25 26 26 27
xxvii
xxviii
List of Figures
Powerful Analytics Platform for National-Scale Database of Health Care Insurance Claims Fig. 1
Structural overview of the analytics platform . . . . . . . . . . . . . . . . . . . .
30
Panoramic View of Diabetes from a Standpoint of the NDB (National Database) Fig. 1
Estimated number of patients with diabetes for recent each fiscal year classified by other lifestyle-related diseases . . . . . . . . . . . . . . . . .
34
Nephrology Research in the NDB Fig. 1
Incidence rate of treated ESKD (per million population/year), by country, in 2016 [6] . . . . . . . . . . . . . . . . . . . . . . . . . . . . . . . . . . . . . .
37
Drug Safety Assessment and the MID-NET® (Japanese Medical Information Database Network) Fig. 1 Fig. 2
Partner hospitals and data categories of MID-NET® . . . . . . . . . . . . . . Periodical checking of data quality . . . . . . . . . . . . . . . . . . . . . . . . . . . .
43 45
A Solution to the Problem of Data Quality in MID-NET Fig. 1
Data quality management . . . . . . . . . . . . . . . . . . . . . . . . . . . . . . . . . . .
53
SS-MIX Structured Standardized Storage Fig. 1
Fig. 2 Fig. 3
SS-MIX Storage installation sites (with lab results, prescriptions 1214/total 1652) (total hospital number in Japan: 8389) as of March 2021 . . . . . . . . . . . . . . . . . . . . . . . . . . . . . . . . . . . . . . . . . . SS-MIX storage structure . . . . . . . . . . . . . . . . . . . . . . . . . . . . . . . . . . . SS-MIX2: HL7 standardized clinical information storage, wide variety of applications . . . . . . . . . . . . . . . . . . . . . . . . . . . . . . . . . . . . . .
62 62 63
Japan Diabetes Comprehensive Database Project Based on an Advanced Electronic Medical Record System (J-DREAMS) Fig. 1
Fig. 2
Overview of Japan Diabetes comprehensive database project based on an Advanced electronic Medical record System (J-DREAMS) . . . . . . . . . . . . . . . . . . . . . . . . . . . . . . . . . . . . . . . . . . . . . An example of the Standard Diabetes Management Template (NEC version). The templates from the different vendors all collect the same set of information. Cited from: Sugiyama et al. Design of and rationale for the Japan Diabetes comprehensive database project based on an Advanced electronic Medical record System (J-DREAMS). Diabetol Int. 2017;8(4):375–382 . . . . .
67
68
List of Figures
xxix
Japan Chronic Kidney Disease Database: J-CKD-DB Fig. 1 Fig. 2 Fig. 3 Fig. 4 Fig. 5 Fig. 6 Fig. 7 Fig. 8 Fig. 9
Prevalence of CKD in Japan (Clinical Practice Guidebook for Diagnosis and Treatment of Chronic Kidney Disease 2012) . . . . . Nation-wide J-CKD-DB project . . . . . . . . . . . . . . . . . . . . . . . . . . . . . . Overview of the J-CKD-DB system . . . . . . . . . . . . . . . . . . . . . . . . . . . J-CKD-DB Data Management . . . . . . . . . . . . . . . . . . . . . . . . . . . . . . . Visualization of laboratory test data distribution by institutions . . . . . Laboratory data cleansing . . . . . . . . . . . . . . . . . . . . . . . . . . . . . . . . . . . CKD severity classes distribution by age and by gender—obtained from J-CKD-DB . . . . . . . . . . . . . . . . . . . . . J-CKD-NEXT: the third generation of J-CKD-DB . . . . . . . . . . . . . . . Development of comprehensive and multilayered kidney disease database . . . . . . . . . . . . . . . . . . . . . . . . . . . . . . . . . . . . . . . . . . . . . . . . . .
74 76 79 80 81 82 83 84 85
The Japan Medical Imaging Database (J-MID) Fig. 1 Fig. 2 Fig. 3 Fig. 4
The overall structure of “Japan Safe Radiology” is shown . . . . . . . . . The database is generated by collecting CT images from medical institutions . . . . . . . . . . . . . . . . . . . . . . . . . . . . . . . . . . . . . . . . . . . . . . . CTDIvol of coronary CT . . . . . . . . . . . . . . . . . . . . . . . . . . . . . . . . . . . . DLP of coronary CT . . . . . . . . . . . . . . . . . . . . . . . . . . . . . . . . . . . . . . .
88 89 91 91
List of Tables
Development of a Casemix System and Its Application in Japan Table 1 Table 2
Patient volume in the Kitakyusyhu health care region for cerebrovascular diseases (2016 fiscal year; extracted) . . . . . . . . An example performance indicator (Saiseikai hospital group; extracted) percentage of early stage rehabilitation for artificial knee replacement surgery (within 3 days after surgery) . . . . . . . . . .
7
8
The Present Status and Future Perspective of the National Database of Health Insurance Claim Information and Specified Medical Checkups of Japan (NDB) Table 1
Status of secondary use of health insurance claims data (third-party provision) by country . . . . . . . . . . . . . . . . . . . . . . . . . . .
20
SS-MIX Structured Standardized Storage Table 1
Survey for purposes of and codes used for SS-MIX2 storages (out of 1360) . . . . . . . . . . . . . . . . . . . . . . . . . . . . . . . . . . . . . . . . . . . .
63
Japan Diabetes Comprehensive Database Project Based on an Advanced Electronic Medical Record System (J-DREAMS) Table 1
The items collected through J-DREAMS (basic information, prescription history, and clinical laboratory data) . . . . . . . . . . . . . . .
70
Japan Chronic Kidney Disease Database: J-CKD-DB Table 1 Table 2 Table 3
Classification of severity of CKD (2012) . . . . . . . . . . . . . . . . . . . . . . J-CKD-DB data elements . . . . . . . . . . . . . . . . . . . . . . . . . . . . . . . . . . Data collection methods: manual versus semi-automatic . . . . . . . . .
74 77 85
xxxi
Diagnosis Procedure Combination (DPC)
Development of a Casemix System and Its Application in Japan Shinya Matsuda
Abstract Diagnosis Procedure Combination (DPC) is the original Japanese casemix system. The principal purpose of introducing the DPC was not only to organize payment plans but also to modernize the Japanese health system. The three main objectives of the DPC are to improve the quality of hospital management, strengthen the accountability of hospitals, and rationalize the health care system. Based on DPC data, patients can determine the clinical performance of each acute care hospital according to parameters such as volume stratified by disease and disorder and related quality indicators. Furthermore, DPC data is used for regional health care planning. This article provides an overview of the DPC system with examples. Keywords Diagnosis procedure combination · Diagnosis related groups · Casemix · Quality indicators
1 Introduction Awareness of the performance of medical care has increased among citizens, along with the need to improve the allocation of medical resources due to the aging population. As a consequence, Japanese health policy now requires further standardization and transparency of information. Additionally, under the current severe fiscal situation, medical institutions are now required to improve the rationality of their management. To properly control hospital expenditure, strategies are needed to measure hospital products. Diagnosis Related Groups (DRGs) were developed in the USA for this purpose [1]. Additionally, DRGs have been widely adopted in European countries where optimization of in-patient health expenditure has been a major subject of fiscal policy since the 1980s. S. Matsuda (B) Department of Preventive Medicine and Community Health, School of Medicine, University of Occupational and Environmental Health, Iseigaoka 1-1, Yahatanishi, Kitakyushu, Fukuoka 807-8555, Japan e-mail: [email protected] © The Author(s), under exclusive license to Springer Nature Singapore Pte Ltd. 2022 N. Nakashima (ed.), Epidemiologic Research on Real-World Medical Data in Japan, SpringerBriefs for Data Scientists and Innovators 1, https://doi.org/10.1007/978-981-16-6376-5_1
3
4
S. Matsuda
Confronted with financial difficulties, the Japanese government began tightening fiscal policy in the early 90s. The health sector, especially the hospital sector, was one of the targets of the government’s proposed restrictions. Based on experience in European countries, a series of feasibility studies using the American DRGs were organized in Japan in the latter half of the 1990s. Despite relatively good results for their applicability, the government concluded that the American DRGs were unsuitable for the Japanese health system. Specifically, the Japan Medical Association stated that they preferred a clinical classification based on existing hospital information systems [2]. They concluded that the American DRGs were too simplistic to effectively describe hospital activity in Japan. Ultimately, the Japanese government decided to develop an original Japanese casemix grouping system based on existing hospital information systems. Our research team, called the Diagnosis Procedure Combination (DPC) research team, was established in 2001 for this purpose.
2 Basic Description of DPC To develop a comprehensive classification system, we generated a bird’s-eye view of the tasks involved, as shown in Fig. 1. In addition, to develop and continuously refine the logic behind groupings, we established sub-research groups to develop DPC-based methodologies for hospital management, hospital function evaluation, health service research, clinical research, and health policy making. To ensure a smooth introduction of the new scheme, we used an existing hospital information technology system—the claims data processing computer system. One of the outputs of this system is used for payment in the form of DPC e-claim, and another output (Form 1 and EF file) is used for further refinement of DPC classifications.
Fig. 1 Scope of DPC projects
Development of a Casemix System and Its Application in Japan
5
Form 1 corresponds to the minimum data set of the American DRG. It contains such information as demographic data (age, sex), date of admission and discharge, prognosis, admission and discharge path, diagnoses (principal diagnosis, co-morbidity, complications), and severity-related scores (NYHA score, cancer stage, etc.). Although the DPC-based tariff schedule is based on lump sum rates, each DPC hospital is required to submit detailed data on all procedures provided during hospitalization in an E file (charged cost data) and F file (procedure data). E and F files are used for re-evaluation of the DPC’s tariff schedule. Beginning in 2018, hospitals have also been required to submit an H file, which provides data on nursing activity. As shown in Fig. 2, the structure of the DPC code comprises 8 parts, each of which is defined in the definition table. The first part indicates the Major Diagnosis Category (MDC) and DPC serial number according to the International Classification of Diseases 10th revision (ICD10). The second part indicates the type of admission (the current version does not use this information for grouping). The third indicates the patient’s age and birth weight. The fourth indicates the existence and types of surgical procedures. The fifth and sixth indicate the existence of additional procedures and adjuvant therapies, including chemotherapy and radiotherapy. The seventh indicates the existence of co-morbidity/complications (CC), and the eighth indicates severity. Although these eight parts comprise the classification structure prototype, it should be noted that they are used for profiling, and that not all parts are necessarily used for determining the reimbursement schedule.
Fig. 2 Structure of DPC code
6
S. Matsuda
The DPC-based payment comprises two components: DPC component and Fee-For-Service (FFS) component. The DPC component corresponds to so-called hospital fees, which include those for hotels, pharmaceuticals and supplies used in wards, laboratory tests, radiological examinations, and procedures that cost less than 10,000 Japanese yen (JPY). The FFS component corresponds to tariffs for surgical procedures, pharmaceuticals and supplies used in operation rooms, and procedures that cost more than 10,000 JPY. For more details on the DPC system, please refer to Refs. [3, 4].
3 Application of DPC Data for Health Management As mentioned above, the purpose of introducing the DPC was not only to organize payment plans but also to increase the transparency of hospital activities. This section will describe the three main applications of the DPC system: improvement of the accountability of health organizations, strengthening the basis of clinical studies, and use in regional health planning. 1.
Amelioration of accountability of health organizations Before the introduction of the DPC system, there was no systematic data on hospital performance in Japan. Today, the Ministry of Health, Labour and Welfare (MHLW) provides annual DPC output data as shown in Table 1 [5]. This example shows the patient volume stratified by a principal diagnosis of cerebrovascular diseases for the Kitakyushu Health Care Region, Fukuoka prefecture. This type of information may be useful for patients to determine the clinical performance of individual acute care hospitals. In 2015, an Organization for Economic Co-operation and Development (OECD) report recommended that the Japanese government implement a systematic quality evaluation system of hospital activity [6]. It is important to note that a large number of hospital associations had already employed DPC data-based quality assessment projects, as shown in Table 2. This example shows the percentage of patients undergoing early stage rehabilitation for artificial knee replacement surgery (within 3 days after surgery) among the Saiseikai Hospital group [7]. That most hospital groups had adopted similar indicators suggested that it would not be difficult to establish a systematic nationwide quality assessment system in Japan. Furthermore, DPC used existing claims data processing systems. Therefore, it was expected to be relatively easy to develop a comprehensive quality assessment scheme that covers patients and care ranging from out- to in-patients and acute to chronic care.
2.
Strengthening the basis of clinical studies It is undeniable that good quality clinical research forms the basis of a good health care system. As DPC data contains very detailed information on procedures, the DPC database can be used to organize all relevant clinical studies.
16
–
14
11
–
–
–
Fukuoka shin-Mizum aki hospital
Shin Kom on ji hospital
Kyushu Rosa i hospital
O htem ach i hospital
U OEH hospital
Setetsu memoria1 hospital
JCHO Kyushu hospital
12
35
18
–
–
40
12
108
Source MHLW (2017) Note “–” indicates that the number of cases is less than 10
11
Sai seikai Yahata hospital
261
Cerebral aneurysm, unruptured
Subarachnoid hemorrhage
31
010030
010020
Kokura memoria1 hospita1
Hospita1
60
30
53
37
39
65
88
28
112
Intracranial hemorrhage, non-trauma
010040
010060
–
–
23
–
16
–
10
13
–
187
150
152
224
201
258
314
354
359
Subdural hem Cerebra1 atom a non-trauma infarction
010050
–
–
38
22
24
–
–
–
–
Sequelae of stroke
010069
Table 1 Patient volume in the Kitakyusyhu health care region for cerebrovascular diseases (2016 fiscal year; extracted)
–
66
10
13
18
18
19
70
180
Other cerebrovascular diseases
010070
Development of a Casemix System and Its Application in Japan 7
8
S. Matsuda
Table 2 An example performance indicator (Saiseikai hospital group; extracted) percentage of early stage rehabilitation for artificial knee replacement surgery (within 3 days after surgery) Hospital
Number of cases (annual)
2016 (%)
2015 (%)
2014 (%)
Yamagata saisei hospital
605
100.0
100.0
100.0
Yokohama east hospital
213
100.0
100.0
100.0
Nakatsu hospital
210
100.0
100.0
99.4
Takaoka hospital
158
100.0
100.0
100.0
Tondabayashi hospital
155
100.0
100.0
100.0
Kumamoto hospital
124
100.0
100.0
100.0 100.0
Suita hospital
120
100.0
100.0
Okayama saiseikai hospital
116
100.0
94.4
90.0
Toyama hospital
112
100.0
100.0
100.0
Niigata second hospital
97
100.0
100.0
100.0
Fukuiken saiseikai hospital
87
100.0
100.0
100.0
Noe hospital
80
98.8
100.0
100.0
Senri hospital
80
100.0
98.3
91.2
Yokohama south hospital
75
100.0
100.0
98.4
Shigaken hospital
70
100.0
100.0
100.0
Utsunomiya hospital
68
100.0
100.0
100.0
Matsuzaka general hospital
61
100.0
100.0
100.0
Today, our research team publishes more than 70 English-language papers annually, some of which have been used to provide valuable suggestions for evaluating health policy in Japan. For example, Murata et al. demonstrated that the greater the number of acute cholangitis cases, the greater the correlation between increased compliance with clinical guidelines and lower mortality rates [8]. Isogai et al. [9] revealed a negative relationship between hospital volume and cardiac complications of endomyocardial biopsy. Other papers based on DPC data have also indicated the positive effect of hospital volume on quality of care [10, 11]. These results suggest that undifferentiated hospital functions due to the existence of too many facilities, which is a key problem of the health service delivery system in Japan, might affect the quality of medical care. Furthermore, Fujino et al. showed that the use of regional clinical pathways significantly reduced the length of stay in hospital among stroke patients hospitalized in DPC hospitals [12]. In response to such evidence, the MHLW established the Regional Health Vision in 2017, which, based on published objective data, mandates that all health care regions aggregate hospital functions and establish cooperation systems among facilities. 3.
Use in regional health planning. As shown in Table 1, the Japanese hospital system has a fundamental problem with efficient service delivery. Specifically, there are too many small- and
Development of a Casemix System and Its Application in Japan
9
medium-sized hospitals, resulting in small numbers of cases at each hospital. This makes it difficult to allocate medical resources, including physicians, nurses and expensive medical devices. Recognition of the small number of cases at individual hospitals will prompt discussions on the necessity of concentrating hospital functions based on objective data. This may be one of the triggers for solving the fundamental problems mentioned above. In fact, discussions for restructuring the medical delivery system based on such data, including DPC data, have been organized in each health care region in Japan in the form of the Regional Health Vision Conference since 2017.
4 Conclusion Since its development 17 years ago, the DPC has become an integral part of the medical system in Japan. Based on the wide recognition of DPC, we are currently working on developing a new DPC scheme that covers chronic hospitalization and outpatients. However, its primary purpose is not to be used as a payment tool, but to measure the medical needs of the community and to performed appropriate financing. To conduct this study, an integrated grouping method is currently being developed to evaluate medical and activities of daily living care needs based on combined claims data from health insurance and long-term care insurance schemes. The research outcomes will be an important basis for future health policy in Japan. Disclosures There is no COI to declare. There was no financial support from any external organization. This article was written by the author alone.
References 1. Fetter RB, et al (1980) Case mix definition by diagnosis related groups. Med Care 18(2):1–53 (suppl) 2. Japan Medical Association Research Institute (1999) Report on validity of DRG, Tokyo (in Japanese) 3. Matsuda S (2008) Diagnosis procedure combination: the Japanese approach to casemix. In: Kimberly JR, de Pouvourville G, D’Aunno T (eds) The globalization of managerial innovation in Health care. Cambridge University Press, Cambridge, pp 254–271 4. Yasunaga H, Matsui, Horiguchi H, Fushimi K, Matsuda S (2014) Application of the diagnosis procedure combination (DPC) data to clinical studies. J UOEH 36(3):191–197 5. Ministry of Health, Labour and Welfare (2018) https://www.mhlw.go.jp/stf/shingi/shingichuo_128164.html. Accessed 11 Nov 2018 6. OECD: OECD Reviews of Health Care Quality: Japan (2015) https://www.oecd-ilibrary.org/ social-issues-migration-health/oecd-reviews-of-health-care-quality_22270485 7. Saiseikai (2014) Report on Quality assessment of health and social care of saiseikai http:// www.saiseikai.or.jp/about/clinical_indicator/h26/ Accessed 11 Nov 2018 8. Murata A, Matsuda S, Kuwabara K, Fujino Y, Kubo T, Fujimori K, Horiguchi H (2011) An observational study using a national administrative database to determine the impact of hospital volume on compliance with clinical practice guidelines. Med Care 49(3):313–20
10
S. Matsuda
9. Isogai T, Yasunaga H, Matsui H, Ueda T, Tanaka H, Horiguchi H, Fushimi K (2015) Hospital volume and cardiac complications of endomyocardial biopsy: a retrospective cohort study of 9508 adult patients using a nationwide inpatient database in Japan. Clin Cardiol 38(3):164–170. https://doi.org/10.1002/clc.22368 10. Yamamoto H, Hashimoto H, Nakamura M, Horiguchi H, Yasunaga H (2015) Relationship between hospital volume and hemorrhagic complication after percutaneous renal biopsy: results from the Japanese diagnosis procedure combination database. Clin Exp Nephrol 19(2):271–277 11. Yoshioka R, Yasunaga H, Hasegawa K, Horiguchi H, Fushimi K et al (2014) Impact of hospital volume on hospital mortality, length of stay and total costs after pancreaticoduodenectomy. BJS open. https://doi.org/10.1002/bjs.9420 12. Fujino Y, Kubo T, Muramatsu K, Murata A, Hayashida K, Tomioka S, Fushimi K, Matsuda S (2014) Impact of regional clinical pathways on the length of stay in hospital among stroke patients in Japan. Med Care 52:634–640
National Database of Health Insurance Claims and Specific Health Checkups of Japan (NDB)
The Present Status and Future Perspective of the National Database of Health Insurance Claim Information and Specified Medical Checkups of Japan (NDB) Naohiro Mitsutake
1 Introduction Japan’s government agencies have been collecting and maintaining massive volumes of data that can be described as “big data”. One of these big data initiatives is the National Database of Health Insurance Claim Information and Specified Medical Checkups of Japan (NDB), which was established by the Ministry of Health, Labour and Welfare (MHLW) in 2009. The NDB is one of the largest databases of healthcare data, and comprises a variety of healthcare-related information (claims data) from all Japanese citizens collected from all authorized insurance medical institutions (8,412 hospitals, 101,471 outpatient clinics, 68,609 dental clinics, and 57,789 outpatient pharmacies in 2014). The NDB is also scheduled to store long-term care insurance data from 2020 onward. Japan has an unprecedented super-aging population and low birthrate, and is now grappling with the problems stemming from increasing financial burdens on social security. As a consequence, there is an urgent need to rationalize medical and long-term care expenditures. Efforts to reform Japan’s healthcare system have been impeded by the inability to conduct evidence-based planning due to the lack of a suitable database. There are therefore high expectations for the NDB to fulfill this role. This chapter will describe the present state of the NDB while outlining comparisons with other countries, and discuss future challenges.
N. Mitsutake (B) Institute for Health Economics and Policy, Tokyo, Japan e-mail: [email protected] © The Author(s), under exclusive license to Springer Nature Singapore Pte Ltd. 2022 N. Nakashima (ed.), Epidemiologic Research on Real-World Medical Data in Japan, SpringerBriefs for Data Scientists and Innovators 1, https://doi.org/10.1007/978-981-16-6376-5_2
13
14
N. Mitsutake
2 National Database of Health Insurance Claim Information and Specified Medical Checkups of Japan 2.1 Claims Data (Medical Fee Statements) With regard to health insurance, when insured persons or their dependents are sick or injured, they, in principle, receive medical services and products (medical care, procedures, and drug dispensation) from medical care professionals (physicians, nurses, and pharmacists) in the form of benefits-in-kind. The benefit ratios are 80% for children before completion of compulsory education (9 years of education during elementary and junior high school), 70% after completion of compulsory education until the age of 69 years, 80% for the ages of 70 to 75 years, and 90% after the age of 75 years (70% for those with an income comparable to that of active workers). However, the patient is liable for cost-sharing at a fixed rate. Most patients pay 30% of the medical expenses directly to the provider. To recoup the remaining expenses for benefits, providers will present patient-level bills every month to insurers for reimbursement. These bills are known as medical fee statements (hereinafter referred to as claims data), with approximately 1.8 billion statements produced each year. Claims data are transactional data produced during the billing process for medical fees, and include approximately 7,000 types of medical procedures (e.g., surgeries and injections) and 20,000 types of drugs that are covered by insurance. In addition to recorded diagnoses, claims data also include detailed information of when and where (medical institution) each patient received medical services and products. In FY2016, the total expenditure (national health expenditure) of insured medical care reached 42.1 trillion yen, which accounted for approximately 7.8% of the gross domestic product. Over 50 years have passed since Japan introduced the universal health insurance system in 1961, and national health expenditures continue to rise annually. National health expenditures refer to the costs for medical services and products covered by public health insurance, and do not include costs for non-insured treatments such as non-prescription drugs and cosmetic surgery. Nevertheless, almost all medical services and products provided to the Japanese people can be considered to be within the confines of health insurance. The government of Japan began to collect and store these claims data from FY2009 onward. As claims data were originally available only as paper documents, their digitization required many years. For example, the then-Ministry of Health and Welfare attempted to implement data digitization in 1983, but ceased their efforts due to overwhelming opposition from the Japan Medical Association. However, Article 16(2) of the 5th revision of the Act on Assurance of Medical Care for Elderly People in FY2008 states that all information needed to produce prefectural health expenditure optimization plans and documents for investigations must be provided to the national government (Department in Charge: Office for Health Insurance System Enhancement, Health Insurance Bureau, MHLW). This revision therefore allowed the legal
The Present Status and Future Perspective …
15
Fig. 1 Flow of claims data and specified medical checkup data to the NDB
collection and storage of claims data. Unfortunately, this meant that all data before the law was enacted (i.e., before April 2009) could not be included in the NDB. Almost 100% of all claims data have become digitized in recent years (although the digitization of dentistry and home nursing claims data lags behind). After the aforementioned law was implemented, the NDB was constructed and the mechanism for the collection of data from insurers was completed. The NDB then began to collect and store all claims data from FY2009 (Fig. 1).
2.2 Specified Medical Checkup Data In April 2008, Japan introduced the Specified Medical Checkups and Specified Health Guidance system (generally referred to as medical checkups for metabolic syndrome). These medical checkups target all citizens aged 40–74 years, and include measurements on waist circumference, body mass index, blood pressure, lifestyle habits (such as smoking) from medical questionnaires, and blood glucose and lipid levels (triglycerides and high-density lipoprotein cholesterol) from blood tests. For example, the cut-off values for optimal waist circumference are 85 cm in men and 90 cm in women. If checkup participants are also found to have a risk of hypertension or diabetes that exceeds defined cut-offs, they must undergo specified health guidance to facilitate improvements in their lifestyle and health. The NDB also compiles data from these checkups. While there is currently no evidence that the Specified Medical Checkups and Specified Health Guidance system has reduced health expenditures, the mediumto-long-term analysis of NDB data is expected to show some degree of health expenditure optimization (containment) associated with this system.
16
N. Mitsutake
2.3 Data Format and Quantity Claims data are transactional data that are sent from medical institutions to insurers as comma-separated value (CSV) files with enumerated rows of insured medical services and products provided to each patient (Fig. 2). As such, the data do not facilitate analyses in their native format. In the NDB, the electronic claims data in the CSV format are segmented and stored as multiple records. The claims data are separated into the 4 categories of Medical (inpatient or outpatient), Diagnosis Procedure Combination (DPC), Drug Dispensation, and Dentistry. Every year, approximately 1.8 billion cases of claims data are separated into multiple records (totaling 37 billion) in the NDB, with almost 10 years’ worth of data currently stored. In addition, approximately 120 million cases of Specified Medical Checkups and Specified Health Guidance data have been collected since 2008. Fig. 2 Data format of medical fee statements
The Present Status and Future Perspective …
17
3 Current NDB Utilization The primary users of NDB data are the MHLW department in charge and the prefectural governments, who use the data to analyze and generate evidence for the rationalization of health expenditures. While third-party users (who do not belong to the MHLW or related ministries/municipalities) may also use NDB data for research purposes, they must first obtain authorization from a council that oversees the provision of claims data and other information, and their research must fulfill the prerequisites of serving the public interest and aiming to improve the quality of medical services. The threshold for authorization is extremely high, and only 6 out of 43 applications were approved the first time that third-party researchers could apply to use NDB data. There were 9 approved applications in 2012 and 3 approved applications in 2013, with a total of approximately 100 approved applications until FY2018. The low number of approved applications for NDB use has been attributed to the following: (1) There are practical difficulties in providing the applicants’ desired data items from the stored data, (2) The applicants lack a clear understanding of the various prerequisites and necessary information for data provision, and (3) the NDB data providers have not presented adequate information to potential applicants. In addition to the aforementioned reasons, this author believes that there are other factors related to the NDB data terms of use. First, the specified scope of a potential user’s application also limits the analytical methods that can be applied. Potential users must specify in detail their desired data items and study period during the application process. As a consequence, they are unable to conduct exploratory analyses through trial and error, and cannot add new research topics midway. Also, users must obtain MHLW approval before they can publish any of their findings from NDB data. Therefore, applicants must indicate their intended publication routes (e.g., journals and conferences) from the start. In addition, users can—in principle—copy the data only once, and must follow a variety of strict security regulations that include using and storing the data in a locked room, managing room access, and not taking the data out of the approved location. Users must also comply with on-site inspections of the utilization site by external inspectors. Among the universities and research institutes that received approval for NDB use, many had to obtain new physical locations as utilization sites or install access control/recording devices in order to fulfill the criteria specified in the terms of use. In this way, many researchers forgo application due to funding limitations. Furthermore, researchers are not allowed to publish aggregate units of 10 people or less (including counts of zero) to ensure patient privacy. This rule also precludes the publication of time series analyses in which an intervention results in patient numbers declining to zero. The NDB has ostensibly implemented these strict measures because it deals with data that is essentially personal information. However, personal information (e.g., names and addresses) in claims data is anonymized through hashing before being provided to analysts, making it impossible to identify individuals.
18
N. Mitsutake
4 Case Study This author had the opportunity to use all FY2010 data in the NDB, and was able to obtain several results. Thus far, patient numbers in Japan have been based on fundamental statistics available in the MHLW’s Patient Survey. However, that survey extrapolates data from a sample of inpatients and outpatients surveyed at medical institutions during one day out of three specified days in the middle of October every year. As a result, the survey cannot support predictions for patients with seasonal conditions, such as influenza in winter and allergic rhinitis in spring. In contrast, the NDB contains all claims data and allows aggregation of patient numbers according to month. For example, the numbers of outpatients with allergic rhinitis were 1.7 million in January, 2.7 million in February, and peaked at 4.5 million in March. However, this number dropped to 1.8 million in April. Furthermore, the prefecture-level data enabled the visualization of the regional shift in disease occurrence as it moved from the Kyushu region to the Kanto and Tohoku regions (Fig. 3). From FY2012 onward, it became compulsory to produce daily tabulations for electronic claims data. Therefore, it will be possible to conduct more detailed analyses at the daily level, such as daily procedures and drug dispensation in individual patients. As the NDB not only includes data on recorded diagnoses, but also data on medical services and products, users will be able to determine the specific quantities, medical institutions, regions, and periods in which anti-influenza drugs are prescribed to patients.
Fig. 3 Time-based changes in the numbers and regional distribution of outpatients with allergic rhinitis
The Present Status and Future Perspective …
19
5 Comparisons with Other Countries South Korea and Taiwan have also implemented universal health insurance and pointbased medical fee reimbursement systems similar to those of Japan. Both countries had designed and implemented their systems after reviewing the merits and demerits of Japan’s systems, and were able to achieve computerization from the start. Their claims data have been actively used in research, with over 100 cases of data provision every year (115 cases in South Korea and 270 cases in Taiwan in 2013). If researchers who apply to use claims data in South Korea and Taiwan submit a signed agreement and receive approval, they are able to conduct analyses without being restricted by the stringent terms of use imposed in Japan (Table. 1).
6 Conclusions Through the continued use of the NDB, it became clear that there was a need to verify the accuracy of the stored data (heretofore, the accuracy of all NDB data has not been tested or published). This author analyzed NDB data from FY2010 and published the following points. First, there are outpatient data from clinics that cannot be integrated with drug dispensation data, which may have led to an underestimation of outpatient expenditures. Second, there are insurers for which specified medical checkup data cannot be integrated with claims data (a recent paper has noted the low linkage rate between claims data and specified medical checkup data). Third, there are issues with identification numbers in the NDB, such as the amount of unique identification numbers exceeding the entire Japanese population. Claims data also do not contain accurate information on patient mortality. A solution to this issue is the compilation of master files comprising insurance enrollee ledgers that are updated daily to allow insurers to confirm insurance fee collections and enrollee statuses. Such ledgers include information on insurer changes (such as changes due to death, marriage, and enrollment in public assistance), and would therefore be able to complement the information available in the NDB. However, the generation of insurance enrollee ledgers is not mandated under Japanese law, and their collection is presently outside the government’s purview. There are similar challenges in the Specified Medical Checkups and Specified Health Guidance data, as these are limited to insured persons who participate in the checkups. Accordingly, there are no data from individuals who do not participate in these checkups. As insurers also possess master files on the participants of Specified Medical Checkups and Specified Health Guidance, the solution to this problem is similar to that of claims data. To address these issues, we have tested a new identification system to improve data integration accuracy, and designed a death identification algorithm that utilizes machine learning.
Ministry of Health, Labour and Welfare (MHLW)
In accordance with the Act on Assurance of Medical Care for Elderly People (Article 16.2), the Health Insurance Bureau of the MHLW collects data on health insurance claims, specified medical checkups, and specified health guidance from all insurers to create a database Health insurance claims data: 99% of total health insurance claims (excluding paper-based claims)
Data archiving agency
Brief summary of data
Japan
South Korea has achieved near-complete digitization of medical insurance claims with the creation of the Electronic Data Interchange (EDI) database, which stores accumulated claims data for insured patients. Several statistical analyses of these claims data have been conducted and made public online. In South Korea, however, medical insurance does not always cover all clinical practices. For example, when universal health care for all citizens was introduced in 2000, magnetic resonance imaging was not yet a reimbursable service. The EDI is therefore not a complete record of all clinical interventions
Health Insurance Review Agency (HIRA)
South Korea
Table 1 Status of secondary use of health insurance claims data (third-party provision) by country
(continued)
The database of this program contains registration files and original claims data for reimbursement. Large de-identified digitized databases derived from this system by the BNHI and maintained by the NHRI are provided to scientists in Taiwan for research purposes The database includes registration files and original claims data for reimbursement from 1996 onward
Bureau of National Health Insurance, Taiwan (BNHI) and National Health Research Institutes (NHRI)
Taiwan
20 N. Mitsutake
Handled as a contract violation between the MHLW and the applicants/users. The violation code is regulated according to guidelines (notification to the director and prohibition of use)
2011
Fiscal year 2012: 9 cases
Countermeasures against inappropriate use (such as data breaches or unintended use) and their rationale
Initial year of data provision
Past record of annual data provision
Japan
The Office for Health Insurance System Enhancement, Health Insurance Bureau (MHLW) and prefectural/municipal governments will use the data when creating health expenditure optimization plans Unintended use: researchers (applicants) can request for the extraction or creation of summarized tables of individual data from the data center via the MHLW
Purpose of data provision
Table 1 (continued)
Fiscal year 2013: 115 cases
2012
If applicants violate the stipulations of the utilization contract, they must accept all liabilities and civil/criminal penalties. In addition, their future use of HIRA data will be prohibited
Based on the Act on Promotion of the Provision and Use of Public Data (Article 3, Basic Principles), public data are provided in a usable form
South Korea
Fiscal year 2013: 270 cases
2000
The Computer-Processed Personal Data Protection Act (1995) stipulates the penalties and fines for violations. If a researcher violates the agreements of the contract, the research director, researcher, and all collaborators will receive notifications to discontinue their use of data; all data must be returned
Data are provided to increase their use in academic research, and to increase the added value of national health insurance
Taiwan
The Present Status and Future Perspective … 21
22
N. Mitsutake
Despite the issues described above, the NDB is a globally unique and highly valuable database. This is attributable to Japan’s implementation of the universal health insurance system, which enables the incorporation of all records of insured medical services and products (claims data) provided at all insured medical institutions throughout the country. Although population decline due to the low birthrate and increased aging is expected, Japan is currently the 10th most populous country in the world, and the NDB provides data from the entire population. The utilization of big data in the medical field is still in its developmental stage, but recent years have seen the creation of databases that are far larger than the NDB and the development of technologies that enable the combination and high-speed processing of such data. In any generation, health and medical problems are consistently topics of great interest. Japan’s population is projected to drop to 100 million by 2030, with 40% aged 65 years or older. This will place an enormous strain not only on health expenditures, but also on social security expenditures (including long-term care expenditures and pensions). With the addition of long-term care insurance data in the NDB from 2020, the next-generation NDB will not only enable analyses such as “what types of diseases did a patient have in the past and what medical care did he/she receive?”, but will also be able to support analyses such as “after a patient developed a condition that requires long-term care, what kind of medical and long-term care services did he/she receive?”. The optimization of healthcare is of the highest priority, and the combined use of various sophisticated predictive models and big data processing technologies is expected to provide useful tools to streamline medical and long-term care expenditures. There are various stakeholders (patients, medical care professionals, insurers, medical associations, and national governments) in healthcare, and it is important to build social consensus toward the utilization of claims data while clearly presenting both the merits of utilizing such data and the demerits of handling personal information.
Surveillances for Non-communicable Complex Diseases by National Databases of Health Insurance Claims and Specific Health Checkups of Japan Naoki Nakashima
Non-communicable diseases (NCD), such as diabetes mellitus, hypertension, and dyslipidemia, are very common in Japan. NCDs are strong risk factors for heart disease and stroke, which are the second and the third causes of deaths in Japan, respectively [1]. Additionally, in Japan, diabetes mellitus is also the main cause of hemodialysis and blindness. A recent study reported that diabetes mellitus increases cancer affliction, which is the top cause of deaths in Japan [2]. Accordingly, NCDs result in increased medical care costs and also reduce labor productivity [3]. The Ministry of Health, Labour and Welfare regularly publishes the results of sampling surveillance of NCD prevalence. In 2016, there were 10 million prediabetics and 10 million diabetic Japanese patients out of the total Japanese adult population of 102 million [4]. In 2017, pre-hypertension (normal high blood pressure) was observed in 22 million; hypertension, in 41 million; and dyslipidemia, in 21 million [5] (Fig. 1). However, these were the combined results of the surveillance of single diseases; consequently, the total prevalence of NCD was 306 million, even though the Japanese adult population is only 102 million (Fig. 1). The different NCDs are similar to each other not only in pathogenesis, pathology, and consequent complications but also in the treatment. Therefore, statistics of concurrent NCDs and the combined treatment status should be considered. Hence, we explored NCDs for concurrent affliction and treatment situation by National Databases of Health Insurance Claims and Specific Health Checkups of Japan (NDB). In Fig. 2, level 0 indicates no diagnosis of NCDs in the personal claim data; level 1, diagnosis of NCDs without any prescription (likely regular blood/urine test or N. Nakashima (B) Medical Information Center, Association of Medical Informatics, Kyushu University Hospital, Fukuoka, Japan e-mail: [email protected] © The Author(s), under exclusive license to Springer Nature Singapore Pte Ltd. 2022 N. Nakashima (ed.), Epidemiologic Research on Real-World Medical Data in Japan, SpringerBriefs for Data Scientists and Innovators 1, https://doi.org/10.1007/978-981-16-6376-5_3
23
24
N. Nakashima
Fig. 1 Combined results of sampling statistics of NCDs by the ministry of health, labour and welfare [4, 5]
Fig. 2 Single disease statistics for three NCDs (diabetes mellitus, hypertension, and dyslipidemia) show a total of 306 million affected Japanese adults; this number can be condensed to 102 million using a counting combination method with NDB
Surveillances for Non-communicable Complex Diseases …
25
Fig. 3 A total of 27 classification patterns exist from level 0 to 2
with diet/exercise therapy); and level 2, diagnosis of NCDs with the prescription of medicines. These definitions slightly differ from the original ones showing “phase 0–2” presented in Fig. 1; however, we found that we could classify all the 102 million adults into 27 patterns (Fig. 3). For example, an individual with diabetes and pre-hypertension but no dyslipidemia can be classified as “D2H1L0.” Using this classification method, we classified the 102 million adults into 27 patterns (Figs. 4 and 5) in 2009–2014. Level 1 classification (NCD diagnosis without prescription) is shown in Fig. 4; the width of the horizontal scales is 5 million. The graph shows a growing curve from 2009 to 2014. However, it does not merely suggest that pre-NCD increases during the first half of the observation period; this is because the initial stages (2009–2011) of NDB occurred when the nationwide digitalization rate of claim data was still increasing. It is noteworthy that the largest group was D1H1L1, and unknown why, but we suspect that an increase in metabolic syndrome, a common cause of these NCDs, is likely part of the reason. Figure 5 shows the level 2 groups that include at least one NCD. In this graph, levels 0 and 1 in the same NCD are combined into one color for easier understanding. The biggest single NCD affliction group was hypertension, followed by dyslipidemia. In the double NCD affliction group, hypertension and dyslipidemia were the most common. Interestingly, there were more single hypertension cases than double hypertension ones and more dyslipidemia cases than single dyslipidemia ones. The prevalence of hypertension was the highest perhaps because it is the easiest to detect as blood pressure is easy to test often; therefore, hypertension appears to be the
26
Fig. 4 Annual changes in level 1
Fig. 5 Annual changes in level 2
N. Nakashima
Surveillances for Non-communicable Complex Diseases …
27
Fig. 6 Comparison of numbers between 3 levels (0–2) and among 27 patterns
only group with a high prescription rate. In contrast, dyslipidemia treatment may be started at the beginning of or during treatment for hypertension. Additionally, the number of D2H2L2 cases, which includes individuals with all three NCD, was approximately 2 million. Surprisingly, focusing on diabetes mellitus, D2H2L2 is the biggest group compared with than any other D2 groups (D2H0L0–2, D2H1L0–2, D2H2L0–1). These results show that diabetes mellitus is a complex disease. Figures 4 and 5 do not indicate any noteworthy annual changes in the subgroups. Next, we compared the numbers of cases between levels 0, 1, and 2 in 2014, which is the newest data year in Fig. 6. Of the total Japanese adult population of 102 million, the number of level 0 cases was 31 million; level 1, 43 million; and level 2, 28 million. However, we should be careful in defining D0H0L0 as a necessarily healthy population because it does include citizens who ignore existing NCDs. Thus far, we have only used the claim DB in NDB; however, NDB also has an anonymous nationwide health checkup database of 27 million (52% of 52 million, 40–74 years old, Japanese citizens). We plan to use these data to correct the D0H0L0 population in a future study. This study is still ongoing. In the future, we plan to conduct a longitudinal study with data from 2009 to 2014 or with newer data that we are currently collecting. For example, we aim to determine which level 1 subgroup in early years will suffer from NCD at level 2 later on, and similarly, which level 2 subgroup will progress to
28
N. Nakashima
more serious complications later (levels 3 or 4; Figs. 2 and 3 and similarly phase 3 or 4; Fig. 1). These data can also help determine preventative measures for NCD and avoid serious complications.
References 1. Kurotani K, Akter S, Kashino I, Goto A, Mizoue T, Noda M, Sasazuki S, Sawada N, Tsugane S (2016) Japan public health center based prospective study group quality of diet and mortality among Japanese men and women: Japan public health center based prospective study. BMJ 22:352:i1209. https://doi.org/10.1136/bmj.i1209 2. Yokomichi H, Nagai A, Hirata M, Kiyohara Y, Muto K, Ninomiya T, Matsuda K, Kamatani Y, Tamakoshi A, Kubo M, Nakamura Y (2017) BioBank Japan cooperative hospital group, Yamagata Z Survival of macrovascular disease, chronic kidney disease, chronic respiratory disease, cancer and smoking in patients with type 2 diabetes: biobank Japan cohort. J Epidemiol 27(3S):S98–S106. https://doi.org/10.1016/j.je.2016.12.012. 3. Chaker L, Falla A, van der Lee SJ, Muka T, Imo D, Jaspers L, Colpani V, Mendis S, Chowdhury R, Bramer WM, Pazoki R, Franco OH (2015) The global impact of non-communicable diseases on macro-economic productivity: a systematic review. Eur J Epidemiol 30(5):357–395. https:// doi.org/10.1007/s10654-015-0026-5 4. Ministry of Health, Labour and Welfare (2017) The National Health and Nutrition Survey in 2016, published in 2017 5. Ministry of Health, Labour and Welfare (2018) The National Health and Nutrition Survey in 2017, published in 2018
Powerful Analytics Platform for National-Scale Database of Health Care Insurance Claims Kazuo Goda and Masaru Kitsuregawa
Japan has been continuously building a national-scale insurance claims database by collecting all the insurance claims data from all the public health care insurers since 2009. These insurers cover almost all the health care services provided to Japanese citizens. Hence, the database has the high potential to enable a thorough and deep understanding of the reality of medical services and to allow the precise and dynamic optimization of the health care system. In 2012, we came to know that health care researchers had difficulty performing analytics on the database due to its scale and complexity. Approximately 126 million Japanese citizens are covered by the claims database, and they produce 1.76 billion claims every year. To our knowledge, this is one of the world’s largest examples of health care big data. Our research group at UTokyo had been studying database technology, a part of computer science. Back in those days, we invented a novel database execution idea called out-of-order database execution (OoODE), which had the potential to significantly accelerate database queries (up to three orders of magnitude compared with the conventional serial execution) [1]. We thought that our technology could resolve the performance issues that the health care researchers confronted in using the national-scale claims database. Thus, we started a joint project with health care researchers to develop and operate a new powerful analytics platform, which employed the newborn OoODE technology to overcome the scale and complexity issues and drive the researchers’ analytics work. In the initial phase, a one-year anonymized portion of the national-scale claims database was officially provided to our project under a special third-party data provision framework. Data were then inserted into the first-generation analytics platform that we designed and implemented on top of our experimental database cluster system. Concurrently, we initiated discussions with health care researchers K. Goda (B) · M. Kitsuregawa The University of Tokyo, Tokyo, Japan e-mail: [email protected] © The Author(s), under exclusive license to Springer Nature Singapore Pte Ltd. 2022 N. Nakashima (ed.), Epidemiologic Research on Real-World Medical Data in Japan, SpringerBriefs for Data Scientists and Innovators 1, https://doi.org/10.1007/978-981-16-6376-5_4
29
30
K. Goda and M. Kitsuregawa
Fig. 1 Structural overview of the analytics platform
and learned that their deliberation process often evolved with a new idea after an iteration of comprehensive and focused surveys of the database. Potentially, many of their surveys could be grouped into several typical patterns. To facilitate this iteration, we decided to develop a separate tool for each survey pattern with a user-friendly interface on top of the underlying database infrastructure. This hybrid solution, where the analytics tools were vertically structured, and the infrastructure was horizontally shared, eventually gained a good reputation from the health care researchers. This is because (1) the users could easily and intuitively input their survey queries without learning any programming skills [2], and (2) the query requests were answered within an acceptable amount of time (typically seconds to minutes) even though they were processed through the national-scale database. In parallel, our analytics platform came to accommodate insurance claims data provided from more than a hundred regional public insurers. This data contained additional information that was not contained in the national-scale database, greatly helping us to study the regional health care system and to explore the future nationalscale database design (Fig. 1). With continued efforts, the analytics platform succeeded in revealing many factual aspects of Japan’s and its regional health care systems. One example was that more than 50% of antibiotic prescriptions in Japan were directed toward infections for which antibiotics were generally not indicated [3]. Other findings included the nationwide structures of health care expenses, the geographical distribution of chronic diseases, and the regional patients’ visiting behaviors, all of which had been practically impossible to explore before then. As the power of the analytics platform was gradually recognized, we were allowed to extend the data provided from the original database. As of March 2019, the platform hosted a six-year claims dataset mostly covering all citizens. This extension opened a new gate for longitudinal analytics. In
Powerful Analytics Platform for National-Scale Database …
31
addition, to improve the data quality and assist the exploration process, we developed and applied new analytics technologies such as graph processing and machine learning [4, 5]. For example, a recently invented learning algorithm successfully classified drug prescription trends for specific diseases and identified changes in temporal trends. In 2017, we launched the second-generation platform1 in order to extend the platform capacity and capability to meet the users’ growing demand for analytics. Our next dream is to substantially accelerate the cycle of data collection, idea exploration, and verification. If this entire process could be performed on a daily or hourly basis, the national health care system might become much more dynamically adjustable. We believe that this helps improve the precision, efficiency, and resiliency of the health care system.
References 1. Goda K, Hayamizu Y, Yamada H, Kitsuregawa M (2020) Out-of-order execution of database queries. Proc VLDB Endow 13(12):3489–3501 2. Sato J, Goda K, Kitsuregawa M, Nakashima N, Mitsutake N (2019) Novel analytics framework for universal healthcare insurance claims database. In: Proceedings of the 17th world congress of medical and health informatics (MedInfo 2019), pp 1578–1579 3. Hashimoto H, Saito M, Sato J, Goda K, Mitsutake N, Kitsuregawa M, Nagai R, Hatakeyama S (2019) Indications and classes of outpatient antibiotic prescriptions in Japan: a descriptive study using the national database of electronic health insurance claims, 2012–2015. Int J Infect Dis 91:1–8 4. Umemoto K, Goda K, Mitsutake N, Kitsuregawa M (2019) A prescription trend analysis using medical insurance claim big data. In: Proceedings of 35th IEEE international conference on data engineering (ICDE 2019), pp 1928–1939 5. Sato J, Yamada H, Goda H, Kitsuregawa M, Mitsutake N (2019) enabling patient traceability using anonymized personal identifiers in Japanese universal health insurance claims database. In: Proceedings of the AMIA 2019 informatics summit, pp 345–352
1
The nickname is Super-fast Super-interdisciplinary Japanese Medical Insurance Claims Big Data Analytics Platform System, abbreviated SFINCS (pronounced “sphinx”).
Panoramic View of Diabetes from a Standpoint of the NDB (National Database) Mitsuhiko Noda, Atsushi Goto, and Naohiro Mitsutake
Based on the result with nationwide 11,191 subjects analyzed from the data of the National Health and Nutrition Survey which was conducted across Japan during the year 2016, it is estimated that approximately 10 million people are “strongly suspected of having diabetes”, which is admitted to be an almost equivalent condition to that of having diabetes; the number has been also reported to be on a slight upward trend. Although this survey is widely utilized for countermeasures for diabetes and other purposes in Japan, there are also issues such as limited number of sample size. On the other hand, the National Database (NDB) is one of the world’s largest medical databases that collects most of the healthcare insurance claims of medical procedures performed in Japan and whole results of the “Specific Health Checkups” as well. Because the database includes not only medical services such as examinations and prescriptions but information ranging over multiple diseases, it is possible to analyze the situation of comorbidity, and is also conceived to be suitable for analyses aimed at regional characteristics and secular trends of both diseases and healthcare procedures in Japan. In this paper, using individual data of the NDB, we will present the results of analyses on the transition of the estimated number of patients with diabetes over a recent period of time as well as situation of comorbidities with other lifestyle-related diseases such as hypertension and dyslipidemia (Fig. 1). It is also feasible to analyze implementation rate of the standard medical care for diabetes using data from the NDB. M. Noda (B) Ichikawa Hospital, International University of Health and Welfare, Chiba, Japan e-mail: [email protected] A. Goto Graduate School of Data Science, Yokohama City University, Kanagawa, Japan N. Mitsutake Institute for Health Economics and Policy, Tokyo, Japan © The Author(s), under exclusive license to Springer Nature Singapore Pte Ltd. 2022 N. Nakashima (ed.), Epidemiologic Research on Real-World Medical Data in Japan, SpringerBriefs for Data Scientists and Innovators 1, https://doi.org/10.1007/978-981-16-6376-5_5
33
34
M. Noda et al.
Fig. 1 Estimated number of patients with diabetes for recent each fiscal year classified by other lifestyle-related diseases
Nephrology Research in the NDB Keiichi Sumida, Ryoya Tsunoda, Hirayasu Kai, Masahide Kondo, and Kunihiro Yamagata
Chronic kidney disease (CKD) is a significant public health problem worldwide with increasing prevalence and poor outcomes such as cardiovascular disease, endstage kidney disease (ESKD), and mortality, and also consumes a disproportionate amount of financial resources [1]. Especially, patients with advanced stages of CKD transitioning to ESKD that requires dialysis treatment suffer from an exceptionally high health and economic burden [2]. In Japan, where the population is super-aging [3], the prevalence of patients with CKD has been reported to be higher than in other countries, with the number of patients estimated to be 14.8 million, corresponding to ~15% of the general adult population [4]. Despite numerous advances in our understanding of CKD progression, the incidence of ESKD remains exceedingly high, and as many as ~39,000 patients annually transition from advanced CKD to maintenance dialysis in Japan [5], leaving the incidence rate of ESKD in Japan as one of the highest among industrialized nations [6]. According to the annual survey of the Japanese Society for Dialysis Therapy (JSDT), the number of patients with ESKD receiving dialysis treatment was reported to be 329,609 as of the end of 2016 [5], which is projected to increase year by year, albeit at a slower pace than before. Given the Japan’s demographic trend of super-aging that has been closely associated with higher incidence of CKD and ESKD [7] and its substantial burden on health systems and national economies, it is of paramount importance to improve early detection K. Sumida · R. Tsunoda · H. Kai · K. Yamagata (B) Department of Nephrology, Faculty of Medicine, University of Tsukuba, Tsukuba, Japan e-mail: [email protected] K. Sumida Division of Nephrology, Department of Medicine, University of Tennessee Health Science Center, Memphis, TN, USA M. Kondo Department of Health Care Policy and Health Economics, Faculty of Medicine, University of Tsukuba, Tsukuba, Japan © The Author(s), under exclusive license to Springer Nature Singapore Pte Ltd. 2022 N. Nakashima (ed.), Epidemiologic Research on Real-World Medical Data in Japan, SpringerBriefs for Data Scientists and Innovators 1, https://doi.org/10.1007/978-981-16-6376-5_6
35
36
K. Sumida et al.
of high-risk individuals and identify modifiable risk factors and interventions that could help prevent or delay the progression of CKD and ameliorate the subsequent risk of adverse clinical outcomes. Over the years, a number of clinical studies have been conducted to elucidate the role of various characteristics in the development of clinical outcomes among CKD patients using large-scale databases including a nationwide health check-up program of the general population [4, 8–10]. However, one of the biggest challenges nephrologists have been faced with is to properly ascertain the incidence of ESKD throughout the course of the disease, largely due to the lack of large databases linking pre-ESKD (i.e., non-dialysis dependent CKD) data to post-ESKD registries such as the JSDT Renal Data Registry (JRDR), a nation-wide ESKD registry system developed by the JSDT. Moreover, the epidemiological and demographic data of patients with ESKD in Japan have been estimated based solely on a voluntary year-end questionnaire survey by the JSDT, with a primary focus on the ESKD patients treated with either hemodialysis or peritoneal dialysis [5]. Therefore, despite its exceptionally high response rate of >95% from all dialysis facilities across Japan, there still remain difficulties in capturing the whole ESKD patient population, particularly those who received pre-emptive kidney transplantation (KT) or KT after short-perioperative dialysis all of whom could not be registered under the current JSDT registry. Considering the recent increase in the number of KT patients and the need for international comparisons of the annual incidence and prevalence of ESKD in which most other countries include the sum of dialysis (i.e., hemodialysis and peritoneal dialysis) and KT patients, it is important to comprehensively identify the total ESKD population in Japan (Fig. 1) [6]. Furthermore, from a research perspective, identifying ESKD patients with specific information about their onset of dialysis initiation or KT is vital to longitudinally examine the risk for incident ESKD in epidemiological studies. In this context, the recent release of the National Database of Health Insurance Claims and Specific Health Checkups of Japan (NDB) for research purposes is one of the major breakthroughs in the field of clinical research in nephrology, with substantial potential to provide not only fundamental epidemiological data on CKD and ESKD in Japan but also novel insights into understanding the underlying mechanisms for the development and progression of CKD and exploring effective therapeutic strategies against both CKD and ESKD. More specifically, with the use of the NDB in which health insurance claims are available in each individual patient on a monthly basis, patients who newly initiated dialysis treatment (either hemodialysis or peritoneal dialysis) can be easily identified by ascertaining de novo appearance of specific health insurance claims related to dialysis treatment (e.g., claims for dialysis procedures, management, etc.). Similarly, patients who underwent KT can be captured by ascertaining de novo appearance of insurance claims associated with specific surgical procedures for KT. In addition, the access to the NDB could allow us to unravel the prevalence of rare kidney diseases in Japan and also help clarify real-world treatment patterns among certain patient populations like ESKD. Furthermore, all of these findings could be analyzed by strata such as age, gender, and regions (e.g., by prefectures).
Nephrology Research in the NDB
37
Fig. 1 Incidence rate of treated ESKD (per million population/year), by country, in 2016 [6]
Meanwhile, as with all epidemiological studies, results from the NDB need to be interpreted with acknowledgment of several limitations. In addition to the inherent limitations of health insurance claims database (e.g., discrepancies between disease names given and actual disease status), information about patients who received publicly funded healthcare (e.g., welfare benefit) before January 2017 is not available. Also, especially when performing stratified analyses in a small number of population such as peritoneal dialysis patients, the number of subgroups consisting of less than 10 individuals is countable but not available under the current NDB platform to avoid personal identification; and hence, the number of populations containing such subgroups could be underestimated. In summary, the exhaustive nature of the NDB has paved the way for future research in the field of nephrology, providing unprecedented opportunities for new
38
K. Sumida et al.
innovative discoveries that could further advance the care of patients with CKD and ESKD in Japan. Acknowledgements This study was supported by AMED under Grant Number JP18ek0310010. Opinions expressed in this article are those of the authors’ and should in no way be viewed as the official policy or interpretation of the Ministry of Health, Labor and Welfare. Disclosures None of the authors have relevant conflicts of interest.
References 1. Levey AS, Atkins R, Coresh J et al (2007) Chronic kidney disease as a global public health problem: approaches and initiatives—a position statement from kidney disease improving global outcomes. Kidney Int 72(3):247–259 2. Eckardt KU, Coresh J, Devuyst O et al (2013) Evolving importance of kidney disease: from subspecialty to global health burden. Lancet 382(9887):158–169 3. Arai H, Ouchi Y, Toba K et al (2015) Japan as the front-runner of super-aged societies: perspectives from medicine and medical care in Japan. Geriatr Gerontol Int 15(6):673–687 4. Nagai K, Asahi K, Iseki K, Yamagata K (2021) Estimating the prevalence of definitive chronic kidney disease in the Japanese general population. Clin Exp Nephrol 25(8):885–892 5. Japanese Society of Dialysis Therapy (2016) An overview of regular dialysis treatment in Japan as of Dec 2016. http://docs.jsdt.or.jp/overview/. Accessed 29 Nov 2018 6. Saran R, Robinson B, Abbott KC et al (2019) US Renal Data System 2018 annual data report: epidemiology of kidney disease in the United States. Am J Kidney Dis Official J Nat Kidney Foundat;73(3)Suppl1:A7–A8 7. Nitta K, Okada K, Yanai M, Takahashi S (2013) Aging and chronic kidney disease. Kidney Blood Press Res 38(1):109–120 8. Yamagata K, Ishida K, Sairenchi T et al (2007) Risk factors for chronic kidney disease in a community-based population: a 10-year follow-up study. Kidney Int71(2):159–166 9. Yamagata K, Yagisawa T, Nakai S et al (2015) Prevalence and incidence of chronic kidney disease stage G5 in Japan. Clin Exp Nephrol 19(1):54–64 10. Yamagata K, Makino H, Iseki K et al (2016) Effect of behavior modification on outcome in early- to moderate-stage chronic kidney disease: a cluster-randomized trial. PLoS One. 11(3):e0151422
Medical Information Database Network (MID-NET)
Drug Safety Assessment and the MID-NET® (Japanese Medical Information Database Network) Mitsune Yamaguchi, Fumitaka Takahashi, and Yoshiaki Uyama
1 Introduction In recent years, the access to new drugs has dramatically improved in Japan due to the shortened review time and increasingly simultaneous global drug development based on multiregional clinical trials [1, 2]. Meanwhile, post-marketing drug safety assessment has gained importance since an increasing number of new drugs with few clinical experiences in foreign countries have become available in Japan. Herein, we describe the drug safety assessment practice adopted by the Pharmaceuticals and Medical Devices Agency (PMDA) as well as a Japanese initiative to establish MID-NET® (Medical Information Database NETwork) for post-marketing drug safety evaluation.
2 Safety Data Available for Drug Approval Various types of data such as those related to the quality, efficacy, and safety of a drug are usually available for regulatory review for approval. With regard to safety, the data obtained from clinical trials as well as non-clinical studies are submitted to a regulatory agency for benefit/risk evaluation. However, it might not be possible to examine all safety profiles of a drug at the time of drug approval due to limited available data. For example, very old patients are usually excluded from clinical trials [3]. Furthermore, an adverse event with very low frequency may not be identified within a limited sample size of patients enrolled in the clinical trials. Concomitant M. Yamaguchi · F. Takahashi · Y. Uyama (B) Office of Medical Informatics and Epidemiology, Pharmaceuticals and Medical Devices Agency, Tokyo, Japan e-mail: [email protected] © The Author(s), under exclusive license to Springer Nature Singapore Pte Ltd. 2022 N. Nakashima (ed.), Epidemiologic Research on Real-World Medical Data in Japan, SpringerBriefs for Data Scientists and Innovators 1, https://doi.org/10.1007/978-981-16-6376-5_7
41
42
M. Yamaguchi et al.
medications and disease complications are usually more simplified in clinical trials than clinical practice. Therefore, even when all efforts are made to establish the safety profile of a new drug for regulatory approval, the continuous post-marketing safety assessment remains important to assure a positive benefit/risk balance for such drug in clinical practice after approval.
3 PMDA’s Initiative to Utilize a Medical Information Database for Drug Safety Assessment The post-marketing drug safety assessment conducted by PMDA has usually been based on spontaneous adverse event reports (SAERs), scientific literature, and safety measures taken by foreign regulatory agencies. It has been reported that safety regulatory actions, such as changes of a drug label, in US and Japan are mainly based on SAERs [4, 5]. SAERs contain useful information in terms of circumstantiality such as the temporal linkage between drug administration and an event as well as the event time course of the laboratory test result; however, some limitations of SAERs are well known, including the unavailability of a denominator and reporting bias due to different clinical judgments of SAERs among physicians [5–7]. In Japan, the marketing authorization holder (i.e., the pharmaceutical industry) has usually conducted a post-marketing observational study upon primary data collection, however in most cases a single cohort study was conducted without comparators. Consequently, although the general safety profile of a drug was better understood, a risk comparison with other drugs was difficult to draw. This might be the reason for the limited use of this type of studies in taking actual safety measures [8]. In 2009, the PMDA initiated the MIHARI (Medical Information for Risk Assessment Initiative) project in order to establish a framework for a pharmacoepidemiological drug safety assessment based on electronic health information including electronic medical records and claims [9]. The main aims of MIHARI were: (1) ensuring access to a database, (2) understanding the data characteristics, and (3) conducting a pilot study. The two proposals from the committees established by the Ministry of Health, Labour, and Welfare (MHLW) [10, 11], which recommended the active utilization of a medical record database for post-marketing drug safety assessment, accelerated the MIHARI project [9]. As examples of the pilot studies, a sequence symmetry analysis for examining the risk of hyperlipidemia associated with atypical antipsychotics [12] and a self-controlled case series to determine the risk of acute asthma attacks associated with nonsteroidal anti-inflammatory drugs [13] were conducted. After accumulating adequate experiences through pilot studies, MIHARI was formally implemented as a routine process for drug safety assessment by the PMDA since 2014.
Drug Safety Assessment and the Japanese Medical Information …
43
4 Establishment of MID-NET® In 2011, a new governmental initiative aimed to establish a medical information database network, designated as MID-NET® , started following a proposal from a MHLW committee for further increasing a quality of drug safety assessment at the post-market stage [11]. The PMDA and 23 hospitals from 10 healthcare organizations across Japan (Chiba University Hospital, Hamamatsu University Hospital, Kagawa University Hospital, 4 hospitals from the Kitasato Institute Group, Kyushu University Hospital, Tohoku University Hospital, 10 hospitals from the Tokushukai Medical Group, 2 hospitals from the NTT Hospital Group, Saga University Hospital, and University of Tokyo Hospital) became involved in this project (Fig. 1). The MID-NET® is a distributed and closed network system that connects all collaborative organizations through a central data center (Fig. 1), and stores hospital information system (HIS) data such as electronic medical records (EMRs), claims data, and diagnosis procedure combination (DPC) data. EMRs are standardized based on the message specifications of SS-MIX2 [14] and include different types of information, such as patient identifiers, medical examination history (including admission and discharge), diagnostic orders, discharge summary, prescription orders/execution, injection orders/execution, and laboratory test data. Administrative claims data are produced to determine the reimbursements for inpatient and outpatient care according
Fig. 1 Partner hospitals and data categories of MID-NET®
44
M. Yamaguchi et al.
to a fee-for-service system. On the other hand, DPC data are produced to determine the reimbursements for inpatient care according to diagnosis-related groups, and provide important context in terms of patient case-mix. The stored data are periodically updated (every week or 1–3 months depending on the type of data) to provide access to the latest information from clinical practice. The target data are extracted in each partner hospital by a user-created program. The user remotely accesses the central data center for checking the extracted data and conducting further analyses as required. The summarized data after the analysis (but not individual-level data) can only be downloaded from the central data center through local access, although individual-level data are stored and maintained for a certain period in the central data center for allowing additional analysis if necessary. Users are only able to access anonymized data for their analyses since individual-level data are automatically anonymized to protect the patient privacy through several steps of data management such as the designation of new patient identification numbers and deletion of personally identifiable information (name, address, and residential postal code).
5 Quality Management of MID-NET® At the beginning of this project, the reliability of the MID-NET® system was checked, and confirmed that the processes of data extraction, data transfer, and data conversion into the SAS® format were reliable. In order to ensure high data quality of MID-NET® , quality management activities are conducted on both daily and periodic basis [15]. For example, data logs and the actual number of messages sent to MID-NET® are monitored daily. In addition, as shown in Fig. 2, data completeness and consistency between the original data collected in hospitals (HIS, claims, and DPC data) and those stored in MID-NET® are periodically checked. As a result, high data quality with almost 100% consistency was ensured after implementing these quality management practices. Several coding standards such as ICD-10 (International Statistical Classification of Diseases and Related Health Problems, Tenth Revision), YJ (Standard master data [YJ codes] for pharmaceutical products), HOT (Standard master data [HOT codes] for pharmaceutical products), JAMI (Usage standard of the Japan Association for Medical Informatics), MERIT-9 (MEdical Record, Image, Text-Information eXchange-9 guidelines), and JLAC10 (Japanese Laboratory Codes, Version 10) are also used to standardize the EMR data in MID-NET® and allow the integration of data originating from different hospitals. Data based on localized codes used in each hospital are converted to standardized codes in MID-NET® . More than 300 laboratory tests (e.g., tests for liver, renal, and bone marrow functions etc.) can be used for analysis (see more details at http://www.pmda.go.jp/safety/mid-net/0001.html) and more standardized tests will become available in the future. For other administrative claims and DPC data, the codes for reimbursement (e.g., claims processing system codes and DPC codes) are standardized across hospitals and preserved in MID-NET®
Drug Safety Assessment and the Japanese Medical Information …
45
Fig. 2 Periodical checking of data quality
to reflect the actual reimbursements. The system and data quality management will be continuously carried out to maintain the quality of MID-NET® . Data stored in MID-NET® were compared with the original data (i.e., data in the hospital information system) for ensuring their completeness and consistency. When any missing data or inconsistencies are found, the PMDA collaborates with the relevant partner hospital for identifying the potential reason and taking appropriate measures such as the modification of the data transfer program and data recovery.
6 Utilization and Characterization of MID-NET® In April 2018, MID-NET® was officially launched and opened to the pharmaceutical industry and academia as well as the MHLW, PMDA, and partner hospitals [16]. For promoting an appropriate use of MID-NET® , utilization rules were discussed by an advisory council established by MHLW, and published on April the 1st 2018 (https://www.pmda.go.jp/safety/mid-net/0003.html). Currently, the utilization of MID-NET® is limited to public purposes such as the post-marketing drug safety assessment conducted by PMDA, pharmaceutical company-sponsored postmarketing database studies required by the pharmaceuticals and medical devices law, and academic research focusing on the benefit/risk assessment of a drug supported by public organizations such as the Japan Agency for Medical Research and Development (AMED). The Good Post-Marketing Study Practice (GPSP) ministry ordinance was also amended in April 2018 [17]. In this amendment, the acceptance of a study based on the secondary use of electronic health information for re-evaluation was formally
46
M. Yamaguchi et al.
announced by the MHLW. The related guidelines were also recently published, such as the Basic Principles on Utilization of Medical Information Databases on Pharmacovigilance at the post-marketing stage (June 2017), Points to consider for ensuring the reliability of post-marketing database study for drugs, medical devices and regenerative medical products (February 2018) and Procedures for developing post-marketing study plan (March 2019) (https://www.pmda.go.jp/safety/mid-net/ 0006.html). Since the amendment of GPSP, the pharmaceutical industry can use medical information databases for pharmacovigilance including the post-marketing safety assessment of a drug. Therefore, MID-NET® is expected to become one of the major data sources for the pharmacoepidemiological drug safety assessment in the post-market stage. MID-NET® is a unique, reliable, and valuable medical information database. The major advantages of MID-NET® are: (1) high data quality by routine management, (2) frequent updates of stored data, (3) availability of a wide variety of data, including EMRs, claims, and DPC data, and especially many standardized laboratory tests, and (4) fulfillment of the GPSP requirements [17]. On the other hand, major limitations of MID-NET® are: (1) relatively small sample size (approximately 5.7 million patients as of December 2021), (2) no patient-level linkage of data among hospitals, (3) only data available from medium-to-large hospitals. A detailed understanding of the characteristics of the MID-NET® data including advantages and limitations is necessary for a proper study planning and data analysis. In order to facilitate such understanding, pilot studies were conducted by utilizing the MID-NET® data. Such studies mainly focused on 3 objectives including the actual drug utilization, impact of the safety-related regulatory actions, and drug-associated risks. For example, the hypocalcemia risk associated with the use of denosumab was examined by utilizing a result of the serum calcium concentration stored in MID-NET® . Such risk was higher than that associated with zoledronate just after the approval of denosumab in April 2012, however the risk was similar for these two drugs after issuing a health care professional letter for denosumab in September 2012 for strengthening the warning level as a regulatory action. These pilot studies revealed the usefulness and value of MID-NET® for post-marketing drug safety assessments [18]. A laboratory test result was particularly useful to examine more objectively a risk associated with the use of a drug. Recently, MID-NET® study results were practically used for drug safety assessment and regulatory safety measure in Japan [19, 20].
7 Challenges in the Secondary Utilization of Electronic Health Information for Drug Safety Assessment In the case of the secondary utilization of electronic health information, there are many challenges that need to be taken into consideration for a proper analysis [21]. The appropriateness of a study design and analysis have been actively discussed
Drug Safety Assessment and the Japanese Medical Information …
47
[22, 23]. In addition, high data quality of the database is a pre-requisite for the secondary utilization of electronic health information. Data quality management should be carried out routinely on daily and periodic basis. Furthermore, data coding processes should be standardized across all sites contributing to a database. A user should understand in-depth the data characteristics for appropriately planning and designing a study. Validation should be performed not only to establish the system reliability but also that of the clinical outcome, which is important to identify a clinically meaningful event in a database. Since the utilization is still at the learning stage, collaborations among experts will be a key success factor. For example, the PMDA collaborates with experts of the partner hospitals of MID-NET® to establish a reliable outcome, promoting the utilization of MID-NET® , and conducting the relevant study more appropriately [24, 25]. The PMDA also shared regulatory experiences about the utilization of electronic health information for drug safety assessment with other regulatory agencies under the ICMRA (International Coalition of Medicines Regulatory Authorities) framework and via bilateral communications. The challenges described here will be overcome more smoothly through collaborations and experience shared among experts. Acknowledgements We thank all PMDA members of MID-NET® project for their continuous efforts and the MHLW for their continuous support. We are also grateful to the partner hospitals of the MID-NET® for their active cooperation. Disclosures None of the aut hors have relevant conflicts of interest.
References 1. Poirier AF (2015) Closing the drug lag for new drug submission and review in Japan: An industry perspective. Clin Pharmacol Ther 98(5):486–488. https://doi.org/10.1002/cpt.192 2. Asano K, Tanaka A, Sato T, Uyama Y (2013) Regulatory Challenges in the Review of Data from Global Clinical Trials: The PMDA Perspective. Clin Pharmacol Ther 94(2):195–198. https://doi.org/10.1038/clpt.2013.106 3. Asahina Y, Sugano H, Sugiyama E, Uyama Y (2014) Representation of older patients in clinical trials for drug approval in Japan. J Nutr Health Aging 18(5):520–523. https://doi.org/ 10.1007/s12603-014-0031-5 4. Ishiguro C, Misu T, Iwasa E, Izawa T (2017) Analysis of safety-related regulatory actions by Japan’s pharmaceutical regulatory agency. Pharmacoepidemiol Drug Saf 26(11):1314–1320. https://doi.org/10.1002/pds.4252 5. Ishiguro C, Hall M, Neyarapally GA, Pan GD (2012) Post-market drug safety evidence sources: an analysis of FDA drug safety communications. Pharmacoepidemiol Drug Saf 21(10):1134– 1136. https://doi.org/10.1002/pds.3317 6. Alvarez-Requejo A, Carvajal A, Bégaud B, Moride Y, Vega T, Arias LHM (1998) Underreporting of adverse drug reactions Estimate based on a spontaneous reporting scheme and a sentinel system. Eur J Clin Pharmacol 54(6):483–488. https://doi.org/10.1007/s00228005 0498 7. Wysowski DK, Swartz L (2005) Adverse drug event surveillance and drug withdrawals in the united states, 1969–2002: The importance of reporting suspected reactions. Arch Int Med. 165(12):1363–1369. https://doi.org/10.1001/archinte.165.12.1363
48
M. Yamaguchi et al.
8. Kanmuri K, Narukawa M (2014) Characteristics of Post-Marketing Studies and their Contribution to Post-Marketing Safety Measures in Japan. Pharmaceutical Medicine. 28(2):67–73. https://doi.org/10.1007/s40290-014-0046-6 9. Ishiguro C, Takeuchi Y, Uyama Y, Tawaragi T (2016) The MIHARI project: establishing a new framework for pharmacoepidemiological drug safety assessments by the Pharmaceuticals and Medical Devices Agency of Japan. Pharmacoepidemiol Drug Saf 25(7):854–859. https:// doi.org/10.1002/pds.4032 10. Special committee for reviewing and prevention hepatitis associated with pharmaceutical products: An overhaul of pharmaceutical regulation for prevention of drug induced suffering (Final Recommendation) (2010). https://www.mhlw.go.jp/shingi/2010/04/s0428-8.html. 11. Special committee for utilization of medical database on drug safety measures: Recommendation on safety and assurance of drugs in utilization of electronic health information (Japanese sentinel project) (2010). https://www.mhlw.go.jp/stf/shingi/2r9852000000mlub.html. 12. Takeuchi Y, Kajiyama K, Ishiguro C, Uyama Y (2015) Atypical Antipsychotics and the Risk of Hyperlipidemia: A Sequence Symmetry Analysis. Drug Saf 38:641–650. https://doi.org/ 10.1007/s40264-015-0298-4 13. Takeuchi Y, Ando T, Ishiguro C, Uyama Y (2017) Risk of Acute Asthma Attacks Associated With Nonsteroidal Anti-inflammatory Drugs: A Self-Controlled Case Series. Ther Innov Reg Sci. 51(3):332–341. https://doi.org/10.1177/2168479016679865 14. Kimura M, Nakayasu K, Ohshima Y, Fujita N, Nakashima N, Jozaki H et al (2011) SS-MIX: A Ministry Project to Promote Standardized Healthcare Information Exchange. Methods Inf Med 50(2):131–139. https://doi.org/10.3414/ME10-01-0015 15. Yamaguchi M, Inomata S, Harada A, Matsuzaki Y, Kawaguchi M, Ujibe M et al (2019) Establishment of the MID-NET® medical information database network as a reliable and valuable database for drug safety assessments in Japan. Pharmacoepidemiol Drug Saf 28:1395– 1404. https://doi.org/10.1002/pds.4879 16. Pharmaceuticals and Medical Devices Agency (2018) Establishment of Regulatory Science Center and formal launch of MID-NET® . https://www.pmda.go.jp/english/rs-sb-std/rs/0003. html. 17. Ministry of Health, Labour and Welfare (2004) Ministerial ordinance No. 171: Good Postmarketing Study Practice 18. Yamada K, Itoh M, Fujimura Y, Kimura M, Murata K, Nakashima N et al (2019) The utilization and challenges of Japan’s MID-NET® medical information database network in postmarketing drug safety assessments: A summary of pilot pharmacoepidemiological studies. Pharmacoepidemiol Drug Saf 28:601–608. https://doi.org/10.1002/pds.4777 19. Sawada S, Ando T, Hirano M, Komiyama N, Iguchi T, Oniyama Y et al (2021) Effect of Hepatitis C Drugs on Blood Coagulability in Patients on Warfarin Using the Medical Information Database Network (MID-NET® ) in Japan. Ther Innov Reg Sci. 55:539–544. https:// doi.org/10.1007/s43441-020-00247-8 20. Kajiyama K, Ishiguro C, Ando T, Kubota Y, Kinoshita N, Oniyama Y et al (2021) Nested case-control study utilizing MID-NET® on thrombocytopenia associated with pegfilgrastim in patients treated with antineoplastic agents. Clin Pharmacol Ther 110: 473–479 https://doi. org/10.1002/cpt.2263 21. Nishioka K, Makimura T, Ishiguro A, Nonaka T, Yamaguchi M, Uyama Y (2022) Evolving Acceptance and Use of RWE for Regulatory Decision Making on the Benefit/Risk Assessment of a Drug in Japan. Clinical Pharmacol Therapeut 111:35–43. https://doi.org/10.1002/cpt.2410 22. Textbook of Pharmacoepidemiology (2013) 2nd edn In Strom B, Kimmel S, Hennessy S (eds) Wiley 23. Wang SV, Pinheiro S, Hua W, Peter A, Uyama Y, Berlin J, Bartels DB et al (2021) STaRT-RWE: structured template for planning and reporting on the implementation of real world evidence studies. BMJ. 372:m4856 24. Tanigawa M, Kataoka Y, Kishino Y, Kohama M, Uyama Y, Suzuki Y, Yokoi H (2019) Identification of gastrointestinal perforation based on ICD-10 code in a Japanese administrative medical information database and associated drug exposure risk factors. Pharmacoepidemiol Drug Saf 28:976–984. https://doi.org/10.1002/pds.4837
Drug Safety Assessment and the Japanese Medical Information …
49
25. Tanigawa M, Kohama M, Nonaka T, Saito A, Tamiya A, Nomura H, Kataoka Y et al (2022) Validity of identification algorithms combining diagnostic codes with other measures for acute ischemic stroke in MID-NET® Pharmacoepidemiol Drug Saf in press. https://doi.org/10.1002/ pds.5423
A Solution to the Problem of Data Quality in MID-NET Takanori Yamashita
1 Present Japanese EMR Electronic medical records (EMRs) accumulated in the system are called Real World Data (RWD). Utilization of RWD can help advance promising treatments, detect side effects detection, predict disease onset, facilitate drug discovery, and improve the efficiency of previously unknown medical treatment which were unknown in previous clinical research and intervention studies. On the other hand, since we are not assuming that it will be used for various purposes in the past. However, we found many problems related to data quality and its utilization. Japanese EMR evolved from medical accounting system around the 1980s, continued its development as an ordering system, and now comprises the EMR system. Although drugs, laboratory tests, diagnoses and surgeries can be expressed as structured data, patient symptoms, the rationales for various medical treatments and the patient outcomes are often described in free-text format. Originally, the medical treatment process is formed in the order of “patient symptom”, “laboratory test/imaging test”, “diagnosis by a doctor”, “medication or operation”, “rehabilitation”, “outcome”. However, present Japanese EMRs are not related to the treatment process and are accumulated individually.
T. Yamashita (B) Medical Information Center, Kyushu University Hospital, Fukuoka, Japan e-mail: [email protected] © The Author(s), under exclusive license to Springer Nature Singapore Pte Ltd. 2022 N. Nakashima (ed.), Epidemiologic Research on Real-World Medical Data in Japan, SpringerBriefs for Data Scientists and Innovators 1, https://doi.org/10.1007/978-981-16-6376-5_8
51
52
T. Yamashita
2 Construction and Data of Standardized To realize analysis of clinical process and to conduct a reliable analysis are necessary for RWD if we are to grasp the various data types and accurately extract these data types. Highly accurate analysis are needed to structure the data. Furthermore, data standardization is necessary for comparing RWD obtained from different medical institutions. MID-NET has targeted several types of structured data in EMR, with data structure standardized based on Standardized Structured Medical record Information exchange (SS-MIX2) [1]. This RWD mainly consists of diagnostic, drug (prescription/injection) and laboratory test data. These data are coded according to institution-specific codes, therefore requires conversion to standardized codes. Standardized codes are as shown below: • Diagnosis: ICD10 (International Statistical Classification of Diseases and Related Health Problems, Tenth Revision) • Drug names: YJ, HOT (Standard master data for pharmaceutical products) • Drug usage: JAMI (Usage standard of the Japan Association for Medical Informatics) • Dosage units:MERIT-9 (MEdical Record, Image, Text—Information eXchange) • Laboratory test: JLAC10 (Japanese Laboratory Codes, Version 10)
3 Data Quality Management During the validation project, data quality management was carried out beginning in FY2013 as one of process of preparation to full implementation of MID-NET. We extracted difficult to utilize data between medical institutes which appeared many problems such as data consistency errors and coded differently. Each medical institute has different local rules for EMR operation and different EMR vendors. Specifically, these following errors were found among the EMR, SS-MIX2, and MID-NET system. • • • • •
Data transfer errors The prescription or injection order had multiple types. Non-numerical data (e.g., comments) included in laboratory test data Standardized code mapping errors. Date type (order date, execution date, laboratory test date, report date).
We finally optimized data quality within the MID-NET system through cooperation with the Ministry of Health, Labour and Welfare and Pharmaceuticals and Medical Devices Agency (PMDA). PMDA and the medical institutes organized solutions for methods to many problems surrounding data transfer and connection (EMRSS-MIX2-MID-NET system) and mapping errors of each code. Then, we achieved to manage high data quality for big efforts. However, these medical institutes routinely (almost daily) to introduce new drugs, laboratory reagents and laboratory methods. Furthermore, EMR is frequently customized and updated to maximize the efficiency
A Solution to the Problem of Data Quality in MID-NET
53
Fig. 1 Data quality management
of medical practice. If data quality management activities do not operate continuously, data quality can deteriorate. Then, the reliability of data analysis will also be affected. Three measures were implemented as solutions to these problems (Fig. 1). (1)
Development of a real-time validation tool An important task of data quality management involves management of standardized code. A real-time validation tool to extract each daily code changes was developed by the Japan Agency for Medical Research and Development (AMED) under Grant Number (18 mk0101064h0003).
(2)
Establishment of a governance center Daily the master changes extracted from medical institutes that introduced the above tool should be monitored and confirmed by experts. We have established a system to feed-back optimized information to each medical institute in AMED under Grant Number (18 mk0101075h0003).
(3)
Organization of procedures to manage data quality
We organized solutions to problems, a real-time validation tool, a governance center, utilization of SS-MIX2, etc. as a procedural document in AMED under Grant Number (18 mk0101064h0003).
54
T. Yamashita
The document is useful for clinical research database projects and secondary data projects, besides MID-NET. In order to construct a database that can be used for clinical research, appropriate research design and design consideration for network/application/databases are important. Only then can accurate data be collected and analyzed. Maintaining data quality within each organization requires innovative human resource development. Disclosures There is no COI to declare.
Reference 1. Kimura M, Nakayasu K, Ohshima Y, Fujita N, Nakashima N, Jozaki H, Numana T, Shimizu T, Shimomura M, Sasaki F, Fujiki T, Nakashima T, Toyoda K, Hoshi H, Sakusabe T, Naito Y, Kawaguchi K, Watanabe H, Tani S (2011) SS-MIX: a ministry project to promote standardized healthcare information exchange. Methods Inf Med 50:131–139
Disease Registration Cohort Study with EMR (SS-MIX2)
Health Information Standards Michio Kimura
1 Ministry Designated Standards The Ministry of Health, Labour and Welfare in Japan started designating healthcare information standards since 2010. These standards are to be used when a healthcare provider applies for Ministry projects. However, not all are mandated to be used in patient information exchange among providers or subsystems of EHR. As of 2021, the following are the designated standards • • • • • • • • • • • • • • •
HOT code for drugs Disease classifications based on ICD-10 Patient referral document Patient information to be given to the patient IHE PDI (Portable Data for Images) MFER (waveform data for many kinds of ECG) DICOM HL7 v2.5 for prescription, image examination orders, laboratory examination orders, and observations) JLAC code for clinical laboratory examinations Dental disease classifications based on ICD-10 JJ1017 for image examination order code Nursing practice code SS-MIX2 standardized storage specifications for prescription, laboratory examination, observation, and disease classification IHE XDS (Cross-provider Document Sharing) and XCA (Cross-Community Access) IHE REM and DICOM RDSR for radiation dose
M. Kimura (B) Hamamatsu University School of Medicine, Shizuoka, Japan e-mail: [email protected] © The Author(s), under exclusive license to Springer Nature Singapore Pte Ltd. 2022 N. Nakashima (ed.), Epidemiologic Research on Real-World Medical Data in Japan, SpringerBriefs for Data Scientists and Innovators 1, https://doi.org/10.1007/978-981-16-6376-5_9
57
58
M. Kimura
• Dental location description • Standardized Discharge Summary
2 Images 2.1 Radiology Images Since 2000, DICOM standard [1] is being used for radiological images for PACS, imaging modalities, and image processors. Today, it is difficult to find non-DICOM imaging modalities. Exceptions are intraoperative/examination videos, inside data of 3D reconstructions. Because thin-slice CT and multi-protocol MRI export thousands of image slices, non-DICOM streaming can be found between PACS and image viewers. Because of improvement in network speed and implementation of Vendor Neutral Archive [2], they are becoming DICOM compliant again. When images are transferred among healthcare providers, the most frequently used method is the IHE PDI [3]-compliant CD (or DVD). As new imaging modalities produce thousands of images, CDs or DVDs are showing limitations in terms of capacity and burning/reading time. Some PDI are sent to external cloud storages, and then retrieved by token (netPDI) or cloud PACS, shared by the community.
2.2 Other Images Ultrasound images are mostly DICOM compliant. Although the apparatuses involved are comparably inexpensive, old apparatuses are still used, where images can only be viewed on the screen. Additionally, it should be noted that it is difficult to fill the required DICOM non-image tag information, such as patient name, ID, sex, and birthdate. This results that ultrasound under control of physiology information department exports DICOM, while portable echoes at clinics and wards are not connected. Endoscopy images are exported by DICOM; however, in most cases, they are under the vendor-dependent endoscopy examination system, and DICOM export is optional. Healthcare providers only aware when they decided to archive endoscopy images in DICOM PACS, which is much more secure and cost effective. In other cases, the JPEG format is commonly used when images are exported to other healthcare providers for sharing patient information. Pathological images have mostly been in the analog format, until virtual slides became available. They are huge with gigabytes of layered thick images, and the data format is proprietary, where viewer are available on EHR terminal. Only snapshots of the view are exported in most cases, in the JPEG format. Ophthalmology, otorhinolaryngology, dermatology, and nursing departments also use images, in most cases, in the JPEG format.
Health Information Standards
59
3 Prescriptions The ministry standard for prescriptions is HL7 v2.5 with HOT-9 code [4]. In Japan, however, prescriptions are in paper from, as free access grants any pharmacy can receive and process the prescription. Prescription information is shared in the community in two ways: cloud server-based viewing and making prescription data visible to SS-MIX storage. HOT code use is limited to 25% of SS-MIX working providers. As of 2021, 1214 hospitals are storing prescriptions in SS-MIX storage (out of a total of 8000 hospitals in Japan). This counts around 200. It should be noted that hospitals only have prescription orders. Dispensing information is acquired only at the pharmacies. Therefore, if regional sharing of patient information includes pharmacies, they can get dispensing information. Data on medication compliance (patient really took the drug or not) is hard to acquire and are available only through interviews with nurses and doctors.
4 Laboratory Examination Conventionally, laboratory examination results are exported to other healthcare providers on paper. Examination laboratories outside healthcare providers provide information to their clients via USB flash memory devices. However, they are in the proprietary format (mostly requested and developed in the EHR proprietary format). Like prescriptions, providers finally become motivated to export them in the standardized format, when they have to share information with others. Almost the same number applies to JLAC-10 code [5] compliant provider numbers (845 × 25%).
5 Documents The documents that are designated are referral document and discharge summery. It is usually in HL7 CDA R2 format. Some (around 100) providers are storing and sending referral documents in CDA format. Recently, HL7 FHIR version are also added in the Ministry standard list. Discharge summaries, diagnostic reports, and surgical operation reports are also now being considered to be standardized in CDA, before applying for Ministry designation. The anesthesiology report is standardized by the Japan Society of Anesthesiology, and as it is required when applying for anesthesiology specialist certification, it is used well, though not in the CDA format.
60
M. Kimura
Note that only structured items can be used for direct retrospective search. Main texts of reports are free text. Diagnostic codes, TNM classifications, time, sex, and examination methods (if in standard codes) are structured and searchable.
6 Disease Classification Disease classification based on ICD-10 is mandated for reimbursement claims. Therefore, it is fully used. It should be noted that in the reimbursement claim, the disease name includes the so-called reimbursement diseases, which means that it is only listed for the purpose of dispensing some drugs, or preforming some examinations, even when it is not a serious problem for the patient. EHR-listed disease names also have a problem; disease diagnoses are likely to be included, and less likely to be deleted because recovered patients do not return to the clinic, and doctors have few opportunities to edit this. In 2003, the payment system based on Disease Procedure Combination (DPC) was started in Japan for inpatients. Now, most middle to large hospitals are claiming this scheme (about 1,730 hospitals). Within this system, the DPC claiming code has “main disease” and “procedures list.” This system has rich information because the doctor selects one main issue and complication of the patient at discharge.
References 1. Digital Imaging and Communications in Medicine. https://www.dicomstandard.org/ 2. SearchHealthIT. https://searchhealthit.techtarget.com/definition/Vendor-neutral-archive-VNA 3. Integrating the Healthcare Enterprise®(IHE). https://wiki.ihe.net/index.php/Portable_ Data_for_Imaging 4. The Medical Information Systems Development Center. https://www.gs1.org/sites/default/files/ docs/healthcare/events/281008/14_MEDIS-DC_Takekuma_281008.pdf 5. Integrating the Healthcare Enterprise®(IHE). https://wiki.ihe.net/images/f/f7/LAB_Tokyo_JLA C10.pdf
SS-MIX Structured Standardized Storage Michio Kimura
In Japan, Standardized Structured Medical Information eXchange 2 (SS-MIX2) Storages were used as the export data from EMR [1]. The SS-MIX project was promoted by Japan’s Ministry of Health, Labour and Welfare (MHLW) and was inherited from the Shizuoka Style EMR project in 2006 [2]. According to investigations completed by MHLW in 2015 [3], EMR systems were operating in 2,542 (34%) out of 7,426 hospitals in Japan. SS-MIX2 Standardized Storage was being implemented in 865 hospitals (34% of the hospitals with operational EMR systems). Confining these metrics to 710 hospitals with more than 400 beds, EMR systems were found to be operating in 550 hospitals (78%) and SS-MIX Standardized Storage in 237 hospitals (43% hospitals with EMR). “SS-MIX2 Standardized Storage: explanation of the structure and guidelines for implementation Ver. 1.2” [4] was authorized as the standard specification of MHLW on March 28, 2016 [5]. In 2018, out of 1360 hospitals, 845 hospitals in Japan were storing prescription orders, and laboratory examination results in HL7 v2.5 format using SS-MIX2 Standardized Storage. Thus, the SS-MIX2 Specification is the de facto standard for data export from EMR in Japan. Figure 1 shows the deployment of SS-MIX2 storages in Japan. Figure 2 shows the SS-MIX2 storage structure. It uses the file system directory service, and does not use a database engine, which contributes to inexpensive implementation of the storage. It only requires the HL7 v2.5-mediated message export for prescriptions and lab results from EMR. The structure begins with the first three digits of the patient ID, followed by the remaining digits, dates, content type, and contents of the HL7 messages. Another Annex storage structure can store any kinds of files including JPEG and PDF in the same directory’s hierarchy. The retrieval of a certain patient’s information using the ID is sufficiently quick. For the retrieval of a list of certain medicine takers, the relational database system will be much quicker. M. Kimura (B) Hamamatsu University School of Medicine, Shizuoka, Japan e-mail: [email protected] © The Author(s), under exclusive license to Springer Nature Singapore Pte Ltd. 2022 N. Nakashima (ed.), Epidemiologic Research on Real-World Medical Data in Japan, SpringerBriefs for Data Scientists and Innovators 1, https://doi.org/10.1007/978-981-16-6376-5_10
61
62
M. Kimura
Fig. 1 SS-MIX Storage installation sites (with lab results, prescriptions 1214/total 1652) (total hospital number in Japan: 8389) as of March 2021 Fig. 2 SS-MIX storage structure
SS-MIX Structured Standardized Storage
63
Fig. 3 SS-MIX2: HL7 standardized clinical information storage, wide variety of applications
Table 1 Survey for purposes of and codes used for SS-MIX2 storages (out of 1360)
• Purpose (multiple choice) – Backup:684 – Regional exchange:815 – Documents storage:158 – Intra-hospital data sharing:26 – MID-NET:20 – Clinical research, case registration:41 – Others:55 • Standard drug code HOT9:136 • Standard lab exam code JLAC10:197 • Annex storage use:823 (60.5%)
Therefore, the SS-MIX2 storage is ideal for patient information retrieval while mass storage is ideal for relaying information. Figure 3 shows how SS-MIX2 storage is used. It imports HL7 v2.5 messages for prescriptions and lab results and disease classifications, regardless of the EMR vendor. Each system gets information from the storage independently from EMR. Examples for its use are PHR, making documents, making case cards, clinical databases, interoperable export of data to peripheral systems, backup for disaster, and including replacing and upgrading HIS. Table 1 shows survey results for purposes of and codes used for SS-MIX2 storages. Top two purposes are backups and data sharing with other healthcare providers. Standardized code use for drugs and lab examination items are still low.
64
M. Kimura
As an epidemiologic application of SS-MIX2 Standardized Storage, Hori reported the detection of fluoroquinolone-induced tendon disorders [6]. Using standardized and stored patient data of 10 groups of providers, the Pharmaceuticals and Medical Devices Agency (PMDA), an agency of the Ministry of Japan, started a project aiming at early detection of drug adverse events. In the preceding pilot project of MIHARI [MIHARI], whether these data of multiple providers are effective for detection, comparing to paper-based and EDC-based methods. In the MID-NET project, a hierarchical patient data searching system D*D[D*D] is employed [7]. It is based not on RDBMS, but a hierarchical representation using CACHE [8]. By confirming its efficacy and effectiveness, since 2018, PMDA is using the MID-NET system even for replacing paper based on post-market surveillance [9, 10].
References 1. Kimura M., Tani S, Sakusabe T (2005) Towards Japanese EHR: Shizuoka style EMR project, deployment stage, CJKMI2005. Proceedings 4–5, Shenzhen, China, Nov. 10, 2005 2. Kimura M, Nakayasu K, Ohshima Y, Fujita T, Nakashima N, Jozaki H et al (2011) SS-MIX: a ministry project to promote standardized healthcare information exchange. Methods Inf Med 50(2):131–139 3. Ministry of Health, Labor and Welfare (2016) Investigations of Medical Sites. http://www. mhlw.go.jp/toukei/list/79-1.html 4. Japan Association for Medical Informatics (2014). https://www.jami.jp/english/about/ 5. Ministry of Health, Labor and Welfare (2016) Standard specifications for healthcare information. http://www.mhlw.go.jp/file/06-Seisakujouhou-10800000-Iseikyoku/0000118987.pdf 6. Hori K, Yamakawa K, Yoshida N, Ohnishi K, Kawakami J (2012) Detection of fluoroquinoloneinduced tendon disorders using a hospital database in Japan. Pharmacoepidemiol Drug Saf 21(8):886–889. https://doi:https://doi.org/10.1002/pds.3285 7. Kimura M et al (2008) High speed clinical data retrieval system with event time sequence feature—with 10 years of clinical data of Hamamatsu University Hospital CPOE. Methods Inf Med 47(6):560–568 8. Intersystems Inc: Introduction to CACHE. https://docs.intersystems.com/latest/csp/docbook/ DocBook.UI.Page.cls?KEY=GIC 9. Ishiguro C, Uyama Y (2016) Utilization of medical information databases for evaluation of drug safety in pharmaceuticals and medical devices agency: MIHARI Project & MID-NET. Jpn Pharmacol Ther 44:s12–s16 10. Ohe K (2017) Mid-NET: medical information database network project to utilize electronic healthcare data for drug safety. Trans Jpn Soc Med Biol Eng 55(4):159–164
Japan Diabetes Comprehensive Database Project Based on an Advanced Electronic Medical Record System (J-DREAMS) Takehiro Sugiyama and Kohjiro Ueki
Abstract Japan Diabetes Comprehensive Database Project Based on an Advanced Electronic Medical Record System (J-DREAMS) is a multicenter, real-world registry study of patients with diabetes, directed by the National Center for Global Health and Medicine (NCGM) in collaboration with the Japan Diabetes Society (JDS). J-DREAMS aims to capture clinical information from electronic medical records (EMRs) or regular visits to diabetologists as conveniently as possible maximizing the benefit of the information technology.
Diabetes has been one of the important diseases in Japan in terms of its prevalence, complication, and economic burden. Relating to the Medical Care Act in Japan [1], diabetes is designated as one of the 5 important diseases. In contrast to its importance, epidemiology of diabetes and its complication have been very difficult to investigate. Comprehensive or even representative assessment of epidemiology about diabetes was scarce. We consider that there are the following reasons for it: (1) (2) (3) (4)
Considerable proportions of patients with diabetes are undiagnosed for a certain period. Incidence/prevalence is high; average duration of the disease is long. All physicians take care of patients with diabetes, regardless of its specialty. Complication of diabetes is heterogeneous; timing to collect information is not limited to a few occasions like diagnosis and/or death in the cancer registry.
T. Sugiyama (B) Diabetes and Metabolism Information Center, Research Institute, National Center for Global Health and Medicine, Tokyo, Japan e-mail: [email protected] Department of Health Services Research, Faculty of Medicine, University of Tsukuba, Ibaraki, Japan K. Ueki Diabetes Research Center, Research Institute, National Center for Global Health and Medicine, Tokyo, Japan © The Author(s), under exclusive license to Springer Nature Singapore Pte Ltd. 2022 N. Nakashima (ed.), Epidemiologic Research on Real-World Medical Data in Japan, SpringerBriefs for Data Scientists and Innovators 1, https://doi.org/10.1007/978-981-16-6376-5_11
65
66
T. Sugiyama and K. Ueki
In a few smaller countries including Denmark and Sweden, national diabetes registries have been established, whereas it is not realistic in Japan due to its nation size and complexity of insurance system. Confronting these difficult situations, we recently launched a large-scale multicenter registry of patients with diabetes, the “Japan Diabetes comprehensive database project based on an Advanced electronic Medical record System” (J-DREAMS). Although representativeness of patients with diabetes are not achievable due to the sample mainly biased to larger hospital setting, we expect that we will be able to use this big data for many types of studies. In this review, we describe the design and rationale of this research project. We also present problems we have newly found since the launch of J-DREAMS. We previously published a protocol article of JDREAMS [2]; this review includes extraction from the protocol article as well as additional information after the publication of the article.
1 Design of the J-DREAMS Project J-DREAMS is a multicenter, real-world registry study of patients with diabetes, directed by the National Center for Global Health and Medicine (NCGM) in collaboration with the Japan Diabetes Society (JDS). J-DREAMS aims to capture clinical information from electronic medical records (EMRs) or regular visits to diabetologists as conveniently as possible maximizing the benefit of the information technology. The registry includes all patients with diabetes (both outpatients and inpatients) who are cared by the physicians in the diabetes and/or endocrinology departments at the facilities participating in J-DREAMS during the case registry period. Patients who decline to participate in J-DREAMS are not registered; after registration, patients can request their information be deleted from the registry.
2 Patient Data Registration and Data Collection The process of data collection highlights the characteristics of this patient registry. Here, we provide a brief outline of the data collection system (Fig. 1). During their consultation of each patient, physicians in the diabetes and/or endocrinology departments at the facilities participating in J-DREAMS describe their patients’ medical information using the Standard Diabetes Management Template (SDMT) installed in the EMR system. SDMT is based on the template function installed by default in each EMR system and has been constructed to collect the same series of information from the systems of the different information technology companies that sell EMR systems (Fig. 2). Data registration for each patient requires entering his or her medical information via the SDMT. If a patient declines to be registered, the physician checks the “Intramural use only” checkbox in the SDMT, and
Japan Diabetes Comprehensive Database Project …
67
Fig. 1 Overview of Japan Diabetes comprehensive database project based on an Advanced electronic Medical record System (J-DREAMS)
that patient’s data are then exempted from data extraction as a part of the J-DREAMS database. Standardized Structured Medical Record Information eXchange (SS-MIX2) is a standard of healthcare data storage developed in Japan; SS-MIX2 is its newer version [3, 4]. All data entered for each patient using the SDMT are automatically converted and stored in the SS-MIX2 “extended” storage in a CDISC-ODM-based XML format defined by our study group [5]. The patient’s basic information, prescription history, and clinical laboratory data are stored in the SS-MIX2 “Standardized Storage” in an HL7 (ISO IS27931) format. Data entry (i.e., registration) for each patient using the SDMT triggers a process in which relevant data, such as his or her basic information (sex, year/month of birth, facility name), prescription status, and clinical laboratory data from the last 3 months, are extracted via the SS-MIX2 Gateway Server (SSMIX2 GW) onto the MCDRS Collection Agent (the “Collection Agent”) and then anonymized on the anonymizing server. As described earlier, if the “Intramural use only” checkbox in the SDMT is checked, this prevents that patients’ data from being extracted to the Collection Agent. After temporary storage at the Collection Agent, the extracted data are automatically or manually collected for forwarding to and storing at NCGM’s data center via one of the following three methods: [1] via a virtual private network (VPN), [2] on electronic media, such as CD-R or DVD-R discs, which are physically taken to the NCGM, or [3] via an available LAN cable (from the NCGM hospital). In each case,
68
T. Sugiyama and K. Ueki
Fig. 2 An example of the Standard Diabetes Management Template (NEC version). The templates from the different vendors all collect the same set of information. Cited from: Sugiyama et al. Design of and rationale for the Japan Diabetes comprehensive database project based on an Advanced electronic Medical record System (J-DREAMS). Diabetol Int. 2017;8(4):375–382
Japan Diabetes Comprehensive Database Project …
69
all data are anonymized/encrypted before forwarding, and care is taken to ensure the protection of personally identifiable information. Access to the MCDRS client is restricted to global IP addresses registered beforehand and is managed by a facility ID and password.
3 Variables The variables collected through J-DREAMS are listed in the Table 1 (the basic information, prescription history, and clinical laboratory data stored in the SS-MIX2 standardized storage). The protocol article provides the Supplemental file illustrating the clinical information collected using the SDMT and stored in the SS-MIX2 extended storage. These variables were selected from the perspective of their clinical importance to diabetes care. Moreover, the variables listed include all the variables in the “Minimum Data Item Set” (MDIS)”, [6] determined by the Joint Committee of the JDS and the Japan Association for Medical Informatics to increase the compatibility of the data with those in other patient registries. If a patient ceases to attend the facility for some reason (such as transfer, drop out, or death), the physician completes the SDMT prepared for such circumstances.
4 Follow-Up Physicians in the diabetes and/or endocrinology departments at the facilities participating in J-DREAMS are expected to fill in the SDMT each time they see an outpatient and once per inpatient hospitalization. It takes approximately 5–15 min to complete the SDMT the first time. Thereafter, the physicians can replicate electronically the previous filled template to save time, and they only need to update any information that has changed since the previous visit, such as the patient’s body weight and blood pressure, and any complications that have arisen. Information collected at each visit is linked by the anonymized patient ID so that the whole database can be used for longitudinal studies.
5 Ethical Considerations The institutional review boards in the NCGM and other collaborating facilities approved the study protocol for J-DREAMS (date of the latest revision approval at NCGM: December 7th 2018, approval number: NCGM-G-001702–11).
70
T. Sugiyama and K. Ueki
Table 1 The items collected through J-DREAMS (basic information, prescription history, and clinical laboratory data) Basic Information
Cystatin C
Year/month of birth
Carcinoembryonic antigen
Sex
Thyroid-stimulating hormone
Hospital code
Free triiodothyronine
Laboratory data
Free thyroxine
Blood samples
Insulin
Blood cell count
C-peptide
Total protein
Anti-GAD antibodies
Aspartate transaminase
Anti-islet antigen 2 antibody
Alanine transaminase
Islet cell cytoplasmic antibody
Gamma-glutamyl transpeptidase
Zinc transporter 8 antibody
Creatine Kinase
Anti-insulin antibody
Total cholesterol
Hepatitis B surface antibody
High-density lipoprotein cholesterol Hepatitis C antibody Low-density lipoprotein cholesterol
Urine samples
Triglycerides
Qualitative urinary test
Blood urea nitrogen
Protein
Creatinine
Albumin
Potassium
Creatinine
Hemoglobin A1c
C-peptide
Glycoalbumin
Prescription
1,5-Anhydroglucitol
All of the patient’s prescription information was obtained from the participating facility
Blood glucose Cancer antigen 19–9 Brain natriuretic peptide
GAD: glutamic acid decarboxylase Cited from: Sugiyama et al. Design of and rationale for the Japan Diabetes comprehensive database project based on an Advanced electronic Medical record System (J-DREAMS). Diabetol Int. 2017;8(4):375–382
6 Overview of Data Collected and Problems to Be Overcome As of September 2018, data were collected and sent to NCGM from 34 participating hospitals. In addition to them, 11 hospitals participated in the J-DREAMS project and started to construct the system. The total number of input of templates was more than 190,000, which are from more than 44,000 unique patients. We will present the results of cross-sectional analyses more in detail in the forthcoming article.
Japan Diabetes Comprehensive Database Project …
71
We have faced several problems to be solved since the launch of J-DREAMS. First, not all physicians in the diabetes and/or endocrinology departments at the facilities participating in J-DREAMS were willing to use SMDT. Input of SMDT is neither mandated by the law (like the National Cancer Registry) nor required for the board certification (like the National Clinical Database). Also, the action of the SMDT was very slow especially in an EMR of a company, which made it difficult to fill the SMDT during the consultation time; this problem was largely improved in most hospitals. NCGM and the JDS will need to repeatedly emphasize the importance of input of SMDT during the routine consultation of patients with diabetes. Second, there are several types of variances in the storage of SS-MIX2. We have given feedback toward hospitals participating in J-DREAMS in terms of variance and mistake regarding data storage in SS-MIX2. We have also shared experiences with researchers and experts in medical informatics through academic conferences.
7 Conclusion In this report, we have illustrated designs and systems of J-DREAMS. Through this project, we expect to obtain clinical data that will be used to elicit the epidemiology of diabetes patients in Japan. We also try to advance the frontiers of data-depository system via SS-MIX2 and template function through the J-DREAMS project. Acknowledgements J-DREAMS is supported by Ministry of Health, Labour and Welfare, Japan Agency for Medical Research and Development, Japan Diabetes Society, Nippon Boehringer Ingelheim, Eli Lilly, Novo Nordisk Pharma, Abbott Japan. We express our heartfelt gratitude to patients, diabetologists, nurses, and healthcare professionals at the 51 participating institutions, and members of the committee for J-DREAMS; Prof. Eiichi Araki, Prof. Yukio Tanizawa, Prof. Hirohito Sone, Prof. Daisuke Yabe, Prof. Hiroaki Watada, Dr. Narihito Yoshioka, Dr. Hiroshi Kajio, Dr. Kengo Miyo, Dr. Mitsuru Ohsugi and Dr. Hiroshi Otsu. We also show our sincere appreciation to Prof. Kazuhiko Ohe for useful advices. Disclosures/Declaration of interests K. U. reports lecture fees from Eli Lilly, Nippon Boehringer Ingelheim, Novo Nordisk Pharma and Abbott Japan; grants and endowments from Eli Lilly, Nippon Boehringer Ingelheim and Novo Nordisk. No other potential conflicts of interest relevant to this work are reported.
References 1. Japan Law Translation Database System. Medical Care Act 2019. http://www.japaneselawtran slation.go.jp/law/detail/?id=2199&vm=04&re=02. 2. Sugiyama T, Miyo K, Tsujimoto T, Kominami R, Ohtsu H, Ohsugi M et al (2017) Design of and rationale for the Japan Diabetes compREhensive database project based on an Advanced electronic Medical record System (J-DREAMS). Diabetol Int 8(4):375–382 3. Kimura M, Nakayasu K, Ohshima Y, Fujita N, Nakashima N, Jozaki H et al (2011) SS-MIX: a ministry project to promote standardized healthcare information exchange. Methods Inf Med 50(2):131
72
T. Sugiyama and K. Ueki
4. Japan Association for Medical Informatics (2014) “SS-MIX2 Standardized Storage” explanation of the structure and guidelines for implementation. https://www.jami.jp/jamistd/docs/SS-MIX2/ descript-implemglonSS-MIX2_V1.2.pdf. 5. Clinical Data Interchange Standards Consortium (2017) Operational Data Model (ODM) - XML. https://www.cdisc.org/standards/foundational/odm. 6. The Japan Association for Medical Informatics, the Japan Diabetes Society, the Japanese Society of Hypertension, the Japan Atherosclerosis Society, and the Japanese Society of Nephrology. Standardized Data Item Sets for Self-management of Chronic Diseases, Determined by 5 Clinical Associations in Japan 2014. https://www.jami.jp/english/document/JAMI_HP_4itemset20150 211-2.pdf.
Japan Chronic Kidney Disease Database: J-CKD-DB Mihoko Okada and Naoki Kashihara
1 Introduction Chronic Kidney Disease (CKD) is a major problem worldwide that adversely affects human health by increasing the cardiovascular disease and reducing the life span, and ultimately increases cost of the healthcare system. CKD is usually asymptomatic until later stages. About one million people in Japan live with CKD. When kidney disease progresses, it may eventually lead to kidney failure that requires dialysis or a kidney transplant. Thus, a further increase of CKD patients is a serious concern. CKD is defined by a GFR (Glomerular Filtration Rate) below 60 (mL/min/1.73 m2 ) and/or presence of albuminuria or proteinuria for three months or more. Table 1 shows the classification of severity of CKD (The Kidney Disease: Improving Global Outcomes (KDIGO) 2012, Clinical Practice Guideline for the Evaluation and Management of Chronic Kidney Disease), and Fig. 1 shows prevalence of CKD in Japan (Clinical Practice Guidebook for Diagnosis and Treatment of Chronic Kidney Disease 2012). Risks of ESKD requiring dialysis or transplantation, and risks for cardiovascular diseases such as stroke, myocardial infarction, and heart failure are coded with colors ranging from green (lowest), yellow, orange and red (highest) CKD chronic kidney disease, Cr creatinine, ESKD end-stage kidney disease, GFR glomerular filtration rate Adapted from KDIGO 2012 Clinical Practice Guideline for the Evaluation and Management of Chronic Kidney Disease. Kidney Inter Suppl. 2013;3:19–62 [1], with permission from Nature Publishing Group., modified for Japanese patients. JSN, JRS, and JCS Joint Working Group. Guidelines on the use of iodinated contrast M. Okada Institute of Health Data Infrastructure for All, Tokyo, Japan N. Kashihara (B) Department of Nephrology and Hypertension, Kawasaki Medical School, Kurashiki, Japan e-mail: [email protected] © The Author(s), under exclusive license to Springer Nature Singapore Pte Ltd. 2022 N. Nakashima (ed.), Epidemiologic Research on Real-World Medical Data in Japan, SpringerBriefs for Data Scientists and Innovators 1, https://doi.org/10.1007/978-981-16-6376-5_12
73
74
M. Okada and N. Kashihara
Table 1 Classification of severity of CKD (2012)
Fig. 1 Prevalence of CKD in Japan (Clinical Practice Guidebook for Diagnosis and Treatment of Chronic Kidney Disease 2012)
Japan Chronic Kidney Disease Database: J-CKD-DB
75
media in patients with kidney disease 2012: digest version. Clin Exp Nephrol (2013) 17:441–479. Patient registries or clinical databases have been used increasingly in recent years to provide real-world evidence on the effectiveness, quality, and safety of healthcare services. Observational studies derived from patient registries form an important part of the research types alongside interventional studies and retrospective studies. Japanese Society of Nephrology in collaboration with Japan Association for Medical Informatics has embarked on Japan Chronic Kidney Disease Database (J-CKD-DB) project to promote research on CKD. Objectives include but are not limited to: • • • •
Cross-sectional and longitudinal analysis Cost–benefit analysis Grasping adoption and compliance of guidelines in clinical practice, and Evidence-practice gap analysis
We describe an overview of the J-CKD-DB project including the methods, data management, and initial findings. We then discuss the semi-automatic vs manual method for data collection, and expectations on J-CKD-DB.
2 J-CKD-DB Project The J-CKD-DB project started in 2015 with an initial funding of the Japanese Ministry of Health, Labour and Welfare. In all 16 university hospitals participate in the J-CKD-DB project. More than 148,000 patients from 15 university hospitals are registered in the database as of March 2019 (Fig. 2).
2.1 Data Source J-CKD-DB collects and stores clinical data from EHR (Electronic Health Record) or EMR (Electronic Medical Record) systems of participating university hospitals. Hereafter, we use the term EHR to represent EHR or EMR for the sake of convenience. Patient data of the entire year 2014, from January 1 to December 31, are collected from SS-MIX2 standardized storage semi-automatically at one time. Details will be described later.
2.2 Inclusion Criteria and Data Elements Inclusion criteria of J-CKD-DB is defined as follows: (1)
Age >18 years old
76
M. Okada and N. Kashihara
Fig. 2 Nation-wide J-CKD-DB project
Asahikawa Medical Univ, Kagawa Univ, Kanazawa Univ, Kawasaki Medical School, Kochi Univ, Kyoto Univ, Kyushu Univ, Nagoya Univ, Niigata Univ, Okayama Univ, Shimane Univ, Tsukuba Univ, Univ of Tokyo, Wakayama Medical Univ, Yokohama City Univ (in alphabetical order)
(2)
Proteinuria >1 + (dip stick test) and/or eGFR