Environmental Chemistry: Fundamentals 9780387260617
Our Earth is a remarkable reaction vessel. It is of paramount importance that students grow in their understanding and a
435 98 45MB
English Pages 350 [351] Year 2007
Cover
Half Title
Environmental Chemistry: Fundamentals
Copyright
Foreword
Preface
Contents
Part 1: Introductory Concepts
1. Introduction to Environmental Chemistry
1.1 Chemistry of the Natural Processes in the Biosphere
1.2 Chemistry Associated with Pollution Processes
1.3 Chemistry Applied to the Analysis of Pollutants and Natural Compounds
1.4 Chemistry Applied to the Treatment and Remediation of Pollution
1.5 Green Chemistry
1.6 Importance of Environmental Chemistry
References and Further Reading
2. Chemistry Fundamentals, Part A
2.1 Chemical Equilibria
2.1.1 Equilibrium Values and Calculations
2.1.2 Exchange Reaction Equilibria: Systems of the Type MLn/MLn_1 / .../ML/M
2.2 Acid-Base Reactions
2.2.1 Acid-Base Characteristics of Common Chemical Species
2.2.2 Buffers
2.2.3 Acid/Base Character of Oxides
2.3 Redox Processes
2.3.1 Latimer Diagrams
2.3.2 Frost Diagrams
2.3.3 Nernst Equation
2.3.4 Pourbaix Diagrams
2.3.5 The pE Scale
References and Further Reading
3. Chemistry Fundamentals, Part B
3.1 Complexes and Complex Formation
3.1.1 Definition and Generalities
3.1.2 Modification of Properties of Metal Ions
3.1.3 Geometry of Metal Complexes
3.1.4 Inner and Outer Sphere Complexes
3.1.5 Mono and Polydentate ligands. The HSAB Approach
3.1.6 The Chelate Effect
3.1.7 Reactions of Complexes
3.1.7.1 Ligand-Exchange or Ligand Substitution Reactions
3.1.7.2 Electron-Exchange Reactions
3.2 Chemical Kinetics
3.2.1 Factors That Influence the Rate of a Mono Directional Reaction
3.2.1.1 Dependence of the Rate of Reaction on Concentrations: The Rate Law
3.2.1.2 The Rate Constant
3.2.2 Integrated rate equations
3.2.2.1 Zeroth-Order Reactions
3.2.2.2 First-Order Reactions
3.2.2.3 Second-Order Reactions
3.2.2.4 Higher-Order Reactions
3.2.3 Complex Reactions
3.2.3.1 Consecutive Reactions
3.2.3.2 Opposing (Reversible) Reactions
3.2.3.3 Parallel Reactions
3.2.4 The Steady-State Approximation
3.2.5 Catalysis
3.2.6 Kinetics of Metal-Complex Dissociation
3.3 Photochemical Processes
3.3.1 Photochemical Processes After the Absorption of Light
3.3.2 Beer's Law
3.3.3 Homogeneous and Heterogeneous Processes
3.4 Radiochemistry
3.4.1 Decay kinetics
3.4.2 Units of Radiation
3.4.3 Detection Devices for Ionizing Radiations and Protection From Radiation
3.4.3.1 Geiger Counter or Ionization in Gas-Filled Tubes
3.4.3.2 Scintillation Devices
3.4.3.3 Photographic Films
3.4.3.4 Semiconductors
3.4.3.5 Thermoluminescence
References and Further Reading
Part 2: The Chemistry of Natural Environmental Processes
4. The Chemistry of Processes in the Atmosphere
4.1 Air
4.2 How Did the Earth's Atmosphere Form?
4.3 Amounts of Constituents in the Atmosphere
4.4 Tropospheric Chemistry
4.5 Physical Principles of the Greenhouse Effect
4.6 Stratospheric Chemistry
4.7 Aerosols
Related Experiment in the Companion Book
Additional Related Experiments/Activities
References and Further Reading
5. The Chemistry of Processes in the Lithosphere
5.1 The Lithosphere and its Components
5.1.1 Structure of the Solid Earth
5.1.1.1 Core
5.1.1.2 Mantle
5.1.1.3 Crust
5.1.2 Classification of Rocks
5.1.2.1 Igneous Rocks
5.1.2.2 Sedimentary Rocks
5.1.2.3 Metamorphic Rocks
5.1.2.4 Rock-Forming Minerals
5.2 Formation and Differentiation of Minerals and Ores
5.3 Weathering
5.3.1 Physical Weathering
5.3.2 Chemical Weathering
5.3.2.1 Dissolution and Precipitation of Solids
5.3.2.2 Dissolution of Natural Oxides
5.3.2.3 Stable and Metastable Solid Phases
5.3.3 Biological Weathering
5.4 Soil Characteristics
5.4.1 Soil Taxonomy
5.4.2 Humic Substances (HS)
5.4.3 Decomposition of Organic Materials Adsorbed on Soil
Related Experiments in the Companion Book
Additional Related Experiments/Activities
References and Further Reading
6. The Chemistry of Processes in the Hydrosphere
6.1 Natural Waters: Types and Composition
6.1.1 Processes That Affect Water Composition
6.1.2 Rainwater
6.1.3 Surface Water
6.1.3.1 Stream and River Water
6.1.3.2 Lake Water
6.1.4 Groundwater
6.1.5 Seawater
6.1.6 Brackish/Saline Water
6.2 Interactions of Water with Air and Sediments; Effects on Aquatic Chemistry
6.2.1 Gas Dissolution and Acidification of Natural Waters
6.2.1.1 Henry 's Law
6.2.1.2 Dissolved Oxygen in Water
6.2.1.3 Dissolution of C02 in Water
6.2.2 Interactions between Water and Sediments/Soil
6.3 Physicochemical Processes in Aquatic Systems
6.3.1 Chemical Processes in Aquatic Systems
6.3.1.1 Acid-Base Reactions
6.3.1.2 Redox Reactions
6.3.1.3 Complex Formation
6.3.1.4 Speciation
6.3.1.5 Colloids: Properties, Types, Sources, and Formation
6.3.1.6 Photochemical Reactions
6.3.2 Natural Removal and Entrainment of Species in Aqueous Systems by Chemical and Physical Processes
6.3.2.1 Sorption onto Colloidal, Suspended, or Settled Sediments
6.3.2.2 Ion Exchange in Sediments and in Aqueous Colloidal and Suspended Matter
6.3.2.3 Precipitation Reactions and Co-precipitation
6.3.2.4 Solidification and Deposition Processes Due to Evaporation
6.3.2.5 Colloidal and Sediment Transport into Surface Water
6.3.2.6 Volatilization of Organic and Inorganic Compounds
Related Experiments in the Companion Book
Additional Related Experiments/Activites
References and Further Reading
7. Natural Biochemical Processes and Organisms in the Biosphere
7.1 Classification of Living Organisms
7.2 Nutritional Classification of Organisms
7.3 Basic Aspects of Ecology
7.3.1 The Habitats of Life : Air, Land, and Water
7.3.1.1 Atmosphere
7.3.1.2 Land
7.3.1.3 Water
7.3.2 Trophic Levels
7.3.3 Non-feeding Relations Among Species
7.3.4 Sustainability of Ecosystems
7.4 Biogeochemical Cycles
7.4.1 Water Cycle
7.4.2 Hydrogen Cycle
7.4.3 Carbon Cycle
7.4.4 Oxygen Cycle
7.4.5 Nitrogen Cycle
7.4.5.1 Fixation
7.4.5.2 Ammonification
7.4.5.3 Nitrification
7.4.5.4 Nitrate Reduction and Denitrification
7.4.6 Sulfur Cycle
7.4.6.1 Sulfur Mineralization
7.4.6.2 Oxidation of Sulfide and of Elemental Sulfur
7.4.6.3 Dissimilatory Sulfate or Sulfur Reduction
7.4.6.4 Assimilatory Sulfate Reduction or Sulfur Immobilization
7.4.7 Phosphorus Cycle
7.4.8 Iron Cycle
7.4.9 Interrelations Among Cycles
Related Experiment in the Companion Book
Additional Related Experiments/Activities
References and Further Reading
Part 3: Effects, Treatment and Prevention of Pollution
8. Effects of Pollutants on the Chemistry of the Atmosphere, Hydrosphere, and Lithosphere
8.1 Importance of the Manufacture and Use of Chemical Substances
8.2 Sources of Chemical Substances as Contaminants and Pollutants
8.3 Transport, Mobility, and Partition of Pollutants
8.4 Air, Water, and Soil Pollution and Their Effects
8.4.1 Effects of Pollutants on the Atmosphere
8.4.1.1 Main Air Pollutants
8.4.1.2 Combustion Processes as the Main Air Pollution Source
8.4.1.3 The Greenhouse Effect
8.4.1.4 Smog Formation
8.4.1.5 Stratospheric Ozone Destruction or the Ozone Hole
8.4.1.6 Acid Rain
8.4.1.7 Indoor Pollution
8.4.2 Effects of Pollutants on the Hydrosphere
8.4.2.1 Oxygen-Demanding Materials
8.4.2.2 Nutrients
8.4.2.3 Pathogenic Organisms
8.4.2.4 Suspended Solids
8.4.2.5 Oil and Grease Spills
8.4.2.6 Metallic and Metalloid Compounds
8.4.2.7 Radionuclides
8.4.2.8 Detergents (Surfactants) and Nutrient Enrichment
8.4.2.9 Salts
8.4.2.10 Heat
8.4.2.11 Other Contributions
8.4.2.12 Groundwater Pollution
8.4.2.13 Surface Waters
8.4.3 Effects of Pollutants on the Lithosphere
8.4.3.1 Transformation of Pollutants in Soils
8.4.3.2 Transport, Mobility, and Partitioning of Pollutants in Soils
8.4.3.3 Agriculture and the Chemistry of Soils
8.4.3.4 Metals and Mining Processes
8.4.3.5 Other Wastes and Pollutants in Soil
Related Experiments in the Companion Book
Additional Related Experiments/Activities
References and Further Reading
9. Effects of Pollutants on the Biosphere: Biodegradability, Toxicity, and Risks
9.1 Types of Pollutants According to Their Capacity to Undergo Biotransformation
9.1.1 Biodegradable Substances and Biodegradation Processes
9.1.2 Biotic Transformation Reactions
9.1.3 Recalcitrance and Recalcitrant Compounds
9.2 Hazardous and Non-hazardous Substances or Pollutants
9.2.1 Classification of Hazardous Substances
9.2.2 Toxicity and Related Definitions
9.2.3 Factors That Affect the Toxicity of Chemical Substances
9.3 Human Health Risk Assessment
9.3.1 Hazard Identification
9.3.2 Dose-Response Assessment
9.3.2.1 Non-carcinogenic Risk Assessment
9.3.2.2 Cancer Risk Assessment
9.3.3 Exposure Assessment
9.3.4 Risk Characterization
9.3.5 Risk Management
9.4 Ecotoxicology
9.4.1 Methods of Ecotoxicology
9.4.1.1 Toxic Endpoints
9.4.1.2 Bioassays
9.4.2 Ecotoxicity Determination
9.4.2.1 Short-Time Toxicity Tests
9.4.2.2 Long-Term Toxicity Tests
9.4.3 Bioconcentration, Bioaccumulation, and Biomagnification
9.4.4 Biomarkers and Bioindicators
9.4.5 In Situ Monitoring
9.4.6 Ecological Risk Assessment
9.4.6.1 Characterization of the Baseline Ecology and Identification of Potential Receptor Populations
9.4.6.2 Ecological Toxicity Assessment
9.4.6.3 Evaluation of Potential Exposures
9.4.6.4 Risk Characterization
9.4.7 Risk Assessment
Related Experiment in the Companion Book
Additional Related Experiments/Activities
References and Further Reading
10. Physicochemical and Physical Treatment of Pollutants and Wastes
10.1 Physicochemical Processes
10.1.1 Redox Processes
10.1.1.1 Chemical Oxidation and Incineration
10.1.1.2 Advanced Oxidation Processes (AOP)
10.1.1.3 Chemical Reduction
10.1.2 Precipitation/Immobilization, Acid-Base/Hydrolysis, and Ion-Exchange Processes
10.1.2.1 Chemical Precipitation/Metal Immobilization
10.1.2.2 Acid-Base/HydroLysis Processes
10.1.2.3 Ion Exchange
10.1.3 Complexation Processes
10.1.3.1 Gaseous Pollutants
10.1.3.2 Aqueous Pollutants
10.1.3.3 Soil Pollutants
10.1.4 Electrochemical Processes
10.1.4.1 Direct and Indirect Processes
10.1.4.2 Electrochemical Processes Based on Ion Exchange
10.1.4.3 Electrochemical Treatment of Gases
10.1.4.4 Electrokinetic Treatment of Soils
10.1.4.5 Electrochemical Production of Water Disinfectants
10.1.4.6 Hybrid Processes that Involve an Electrochemical Step for the Treatment of Aqueous Wastes
10.1.5 Other Chemical Processes
10.1.5.1 Selective Dissolution in CO2
10.1.5.2 Extraction with Other Liquefied Gases
10.1.5.3 Extraction with Liquid Solvents
10.1.5.4 Catalytic Hydrodechlorination
10.2 Physical Processes
10.2.1 Adsorption Processes
10.2.2 Incorporation of Pollutants into Solid Materials
10.2.2.1 Clay Incorporation
10.2.2.2 Supersoaker Materials
10.2.2.3 Vitrification
10.2.3 Radiation-Based Processes
10.2.3.1 Microwave Energy
10.2.3.2 Electron Beams
10.2.3 .3 Ultrasound
10.2.3.4 Photochemical Methods
10.2.4 Methods Based on Magnetic Fields
10.2.4.1 Magnetic Treatment
10.2.4.2 Magnetic Particles
10.2.5 Filtration Methods
10.2.6 Evaporation
10.2.7 Air/Steam Stripping
10.3 Combined Treatments
Related Experiments in the Companion Book
Additional Related Experiments/Activities
References and Further Reading
11. Biological Treatment of Pollutants and Wastes
11.1 Removal of Pollutants from Wastewater
11.1.1 Preliminary Treatment
11.1.2 Primary Treatment
11.1.3 Secondary Treatment
11.1.3.1 Aerobic Processes
11.1.3.2 Anaerobic Treatment of Wastewater
11.1.3.3 Biological Nutrient Removal
11.1.4 Tertiary Treatment
11.1.5 Chemical and Physical Disinfection
11.2 Sludge Treatment Options
11.2.1 Anaerobic Digestion of Sludge
11.2.2 Composting
11.2.3 Pasteurization and Drying
11.2.4 Lime Stabilization
11.3 Wastewater Reuse
11.4 Biological Treatment of Soil and Groundwater
11.4.1 In situ Bioremediation
11.4.2 Treatment of Excavated Soils
11.4.2.1 Composting
11.4.2.2 Slurry Reactors
11.4.3 Treatment Strategies for Aquifers
11.4.3.1 Physical Containment
11.4.3.2 In Situ Biorestoration
11.4.3.3 Above-Ground Bioreactors (Pump-and- Treat Technology)
11.4.4 Marine Oil Spills
11.5 Biological Treatment of Volatile Compounds
Related Experiments in the Companion Book
Additional Related Experiments/Activities
References and Further Reading
12. The Minimization and Prevention of Pollution; Green Chemistry
12.1 Industrial Ecology
12.2 Life-Cycle Assessment
12.3 Green Chemistry
12.3.1 Prevent Waste Production
12.3.2 Design Effective, Non-toxic Products
12.3.3 Design Good Syntheses
12.3.4 Use Alternative Feedstock/Starting Materials
12.3.5 Minimize Waste Using Catalytic Reactions
12.3.6 Avoid Temporary Modifications
12.3.7 Maximize the Use of Starting Materials
12.3.8 Minimize the Use of Auxiliary Chemicals
12.3.8.1 Ionic Liquids (lLs)
12.3.8.2 Fluorous Compounds and Solvents
12.3.8.3 Supercritical Fluids
12.3.8.4 Solventless Reactions
12.3.8.5 Aqueous Systems
12.3.8.6 Biosolvents
12.3.9 Energy Requirements
12.3.9.1 Microwave Radiation
12.3.9.2 Green Photochemistry
12.3.10 Design Benign Products
12.3.10.1 Synthetic Biodegradable Polymers
12.3.10.2 Starch-Based Biodegradable Plastics
12.3.11 Optimize Monitoring and Control
12.3.12 Minimize the Potential for Accidents
Related Experiments in the Companion Book
Additional Related Experiments/Activities
References and Further Reading
Index
Recommend Papers


![Environmental Chemistry [7ed]](https://ebin.pub/img/200x200/environmental-chemistry-7ed.jpg)


![Fundamentals of Inorganic Chemistry [3]](https://ebin.pub/img/200x200/fundamentals-of-inorganic-chemistry-3.jpg)


- Author / Uploaded
- Ibanez J.
- Hemandez-Esparza M.
- Doria-Serrano C.
- Fregoso-Infante A.
- Singh M.M.
File loading please wait...
Citation preview
Environmental Chemistry
Environmental Chemistry Fundamentals
Jorge G. Ibanez Margarita Hemandez-Esparza Carmen Doria-Serrano Arturo Fregoso-Infante Mexica n Microscale Chemi stry Center Dept. of Chemical and Engin eering Sciences Universidad Iberoam erican a-Mexico City
Mono Mohan Singh National Microsca le Chemistry Cente r Merrimack College-North Andove r, MA
~ Springer
Lib rary of Con gress Control Numbe r: 2007920054 ISB N-13: 978-0-38 7-2 606 1-7 eISBN- 13: 978 -0-387 -3 1435-8 Printed on acid-free paper.
© 200 7 Springer Scien ce-Business Med ia, LLC
All right s reserved. Thi s work may not be translated or copied in whole or in part without the written perm ission of the pub lisher (Springer Scien ce-Business Medi a, LLC , 233 Spring Street, New York, NY 10013, USA ), except for brief excerpts in conn ection with reviews or sc ho larly analysis. Use in connection with any form of inform ation storage and retrieval, electronic adaptation , co mputer software, or by similar or dissimilar methodology now known or hereafter developed is forbidden. Th e use in this publi cation of trade nam es, tradem arks, service marks, and similar term s, even if they are not ident ified as such, is not to be taken as an ex pressio n of opinio n as to whether or not they are subjec t to proprietary rights .
9 8 7 6 5 4 3 2 I springe r.com
Foreword
When I was about eight years old, the beautiful wetland that stretched out beside my home was destroyed and was replaced by a large office park. My father, upon seeing how upset I was, said to me, "If you care about something, you care enough to learn about it." This event perhaps more than anything else caused me to dedicate my life to sustaining our environment, our world, through the power of chemistry. And perhaps, more than anyth ing else, this is also the lesson of this excellent textbook, Environmental Chemistry : Fundamentals and Microscale Experiments. It is the knowledge and perspective contained in this textbook that allows all of us as scientists to understand the way our environment functions on a molecular level and how to identify potential threats to human health and the environment that need to be addre ssed. But it does more than that. It also gives us the fundamental basis for ensuring that those problems never arise by using the Principles of Green Chemistry that emphasize avoiding hazards through innovations in chemistry. For much of the history of the environmental movement, the scientific community has sought to identify and quantify environmental problems. If we were able to identify the problems , we then sought ways to clean them up sometimes elegantly, sometimes expensively, sometimes both. Because of the knowledge and fundamentals presented in this textbook we are able to build on those historical approaches and incorporate the principles of sustainable design into the chemical products and processes of tomorrow. The authors deserve tremendous credit for their extraordinary efforts that have resulted in this comprehensive and much needed volume . This book will provide an excellent resource for those aspiring scientists to understand that the way to protect the Earth is through intimately and rigorously understanding the Earth. Paul T. Anastas Yale University December, 2006
v
Preface
Modern science is not straightforward. Intricate relationships exist among the different disciplines involved in the understanding of virtually every scientific issue and phenomenon. The days of the Renaissance, when a single person could master a large portion of the knowledge then available, are long gone. This is not due to a lack of individual capacity, but rather to the explosion of knowledge, characteristic of our times. Environmental Science-and more specifically, Environmental Chemistry-finds itself completely immersed in such a scenario. In this regard, a book written by several authors having complementary backgrounds and interests appeared to be an appropriate project to pursue. On the other hand, multiauthored undergraduate textbooks run the risk of lacking smoothness and continuity in the presentation of ideas and con cepts. The pre sent project involved many meetings and cro ss-checking among the five authors . This is why we perceive thi s finished task as valuable, and we hope that the reader finds a flowing progression and fair treatment of the various subjects. The book is written with sophomore or junior college students in mind (i.e. , undergraduate students in their second or third year). However, issues are often presented in such a wa y that General Chemistry students- and even graduate studenrs-i-can find subjects of interest applicable to their level. The book consi sts of a theoretical section (12 chapters) and a companion book with an experimental section (24 experiments). A brief de scription now follows (initials of the main authors of each chapter and experiment appear in parentheses). The beginning of the theoretical section comprises a general introduction to Environmental Chemistry (Chapter 1, MH), and a summary of the main background concepts that a student of Environmental Chemistry ought to know (Chapter 2, JI; Chapter 3, JI, AF, MS). We assume that the students have the minimum background in Organic Chemistry and in Biochemistry necessary for Environmental Chemistry. Subsequent chapters discuss the composition and characteristics of the natural chemical processes that occur in the atmosphere (Chapter 4, AF) , the lithosphere (Chapter 5, JI), and the hydrosphere (Chapter 6, MH and JI) . This discussion concludes by examining natural biochemical processes and introducing the organi sms in the biosphere (Chapter 7, CD). Chapters that follow then analyze the effects of many pollutants (Chapter 8, 11, CD and MS; Chapter 9, CD), their treatment (Chapter 10, JI and CD; Chapter II, CD) , and the minimization and prevention of pollution, emphasizing Green Chemistry (Chapter 12, CD). Each chapter also contains a list of educational experiments in the literature related to its subject and a list of other useful references. The experiments are rather varied, ranging from the characterization of aqueous media to pollutanttreatment schemes. For increased safety, savings, and environmental awareness, as well as for reduced cost s, wastes , and environmental damage, we present our experiments at the microscale level (sometimes also called small- scale). Such experiments typically use microliters or micromoles of at least one of the reagents. The main authors of each experiment are as follows: Experiments 1-4, MH; 5, 6, 11; 7, AF and JI; 8, JI; 9, MH; 10, AF;ll,12, JI; 13,14, JI and MS; 15, JI; 16, JI and AF; 17, JI and MH; 18-20, JI;
vii
viii
Preface
21, 11 (from an experiment by Viktor Obendrauf); 22-24, CD. The answers to selected problems from the various experiments are given in the book 's website at www.springer.com. Many open-ended projects are suggested in the additional related projects section of each experiment. The possibilities for accidents or personal injury while performing these experiments are fairly small. However, owing to the incalculable number of variable s involved when many individuals perform experiments in separate places with different materials and reagents, we cannot accept any responsibility in such unlikely events. In the same vein, we cannot accept responsibility for any possible consequences when performing the additional related projects described above. The book contains 240 questions, problems, and examples; of these, over 100 are solved in the text. It also contains more than 150 figures, 70 tables , and 1300 references to the literature (almost 50% of the se references are related to educational environmental activities and experiments). Lastly, 80 additional related projects are suggested in the experimental section. Further technical notes are in order: (a) Even though the IUPAC (International Union for Pure and Applied Chemistry) has advised using the symbol e (for the electron) without its negative charge as superscript, we have circumvented this rule for didactic purposes since, in our experience, students are less confused when balancing charges in redox equations when they actually see the minus sign of the electron charge. (b) Physical states are written here as subscripts just below the participants in chemical reactions, except for aqueous species. A few years ago, such physical states started to be written as normal letters rather than subscripts; however, we use the traditional convention here for the sake of clarity. In addition, following the usage set forth by perhaps the most referenced book worldwide in Aquati c Environmental Chemistry (Stumm and Morgan) , we adhere in this text to the practice that aqueous species are to be understood as such, even when they appear without the corresponding physical state as subscript. This undoubtedly improves the readability of a large number of reactions. A similar idea applies to the gases in Chapter 4, where it would be cumbersome to write their physical states. (c) Some chapters and subjects lend themselves more naturally than others to exercises (shown as examples). (d) Old and new styles of writing references have been combined in this book. Most of the references appear only with initials of the authors, as in the traditional manner. However, other references are written according to an emerging trend that includes entire name s. (e) Equations and figures in the worked examples are not numbered, unless they need to for a practical reason. (f) A plethora of Environmental Chemistry experiments are performed throughout the world. As this book presents merely a few of these subjects, each chapter also has references to other experimentation found in the literature. The reader is encouraged to inform the authors of any omissions, so that future editions may be as complete as possible. (g) Environmental Analytical Chemistry is of the utmost importance in understanding a large number of environmental issues, and there are many excellent textbooks and laboratory manuals dealing with this area of interest. Unfortunately, this rather extensive subject requires a stronger background than that assumed for readers of the present book. Furthermore, the methods and techniques involved often call for somewhat sophisticated equipment not available in all schools. It is for these reasons that we have chosen to emphasize other aspect s in the present text, and thus urge the readers to seek key references in this field elsewhere. With such a thought in mind, a comprehensive list of Environmental Chemistry experiments that give prominence to analysi s-and that require instrumentation beyond that used in the present book-is given in the Appendix. Jorge Ibanez first conceived the idea for this book. Zvi Szafran (New England College, USA) induced us into making this a full textbook and not simply a laboratory manual. Margarita Hernandez was the architect and Jorge Ibanez the main driving force behind the project-they weaved the thread s from the different chapters into an orderly whole. In addition, Carmen Doria endowed this book with her expertise
Preface
ix
in the Life Sciences and Green Chemistry, Arturo Fregoso in the Atmospheric Sciences, and Mohan Singh in Microscale Chemistry. In addition, all the authors participated in and reviewed other chapters as well. Work on the book greatly benefited from comments and suggestions made by Hugo Solis (Universidad Nacional Autonoma de Mexico-Universidad Autonoma Metropolitana - Azcapotzalco, Mexico) and Mario Avila (Ecole Nationale Superiure de Chimie de Paris, France - Universidad de Guanajuato, Mexico). In addition, Dara Salcedo (Massachusetts Institute of Technology, USA - Universidad Autonoma del Estado de Morelos, Mexico), Pedro F. Zarate-Del Valle (Univer site Pierre et Marie Curie, France - Universidad de Guadalajara, Mexico), Sergio Gomez-Salazar (Syracuse University, USA - Universidad de Guadalajara, Mexico), Martin Adolfo Garcia-Sanchez (ITESO - Guadalajara), and Lorena Pedraza-Segura (Universidad Iberoamericana) also helped reading some portions. Andrea Silva-Beard gave the book the final administrative "push" for its completion. Rosa Maria Noriega provided the magic touch to the use of language through editing English grammar and style in mo st of the manuscript. Aida Serrano, Patricia Hernandez-Esparza, Marcela and Daniela Delgado-Velasco revi sed some parts of the book . Juan Perez-Hernandez (PROVITEC) helped in getting all the authors together for meetings, and Elizabeth Garcia-Pintor tested most of the experiments. Alberto Sosa-Benavides, Adriana Canales-Goerne, Gabriela Castaneda-Delgado, and Alejandro Correa-Ibarguengoitia transformed many of our rough sketches into understandable figures . The cover was developed after an idea first conceived by Carmen Marfa Tort-Oviedo (Universidad Iberoamericana). We are especially thankful to Ken Howell (Springer) for believing in us, and for his patience and encouragement. We also thank the many other co-authors and experimenters from other institutions that participated at different stages: Zvi Szafran (Merrimack College - Georgia Technical University, USA), Ronald M. Pike (Merrimack College - University of Utah, USA), Patricia Balderas-Hernandez (Universidad Nacional Autonoma de Mexico - Universidad Autonoma del Estado de Mexico), Bruce and Susan Mattson, Michael P. Anderson, Jiro Fujita, and Trisha Hoette (Creighton Jesuit University, USA ), Alejandro Alatorre-Ordaz (Universidad de Guanajuato, Mexi co ), Viktor Obendrauf (Graz Pedagogical Academy, Au stria), Michael W. Tausch and Michael Seesing (Universitat Duisburg-Essen, Germany), Rodrigo Mayen-Mondragon (CINVESTAV-Queretaro, Mexico), Maria Teresa Ramirez-Silva (Universidad Autonoma Metropolitana - Iztapalap a, Mexico), Chri ster Gruvberg (University of Halmstad, Sweden), Alanah Fitch (Loyola University-Chicago, USA ), and Adolfo de Pablos-Miranda (Institut Quimic de Sarria, Spain). Also, many thanks are in order for exten sive experimental assistance in some cases and exceptional clerical help in others, to colleagues and students at Universidad Iberoamericana: Samuel Macia s-Bravo, Veronica Garces-Castellanos, Sebastian Terraza s-Moreno, Rodrigo Mena-Brito, Carlos Navarro-Monsivais, Ignacio Gallo-Perez, J. Clemente Miranda-Trevifio, Jose Topete-Pastor, Lui s C. Gonzalez-Ro sas, Iraida Valdovinos-Rodriguez, Maria Lozano-Cusi, Ana Lozano-Cusi, Enrique LopezMejia, Jose A. Echevarria-Eugui, Karla Garcia, Juan Jose Godinez-Ramirez, Fernando Almada-Calvo, Leticia Espinoza-Marvan, Rosa Margarita Ruiz-Martin, Juan Jose Arrieta, Alejandro Moreno-Arguello, and Deni se Salas . Funding was-without a doubt--of paramount importance for the development of experiments through projects and research stays at diverse stages. This was kindly provided by Universidad Iberoamericana (Mexico), the International Business Office of CONACYT (Mexico), Merrimack College (USA), the National Microscale Chemistry Center (USA ), the National Science Foundation (USA), the Fulbright Program of the Department of State (USA) , the Linnaeus - Palme Program of the Swedish Agency for International Development (Sweden), the Alfa Program of the European Commission (Belgium), Loyola University of Chicago (USA), Creighton Jesuit University (USA), the University of Halmstad (Sweden), and the University of Guadalajara (Mexico). Above all, we thank our families for their gift of patience and understanding during the seem ingly unending and highly demanding hours that this book required. We are convinced that among the most important issues in Environmental Science are the appreciation and knowledge of the different phenomena involved in our environment, and the on-going need to participate in its care . We are hopeful that through this book we are contributing with a grain of sand to such an end.
Preface
x
Our environment is undoubtedly part of a greater, transcendental realit y-it is in this sense that we dedicate the present book ad majorem Dei gloriam .
(Note: Nam es ofthe authors appear belowf ollowed by the institutions where they did graduate work, then by their pres ent affiliations). Margarita Hernandez-Esparza (Stanford University ). Univer sidad Iberoamericana, Mexico City. Ma. del Carmen Doria-Serrano (Universidad Nacional Autonoma de Mexico). Universidad Iberoamericana, Mexico City. Arturo Fregoso-Infante (University of Missouri-Kansas City). Univer sidad Iberoamericana, Mexico City. Mono Mohan Singh (St. Petersburg Institute of Technology). Merrimack College , MA, USA. Jorge G. Ibanez (University of Hou ston). Universidad Iberoamericana, Mexico City. Mexico City and North Andover, MA, USA Spring of 2007
Contents
Foreword ... ....... .... ........... ............... .... ... .. .. ..... ............ ........... .. .. .. .... ... .... ....... ..... ..
v
Preface ........................... .......................................... .... ............ ...... ............ ..... .....
vii
Part 1 Introductory Concepts 1
Introduction to Environmental Chemistry .. .. .. ... .. ... .... ... .. .. .. ...... .... ... .... .... .... .. ...... .. . 1.1 Chemistry of the Natural Processes in the Biosphere .. ..... .. . .. ... .. .. .. .. .. .. .. .. ... .... .. .. .... 1.2 Chemistry Associated with Pollution Processes. .. ... .... .. ......... ... 1.3 Chemistry Applied to the Analysis of Pollutants and Natural Compounds . 1.4 Chemistry Applied to the Treatment and Remediation of Pollution. ... .. ..... ...... . 1.5 Green Chemi stry .. .. . .. .. .... ... .. ..... ..... .. ..... ... 1.6 Importance of Environmental Chemistry. ......... .. .... ..... . .... .. .... ..... .. .... .. . Reference s and Further Reading ... ..... . .. . .. . . ..... ..
3 3 4 6 8 8 9 10
2
Chemistry Fundamentals, Part A . .. ..... ... ..... .... 2.1 Chemical Equilibria. .. . .. .. .. .. .... ... ..... . . 2.1.1 Equilibrium Values and Calculation s 2.1.2 Exch ange Reaction Equilibria: Systems of the Type MLn/MLn- Ii ML/M. .. .. . 2.2 Acid-Base Reactions .. .. ... .. .. .. ... .. .. .. ... .. .... ... ..... ....... ... ... .. .. ... .. . .... .. .. ..... .. ... .. .. . 2.2.1 Acid-Base Characteri stics of Common Chemical Species ... .. .. ..... ...... ..... ... ... . 2.2.2 Buffers ............. ........ .......... ................ ... . .... ..... .... .. ... ...... .. ..... .... .... .. . 2.2.3 Acid/Base Character of Oxides ..... .. . .... . .. . 2.3 Redox Proce sses .... .... .. ..... .. ... . .. . . 2.3.1 Latimer Diagrams ... ...... .... ...... .... . . . ...... .. . .. 2.3.2 Frost Diagrams. .. ..... ... .. .. .. ... ..... ... .. .. ............ ... ....... ...... .. ..... . ... .... ..... .. . 2.3.3 Nemst Equation ... ... .. .... .... ... .. ............ ..... ... ... ... ....... .. .. ............. .. .... .. ... 2.3.4 Pourbaix Diagrams ...... .. ... .. .. .. .. ... .. .. .. .. .. .. .. .... .... ...... .. . .. ..... .. ...... .... .. . .. . 2.3.5 The pE Scale References and Further Reading .... ... .. .. ... . .. ...... .. ... ..... . .. .. .
11
Chemistry Fundamentals, Part B 3.1 Complexes and Compl ex Formation .. .. .. ... .. .. 3.1.1 Definition and Generalities ... .. .. ... ... .. .. .. .. .. .. .. ........ .. .. .... .. .. . .. ... .. . .. ... .. .. ...
43 43 43
3
11 12 12 15 15 16 21 23 25 27 27 28 33 41
xi
Contents
xii 3.1.2 3.1.3 3.1.4 3.1.5 3.1.6 3.1.7
3.2
3.3
3.4
Mod ification of Properties of Metal Ions....... ... .. ..... ... .... .. .. ....... ..... ..... . ...... Geometry of Metal Complexes .. .. .. .... .. ............ .. .. ..... .. .. .. ... ... .. ... .. ....... .... Inner and Outer Sphere Complexes .. ........ ..... ............. ......... ... ....... .. ... ...... Mono and Polydentate Ligands. The HSAB Approach.. .. .......... .... ...... ..... .... . The Chelate Effect.. .... .. ... .. ...... ..... .... ... .. ..... .. ...... .. ........ .... .......... ..... .... Reactions of Complexes '" . . 3.1.7 .1 Ligand-Exchange Reactions .. .... .............. .............. .... ....... .... ... ... 3.1.7.2 Electron-Exchange Reactions Chemical Kinetic s .. .............. ................... .. .. ..... .. .... .. .. ........... .... ......... .......... 3.2.1 Factors That Influence the Rate of a Mono Directional Reaction ... ...... .. .. .... ..... 3.2.1 .1 Dependence of the Rate of Reaction on Concentrations: The Rate Law.. 3.2.1.2 The Rate Constant ................ .......... ....... .. .. .... ....... .. ... ... .. .. ... .. .. 3.2.2 Integrated Rate Equations ... 3.2.2.1 Zeroth-Order Reaction s. .... .......... ........... ... ... .. ................. .. ........ 3.2.2.2 First-Order Reaction s.. ..... .. ..... .......... .... ..... ...... .. ..... ......... ........ 3.2 .2.3 Second-Order Reactions. .... .. .... ... ....... ...... .. .............. ...... ........... 3.2.2.4 Higher-Order Reactions . 3.2.3 Complex Reaction s.. ..... ..... ..... ......... . .......... ............. .. ....... ..... .... .. ........ 3.2.3 .1 Consecutive Reactions ........... .................. .. ........ ........ ...... ...... ... 3.2.3. 2 Opposing (Reversible) Reaction s 3.2.3.3 Parallel Reactions. ... .. ... ... ... ........ .............. ........ ......... ... ... ... ..... 3.2.4 The Steady-State Approximation .. .. .. .. ......... ...................... ........... ... ........ 3.2.5 Catalysis ...... 3.2.6 Kinetics of Met al-Complex Dissociation .. ... ....... .. ........ .. .. ... .. .... ... ... ... ... .. .. Photochemical Processes ... .. .. .... ..... .. ... .. .. ... .... .. .. ... .... .. ... ............... .... ............. 3.3.1 Photochemical Processes After the Absorption of Light.... .......... ...... ... ... .... ... 3.3.2 Beer's Law..................................... .. ..................... .... ..... ...... .. .... .. ... .. 3.3.3 Homogeneous and Heterogeneou s Processes..... .. .. ........ ... ....... ...... .......... .. . Radiochemistry. .. ... ..... 3.4.1 Dec ay Kinet ics........ .. ..... ... ....... .... .... .. .... ......... ............ .... .. .. ... ....... ..... 3.4.2 Units of Radiation....... .. ... .. ... .. .... ... ... ....... .. .. ................... ... ....... .. .. ...... 3.4.3 Detection Devices for Ionizing Radiations and Protection From Radiation .......... 3.4.3.1 Geiger Counter or Ionization in Gas-Filled Tubes......... .... .. .... .. .... .... 3.4.3 .2 Scintillation Device. ... .. .. .. .. ........... ................ .. ... ... .. ....... .......... 3.4.3.3 Photographic Films... .. ............. ....................... .. ......... ............. . 3.4.3.4 Semiconductors 3.4.3.5 Thermoluminescence............. .. .. .......... .. .. .... ... .. ...... .. ........... ... .. References and Further Reading. .. ....... .. ....... . .... . .. .. .
Part 2 4
The 4.1 4.2 4.3 4.4 4.5 4.6 4.7
43 46 47 48 48 50 50 50 51 52 53 54 54 54 54 55 55 55 56 56 57 57 57 58 59 59 60 61 61 62 63 64 64 64 64 64 64 64
The Chemistry of Natural Environmental Processes
Chemistry of Processes in the Atmosphere ... ...................... ..... ...... .......... .... .... .. Air How Did the Earth 's Atmo sphere Form? Amounts of Constituents in the Atmosphere.... ......... .. .......... ........... .... .. .. ... ... .. .. .. Tropospheric Chemi stry. ......... ........ ..... .. .. .. .. ..... ........... ....... ... .. .... .. ......... ....... Physical Principles of the Greenhouse Effect .. .......... .. .. Strato spheric Chemistry Aero sols Related Experiment s in the Companion Book ... ............ .. .. .. ....... .. .. .... ... .. ....... .. .... .
69 69 70 71 73 74 75 76 76
Contents
xiii
Additional Related Experiments/Activities .. References and Furthe r Reading. ........ ...
......
76 77
5
The Chemistry of Processes in the Lithosphere .. .. ... .... ... .. ... .. .. .. ...... .... .. ...... .... .. .. ...... 5. 1 The Lithosphere and its Components 5.1.1 Structure of the Solid Earth.. .. .. .... .. .... .. .......... .. ..... .. ... ...... ...... .. .. .. .. .... .... 5.1.1.1 Core .. ... ... ... .. ... ... ... .. .... .. .... .. .... ...... ... .... .. .. .. .. ... .... ... .. .. . .. ..... . 5.1 .1.2 Mantle ..... .. ... ... ... .. .. .... ... ... .. .. .. ... .. ... .... .......... .. .. .. . ........ ... . ... .. 5.1.1.3 Crust. .. ... ... .. .. .. .. .. ... ... .. .... ... .... ... ... .. .... .. .. .. .. .. ... .... .. . ... .. ..... .. .. 5.1.2 Classification of Rocks ... .. .. ... ... .. ... ... .. .. .. .. ....... .. . ... .... .. .. .. ... .... ... .... .. .. ... 5.1.2.1 Igne ous Rocks.. .. .... ... .. ... ... .. .. .. ..... ... .. .. ... . ..... ..... ... .. .. ... . ..... ..... 5.1.2.2 Sedimentary Rocks .. ... .. ... ... ... .. .. ... .. ..... ... ........... .. .. ..... .. .... ... .... 5.1.2.3 Metamorphic Rocks .... .. .. ... .. .. ... .. . ..... .. .. ... ... .... .... ... ... ... . ..... .. .... 5.1.2.4 Rock-Forming Mineral s .... .. .. .. .. .. ... .. .. .. .. .. . ......... .. .. .. ... ... .... ... .... 5.2 Formation and Different iation of Minerals and Ores ... ....... .. .... .. .. .. .......... .. .. .. .. ...... . 5.3 Weathering .. ...... .. ..... .... .... .. .. ... .... .. .. .. .. ... .. .. ... .. . .... .. .. .... .... ... . ... ... .. ... .. .. ... ... . 5.3.1 Physical Weathering.. .. .... ... .. ... .. ... ... ... ... ............ ... .. .. .. ..... ... ..... ... .. .. .. .. . 5.3.2 Chem ical Weathering ... .. ... ... .. ... .. ... .. .. .. .. .. .......... ....... .. .. ...... ..... ... .... .. ... 5.3.2.1 Dissolution and Precipitation of Solids 5.3.2.2 Dissolution of Natural Oxid es ... .. .. ... .. .. .. .. .. . ... .... .. ... .. ....... ..... ... .. . 5.3 .2.3 Stable and Metastable Solid Phases .. .. .. .. ... .. .. .. .. .. .. .. .. .. .. ... .. .. .. .. .. .. 5.3.3 Biological Weathe ring .. ... .. ... .. .. ..... ... .. .. ... .. .. .. ... .... ... ... ... .. .. ...... ...... .. . .... 5.4 Soil Characteristics.. .. .. .... .. 5.4.1 Soil Taxonomy.... ... .. ... .. ... ... .. .. ... ... .. ... .. . .. .. .. .. .. ... . .. .... ... .. . .... ... . ..... ... ... 5.4.2 Hum ic Sub stances (HS) .. .. ... .. .. .. .. .. .. .. .. .. ... ...... ...... .. .. .. .. ...... .. .. .. .. .. . .... .. . 5.4.3 Decomposition of Organic Materi als Adsorbed on Soil.. ........ .. .. .. . ... .. .. .. .. .. .. .. Related Experiments in the Companion Book .. .. .. .. .. .. .. .. .. .. .. ......... .. .. .. .. .... ...... .... .. Additional Related Experiments/Activities .... .. ... ............ ... .. ....... .. .... Reference s and Further Reading .. ... .. ... .............. ........ . ...
78 78 78 78 78 78 79 79 79 80 80 80 81 81 82 85 89 90 92 92 93 93 93 93 94 94
6
The Chemistry of Processes in the Hydrosphere " .. .. ..... .. . 6.1 Natur al Waters: Types and Composition.. .. .. .. .. .. .. .... ........ .... .. .. .. ........ .. .. .. .. ...... .. .. 6.1.1 Processes That Affect Water Composition " ......... .. ...... .. ... 6.1.2 Ra inwater .... . ....... ... ....... ... . ....... .... 6.1.3 Surface Water ... ... .... .. .. ... .. .. .. ... ... ....... ... ... ... ... ... .. . .... ..... .. .. . .. ... ... ... .. .. . 6.1.3.1 Stream and River Water. .. ...... .. .......... ....... 6.1 .3.2 Lake Water 6.1.4 Groundwater. .. .... .. .... ...... ..... .. .. .. ... .. .. .. . ... ...... .. .. .. .. .. .. .. ...... .. ... .. . ... ...... 6. 1.5 Seawater . .. .. ....... ..... .. .. 6.1.6 Brackish/Saline Water. .. ... ... ... ........... .. ............ .... .. ...... ... ... ....... 6.2 Interactions of Water with Air and Sediments; Effects on Aquatic Chemistry .. . ... . ..... .. ... .. ... . 6.2.1 Gas Dissolution and Acidification of Natural Waters.. ... ..... ... ..... ...... ... ...... .. .. 6.2 .1.1 Henry 's Law 6.2.1.2 Dissolved Oxygen in Water. .. .. .. .. .. .. .. .... .. .. .. . .. .. .. .... .. ........ ... ... .... 6.2 .1.3 Dissolution of CO 2 in Water .......... ........... .... ......... ..... ..... ... .... .... 6.2.2 Interactions between Water and Sediments/Soil .. .. .. .. ...... .. .. .. .. .... ... .. .. .. .. .. .. .. 6.3 Physicochemical Processes in Aquatic Systems.. .. .... .. .. .. .... ........ .. .. .. .. ... .... ..... ... .. . 6.3.1 Chemical Proce sses in Aquatic Systems .. .. .... .... .... .... .. .... ........ .... .. .. .. .... .. .. 6.3.1.1 Acid-Base Reactions.. .. .. .. .. .. .. .... .. .. .. .. .. .. .. .. .. ...... .... .. ... .... .. .... ...
96 96 96 98 99 101 103 105 106 107
..
...
............
..
.. ..... .
110 110 110 111 113 114 115 115 116
xiv
Contents 6.3.1.2 Redox Reactions .. ............ ...... ..... .. .......... .. .... ........... ... .. .. .. .. ... . 6.3 .1.3 Complex Formation . . ....... . . 6.3.1.4 Speciation .. ......... .. .. ... ... .... ..... .. .... ...... .. .............. .......... .. ... .... 6.3.1.5 Colloids: Properties, Types, Sources, and Formation 6.3.1.6 Photochemical Reactions ...... .. ... .. ....... ..... .. ......... .... ....... ... ..... .. .. 6.3.2 Natural Removal of Species from Aqueou s Systems by Chemical and Physical Processes .. .... .. .. .. ..... .. .. ......... ... ... ............... ............ .. .... .. .. 6.3.2.1 Sorption onto Colloidal , Suspended, or Settled Sediments...... .. .... ..... . 6.3.2.2 Ion Exchange in Sediments and in Aqueous Colloidal and Suspended Matter 6.3.2.3 Precipitation Reactions and Co-precipitation........ ..... ...... .. ... .... ... .... 6.3.2.4 Solidification and Deposition Processes Due to Evaporation. .. . .. .. .. ... ..... .. .. . 6.3.2.5 Colloidal and Sediment Transport into Surface Water.. ...... .. ... .. ......... 6.3.2.6 Volatilization of Organic and Inorganic Compounds. .... Related Experiments in the Companion Book..... ...... ... .. .. ......... .. .... ........ ....... ... .. .. Additional Related Experiments/Activities References and Further Reading ,....
7
119 122 122 124 126 128 128 129 131 131 131 132 132 135 135
Natural Biochemical Processes and Organisms in the Biosphere ....... . 137 7.1 Classification of Living Organisms .... ... ..... ... ..... ........ .... .. .. ......... ............ ... .. ...... 137 7.2 Nutritional Classification of Organisms. ..... ... ........ .............. ......... ... ...... ..... ... ..... 140 142 7.3 Basic Aspects of Ecolo gy 7.3.1 The Habit ats of Life: Air, Land, and Water .. .. .. .. ...... .. ....... .... .. .. ... ... .. ... .. ... .. 143 7.3.1.1 Atmo sphere.. ... .... .. ... ... ... .. .... . . .. 143 7.3.1.2 Land.. .......... .... ... ........... ... ......... ..... ......... .......... ... ... .. ..... ..... 143 7.3.1.3 Water ... .. ... .. .. ...... .. .... ................ .. ....... ..... ... ......... .... .. ...... .. ... 144 7.3.2 Trophic Levels 145 7.3.3 Non-feeding Relations Among Specie s 146 7.3.4 Sustainabi1ity of Ecosystems.. ... .... .. ... ... . 147 7.4 Biogeochemical Cycles .. ... ... ...... ... ...... .. .... .. .. ..... ... .. .. ...... ... ...... ...... .. ....... .. ..... 148 7.4.1 Water Cycle ,.. ... ... 148 7.4.2 Hydrogen Cycle . 148 7.4.3 Carbon Cycle .... ...... ..... ...... ... ... ......... ....... .. ...... .. ..... ....... .. .. ... .... ... ... ... 149 7.4.4 Oxygen Cycle................ ........ ... ... ..... .. ... ........ . .. .............. .. ... ......... ..... 150 7.4.5 Nitrogen Cycle ...... .. ... ........ .. .. 152 7.4.5.1 Fixation.... ... ... ... .. ......... ... ..... .... ..... ... .. ..... ....... ..... .... .. ... .... .... 152 7.4.5.2 Ammonific ation. .. ... ...... .... .. ..... .................. ........ ... ... ........ .... ... 153 7.4 .5.3 Nitrification....... .. ...... ... ............... ...... ........ ... ... ......... ........ ..... 154 7.4.5.4 Nitrate Reduction and Denitrification .. .. ........... .. .. .... .. ......... .... ... ... 154 7.4.6 Sulfur Cycle 155 7.4.6.1 Sulfur Mineralization ...... ..... .... ... ...... .. .... .... ....... ... ........ .. ... ... ... 155 7.4 .6.2 Oxidation of Sulfide and of Elemental Sulfur .. .. .. ... .. .. ...... ... .. ..... ... .. 156 7.4.6.3 Dissimilatory Sulfate or Sulfur Reduction ........ ............... ... ... ... .. .... 157 7.4 .6.4 Assim ilatory Sulfate Reduction or Sulfur Immobilization... ...... .... .... 157 7.4.7 Phosphorus Cycle 157 7.4 .8 Iron Cycle............. .. ..... .. .. .... .... ... .. ... .. ....... .. ... ....... .. .. ... ...... ............... 159 7.4 .9 Interrelations Amon g Cycles 160
Contents
xv
Related Experiments in the Companion Book.. ... ..... ....... ........... ... .... .... ...... ...... .. .. Additional Related Experiments/Activities ... ......... .. ...... .... .. . References and Further Reading .. ... . ..... .... .. . Part 3 8
9
161 162 162
Effects, Treatment and Prevention of Pollution
Effects of Pollutants on the Chemistry of the Atmosphere, Hydrosphere, and Lithosphere..... ..... .. ......... ... .. ...... ... ...... .... ........ .............. ... .. ... .... ..... .. ... ..... ... 8.1 Importance of the Manufacture and Use of Chemical Substances... .. ... .............. ..... .... 8.2 Sources of Chemical Substances as Contaminants and Pollutants ... ................... .. .. .. ... 8.3 Transport , Mobility, and Partition of Pollutants .. .. ... ... .. .. ... .... ............ ... .. ........ .. .. ... 8.4 Air, Water, and Soil Pollution and Their Effects .. ... .. .. .. .... .... ... ........ .. ....... ..... ..... .. . 8.4.1 Effects of Pollutants on the Atmosphere..... ..... .... .. ... .. .... . .... ............... ....... 8.4.1.1 Main Air Pollutants.... ... ... ..... ... ... ... ............ ................. ..... ...... 8.4.1.2 Combustion Processes as the Main Air Pollution Source.... .. .. .. ... ... ... 8.4.1.3 The Greenhouse Effect.. ......... ... ...... ............ ...... ... ... .. ... ......... .. 8.4.1.4 Smog Formation. ....... .. ..... ............ ......... .... ... ..... ... .. ..... .. ........ 8.4.1.5 Stratospheric Ozone Destruction or the Ozone Hole .............. ....... ... 8.4.1.6 Acid Rain .. ... ..... ...... .... .. .... .... ...... .... ......... .... . .... .......... .... .... 8.4.1.7 Indoor Pollution.. .... .. ... .. ... .. .. .. .... .... .. .... ............ ... ...... ........... 8.4.2 Effects of Pollutants on the Hydrosphere 8.4.2.1 Oxygen-Demanding Materials .... .... ..... ....... ....... ....... .... .... ..... .... 8.4.2.2 Nutrients 8.4.2.3 Pathogenic Organisms .... .. .. ... ... .... ..... .. ... ... ...... ... .. ......... ....... .. . 8.4.2.4 Suspended Solids .... .... ....... .. .. .... ......... ..... .. .. .. .. .... .... .... . ... .. .... 8.4.2.5 Oil and Grease Spills 8.4.2.6 Metallic and Metalloid Compounds .. .... ......... ..... .... .... ..... ... ..... ... 8.4.2.7 Radionuclides.... ...... ............... ............ .. ..... ..... ........ ...... .... .... 8.4.2.8 Detergents (Surfactants) and Nutrient Enrichment. .. ..... .......... .... .. ... 8.4.2.9 Salts .... .... .. ... ..... .. ... .... .. ..... ...... ... .. ..... ....... ....... ...... .. .... ... ... . 8.4.2.10 Heat.. .. ... .... .. ... ....... .... .. .... ..... .. ........ .. ...... . .. .. ... .... .. .... ... .. ... . 8.4.2.11 Other Contributions .... ............ .... ...... ... .. ..... ............... ........ ..... 8.4.2.12 Groundwater Pollution .. ..... .... .......... .. ...... .... ... ..... ..... ... ..... ... ... 8.4.2.13 Surface Waters ... .... .. .. .. .... .... .. ... .. ........ ...... ... ................ .... .... . 8.4.3 Effects of Pollutants on the Lithosphere............ ... .... .. .. .. .. ........ ..... .... .. .. .. .. 8.4.3.1 Transformation of Pollutants in Soils..... .. .................... . .. .... ... .. .... 8.4.3.2 Transport, Mobility, and Partitioning of Pollutants in Soils .. ... ..... ...... 8.4.3.3 Agriculture and the Chemistry of Soils.. ..... . .... ..... .... ......... ..... ..... 8.4.3.4 Metals and Mining Processes 8.4.3.5 Other Wastes and Pollutants in Soil.. ... .. . Related Experiments in the Companion Book.. ............... .... ..... .. ......................... .. Additional Related Experiments/Activities .. .... .... .. . References and Further Reading ... .. .. .... ........ ... .. .. .. .. ....... . ....
167 167 167 169 173 173 173 175 176 176 177 178 179 180 180 182 183 183 184 185 185 185 186 186 187 187 187 187 187 188 188 189 190 190 191 196
Effects of Pollutants on the Biosphere: Biodegradability, Toxicity, and Risks.. ... ... .......... 9.1 Types of Pollutants According to Their Capacity to Undergo Biotransformation.. .... ... ... 9.1.1 Biodegradable Substances and Biodegradation Processes 9.1.2 Biotic Transformation Reactions .. .. ..... ... ................ ..... ..... .. .... ....... ... .. .. ... 9.1.3 Recalcitrance and Recalcitrant Compounds. . .... ... ...... . ..
198 198 198 199 204
xvi
Contents
9.2
Hazardous and Non-hazardous Substances or Pollutants. ... 9.2.1 Classification of Hazardous Substances .... . 9.2.2 Toxicity and Related Definitions. ...... ..... 9.2.3 Factors That Affect the Toxicity of Chemical Substances .... . 9.3 Human Health Risk Assessment .... .. . .. . . 9.3.1 Hazard Identificat ion. .. ... ...... .... ....... ..... ... .... .... ..... .... .......... ....... .. ..... .... 9.3.2 Dose-Response Assessment. .. ... ....... ... ... .. . ............................ ........ ..... .... 9.3.2.1 Non-carcinogenic Risk Assessment . 9.3 .2.2 Cancer Risk Assessment .... ... .. . . 9.3.3 Expo sure Assessment. ..... 9.3.4 Risk Characterization .. ... ... .. ... .. .. .. ... .. .. .. ... .... .... .. .. .... ... ...... ... .. ... ..... .. .. .. 9.3.5 Risk Management 9.4 Ecotoxicology 9.4.1 Methods of Ecoto xicology.... ......... ............. ... ... ........ ... ....... .. ....... ... ....... 9.4 .1.1 Toxic Endpoints 9.4 .1.2 Bioassays ........... ............ ... .... ...... .... ... .. .. .. .. .. .. .. .. .. .... ... ....... . 9.4.2 Ecotoxicity Determination ... .. .. ... ...... .. .. ... ...... ............ .. .. .... .... ... .. .. ... . 9.4.2.1 Short-Time Toxicity Tests..... .. .... ..... ...... .... .. ..... .... .. ............. 9.4.2.2 Long-Term Toxicity Tests .... .. .. ... .. ... .. .. ... .... .. .. .. .. .. ..... ... ... .. .. 9.4.3 Bioconcentration, Bioaccumul ation, and Biomagnification 9.4.4 Biomarkers and Bioindicators. .. ... .. .... .. .. ... .. .......... .. ..... ...... .. ... ..... .. .... 9.4.5 In Situ Monitor ing 9.4.6 Ecological Risk Assessment ...... .. .... ....... .... ............. ........ ............ ... ... 9.4.6.1 Characterization of the Baseline Ecology and Identification of Potential Receptor Populations. .. ... .... ... 9.4.6.2 Ecological Toxicity Assessment 9.4.6.3 Evaluation of Potential Exposures.... ..... 9.4.6.4 Risk Characterization. .... .. ... ........ .... ....... ..... ........ ... ............ 9.4.7 Risk Assessment. .. ... .... ........... .... ...... .. ...... ...... ..... .... ... ... ... ... ........ .. Related Experiments in the Companion Book ..... ............. ...... .. ..... ... ......... .... .. ... Additional Related Experiment s/Activities .. .... ... .. . References and Further Reading. .. ......... ... .
10
Physicochemical and Physical Treatment of Pollutants and Wastes ......... ....... ... .... .. .... 10.1 Physicochemical Processes .. ........... .. ... ........ .. .... ... .... .... ....... .. .. ... .... ......... ... . 10.1.1 Redox Proce sses 10.1.1.1 Chemical Oxidation and Incineration .. .. .... .. .. .. .. .. .. .. .. ..... .. .. ... .. 10.1.1.2 Advanced Oxidation Processe s (AOP) 10.1.1.3 Chemical Reduction....... .... .. .... ............ .......... ...... ......... .. ... 10.1.2 Precipitation/Immobilization , Acid-Base/Hydrolysis, and Ion-Exchange Processes .. ........ .. ........ ..... .... ...... ... ...... .... ......... ..... .... . 10.1.2.1 Chemical Precipitation/Metal Immobilization ... ...... .... ..... ........ . 10.1.2.2 Acid-Base/Hydrol ysis Processes.... ... .. .... ........ ..... .. .... ....... ... . 10.1.2.3 Ion Exchange ... ... .. . 10.1.3 Complex ation Processes. ..... .. ........ ........ ... .... ......... .. .. .......... ...... ... ... . 10.1.3.1 Gaseous Pollutants. ..... ... ... ....... ... ........ .. ....... ... .... ..... ........ . 10.1.3.2 Aqueous Pollutant s.. .. ....................... .. .. .. .. .. ..... .. ............. .. . 10.1.3.3 Soil Pollutants ... ...... .. .... ...... ... ............ ... .. . ....... .. .. ....... .. .... 10.1.4 Electrochemical Processes. ....... .. .... .. .. .. .... ..... ..... .... .. ...... .. ... ....... ...... 10.1.4.1 Direct and Indirect Processes .. .. .. .. .... .. .......... .. .. ... .... ...... .. .....
207 208 208 208 220 221 222 223 224 226 226 227 228 229 230 230 231 231 231 232 233 233 234 234 234 234 234 234 235 236 236
237 237 237 238 249 253 255 255 256 256 258 258 258 259 260 260
Contents
xvii 10.1.4.2
10.2
10.3
11
Electrochemical Proce sses Based on Ion Exchange.. .. ... .... .. .. .. .... . ......... ................... ...... .... ... 26 1 10.1.4.3 Electrochemical Treatment of Ga ses . .. ...... . ... ........ ........ .. . .... ... 26 1 10.1.4.4 Electrokinetic Treatment of Soils .. ......... . .......... .......... ... .. ... .. . 262 10. 1.4.5 Electrochemical Production of Water Disinfectants.. ........ .... ....... 263 10.1.4.6 Hybrid Processes that Involve an Electrochem ical Step for the Treatment of Aqueous Wastes.. .. .......... ..... ... ... .......... .... ..... ... 263 10.1.5 Other Chemical Processes.. .. .. ... .. ....... .... ... . .. ....... .... . ..... .. .......... ...... .. 264 10.1.5.1 Selective Dissolution in CO 2 . . . • • • • • • • . . . . . • . . . . . . . . . . . . . . • . . . . . . • • • . • . • . • . • 264 10.1.5.2 Extraction with Other Liquefied Gases. .. ......... ..... ... ......... ....... 264 10. 1.5.3 Extraction with Liquid Solvents (Liquid- Liquid Extraction) 264 10.1.5.4 Catalytic Hydrodechlorination . .... .. .......... ..... .. ............. .. ... .. .. 264 Physical Processes .. .. ....... .. ....... ...... ......... ............... .......................... . ...... . . 264 10.2.1 Adsorpt ion Processes .. .. 264 10.2.2 Incorp oration of Pollutants into Solid Materials... .... .. .. . ........ ....... .... ..... .. 265 10.2.2.1 Clay Incorporation. .. ............. ...... .. .... ... .. ....... ..... ...... .... .. ... 265 10.2.2.2 Supersoaker Materials .... .. ..... ... ....... ... .......... ....... ...... 265 10.2.2.3 Vitrificatio n ,. 265 10.2.3 Radiation-B ased Processes ............... ........ ........ ..... 265 10.2.3.1 Microwave Energy .... ..... ...... .................... .. .. .. ..... ... ....... .... 265 10.2.3.2 Electro n Beams. .. ..... ......... . ... . ................... .... ....... . ........ ... 266 10.2.3.3 Ultrasound 266 10.2.3.4 Photochemical Methods ........ ......... ...... ......... ............. ...... ... 266 10.2.4 Methods Based on Magneti c Fields. ...... ....... ..... ... .... . .... ....... ..... .. ...... .. 266 10.2.4.1 Magnetic Treatment .... ......... .... .......... ...... ... .............. ..... .... 266 10.2.4.2 Magnetic Particles... .. ... .. ............ .. .. ........... .......... .... .... .. .... 266 10.2.5 Filtration Methods ...... ..... ... .. .. .... ... ........ ...... ........ ............ .. ... ..... .... . 267 10.2.6 Evaporation .... .. .... .. ..... ... .. ..... .. ... .... .. .. .... ... .. ...... ........... .... 268 10.2.7 Air/Steam Strip ping .......... ....... ... .... ............... .. ....... .. .. .... ..... . ...... .... 268 Com bined Treatments. ..... ..... .. .................... ...................... .... .. ... ..... ... . .... .... 268 Related Experiments in the Companion Book.. .. . ...... ... .......... .... ....... .. .... .... .... ... 269 Additional Related Expe riments/Activities ........ ............. .... . ....... .... .......... .. .... .. 272 References and Further Reading ..... .............. .. ...................................... ...... ... 272
Biological Treatment of Pollutants and Wastes ...... ... ......... ..... .... ........ ...... .. .... ...... .. 11.1 Removal of Pollutants from Wastewater. . 11.1.1 Preliminary Treatment ... ....... ......... .. .. .... ..... ...... .. .................... .... ..... 11.1.2 Prim ary Treatment... .... ... ..... .. ... .. .. ....... .... .. .... .... .. .. . .. ..... ... .... .. ..... ... 11 .1.3 Secondary Trea tment... ....... .. .. .. ...... ... .... ....... .. ..... . .. ... ... .. ... .. ... ... . ... .. 11.1.3.1 Aero bic Processes .. .. ... ..... ........ .... .. ....... ... .. ... ... .. .. . ... ..... .. . . 11.1.3.2 Anaero bic Treatment of Wastewater. ... ....... ..... .. ... ...... .. ..... .... . 11.1.3.3 Biological Nutrient Removal .. ... ................. .... ........ .. ... ..... .... 11.1.4 Tertiary Treatment ... ,.. .. ...... .... ... ... .. ....... .. .. ..... .. ................ ... ..... . ..... 11.1.5 Chem ical and Physical Disinfection.. ... .. .. ....... .. ...... .. ... .... .... .. .. ...... .. .... 11.2 Sludge Treatment Option s.. ...... .... .... ...... ..... .... .... .. .. .. .. ... .. ... .... .. ... .. .... ..... ... . . 11.2.1 Anaerobic Digestion of Sludge .... ... .. ....... .. ... .... .......... ... ... .. ..... .. .. . .. .. .. 11.2.2 Composting .... . .. . .. .. .. ... ...... ... ...... 11.2.3 Pasteurization and Drying ..... ... .. ..... ... ... ......... .... ...... ..... ...... .. 11.2.4 Lime Stab ilization ....... .. .. ... .. ...... .. ...... ..... .... ..... .... ... ..... .... .... .. .... .... 11.3 Wastewater Reuse ," ..
276 276 276 276 277 277 281 283 287 288 288 289 289 289 289 290
xviii
Contents
11.4
Biological Treatment of Soil and Groundwater .... ........... .......... ... ... ... ....... .. ...... . 11.4.1 In Situ Bioremediation .. ... .. ...... .......... ... ....... ..... ... ........ ... ... ..... .... ... .. 11.4.2 Treatment of Excavated Soils... ... .. 11.4.2.1 Composting 11.4.2.2 Slurry Reactors.. ....... ..... 11.4.3 Treatment Strategies for Aquifers.. ........... .. 11.4.3.1 Physical Containment. ...... .......... ................. .. .. ..... ....... ... .... 11.4.3.2 In Situ Biorestoration 11.4.3 .3 Above-Ground Bioreactors (Pump-and-Treat Technology) 11.4.4 Marine Oil Spills. .. ... .. .. ... ..... ... .. ....... ...... ...... .... ..... .. .. ... .... ......... .. ... Biological Treatment of Volatile Compound s ........ ....... ... .. ......... ... ... ... .. .. .......... Related Experiments in the Companion Book ..... ..... .... ... ................ ..... ... ......... .. Additional Related Experiments/Activities References and Further Reading.......... ... .... .... .. ............... ........ ...... .............. ..
290 291 292 292 292 292 292 292 293 293 294 295 295 295
The Minimization and Prevention of Pollution; Green Chemistry ... . ... . 12.1 Indu strial Ecology. . ...... . .. . . 12.2 Life-Cycle Assessment 12.3 Green Chemi stry........ .. ... ... ... ..... .. .. ... 12.3.1 Prevent Waste Production ....... ......... ..... ..... ........ .. ....... ... .... ......... ...... 12.3.2 Design Effective, Non-toxic Products... .. ...... 12.3.3 Design Good Syntheses..... ...... .. 12.3.4 Use Alternative Feedstock! Starting Materi als. 12.3.5 Minimize Waste Using Catalytic Reactions.. 12.3.6 Avoid Temporary Modifications 12.3.7 Maximize the Use of Starting Materials.. ... ............. .. ........ .. ....... .......... . 12.3.8 Minim ize the Use of Auxiliary Chemicals ........... .. ..... ... ..... .......... ... . ..... 12.3.8.1 Ionic Liquids (ILs) .. 12.3.8.2 Fluorous Compounds and Solvents 12.3.8.3 Supercritical Fluids... ........ .. .... ...... ... ........... .... ... .. .. .... .. .. 12.3.8.4 Solventless Reactions......... ....... .......... ...... .. .. ... ... .......... .. 12.3.8.5 Aqueous Systems .... ... ....... ....... ......... ...... ... .. ........ ... ..... .. 12.3.8.6 Biosolvents 12.3.9 Energy Requ irements...... ...... ........ .. ... .. ................. ...... ........... ...... .. 12.3.9.1 Microwave Radiation... .. .... .... ... ....... .. ............ ..... ..... ....... 12.3.9.2 Green Photochemistry......... ...... .......... ........ .. ...... ....... .... . 12.3.10 Design Benign Products.... .. .. ... ... ....... ....... .. ......... ...... .. .. ... ... .. .. .... ... 12.3.10.1 Synthetic Biodegradable Polymers....... .. .. .. ... ..... ... ....... .. .. ... 12.3.10.2 Starch-Based Biodegradable Plastics...... ........... ...... .......... .. 12.3.11 Optimize Monitoring and Control................ .. ........ ........ ... ..... ..... .... ... 12.3.12 Minimize the Potential for Accidents...... ...... ....... ... ........ ..... ........ ... .. .. Related Experiments in the Companion Book...... .. .. ..... .... ... .. .......... ......... ..... .... Additional Related Experiments/Activities References and Further Reading. ......... ....... .. .. ........ ........ ..... .... ........ ........ .... ..
296 296 296 297 297 298 298 299 302 304 305 307 307 312 313 314 315 316 316 317 317 318 318 319 319 320 320 320 322
11.5
12
Index
325
Part I
Introductory Concepts
1
Introduction to Environmental Chemistry
When we see the words "Environmental Chemistry," several questions come to mind .
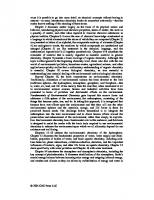
ing different pathways and exchange mechanisms among different environmental compartments • Complex spatial and temporal physical phase equilibria • Chemical transformations ofbiotic and abiotic nature, using air and water as their mobile phases and equilibrating media
• What do we understand as Environmental Chemistry? • Why is it important that we understand and know Environmental Chemistry? • What areas of knowledge are related to Environmental Chemistry, and how can we use this concept?
All the chemical reactions that take place in the environment-and that are directly related to the natural cycling and transformation of the elements on Earth-are identified as Environmental Chemistry. Likewise, the transformations or chemical interactions and processes of (a) substances introduced by human activity into the environment, (b) natural compounds, or (c) living organisms are included in this concept. In the natural cycles of elements and molecules, the biochemical and chemical transformations have been recycling the elemental compounds for millennia, maintaining a balance and a cycling rate that allows natural ecosystems and organisms to coexist. Originally, the concept of Environmental Chemistry focused on
In this chapter we consider these questions and try to explain what many scientists have come to agree on, as to the meaning of Environmental Chemistry. It is clear that Environmental Chemistry encompasses a number of fields of chemistry and chemical processes that take place in soil, water, air, and living systems.
1.1 Chemistry of the Natural Processes in the Biosphere Our Earth is a reaction vessel, in which complex reactions take place. It can also be considered a closed system, in which atoms and molecules are neither created nor destroyed, and a balance is maintained . The atoms and molecules are always located in some environmental compartment, combined in different compounds, present in different physical states, or accumulated in organisms. They are transported through
• Reactions related to the "biogeochemical cycles" • Reactions that may affect the growth of plants and the sustainment of organisms • Reactions and processes that involve geochemical formations and transformations However, the ever-increasing complexity of biochemical and chemical processes has changed this focus, and a wider range of views and new aspects are incorporated into the concept. Examples of some natural reactions and transport phenomena
• Local , regional and global mass flow • Horizontal and vertical mass transfer in the atmosphere, hydrosphere, and lithosphere, foIlow-
3
I. Introduction to Environmental Chemistry
4 ATMOSPHERE
~
LITHOSPHERE
FIGURE
1.1. Reactions and transport of substances in the environment.
involved in the cycling of the elements are shown in Figure 1.1.
1.2 Chemistry Associated with Pollution Processes Mankind-with its exponential population growth and its ever-changing and -expanding activities and demands for products and services-has increased the discharge of substances and extraction of resources, thereby increasing the pollution of the environment. Many of these contaminating substances are the same as those found in nature, but in higher concentrations. Therefore, cycling of the natural chemical species has been altered by human action through the discharge into environmental compartments of excessive amounts of compounds that cannot be assimilated, moved, or transformed at the same rate as before. This has resulted in an environmental and health impact due to the high concentrations of natural compounds and elements in a given environmental compartment, phase, site, or organism. Such high concentrations may exceed toxicity levels or the tolerance limits of organisms, or give rise to the inordinate reproduction of one organism over others; this, in turn, modifies the reproduction rates, the food chains, and the energy and mass balances in the ecosystems.
In addition, a number of natural elements and molecules have been combined through human inventiveness into synthetic compounds that are particularly beneficial to mankind and its present quality of life, many of which are xenobiotic substances (i.e., substances not found in nature) . Some of these substances have been introduced into the environment deliberately, like pesticides; others have been discharged into the environment either by accident or as wastes, owing in part to the lack of awareness of the possible negative environmental and human impact in the long, or even the short, term; or of the dispersion and transformations that such compounds may undergo. This is known as the Law of Ignored or Unexpected Consequences. An example of how human activity has affected or contributed to the alteration or modification of the natural biogeochemical cycles is depicted in Figure 1.2. The pollutants discharged into the environment, may, in the best case, undergo abiotic or biotic transformations, resulting in innocuous compounds that may not represent an immediate health hazard. However, many of the xenobiotic compounds are toxic and may undergo partial transformations that result in even more toxic derivatives. This process is known as activation. In the polluting process, the original compounds themselves or their derivatives are transported through the biosphere and may then be partially
Chemistry Associated with Pollution Processes
5
HC,H2S
1(
I
GROUNOWATER
FIGURE
I .2. Contributions of human activity to the environmental load , modifying the biogeochemical cycles .
degraded or totally mineralized (i.e., converted into small, relatively innocuous inorganic molecules) and excreted, or else they may be transformed and accumulated in organisms. Many of the products that accumulate in organisms (bioaccumulation) or are metabolized have genotoxic effects (i.e., they affect cellular reproduction) and may even cause death. Many of these transformations or activations can be brought about by microorganisms under aerobic or anaerobic conditions, or carried out through the metabolic processes in animals and humans . Some examples of biotic and abiotic transformations of toxic substances and contaminants that do not result in mineralization or detoxification, but result in products sometimes even more toxic than the original ones, are listed in Table 1.1. An example in which a biotic transformation of a man-made pollutant generates a nontoxic product is the metabolic biotic transformation of the dodecylsulfate detergent into acetoacetic acid. On the other hand, an example of the generation of a toxic substance due to human chemical treatment is the generation of chloroform (or other organochlorine compounds or trihalomethanes) in treated
water, through the chlorine disinfection process that entails the reaction of chlorine with a biodegradation product of organic matter. Other xenobiotic compounds are more stable and may be transported, without major changes, through global mass transfer to sites very far from the original discharge point, and exposed to unpredictable conditions that may produce a serious environmental or health impact. Such is the case of the pesticide DDT and the CFCs (chlorofluorocarbons). In the case of DDT, although it has been banned in the United States and other countries since 1972, its negative effects are still present; for example, it has been detected in the Arctic Circle where no DDT was ever applied. In the case of CFCs, their high volatility and low reactivity allow their movement to the stratosphere and the destruction of the protective ozone layer through an initial photolytic reaction caused by ultraviolet (UV) radiation. Therefore, the principles of atmospheric, water, and soil chemistries along with those of organic, inorganic, and biochemistry are a basic part of Environmental Chemistry. Moreover, they are essential for understanding (a) the fate and transformation
I. Introduction to Environmental Chemistry
6
TABLE 1.1. Transformat ion and characteristics of different toxic pollutants
Parent compound
Dangerous characteristics
Biotic and abiotic transformations
(RDX) 1,3,5Explosive, Anaerobic neurotoxicant, reduction and Cycl otrimethylene possible carci nogen photolysis nitroamine or "cyc lonite" (used as an explosive) Benzo(a)pyrene (found in Carci nogen Metabolic oxidation cigarette smoke) Toxic vapor (neuroHg O (used in industrial Abiotic oxidation processes) and nephrotoxicant) and microbial transformation in aerobic or anaerobic conditions (DDT) Dichlorodiphenyl Neuro- and Photolysis and trichl oroethane hepatotoxicant, microbial (pesticide) causes reproductive transformation alterations, probable carcinogen
reactions ofthe compounds discharged into the environment, (b) the decomposition reactions of wastes, and (c) the alteration of biogeochemical cycles. An understanding of the chemistry involved in the abiotic and metabolic processes, and of the biochemistry in the biotic processing of xenobiotic compounds and natural compounds, may lead to important considerations. For example, this understanding can help to determine which chemicals can be employed that are not only safe for the environment and human health, but also beneficial for human use, and which ones, if used, are dangerous and carry a high risk for humanity. The following example presents some of the possible movements and transformations that may result from the discharge of a pollutant (which may imply a risk to human beings or animals upon exposure ). Perchloroethylene is a pollutant that can be discharged into the atmo sphere from dry-cleaning processes and industrial degreasing of parts, or from seepage from a leaking storage tank in an industrial site. Its vapors will move alon g with air and can be transported by rainfall into land and surface water. Seepage from a storage tank will partially vaporize, and the rest can seep into ground water or surface water. If retained in the groundwater or in the sediments of aquat ic bod ies, it can undergo sequential anaerobic biotic transformations or cometabolic dechlorination. In other media, it can
Final products
Dangerous characteristics of final or intermediate products
I,I -Methylhydrazine, Possible carcinogens and 1,2-Dimethylhydrazine mutagens, neuro-, nephro-, and hepatotoxicants B enzo(a )pyrene-
hydroquinone Hg 2+ and methyl mercury
Dichlorodiphenyl dichloroethylene (DDE)
Highly carci nogenic Toxic compounds, nephroand neurotoxicants, affect reproduction and digestive processes, probable carcinogens Neurotoxicant, reproduct ive alterations, probable carci nogen
undergo abiotic elimination reaction s that will result in other compounds, all of them toxic. Such transformations are summarized as: PCE (perchloroethylenej-s- TCE (trichloroethylenej-» DCE (dichloroethylene) -+ vinyl chloride Such a transform ation process will affec t its mobility and increase its toxicity. This we can see in the corresponding data, reported in Table 1.2 (i.e., the carcin ogenic potential or slope fa ctor, the ref erence dose f or oral and inhaled intak e (RfD) , its solubility, and its vapor pressure]. If these pollutants reach a certain exposure level for a community who breathes contaminated air or consume s polluted water, its memb ers will be at risk.
1.3 Chemistry Applied to the Analysis of Pollutants and Natural Compounds When people want to know more about the environment where they and their families live, their concerns are : What is the quali ty of the water that we drink or of the air that we breathe? How clean is the water in the lake ? What types of toxic wastes are there in a nearby dumpsite or in an aquifer, and what are their concentration levels? What causes certain
Chemi stry Applied to the Analysis of Pollutants and Natural Compounds T AB L E
7
1.2. Risk characteristics of compounds derived from environmental transformations of perchloroeth ylene Carcinogenic slope factor [(mg!kg.d)- ' I
Solubility (mg/L at 25°C)
Vapor pressure (mm Hg at 25°C)
Compound
Reference dose (mg/kg -d)
Perchloroethylene (tetrachloroethylene )
0. 17 1 (inh) 0.01 (oral)
0.175 (inh) 0.052 (oral)
150 (at 20°C)
Trichloroethylene
0.0 1 (inh) 0.0003 (oral)
0.4 (inh) 0.0 11 (oral)
1366
74
0.057 (inh) 0.05 (oral)
0.175 (inh) 0.6 (oral)
2500
591
0.028 6-0.01 (inh) 0.003 (oral)
0.03 (inh) 1.5 (oral)
2763
2660
I, I-Dichloroethylene Vinyl chloride
18.47
Sou rces: http://www.atsdr.cdc.gov/toxpro files/, EPA Toxic Profiles. http://www.epa.gov/iris/subst/.IRIS (EPA Integrated Risk Information System ). http://www.epa.gov/ttn/atwIhIthef/ , EPA Technology Transfer Network Air Toxics Website. http://risk.Isd.ornl.g ov/cgi.binltox/, RAIS (EPA Risk Assessment Information System ).
algae blooms for the death of fish? How safe is it to eat fish from a body of water (for example, from Chesapeake Bay or Lake Michigan)? Do the fruits and vegetables we eat contain pesticides? In order to have this information , the parameters that define the level and type of pollution need to be evaluated. Therefore, scientists and technici ans have to find the best chemical analytical tools that identify potential and existing pollutants, They also need to determine their properties, particularly those affecting the fate, transport, bioavailabil ity, toxicity, and stability/degradation of the chemical constituents in a sample. Tools such as these may be considered a part of Environmental Chemistry. Thus, Environmental Chemistry is related to the methods required to determine, in a complex sample, the presence of pollutants and their transformation products, from high to very dilute or trace concentrations. This chemistry, focused on the analysis of environmental contaminants or natural compounds, has special concerns: a. It should have a truly represent ative environmental sample. b. It should identify and avoid possible sources of sample contamination. c. It often needs a highly effective method of extraction or separation, and concentration to reach detection levels, especially when measuring extremely low concentrations or trace amounts of the analyte.
d. It should separate or identify a target compound from an array of a complex mixture of compound s or matrix , taking into account innumerable interaction s with other compounds present in the sample and con siderin g that they may interfere with the method. e. Because many of the analy ses have to be normalized , it is almo st certain that valid ation of the results will be necessary. An example of an extraction and reaction sequence of a soil matrix sample analy sis is presented in Figure 1.3. The foll owing is an example of a typical chemical process (in a schematic form ) used for the analysis of a wastewater sample in order to determine the presence of organic matter or oxidizable fraction through the measurement of the chemical oxygen demand (COD), a very common parameter in the evaluation of water pollution: (a) Digestion of the sample with dichromate in acid media: Organic matter (CaHbO c) + Cr20/ + xH+ -----+ aC0 2(g ) +2C~+
+ yH20(l)
( 1.1)
(b) Titration in the excess dichromate with Fe2+ (as ammonium ferrous sulfate), after the carbon oxidation in organic matter: Cr20/ - + 6Fe2+ + I4H+ -----+ 2C~+ + 6Fe 3+
+ 7H 20(l)
( 1.2)
I. Introduction to Environmental Chemistry
8
Acid-soluble fraction (e.g., carbonates)
FIG URE
Reducible fraction (e.g., iron and manganese oxides)
Oxidizable fraction (e.g., organic matter and sulfides)
1.3. Repre sentative line of analysis for environmental soil samples.
The se are chemical reactions typically used in environmental analysis.
1.4 Chemistry Applied to the Treatment and Remediation of Pollution Environmental Chemistry can also be applied to treat wastes, and to prevent and reduce the impact of certain discharges into the environment. A basic knowledge of chemistry will allow for a moredetailed understanding of processes such as water and wastewater treatment, air pollution control , and waste management. Chemistry is one of the essenti al tools available to mankind for the transformation of dangerous and toxic wastes into less aggre ssive substances, or for separating these toxic, dangerous, or sometimes valuable substances. The purpo se of such waste segregation is either to recover the waste for further reuse or recycling or to make it insoluble through a prec ipitation reaction or through a fixation or solidification process in order to reduce its mobility and lessen the risk of human contact. Chemistry is also used to transform complex, although biodegradable, wastes into simpler products that can be easily incorporated in the biogeochemical cycle of the elements. It is often used to mimic natural chemical or biochemical processes under human-controlled circumstances. In optimal conditions these processes are kineti cally favored, achieve high efficiencies, and compl etion of the reactions in shorter time s as compared to the corresponding natural rate s of change. This ideally leads
to discharges that can be easily assimilated by natural web s and cycles. When a leaking tank has contaminated a site or an aquifer, or an accidental spill occurs, the only option is remediation, that is, cleaning-up the site or any other environmental space that has been polluted. This remediation will often be performed by applying chemical processes to transform those undesirable substances either on- or off-site (e.g., by normal extraction and treatment techniques) using biochemi cal reactions with microorganisms, chemical oxidation , stabilization, or other advanced technologies. In further reference to our previous example , a chemical process for the remedi ation of perchloroethylene- and trichloroethylenecontaminated sites is the oxidation of these pollutants with potassium permanganate, hydrogen peroxide , or ozone. The final products will be C02, Cl -, Cl-, and H 20, which upon reaction will give HCIO and HCI, plus Mn2+ and Mn02 (as byproducts of the permanganate oxidation) . Such products represent a much smaller risk (or no risk at all) than the original pollutants.
1.5 Green Chemistry Many of the unde sirable situation s described above can be avoided by a judicious selection of more environmentally friendly proce sses. This is where Green Chemistry becomes an essential and important issue. What is Green Chemistry ? Green Chemi stry is the chemical tool used to design a reaction, a process, or a new material benign to the environment. It is the
Importance of Environmental Chem istry
chemistry applied in pollution prevention and waste minimization. In the design and development of new products and processes, key environmental requirements that should be observed or are a priority in Green Chemistry are: • utilization of reusable or recyclable materials, thus avoiding consumption of nonrenewable natural resources as material inputs • reduction and replacement of some of the traditionally harmful reagents and solvents in industry • reduction in energy consumption • reduction in dissipative loss of waste materials, aiming for zero discharges • lessening of threats to the ecology and to human health • lowering of safety risks A sustainable chemical industry is characterized by green chemical processes, where all of the above concerns are taken into account, or where there is a total recycling of intrinsically toxic or hazardous materials and substances, and an almost total recycling of other nonhazardous materials (e.g., water, plastic, or metals) that may constitute an environmental problem through resource depletion and pollution, as well as additional energy consumption. A major challenge for Green Chemistry lies in the large percentage of chemical products such as coatings, pesticides, pigments, flocculants, detergents, fuels, and others, where recycling is inherently unfeasible due to chemical, economical, or technical reasons. Wasteful processes can be made more economical and environmentally compatible by applying new green technologies. For example, the use of biosynthesis or catalytic transformations, with biocatalysts or other catalysts that are highly selective, which occur under mild reaction conditions is possible; they save energy and provide high structural selectivity, thereby reducing byproducts. The importance of waste reduction through the use of a chemical catalyst can be exemplified by the use of N-methylimidazole as a catalyst in the leaching step of gold extraction from ores in the mining industry. Cyanide, a toxic substance that poses a major health threat, has traditionally been used for these processes. A sample case is the 1999 leak in a Rumanian facility from a cyanide storage tank into the Rhine River that killed thousands of fish.
9
A hopeful sign is that DuPont scientists have been able to considerably reduce the amount of sodium cyanide and the reaction time required in the gold leaching process, by using a few parts per million of the imidazole activator that dramatically boosts the recovery rates . In some cases , green reactions are based on feedstocks derived from renewable resources that produce highly pure compounds. Another green option is the use of supercritical fluids that are more benign substances (e.g., water, carbon dioxide, and light nonhalogenated hydrocarbons); such fluids can be used as solvents for separations or as media for reactions, and can be easily recovered from the product mixture and recycled. We can also include here the use of ionic systems of nonvolatile salts that are molten at ambient temperature, and that act as solvents or even have a dual role (as catalysts and solvents), without the risk of unwanted vapor s. The se ionic solvents replace the more hazardous, volatile, and expensive organic solvents used traditionally. Other technologies that are applied in pollution prevention include electrochemical processes, which normally take place under mild reaction conditions and can be highly selective. They are usually cost-effective for low-volume, high-value products, although their overall competitiveness in high-volume processes needs to be analyzed as each case may requ ire. Another "green" alternative is the use of photocatalytic processes, which involve photochemical activation of semiconductors working as catalysts for redox processes that efficiently transform organic or inorganic pollutants into less dangerous substances.
1.6 Importance of Environmental Chemistry As indicated above, knowledge of Environmental Chemistry is essential for understanding what happens in nature and for predicting the fate and the chemical reactions that natural compounds and artificial pollutants may undergo; for understanding their interactions, and for predicting what may happen to certain compounds if discharged into the environment, and if organisms (human or not) come into contact with them. It is also fundamental to know what are the abiotic transformations, the metabolic
10
I. Introdu ction to Environm ental Chemistry
pathways, or other biotic transformations carried out by microorgani sms that take place under different environmental conditions (e.g., aerobic or anaerobic). Reactions such as dissolution , hydrolysis, precipitation, photolysis, adsorption/desorption , oxidation-reduction, ion exchange, complexation, biodegradation, polymerization , and others taking place in the environment, may affect the solubility of pollutants and therefore their mobility, speciation, and toxicity. Thi s, in tum , can define to a great extent the dispersion , bioa vailability, and risk associated with them. Examples of the above include the following :
quality or control needed in a system. All of these factor s are particularly important when making cost-effective decisions about discharge treatment s or risk-m anagement deci sions, or in determ ining environmental-impact mitigation or remediation measures. In the following chapters we will explore , from the chemical point of view, what are the main reactions taking place in the processes mentioned above. This will help us understand what is happening in and to our environment, with and without human inter vention .
• The solubility of Fe(lI) and Mn(lI) compounds can be greatly decreased by oxidizing them to Fe(III ) and Mn(lV), respectively. • The bioavailability and toxicity of copper, selenium , and arsenic for some aquatic organi sms is higher in their inorganic form , but not in the presence of certain chelating ligand s or metal-organic complexes. • The toxi city of Cr (VI) compounds can be greatly decrea sed by simply reducing it to a lower oxidation state, Cr(lll). • Iron oxides in minerals or in deposits can be dissolved by the action of light in the presence of certain compounds (ligands), but not in their absence.
Alloway , B. J.; Ayres, D. C. Chemical Principles of Environm ental Pollution, 2 nd ed.; Chapman & Hall: Lond on, 1997 . Ballschm itter, K. "The Globe as a React ion Vessel," Sci. Spectra 1997 ,11,1 8- 23. Butcher, Samuel , S. ; Charlson , Robert J.; Orians, Gordon H.; Wolfe , Gordon V. Global Biogeochemical Cycles; Academic Press: San Diego , 1992. Freemantle, Mich ael. "Gree n Appl ications of Ionic Liquids." Chern. Eng. News, March 30, 1998, pp. 3233. McEld owney, Sharon ; Hardman, David J.; Waite, Stephen. Pollution: Ecology and Biotreatment, Longman Scientific & Techn ical: Essex, UK, 1993. Turner II, B. L.; Clark , William c., Kates, Robert w.; Richard , John E ; Mathew s, Jessica T.; Meyer, William B. The Earth as Transf ormed by Human Action: Global and Regional Changes in the Biosphere over the Past 300 Years; Cambridge University Press: Cambridge, UK, 1993. Wilkin son , Soph ie L. "Green is Practical, even Profitable", Chern. Eng. News , Aug. 4,1997, pp. 35-43.
The se and other examples are further discussed throughout this book. Environmental Chemistry also provide s data input for risk assessment and treatability studies, and determines the required level of environmental
References and Further Reading
2
Chemistry Fundamentals, Part A
From the overview given in Chapter I it is clear that many chemical principles are involved in the discussion of environmental phenomena. The next two chapters are devoted to several of these principles, namely: chemical equilibria, acid-base reactions, redox reactions, complexes and complex formation, chemical kinetics, photochemical processes , and radioactivity. The first three are dealt with in this chapter and the rest in the next chapter.
2.1 Chemical Equilibria
(2.3a)
Chemical transformations can be of a reversible or irreversible nature. In the irreversible case, reactions may be simply written as follows: aA
+ bB -+ cC + dD
(2.1)
where a, b, c, d are the stoichiometric coefficients of each species as they participate in the reaction (A and B are the reactants, C and D are the products). The reversible case occurs when the reaction proceeds as above, and then the products "react back" to yield the reactants. This can be written as aA
+ bB ;:::::tcC + dD
mentally that regardless of the initial concentration of the reactants or products, the system will always reach equilibrium in ideal solutions (see below) when the product of the molar concentrations of the products (raised to their stoichiometric coefficients), divided by the product of the molar concentrations of the reactants (also raised to their stoichiometric coefficients) becomes constant. This ratio is called the equilibrium constant, K. In an aqueous solution of dissolved species this constant is given for reaction 2.2 by the expression
(2.2)
The two arrows here indicate bidirectionality of the reaction. All the species involved in this equilibrium react back and forth until the system reaches its natural equilibrium (i.e., until the Gibbs free energy of the reactants and the products becomes equal) . At this point a dynamic equilibrium is achieved, because the overall reaction does not stop but the forward and backward reaction rates become equal. It has been found experi-
or, in general,
TI[PJP K = -=,= ' ::---
TI[RY
(2.3b)
j
where the symbol n indicates multiplication of all the ith and jth concentration terms involved, and [Pl, [Rl represent the molar concentrations of the products and reactants, respectively, raised to their corresponding stoichiometric coefficients. As mentioned above, this K is defined for ideal solutions (i.e., those solutions in which the participating species behave as if little or no interactions existed among them, nor with the solvent). A measure of the "departure" from ideality is the activity coefficient, "V . The closer it is to unity, the more "ideally" the solution behaves . The product of this coefficient and the molar concentration is called activity (ai) of the ith species, and is given by a, = "Vi [il
(2.4)
11
2. Chemistry Fundamentals, Part A
12
If the solution is non-ideal, a new K (called K ') is
defined for the equilibrium described in equation 2.2 as (2.5a) or, in general
K' =
Il [a~] i
(2.5b)
[a~)
where a~, a~ represent the activities of the products and reactants, respectively, raised to their stoichiometric coefficients. It then follows that K'
= 'Yc[C]c'Y~[D)d = ('Yc 'Y~) . [C]C[D)d 'Yi[A)a'Y~[B)b
'YA 'Y~
[A)a[B)b
(2.6) It can be noted that the last term on the right is equal to K. The preceding term contains the activity
coefficients ('Y), and depends on the concentration, charge, and nature of the species involved. In solutions where strong interactions among the dissolved species occur, the value of these coefficients drops significantly below unity. For example, in seawater the following activity coefficients (in parentheses) have been evaluated: (a) monovalent ions, Na+ (0.76), HC0 3 - (0.68); and (b) divalent ions, Ca2+ (0.26), C0 3 z- (0.20) . To simplify, we will assume ideal conditions for the reactions described throughout this book. However, the reader is by now aware of the deviations from ideality that can be encountered, and of the kind of errors that can be made by using this simplified approach. Better (and somewhat more complicated) approximations can be used; the reader is referred to more advanced books
if such calculations are desired (see, for example, the books by Ramette, 1981 or Stumm and Morgan, 1996). K ' is then a constant whose value depends on these factors, i.e., a conditional constant.
2.1.1 Equilibrium Values and Calculations To give an idea of the possible magnitude of K , we can cite some extreme values it can acquire: for example, from lO- IZO (as in the gas-phase decomposition of N z to atomic nitrogen) to 10+79 (as in the formation of an Ag complex with six thiosulfate ligands). In aqueous solutions the most common values for K are in the range r - 10- 30 to 10+30 (e.g ., solubility products, complex formation, dissociation constants, etc.). The magnitude of K signifies the extent of a reaction. When solids or gases are present in a reaction either as products or reactants, mole fractions and partial pressures (respectively) are normally used as a measure of their concentration. If the solid is a pure, one component phase, its mole fraction is used and its value is unity. Likewise, the solvent mole fraction (which is practically unity in very dilute solutions) is used as a measure of its concentration. In this book we use the convention that those ions for which the phase is not specified are in the aqueous phase. When the values of the concentrations of the species that appear in the equilibrium expression are known, the calculation of the equilibrium constant is an easy task. Likewise, when the equilibrium constant is known, the equilibrium concentrations can often be obtained. See Examples 2.1-2.4.
Example 2.1 Write the equilibrium expression for the reaction systems below. 1. Solubility of calcite
2. Dissolution of goethite in acidic water
CaC03(s) ;::::! Ca2+ + CO~Answer K = [Ca z+ ) [CO~-]
CaC03(s) is a solid; therefore, its mole fraction is unity and it is not included in the equilibrium expression . K is called here the solubility product, K sp •
FeOOH(s) + 3H+
;::::!
Fe3+ + 2H zO(l)
Answer
Because water is the solvent, its mole fraction is considered unity. Because FeOOH is a solid, the same rule applies.
Chemical Equilibria
13
3. Dissolution of atmospheric ammonia
Answer
Answer
This is a complexation constant.
When the partial pressure of ammonia gas (PN H 3) is used instead of its molar concentration, this expression is also called Henry's constant (see Chapter 6). 4. Reaction between a metal ion (electron-pair acceptor, Lewis acid) and a Lewis base (electronpair donor). For example, complex formation (see Chapter 3) : Fe 3+ + 4Cl- ;:::2 FeCl 4
5. Autodissociation (autoionization, self-ionization) of water H20(l ) ;:::2 H+
+ OH-
(As discussed below, we will use H+ in this book to designate the solvated proton, which in reality exists mainly as the hydronium ion, H30+) .
Answer
This is called the water dissociation constant, K w (its value at 25°C is approximately I x 10- 14 ) .
Example 2.2 Calculate the equilibrium concentration of [OH -] in a water sample where [H+] = 10-5 M .
Answ er
Example 2.3 Calculate the solubility of CaS04(s) assuming that the dissolution equilibrium is the only equilibrium present in this water/salt system. Here, K s p = 10-5 .9 . Answer CaS04(s) ;:::2 Ca 2+ + SO~ K sp = 10-5.9 = [Ca2-t][SO~-1
Because the concentration of the cation and the anion is the same (let us call it x) , then
K sp = x 2 , and x = 10- 2.95 = 0 .00112 moljL
Example 2.4 Calculate the solubility of atmospheric ammonia in water, knowing the value of Henry's constant, K H = 101.75 (for partial pressure in atmospheres and aqueous concentration in moles/L). The partial pressure of atmospheric ammonia can be taken as 5 x 10- 9 atm. Answer Because NH3(g)
Then
+ nH20(l) ;:::2 NH 3 ,
[NH 3 1 = K H PNH 3 = 101.75(5 x 10- 9 )
= 2.8
X
10-7 M
2. Chemistry Fundamentals, Part A
14
2.1.2 Exchange Reaction Equilibria: Systems of the Type MLn/MLn_ l / ...
/ML/M
Aqueous systems where one chemical species (say, L) is "exchanged" are quite common, and the study of the equilibria involved is crucial to understanding their behavior. For example, when a monoprotic acid is dissolved in water, the following equilibrium exists: (2.7)
(For a discussion on the aquation of H" , see reaction 2.9c). The acid (HA) is called the donor, the base (A-) is the acceptor, and H+ is the exchanged species or exchangedparticle. Owing to the wide range of concentrations in which the exchanged particles can be found, a logarithmic definition is commonly used . In general, if the exchanged particle is X, then pX = -Iogax
action occurs between a metal ion, M, and a ligand, L, e.g., OH -, NH 3, CI- (see definition of metal complexes in next chapter). This reaction can be written as ML
Absolute weight change,g
Percent change
-15.89 0 0.54 -3.77 4.36
-22.2 0 78.26 - 98.2 1363
Note that the absolute weight change (in grams) is numerically identical to the weight percent change in a 100 g sample. (c)
100
F===;:====:] A
0.1
I--------...-;:;~
0.01
L..-.
(d) The oxides to be labeled are Na20, H 20 , A1203, Si02 , and Fe203 . (e) Because Ah03 is not weathered, then its weight remains constant (i.e ., oxide B). • From the type of the rock, from Table 5.1 it is clear that the main component (and thus the highest in composition) must be Si02 (i.e. , oxide A) . The observed loss is probably due to hydrolysis. • H20 gets incorporated into the weathered rock, and thus it shows a large percentage increase (i.e ., oxide E). • Na20 is fairly soluble, and it is lost during weathering (i.e ., oxide C). • The only one remaining is Fe203 (i.e., oxide D). The observed increase is probably due to hydration.
--+
-:--J
Weathering degree (relative scale)
hand, temperature greatly affects the vegetative activity as well as the evaporative processes. In summary, the main weathering reactions that contribute to the introduction or removal of solutes in water and to the transformation of rocks
are dissolution, precipitation and redox reactions. Because redox reactions were treated in Section 2.3, we now proceed to analyze more in depth the chemistry of dissolution and precipitation reactions .
Example 5.2 Erosion rates.
The Rhine River (above Lake Constance) averages a Mg2+ composition of 9 mg L-I (see Stumm, 1996). If the annual runoff in that area is approximately 1 m 3 per m 2 of geographical area, estimate the erosion rate of Mg2+ (as MgC0 3 ) , in g m- 2 y-I . Answer Erosion rate = (9 mg Mg2+fL) (1 m 3/m2 y ) (1 mmol MgC0 3/l mmol Mg2+) (74 .3 mg MgC03/l mmol MgC03) (1 mmol Mg2+/24.3 mg Mg2+) (10 3 Llm 3) (1 gll03 mg) = 31.2 g Mg C03 m- 2y-1
5. The Chemi stry of Processes in the Lithosphere
86
Example 5.3 Determination of stable species upon weathering. The composition of the weathering water often determines the composition of the final stable mineral product. For example, the potassium feldspar/mica/gibbsite system under weathering can be simplified as follow s (see Fergusson, 1985) : KAISi 308(s)
~ KAhShOIO(OHh (s) ~
pota ssium feldspar
Ab0 3 · 3H zO ( s) gibbsite
mica
The corresponding unbalanced reaction s in this process are 1. KAISi 308 (s) + H 20(l) + H~q)
;::::!
KAhSi 30 IO (OH h (s) + H4Si04(aq) + K~q)
followed by 2. KA13Si30IO(OHh(s) + H 20(l) + H~q)
;::::!
Al z03 . 3H zO(s) + H4Si04(aq)
+ K+(aq)
Using Le Chatelier's principle, one can see that water with high H+ content and low K+ content will favor the existence of gibb site. Likewise, a high silicic acid content will favor feldspar. With this in mind, (a) Balance reactions 1 and 2. (b) Using the thermodynamic data of the table below, calculate ~ GOand K for each reaction. (c) Find the equation that relates the log of the ratio {[K+]/[H+]} and the log [H4Si04] for each reaction. (d) Find the solubility limit of [H4Si04], knowing that SiO z(s) + HzO(l) ;::::! H4Si04(aq)
K;; oc = 1 X 1O- z,7
(e) Draw an x -y diagram of log {[K+J/[H+]} = y, vs log [H4Si04] = x (called stability field diagram ) containing both equations from part (c) for the region where 2.7 < x < -6 and 0< y < 10. (0 Which is the most stable species (potassium feld spar, mica , or gibbsite) at the point where {[K+]/[H+]} = lOz and [~Si04] = 1O-3? Free energies of formation (The physical states are those in the two equations above) . Sub stance KAISiJ Og KA bSiJ O IQ (OH h
Ah 0 3,3H20 H4Si04 H20 K+ H+
- 3582
- 5439 -
Z322 1255 238 280
o
An swer (a) By performing normal mass and charge balance s, the stoichiometric coefficients are
Eq.I: [3, 12,2] = [1,6,2] Eq.2: [2, 18,2] = [3,6,2] (b) ~G? = ~G~od - ~G~eact = [-5349 + 6(-1255) + 2(-280)] - [3(-3582) + I2 (- 238) + 0] = 73 kJ Becau se ~G ? = - RT In K( , then K1
=
exp(-~G?!RT )
= exp[-73000J/(8.3I4J/K mol) = 1.4
X
x 298 K] 10- 13
In the same manner, ~G ~ = 106 kJ and K 2 = exp[ - 106000/(8 .314 x 298 )] = 2.6 X 10- 19
Weathering
87
Example 5.3 (Continued) (c) Eq.l :
(e) By using the equations of the two straight lines just calculated, and makin g [SAl = silicic acid co ncentration, and r = [K+]/[H+] for each equ ation one can plot the co rrespo nding log r vs log[SA] in the requested region:
K I = [K+ ]2[H 4 Si0 4 ]6 j[H+f = {[K+]j[H+]}2[H4Si04 ] 6
From here, 2 [H4Si04 ] 6 = K l j {[K+ lj [H+l } Taking log on both sides, and using the properties of logarithms 6 10g [H4S i0 4 ] = log K I
-
2 log {[K+]j[H+]}
log {[K+] j[H+]} = 1j 2 10g K 1 -310g [H4Si04 ]
ISAl log [SAl I.00E+OO 0 I.00E-01 - I I.00E-02 - 2 I.00E-03 - 3 I.00E-04 - 4 I.00E-05 - 5 I.00 E-06 - 6
By substituting and rearranging one gets
-
9.3
Th is line gives the equilibrium between mica and gibbsite . (d) Because Si0 2 is a solid and H 20(l) is the reaction medium, one ha s that K = I X 10- 2.7 = [H i0 (aq)] sp
4S
4
and thu s the solubility limit for [H4Si04(aq)] is I x 10- 2.7 M (in the absence of other silica containing species).
5.3.2 .1 Dissolution and Precipitation of Solids As introduced above, the interaction between the hydrosphere and the lith osphere frequently results in mass exchange. In this way rocks get dissolved, sediments build-up, stalactites and stalagmites form , materi als get transported, and so on. The pH of water and of sediments determines the mobility and solubility of different elements, which may in tum modify the redo x potential of the aque ous medium. For example, aluminum, calcium, magnesium , iron , manganese, and other metals become more soluble at low pH; if pH increases, their solubility decreases and precipitat ion occurs.
-
log ' 2 9.30E+OO 6.30E+OO 3.30E+00 3.00E-0 1 2.70E+OO 5.70E +OO 8.70E+00
'2
5.01 187E-10 5.0 1187 E-07 0.000501187 0.501187234 501. 1872336 501 187.2336 50 1187233 .6
14
10
Thi s line gives the eq uilibrium between fe ldspa r and mica . 10g{[K+l j[H+]} = - 310g[H4 Si0 4 ]
r
3.89045E-07 0.000389045 0.389045145 389.045 145 389045. 145 38904 5 145 3.89045E+ 11
12
log {[K+ II[H+]} = -3 log [H4Si04l - 6.41
Now, for Eq. 2 one uses the same procedur e and
log " - 6.4 1 - 3.4 1 -0.41 2.59 5.59 8.59 11.59
8 6
~
2
o -2 -4 ~
-8
-10
+--~~......---.----.----.-~--r----,~ -5 -3 -2 -1 o
log [SA]
(f) At the point where [K+]/[H+] = 102 and
[H4Si04 ] = 10- 3, we have log [SAl = -3, and log r = 2. From the plot one ca n see that the stable spec ies at (-3 , 2) is mica.
Using the idea s discussed in Section 2.1, the following equilibrium applies to an ionic so lid in equilibrium with its ion s in pure water: M xAy(s) ;::::2 x M m + + y A n -
x;
= [Mm+Y[A" - ]Y
(5.2)
(The conditions for this equation to be reasonably accurat e are that the solid be of uniform composition and large grain size. In addition, it is assumed that no protoly sis reaction s nor ion pairing occur and that no complexes nor multinuclear spec ies are formed). Taking negative logs on both sides of equation 5.2 , - log K sp = pK sp = - x log [M m +] - y log [A?"] (5.3)
5. The Chemistry of Processes in the Lithosphere
88
Or------------::_---------, ...:=:...--....
-i!.
slope = YI X
+
E
j
Undersaturated
• P~ FIGURE 5.5.
1-._-----------_--1 o
pA
Precipitation diagram for an ionic solid in equilibrium with its aqueous ions.
From the general defin ition of pZ = - log Z, one get s upon rearrangement: x log [M m + ] = -pKsp
+ Y pA + (y j x ) pA
log [M m + ] = -(ljx )pKsp
(5.4) (5.5)
This is a straight line with a slope y]» and an intercept equal to -(ljx) pKsp . The plot of this equation
is actually the precipitation diagram for the system and is shown in Figure 5.5 . For salts of different stoichiometries (e.g., M2A. MA, or MA 2), the equilibrium lines can be obtained from eq. 5.5 as shown in Example 5.4. To calculate the solubility of a salt, let us use the ionic salt MA with a I:1 ionic stoichiometry. For
Example 5.4 Slopes and intercepts in precipitation diagrams. For the following ionic so lids , find the slope and in tercept of each precipitation lin e (eq . 5.5) in terms of the corresponding pKs p : (a) BaS04, (b) CaF2, and (c ) Ag2Cr04 or-----,---::---::",_---, I
Answer Using equation 5.5 , one gets: Salt BaS04 CaF 2 Ag2Cr04
x
y
I
I
1
2
2 1
Slope - y l x 1
2 1/2
Intercept - pK sp - pK s p - 1/2pKsp
e;: ~
-(1/2)
PK",
-'I
opK", L -
The corre sponding plots are shown in the following figure .
o
pA
Note : These lines become less valid as [Mm +] and [A n - ] increase, i.e., toward the extremes of each equilibrium line because the concentration s become more and more different than the activities.
89
Weathering
0....--------------------7"1 \
\
\
\
\
\~ \
\
+...... E
~
\
'\ ./
~
\ 4
\ '> \
0>
\
.Q
\
\
\----Z: \
- pK
\
\
\
\
\
_.;lo__
~
sp
• solubility of MA
o
....J
pA FIGURE 5.6. Solubility of the salt MA.
this salt, (5.6) Assuming that the concentration of any other ions possibly present (including H+ and OH -) is very small compared to [M m+] or [A":"], then log
[M m + ]
= log [N -] = -pA
(5.7)
The dashed line in Figure 5.6 represents this condition . The solubility of this I: I salt is given by the concentrations of [M m + ] and [A":"] at the intersection . In the general case, the solubility is given by equation 5.5. Another way of looking at solubility equilibria to find out whether a solution is oversaturated, saturated, or unsaturated consists of calculating the free energy for the system in eq. 5.2. From eq. 2.58 and 2.69-2.72 one can write the free energy change for this equilibrium as ~GO = -RTln K sp
+ RTln Q =
RT In(Q/ K sp ) (5.8)
where Q = rn [Products ]produCIS}j rn [Reactants yeaclanIS} . Then, the following conditions apply:
If Q < K sp , then ~Go < 0 and the solution is undersaturated If Q = K.,p, then ~Go = 0 and the solution is saturated If Q > K sp , then ~Go > 0 and the solution is oversaturated (or in equilibrium with a precipitate)
Under real circumstances equilibrium conditions are difficult to attain, and kinetic criteria (which are often hard to predict) playa key role . To complicate matters, the stoichiometries of some of these reactions do not obey their theoretical chemical equations. In addition, the formation of a solid phase can be the result of successive reactions with varied rates. See, for example, the simplified precipitation pathway offerric ions with hydroxide ions, depicted in Figure 5.7.
5.3.2.2 Dissolution ofNatural Oxides Ligands and metal complexes present in aqueous systems in contact with natural oxides can affect their dissolution either by promoting or inhibiting it. For example, some metal-EDTA complexes react with Fe203 and dissolve it, producing [Fe(III)EDTA]. Other minerals like Co(III)OOH and Mn(III)OOH reductively dissolve by oxidizing ligands and metal complexes. Dissolution rates can
5. The Chem istry of Proc esses in the Litho sphere
90
n CFe
L
»-:
+
L ] _OH
the dissolution of solid metal oxides is discussed in Chapter 8. Soil components often retain complexes more strongly than they retain metal ions alone. For example, the general description of a surface reaction for the complex of a divalent metal (e.g., Pb 2+ ) with a typical tetra valent ligand (e.g., EDTA4 - ) is dep icted by
2+
2+
n
[L -
OH~
Fe
L4]
=SOH + ML2-
H
o [ I..2(OH)2Fe()Fe(OH)2L2 ] + H
.,W +
l3F~ ( ) OH 0
FeL3 I OH
t
+
2,",0
1 2n[FeOOH . 3L] = 2n[FeOOH . 3H20] FIGURE 5.7 . Simpl ified precipitation scheme of Fe3+ + OH - . Here , L denotes H20 .
be linear funct ions of the surface concentration of the ligands. The action of polyphosphate anions on (a) v m
»
AB +CD
1 1
V
S
(b) v m
«
V
AB + CD
sm
SS
+ H 20
(5.9)
To circumvent such seemingly insurmountable difficultie s, approximation s and simplifications can often be made . For example, even though the formation of a solid from a saturated solution can involve several successive reactions, one may judiciously select for analysis or pred iction the one that presents the slowest rate. The so-called Ostwald's phas e rule states that a supersaturated solution that undergoes a sudden alteration that takes it out of such a state will produce a metastable solid (instead of the expected thermodynamically stable solid). It is a very useful rule , although it is not alway s obeyed. Three limit ing cases are shown in Figure 5.8 for different values of the overall crystallization rate (nucleation + crystal growth ), v. It is then clear that under a given set of conditions, metastable and/or stable phases can exist. To find the conditions for precipitation/dissolution of a stable solid, one can use the corre sponding thermodynamic constants as shown in the following example.
40L
2nL
[
=S-L-M-
5.3.2.3 Stable and Meta stable Solid Phases
n
1
+ H + -+
s
(c) v m =
V
S
AB +CD
A
sm
Ss
Ss
FIGURE 5.8. Forma tion of metastabl e (super index m ) or stable (super index s) ph ases by precip itation of the solid S fro m an aqueous solutio n.
91
Weatherin g
Example 5.5 With the following data, establish the four main equilibrium equations involved in the solubility/preci pitation of iron (III) hydroxide, in the form: log [X] = f (pH) . Then, plot the complete solubility diagram for this substance. Lastly, show the predominance zone of the insoluble Fe(OH h
10.32. Common
practice considers that the predominant species that determines the alkalinity of water in the pH range 6.38-10.32 is [HC03 ]. Carbonate equilibria are further discussed in Experiment 4. Another interesting result of carbon dioxide solubility in water is that it constitutes the basis for the phenomenon of spontaneous and violent liberation of dissolved CO 2 to the atmosphere in a stratified lake, as in the case of Lake Nyos in Cameroon mentioned above (see Section 6.1.3). When dissolved C02 seeps from a hydrothermal vent into a stratified lake , the pressure and low temperature favor the dissolution and saturation in the lower strata of the lake. Because of its high solubility, more than five volumes of CO 2 can dissolve in one volume of water. As for any other gas, however, its solubility depends on temperature and pressure, making the
Lastly, pH
= -log[H 30+] =
-log(2.1 x 10- 6 )
and pH = 5.7 which shows that rainwater will be slightly acidic, even under non-polluted conditions. The proton concentration thus calculated (2. I x 10- 6 ) is indeed considerably larger than that provided by the self-dissociation of water (i.e., I x 10- 7 ) , and thus our assumption can be considered appropriate.
stratification intrinsically unstable. The long stability of such accumulation stems from the fact that C02-rich water is denser than pure water, as long as gas bubbles do not nucleate. The horizontal layering is due to the diffusion of the C02 and the temperature of the lake stratum. Thus, it seems that there are two possible reasons for the release of the dissolved gases : one is that an external trigger upsets the lake stratification (e.g., landslide, earthquake, or heavy rain); another is that CO 2 bubbles nucleate within a saturated layer of the lake water, then they rise and grow, attracting in their wake deeper water available for liberating the gas in solution. This may initiate a chain-like reaction, causing the entire lake to overturn through an ascending column of rising and expanding CO 2 bubbles.
6.2.2 Interactions between Water and Sediments/Soil There are many interactions between water and sediments/soil. Some examples are discussed in Chapter 5.
116
6.3 Physicochemical Processes in Aquatic Systems In addition to the influence of the gas-water equilibria discussed above, the presence and concentration of different compounds in surface water, seawater, groundwater, and the like depend on physicochemical proce sses such as weathering, adsorption, ion exchange, redox proces ses, and precipitation reaction s. The se reactions and processes are affected by the interactions among the different dissolved species and tho se with suspended constituents and sediments. Physical processes such as water flow, transport phenomena, evaporative processes, and others can also determine the composition and transformations of the different compounds. Reactions occurring in pristine or polluted waters typically include acid-base (protolysis), electron transfer (redox), electron-sharing, complexation, ligand exchange, and light-induced reactions. The master variables here are normally pH and pE, as defined in Chapter 2. Such reaction s are normally respon sible for the incorporation, removal, or transformation of ions and compounds in aqueou s media; the se react ions are considered next. Hereafter, we will proceed to a brief discus sion of other chemi cal and physical phenomena mentioned above.
6.3.1 Chemical Processes in Aquatic Systems The main natural phenomenon that contributes to the presence of new compounds in water is the weathering process. Water (mainly acidic water) and gases in air or dissolved in water (mainly oxygen and carbon dioxide) can cause chemical weathering. The ions and compounds formed or removed from mineral s and soil percolate and move into rivers, lake s, and groundwater, thus changing their original composition. Weathering reaction s are caused by the interaction of water and air with the surface of compounds on the Earth 's crust. The se are normall y slow reactions, previously discussed in detail in Section 5.3.2.
6.3.1 .1 Acid-Base Reactions As discussed in Section 2.2, acid-base reaction s depend on the pre sence of proton donors and accep-
6. The Chemistry of Processes in the Hydrosphere tors. The main natural sources of proton donors include the dissolution of atmo spheric gases (mainly CO 2) and the additional CO 2 contributions from biochemical proce sses, some of which will also promote the presence of organic acids as decomposition products (such as fulvic and humic acids). Proton acceptors include basic substances (e.g., amine s) and some alkaline or alkaline earth metal derivatives (e.g., sodium carbonate, calcium hydroxide). Protons are sometimes released by ion exchange reactions between aqueous components and living organisms or soil, whereby protons are unconfined due to cation substitution. Another natural proton source is the oxidation of S-, N-, and P-containing compounds, as well as the oxidation and hydrolysis of hydrated polyvalent metals such as AI3+ , Fe2+, and Fe3+. For example, AI(H20)~+
+ H20 (l ) +± AI(OH)(H 20); + + H30+ (6.8)
a. The pH of Aquatic Systems The hydrological cycle involves pH variations. In fact , most natural waters have a pH between 4 and 9 that is controlled mainly by the carbon dioxidecarbonate equilibrium. For instance, as calculated in example 6.4, the pH of rainwater is around 5.7 because of its equilibrium with carbon dioxide , but as it touches the Earth and come s in contact with decomposing organic materials, it may acidify even further. On the other hand, if water come s in contact with alkaline environments, mineral s or sediments - mainly carbonates (which upon dissolution in water generate strongly basic media), its pH will rise. Sometimes the natural oxidation of sulfur compounds expo sed to air and rainwater will generate sulfuric acid that may lower the pH to extremely acidic values . This is typical of mine spoilage or acid mine drainage, AMD , where pyrite (FeS2) is exposed to oxidation: FeS2(s) + 15/402(g) + 12 H20 (l) Fe3+ + H+ + 2S0~-
---+
(6.9)
Acid drainage originates when the sulfidic rock is exposed to the atmo sphere and oxidation processes take place, transforming the sulfur compounds of
Physicochemical Processes in Aquatic Systems
117
the minerals into sulfuric acid. Th is phenomenon is further discussed in Section 8.4.3. The pH of a system determ ines the reactions that define the concentration of man y dissolved chemical species in wate r co ntaining salts and minerals, supplied by weathering reaction s, rain , runoff, and lixiviating processes. The pH is a key parameter for biological grow th and for the sustainment of life for the different aquatic flora and fauna species. As discussed in Chapter 2 the co ntribution of the different species will affect the final pH and vice versa (i.e., the pH on its own often determines the form of the species present). That is why the distribution diagrams of chemica l species are frequently defined as functions of pH (Section 2.1.2). In summary, the main environmental processes that affect the pH and the alkalinity of natural water s include: (a) Physicochemi cal processes • Acidificatio n through atmo spheric CO 2 dissolution • Atmospheric acid deposition • Oxidation and hydrol ysis of hydrated polyvalent metals • Cation uptake and proton exc hange • Acidification through air-ox idation of metal sulfides • Basifi cation by partial dissolut ion of solid carbonates • Acidification by NH 4HS04 aeroso ls from ocea n sources (b) Biologically mediated processes • Photosynthe sis and respiration (liberation of CO 2 ) • Nitrification (ammonium ion oxidation that involves proton liberation): 2NH:
+ 302(g) +± 2NOi + 4H + + 2H20(1) (6.10)
• Microbial-mediated production of sulfides and further oxid ation to sulfuric acid: R - SH
+ H 20(l) +± R -
OH
+ H2S(g) (6.11)
H2S (g) + 20 2(g ) +± 2H+
+ SO~ -
(6.12)
• Acidification from biod ecomposition of organic matter (formation of humi c and fulvic acids)
J:
a.
Buffer Acid Buffer Capacity
Base Buffer Capacity
Volume of base added - ) (- Volume of acid added FI GURE 6.6 . Schematic diagram of the buffer capacity of an aqueo us system. (Source: Dartm outh University, 2005 ).
b. Buffering Ca pacity in the Environm ent In an enviro nmental aqu atic system, the dissoluti on of ions fro m soils and the dissolut ion of atmo spheric or biologically generated gases may determine its neutrali zing and buffering capacities. (The action of buffers is discussed in Section 2.2.2). They consist, respectively, of the ability to neutralize and to resist pH changes resulting from acidic or basic inputs or discharges. These properties allow an aquatic system to tolerate such inputs as long as they do not surpass its bu fferin g capaci ty (see Figure 6.6). This phenomenon is mainly due to the presence of inorgan ic or organic conjugate acid- base pair s in natural waters, and of soluble minerals and inorganic compounds from sediments. The conjugate base neutralizes the extra acid input, while the conjugate acid rea cts with the extra base. Th is is a common occurrence, especially in the presence of salts of weak acids or bases, because they establish equilibria between the two phases: solid (sediments) and aqueou s. Thi s allow s the aquatic system to have a neutralizing and buffering capacity. Many natural aqueous systems have ion combinations in solution that allow them to fun ction as buffers. Other aquatic systems (e.g., some river s and lakes) lack such ions or have a poor buffering capacity, and therefore they are vulnerable to acid or basic inputs. The spec ies produced by the dissolution of CO 2 in water are extremely important in regul ating the pH of natur al waters. Like wise , the presence of limestone, calcite (calcium car bonate), and
6. The Chemistry of Processes in the Hydrosphere
118
dolomite, CaMg(C03h (that are commonly present in soil and sediments) is often decisive for the neutralizing capacity of aquatic systems. Other common species that have an effect on the pH and buffering capacity of natural systems include phosphates, borates, amino acids, and some organic compounds (generally weak acids). Phosphoric acid is a polyprotic acid that liberates one proton in each of its three dissociation steps, leaving a weaker acid in each step: H3P04 ~ H zP04" + H+
K I = IO- Z. 14
HzP04" ~ HPO~- + H+
Kz
(6.13a)
= 1O-7.zO
(6.13b) HPO~- ~PO~- + H+
K 3 = 1O-
1Z.34
(6.13c) The evident buffering capacity in seawater resists pH changes due to acid or base inputs and maintains a pH close to 8 because of the presence of several ions [mainly the HC03" /CO~- pair and the borate system, B(OH)3IB(OH)4"]. Although borates and carbonates are considered weak bases, they actually act as amphoteric species (i.e., they behave as acids or bases, depending on the nature of the other species present). When a strong acid is present in the solution, the amphoteric species acts as a base; if a stronger base is present, it acts as an acid. For example, in the H ZC0 3INaHC03 system, this conjugate pair behaves like seawater by showing a relative insensitivity to pH changes resulting from acid or base additions. As noted in the buffering index discussion (Section 2.2.2), this ability will be best at pH values in the vicinity of each pKa or pKb of the weak acid or base. When the carbonate system is the buffer, the addition of H+ gives : (6.14) This reaction prevents a large pH drop in the system. A similar buffering behavior is observed when a base is added to the buffer solution. Here, the OHof the base reacts with the acid, forming more hydrogen carbonate ions : (6.15) Because the ratio of carbonic acid to hydrogen carbonate ion decreases here, then the pH rises but only
slightly. When the acid or base added to the system completely neutralizes either member of the pair, the system moves out of the buffering range and the buffering action is lost. Changing the ratio by a factor greater than 10 will have this effect, and the pH will then change directly with the amount of acid or base added. c. Alkalinity or Acid-Neutralizing Capacity Because the buffering capacity of a natural aquatic system is often too complex to calculate, a much simpler alternative is to determine its alkalinity or, alternatively, its acid-neutralizing capacity (ANC). These parameters represent the ability of an aquatic system to neutralize an acid discharge, because they measure the concentration of neutralizing ions present in the aqueous system. The difference between alkalinity and the ANC of a water sample is that the latter considers the acid neutralizing capacity of solutes plus particulate matter, whereas alkalinity only takes into account the dissolved species. Alkalinity generally gives valuable information with respect to the concentration of carbonate species because the carbonate system is the key factor for the buffering capacity in aquatic systems. Both parameters are generally reported as equivalents (or meq, or ueq) per liter, or ppm of CaC03 . Alkalinity is algebraically represented as the total concentration of basic anions present in water minus the hydrogen ion concentration; it generally considers only the basic anions associated to the carbonate system because it is the predominating species in nature. This may be expressed as mg/L (as calcium carbonate): Alkalinity = [HC03"] +2[CO~-] + [OH-] -[H+] (6.16) Any substance contained in an aqueous system that reacts with a strong acid contributes to its ANC. Important non-carbonate species that contribute to this capacity include organic ligands (e.g., acetate and propionate), silicates, borates, ammonia, and sulfide ions. Phosphate and arsenate ions, when found in high concentrations, may also contribute to the ANC. In average natural waters, non-carbonate contributors are not present in sufficient amounts so as to affect the alkalinity or ANC determinations.
119
Physicochemical Proce sses in Aquatic System s
12,.....
-,
10 2nd endpoint, at pH 4.3
3
4
5
Titrant volume, mL 6.7. Experimental determination of alkalinity or ANC in a water sample.
FIG URE
d. Experimental Determination of Alkalinity or ANC Alkalinity can be determined by an acidimetric potentiometric titration of a filtered sample. In the case ofthe ANC , a raw water sample is used. The titration involves the addition of an acid of known concentration (typically in the range 0.01 to 2 N HCI or H2S04) to a given sample volume Vs . A typical plot is schematically shown in Figure 6.7. The first endpoint (phenolphthalein endpoint, at Vp ) occurs at pH ~ 8.2 and indicates the neutralization of OH- and the conversion of CO~- to HCO;as follow s:
+ H+ +±H 20 (6.17) (6.18) CO~- + H+ +±HCO ;The second endpoint (at V p + VM , where VM is the OH-
methyl orange endpoint) occurs at pH ~ 4.3 and indicate s the conversion of HCO ;- into H2C03 as follows: (6.19)
Then , the amount of acid added at V p provides all the H+ necessary to neutralize the OH - present, plus half the H+ necessary to titrate CO~- all the way to H2C03. Similarly, the amount of acid added from V p to the second endpoint VM is the amount needed to titrate all the HCO ;- (i.e. , that produced in the CO~- + H+ +± HCO ;- reaction, plus the HCO;initially present in the sample), to H 2C03. This
interpretation also involves the (reasonable) assumption that the initial [H+] is small and thus H+ is not a major component of the sample. For different alkalinity cases, see Example 6.5. The relative neutralization capacity of an aquatic system to acid depo sition or acid drainage may be assessed using Table 6.11 . Alternatively, the sensitivity of an aquatic body can be given in terms of the ANC (using the same units as in the previous table): :sO (Acidified), 0-40 (Very sensitive) , 40-200 (Sensitive), >200 (Insensitive). (See Thomas, 1992.) Although it is good for neutralizing acid deposition, the ANC in freshwater systems is one of the critical parameters for determining the risk to the flora and fauna living in those systems. For example, Scandinavian countries have limited the ANC value for freshwater lakes to 20 ueq/L since brownlake trouts and other species respond negatively to increased alkalinity levels.
6.3.1.2 Redox Reactions Because the pH of natural water systems is a function of their dissolved compounds (including gases), these species also confer a definite electrochemical reduction potential range to the aquatic medium. Some of the pH and E values typically found in natural water systems are given in Table 6.12. Redox conditions vary in natural aquatic systems with composition and depth. The superficial or top layer provides an oxidizing environment, usually with a high dissolved oxygen content (and thu s a high E), and as a rule the species found there will be in a highly oxidized state. The lower or bottom layer provides a reducing environment, with low dissolved oxygen concentration where reduced forms predominate; microorganisms mediate many redox reactions here (see Chapter 7). Redox reactions affect the solubilization of certain solids and their mobility as well. Elements whose solubility strongly depends on their oxidation state include Fe, Mn , Cr, N, and S. Oxygen is normally the main oxidant or electron acceptor; however, when there is oxygen deficiency, these other elements may become the electron acceptors and their compounds change to a reduced form . In this way, Mn(II1) or Mn(lV) are reduced to Mn(II); Fe(II1) to Fe(II ); SO~- to S2- ; and NO;- can be
6. The Chemistry of Processes in the Hydrosphere
120
Example 6.5 Alkalinity (A) Match each alkalinity case (as specified by the results of the corresponding titration, given in the left column) to its appropriate interpretation (right column). Note that the predominant (and only) species considered in this aqueous system before each titration are OH - , CO~- , and HC03'. I. Vp = 2. Vp = 3. VM = 4. VM > 5. Vp >
a. b. e. d. e.
VM
0 0 Vp VM
CO~- and HC03- predominate Only CO~- is present
Only HCO;- is present OH - and CO~- predominate Only OH- is present
and
[CO~-] = N~~p = (~;) v-. in (mal ~o~-) The other cases can be solved in the same way, as shown below. (Suggestion: try not to look at the answers until you have solved all five cases). CASE 2
Only HC0 3 - is present. Then, [HC03']Vs = NHVM
Answer to (A)
[HC03'] = NH V M = (NH) VM
I-b, 2-c, 3-e, 4-a, 5-d
Vs
(B) For cases I through 5 of part A, write the concentrations of the following species (in mol/L) as a function of: • the concentration of the acid titrant (N H, expressed in equivalentslL), • the sample volume (V s), and • the parameter(s) specified in each case. As a guide, see the solution to Case I below. Cone . sought, mollL
Parameter (s)
Answer, mollL
1
[CO~-l
Vp
2 3 4
[HCO;-]
(~) Vp
VM Vp (i) Vp (ii) VM, Vp (i) VM, Vp (ii) VM
Case
5
[OW]
(i) [CO~ -] (ii) [HCO;-] (i) [OW]
(ii) [CO~-]
Vs
CASE 3
Only OH- is present. Then, [OH-]Vs = N H Vp p [OH-] = NHV = Vs
(N
H
Vs
Vp
)
CASE 4 CO~- and HC03' predominate. (i) Since titration ofCO~- to the phenolphthalein
end-point is independent of the presence of HC03', one can use the same expression derived in Case I for [CO~-] :
[CO~-] = (~;) V p (ii) Since VM contains the H+ necessary to titrate both, the HC03' coming from CO~- as well as
Answer to (B)
the HC03' initially present, one can find this last unknown by simple substitution:
CASE J
moles ofH+(in VM )
In this case, only CO~- is present (see the answers from part A). Because one H+ titrates one CO~ to the phenolphthalein end point, then moles CO~- = moles H+ (
mol CO~-) (mal H+) p L Vs = L V = (mol H+) (I equiv . H+) V p
L
= (
equiv. H+) L
I mol H+
V p =NHVp
= moles of HC03' (from CO~-)
+ moles
of HC03' (initially present) = moles of CO~-
+ moles of HC03'
Then, moles of HC03' = moles of H+ (in VM )
-
moles of CO~
[HC03']Vs = [H+]VM - [CO~-]Vs [HC03']Vs = NHVM - [NH/Vs]VpVs
=
[HC03']
NH(VM - Vp)
= [NH/Vs](VM -
Vp)
121
Physicochemical Proce sses in Aquatic Systems
CASES OH - and CO~ - predominate. One can differentiate between them by noting that the phenolphthalein end-point encompasses both species, whereas the methyl orange end-point does not measure the OH-. Then, (i) We subtract:
To convert a CO~- concentration of C (mol CO~- / Lsolution) into alkalinity (mg CaC03ILsolution), the following conversion factor is used :
. . (C,mOlco (I molcaco )
+ moles of CO~-
minus mole s of H+(in VM ) = N H VM = moles of CO~ Nu Vp - N H VM
= moles OH- =
[OH -]Vs
L
[OH -J = (NHVP [OH -J =
-
.. (N,
(I
equiv L
Lastly,
v, = NHVM [CO~-] = (~;) VM
Alkalinity =
[CO~-]
TABLE 6.11. Classification of an aquatic system according to its capacity to neutralize an acid discharge ANC,' ueq CaC031L
Classification
o
No capacity - acidified Low capacity Moderate capacity High capacity
o to 25 25 to 200 200 to 500
'Determined by a Gran titration plot. Source : U.S. Environmental Protection Agency, 2003.
3
CO~-)
(
I
mol co 23 - ) 2 equivco 32-
(100
mOlcaC03) gCaC03) I mol co 32I molcaco3 3 x (10 mgCaC03) I gCaC0 3 X
molesofCO~- = NHVM
reduced to gaseous N z, passing through several oxidation states corresponding to different denitrification stages. The actual reduction of aqueous species is limited by the potentials corresponding to the oxidation and reduction of water, respectively, given by E = 1.23 - 0.059 pH and E = -0.059 pH, as discussed in Section 2.3.4 . However, thermodynamics and kinetics do not always coincide, and a more re-
I mol co 23
Alternatively, if one starts with the normality of
VM )
(ii) To find [CO~-], one simply uses the second expression from (i):
)
CO~-, the conversion is
~sNHVM)
(~;) (Vp
-
= 105 C mgCaC03 L
Alkalinity =
Then,
3
3 x (100 gCaco3) (10 mgCaC03) I moiCaC03 I gCaC0 3
moles of Hf (in V p ) = NHVp = moles of OH -
2
Alkalinity =
C~5)
N
mg~C03
= 5 x I04N mg CaC0 3 L
alistic potential range observed in natural waters is approximately +0.5 to -0.5 V. Among the most common natural redox reactions are the oxidation and reduction of Fe species. For instance, iron is present as Fe(II) in the primarybearing minerals. Fe(II) is liberated through weathering reactions in proton-rich media, and becomes easily solubilized and oxidized to Fe(III) in the presence of dioxygen; it is simultaneously hydrolyzed
TABLE 6.12. Typical pH and E ranges of natural systems System Waterlogged soils Rain Rivers and lakes Marine sediment s Oceans (surface waters)
pH
E(V vs SHE)
3.8-5 .7
-0.3 to 0.05 0.4 to 0.5 0.3 to 0.4 -0.5 to 0.25 0.2 to 0.3
5-6 6-7.5 6.3-8.8 7.6-8.8
6. The Chemi stry of Proce sses in the Hydrosphere
122
Example 6.6 A 50 .00 mL water sample is titrated to the phenolphthalein end-point with 5.00 mL of 0.02 N H 2 S0 4 , and to the methyl orange end -point with additional 5.00 mL of the acid. What is the total alkalinity, in mgCaC0 3 /L? An swer Since V p = VM (which corre spond s to Case I in the previous example), one can assume that CO~ predominates in the system. Using the equation corresponding to Case I , one gets
Total alkalinity = 105
X
0.002 mg~C03
= 200 .0 mgcaco 3
L = 4.0 meqcacoJL
[CO~-] = (N H / Vs)Vp = (0.02/50)5
= 0 .002 molc0 32- /L
into an insoluble iron oxy-hydroxide product, as shown below: Fe
2+
+ -4I 02(g) + -23 H2 0 (l ) +± FeOOH (s) + 2H +
(6.20)
Different oxidation states as well as different solid and dissolved compounds can be predicted from the corresponding E -pH diagrams, as discussed in Chapter 2.
6.3.1.3 Complex Formation Metals are present in the environment in a variety of form s, including inorganic and organic complexes. The pre sence of complex-forming ligands in natural environments is quite varied . Examples include citrate ions (found in natural waters as a result of biological activity), humic and fulvic acids (found in soils and wate r), amino acids and other DOM (dissolved organic matter, i.e., simple organic acids) , and the like . Additionally, many ligands are pumped into the environment as a result of a myriad of industrial and other human acti vities (see Chapter 8). The importance of complex formation is exemplified by the binding of Mg, Na, Co, Mn, Fe, Cu , and Zn to fulvic acid s (FA), and of Fe to humic acid s. The binding capacity of these natural acid s for metal ions is within the range of 0.2-0.6 mmol/g, and the order of stability of complex formation (M-FA) with some key metals is Fe H > A1 3+ > Cu 2+ > NiH > Ca H > Zn 2+ > Mn 2+ > Mg 2+ (see Schnitzer, 1970). Interestingly, some cryptogams (i.e., mosses and lichens ) capture part of their essential minerals by secreting
ligands to complex them from their host rocks. Other examples follow. a. Metal Complex and Ligand Adsorption onto Solid Surfaces. Because many aqueous metal ions and complexes adsorb onto mineral s such as Fe and Al oxides and hydroxides, this alters the met al partitioning between the aqueous and solid phases; consequently, their migration, mobility and bioavailability can be affected as well (Section 6.3.2). Complexation of metal ions by ligand s in solution can be in competition with the binding of metals onto solid surfaces. The final result will depend on
• the concentration of the ligand • the concentration of active surface sites on the solid (sediment or soil) • the stability of the metal-ligand complexes in solution • the stability of the solid surface compl exes. For example, in the presence of strongly binding natural organic ligands in water (especially at pl-l » 6), metal s such as Cu, Ni, and Cd remain in solution, decreasing their extent of adsorption onto solid particle s (e.g., goethite). On the contrary, with weaker ligands (even in excess), and more acidic pH, the metal ions prefer to adsorb onto soil or sediment particles. b. Natural Oxidation ofDissolved Metal Complexes Oxidation react ions of metal complexes by dissolved oxygen are relatively common. For example, Fe(II) complexes can be oxidized to their Fe(III )
Physicochemical Processes in Aquatic Systems
123
counterparts: 4[Fe 2+L"-](2-1 ) + 0
2(g ) + 2H 20 (l) ----+ 4[Fe 3+L" -](3- ") + 40H-
(6.2 1)
Another example involves complex oxidation with the participation of natural cata lysts such as goethite (a-FeOOH), a redox -reacti ve solid: 4[Co(ll)EDTA]2-
+ 0 2(g) + 4H +
4[Co (III)EDTA) -
+ 2H 20(l )
goet hite
-----*
(6.22)
6.3.1.4 Speciation As mentioned in Chapter 2, the form in which the elements and co mpounds are found in different environments depe nds on the medium conditions. Thus, the distribution of their species in water is highly dependent on pH, composition, temperature, and the oxidation- red uction potential of the solution . These variables define their precipitation, disso lution, and complexation reactions. For example, Pin water may be present in different forms (polyphosphate , H2P04 - , HPO~ - , or PO~- ) but the domi nant species present strongly depend on pH (see Section 8.4.3) and on the solution's ionic strength. As a case in point, H2P04 - will be the dominant species in fresh waters (at pH ~ 6), but HPO~ - predominates in seawater (pH ~ 8, and high ionic strength). Phenomena such as chemical and biological transformations, metal mobility, bioavailability, bioaccumulation, toxicity, and persi stence in the environment freq uently depend on the chemical form or speciation of a give n ion, especially the metallic ions. For example, there is normally a great difference betwee n the sorptio n behavior of a free metal cation and that of its anio nic complexes onto mineral oxides and hydroxides . In the same vein, ligand speciation may drastically affect the nature of the complexes they form. (For ligand speciation calculations, one can use the chemical-species distribution algorithm derived in Section 2.1.2). For example, EDTA can be present as five different che mical species depe nding on pH and thus its complexes can be anionic, cationic, or neutral. This can have dramatic effects on their physicochemical properties and adsorption behavior. A case in point is the EDTA complexation of Fe 3+, where the neutral complex formed with HE DTA3- is more than 20 orders of magnitude less stable than its corresponding anio nic complex with EDTA 4- .
Bioavailabi lity and toxicity of metal ion s in aqueous system s are ofte n proportional to the concentration of the free meta l ion and thus decrease upon complexation. However, there are some metal compound s more dangerous than the metallic element itself (e.g., mercury vs. methyl mercury). The redo x environment can also determine some of the properties of meta llic and non-metallic species. For example, the toxicity of arsenic when present in oxic (oxidizing) environments such as As(V) is very low, whereas its reduced form, As(III), is highly poisonous. Th e opposite occ urs with Cr(VI) that is much more toxic than its reduced co unterpart, Cr(lll). Mobi lity can also be severely affected by the redox environment. For exa mple, Fe(ll) and Mn(II) species are ordinarily soluble in natural wate rs deficient in oxygen, but their oxi dized forms precipitate quite easily. The stability regions of inso luble Mn oxides can be seen in the Pourbaix diagram depicted in Figure 6.8. Becau se of these reasons, the determination of the total concentration of a metal in a given matrix is often inadequate as a useful characterization, and spec iation has gained con siderable ground. Speciation is the proce ss yie lding evidence of the atomic or molecular form of an analyte. It can be defined either fun ctionally (e.g., the dete rmination of species that have cert ain specific functions such as their avail ability to plant s), or operationally (e.g., the determination of the extractable form s of an element). +0.8 +0.7 +0.6 +0.8 +0.4
>
ui
+0.3 +0.2
2+
Mn
+0.1 +0.0 -0.1
c=J
Mn soluble
FI GURE
~
Mn insoluble
6.8. E-pH diagram for Mn.
124
For example, the speciation analy sis of metal ions in sediments can be performed by sequential extraction , whereby each of the fractions obtained shows a different form of association of the metal in the soil matrix. As mentioned in Chapter I , an accepted modem procedure is: Step I . Extraction of the acid soluble fraction (i.e., carbonates) with CH 3COOH Step 2. Extraction of the reducible fraction (i.e., iron/manganese oxides) with hydroxyl amine hydrochloride Step 3. Extraction of the oxidizable fraction (i.e., organic matter and sulfides) by HzOz oxidation followed by extraction with NH4(CH3COO) Sampling and analyzing in a way that does not affect the speciation of the sample is not always a trivial task , because the integrity of the target species can sometimes be altered quite easily. For example, a common practice is to add acid to samples to preserve species in their original form ; however, this practice may lead to changes in ligand speciation as well as in the oxidation states of metal ion s. Another example is the sampling and storage of Hg-containing samples because this metal can escape from containers made of certain plastics, which yields lower-than-true concentrations. Other sample s are photosensitive (e.g. , alkyltins and arsenobetaine) and must be isolated from light immediately after collection. Sound knowledge of fundamental chemistry helps in most cases. For example, the analysis of Fe(II) in an aqueous sample can be accurately accomplished in an acidic environment even if it is not performed immediately, whereas the conversion of Fe(II) to Fe (III) in an alkaline environment in the presence of air is quite fast and will significantly alter the speciation results.
6.3.1.5 Colloids: Properties, Types, Sources, and Formation The size of particles in water determines to a large extent their different physical states: large particles precipitate, small particles tend to dissolve. However, this differentiation is far from clear-cut, and as a result there are particles between these two extremes that remain suspe nded in water. Because these suspended colloidal particles (called
6. The Chemistry of Processes in the Hydrosphere colloidal sols ) are not directl y observable by the human eye, they look homogeneous and do not settle upon standing. A colloid is a small particle separated from others by a dispersion medium (in aqueous systems this medium is obviously water). The size of colloidal particles range s from one nanometer (nm) to one micrometer (u rn). They are formed either by aggregates of small molecules or by large molecule s of high molecular weight. Dispersions created with coarser materials ( < 10 urn) are sometimes considered colloidal disp ersions as well. The most common types of colloidal dispersion s in aqueous systems are
• the dispersion of small solid particles • a dispersed gas that forms a foam • an insoluble dispersed liquid that forms an emulsion
In natural systems, solid-liquid dispersions are the most common colloidal dispersions. Bacteria, viruses, organic polymeric substances, or inorganic solid particles of suspended sediment can also form colloids. Organic sources of colloidal particles in water include certain living and dead microorganisms, proteins, lignin, cellulose, and the natural insoluble polymeric fraction of humic substance s (from kerogens to fulvic acids) that serve as ligand s and form colloidal metal chelates. Colloidal matter in water may also be a result of the weathering reactions of minerals such as hydrated iron oxides, and the disintegration and suspension of sediment clays that form coarse colloidal suspensions. Such colloids may also form by precipitation of inorganic ions due to geochemical changes (such as the formation of metal oxides, hydroxides, carbonates, and silicate s, particularly into non-crystalline forms). This is especiall y true when the particles do not grow into larger aggregate s that could increase their weight and make them settle easily, separating from water. A typical example of colloid formation involves acidic streams containing dissolved AI3+ that encounter neutralizing streams, whereby aluminum hydroxide colloids form . Other cases include the formation of solid oxides and hydroxide s of Fe3+ and Mn 4+ through natural oxidation processes. When dissolved, the reduced species may encounter high oxygen level s in water that favor their oxidation proce sses, as repre sented in reaction 6.20 which
Physicochemical Processes in Aquatic Systems
125
can also occur as follows: I + 2:02(g) + 5H20(l ) -+
+
2Fe(OHh(s) + 4H (6.23) Colloidal dispersions may appear either translucent or cloudy, depending on the type of colloid and the degree of particle concentration and dispersion. The colloidal particles cannot be easily distinguished from water. They possess properties that are very different from other solid settable suspensions and from solutions. When the colloidal particles are < 5 urn, they have erratic aleatory movements known as Brownian movements, caused by collisions with molecules from the dispersion medium. When a light beam passes through a colloidal dispersion, this reflects and scatters light (Tyndall effect) . Colloids are either hydrophilic (water-loving) or hydrophobic (water-hating). Hydrophilic colloids (e.g., proteins, humic substances, bacteria, viruses, as well as iron and aluminum hydrated colloids) tend to hydrate and thereby swell. This increases the viscosity of the system and favors the stability of the colloid by reducing the interparticle interactions and its tendency to settle. These colloids are stabilized more by their affinity for the solvent than by the equalizing of surface charges. Hydrophilic colloids tend to surround the hydrophobic colloids in what is known as the protective-colloid effect, which makes them both more stable . Hydrophobic behavior generally occurs in inorganic colloids (e.g., silicates, carbonates, and sulfates) that have little or no affinity for water. Such colloids tend to acquire a surface charge that promotes the adsorption of oppositely charged electrolyte ions, thereby generating a mutual repulsion of similar charges. Colloidal particles are also characterized by a large surface area/mass ratio (called specific surface), and by a strong surface charge that favors adsorption. For example, montmorillonite clays and some organic colloids may have specific surfaces of up to 800 m2/g. Colloids are either negatively or positively charged as a result of dissociated surface groups that create unbalanced charges, and of the ions of opposite charge in the surrounding medium. The magnitude and type of charge of colloids in a suspension is particularly difficult to predict. The most abundant colloids in water (including sea water) are clay minerals (see Section 5.4). These 2Fe
U
colloids typically display a negative charge that can be partially neutralized by the electrostatic adsorption of surrounding cations in solution. Such negative charges are mainly due to two effects: one that defines a permanent charge and another which is a variable effect (pH-dependent) that promotes the deprotonation of the outer OH group s, leaving the negative charge of oxygen on the surface. This variable effect is very common in other type s of mineral particles such as metal oxides, oxyhydroxides, hydroxides, and the like. The permanent charge in clays is due either to uncompensated internal charges, or to the loss or substitution of interlayer cations in the lattice structure; the latter is known as isomorphous substitution which occurs during mineral formation . This consists in the substitution of one cation by another of similar size and coordination number in the crystal lattice, without disrupting the crystal structure of the mineral. In this way, a Si 4 + moiety may be substituted by an AI3+ , or an AI3+ may be replaced with Fe2+ , Ni u or Mgu ; this unbalances the charges and leaves a net negative charge. Organic colloids (mainly humic substances) also possess large specific surfaces and are generally negatively charged due to the acidic functional groups that tend to dissociate or polarize. Examples of such groups include carboxyls (R-COOH), quinones (-Ar=O), phenols (-Ar-OH), and enols (RCH=CH -OH) . (See Section 5.4.2 for a more complete discussion of humic substances.) The net charge in colloidal particles results largely from the adsorption of ions, favored by the large surface area, that tends to neutralize the colloidal charge. This effect creates a double layer of counter ions around the particles. The sign and magnitude of the net charge on the colloid is mainly due to its chemical nature and to the characteristics of the dispersion medium (i.e., ionic strength and pH). The double layer is formed by a fixed, inner layer and an outer, diffuse and mobile layer offreely moving counter ions (see Figure 6.9). The double layer is responsible for some of the properties of colloids. It generates a surface potential called zeta potential, usually expressed in millivolts. The colloidal particles are subject to two forces : Vander Waals ' attractiveforces and repulsive forces caused by the electrostatic repulsion of similar charges. While these particles remain suspended in colloidal form, the repulsive forces predominate; the
6. The Chemistry of Processes in the Hydrosphere
126
TABLE 6.13. Ch arges on common natural colloids
+
+
+
-
+
+
+ Surface po~ntial
+
Colloid
Charge
Clay minerals Silica Manganese dioxide Sulfides Carbonates Ferric hydroxide
( -) ( -)
Organic colloids
( -)
(-) (- ) Usually (+) Usually (+) , but it may also be (- l, depending on pH
Source: Krauspkopf, 1979. \+-_-+--,-P=hase of s hear Stem layer (rigid layer attached to the particle) Diffuse layer of counterions
Concentr ation of positive ions
Concentration of negative Ions
FIGURE 6.9. Double layer of charges in a colloidal particle.
colloids mayor may not come together, depending on the net repulsive or attractive nature of their interaction. In tum, this depends to a large extent on the ionic strength of the medium, whereby one of the two opposing interactions will predominate. At higher ionic strength, the repulsion forces dimini sh due to the compression and contraction of the double layer. Such a phenomenon reduces the surface potential, allowing the colloids to come together and aggregate. On the other hand , at low ionic strengths, the repulsive forces become dominant and prevent aggregation. The flocculation and formation of colloidal particle aggregates is an example of how ionic strength modifies the forces interacting on the colloidal particles. This is the case of clay minerals or sediments discharged by rivers into estuaries . Here, the river drainage containing sediments and colloidal particulate matter encounters a strong electrolytic medium in the estuary. This increase s the concentration of counter ions that neutralize practically all the surface charges, thus reducing the size of the double layer. Van der Waals' forces then predominate , and the colloids will form aggregates and settle as sediments. The presence of organic matter (especially particulate organic matter, POM, common in seawater) promotes the coagulation of colloids by serving as binding material that favors their aggregation. Nevertheless, tidal movements re-suspend these settled
sediments, creating a region in the estuaries with a high concentration of the re-suspended sediments called turbidity maxima. Here, many other important reactions take place (especially at the solidliquid interphase). Some of the most typical charge s in common natural colloidal particles are shown in Table 6.13. One of the most relevant environmental consequences of the existence of colloids derives from their ability to adsorb different species and to exchange ions. Examples include radionuclides, organics, and metal derivatives that may be toxic pollutants. Colloids that retain these species may participate in transforming them into catalysts, after which they tran sport them into aqueou s systems located far from their original discharge points.
6.3.1.6 Photochemical Reactions As discussed in Section 2.6, natural light can induce a variety of processes of environmental importance either directly (when light is absorbed by the species of interest) or indirectly (when the species of interest reacts with an intermediate called mediator, previously excited or produced by light). The best conditions for photolysis in natural aqueous bodies involve low turbidity, low concentrations of dissolved organic compounds, bright sunny days, and quiescent waters or slow-moving streams. For example, the rate of photoproduction of ·OH radicals from nitrate photolysis (see below ) is lower at higher latitudes. For example, at a latitude 0 N (like in Lake Victoria, in Tanzania) this rate is more than twice that for latitude 60 N (like in lake Tyrifjorden, in Norway). Likewise, at this last latitude the rate can vary by a factor of 40 from mid-summer to mid-winter. In deep-water bodies (i.e., lakes) the photoprocesses are generally much slower. Some
Physicochemical Processes in Aquatic System s
127
example s of natural photoprocesses in aquatic media now follow. a. Photodegradation of Dissolved Organic Matter Most organic compounds absorb strongly only at wavelengths below 250 nm. Under irradiation in aqueou s media, the net result is usually their oxidation into simpler compounds, because initial photoexcitation is typically followed by reaction with dissolved O2 :
R~R*
(6.24)
R* + O 2 ---+ R+· + 02"· R+· ---+ products
(6.25) (6.26)
or
R-X ~ R· +X·
(6.27)
R·
(6.28)
+ O 2 ---+
R02
Since dissolved organic matter involve s considerable amounts of humic sub stances (HS), which contain 3-6% nitrogen that may undergo recycling, they can act both as sources and sinks for ammonium in natural waters. Their natural photodegradation produces significant concentrations of nitrite , N02" ; this anion plays a crucial role in many biological processes in water within the nitrogen cycle. In addition , trace amounts of nitrite usually indicate the extent of pollution and eutrophication in natural waters. The rates of direct photolysis are often much slower than those of indirect photolysis. For example, the rate of direct photooxidation of atrazine (a herbicide) is six time s slower than that of its indirect, nitrate-mediated photooxidation (see below) . b. Photoly sis of Nitrates and Nitrites Nitrate is the most thermodynamically stable aqueous nitrogen species in oxic (i.e., oxidizing) environments. However, it can be photolyzed by natural sunlight to produce hydroxyl radicals , ·OH, that are known to be powerful oxidizing agents. The net result involve s rapid nitrate-induced photooxidation s. Other species (ozone, hydrogen peroxide, nitrite, dissolved organic matter, and FeOH 2+) also produce ·OH upon photolysis, although that of nitrates is believed to be the key source of ·OH in natural waters. Such a photolysis can follow three
pathways: (a) NO;- + hv ---+ N02" + 0 (atomic) (b) NO;- + hv ---+ N0 2 +·0-
(6.29) (6.30)
followed by ·0- + H 20(l)? ·OH + OH-
(6.3 1)
(c) NO;- + H 20(l) + hv ---+ NOi + OH - +·OH (6.32) The photolysis of nitrites is as follow s: N02" + hv ---+ NO +·0·0- + H20(l)? ·OH + OH -
(6.33) (6.31)
These ·OH radical s produce several environmentally important oxidation reactions. They can be scavenged primarily by dissolved organic matter, DOM (in waters with high dissolved organic carbon concentration, DOC), or by carbonate and hydrogen carbonate ions (in waters with high alkalinity). The bromide ion is their key scavenger in seawater. Nitrate photolysis is likely to provide a key pathway for the oxidation of different types of DOM. c. Photolysis of Metal Complexes The photochemistry of metal complexes is rather interesting, becau se there are several pathways for reaction upon excitation. For example, in a given transition metal complex that has d electrons, there are several d ---+ d transitions allowed. Similarly, there exist charge-transfer transitions where the excited state permits the transfer of electronic charge from an occupied orbital in the ligand to an unoccupied orbital in the central metal ion, reducing it to a lower oxidation state (ligand to metal charge tran sfer, LMC1). The final products depend on whether the irradiation energy is aimed at the d-d bands (hv)) or at the charge-transfer band (hV2), as exemplified in the generalized scheme below, where M is a metal ion in the (n + 1) oxidation state (unless otherwise specified), L' is a neutral ligand, and L is a negatively charged ligand. (L')o denotes a neutral species. (a) Ligand exchange: [M(L)sL']n+ + H 20(l) + hv, ---+ [M(LMH 20)L']"+ + L
(6.34)
6. The Chemistry of Processes in the Hydro sphere
128
(b) Photoredox reaction: [M(n+l)+(LhL'(+
+ hV2 -+
[Mn+(Lht+
+ (L')o (6.35)
A typical example is the photolysis of ironcarboxylato complexes (i.e., complexes with oxalate, aminopolycarboxylates, citrate , humic or fulvic acids) that can occur with high quantum yields. A simplified reaction mechanism (using oxalate as the ligand) is
+ hv -+ Fe(II) + 2C20~- + C204"C 204"- -+ CO 2- + CO 2 CO 2- + Fe(III) -+ Fe(II) + C02 [Fe(III)(C20 4h]3 -
(6.36) (6.37) (6.38)
Note that in the C20~- reactant, C is in the +3 oxidation state, whereas in the C204" product it is +7/2. Thus, it underwent oxidation in order to reduce Fe(III) to Fe(II). This Fe(II) can (in the presence of H202) generate the potent -OH radicals . This is called the Fenton reaction, and when the Fe(II) is produced by the photolytic reduction of Fe(III), it is called aphoto-Fenton reaction (see Section 10.1.1.2) . Some complexes (e.g., [Fe(III)EDTA]) can undergo total photolysis in a sunny day within hours, while others are only slightly affected (e.g., [Mn(II)EDTA], [Co(III)EDTA]), or not affected by light at all. The ability of [Fe(III)EDTA] to undergo photolysis is very fortunate because EDTA is a refractory compound, and thus the natural photolytic pathway provides a means for its destruction. (From these cases it can also be deduced that some metal complex-containing samples to be analyzed for environmental purposes must be isolated from light immediately after collection).
6.3.2 Natural Removal and Entrainment of Species in Aqueous Systems by Chemical and Physical Processes There are several natural pathways for the removal and entrainment of inorganic and organic materials from water. Some examples follow.
6.3 .2.1 Sorption onto Colloidal, Suspended, or Settled Sediments We use here the term sorption as the retention of a compound on the surface of a solid particle that removes it from the aqueous medium. This phenomenon affects the composition of water by transferring the compound or ion from the aqueous medium to a solid (mainly a sediment in suspension or a colloid). Then, it may no longer be present in water, especially if the sediment settles. Sorption may be identified and associated with adsorption, surface precipitation, surface complexation, and/or ion exchange (or even absorption). Sorption is a surface phenomenon determined by the surface charges and those of the ions surrounding it. One or more of the following mechanisms can be involved in the removal of species by sorption: (i) mechanical entrapment, (ii) absorption, (iii) physical sorption, or (iv) chemical sorption on the surface of the solid particle. Physical adsorption (which is weaker than its chemical counterpart) occurs through Van der Waals ' forces and it is generally reversible and instantaneous. On the other hand, chemical adsorption or chemisorption occurs through the formation of chemical bonds at specific sites. This is closely related to ion exchange processes and complexation. Surface functional groups in the suspended particles determine the type of process that will take place. In the case of inorganic colloidal particles (e.g., clays) the main functional groups are silanol (=Si - OH) and aluminol (=AI - OH), whereas in metal oxides or hydroxides the functional groups are (=M - OH). These groups may become protonated or deprotonated, depending on the pH of the aqueous medium, by sorption of H+ or OH- ions as follows:
+ H+ -+
=M - OHi (b) =M - OH -+ =M - 0 - + H+ (a) =M - OH
(6.39) (6.40)
Then , they can function as surface-bound ligands (depending on pH) and adsorb or desorb charged specie s through the formation of surface complexes. The silanol groups generally dissociate to liberate H+ (leaving a negative charge), whereas aluminol and iron oxide and hydroxide can dissociate to end up with either negative or positive charges (and also bind H+). Surface ionization and complexation models account for metal sorption reactions at these
Physicochemical Processes in Aquatic Systems
129
interphases, and are based upon the simple reaction: =M - OH
+ Me n + -+
=M - OMe(n-IJ+
+ H+ (6.41)
where =M - OH represents a singly protonated surface oxide site, Me n + is a metal cation, and =M-OMe(n-I)+ is the resulting surface complex. An increase in pH and/or concentration of the adsorbent sites will increase cation sorption (by Le Chatelier's principle), whereas the presence of foreign anionic complexing ligands will create competition for the target metal ions and thus decrease their adsorption. In this reaction model, the adsorbates are cationic metal ions, but aquo or hydroxo metal-ligand complexes can be strongly bound by oxide surfaces as well. Other types of dissolved metal complexes can also adsorb to these sites, although less strongly than the above. Consistent with this rationale, a complex is called a metal-like complex if its adsorption increases with pH, whereas it is a ligand-like complex if it decreases. When there is a water molecule between the ion or molecule and the functional group of the solid phase, the complexes that form are called outersphere complexes (see Section 3.1.4). Here, bonding is due to weak electrostatic interactions. This type of adsorption or complex formation is rapid and reversible, and it is affected by the ionic strength of the surrounding medium. On the other hand, when the ion or molecule forms a bond directly with the surface functional group, the resulting moiety is an inner-sphere complex, and stronger bonds are generally involved. This is a slower, typically irreversible process in which monodentate or polydentate species may participate. The process is slightly affected by the ionic strength of the medium. In this case, the adsorbed or complexed compound, called a sorbate, can undergo charge modification. The metal ions that bind to these oxide surfaces normally tend to form aquo or hydroxo complexes in solution. The adsorption of metal cations is therefore dependent on pH, on concentration, and on the type of adsorbents or solid particles. Anions (including metal oxyanions such as chromate) can also be adsorbed, as can anionic ligands (such as phosphates and sulfates), and dissolved or suspended humic substances (such as fulvic acids) . The ionic strength and pH influence the sorption of anions since they compete with the OH- ions
for the surface positive charges. Some anionsusually those related to the conjugates of monoprotic acids-adsorb more at a higher pH and reach a maximum value near the pK a of the corresponding acid. On the other hand, conjugate anions of diprotic acids tend to sorb less with pH even near the pK 2 value, after which the decrease is more pronounced. Particulate or dissolved humic substances tend to adsorb onto solid phases (generally clays), some times coating them completely. Even after adsorption, they still possess enough active sites to complex metallic ions or adsorb other organic substances . Here, the sorbed organic molecule (generally neutral) penetrates and almost "dissolves" in the porous structure of the adsorbed humic substance. Globular structures and coiling minimize the degree of hydrophobic-surface exposure to the aqueous medium. Other organic substances (e.g., organic acids and amino acids) can also bind directly to inorganic colloids or particles.
6.3.2.2 Ion Exchange in Sediments and in Aqueous Colloidal and Suspended Matter Colloids and suspended matter in water typically have sorbed ions on their surface. When these charged particles (with electrostatically sorbed cations or anions) come in contact with water rich in dissolved solids or high in electrolytes, the ions in solution will substitute the weakly attached ions on the surface of the particle. The higher the charge and concentration of the counter ion in the aqueous medium, the higher the probability of displacing the ion originally attached. The process is normally instantaneous and reversible, and it takes place at a stoichiometric ratio that preserves electroneutrality. This means, for example, that a cation with a 3+ charge will use three (mono) negative sites . This also depends on how easily the counter ion diffuses towards the charged site. When several types of counter ions are present, there will be an exchange preference for one ion over the other (i.e., the process is selectivity-controlled). Here, cations with the smallest hydrated radii are preferred for the exchange because of their greater charge density and stronger ability to produce polarization. For instance, Cu2+ is preferred over ufor cation exchange owing to its smaller radius and greater charge density. (Interestingly, hydrated Li+ is a very large ion with a radius of 3.40 A).
130
Ion exchange is common in colloidal clays or in clay sediments that tend to flow and re-suspend with water movement. The se minerals have uncoordinated oxygen s that give the particle a negative charge when the minerals are expo sed. When the octahedrallayers of the clay particle s are exposed, the hydrox yl groups dissociate and generate a negative charge that attracts positive ions. The facts described above pave the way toward the concept of point ofzero charge. This corresponds to the point where the net, total charge adsorbed at the surface of the particle (including all the cations and anion s) is zero . The pH of the suspension that corre spond s to the point of zero charge is known as the pHpzc , or simply, pzc. At this pH, the charge balance on the surface of the colloid is zero. As a result, the pH of the solution defines the type of exchange that predominates in the particle: (a) At pH < pHpzc the surface will contain excess protons and the particle will have an anion exchange capac ity or anion ads orption capacity (AA C). (b) At pH = pHpzc the particle will be balanced with protons and hydro xyls so that the net charge becomes zero. There is no exchange capacity here. (c) At pH > pHpzc there will be an excess of dissociated hydro xyl negati ve groups, and the particle will have a cation exchange capacity (CEC). For example, montmorillonite (a strong waterabsorbent clay ) has an average pH pzc of 2.5, and for that reason the CEC is domin ant at a pH > 2.5. Goethite (a -FeOOH) has a pHpzc of6-7, and therefore it can have an AAC at pH < 6 and a CEC at pH > 7. In the case of a-AlOOH, its pHpzc is 9.1 and it display s a predominantly AAC in natural waters . Organic suspended particles (mainly humic substances) have pHpzc values in the vicinity of 3, and thus in natural waters they are negatively charged part icles with a high CEC. Natural pH values are rarely above 8.6. Clays and particles of soil organic matter have negative charges and high CEC s, as confirmed by the following values : 150-500 meq/lOO g for organic matter and 3-150 meq/lOO g for clay minerals (as kaolinite and smectite). On the other hand , aluminum and iron hydroxide colloids tend to be hydrophobic, with surface positive charges, and, consequently, they are predominantl y anion adsorbers.
6. The Chemistry of Processes in the Hydrosphere
Ion exchange in colloids and sediments plays a critical role in the composition of water because it determines which ions will remain in solution and which will be adsorbed onto the surface of the particle s. This is evident in the compos ition of seawater, where [Na+] predominates over [K+] since the hydrated radius of the latter is smaller (i.e., 2.76 vs 2.32 A, respectively) and thus has more affinity for seawater colloids. Likewise, Pb2 + is preferentially adsorbed or retained over Cu2+ or Mg2+. Ion exchange also occurs in estuaries (i.e., where rivers discharge) rich in clay-suspended particles saturated with adsorbed Ca2+ ions. As river water mixes with the high salinity of seawater (rich in Na+), ion exchange takes place and Ca2+ is liberated while Na+ , K+, and Mg2+ are removed. Phosphates and Fe ions may also be removed. This is why the Na+/Ca2+ proportion in estuaries is sometimes inverted with respect to that in the ocea ns. Ion exchange is normally defined by a distribution coefficient or by a selectivity coefficient more than by an equilibrium exchange constant (see below). The se coefficients relate the amount of the exchanged ions that stay in the colloidal solid matrix to that in the aqueous pha se. In this context, a simplified exa mple of an ion exchange reaction (e.g., H+ for K+) is Clay-Si-O-H+
+ K+ += Clay-Si-O-K+ + H+ (6.42)
The distribution coefficient in this case can be defined as
x, =
Wion-clay/ Wion-solution
(6.43)
where Wion-clayis the mass ofthe target ion adsorbed or retained per unit mass of clay (or solid) at equilibrium, and Wion- solution is the mass of the ion in solution per unit mass of solution. If one assumes that the only exchangeable cation s in the solution are K+ and H+, then a selectivity coefficient, K K-H can be defined in term s of produ cts/reactants as an "equilibrium constant" for equation 6.42: KK-H
= (XK-clay[H+]) /(XH-clay[K+]) = (XK-clay/(K+])/(XH-clay/(H+n
K K-H
= (XK-clay/ XH-clay)([H+]/[K+])
where Xi
= mass fraction of ion i
in the clay
(6.44)
Phy sicochemical Processes in Aquatic Systems
131
Using a definition similar to that in Section 2.1.2, these fractions are given by X H- c1ay = WH-c1ay/(WH- c1ay + WK - c1ay) (6.45) and (6.46) If we now define mK-c1ay and mH- c1ay as the concentrations of adsorbed K+ or H+ per unit mass of clay (in meq/kg ), respectively, we can equate their sum to the CEC of the solid sample under analysis (which can generally be obtained experimentally): CEC (in meq/kg) = (mH-c1ay + mK-c1ay)
(6.47)
Then, in a similar fashion as in equation 6.44, one can write a selectivity coefficient in terms of concentrations as K~ _K = [mK-c1ay/mH-c1ay]([H+]/[K+])
(6.48)
= [mK-c1ay/(CEC - mK-c1ay)]([H+]/[K+])
(6.49) If the total cation concentration in solution (i.e., [K+] + [H+]) is given by C , then K~_K = [mK- c1ay/ (CEC - mK- c1ay)]
([H+J1(C - [H+])}
(6.50)
Then, knowing the amount of K+ and H+ retained per unit mass of clay, the CEC, the C , and the pH of the solution, one can calculate this coefficient. (For the case where a divalent cation is exchanged, the corresponding exponents are simply included in these equations).
6.3.2.3 Precipitation Reactions and Co-precipitation Precipitation is the formation of a compound that exceeds its solubility limit in a given medium. Coprecipitation is the inclusion or trapping of an otherwise soluble compound when a precipitate is formed under the same conditions. Precipitation calculations , including equilibrium diagrams involving the solubility- precipitation of solids, are discussed in Section 5.3. Precipitation is one of the reactions responsible for the removal of ions in water. This is especially important in seawater, where ions such as Ca2+, Mg 2+, Fe H , Na+, Cl- , SO~-, CO~- , PO~-, and
SiO: - precipitate and end up in the sediments. The main precipitation produ cts are gyp sum (CaS04), halite (NaCl), opal (Si02), and calcite (CaC03). Other important precipitation reactions include the formation of solid Mn02 and Fe(OH h , generally due to oxidation reactions in the upper strata of the ocean. In the case of Fe3+, precipitation can be reverted when reaching the anoxic zone at the bottom (i.e., under reducing conditions) that change insoluble Fe(OHh back to soluble Fe2+. Pyrite formation (FeS2) is related to biologically mediated reduction of sulfate to sulfide and of Fe3+ to Fe2+ in anoxic zones. In the case of pho sphate, this can be removed through precipitation reactions with Ca2+ and Fe 3+ (by formation of apatite or iron phosphate, respectively) , by co-precipitation, or by formation of surface complexes with Fe or Mn oxides or hydroxides. Another natural ion-removal scheme involves the biogenic formation of solid hydroxyapatite, Ca lO(P04 )6(OH h as well as CaC03 and Si02 as exoskeletons, bone s, or scales of aquati c flora and fauna that precipitate as sediments upon the death of the organisms.
6.3.2.4 Solidification and Deposition Processes Due to Evaporation These processes occur by precipitation through evaporative concentration of a solute in the aqueous medium until its dissolution capacity is exceeded. Then, a solid is formed and depo sited either as a sediment or on a nearby surface. The se products are called evaporites. A typical example is the deposition and formation of calcium carbonate stalactites and stalagmites. Evaporation is a major process in arid areas and it influences the chemistry of surface waters. That is why in saline lakes, inland seas, or even in estuaries, evaporites of NaCI or NaCUKCl and deposits of CaS04 and CaC03 are formed. Here, CaS04 generally precipitates first, and then NaCl.
6.3.2.5 Colloidal and Sediment Transport into Surface Water Entrainment of suspended solids (made of solid chemical compounds or chemical colloids) may occur under turbulent or agitated flow of surface water. In this case, the theoretical aqueous equilibrium con-
6. The Chemistry of Proces ses in the Hydro sphere
132
centrations can be exceeded. As discussed in Section 6.3.1, colloids can be organic or inorganic in nature, and the interactions of the solid particles and adsorbed substances may modify the solute composition. In water-saturated porous media, colloid mobilization depends on their interaction with the pore walls. The resulting net interaction potential is the sum of the electrostatic double layer force, the Van der Waals' force, and the short-range solvation or steric forces. A large interaction potential means that the colloidal particles will not be released from the pore water and thus their transport will be prevented. In the same manner as colloids can aggregate or not, depending on the ionic strength of the solution (see Section 6.3.1), a decrease in the ionic strength of pore water brings about an increase in the repulsive magnitude of the electrostatic double layer force, and the colloid can then be released and transported away from the pore.
6.3.2.6 Volatilization of Organic and Inorganic Compounds Volatilization of naturally formed gases (e.g., H2S, C02, CH4, NH 3 ) represents a removal process
that modifies the composition of a water reservoir and the surrounding air. It depends on the Henry's law constants and on the partial pressures of the compounds, the ambient temperature and pressure, as well as on factors that may favor the mass-transfer process. Another form of removal through the wateratmosphere interphase is aerosol formation in marine surface waters where salt spray tends to remove mainly NaCl, NaS04, and MgS04. These are generally known as cyclic salts due to their potential return to the sea through rain washout. All the concepts and examples presented in this chapter refer to natural phenomena in the hydrosphere, and are basic for understanding the dynamics, quality, and characteristics of aqueous systems. They are also relevant for understanding what may happen to these natural systems that could alter, deviate, or intensify the natural processes when other types of substances or conditions are introduced by anthropogenic activities and pollution processes. These issues are further discussed in Chapter 8, where we will consider the impact of these activities on the surrounding systems and the resulting chemical processes.
Related Experiments in the Companion Book 1. 2. 3. 4.
Water characterization Dissolved oxygen in water Alkalinity and buffering capacity of water Aqueous carbonate equilibria and water corrosiveness 5. The point of zero charge of oxides
6. Experimental transitions in E vs pH (or Pourbaix) diagrams 7. Air oxidation of metal ions 8. Photoassisted reduction of metal complexes 9. Anionic detergents and a-phosphates in water
Additional Related Experiments/Activites Anderlick, B. "Water Analysis Experiment," J. Chern. Educ. 1972,49, 749. Barrett, Richard L. "C02-H20 Equilibrium and the Principle of Le Chatelier," J. Chern. Educ. 1959,36, A741. Bauer, R.; Birk, J.; Sawyer, D. Laboratory Inquiry in Chemistry, 2nd ed; Brooks-Cole: Stamford, CT,2005. • Is the water hard or soft? (Experiment 7) Boehnke, D. N. ; Delumyea, R. D. Laboratory Experiments in Environmental Chemistry;
Prentice-Hall: New York, 1999. • The pH and buffer capacity of environmental waters (Experiment 3) • Alkalinity of streams and lakes (Experi ment 4) Bowers, P. G.; Rubin, M. B.; Noyes, R. M.; Andueza, D. "Carbon Dioxide Dissolution as a Relaxation Process: A Kinetics Experiment for Physical Chemistry," J. Chern. Educ . 1997,74, 1455-1458.
Physicochemical Processes in Aquati c Systems
Buell, P.; Girard, J. Laboratory Manualfor Chemistry Fundamentals, 2nd ed. ; Jones and Bartlett: Boston, MA , 2002. • Determination of the hardness of water (Experiment 12) • Determination of chloride in seawater (Experiment 21) Bush, P. "Solubility of Carbon Dioxide in Water," Sci. Activit. 1992, 29(3 ) 33-36. Carvalho, K. M. "Water Quality: A Project-based Laboratory for Introductory Chemistry," 225th Am. Chem. Soc. National Meeting, New Orleans, LA, March 23-27, 2003 . Chem. Ed. Division Paper # 44. Clemson University. Introdu ctory Chemistry Lab Experiments in Environmental Chemistry; Environmental Chemistry Library. National Science Foundation, 2002. http://www.ces .clemson.edu/ecl/labs/generaVindex.html • • • • •
Hardwater determination Changes in alkalinity and pH pH and buffer capacity Total suspended solid s Total dis solved solids
Cornell University, School of Civil and Environmental Engineering, Hollister Hall, Ithaca, New York. "Measurement of Acid Neutralizing Capacity". pp. 49-60. http ://Ceeserver.Cee .Cornell.EdulM w24/Archive/03/Cee453/Lab .Manual/Pdf/Gran.Pdf Cros son, M. ; Gibb, R. "Dissolved Oxygen and Chloride Determination in Water," J. Chem. Educ.1992,69,830-832. Dolan, E.; Zhang, Y; Klarup, D. G. "The Distribution Coefficient of Atrazine with Illinois Soils: A Laboratory Exercise in Environmental Chemistry," J. Chem. Educ . 1998,75, 1609-1610. Dorman, S. C. "Using the Local Watershed as an Outdoor Laboratory: A Campus-Community Partnership", 225th Am. Chem. Soc. National Meeting, New Orleans, LA, March 23-27, 2003. Chem. Ed. Division Paper # 130. Favaretto, L. "An Inexpensive Device for Collection of Samples of Water for Dissolved Oxygen Determination without Air Contact," J. Chem. Educ.1990,67,509. Ganong, B. R. "Hand-Held Conductivity Meter and Probe for Small Volumes and Field Work," J. Chem . Educ. 2000 , 77, 1606-1608.
133
Greco, T. G.; Rickard, L. H.; Weiss, G. S. Experiments in General Chemistry: Prin ciples and Modem Applications, 8th ed.; Prentice Hall : Upper Saddle River, N.J., 2002. • Determination of water hardness (Experiment 26) Halstead, J. A. "Rain, Lakes and Streams: Investigating Acidity and Buffering Capacity in the Environment," JCE Clas sroom Activity #4, J. Chem. Ed. 1997,74, 1456A-1456B. Harris, T. M. "Potentiometric Measurements in a Freshwater Aquarium," J. Chem. Edu c. 1993, 70,340-341. Hughes, K. D. "Marine Microcosm-Using an Aquarium to Teach Undergraduate Analytical Chemistry", Anal. Chem . 1993, 65, 883A889A. Ibanez, J. G.; Miranda, c.; Topete, J.; Garcia, E. "Metal Complexes and the Environment: Micro scale Experiments with Iron-EDTA Chelates," Chem . Educ. 2000, 5, 226-230. http://journals.springemy.com/chedr/ Ibanez, J. G. "Redox Chemistry and the Aquatic Environment: Examples and Microscale Experiments," Chem. Educ. Int. (IUPAC) 2005 , 6,1-7. Jackson, G. B. Applied Water and Spentwater Chemi stry. A Laboratory Manual; Van Nostrand-Reinhold: New York, 1993. • Alkalinity measurement (Experiment 13) • Hardness measurement (Experiment 14) • Calcium and magnesium measurement (Experiment 15) • Total suspended solids measurement (Experiment 16) • Calcium carbonate stability measurement (Experiment 17) • Total residual chlorine measurement (Experiment 21) • Chlorine demand measurement (Experiment 22) • Dissolved oxygen measurement (Experiment 27) • Oil and grease measurement (Experiment 33) • Volatile acid to alkalinity ratio measurement (Experiment 34) Johll, M. E.; Poister, D.; Ferguson, J. "Statistical Comparison of Multiple Methods for the Determination of Dissolved Oxygen Levels in Natural Waters," Chem . Educ. 2002,7,1146-1148.
134
6. The Chemistry of Proc esse s in the Hydrosphere
Juhl, L.; Yearsley, K.; Silva, A. J. "Interdisciplinary Project-Based Learning through an Environmental Water Quality Study," J. Chem. Educ. 1997, 74, 1431-1433. Lambert, J. L. ; Meloan, C. E. "A Simple Qualitative Analysis Scheme for Several Environmentally Important Elements," J. Chem. Educ. 1977, 54, 249-252. Lewis, A. ; Bumpus, J. A.; Truhlar, D. G.; Cramer, C. J. "Molecular Modeling of Environmentally Important Processes: Reduction Potentials," J. Chem. Educ. 2004, 81, 596-604. Livneh, M. "Determination of the Hardness ofWater by a Microscaled EDTA Titration," J. Sci. Educ. (Rev. Educ. Cien., Colombia), 2005, 6( 1), 51-52. Lunsford, S. K.; Slattery, W. "An Interactive Environmental Science Course for Education Science Majors," J. Chem. Educ. 2006, 83, 233236. McCormick, P. G. 'The Determination of Dissolved Oxygen by the Winker Method- A Student Laboratory Experiment," J. Chem. Educ. 1972,49,839-841. McInnes, D. M.; Kampbell, D. "Bubble Stripping To Determine Hydrogen Concentrations in Ground Water: A Practical Application of Henry's Law," J. Chem. Educ. 2003,80,516519. Mihok, M.; Keiser, J. T.; Bortiatynski, J. M.; Mallouk, T. E. "An Environmentallyfocused General Chemistry Laboratory," J. Chem. Educ. 2006, 83, 250 . http://jchemed .chem.wisc.edu/Journal/lssuesI2006/FebACS/ ACSSub/ACSSupp/JCE2006p0250W.pdf • Iron and alkalinity determination (Experiment 2) Myers, R. L. "Identifying Bottled Water: A Problem-Solving Exercise in Chemical Identification," J. Chem. Educ. 1998, 75, 1585-1587. Ortega, T.; FOIja, J. M. ; Gomez-Parra, A. "Teaching Estuarine Chemical Processes by Laboratory Simulation," J. Chem. Educ. 2001 , 78,771775 . Pidello, A. "Environmental Redo x Potential and Redox Capacity Concepts Using a Simple Polarographic Experiment," J. Chem. Educ. 2003, 80,68-70.
Scheuer, Paul J. "Exploring the Ocean-Stating the Case for Chemistry," J. Chem. Educ. 1999, 76, 1075-1079. Selco, J. 1.; Roberts, J. L., Jr.; Wacks, D. B. "The Analysis of Seawater: A Laboratory-Centered Learning Project in General Chemi stry," J. Chem. Educ. 2003,80,54-57. Sanderson , P. L. "E nvironmental Chemistry in Action ," Educ. Chem. 1987,24(1 ) 16-18. Sawyer, C. N.; McCarty, P. L. ; Parkin, G. F. Chemistry for Environmental Engineering; McGrawHill International editions, Civil Engineering Series: New York, 1994. • • • • • • • • •
Acidity (Chapter 16) Alkalinity (Chapter 17) Hardness (Chapter 18) Chlorides (Chapter 20) Dis solved oxygen (Chapter 21) Nitrogen (Chapter 24) Solids (Chapter 25) Iron and manganese (Chapter 26) Sulfate (Chapter 28)
Shakhashiri, B. Z. Chemi cal Demonstrations: A Handbook for Teachers of Chemistry; Vol. 3, The University of Wisconsin Press: Madi son , WI (USA), 1989. • Acid neutralizing capacity of lake beds (page 125) Stagg, W. R. "Dissolved Oxygen-A Relevant Experiment for the Introductory Laboratory," J. Chem. Educ. 1972,49,427-428. Thistlethwayte, D.; Ellis, J. ; Kanamori , S. "The Measurement of Dissolved Oxygen ," Educ. Chem. 1974,11(1) 23-24. Tratnyek, P. G.; Reilkoff, T. E.; Lemon, A. w.; Scherer, M. M.; Balko, B. A. ; Feik, L. M. ; Henegar, B. D. " Visualizing Redox Chemistry : Probing Environmental Oxidation-Reduction Reactions with Indicator Dyes," Chem. Educ. 2001, 6(3) 172-179. Urbansky, E. T.; Schock, M. R. "Understanding, Deriving, and Computing Buffer Capacity," J. Chem. Edu c. 2000, 77, 16401644. Walker, N.; Mintz, J. "Hydrolysis of the Carbonate Ion," J. Chem. Educ. 1970,47, A119.
Physicochemical Processes in Aquatic Systems
Williams, D. J. ; Williams, M. c .. Foster, B. E.; Malone, J. c.. Milner, E. E.; Tartaglia, A. L.; Turner -Reed, A.; Koether, M. C. "Teaching Environmental Chemistry with Wetland Microcosm s," Chern. Edu c. 2003, 8, 312314.
References and Further Reading Alloway, B. J.; Ayres, D. C. Chemical Principles of Environmental Pollution , 2nd ed.; Chapman & Hall: London, 1997. Atkin s, P. W.; Beran , J. A. General Chemistry , 2nd ed.; W. H. Freeman: New York, 1992. Chapter 21. Barona, A.: Etxebarria, B. "Di stribution and Extraction of Pb and Zn with Chelating Agent s in Soils with Varying Pollution Level," American Institute of Chemical Engineers, 5th World Congress. Chern . Eng., Jul. 14-1 8, 1996. San Diego , CA ., Vol. III, pp. 576581. Berner, E. A.; Berner , R. A. The Global Water Cycle, Geochemistry and Environm ent ; Prentice Hall : Englewood Cliffs, USA, 1987. Bolin, B.: Degen s, E. T.; Kempe, S.; Ketner, P., Eds. The Global Carbon Cycle ; Scope Report No. 13, Wiley: London , 1979. e-version by M. S. Swaminathan Research Foundation: Chennai , India . http ://www.icsusco pe.orgl Bolin , 8. ; Cook, R. B., Eds. The Maj or Biogeochemical Cycles and their Interactions; Scope Report No. 2 1, Wiley: London, 1983. e-version by M. S. Swami nathan Research Foundation: Chennai, India. http://www.icsu-scope.org/ Butcher, S. S.; Charlson, Robert, J.; Orian s, Gordon H.; Wolfe, Gordon v.,Eds. Global Biog eochemical Cycles ; Academic Press: London, 1992. Brezonik, P. L. ; Fulkerson-Brekken, J. F. "NitrateInduced Photolysis in Natural Waters: Controls on Concentrations of Hydroxyl Radical PhotoIntermediates by Natural Scavenging Agent s", Environ. Sci. Techno/. 1998 ,32,3004-3010. Bunce, N. J. Introdu ction to Environmental Chemistry; Wuerz Publishing: Winnipeg, 1993. Darthmouth University. http ://www.dartmouthuniv.edul chemlab/chem3- 5/acid I/fulltextlchemistry.html DGPCCIDRAMA. Annual Report, Acid Precipitations Program of the Metropolitan Zone, Mexico City ; Environmental Secretariat, DDF: Mexico, 1996. Egen, N.; Ford, P. C. "Hard Water, Water Softening, Ion Exchan ge," J. Chem . Edu c. 1976 ,53,302-303.
135
Whisnant , D. M.; McCormick, J. A. "BCTC for Windows: Abstract of Issue 9903W," J. Chern. Educ. 1999,76,719. Wu, R. S. S. "Change of Forms of Cadmium in the Aquatic Environment," J. Chern. Edu c. 1995 , 72, 264-265 .
Environment Canada. http ://www.ec.gc .calwater/images/ nature/grdwtr/a5f3e.htm Environmental Protection Agency, Response of Surface Water Chemistry to the Clean Air Act Ammendments of 1990 (EPA 6201R-03/00 I, Jan . 2003, p. 18). http ://www.epa.gov/ord/htmlCAAA2002-report-2col-rev-4 .pdf Hill, S. J. "Speciation of Trace Metals in the Environment," Chem. Soc. Rev. 1997 ,26, 291-298. Howard, A. G. Aquatic Environm ental Chemistry ; Oxford Science Publications, Oxford Univer sity Press: Oxford, 1998. Kegley, S. E.; Andrews, J. The Chemistry of Water ; University Scien ce Book s: Sau salito , CA , 1997. Kieber, R. J.; Li, A. ; Seaton, P. J. "Production of Nitrite from the Photodegradation of Dissolved Organic Matter in Natural Waters," Environ. Sci. Techn ol. 1999 ,37, 993-998 . Krauskopf, K. B. Introdu ction to Geochemistry, 2nd ed. ; McGraw Hill-Ko gaku sha : Tokyo, 1979. Lenhart, J. J.; Saiers, J. E. "Colloid Mobili zat ion in WaterSaturated Porou s Media under Transient Chemical Conditions," Environ. Sci. Techn ol. 2003 , 3 7, 27802787. Lien, L. ; Raddum, G. G.; Fjellheim, A. ; Henriksen, A. "A Critical Limit for Acid Neutralizing Capacity in Norwegian Surface Waters, Based on New Analyses of Fish and Invertebrate Responses," Sci. Tot. Environ . 1996,26,173-193. Lin, C.-F. "The Effects of Strongly Complexing Ligands on the Adsorptive Partitioning of Metal Ions," Wat. Res. 1992,26,397-407. Livingston, D. A. Chemi cal Composition of Rivers and Lakes ; U.S. Geol. Surv., Prof. Pap. 440 G: Washington, 1963. Martell, A. E.; Hancock, R. D. Metal Complexes in Aqueous Solutions; Plenum Press : New York, 1996. Martin, S. B.; Allen, H. E. "Recycling EDTA after Heavy Metals Extraction," Chemtech 1996, 26(4) 23- 25. Meybeck, M.; Chapman, D.; Helmer, R., Eds. Global Freshwater Quali ty: A First Assessment: Blackwell Reference: Oxford, 1989.
136 Mono Lake Committee. http ://www.monolake.org/ naturalhistorylstats.htm National Environmental Technology Centre, Acid Deposition Data Report; AEA : London, 2002. Nowack, B.; Lutzenkirchen, J.; Behra, P.; Sigg , L. "Modeling the Adsorption of Metal-EDTA Complexes onto Oxides," Environ. Sci. Techno/. 1996, 30, 23972405 . O'Neill, P. Environmental Chemistry; Chapman and Hall: London, 1993. Chapter 8. Peavy, H. S .; Rowe, D. R.; Tchobanoglous, G. Environmental Engineering; McGraw Hill : New York, 1985. Rajeshwar, K.; Ibanez, J. G. Environmental Electrochemistry; Academic Press: San Diego, 1997, Chapter 6. Robertson, A. P.; Leckie, J. O. "AcidlBase, Copper Binding, and Cu2+/H+ Exchange Properties of Goethite , an Experimental and Modeling Study," Environ. Sci. Technol. 1998, 32 2519-2530. Sawyer, C. N.; McCarty, P. L. ; Parkin, G. E Chemistry for Environmental Engineering ; McGraw-Hili International Editions, Civil Engineering Series: New York, 1994. Schnitzer, M.; Khan, S. V ., Eds . Humic Substances in the Environment; Marcel Dekker: New York, 1972. Schnitzer, M.; Hansen, E. H. "Organo-metallic Interaction s in Soils : 8. An Evalu ation of Methods for the Determination of Stability Constants of MetalFulvic Acid Complexes," Soil. Sci. 1970, 109, 333340. Schwarzenbach, R. P.; Gschwend, P. M.; Imboden, D. M. Environmental Organic Chem istry; Wiley: New York, 1993. Shiklomanov, I. A. A World ofSalt: Total Global Saltwater and Freshwater Estimates; VNESCO (VNEP): Paris, 1999. Sparks, D. L. Environmental Soil Chemistry; Academic Press : San Diego, 1995. Spiro, T. G.; Stigliani, W. M . Chemistry of the Environment; Prentice Hall: Upper Saddle River, NJ, 1996.
6. The Chemistry of Processes in the Hydrosphere Stumm, W.; Morgan, J. J. Aquatic Chemistry: Chemical Equilibria and Rates in Natural Waters; Wiley Interscience: New York, 1996. Thomas, E ; Mas ion, A.; Bottero , J.; Roullier, J.; Genevrier, E ; Boudot, D. "Aluminum(I1I) Speciation with Acetate and Oxalate. A Potentiometric and 27 AI NMR Study," Environ . Sci. Techno/. 1991 , 25, 15531559. Thomas, R.; Meybeck, M.; Beim, A. Chapter 7: Lakes, in Water Quality Assessment: A Guide to Use of Biota . Sediments and Water in Environmental Monitoring , 2nd ed .; Chapman, D., Ed., VNESCOIWHOIUNEP, Chapman Hall : London, 1992. http ://www.who.int/ docstore/water.sanitation.health/wqassess/ch12.htm VNEP, Vital Water Graphics: An Overview of the State of the World's Fresh and Marine Waters, 2002 . http://www.unep .ort/vitalwater/ V .S. Geological Survey, National Field Manual for the Collection of Water-Quality Data . Techniques of Water-Resources Investigations, TWRI Book 9.2004. http ://water.usgs.gov/owqlFieldManual/ Vaughan, P.; Blough, N. V. "Photochemical Formation of Hydroxyl Radical by Constituents of Natural Waters," Environ. Sci. Technol. 1998,32, 2947-2953 . Wetzel, R. G. "Natural Photodegradation by UV-B of Dissolved Organic Matter of Different Decomposing Plant Sources to Readily Degradable Fatty Acids," Verhand. Int . Verein. Limnol. 2001, 27, 2063-2073 . Xue, Y.; Traina, S. J. "Oxidation Kinetics ofCo(II)-EDTA in Aqueous and Semi -Aqueous Goethite Suspensions," Environ. Sci. Technol . 1996,30,1975-1981. Yang, Z.; Zhang, J. "Chemical Speciation and Coordination Chemistry in Aquatic Environment", Preprints of Extended Abstracts, 217th Nat. Meet ., Am. Chem. Soc . Anaheim, CA. Vol. 39 (1) March, 1999, p.58-60. Zepp, R. G.; Hoigne, J.; Bader, H. "Nitrate-Induced Photooxidation ofTrace Organic Chemicals in Water", Environ. Sci. Technol. 1987,21,443-450.
7
Natural Biochemical Processes and Organisms in the Biosphere
Up to now, we have presented key chemical processes in our environment. Biochemical processes fashioned by different organisms, and the biogeochemical cycles of key elements and water, are also of paramount importance. We proceed now to discuss them.
7.1 Classification of Living Organisms There is no simple definition for life. It may be characterized by a list of properties shared by all living organisms (with the exception of viruses) that distinguish them from non-living matter: movement, responsiveness, growth, feeding, reproduction, energy release, and excretion. Thus, a living organism is a self-reproducing system capable of growing and maintaining its integrity by the expenditure of energy. In addition, all living organisms share the same basic unit structure termed the cell . There is an age-old interest in understanding the relationships that exist among living organisms and establishing their classification according to different categories. In fact, Aristotle had the key idea that, in order to classify in a formal and reproducible way, it was necessary to choose among different criteria. Thus, he divided animals not, for example, accord ing to their number of legs, but as oviparous (those that lay eggs) and viviparous (the mammals). The main representative of the classic period of taxonomy, the discipline that classifies and identifies all living creatures, was Carolus Linnaeus (Linneo) (1707-1778), who divided living creatures in two kingdoms : animal and vegetal, or the Animalia and
the Plantae. He also proposed a binomial system for the nomenclature of all organisms: one generic (genus) and one specific (species), which is still in use today. He proposed a hierarchic system of classification formed by six ranks, each one nestled in the higher level: species, genus, order, class , and kingdom. In the l Sth century there was no alternative but to use a strictly morphological approach, so that the more structural traits shared by different organisms (i.e., the number and placement oflimbs, the shapes of leaves, or internal organs), the closer their taxonomic relationship. Two major factors have altered the basis on which taxonomies are constructed and their uses established. The first was Charles Darwin's theory of evolution. The second was the advent of new techniques for studying the physiology, embryology, and biochemistry of living creatures. Evolutionary thought and theory since the time of Darwin have created a new function for taxonomic classification: to provide a framework for the study of evolutionary relationships. The overwhelming evidence we have that all organisms on Earth are related by common descent from some of the first cells, has led to different methods for tracing the family trees or phylogenetic trees of living and fossil organisms. The discipline that attempts to understand the evolutionary interrelationships of living things, trying to interpret the way in which life has diversified and changed over time is systematics , while taxonomy is primarily the creation of names and groups. In the 19th century, evidence began to accumulate showing that the classification in the animal
137
138
7. Natural Biochemical Processes and Organisms in the Biosphere
and plant kingdoms was inadequate to express the diversity of life. The development of the electron microscope in the 1950s permitted detailed examination of the cell structure. These studies revealed a fundamental dichotomy, as it became evident that two basic cell types exist : the eukaryotic cell, which contains a nucleus and other internal organelles surrounded by membranes, and the prokaryotic cell, which has no internal membranes, and thus no nucleus. Such differentiation led to various classification schemes, and three, four, or more kingdoms were proposed. The scheme most widely used divided all living organisms into five kingdoms, as established by Whittaker in 1963: Monera, Protoctists, Fungi, Plantae, and Animalia. This classification coexists with the scheme mentioned above that separates life into two main divisions: the Prokaryotae (bacteria) and the Eukaryotae (animals, plants, fungi, and protists). The basis for this taxonomy is shown in Table 7.1 and Figure 7.1. According to most theories on the origin of life, prokaryotes were the first living inhabitants of the TABLE
Earth. Several theories explain the evolution of modem eukaryotic microbial cells. One of the most interesting constructs states that organelles and higher life forms evolved by serial symbiosis with genetically distinct cell lines uniting to form entirely new organisms. Modem taxonomy allows the construction of various types of phylogenetic trees and the relatedness among organisms. Ideally, forms collected into one taxon (i.e., a category in a system of taxonomy)whether a species, a family, a phylum, a division, or others-can be considered as evolved from one ancestral species. All organisms that have evolved in this way are monophylectic. A group of monophylectic organisms is a clade, and the study of how closely related groups branched and separated from one another is called cladistics. Traditionally, phylogenetic trees were constructed relying on morphology and on the fossil records. Nowadays, however, they are constructed from comparisons of DNA or protein sequences in living organisms. Because of the antiquity of
7.1. General organism classification
Type of cell
Other general characteristics
Akaryotic
No cellular organization
virus
Prokaryotic
Unicellular, filamentous, colonial or mycelial Little or no differentiation Anaerobic, aerobic, facultatively-anaerobic, microaerophilic or aerotolerant Asexual reproduction Cell walls (with some exceptions)
bacteria and archaea
Monera
Unicellular More than a single chromosome per cell Heterotrophic or photoautotrophic nutrition Asexual or sexual reproduction
protists
Protoctist
Multicellular, filamentous (mycelial) composed of hyphae, or unicellular (yeasts) Propagation by spores Chitinous walls Absorptive nutrition
fungi
Fungi
Multicellular Extensive differentiation Photoautotrophic nutrition
higher plants
Plantae
Multicellular Extensive differentiation Sexual reproduction Heterotrophic nutrition (ingestive or absorptive)
animals
Animalia
Eukaryotic
Type of organism
Kingdom
Classification of Living Organisms
139
,/
basidiomycota
,..-r
,,------........... .~.,.j~+
_ _' \ .
chordate s
\
", \
FUNGI
red algae
sponges)
slime green molds algae
ANIMALS /
--
./
I
brown algae diatoms dinoflagellates
apicomplexans
PROTISTANS I MONERANS
,"b'ot""~~archasbacteri
CHEMICAL OR IGIN OF LIFE FI GURE
7.1. Graphical organism classification. (Source : Talaro, 1999).
the protein-synthesizing process, ribosomal RNAs appear to be excellent molecules for discerning evolutionary relationships among organisms. Use of 16S and 23S RNA as phylogenetic tools was pioneered in the early 1970s by Carl Woese . At present, a number of groups throughout the world work favorably with it. Molecular phylogeny, as this approach has been called, has greatly changed our evolutionary thinking about living organisms. The main conclusion from ribosomal RNA phylogeny is that life on Earth is based on three main lines of cellular descent, all derived from a universal ancestor. See Figure 7.2. As prokaryotes are far more diverse than suspected, the Prokaryotae are now divided in two groups: the Bacteria and the Archaea, which are as different from each other as either one is from the Eukaryota. In addition, a new taxon called a domain has been proposed above the kingdom level to emphasize the importance of the tripartite division of the living world: Bacteria, Archaea, and Eu-
karya. None of these is an ancestral group of the others, and each shares certain features with the others as well as having unique characteristics of its own. As the tree shows, the true relatives of the archaea are not the bacteria but the eukaryotes. However, because the archaea branch-off closest to the root of the tree, the suggestion is that they are the most primitive of the three kingdoms of organisms whereas the eukaryotes are the least primitive (or the most derived). Placement of the archaea closest to the universal ancestor is supported by the fact that many archaea inhabit extreme environments involving high temperature, low pH, high salinity, and so on. Thus, archaea may well be evolutionary relics of the Earth's earliest forms of life. Although the primary domains-Bacteria, Archaea, and Eukarya-were originally classified on the basis of comparative ribosomal RNA sequencing, subsequent studies have shown that each kingdom can also be defined on the basis of other
7. Natural Biochemical Proce sses and Organi sms in the Biosphere
140
CYANOBACTERIA
f1.o\VOBACTERIA
FIGURE 7.2. Line s of cellular descent. (Source: Levine, 1994).
phenotypic properties. Some of these properties are shown in Table 7.2 .
7.2 Nutritional Classification of Organisms Organisms live in nature forming complex webs of interactions among themselves and with the environment in which they flourish . All organisms require energy to stay alive and grow. Organisms are divided into two major cate-
gories , based on the nature of their energy source: phototrophs and chemotrophs. Phototrophs capture the radiant energy of sunlight and transform it into chemical energy that is stored in the bond s of carbohydrates and other molecules. Green plants, algae, cyanobacteria, and photosynthetic green and purp le bacteria are examples of phototrophs. Most organisms, however, are unable to use radiant forms of energy and rely instead on the oxidation of chemical compounds as a source of energy. These organ isms (called chemotrophs) are divided in two groups on the basis of the type of
TABLE 7.2. Phenotypic properties of the different domains of organisms Characteristic
Eubacteria
Archaebacteria
Eukaryote s
Membrane-bound nucleu s
absent
absent
present
Membrane lipids. Linka ge to glycerol
ester-linked
ether-linked
ester-linked
Muramic acid in the cell wall
present
absent
absent
Intron s in tRNA genes
no
yes
yes
Initiator tRNA
form ylmeth ionine
meth ionine
methionine
Sensitiv ity to chloramphenicol, streptomycin and kanamycin
yes
no
no
Ribosome s
70S
70S
80S
Nutritional Classification of Organi sms
chemical compounds they use: chemo rganotrophs and chemolithotrophs. Chem organotrophs obtain their energ y from the oxidation of organic compounds. Most bacteria are chernorganotrophs, and they use compounds such as carboh ydrates, organic acid s, and prote ins as energy sources. Chemolithotrophs obtain their energ y from the oxidation of inorganic compounds such as hydrogen sulfide (H 2 S), hydrogen gas (H2 ) , nitrite (N0 2), ammonia (NH3), and ferrou s iron (Fe2+). Chemolithotrophy is restricted to bacteria and is not found in higher forms of life. Chemolithotrophic bacteria are widespread in soil and water, and they benefit from the inorganic energy sources available in these habitats. The carbon required by living organi sms is an important co nstituent of ce llular structure and metabolic compo unds. Thi s element is present in the environment in man y forms . It may appear in simple form as gaseou s carbon dioxide or as more complex organic compounds. Microorganisms are remarkably diverse in their carbon requirements and they are divided into two group s: autotroph s and heterotrophs, based on their carbon source. Autotrophic microorganisms synthesize organic substances from carbon dio xide throu gh a process known as carbon dioxide fix ation. They are important in nature because carbon dioxide fixation works as a precursor for the organic substrates that form the basis of the food chain for other organisms. Autotrophic bacteria include those that obtain their energy from light (photoautotrophs) and those that obtain it from the oxidation of chemical bonds (chemo autotrophs). Most microorgani sms are unable to use carbon dioxide as their ma in carbon source, and thus they requi re preformed organic compounds instead. These microorganisms are called heterotrophs. Chemoheterotrophs obtain the energ y they need by oxidizing chemical compounds, wherefrom they require organic forms of carbon. Heterotrophic bacteria vary con siderably in their requirements for organic substrates. Some (as the methane-oxidizing bacteria of the Meth ylomonadaceae family ) use methane and other one-carbon compounds as their sole source of energy and carbon; they are called meth ylotrophs. Still other
141
bacteria use a wide variety of organi c substrates as energy and carbon sources; for example, several versatile strains of Pseudom ona s are cap able of using more than 100 different types of organic compounds. Because of this capacity, pseudomonas is widely distributed in water and soil. A summary of mode s of nutrition is given in Table 7.3 . Oxygen is a universal component of cell s that is always prov ided in large amounts by the major nutri ent: water. However, man y organisms also requ ire molecular oxygen (0 2 ) . The se are organi sms that are dependent on aerobic respiration for the fulfillment of their energ y needs , and for which molecular oxygen works as a terminal oxidizing agent. Such organisms are termed obligate ae robic. At the other physiological extreme are those microorganisms that obt ain ene rgy by means of reactions that do not involve molecular oxygen. Indeed, for man y of these physiolo gical groups , mole cul ar oxyge n is a toxic substance that e ither kills them or inhibits their growth. Such organisms are obligate anaerobic. Some microorgan isms are fa cultative ana erob es, able to grow either in the presenc e or absence of mole cular oxygen . In metabolic term s, facultative anaerobes fall into two subgroups . Some (as the lactic acid bacteria) have an exclusively fermentative energy-yielding metabolism but are relativel y insen sit ive to the presence of dioxygen; such organ isms are most accurately term ed aerotolerant anaerobes. Others (as man y yeas ts and enteric bacteria) can shift from a respiratory to a fermentative metabolism . Such facultative anaerobes use O 2 as a term inal oxidizing agent when it is available, but they can also obtain energy in its absence by fermentative reaction s. Some obligate aerobes grow best under oxygen partial pressures considerably below its pressure in air (0.2 atm ); they are called microaerophilic. This is probably due to some of their enz ymes, which are inactivated under strong oxidizing con ditions; such obligate anaerobes can thus be maintained in a functional state onl y at low O 2 partial pre ssure s. Many bacteria that obtain energy from the oxidation of molecular hydrogen show this behavior, and hydrogenase-the enzyme involved in hydrogen utilization-is readily inactivated by dioxygen .
142
7. Natural Biochemical Proce sses and Organisms in the Biosphere
TABLE
7.3 . Mode s of nutrit ion of organisms
Energy source
Electron source
Carbon source
Organisms and their hydrogen or electron donors Prokaryotes
Lithot-
(inorganic and C 1 compounds)
Autot---
(CO2)
I--
t-
Hetero-
t---
Photo(light)
Chlorobiaceae, H2S, S Chromatiaceae, H2S , S Rhodospirillaceae, H2 Cyanobacteria, H2O Protista (algae), H2O
t---
~
Organo(organic compounds)
Prokaryotes Chromat iaceae Chloroflex aceae Heliobacteriaceae Prokaryotes
AutoLitho~
Chemo(chemical compounds)
(inorganic and C) compounds)
1/
'\
(CO 2)
t---
Prokaryotes Hetero-
f-----
t---
'---
Organo(organic compounds)
V ~
Methanog ens, H2 Hydrogen oxidizers, H2 Methylotrophs, Cf4 , -CHOH Ammonia , nitrite oxidizers, NH 3, N0 2-
Auto(CO2)
Hetero-
t---
t---
Sulfur bacteria, S Manganese oxidizers, Mn2+ Iron bacteria, Fe2+ Sulfide oxidizers Sulfate reducers Prokaryotes Clostridia
Prokaryotes Nitrate, sulfate, oxygen and phosphate as terminal electron acceptors Protista Fungi Plants Animals
Source: Margulis, 2000.
7.3 Basic Aspects of Ecology The interactions among organ ism s and the environment determine their distribution and abundance
in nature . Such interactions necessarily begin with a constant source of energy-predominantly the flow and harvesting of life-supporting solar energ y through photosynthesis or food gathering. The se
Basic Aspects of Ecology
interactions extend to chains or forms of dependence among particular organisms, and ultimately to complex networks that weave together communities of organisms with the physical and chemical constituents of their environment. The most complex level of biological organization is the ecological system or ecosystem, which is generally defined as a community of organisms living in a particular environment (the biotic component), along with the physical elements in that environment (abiotic component) with which they interact. Ecosystems are dynamic and incredibly complicated. Nowhere is this better observed than in the largest ecosystem: the Earth itself or, more precisely, its life-supporting soils, seas, and atmosphere as well as all the organisms in them , collectively called the biosphere. The term ecosystem can also be applied to much smaller environments which have natural boundaries that make them more or less self-contained. Examples include a meadow within a forest , a beach with water on one side and grassy dunes on the other, or an island surrounded by ocean. In everyone of these cases, however, the boundaries are not sharp, nor are the ecosystems truly self-contained because • energy must enter into them • gases, nutrients, and water cycle in and out • organisms come and go in space and time These blurred boundaries reflect the fact that every small ecosystem exists within larger ecosystems. Each ecosystem blends into the next through a transitional zone called ecotone, which contains many of the species and characteristics of the two adjacent systems, plus unique species adapted to the special conditions of the interphase. The biosphere has many parts and subparts, as deciduous forest and rain forest, grassland and dessert , seacoast and ocean floor, which provide a myriad of habitats or actual places where organisms live. The Earth's major ecosystems are called biomes, which have characteristic types of organisms. Some useful definitions are listed in Table 7.4.
7.3.1 The Habitats of Life : Air, Land, and Water Climatic differences associated with the various biomes largely determine where particular types of
143
organisms may live. At a more fundamental level, however, the three very different states of matter that make up habitats (solid, liquid, and gas) impose constraints on organisms and affect their way of living.
7.3.1.1 Atmosphere Gaseous constituents in the air provide important chemical raw materials for life. Carbon dioxide is, of course, the carbon source for photosynthesis. Nitrogen, reduced by nitrogen-fixing organisms, is a necessary component of proteins and nucleic acids. The amount of water vapor in the air (i.e., the relative humidity) largely determines rates of evaporation from the skin of a frog , through the stomata of a plant, and so on. Hence, organisms that live in habitats with low relative humidity must adapt for survival. Finally, although we think of rain as beneficial for plants , it is also true that raindrops may strip the waxy covering layer from leaves, rendering them vulnerable to pollutants, pathogens, and chemicals. Rain also leaches nutrients from leaves and decreases plant productivity as a result. But at the same time , raindrops may contain dissolved phosphate, potassium, calcium, and other essential plant nutrients . Thus , with the potential harm comes an even greater good .
7.3.1.2 Land Many plants and most animals acquire water and non-gaseous mineral nutrients directly or indirectly from soil. Without living organisms, the material we know as soil would not exist, for it is a product of the interplay of organisms and the Earth's crust. Plant roots, burrowing mammals, earthworms, and fungal hyphae inhabit the soil and are found amid soil particles, where water and air also occur. Soil chemistry and structure determine the amount and availability of minerals and water to organisms. For instance, soil pH determines whether Ca2+, P04 3-, and other essential ions are bound tightly to its particles or are free to be absorbed by organisms, or else leached away in water runoff. Likewise, plants tend to adapt to a specific soil pH . Soil is a restrictive environment for most animals, because relatively little food and oxygen are available, and movement through densely packed dirt, rocks, sand, and organic debris is difficult. On the
144
7 . Natural Biochemical Processes and Organisms in the Biosphere
TABLE 7.4. Important definitions related to the biosphere Biosphere The assemblage of regions of the Earth that support life, including the lower atmosphere, the Earth's surface and aquatic environments. The term may also define a system rich in feedback loops that link life with non-living aspects of the environment. Biomes Biomes are a group of closely related ecosystems (see below). Terrestrial biomes include tundras, taigas, temperate forests, deserts, grasslands , and tropical rain forests. Major aquatic biomes are freshwater swamps, marshes and bogs, lakes and rivers, estuaries, inter-tidal zones, coastal oceans and open oceans. Ecosystems A sizable interacting system composed of living organisms and their physical environment. An ecosystem is a grouping of various species of plants , animals and microbes interacting with each other and with their environment. Biotic factors Organisms and their products (secretions, wastes, and remains). Abiotic factors They include rainfall (amount and distribution over the year), temperature (extremes of heat and cold as well as their average), light, water, wind, chemical nutrients, pH, salinity, and fires. The climate for a given region involves its temperature and precipitation. The degree (high or low) to which each of these factors is or is not present profoundly affects the ability of organisms to survive. The difference in response to environmental factors determines which species may (or may not) occupy a given region. In tum, the organisms that do or do not survive determine the nature of a given ecosystem. Each species has an optimum range, a zone of stress, and tolerance limits with respect to every abiotic factor. Population A population consists of all the members of a species living in a given area at the same time. It is an interbreeding reproducing group. Habitat Location within an ecosystem where a population actually lives and thrives. The habitat must supply the needs of organisms, such as food, water, temperature , oxygen , and minerals. If the population's needs are not met, it will move to a better habitat. Several populations may share a habitat, but competition may be small or non-existent because different populations have different niches. Community A coherent assembly of populations that inhabit the same habitat and interact with each other. Each successful population within a community plays a functional role that contributes to the maintenance of that community. Populations within a community that use the same resources-the guild structure of the community-often exhibit intense compet ition. The species assemblage that successfully inhabits a delineated volume of resources is called a unit community. Populations in a unit community tend to interact with each other and not with population s in other unit communities. Niche Each population that functions as a member of the community in a given habitat has a specialized functional role called a niche. An ecological niche is a functional description of the role that a species plays in a community-how it obtains food, what relationship it has with other species and the services it provides in its biological community. Some species are specialists and occupy a very narrow niche; others are generalists that eat a wide variety of food and live in a broad range of habitats.
other hand, however, burrowing animals that have adapted to underground life are more difficult for predators to find, and although the soil surface may be subject to extreme temperatures, creatures living even a few centimeters beneath it are relatively well insulated from both heat and cold.
7.3.1.3 Water In contrast to terre strial organisms-whose life support comes from both air and land-aquatic life forms derive food, water, gases , support, protection from temperature extremes, and other basic
needs from the surrounding water. Some waters contain nutrients and provide around 15% or less of the amount of oxygen present in air. The density of water is between that of air and soil, and buoys up the bodies of plants and animals so effectively that less massive support structures are needed. Like deep soil, water moderates temperatures because of its large capacity to absorb and hold heat; thus, the temperature extremes occurring in the air are not encountered in oceans and lakes. Very deep waters may be cold-in fact near freezingand yet their unchangeability has allowed organisms to evolve enzymes that function very rapidly
145
Basic Aspects of Ecolog y
at such temperatures. Lastly, water itself-a critical requirement for life-is available in unlimited supply. Although there is animal life even in the inky and ice-cold depth s of great ocean basins, plants can survive only in the top layer of water known as the photic zone, where enough light is present for photo synthesis . Because water both reflects and absorbs light, even the cleanest ocean water has a photic zone of only about 100 meters deep . Most animal s living deeper are either carnivores that eat smaller animals that consume phytoplankton in the photic zone, or scavengers that depend on a steady supply of dead and dying plant and animal bodies drifting down from the above. Interestingly, true miniature eco systems that do not rely on energy arriving from the photic zone exist in deep ocean abysses. Communities of giant tubeworm s, huge clams , crabs , a few fish, and other animal s cluster around deep-sea vents or perforations in the sea floor where superheated mineralladen water pours out. The ultimate source of food that supports these vent communities is the population of chemolithotrophic bacteria that oxidize hydrogen sulfide or other compounds spewing from the vents in order to harve st energy to build organic material s. These sulfur bacteria live symbiotically in the tissues of tubeworms and in clam s' gills, while crabs consume the producers directly. Thus, each environment supports a more-or-les s unique grouping of organi sms interacting with each other and with their surroundings in a way that perpetuate s or sustains the entire group. In other words, an ecosystem is an environment plus the species it support s. Every ecosystem is interconnected with others through ecotones and through some species that cross from one system to another. Each species and ecosystem is kept within certain bounds by limiting factors: (a) biotic and abiotic conditions that each species cannot tolerate (b) competition with other species (c) one or more phy sical barriers.
7.3.2 Trophic Levels The biotic structure is similar in all eco systems and include s three basic categories of organi sm-feeding relation ships that interact forming afood web:
• Producers • Consumers • Detritus feeders and decomposers Producers are photoautotrophic organi sm s such as green plants and bacteria that employ photosynthesis to produce glucose and that release dioxygen as a by-product. Plants are able to manufacture all the additional complex molecules that make up their structure from glucose and mineral nutrients such as nitrogen , phosphorus, and sulfur that they absorb from the soil or from water. As this conversion from inorganic to organic molecules occurs, part of the energy from light is stored in the organic compounds as chemic al energy. All other organisms, which are heterotrophs, must consume organic material made by autotrophs in order to obtain ene rgy and nutrients. In this way they may eat plants (herbivores) or animals (carnivores ), or decompose the remains of other organisms and their waste produ cts (decomposers). Herbivores are primary con sumers, carnivores are secondary consumers, or they may be tertiary consumers if they eat other con sumers. Decomposers, such as many fungi and bacteria, obtain energy by breaking down complex molecules in tissue s of dead plant s and animals. These decaying organi sms are essential for the health of all ecosystem s because they cycle important nutrients. Despite their complexity, food web s basically folIowa series of steps or levels-from producers to primary con sumers, to secondary con sumers, and so on. The se feeding levels are called trophic levels. All producers belong to the first trophic level; all primary consumers belong to the second trophic level, and so on. All feeding relationships can be visualized as a flow of nutrients and energy through a series of trophic levels. There are no more than three or four discernible trophic levels in any ecosystem. For instance, a typical food chain in a field ecosystem might be grass
-+
zebra -+ lion
The real world , of course, is more complicated than a simple food chain. While many organisms do specialize in their diets , other organi sms do not. Hawks do not limit their diet to snake s, snakes eat things other than mice , mice eat grass as well as grasshoppers, and so on. A more realistic depiction of who
7. Natural Biochemical Processes and Organisms in the Biosphere
146
~ Wildebeest
White rhino
Grass species 1
Grass species 2 FIGURE 7.3. Sample food web.
eats whom is called a food web. An example is shown in Figure 7.3. In food chains and webs , energ y flows through trophic levels with smaller amounts of energy making it to the next level (approximately 10 %). Eventually all the energy is lost, much of it as heat.
7.3.3 Non -feeding Relations Among Species The overall structure of eco systems is dominated by feeding relationships. However, different populations may interact in a way that one or both of them may benefit from the interaction (coope ra tion), or one or both may be negatively affected (co mpeti tion ).
Cooperation The types of positive interactions are:
• Commensalism Commensalism is a relat ionship in which one member clearl y benefits and the other apparently is neither benefited nor harmed. It often results
when the unaffected population, in the course of its normal growth and metabolism, modifies the habit at in such a way that another population benefits because the modified habitat is more suitable for its need s. For example, an epiphyte growing on a tree gets an increased supply of light while the tree is not affected. • Synergism Both populations benefit from the relationship, but the relationship is not an obligatory one, as both populations are capable of surviving in their natural environment on their own. For example, there are synergistic relation ships among bacterial populations involved in the cycling of nitro gen . • Mutualism Mutualism is an obligato ry relationship between two populations that benefits both . A mutu alistic relationship requi res close physical pro xim ity; it is highly specific, as one member cannot be replaced by another related species. A typical example is that of flower s and insects. Insects benefit by obtaining nectar from the flowers, and the plants benefit by being pollinated in the process. In some cases, the mutu alistic relation ship has become so close that the species involved are no longer
147
Basic Aspects of Ecology
capable of living alone. For example, lichens com prise two organisms, a fungus and an algae; the fungus provides protection for the algae, enabling it to survive in dry habitats where it cannot live by itself, and the algae (which is a producer) provides food for the fungus (which is a heterotroph). • Symbiosis Symbiosis refer s to the intimate association between members of different species. It does not specify a mutual benefit or harm . Therefore, symbiotic relationships may include mutualism, commensalism, or parasitism. Symbiotic relationships often entail some degree of coevolution of the partners, shaping in part their structural and behavioral characteristics . Competition Competition occurs when two populations utilize the same resources, whether space or a limiting nutrient. Competition tends to bring about ecological separation of closely related populations. This is known as the competitive exclusion principle, which states that two species will not occupy the same niche and compete for exactly the same resources in the same habitat for very long. Eventually, one group will gain a larger share of resources while the other will either migrate to a new area , become extinct, or change its behavior or physiology in ways that minimize competition. The types of competition are : • Amensalism When one population produces a substance that is inhibitory to another population, the relationship is called amensalism. Once an organism establishes itself surviving in the habitat, it may prevent other populations from surviving in that habitat . • Parasitism In a relationship of parasitism the population that benefits, the parasite, normally derives its nutritional requirements from the population that is harmed, the host. The host-parasite relationship is characterized by a relatively long period of contact, which may be directly physical or metabolic. Normally, the relation is as specific as for example the viruses, which are obligate intracellular parasites of bacterial, fungal, algal, and protozoan populations. • Predation A predator in an ecological sense is an organism that feeds directly upon another living
organism, the prey. Predation is a potent and complex influence on the population balance of communities and a mayor factor in evolution and adaptation. Many species of plants and animals have toxic chemicals, body armor, and other ingenious defensive adaptations to protect themselves from competitors or predators. Both positive and negative interactions may occur even within a single population. Such interactions are population-dependent. In general, positive interactions increase the growth rate of a population, whereas negative interactions have the opposite effect. With increasing population density, positive interactions theoretically increa se the growth rate to some asymptotic limit. In contrast, negative interactions decrease growth rate as the population density increases. Commonly, positive interactions predominate at low population densities and negative ones at high population densities. As a result, there is an optimal population density for maximal growth rate .
7.3.4 Sustainability of Ecosystems Ecosystems change as conditions are altered. The one thing that enables ecosystems to sustain a given compos ition of species over long periods of time is the dynamic balance involving all the relationships within the system. Each species in an ecosystem exists as a population. An ecosystem remains stable over a long period of time as the population of each species remains more or less constant in size and geographic distr ibution . This means that reproductive rates are equaled by death rate s and thus a balance is achieved. There are several laws for the sustainability of ecosystems: • They use sunlight as their primary energy source (except in certain deep ocean or underground habitats) . • The size of consumer population is maintained in such a way that overgrazing does not occur. • Biodiversity is maintained, so that the ecosystem can adjust and adapt to various changes. • Ecosystems vary greatly in the efficiency with which they retain specific materials such as essential nutrient elements. Habitats capable of retaining nutrients can sustain high rates of pro ductivity.
148
7. Natural Biochemical Processes and Organisms in the Biosphere
7.4 Biogeochemical Cycles In addition to obtaining energy from food, organisms must obtain the necessary nutrients to construct body tissues. For proper growth, most organisms require the following elements or essential nutrients (biogenetic elements):
Essential nutrients: C, H, 0, N, S, P Minor elements: Mg, K, Na, halogens Trace elements: B, Co, Cu, Mo, Ni, Se, Sn, V, Zn Interestingly, although energy and nutrients are passed on from one organism to another within the same complex molecules, their paths through ecosystems are quite different. Energy flows through ecosystems by steadily arriving from the Sun, then passing from one trophic level to the next, and dissipating into the environment as heat. On the other hand, elements are neither produced nor destroyed; they are transferred from one organism to another in closed loops called nutrient cycles . Because most of these cycles involve the passage of elements through living organisms and the atmosphere, hydrosphere, and lithosphere, they are often called biogeochemical cycles. Those elements that are essential components of living organisms are normally subject to biogeochemical cycling. The major elemental components of living organisms are cycled most intensely whereas minor elements are cycled less intensely. In terms of biogeochemical cycling, the various chemical forms of a particular element constitute the socalled pools or reservoirs. When examining the biogeochemical cycling of an individual element, one should consider its global reservoirs and their size, and whether or not they are actively cycled.
704.1 Water Cycle In the water cycle energy is supplied by the Sun, which drives evaporation from ocean surfaces or from treetops. The Sun also provides the energy that drives the weather systems and moves the water vapor (clouds) from one place to another. Precipitation occurs when water condenses from a gaseous state in the atmosphere and falls to earth. Evaporation is the reverse process in which liquid water becomes gaseous. Once water condenses, gravity takes over and the water is pulled to the ground. Gravity continues to operate, either pulling the water underground
(groundwater) or across the surface (runoff). In either event, gravity continues to pull water lower and lower until it reaches the oceans or lakes. Frozen water may be trapped in cooler regions of the Earth (the poles, glaciers on mountaintops, etc.) as snow or ice, and may remain as such for very long periods of time. Lakes, ponds, and wetlands form where water is temporarily trapped. The oceans are salty because any weathering of minerals that occurs as the water runs to the ocean will add to the minerai content of the water, but water cannot leave the oceans except by evaporation, and evaporation leaves the minerals behind. Thus, rainfall and snowfall are comprised of relatively clean water, with the exception of pollutants (such as acids) picked up as the water falls through the atmosphere. Organisms play an important role in the water cycle. Most organisms contain a significant amount of water (up to 90% of their body weight). This water is not held for any appreciable length of time and moves out of the organism rather quickly in most cases . Animals and plants lose water through evaporation from the body surface, and through evaporation from the gas exchange structures (such as lungs). In plants, water is drawn in at the roots and moves to the gas exchange organs, the leaves, where it evaporates quickly. This special case is called transpiration because it is responsible for so much of the water that enters the atmosphere. In both plants and animals, respiration and photosynthesis participate in the water cycle.
704.2 Hydrogen Cycle The largest global hydrogen reservoir is water, which is actively cycled by photosynthesis and respiration, although they do not normally result in Hz evolution or consumption. Instead, reduction of CO z occurs with electrons coming directly from HzS, from other low-molecular weight organic compounds (by anoxyphotobacteria), or from HzO (by the other photosynthetic organisms). In respiration, electrons from reduced organic compounds pass along the respiratory chain and ultimately reduce dioxygen to water. Free gaseous Hz is biologically produced during anaerobic fermentations and also as a side product of photosynthesis coupled with nitrogen fixation by cyanobacteria and by Rhi zobium legume associations. Most of the Hz produced is utilized anaerobically to reduce NO.3 ' SO~- , Fe(III) , and Mn(lV) or
149
Biogeochemical Cycles
.aGO, K eq , and EO in biochemistry As discussed in Section 2.3 , when a reacting system is not at equilibrium, the tendency to move toward equilibrium represents a driving force, the magnitude of which can be expressed as the freeenergy change for the reaction ~G . Under standard conditions (298 K = 25°C) , when reactants and products are initially present at 1 M concentrations or, for gases, at partial pressures of 101.3 kPa or 1 atm, the force driving the system toward equilibrium is defined as the standard free -energy change, sc». By this definition, the standard state for reactions that involve hydrogen ions is [H+] = 1 M, or pH O. Most biochemical reactions occur in well-buffered aqueous solutions near pH 7; both the pH and the concentration of water (55.5 M) are essentially constant. For convenience of calculations, biochemists therefore define a different standard state, in which the concentration of H+ is 10- 7 M (pH 7) and the water is 55.5 M. Physical constants based on the biochemical standard state are called standard transformed constants and are written as ~G O' or K~q to distinguish them from the untransfonned con stant s used by chemists and physici sts. By conto generate C~ . When H 2 rises through oxygenated soils or sediments, it is oxidatively metabolized to H20 , and only a small part is likely to escape to the atmosphere. The aerobic utilization of H2 is performed by facultatively chemolithotrophic hydrogen bacteria according to the following reaction: 6H2(g) + 202(g)
+ CO 2(g) -+
[ CH20 ]
+ 5H 20(l)
(7.1) The formula in brackets represents cell material. The most efficient hydrogen-consuming bacteria belong to the genus Alkaligens. A significant aspect of hydrogen cycling is the interspecies hydrogen transfer among microorganisms with different metabolic capabilities that complement each other in terms of nutritional factors (a phenomenon called syntrophism). Examples include the fermentative and methanogenic component of Methanobacillus omelianskii association, as well as the transfer between methanogens and sulfate reducers.
vention, when H 20 or H+ are reactants or products, their concentrations are not included, but are incorporated into the constants ~G o' and K~q' As in the definition of so". biochemists define the standard sate of oxidation-reduction reactions as pH = 7 and express reduction potentials as E O', the standard reduction potential at pH = 7. Values of E O' represent the potential difference when the conjugate redox pair, at 1 M concentrations and pH = 7, is connected with the standard (pH = 0) hydrogen electrode. When the conjugate pair 2H+ /H2 at pH 7 is connected with the standard hydrogen electrode (pH = 0), electrons tend to flow from the pH = 7 to the standard (pH = 0) cell; the measured for the 2H + /lh pair is -0.414 V (Table 7.5) . The energy made available by spontaneous elec tron flow of a reaction (the free-energy change for the oxidation-reduction reaction) is:
so" =
-nF~Eo'
where n repre sents the number of electrons transferred in the reaction and F is the Faraday con stant (96.496 kJN mole of electrons).
7.4.3 Carbon Cycle The most actively cycled reservoir of carbon is atmospheric C02 (it con stitutes 0.034% of the atmosphere). Carbon dioxide dissolves readily in water and is in direct equilibrium with dissolved inorganic forms of carbon (H2C03, HC03, and CO~ -, see Section 6.2.1.3). Once there, it may precipitate as solid calcium carbonate (limestone). Corals and algae encourage this reaction and build up limestone reefs in the process, but a much larger portion in the deep sea equilibrates only at the slow rate of 7.5 . Standard reduction potentials of some biologically important half-reactions (2SoC, pH = 7)
TABLE
E O' (V)
Half-react ion ~ 02
+ 2H + + 2e- ~ H20
Fe3+ + e: ~ Fe 2+
z
+ 2H + + 2e- ~ NO + H20 S + 2H+ + 2e- ~ H2S 2H + + 2e- ~ H2 (at pH 7 ) NO;-
0. 816 0.771 0.4 21 -0.243
-0.414
150
7. Natural Biochemical Processes and Organisms in the Biosphere
Example 7.1 Determine the oxidizing and reducing agents in reaction (7.1). Answer Analyzing the change in oxidation numbers :
o
+1 +1 H 2 -+ H20 + [CH20] hydrogen loses electrons ; therefore, it is a reducing agent.
vertical seawater circulation. The carbon in limestone or other sediments can only be released to the atmosphere when they are subducted and brought to volcanoes, or when they are pushed to the surface and slowly weathered away. From a biological perspective, the key events of this cycle are the complementary reactions of respiration and photosynthesis. Respiration takes carbohydrates and oxygen and combines them to produce carbon dioxide, water, and energy. Photosynthesis takes carbon dioxide and water and produces carbohydrates and oxygen. The outputs of respiration are the inputs of photosynthesis, and the outputs of photosynthesis are the inputs of respiration, as shown in Figure 7.4. If glucose is used as the substrate for respiration, the reaction is the following: C6HI206
+ 602(g) -+
6C0 2(g) + 6H zO(l) 6. GO' = -2834kJjmol (7.2)
The reactions are also complementary in the way they deal with energy. Photosynthesis takes energy from the Sun and stores it in the carbon-carbon bonds of carbohydrates; respiration releases that energy. Both, plants and animals accomplish respiration, but only plants (and other producers) can accomplish photosynthesis. Then, plants take up carbon dioxide and convert it into carbohydrates. Th is carbon in the plants has three possible fates: it can be liberated to the atmo-
1
(CH 20)n + n02
respiration
r
photosynthesis
nC0 2 + nH 20 + energy
FIGURE 7.4 . The respiration-photosynthesis cycle.
0 - 2 O 2 -+ H20 oxygen gains electrons; it is an oxidizing agent.
+4
0
CO 2 -+ [CHzO] carbon gains electrons; it is an oxidizing agent.
sphere by the plant through respiration; it can be eaten by an animal; or it can be present in the plant when the plant dies. Animals obtain all their carbon in their food ultimately from plants (autotrophs). In the animal, the carbon also has the same three possible fates. Carbon from plants or animals that is released to the atmosphere through respiration will either be taken up by a plant in photosynthesis or dissolved in the oceans. Dead organic matter such as humus and organic sediments is also actively cycled carbon and two things can happen: it can be respired by decomposers (and released to the atmosphere) or it can be buried intact and ultimately form coal, oil, or natural gas (fossil fuels). See Figure 7.5. The natural rates of carbon cycling in oceans and land are nearly in a steady state; that is, the rates of movement of carbon between the atmosphere and trees, or between algae and the inorganic carbon dissolved in the ocean do not change measurably from year to year and tend to balance each other. However, human activities have recently introduced changes that will be addressed in Chapter 8.
7.4.4 Oxygen Cycle The carbon cycle also describes the oxygen cycle , because these atoms are often combined. Oxygen is present in carbon dioxide, in carbohydrates, in water, and as a molecule of two oxygen atoms. Oxygen is released to the atmosphere by autotrophs during photosynthesis and taken up by both autotrophs and heterotrophs during respiration. In fact, all of the oxygen in the atmosphere is biogenic ; that is, it was released from water through photosynthesis by autotrophs. It took about 2 billion years for autotrophs (mostly cyanobacteria) to raise the oxygen content of the atmosphere to the 21 % that it is today; this
151
Biogeochemical Cycles SU UGHT
~~
~1__ CO. CYCLE
FACTORY EMISSIONS
ROOT RESPIRATION DECAY ORGANISMS
DEAD ORGANISMS AND WASTE PRODUCTS MINERAL CARBON
FIGURE
7.5. The carbon cycle.
Example 7.2 (a) Write the reduction and oxidation half-reactions that take place in the respiration process: C6HI206
+ 602(g) -+ 6C02(g ) + 6H20(l)
(b) Determine the number of electrons transferred in this reaction. Answer Analyzing the change in oxidation numbers, carbon changes from 0-+ +4 C 6H 1206 -+ C02
In order to balance the number of electrons, this reaction is multiplied by 6 and:
24e-
+ 24H+ + 602 -+
12H2 0
Adding the half-reactions:
this is the oxidation half-reaction, which can be balanced in acid media: (b) The number of electrons transferred is 24.
The reduction half-reaction is: O2 -+
H2 0
as oxygen changes from 0 to -2. The reduction half-reaction is balanced as:
4e -
+ 4H+ + O 2 -+
2H 2 0
This is a global reaction. Electrons are transferred in pairs or individually in a series of reactions called metabolic pathways. In the case of respiration, the metabolic pathways are glycolysis, the citric acid cycle, electron transfer, and oxidative phosphorylation.
152
7. Natural Biochemical Proce sses and Organisms in the Biosphere
opened the door for complex organisms such as multicellular animals, which need a lot of oxygen . The amount of oxygen combined with Fe and Mn, together with that in dissolved and sedimentary sulfates, exceeds the oxygen in the atmo sphere several times over. The se mineral reservoirs of oxygen (including the carbonates) participate to some extent in the oxygen cycle, but because of their large combined mass, their turnover rate is negligible . Atmo spheric and dissolved oxygen in CO 2 and H20 are the predominant actively cycled oxygen reservoirs. Oxygen in living and dead organic matter and nitrates constitute relatively small (but actively cycled) reservoirs. The presence or absence of molecular oxygen in a given habitat is crucial in determining the type of metabolic activities that can occur there. Oxygen is inhibitory to strict anaerobes. Facultative anaerobes can gain more energy from organic substrates by using oxygen as the terminal electron acceptor than by fermentative metabolism. Oxygen serves as the terminal electron acceptor not only in degradation of organic matter, but also in the oxidation of reduced inorganic chemicals used as energy sources by chemolithotrophs. The exhaustion of oxygen in an environment initiates the reduction of nitrate , sulfate, ferric iron, and oxidized manganese species. If such electron acceptors are unavailable or become exhau sted, fermentative metabolism and methanogenesis (involving C02 reduction) become the only option s. Biogenic elements other than carbon, hydrogen, and oxygen are often referred to as mineral nutrients. They include nitrogen, sulfur, and phosphorus, and are usually taken up by autotrophs and phototrophic heterotrophs in the form of mineral salts. Biogenic elements such as nitrogen, sulfur, iron, and manganese exist in the ecosphere in several stable oxidation states and tend to be cycled in complex redox processes. Elements such as phosphoru s, calcium, and silicon exist in compounds in only one stable oxidation state; they have relatively simple cycle s comprising dissolution and incorporation into organic matter, balanced by mineralization and sedimentation.
7.4.5 Nitrogen Cycle Nitrogen occurs in numerous oxidation states ranging from -3 (as in ammonia) to +5 (as in nitrate) . It
is a con stituent of amino acids, nucleic acids, amino sugars, and their polymers. A large and slowly cycled nitrogen reservoir (approximately 3.8 x 10 15 tons) is the N2 gas contained in the atmo sphere. The inorganic nitrogen ions (e.g., ammon ium, nitrite and nitrate ) occur as highly water-soluble salts and consequently spread in dilute aqueous media throughout the eco system s. Living and dead organ ic matter also provide relatively small , actively cycled nitrogen reservoirs. The biogeochemical nitrogen cycle strongly depends on microbial activity. The various transformations on nitrogen bring about the circula tion of nitrogen from the atmosphere through terrestrial and aquatic habitats. These movements through the biosphere largely determine the ecological productivity of the different habitats. See Figure 7.6. Key processes in the nitrogen cycle include: (a) (b) (c) (d)
fixation ammonification nitrification nitrate reduction/denitrification.
7.4 .5.1 Fixation
Nitrogen gas can be naturally taken from the atmosphere (i.e., fixed) in two basic ways. First, lightning provides enough energy to reduce nitrogen and generate nitrate. The second way is biological fixation of molecular nitrogen, which is carried out by several types of bacteria: free-living soil bacterial genera, bacteria that form symbiotic, mutualistic associations with the roots of bean plants and other legumes (rhizobial bacteria), and photo synthetic cyanobacteria (blue-green algae) , which are found most commonly in water. All of these fix nitrogen, according to the following reaction: N2(g) + 8H+
+ 8e- ---+ 2NH3(g) + H2(g) f}.Go' = + 630 kl/mol (7.3)
Nitrogenase is the complex enzyme responsible for nitrogen fixation. Thi s process requires not only nitrogenase but also energy. The energy for carrying out these proce sses may be obtained from the conversion of light energy by photoautotrophs (such as cyanobacteria) or by respiration of heterotrophs (such as Azoba cter). In the latter case, nitrogen fixation is limited by the availability of organic substrates.
Biogeochemical Cycles
153
NITROGEN IN ATMOSPHERE IN,)
DENITRIFYING BACTERIA
FIG URE
7.6. The nitrogen cycle .
In terrestrial habitats the symbiotic fixation of nitrogen by Rhizobia accounts for the largest contribution of combined nitrogen. For example, Rhi zobia associated with an alfalfa field may fix up to 300 kg N/ha/year, compared with a rate of 0.5-2.5 kg N/ha/year for free-living Azotobacter species. In aquatic habitats, cyanobacteria are the principal nitrogen fixers . Rates of nitrogen fixation by cyanobacteria are generally one or two orders of magnitude higher than those by free-living , nonphotosynthetic soil bacteria. Under favorable conditions, cyanobacteria may fix up to 1600 kg of N/ha/year in a rice paddy. Nitrogen fixation also occurs within the digestive tracts of some animals (as termites). The fixation of nitrogen in organisms that primarily consume nitrogen-free cellulose is especially important for the formation of proteins. Ammonia is assimilated into amino acids that are then polymerized into proteins .
7.4.5.2 Ammonification This is a process in which organic nitrogen is converted into ammonia. Nitrogen in living and
dead organic matter occurs predominantly in the reduced amino form. A typical ammonification reaction is NH2-CO-NH 2 + HzO(1)
--,>
2NH 3(g )
+ COZ(g) (7.4)
Some of the ammonia thus produced is released from alkaline environments to the atmosphere, where it is relatively inaccessible to biological systems. This form of nitrogen (and others in the atmosphere) is subject to chemical and photochemical transformations, after which they can be returned to the litho- and hydrosphere through water deposition. Numerous plants and microorganisms can assimilate ammonium ions by incorporating them into amino acids and other nitrogen-containing biochemicals. Animals acquire all of their amino acids when they eat plants (or other animals). When plants or animals die (or release waste), the nitrogen is returned to the soil. The usual forms of nitrogen returned to the soil in animal wastes or in the output of the decomposers are ammonia, urea, or uric acid.
154
7. Natural Biochemical Processe s and Organisms in the Biosphere
7.4.5.3 Nitrification In nitrification, ammonia or ammonium ions are oxidized to nitrite ions and then to nitrate ions: NH 4 + + 1.50z(g) -+ NO z - +2H+ + HzO(l) l}.Go' = -277 .2 kl/mol (7.5) NOz - + I/zOZ(g) -+ N03 -
l}.Go' = -71.4 kJ/mol
(7.6)
Nitrification seems limited to a number of autotrophic bacteria. The dominant genus that is capable of oxidizing ammonia to nitrite in soils is Nitrosomonas, and the dominant genus capable of oxidizing nitrite to nitrate is Nitrobacter: Normally, the two processes are closely connected and nitrite accumulation does not occur. Nitrifying bacteria are chemolithotrophs that utilize the energy derived from nitrification to assimilate C02. Nitrification is especially important in soils because the transformation of ammonium into nitrite and nitrate ions results in their charge switching from positive to negative. As discussed in Chapter 5, positively charged ions tend to be bound by negatively charged clay particles in soil, but negatively charged ions freely migrate in the soil water. This mobilization process results in a net nitrogen transfer within soil habitats. Most plants can take up nitrate and convert it to amino acids . Nitrite and nitrate can readily leach from the soil column into ground-
water, which represents a loss of fixed forms of nitrogen from the soil that plants utilize for biomass production.
7.4.5.4 Nitrate Reduction and Denitrification A heterogeneous group of microorganisms, including many bacterial, fungal, and algal species, are capable of assimilatory nitrate reduction, a process that reduces nitrate and nitrite to ammonia, which can be subsequently incorporated into amino acids. Denitrifying nitrate reducers such as Paracoccus denitrificans, Thiobacillus denitrificans, and various pseudomonads follow a more complete reduction pathway, converting nitrate through nitrite to nitric oxide, nitrous oxide and lastly to molecular nitrogen:
Primary denitrifying genera in soils are Pseudomonas and Alkaligens. Simultaneous with denitrification is organic matter oxidation. The utilization of glucose through nitrate reduction by Pseu domonas denitrificans can be written as (5/6)C6H1206 + 4N03 + 4H+ -+ 5COZ(g) + 7H zO(l) + 2N z(g)
(7.8)
Denitrification typically occurs under strictly anaerobic conditions or under low-oxygen part ial pressures.
Example 7.3 (a) Establish the half-reactions in equation 7.5 (b) Determine the number of electrons transferred (c) Determine D. EO' of the reaction . (d) Based on information on Table 7.5, determine EO' for the oxidation ofNHt NH + + 1.50z(g) --+ N02" + 2H+ + H zO(1) D.G0' = -277.2 kl/mol 4
Answer
(a) 2H zO + NHt -+ NO; + 8H+ + 6e6e- + 6H+ + 1.50z -+ 3H zO (b) 6e (c) l}.Go' = -nFl}.Eo' l}.Eo' = -l}.Go' InF l}.Eo' = -277.2 kJ/mol/(-6)(96.496 kJN mol) l}.Eo' = 0.478V
(d) According to Table 7.5 : I/zOz+2H++2e- -+ HzO l}.E
0'
0' _ E ox -
=
0' E ox 0'
sr: +
EO' =0.816V
0' Erect 0' Erect
E2~ = 0.478 + 0.816 = 1.294 V
155
Biogeochemical Cycles
Example 7.4 Determine the oxidation number of nitrogen in each species of the sequence 7.7.
Answer + 5 ---+ +4 ---+ + 2 ---+ + I ---+ 0
Because different environmental conditions favor specific nitrogen-cycling processes, there is a spatial zoning of cycles. Nitrogen fixation occurs both in surface and in subsurface habitats, whereas nitrification exclusively occurs in aerobic habitats, and denitrification predominates in waterlogged soils and anaerobic aquatic sediments. The cycling of nitrogen within a given habitat also exhibits seasonal fluctuations because cyanobacteria bloom during spring and fall, and con sequently the rates of nitrogen fixation in aquatic habitats increa se.
7.4.6 Sulfur Cycle Sulfur, a reactive element with stable oxidation states ranging from - 2 to +6, is among the 10 most abundant elements in the Earth's crust. In living organisms, sulfur occurs mainly as sulfhydryl groups in amino acids and their polymers. At an approx-
imate average conc entration of 520 ppm, it rarel y become s a limiting nutrient. In its fully oxidized state , sulfur exists as sulfate. Sulfate is the second most abundant anion in seawater, and the SO~- in marine environments represents a large, slowly cycled sulfur reservoir. Living and dead organic matter compose a smaller, more rapidly cycled sulfur reservoir. Largely inert sulfur reservoirs include metal sulfides in rocks, elemental sulfur depo sits, and fossil fuel s. In soil, 90% of the sulfur present is organic: 50% is C-O-S linkages (sulfate esters), 20% is S-amino acids, and 20% as a wide range of different sulfur compounds. See Figure 7.7.
7.4.6.1 Sulfur Mineralization Organosulfur decomposition in soils and sediments yields mercaptans and H2S. Analogous to ammonification, this proces s is referred to as desulfurization.
.....,.........' .
~
......... ...., .......,
.......
SUlfATES " WAT£II~.'1
'i
L
_ FIGURE
7.7. The sulfur cycle .
J
156
7. Natural Biochemical Processes and Organisms in the Biosphere
according to the equation: H2S(g) + Y20 2(g ) ~ S(s) + H 20(l) D.Go' = -210.4 kl/mol NH 3 + HS-CH 2-CO-C02H (l3-mercaptopyruvic acid)
FIGURE
7.8. The degradation of cysteine.
So, as with nitrogen, these organic sulfur compounds are returned to the land or water after the plants die or are consumed by animals. As an example, consider the degradation of cysteine shown in Figure 7.8. The H 2S and NH3 are released into the atmo sphere, contributing to the characteristic smell associated with putrefaction. In the marine environment, a major decomposition product of organosulfur is dimethyl sulfide (DMS). This product originates from dimethylsulfoniopropionate, a major metabolite of marine algae that may have a role in osmoregulation. The volatile DMS escapes from the oceans; according to some estimates, 90% of the total sulfur flux from the marine environment to the atmosphere occurs in the form of DMS. Another major product is H2S. Once they escape to the atmosphere, DMS, H2S and mercaptans are subject to photooxidative reactions that ultimately yield sulfates. H2S also reacts directly with 0 2 in the atmo sphere. If H2S does not escape into the atmosphere, it may be subject to microbial oxidation under aerobic conditions. Alternatively, it may undergo phototrophic oxidation under anaerobic conditions, where sulfate as well as elemental sulfur may serve as electron acceptors while organic substrates are oxidized.
7.4.6.2 Oxidation ofSulfide and of Elemental Sulfur In the presence of oxygen, reduced sulfur compounds can support chemolithotrophic microbial metabolism. Some examples are given below. Beggiatoa, Thioploca, Thiothrix, and the thermophilic Thermothrix are filamentous , microaerophilic bacteria capable of oxidizing H2S
(7.9)
Other Thiobacillus produce sulfate from the oxidation of elemental sulfur and other inorganic sulfur compounds: S(s) + 1.502( g) + H20(l) ~ H2S04 D.Go' = -629.2 kl/mol
(7 .10)
Thiobacillus are acidophilic (they grow well at pH 2-3). They are obligate chemolithotrophs that obtain their energy exclusively from the oxidation of inorganic sulfur, and their carbon from the reduction of carbon dioxide. Most Thiobacillus are obligate aerobes, requiring O2 for the oxidation of the inorganic sulfur compounds. Thiobacillus denitrificans, however, can utilize nitrate ions as terminal electron acceptors in the oxidation of inorganic sulfur compounds: 5S(s)+6N0 3 - +2H20(1) ~ 5S042- + 3N2(g)+4H+ (7.11)
Sulfur oxidation produces substantial amounts of H2S04 . The resulting acidification can lead to solubilization of phosphorus and other mineral nutrients in soils with a generally beneficial effect on both microorganisms and plants. Hydrogen sulfide is also subject to phototrophic oxidation in anaerobic environments. The photosynthetic sulfur bacteria Chromatiaceae, Ectothiorhodosp iraceae, and Chlorobiaceae can photoreduce CO 2 while oxidizing H2S to S, in a striking analogy with the photosynthesis of eukaryotes : CO 2(g) + H2S(g)
~
carbohydrate + S(s)
(7.12)
The chemoautotrophic fixation of CO 2 connected with this activ ity, only minimally contributes to the carbon cycling in most ecosystems. Notable exceptions to this include the deep-sea hydrothermal vent ecosystems, where the whole vent community is supported by the chemoautotrophic oxidation of reduced sulfur, primarily by Beggiatoa, Thiomicropira, and other sulfur oxidizers. In environments other than these, the generation of reduced minerals used in chemolithotrophic production is dire ctly tied to the oxidation of photosynthetically produced organic matter. Therefore, sustainable primary production without solar energy input is unthinkable even in the case of chemolithotrophs.
157
Biogeochemical Cycles
7.4.6.3 Dissimilatory Sulfate or Sulfur Reduction The sulfur- and sulfate-reducing microorganisms represent a large and diverse group that is strictly anaerobic. Most are eubacteria, but several archaea that reduce sulfur have also been described. The analogy between HzO and HzS in oxygenic and anaerobic phototrophy, respectively, was pointed out above. Interestingly, elemental sulfur can be used in respiratory processes. Desulfuromonas acetoxidans grow on acetate, anaerobically reducing stoichiometric amounts of S to HzS: CH 3COOH + 2H zO(I) + 4S(5) ---+ 2CO z(g) + 4H zS(g)
sc" =
-23 .9 kl/mol
(7 .13)
They occur in anaerobic sediments rich in sulfide and elemental sulfur, and live syntrophically with the phototrophic green sulfur bacteria (Chlorobiaceae) that photooxidize HzS to S and excrete sulfur extracellularly. Desulfuromonas regenerate HzS by sulfur respiration, using, at least in part, organic matter leaked by Chlorobium cells. From submarine hydrothermal vent environments, extremely thermophilic anaerobic archaea are capable of sulfur respiration with hydrogen gas : (7.14) When obligate anaerobic bacteria carry out dissimilatory sulfate reduction, they are referred to as sulfate reducers or sulfidogens. The traditional sulfate-reducing genera are Desulfovibrio and Desulfotomaculum. Sulfate reduction results in the production of hydrogen sulfide: 4Hz(g)
+ SO~-
---+ HzS(g) + 2H zO(1)
+ 20H-
(7.15) Typical habitats are anoxic sediments or bottom waters of freshwater, marine, or hypersaline aquatic environments; thermophilic species occur in hot springs and submarine hydrothermal vents. In soils that become deficient in oxygen, usually as a result of flooding, the sulfide level will increase to relatively high concentrations. The formation of sulfide by sulfate reduction in nature is enhanced in warm, wet, or waterlogged soils with a pH above 6.0. Sulfide accumulation may be particularly pronounced in sulfate-rich saline areas in which plant excretions (release of carbon compounds) serve as the oxidizable carbon source, in addition to the hy-
drogen. Thus, like denitrification, an oxidizable carbon source serves as the electron donor, while the sulfate serves as the electron acceptor. Only a few compounds can serve as electron donors for sulfate reduction. The most common are pyruvate, lactate, and molecular hydrogen. Sulfate reduction is inhibited by oxygen, nitrate, or ferric ions and its rate is carbon-limited. Some bacteria are facultative chemolithotrophs as they can mixotrophically grow on acetate, COz, and Hz. The production of even small amounts of hydrogen sulfide by sulfate reducers can have a marked effect on populations within a habitat. Since it is extremely toxic to aerobic organisms because of its affinity for Fe in the cytochrome systems, hydrogen sulfide can kill for example nematodes and plants.
7.4.6.4 Assimilatory Sulfate Reduction or Sulfur Immobilization In contrast to the specialized dissimilatory sulfate reducers, many organisms (humans as well) are capable of assimilatory sulfate reduction. This process, which requires chemical energy in the form of ATP and a series of transfer reactions, can occur anaerobically and aerobically. It produces low concentrations of hydrogen sulfide that are immediately incorporated into organic compounds. Many microbes, plants, and animals have such a metabolic ability.
7.4.7 Phosphorus Cycle Phosphorus is essential to all living systems. Within biological systems the most abundant forms ofphosphorus are phosphate diester bonds, which form the links within nucleic molecules. Phosphate is an indispensable portion of the ATP molecule. The hydrolysis of phosphate from ATP to ADP forms the basis of most energy transfer reactions within biological systems. Phospholipids and sugar phosphates are constituents of all living cells. However, phosphorus is not abundant in the biosphere and it often limits microbial growth. The availability of this element is restricted by its tendency to precipitate in the presence of several polyvalent metal ions at neutral to alkaline pH. Large, slowly cycled phosphate reservoirs occur in marine and other aquatic sediments, whereas small, actively cycled reservoirs comprise dissolved phosphate in
158
7. Natural Biochemical Processes and Organisms in the Biosphere
soils and waters , as well as phosphate in living and dead organic matter. A largely inert reservoir is phosphate rock , such as apatite, Ca5(P04h(OH, F, CI). The microbial cycling of phosphorus does not alter its oxidation state. Most phosphoru s transformations mediated by microorganisms can be viewed as inorganic to organic pho sphate transfers or as tran sfers of phosphate from insoluble , immobilized form s to soluble or mobile compounds. Various microorganisms have evolved transport systems for the regulated acquisition of phosphate from the environment. As phosphates are combined with calcium in many habitats, this renders them insoluble and thus makes them unavailable to plants and many microorganisms. Some heterotrophic microorganisms can solubilize phosphates from such sources. The mechanism for phosphate solubilization normally takes place through the production of organic acids. Some chemolithotrophic microorganisms such as Nitrosomonas and Thiobacillus mobilize inorganic phosphates by producing nitrou s and sulfuric acids, respectively. Phosphate also exist s within soils as the insoluble iron, magnesium, or aluminum salts. Solubilization of insoluble ferric phosphate s may occur when microorganisms reduce ferric ions to ferrou s ions under anaerobic conditions.
Plants and microorganisms can take up soluble forms of inorganic phosphates readily and assimilate them into organic phosphate s. Heterotrophs (animals) obtain their phosphorous from the plants they eat, although one type of heterotroph , the fungi, excels at taking up phosphorous and may form mutualistic symbiotic relation ships with plant roots. The se relationships are called mycorrhi zae; the plant gets phosphate from the fungus and gives the fungu s sugars in return. Animal s may also use phosphorous as a component of bones, teeth, and shells . When animals or plants die (or when animals defecate), the phosphate may be returned to the soil or water by the decompos ers. There, it can be taken up by another plant and used again. This cycle will occur over and over until at last the phosphorous is lost at the bottom ofthe deepest parts of the ocean, where it becomes part of the sedimentary rocks forming there. Ultimately, phosphorous will be released if the rock is brought to the surface and weathered. Marine birds playa unique role in the phosphorous cycle , as they take phosphorouscontaining fish out of the ocean and return to land, where they defecate. Their guano contain s high levels of phosphorous and in this way marine birds return phosphorous from the ocean to the land. See Figure 7.9.
FIGURE 7.9. The phosphorous cycle.
Biogeochemical Cycles
7.4.8 Iron Cycle Even though iron is the fourth most abundant element in the Earth's crust, only a small portion is available for biogeochemical cycling which consists largely of oxidation-reduction reactions of ferric to ferrous ions and vice versa. These reactions are important in organic and inorganic iron-containing compounds. As discussed in Chapter 5, ferric and ferrous ions have very different solubility properties. Ferric ions precipitate in neutral to alkaline environments as ferric hydroxide, and under anaerobic conditions they may be reduced to the more soluble ferrous form. However, under certain anaerobic conditions enough H 2S may be present so as to precipitate iron as ferrous sulfide. In organic compounds, iron is often attached to organic ligands by chelation and, thereby, it can undergo oxidation-reduction transformations that are utilized in electron-transport processes. Cytochromes in electron-transport chains contain chelated iron that undergoes such redox transformation s. Virtually all microorganisms-with the exception of certain lactobacilli- require iron as cofactor of many metabolic enzymes and regulatory proteins because of its ability to exist in two stable oxidation states . Although iron is one of the most abundant elements in the environment. it is often a limiting factor for bacterial growth. This is so because of the formation of insoluble ferric hydroxide complexes under aerobic conditions at neutral pH, which impose severe restrictions on the availability of the element. Consequently, bacteria have evolved specialized high-affinity transport systems in order to acquire sufficient amounts of this essential element.
159
Most bacteria have the ability to produce and secrete molecules-called siderophores-to fulfill their iron requirements. Siderophores are special iron-chelating agents that facilitate iron solubilization and uptake. They are water-soluble, low-molecular weight molecules that bind ferric ions strongly. The ability of bacteria to utilize siderophores is associated with the presence of transport systems that can recognize and mediate uptake of the ferric-siderophore complexes into the cell. These iron-acquisition systems are regulated in response to iron availability, and their action thus increases under iron limitation conditions. As discussed in Chapter 2, iron forms a variety of oxidized or reduced compounds in a given environment depending on the pH and redox potential, which leads to a heterogeneous distribution of various iron-containing compounds. Under conditions ranging from alkaline to neutral. ferrous iron is inherently unstable in the presence of O2 as it is spontaneously oxidized to ferric ion. In such conditions, microorganisms have little chance to extract energy from the oxidation processes. Under acidic conditions in oxygenated environments, however, ferrous iron is relatively stable and acidophiles such as Thiobacillus ferroxidans, Leptospirillum ferroxidans, and some strains of SulfoLobus acidocaldarius are capable of producing the chemolithotrophic oxidation of ferrous iron : 2Fe2+ +
12 02(g)
+ 2H+
---+
2Fe 3 +
+ H 2 0 (l ) (7.16)
With the exception of L. ferroxidans, the same microorganisms can also oxidize sulfur compounds. There are also non-acidophilic iron bacteria, such as the prosthecates Hyphomicrobium,
Example 7.5 Determine the ~Go' of reaction 7.16.
and:
Answer
According to Table 7.5:
EO' = 0.816 - 0.771 = 0.045V ~GO' = -nF~Eo'
= -2(96.496 kJ V/mol)(0.045V)
= -8.68 kl/mol
160
7. Natural Biochemical Processesand Organisms in the Biosphere
Pedomicrobium, and Planctomyces, and the filamentous Sphaerotilus and Leptothrix that derive energy from ferrous iron oxidation. The activity of iron-oxidizing bacteria can lead to substantial iron deposits; most iron in the biosphere exists in the oxidized state. Where anaerobic conditions are created as a result of limited oxygen diffusion and vigorous heterotrophic microbial activity-as in the hypolimnion of stratified lakes, waterlogged soils, and aquatic sediments-ferric ion may act as an electron sink and become Fe2+. A large heterogeneous group of heterotrophic bacteria, comprising Bacillus, Pseudomonas, Proteus, Alkaligens, Clostridia, and Enterobacteria, are thought to be involved in iron reduction. Magnetite (Fe304) and siderite (FeC0 3) are the major end products of Fe(III) reduction.
7.4.9 Interrelations Among Cycles Biogeochemical cycles interact with each other extensively in space and time. This is true not only for C, H, and 0, which are cycled by the same two processes of photosynthesis and respiration, but also for cycles that are driven by different biochemical processes and performed by distinct microorganisms. The reductive portions of the N, S, and Fe cycles are driven by chemical energy fixed in organic substances during photosynthesis. The chemolithotrophic reoxidation of N, S, and Fe is, in tum, linked to the conversion of CO 2 , into cell material, again involving the cycling of C, H, and O. This is shown in Figure 7.10.
Solubilization, uptake, and precipitation of Ca and Si are directly (or at least energetically) linked to the photosynthetic and respiratory cycling of C, H, and O. Acids from nitrification and sulfur oxidation aid phosphorus mobilization; photosynthesis or respiration is required for the uptake and conversion of phosphorous into high-energy phosphate. Sulfur is oxidized (with the concomitant reduction of nitrate) by Thiobacillus denitrificans; likewise, some extremely thermophilic methanogens can transfer hydrogen not only to CO 2 , but also to S. These are a few examples of interrelations involved in biogeochemical cycles. Under each given set of circumstances, the process that allows for the maximal energy flow is selected. Many of the biogeochemical cycling reactions of individual elements are actually connected by factors such as redox potentials. Individual minerals are oxidized only at specific redox potentials. This leads to zonations in soil and aquatic environments where minerals accumulate in specific chemical forms and where specific microbial populations proliferate. From the pool of potential electron acceptors, microorganisms within a given community use the specific electron acceptor that they are genetically capable of using, which yields the maximum energy from the available substrate. Each electron acceptor is utilized at a different redox potential, which is in part due to metabolic regulation within a single population and, to some degree, due to competition between populations with diverse metabolic capabilities. Through various regulatory mechanisms, facultatively anaerobic microorganisms shut
oxidized N S Fe
respiration
photosynthesis reduced N
S Fe FiGURE
7.10. Interrelations among cycles.
Biogeochemical Cycles TABLE
161
7.6. Relative energy yield of electron acceptors (AH z is an oxidizable substrate)
Type of metabolism
Energy yield
Schematic reaction (not balanced)
Aerobic
AHz + Oz ~ COz + HzO + energy
Anoxic
AH z + N0 3- ~ Nz + HzO + energy
Facultative-
AH z + so,': ~ HzS + HzO + energy
anaerobic
AH z + COz ~ CH 4 + HzO + energy
off their less efficient fermentative or dissimilatory nitrate reduction pathways in the presence of dioxygen. In the absence of oxygen or Fe(III) , the most oxidizing electron acceptor is N03- . From a substrate equally utilizable by nitrate and sulfate reducers, the former will obtain a higher energy yield and, therefore, will produce more biomass per unit of substrate utilization. Nitrate reducers also outdo the sulfate reducers because the latter have lower thresholds for carbon substrates. Nitrate and iron are usually scarce in aquatic sediments and become rapidly depleted, leaving sulfate as the most oxidizing electron acceptor. When competing for a common substrate (i.e., Hz), methanogens have lower utilization efficiency and a higher threshold for hydrogen uptake than sulfate reducers . Consequently, methanogens cannot effectively compete with sulfate reducers until most of the sulfate (or all of it) is depleted. In low-sulfate freshwater sediments this occurs fairly rapidly; in sulfate-rich marine sediments, it occurs much more slowly. The sequence of electron-acceptor utilization can be spatially observed in horizontal layers of increasing depth in aquatic water columns and sediments. In a typical littoral marine sediment, only the first few millimeters of the sediment are oxygenated and nitrate serves as the electron acceptor. Below this, for several meters, sulfate is the principal electron acceptor. Methanogenesis is usually confined to the sulfate-depleted deeper sediment layers; methane
Related Experiment in the Companion Book 22. Microorganisms in soil, water and air
decreasing ~
energy
~
may diffuse upwards into the sulfate-reduction zone. Hydrogenogens (i.e., hydrogen-producing fermentative microorganisms) are at thennodynamical disadvantage if hydrogen accumulates. They live syntrophically with hydrogenotrophs (i.e ., hydrogen consumers such as sulfate reducers, methanogens and acetogens) and supply them with the hydrogen necessary for S04z- or COz reduction, respectively. Most of the Hz-dependent methanogenesis in these ecosystems occurs via interspecies hydrogen transfer. Then, electron acceptors are sequentially used in the following general descending order: dissolved dioxygen, nitrate, sulfate, and carbon dioxide. Therefore, hydrogen sulfide formation follows nitrate reduction but precedes methane production as shown in Table 7.6. Due to the lack of electron acceptors in anaerobic decompositions, the low energy yield per unit of substrate is a limiting factor that results in the incomplete breakdown of the substrate. Metabolism and synthesis cease when the supply of biologically available energy is exhausted. On the other hand, biologically available carbon is the limiting factor in aerobic metabolisms, with no shortage of electron acceptors because of the abundance of dioxygen. However, the supply of carbon-containing substrates is rapidly exhausted because of carbon dioxide metabolism and organic synthesis.
7. Natural Biochemical Processes and Organisms in the Biosphere
162
Additional Related Experiments/Activities Andino, J. M.; Wallington, T. J.; Hurley, M. D.; Wayne, R. P. "A Classroom Demonstration of the Formation of Aerosols from Biogenic Hydrocarbons," J. Chern. Educ. 2000, 77, 15841586. Norman, J.; Cedergren, H. "Phosphorus Cycling-An Ecology Experiment," J. Coil. Sci. Teach. 1987,16,529-531. Pepper, I.; Gerba, C. Environmental Microbiology: A Laboratory Manual, 2nd ed.; Academic Press : San Diego , 2005. • Experiment 1: Dilution and Plating of Bacteria and Growth Curves • Experiment 2: Soil Moisture Content Determination, Examination of Soil Microorganisms via Microscopic and Cultural Assays • Experiment 3: Contact Slide Assay • Experiment 4: Filamentous Fungi • Experiment 5: Bacteria and Actinomycetes • Experiment 6: Algae: Enumeration by MPN Microbial Transformations and Response to Contaminants • Experiment 7: Oxidation of Sulfur in Soil • Experiment 8: Dehydrogenase Activity of Soils • Experiment 9: Nitrification and Denitrification • Experiment 10: Enrichment and Isolation of Bacteria that Degrade 2, 4- Dichlorophenoxyacetic acid • Experiment 11: Adaptation of Soil Bacteria to Metals • Experiment 12: Biodegradation of Phenol Compounds • Experiment 13: Assimilable Organic Matter • Experiment 14: Biochemical Oxygen Demand, Water Microbiology
References and Further Reading Alexander, M. Biodegradation and Bioremediation; Academic Press: San Diego, CA, 1994. Atlas, R. M.; Barths, R. Microbial Ecology. Fundamentals and Applications; Benjamin Cummings : San Francisco , CA, 1998.
• Experiment 15: Membrane Filter Technique • Experiment 16: Bacteriological Examination of Water: the Coliform MPN Test • Experiment 17: Detection of Bacteriophages • Experiment 18: Film Medium for the Detection of Coliforms in Water, Food, and on Surfaces • Experiment 19: Defined Substrate Technology for the Detection of Coliforms and Fecal Coliforms, Advanced Topics • Experiment 20: Detection of Enteric Viruses in Water • Experiment 21: Detection of Waterborne Parasites • Experiment 22: Kinetics of Disinfection • Experiment 23: Aerobiology: Sampling of Airborne Microorganisms • Experiment 24: Detection and Identification of Bacteria via PCR and Subsequent BLAST Analysis of Amplified Sequences Piedrahita, R. H. "Biology in Aquacultural Engineering Instruction," Proc. Ann. ASEE Conf 1995,2, 2529-2533. Anaheim, CA, USA, Jun. 25-28, 1995. Schmitz, R. A. "The Earth's Carbon Cycle : Chemical Engineering Course Material," Chem. Eng. Educ.2002,36,296-303. Shrnaefsky, B. R. "Using Elodea as a Live Model of the Eukaryotic Cell," J. Coil. Sci. Teach. 2003, Dec., 52-55 . Watson, J. "How to Collect and see the Microbial Community that Fixes Iron and Maganese in the Natural Environment," U.S. Geological Survery, Department of Interior. http://pubs.usgs .gov/gip/microbes/
Biology Daily. The Biology Encyclopedia. http://www. biologydaily.com/biology/upload/thumb/3/37/340pxPhylogeneticTree.jpg Chasteen, T. G.; Bentley, R. "Volatile Organic Sulfur Compounds of Environmental Interest : Dimethyl Sulfide and Methanethiol. An Introductory Overview," J. Chem. Educ . 2004,81 , 1524-1528.
Biogeochemical Cycle s Doolittle, W. E, Canadian Institute for Advanced Research, Dept. of Bioch emistry and Molecular Biology, Dalhousie University, Halifax, Nova Sco tia, Canada. " Phylogenet ic Classification and the Universal Tree." http://cas.bellarmine.edu/tietjen/Ecology/phylogenetic .classification. and. ihtm Gura, T. " Bones, Molecu les. . . or Both ?", Nature 2000 , 406 , 230-233 . Khan, H. R.; Adac hi, T. "Soil Acidity and its Impact on Acidic- Basic Cati ons in Recen t Sedime nts as Influenced by Micro-Organi sm s and Water Contents," Proc. l st Int. Con! Environ. Eng. Educ. Train. (EEET'96). Southa mpton, UK, Apr. 17-1 9, 1996, pp. 197-206 . Levine, J. S.; Miller, K. R. Biology: Discovering Life; D. C. Health : Canada, 1994. p. 71 I. Maier, R. M.; Pepp er, I. L.; Gerba , C. P. Environmental Microbiology; Acad em ic Press: San Diego, CA, 2000 . Marguli s, L.; Matthews, c.; Haselton, A. Environmental Evolution. Effects of the Origin and Evolution of Planet Earth ; The MIT Pre ss: Cambridge . MA, 2000. Martin, W; Embley, T. M. " Early Evolut ion Comes Full Circle ," Nature 2004 , 431 , 134-1 35. Marietta College , Biology. Environm ent al BiologyEcosystems. http ://ww w.mari etta . edu/~bi ol/I 02/ ecosystem.html Nevel, J. B.; Wright, R. T. Environme nta l Science. Toward a Sustainab le Future, 8th ed .; Prentice Hall: Uppe r Sadd le River, NJ, 2002.
163 Nisbet, E. "The Realm s of Archa ean Life," Nature 2000 405, 625--626. Reeburgh, W. S. Dep artment of Earth System Science, University of Cali forn ia, Irv ine. " Figures Summarizing the Global Cycle s of Biologicall y Active Element s," htt p : //w w w.ess .uci.edu /~reeburgh/fi gures . html Scheffe, M; Carpe nter, S .; Foley, J. A.; Folk e, c, Walker, B. "Catas trophic Sh ifts in Eco system s," Nature 2001 , 413,59 1-5 96. Stem , D. I. "G lobal Sul fur Emi ssion s from 1850 to 2000." Chemosph. 2005,58 , 163-175. Talaro, K. P.; Talaro , A. Foundations in Microbiology; McGraw-H ili College: New York, 1999 . p.22. University of Florida, Dept. of Agri cultural and Biological Engineering. http ://www.agen.ufl .edu/~chyn/ age2062!1ect!1ecL 19/5kingdms.gif Whitfield, J. " Born in a Watery Commune," Nature 2004 , 42 7, 674--676. Wilkinson , D. "At Cro ss Purposes", Nature 2001 , 412, 485. Williams, R. J.; Frau sto da Silva, J. J. "The Trin ity of Life: Gen ome, the Prote ome , and the Mineral Chemical Element s," J. Chem. Educ. 2004, 81, 738749. Yarnell, A. " Defining Life 's Lim its," Chern. Eng. News , April 4, 200 5, pp. 60--63.
Part 3
Effects, Treatment and Prevention of Pollution
8
Effects of Pollutants on the Chemistry of the Atmosphere, Hydrosphere, and Lithosphere
In this chapter we present the main type s of useful chemical substances, contaminants, pollutants, and wastes, and give an overview of their key undesirable effects upon the atmosphere, hydrosphere, and lithosphere. In the following chapter, we will deal with their effects on live organ isms. The unavoidable overlap with other chapters is addressed in the form of references to the sections where a specific theme is further discussed .
8.1 Importance of the Manufacture and Use of Chemical Substances Production processes typically depend on materials and substances derived from the chemical industry, which in turn relies on chemical feed stock s. To give an idea of the importance of chemical trade, the United State s exports and imports are both on the order of $10 11 USD per year. A list of the most important organic and inorganic chemicals is given in Table 8.1. Key uses for the chemicals described in Table 8.1 include the manufacture of plastics, resins, synthetic rubber and fibers, agricultural chemicals (e.g., fertilizers and pesticides), dyes and pigments, pharmaceuticals and med icines, soap, cleaning compounds and toiletrie s, and paints and coatings. Table 8.2 gives examples of the production of some of these goods.
8.2 Sources of Chemical Substances as Contaminants and Pollutants (a) Natural types and sources of pollutants Nature may be respon sible for generating pollutants when natural sub stances are liberated in amounts that can harm health or cause alterations in ecosystem s. This is the case with volcanic eruptions that generate abnormal levels of particles and gases in the atmosphere. Processes such as wind erosion and natural anaerobic processes (involving the production of CO 2, CH 4 , and H2S) may also contribute to abnormal levels of natural sub stances. Other examples include: • The contribution of non-methane volatile organic compounds (VOCs) to the atmosphere due to the liberat ion of volatile phytochemicals. • The production of NOx and 03 by lightning. • The liberation of Rn gas from the lithosphere. • The action of termites, organic matter decay, geological activity, and biogenic processes. The majority of natural contributions to pollution (including particles, aerosols, VOCs, and inorganic gases) strongly influence air composition. They make an impact on the hydrosphere generally through the dissolution of substances produced by dry or wet depos ition , or by the transport of sediments resulting from runoff or river drainage.
167
8. Effects of Pollutants on the Chemistry of the Atmosphere, Hydrosphere, and Lithosphere
168 TABLE
8.1. Production of key organic and inorganic chemicals
ORGANICS
Relative production (by weight)'
Ethylene Propylene Ethylene dichloride Urea Ethylbenzene Styrene Ethylene oxide Cumene 1,3-Butadiene Acrylonitrile Vinyl acetate Aniline Benzene
INORGANICS Sulfuric acid Phosphoric acid (as P20S) Chlorine Ammonia Sodium hydroxide Nitric acid Ammonium nitrate Hydrochloric acid Ammonium sulfate Titanium dioxide Aluminum sulfate Sodium chlorate Sodium sulfate
100
60.6 43.5 26.7 24.3 22.5 15.9 14.8 8.3 6.5 5.7 4.2 3.6
INORGANIC GASES Nitrogen Oxygen Hydrogen
Relative production (by weight)' 100
29.6 28.8 28.8 23.4 17.2 15.3 11.0 6.7 3.8 2.5 1.8 1.3
Relative production (by volume)" 100
73.3 53.3
'Data for U.S. production in 2003 .The average annual net production of sulfuric acid is approximately 40 x 106 tons (metric). The production ratio of sulfuric acid to ethylene (by weight) is typically 1.6 to I . "The annual production of each gas is given relative to that of nitrogen (approximately 3 x 10¹⁰ cubic meters). (Source : Chern. Eng. News, July 5, 2004.)
(b) Anthropogenic types and sources of pollutants As the use of synthetic chemicals increased dramatically after World War II, their possible adverse 8.2. Examples of production of goods derived from the chemical industry
TABLE
Products PLASTICS AND SYNTHETIC RUBBER Thermoplastic resins Thermosetting resins Rubber SYNTHETIC FIBERS Non-cellulosic fibers Cellulosic fibers
Millions of tons (metric)' 35.2 3.7 2.2 3.9 0.1
FERTILIZERS Phosphate products Nitrogen products Potash products
58.3 28.4 1.4
PAINTS AND COATINGS** Architectural Products for manufacturers Special purpose
3.0 1.5 0.7
*U.S. production in 2003 . **In 109 liters. (Source : Chern. Eng. News, July 5, 2004.)
effects on human health and the environment also increased. As a consequence, the air we breathe, the water we drink and bathe in, the soil in which our crops are grown, and the environments in which populations of animals and plants thrive are often contaminated to different extents with a variety of synthetic chemicals, heavy metals, and/or radionuclides. The main sources of anthropogenic pollutants derive from the following human activities: • Industrial processes • Agricultural practices • Energy-related activities (mainly transportation and combustion) • Resource exploitation • Urban refuse Such pollutants typically involve • Substances deliberately or inadvertently discharged into waters or soils following their intended use • Substances generated during water treatment operations
Transport, Mobility, and Partition of Pollutants TABLE 8.3. EPA's conventional and non-conventional pollutant categories (code of Federal Regulations, Title 40) Conventional
Non-conventional
Biochemical oxygen demand Total suspended solids Oil and grease
Ammonia Chromium (VI) Chemical oxygen demand CODIBODj Fluoride Manganese Nitrate Organic nitrogen Pesticide active ingredients Phenol s Phosphorus Total organic carbon
pH
• Byproducts of manufacturing operations that do not use waste treatment facilities • Wastes that are inadequately treated • Derivative s of synthetic substances produced by reaction s in the environment • Con sumer products that are discarded as waste after use Many of these substances are exemplified in Tables 8.3 and 8.4. The substances in Table 8.4 are not normally found alone in the environment but rather in simple or complex mixtures. These mixtures may be associated with the release, storage, or transport of chemicals in surface or groundwater, waste-treatment systems, soils, or sediments. Although many of these chemicals are either consumed or destroyed, a significant portion find their way into the air, waters and soils far away from their original discharge sites . The major polluters in industrialized countries are typically the • • • •
Electric utilities Metal mining corporations Chemical and petroleum indu stries Agro and food industries
The first three together contribute around twothird s of the total toxic releases. Air emissions alone involve more than 3 x 10⁵ tons per year. In the same vein, approximately 106 tons of petroleum are released annually into the oceans due to natural seeps , or extraction-transportationconsumption processes.
169
(c) Point and non-specific (or multimedia) pollution sources The environmental effects of pollutants and wastes have traditionally been confronted with actions at the immediate vicinity level. A typical example involves the emissions resulting from fossil fuel burning in industrial and power plants, where taller stacks were built in the past to disperse pollutants in the air (mainly sulfur oxides) in a more efficient way. However, it is now recognized that these oxides can have important effects even in regions far away from the emission source due to environmental transport phenomena. Consequently, increasing the height of the stacks did not solve the problem. The boundary between the effects of point sources (i.e., localized discharges) and non-point or non-specific sources (NPS) to local and global pollution is becoming more and more blurred, and the latter sources have become more relevant due to the difficulty in evaluating and controlling them. Because local regulations are insufficient to tackle such overall problems, national, regional, and international regulations as well as other concerted efforts have become essential strategies. Non-point specific pollution is caused, for example, by • Runoff due to rainfall or melting snow that dissolves and transports pollutants as it moves • Industrial diffuse or fugitive releases and leaks • Accidental spill s • Atmospheric wet and dry deposition • Local air contamination sources (e.g., forest fires and highly transited highways or streets) The pollutants thus transported include fertilizers, pesticides, oil, grease, other organic and inorganic industrial chemicals, sediments, salts, acid mine drainage, nutrients, radionuclides, microorganisms, and noxious gases.
8.3 Transport, Mobility, and Partition of Pollutants From the previous discussion it is clear that pollutants may be transported away from their sources by physical, chemical, or biological means, or a combination thereof. They may also accumulate in various media. Assessment of their chemical fate requires knowledge of many factors including those
170 T ABLE
8. Effects of Pollutants on the Chemi stry of the Atmosphe re, Hydrosphere, and Lithosphere 8.4. Main types and examples of anthropogenic pollut ants
ORGANICS Pesticides Th ese include herbicides for weed control, insecticides for insect contro l, and fungic ides for fungi control. Chemically speaking, they typically belong to one of the following three gro ups: (a) chlorinated hydrocarbons, (b) organic phosphates, or (c) carbamates, as see n in the following list. Herbicides (e.g ., alachlor, atrazi ne, butachlor, cyanazine, and dioxin) Insecticides (e.g., chlordane, dieldrin, heptachlor, and DDT) Fungicides (e.g., quinones, dithiocarbamates, halogenated thiocarbamide s, halogenated and nitrated benzenes , oxathines, benzoim idazole s and pyrimidines) The most common pesticide used for many years was DDT. Thi s was discussed briefly in Chapter I and it is discussed in more detail further ahead in Section 9.1.
Organic solvents and hydrocarbons (HC) Organi c solvents are derived mainly from petroleum and are widely used in industry to dissolve non-polar (or slightly polar ) organic compounds for further processing or separation. Exampl es includ e the membe rs of the BTEX family (benzene, toluene, ethylbenze ne, and xylene), ace tone, and chlorinated solvents (e.g., chloroform trichloroeth ylene and methylene chloride). These are all generally considered VOCs. They typically have low boiling points (also high vapor pressures at ambient conditio ns); therefore, they are partia lly transferred to the atmos phere . Another source of hydrocarbon pollution involves petroleum exploitation and processing, as well as incomplete combustion or oxidation of fossil fuel s. Polychlorinated organic compounds: polychlorinated biphenyls (PCBs), polychIorodibenzodioxins (PCDD), and polychlorodibenzofurans (PCDF) Polychlorinated biphenyls (PCBs) are mixtures of biphenyls with I to 10 chlorine atoms per molecule. They are oily fluids with high boilin g point s, great chemical resis tance, and low electrical conductivity, and have been used as plasticizers in poly vinyl polymer s, insulators and coo lants in transformer s and heat exchange fluids. Dioxins and furans (see Section 9.1) are not produced intentionally but are derived from combustion processes of chlorinated aromatic hydrocarb ons, pesticides and chlorinated solvents. Trihalomethanes (T HMs) Th ese halogenated organic substances (e.g., chloroform and carbon tetrachloride) are generated as disinfection byproducts from the use of chlorine in water treatment.
Polycyclic aromatic hydrocarbons (PAHs) The y are typically produced in coal furnaces, through petroleum use and exploitation, in tobacco smoke, and other sources . Th e most important exam ples are benzo(a )pyrene and cyclo penta(cd)pyrene. Dyes, colorants, pigments, and paints Modern commercia lization strategies rely heavily on produ ct appeal. Dyes and paints play a key role in luring consumers toward certain produ cts. Unfortunately, produ ction process es involving, for examp le, textile dyes, which are complex organic molecules (generally of difficult biodegradation and some even toxic, see Section 9. 1.2), are intrinsically wasteful in the sense that a large percentage of the dye load is lost to the environment (typically in the dyeing bath) . Paints generally have an organ ic synthetic resin and one or more solvents that are comb ined with a series of inorganic pigments. When applied, paints release solvents into the atmosphere and, when dry, they eventually degrad e and/or erode, resulting in the release of dust part icles. Surfactants Chemicals with surface activity are used for a myriad of applicatio ns, includ ing deterg ents for household and industria l cleaning, and personal care products (e.g., soaps and shampoos) . Large amounts of surfactants enter ecosystems through wastewaters. Detergents are formed by com plex organic molecule s with a series of additives. They originally consisted of highly branched organic compounds but, owing to their low biodegrad ability (see Section 9.1.2), they were replaced by the more linear compounds alkyl benzene sulfonates (LAS), even though some of the substances used in their production are environmentally problem atic. Another former difficulty associa ted with detergents involved the use of polyphosphates as additives which , when discharged , enhan ced eutrophication in water. Add itives such as citrates may slowly replace phosphates. Other industrial organics Chlorofluorocarbons (CFCs) such as freons (e.g., CCh F2 and CCI3F) were traditionally used as propellants for different liquids and as refrigerants. Fortunatel y, their use has decreased drama tically owing to increased awareness of their negat ive effect on our planet' s protective ozo ne layer (see Section 8.4.I .5). Formaldehyde is used in the conservation of organs and in polymer preparation. It is toxic and its high vapor pressure makes it rather volatile. Phenols are used, for example, in general disinfection and in the manufacture of resins, medicines, industrial organic compounds, and dyes.
Transport, Mobility, and Partition of Pollutants
171
TABLE 8.4 . (Continued)
Monomers . plastics adh esives and resins are consequences of the production and use of polymers. They have a strong environmenta l impact in waters and soils due to their low biodeg radab ility. It is very commo n to find plastic residues in marin e sed iments, soils, seas hores, lakes , and rivers. Furthermore , some of the monomers used in their production are volatile and toxic (e.g., acrylamide, isocyanates, and vinyl chloride). Paper. glass and othe r solid wastes (i.e., trash) are derived from urban activities. These products can usually be recycled. Food wastes, human and animal detritus and waste, oxygen-dem anding substances These are simple or complex organic substances (e.g., carbohydrates, proteins and lipids derived from urban wastewater and agro industrial discharges) wh ich, when dissolved in water or pre sent as highl y conc entr ated co lloids, strongly promote the lowering of the dissolved oxyge n level, thu s affecting the aquatic ecosystem . See Section 8.4.2. Th ey can also be solid or se misolid wastes.
INORGA NICS Gases They are used for che mica l sy nthesis , water and waste treat ment, disinfection, neutralizations, and the like. The y can also be prod uced in atmos pheric photoch emical reactions and as undesirabl e produ cts, for example, in the combu stion of fuels and ind ustrial proce sses. The most importa nt inorganic gases are ammo nia , car bon oxides, nitrogen oxides, ozo ne and sulfur oxi des. Metals and metal cations Pb, Hg, As, Cd, Sn , Zn , and Cu are widely used in industry, particularly in metal-w ork ing and metal -plating processes, and in products such as batteries, electroni c components, certain pesticides, and medicine s. Owing to the brilliant colors of certain heav y metal co mpounds , they are also used in paint pigments, glazes, ink s, and dyes. Metalloids Arsenic is an ubiquitou s element in many ores and minerals. Toxic AS203 is typ ically produced upon smelting them . Arsenic is used for exampl e in the hardening of some metal s and alloys , and in the production of some type s of glass. Selenium is found in the sulfide ores of many heavy metal s. It is used for example in photogr aph ic baths, pigm ents, photocells, electro nic devices, arc lights, rubber vulcanizing, and as a catalys t.
Source: Rajeshwar and Ibanez, 1997.
Acids and Bases Acids and bases are amon g the most abunda nt industrial discharges. The y may alter the pH of aquatic eco sys tems and co nseq uently the life of reside nt organis ms. Anions Cyanide is produ ced mainly as a residue in the mining industry because it can selectively form stable complexes with certai n metals. It is very toxic. Perchlorate is produ ced mainl y for military and construc tion applications owing to its expl osive nature. Chroma te is derived fro m metal work ing and finishing , and from old tannery proce sses. As will be discu ssed in Section 9.1.1, Cr(VI) is highly mobile and toxic. Phosphates co me from waste nutrients (see below ) and clean ing produ cts (see above). Other important ani ons include F- , Br-, SO~- , and cr released from man y indu strial and agricultural proce sses. They are part of the salt polluti on burden in the enviro nment.
OTHER IMPORTA NT POLLUTANTS Nutrients Nutrie nts are sources of Nand P such as ammo nia, nitrites, nitrates, orthophos phates, metaph osph ates, and polyph osph ate s. The y are present in ferti lize rs and are formed during biodegradat ion of organic matter in wastewater disch arges or dead organic matter. Particles, fumes, and dusts These are produ ced , for exampl e, during inco mplete combustion proce sses, and mineral extrac tion and processing. Th ey can be organic or inorganic , and ca n form aeroso ls in whic h hydrocarbons may be present (these hydroc arbons may have toxic effects). Exa mples include coal du st and asbestos. Radionuclides There are nearly 100 radioisotopes whose beta and/o r gamm a radi ation is used in diagnosis, ther apy, or research in nuclear medi cine . As discus sed in Ch apter 3, radioactive decay kinet ics enables dating of materials. Some of the radionuclides in the environment (e.g., 3H, 85 Kr, and 14C) are emitted in gase ous or liquid waste s during the proce ssing and use of radioactive materials in nucle ar reactors. 129 1 is emitted during the nuclear fuel reprocessing . Oth ers are em itted during the explosion of nuclear weapons and nuclear accident s (e.g., 137Cs, 134Cs, 9OSr, and 99Tc) . Some other low-radiation products are intentionally used in consumer products such as ceram ic glazes, or in luminous paints in timepi ece s and diverse indic ator instruments.
8. Effect s of Pollutants on the Chemi stry of the Atmosphere . Hydrosph ere. and Lithosphere
172
mentioned below. (The corresponding characterization parameters are given in parentheses). • Organic carbon water-partitioning at equilibrium (K oc )
• Chemical partitioning between soil and water (Kd)
• Partitioning between air and water (Henry's law constant, K H .; ) • Solubility constant (K s p ) • Vapor pressures (Pi) • Partitioning between water and octanol (Ko,w) • Bioconcentration factors (see Section 9.5) To understand the factors involving partitioning between one medium and another, one must understand the concept of partition coefficient which is of paramount importance. This is discussed next.
Partition or distribution coefficients Environmental phenomena frequently involve the transfer of a substance, i (or solute) from one medium (phase 1) into another (phase 2) . The amount transferred can be quantified by measuring the equilibrium concentration of i in both media (phases). If the overall attraction between i and phase 1 is weaker than that between i and phase 2, the substance will prefer to be in phase 2. The resulting distribution or partitioning of i can be estimated quantitatively by defining a partition or distribution coefficient (K il ,2) as follows: K
il
,2
equilibrium concentration of i in phase I = equilibrium concentration of i in phase 2 (8.1)
As with any physicochemical equilibrium, a greater tendency for transfer from one phase into another is the result of a free energy decrease, as given by the generalized equation: - t..G il ,2 ex: In Kn. :
(8.2)
At constant temperature this becomes -t..G il ,2 ex: Tin Kil, 2
(8.3)
which can be rewritten by using A as the proportionality constant: -t..G i 1,2 = AT In K i l,2
(8.4)
or in the form of the familiar t..G expre ssion: t..G il ,2 = -AT In K il ,2
(8 .5)
The amount transferred depends on the type and strength of the interactions between i and the source and receptor phases. The key interaction type s are the dipole-dipole and hydrogen bonding. Surface or interface adsorption may also playa key role in certain partitioning phenomena; howe ver, only bulk interaction s (i.e., dipole - dipole and hydrogen bonding) are considered in the present discussion. The strength of the interaction between i and its host phase can be understood with a simple cavity model, based on the idea that the molecular transfer from one phase into another involves two steps (see Goss and Schwarzenbach, 2003): (a) The removal of a molecule of i from phase 1, and (b) Its insertion into phase 2, Step a requires some energy expenditure for the breaking of the cohesive force s between i and phase 1, whereas step b also requires energy for the creation of a physical space inside phase 2 (i.e., a cavity ) so as to receive the molecule of i: however, it releases energy due to the formation of new bonds between i and the molecules of phase 2. Obviously, the bigger the molecule, the more energy is required to form a larger cavity. The final energy balance determines the outcome of the proces s, and appears reflected in the value of K il ,2 . In tum, all of these steps depend on the Van der Waals and hydrogen-bond interaction forces, which become stronger with the number of interactions. For example, a non-polar compound only interacts through Van der Waals forces, whereas a monopolar compound (i.e. , an H-donor or H-acceptor) interacts through Van der Waals and hydrogen bonding forces. A bipolar compound (i.e., an H-donor and H-acceptor) interacts through Vander Waals, hydrogen donor, and hydrogen acceptor forces. Therefore, one can expect that the partition coefficient for a non-polar solute between a non-polar solvent and air will be much smaller than that of a bipol ar solute between a bipolar sol vent and air. In fact, the (dimen sionless) value of K, solvent, air for n-octane in n-hexane (i.e., non-polar/non-polar) is 9.3 x 10³, whereas that for phenol in n-octanol (i.e. , bipolar/bipolar) is 2.2 x 10⁶ . This mean s that more solute goes into the air in the first case than in the second, because the interaction between the solute and the solvent is weaker in the first case.
Air, Water, and Soil Pollution and Their Effects
173
Owing to the impossibility of compiling partition coefficients for a substance into every possible set of solvents/phases, a reference that is commonly accepted is the octanol/water partition coefficient, K io,w ' This solvent (i.e., the l-octanol) is a good reference choice as it mimics (to a reasonable extent) the solvent behavior oflipids in biota as well as that of humic substances in soils . Extensive tables of K io,w values are readily available (see for example, the CRC Handbookfor Chemistry and Physics). Such data help predict the environmental fate of many substances (see Casey and Pittman, 2005) . If one has the value of K io , w for a given substance i as well as its partition coefficient between water and a different medium (x), one can calculate the value of the partition coefficient between l-octanol and x, Ki o ,x by noting that the I:::..G values are additive , assuming that the values of A and T are constant: I:::..Gi o,x
=
-AT In K io,x =
+ I:::..G i w ,x -AT In K io, w + (-AT In K i w,x ) I:::..G io, w
(8 ,6)
Dividing by - A T one obtains In K io, x = In K io, w + In Ki w ,x e 1n K io.x = e 1n Kio.w+ln K i w .x K io ,x
=
Ki o ,wKi w ,x
( 8 .7 ) ( 8 .8) ( 8 .9)
See Example 8.1.
8.4 Air, Water, and Soil Pollution and Their Effects The pollution of air, water, or soil mayor may not be intentional. Deliberate contamination may involve a myriad of paths, such as the disposal of pollutants into water, or the control of animals, plants, or microorganisms with biocides, open-air incineration, and distorted industrial disposal practices, Non-intentional routes mainly involve biogenic and
accidental pollution. An example of the former is the production of methane by biodecay processes. Accidental contamination may result from short-term or long-term aerial transport, natural disa sters (e.g. , flooding by rivers or seas, or hurricanes), collision of trains or tankers carrying toxic chemicals , among many others, Regardless of the sources and intentions, a pollutant produced in one or another form has similar effect s. A summary of their effec ts is presented next.
8.4.1 Effects of Pollutants on the Atmosphere The main sources of air pollution include combustion processes, industrial processes, natural resource exploitation and proce ssing, commercial services (e.g., dry-cleaning or painting), and biogenic or non-anthropogenic proce sses. The most abun dant air pollutants can be grouped and classified into 10 groups (see below ). The last six groups include many substances listed on the U.S. EPA official Hazardous Air Pollutants lists (HAPs), derived from the Clean Air Act. The majority are primary pollutants (i.e., those that are directly emitted to the atmosphere), while others may form as secondary pollutants through photochemical or other reactions in the atmo sphere.
8.4.1,1 Main Air Pollutants (a) CO and C02: These two oxides are directly related to fossil fuel and biomass combustion, biogenic processes, and photochemical transformations in the atmo sphere. CO 2 is produced as a consequence of complete combustions and metabolic processes. Its main importance is that of a greenhouse gas, as discussed in Chapter 4. CO is derived from incomplete combustion processes and from
Example 8.1 Calculate the partition coefficient of aniline between l-octanol and air. Answer One looks up the K io,w for aniline and its water/air partition coefficient. Often time s such data are found in logarithmic form as log K u». (See Goss and Schwarzenbach, 2003 and any CRC Handbook of Chemistry and Physics).
log K ani lin e o,w = 0.90, and thu s K anili ne o, w = 7.94. Because K an ili ne w ,air = 7.2 X 10³ , then 4 K ani/in e o,air = 7.94 x 7.2 x 103 = 5.7 X 10
8. Effect s of Pollutant s on the Chemi stry of the Atmosphere, Hydro sphere, and Lithosphere
174
the photochemical transformation of methane and other non-methane VOC s by the hydroxyl radical generated in the atmosphere:
+ ·OH -+ CH; + H20 CH; + O 2 + hv -+ CO + H 2 + ·OH CH 4
(8.10) (8. 11)
In turn , the se products ma y react to form CO 2 in the atmosphere. The main hazard of CO is its toxicity since it can substitute dioxygen uptake in hemoglobin. (b) NOx and N20: This nomenclature repre sents the NO, N0 2, and N20 gases. The last of these is of biogenic origin (released by soil bacteria) and can be transformed in the atmosphere into NO. The latter is a combustion product through oxidation of air nitrogen at high temperatures, and can also be produced in the atmosphere by lightning. In turn, it oxidizes into N0 2, which is a precursor of acid rain and smog formation (thi s will be further discussed below). (c) SOx: Thi s nomenclature represents the S02 and S03 gases as well as the SO~ - ion, all of which are generally related to the oxidation of sulfurcontaining fuels and the oxidation ofH 2S. The latter is a toxic gas produced from the biological decay of organic matter (e.g., sulfate reduction), geothermal action, or industrial processes such as wood pulping. The oxidation of H 2S gas can take place in the atmosphere with the presence of oxidants such as ozone (plus water, probably as vapor): (8.12) In turn, S02 can react photochemically with dioxygen to yield S03: 2S0 2(g)
+ 02(g) -+
2S03(g)
(8.13)
(d) Photochemical oxidants: These are secondary pollutants because they are formed through photochemical reactions based on other primary pollutants. The main photooxidant is ozone, generated in nature by lightning or through photochemical reactions based on N0 2 as the precursor. Other photochemical oxidants include PBzN (peroxybenzoyl nitrate) and PAN (perox yacyl nitrates), both produced as a con sequence of reactions among HC , ozone, or other ambient oxidants (e.g., the ·OH radical), and NO derivatives in the atmosphere. (e) Particulates and aero sols: These are generated by wind-blown dust and wildfire s, volcanic
eruptions, incomplete combustion , industrial and mineral processing , and the formation of aerosols. The particles may be minute ocean salt crystals, soil particles, minerals, and metallic compounds, condensed hydrocarbons or other organic compounds, and sulfuric and nitric acid aero sols. Particulate matter is generally cla ssified as PM2.5 (i.e., particulate matter of diameter S 2.5 urn) and PM IO (i.e., particulate matter 2.5 u.m S d S 10 urn). The most dangerous type is the former because the body is unable to release these particles that often con sist of aerosols containing carcinogenic substances. Such particles also play a relevant role as reaction nuclei for smog formation or other photochemical reactions. Although they may comprise compounds from other air pollutant groups, it is common to con sider them separately. They are part of the criteria pollutants of the U.S. National Ambient Air Quality Standards (NAA QS). (f) Metal and metalloid compounds and vapors: The se may con sist of hazardous particulate matter or vapors of metals such as Pb, Hg, As, Ni, Be, and Cu that are generated by combustion and incineration processes, engine wear, lubricating oil component s, lamp wastes, and mineralization of geologic formations. (g) PAHs (p olycyclic aromatic hydro carbons and derivatives): Th ese are aromatic compounds of at least three fused aromatic ring s. Tho se containing up to 6 ring s are called "s mall PAH", and those containing more are "large PAH". When the molecular weight (MW) is below 230, the PAH is generally a gas, whereas for larger MW value s they are particle s. All PAHs are hazardous air pollutants (e.g., dibenzo(a)anthracene, and pyrene) and are found as products of the incomplete combustion of fossil fuels and vegetable matter, petroleum refinerie s, and in petroleum products. These compounds may have a half-life in the troposphere of 3.5 to 10 days and they may react with hydroxyl radicals, ozone, and nitro radicals, generating in the last case mutagenic nitro-PAHs. (h) VOCs (me thane and non-methan e volatile organic compounds) : These are light hydro carbons (e.g., of the BTEX family) and unsaturated hydrocarbons. Methane--one of the greenhouse gases and a natural contaminant-is also included in this ca se, as well as partially oxidi zed compounds such as formaldehyde and other aldehydes, ketone s,
Air, Water, and Soil Pollution and Their Effects
and alcohols. Sources of VOCs include incomplete combustion processes, fugitive sources, industrial processes, petroleum processing, and painting and other solvent-intensive processes. There is also a non-methane VOC contribution due to biogenic processes (i.e ., the phytochemical liberation of light hydrocarbons). The most abundant biogenic VOCs include the highly reactive isoprene (CsHs), monoterpenes (CIOH16 ) (e.g., a-, 13pinene, limonene, and d-3-carene), sesquiterpenes (C 1sHz4 ), methylbutenol, and other reactive oxygenates such as aldehydes, ketones, and esters . These emissions are influenced by five factors : (a) ambient temperature, (b) vegetation type, (c) vegetation density, (d) solar radiation, and (e) cloud coverage. These compounds are precursors of smog formation and organic aerosols, and many are also classified as HAPs. (i) Halogenated hydrocarbons and polychlorinated organic compounds: Volatile chlorinated hydrocarbons used as solvents (e.g. , chloroform, carbon tetrachloride, methylene chloride, and perchloroethylene) fall into this category. The polychlorinated dibenzo compounds dioxins and furans also belong to this group (see Section 9.1.4); they are related to the PAHs, mainly produced and emitted through incineration processes and car emissions. The CFCs (chlorofluorocarbons and similar polyhalogenated compounds) are also included here. The first two types are very hazardous compounds and the others are responsible for the destruction of the ozone layer (see Section 8.4.1). G) Radionuclides: Their presence is due to natural gas or particulate emissions from natural deposits of uranium where radon is liberated, as well as emissions from uranium processing, nuclear reactors, and fuel-reprocessing wastes. From the analysis of air pollutants and their effects, the NAAQS described above were developed by the US EPA based on requirements of the Clean Air Act. This was done by defining the criteria pollutants to measure air quality, and then by determining the acceptable concentrations under health protection criteria (known as primary standard); a secondary standard was also defined to protect public welfare and prevent environmental and property damage. The criteria pollutants for air quality thus selected were CO, Pb, NOz, 03, PMIO, PM z.s, and SOz .
175
8.4.1.2 Combustion Processes as the Main Air Pollution Source Where do trace gases originate? For the most part, they come from anthropogenic activities related to the combustion of fossil fuels, leading to the production of the main primary pollutants: CO, NOx, VOCs, and SOz. The (ideal) combustion of gasoline in internal combustion engines is expressed by the following equation: CnHm(g)
+ (n + m/4)Oz(g) ~ nCOZ(g)+(m/2)HzO(g) (8.14)
If the ratio of hydrocarbons to oxygen is not adequate, partially oxidized compounds of carbon will be emitted, together with unreacted hydrocarbons. On the other hand, an excess of oxygen favors the production of NO because of the exothermicity of the reaction and because the oxygen required comes from the air: NZ(g) + OZ(g)
U
::r:
"'C
c: tU X
o
z
a
u
10
12
14 16 18 Air-fuel ratio
20
22
8.1. The effect of air-fuel ratio on exhaust composition (not to scale; only approximate ranges are given). (Adapted from Nishikawa et al. 2000 and Stem, 1976). FIGURE
8. Effects of Pollutants on the Chemistry of the Atmosphere, Hydrosphere, and Lithosphere
176
Figure 8.1 shows the relative amounts of exhaust gases from a combustion engine at different air-tofuel ratios. The sulfur content of the fuels generates sulfur dioxide upon burning:
Combustion processes also generate many other contaminants. For example, diesel combustion produces more than 40 components including gases , vapors, and fine particles, many of them hazardous . Furthermore, mercury has been identified as an abundant contaminant from coal-burning processes . Unfortunately, incineration processes and vaporgenerating processes also produce toxic dioxins and furans, among other contaminants.
Another contribution to the greenhouse effect involves the increase in methane production. This increase is due to two factors : there is an increasing demand on rice production for a growing population, and methane is produced in the rice pads; and there is also intensive livestock breeding, which is a source of concentrated methane production. (On a humorous note, in 2003 New Zealand considered applying a special tax that would be paid by farmers . This tax was to be derived from the high methane content of the flatulence gases of their livestock and its possible contribution to the greenhouse effect. The proposal was known as the "flatulence tax." It was later suggested that most of the methane from livestock probably comes from burping . .. and so it could have been considered as the "burping tax" instead. The proposal was dropped) .
8.4.1.3 The Greenhouse Effect
8.4.1.4 Smog Formation
{S}
+ 02(g) --+
S02(g)
(8.17)
An additional effect of combustion gases is the Smog formation-a local air pollution problem-is strong anthropogenic contribution to the greenhouse a consequence of photochemical reactions based on effect, a global air pollution problem whose princi - primary pollutants discharged into the atmosphere. ples are discussed in Section 4.5. This is primarily For this effect to occur, the following factors must be due to the augmented emissions of CO 2 and NOx present: high solar radiation, dioxygen, NOx, S02, into the atmosphere, promoted by unregulated in- hydrocarbons, and particles that serve as reaction creases in population, transport, and industrial activ- nuclei. As stated earlier, HC, NOx , and S02 can ity. The gas of major concern is CO 2 because its con- be provided through anthropogenic and biogenic centration has been steadily increasing over the last sources. Smog has many deleterious effects on hu100 years as a result of the combustion of fossil fuels. man health as well as on plants and materials. The most important reaction in the initiation of The great majority of the anthropogenic emissmog formation is the production of ozone, a strong sions from CO 2 are related to energy production. oxidant generated through the N02 photodissociaThe current concentration of this gas is approxition cycle known as the null cycle: mately 370 ppm as opposed to approximately 280 ppm at the beginning ofthe 19th century. Because an N0 2(g) + hv (A < 430 nm) --+ NO(g) + O(g) (8.18) increase in CO 2 concentration increases the green(8.19) house effect, some estimates indicate that by dou- O(g) + 02(g) + M(g) --+ 03 (g) + M(g) (8.20) bling the concentration of this gas , the Earth's sur- 03(g) + NO(g) --+ N0 2(g) + 02 (g) face temperature could increase 3.5°C. where M represents any third atom or molecule Other potential greenhouse pollutants are the needed to absorb the excess energy of the intermechlorinated alkyl compounds such as tetra- diate formed. Ozone is a pollutant of the urban trochloromethane, chloroform, the chlorofluorocar- posphere, but because it is not directly released, it is bons (CFCs and their substitutes: the halon s (e.g., called a secondary pollutant. Its formation depends CBrCIF2) , the hydrochlorofluorocarbons, HCFCs on the photolysis rate and on the ratio of N021N0. (e.g ., C2H4HCl), and the hydrofluorocarbons, HFCs The contribution from hydrocarbon emissions con(e.g ., CF3CH3). The CFCs are double trouble be- sists in the formation of free radicals after their reaction with strong oxidants such as OH radicals, cause they are the principal agents in ozone depleatomic or molecular oxygen, nitric oxide or ozone, tion and are greenhouse gase s as well. Although or even photo dissociating in the presence of sunthey are trace gases , they are very efficient IR ab- light . (Note : all the species in the remainder of this sorbers in the atmosphere, as shown in Table 4.3. section are in the gas phase, but their physical state
Air, Water, and Soil Pollution and Their Effects
177
is omitted for the sake of clarity. ) O· + H20 -.. 2·0H
Combination reaction:
(hydroxyl radical)
(8.21)
RH + ·OH -.. R· + H20 (alkyl radical) RH + O· -.. RO· + H" (alkoxyl radical)
(8.22b)
R· +0 2+M
(8.22c)
--+
ROi+M
(peroxyl radical)
(8.22a)
ROi + RH -.. ROOH + R·
(8.22d)
ROi + NO -.. RO· + NOi
(8.22e)
RH(alkcne) + 0 3 --+ ·OH + product s
(8.22f)
ROR + hv
--+
RO· + R·
(8.23)
In tum, these free radicals may react with atomic or molecular oxygen, nitric oxide , and nitrogen dioxide without necessarily sacrificing the ozone present. A series of chain reactions then take place, which depend on radical initiation, propagation, and termination. These are aleatory proce sses where reactions occur among the species as they come upon each other, depending on the individual reactivit ies. The oxidation of hydrocarbons in the termination reactions leads to aldehydes, which may be further oxidized to form aldehyde peroxides, peroxides, hydroperoxide s, and peroxyacids: RO· + 0 2 -.. R' CHO + HOi RCHO + ·OH
(hydro peroxy l radical)
(8.24)
RCO· + H20 RC(O )Oi (acylperoxyl radical)
(8.25)
--+
RCa· + O2 --+ R· + O2 + M --+ ROi + M
(8.26)
ROi + NO
(8.28)
--+
(8.27)
RO· + NOi
ROi + O2 --+ RO· + 0 3
(8.29)
H202 + 0 2 2"OH -.. H202
(8.30)
2HOi
--+
(pero xide)
(8.31)
Some termination reactions also include the forma tion of acids, alcohols, and nitro compounds. They may take place through combination or disproportionation (dismutation) reactions: 2ROi
--+
ROaR + 0 2
(organic peroxide ) (8.32a)
"OH + N0 2 + M --+ HN03 + M R-O-CH20i + HOi --+ R-D-CHO + 0 2 + H20 ROi + HOi
--+
(acid) (8.32b) (ester)
(8.32c)
ROOH + 0 2 (organic hydroperox ide) (8.32d)
RO· + NO/N0 2 --+ RONO /RON0 2 (nitro compounds) (8.32e) ROi + NO
--+
RON02
(8.32f)
2RO·
ROaR
~
(organic peroxide)
(8.33)
Dismutation or disproportionation: RO·
+ RO·
~
R'CH=O + R-oH (aldehyde
+ alcohol)
(8.34)
Among the very important secondary pollutants related to smog are the peroxy-nitro compounds, PAN (peroxyacetyl nitrate) and PBN (peroxybenzylnitrate), which are responsible for the phenomenon of eye redness in polluted cities. Ozoneas well as these organic peroxides-is part of the end of the chain mechanisms of photochemical smog. Considering acetaldehyde as the initial organic reactant we have:
+ ·OH ~ CH 3CO· + HzO CH3CO· + Oz + M ~ CH 3COO; + M CH3COO ; + NO; + M ~ CH 3COOONOz(PAN) + M CH3CHO
(8.35 ) (8.36) (8.37)
In summary, the main products derived from these photochemical reactions are 0 3, peroxides (e.g., PAN, PBN , and H zO z), hydroperoxides, aldehydes, ketones, alcohols, nitro compounds (alkyl and benzyl nitrates and nitrite s), and acid s such as sulfuric, nitric, and nitrous acid.
8.4.1.5 Stratospheric Ozone Destruction or the Ozone Hole In the winter of 1984, massive losses of stratospheric ozone were detected in Antarctica over the South Pole (Halley Bay) . This ozone depletion is known as the ozone hole. We know now that it also forms over the Arctic, although not as dramatically as in the Antarctic. Stratospheric ozone protects life on the surface of the Earth by screening harmful UV radiation coming from the sun through a photodissociation mechanism (see Chapter 4). The ozone hole is geographically defined as the area where the total ozone amount is less than 220 Dobson Units (DU) (see definition in Chapter 4). The ozone hole has steadily grown in size (up to 27 Mkrrr' ) and length of existence (from August through early December) over the past two decades. As a reference to the size of the "hole," the continental United States has an area of'v .d Mkm -. Figure 8.2 shows a comparison of the ozone distribution over
8. Effects of Pollutant s on the Chemi stry of the Atmo sphere, Hydro sphere , and Lithosphere
178
Solid line.average before 1984 Broken line. earlySpring 2001
30
25
~
or
.a ~
't:l
Sunlight also drives the following reactions:
Mechanism 1:
+ CIa" + M ~ Ch02 + M Cl 202 + hv ~ Cl" + Cl0 2 Cl02 + M ~ Cl" + O 2 + M (Cl" + 0 3 ~ CIa" + O 2) x 2 CIa"
20 15
10
(8.44)
(8.45) (8.46) (8.47)
The net reaction is
5
(8.48 ) 10 20 Ozone Pressure, mPa
Me chanism 2:
FIGURE 8.2. Ozone distribution over Antarctica in different years .
Antarctica in two different years (before 1984 and in 2001). During the winter season in the South Pole, a strong circumpolar wind develops in the middle to lower stratosphere. Such strong winds , known as the polar vortex, isolate the air over the polar region. In the winter there is no sunlight and the air contained in the vorte x becomes very cold (i.e., temperatures below -80°C) leading to the formation of the polar stratospheric clouds (PSG). The se PSG are composed not only of water but also of nitric acid trihydrate. It is now an established fact that anthropogenically generated chlorine and bromine compounds in the atmosphere are responsible for the decrease in ozone concentration observed over Antarctica and over the North Pole. Such compounds form HCl and CION02 (and the corresponding bromine compounds), which act as chlorine (or bromine) reservoirs. They are then converted into more active forms of chlorine on the surface of the PSG, according to the following scheme:
+ ClON02 ~ HN03 + el 2 CION0 2 + H20 ~ HN03 + HOCI HCl + HOCI ~ H20 + Ch N20S + HCl ~ HN0 3 + CIaNO N 20s + H 20 ~ 2HN03 HCl
(8.38) (8.39 ) (8.40) (8.41 ) (8.42 )
The destruction of ozone requires atomic chlorine produced by sunlight: Cl 2 + hv
~
2Cl"
(8.43)
+ Bra" ~ Br" + Cl' + O 2 Cl' + 0 3 ~ CIa" + O 2 CIa" Br'
+03~
BrO"
+ O2
(8.49) (8.50) (8.51)
The net reaction is the same as above: (8.52) These catalytic cycles are largel y respon sible for the depletion of ozone. One chlorine atom may destroy more than 100,000 ozone molecules before it is tran sformed into a non-reactive species. Despite the substantial reduction of chlorine and bromine compounds released into the atmo sphere as a result of the Montreal Protocol, thi s has not shown any significant impact on the reduction of the size of the ozone hole. If such a trend continues, it may still take some half a century for the recovery of ozone to the levels it had prior to 1984.
8.4.1 .6 Acid Rain We may think of rain as a way that nature has to clean the atmosphere by washing-off substances from it. The cleaning process is carried out in two forms: one, by dissolution of the soluble compounds, and the other by sweeping away suspended particles. Under "normal" conditions the pH of rain is acidic (approximately 5.7) due to the dissociation of dissolved carbon dioxide in water, as discussed in Chapter 6: CO 2 + H20 ~ HCO;
+ H+
(8.53)
However, in polluted environments there are also oxides of sulfur and nitrogen pre sent, which are stronger acid s than carbon dioxide. When these oxides dissolve in rain droplets, the pH reache s values lower than 5.7 , thu s forming what is known as acid rain or - in a broader sen se - acid deposition.
179
Air, Water, and Soil Pollution and Their Effects
Sulfur dioxide from the combustion of sulfurcontaining fossil fuels (e.g ., diesel oil and coal) is oxidized in the atmosphere to form sulfur trioxide that reacts with water to form sulfuric acid. S02 +0'
~
S03
(8.54)
S03 + H20 ~ H2S04
(8.55)
H2S04 ~ HS0 4 + H+
(8.56)
Although the oxidant in combustion reactions is dioxygen, nitrogen oxides form because dioxygen comes from air which contains approximately 78% nitrogen. The following reaction scheme explains the formation of nitric acid, another component of acid rain: N2+02
~
2NO'
(8.57)
2NO' + O 2 ~ 2NOi 3NOi + H20 ~ 2HN03 + NO'
(8.58)
HN0 3 ----+ NO;- + H+
(8.60)
(8.59)
In addition to low pH values, acid rain containing nitrates can oxidize materials such as copper or iron . Other consequences of acid rain include the deterioration of marble or any carbonated exterior material due to the decomposition reaction: CaC0 3(s) + 2H+ ~ CO 2(g) + H20(1) + Ca2+ (8.61) Volcanic eruptions are natural sources of sulfur oxides, and lightings are natural sources of nitrogen oxides and ozone, while combustion processes are the main anthropogenic sources of these two pollutants.
8.4.1.7 Indoor Pollution Air quality in homes and workplaces is affected by human activities, construction material, underground minerals, and outside pollution. The most common indoor pollutants are radon, carbon oxides, nitrogen oxides, tobacco smoke, formaldehyde, and a large variety of organic compounds. Indoor atmospheres can also be contaminated with fine particles such as dust, aerosols (from spray cans), fungal spores, and other microorganisms. Water vapor itself is not usually considered a pollutant, but the amounts generated in closed spaces such as in kitchens (that use gas for cooking) can favor the growth of house dust mites, moulds, and fungi, which in many cases lead to allergic reactions.
(a) Radon Why is radon, a noble gas, a pollutant? Although Rn is a member of the noble gas family, 222Rn is a radioactive gas (half-life = 3.8 days) that decays first into 218pO (half-life = 3 min), ending in 210Pb (half-life = 22.3 years). Radon enters a building from the subjacent ground, either carried by a convective flow of soil gas or dissolved in the groundwater. Indoor moderate airborne concentrations of radon daughters can increase considerably in the presence of particles such as those found in cigarette smoke. The size of these particles (now radioactive) allows them to reach the lungs and remain there, increasing the probability of consequences in health. The amount of radon that enters a building depends on the geology of the zone, the concentration of the gas, the pathways into the building and its ventilation rate. The US EPA recommended limit indoor radon concentration is 4 pico CurieslL. (b) Carbon oxides Carbon dioxide is not a toxic gas. However, when individuals are exposed for prolonged periods to 1.5% CO 2 (vol/vol in air), this apparently causes metabolic stre ss. Exposure to 7-10% will produce unconsciousness within minutes. Carbon monoxide is a toxic gas that binds hemoglobin more efficiently than dioxygen, and therefore its presence decreases the oxygen uptake by cells, ultimately leading to asphyxia. These two pollutants can be found concentrated inside buildings due to unvented heaters, leaking chimneys, furnaces, and stoves, in addition to automobile exhaust from garages, and tobacco smoke. These are among the most common pollutants that cause deaths in underdeveloped countries during winter, when people warm themselves using wood stoves. (c) Nitrogen oxides Most health effects associated with nitrogen oxides (NOx) are attributed to nitrogen dioxide. The main source of NOx in homes can be traced to gas stoves and heaters, where combustion takes place to produce heat. The combustion first produces NO, which then oxidizes rapidly to N0 2. High levels of N02 (approximately 150 ppm) can be lethal, while concentrations in the range of 50-150 ppm can produce lung disease. Lower concentrations may lead to eye, nose, and throat irritation. (d) Tobacco smoke
180
8. Effects of Pollutants on the Chemistry of the Atmosphere, Hydrosphere, and Lithosphere
Tobacco smoke contains both particulate matter (see Chapter 4) and a large number of gaseous and vapor components. These components include CO, CO 2, NO, N02 , acrolein, pyridine , methyl chloride, acetaldehyde, formaldehyde, and dimethylnitrosamine. Particulate matter comprises, for example, nicotine, pyrene, benzo(a)pyrene, naphthalene, methyl naphthalene, aniline, and nitrosonomicotine. The health effects associated with direct or indirect (i.e., passive smoking) exposure are multiple, but their discussion is beyond the scope of this chapter. This is even more worrisome because it is not only the smoker but the non-smoker as well who is exposed to all these toxic substances; in fact, the side stream smoke (which also reaches all the nonsmokers in the room) may contain higher concentrations of the toxicants than the mainstream smoke. Strict prohibitions, therefore, have been established for smoking in public spaces. (e) Formaldehyde Formaldehyde is an important industrial chemical for the production of synthetic resins. These resins are applied primarily as adhesives in the production of a large number of consumer products and construction materials that end up in homes . Other sources of indoor formaldehyde include ureaformaldehyde foam insulation, textile additives, as well as combustion and tobacco smoke. Formaldehyde is one of the many VOCs present indoors and it is considered the most abundant among them . It has important toxic effects in the 0.1-5 ppm concentration range. (f) Other volatile organic compounds Most of the 300+ organic vapors that may be found in indoor pollution are derived from paints, paint strippers and other solvents, wood preservatives, aerosol sprays, cleansers and disinfectants, moth repellents, air fresheners, in addition to fuels and automotive products, and dry-cleaners. Many of these compounds are halogenated hydrocarbons, PAH, ketones and aldehydes, which exhibit different degrees of toxicity. (g) Particulates As stated above , indoor pollution has a high content of particulate matter (solids and aerosols), including that in tobacco smoke. Particulates may originate inside a closed area or drift inwards into a building from the outside. Other important sources include combustion processes inside the homes,
where carbon and soot particles are generated from sources such as fireplaces, woodstoves, and heaters. Particulate matter also arises from contaminated soil and dust, deteriorating paint, and damaged insulation and floor tiles. These last two are key sources of Pb and asbestos, two of the main toxic pollutants. Additional sources of particles and aerosol s include the pesticides used inside or outside residences.
8.4.2 Effects of Pollutants on the Hydrosphere The effects of pollutants on the hydrosphere are quite notorious. For example, an estimated 40% of the U.S. waterways are too polluted for swimming or fishing . Thus, it is important to understand the sources of these pollutants, their interactions and effects. The main sources of water pollutants are point and non-point sources: for example, domestic sewage, industrial discharges, agricultural and livestock breeding runoff, accidental spills, storage tank leaks, urban runoff, and contaminated rain. The main industrial discharges come from the following industries : chemical, petroleum and petrochemical, beverages and food, paper, textile, sugar, mining and metallurgy, tannery, fishing and fish processing, and fertilizer production. Many thousands of chemicals enter water bodies from anthropogenic sources. These chemicals have significantly different properties, which makes it impossible to monitor or measure such a variety. Consequently, when these water pollutants are considered, they are generally grouped into substance types, and a priority or indicator substance is used to estimate their presence. The main types of water pollutants and their sources are listed in Table 8.5.
8.4.2. J Oxygen-Demanding Materials Anything that can be oxidized in the receiving water with the consumption of dissolved molecular oxygen is termed oxygen-demanding material. This usually consists of biodegradable organic matter (see Chapter 9), but it may also include certain inorganic compounds. The consumption of dissolved oxygen (DO) poses a threat to fish and other higher forms of aquatic life that require it for respiration. The critical level of DO varies greatly
Air, Water, and Soil Pollution and Their Effects TABLE
181
8.5. Principal water pollutants Non-point sources
Point sources Water pollutant type
Urban
Oxygen-demanding substances (BOD) Nutrients Suspended panicles/sediments Salts Toxic metallic and metalloid compounds Surfactants Acids and bases Toxic organic substances Toxic inorgan ic salts Oil and grease Plastic, polymers, etc. (trash) Pathogens Heat
* * *
Industrial
* * * * * * * * *
*
*
among species . For example, brook trout require about 7.5 mg/L of DO, while carp may survive at 3 mgiL . Oxygen-demanding materials in domestic sewage come primarily from human waste and food residues. Particularly noteworthy among the many industries that produce oxygen-demanding wastes are the food processing and paper industries. Almost any naturally-occurring organic matter such as animal droppings, crop residues, or leaves that reach the water from non-point sources, contribute to DO depletion. The amount of oxygen required for oxidizing a substance to carbon dioxide and water may be stoichiometrically calculated if the chemical composition of the substance is known. In contrast, the
Field, agricultural , other runoff
Urban runoff
* * * *
* * * * * * * * * * *
* * *
* *
chemical oxygen demand (COD) does not rely on knowledge of the chemical composition of the substances in the water. The COD test measures the amount of dioxygen required to achieve a complete chemical oxidation of I L of sewage sample using a strong chemical oxidizing agent (i.e., Cr6+ , typ ically as dichromate in 50% sulfuric acid) mixed with a water sample and then heated to I50 aC for 2 h. The difference between the amount of oxidizing agent at the beginning and at the end of the test is assumed to have been used for the complete oxidation of the oxidizable contaminants present in the aqueous sample, and is used to compute the COD, reported in mg/L of dioxygen (see Examples 8.2 and 8.3). Since this analysis produces toxic chromium
Example 8.2 A general reaction that occurs in the COD test is represented as follows: z CnHaObNc + dCrz07-
+ (8d + e)H+ ~ nCOz+
a
+ 8d 2
3e
HzO
+ eNHt + 2dCr3+
where organic nitrogen is assumed to be in its most reduced oxidation state (Le., -3). With this information, show that the number of moles of dichromate, d required for the oxidation of one mole of the organic substance, is given by: d = 2nl3 +a16 - bl3 - el2 Answer From the oxygen balance,
b+7d=2n+
Solving for d one obtains
3d = 2n - b a
+ 8d
2
- 3c
+ a/2 -
(3/2)c
and
d = 2n/3
+ a/6 -
b/3 - c/2
8. Effect s of Pollutants on the Chemistry of the Atmosphere, Hydrosphere , and Lithosphere
182
Example 8.3 Assuming acidic media, (a) Write the half-reaction for the reduction of one mole of dichromate ions into Cr (III). (b) Write the half-reaction for the reduction of one mole of dioxygen in water. (c) If in a real COD test one required 1 mole of dichromate for the oxid ation of a given amount of organic matter, how many moles of dioxygen would this be equivalent to?
residues, alternative oxidants are actively sought, for example Mn(III). If oxidation of the compounds in wastewater is carried out by microorganisms, the dioxygen consumed is known as the biochemical oxygen demand (BOD). Dioxygen is consumed by heterotrophs that use organic matter as food and energy source (carbonaceous BOD, or CBOD) and by autotrophs, such as nitrifying bacteria, for the oxidation of NHt to nitrite and nitrate (i.e., nitrogenous oxygen demand or NOD). During the BOD test, a mixed population of microorganisms oxidizes organic and inorganic compounds in the dark at 20°C over a period of 5 days (and therefore it is often called the BODs test). The corresponding reaction is written as follows : CnHaObN c + (n + al4 - bl2 - 3c14)02 ~ nC0 2 + (a12 - 3c12)H20 + cNH 3 (8.62a) NOD is significant in nitrified wastewater effluents. The reaction is: NHt
+ 202 ~
NO;-
+ H20 + 2H+
(8.62b)
One must inhibit nitrification in order to distinguish between carbonaceous and nitrogenous BOD. Sewage discharged into surface waters should have values for COD and BOD that fall below the established limits. Values which are above these limits indicate that the organic content of the sewage is too high for its discharge into receiving waters . Such a discharge could cause a sub stantial reduction in the oxygen level of the water with serious consequences for aquatic organisms. In practice, the quality of sewage effluents varies enormously from country to country and from place to place. Because of the high cost of sewage treatment, nothing more is done other than what the regulation-requires . This even occurs in developed countries.
Answer (a) Cr20~- + l4H+ + 6e- -+ 2C~+ + 7H20 (b) O 2 + 4H+ + 4e- ~ 2H 20 (c) Then 6/4 (or 1.5) times that required for the dichromate is the number of moles of O 2 needed for oxidation of the organic matter (i.e., for removal of the same number of electrons as dichromate).
There are thousands of naturally-occurring organic compounds, not all of which can be degr aded with equal ease . Simple sugars and starches are rapidly degraded; cellulose (a polysaccharide) degrades much more slowly, and hair and fingernails (fibrous proteins) are almost non-degradable in the BOD test or in normal wastewater treatment. Other compounds lie between these extremes. Microorganisms are limited in their ability to utilize organic compounds as carbon and energy sources. Consequently, many organic compounds can only be degraded by a small group of microorganisms.
8.4.2.2 Nutrients Nitrogen and phosphorus-two nutrients of primary concern-are considered pollutants because they are essential nutrients for living organisms to grow. Thus, they must be present in rivers and lakes to support the natural food chain. Problems arise when these nutrient levels become excessive and the food web is grossly disturbed, causing some organisms to proliferate at the expense of others. As discu ssed in Section 6.1.3 .2, excessive nutrient concentrations often lead to eutrophication-a process in which lakes gradually become shallower and more productive through the introduction and cycling of nutrients. Oligotrophic lakes have a limited supply of nutri ents and a low capacity to support a food web. The se lakes gradually pass through the mesotrophic and eutrophic stages, as nutrient availability increases and algal growth supplies food for higher organisms. A more productive lake will usually have a higher fish population, but water quality is reduced as algal
Air, Water, and Soil Pollution and Their Effects
death and its decomposition is sufficient to deplete dioxygen. Senescent lakes have thick organic sediments and rooted plants in abundance until they fill up completely. The time for this process to occur depends on the original size of the lake and on the rate at which sediments and nutrients are introduced. In some lakes the natural eutrophication process is so slow that thousands of years may pass with little change in water quality. Cultural eutrophication is caused when human activity speeds natural processes by increasing the rate at which sediments and nutrients are added to the lake. Some major sources of nutrients include phosphorus-based detergents, fertilizers , and food-processing wastes. Thus , lake pollution can be seen as the intensification of a natural proce ss.
183
Untreated sewage is a major public health hazard because it is a major pathway in the spread of many infectiou s diseases. The excrement from humans and other animals infected with certain pathogens (e.g., diseas e-causing bacteria, viruses, and other parasitic organisms) cont ains large numbers of these organisms or their eggs. Even after the symptoms of disease disappear, an infected person or animal may still harbor low populations of the pathogen, thus continuing to act as a disease carrier. If wastes from carriers contaminate drinking, swimming, or bathing water or food, the pathogens can gain access to and infect other individuals (Table 8.6). Before the connection between disease and sewage-carried pathogens was recognized in the mid-18th century, disastrous epidemics were common. For example, typhoid fever and cholera killed
thousands of persons in different cities. Today, public-health measures have prevented this disease cycle; examples include purification and disinfection of public water supplies with chlorine or other agents, sanitary collection and treatment of sewage wastes, and maintenance of sanitary standards in all facilities where food is processed or prepared for public consumption. Nevertheless, in many parts of the world-and largely because of poor sanitation regarding water and sewage-a significant portion of the world 's population is chronically infected. More than 250 million new cases of water-borne disease are reported each year, about 10 million of which result in death (about 50% of these are children under five). The routine examination of environmental samples for the presence of intestinal pathogens is often a tedious, difficult , and time-consuming task. Thus, it has been customary to tackle such examinations by looking for certain microorganisms whose presence indicates that pathogenic microorganisms may also be present. For example, coliform bacteria, which normally occur in the inte stines of all warmblooded animals, are excreted in great numbers in feces. In polluted water, coliform bacteria are found in densities roughly proportional to the degree of fecal pollution. Many countries have adopted coliforms as official standards for drinking water, recreational bathing waters, wastewater discharges, and various foods. For example, the average density of fecal coliforms in human excreta is 1.3 x 10⁷/g . The US EPA has set a standard of no detectable coliforms per 100 mL in drinking water. In contrast, the Clean Water Act indicates 200 fecal coliforms/1 00 mL for wastewater discharges.
TABLE 8.6. Infectious agents present in polluted wastewater
8.4.2.4 Suspended Solids
8.4.2.3 Pathogenic Organisms
Infectious agent
Disease
Salmonella typhi (bacteria) Vibrio cholerae (bacteria) Salmonella SP (bacteria) Escherichia coli (bacteria) Hepatitis A virus Shigella sp. (bacteria) Entamoeba histolytica (protozo an) Giardia intestinales (protozoan) Roundworms , flatworms
typhoid fever cholera salmonellosis diarrhea infectious hepatiti s dysentery dysentery giardiasis several parasitic diseases
Wastewater contains a wide variety of suspended solid materials. The classification of the various solids is shown in Figure 8.3. Total solids are obtained by evaporating a sample of wastewater to dryness at 103-105°C . A filtration step separates the total suspended solids (TSS) , which remain on the filter, from the total dissolved solids (TDS), which pass in the filtrate. The residue that remains after the TS are ignited at 500 °C is called the total fixed solids (TFS), and they represent the inorganic salts in the sample. The solids that are volatilized
184
8. Effects of Pollutants on the Chemistry of the Atmosphere, Hydrosphere, and Lithosphere Total solids, TS Total suspended solids, TSS Volatile suspended solids, VSS
Total fixed solids, TFS
Total volatile solids, TVS
Total dissolved solids, TDS Volatile dissolved solids, VDS
Fixed dissolved solids, FDS
Total fixed solids, TFS
FIGURE 8.3. Types of solids in water and wastewater.
and burned off are the total volatile solids (TVS) and they represent the organic matter, including microorganisms. As can be seen in Figure 8.3, both TSS and TDS include volatile and fixed solids . They are all reported as mg/L. The term settleable solids applies to suspended solids that settle under quiescent conditions because of the influence of gravity. Their measurement is important in engineering practice to determine the need for sedimentation units and the physical behavior of waste streams entering natural water bodies. Colloidal particles do not settle readily and cause the turbidity found in many surface waters. In turbid waters, most of the harmful organisms are exposed to the action of a disinfectant. However, in cases in which turbidity is caused by municipal wastewater solids, many of the pathogenic organisms may be encased in the particles and protected from the disinfectant. For this and for aesthetic reasons, the U.S. Environmental Protection Agency has placed a maximum contaminant level of 0.5 to 1.0 units of turbidity in public water supplies, depending on the treatment process. Turbidity is a measure of the light-transmitting properties of water. The measurement of turbidity is based on comparison of the intensity of light scattered by a sample to the light scattered by a reference suspension under the same conditions. The most widely used standards are prepared with hydrazine sulfate and hexamethylenetetramine in water, and give rise to the Formazin Turbidity Units (FTU). The amount of suspended matter in wastewater increases with the degree of pollution. Sludges
represent an extreme case in which most of the solid matter is suspended. The determination of suspended solids is therefore valuable in the analysis of polluted waters . It is one of the major parameters for evaluating the "strength" of domestic wastewaters and for determining the efficiency of treatment units.
8.4.2.5 Oil and Grease Spills Oil spills represent an important hydrocarbon input into oceans, surface water, and groundwater. They are produced by accidents (e.g ., ship, train, or truck wreckages), lack of maintenance (e.g., corroded pipelines), neglectfulness (e.g ., car oil changes that end up in the sewage), and the like. Oil spills imply the discharge of mineral oils and petroleum products. They are composed of low- and highmolecular weight aliphatic, aromatic, and naphtenic (mono and polycyclic) hydrocarbons, as well as high-molecular weight unsaturated heterocyclic compounds (e.g., resins and asphaltenes). Generally, the oil will spread in the bodies of water in dissolved, film, emulsion, or sorbed fractions, and there will be a transformation ofsome of these compounds through microbiological, chemical, and photochemical processes. The lighter fractions (VOCs) will tend to volatilize, whereas the most persistent will be the heavy high-molecular weight PAHs. The effects of oil in aquatic media are multiple. Besides physically affecting aquatic organisms, many of these substances are toxic and carcinogenic. Oil-transporting ship wreckages represent a
185
Air, Water, and Soil Pollution and Their Effects
serious danger to the physical environment and living species surrounding the accident area. As an example, it is estimated that the tragic accident involving a major oil-spill on the coa st of Spain, back in 200 I, will still take many year s to clean-up. Another effect of oil spills con sists in the formation of oil emulsions that block the entrance of light into bodies of water, with the concomitant decrease in biological activity and cleansing action. Lastly, oil-polluted water is very negative to the public eye. One effect of immediate concern is the fact that the large majority of water treatment plant s throughout the world use chlorine as a disinfecting agent. Unfortunately, chlorine is capable of halogenating many organic materials (including oil component s) which produce harmful organochlorinated compounds.
8.4.2.6 Metallic and Metalloid Compounds As discussed earlier, many metal s and their ions have become wide spread in the environment through many human activities, the main ones being industrial processes (e.g., mining and smelting). The mining of metal s may bring about considerable am ounts of mine drainage, deleterious to the surroundings. Thi s point is discussed below (Section 8.4.3). As discussed in Chapters 3 and 6, the availability and chemical form of aqueous metal species depend on several factor s, the most important of which are, as a rule, the pH of the solution and the nature and concentration of complexing agents present. As mentioned in those chapters, the ensuing distribution of species (speciation) plays a key role in their effects (e.g., toxicity, as discussed in Chapter 9). Prediction of such effects with laboratory tests becomes increasingly difficult when the metal-containing stream undergoes drastic changes during its normal course (e.g., mixing with acid rain) or when it is discharged into receiving waters with very different pH values . Metal s may become "locked up" in the bottom sediments of aquatic systems by chemical reactions, where they may remain for many year s. However, metal solubility increases if the pH falls and they become more mobile. In fact, one of the knock-on effects of acid rain is the tran sport of metals to lower levels in the soil profile , where they may damage deep-rooted plants and contaminate groundwater. A
further example of the effect of pH is the metal ion uptake by crops which can multiply several time s by a one unit pH decrease. In addition to health concerns, the presence of metal ions in water can bring about side effects such as bad taste, increase in turbidity and coloration, staining of fixtures in contact with water, and the like. Iron and manganese ions may also promote bacterial growth with its concomitant drawbacks (e.g., foul smell). Fortunately many methods of treatment are available, as discus sed in Chapter 10.
8.4.2.7 Radionuclides Aside from accidents in nuclear facilitie s (e.g., Chernobyl), the main source of anthropogenic radioactive pollution is probably derived from medical applications. Documented reports of radioactive residue mismanagement indicate that sometimes these substances end up in garbage dumps, with the consequent danger of public expo sure . The main radioactive isotopes in medical applications are listed in Table 8.7. The main natural source of dan gerous radioactivity is probably Rn. (See Section 8.4.1).
8.4.2.8 Detergents (Surfactants) and Nutri ent Enri chm ent The most common synthetic type of detergent used up to the late 1960s was an alkyl aryl sulfonate that turned out to be very slowly biodegradable due to its branched structure (see Section 9.1.3). This problem is now avoided by replacing the branched alkyl part with less branched (or more linear) structures such as in the anionic detergent, dodecyl benzenesulfonate, ABS. In the formulation of a commercial product, the detergent molecule itself constitutes only between I13 and I110 of the total preparation. Polyphosphate anions (e.g. , P30I05-) are still widely used in some parts of the world as detergent builder s, because they can complex the Ca and Mg ions that are responsible for the hardness of water and for the inability of detergents and soap s to exert their surfactant effects. The complexing ability of polyphosphate can be readily understood in Figure 8.4. As discussed above , exce ssive algae growth (eutrophication) results when phosphates from detergents and nutrients enter surface waters. Upon
186
8. Effect s of Pollutants on the Chemistry of the Atmosphere, H ydrosphere, and Lithosphere
TABLE 8.7. Radioacti ve isotopes used in medicine' Isotope name
Symbol
Half-life
Use
Cobalt-60 Radium-226 Iodine-I 3 I Cobalt-57 Phosphorus-32 Sodium-24 Chromium -5 1 Technetium-99 Americum-24 I Cerium-141
6OCo 226Ra 131I 57Co 32po 24Na 51 Cr 99Tc 241Am 141Ce
5 years 1590 years 8 days 270 days 14 days 15 hours 28 days 6 hours 432 years 32.5 days
Europium-ISS Gallium-6 8
155Eu 68Ga
4.73 years 68.1 min
Thallium-201 Ytterbium-I69
20ln 169Yb
3.04 days 32 days
Radiation therapy for cancer Radiation therapy for cancer Thyroid function. cance r therapy, liver function Vitamin 8-1 2 uptake Skin cancer detection Detection of blocked arterie s Red blood cell volume Images of brain. lung. heart. liver, kidney Osteoporosis detection , heart imaging Gastrointestinal tract diagnosis, measuring regional myocardial blood flow Osteoporosis detection Study of thrombo sis and atherosclerosis. PET imaging. dete ction of pancreatic cancer, attenu ation correction Radionuclide injected into patient s to allow analysis of heart conditions Gastrointestinal tract diagnosis
' Note: The principles of radioa ctivity and associated definitions are discussed in Section 3.4.
death of the algae , their microbial degradation can dramatically increase the water's oxygen demand and thus lower its quality by reducing its lifesustaining abilit y. Furthermore, algae impede the acce ss of incoming light into lower regions of the water reservoirs and thus affect their natural photochemical processes. Polyphosphates can act as ligands and as such they show additional environmental effect s, including alteration of metal ion solubility and the dissolution of solid natural oxides (see Section 8.4.3).
8.4.2.9 Salts A high concentration of salts is discharged by many indu stries . Furthermore, the use of salt on roads during winter cau ses high salt levels in urban runoff, especially during the spring snowmelt. Of particular concern in arid regions, where water is extensively used for irrigation, is the fact that water picks up salts every time it passes through the soil on its way back to the river. In addition, evaporation causes the salts
I
o
I I o I
I
0
I I 0 I
I
0
5-
I I 0 I
-O-P-O-P-O-p-O-
F IGURE8.4. Chemical structure o f a pol yphosphate ani on .
to become further concentrated. Thus, salt concentration continuously increases as the water moves downstream. If this parameter becomes too high , crop damage or soil poisoning may ensue. A different problem occurs in normally fresh water, because as salt concentration increases the water may reach the point where either the natural population of plants and animals is threatened or the water is no longer useful for public water supply or irrigation. Salts can be determined as TDS or by measuring the condu ctivity of the solution (i.e., the ability of a solution to conduct an electric current). The electrical conductivity in SI units can be expressed as milliSiemens/m (mS/m ) or in micromhos per centimeter ( umh o / cm); ImS/m is equivalent to 10 umho/cm, and IS = Imho .
8.4.2.10 Heat Although heat is not often recognized as a pollu tant, individuals in the electric power industry are well aware of the problems involved in the dispo sal of waste heat. Furthermore, waters released by many industrial processes are much hotter than the receiving waters . While in some cases an increase in water temperature can be beneficial (e.g., the production of clams and oysters can increa se), in other case s it can have negative impacts. For example, many important commercial and game fish (e.g., salmon and trout ) live only in cool waters. Higher water temperatures also increase the rate of dioxygen
Air, Water, and Soil Pollution and Their Effects
depletion in areas where oxygen -demanding wastes are present. The quality of sewage discharged into surface waters depends on the quality of the raw sewage received by the sewage work s and its treatment.
8.4.2.11 Other Contributions Many other pollutants enter water reservoirs daily and to present them in this limited space would be virtually impossible. One example involves plastic debris, which can erode and become microscopic fragments in the form of granules or fibers small enough so as to be ingested by small organisms, posing a substantial threat to their lives. Larger pieces of plastic (e.g., bags) can be dangerous to animals such as turtle s that may inge st them or be strangled by them; to make matters worse, in the ocean such materials resembl e food (e.g ., jell y fish).
8.4.2. 12 Groundwater Pollution Groundwater (see definition in Chapter 6) may be contaminated by several anthropogenic sources, the main ones being septic systems and cesspool effluents, animal wastes, agricu ltural runoff, re-use of irrigation water, indu strial wastewater impoundments, acid mine drainage, underground wells for waste injection , underground storag e tanks, highway de-icing salts, leakin g pipelines, accidental spills, and landfillieachates. Leach ates are liquid effluents generated at landfill sites- they contain soluble and/or suspended pollutants resulting from the percolation of water through the waste. Natural pollution of groundwater can also occur, albeit to a lesser extent; examples include the mineralization of soluble aquifers and arsenic dissolution. Groundwater pollution is much less reversible than that of surface waters and also considerably more difficult to tackle, because most clean sing microorganisms work aerobically (see Chapter s 7, 9, and 11), and groundwater is norm ally not in contact with a fresh dioxygen supply. Furthermore, lightpromoted clean sing processes obviously cannot occur here.
8.4.2.13 Surface Waters The discharge of sewage into surface waters is a major global source of pollutants. Dome stic and industrial wastes are mainly discharged into sewage
187
systems (industrial wastes are sometimes directly discharged into surface waters). The sewage quality depends on the quality of the raw sewage received by the sewage works and on its treatment. Urine, feces, paper, soap, and synthetic detergents are important constituents of domestic waste. Indu strial wastes are many and quite varied; their qual ity depends on the nature of the individual source operations. A diver sity of treatments may be carried out at sewage work s to improve the quality of sewage before it is discharged into surface waters (see Chapters 10 and 11). Pollutants in surface waters are transported by rivers either in the dissolved or in the particulate states, and they may later accumulate in lake s or in the estuaries into which they flow. Ocean currents can transport pollutants over long distances.
8.4.3 Effects of Pollutants on the Lithosphere Of particular importan ce is the contamination of soil, becau se it receives pollutants from the atmosphere (e.g., sulfates and nitrate s resulting from oxidation of nitrog en and sulfur oxides, and metals from smelters) and from the hydro sphere (e.g., sediments that concentrate heavy metal s from aqueous bodies and mining operations). In multimedia massbalance models, soil is an important sink as well as a conduit for mass transfer to vegetati on and shallow groundwa ter. Soils are the main and ultimate culprit of many different human exposure pathways to pollutants through the food chain, partly becau se lipophilic compounds that reside mainly in soils dissolve pesticides, herbicides, and the like .
8.4.3.1 Transformation of Pollutants in Soil s Soil pollutants may percolate and end up in groundwater, or be retained by a soil matrix due to their affinity for specific soil components (e.g., insoluble organic compounds in humi c substances) . There , they may stay inactive, decompose, or react with soil components or with other pollutants. Reactions from these type s of pollutants with soil include oxidation, redu ction, combination, precipitation, dissolution, and metathesis. The main decomposition pathways include biodegradation (see Section 9.1.2), chemical degradation, and
188
8. Effect s of Pollutant s on the Chemistry of the Atmosphere, Hydrosphere, and Lithosphere
photolysis (only for surface species); the final product(s) mayor may not be more environmentally friendly than the starting material. For instance, trichloroethylene photodecomposes on clays (e.g., on Ca-montrnorillonite), and primarily yields the carcinogenic dichloroacetic acid, whose potency is greater than that of trichloroethylene.
8.4.3.2 Transport, Mobility, and Partitioning of Pollutants in Soils A given pollutant may penetrate in soil down to a specific depth, and therefore transport calculations need individual depth data. Owing to mass transport restrictions, residence times of many pollutants in soils are (unfortunately) much longer than those in the gas or liquid phases. In addition, partitioning effects in soils can be dramatic; a case in point is the concentration effect that occurs with uranium, which sometimes reaches levels up to 104 times higher than its concentration in water with which the soil is in equilibrium. Biota plays a key role in the transport and mobilization of pollutants from soil, because for example, many of them bioaccumulate in vegetation and cattle (see Section 9.2). Land is also contaminated by aerially-transported materials. Smoke and dust from chimneys can fall on neighboring land, carrying along a variety of organic and inorganic pollutants. Gases such as sulfur dioxide and nitrogen oxides, released from chimneys, may cause damage to vegetation in the neighborhood of industrial premises. Additionally, as with surface waters, atmospheric pollutants reach land after traveling considerable distances. They are carried down by rain or snow, in solution or suspension, or by dust particles. Partitioning and mobility of metal ions, metal complexes, and ligands in soils or sediments are affected by their adsorption onto a variety of substrates. As mentioned earlier (see Section 6.3.1), natural oxides offer suitable adsorption sites for some of these species and may even undergo dissolution as a result. Here, an understanding of the bonding phenomena is crucial. For example , the adsorption of [Co(III)EDTA] (here written as [MLr) on hydrated aluminum oxide surfaces (written as =AIOH) can be represented as: =AIOH + [MLr
+ H+ ---+
=AIOHt - - [LM] (8.63)
It involves an outer-sphere mechanism (see Section 3.1.4) because the four carboxylate groups in the monovalent [Co(III)EDTAr complex are coordinated to the metal center, whereas in the divalent [Co(II)EDTA]2- complex, one carboxylate group is free to coordinate with the surface and thus it adsorbs through an entirely different path. Polyphosphates also playa role in the chemistry of natural metal oxides. For example, if the concentration of poly phosphates is smaller than that needed to saturate the available sites of a solid oxide surface, their presence enhances the sorption of surrounding metal ions; by contrast, if their concentration exceeds that needed to saturate the surface, their presence decreases metal ion sorption due to two effects: (a) Competition between dissolved and surface polyphosphates for the target metal ions. (b) Dissolution of the oxide itselfby the action of the polyphosphates. For example, phosphates compete so successfully with metal-EDTA species for adsorption sites onto natural iron oxides (e.g., goethite), that the metal complex can be desorbed completely under appropriate conditions of pH and concentration. As discussed above, soil pH may playa major role in its interactions with pollutants. Species distribution diagrams (see Chapter 2) set the framework to know which species are predominant at a given pH. For example, phosphates have the predominancezone diagram shown in Figure 8.5. Because soils typically have surface hydroxyl groups, low pH values allow their protonation and render the surface positive or neutral. The OH 2 groups thus formed are easier to displace from the surface-bonding sites than the OH groups, and therefore ligand exchange reactions with the negativelycharged phosphate groups occur more easily at low pH. On the other hand, at high pH the excess of OHin solution removes protons from the surface, making it negative; as a result, the negatively-charged phosphate groups become electrostatically repelled and adsorption does not occur.
8.4.3.3 Agriculture and the Chemistry ofSoils Soils receive vast amounts of fertilizers, soil additives (e.g., gypsum and sulfur), pesticides, and
189
Air, Water, and Soil Pollution and Their Effects
7
2
FI GURE
12
pH
8.5. Predominance-zone diagram for phosphat es.
herbicides as a result of their application to crops . Biocides are used for the control of vertebrate and invertebrate pests, weeds , and other vectors of disease. This is important in areas of inten sive agriculture, where a variety of different pesticides are used during the course of a farming year; they are applied in different forms, as sprays, granules, dust s, and seed dressings. The method of application and the nature of the formulation influence the ways in which pesticides are distributed in the crops and soils. They sometimes move through the soil to contaminate groundwater, especially where there are crack s in the soil profile that allow rapid percolation of water. Apart from agricultural applications, pesticides are appl ied over large areas for other purposes such as the control of the tsetse fly and locu st swarms in Africa. The use of sewage sludge as fertilizer on agricultural land is another source of polluti on. Heavy metals, nitrates, pho sphates, and detergents are all added to soil in this way. As mentioned earlier, high salt contents in water (e.g ., Na, Ca, and Mg sulfates) in contact with soils produce salinization (i.e., excess salinity). Other causes of salinization include high water tables , high evaporation rate s, and low annual rainfall. Excessive salinity makes it more difficult for plant roots to take in water, which considerably reduces crop yields and also degrade s the qual ity of shallow groundwater and of surface water.
plexation . The extent of such interactions obviou sly affects metal ion leaching, plant uptake, and related phenomena. It is then clear that an inevitable overlap exists between the discussion of this subject here and that in the sections dealing with the effect s of metallic pollutants in the hydrosphere. Metal contamination of soils is primarily due to the application of sewage sludge, manure, phosphate fertili zers, atmospheric deposition, and traffic emissions. The most common heavy metal ions found in soils are Zn, Cu , Ni, Pb, Cr, and Cd . As mentioned earlier (see Section 6.3 .1.4), sequential extraction techniques can differentiate among the metal form s in a soil, typically the acid soluble fraction (e.g., carbonates), the reducible fraction (e.g., iron/manganese oxides), and the ox idizable fraction (i.e., metal s in low oxidation states). Among other minerals, metal sulfides are nearl y ubiquitou s in the environment. When they become exposed to air as a result of mining processes, they become oxidized. Microorganisms typic ally mediate this process, although pure chemi cal oxidation is also possible. After coming into contact with water (mainly rainwater), these mineral s form aqueous solution s that are notably acidic and are generically called acid min e drainage (AMD) . Because Fe is often the main metal present, AMD can be represented by the equation FeSZ(S) + HzO(l)+ 7/20Z(g) ~ Fez+ +2S0~- + 2H+ (8.64)
8.4.3.4 Metals and Mining Processes Metals constitute an important source of pollution in soils. As discu ssed in Chapters 5 and 6, they can bind to soils through humic substances, surface complexation, or ion exchange. In some cases more than one type of interaction can occur, as in clay minerals (e.g., montmorillonite and vermiculite) that bind metals through ion exchange as well as surface com-
The Fe2+ thus produced oxidizes to Fe3+ in air at low pH, albeit very slowly. Then , Fe3+ can either hydrolyze and form insoluble Fe(III) hydro xide, or act as a secondary oxidant to FeSz:
FeSZ(s) + 14Fe 3 + + 8H zO (l) ~ 15Fe2+ + 2S0~- + 16H+
(8.65)
8. Effect s of Pollutants on the Chemistry of the Atmo sphere, Hydro sphere , and Lithosphere
190 TABLE
8.8. Extremely acidic solutions in the environment
Site
Loc ation
pH
Comments
Kawah Ijen Kilauea Iki Poas crater Ebeko volcano Iron Mountain
Java Island Hawaii Costa Rica Kurile Islands, Russia California
Oto O.2 -0.3 -0.9 - 1.7 1.5 to -3.6
Lake waters HCI - HF fum arolic condensates Lake waters HCI - H2S04 hot springs AMD
Source : Nord strom. 2000 .
The residue s obtained after the main mineral or metal has been extracted are called mine tailings. They normally appear in a substantially divided form (as a result of crushing and grinding) and therefore have high surface areas that favor the previous reactions. The ensuing production of protons and sulfate ions yields H2S04, which can dissolve minerals and therefore increase the metal and non-metal ion content and acidity in nearby surface waters, in groundwaters, and in the corresponding receiving bodies of water. For example , arsenic builds up in particular areas when the sulfide minerals contain this element. In addition , the AMD process promotes downstream deposition of insoluble Fe(III) species. When the water table is near the surface, capillary rise and evaporation may also contaminate the upper soil layers. Amazingly, tailing dumps can be oxidized at depths of even 5 m. As shown in Table 8.8, quite acidic solutions exist in the environment as a result of AMD and other natural environmental phenomena (mainly produced by magmatic gases: Hel, HF, H 2S04).
8.4.3.5 Other Wastes and Pollutants in Soil The dumping of wastes at landfill sites is a wide spread practice. Indeed, many old sites can be regarded as ecological "time bombs." Hazardou s substances in landfills are typically mixed with
other wastes and with soil itself, which unfortunately make s their treatment rather complicated. The wastes at landfills commonly involve : • Solid wastes. These mainly include waste paper, food, yard, and street wastes, plastic trash, metal objects, and septic tank residues. • Industrial wastes. They vary widely, including items such as thick organic waste (e.g., tars), residual con struction materials, pollution-treatment wastes, scrap , personal waste and safety items, and other various type s of solid trash. • Sewage sludge. Thi s is the solid material produced in wastewater treatment plants. It contains residues from residential and commercial settings , storm-water runoff, and others. On the other hand, there is the question of disposal of domestic and general industrial waste s. There are toxic wastes which require more careful handling. Of particular concern are radioactive wastes from nuclear power stations. With the latter, there are stringent regulations for safe disposal to minimize contamination of the land surface and neighboring surface waters . Lastly, non-ionic organic pollutants can also adsorb onto soil from water. This constitutes a major process in pollutant transport/mobility in subsurface environments. Both the organic fraction of soils and the clay minerals can play key roles as adsorption sites.
Related Experiments in the Companion Book 2. 3. 7. 8.
Dissolved oxygen in water Alkalinity and buffering capacity of water Air oxidation of metal ions Photoassisted reduction of metal complexes
9. Anionic detergents and a-phosphate s in water 11. Acid mine (or acid rock) drainage 15. Removal of nitric oxide by complex formation
Air, Water, and Soil Pollution and Their Effects
19 1
Additional Related Experiments/Activities Adelheim , M.; Hahn, E.-G . "A Simple Demonstration of the Greenhouse Effect ," J. Chem. Educ. 1993, 70, 73-74. Abney, J. R.; Scalettar, B. A. "Saving your Students' Skin . Undergraduate Experiments that Probe UV Protection by Sunscreen s and Sunglasses," J. Chem. Edu c. 1998,75, 757-760. Andino, J. M.; Wallington, T. J.; Hurley, M. D.; Wayne, R. P. "A Clas sroom Demonstration of the Formation of Aero sol s from Biogenic Hydrocarbon s," J. Chern. Edu c. 2000, 77, 15841586. Baedecker, P. A.; Reddy, M. M. "The Erosion of Carbona te Stone by Acid Rain-Laboratory and Field Investigation," J. Chem. Educ. 1993 , 70, 104-108. Baker, R. C; Jr. "Checking Trace Nitrate in Water and Soil Using an Amateur Scientist' s Measurement Guide ," J. Chem. Educ. 1995, 72, 57-59. Bauer, R.; Birk, J.; Saw yer, D. Laboratory Inqui ry in Chemistry, 2nd ed .; Brooks-Cole: Stamford, CT,2005. • How much cobalt is in the soil? (Experiment 17) Betterton, E. A. "Acid Rain Experiment and Construction of a Simple Turbidity Meter," J. Chem. Educ.1991,68,254-256 . Bilanovic, D.; Loewenthal, R. E.; Avnimelech, Y.; Green, M. "Potentiometric Measurement of Chemical Oxygen Demand," Water SA 1997, 23(4) 301-309. Blume, R.; Bader, H. J. Environmental Chemistry in Classroom Experiments; IUPAC Publication, S. M. V. Traders and Printers: Delhi, 1990. • Preparation of NO and N02 (Experiment 2) • Preparation of nitrogen dioxide (Experiment 3)
• The test of NOx and nitrite ions: Lunge 's reagent (Experiment 5) • The test of NOx in exhaust gases and cigarette smoke (Experiment 6) • The oxidizing effect of nitrogen oxides (Experiment 7)
• Preparation and detection of hydrogen sulfide (Experiment 11) • Model experiment on the effect of H2S as a respiratory poison (Experiment 13) • Reducing properties of hydrogen sulfide (Experiment 14) • Roasting of pyrite s (Experiment 21) • Model experiment on the lime stone process (Experiment 25) • Preparation of carbon monoxide (Experiment 28) • Test for carbon monoxide (Experiment 29) • Test for carbon monoxide in tobacco (Experiment 30) • Test for carbon monoxide in exhau st gases (Experiment 3 1) • Test for freons (CFC's) in the propell ant gas of sprays (Experiment 45 ) • Model experiment on the reacti ve nature of chlorine atoms (Experiment 46) • Combustion products of PVC (Experiment 49 ) • Analysis of rain water (Experiment 50) • Effect of heavy metal salts on the activity of enz yme s (Experiment 56) • Model experiment on ground water pollution (Experiment 57) • Model experiment on the processes in a refuse incineration plant (Experiment 6 1) • Determination of degree of pollution of water (Experiment 109) • Test for nitrate and nitrite in drinking water reduction; reduction of nitrate to nitrite (Experiment 119) • Phosphate determination in surface water (Experiment 122) • Adsorption of phosphate ions by aluminum oxide (Experiment 124) • Emulsifying action of detergents (Experiment 125) • Water softeners in action (Experiment 126) • Sequestering a detergent by adsorbing resins (Experiment 128)
192
8. Effects of Pollutants on the Chemi stry of the Atmo sphere, Hydro sphere, and Lithosphere
Boehnke, D. N.; Delumyea, R. D. Laboratory Experiments in Environmental Chemistry; Prentice-Hall: New York, 1999. • Determination of oils and greases by Soxhlet extraction (Experiment 14) • Determination of oil-spill sources using pattern recognition of known petroleum product gas chromatograms (Experiment 17) • Properties of detergents: surface tension measurement of critical micelle concentration (Experiment 20) • Introduction to air sampling: particulates in urban air (Experiment 21) • Collection and chemistry of acid rain (Experiment 23) Brouwer, H. "Demonstration Properties of Sulfur Dioxide," J. Chem. Educ. 1991 ,68,417. Brouwer, H. "Acid Volatile Sulfid es (AVS) in Sediment. An Environmental Chemistry Experiment ," J. Chem . Edu c. 1995,72, 182-183. Buell, P.; Girard, J. Laboratory Manualfor Chemistry Fundamentals, 2nd, ed. ; Jones and Bartlett: Boston, MA , 2002. • Nucle ar radiation (Experiment 8) • Acid rain (Experiment 11) • Environmental sampling (Experiment 22) Butala, S. J.; Zarrabi, K.; Emerson, D. W. "Sampling and Anal ysis of Lead in Water and Soil Samples on a University Campus- A Student Research Project," J. Chem. Educ. 1995, 72, 441-444. Caldararu, F.; Patrascu, S.; Caldararu, M.; Paraschiv, A. "Higher Education Level Laboratory for Real Time Pollution Monitoring," Int. Geosci. Remote Sens . Symp. (IGARSS) 2003,7, 4587-4589. IEEE. Toulou se, France, Ju121-25 2003. Casey, R E.; Pittman, F. A. "Intermolecular Forces as a Key to Understanding the Environmental Fate of Organic Xenobiot ics," J. Chem. Educ. 2005, 82, 260-264. Chri sten sen, J. K.; Hoyer, B. L.; Kryger, L.; Pind , N.; Kong, L. S. "Sulfides in the Anaerobic Environment: The Determ ination of Hydrogen Sulfide and Acid-Soluble Metalli c Sulfides in
Sea-Floor Sediment," J. Chem. Educ. 1998, 75, 1605-1608. Cirsp, P. T.; Eckert, J. M.; Gibson, N. A. "The Determination of Anionic Surfactants in Natural and Waste Waters" , J. Chem. Educ. 1983,60, 236-238. Clem son University. Introducto ry Chemistry Lab Experiments in Environmen tal Chemistry; Environmental Chemistry Library. National Science Foundation, 2002 . http ://www.ces.clem son.eduJ ecl/labs/generaVindex.htrnl • • • • • • •
Pho sphate determination Sulfate determination Chloride determination Total suspended solids Total dis solved solids Soap and detergents Fertil izer and water quality
Dacko, B. M.; Giulano, L. "Why do Some Turds Float ? Wastewater Chemistry in the Classroom ," 214th Am. Chem. Soc. Nat. Meet. , Chern. Ed. Division Paper # 068 . Las Vegas, NV, Sept . 7-11 ,1997. Daniel, D. W.; Allen, Alisha G.; Brown, Gregory R ; Chandrupatla, Hareesh; Fowler, Steve A.; Richmond, DeondreJ.; Skipper, Shaun w.; Taylor, Jason A.; Waslak , Amy E. "A Simple UV Experiment of Environmental Significance ," J. Chem. Edu c. 1994, 71,83. Dingrando, L.; Tallman, K.; Hainen, N; Wistrom , C. Chem istry: Matter and Change (Lab Manual) ; Glencoe SciencelMcGraw-Hill Ryerson: New York , 2005 . • Growth of algae as a function of nitrogen concentration (Experiment 26.2) Dolan, E.; Zhang, Y.; Klarup, D. "The Distribution Coefficient of Atrazine with Illinois Soils: A Laboratory Exercise in Environmental Chemistry," J. Chem. Educ. 1998,75, 1609-1610. Driscoll , J. A. "Acid Rain Demon stration: The Formation of Nitrogen Oxides as By-Products of High Temperature Flame in Connection with Internal Combustion Eng ines," J. Chem. Educ. 1997, 74, 1424-1425.
Air, Water, and Soil Pollution and Their Effects
Dunnivant, F. M.; Moore, A.; Alfano, M. J.; Brzenk, R.; Buckley, P. T; Newman, M. E "Understanding the Greenhouse Effect: Is Global Warming Real ? An Integrated Lab-Lecture Case Study for Non -science Majors," J. Chem. Educ. 2000, 77, 1602-1603. Epp, D. N.; Curtright, R. "Acid Rain Investigation s", J. Chem. Edu c. 1991 ,68, 1034-1035. Gleason , G. I. " Nitric Acid in Rain Water," J. Chem. Educ. 1973,50,718-719. Godfrey, P. J. "Acid Rain: The Scientific Challenge," Sci. Prob. 1991,1 (3) 71-80. Goss, K. U.; Schwarzenbach, R. P. "Rules of Thumb for Assessing Equilibrium Partitioning of Organic Compounds: Successes and Pitfalls," J. Chem. Educ. 2003, 80, 450--455 . Goss, L. M.; Eddleton, J. E. "A Demonstration of Acid Rain and Lake Acidification: Wet Deposition of Sulfur Dioxide," J. Chem. Educ. 2003 , 80 , 39-40. Grec o, T G. ; Rickard, L. H.; Weiss, G. S. Exp eriments in Gen eral Chemi stry: Prin ciples and Modern Applications, 8th, ed.; Prentice Hall : Upper Saddle River, NJ , 2002. • Investigation of buffer systems (Experiment 20) • Determination of water hardness (Experiment 26) • Analysis of common anions and their salts (Experiment 38) Holl enberg, J. L.; Stephens, E. R ; Pitt s, J. N ., Jr. "Demonstrating the Chemistry of Air Pollution," J. Chem . Educ. 1987,64,893-894. Horan , J. H. ; Wildeman, T R; Ernst, R "Acid Mine Drainage Laboratory Experiments," 214 t h Am . Chem. Soc. Nat. Me et., Chem. Ed. Division Paper # 005. Las Vegas, NV, Sept. 7-11, 1997. Howe , A. c.; Cizmas, L.; Bereman, R. "Eutrophicati on of Lake Wingra: A Chemistry-Based Environmental Science Module," J. Chem. Educ. 1999 , 76, 924-926. Ibanez, J. G. "Redox Chemistry and the Aquatic Environment: Examples and Microscale Experiments," Chem. Edu c.lnt. (l UPA C) 2005, 6, 1-7. Jack son , G. B. Applied Water and Spentwater Chemistry. A Laboratory Manual; Van Nostrand-Reinhold: New York, 1993.
193 • Color measurement (Experime nt 9) • Turbidity measurement (Experiment 10) • Specific conductivity measurement (Experiment 12) • Total suspended solids measurement (Experiment 16) • Calcium carbonate stability measurement (Experiment 17) • Total residual chlorine mea surement (Experiment 21) • Chlorine demand measurement (Experiment 22) • Chloride measurement (Experiment 23) • Sulfate mea surement (Experiment 24) • Nitrate-nitrogen measurement (Experiment 25) • Fluoride measurement (Experiment 26) • Biochemical oxygen demand measurement (Experiment 28 ) • BOD s toxicity measurement (Experiment 29) • Glucose-glutamic acid mea surement (Experiment 30) • Chemical oxygen demand mea surement (Experiment 32) • Oil and grease mea surement (Experiment 33) • Volatile acid to alkalinity ratio measurement (Experiment 34 ) • Pho sphate mea surement (Experiment 35) • Ammonia and organic nitrogen measurement (Experiment 36) • Methylene blue surface active agents mea surement (Experiment 37) • Iron measurement (Experiment 38 ) • Manganese measurement (Experiment 39) • "Jackson's" modified sulfur dioxide measurement (Experiment 40) • Residual sulfur dioxide measurement (Experiment 41) JCE Editorial Staff. "Acid Raindrops Keep Fallin ' in my Lake," J. Chem. Educ. 2003, 80, 40A. Klausen , J.; Meier, M. A. ; Schwarzenbach, R. P. "Assessing the Fate of Organic Contam inants in Aquatic Environments: Mechanism and Kinetics of Hydrolysis of a Carboxylic Ester," J. Chem. Edu c., 1997, 74, 1440-1444.
194
8. Effects of Pollutants on the Chem istry of the Atmosphere, Hydrosphere, and Lithosphere
Kelter, P. B.; Grundman, J.; Hage, D. S.; Carr, J. D.; Castro-Acuna, C. M. "A Discussion of Water Pollution in the U.S. and Mexico, with High School Laboratory Activities for Analysis of Lead, Atrazine, and Nitrate ," J. Chern. Educ. 1997,74, 1413-1421 . King, D. M.; Lampman, G. M.; Smith III, J. H. "Nitrate Analysis-A Laboratory Experiment for the Non Science Major Course," J. Chern. Educ.1971,48,647. Kohn, H. W. "Student Flowmeter and an Air Pollution Experiment," J. Chern. Educ. 1972, 49, 643. Koubek , E. "The Absorption of UV Light by Ozone," J. Chern. Educ . 1989,66,338. Kriz, Jr., G. S.; Kriz, K. D. "Analysis of Phosphates in Detergents," J. Chern. Educ. 1971,48, 551-552. Lauren, Paul M. "Oxidizing Action of Sulfur Dioxide", J. Chern. Educ. 1969,46, A55. Lee, C. M. "Speciation of Aluminum in Acidified Waters," Environmental Chemistry Library. NSF-Clemson University. Environmental Engineering and Science, Clemson University, 2002. http://www.ces.clemson.edu/ecVmodeling/ visual..MIfishiindex.html Lisensky, G.; Reynolds, K. "Chloride in Natural Waters-An Environmental Application of a Potentiometric Titration," J. Chern. Educ. 1991, 68, 334-335. Lynam, M. M. ; Kilduff, J. E.; Weber, W J. "Adsorption ofp-Nitrophenol from Dilute Aqueous Solution: An Experiment in Physical Chemistry with an Environmental Approach," J. Chern. Educ. 1995,72,80-84. MacLeod, M.; Mackay, D.; Webster, E. "Contaminant Fate Models for Undergraduate and Graduate Education in Environmental Chemistry," Prepr. Ext. Ab str., Arn. Chern. Soc. Nat. Meet., Div. Environ. Chern. 1999,39(2),232-234. Marsella, A. M.; Huang, J.; Ellis, D. A ; Mabury, S. A. "An Undergraduate Field Experiment for Measuring Exposure to Environmental Tobacco Smoke in Indoor Environments," J. Chern. Educ. 1999,76, 1700-1701. Martin, David P. "Demonstrating the 'Greenhouse ' Effect," J. Coli. Sci. Teach. 1996, 25, 225-228.
Meserole, C. E.; Mulcahy, F. M.; Lutz, J.; Yousif, H. A "C02 Absorption of IR Radiated by the Earth," J. Chern. Educ. 1997,74,316-317. Mihok, M.; Keiser, J. T.; Bortiatynski, J. M.; Mallouk , T. E. "An Environmentally-focused General Chemistry Laboratory," J. Chern. Educ. 2006 ,83,250. http://jchemed.chem.wisc.edu/Joumal/lssues/2006 FebACS/ACSSub/ACSSupp/JCE2006p0250W .pdf • Acid rain deposition (Experiment 7) Molirig, J. R "An Introductory Experiment on Phosphates in Detergents," J. Chern. Educ. 1972,49, 15-18. Moore, B. III. "Environment, Education, and Health: The Environment," Proc. 31st Goddard Mern. Symp., Arn. Astronaut. Soc. Sci. Techno!' Ser. 1994,83,51-56. Arlington, VA, USA, Mar. 9-10, 1993. Morrison, R J.; Dandy, A J. "Phosphate Fertiliser in Soils," Educ . Chern. 1979,16 (6) 176177. Newton, T. A. "Partition Coefficients-A Lecture Demonstration," J. Chern. Educ . 1982, 59, 973 . Ophardt, C. E. "Acid Rain Analysis by Standard Addition Titration," J. Chern. Educ. 1985, 62, 257-258. Osorio, V. K. L.; de Oliveira, W; El Seoud, O. A. "Hard Water and Soft Soap : Dependence of Soap Performance on Water Hardness. A Classroom Demonstration," J. Chern. Educ . 2005, 82, 257-259. Peterson, J. B.; May, A "Characterization of MininglMineral Processing Waste Using OxidationlReduction Potential and pH Measurements," Proc. Western Reg. Symp . Mining & Min. Process. Wast. (Soc. for Mining, Metallurgy & Exploration) 1990, 53-59. Berkeley, CA, USA, May 30-Jun I 1990. Powers , D. c.. Higgs, A. T.; Obley, M. L.; Leber, P. A.; Hess, K. R ; Yoder, C. H. "Analysis of Natural Buffer Systems and the Impact of Acid Rain. An Environmental Project for First-Year Chemistry Students," J. Chern. Educ. 2005, 82, 274-277.
Air, Water, and Soil Pollution and Their Effect s
Ramachandran, B. R. ; Allen , J. M.; Halpern, A. M. "Air-Water Partitioning of Environmentally Important Organic Compounds: An Environmental Chemistry or Integrated Laboratory Experiment," J. Chern. Educ. 1996,73, 1058-1061. Roesky, H. W.; Mockel, K. Chernical Curiosities; VCH: Weinheim, 1996. • A simple experiment to demonstrate the greenhouse effe ct (Experiment 94) Romero, A.; Hernandez, G.; Suarez, M. F. "Photocatalytic Oxidation of Sulfurous Acid," J. Chern. Educ. 2005 ,82,1234-1236. Sawyer, C. N.; McCarty, P. L.; Parkin, G. F. Chernistry f or Environrnental Engine ering; McGrawHill International Editions, Civil Engineering Serie s: New York, 1994. • Biochemical oxygen demand (Chapter 22) • Chemical oxygen demand (Chapter 23) • Phosphorous and phosphate (Chapter 29) Schilling, A. L.; Hess, K. R.; Leber, P. A.; Yoder, C. H. "A Simulation of the Interaction of Acid Rain with Soil Minerals," J. Chern. Educ. 2004 , 8 1,246-247. Schonbeck, N. D. "Visualization of Buffer Action and the Acid ifying Effect of CO 2 ,' ' J. Chern. Educ. 1985, 62, 436-437. Seeley, J. V.; Bull , A. w.; Fehir, R. J. Jr.; Cornwall, S.; Knudsen , G. A.; Seeley, S. K. "A Simple Meth od for Measuring Ground-Level Ozone in the Atmosphere," J. Chern. Educ. 2005 ,82. 282-285. Seym our, P. "Chromium Pollution: An Experi ment Adapted for Freshman Engineering Student s," J. Chern. Educ. 1999, 76, 927-928. Shooter, D. "Nitrogen Dioxide and its Determination in the Atmosphere- A Simple Method for Survey ing Ambient Pollution Concentrations," J. Chern. Educ. 1993 , 70, AI 33-AI40. Solomon, S. Oliver-Hoyo, M. ; Hur, C. "Generating Water-Soluble No xious Gases : An Overhead Projector Demonstration," J. Chern. Educ. 1998, 75, 1581-1582. Sipos, L. "Inhibition of Sulfite Oxidation by Phenols: Screening Ant ioxidant Behavior with a
195
Clark Oxygen Sen sor," J. Chern. Edu c. 1998, 75, 1603-1605. Stephens, E. R. "Gasoline Vapor : An Invi sible Pollutant ," J. Chern. Edu c. 1997, 54 , 682-684. Suplinkas, R. J. "Air Pollution Measurements in the Freshman Laboratory," J. Chern. Edu c. 1972,49, 24-25. Szafran, Z.; Pike, R. M .; Foster, J. C. Mi croscale General Chernistry Laboratory with Selected Macroscale Experirnents, 2nd ed.; Wiley: New York, 2003 . • Determination of the source of iron pollution (Experiment 15) Tandon, R. K.; Finlay son , E ; Adeloju, S. B; "Tes ting the Waters," Edu c. Chern. 1994, 31 (6) 159161. Tratnyek, P. G.; Reilkoff, T. E. ; Lem on, A. W.; Scherer, M. M.; Balk o, B. A .; Feik, L. M. ; Henegar, B. D. " Visualizing Redox Chemistry: Probing Environmental O xidation-Reduction Reactions with Indicator Dyes," Chern. Edu c. 2001 , 6(3) 172-179. Tripp, T. B.; Nadenu , J. L. "Ro adsi de Salt Pollution and the Absorption-Emission Spectra of Sodium-A General Chemistry Expe riment," J. Chern. Educ. 1974,51, 130. Urbansky, E. T. "Carbinolamines and Geminal Diols in Aqueous Environmental Organic Chemistry," J. Chern. Edu c. 2000, 77, 1644-1647. Walczac, M. M. "Should We Build a Copper Mine?", 2 14th Am. Chern. Soc. National Meeting, Las Vegas, NY, Sept. 7-11 , 1997. Ch ern. Ed. Division Paper #003. Walczak , M. M.; Lantz, J. M. "A Case on Septic System s and Well Water Requiring In-Depth Analy sis and Including Optional Laboratory Experiments," J. Chern. Edu c. 2004, 8 1, 218220. West, P. W.; Sachdev, S. L. "Air Pollution Studies-The Ring Oven Techniques," J. Chern. Educ.1969,46,96-98. Whisnant , D. M. ; McCormick, J. A . " BCTC for Window s: Abstract Issue 9903W," J. Chern. Educ. 1999 ,76,719.
196
8. Effec ts of Pollutants on the Chemistry of the Atmosph ere, Hydrosphere, and Lithosphere
Wild em an, T. R. "Minera l Acidity, APP, ANP, NNP: The Stoichiometry and Quantitative Ch emi stry of Acid Rock Drainage Explained ," 214th Am. Chern. Soc. Nat. Meet., Chern. Ed. Division Pap er# 006 . Las Vegas, NV, Sept. 711, 1997. Wu , R. S. S. "Cha nge of Forms of Cadmium in the Aqu atic Environments," J. Chern. Educ. 1995 , 72, 264-265. Xia, K. ; Pierzyn ski , G. "Competitive Sorption between Oxalate and Phosphate in Soil: An En-
References and Further Reading Batty , L. e. ; Younger, P. L. "Critical Role of Macroph ytes in Achieving Low Iron Concentrations in Mine Water Tre atment Wetlands," Environ. Sci. Technol. 2002 , 36, 39 97-4002. Casey, R. E.; Pittman, F. A. " Intermolecular Forces as a Key to Under stand ing the Environ mental Fate of Orga nic Xeno biotics," J. Chern. Ed uc. 2005 , 82, 260264 . C limate Mon itoring and Diagn ostic Laboratory. http: // www.cmdl.n oaa.gov/ozone.html Dom enech , X.; Ayll6n , J. A.; Peral, J. "Use of Physicoche mical Param eters to Assess the Environ mental Fate of Organic Pollutants: The Fugacity Model," J. Chem. Ed uc. 2006,83,237-240. Fukush i, K.; Sat o, T.; Yanase, N. "So lid-Solution Reaction s in As(V ) Sorption by Sch wertmannite," Environ. Sci . Techn o!' 2003, 3 7, 3581- 3586. Gri sham, J. "EPA Proposes Plan to Clean up Waterw ays," Chem . Eng. News , Au g. 23, 1999 . pp. 10-11. Goss, K.-U .; Schwarzenbach, R. P. " Rules of Thumb for Ass ess ing Equilibrium Partiti oning of Organic Compounds: Successes and Pitfall s," J. Chem. Educ. 2003 , 80, 450-455 . Gustafsson , J. P.; Pechova, P.; Berg gren, D. "Modeling Metal Binding to Soil s: The Role of Natural Organic M att er," Environ. Sci . Technol. 2003, 3 7, 2767-2774. Halstead , J. A. "Spri ng Shock ! Impact of Spring Snowm elt on Lakes and Stream s," J. Chem. Educ. 1998, 75, 400A. H ogu e, e. "Scuffle ove r Perchl orate," Chem. Eng. News , Nov. 3, 2003 . p. 14. Hogue, e. "North Ame rica n Pollution," Chem. Eng. News, Jun. 7, 200 1. p. 8. How ard , A. G . Aquatic Environm ental Chemistry; Oxford Ch emistry Prim ers. Oxford Sc ience Publications: O xford , 1998. Chapte r 5. How e , A. Ci : Cizmas, L. ; Berem an, R. "E utrophica tion of Lake Wingr a: A Chem istry-B ased Environrnen-
vironmental Chemistry Laboratory Using Ion Chromatography," J. Chern.Educ. 2003 , 80,7175. Xiao, D.; Lin, L., Yuan, H.; Choi, M. M. E ; Chan, W. "A Passive Sampler for Determ ination of Nitrogen Dioxide in Ambient Air," J. Chern. Educ. 2005 , 82,1 231-1 233. Yappert, M. C.; DuPre, D. B. "Complexornetric Titrations: Competition of Complexing Agents in the Determination of Water Hardness with EDTA," J. Chern. Educ. 1997, 74,1422-1423. tal Science Module," J. Chem. Educ. 1999, 76, 924926 . IUPAC (Interna tional Union of Pure and Applied Chemistry) . Commiss ion on Atmospheri c Chemistry, "Glossary of Atmospheri c Chemistry Terms", Pure App!. Chern. 1990 , 62,21 67-2219. IUPAC Sub committee on Gas Kinetic Data Evaluation for Atmos pheric Ch em istry. Atkin son, R.; Baulch, D. L.; Cox, R. A. ; Crowley, J. N.; Hampson, R. F. Jr.; Hynes, R. G.; Jen kin, M. E.; Kerr, J. A.; Rossi, M. J.; Troe, J. "Summary of Evaluated Kinet ic and Photochem ical Data for Atmos pheric Chemistry," http :// www.iupackinetic.ch.ca m.ac .uk!summaryIIUPACsumm_web_ March2oo5 .pdf Jones, J.e. "Gree nhouse Gases and Non-gray Behavior," J. Chem. Educ. 2005, 82, 837 . Kaasaainen, M.; Yli-Halla, M. "Use of Sequ ential Extraction to Assess Metal Part itioning in Soils," Environ. Poll. 2003, 126, 225- 233. Klausen, J.; Meier, M . A.; Schwarzenb ach, R. P. "Assess ing the Fate of Organic Contaminants in Aquatic Environments: Mechanism and Kinetics of Hydrolysis of a Carb oxylic Ester," J. Chem. Educ. 1997 , 74 1440-1444. Langmuir, D.; Chrostowski, P.; Chaney, R. Vigneault, B. "Iss ue Paper on the Environmental Chemistry of Metals," U.S. Environm ental Protection Agency, Risk Assessment Forum; Draft, Contract # 68-C-98- 148 : Washin gton , August 200 3. Lajeunesse, S. "Plastic Bags," Chem. Eng. News Sept. 20, 2004 . p. 51 . Lew is, A. ; Bumpus, J. A.; Truhl ar, D. G .; Cramer, C. J. "Molec ular Modelin g of Environm entally Important Processes: Redu ction Potentials," J. Chem. Educ. 2004 , 81, 596-604. Lide, D. R. Handbook of Chemistry and Physics. Chemica l Ru bber Company (CRC) : Boca Raton, FL (USA) (any modem edition) . McKone, T. E.; Benn ett, D. H. "Chemical Specific Representatio n of Air-Soil Exchange and Soil Penetration in
Air, Water, and Soil Pollution and Their Effects Regional Multimedia Models," Environ. Sci. Technol. 2003,37,3123-3132. Naicker, K.; Cukrowska, E.; McCarthy, T. S. "Acid Mine Drainage Arising from Gold Mining Activity in Johannesburg, South Africa and Environs," Environ. Poll. 2003, 122, 29-40. NASA website . http ://www.nas.nasa.gov/Services/ EducationlResourceslTeacherWorkiOzone/ Ozonehomepage.html Nishikawa, S.; Hill, L.; Kihara, N. "Clean up in Engine R&D: Your Guide to Lowering Exhaust Emissions," Engine Technol. Intern . 2000, 4, 112114. http://www.emd.horiba.com/engmeas/techpdf/ cleanup.engine.corr.pdf Nordstrom, D. K; Alpers, C. N.; Ptacek, C. J.; Blowers, D. W. "Negative pH and Extremely Acidic Mine Waters from Iron Mountain, California," Environ . Sci. Technol. 2000 ,34,254-258. Northern Arizona University. Department of Chemistry. Flagstaff, AZ. Use of the Internet to Support onand off-Campus Environmental Chemistry Courses . http://jan.ucc.nau.edu.doetqp/ Rajeshwar, K.; Ibanez , J. G. Environmental Electrochemistry: Fundamentals and Applications in Pollution Abatement; Academic Press : San Diego, 1997. Chapter I. Rebhun, M.; Kalabo , R.; Grossman, L. ; Manka, J.; Rav-Acha, Ch . "Sorption of Organics on Clay and Synthetic Humic-Clay Complexes Simulating Aquifer Processe s," Wat. Res. 1992 , 26, 7-84. Reese , K. M. "Flatulence Tax Goes Away," Chern. Eng. News Dec . 1,2003. p. 56. Ritter, S. "Plastic Fallout in the Oceans," Chern. Eng. News May 10, 2004 . p. 10. Roundhill, D. M. " Novel Strategies for the Removal of Toxic Metals from Soils and Waters," J. Chern. Educ.
2004,81,275-282. Sawyer, C. N.; McCarthy, P. L.; Parkin, G. F. Chemistry for Environmental Engineering. McGraw-Hill Interna tional Edition, Civil Engineering Series: New York, 1994. Chapter 33. Schilling, A. L.; Hess, K R.; Leber, P. A.; Yoder, C. H. "A Simulation of the Interaction of Acid Rain with Soil Minerals," J. Chern. Educ . 2004, 81, 246247.
197 Stem , A. C. (Ed .), Air Pollution 3rd ed .; Vol. I. Academic Press: New York, 1976 . p. 56. Storck, W. J.; McCoy, M .; Reisch, M. S. ; Tullo, A. H.; Short, P. L. ; Tremblay, J.-F. "Facts & Figures for the Chemical Indu stry," Chern. Eng. News, July 5, 2004, pp.23-63. Tao, T.; Yang, J. J.; Maciel, G . E. "Photoinduced Decomposition of Trichloroethylene on Soil Components," Environ. Sci. Technol. 1999,33,74-80. Turner, S. M. "Ground Water," Information pamphlet, American Chemical Society: Washington, 1989 . University of Adelaide, Australia. "Data on the Environmental and Toxicological Effects of Chemical Substances," http :/www.adelaide.edu .au/library/ guide/sci/Chemistry/env.html U.S. Environmental Protection Agency. http ://www. epa.gov/owow/tmdl U.S. Environmental Protection Agency. Proposed Guidelines for Carcinogen Risk Assessment, Fed. Registry 1996, 6 I (79), 17959-1800 1. U.S. Environmental Protection Agency. U.S. Department of Agriculture. Natural Resources Conservation Service . Proposal to Clean up the U .S. Waterways. www.nssc.nrcs.usda.gov U.S. Environmental Protection Agency. Ozone depletion. http://www.epa.gov/ozone/ Wang, J. W.; Bejan, D.; Bunce, N. J. "Removal of Ar senic form Synthetic Acid Mine Drainage by Electrochemical pH Adjustment and Coprecipitation with Iron Hydroxide," Environ. Sci. Technol. 2003, 37, 4500-4506. Wang, J. S.; Wai, C. M . "Arsenic in Drinking Water-A Global Environmental Problem," J. Chern. Edu c. 2004, 81,207-213. Wentz, C. A. Hazardous Waste Management; McGraw Hill: New York, 1989 . Weston, R. E., Jr. "Climate Change and its Effect on Coral Reefs," J. Chern. Educ. 2000, 77, 1574-1577. Williams, K. R. "Refrigeration- From Ice Man to Ozone Hole," J. Chern. Educ. 2000, 77, 1540-1541. Yonkos, L. T.; Fisher, D. J.; Burton, D . T.; Whitekettle, W. K; Petri lie, 1. C. "Effectiveness of the Sulfur(lV) Compound, Sodium Bisulfite, in Reducing Chlorine, Chlorine Dioxide, and Chlorite Toxicity to Daphnia Magna in Well Water and Pond Water," Environ. Toxicol. Chern. 2001 ,20, 530-536.
9
Effects of Pollutants on the Biosphere: Biodegradability, Toxicity, and Risks
As shown in the previous chapter, numerou s pollutants may be classified in terms of the environmental sector on which they make an impact (e.g., air pollutants). They can also be classified according to the tran sformations that they undergo in the environment (e.g., chemical substances may be biodegradable or recalcitrant, as discussed below). More importantl y, the y can be classified by the hazards they pose to human health and the ecosys tems. The latter aspects are closely related to the chemical structure and characteris tics of the discharged substances and their interactions with the environment and its organis ms .
9.1 Types of Pollutants According to Their Capacity to Undergo Biotransformation Many pollutants can be degraded by certain microorganism s (i.e., they are biodegradable), while others lack the mechanisms necessary to break them apart or ass imilate them through metabolism. Alternati vel y, the degradation of a substance may occur very slowly, in such a way that the incorporation of its atom s into bio geochemical cycles will require a long time. Th ese last types of substances are called non-biodegradable or recalcitrant . In the following sections the two concepts are discussed in more detail.
198
9.1.1 Biodegradable Substances and Biodegradation Processes Although abiotic transformations of organic compounds may occur in the environment, such processes seldom, if ever, totally convert organic compounds into inorganic substances. The se processes are generally linked to oxidation , hydrol ysis, or photolysis reactions. On the other hand , biological processes may modify organic molecul es at their discharge sites or during transport. Such proce sses are largely a result of microbi olog ical activity, and they frequently bring about extensive modific ation in the structure and toxicolo gical properties of pollutants or potent ial pollut ants (see below ). As discussed in Chapter 7, microorganisms require organic or inorganic carbon sources, nitrogen, pho sphorus, sulfur, certain trace minerals, water, and an energy source for their maintenance and activity. That is, the biochemical liberation of energy in the absence of light requires electron donor s (e.g., oxidizable organic or inorganic substances) and electron acceptors (e.g., molecular oxygen, sulfate ions, nitrate ions, ferric compounds, carbon dioxide , or simple organic compounds). Biodegradation can be defined as the biologically-catalyzed reduction of the complexity of a substance. Several conditions must be satisfied for biodegradation to occur: • An organism must exist at the site and possess the necessary enzyme s.
Types of Pollutants According to Their Capacity to Undergo Biotransformation
• The target substance must be physically accessible to the degrading organism. (Inaccessibility may result if the substance is present in a different microenvironment, dissolved in a solvent that is not miscible with water, or sorbed onto a solid surface). • If the degrading enzyme is extracellular, the target bonds in the molecule must be exposed to this enzyme. • If the degrading enzyme is intracellular, the target molecule must penetrate the surface of the cell into the internal enzyme-acting sites . The population (or biomass) of bacteria or fungi acting on many synthetic compounds is typically small , and therefore the surrounding conditions must allow their proliferation for biodegradation to take place. The occurrence and abundance of microorganisms in an environment are determined not only by the available carbon, but also by physical and chemical factors such as dioxygen and nutrient availability, temperature, pH, salinity, and water activity. Biodegradation frequently leads to the conversion of organic compounds into inorganic substances. Such a conversion is called mineralization, which refers to the capacity of chemoheterotrophic microorganisms to transform organic compounds into inorganic products with the recovery of carbon and energy for the purpose of cell growth. Thus, the organism mineralizes organic carbon, nitrogen (e.g., as proteins), phosphorous (e.g., as phospholipids or nucleic acids), and sulfur (e.g., as organic sulfates or cysteine) to produce CO 2 as well as inorganic forms of N, P, and S (e.g., NH3, PO~-, SO~- and S2-) all of which are released and enter the surrounding environment. Plant and animal respiration are mineralization processes that degrade numerous organic molecules of living organisms; on the other hand, the mineralization of xenobiotics (see definition below) is almost always observed in microorganisms. Because of their ability to mineralize anthropogenic compounds, microorganisms play key roles in the biodegradation processes in polluted soils, waters, and sediments. A xenobiotic is a compound "foreign" to a particular organism (i.e., it does not participate in its normal biochemistry). A chemical that is "normal" to one organism may be foreign to another, and so xenobiotics may be natural or synthetic. They may
199
produce beneficial effects (e.g., pharmaceuticals) or toxic effects (e.g., Pb). Microorganisms bring about biodegradation in many different types of environments. Of particular relevance are sewage treatment systems, soils, underground sites for the disposal of chemical wastes, groundwater, surface waters, oceans, sediments, and estuaries. Natural microorganism communities in these various habitats possess an amazing physiological versatility. They are able to metabolize, and often mineralize, an enormous number of natural and xenobiotic organic molecules. There are cases when a substrate is not used for growth, but is metabolized in the presence of a second substrate that is used to support microorganism reproduction. This type of transformation is called cometabolism. Cometabolic conversions that apparently involve a single enzyme include hydroxylations, oxidations, denitrations, deaminations, hydrolyses, acylations, and cleavages of ether bonds. Many of these conversions are complex and involve several enzymes. This may be explained by the existence of enzymes that perform a single type of reaction, but which act on a series of closely related molecules.
9.1.2 Biotic Transformation Reactions A. Aerobic conditions Aerobic microorganisms can completely oxidize organic carbon to carbon dioxide, using dioxygen as the terminal electron acceptor. A.I Aliphatic compounds Aliphatic hydrocarbons include straight chain and branched structures. Industrial solvents, petroleum hydrocarbons, and the linear alkyl benzene sulfonates (LAS) are the primary sources of aliphatic hydrocarbon pollutants. Many microorganisms utilize aliphatic hydrocarbons as carbon sources . Long-chain n-alkanes are utilized more slowly due to the low bioavailability that results from their extremely low solubility in water. In contrast, short-chain n-alkanes show a higher aqueous solubility. Saturated and unsaturated aliphatics are readily biodegraded. Saturated molecules are oxidized with the aid of enzymes that use molecular oxygen (monooxygenases, see Figure 9.1), while the unsaturated ones become hydrated to form linear fatty acids, which are natural substrates for the
200
9. Effects of PoIlutants on the Biosphere
FIGURE
9.1. Oxidation of linear aliphatic hydrocarbons.
(3-oxidation pathway (see Figure 9.2). They are degraded to acetylCoA and then mineralized by respi ration. The biodegradability of aliphatics is negatively influenced by branches in the hydrocarbon chain. The degree of resistance to biodegradation depends on both the number of branches and their position in the molecule, because the (3-oxidation pathway RCHzCHzCHzCOOH
rCOASH
R CH z CH z CH z COSCoA NAD+
FNADH+H'
r:
CH3CH2C1
R CH z CH=CH COSCoA
R CH z CH CH z COSCoA
F= I
OH
NAD+
NADH+H '
R CHz CCHz COSCoA II
o
rCOASH R CHzCOSCoA
+
CH 3COSCoA FIGURE
may be blocked. Therefore, compounds with a quaternary carbon atom are extremely stable due to steric effects. A.2 Halogenated Aliphatics The biodegradability of aliphatics is also negatively influenced by halogen substitution. While monochloro-n-alkanes can be biodegraded, the presence of two or three chlorines on the same carbon significantly slows down this process. Chlorinated solvents are used extensively as indu strial solvents. As a result of improper use and disposal, they are among the types of organic pollutants most frequently detected in groundwater. Biodegradation of halogenated aliphatics occurs by: (a) Substitution. The halogens of a mono- or dihalogenated compound are substituted by a hydroxyl group as follows :
9.2. f3-0xidation pathway of fatty acids.
+ H20(l) ~ CH 3CH20H + H+ + cr (9.1)
(b) Oxidation. This is catalyzed by mono and dioxygenase enzymes that act on highly chlorinated C\ and C2 compounds. These enzymes are produced by bacteria to oxidize methane, ammonia, toluene, and other non-halogenated compounds. They do not show high substrate specificity and can participate in the cometabolic degradation of chlorinated aliphatics. As an example, the chemoautotroph Nitrosomonas europaea has NH3 as its natural energy source and CO 2 as its carbon source. It cometabolizes trichloroethylene, Ll-dichloroethylene, di- and tetrachloroethanes, chloroform, and other monochloroethanes (even fluoro- , bromo-, and iodomethane). See Figure 9.3. Aerobic conditions generally favor the biodegradation of compounds with a small number of halogens, while anaerobic conditions favor the
Types of Pollutants According to Their Capacity to Undergo Biotransformation
CHCI 3+ 1/ 2 0 2 -
201
HO-CCI 3
o
I \ H20 CIHC-C CI 2 ---"--+
HO I CIHC-CCI 2 I
H~OH~O CHO-COOH + 3CI-+3 H+
HCOOH + CO + 3 CI- + 3H +
FIGURE 9.3. Biodegradation of chloroform and trichloroethylene.
biodegradation of compounds with a greater number of substituents. Complete biodegradation of highly halogenated aliphatics is difficult under anaerobic conditions. A.3 Alicyclic hydrocarbons Alicyclic hydrocarbons are major components of petroleum (comprising from 20% to 67% of its volume) as well as components of plant oils and paraffins, microbial lipids, and pesticides. They range from simple molecules (e.g., cyclopentane and cyclohexane) to complex molecules (e.g., the pesti cides aldrin and kepone shown in Figure 9.4). Alicyclic hydrocarbon degradation is thought to occur primarily by comensalistic and cometabolic reactions as shown in Figure 9.5, where one organism converts cyclohexane into cyclohexanone (steps I and 2), but it is unable to lactonize and open the ring. A second organism, which is unable to oxidize cyclohexane to cyclohexanone, can perform reactions 3, 4 and the mineralization of the remaining aliphatic compounds. The rate of degradation of alkyl derivatives of this type of hydrocarbons decreases with the number of substituents. A.4 Aromatic hydrocarbons Most aromatic hydrocarbons are natural products, but their addition to the environment has increased dramatically through activities such as fossil fuel processing and utilization. Biodegradation of aro-
a
~
Cl
I
FIGURE 9.4 . Alicyclic pesticides (aldrin and kepone, respectively) .
matic compounds is accomplished by a wide variety of bacteria and fungi under a variety of environmental conditions. The most common initial transformation under aerobic conditions is hydroxylation, which involves the incorporation of molecular oxygen. See Figure 9.6. In general, bacteria transform aromatics by an initial dioxygenase attack to form cis-dihydrodiols. The molecule is then aromatized to form catechol. Other non-halogenated aromatic compounds are transformed into either catechol or protocatechuate. Then, through a series of oxidative cleavage reactions, catechol and protocatechuate are processed to yield either acetylCoA and succinate, or pyruvate and acetaldehyde. In general, aromatics composed of one, two, or three condensed rings with several types of substitutions are also transformed into catechol. See Figures 9.7a and 9.7b. The catechol ring is cleaved by a second dioxygenase, either between the two hydroxyl groups (artha pathway, Figure 9.8) or next to one of the hydroxyl groups (meta pathway), as shown in Figure 9.9. Eukaryotic microorganisms initially attack aromatics with a cytochrome P-450 monooxygenase, incorporating one atom of molecular oxygen into the aromatic species and reducing the second one to water, which results in their conversion into an arene oxide. This is followed by the enzymatic addition of water to yield a trans-dihydrodiol. See Figure 9.10. Alternatively, the arene oxide can be isomerized to form phenols, which can be conjugated with sulfate, glucuronic acid, or glutathione, compounds that aid in the elimination of aromatics from the organism. In general, aromatics composed of one to three condensed rings can be transformed and mineralized, whereas aromatics containing four or more condensed rings are transformed very slowly due to their increased hydrophobicity and toxicity.
202
9. Effects of Pollutants on the Biosphere
6
- - -LJ- - -."~ ~"~loo
r
cyclohexane 2H+
H20
/ cHoL HOOC ~CH20H ~2H+
.............. ............. HOOC./ 99% to the o-arylation product was achieved in the ing associated with catalyst leaching. Heck coupling of I-bromonaphthalene to butyl • The Friedel-Crafts acylation of toluene, chlorotolvinyl ether in [bmimjj Bfia]. In contrast, the same uene, and anisole with acetyl chloride in [emim] reaction in toluene, acetonitrile, DMF, or DMSO [Cll/AICl) gives excellent regioselectivities to the
O
0
rQ'rYl
12. The Minimization and Prevention of Pollution; Green Chemi stry
312 TABLE
12.5. Various enzymes used with ILs as solvents
Biocatalyst
Ionic liquid
Reaction
alkaline phosphatase a-chymotrypsin thermo lysine formate dehydrogenase Iipases
[H3NEt][N031 [emim)[[PF61 [bmim][ PF61 [mmim][ CH3S041 [bmim][ BF41, [bmim][ PF61 . other ILs
hydrolysis of pho sphate trans-esterification synthesis of Z-aspartame redox esterifications, trans-esterifications. kinetic resolution of secondary and allyli c alcohols
Source: Krag, 2002 .
para isomer (see Sheldon, 2001): o
[emimJ[CI1/AIC13(1:2;~ (12.14) where R = Mea, Me, or Cl; yields = 97-99%. • The application of ILs is most surprising and intriguing in the area of biotransformations. Many enzymes are catalytically active in ILs or in aqueous biphasic ionic liquid systems. Lipases maintain their activity in anhydrous IL media, and their enantioselectivity and operational stability are often better than in traditional media. See Table 12.5. In spite of their promising future, ILs have characteristics that may not be very kind to the environment, especially when they have to be discarded. This aspect should be carefully considered. One should seek to combine the cationic and anionic elements that are adequate for the process yet will represent the minimum environmental impact.
12.3.8.2 Fluorous Compounds and Solvents Fluorous compounds and solvents have emerged as powerful tools in modem synthetic organic chemistry. The concept ofjluorous biphasic system andjluorous biphasic catalysis is based on catalysis through the use of reagents that have perfluorinated carbon chains. Fluorous molecules typically have two domains: the organic domain that resembles a standard organic parent molecule and dictates its reactivity, and the fluorous domain, which is a highly fluorinated group that controls the separation features of the molecule. Fluorous domains are often
perfluoroalkyl groups. For example, the so-called FC-72 is a solvent mixture consisting mostly of perfluorohexanes, and it boils at 56°C. The FC-72 mixture and related solvents (perfluorohexane, perfluoroheptane, perfluorodecalin) show some unique properties which render them attractive alternatives to conventional organic solvents : they are outstandingly inert against chemical treatment, predominantly those of the non-polar type , and they have high thermal stability which allow s for reactions under relatively drastic conditions. Because they are immiscible in water and in most common organic solvents, they represent a third liquid phase-the jluorous phase. Individual components of reaction mixtures, which bear perfluoroalkyl substituents of sufficient size and number, can be selectively extracted into the fluorous phase. This is the base of the so-called jluorous synthesis. Fluorous biphasic catalysis exploits not only this principle, but also the ability of certain perfluorocarbon/hydrocarbon biphasic mixtures to form a homogenous solution at high temperatures. An extremely fluorinated catalyst can thus be applied under homogeneous conditions and recovered from the fluorous phase subsequent to a phase separation step at lower temperatures. Fluorous biphasic catalysis was first reported with the hydroformylation reaction depicted in Figure 12.16 (Curran and Lee , 2001). To effect the reaction, one heats a biphasic mixture of an alkene, toluene (the organic solvent), a fluorous phosphine, a standard Rh salt, perfluoromethylcyclohexane (the fluorous solvent), CO, and H2. When the hydroforrnylation is complete, the mixture is cooled so as to induce the phases to separate. After cooling, the toluene phase containing the organic products is separated from the fluorous
Green Chemistry
313
CgH17CH=CH2 + CO /Hz
C6HSCH3/Q;F11CF3 -------;~~
FIGURE
(C6F 13CH2CH2)3P Rh(COh
12.16. Fluorous hydroformylation reaction .
phase containing the catalyst. This fluorous phase can then be reused to catalyze another reaction. Therefore, the technique can in effect be considered as a liquid-phase catalyst immobilization method . A number of these useful reactions utilize organic/ fluorous solvent pairings that are miscible at higher temperatures but which separate upon cooling. Another example is the trans-esterification reaction shown in Figure 12.17, performed at ISO°C with equimolar amounts of the alcohol and the ester, which gives a 99 % yield. This reaction uses a fluorinated tetraalkyldistannoxane catalyst in perfluorohexanes. Here, the catalyst and solvent form one layer, while the ester and alcohol reactants form a separate organic layer. On heating, the two layers are sufficiently miscible for the reaction to occur; on cooling, the organic and fluorinated layers separate. The pure ester is recovered by evaporation of the ethanol co-product. The catalyst can be recovered from the perfluorocarbon solvent. The variety of separation processes offered by fluorous chemistry will undoubtedly continue to have an impact on new synthetic methods requiring efficient separation procedures. Besides being compatible with a wide variety of chemical reactions, fluorous chemistry works well with several new synthetic technologies, including automated synthesis, the use of supercritical CO 2, and microwave synthesis .
12.3.8.3 Supercritical Fluids A supercritical fluid is a substance above its critical point (i.e., above its critical temperature and pres-
90%, but significant material breakdown occurs above 60%. As the starch content increases, the polymer compos-
ites become more biodegradable and leave less recalcitrant residues . Starch-based polymers are often blended with high-performance polymers (e.g., aliphatic polyesters and polyvinyl alcohols) for different applications. Biodegradation of starch -based polymers is a result of enzymatic attack at the gluco sidic linkages between sugar groups, leading to a red uction in chain length and the splitting off of sugar unit s (i.e., monosaccharides, disaccharides, and oligosaccharides) that are readily utilized in biochemical path ways. At lower starc h contents (i.e., less than 60 %) the starch particles act as weak links in the plastic matrix and become sites for biological attack. The polymer matrix can therefore disintegrate into small frag ments, but this does not mean that the entire polymer structure will actually biodegrade. Thermoplastic starch polymers are generally used as films in shopping bags , bread bags, bait bags, over wrap, "flushable" sanitary product backing material, and mulch films.
12.3.11 Optimize Monitoring and Control Include in-process, real-time monitoring and control during product synthesis to minimize or eliminate the formation of by-products. The term process analytical chemistry implies real-time meas urement of reaction conditions during chemical synthesis, coupled with the abili ty to alter the reaction depending on the outcome of such analyses. A considerable amount of research is curre ntly being done in the field of process analy tica l chemistry. The tech nique is particularly applicable to biotechnological syntheses, where the reactions are usually quite complex and the value of the resulting product is high, thus making process analytical chemistry cost effective. An area for analytical chemists to focu s on is the development of meth ods and technology that will allow preventing and reducing the generation of hazardous subs tances in chemical processes. In order to be able to effect changes, we require reliable sensors, monitors, and analytical techniques to assess the hazards in process streams. When toxic substances (e.g., by-products and side reactions)
320
12. The Minimizationand Preventionof Pollution; Green Chemistry
are detected, their formation may normally be controlled or prevented. The use of process analytical chemistry can be further exemplified in the monitoring of reactions to observe their progress and determine their completion. In many cases, chemical processes require the continuous addition of reagents until the reaction is completed. If there is real-time, in-process monitoring to allow completion follow-up, then the need for adding more reagents can be eliminated and there will be none in the waste stream.
12.3.12 Minimize the Potential for Accidents In process design, chemicals and their phase (solid , liquid, or gas) should be selected in such a way that the potential for chemical accidents (including explosions, fires, and releases to the environment) is minimized. The hazards posed by toxicity and by the risk of explosion and flaming also need to be addressed in the design of chemical products and processes. The goals of green chemistry must involve the full range of dangers and should not be focused merely on pollution or ecotoxicity.
Minimizing waste of a solvent in a given process may inadvertently increase the accident potential. Even though such an action may be beneficial from the perspective of pollution and release to the environment, it may also heighten the potential for a chemical accident or a fire, for example due to product dryness. A process must balance pollution prevention against accident prevention. Approaches to the design of inherently safer chemistry can include the use of solids or low-vapor pressure substances as opposed to the volatile liquids or gases associated with most chemical accidents. Another approach consists in avoiding the use of large quantities of molecular halogens by substituting them with halogenated reagents that can be transferred in a more innocuous manner. Hazards may be reduced if a process involves near-ambient temperatures and pressures. Thermal separations, such as distillation and evaporation, as well as solvent extractions can be risky operations. It is better to use, for example, more environmentally friendly separation techniques such as gas membranes or adsorption, which are separations that do not require heating of volatile solvents, and to reduce the number of separation stages.
Related Experiments in the Companion Book 20. Metal ion recovery by cementation
21. Green chemistry: The recovery and reuse of sulfur dioxide
Additional Related Experiments/Activities Andrews, L.; Smith, W. L. "The Liquid Phase of Carbon Dioxide: A Simple Lecture Demonstration," J. Chern. Educ. 1989,66,597-598. Arnaiz, F. J.; Pedrosa, M. R. "Microscale Transformations of Some Lead Compounds. A Cycle for Lead Minimizing the Production of Wastes ," J. Chern. Educ. 1999, 76, 1687-1688. Bauer, R.; Birk, J.; Sawyer, D. Laboratory Inquiry in Chemistry, 2nd ed.; Brooks-Cole: Stamford, CT,2005. • How can the waste be made useful? (Experiment 6) • Is it economical to recycle aluminum? (Experiment 12)
Brodemus, J. S. "Obtaining the Coming Catalytic Combustor: A Low-Cost Method to Demonstrate Catalysis," J. Chern. Educ. 1989,66,768. Buell, P.; Girard, J. Laboratory Manualfor Chemistry Fundamentals, 2nd ed. ; Jones and Bartlett: Boston, MA, 2002 • Classification of plastics for recycling (Experiment 18) Cann, M. C. "Bringing State-of-the-Art, Applied, Novel, Green Chemistry to the Classroom by Employing the Presidential Green Chemistry Challenge Awards," J. Chern. Educ. 1999, 76, 1639-1641.
Green Chemistry
Cave, G. W. Y.; Raston, C. L. "Green Chemistry Laboratory: Benign Synthesis of 4,6Dipheny 1[2,2']bipyridine via Sequential Solventless Aldol and Michael Addition Reactions," J. Chern. Educ . 2005,82,468-469. Clarke, N. R.; Casey, J. P.; Brown, E. D.; Oneyma, E.; Donaghy, K. J. "Preparation and Viscosity of Biodiesel from New and Used Vegetable Oil. An Inquiry-Based Environmental Chemistry Laboratory," J. Chern. Educ . 2006,83,257-259. Crumbie, R. L. "Environmentally Responsible Redox Chemistry: An Example of Convenient Oxidation Methodology without Chromium Waste," J. Chern. Educ. 2006,83,268-269. Donahue, C. J.; Exline, J. A.; Warner, C. "Chemical Recycling of Pop Bottles: The Synthesis of Dibenzyl Terephthalate from the Plastic Polyethylene Terephthalate," J. Chern. Educ. 2003,80, 79. Doxsee, K. M.; Hutchison, J. E. Green Organic Chernistry: Strategies, Tools, and Laboratory Experirnents; Thomson-Brooks/Cole Publishing: London, 2004. EI-Halwagi, M . M .; Spriggs, D. H. "Educational Tools for Pollution Prevention through Process Integration," Chern. Eng. Educ. 1998 ,32,246249. Harper, B. A.; Rainwater, J. C, Birdwhistell, K.; Knight, D. A. "Aqueous-Phase PalladiumCatalyzed Coupling. A Green Chemistry Laboratory Experiment," J. Chern. Educ. 2002, 79, 729-731. Harris, M. E.; Harris, H. H. "Sorting Recycled Trash ," J. Chern. Educ. 2007,84,207-210. Ingles, M.; Bonete, P.; Exposito, E.; GarciaGarcia, Y.; Gonzalez-Garcia, J.; Iniesta, J.; Montiel, V. "Electrochemical Regeneration of a Spent Oxidizing Solution: Example of a Clean Chemical Process," J. Chern. Educ. 1999, 76, 1423-1425. Jacobsen, E. K. "JCE Resources for Chemistry and Recycling," J. Chern. Educ. 2007,84,212-213. Johnston, J. E. "Catalysis and Cleanliness," J. Chern. Educ . 1969,46, A547. Kaufman, D.; Wright, G. ; Kroemer, R; Engel, J. "New Compounds from Old Plastics: Recycling
321
PET Plastics via Depolymerization. An Activity for the Undergraduate Organic Lab," J. Chern. Educ. 1999, 76, 1525-1526. Kirchhoff, M.; Ryan , M. A., Eds: Greener Approaches to Undergraduate Chernistry Experiments; American Chemical Society: Washington, 2002. (The following experiments are all authored by John C. Warner) : • Biosynthesis of ethanol: renewable feedstock and enzyme catalysis (p. 11) • Benzoin condensation using thymine as a catalyst instead of cyanide (p. 14) • Water soluble catalysis: aqueous analogue of the Grignard reaction (p. 23) • Synthesis of7-hydroxy-4-methylcoumarin by a solid-catalyzed Pechmann reaction (p. 25) • Construction of solar energy devices with natural dyes (p. 42) • Aqueous photoresists (p. 45) • Microwave-assisted Diels-Alder reaction of anthracene and maleic anhydride (p. 85) Mattson, B. ; Fujita, J.; Catahan, R.; Cheng, W.; Greimann, J.; Khandhar, P.; Mattson, A.; Rajani , A.; Sullivan, P.; Perkins, R. "Demonstrating Heterogeneous Gas-Phase Catalysis with the Gas Reaction Catalyst Tube," J. Chern. Educ. 2003,80,768-773. Meyer, S. A.; Morgenstern, M. A. "Small Scale Biodiesel Production: A Laboratory Experience for General Chemistry and Environmental Science Students," Chern. Educ. 2005, 10, 130132. Maya, H. D.; Neves, E. A.; Coichev, N. "A Further Demonstration of Sulfite-induced Redox Cycling of Metal Ions Initiated by Shaking," J. Chern. Educ . 1999, 76, 930-932. Pohl, N.; Clague, A.; Schwarz, K. "Chiral Compounds and Green Chemistry in Undergraduate Organic Laboratories: Reduction of a Ketone by Sodium Borohydride and Baker's Yeast," J. Chern. Educ. 2002, 79, 727-728. Reed, S. M.; Hutchison, J. E. "Green Chemistry in the Organic Teaching Laboratory: An Environmentally Benign Synthesis of Adipic Acid", J. Chern. Educ. 2000, 77, 1627-1629.
322
12. The Minimization and Prevention of Pollution; Green Chemistry
Orecchio, S. "Recovery and Reutilization of Waste Matter from Coffee Preparation. An Experiment for Environmental Science Courses," J. Chern . Educ. 2001 , 78, 1669-1671 . van Wyk, J. P. H. "Conversion of Used Paper Materials into Sugars: A Biochemical Process to Limit Environmental Pollution," Chern . Educ. 2000,5,315-316.
Venditti, R. A. "A Simple Flotation De-Inking Experiment for the Recycling of Paper," J. Chern. Educ.2004,81,693 .
Vidal, M. M.; Filipe, O. M. S.; Cruz Costa, M. C. "Reducing the Use of Agrochemicals: A Simple Experiment," J. Chern. Educ. 2006,83,245247.
References and Further Reading American Chemical Society's Education and Internatinal Activities Division, U.S. Environmental Protection Agency's Green Chemistry Program, Office of Pollution Prevention and Toxics . " Innovations for a Cleaner World". Video . http ://www.chemistry.org/portal/a/c/s/ 1/acsdisplay.html?DOC=education%5cgreenchem% 5cvideo.html American Chemical Society. Green Chemistry: Meeting Global Challenges; Green Chemistry on DVD, American Chemical Society: Washington, 2002. American Plastics Concil. http ://www.americanplastics council.org/s.apc/sec.asp? CID=296&DID=895 Ana stas , P. T.; Warner, J. C. Green Chemistry. Theory and Practice; Oxford University Press: Oxford, 2000. p.30. Anastas, P. T.; Williamson, T. c.. Eds . Green Chemistry: Designing Chemistry for the Environment; ACS Symposium Series 626 ; American Chemical Society: Washington, 1996. Cann, M. C; Connally, M. E. Real- World Cases in Green Chemistry; American Chemical Society: Washington, 2000. Cann, M. C.; Dickneider, T. A "Infusing the Chemistry Curriculum with Green Chemistry Using Real-World Examples, Web Modules, and Atom Economy in Organic Chemistry Courses," J. Chern. Educ. 2004, 81, 977-980. Carmichael, A. J.; Earle , M. J.; Holbrey, J. D.; McCormac, P.B. ; Seddon, K. R. "The Heck Reaction in Ionic Liquids: A Multiphasic Catalyst System ," Org. Lett. 1999,1,997-1000. Chemical Logic Corporation. http://www.chemicalogic. corn/down10ad/c02_phase_diagram.pdf Curran, D., Lee, Z. " Fluorous Techniques for the Syn thesis and Separation of Organic Molecules," Green Chern. 2001 , 3(1), G3-G7. Curzons, A D.; Constable, D. J. c.. Mortimer, D. N.; Cunningham, V. L. "So You Th ink Your Process is Green, How do You Know?-Using Principles of Sus-
tainability to Determine what is Green-A Corporate Perspective," Green Chern. 2001,3(1),1-6. Domenech, X. ; Ayllon, J. A ; Peral , J.; Rieradevall, J. "How Green is a Chemical Reaction? Application of LCA to Green Chemistry," Environ. Sci. Technol. 2002, 36,5517-5520. Draths, K. M.; Frost, J. W. " Environmentally Compatible Synthesis of Adipic Acid from D-Glucose," J. Am. Chern. Soc. 1994, 116,399-400. DuBay, K.; Schweitzer, J.; Dunn, T.; Keoleian, G. A.; Osborn, N. A "Annotated Bibliography of Chemistry-Related Pollution Prevention Sources," National Pollution Prevention Center for Higher Education. http ://css.snre.umich.edu/ Huddleston, J. G.; Visser, A. E.; Reichert, W. M.; Willauer H. D.; Broker, G. A ; Rogers, R. D. "Characterization and Comparison of Hydrophilic and Hydrophobic Room Temperature Ionic Liquids Incorporating the Imidazolium Cation," Green Chern. 2001,3, 156-164 (see also http ://lem.ch.unito.it/didattica/infochimica/ Liquidi%20Ionici/GreenAspects.html and http://pb. merck.de/servlet/pB/menu/1 06l480/index.html) . Hutchinson, J. University of Oregon, Green Chemistry Program. http ://darkwing.uoregon .edu/hutchlab/ greenchern/index.html Illman, D. L. "GREEN Technology Presents Challenges to Chemists", Chern. Eng. News, Sept. 6,1993, pp. 2630. Kidwai, M. "Dry Media Reactions," Pure Appl. Chern. 2001 ,73, 147-151. Kirchhoff, M. M. "Topics in Green Chemistry," J. Chern. Educ. 2001, 78, 1577 . Krag1, U.; Eckstein, M.; Kaftzik, N. "Enzyme Catalysis in Ionic Liquids," Curro Opin. Biotechnol. 2002 , 13, 565-571. Laschowski, Andre. Postdam University . http ://www. chem.uni -potsdam. de/ape/polymer.toppage.html Li, C. J.; Chan, T. H. Organic Reactions in Aqu eous Media; Wiley : New York, 1997 .
Green Chemistry McKenzie , L. c.; Huffman, L. M.; Parent , K. E.; Hutchison, J. E.; Thompson, J. "Patterning Self-Assembled Monolayers on Gold . Green Materials Chemistry in the Teaching Laboratory," J. Chern. Educ. 2004, 81, 545-548. Monteiro, A. L.; Zinn , F. K.; de Souza, R. E; Dupont, J. "Asymmetric Hydrogenation of2-Arylacrylic Acids Catalyzed by Immobilized Ru-BINAP Complex in I-nButyl-3 -Methylimidazolium Tetrafluoroborate Molten Salt," Tetrahed. Asyrnrn. 1977,8,177-179. Narender, N.; Srinivasu, P.; Kulkarni , S. J.; Raghavan, K. V. "Liquid Phase Acylation of Amines with Acetic Acid over HY Zeolite," Green Chern. 2000,2, 104-105. Nilcher, M.; Ondruschka, B.; Bonrath, W.; Gum , A. "Microwave Assisted Synthesis-A Critical Technology Overview," Green Chern. 2004 ,6, 128-141. Ono , Y. "Dimethylcarbonate for Environmentally Benign Reactions," Pure Appl. Chern. 1996, 68 , 367-375. Overmeyer, A.; Schrader-Lippel, S.; Kasche , V.;Brunner, G. "Lipase-catalyzed Kinetic Resolution of Racemates at Temperatures from 40°C to 60°C in Supercritical CO z," Biotech . Lett. 1999,21,65-69. Pillai, U.; Sahle-Demessi, E. "Selective Hydrogenation of Maleic Anhydride to ')'-Butyrolactone over Pd/Al-O, Catalyst Using Supercritical CO z as Solvent," Chern. Commun. 2002 ,5,422-423. Ritter, S. K. "Green Rewards ," Chern. Eng. News , June 30,2003. pp. 30-35. Ryan, M. A.; Tinnesand, M. J. Eds .lntroduction to Green Chemistry; Americ an Chemical Society: Washington, 2002 . Schiel, Ch.; Oelgemoler, M.; Ortner, J.; Mattay, J. "Green Photochemistry : The Solar-Chemical ' Photo-FriedelCrafts Acylation' of Quinones," Green Chern. 2001,3, 224-228. Sheldon, R. "Catalytic Reactions in Ionic Liquids ," Chern. Commun. 2001,23,2399-2407.
323 Sheldon, R. A. "Catalysis and Pollution Prevention," Chern. Ind. 1997, (Jan . 6), 12-15. Sijbren, 0 .; Engberts, J. B. F. N. "Diels-Alder React ions in Water," Pure Appl. Chern. 2000, 72, 1365-1372. Sime, J. T. "Applications of Biocatalysis to Industrial Processes," J. Chern. Educ. 1999,76, 1658-1661. Singh, M. M.; Szafran, Z.; Pike, R. M. "Microsca le Chemistry and Green Chemistry: Complementary Pedagogies,' J. Chern. Educ . 1999, 76,1684-1686. Song, Y.; Wang, Y.; Geng, Z. "Some Exercises Reflecting Green Chemistry Concepts," J. Chern. Educ. 2004,81 , 691-692. Steines, S.; Wasserscheid, P.; Driessen-Holscher, B. "An Ionic Liquid as Cataly st Medium for Stereoselective Hydrogenations of Sorbic Acid with Ruthenium Complexes," J. Prakt. Chern. 2000 ,342,348-354. Trost, B. M. "The Atom Economy-A Search for Synthetic Efficiency," Science 1991, 254,1471-1477. Tsukinoki, T.; Hirohisa, Tsuzuki. "Organic Reaction in Water. Part 5. Novel Synthesis of Aniline s by Zinc Metal-Mediated Chemoselective Reduction of Nitroarene s,' Green Chern. 2001 ,3,37-38. Tundo, P. "New Developments in Dimethylcarbonate Chemistry," Pure Appl. Chern. 2001 , 73, 1117-1124. Uffelman, E. S. "News from Online: Green Chemistry," J. Chern. Educ. 2004 ,81 ,172-176. VanArnum, S. D. "An Approach Towards Teaching Green Chemistry Fundamentals," J. Chern. Educ. 2005 , 82, 1689-1692. Welton, T. "Room-Temperature Ionic Liquids. Solvents for Synthesis and Catalysis," Chern. Re v. 1999, 99, 2071-2083 . Xiang, J.; Toyoshima, S.; Orita , A. ; Otera, J. "A Practical and Green Chemical Proces s: Fluoroalkyldi stannoxane-catalyzed Biphasic Tran sesterification," Angew. Chem., Int. Ed. , 2001, 40 , 3670-3672.
Index
1,3-Butadiene, 168 2,4,5-T, 205 2,4-0, 205 2,4-0, biodegradation, 204 Abiotic factors, 144 Abiotic transformations 3--6, 9, 198 Abrasion, 81 Absorbed dose unit (Gray, Gy) 63 Absorptivity, 60, see also Molar extinction coefficient Acceptable daily intake (ADI), 223 Acenaphthylene , rate of biodegradation, 206 Acetaldehyde, 20 I, 203 Acetyl eOA, 201 Acid deposition, 99, 101,117,11 9, 178 Acid mine drainage (AMD), 116, 119, 189 Acid neutralizing capacity (ANC) , 118, 119,1 21 Acid rain, 99, 178 Acid soluble fraction, 189 Acid-base characteristics of species , 17, 22 Acid-base reactions, 116 Acidic oxide, 22 Acidogenesis, 281, 282 Acrylonitrile, 168 Activated carbon, 254 , 264, see also Activated carbon Activated charcoa l, 254, see also Activated carb on Activated complex, 54 Activated complex, tran sition state, 54 Activated sludge system, 277, 278 Activation energy (Ea), 54 Activation , 4, 5, 9 Activit y coefficient ('y ), 12 Acylamide herbicides degrad ation , 207 Adipic acid, biodegradation, 202
Adipic acid, Draths-Frost synthesis, 30 I Adipic acid, traditional synthesis, 300 Administered dose, 209 Adsorption breakthrough, 265 Adsorption processes, 264 Adsorption, 97, 106, 108, 116, 122, 123, 125, 128, 129, 130 Advanced oxidation processes (AOP), 249 Aerobic attached-growth processes, 277 , 278 Aerobic processes, 101, 105, 107, 108, III , 112, 114,277 Aerobic suspended-growth processes, 277 Aerob ic treatments, see Aerobic processes Aerosols, 174 Aerosols, seawater, 99, 101, 117, 132 Aerotolerant anaerobic organisms, 141 Aflatoxin b I , biotransformation, 2 18 Africa, 101, 102, 104 Agriculture, 188 Air emissions, 169 Air pollution, 99, 104 Air stripping, 268 Air, 69-74 Airborne compounds, 97 Air-to-fuel ratio, 175, 176 Albedo , 74 Aldrin , 20 1 Alicyclic hydrocarbon s, biotic transformation, 20 I Aliphatic compounds, biotic transformation, 199-200 Alkalinity, 98, 99, 102, 103, 106, 114, 115,117-122,127,132-134 Alumino silicates, 92 Aluminum aqueous system, 32- 37 Aluminum hydroxide, 124
Aluminum ions, 102, IOJ, 116, 122, 124, 125 Alum inum sulfate, 168 Aluminum, 102, 103, 124, 125, 130 Amazo n river, 103 Amensalism, 147 Americum- 24 I , 186 Am ino acids, 101, 118, 122, 129 Amm onia vapors, 265 Ammonia/nitrate aqueous sys tem, 41 Ammonification, 153 Ammonium ion, 99,100, 101, IOJ, 105, 117,127 Ammonium nitrate , 168 Ammonium sulfate, 168 Ammonium sulfide, 99 Amphib ole, 80 Ampholytes, I4 Amphoteric oxide, 22 Anaerobic digestion, 289 Anaerobi c filter, 282, 283 Anaerobic process, 105, 108, 111-11 4 Anaerobic treatment s, 276 , 281-283 Analysis, environmental sample, 6-8 Aniline, 168, 173 Anion exchange capacity (AAC) , 130 Anoxic sediments, 157 Anoxic, 99, 105, 131 Anthra cene , biodegradation , 202, 206 Anthranilic acid, biodegradation , 202 Antifouling agents, tributyltin oxide, 298 Aquated electrons, 250 Aquatic fauna , 101 Aquatic flora, 101, 112, 117, 131 Aquifer, 96, 105, 106, 109 Aquifers, biorestoration, 292 Aquifers, physical containment, 292 Aquifers, treatment, 292 Archaea, 138 Aromatic degradat ion, meta pathway, 20 1, 203
325
Index
326 Aromatic degradation, ortho pathway, 202,203 Aromatic hydrocarbons, biotic transformation, 201-204 Arrhenius' equation, 54, 58 Arsenic (III), 237 Arsenic (V), 237 Arsenic crisis, 265 Arsenic, 266 Artesian well, 106 Artie circle, 5 Assessment, dose-response, 22 I Assessment, exposure, 22 1, 226 Assessment, human health risk, 220 Associative and dissociative mechanisms, 50 Athalassohaline, 108, 109 Atmo sphere, 3, 6, 4, 69-74, 76 Atmosphere, 96, 97, 99, 100, 106, 107, 110, 115, 116, 132 Atmospheric composition, transport, 97, 99,101 ,102,107,110,113,116,117 Atmospheric deposition , 103 Atom economy, 305 Atom ic number, 62 Autotrophs 141, 142, 154 Auxiliary chemicals, minimization, 308 Bacteria, 139 Bacteria, facultative anaerobic, 252 Baltic sea, 107 Band gap energy, 25 I Barbier-Grignard reaction, 304 Barium sulfate, 260 Basic oxide, 22 Basification, 117 Becquerel (Bq), 63 Beer's law, 60 Benz(a)anthracene, biodegradation rate, 206 Benzaldehyde, biodegradation, 202 Benzene, 168 Benzene, biodegradat ion, 202, 203 Benzo(a)pyrene , 6 Benzoic acid, biodegradation, 202 Benzoic acid, biotransformati on, 217 Benzyl alcohol, biodegradation, 202 Bicarbonate ion, 99, 102-104, 106, 109, 120 Bimolecular, 54 Binding capacity, 122 Bioaccumulati on factor (BAC), 232 Bioaccumu lation, 5, 216 Bioactivation, 2 16 Bioassay data, animal, 221 Bioaugrnentation, 291 Bioavailability, 7, 10 Biocatalyst, 9
Biochemical oxygen demand (BOD), 182, 277 Biochemical processes, I 10, I 16 Biocides, 189 Bioconcentration potential factor, 2 16 Bioconcentration, see Bioaccumul ation Bioconversion factor (BCF), 232 Biodegradable plastics, starch-based, 3 19 Biodegradable polyesters, 3 19 Biodegradable polymers, synthesis, 3 I8 Biodegradable synthetic polymers, 206 Biodegradation, 5, 10, 101, 102, 198 Biofilm reactors, 278 Biofilm, 277 Biofiltration, 294 Biofouling control, 247 Biogenic contributions, 103, 131 Biogeochemical cycle, 3-6, 96-98, 148 Biogeochemical cycles, interrelations, 160--161 Bioindicators, 232 Biological activity, 101-103, 108, 122 Biological nutrient removal, 283 Biological nutrient removal, double-sludge system, 286 Biological nutrient removal, single-sludge system, 285 Biological phosphorus removal, 285 Biological treatment, 277 Biomagnification, 232 Biomarkers, 233 Biomass, 105 Biomes, 99, 143 Biopolymers, 102 Bioreactors, above-ground , 293 Bioremediation, 290 Bioremediation, in situ, 29 1 Biosolvents, 316 Biosphere, 3, 4, 98, 107, 143 Biota, 4 Biotic factors, 144 Biotic process, 3-6, 10 Biotic transformation reaction s, 199-204 Biotic transformation reactions, anaerobic, 204 Biotransformation reactions, phase I, 215 Biotransformation reactions, phase II , 2 16, 2 17 Biotransformations, 303 Bioventing, 291 Biphenyls, 205 Biphenyls, toxicity, 208 Black Amazon river, 103 Borate system, 118 Borohydrides, 254 Brackish water, 105, 108 Breakpoint chlorination, 242 Brines, 97, 108, I 10 Bromide ion, 102, 108, 110, 127
Brown water lakes, 104, 107 Brownian movements, 125 BTEX, 175 Buffer intensity, 19, 20 Buffering capacity, 19,20,11 7- 119, 121, 132,1 33,1 34 Buffering index, 19, 20, 118 Buffers, 17 Calcareous rocks, 102, 103, 106 Calcite, 12,80,100, 103, 117, 131, see also Calcium carbonate Calcium carbonate, 99, 100, 106, 117, 118,121,1 22, 131, 1 3 3 , see a~o Calcite Calcium ion, 99-102 , 106-110, 117, 118,122,130,1 31, 133 Caldera lake, 104 Cameroon, 104, 115 Cancer slope factor, 225 Capture area, 104 Carbohydrates, 101 Carbon cycle, 149-152, 151 Carbon dioxide,99, 101, 104-106 , 111-119,1 28, 132,1 33,173, 179, 262 Carbon dioxide, supercritical, 3 13, 314 Carbon dioxide, supercritical, enzyma tic reaction, 315 Carbon dioxide, supercritical, hydrogenation reaction, 314 Carbon disulfide, 99, 266 Carbon efficiency, 307 Carbon monoxide, 173, 179 Carbonaceous biochemical oxygen demand (CBOD), 182 Carbonate ion, 99, 108, 114, 115, 118-1 22, 127 Carbonate system, 104, 118 Carbonic acid, 114, 115, 118 Carbon yl sulfide, 99 Carcinogen, possible human, 224 Carcinogen , probable human, 224 Carcino gen, risk, 227 Carcinogenic potential (slope factor) , 6, 7 Carcinogenic, 6, 7 Carcinogenicity, 220 Carnivores, 145 Carp, 181 Catalysis 57, 58 Catalyst, 9 Catechol, 20 1, 202 Cation exchange capacity (CEq , 130 Cell, eukaryotic, 138 Cell, prokary otic, 138 Cellulose, 102, 124 Cellulosic fibers, 168 Cement, Portland , 265 Cementation , 254 Central America, 104
327
Index Cerium-141, 186 Chalcophiles, 79, 80 Chelate effect, 48 Chelates and chelating agents , 48 Chemical coagulation, 255 Chemical oxygen demand (COD) , 7,181 Chemical species distribution diagram, 14 Chemisorption, 128 Chemoautotrophs, 141, 142, 156 Chemoheterotrophs, 141, 142 Chemolithotrophs, 141, 142, 149, 154, 156-160 Chemorganotrophs, 141, 142 Chemotrophs , 140 Chloramines, 239-241 Chloride ion, 99-104, 106, 108, 109, 131,133,134 Chlorine dioxide, 244, 245 Chlorine, 168,239,262 Chlorine, available, 241, 242 Chlorine, demand, 242 Chlorine, residual, 241, 242 Chlorofluorocarbons (CFC) , 5, 175 Chloroform, biodegradation, 201 Chlorophyll, 105 Cholera, 183 Chromate, 172, see also Chromium VI Chromium (III), 237 Chromium (VI), 237, see also Chromate Chromium-51,186 Chrysene, rate biodegradation, 20t' Clade, 138 Cladistics , 138 Clay incorporation, 265 Clay, 92, 93, 102, 105, 124-126, 128-131 Clean Air Act, 173, 175 Clean Water Act, 183 Climatic regimes, 97, 101, 102 C02 concentration, 176, see also Carbon dioxide Coagulation , 255 Coal burning, 176 Cobalt-57 , 186 Cobalt-60, 186 Coliform bacteria, 183 Collision frequency, 51 Collision theory, 51 Colloid specific surface, 125 Colloid, 97, 105, 124-126, 128-132 Colloidal sols, 124 Combined treatments, 268 Combustion processes, 175 Combustion, incomplete, 173 Cometabolism, 199 Commensalism , 146 Community, 144 Competition, 146
Competitive exclusion principle, 147 Completely-mixed aerated system, 279 Complex flotation, 259 Complex, formation , 14, 122, 129, see also Complexation Complex, inner sphere, 129 Complex, ligand like, 129 Complex, metal, 122, 127-129, 132, 133 Complex, outer sphere, 129 Complexation processes, 258 Complexation, 106, 116, 122, 123, 128 Complexes 43, 50, 58, see also Coordination compounds Complexes, inert, 50 Complexes, labile, 50 Complexes, metal, ligand, hydroxo, 102, 107, 122, 123, 127-129, 131-133 Complexes, quasi labile, 50 Complexes, slowly labile, 50 Composting , 289, 292 Condensation, 99 Conditional constant, 12 Conductivity, 98, 103, 108, 110, 133, 186 Confining layer, 105 Conjugate acid-base pairs, 117, 118, 129 Consecutive reaction, 56 Conservative elements , 107 Consumers, primary, 145 Consumers , secondary, 145 Consumers, tertiary, 145 Contact stabilization, 279 Coordination compounds , 43, see also Complexes Coordination number, 46 Coprecipitation, 106, 116, 122, 123, 128 Corona discharge, 245 Critical point, 248 Crust, 78-82 Crust, continental , 78 Crust, oceanic, 78 Crustal spreading , 109 Crystal growth, 90 Crystallization rate, 90 Cultural eutrophication, 183 Cumene, 168 Cumulative damage, 211 Curie (Ci), 63 Cyanide, 9, 171,239 Cyanobacterial toxins, 266 Cyclic salts, 132 Cyclohexane , biodegradation, 202 Cyclosilicates, 80 Cytochrome P-450 monooxygenase system, 201 Daughter nuclide, 62 DDE, 6, 205 DDT, 5, 6, 205, 207 Dead sea, 108, 109
Decay constant, 62 Decay kinetics, 62 Decomposers, 145 Degree of dissociation (flvl) , 58 Dendrimers, 258 Denitrification, 154, 284 Deposition upon cooling , 81 Desulfovibrio desulfuricans, 83 Detection levels, 7 Detection of radiations, 64 Detection of radiations, Geiger counter, 64 Detection of radiations, photographic films, 64 Detection of radiations, scintillation counter, 64 Detection of radiations, semiconductors, 64 Detection of radiations , thermoluminescence, 64 Detergents, 185 Detoxification, 216 Dibenzofurans, 205 Dichloroacetic acid (DCA), 188 Dichloroethylene (DCE) , 6, 7 Diels-Alder reaction, 315 Diesel combustion, 176 Differentiation, 78, 80 Dihydrodiols, 201 Dimethyl carbonate, as alkylating agent, 299 Dimethyl carbonate, green synthesis, 300 Dimethyl sulfide, 99 Dioxin , 175, 176,206,248,266 Dioxygen, 69-73 Dipole-dipole interaction, 172 Dipoles, 96 Disinfection, 238, 263, 276, 288 Disinfection, byproducts (DBP), 244 Dismutation, 177 Disproportionation, 26, 177 Dissolution of solids, 82-90 Dissolution rate, 89 Dissolved organic matter (DaM or SaM), 101, 105, 122, 127 Dissolved oxygen, 101, 108, 111-114, 119,132-134,180 Distribution coefficient, 130, 172,265, 275 Dithionite, 253 Dobson units, 72 Dolomite, 80, 103, 106, 118 Domestic wastewater, 276 Dosage, 212 Dose equivalent, quality factor, 63 Dose equivalent , rem, 63 Dose-response curve, 209, 210 Double layer, charge, 125, 126
328 Drainage basin, 98,101,103 Drainage, 97, 98,101 ,107-109, 116, 119,126 Draw solution, 268 Dry deposition, 97, I 10 Dry-weight distribution ratio, 257 Dusts, 172 Dystrophic lakes, 104 Earth, 96,97,99-102, 105, 107, 108, I I I, 1I5 , 116 Earth, core, 78, 79 Earth, mass of, 78 Earth, sunace, 79, 82,96 Ebeko volcano, 190 Ecosystem , 144 Ecosystem, sustainabiIity, 147 Ecotone, 143 Ecotoxi cology, 228-235 Ecotoxicology, at different organizational levels, 229 Ecotoxicology, bioassays, 230 Ecotoxi cology, bioavailability, 233 Ecotoxicol ogy, determination, 231 Ecotoxicolog y, methods , 230 Ecotoxicology, most sensitive species, 229 Ecotoxicology, toxic endpo ints, 230 Ecotoxicology, toxicity tests, 23 I EDTA, see Ethylenedi aminetetraacetate Effective dose, 2 14 Electro Fenton, 260 Electrochemical processes, 9, 260 Electrochemical proce sses, direct oxidation, 261 Electrochemical proce sses, direct reduction , 26 I Electrochemical proces ses, electrocatalytical reduction, 262 Electrochemical processes, gas treatment, 261 Electrochemical processes, indirect oxidation , 26 I Electrochemical processes, soil treatment, 262 Electrokinetic proces sing, see Electrok inetic remediation, 262 Electrokinetic remediation, 262 Electromi gration, 262 Electromoti ve series, 24 Electron acceptor, I 19 Electron beams, 266 Electron density, 96 Electron donating reaction s (reduction reactions), 10I Electron exchange, 5 I Electron exchange, 51 Electron volt (eV), 61 Electronegativity, 96
Index Electroneutrality, 129 Electron-hole recombination , 25 I Electrons, solvated, 255 Electroosmosis, 262 Electrophoresis, 262 Electropotential ion transport, see Electrokinetic remediation Electroreclamation, see Electrokine tic remediation Electroremediation, see Electrokinetic remediation Electrorestoration, see Electrokinetic remediation Elementary reaction, 53 Endogenous respiration, 277 Energy use, minimization, 3 16 Entamoeba histolytica, 183 Entropic effect, 49 Environmental chemistry, 3, 7, 8, 10 Environmental factor, 308 Environmental load, 5 Environmental toxicology, see Ecotoxicology Enzymes as green catalysts, 302 Eolian erosion, 10I Epidemiology, human data, 22 I Epilimnion, 104 Equilibrium constant (K), I I , 44 Erosion, 79, 81, 85, 97, 99,101 ,102, 110 Escherichia coli, 183 Essential nutrients, 148 Estuaries, 108, 126, 130, 13I Ethiopia, 103 Ethylbenzene, 168 Ethylene dichloride , 168 Ethylene oxide, 168 Ethylene, 168 Ethylenediaminetetraacetate (EDTA), 43,89,90,188 Eukarya, 138 Europe, 102, 104 Europium-155, 186 Eutrophic lakes, 182 Eutrophication, 104, 105, 127, 182, 185 Evaporation, 81, 96-99,103,104, 107-109, 1I2 , 131,268 Evaporites, 13I Evapotranspiration, 98 Exchange reaction equilibria , 14 Exhaust gases, 175 Explosive, 6 Explosives, nitro, 256 Exposure, acute, 21 I Exposure, chronic, 2 I I Exposure, standards and guidelines, 228 Exposure, subacute, 21 I Exposure, subchronic, 21 I Extended aeration system, 279 Extent of binding (EOB), 258
Extraction, sample, 7- 9 Eye redne ss, 177 Facultative anaerobic organisms, 14 1 Farada y's constant, 25 Feldspar, 80, 84, 86, 87 Fenton reacti on, 128, 252 Ferrate, 247 Ferric ions, precipitation, 89 Fetotoxicity, 220 Filtration method s, 267 Filtration method s, depth filtration, 267 Filtration method s, micro, 267 Filtration method s, nano, 267 Filtration method s, surface filtration, 267 Filtration methods, ultra, 267 Filtration spectrum, 267 Fixation (solidificat ion), 8 Flatworms, 183 Flocculation, 255, 260 Floes, 255 Fluidized bed reactor, 283 Fluoride ion, 102, 107, 115 Fluorous biphasic catalysis, 312 Fluorous compound s, 313 Fluorou s solvents, 312, 313 Fluorou s, hydroform ylation reaction, 3 I3 Fluorou s, trans-esterification reaction, 3 13 Food chain , 4,145- 146 Food web, 146 Form aldehyde, 99, 170, 180 Formation constants, 44, 49 Free energy, 44 Freezing proce ss, 96 Frequency factor (Z), 54 Freshwater, 97, 100, 103, 104, 109, 119, 133 Frost diagrams, 27-29, 45 Fulvic acids , 93,101 ,102,122,124,129 Fumaroles, 104 Fumes, 172 Furans , 175, 176,248 GalIium-68, 186 Garnet, 80 Gas exchange, 97 Gasoline oxygenates , 266 Gasoline , combustion, 175 Genotoxicity, 5, 2 I8 Geochemical, 3, 97, 107, 124 Geological, environment , 96, 97 Geometrical isomerism (cis/trans), 47 Geometry of complexes 46, 47 Getter material s, 265 Giardia intestinales, 183 Gibbsite, 86, 87 Glaciers, 96, 98, 100, 107 Global equilibrium, 14
329
Inde x Glu cu ronic acid, 201 , 2 17 Glutath ione , 20 1, 2 17 Gne iss, 84 Goethite, 12, 123,1 30 Gray, see Absorbed dose unit Gre at Salt lake, 108,109 Green chemistry, 8, 9, 297 Greenh ouse effect, 74,176 Gre enh ouse gas, 173 Grign ard reaction , 304 Groundwater injection, 267 Groundwater pollution , 187 Groundwater, biological treatment, 290 Groundwater, saline, 108-110 Groundwater, upflow, 101, 102, 109 Groundwater, upper, deep , 96 , 97, 100-103, 105, 106, 108-110, 114, 116 Gyps um, 102, 103 Haber and Weiss mechanism , 252 Habi tat, 144 Habitat, atmosphere, 143 Habit at, land, 143 Hab itat, water, 143 Habitat, water, photic zone, 143, 145 Half-cell, 24 Half-life (t l/2), 62 Half-reaction, 24 Halite, 103, 131 Halogenated aliphatics, biot ic transformation, 200-201 Halogenated hydrocarbon s, 175 Halon s, 176 Hard and Soft Acid s-bases (HSAB), 48, 79 Hazard identification, 22 1 Hazard of concern , primary, 222 Hazard , index, 226 Hazardous Air Pollutants (HAP), 173, 175 Hazardou s substanc es, 208 Heat, 186 He avy metal s, biotic transformation , 204 Henry 's constant (KH), 13,99, III , 112, 114,1 32,1 34 Hepatitis A virus , 183 Hep atoxicant, 6 Heptachlor, biotransformation, 2 18 Herbi vores, 145 Hete rogeneou s photolysis, 25 1 Heterotroph s, 140, 142 High rate activated sludge, 279 Homogeneous and heterogeneous processes, 61 Homogeneous photol ysis, 249 Horocallo river, 103 HSAB theory, see Hard and Soft Acid s-bases HSC chemistry program, 36
Hum ic acids, 93, 101, 102, 116, 117, 122,1 28 Hum ic substa nces, 92, 93, 101,1 04 , 106 , 124,1 25,1 27,1 29,1 30 Hum in, 93, 101 Hydrated alum inum oxide, 188 Hydrated electrons, 38 Hydrated polyvalent metal s, 116, 117 Hydrazine, 253 Hydrocalumite, 265 Hydrocarbons, 170 Hydrochloric acid, 168 Hydrochlorofluorocarbons (HCFC), 176 Hydrodechlorination, catalytic, 264 Hydr ofluorocarb ons (HFC), 176 Hydrogen bond s, 96, 172 Hydrogen cycle, 148 Hydrogen perox ide, 246 , 254 Hydrogen peroxide , decompo sition , 26-28,249 Hydro gen sulfide, see Hydrogen sulphide Hydrogen sulphide, 99,104,105, III , 113,117,132, 262 Hydrogenogens, 161 Hydrogenotroph s, 161 Hydrological cycle, 96 , 98, 116 Hydrolysis, 116, II 7, 134, 281, 282 Hydrolysis, alkaline, 256 Hydrophilic, 125 Hydroph obic, 125, 129, 130 Hydro sphe re, 3, 4, 6, 101, 132 Hydrosulfite, see Dithionite Hydrothermal proces ses, 81 Hydrothermal, 97, 104, 107, 108, 115 Hydroxyl radical, 174, 177, 249 Hydro xylam ine, 253 Hydro xylation reaction, 201 Hypereutrophic, 105 Hyperh aline , 108 Hyper saline, see Hyperhaline Hypochlorous acid , 239 Hypolimnion, 104, 105 Hypo sulfite , see Dithionite Ibupro fen, conventional synthe sis, 305 Ibuprofen, green synthe sis, 306 Ice melting proce ss, 10I Icebergs, 96 Imid azole , 9 In situ gas reduction (lSGR), 253 Incineration, 247 Indic ator substance, 180 Indone sia, 104 Indoo r polluti on, 179 Indu strial ecology, 296 Indu strial sewage, 276 Inner and outer coordination sphere, 47 Inner sphere mechan ism, 5 I Inorg anic chemicals, industrial, 168
Inosilicates, 80 Intake dose, 2 13 Integrat ed rate, 54 Integrated rate, first order, 54 Integrated rate , higher order, 55 Integ rated rate , seco nd order, 55 Integrated rate , zeroth order, 54 Inte ractions am ong species, positive, 146-147 Inte rface adsorption , 172 Internal combustio n engines, 175 Iodide, radio acti ve, 265 Iod ine-13l ,1 86 Ion exchange , 97,100 , 107, 116, 128, 129 ,256 Ionic liquids, biotransform ations, 312 Ionic liqu ids, Friedel-Crafts alkylation, 3 11 Ionic liqu ids, He ck reaction , 31 1 Ioni c liquids, hydrogeneration reactions, 3 11 Ionic liquids, physical propert ies, 3 11 Ioni c liquids, structures, 309 Ion ic strength, 98, 100 , 101, 105, 107, 123,1 25 ,1 26,1 29, 132 Iron co mpounds, 83, 91, 92, 104, 105, 121 ,1 22,1 24, 125, 128,1 30,1 3 1, 133,134 Iron cycle, 159-160 Iron ions, 102-1 04 , 106, 110, 116, 122- 125, 134 Iron Mountain, 190 Iron walls, 254 Isom orphous substitution, 125 Isoprene, 175 Isotope nucl ides, 62 Japan, 104 Jordan river, 109 Kaolinite, 92 Kar st lake s, 102, 103 Kawah Ijen , 190 Kepone, 201 Kerogen, 93 , 101 Kilauea Iki Kinetics, 51-59 Kineti cs-metal complex dissoci ation, 58 Lake Bonneville, 109 Lake Erie , 104 Lake Monoun, 104 Lake Nyos, 104, 115 Lake Superior, 104 Lake, alp ine , 103 Lake , caldera, 104 Lake , eutrophi c, 105 Lake, freshwater, 98, 100 , 103, 104, 109, 119
330 Lake, glacial, 103 Lake, karst, 103, 104 Lake, maars, 104 Lake, saline, 100, 104, 108-110, 131 Lake, soda, 104, 108 Lake , stratification, 104 Lake, volcanic, 104 Landfill sites, 190 Latimer diagrams, 26-29 Law of unexpected consequences, 4 LDso values of chemi cal substances, 2 11 Le Chatelier principle, 129, 132 Leachate, 97, 104 Leachates, landfill, 187 Lewis acid/base, 47 Life-cy cle assessment, 296 Ligand adsorption, 122 Ligand exchange chromatography, 51 Ligand exchange, 116, 127 Ligand exchange/substitution, associative (A), 50 Ligand exchange/substitution, dissociative (D), 50 Ligand exchange/substitution, interchange (I ), 50 Ligand field stabilization ener gy (LFSE), 50 Ligand to metal charge transfer (LMCT), 127 Ligand, 43, 116, 122-124, 127-129 Lightnin g, 167, 179 Lignin, 102, 124 Lime stabilization, 289 Limestone , 97, 100, 102, 105, 106, 117 Linear alkyl benzene sulfonates (LAS), 199,206 Lipases, as catalysts for polymerizations, 303 Liquefied gases (LG), 264 Liquid-liquid extraction, 264 Lithophiles, 79, 80 Litho sphere , 3, 78, 87 Living organisms, classification, 137 Living organisms, nutritional classification , 140 Lowest observed effect level (LOAEL ), 220 Lowest observed level (LOEL), 231 Lux and Flood, reaction definit ion, 22 Maars,l04 Magm atic concentration, 81 Magnesium aqueo us system, 3 1-33 Magnesium ion, compounds, 99-102, 106-109,1 22,1 25, 130-132 Magnet ic particles, 266 Magnetic treatment , 266 Magnet ically-assisted chemical separation, 267
Index Magnetite, 80, 266 Manganese aqueous system, 28, 29, 39 Mantle, 78 Marble deterioration, 179 Marine oil spills, 293-294 Marshes, 100, 102, 108, 109 Mass efficiency, 306 Mass intensity, 307 Mass number, 62 Matrix sample, soil, 7, 8 Maximum tolerated dose (MTD), 222 Mechanical concentrat ion, 81 Median lethal concentration (LCso), 210 Median lethal dose (LDso), 210 , 222 Mediator, 60 Mercury, biotic methylation , 204 Mesocosms, 230 Mesosphere, 69 Mesotrophic lakes, 182 Mesotrophic, 105 Metabolic pathways , 151 Metabolic process , 5, 6, 9 Metabolic products , 97 Metabolic rates, products and proce sses, 97, 106, 112, 113 Metal immobili zation, 255, 256 Metal ions, 122-124, 129, 132 Metals mining, 185 Metals, high oxidation states, 260 Metamorphism, 81 Meteorites, 78 Methane production, 176 Methane, 104, 105, Ill , 113 Methanogenesis, 281, 282 Methanogens, 149, 160, 161 Methyl orange endpoint, 119, 121, 122 Methylbutenol , 175 Methylotrophs, 141, 142 Mexico City, 100 Mica, 80, 86, 87 Microaerophilic, 141 Microcosms, 230 Microwave energy, 265 Microwave radiation, 317 Microwave radiation, Diels-Alder reaction , 317 Microwave radiation, Friedel-Crafts reaction, 317 Mine tailings, 190 Mineral nutrients , 152 Mineralization, 5, 199 Minerals, 96, 97, 99, 100, 102, 109, 116, 117,1 21,122,124-1 26,130 Minimal risk level, 223 Mining, 104, 106, 119, 189 Mississippi river, 103 Mixing ratio, 71, 72 Molar extinction coefficient (EA), 60 Molecularity of a reaction, 54
Monerans, 139 Monitoring processes, optim ization, 319 Monodirectional reaction, 53 Monoph yletic, 138 Monoterpenes, 175 Montmorillonite, 93, 189 Montreal Protocol, 178 Morphometric characteristics, 103 Multiplicity (M), 60 Mutagen , 6, 218 Mutagenesis, 218 Mutuali sm, 146 Mycorrh izae, 158 N:P ratio , 103 NAAQS, 175 Naphthalene, biodegradation, 205, 208 Natural excretes, 97 Natural oxide , dissolution, 84, 89 Nephrotoxicant, 6 Nern st equation, 28 Nesosilicates , 80 Net intera ction potential, 132 Neurotoxicant, 6 Neutrali zation , 119, 256 Niche, 144 Niger river, 103 Nitrate ion, 100, 101, 103, 126, 127 Nitrate reduction, 154, 161 Nitric acid trihydrate, 178 Nitri c acid, 168 Nitric oxide, 174, 179, 262 Nitrification , 117, 152, 154,284 Nitrify ing bacteria, autotrophic, 285 Nitrite ion, 103,1 27 Nitro group reduction, 3 16 Nitrogen cycle , 103, 105, 127, 134, 152-155 Nitrogen diox ide, 174, 179, 262 Nitrogen fixation, 152 Nitrogenous oxygen demand (NOD), 182 Nitrous oxide , 174, 262 No observable adverse effect level (NOAEL), 222 Non-carcinogenic effects, 222 Non-cellulosic fibers, 168 Non-conservative elements, 107 Non-linear alkyl benzene sulfonates (abs), 206 Non-observed effect level (NOEL), 231 Non-point sources, 169 Nonylphen ol polyethoxylate , 205, 207 North America, 102 Nucleation, 90 Null cycle, 176 Number of cycles/turn overs, 58 Nutrient cycles, 148 Nutrients, 101-105, 108, 112, 172, 182
331
Index Obligate aerobic organisms, 141 Obligate anaerobic organisms, 14 1, 157 Ocean , 96 , 98, 99,114,117,121,130, 131,134 Octanol/water partition coefficient, 173 Oil spills , 184 Oligotrophic lakes, 182 Oligotrophic, 105 Olivine, 80 Opposing reaction, 56 Optical density or absorbance (A), 61 Ore formation, 80-83 Organic chemicals, industrial, 168 Organic solvents, 170 Osm osis, forward, 268 Osmosi s, reverse , 267 , 268 Ostwald's phase rule, 90 Outer sphere mechanism, 51 Outer-sphere mechanism, 188 Outflow, 103, 109 Oversaturated solution, 88, 89 Oxic/anoxic medium, 45 Oxidation 4,6-8, 10,99, 101, 108, 113, 116,117,119,121-124,127, 128, 131-134 Oxidation ditch , 279 Oxidation state diagrams, 27 Oxidation, abiotic, 81, 83 Ox idation , and precipitation, 238 Oxidation, biotic , 81, 83 Oxide relat ive acidity value , 22, 23 Oxidizable fraction , 189 Oxygen cycle, 150 Oxygen depletion, 105 Oxygen, dissolved, lOS, 108, 111-114, 116,119,122-125,132-134 Oxygen-demanding materials, 180 Ozone hole , 75 , 177 Ozone layer ,S Ozone,70-77,174,245 Ozone , decomposition, 249 Ozone , photolysis, 249 Parallel reaction , 57 Parasitism, 147 Partial pressure, 110, 111, 114 Particulate matter, 10 I, 102, 108, 118, 126,129,180 Particul ate organic matter (POM), 101, 126,277 Particulates, 174 Partition coeffic ient, 172, 173 Parts per million, 71 Passive smoking, 180 Pasteurization, 289 Pathogenic organisms, 183 pE, 38-41 , 116 Peat bogs, 102 Perchlorate, 172
Perchloroethylene (PCE), 6-8 Perfusion, 214 Permanganate, 246 Permissible exposure levels (PELS), 224 Perovskite, 78, 79 Peroxyacetyl nitrate (PAN), 74 Peroxyalkylnitrates (PAN), 174,177 Peroxybenzylnitrate (PBN) , 174,177 Persistent organic pollutants (POP), 205 Perylene, rate of biodegradation, 206 Pesticides, 4, 5, 7, 9, 170, 189 pH , definition, 16 Phenanthrene, biodegradation, 202, 206 Phenol, biodegradation, 202 Phenol, biotransformation, 217 Phenolphthalein endpoint, 119-122 Phenols, 170 Philippines, 104 Pho sphate ions , 101-103, IDS, 118, 123, 131 Phosphates, 172 Phosphates, predominance diagram, 189 Phosphoric acid, 168 Phosphorus cycle , 157-160 Phosphorus removal, aerobic/oxic process (a/o), 286 , 287 Phosphorus removal, modified Bardenpho proce ss, 286-288 Phosphorus rem oval , VCT process, 286, 287 Phosphorus, 103, lOS, 107, 116, 127 Phosphorus-32, 186 Photo Fenton reaction, 128, see also Fenton reaction Photoassisted processes, 249 Photoautotrophs, 141, 142 Photocatalysis, 9, 252 Photocatalysis, electrochemically-assisted, 251 Photochemical methods, 266 Photochemical oxidants, 174 Photochemical processes, 59 Photochemical reactions, 126 Photochemical smog, 177 Photochemistry, acylation reactions, 318 Photochemistry, reactions, 317 Photoelectrocatalysis, 251 Phorotysis.a-o, 10,60,71,74, 126-128 Photoprocesses, 60 Photoprocesses, collision deactivation, 60 Photoprocesses, fluorescence, 60 Photoprocesses, internal conversion, 60 Photoprocesses, intersystem crossing, 60 Photoprocesses, sensitization, 60 Photoreactions, 60 Photoredox reaction, 128 Photosynthesis, 105,110-112, 114, 117, ISO, 160
Phototrophs, 140, 142, 157 Phyllosilicates, 80 Phylogenetic trees, 138 Phytoplankton, 105 Piezometric surface, 106 pK. 114, 115, 118, 129 Planetesimals, 70 Playas, 110 Poas crater, 190 Point of zero charge (pzc), 130, 132 Point sources , 169 Poison, 208 Polar stratospheric clouds (PSC), 178 Polar vortex, 178 Pollutant fate, 7, 9 Pollutant, conventional, 169 Pollutant, mobility, 169 Pollutant, non-conventional, 169 Pollutant, partition, 169 Pollutant, sources, 167 Pollutant, transport, 169 Pollutants, biodegradable, 198 Pollutants, recalcitrant, 198, 204 Pollution prevention, 296 Pollution, 4, 5, 7-9 Poly (methyl methacrylate), conventional synthesis, 307 Poly (methyl methacrylate), green synthesis, 307 Polyaluminum chloride, 255 Polycarbonate, conv entional synthesis, 299 Polycarbonate, green synthesis, 299 Polychlorinated biphenyls (PCB), 205 Polychlorinated organics, 170, 175 Polychlorodibenzodioxins (PCDD), 170 Polychlorodibenzofurans (PCDF), 170 Polycyclic aromatic hydrocarbons (PAH) , 170, 174 Polyhumic lakes, 104 Polymeric ligand exchange (PLE), 258 Polyphosphate, 185, 186,188 Ponds, 96, 100, 105 Population, 144 Potassium ion, 99 , 100, 102, 106-110, 130,131 Pourbaix diagrams, 30-37, 45 Precipitation, 97-101,103-106,108, 109,116,123,124,128,131 Precipitation, chemical, 82, 85, 87-91, 255 Precipitation, diagram, 88, 91 Precipitation, equilibria, 88 Precipitation, pathway, 89 Predation, 147 Predicted environmental concentration (PEC),235 Predicted non-effect environmental concentration (PNEC), 235
332 Predominance-zone diagram, solubility, 91 Predominant species, 15, 18 Preferential anatomic site, 214 Preliminary treatment, 276 Prevention of waste production, 297 Primary clarifiers, 276 Primary productivity, 104 Primary sludge, 277, 288 Primary standard, 175 Primary treatment, 276 Priority substance, 180 Propylene, 168 Protecting groups , avoidance, 304 Protective colloid effect , 125 Proteins, 101, 102, 124, 125 Protistans, 139 Protocatechuate, 201, 202 Protolysis, 116 Proton acceptors and donors, 116 Pure dioxygen aeration, 279 pX,14 Pyrite, 116, 131 Pyroxene, 80 Pyruvate, 20 I , 203 Quantitative structure-activity relationship (QSAR), 232 Quantum yield ('P), 60 Quartz, 78-80, 84 Rad, see Radiation absorbed dose Radiation absorbed dose (Rad), 63 Radiation energy, 61 Radiations, ionizing, 61 Radiations, non-ionizing, 61 Radiations, lX,~, -y, 61 Radioactive decontamination, 259 Radioactivity, 61 Radiochemistry, 61 Radionuclides, 172, 175, 185 Radionuclides, biotic transformation, 204 Radium-226, 186 Radon, 167, 179 Rain , rainfall, 96, 97, 99-102, 105, 107, 109,115,117,121,132,133 Rainwater, 99-102, 115, 116 Rate constant, 53 Rate law, 53 Raw sewage, 276 Raw sludge, see Primary sludge Raw wastewater, 276 RDX , 6 Reaction selectivity, 307 Reaction mechanism, 53 Reaction order, 53 Reaction rates, 51 Recharge, 105, 106, 109, 114
Index Recommended exposure levels (REL) , 224 Recycle, 8, 9 Red sea, 107 Redox potential , 238 Redox, 101, 108, 112, 114, 116, 119, 121,123,128,133,134 Reducible fraction, 189 Reduction reactions, reductive conditions, 101, 105, 108, 119, 121, 123,128,131 ,132,134 Reduction, abiotic , 81, 83 Reduct ion, biotic , 81, 83 Reference dose (RID), 6, 7, 223 Remediation, 8, 10 Renewable feedstocks , 300 Renewal of water, turnover 96, 98 , 102-104, 107 Reservoir, 101, 105, 107, 132 Reservoirs of elements, 148 Residence time, 72, 73 Residual concentration, 81 Respiration, 106, 112, 117, 150 Reuse, 8 Rhine river, 103 Risk assessment , carcinogenic, 224 Risk assessment, ecological, 234 Risk assessment , non-carcinogenic, 223 Risk assessment, proce ss, 221 Risk characterization, 221, 226 Risk management, 227 Risk quotient, 235 Risk, 6-10, 220 River water, 98, 101-103, 108, 130 River, Rhine, 85 Rocks, acidic , 79 Rocks, basic, 79 Rocks, extrusive , 79 Rocks, felsic, 79 Rocks , igneous , 79, 80, 82 Rocks, intrusive, 79 Rocks, mafic, 79 Rocks, metamorphic, 79, 80 Rocks, sedimentary, 79, 80 Rocks, silicic, 79 Rotating biological contractors (RBC) , 278,280,281 ,283 Roundworms, 183 Rubber, 168 Runoff, 97, 100-104, 107, 110, 117 Safety factors, 223 Salicylic acid , biodegradation, 202 Salinity, saline, 97, 98, 100, 104-110, 113,114,130,131 Salinization, 189 Salmonella sp., 183 Salmonell a typhi , 183 Saltwater intrusion, 106, 109
Saltwater, 97 , 109, 136 Sand, 102, 105 Sandstone bed aquifers , 106 Saturated solution, 89, 90 Saturated zone, layer, 105, 115, 132 Saturation percentage, 105 Saturation, 104-106, 109, 110, 113-115 Scavengers of OH radicals, 250 Sea salt aerosols, 101 Sea , 96, 99, 100, 107-109, 132 Seawater, 99 , 106-110, 114, 116, 118, 123,125-127,130,131-134 Secchi disk depth, 105 Secondary pollutants, 176 Secondary sludge, 288 Secondary standard, 175 Secondary treatment, 276, 277 Sedimentation, 81 Sediments, 79, 82, 87,92,96,97,99, 101,103,105,107,108,110, III , 113-118,121 ,124,126,128-131 Seepage, 103, 109 Selective toxicity tests (SER), 231 Selectivity coefficient, 130, 131 Semi-permeable membrane, 267 Senescent lakes, 183 Septic tanks , 281 Sequential extraction, 124 Sesquiterpenes, 175 Settleable solids, 184 Sewage sludge, 190 Sewage, 276 Shigella, 183 Siderophiles, 78-80 Siderophores, 159 Sievert (SY) , 64 Silica, 78 , 87, 92, 99, 100, 102, 103, 110, 126,131 Silicates, 78, 80, 82, 100, 103, 104, 118, 124, 125 Silicates, high-density, 78 Silicic acid, 86, 87, 100, 102, 103 Silt , 102, 105 Singlet (S), 60 Sludge age, 284 Sludge treatment, 276, 288-290 Smog formation, 176 Snow, 96 , 99-101,103 Soda lakes , 104, 108 Sodium chlorate, 168 Sodium derivatives, 99-103, 106-109, 116,130,131 Sodium hydroxide, 168 Sodium sulfate, 168 Sodium:calcium ratio, 99 Sodium-24,186 Soil pollutants, 259 Soil vitrification, 255, 265 Soil washing, 259
333
Index Soil, 92, 93, 96, 97, 100-103, 105, 106, 109, 110, 115-118, 122, 124, 130, 133,290-292 Soil, biological treatment, 290-292 Soil, characteristics, 92, 93 Soil, composition, 93 Soil, horizons, 93 Soil, taxonomy, 93 Solar constant , 74 Solid electrolyte cells, 262 Solid phases , stable, 90 Solids, metastable , 90 Solids, precip itation of, 87-89, see also Precipitation Solubility product (Ksp ), 12 Solubility, affected by ligands, 89, 90, 259 Solubility, calculation, 86-92 Solubility, diagram, 91, 92 Solubility, equilibria, 86-92 Solubilization, 89, 90, 97,105,106,119, 259 Solvation, 132 Solventless reactions, 315 Solventless reactions, amide formation , 315 Solventless reactions, use of zeolites, 315 Solvents, ionic, 9 Sorbate, 129 Sorosilicates, 80 Sorption, 93, 123, 128, 129 South America, 101, 102 Spatial processe s, 3 Speciation, 10, 106-108, 123, 124 Spring water, 96, 100, 104 Stability constant, 50 Stability field diagram, 86 Stalactites, 131 Stalagmites, 131 Standard hydrogen electrode (SHE) , 24 Standard reduction potential (EO), 24, 25 Standard reduction potential, biochemical , 149 Steady state approximation, 57 Steam stripping, 268 Step aeration, 279 Steric forces , 132 Sterilization, 238 Stratification, 104, 115 Stratopause, 69 Stream water, 96, 101-103, 109, 124, 126, 132, 133 Structure-activity relationship (SAR) , 222 Styrene, 168 Submarine hydrothermal vents, 157 Submerged filters, 278 Succinic acid, 203
Sulfate, 99, 100, 102, 109, 117,125,129, 131,132,134 Sulfide, 99, 102, 104, 117, 118, 124, 126, 131,253 Sulfite, 253 Sulfur cycle, 155-157 Sulfur dioxide, 174,253,262 Sulfur trioxide, 174 Sulfuric acid, 119, 122, 168 Supercritical fluid, 9, 313 Supercritical C02, 264 Supercritical water oxidation (SCWO) , 248 Supersoaker materials, 265 Surface adsorption, 172 Surface tension, 96 Surface water pollution, 187 Surface water, 96-98, 100, 101, 105, 107,109,110,114,116,121 ,131 ,132 Surfactants, 170, 185 Suspended solids, 183 Sustainability, 296 Swamp, 100, 113 Symbios is, 147 Synergism, 146 Syntrophism , 149, 157 Systematics , 137 Tailing dumps, 190 Target dose, see Effective dose Target organs, 214 Taxon, 138 Taxonomy, linnean, 137 Technetium-99, 186 Tectosilicates , 80 Teratogenicity, 220 Tertiary sludge, 289 Tertiary treatment , 276, 287-288 Texas (USA), 106 Thalassohaline, 108 Thallium-201,186 Thermal inversion, 69 Thermocline, 104 Thermoplastic resins, 168 Thermosetting resins, 168 Thermosphere, 70 Thiosulfate , 253 Threshold dose level, 210 Threshold limit values (TLVS), 224 Tissue affinity, 214 Titanium dioxide, 168 Tobacco smoke, 180 Toluene, biodegradation, 202 Total dissolved solids (TDS), 103, 105-110, 133, 183 Total fixed solids (TFS), 183 Total solids (TS), 183 Total spin (S), 60 Total suspended solids (TSS), 183
Total volatile solids (TVS), 184 Toxic effects, benzene, 220 Toxic effects, chloroform, 220 Toxic effects, heptachlor, 220 Toxic effects, Hg, 220 Toxic effects, Pb, 220 Toxic effects, vinyl chloride, 220 Toxic substance, 6-10 Toxicant, 207 Toxicant, population response, 209 Toxicity assessment, ecological, 234 Toxicity factor, 208-220 Toxicity factor, age, 212, 215 Toxicity factor, dose-response relationship, 209, 222 Toxicity factor, dose-time relationship or exposure, 211 Toxicity factor, route of exposure, 212, 214 Toxicity factor, sex, 212 Toxicity factor, species differentiation, 212,210 Toxicity factor, structure and reactivity, 208 Toxicity factor, susceptibility of organi sms, 209 Toxicity, additivity, 218 Toxicity, antagonism, 218 Toxicity, chromium, 208 Toxicity, dermal, 219 Toxicity, endpoint, 216 Toxicity, hepato- , 219 Toxicity, hydrogen cyanide , 209 Toxicity, immuno-, 219 Toxicity, interactions among chemical substances, 218 Toxicity, nephro- , 219 Toxicity, neuro-, 219 Toxicity, nicotine , 209 Toxicity, ocular, 219 Toxicity, organ specific effects, 219 Toxicity, potentiation, 218 Toxicity, receptors, 214 Toxicity, reproductive, 219 Toxicity, respiratory, 219 Toxicity, synergism , 218 Toxicity, systemic, 218 Toxicity, thalidomide, 208 Toxicity, threshold, 211 Toxicodynamics,214 Toxicokinetics, absorption, 213 Toxicokinetics, biotransformation, 213, 214 Toxicokinetics, distribution, 213 Toxicokinetics, excretion, 213 Toxicokinetics, storage, 214 Toxicology , 207 Toxin, 208 Trichloroethylene (TCE), 6-8, 188
334 Trichloroethylene, biodegradation, 201 Trickling filters, 278, 280 Trihalomethanes (THM), 5, 170 Triplet (T), 60 Trophic levels, 145 Tropical rainforest, 100, 101 Tropical zones , 105 Troposphere, 69, 70, 73, 75 Trout , 181 Turbidity maxima, 126 Turbidity standard, 184 Turbidity, 105, 126, 184 Turnover time, 96, 98, 102, 104 Tyndall effect, 125 Typhoid fever, 183 Ultrasound, 266 Ultraviolet radiation (UV) , 5 Unimolecular, 54 United Kingdom , 100 Unsaturated zones, 96 Upflow anaerobic sludge blanket (UASB) ,283 Urea, 168 Vadose, 96 Van derWaal's forces, 125, 126, 128, 172 Vanillin, biodegradation, 202 Vapor pressure, 6, 7, 110, III Venting, see Bioventing Vents, 104, 114
Printed in the United States of America.
Index Vermiculite, 189 Vibrio cholerae, 183 Vinyl acetate, 168 Vinyl chloride, 6, 7 Volatile compounds, biological treatment, 294-295 Volatile organic compounds (VOC), 174, 175 Volcanic eruptions, 167, 179 Volcanic fallout, 97, 101,104, Ill , 114
Volcanic vents, 104, 114 Volt-equivalent, 27 Washout, 99, 101, 103, 132 Waste minimization by catalytic reactions, 302 Waste segregation, 8 Wastewater reuse, 290 Water cycle, 149 Water pollutants, 181 Water softening, 255, 267 Water, brackish, 105, 108 Water, coastal, 99, 109 Water, composition, 96, 97, 101, 102, 104,109 Water, cycle, 97, 99 Water, distribution, 97 Water, hardness, 98, 99, 103, 106, 133, 134 Water, interstitial, 96
Water, runoff, 97,100-104,107,110, 117
Water, saline, 105, 108, 109 Water, springs, 96, 97, 100, 103, 104 Water, table, 100, 105, 109 Water, turnover, 96, 98 Water, vapor, 100 Water-borne diseases , 183 Waterlogged soils, 121 Watershed ,96, 104, 133 Weathering, 81-92, 97, 100-105, 109, 110,116,117,121 ,124 Weathering , biological, 92 Weathering , chemical , 81-87 Weathering, physical, 81, 82 Wet oxidation (WO), 248 Wetlands, 102, 108, 109 Wind activity, erosion , 99, 104, 107 Wollastonite, 80 Wurstite, 78 Xenobiotics, 4-6, 199, 204 Xenophores, 205 Ytterbium-169,186 Yucatan (Mexico) , 106 Zeolites, 265 Zero discharge s, 9 Zero -valent metals (ZVM), 254, 265 Zeta potent ial, 125, 126