Energy Market and Policies in ASEAN 9789814379380
This book provides a detailed understanding of the energy situation in ASEAN and analyses the key aspects of the energy
253 74 11MB
English Pages 270 [269] Year 2018
CONTENTS
CONTRIBUTORS
FOREWORD
INTRODUCTION
I. A DECADE OF CHANGE IN THE ASIAN-PACIFIC REGION
II. STRUCTURAL CHANGE AND ENERGY POLICY IN ASEAN
III. ENERGY AS A DEVEIDPMENT RESOURCE
IV. MALAYSIAN ENERGY POLICY
V. PHILIPPINE ENERGY POLICY AND PROBLEMS IN A CHANGING WORLD
VI. THE ENERGY ECONOMY OF A CITY STATE, SINGAPORE
VII. DEVELOPMENT OF THE ENERGY POLICY IN THAILAND
Recommend Papers


![Harmonization and Standardization of Bond Market Infrastructures in ASEAN+3 : ASEAN+3 Bond Market Forum Sub-Forum 2 Phase 3 Report [1 ed.]
9789292570828, 9789292570811](https://ebin.pub/img/200x200/harmonization-and-standardization-of-bond-market-infrastructures-in-asean3-asean3-bond-market-forum-sub-forum-2-phase-3-report-1nbsped-9789292570828-9789292570811.jpg)


- Author / Uploaded
- Shankar Sharma (editor)
- Fereidun Fesharaki (editor)
File loading please wait...
Citation preview
ENERGY MARKET AND POLICIES IN
ASEAN
The Institute of Southeast Asian Studies was established as an autonomous organization in 1968. It is a regional research centre for scholars and other specialists concerned with modern Southeast Asia, particularly the multi-faceted problems of stability and security, economic development, and political and social change. The Institute is governed by a twenty-two member Board of Trustees comprising nominees from the Singapore Government, the National University of Singapore, the various Chambers of Commerce, and professional and civic organizations. A ten-man Executive Committee oversees day-to-day operations; it is chaired by the Director, the Institute's chief academic and administrative officer. The ASEAN Economic Research Unit is an integral part of the Institute, coming under the overall supervision of the Director who is also the Chairman of its Management Committee. The Unit was formed in 1979 in response to the need to deepen understanding of economic change and political developments in ASEAN. The day-to-day operations of the Unit are the responsibility of the Co-ordinator. A Regional Advisory Board, consisting of a senior economist from each of the ASEAN countries, guides the work of the Unit.
ENERGY MARKET AN D POLICIES IN Edited by
Shankar Sharma & Fereidun Fesharaki
• - • • ASEAN Economic Research Unit
I i i - INSTITUTE OF SOUTHEAST ASIAN STUDIES
Published by Institute of Southeast Asian Studies Heng Mui Keng Terrace Pasir Panjang Singapore 0511 All rights reserved. No part of this publication may be reproduced, stored in a retrieval system, or transmitted in any form or by any means, electronic, mechanical, photocopying, recording or otherwise, without the prior permission of the Institute of Southeast Asian Studies. ©
1991 Institute of Southeast Asian Studies
Cataloguing in Publication Data
Energy market and policies in ASEAN /edited by Shankar Sharma and Fereidun Fesharaki. 1. Energy policy - ASEAN countries. I. Sharma, Shankar. II. Fesharaki, Fereidun. sls91-11860 1991 HD9502 A92E56 ISBN 981-3035-82-X (soft cover) ISBN 981-3035-85-4 (hard cover) The responsibility for facts and opinions expressed in this publication rests exclusively with the contributors and their interpretations do not necessarily reflect the views or the policy of the Institute or its supporters.
Typeset by Letraprint Printed in Singapore by Chong Moh Offset Printing Pte Ltd
CONTENTS Contributors vii Foreword Xl
Introduction Xlll
A Decade of Change in the Asian-Pacific Region: The Energy Outlook and Emerging Supply/Demand Imbalance Fereidun Fesharaki and Nancy D. Yamaguchi 1 II Structural Change and Energy Policy in ASEAN Shankar Sharma 26 III Energy as a Development Resource: The Indonesian Experience Budi Sudarsono
57
IV Malaysian Energy Policy: An Economic Assessment Wan Leong Fee
81
v Philippine Energy Policy and Problems in a Changing World Teodoro M. Santos 117
VI The Energy Economy of a City State, Singapore Tilak Doshi 161
VII Development of the Energy Policy in Thailand Tienchai Chongpeerapien 215
CONTRIBUTORS T!LAK DOSHI is a Research Associate with the Institute of Southeast Asian Studies in Singapore. Currently, the author is based in Hawaii as a Research Scholar with the Energy Program at the Resource Systems Institute, East-West Center. The author holds B.A. and M.A. with Distinction degrees in Economics from Victoria University of Wellington, New Zealand and was awarded the 1984 RobertS. McNamara Fellowship of the Economic Development Institute of the World Bank. The author has published a monograph on the Singapore petroleum industry as well as articles in journals. He is currently working on his Ph.D. dissertation concerning energy policy modelling at the Department of Economics, University of Hawaii. The author wishes to acknowledge financial and research support for this study from Resource Systems Institute of the East-West Center. FEREIDUN FESHARAKI is the Director of Resources Programs at the EastWest Center, Honolulu. He received his Ph.D. in Economics from Surrey University, England. He was a Visiting Fellow at Harvard University as well as a Senior Fellow at the Institute for International Economic and Political Studies in Iran. As Energy Adviser to the Prime Minister of Iran (1977/78), he attended the OPEC Ministerial Conference. Dr Fesharaki specializes in oil/gas market analysis and the downstream petroleum sector with emphasis on the Middle East, Asia-Pacific, the Caribbean, and the United States. He has written and edited many books, monographs and papers on the international oil and gas industry. He is currently also a member of the Editorial Board of the journal Energy Policy. TEODORO M. SANms graduated with a Ph.D. in Mineral Economics from the Pennsylvania State University in 1976. He is currently a professor of Mineral Economics and Geology at the National Institute of Geological Sciences of the University of the Philippines in Diliman, Quezon City. He was former chairman of the Department of Geology and Geography, director of the National Institute of Geological Sciences, and professorial lecturer at the School of Economics of the same university. He has served as consultant on mineral resources and policies with the Ministry of Natural Resources. His research and publications cover various facets of energy and mineral resources, including sea-bed mining in the context of the law of the sea. Vll
vm
Contributors
SHANKAR SHARMA, Ph.D. in economics (University of Hawaii), is a Fellow and Co-ordinator, Energy Project in the ASEAN Economic Research Unit, Institute of Southeast Asian Studies. He has published several papers and monographs on energy and economy with emphasis on ASEAN, and has presented papers at several international energy conferences. He has also served as a consultant to several national and international agencies. He is currently also one of the editors of the ASEAN Economic Bulletin. BUD! S. SUDARSONO, Ph.D., seconded by the National Atomic Energy Agency of Indonesia to the secretariat of the United Nations Economic and Social Commission for Asia and the Pacific in Bangkok since December 1988, is Chief, Energy Resources Section, Natural Resources Division. In Indonesia he was in charge of studies relating to the feasibility of a nuclear power programme, and has been a member of PTE or the Technical Committee on Energy Resources since 1977. He has participated and presented papers in many meetings on energy and nuclear energy, both national and international. T!ENCHAI CHONGPEERAPIEN, Ph.D., is a research fellow at the Thailand Development Research Institute. He has been responsible for the Institute's energy policy studies programme. He has written several articles and books on energy pricing, fiscal regime on oil and gas exploration, oil transportation, and the competitiveness of the oil industry in Thailand. He was appointed to several government energy policy committees and has continued to work closely with government energy policy planning and electric utility agencies. He formerly worked for the Shell Company of Thailand as a senior economist. NANCY YAMAGUCHI received her Ph.D. in Geography from the University of Hawaii in 1988 and her B.A. in Communications and Environmental Policy from the University of California at Davis in 1981. As a Research Fellow, Energy Program, East-West Center, she is currently the Co-ordinator of the Indonesia Energy Sector Study and the U.S. West Coast Oil Study. Her work has focused on petroleum and petroleum product transport and trade. She was a member of the South Pacific Oil Supply Options study team and helped co-ordinate the Training Workshop on Petroleum Pricing and Supply issues, and the Pacific Islands Energy Ministers Conference. Prior to joining the Energy Program she was employed by the California Energy Commission in the Liquid Fuels Conservation and Contingency Planning Office. She is author of a number of technical reports and articles.
Contributors
ix
WAN LEONG FEE, Ph.D., is Associate Professor, Faculty of Economics and Management, University of Agriculture, Malaysia. He has been a Fellow of the Agricultural Development Council, New York Inc., 1972-76; Honorary Fellow, Department of Agricultural Economics, University of Wisconsin-Madison in 1981; and a Visiting Fellow, Resource Systems Institute, East-West Center, Honolulu, Hawaii where he spent nine months of sabbatical in August 1989. He served as a Consultant to the Government of Malaysia in the Kedah/Perlis Water Resources Management Study in 1979/80. He was appointed as Head of the Natural Resources Unit, Centre for Agricultural Policy Studies, University of Agriculture, Malaysia in 1988-89. He is the author of a number of papers on ASEAN oil and gas issues presented in the World Energy Conference, 14th Congress, Montreal, Canada, September 1989, the 4th ASCOPE conference in Singapore, and the Energy '90 conference in Manila. His latest works include a study on investment strategies in ASEAN energy markets funded by the Ministry of Science and Technology, Government of Malaysia under the programme of intensification of strategic research in priority areas. He was Malaysia's representative to the Fourth PECC Minerals and Energy Forum, 4-6 November 1990 at Dallas, Texas.
FOREWORD
T
his book was prepared under the auspices of the Joint Energy Programme of the Institute of Southeast Asian Studies (ISEAS) and the East-West Center. The goals of the Joint Energy Programme, which was initiated in 1988, are to develop a data base and conduct analyses on key aspects of the energy economies of the Asian-Pacific region and its major constituent nations. A further purpose of the Programme is to utilize the expertise at the East-West Center for the development of a research capability within !SEAS with respect to major aspects of energy supply and demand of the region. A number of monographs and papers have already been completed and published under the Joint Programme. The main objectives of this book are to assess the energy situation in ASEAN (Association of Southeast Asian Nations) and to analyse the key aspects of the energy policies of the member countries, viz. Brunei, Indonesia, Malaysia, the Philippines, Singapore, and Thailand, in broader regional and international perspectives. The book provides a comparative analysis of the energy situation and policies in the region as well as detailed country studies of all the ASEAN countries except Brunei. (A country study on Brunei has not been included due to lack of data.) There are primarily three reasons for focusing this study on ASEAN. First, ASEAN countries have been economically dynamic. They have all adopted export-oriented policies and have had rapid economic growth making their economies highly interdependent with the rest of the world. Second, the energy demand, especially demand for oil and gas in this region, has been spectacular - in fact, one of the highest in the world. Third, the region provides a unique combination of countries in terms of energy resources and activities. Indonesia, Malaysia, and Brunei are three major producers of oil and gas and depend heavily on these resources for foreign exchange earnings and government revenues. Singapore, the largest oil-refining and trading centre in the Asian-Pacific region, is a major exporter of petroleum products. On the other hand, the Philippines and Thailand depend overwhelmingly on imported oil. These factors make ASEAN an interesting region for energy study. Unavailability of comprehensive and standardized energy statistics is one of the constraints in analysing and comparing the detailed energy situation between countries and in examining the specific problems. The energy statistics coverage are different in different countries and vary XI
xii
Foreword
from one publication to another. Thus, the analysis has to be carried out on the basis of limited information. These constraints forced us to make the framework of analysis more flexible. The analysis of this book is concerned more with the medium- and longer-term energy policy issues. However, one has to be cautious. Things change quickly. Any major changes in oil prices, economic activities, new discoveries of energy resources, technological breakthroughs, OPEC countries' behaviour, and political and economic turmoils can change the future outlook. Depending upon the situation, some of them affect the shorter-term energy outlook and others may affect shorter- as well as longer-term perspectives. One of the political turmoils that occurred after the completion of this study was the Gulf crisis of 1990. However, by all considerations it appears that the disruption in the oil market resulting from the Gulf crisis is temporary. The analysis for the medium- and longer-term is thus not affected very much. However, even with these limitations, we hope that this book will be of use to academicians, decision-makers in government, the business community, and others who are concerned with the energy situation and policies of the thriving Asian-Pacific region and especially those of ASEAN economies. We would like to acknowledge the help of the contributors and researchers and their affiliated institutions for making this research study possible.
Fereidun Fesharaki East-West Center Hawaii
Shankar Sharma Institute of Southeast Asian Studies Singapore
INTRODUCTION
T
he economies of the ASEAN countries - Brunei, Indonesia, Malaysia, the Philippines, Singapore, and Thailand - are highly energy dependent. The member countries have always been vulnerable to price, supply, and demand swings relevant to energy resources. Any disruption in energy supply and price represent a serious threat to economic stability as was proved by the oil crises of 1973-74 and 1979-80. Both crises caused higher inflation, depressed the export market, and raised import expenditures. The economy of the region slowed down considerably. In response to the volatile behaviour of the oil market, oil importing countries, since the first oil crisis, have increased indigenous energy production, diversified their source of energy supply, intensified substitution efforts to replace oil with alternative energy resources, and have reduced energy intensity significantly. Similarly, to minimize the impact of lower oil prices in the economy, Malaysia and Indonesia, the major oil exporting countries in the region, have increased the share of non-oil-and-gas exports dramatically and are now better prepared to absorb the shock of lower oil prices than in the 1970s. However, even with these structural changes and the experience of two decades of dramatic price fluctuations, the region is still vulnerable to energy prices and supply disruptions as demonstrated by the energy problems triggered by the Iraqi invasion of Kuwait in 1990. Higher oil prices generated a multitude of problems - pressure in trade balance and balance of payments, inflation, and the curbing of economic growth in oil importing countries. The oil windfalls produced by the 1990 energy crisis were still highly significant to Indonesia and Malaysia. The strong relationship that exists between energy and economic development in the ASEAN countries (as is true in many developed as well as developing countries) makes comprehensive energy planning imperative, but the uncertainty involved in the energy market makes such planning increasingly difficult. As a consequence the energy situation has to be assessed and policies have to be reviewed regularly. Considering the importance of these issues, it was decided to undertake the present study of the energy market and policies in ASEAN. This study not only provides assessments of the energy situation, and energy strategies and policies of individual ASEAN countries, but also examines the prospects for regional oil and gas production, energy demand pattern, X111
xiv
Introduction
the future of the regional refining sector, and various policies adopted to overcome the problems created by energy crises in the region. Our comparative analysis should contribute to an understanding of the energy situation of individual countries in a regional perspective. This book has been organized in seven chapters. Two chapters provide a regional comparative analysis of the energy situation and the remaining five chapters are devoted to country analyses. Chapter 1 reviews the energy situation in the Asian-Pacific region and provides an outlook for the regional oil and gas market. It begins with a review of the structure of demand, the extent of the regional oil and gas resources, the prospects for crude oil production through the year 2000, and the future of the regional refining sector. Chapter 2 examines the energy policies of ASEAN countries especially after 1973. Policy responses to the crises on demand and supply management, pricing, non-pricing and macroeconomic policies are also discussed in this chapter. The country studies (chapters 3-7) provide detailed descriptions of the energy sector and its relationship with the economy together with discussions of the energy policies of the respective countries. Future problems and prospects of energy development in these countries are also examined and the particular problems of each country are reviewed and discussed. In particular, chapter 3 reviews the energy developments in Indonesia during the last three decades, examines the role of oil and gas in the economy, describes the formulation and implementation of energy policies, and discusses future prospects of the country in terms of energy policy. Chapter 4 provides an economic assessment of Malaysia's energy policy in relation to the overall objective of developing the nation's energy resources for economic growth. Chapter 5 reviews the energy policy of the Philippines for the last two decades with the objective of identifying important problem areas along with the policies that evolved. The problems implied by the aspiration of national leadership to transform the country into a newly industrializing economy by the year 2000 are also examined. Similarly, chapter 6 provides an overview of the energy economy relationship in Singapore, evaluates Singapore's petroleum industry, and examines the country's position in the regional oil trade. There is also some discussion on the linkages between public policy, economic development, and the energy sector. By reviewing the past energy strategies and by assessing the energy demand and supply situation, chapter 7 provides an analysis of the energy
Introduction
xv
policy in Thailand with emphasis on oil and gas. Development of possible future energy policies is also discussed in this chapter. All chapters included in this volume discuss, analyse, and address energy policy issues mainly from a longer-term perspective. The shortrun energy situation may be affected by political upheavals like the one caused by the Iraqi invasion of Kuwait in 1990, but in the longer-run economic forces are expected to determine the shape of the energy market. The longer-term analysis is thus more important for the purpose of policy formulation.
I
A DECADE OF CHANGE IN THE ASIAN-PACIFIC REGION The Energy Outlook and Emerging Supply/Demand Imbalance Fereidun Fesharaki and Nancy D. Yamaguchi
T
he 1980s ushered in what many analysts refer to as the "Pacific Century". The region is seen as the emerging centre of gravity for the world economy, and even if economic growth slows during the 1990s, there is wide acceptance of the idea that the region will continue to be one of the fastest-growing in the world. The 1980s witnessed spectacular growth rates in the Asian-Pacific region, the rising economic power of Japan, an unprecedented opening of China's economy, the emergence of the "Four Tigers" or the "Little Dragons" (Singapore, South Korea, Taiwan, and Hong Kong), a rapid growth of exports from the region - in short, remarkable economic success and an increase in entrepreneurialism and the free-market philosophy. Even the United States, which historically has been Atlantic-oriented, sat up and took notice. While the relationship between economic growth and energy consumption is not necessarily absolute, energy is a required input for economic activity and trade. Energy demand growth in the Asian-Pacific region, accordingly, has been rapid. At this point in history, oil and economic growth are so interrelated that changes in one invariably have major repercussions on the other. During the coming decade, continued economic growth is foreseen for the Asian-Pacific region, coupled with the fastest rate of oil-demand growth of any region on earth. Pressure will come to bear on the regional oil and gas markets, since demand growth will take 1
2
Fereidun Fesharaki and Nancy D. Yamaguchi
place concurrently with a decline in the availability of local, low-sulphur crudes. The region will become even more dependent on imports of Middle Eastern crude, which will result in a higher-sulphur crude slate. Moreover, we anticipate that the existing and planned refinery complex will lack the capacity and the flexibility to satisfy fully product demand. The consequence will be a higher level of refined product imports. The problem facing the regional market is one of both quantity and quality. Petroleum product specifications are tightening significantly, due in part to a rising environmental consciousness. Octane requirements are increasing, not merely because of demand for premium gasoline but because the regular grades in many nations are significantly underpowered (some have research octane numbers in the low-eighties) and the long-term costs to the motor-vehicle fleets are becoming all too apparent. At the same time, many countries are phasing in low-lead and unleaded gasoline grades, which places additional pressure on the octane pool. Additionally, the higher-sulphur crude slate will correspond with a tightening of sulphur standards for middle distillates and fuel oil. The 1990s should prove exciting for the regional oil and gas industry. In this chapter, we examine the Asian-Pacific energy situation and the outlook for the regional oil and gas market, beginning with a look at the structure of demand, the extent of the regional oil and gas resource, and the prospects for crude oil production through the year 2000. Following this is our assessment of the Asian-Pacific supply/demand balance (or imbalance, as the case may be), and the future of the regional refining sector. STRUCTURE OF ENERGY DEMAND World versus Asia-Pacific The world energy markets consumed 160.6 million barrels per day of oil equivalent (MMBDOE) in 1988, of which two-thirds were consumed in the non-Communist world. As shown in Table 1, 38 per cent of world energy consumption was supplied by oil, 20 per cent by gas, 30 per cent by coal, 7 per cent by hydro, and 5 per cent by nuclear power. If only non-Communist countries are considered, the share of oil in energy demand rises - primarily because the use of natural gas and coal in the Communist world is higher than it is in the non-Communist world. When comparing the Asian-Pacific region with the world, the size of China's energy market poses a serious problem. Since China's coal consumption accounts for nearly 80 per cent of its total commercial energy
A Decade of Change in the Asian-Pacific Region
3
TABLE 1 Primary Energy Consumption by Fuel 1988 (In millions of barrels per day of oil equivalent) Asia-Pacific (excluding China)
Asia-Pacific*
Total World
MMBDOE
%
MMBDOE
%
MMBDOE
%
Oil
60.1 (47.5)
38 (45)
11.2
33
9.3
47
Gas
32.5 (19.0)
20 (18)
2.2
6
1.9
10
Coal
48.6 (23.6)
30 (22)
17.7
52
6.1
31
Hydro
10.6 (8.3)
7 (8)
1.8
5
1.2
6
Nuclear
8.8 (7.6)
5 (7)
1.3
4
1.3
6
160.6 (106.0)
100 (100)
34.2
100
19.8
100
TOTAL
*East, Southeast, and South Asia plus Australasia. Brackets denote non-Communist world.
demand, the total Asian-Pacific picture is greatly affected. As a result, consumption of oil in the region is shown to be only 33 per cent, gas 6 per cent, and coal 52 per cent. Since China's inclusion in the table distorts the regional picture, we have constructed a table excluding China. The emerging picture makes the region not all that different from the global economy - except for gas. Excluding China, the Asian-Pacific region depends on oil for 47 per cent of its energy demand, coal for 31 per cent, hydro and nuclear for 6 per cent each, but on gas only 10 per cent. In contrast, global energy demand is supplied 20 per cent by gas. Indeed, the role of gas as a source of energy in the Asian-Pacific region is lower than in any other part of the world (see Table 2). In the Soviet Union, gas supplies 39 per cent of energy demand, in the United States 24 per cent, and in the Middle East 28 per cent. Even Latin America and Africa consume more gas than the fast-growing Asian-Pacific region. It is only natural to expect that the share of gas consumption will rise dramatically in the region by the year 2000.
4
Fereidun Fesharaki and Nancy D. Yamaguchi
TABLE 2 Share of Gas in the Structure of Energy Demand 1989 (In percentages) USA Western Europe Asia-Pacific (China) USSR Middle East Latin America Africa World
25 16 7 to 10* (2) 41 37 18 14 21
*7% including China and 10% excluding China.
Our own assessment of the future Asian-Pacific energy demand is shown in Table 3. The share of different energy sources clearly varies by oil price. If we assume an oil price of around US$23 per barrel by the year 2000 (in real 1988 prices), we expect the share of oil to decline to 42 per cent (though in absolute terms oil demand will rise significantly), the share of coal to decline to 26 per cent; the share of gas to rise dramatically to 16 per cent, and the share of nuclear power to rise to 9 per cent. A higher oil price would reduce oil demand to 37 per cent and result in higher demand for other energy sources. In both price scenarios, however, the share of gas will expand significantly. In fact, we believe that current economics already warrant increased gas use in many parts of the region. Gas use will expand with additional discoveries and, even more importantly, with progressive development of a "gas utilization culture". Use of gas is new in the region. As the governments and industries become familiar with established and new uses of gas, and as they prepare to make the heavy start-up investments in infrastructure and distribution, the consumption of gas is certain to rise by leaps and bounds. Assuming an annual energy demand growth of 3.5 to 5 per cent annually, we are likely to see demand for gas of 5 to 6 MMBDOE in the year 2000, compared to 1.9 MMBDOE in 1988. And still, we may well be on the conservative side. Insofar as nuclear power is concerned, our forecasts do not include any nuclear power production in Indonesia, China, Pakistan, and the Philippines. In fact, we assume that there will be no additional nuclear
A Decade of Change in the Asian-Pacific Region
5
TABLE 3 Current and Future Asian-Pacific* Energy Demand Structure (Two Scenarios) (In percentages) 2000**
1988
II Oil Gas Coal Hydro/Other Nuclear
TorAL
47 10 31 6 6
42 16 26 7 9
37 17 29 7 10
100
100
100
*Excluding China. **Corresponding to our Low Price Scenario I of US$23 per barrel and High Price Scenario II of US$35 per barrel of oil in the year 2000.
development in nations outside of the few already involved in nuclearpower generation. Most of the projected additions are for the power plants already under construction or firmly planned. Nuclear-power generation in Taiwan has encountered severe political opposition and faces a moratorium. At most, two new power plants may be built in Taiwan by the end of the century. In Japan, already up to 10,000 MW of new generation capacity from nuclear power has been postponed. In South Korea, there is as yet no active opposition, but it will be surprising if the environmental concerns already surfacing do not extend to nuclear power as well. Essentially, after a jump in nuclear capacity between 1990-95 because of facilities already committed or under construction, we do not see much prospect for growth of nuclear power in the region. ASIAN-PACIFIC OIL AND GAS RESERVES In the global context, the Asian-Pacific region has only a small oil and gas resource base. Proven oil and gas reserves are shown in Table 4. The Asian-Pacific region contains around 45 billion barrels of proven oil reserves, equivalent to only 4.5 per cent of world proven reserves, with a
6
Fereidun Fesharaki and Nancy D. Yamaguchi
TABLE 4 Proven Oil and Gas Reserves (As of 1 January 1989)
TOTAL WORLD*
OPEC** Asia-Pacific Brunei Indonesia Malaysia India Australia China
TOTAL WORLD
OPEC Asia-Pacific Brunei Indonesia Malaysia India Australia China New Zealand Bangladesh Pakistan
Oil (Billion Barrels)
Share of Total (%)
RIP Ratio
992.5 764.7 45.1 1.4 8.3 2.9 6.4 1.7 23.6
100.0 77.0 4.5 0.1 0.8 0.3 0.6 0.2 2.0
45.0 100.0+ 21.0 27.5 19.6 14.8 26.6 9.1 23.0
Gas (Trillion Cubic Feet)
Share of Total (%)
RIP Ratio
3,953.3 1,498.3 272.4 11.6 83.6 51.7 17.7 16.6 31.7 5.2 12.7 17.7
100.0 37.9 6.9 0.3 2.4 1.5 0.5 0.5 0.9 0.1 0.4 0.5
55.9 100.0+ 57.0 37.9 68.3 100.0+ 40.3 30.7 44.4 32.0 60.7 40.3
*Includes more than 300 million barrels of official "paper" increase by the Persian Gulf countries - half of which probably do not as yet exist. **As of 1 March 1989.
reserve-to-production (R/P) ratio of twenty-one years. Indonesia and China together account for over 70 per cent of the regional oil reserves. Gas reserves in the Asian-Pacific region account for nearly 7 per cent of proven world reserves, with a R/P ratio of fifty-seven years. There are many more countries with gas resources than with oil reserves, and the outlook is generally brighter.
A Decade of Change in the Asian-Pacific Region
7
If we were to look at an updated version of Table 4 in, say, five years, we would probably see very little change in the oil picture, but a substantial change in the gas picture. Oil reserves will not change dramatically, but both gas reserves and RIP ratios will be very different. We are only in the early stages of finding gas and learning how to use it in the AsianPacific region. In addition, we do not believe there will be any new LNG importers. Therefore, new gas discoveries will be used domestically on a much wider scale in almost every country with significant gas reserves. DECLINING CRUDE PRODUCTION AND EXPORT AVAILABILITY The Asian-Pacific region has four net oil exporters: Indonesia, China, Malaysia, and Brunei. Burma, an oil exporter until1986, is now a minor importer, and Vietnam's exports of 15-20 mb/d are less than its 30 mb/d demand. The net oil exporters in the region exported 1.8 mmb/d of oil in 1985. Additional discoveries and enhanced recovery techniques have succeeded in maintaining a fairly steady level of exports to the present time. However, beyond 1990 the outlook is for a decline. Exports will drop to 1.2 mmb/d in 1995 and to only 0.45 mmb/d by the turn of the century. Two key factors will be responsible for the dramatic drop: rising demand in the four net oil-exporting nations, and a drop in the oil production capacity of each country with the exception of Brunei. China is likely to witness a major decline in crude oil availability from 450 mb/d in 1990 to 200 mb/d in 1995. Coupled with additional large-scale oil product imports, China may well be a net importer by 1995. In the early 1990s, significant new sources of heavy sweet crudes will come on-line in Indonesia. Duri production (Caltex) will jump from 100 mb/d in 1988 to 250 mb/d in late 1990 and to 300 mb/d by 1992/93. Production of Intan (Maxus) began in June 1989 and reached 45 mb/d in September. Widuri (Maxus) began production in 1990. By 1992, the Intan and Widuri fields will produce 220 mb/d. As a result, significant additional Low-Sulphur Waxy Residue (LSWR) supplies may become available during the period from 1990 to 1992/93. However, by the turn of the century, Indonesian crude production will fall to approximately 800 mb/d, the bulk of which will be used domestically. Malaysia will experience a similar though less-pronounced trend, with the result being that Indonesia and Malaysia will become very small players in the crude export market. Of the four net oil-exporters, only Brunei will be able to continue exports at current rates into the twenty-first century.
8
Fereidun Fesharaki and Nancy D. Yamaguchi
Meanwhile, Australian production is expected to decline slowly. The decline of Gippsland crude production will be offset partially by new production in the Timor Sea, which was expected to reach 100 mb/d by December 1989. Still, we expect that the Australian market will absorb virtually all domestic crudes. Very few nations in the region are moving to fill the void that will be created as the traditional oil-exporters enter into production decline. By the year 2000, new sources may include perhaps 50-75 mb/d from Papua New Guinea and 30 mb/d from Burma. Papua New Guinea's lagifu/South Hedonia crude is a light, Gippsland-type material. Production of Minastype material from Vietnam (Bach Ho crude) is expected at 20 mb/d in 1990 and may reach 50 mb/d by 1995. By then, we expect that domestic processing will keep exports out of the regional market. The conclusion is that the availability of Asian low-sulphur crudes will be seriously reduced due to rising domestic demand and lower production. The decline of low-sulphur crude will occur simultaneously with changing sulphur standards requiring reduction of sulphur in fuel oil and middle distillates. Shorter supplies of light sweet crudes are likely to result in sulphur premiums, since additional Middle Eastern crudes will be used. At the same time, we may see a widening differential between light sweet and heavy sweet crudes by the early 1990s. THE ASIAN-PACIFIC OIL BALANCE The Asian-Pacific oil balance, 1980-2000, is displayed in Table 5. Regional demand will grow dramatically by 2 mmb/d from 1990 to 1995 and another 1 mmb/d to the year 2000. It is to be noted that our demand forecast, which is aggregated from two dozen sources, is very conservative - almost 50 per cent lower than an individual country-by-country forecast would indicate. Demand could easily be 1-2 mmb/d higher in each of the two periods. At the same time, regional production is declining moderately. Dependence on outside sources of oil will rise to unprecedented levels. Imports from sources outside the Persian Gulf will rise but will be almost insignificant when compared to the volumes of Middle Eastern oil. Indeed, it is the Persian Gulf which will be the chief supplier of oil. As discussed above, exports from Asian-Pacific oil producers will drop sharply, from approximately 1.8 mmb/d in 1990 to 1.2 mmb/d in 1995, and to less than half-a-million barrels per day by the year 2000. Assuming that all of this goes to other nations in the region - a generous assumption - imports from the Persian Gulf are likely to rise to over 7.6 mmb/d in 1995, an
A Decade of Change in the Asian-Pacific Region
9
TABLE 5 Asian-Pacific Oil Balance (In thousands of barrels per day)
Regional Demand Regional Production Net Oil Required from Outside the Region Imports from Regional Oil Exporters Imports from Persian Gulf Imports from Other Regions TOTAL
IMPORTS
Import Dependence on Persian Gulf
1980
1985
1990
1995
2000
10,735 4,885
10,140 5,790
11,965 5,910
13,937 5,880
14,942 5,480
5,850
4,350
6,055
8,057
9,462
1,255 5,525 325
1,874 4,170 180
1,797 5,705 350
1,213 7,657 400
450 8,962 500
7,105
6,224
7,852
9,270
9,912
78%
67%
73%
83%
90%
increase of more than 80 per cent over the 1985 level of 4.2 mmb/d. Dependence on imports from the Persian Gulf may rise from a 1985low of 67 per cent to 73 per cent in 1990, 83 per cent in 1995, and perhaps to 90 per cent by 2000, making the Asian-Pacific region the most importdependent region of the world. This trend is likely to hold whether Asian refining capacity expands to meet demand or not, since the Middle East is the most likely swing source of product as well as crude. THE BOOM IN ASIAN-PACIFIC OIL DEMAND During the mid-80s, the future of oil-demand growth was the most frequent topic of debate at energy conferences. Those who forecasted increasing demand were hard-pressed to identify where such growth would take place; both Europe and the United States were seen as stagnant or declining markets. Developing-country demand was often invoked as the variable that would balance the equation, but careful observation of Third World oil consumption showed that the total volume of consumption was growing at only moderate rates from a relatively modest base. By the late 1980s, many analysts were inclined to dismiss the idea of demand surges in the developing world.
Fereidun Fesharaki and Nancy D. Yamaguchi
10
As so often happens in the world of oil, about the time that a possibility is dismissed, it begins to occur. Lower oil prices and booming economic activity are leading to rapid increases in oil demand in the majority of Asian-Pacific countries. Between 1987 and 1995, current forecasts suggest average annual growth of 3.6 per cent per year. Although a massive economic turnaround or another oil-price shock could stern this growth, most of the current forecasts are reasonable given today's economic and price outlook; some, indeed, may be too low. Our 1987-95 product demand forecast by region is included as Table 6. Most of the forecasts used in this chapter are the most recent made by the relevant ministries in the Asian countries (except for many of the small economies, where our own forecasts have been employed); where possible, however, these have been compared with the internal forecasts of oil companies operating in the countries, and there is remarkably little divergence between the industry
TABLE 6 Asia-Pacific: Forecast of Petroleum Product Demand, 1987-95 (In thousands of barrels per day) Region
Year
LPG
Light*
Medium
Heavy**
Total
East Asia
1987 1990 1995
651.1 707.4 779.4
1,840.4 2,098.8 2,554.8
2,326.9 2,801.0 3,298.7
2,398.9 2,623.2 2,746.0
7,217.3 8,230.4 9,378.9
Southeast Asia
1987 1990 1995
55.4 63.1 78.2
231.6 332.3 388.5
642.9 776.6 919.9
433.1 476.1 515.4
1,362.9 1,648.0 1.902.0
South Asia
1987 1990 1995
33.9 20.4 22.4
162.1 191.8 277.1
689.3 837.9 1,135.8
319.3 337.0 507.0
1,204.6 1,387.1 1,942.2
Australasia
1987 1990 1995
40.7 42.3 43.4
339.6 339.6 337.1
237.4 247.1 275.2
68.0 70.1 57.8
685.6 699.1 713.5
1987 TOTAL
781.0
2,573.7
3,896.4
3,219.4
10,470.5
1990 TOTAL
833.1
2,962.5
4,662.5
3,506.4
11,964.6
1995 TOTAL
923.4
3,557.5
5,629.5
3,826.2
13,936.7
*Includes naphtha, solvents, and petrochemical feedstocks. **Includes crude burned as fuel.
A Decade of Change in the Asian-Pacific Region
11
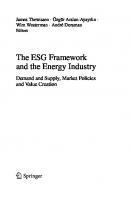
perspective and the predictions of individual governments. In each country covered, there is general agreement that a demand boom is occurring. What is not generally noticed is that the boom is pandemic; virtually every major Asian country is facing rapid growth in demand that is likely to send Asian oil consumption well above historical levels. Much of the growth can be accounted for by continued demand increases in the traditional high-oil-growth exporting countries such as Indonesia and China, but more surprising is the surge in growth in the traditionally demand-controlled economies of East Asia. Taiwan is experiencing rapid increases in demand, South Korea's consumption is surging forward at record rates, and even Japan is experiencing an increase that is very large in absolute terms. Between 1987 and 1995, oil demand in the Asian-Pacific region is likely to increase by 3.5 mmb/d. China alone accounts for about 1 mmb/d of this increase. Four countries - China, Japan, India, and South Korea - account for 2.6 mmb/d, or nearly three-quarters, of the total additional demand. A bar chart displaying the absolute increases in oil demand by nation is provided as Figure A. The initial drop in prices seemed to spur little increase in consumption. In part, this is because it takes a considerable period for consumers to readjust their behaviour, and even longer to change perspectives on the future availability of energy. An even more important factor in Asia, however, is the adjustment of government policies. Most Asian governments continued to control oil demand tightly even after the initial price collapse; only in late 1987 through 1988 did most of them begin to relax their taxes, quotas, and administrative controls. At present, a wave of liberalization is sweeping the petroleum industry in the Far East; from Australia and New Zealand to Japan and South Korea, privatization and free-marketeering are the watchwords of the day. The perceived lack of danger from future shortages in the oil market is a contributing factor to this change in outlook, but the most compelling force has undoubtedly been the price decrease; coupled with the general weakness of the dollar and expanding Asian economic success, the real price of oil is at one of its lowest levels in many domestic currencies, and its price relative to income levels has diminished rapidly. Figure B displays the regional demand growth in absolute terms by product from 1987 to 1995, while Figure C depicts the demand barrel in relative terms. Unlike the outlook of previous years, when rapid growth was seen for middle distillates, with only slow growth for light products and declining demand for fuel oil, the regional picture now shows more rapid growth at both the top and the bottom of the barrel. Although
FIGURE A Increase in Oil Demand in the Asian-Pacific Region, 1987-95
ALL OTHERS
~
MALAYSIA~ PHILIPPINES
~
INDONESIA~ TAIWAN
~:.C.CjlC>C:.c.q
THAILAND f'->''-"-''-1"-
SOUTH KOREA
~~~~~~?2~~~~a
JAPAN~ INDIA CHINA
;c;()d
X
0
100
200
300
400
XX
500
600
700
Thousands of barrels per day
800
900
1000
FIGURE B Asian-Pacific Petroleum Product Demand, 1987-95 14,000
-.---------- -----;:::== ==::::;-.... ,
12,000 ;--------;:::: :===:::::;-- -f
10,000 >-
Ill "'0
(i) 0.
en
8,000
~
(i;
..0
0
en c en
"'0
6,000
Ill :J
0
..r::.
1-
4.000
2,000
0
1995
1990
1987
•
Medium Heavy••
• Includes solvents and petrochemical feeds. •• Includes crude burned as fuel.
FIGURE C Asian-Pacific Product Demand Barrel, 1987-95*
% 100-r--r---------. --.---------.-,r---- -----.-.
90 80
60
30 20 10 0
1987 Ought**
1990 ~Middle
~Distillates
* Excluding LPG and direct-burned crude. ** Mogas, naphtha, etc. *** Fuel oil, asphalt, lubes, ~tc.
1995 •
Heavy•••
A Decade of Change in the Asian-Pacific Region
15
middle distillates' share of the demand barrel is increased at the expense of fuel oil, the share of mogas and naphtha also increases, and all cuts of the barrel increase substantially in absolute terms. Although middle distillates will continue to be under some degree of stress, the outlook now, in terms of refinery capabilities, is far less grim than the drastically unbalanced barrel that earlier trends had suggested. Moreover, the increase in gasoline demand, coupled with new environmental restrictions on lead content in many countries, suggests that octane may become a more important issue in the Asia-Pacific than in past years. In the mid-80s, hydrocracking was seen as the only feasible solution to the region's supply/ demand imbalance; now catalytic cracking technologies, particularly resid cat cracking (RCC), appear to have considerable promise in helping to overcome the mismatch.
THE ASIAN-PACIFIC REFINING SECTOR Of the 14.2 mmb/d of demand (including bunkers) projected for 1995 in the region as a whole, substantial quantities derive from non-refinery sources. About 300,000 bid of this amount are crude oil burned directly in Japanese power stations, and about 775,000 bid of LPG will be provided from natural gas and LNG facilities; thus the actual demand for refined products in the region will be about 13.1 mmb/d. This is still well above the region's total installed distillation capacity of 12.2 mmb/d. The gap between demand and refinery capacity is even more marked when it is noted that a substantial fraction of the region's capacity is idle in Japan, which is unlikely to become a major exporting centre unless Japanese policies and Japanese refinery economics change dramatically. If all regional demand were to be met from regional refineries, this would demand a crude throughput of at least 13.6 mmb/d, implying a utilization rate of 96 per cent for the region's refineries, including currently idle Japanese capacity. Plans have been made to add substantial new refining capacity in the Asian-Pacific region. Current plans call for the addition of more than 2 mmb/d of new distillation capacity before 1995, which will raise the regional total to 14.2 mmb/d. The configurations of the current and planned Asian-Pacific refining complex, by nation, are provided in Tables 7, 8, and 9. Graphic depiction follows in the form of a nation-by-nation comparison of "Asian-Pacific Crude Distillation Capacity 1987 and Minimum Likely 1995" (Figure D).
TABLE 7 Asia-Pacific: Refinery Configuration, 1989 (In thousands of barrels per day) Country
COU
Australia Bangladesh Brunei Burma China India Indonesia )a pan Malaysia New Zealand Pakistan Philippines Singapore South Korea Sri Lanka Taiwan Thailand
644.1 154.0 31.2 3.5 10.0 26.3 4.8 1.7 2,251.0 n.a. 40.0 1,051.4 333.0 73.8 288.0 65.6 812.0 4,111.0 1,563.0 60.0 209.3 7.2 88.4 36.6 130.1 14.2 254.0 58.6 852.0 256.1 137.7 855.0 59.0 50.0 50.0 2.4 12.5 600.0 123.5 202.7 38.7 19.5
TOTAL
VOU
VBR
Coking
FCC*
111.0 36.9 35.2 22.8
HOC
Resid OS
VGO OS
Alkyl Poly BTX Is om
250.0 1.9
32.9
606.0 90.0 134.0 6.0 35.0 110.8 522.9 91.0
85.0 109.0 26.0 13.8 70.6 73.3 18.0 51.5 531.1 386.5 610.9 298.9 1,880.5 22.0 60.9 21.9 6.5 47.4 5.5 24.8 5.0 18.0 39.4 91.2 58.3 44.6 36.0 11.0 68.0 21.0 175.0 3.8 2.1 15.3 62.5 60.0 58.5 54.9 17,6 26.3 69.0
24.0
48.1 29.0
19.0 25.0 8.1
20.0
22.7 2.4
HOT
159.6 1.7
23.1
11.0
HOF
190.3
21.5
15.0
Cat Ref
As ph
13.8
13.2
16.4 1.2
10.5
51.0 15.0 5.0 48.6
n.a. 37.2 7.5 58.5 1.7 2.3 4.1 5.0 12.0 11.2 1.0
n.a.
4.3 0.6 24.4
48.6
1.3
3.8 3.4 12.8 4.2
11.9 3.2
29.7
H2 Lube
(mmcfd)
n.a. 9.5 130.8 850.8 44.0 0.1 79.0 68.0
1.1
100.0 4.7
13.5
12,178.5 2,942.6 460.8
239.9
1,544.4 416.4 1,184.4 446.5 738.6 564.2 2, 797.2
85.1
95.8
37.8
157.0 159.2
1,286.9
Total excluding japan
8,067.5 1,379.6 400.8
217.1
1,021.5 325.4
653.3
60.0 127.7 265.3
916.7
60.7
47.2
27.3
108.4 100.7
436.1
Total excluding Japan & China
5,816.5
106.1
415.5 235.4
568.3
60.0 127.7 265.3
807.7
36.7
n.a.
27.3
n.a.
360.8
57.4
n.a.
n.a.
·china's FCC capacity includes 108 mb/d of resid cat cracking (RCC). Abbreviations: CDU Crude Distillation Unit VDU Vacuum Distillation Unit VBR - Visbreaking FCC Fluid Catalytic Cracker HOC Hydrocracking
Cat Ref Resid OS VGO OS HDF HOT
-
Catalytic Reforming Residual Fuel Oil Desulphurizing Vacuum Gas Oil Desulphurizing Hydrofining Hydrotreating
Alky/Poly BTX lsom As ph HZ
Alkylation/Polymerization Benzene, Toluene and Xylene Extraction Isomerization Asphalt Hvdrogen
TABLE 8 Asia-Pacific: Refinery Construction Planned, 1990 (In thousands of barrels per day) Country Australia Bangladesh Brunei Burma China India Indonesia )a pan Malaysia New Zealand Pakistan Philippines Singapore South Korea Sri Lanka Taiwan Thailand
COU
VOU
VBR
Coking
FCC*
HOC
Cat Ref
Resid OS
VGO OS
HOF
HOT
22.0
18.7
36.0 8.1
5.3
28.5
29.0 26.5
Alkyl Poly
BTX
Is om
Lube
10.0
As ph
H2 (mmcfd)
3.0
13.0
360.0 498.8 485.0 10.0 100.0 34.0 46.0
140.0 139.7
75.0
11.4
7.9
166.8 4.5
22.2 12.0
210.0 2.9 120.0 170.0
45.0
14.7
19.4
50.0 25.0
30.0
23.0 27.0
25.0 14.0
17.0
4.1
4.1 14.8 9.6 31.5
5.0 12.0
22.5
27.0
60.0
105.0
11.0
28.2
2.5
12.0
6.0
9.1 46.8
TOTAL
2,036.7
223.4
114.1
375.8
161.4
181.2
132.0
11.0
167.7
2.5
21.1
28.0
7.9
54.8
Total excluding japan
2,026.7
218.9
114.1
375.8
161.4
181.2
132.0
11.0
138.7
2.5
21.1
28.0
7.9
54.8
Total excluding japan & China
1,666.7
218.9
114.1
235.8
161.4
145.2
132.0
11.0
138.7
2.5
21.1
28.0
7.9
54.8
*Planned FCC units are resid cat crackers (RCC). Abbreviations: CDU - Crude Distillation Unit VDU - Vacuum Distillation Unit VBR Vis breaking FCC - Fluid Catalytic Cracker HOC - Hydrocracking
Cat Ref Resid OS VGO OS HDF HOT
Catalytic Reforming Residual Fuel Oil Desulphurizing Vacuum Gas Oil Desulphurizing Hydrofining ·- Hydrotreating
-
Alky/Poly BTX Is om As ph H2
Alkylation/ Polymerization Benzene, Toluene and Xylene Extraction Isomerization Asphalt Hydrogen
TABLE 9 Asia-Pacific: Future Refinery Capacity (In thousands of barrels per day) Country
CDU
Australia Bangladesh Brunei Burma China India Indonesia japan Malaysia New Zealand Pakistan Philippines Singapore South Korea Sri Lanka Taiwan Thailand
644.1 154.0 31.2 3.5 13.0 10.0 26.3 4.8 1.7 2,611.0 n.a. 40.0 1,550.2 472.7 85.2 1,297.0 288.0 65.6 4,121.0 1,567.5 60.0 309.3 7.2 88.4 36.6 164.1 36.4 14.7 300.0 70.6 852.0 256.1 187.7 1,065.0 104.0 75.0 52.9 2.4 12.5 720.0 123.5 372.7 38.7 19.5
VDU
VBR
Coking
FCC
111.0 36.9 35.2 22.8
HDC
Resid VGO DS DS HDF
BTX
/sam
Lube
23.8
13.2
10.5
51.0 22.9 5.0 48.6
268.7 1.9
32.9
746.0 90.0 134.0 81.0 201.8 110.8 522.9 91.0
121.0 109.0 34.1 13.8 75.9 73.3 18.0 51.5 531.1 386.5 610.9 298.9 1,909.5 60.9 50.5 26.5 21.9 6.5 47.4 9.6 28.9 39.4 5.0 18.0 106.0 44.6 36.0 20.6 58.3 90.5 27.0 21.0 206.5 2.1 3.8 15.3 122.5 165.0 58.5 65.9 28.2 17.6 26.3 69.0
24.0
5.7
41.7
19.5
19.0 50.0 22.1
71.1 56.0 20.0 17.0
22.7 2.4
Alkyl Poly
181.6 1.7
23.1 30.0
11.0
HDT
190.3
21.5 19.4
15.0
Cat Ref
n.a.
4.3 0.6 24.4
48.6
1.3 12.0 21.0
3.8 3.4 12.8 4.2
H2 As ph (mmcfd) 19.4 1.2
n.a.
n.a.
37.2 7.5 58.5 1.7 2.3 4.1 10.0 12.0 11.2 1.0 46.8 1.1
9.5 130.8 850.8
100.0 4.7
44.0 0.1 79.0 68.0
TOTAL
14,215.2 3,166.0 574.9
239.9
1,920.2 577.8 1,365.6 578.5 738.6 575.2 2,964.9
87.6
116.9
65.8
164.9 214.0
1,286.9
Total excluding japan
10,094.2 1,598.5 514.9
217.1
1,397.3 486.8
834.5 192.0 127.7 276.3 1,055.4
63.2
68.3
55.3
116.3 155.5
436.1
106.1
651.3 396.8
713.5 192.0 127.7 276.3
39.2
n.a.
55.3
Total excluding Japan & China
-
7,483.2
n.a.
Abbreviations: CDU - Crude Distillation Unit VDU Vacuum Distillation Unit VBR Visbreaking FCC Fluid Catalytic Cracker HOC Hydrocracking
474.9
Cat Ref Resid OS VGO OS HDF HOT
-
Catalytic Reforming Residual Fuel Oil Desulphurizing Vacuum Gas Oil Desulphurizing Hydrofining Hydrotreating
946.4
Alky/Poly BTX Isom Asph HZ
65.3
n.a.
n.a.
Alkylation/Polymerization Benzene, Toluene and Xylene Extraction Isomerization
Asphalt Hydrogen
FIGURE 0 Asian-Pacific Crude Distillation Capacity 1987 and Minimum Likely 1995 Brunei
Burma Bangladesh Sri Lanka New Zealand Pakistan Thailand Mal:;oysia Philippines Taiwan Australia
Indonesia Singapore South Korea India China Japan 0
500
1,000
1,500
2,000 3,000 2,500 Thousands of barrels per day
3,500
4,000
4,500
20
Fereidun Fesharaki and Nancy D. Yamaguchi
Substantial additions to upgrading capacity are also being made, including 160,000 bid of hydrocracking and 375,000 bid of new RCCs. Figure E, titled "Asian-Pacific Current and Planned Upgrading Capacity", provides a look at planned capacity by unit type. Nonetheless, these additions are almost certain to be inadequate to the task of balancing the barrel. To meet 1995 demands, about 2.5 mmb/d of fuel oil will have to be cracked into light and middle products. The region's planned 2.7 mmb/d of FCC, RCC, hydrocracking, and coking capacity still falls short of the ability to convert 2.5 mmb/d in net terms, even if fully utilized. Thus, the region will have to either expand refinery construction well beyond current plans, or anticipate substantial product imports from the Middle East. IMPACTS OF CHANGING PRODUCT SPECIFICATIONS Product specifications are likely to become a greater problem for Asian refiners than ever before. In South Korea, where gasoline demand is growing at 20 per cent annually, the government has initiated a five-year phase-down of lead that will eliminate leaded gasoline in the early 1990s; the growth rate in octane demand is thus even higher than the 20 per cent growth in gasoline. Some countries, notably South Korea and Taiwan, have stiffened sulphur standards on fuel oil and diesel substantially, and further tightening should be expected. One of the most surprising developments in Asia is the rapid spread of environmental concerns within national governments and the populace as a whole. Many countries that have previously paid only lip service to environmental protection are now seriously considering changes in sulphur and leading specifications. Although this does not go nearly as far as in the United States, where reduction of benzene in gasoline is being advocated, a significant tightening of specifications at a time of soaring demand will confront Asian refiners with increasingly difficult problems. PRODUCT TRADE AND GASOLINE EXPORT AVAILABILITY In the key refining centres total gasoline production reached 1.75 mmb/d in 1988. Imports of 172 mb/d and exports of 123 mb/d meant a consumption of 1.81 mmb/d. The key refining centres in this context are Australia, China, Indonesia, India, Japan, Malaysia, New Zealand, the Philippines, Singapore, South Korea, Taiwan, and Thailand. The petroleum product balance for these nations in 1988 is provided in Table 10.
FIGURE E Asian-Pacific Current and Planned Upgrading Capacity
Residual desulphurizing
Reforming
Hydrocracking
RCC
FCC
Coking
0
200
400
Planned
800 1,000 1 ,200 1,300 600 Thousands of barrels per day
m
Current
1,400
1,600
22
Fereidun Fesharaki and Nancy D. Yamaguchi
TABLE 10 Key Refining Centres* Petroleum Product Balance, 1988 (In thousands of barrels per day) Product
Production
Imports
Exports
Consumption
LPG Gasoline Naphtha Kero/Jet Diesel /Gasoil Fuel Oil Others
429.9 1,751.7 711.8 1,148.8 2,265.4 2,716.9 452.2
480.5 172.1 456.1 227.0 383.7 605.3 22.4
57.7 123.2 215.4 205.2 287.1 562.0 47.5
846.9 1,811.6 897.3 1,170.2 2,373.0 2,776.2 438.5
TOTAL
9,476.7
2,347.1
1,498.1
10,313.7
*Key centres are Australia, China, India, Indonesia, Japan, Malaysia, New Zealand, Philippines, Singapore, South Korea, Taiwan, and Thailand.
In 1988, diesel production of 2.3 mmb/d and imports of 384 mb/d were observed, with exports accounting for 287mb/d. Fuel oil production of 2.7 mmb/d was supplemented by 605 mb/d of imports. Fuel oil exports averaged 562 mb/d, most of which were shipped from Singapore and Indonesia. The four net exporters of gasoline in 1988 accounted for 65.8 mb/d of exports, with China and Singapore accounting for almost the entire volume. The region as a whole is a net importer of gasoline; however, we have calculated the potential for gasoline exports from the four current and two prospective net exporters in the region. Our findings are included as Table 11. For 1995, our low-range gasoline export availability is 67 mb/d, and high-range export availability is 140 mb/d. China and the Philippines drop out of the picture entirely, and Singapore and Indonesia account for virtually all exports. We expect all net exports to be easily absorbed in the Asian-Pacific region. CONCLUSION A substantial amount of the demand increase projected between 1987 and 1995 has already taken place. Based on preliminary statistics for 1988 and 1989, it appears that regional demand will reach 12 mmb/d in 1990, an increase of about 1.5 mmb/d over 1987. Thus, over 40 per cent of the total growth of 3.5 mmb/d in Asian demand over the 1987-95 period is likely
A Decade of Change in the Asian-Pacific Region
23
TABLE 11 Potential Gasoline Exports in the Asian-Pacific Region (In thousands of barrels per day) Net Exporters
1995
1995
Lower
Upper
1988
Australia China Indonesia Philippines Singapore South Korea
0.0 24.1 0.0 3.6 38.0 0.1
0.0 0.0 25.0 0.0 42.0 0.0
0.2 0.0 74.1 0.0 64.8 1.4
TOTAL
65.8
67.0
140.5
to have been reached by next year. Even if demand does not grow as rapidly as anticipated, even modest increases from the 1990 base, seen against a background of declining Asian crude exports, point to a tighter market, a prolonging of high refinery margins, an increased reliance on supplies of oil from the Middle East and, more surprising, an unforeseen rate of firming in the crude market. OPEC is likely to resume its pivotal role in the oil market, and the Persian Gulf will once again be the focus of political and economic attention. The increase in demand in Asia, in concert with the levels of demand increase worldwide, may return the global economy to a situation where a disruption or political instability in the Middle East can give rise to sudden price shocks and market dislocations. There are many factors that could alter this outlook. Those who believe that we learn from history might suggest that OPEC will be more moderate in its pricing behaviour during a new tightening of the market. The "Yamani strategy" of slow and steady price increases, at low enough levels to discourage major shifts away from oil, may carry the day with oil ministers who remember the debacle following the rise to US$34 per barrel. Downstream integration, especially the moves by Venezuela, Saudi Arabia, Kuwait, and Indonesia, may act as a force in favour of market stability; those countries with extensive joint ventures and overseas marketing outlets have much more to lose from market disruptions than in the past.
24
Fereidun Fesharaki and Nancy D. Yamaguchi
Near-term price increases could also have a constraining effect on demand growth, not only through direct price effects, but also from their effects on perception. Both policy-makers and end-users appear to be more sensitive to the rate of price increases than to the absolute levels of price. A steady increase in price might do little to discourage demand growth, but a near-term price spike owing to a supply disruption could have a dramatic effect on the policies of both governments and consumers. In Asia, particularly, it would be easy for governments to reinstate the control systems that governed petroleum in the mid-70s through mid-80s. Furthermore, conservation measures are now more widely understood by both industry and residential customers than immediately after the previous two oil shocks. A sense that oil is a point of vulnerability, which has largely vanished, could result in a curtailment of demand much more rapidly than has occurred in the past. Finally, the economic position of the Asian economies must be considered. Recessions could dramatically affect the demand outlook. Some analysts simply feel that the recent booming growth cannot be sustained. Demand growth could be set back somewhat if political or social strife postpones or derails national development plans. The recent events in China could result in a major change in Chinese consumption. Since China accounts for nearly 1 mmb/d of the projected demand increase from 1987 to 1995, a slump in Chinese demand growth would have a massive impact on the overall regional forecast. (However, reduced Chinese demand might not fully alleviate the pressure on refined product supply, since it is possible that some planned refinery construction projects might be cancelled or postponed.) Similarly, India's always-precarious economic growth could be reversed; India accounts for over 680,000 b/d of the incremental demand projected. In closing, we would like to emphasize very briefly some key points to be kept in mind and examined. Is the pace of world demand growth likely to continue higher than our forecasts? If so, the biggest pressure on oil prices in the 1990s will come from the Asian-Pacific basin. Japan's crude-burning practice is the most important single determinant of crude prices in the Asian-Pacific region. The Asian-Pacific refining sector still lags far behind the rest of the world in terms of capacity and sophistication. Product imbalances are virtually inevitable and will necessitate significant growth in product
A Decade of Change in the Asian-Pacific Region
25
trade. Increasingly, nations will have to look outside the region for marginal supplies of petroleum product. The implications for freight markets are potentially enormous. The four most critical product imbalance centres are likely to be India, China, Japan, and the U.S. West Coast. These pressure points are likely to cause significant changes in the regional crude and product flows. For example, the U.S. West Coast will make the transition from crudesurplus region to crude-deficit region. We anticipate that the West Coast refiners will look to the Asian-Pacific region for additional supplies of crude, product, or both. Changing environmental standards on sulphur and lead will result in much stronger premiums for Far East crudes. With low-sulphur crudes declining in availability, hydroprocessing will be relied upon more and more to reduce sulphur and increase yields of transport fuels. Refining will remain profitable even for less-sophisticated refineries. Since the imbalance in the region will involve both quantity and quality, straight-run products from simple hydroskimming plants will be highly valued - cracking improves yields, but cracked stocks (particularly thermally cracked stocks) are generally poorer in quality. This is not to say that a sophisticated refiner will ever find himself at a disadvantage - the added element of flexibility will remain at a premium. Experienced refining/trading centres such as Singapore will be admirably poised for the coming decade. In short, the 1980s brought many changes to the Asian-Pacific region, and the coming decade is certain to pose continual challenges. The region will undergo major structural changes; dynamic demand growth and impending product imbalances offer many exciting opportunities to buyers, sellers, and shippers alike. The unusual complexities of the regional system will make planning an essential tool. Those who have learned from the past and can project their experiences into the future stand to do very well in the "Pacific Century" - or at least in part of it, since the "century" may very well outlast our lifespans. In contrast, for those who cautiously stand back and catch only the tail end of the coming cycles in building, buying, or selling, the future may be full of pitfalls and unpleasant surprises.
II
STRUCTURAL CHANGE AND ENERGY POLICY IN ASEAN Shankar Sharma
A
SEAN as a group has a fast-growing economy. The economic performance of individual member countries - Brunei, Indonesia, Malaysia, Philippines, Singapore, and Thailand - has been impressive during the last two-and-a-half decades. The success of the economic development, in general, can be attributed to their market-oriented, outward-looking economic policies. The region, whose economy is closely related with the energy sector, comprises both energy importers and energy exporters. Three major producers of oil and gas - Indonesia, Malaysia, and Brunei - depend heavily on oil and gas exports for foreign exchange earnings and government revenues. Singapore, the largest oil-refining and trading centre in the region, is a major exporter of petroleum products. On the other hand, the Philippines and Thailand depend overwhelmingly on imported oil. The high degree of dependence on energy has made the economy of these countries vulnerable to energy prices. Despite the impressive economic growth, the region was greatly affected by the oil crises. Rapid price increases and vulnerability in supply in the 1970s led oilimporting countries to pursue various counter-acting policies. ASEAN countries formulated and implemented comprehensive energy policies; exploration and production activities of energy resources were intensified. Substitutions of other sources of energy for oil were sought and encouraged. Efforts were also made to increase the efficiency in energy use. Different pricing policies were adopted and macroeconomic policies were adjusted to ease the adverse impact of the oil crises. However, because of the diverse nature of the countries, the policy responses to the energy crises and the experiences were different.
26
Structural Change and Energy Policy in ASEAN
27
The objective of this chapter is to provide a comparative analysis of the energy policies of ASEAN member countries, especially after 1973. Policy response to the crisis, relating to demand and supply management, pricing, non-pricing, and macroeconomic policies, is also discussed. DEMAND AND DEMAND MANAGEMENT ASEAN's share in the world's total energy consumption is small. The region accounts for only about 1.2 per cent of the world's total although it has more than 5 per cent of the population. In the Asian-Pacific region, with 10 per cent of the population, it consumes about 6 per cent of the energy. The level of energy consumption varies from one country to another in ASEAN, depending on the level of economic development and industrialization, prices of energy resources, per capita income, and the degree of urbanization. In 1987 the average per capita energy consumption in ASEAN was 270 kilograms of oil equivalent (kgoe), which was lower than those for the world (1,327 kgoe) and the Asian-Pacific region (508 kgoe). Per capita consumption is the highest in Brunei and the lowest in the Philippines. In ASEAN countries, over the period 1965-73, the average annual growth rates in demand for primary energy and oil were 18.2 and 18.4 per cent, respectively; the rates were high in all countries except Indonesia (Table 1). The energy demand rose for a number of reasons. The industrial sector was growing rapidly while the agricultural sector became more commercial. It also increased with higher population growth and rapid urbanization. Substitution of commercial energy for traditional fuels (wood/charcoal by kerosene and LPG) also raised the share of commercial energy in the economy. But the most important factors for higher demand were the low energy price and the rapid economic growth of these countries. With the price of oil at about US$2 per barrel, the ASEAN economies were growing at an average annual rate of 8.2 per cent per annum during 1965-73. In Indonesia the rate of industrialization was slower, resulting in lower energy demand. Among the ASEAN countries during the period economic as well as industrial growth rates were lowest in Indonesia (World Bank 1980). Between 1973 and 1980, growth rates in demand for both primary energy and oil declined in all ASEAN countries, again with the exception of Indonesia. Primary energy consumption in ASEAN grew by 9.8 per cent per annum - a rate slower than before. Similarly, the rate of oil consumption grew only 8.2 per cent. But these rates were still much higher
28
Shankar Sharma
TABLE 1 Average Annual Energy Demand Growth Rates in ASEAN Countries (In percentages) Primary Energy
Oil
Country
1965-73
1973-80
1980-87
1965-73
1973-80
1980-87
Brunei Indonesia Malaysia Philippines Singapore Thailand
n.a. 7.0 15.9 11.9 26.2 30.1
21.5 17.1 13.2 3.5 8.5 5.8
14.8 5.7 8.3 1.8 10.9 8.4
n.a. 7.6 14.8 12.8 26.3 30.6
20.1 14.9 10.8 2.4 8.5 6.3
5.4 3.2 1.7
A SEAN
18.2*
9.8**
5.8**
18.4*
8.2**
~2.6
12.0 0.6 1.6**
*Simple averages. **Weighted averages. SouRCES: ADB (1989a); James (1983); lEA (1989).
than those for the Asian-Pacific region, where primary energy and oil consumption grew by 4.1 per cent and 1.7 per cent, respectively, during the period. Indonesia, being a major oil-exporting country in the region, benefited hugely from the 1973-74 and 1979-80 oil price rises. Increased export earnings from oil enabled Indonesia to spend more on development projects; energy products were also subsidized. As a result, energy demand grew rapidly in Indonesia after 1973. World energy consumption further slowed down after the second oil crisis; it grew by only 1.9 per cent per annum between 1980 and 1987. In the Asian-Pacific region, energy demand growth rates were lower than before, but they were still higher than the world averages; ASEAN's rates were even higher. Average annual growth rate of primary energy consumption was 5.8 per cent in ASEAN countries compared to 4.3 per cent in the Asian-Pacific region. Similarly, oil demand in ASEAN countries grew by an average annual rate of 1.6 per cent during the same period, whereas those for the world and the Asian-Pacific region were -0.4 per cent and 0.2 per cent, respectively (British Petroleum Company 1989). The growth rates in energy demand varied from one ASEAN country to another. In general, the primary energy as well as the oil demand growth rates were higher in oil-exporting countries than in oil-importing
Structural Change and Energy Policy in ASEAN ----
-----·-----
29
-------
ones during 1973-80. However, after the second oil crisis, Singapore's growth rate of oil consumption became the highest in the region. This is due mainly to its higher economic growth and total dependence on oil for energy.
SECTORAL USE AND ENERGY INTENSITY The percentage shares of energy demand by major consuming sectors in 1973, 1980, and 1987 are provided in Table 2. The pattern of sectoral energy use also varies greatly among ASEAN countries, depending on the degree of industrialization. Different accounting systems of different countries also account for the difference in the sectoral share. Thus, comparison between countries should be done with caution. 1
INDUSTRIAL SECTOR The shift in the industrial sector's share in total energy demand was not uniform across countries; it increased in some countries but declined in others over the period 1973-87. On the other hand, this sector's share in oil demand has declined significantly in most of the countries since 1973. Among the oil-importing countries, the industrial sector's energy demand of about 40 per cent in Thailand during 1973-80, declined to 29.8 per cent in 1987. Since no major change in the industrial structure affecting energy use was observed during the study period, the decline in share could be due to increased efficiency in energy use (Koomsup, Tinakorn, Ratanakomut 1986). However, in the Philippines the share declined only after the second oil crisis and was due both to the change in the industrial structure and improvement in efficiency. The share of manufacturing in the industrial sector declined from 78 per cent in 1974 to 72.5 per cent in 1984, whereas the share of construction subsector increased substantially. This subsector caused the reduction in the energy demand in the industrial sector (Alejo 1986). Higher energy prices and non-price policies also provided incentives for energy conservation in this sector. In Singapore, increasing industrial sector share in energy use can be attributed to the increasing share of manufacturing in GOP, product mix of industry, increasing automation, and the need for air-conditioning to provide a good working environment in industries (Ang 1988, Sharma 1989a).
30
Shankar Sharma
TABLE 2 Sectoral Energy and Oil Use in ASEAN Countries (In percentage share) Oil
Energy 1973
1980
1987
1973
1980
1987
Brunei Industry Transport Residential/Commercial Others
17.4 19.0 14.1 49.5
15.5 25.4 17.1 41.9
10.9 24.0 13.3 52.1
21.5 32.7 16.8 29.0
16.8 43.2 20.5 19.6
11.9 59.4 16.4 12.3
Indonesia Industry Transport Residential/Commercial Others
34.2 29.0 33.8 3.0
32.2 29.0 33.8 5.0
35.5 30.6 24.3 9.6
33.1 30.0 34.4 2.5
26.5 34.0 37.3 2.2
23.7 43.4 30.2 2.7
Malaysia Industry Transport Residential/Commercial Others
45.2 41.9 9.8 3.1
44.9 37.6 12.9 4.6
44.0 39.4 13.0 3.6
44.9 46.1 6.6 2.4
43.8 43.2 7.7 5.2
33.5 54.0 7.3 5.2
Philippines Industry Transport Residential/Commercial Others
48.3 37.5 10.2 3.9
52.7 27.2 12.4 7.7
47.8 30.5 16.5 5.2
47.2 41.1 7.5 4.2
53.8 31.8 8.1 4.2
46.1 39.5 9.3 5.1
Singapore Industry Transport Residential/Commercial Others
5.6 15.4 4.5 74.4
7.1 14.0 3.0 75.6
14.3 15.8 3.8 66.1
4.2 17.1 1.4 77.3
5.1 14.8 0.7 79.4
12.3 16.9 4.1 66.7
Thailand Industry Transport Residential/Commercial Others
41.6 46.6 4.6 7.2
40.8 42.0 10.0 7.2
29.8 55.1 12.1 3.0
25.0 51.0 3.4 20.6
25.1 48.2 4.8 21.9
15.3 68.6 5.1 11.0
SOURCES:
ADB (1989a); lEA (1989).
Structural Change and Energy Policy in ASEAN
31
The industrial sector's share of energy consumption in Indonesia was observed to be rising, due to rapid industrialization, faster growth of energy-intensive industries (chemicals, refineries, iron and steel, etc.) and increased domestic energy production (Sathaye, Ghirardi, and Schipper 1987 and ESCAP 1987). Also, as oil was heavily subsidized in Indonesia, there was no disincentive to using more energy during the crisis period. The industrial sector's share did not change significantly in Malaysia. But this sector is very broad based, consisting of manufacturing, industrial feedstock, construction, mining, agriculture, forestry, and fishing. There might possibly have been changes in different subsectors within the industrial sector in terms of energy utilization, but it is difficult to separate them due to unavailability of disaggregated data. The share of oil consumption in the industrial sector, as expected, has declined in almost all ASEAN countries after 1973 except in Singapore. This decline was mainly the effect of higher oil prices. Substitution efforts were also intensified in the industrial sector. The main substitutes were natural gas and coal. The use of electricity also increased significantly in all countries in the region. In Singapore, oil is the only kind of energy used in the economy. Thus, the reasons for the higher industrial sector share in oil use are the same as those for all energy use discussed above. Generally, the change in the industrial sector's share in energy use in ASEAN countries was due to either structural change in industry or increase in efficiency, or both; no uniform pattern was observed. Any improvement in industrial efficiency caused by factors other than structural change in the industry might be due to energy conservation. Energy conservation might have resulted from the price increases, improvement in the new industrial facilities, including plants and equipment, and the type of energy used.
Industrial Energy Intensity Productivity in energy use in industry depends primarily on the industrial structure. Some industries, such as petrochemicals, fertilizers, cement, oil refining, pulp and paper, steel, aluminium, and sugar, are energy-intensive. The intensity also varies with the process and type of fuel used. Energy productivity, measured as the value of output per unit of energy use, varies in the ASEAN countries. Table 3 shows that in 1986 Singapore and Thailand had the most energy-efficient industrial sector in the region. On the other hand, Indonesia had the most energy-intensive industrial sector.
32
Shankar Sharma
TABLE 3 Industrial Value Added (In 1980 US$ thousands/toe)
Indonesia Malaysia Philippines Singapore Thailand
1973
1980
1986
3.65 1.37 2.47 6.01 2.15
1.47 1.80 3.42 5.20 3.19
0.76 1.49 2.18 2.97 2.99
SOURCES: Central Bureau of Statistics, Jakarta (various issues); Department of Statistics, Malaysia (various issues); Department of Statistics, Singapore (various issues); National Economic Development Authority, Philippines; National Statistical Office, Thailand (various issues).
Energy productivity rose in Malaysia, the Philippines, and Thailand, and declined in Indonesia and Singapore between 1973 and 1980, but dropped in all ASEAN countries after 1980. In Malaysia, the Philippines, and Thailand the share of oil in total energy consumption was high and did not change significantly during 1973-80. Hence, the overall energy efficiency was achieved through more efficient use of oil. The increase in oil efficiency was achieved mainly by pricing instruments. In Indonesia, the decline in energy productivity might have been caused mainly by the higher rate of utilization of newly discovered natural gas in the industrial sector and change in the industrial structure. The share of natural gas in energy use in Indonesia increased from 3.1 per cent in 1973 to more than 21 per cent in 1987. More than 95 per cent of the total natural gas consumed in the country was used in the industrial sector (Sharma 1989b). Furthermore, the combined share of energy-intensive industries (basic chemicals, fertilizers, iron and steel, and cement) in total gross output value of manufacturing increased from 18.4 per cent in 1974 to 30.2 per cent in 1985 (Central Bureau of Statistics 1986). In Singapore, a number of factors might have acted in lowering the industrial energy efficiency. First of all the share of energy-intensive industries (chemicals, plastic products, glass products, cement, iron and steel but excluding petroleum refineries and petroleum products) in manufacturing value added increased from 9.2 per cent in 1973 to 12.9 per cent in 1986. Secondly, the share of petroleum, which is highly energy-
Structural Change and Energy Policy in ASEAN
33
intensive industry, was about 17 per cent of the total industrial value added in 1980. Its share declined to 6.6 per cent in 1986. But in terms of refinery production, the output was about the same for both periods. The value added declined sharply because of declining refiner's margin. Thirdly, Singapore is already having a labour shortage and is giving emphasis on less labour-intensive industries. Cross-elasticity between labour and energy has been found statistically significant, indicating that energy is one of the substitutes of labour (Siddayo 1986). Finally, because of the higher economic growth and income, companies in Singapore are providing better working environment, with air-conditioning and so on (Ang 1988). These changes in the industrial structure, increased automation, and the greater need for air-conditioning might have caused the energy-output ratio to rise. Substantial increase in the availability and use of natural gas after the second oil crisis might be a factor in the rise of energy intensity in Malaysia and Thailand. Malaysia, which consumed negligible amount in 1980, used 855,000 toe of natural gas in the industrial sector in 1986. In Thailand, the increase was from nil to 88,000 toe during the same period. Substitution from oil base to natural gas and coal usually results in an increase in industrial energy intensity, at least in the short run. Political upheavals were the main reason for the overall worsening of industrial productivity in the Philippines in the first half of 1980s, which also led to lower energy productivity. TRANSPORTATION SECTOR Table 2 also provides the shares of the transportation sector in energy use in ASEAN countries. The share of oil in total energy use varies from one country to another and is closely related to the number of vehicles in the country. Between 1973 and 1987 this sector's share increased in all countries except the Philippines and Singapore. Thailand used 51 per cent of oil for the transportation sector in 1973 and 68.6 per cent in 1987. Similarly, this sector's share increased from 46.1 per cent to 54.0 per cent during the same period in Malaysia. It increased in Indonesia and Brunei as well. The main reasons for increasing transport shares are (1) almost nonavailability of substitutes for transport fuels and (2) the enormous growth in the number of vehicles. Motor vehicles are the major means of transporting passengers and commodities in this region. The number of motor vehicles in the region grew at an average annual rate of 13.9 per cent during 1973-86 (ESCAP 1989 and various issues).
34
Shankar Sharma -------
~--------~~---
~
----------
In the Philippines the decline in the transport sector's share in oil demand can be attributed mainly to the pricing policy. Among the different sectors of the economy the transport sector experienced the highest price increase in the Philippines. The price increase in this sector was also the highest among the ASEAN countries. In Singapore, the growth rate of vehicles was much slower. Motor vehicles grew at an average annual rate of less than 3.3 per cent, which was the lowest in the region during 1973-86. This lower vehicle growth resulted from the government policy of reducing the problems of road congestion. The area licensing scheme (pay toll to enter the central business district during rush hours), higher car registration fee, and higher road taxes were some of the measures implemented in the transport sector after the first oil crisis. Gasoline consumption before the scheme was increasing at an average rate of 6.4 per cent a year during 1970-75. It has increased by only 3.8 per cent a year since the scheme was introduced in 1975 (World Bank 1981). Fuel consumption by road vehicles increased by less than 6 per cent per annum as against the country's oil consumption increase of about 13 per cent per annum between 1975 and 1987. Despite all these measures, the car population in Singapore grew at a higher rate in 1987 and 1988 due to rapid economic growth. The area licensing fee was increased and several other measures were taken in 1989 to limit the car population in the country.
Transportation Energy Intensity Table 4 shows that average oil consumption per vehicle declined significantly from 4.15 tonnes per vehicle per year in 1973 to 2.26 tonnes per vehicle in 1986 in the ASEAN countries. 2 The decline in intensity was substantial in the Philippines, Indonesia, and Malaysia after the oil crises of 1970s. In the Philippines, the demand for oil for road transport declined by 3.3 per cent per annum despite the increase in the number of vehicles by 4.9 per cent per annum between 1973 and 1986, resulting in the transport intensity decline by almost 65 per cent. This is mainly because the transport sector experienced the highest increase in price among the different petroleum products (Alejo 1986). Oil price increases were the main reason for the decline in transport intensity in other countries, too. In Indonesia and Malaysia energy intensity in the transport sector declined by 48 per cent and 37 per cent, respectively, during the period. There may be other reasons for declining transport intensity. More energy-efficient vehicles were used after the crises, the result of direct technological shift in car manufacture. Furthermore, the shift in the pattern
Structural Change and Energy Policy in ASEAN
35
TABLE 4 Oil Consumption in Transportation (In tonnes/vehicle /year) 1973
1980
1986
Indonesia Malaysia Philippines Singapore Thailand
6.03 3.61 3.39 2.01 5.73
4.50 2.26 1.59 2.64 n.a.
3.15 2.27 1.19 2.42 n.a.
ASEAN*
4.15
2.75
2.26
*Simple averages. SoURCES: ADB (1989a); ESCAP (1988).
of energy consumption may be another factor responsible for higher energy efficiency in transportation in ASEAN countries. The share of diesel in total oil consumption increased - diesel-run vehicles are more energy efficient than gasoline-run vehicles. Per capita income in Singapore is increasing rapidly. Studies show that in absolute terms the income elasticity is much higher than the price elasticities for the demand for transport fuel (Taylor 1977). Rapidly rising per capita income could be the main reason for the rise in transport intensity in Singapore. Average gasoline and diesel consumptions per motor vehicle were observed to be different in the various countries. The number of vehicles is the most important factor responsible for higher energy use in the transport sector, but the number of vehicles in any country depends not only on per capita GOP but also on the prices of vehicles and gasoline. Singapore, with a high per capita GOP, and Indonesia and Malaysia, with lower car and gasoline prices, consume more oil per vehicle than Thailand and the Philippines where the price of motor fuel is higher and whose per capita GOP is lower. RESIDENTIAL AND COMMERCIAL SECTORS The demand for energy in the residential and commercial sectors is increasing due to growing urban population and the increasing role of the commercial sector in the economy. As people move from rural to urban
36
Shankar Sharma
area, the pattern of energy demand changes. Biomass are replaced by kerosene, LPG, and electricity for cooking purposes. Similarly, kerosene is replaced by electricity. But there is a wide variation in the residential and commercial demand for energy in ASEAN countries. The share of energy in this sector increased in all countries except Indonesia and Brunei. In Thailand and the Philippines the increase in this sector's share was mainly due to the higher growth rates of urban population. Rural electrification programmes have also raised the demand for energy among households. Similarly, the share of oil in this sector was increasing (again with the exception of Brunei and Indonesia). The decline in share in Brunei and Indonesia is mainly due to faster growth in energy demand in the industrial and transportation sectors. LPG demand in Malaysia increased at an average annual rate of 17 per cent per annum during 1980-87 and this could be the main reason for this sector's higher share. Similarly, substitution of gas cooker for charcoal cooker, change of housing structure, improvement in standard of living, and rapid expansion of the commercial sector raised the share of residential and commercial sectors in Singapore. The share increased in Thailand and the Philippines for similar reasons. Energy and oil intensity measured in terms of oil consumption per 1,000 persons declined in net energy-importing countries (Thailand and the Philippines) but both increased in the net energy-exporting countries (Indonesia and Malaysia) between 1978 and 1984 (Sathaye, Ghirardi, and Schipper 1987). The decline is due mainly to the increase in energy prices. Increasing energy supply and/or subsidy could be the reason for higher intensity in the oil-exporting countries. The shift in the sectoral demand pattern for energy is not similar in all ASEAN countries. It varies with the level of economic development, availability of energy resources, level of industrialization, urban population, and conservation and substitution efforts.
PRICING POLICY The structure of international oil prices has changed significantly since 1973. Singapore f.o.b. prices of petroleum products increased by more than eleven times between 1973 and 1982. But, since 1982, petroleum product prices have started declining; they declined by almost 50 per cent by 1986. Table 5 provides the ratio of domestic to international petroleum product prices in different ASEAN countries for selected years over the period 1973-86. The ratio gives an idea of the movements of domestic petroleum
Structural Change and Energy Policy in ASEAN
37
TABLE 5 Ratio of Domestic to International Petroleum Product Prices (Domestic/Singapore) 1971
1974
1980
1983
1986
Indonesia Gasoline Kerosene Diesel
3.2 1.0 1.2
1.4 0.4 0.5
1.0 0.2 0.3
2.1 0.6 1.0
2.1 1.3 1.6
Malaysia Gasoline Kerosene Diesel
7.2 2.3 2.8
3.8 1.0 1.5
2.2 0.8 0.8
2.4 1.0 1.1
2.5 1.7 1.8
Thailand Gasoline Kerosene Diesel
3.5 2.8 2.0
2.1 1.4 1.2
1.8 1.0 1.2
2.3 1.2 1.5
2.3 1.9 2.3
Philippines Gasoline Kerosene Diesel
1.8 1.4 1.7
2.0 1.4 1.6
2.3 1.1 1.2
2.4 1.5 1.6
2.4 2.1 2.5
3.9 1.9 1.9
2.3 1.1 1.2
1.8 0.8 0.9
2.3 1:.1 1.3
2.3 1.8 2.1
ASEAN Gasoline Kerosene Diesel
SOURCES: United Nations (various issues); ADB (1987a).
product prices with respect to the changes in the international product prices. Although the retail prices in these countries cannot be compared directly with the international prices without making allowances for transportation and marketing costs, the differences can highlight the taxation or subsidization policy in petroleum products in the respective countries. It can be observed from the table that in 1971, all kinds of products were most heavily taxed in Malaysia, followed by Thailand. Only gasoline was taxed heavily in Indonesia; kerosene and diesel prices were comparable with the international prices. In the Philippines prices of petroleum
38
Shankar Sharma
products (including gasoline) were low and comparable with the international prices. After the first oil crisis countries followed different pricing policies. The domestic taxes on gasoline declined in all countries between 1971 and 1980 except in the Philippines, but were raised in all countries after 1980. The average domestic retail price of gasoline, which was 3.9 times higher than the international price in 1971, declined to only 1.8 times in ASEAN countries in 1980. It indicates that the gasoline tax rates were reduced with the increase in the international prices. On the contrary, in the Philippines the tax rates were raised with price. For example, the share of tax on premium gasoline, which was 19 per cent in 1973, reached 57 per cent in early 1987. Since the domestic tax rate before 1973 was low, the government's policy since the first oil shock was designed to let the burden of taxes fall more on higher income groups (Habito and lntal1988). In other countries, where gasoline taxes were already high before the first oil crisis, the taxes were reduced to prevent gasoline retail price from escalating to a high level. However, in the 1980s, the trend was reversed. International oil prices declined but the taxes did not. In fact, the taxes were raised in some countries. As a result, the proportion of gasoline tax became higher compared to the earlier decade, and the average ratio of domestic to international gasoline prices increased to 2.3 in 1986. The decline in world oil prices was not fully passed on to the consumers. The case of middle distillates is different. Since kerosene is used by poor people for cooking and lighting, the tax rates were lower. Similarly diesel, which is used mainly in public transport (servicing relatively less well-off people), was also not taxed very heavily. On an average domestic price of kerosene was 1.9 times higher than the international price in 1971. Only in Indonesia was the domestic price closer to the international price (if the marketing and distribution costs are considered, the kerosene price was subsidized). In other countries the kerosene prices were higher than the international price. After 1973, either tax rates were reduced or subsidy was raised for kerosene. In Indonesia, subsidy for kerosene rose significantly. Malaysia, which was taxing kerosene significantly before the crisis, reduced taxes completely after the first oil crisis. The Philippines and Thailand also reduced the kerosene tax significantly. The effect of the second oil crisis on kerosene pricing policy was even greater. Almost all the countries increased the subsidy. The subsidy was highest in Indonesia; the price of kerosene was only one-fifth of the
Structural Change and Energy Policy in ASEAN
39
international price in 1980. Malaysia and Thailand also increased subsidy whereas the Philippines reduced taxes significantly. After 1980, not only was the subsidy for kerosene reduced, but tax (though marginal) was levied on it in almost all countries. Even in Indonesia, where kerosene was subsidized throughout 1971-83, it was taxed significantly; the domestic price of kerosene rose 30 per cent higher than the international price in 1986. Similarly, tax rates on diesel were reduced gradually after 1973. The domestic diesel prices (including distribution and marketing costs) in Thailand and the Philippines became comparable with the international price in 1980. The prices were subsidized heavily in Indonesia and Malaysia. By 1986, all countries had levied taxes on diesel. The tax rates,' in general, were higher than those for kerosene but lower than those for gasoline. In a similar manner, Table 6 provides the ratios of the domestic gasoline to diesel prices and diesel to kerosene prices for selected years between 1971 and 1986. For comparison purpose, international prices are also provided in the table. The ratios show the relative movements of gasoline and middle distillate prices and provide some insight into the relative taxation and subsidy of petroleum products in ASEAN countries. Although the ratio of international gasoline to diesel prices was close to one throughout the study period, the gasoline prices were much higher than the diesel prices in all ASEAN countries. This is because gasoline is taxed on the basis that its users are relatively rich; kerosene and diesel are subsidized on the grounds that they are used by poor households. Despite the lower ratio on the international front, the differences between gasoline and diesel prices were, in general, increasing between 1971 and 1980 in Indonesia and the Philippines but declining in Malaysia and Thailand. The differentials started shrinking after 1980. This was mainly because the subsidy for diesel was withdrawn or reduced significantly. Diesel prices were comparable with kerosene prices in 1971. During 1974-83 subsidy was increased or the tax rate was lowered for kerosene compared to diesel. In 1986, prices of diesel and kerosene became comparable to international prices in all countries. The reaction to changes in international prices differed in the various countries. In generaL what was observed is that the Philippines, which had the lowest average price of petroleum products in 1971, became the most expensive country in 1986 compared with prices in the rest of the ASEAN countries and international prices. With the decline in oil prices, taxes were raised to promote energy price stability. Furthermore, after the second oil crisis, all the countries were pressured to provide more subsidy
40
Shankar Sharma
TABLE 6 Gasoline and Kerosene Prices Relative to Diesel Prices in ASEAN Countries 1971
1974
1980
1983
1986
2.9 1.0
2.6 0.8
3.4 0.9
2.2 0.7
1.8 1.0
2.9 1.0
2.6 0.8
2.4 1.0
2.2 1.0
1.9 1.1
1.9 1.7
1.7 1.2
1.4 0.9
1.5 0.8
1.3 1.0
1.2 1.0
1.3 1.0
1.8 1.0
1.6 1.0
1.3 1.0
1.1 1.2
0.9 1.1
0.9 1.1
1.0 1.0
1.1 1.2
Indonesia
GID* KID** Malaysia
GID KID Thailand
GID KID Philippines
GID KID International (Singapore)
GID KID
*G!D = Ratio of Gasoline to Diesel Prices **KID = Ratio of Kerosene to Diesel Prices SOURCES:
ADB (1987a); United Nations (various issues).
for middle distillates; the subsidies were higher in oil-exporting countries than in oil-importing countries. It was also observed that the tax rates were usually higher when international oil prices were low and vice versa. This concludes that the countries are not concerned much about the efficiency pricing policy of oil and oil products. The pricing policies in these countries (as is true for many developing countries) were motivated and affected by fiscal and distributional concerns rather than economic efficiency. The interventions are intended to promote conservation, to generate government revenues, and to enhance income distribution, but the wedge between domestic and international prices was declining. However, the wedge was seen to be the smallest in 1980, at the time immediately after the second oil crisis. But when international oil prices started declining after 1982, domestic prices were not reduced.
Structural Change and Energy Policy in ASEAN
41
NON-PRICING POLICIES Various non-pricing policies for demand management were used in the ASEAN countries after the oil shocks of the 1970s. They include incentive policies, information programmes, and regulatory measures. Most of the measures were taken after the second oil crisis. 3 In Singapore, Thailand, and the Philippines, financial incentives in the form of reduction in import duties, tax exemption and/or credits on investments are provided for installation of new equipment and materials used for energy conservation. As an educational measure, training and seminars are also organized regularly in these countries to promote energy conservation. In terms of regulatory measures, Thailand adopted some temporary measures by setting some regulations on public lighting, official passenger vehicles, and air-conditioning after the second oil crisis, but they are now lifted. The Philippines used the most comprehensive regulatory measures for energy conservation. Regulations were set on the use of air-conditioners, labelling of energy requirements in machinery and appliances was made mandatory, and measures were taken to develop energy consumption standards for machinery, appliances, building materials, and designs (ADB 1987a). Singapore also started a very comprehensive plan for energy conservation in buildings in 1979. Regulations were set in the air-conditioning of buildings to improve the efficiency of energy usage. Buildings were required to maintain an overall thermal transfer value of below 45 watts per square metre. Incentives and penalties were used to enforce the regulations. Energy audits of private firms were also conducted and tax incentives were provided to replace energy-intensive machines (Ministry of Trade and Industry 1984). As discussed earlier, Singapore has become the leader in controlling the congestion problem in road transport. The measures taken to alleviate the problem may also conserve energy. Other ASEAN countries, wherever feasible, can follow some of Singapore's techniques to control congestion problems and help to conserve energy as well.
ENERGY CRISIS AND MACROECONOMIC ADJUSTMENT The higher energy prices of the 1970s have had strong impacts on the external balance, inflation, and economic growth in the ASEAN countries. However, the impact on individual countries varies, depending mainly on the role of energy in the economy.
42
Shankar Sharma ------- --·--·-----
The economy of net oil-importing countries usually face grave consequences as oil price rises. The balance of payment generally deteriorates, owing to higher import expenditures and decline in exports because of reduced international demand. Higher energy prices translate into domestic price increases; terms of trade will worsen and it generally will have an adverse impact in the economic growth of the country. For net oil-exporting countries higher oil prices generate higher export earnings, external balance will improve and economic growth will be higher, but it may cause higher inflation. If the domestic currency appreciates because of higher mineral exports, other sectors of the economy, by losing international competitiveness, will be penalized. The main macroeconomic indicators related to oil prices for ASEAN countries are presented in Table 7. The major impact of the oil shocks was seen in the growth rates of inflation. Among the oil-importing countries inflation, measured by the consumer price index (CPI), increased by 33.5 per cent in 1974 in the Philippines as against 15.3 per cent in 1973. In Thailand, the CPI rose by 11.9 and 23.2 per cent in 1973 and 1974, respectively. The increase was almost 46 per cent between 1972 and 1974 in Singapore. Besides the increase in oil prices, there was another reason for this high growth of inflation. OECD countries were growing strongly in 1972/73. The higher economic growth stimulated the import demand of these countries, especially for industrial raw materials, and the developing countries were able to export more. For example, Singapore's merchandise exports grew at a rate of 49 per cent in 1973; the increase was about 71 per cent in the Philippines and 45 per cent in Thailand in 1973. Export boom in these countries prior to the first oil shock also fueled the inflation. The average annual growth rate of inflation subsided after 1974; the rates were only a single digit during 1974-79 in these countries. Terms of trade improved as exports increased in all countries in 1974. The higher growth in exports, together with the improved terms of trade, eased the balance of payment problem. But after 1974, the terms of trade started deteriorating, but the export growth rates were still high, higher than the growth rates of imports. Nonetheless, deteriorating terms of trade and higher investment-GOP ratio led to higher current account deficit. However, since the rise in exports was not enough to offset the increase in import bill, foreign borrowings increased. Debt outstanding to GNP ratio increased from 4.2 per cent in 1973 to 12.5 per cent in 1981 in Thailand. Similarly, the ratio increased from 7.8 to 18.5 per cent in the Philippines and from 10.5 to 12.1 per cent in Singapore during the same period.
Structural Change and Energy Policy in ASEAN
43
TABLE 7 Macroeconomic Indicators of ASEAN Countries (Average annual growth rates except current account balance in % of GNP) Indicators
1974-79
1979-83
1983-87
Indonesia Real GOP Exports Terms of Trade Consumer Price Index Current Account Balance
7.2 36.3 8.5 11.6 -1.4
6.1 14.2 4.3 11.2 -1.8
3.8 4.7 -11.2
Malaysia Real GOP Exports Terms of Trade Consumer Price Index Current Account Balance
7.0 20.8 9.0 2.2 -0.4
7.2 15.4 -4.2 3.2 -6.8
3.2 7.4 -2.0 1.5 0.1
Philippines Real GOP Exports Terms of Trade Consumer Price Index Current Account Balance
6.2 14.2 -1.4 9.8 4.2
3.9 9.0 -8.5 12.4 -6.4
-0.9 2.0 2.1 20.5 -0.5
Singapore Real GOP Exports Terms of Trade Consumer Price Index Current Account Balance
6.8 24.4 1.4 3.5 -10.1
8.7
17.8 0.8 5.5 -5.4
4.3 7.7 0.3 0.5 0.9
Thailand Real GOP Exports Terms of Trade Consumer Price Index Current Account Balance
7.7 23.2 -1.9 8.1 -3.7
5.6 10.2 -4.9 10.5 -6.3
4.7 16.8 1.1 1.9 -2.8
SOURCE: ADB (1987a and various issues).
7.8
-3.4
44
Shankar Sharma
The real GOP growth rates did not slow down immediately after the first oil crisis. In fact, all the countries were able to sustain growth rates of the pre-1973 years. Higher export performance, increase in remittance, official development assistance, and foreign borrowing were the major factors responsible for curtailing the effects of higher oil prices in the economy. 4 Money supply was also increased sharply in some countries. These policies also helped to generate domestic demand in the economy. Unlike the first oil crisis, the Philippines and Thailand were not able to maintain a high economic growth after the second oil crisis. The negative effects of the second oil price shock were stronger than those of the first. Higher foreign debt and trade deficit resulting from the first oil crisis made it difficult for them to cope with the second crisis. Furthermore world recession, which was the consequence of the second oil crisis, made it difficult to increase exports. GOP growth rates declined, inflation rates increased, current account deficits widened, and terms of trade worsened again after the second oil crisis. However, borrowing continued in the Philippines and Thailand, but did not help to raise economic growth. On the other hand, Singapore was able to restrain the adverse impact of the second oil crisis. The country's exports were affected in 1981-82 as a result of sluggish world demand, but the economy did not slow down. Financial and business sectors grew and Singapore remained an attractive place for investment. However, Singapore's economy declined by 1.8 per cent in 1985, especially due to higher domestic labour cost, decline in international competitiveness, and sluggish international market. But the lower oil prices after 1986 helped the world economy to expand. The economies of the United States, Japan, and European and neighbouring countries grew at robust rates. As a result Singapore's exports rose by 11 per cent in 1987 and 29 per cent in 1988 (Ministry of Trade and Industry 1989). Current account balance improved significantly and the economy rebounded again. The effect of declining oil prices was favourable to Thailand. Since 1984, the current account deficit has been declining. This is mainly due to higher growth in exports and declining oil prices. Domestic production of crude oil and natural gas also reduced the burden of imported petroleum. However, in the Philippines the political upheavals which began in 1983 disturbed the national economy. Economic growth was the lowest in about two decades, and the economy declined further in 1984 and 1985. The flight of capital was one of the most serious problems confronting the country. Foreign investment also started declining from 1983. Between 1983 and 1986 the decline in foreign investment was almost 71 per cent. Recovery
Structural Change and Energy Policy in ASEAN
45
started in 1987. Inflation rate also jumped to a record high in 1984. Deteriorating trade balance, together with these developments, precipitated a balance of payment crisis. The economy started recovering from 1986. Foreign investment also rose. It is difficult to identify the impact of lower oil prices because of the political and economic instability in the country, but in general, most of the economic indicators were promising in 1986 and 1987, when the oil prices were the lowest in the decade. The economy of Indonesia rose sharply after the first oil crisis. This was mainly because of its high dependence on oil and gas for export earnings. Terms of trade improved rapidly and current account balance rose, but inflation soared due to higher aggregate demand resulting from higher export earnings. As expected, the CPI increased by almost 83 per cent in 1979~80; the increase was smaller after the second oil crisis. The fall in oil prices since 1982 has had an adverse impact on the economy. Terms of trade worsened and economic growth slowed down. Current account deficit grew dramatically. Government revenue fell by more than 50 per cent in 1986/87 from the level of 1975/76. The policy in Indonesia at the time of lower oil prices has been fiscal austerity. Development expenditures were cut by 23 per cent in 1986/87. The Indonesian rupiah was devalued by 31 per cent in 1986. Emphasis was put on non-oil exports. Non-oil exports (e.g. plywood, textiles, and electronic components) are rising significantly. Measures to broaden the domestic tax base were taken. Foreign aid, which was declining in the boom years, started increasing since the ending of the oil boom (Arndt and Hill 1988). The share of oil and gas in Malaysian exports is much less than that in Indonesia. The share, which was 14 per cent in 1977, increased to 26 per cent in 1982; since then it is declining owing to lower oil prices. From 1979 to 1982, oil was the dominant export, but the manufacturing sector has taken the first position since 1983. Rubber, tin, and palm oil are also major exports of Malaysia. Their combined share was 18.6 per cent in 1988. The share of manufacturing increased from 22 to 45 per cent during the same period. Thus, despite the fact that Malaysia is a net oil exporter, its economy is influenced mostly by prices and trade of commodities other than oil. In 1973, Malaysia was still a net oil importer. The commodity boom of 1973 had a positive impact on the Malaysian economy and economic growth, but the oil shock resulted in price increases. Current account surplus was high due to higher exports.
46
Shankar Sharma
Malaysia became a net oil exporter in 1976. Terms of trade improved and current account surplus rose. However, despite the higher oil prices in 1980-81, there was no improvement in the current account balance due to higher imports. But in 1983-84, non-oil exports surged and the economy rebounded; current account balance improved. Terms of trade declined in 1985-86, partially due to lower oil prices, but it did not have any adverse impact on the balance of payment position. Terms of trade improved and balance of payment situation further strengthened again in 1987-88. Inflation in Malaysia did not increase as much as it did in Indonesia in the oil boom period because of the lower share of oil in exports. However, it was also controlled by tighter monetary policy (Meyanathan 1983). But prices began to rise at a faster rate after the second oil crisis, mainly because of greater imports and higher import costs. Inflation was controlled in later years mainly by fiscal restraint. The inflation rate was below 1 per cent during 1985-87. However, in 1988 the CPI rose to almost 2.7 per cent because of economic recovery and higher domestic demand (ADB 1989b). In general, in the oil-importing countries the oil price rises of 1973 and 1979 had an adverse impact on terms of trade, trade balance, inflation, and current account balance. Higher exports, increased foreign borrowing and expansionary economic policy adopted by some of the countries helped to sustain relatively high economic growth after the first oil crisis. But the experience of the second oil crisis was different. In addiiton to the indicators discussed above, the crisis adversely affected the economic growth rates. The fall in oil prices after 1982 provided better opportunities for increased economic activities in the region. On the other hand, among the net oil-exporting countries, Indonesia benefited most from the oil price surge, but the fall in oil prices in the mid-1980s had an adverse impact on the economy. Compared to Indonesia, the impact of oil prices was less felt in Malaysia because of the country's less reliance on oil and gas for export and government revenues. SUPPLY MANAGEMENT The oil shocks of the 1970s forced oil-importing countries to reconsider their supply options of energy resources. In general, three strategies have been taken in supply management. They are (1) to increase oil exploration activities to expand production, (2) to develop alternate energy resources, and (3) to diversify source of imports to minimize supply disruption. On the other hand, the major policy objective of the oil-exporting countries
Structural Change and Energy Policy in ASEAN
47
has been to substitute alternative energy resources for oil in domestic consumption and to maintain the current rate of oil exports into the future. Table 8 provides data on oil and non-oil energy production in individual ASEAN countries in 1973 and 1987. The table shows that oil production in ASEAN countries increased from 84.4 million toe in 1973 to 102.4 million toe in 1987. The increase in production can be attributed mostly to Malaysia, but the rate of increase in production was impressive in Thailand and the Philippines as well. The production of non-oil energy resources also increased from 10.2 million toe in 1973 to 81.2 million toe in 1987. The most remarkable growth in the production of alternative resources was observed in Indonesia and Thailand. Indonesia, the oniy OPEC member in the region, accounts for almost two-thirds of the oil production among ASEAN countries. Production increased from 68,542,000 toe in 1973 to 86,271,000 toe in 1977, but from 1977 production declined because of the imposition of OPEC production quota. Production in 1987 dropped below the level of 1973. Oil-exploration activities in Indonesia have slowed down in recent years. For example, more than fifty contracts were signed during 1978-82. But since 1982 exploration has slowed down. Only five contracts were signed between 1982 and 1985, mainly the result of falling oil prices. But after 1985 there has been some increase in exploration activities. The government announced additional incentives for oil exploration in 1988 and 1989. These incentive schemes have encouraged exploration interest. TABLE 8 Primary Commercial Energy and Oil Production, 1973 and 1987 (In million tonnes of oil equivalent) Primary Energy
Oil
1973
1987
1973
1987
Brunei Indonesia Malaysia Philippines Thailand Singapore
13.0 73.7 6.9 0.5 0.5
16.9 114.6 39.9 3.3 8.9
11.6 68.5 4.3 0.0 0.0
8.9 66.9 24.7 0.3 1.6
TarAL
94.6
183.6
84.4
102.4
SOURCES:
ADB (1989a); lEA (1989).
48
Shankar Sharma
Similarly, the production of other energy resources has been impressive in Indonesia. Natural gas is playing a major role in the domestic energy scene. Indonesia has become the biggest industrial user of natural gas in the region. The country has a target of increasing non-oil uses from 58 per cent in 1988 to 62 per cent by 1993 (Abda'oe 1989). The country also has plans to develop nuclear energy. In Malaysia oil production increased from 4,263,000 toe in 1973 to 24,742,000 toe in 1987. The number of exploration and development wells increased from forty-six in 1976 to more than a hundred in 1988. Exploration activities have also increased substantially from 1988. However, since gas reserves are three times more than oil, Malaysia is also promoting the maximum utilization of gas in the country. The country has adopted the "four-fuel (oil, natural gas, coal, and hydropower) diversification strategy" in energy supply. In Thailand, oil explorations were made more attractive with a new legislation in 1971. The oil-price surge of 1973 made explorations even more attractive. Before 1983, oil was produced from only one onshore field, with an output of less than 50,000 toe, but in 1987 more than 1,500,000 toe of crude oil were produced from three oilfields. However, the oil-price slump has slowed down exploration activities in Thailand as well. Among the alternative energies, coal production increased by more than fifteen times between 1973 and 1987. An unprecedented increase in the demand for natural gas was also observed in Thailand after the second oil crisis. The country, which started producing natural gas only in 1981, increased natural gas production from 0.3 million toe to 4.4 million toe in 1987. Hydroelectricity production also increased significantly. The Philippines has also made significant progress on oil exploration and production. Foreign participation in oil exploration has increased and more drilling has been carried out in recent years. The country produced 273,000 toe of oil in 1987 from nothing in 1973 and has a target of producing about 1,370,000 toe (or 10 million barrels) by 1992. Coal production increased by almost three times during 1973-87. Geothermal energy was first produced in 1978. The country has become the world's second biggest producer of geothermal energy, after the United States. In 1987, it accounted for about 50 per cent of the national primary electricity supply. Increase in oil and non-oil energy production has made Thailand and the Philippines more self-reliant on energy (Table 9). In Thailand, the share of oil in energy consumption was reduced from 93.5 per cent in 1973 to 62.0 per cent in 1987; the self-reliant ratio increased from nil to 43 per
Structural Change and Energy Policy in ASEAN
49
TABLE 9 Self-Reliance in Energy Consumption (In percentage share)
Brunei Indonesia Malaysia Philippines Thailand
1973
1987
130.9 627.2 122.0 5.0 6.2
47.7 265.6 280.0 26.6 45.3
NOTE: Self-reliance is defined as the percentage share of indigenous production of energy to primary energy consumption. SoURCES:
ADB (1989a); lEA (1989).
cent during the same period. The share of oil is forecast to decline to 48.3 per cent in 2000 (Sookawesh 1989). The Philippines has also pursued a policy towards self-reliance after the first oil crisis. In 1973, more than 95 per cent of the energy (all of it oil) consumed was imported. The only indigenous energy sources were coal and hydro. By 1987, the country was able to supply almost 27 per cent of domestic demand by indigenous production; imported oil accounted for 58.6 per cent of the country's energy mix. The generating capacity of geothermal energy, which represents about 10 per cent of the energy demand mix, is forecast to double by 1995 (Estrella 1989). Brunei, Malaysia, and Indonesia also increased their non-oil energy supply rapidly, but in the meantime their domestic demand for oil also increased at faster rates. The reserve-to-production ratio is eighteen years for Indonesia, fifteen years for Malaysia, and twenty-eight years for Brunei (Fesharaki 1989). To maintain the present rate of exports for a longer term, either oil production should be increased or substitution of oil with other resources should be rapid. As the supply of energy resources increased in the ASEAN countries, oil-importing countries actively sought to diversify their source of imports to minimize the risk of supply disruption. ASEAN countries received almost 92 per cent of their import requirements from the Middle East in 1973. After the oil crisis, the oil-importing countries sought agreements with non-OPEC oil producers in an attempt to diversify the supply sources. For example, in the Philippines the supply share of non-Middle East
50
Shankar Sharma
------------------,----~----
sources increased from less than 5 per cent in 1974 to 51 per cent in 1985. Similarly, Thailand and Singapore imported more from the Asian countries than before. Thailand, which imported almost all of its crude requirements from the Middle Eastern countries in 1973, imported more than 36 per cent of its crude from Asian countries after the crisis. In Singapore crude imports from the Far East, which were negligible in 1973, increased to 40 per cent in 1988. ASEAN countries were observed to be highly successful in diversifying supply sources.
SUMMARY ON POLICY ISSUES After the oil crises the demand for oil as well as non-oil energy slowed down in the ASEAN countries, mainly because of higher prices, but the demand growth rates were still higher than the averages for the world and the Asian-Pacific region. The higher demand growth was the result of higher economic growth in the region. The shift in the sectoral demand does not show any pattern; the differences might be due to the level and the growth rates of economic development, availability of energy resources, level of industrialization, etc. Another successful strategy was observed in supply management. Production of oil as well as non-oil energy was increased rapidly. Oil was substituted wherever it was commercially feasible. Since most of the substitutes for oil compete with fuel oil, the demand for fuel oil declined as the alternative sources of energy were developed. Substitution was more pronounced in the situation of faster electricity growth. About 35 per cent of the increase in demand for energy between 1973 and 1987 was met by the substitution of oil by other energy resources. Another important factor observed was the narrowing of the wedge between domestic and international prices. During the 1970s (including the period before the first oil crisis) the pricing policies of petroleum products in most of the developing countries were affected and motivated by fiscal and distributional consideration rather than economic efficiency. Kerosene and diesel were subsidized to prevent erosion of real incomes arising from higher oil prices and was targeted to the poor people, but gasoline was taxed more heavily. The average domestic prices of petroleum products were almost four times higher than the international prices in 1973. The difference was only about 2.3 times in 1988. There have been some attempts to conserve energy, but it seems that most of the measures were temporary regulations to reduce oil consump-
Structural Change and Energy Policy in ASEAN
51
tion. In the transportation sector the efficiency incre~sed in most of the countries because of the development of energy-efficient vehicles. There have been some changes in energy intensity in the industrial sector but they are mainly due to structural change in industry and use of new energy resources. Data are not available on how much conservation has been achieved owing to the change in plant and equipment and new technology. This is a research question. But scant evidence shows that progress in energy conservation has been limited. Oil-importing countries were highly successful in diversifying their source of energy supply, increasing indigenous production, and reducing the oil-import dependence. However, oil exploration activities have slowed down after 1982 in ASEAN countries because of declining oil prices. But production is increasing in all oil-producing countries in the region except Brunei. As it is rich in natural gas and oil reserves, Brunei will not have any production problem for at least 20-30 years into the future. Production of oil in Brunei was reduced to prolong the life of the petroleum reserves. Singapore is also trying to diversify its energy consumption by importing natural gas from Malaysia and Indonesia. Among oil-exporting countries, Indonesia's oil consumption increased by more than 150 per cent between 1973 and 1987, but production in 1987 was about the same as in 1973. Similarly, total primary energy consumption increased by almost four times but production grew by only 55 per cent. Thus, energy substitution should take place at a rapid rate to prolong the present rate of oil exports. So far as the macroeconomic effects of the oil shocks were concerned, oil price increases in general had a negative impact on the balance of payments, terms of trade, and inflation in oil-importing countries. Growth rates of real GOP were not affected immediately after the first oil crisis. The expansionary economic policies adopted by most of the ASEAN countries after the crisis and higher export growth rates helped them to maintain higher economic growth. But after the second oil crisis export growths were lower than before; most of the countries were already in heavy debt and could not borrow more. As a result, in addition to the adverse impact on balance of payment, terms of trade, and inflation, the second oil crisis also adversely affected the economic growth. The oil price decline after 1982 has had a positive impact on the economic indicators of these countries. But in general, the countries that were more outward oriented in terms of trade and foreign investment were more resilient to the oil shocks.
52
Shankar Sharma
CONCLUSION It is difficult to forecast the future outlook of the ASEAN energy market. But it is expected that the region's economy will grow by at least 4-5 per cent in the medium term. This will stimulate energy demand in the region. The demand for oil in the region is also forecast to be one of the highest in the world. 5 Energy exploration and energy production will also be strengthened. The short life of oil reserves and the large natural gas deposits provide enough incentives to develop gas, which will play a major role in the development of the region's economy. The scope for substitution of fuel oil by natural gas in power generation is great. However, production, distribution, and consumption of all commercial energy contribute negatively to the environment. Nitrogen, carbon dioxide, and sulphur oxides are the main pollutants resulting from fossil fuel (coal, oil, and natural gas) combustion. They are also the main culprits which cause the greenhouse effect and acid rain. Production and distribution also cause different safety and environmental effects. Public consensus on environment is growing in developed countries and its effect is being felt in ASEAN countries. The growing commercial energy use and its increasing share are making the environment a more burning issue and the time has come to integrate energy and environment policies in the development of these countries. Taking into consideration the environmental effects of energy development in the formulation of energy policies will minimize the long-term environment control cost and help in the development of a healthy energy system. The conservation measures taken in ASEAN countries are minimal. Structural change in the industrial sector and the growing use of energyefficient vehicles raised energy efficiency in these sectors in some of the ASEAN countries. But substantial/concerted efforts for energy conservation are lacking in ASEAN countries. This could be due to resource and manpower constraints. The low energy intensity of the economy reduces the vulnerability to a sharp rise in international oil prices and supply disruption. Energy conservation efforts in the long run will improve industrial competitiveness in the international market. Countries should try to take measures to increase efficiency in energy use. Observations show that energy intensity started increasing in the firsthalf of the 1980s, during which oil prices were also declining. It looks like the increase in energy intensity was due partially to the structural change in the industrial sector and partially to lower oil prices. In any case there exists sufficient scope for improvement. Similarly, energy conservation in
Structural Change and Energy Policy in ASEAN
53
heating/cooling and lighting systems for buildings can be made more efficient. Technology transfer from European and American experience can be useful in this sector. In terms of transportation, the technology is transferred from the industrialized countries, but the policies adopted by Singapore to reduce traffic congestion are praiseworthy. These policies also reduce pollution and improve conservation. Other countries, wherever feasible, should follow Singapore's experience in traffic management. Pricing policy is the most important tool of energy demand management. Governments of all countries are involved in one way or another in the price-setting process. The retail prices of petroleum products deviated from the international prices because of taxes or subsidies, and the deviations were very high. Intervention in energy pricing is made to promote conservation (to reduce demand), to generate revenue for the government, for income distribution (by subsidizing kerosene/diesel used by relatively poor consumers and taxing gasoline), and to minimize the import bill (minimize supply insecurity). But these criteria conflict with the objective of economic efficiency. Efficient pricing helps in optimal allocation of resources. Any deviation from this principle results in inefficiency in the economy. The diverse nature of the economy of different countries requires different pricing objectives, but in the long run the economic principle of efficiency should be the basis for setting prices. Furthermore, energy pricing policy is the major issue for natural gas development in the region. The growth rate of natural gas demand in the region is expected to be the highest among the fuel categories. But none of the ASEAN gas producers has any uniform gas-pricing policy. Prices are set differently in different sectors of the economy. Moreover, the export price of gas is set by a formula that is linked with crude oil. It is all right to link the price of natural gas with one of its closest substitutes, but in a situation of low oil prices (as happened in 1986), buyers will find natural gas less economical than oil owing to the high fixed-cost ratio of natural gas. Since pricing policy is the key issue for the development, consumption, and trade of natural gas, it may be worthwhile to set a policy for natural gas pricing in ASEAN countries. It is true that the energy market is volatile and can be affected by OPEC production, technological breakthroughs, new discoveries of energy resources, environmental concerns, political turmoils and so on. But, in the final analysis, whether the countries can become more resilient in riding out crises and uncertainties depends largely on the energy policies they devise.
54
Shankar Sharma ---------
NOTES 1. For details about classification problems see Gamba et al. (1986). Ang (1986), and Lucas et al. (1987). 2. Motor vehicle statistics are taken from ESCAP (1989 and various issues). The statistics do not include motor cycles. If motor cycles are included in the computation of transport intensity, the productivity improvement observed will be even higher. Similar results were also observed by Sathaye, Ghirardi, and Schipper (1986). 3. For further details about non-pricing measures taken in different ASEAN countries see Lucas (1989), Lucas et al. (1987), Asian Development Bank (1987a), and Siddayo (1983). 4. The macroeconomic impact of the energy crises can be seen also in World Bank (1981). 5. For the oil-demand growth of the Asian-Pacific region see Miyata (1990) and Fesharaki and Totto (1989).
REFERENCES Abda'oe, F. "Indonesia's Energy Outlook, A Short Overview". Paper presented at the Oil and Money Conference, Singapore, 14-15 June 1989. Alejo, L. Energy Demand Management Policies in the Philippines. Manila: Asian Development Bank, 1986. Ang, B.W. "Energy End-Use Structure of an Urban Society: The Case of Singapore", Energy Journal, October 1988. ____ . "ASEAN Energy Demand: Trends and Structural Change". Singapore: Institute of Southeast Asian Studies, 1986. Arndt, H.W. and Hal Hill. 'The Indonesian Economy: Structural Adjustment after the Oil Boom". In Southeast Asian Affairs 1988. Singapore: Institute of Southeast Asian Studies, 1988. Asian Development Bank (ADB). Energy Indicators of Major Developing Member Countries. Manila, 1989a. ____ .Asian Development Outlook 1989. Manila, 1989b. ____ .Key Indicators of Developing Member Countries of ADB. Manila, 1987a (and various issues). ____ .Energy Policy Experience of Asian Countries. Manila, 1987b. British Petroleum Company (BP). BP Statistical Review of World Energy. London, 1989. Central Bureau of Statistics. Statistical Year Book of Indonesia (various issues). Jakarta. Department of Statistics (Malaysia). Yearbook of Statistics (various issues). Kuala Lumpur. Department of Statistics (Singapore). Yearbook of Statistics (various issues). Singapore. Doshi, T. Houston of Asia: The Singapore Petroleum Industry. Singapore: Institute of Southeast Asian Studies, 1989. ESCAP. Structural Change and Energy Policy. Bangkok, 1987.
Structural Change and Energy Policy in ASEAN
55
____ . Statistical Yearbook for Asia and the Pacific 1988. Bangkok, 1988. Estrella, M.A. "Philippine Petroleum Industry - Policies and Statistics". Paper presented at the Asia-Pacific Petroleum Conference, Singapore, 11-13 September 1989. Fesharaki, Fereidun. "Energy Outlook in the Asia-Pacific Region: Declining Oil Availability and Its Impact on Gas Requirements", ASEAN Economic Bulletin 6, no. 2 (1989). Fesharaki, F. and L. Totto. "Economic Fate Hinges on Energy Balance", Oil and Gas News, 4-10 September 1989. Gamba, ].R., D.A. Caplin, and].]. Mulckhuyse. Industrial Energy Rationalization in Developing Countries. Baltimore: Johns Hopkins University Press, 1986. Habito, C.F. and P.S. lntal. "Some Observations on Petroleum Pricing and Taxation: Policy in the Philippines", Philippine Economic Journal XXVII, nos. 1 & 2 (1988). International Energy Agency (lEA). World Energy Statistics and Balances 1971!1987. Paris, 1989. James, William. External Shocks, Energy Policy and Macroeconomic Performance of Asian Developing Countries: A Policy Analysis. Manila: Asian Development Bank, 1983. Koomsup, Praipol, P. Tinakorn, and S. Ratanakomut. Energy Demand Policies in Thailand. Manila: Asian Development Bank, 1986. Lucas, N. "Energy Demand and Pricing Policies in ASEAN Countries". Paper presented at the Southeast Asian Co-operation with the European Community Seminar, Bangkok, 1989. Lucas, Nigel J.D. et al. Energy Policies in Asia: A Comparative Study. Singapore: McGraw-Hill, 1987. Meyanathan, S. "Energy and Adjustment: Indonesia and Malaysia in Energy and Structural Change in the Asia-Pacific Region". Paper and proceedings of the Thirteenth Pacific Trade and Development Conference, 24-28 January 1983. Manila: Philippines Institute for Development Studies, 1983. Ministry of Trade and Industry (Singapore). Economic Survey of Singapore 1988. Singapore, 1989, and various issues. Miyata, Mitsuru. "Energy Demand and Supply Forecast for the Pan-Pacific Region in Year 2000 and Tasks for Energy Co-operation". Paper presented at the Fourth Symposium on Pacific Energy Cooperation, Tokyo, 29-30 January 1990. National Economic Development Authority. Philippine Statistical Yearbook. Manila, 1988, and various issues. National Statistical Office (Thailand). Quarterly Bulletin of Statistics. Bangkok, various issues. Sathaye, J.. A. Ghirardi, and L. Schipper. "Energy Demand in Developing Countries: A Sectoral Analysis of Recent Trends". In Annual Review 'of Energy 12, edited by J.M. Hollander, H. Brooks, and D. Sternlight. 1987. Sharma, Shankar. The Role of Petroleum Industry in Singapore's Economy. Singapore: Institute of Southeast Asian Studies, 1989a. ----·"Domestic Utilization and Trade of Natural Gas in ASEAN". ASEAN Economic Bulletin 6, no. 2 (November 1989b).
56
Shankar Sharma
Siddayo, C.M. Energy Demand and Economic Growth: Measurement and Conceptual Issues in Policy Analysis. Boulder: Westview Press, 1986. ____ . Energy Conservation Policies in the Asia-Pacific Region: Economic Evaluation. Honolulu: East-West Center, Resource Systems Institute Working Paper, 1983. Sookawesh, P. "Natural Gas Development and Utilization in Thailand". ASEAN Economic Bulletin 6, no. 2 (November 1989). Taylor, Lester D. "The Demand for Energy: A Survey of Price and Income Elasticities". In International Studies of the Demand for Energy, edited by William D. Nordhaus. Amsterdam: North Holland Publishing Co., 1977. United Nations. Energy Statistics Yearbook. New York: United Nations, 1986, and various issues. World Bank. World Development Report. New York: Oxford University Press, 1980, and various issues.
III ENERGY ASA DEVEIDPMENT RESOURCE The Indonesian Experience Budi Sudarsono
I
ndonesia proclaimed its independence in 1945, and after several armed clashes with the Dutch obtained international recognition in 1950. But it was only after the 1965 attempted coup d'etat and a political and economic stabilization programme that Indonesia in 1969 embarked on planned economic development. Energy was already an important part of the first five-year development plan, or the first REPELITA, covering the period 1969-73.
THE FOUR REPELITAS During the early 1960s Indonesia had already prepared to consolidate the fledgling domestic oil industry, set up in the aftermath of a series of acts of nationalization on assets of several foreign oil companies during the latter part of the 1950s. Following the turmoil of 1965-66, the Indonesian economy was opened to foreign investors, and one of the first groups of investors consisted of a few small, independent oil companies. When these companies succeeded in finding oil, the large oil companies followed suit. Oil production then steadily increased. In the mean.time, the government launched a stabilization and rehabilitation programme to improve the economy. Inflation was greatly reduced from 500-600 per cent per year during 1965-66 to less than 30 per cent within three years, and the currency was thus stabilized. Concurrently the physical infrastructure was restored and upgraded. The government gave the highest priority to agriculture, especially to food production. The 57
58
Budi Sudarsono
textile industry was also accorded top priority. The most important policy change was on the government's own role of assuming only indirect control of the economy in contrast to the previous "Old Order" practice of direct control: the prices of only a few basic necessities remained under control. The private sector responded in a positive manner. Investment increased and the economy grew rapidly. The basic needs of the people for food and clothing were met. Trade and industrial activity picked up. The increased oil exploration activity brought results: oil production expanded rapidly, and large reserves of gas were discovered in 1972. When the oil windfall occurred in 1973-74, the country's economic development received a big impetus and was quickly being financed by oil earnings. Figure 1 shows the developments in the level of crude oil production after 1973; in particular, the rapid increase until 1977 was impressive. But it also shows the unmistakable decline in exportable oil surplus due to the large increases in oil consumption (until 1981) which was an inevitable result of economic expansion. The fact that oil and gas earnings became the major source of development finance is evident from Table 1. Note the rapid increase in oil and gas contributions during the 1970s, with gas export revenues beginning in 1977, and for several years of the 1980s these reached above 66 per cent of total revenues. Note also the impact of the 1986 oil price plunge as well as the improved performance in non-oil/gas revenues since 1986. It may be observed here that the development programme or government investment/capital expenditures were financed from the excess of total revenues over routine expenditures (comprising expenses for the civil service, office expenditures of the administration, and loan and interest payments). In addition, a major source of funding for the development programme had been development project assistance from outside sources, i.e. donor countries and multilateral agencies. Part of the development programme came in the form of "subsidies to the regions", i.e. allocations to all districts for various infrastructure development based on population distribution. Commercial energy consumption, largely of oil products, correspondingly increased with the increase in economic activity. Oil products were, however, subsidized, partly because it had been the usual practice during the previous "Old Order" government and partly a reflection of a mandate arising out of article 33 of the Constitution that all natural resources were to be used for the maximum welfare of the people (thus should be affordable to the vast majority of the population). Quickly the
FIGURE 1 Indonesia: Oil Developments
700-.------------------------------------------------------------------------,
: [: ~=::.::
,.,. I............···......•.··
••••
/
~
·~~
~
······...............
CD
100 0
.
•,
''•,.,....... ,../
mc .0 300 :>
200
:;;;> ...............
\
-b~
~--~--~--~
~-
----~.....
I
I
-I
-~~~
I
..... I
---.... ''~I
1981 1982 1980 ·--------- Consumption
1979
I
.......
...
•,,••............. .
~---
1978 1974 1976 1977 1975 ___ Production ••••••••• Export
1973
.~'
~
J ....I
-I
---I -~--~---
1985 1984 1983 ---·Import
1986
1987 Year
60
Budi Sudarsono
TABLE 1 Domestic Revenues, 1969/70-1988 I 89
Fiscal Year
Revenue from Oil & LNG Billion rupiah Per cent
1969/70 1970/71 1971172 1972/73 1973/74 1974/75 1975/76 1976/77 1977/78 1978/79 1979/80 1980/81 1981182 1982/83 1983/84 1984/85 1985/86 1986/87 1987/88 1988/89
66 99 141 231 382 957 1,248 1,635 1,949 2,309 4,260 7,020 8,628 8,179 9,520 10,430 11,144 6,338 10,047 9,527
27 29 33 39 39 55 56 56 55 54 64 69 71 66 66 66 58 39 48 41
Revenue from Sources other than Oil & LNG Billion rupiah
Per cent
178 246 287 360 586 797 994 1,271 1,586 1,957 2,437 3,207 3,585 4,248 4,913 5,476 8,109 9,803 10,756 13,477
73 71 67 61 61 45 44 44 45 46 36 31 29 34 34 34 42 61 52 59
Total
244 345 428 591 968 1,754 2,242 2,906 3,535 4,266 6,697 10,227 12,213 12,427 14,433 15,906 19,253 16,141 20,803 23,004
SOURCES: Djiwandono, Indonesian Quarterly XVI, no. 2, and Ministry of Information (1989).
economy became highly dependent on oil, both as a source of development finance and as a source of energy. One aspect of national resource management was the need to install domestic refinery capacity to meet the growing demand for oil products. This need arose not only out of energy supply security considerations but also reflected the requirements out of the same article 33 of the Constitution, in this case that management of natural resources of vital importance to the well-being of the population should be entrusted to the state. The extremely rapid growth of demand meant that refining capacity also had to be built very rapidly. When the capacity could not catch up with demand, processing deals (Indonesian crude to be refined and the products
Energy as a Development Resource
61
returned) were effected with refineries in Singapore in order to assure domestic supply. Table 2 shows the developments in refining capacity for the period 1973 through 1987. This dependence of the economy on oil made itself evident in several crises, arising out of world recession, and in measures to overcome them - the Pertamina crisis of 1975-76 (due to lack of foresight on the impact of world recession on oil demand) and several currency devaluations (considered necessary in the management of the macroeconomy) in 1978, 1983, and 1986. This Dutch disease is now being overcome by the lessons which had been learned through a series of drastic measures such as the 1983 rephasing of capital-intensive projects (including some indefinite postponements), and the various deregulation measures effected since 1983: (1) on the flow of goods through the harbours, (2) on non-tariff barriers, and (3) in trading practices, and, more recently, (4) in the banking sector, and (5) in the campaign for effective built-in control within the government apparatus. A certain degree of success has been achieved, as evidenced by the increased export earnings since 1986, which have included increased exports from the manufacturing sector, in particular garments. Thus constraints have been turned into opportunities, as eloquently expressed by Foreign Minister Alatas in a speech at ESCAP in March 1989. Table 3 shows that Indonesia has succeeded in maintaining a steady growth of exports by increasing non-oil/gas exports, even though oil/gas exports have not grown over this recent 1986-90 period. Thus the trade balance has remained positive and the current account deficit has been kept constant at around US$1.5 billion. Barring world recession or political upheavals - both seem unlikely for the time being - prospects for further continued growth and the projected "take off' foreseen for the next REPELITA are good, especially if recent developments in Western and Eastern Europe as well as in Asia itself, as widely believed, will be conducive to such growth. Many factors have contributed to Indonesia's economic success. Of particular importance is the continued inflow of capital and technical assistance from the countries of the Inter Governmental Group on Indonesia (IGGI), a consortium of advanced countries and multilateral agencies set up in 1966 to assist Indonesia in economic recovery, as well as from the newly industrializing economies of Asia. But it was certainly partly also due to the revenues accrued from oil and gas. In this respect, however, whatever benefits Indonesia had obtained from the sale of its precious commodities, they seemed to have vapourized through the exchange rate
TABLE 2 Indonesia: Refining Capacity (In thousands of barrels per day)
Crude distillation capacity Pangkalan Brandan Dumai & Sungai Pakning Musi (Plaju & Sungai Gerong) Cilacap & Wonokromo Cepu/Lemigas Balikpapan Thermal operations
1973
1975
1977
1979
1981
1983
1985
1987
293 5 136 80 4 4 65
293 5 136 80 4 4 65
393 5 136 80 104 4 65
393 5 136 80 104 4 65
393 5 136 80 104 4 65
393 5 136 80 104 4 65
739 5 136 80 275 4 240
817 6 150 89 304 4 265
-
-
44.6
9.5
18.1
Catalytic cracking
19.5
19.5
19.5
19.5
37.5
11
Catalytic reforming
23
23
23
34.4
32.7
17.3
SOURCE:
ADB
(1989).
81.5
81.5
60.7
60.7
Energy as a Development Resource --------
---
63
-------
TABLE 3 Indonesia: Recent Economic Performance 1986
1987
1988
1989
1990
5.9 9.1
4.8 9.3
5.7 5.5
5.9 6.0
6.1 5.8
-4.1 6.5 8.3 10.7
-2.3 8.6 8.6 12.4
-1.6 11.5 7.7 13.2
-1.5 13.5 8.8 15.6
-1.6 14.8 8.7 16.9
Government finance (trillion rupiah, fiscal years) Oil and gas revenues 6.3 10.0 Non-oil!gas revenues 9.8 10.8 Development revenues 5.8 6.2 Total revenues 21.9 27.0
9.5 13.4 10.0 33.0
10.5 16.5 9.9 36.9
10.8 20.8 11.3 42.9
Key indicators: Real GOP growth Inflation rate Current account, billion US$ Exports, non-oil!gas Exports, oil!gas Imports
SouRCE: Soekarni and Sitorus (1990).
developments that took place during 1986-88. For, much that the country had earned were in U.S. dollars, but a large proportion of its debts were in other currencies, which became considerably stronger during this period. THE OIL AND GAS SECTOR The role of oil and gas thus had been crucial in Indonesia's emergence as an economic entity during the recent past. Since oil and gas are energy commodities, it would be worthwhile to look into more detail on questions of energy. In this regard, energy policy during the period of the four REPELITAs had been based upon three key words: intensification, diversification, and conservation. First we review intensification and conservation.
Oil Intensification meant that energy development was continually pursued through intensification of exploration and development activities for all energy sources, but chiefly oil. Some 60-80 foreign companies set up operations in Indonesia through 120 or so production-sharing contracts (PSCs).
64
Budi Sudarsono
Indonesia had pioneered the production-sharing system of contracts. The relationship between Pertamina and the contractor has undergone several changes: the sharing of production of 80:20 (in the early years it had been 70:30) was changed to 85:15, the changes in the contracts to accommodate the U.S. Internal Revenue ruling (that the Indonesian share is a tax on the contractor company, for which it can claim exemption in the United States), the disputes arising out of the definition of commerciality, the delays resulting from the reviews by the government on implementation of purchase and service contracts (procurement above US$500,000), and most recently a liberalization of the terms of the contract. Oil development in Indonesia has been a success: finding rate has been high (30 per cent), production has increased, and the level of reserves, at least for a large part of the period of the four REPELITAs, maintained. However, oilfields are mostly small, or even very small compared with Middle East fields. With the recent drop in oil prices exploration has slowed, and reserves are being drawn upon. Prospects of Indonesia becoming a net importer of oil as early as 2005 are real, even though the number of producing basins is still small compared with the number being explored. The problem of subsidies for oil products has been mentioned previously. Pertamina is required to supply oil products at prices set by the government. Since kerosene is regarded as the fuel of the people, it has always been priced at lower than production cost. Gasoline is another essential fuel for the economy, but its use by vehicles has allowed the price to be set above its production cost. There is a cross-subsidy, therefore, from gasoline to kerosene; any losses incurred by Pertamina are borne by the state budget. However, a third fuel assumed great importance during this period under review, namely diesel fuel. For fear of widespread diesel fuel substitution by kerosene, the price of diesel fuel was kept close to that of kerosene, i.e. below cost. This greatly encouraged its use as fuel for captive power generation. Consumption of both kerosene and automotive diesel oil therefore expanded rapidly and accounts for the rapid increase during the 1970s. This rapid increase may be seen from Figure 2; Figure 3 shows the volumes sold over the more recent period. Table 4 shows developments in oil product pricing. By 1979 the combined volume of kerosene and diesel (both automotive and industrial) fuels had nearly reached four times the volume of the two types of gasoline sold in the market (about 40 per cent of the diesel fuel was used for transportation, most of the rest for power generation). Even with a substantial increase in oil product prices in 1980, government subsidies had increased to almost unacceptable levels: US$1.6 billion and US$2.0 billion in fiscal years 1980
FIGURE 2 Indonesia: Oil Product Sales 27 26 25 24 23 22 21 20
19 18 ::i! 17 c: ,g 16 ~ 15 14 13 12 11 10 9 8 7 6 5
...0~
1970 1m
1m1m1m1m1m1m1m
1m1~1~
1~1~1~1~1~1~
Year
$
.!l!
0
I
TABLE 4
Indonesia: Pricing of Oil Products (In rupiah per litre) 1973
1974
1975
1976
1977
1978
1979
1980
1981
1982
1983
1984
1985
1986
1987
Aviation gasoline
40
50
62
70
70
70
100
150
150
240
300
300
330
300
300
Avturbo
40
50
62
70
70
70
100
150
150
240
300
300
330
300
300
Premium gasoline
45
67
90
90
90
140
220
220
360
400
400
440
440
440
57
70
70
70
100
150
150
240
320
350
385
385
385
16
18
18
18
25
37.5
37.5
60
100
150
165
165
165
Regular gasoline
41
55 46
Kerosene
11.5
13
Automotive diesel
16
19
22
25
25
25
35
52.5
52.5
85
145
220
242
200
200
9
13
19
22
22
22
30
45
45
75
125
200
220
200
200
7.5
Industrial diesel
12
19
22
22
22
30
45
45
75
125
200
220
200
200
Oil products, weighted
19
23
29
36
36
36
52
80
80
127
177
230
255
242
n.a.
Implicit GOP deflator
100
147
166
190
214
238
315
407
448
484
555
618
655
649
752
Fuel oil
SOURCE:
ADB (1989).
68
Budi Sudarsono
and 1981! Moreover domestic sales of oil products had reached almost 160 million barrels in 1981, or 31 per cent of crude production. Table 5 shows the oil product subsidies required to be funded from the budget. Note the decrease from 1982 due to the price increases and no subsidy was required in 1986 because of the drop in international price. The subsidy then increased again because of higher production costs and the higher oil price (set at the GSP, or government selling price). The government therefore effected price increases in 1982 and 1983, which had to be continued into 1984 and 1985 because of the March 1983 devaluation, in order to bring oil product prices in line with those prevailing in other neighbouring countries. It might be said that circumstances had forced these measures to be taken by the government; nevertheless, an examination of Table 4 reveals the bold price increases taken over a period of several years. By early 1986 this had been satisfactorily achieved without causing political unrest. As may be observed from Figure 3, oil product consumption levelled off to a more or less constant value. Thus the conservation programme was achieved mainly through increases of energy price from 1982 through 1984 and through the intro-
TABLE 5 Indonesia: Oil Product Subsidies Subsidy Financial Year 1978/79 1979/80 1980/81 1981/82 1982/83 1983/84 1984/85 1985/86 1986/87 1987/88 1988/89
Billion Rp.
Million US$
197 535 1.021.7 1,316.4 961.5 928.1 506.7 374.2
394 853.3 1,629.5 2,056.2 1,413.9 938.7 480.3 598.8
nil
nil
401.2 266.5
241.7 156.8
Non: The rupiah currency was devalued in 1978 (on average, the US$ was Rp.442), in 1983 (Rp.909), and in 1986 (Rp.1,283). In 1987 the US$ was Rp.1,644. SoURCE: United States Embassy (1988).
Energy as a Development Resource
69
duction of the value-added tax in 1985, instigated by the realization that subsidized prices encouraged wasteful use and this in turn was rapidly reducing export earnings because of the reduced volumes available for export. This is not to say, however, that there had been no other conservation efforts; indeed there were government campaigns to appeal to consumers and drivers, and especially to managers of government office buildings, to save energy. Several energy studies were conducted and a state-owned energy-auditing company was set up to help industry in taking energy-conservation measures. Taken together, these efforts have been claimed to save energy by as much as 10 to 30 per cent. The transportation sector accounts for about one-third of total oil product consumption, and the annual increase has been steady at 8-10 per cent per annum. The price increases of 1982-85 have moderated somewhat this growth, but the declining price (in constant terms) since 1986 will tend to return it to previous growth. This trend over the past two decades was a reflection of the economic growth achieved and the fact that passenger and freight traffic in Java had been served by buses and trucks, which were run by (mostly) privately owned companies. The energy consumed by the transportation sector would certainly have been less if the state-owned railway could compete with those companies. Another feature of note is the significant role of motor cycles, using about 20 per cent, in gasoline consumption: this "discovery" may cause the government to abandon plans to increase the octane content of gasoline (Said et a!. 1989). The limits to development financing from oil and gas were felt when the oil price plunged in 1986. The state budget had to be severely curtailed, with projects being rephased, indefinitely postponed, or' even cancelled. The rupiah had to be devalued in September 1986, the third large devaluation in 1 ss than eight years, which unfortunately also had the effect of lowering oil product prices when compared with other countries. Questions were now raised concerning the resource base in Indonesia and policymakers became preoccupied with future oil price developments. For these several reasons, therefore, there was a need for additional incentives to stimulate exploration, development, and production of oil; and these were provided in 1989: 1. for frontier areas, 75 per cent of first 50 mb/d as government take, instead of 85 per cent, the figure of 85 per cent retained for production above 150 mb/d; 2. 110 per cent investment credits for offshore wells deeper than 180 metres;
70
Budi
Suda~ono - - - - - - - -
·-----
------
3. enhanced oil recovery with 75/25 split in frontier areas and 80/20 elsewhere.
Natural Gas Gas development has also been successful, although it must be admitted that gas was found when drilling for oil. Huge fields were discovered in Arun, North Sumatra, and Badak, East Kalimantan, in 1972. Negotiations were first held with utility interests in California for the export of LNG. These were, however, unsuccessful because of opposition from environmentalists on grounds of safety of the gas-receiving terminals. Then contracts were signed with utility interests in Japan, and the first LNG shipments were sent in 1977. By 1982 Indonesia had become the world's largest LNG exporter - a position Indonesia still holds today with South Korea as a second destination (since 1979), and the prospect of Taiwan becoming the third in 1990. LNG exports in 1987 totalled 16.8 million tons. The large natural gas fields are located far from consumption centres and hence more suitable for export in the form of LNG. The development of the gas fields in Arun in North Sumatra and Badak in the northern part of eastern Kalimantan have also been characteristic of the early successes of Pertamina. While those gas fields located in East Sumatra had been exploited for fertilizer plants, those on or offshore Java were for fertilizer plants, power generation, and other industrial uses as well as for household purposes. Figure 4 shows developments in gas production, consumption, and export. Table 6 shows domestic consumption of natural gas, indicating that most of the so-called gas consumption is for LNG and LPG production, and for use in the fields for gas injection, gas lift, as well as for fuel gas. Gas pricing had always been controversial. The government in the past had favoured the use of gas for fertilizer production, and since fertilizer is an important input in food production the price of gas had to be low. Similar arguments were used in the determination of gas price for steel production. And so the prices were set at US$0.65/mscf and US$1.00/mscf respectively. For power generation and other industrial uses, however, the price was set at US$3.00/mscf. This state of affairs was unsatisfactory: not only did it not encourage the gas producers, but it was also discriminatory to the power and industrial sectors. The pricing of LNG also had its share of disputes, especially after the 1986 oil price crash. In 1989 the government decided to base the gas price on a more realistic footing by relating it to international crude oil prices.
FIGURE 4 Indonesia: Gas Developments ~-r--------------------------------------------------------------~
~-r--------------------------------------------~k-----------~
i
~
u~30 r--------------------------~~~~~=-- ~il EE
:g
~ 20
10
,,
7
I
,•'
,,
,
~~
~~
#---------
, ... -------·-···'
, _____....,.,
I
~ ~~~,
I
,
0
·---·----·-1973
1974
1975
- - - Production
,
1976
1977
1978
1979
- - - Consumption
1980
1981
1982
_____ Export
1983
1984
1985
1986
1987
Year
72
Budi Sudarsono
TABLE 6 Indonesia: Utilization of Natural Gas (In million standard cubic feet) 1984
1985
1986
1987
Own use: Gas injection Gas lift Fuel gas Sub-total
221.8 60.0 77.0 358.8
253.7 48.7 75.1 377.5
245.7 52.9 83.1 381.7
249.7 58.7 88.0 396.4
Net production
1,162.6
1,277.7
1,330.4
1,423.7
Sales: Electricity (PLN) City/town gas Fertilizer plants Cement plant Cilarnaya* Refinery LPG plants LNG plants Others Sub-total
0 0.8 105.2 n.a. 62.5 11.7 35.0 830.1 1.6 1,027.2
0.1 1.3 127.6 1.1 66.7 12.9 47.1 816.8 0.1 1,073.5
2.8 1.3 136.1 2.1 76.5 19.0 41.0 834.4 0.2 1,113.3
5.2 1.7 138.3 2.7 77.8 20.9 24.5 917.0 0.3 1,188.3
135.4
129.0
134.0
147.3
Flared *Delivered to: Kujang fertilizer plant Krakatau steel plant Cibinong cement plant City gas for Jakarta and Bogar.
Household consumption of LPG is being encouraged, although only the higher income groups could make the necessary expenditures for stoves and the bottling arrangements. The pricing of LPG, however, has not been set with a view to increase its penetration (since kerosene is priced low in order to be affordable). One consideration has been that LPG is also being developed as a foreign exchange earner. The availability of natural gas in and offshore Java has afforded the opportunity to substitute oil products. Town gas development has been an obvious choice, because of the reliance of the household sector on kerosene and the desirability to substitute it. But only a few cities have
Energy as a Development Resource
73
gas networks, and most of these are old systems needing complete restoration and new investments. Table 7 shows developments in the city/town gas sector. Most of the supplied gas, 80 per cent or above, consisted of natural gas supplied to Jakarta, Bogor, Medan, and Cirebon; the rest was gas derived from coal or oil, supplied to Bandung, Semarang, and Surabaya. The latest development is using offshore gas for power production in Java. New gas fields have been found offshore Madura island east of Java and north of Bali, which are close enough to industrial and consumption centres in Surabaya, East Java. Plans are underway to install combined cycle plants with 900 MW capacity, with possible additions of 600 MW. Further development of these fields could increase the penetration of natural gas in the power sector. In the longer term, the large gas fields in East Kalimantan and in the Natuna offshore area offer the possibility of a large expansion in gas utilization through pipeline to consumption centres both in Java as well as in the area of Batam island, Singapore, and East Sumatra.
Pertamina Pertamina in the past has had its ups and downs. It had promoted the construction of fertilizer plants and other petrochemical plants, whose products were essential to the agricultural sector and to the economy as a whole. It had also gone through a financial crisis, when it overreached itself in making transportation commitments for oil shipments based on demand projections which did not materialize. Pertamina has been able to function as an agent of development: it acts as a supplier of oil products (with demand for oil products doubling every
TABLE 7 Indonesia: City/Town Gas Developments (In thousand m3) 1983/84
1984185
1985/86
1986187
1987188
1988/89
94,758
102,585
132,052
171,556
202,331
247,416
29.1
25.2
15.8
16.5
11.8
9.5
Sales
67,232
76,764
111,127
143,319
178,287
223,861
Subscribers (no.)
21,129
20,872
21,668
21,599
22,083
24,168
Production Losses (percentage)
SOURCE: Ministry of Information (1989).
74
Budi Sudarsono
six years between 1969 and 1981) and LPG; it has spawned a number of daughter companies serving itself and the oil industry in a number of areas; it is the largest employer in Indonesia; and it is managing the oil industry, with multibillion-dollar activities. By 1985 it was able to commemorate a century of Indonesian oil industry: the oil industry in Indonesia was mature and dominant. ENERGY OTHER THAN OIL AND GAS
Electricity The power sector, next to oil and gas, is the most important energy sector. It is important not only for its versatility and utility in supporting the modern sector, but also because of its capital intensity and its very high growth. This is also the sector where the implementation of the second component of energy policy, that of diversification, is carried out. The problem in the power sector is one of meeting rapid demand growth, including the demands for rural electrification, and minimizing captive generation. At the beginning of the first REPELITA Indonesia's utility PLN had less than 500 MW in installed capacity, with most of it located in Java where 62 per cent of Indonesia's population live, and the power system outside of Java fragmented in many isolated city and town systems (which is still the case today, in fact). Even in Java there were still four separate grid systems. The early REPELITA years were difficult ones for PLN: no investment funds were available, technical skills and expertise were lacking, and the surge of economic activity produced a demand for power that could not be met. The government, through the Investment Board, was obliged to allow the installation of captive power-generating capacity as part of the investment packages (and therefore enjoying tax privileges) proposed by investors. Thus a substantial power-generating capacity still exists today outside the utility - a very inefficient use of resources: capital tied up in separate, unconnected high-cost units, inefficient use of diesel oil because of the small capacities, and the impossibility of substituting other, i.e., non-oil, fuel. The availability of diesel oil allowed this situation to continue to this day, although PLN's increased reliability and ability to supply power have decreased the growth of captive power. Table 8 shows these developments up to 1986. It was realized from the early years of the New Order that in energy consumption it was desirable to diversify away from oil. But it was also
Energy as a Development Resource ~-
~~~~-----~-
75
- - - - - - - -
TABLE 8 Installed Capacity of Self-Producers (In MW)
Capacity
1982
1983
1984
1985
1986
2,378
3,158
3,335
4,721
5,171
SoURCE: ESCAP (1989).
realized that diversification could only be implemented in a significant manner through the electricity sector. The opportunity presented itself with the advent of the oil windfall of 1979~80. When the first oil windfall occurred in 1973~74, neither PLN nor the planning agency was ready for a large expansion of the power system. The decision to cease the construction of oil-fired plants in Java and to build coal-fired plants was taken in 1975. A thorough review of the long-term power demand, particularly in Java, was undertaken in 1976~77 by both state agencies, with the catalytic assistance of the Indonesian National Committee of the World Energy Conference. By 1978 the government was prepared with diversification plans to build hydro-power and coal-fired plants in Java. Thus the decisions were made at the onset of the second oil windfall to build several hydro-power plants in Java and to begin construction of the first units of the Suralaya coal-fired power plants in west Java. These decisions to diversify enabled PLN to maintain substantial reserve capacity during the 1980s, which is still the case today. However, as the power system gets larger, it is becoming more difficult to double the supply capacity every five or six years. Table 9 shows the installed capacity according to type of power plant, by year, for the period 1973-87. The problems in rural electrification are well known. In the earlier REPELITA periods PLN had not been in a position to extend grids to village communities. This fact prompted some attempts to initiate rural electrification projects, especially in areas not likely to be covered by PLN in the short or medium term. However, as with many other similar efforts in the past, the initiators usually ended up requesting PLN's assistance to take over the projects. In recent REPELITA periods PLN had been able to launch rural projects, as shown in Table 10.
TABLE 9 Indonesia: Utility Installed Capacity (In MW) 1973 1974
1975
1976
1977
1978
1979
1980
1981
1982
1983
1984
1985
1986
1987
Type of power plant Thermal
497
643
809 1,056 1,540 1,937 2,158 2,176 2,634 2,939 3,368 4,042
Steam Diesel Gas
225 230 42
250 267 126
250 274 285
250 323 483
250 462 829
556 499 882
756 506 896
756 1,156 1,356 1,556 2,086 2,487 2,487 2,817 524 581 664 784 860 937 1,326 1,652 896 897 919 1,028 1,096 1,116 1,116 1,116
279
279
321
321
322
351
378
379
398
437
536
0
0
0
0
0
0
0
0
0
30
30
776
922
Hydro-power Geothermal TOTAL S0!-'1\CE: ADB (1989).
4,540 4,930 5,585
536 1,064 1,240 1,512 30
140
1,129 1,377 1,863 2,288 2,536 2,555 3,033 3,406 3,398 4,608 5,635 6,200
7,237
30
30
Energy as a Development Resource
77
TABLE 10 Rural Electrification Projects 1983/84 1984/85 1985186 1986/87 1987188 1988189 No. of villages No. of subscribers Capacity installed, MW
1,405
1,606
1,472
2,387
3,672
2,270
365,682 451,508 519,898 584,950 1,020,783 848,065 6.3
12.5
14.1
9.9
10.9
52.4
Medium-tension network, km
2,165
3,496
2,414
3,472
4,554
3,151
Low-tension network, km
2,184
3,453
3,448
4,047
5,766
2,076
SOURCE:
Ministry of Information (1989).
Coal Coal development was part of the intensification programme, whereas coal utilization was considered part of the diversification programme. The decision taken in 1975 was thus actually on coal development, and it was soon evident that it had not been an easy task. The goal of having coal-fired plants on-line by 1984-85 prompted the government to invite foreign investors in 1981 to develop coal resources in Kalimantan. No less than eight consortia signed up with P.N. Batubara to develop coal mines in Kalimantan. Five of these have now reached commercial production, their combined production in 1988 being equal to that of the two stateowned mines (P.T. Tambang Batubara Bukit Asam and P.N. Batubara). However, the initial coal-fired plants built in Java were designed for South Sumatra's state-owned Bukit Asam coal mine, whose development experienced some setbacks. Four of these 400 MW plants have now been built: two units have been operating since 1985, one unit began operations in 1989 and the fourth will begin commercial operation in 1990. Although the Bukit Asam coal mine is currently in the process of greatly increasing production to meet the demand of the Suralaya power plants, part of the supply since 1985 unavoidably had to be imported. Future coal-fired power plants in East Java will be designed to use Kalimantan coal. The production of cement has been the next largest user of coal. Growth in cement production had increased continually since the earlier REPELITA years; during the previous one cement production increased from 8.1 million tons in 1983/84 to 13.3 million tons in 1988/89. The cement plants had switched fuel, from oil and gas to coal. Johannas projects coal consumption as shown in Table 11.
78
Budi Sudarsono TABLE 11 Forecast of Coal Consumption (In thousand tons) 1989
1990
1991
Power generation
3,860
4,790
Cement manufacture
1,780
1,795
110 5,750
Others TOTAL
SOURCE:
1992
1993
1995
2000
4,790
5,070
6,630
8-12,000
15-29,000
1,845
1,895
1,945
2,200
3,200
110
110
110
110
3,400
7,400
6,695
6,745
7,075
8,685
13-17,700
26-39,500
Johannas (1989).
FUTURE PROSPECTS Finally, it will be appropriate to discuss Indonesia's prospects during the current five-year plan: REPELITA V, which began in April 1989. The targeted economic growth rate of 5 per cent implies an optimistic oil price scenario. (Curiously, the oil price assumption used in the 1989 fiscal year budget was US$14 per barrel, although for the 1990 fiscal year it has been raised to US$16.50 per barrel.) The concern over Indonesia's rapidly depleting oil resources (evident by statements on the possibility of Indonesia becoming a net importer of oil by 2005) has been overcome by the new incentives for the oil industry, said to defer the net importer status by a decade or two, and by the emergence of gas as a major foreign exchange earner and as a source of energy for power generation. There is still concern about the large consumption of kerosene; hence plans are under way to increase gas utilization in the household sector in order to substitute kerosene. The capital requirements, however, will mean that its realization will be slow. The alternative solution, namely price increases of oil products, will have to be addressed soon in order to avoid increases in subsidies. New and renewable energy sources, such as solar energy, biomass, etc., have been under study by various government agencies, institutes, and universities. In agreement with many other developing countries, the penetration of these technologies in Indonesia will be slow unless the price of oil returns to the high levels of 1979/80. The country's economic structure will still be undergoing a transformation into a more industrial and more service-oriented structure for many years to come, and therefore reliance will be placed on conventional energy technologies. In the
Energy as a Development Resource
79
------~~---~-
household sector, for instance, only about 22 per cent of households are connected to the utility system, and only about 60 per cent of the population can use kerosene as fuel. In the country's efforts on technology development, the energy sector is also one of the "vehicles" for increasing the local content of construction and manufacturing projects. Setting up of joint venture companies had been encouraged, particularly in Batam island. The degree of success which has been achieved thus far is shown by units 3 and 4 of the Suralaya coal-fired plant, which have installed boilers made in Indonesia. The longer term outlook for the power sector is not too optimistic, unless a conscious effort is made to increase public financing in that sector. The reason is that, even though in the short term electricity demands can be easily met, the long-term prospects depend on finding the sources of financing for the very large sums required for future projects - at a time of constraints in government revenues. Environmental considerations are being thrust more and more in the forefront of deliberations on energy. Already, a limit on the use of coal for power production in Java, reported to be 40 million tons per annum, is being seriously considered. The use of environmental protection equipment, decreed in 1988, entails higher power-generation costs and nuclear electricity competitiveness. Nuclear power plant construction, however, entails higher front-end capital outlays, and raises issues of safety and public acceptance. A possible solution to this problem invites a dilemma to be answered: should foreign parties be allowed to invest in power generation and participate in a public utility? For the moment no one has come forth with an answer.
REFERENCES Asian Development Bank. Energy Indicators of Developing Member Countries of ADB. May 1989. Djiwandono, J. Soedjati. "Recent Indonesian Experience in Economic Management", Indonesian Quarterly XVI, no. 2. ESCAP. Electric Power in Asia and the Pacific in 1985 and 1986, 1989. Johannas. "Coal Situation in Indonesia", Quarterly Report 1, no. 3 (August 1989). Japan: New Energy and Industrial Technology Development Organization. Ministry of Information, Jakarta. "Lampiran Pidato Kenegaraan Presiden Republik Indonesia" [Annex to the Presidential State Address], 16 August 1989.
80
Budi Sudarsono
Said, Umar, Chairul Aswan, and F.X. Sutijastoto. "Sectoral Energy Demand Studies in Indonesia". Paper presented at REDP Regional Workshop on Sectoral Energy Demand Studies, ESCAP. Bangkok, 28-30 November 1989. Soekarni, M. and T. Sitorus. "Indonesia: Recent Economic Performance and Prospect". Paper presented at Regional Seminar on an Interlinked Country Model System, Eighth Session, ESCAP. Bangkok, 17-19 January 1990. United States Embassy, Jakarta. The Petroleum Report Indonesia. Various issues (annual).
IV MALAYSIAN ENERGY POLICY An Economic Assessment Wan Leong Fee
R
apid economic growth and structural changes in the Malaysian economy during the last two decades have led policy planners and analysts to reassess the efficiency in the use of energy resources and their availability for future requirements. Special concern is focused on the extent to which natural gas can be used for power generation and the suitable timeframe for the introduction of the 2,400 MW Bakun hydroelectric project in Sarawak. To reduce the economy's dependence on oil, the government has embarked on the four-fuel diversification strategy for the optimal mix of oil, natural gas, coal, and hydro in energy use. With the revisions of the production-sharing contracts (PSCs) in December 1985, Malaysia is set to attract foreign capital to invest in the upstream and downstream activities of the energy sector. In 1988, Malaysia led an upturn in upstream investment in the Asian-Pacific region. Malaysia also overtook Australia as the second largest producer of oil in the AsianPacific region in 1989 (Petroleum News, 1989). The strategy to diversify natural gas development from the limited liquefied natural gas (LNG) export markets (dominated hitherto by Japan) for domestic uses is actively pursued with the construction of the 726-km pipeline to supply natural gas to the power plants and the industrial sector in West Malaysia and eventually Singapore. The development of a new oil refinery with a capacity of 100,000 b/d in Malacca and the proposed Methyl Tertiary Butyl Ether (MTBE) and polypropylene plants for petrochemical development reinforce energy investments in the 1990s to turn Malaysia into the powerhouse of the ASEAN region. Refinery integration in response to the changing demand 81
82
Wan Leong Fee
for light and middle distillates (as environmental concern catches on in the ASEAN region with new legislations in Malaysia, Singapore, Thailand, and Indonesia to reduce lead pollution in gasoline) has provided new opportunities in the highly risky exploration and development of oil/gas. The choice of an optimal investment strategy among the highly competitive options of oil, gas, coal, and hydro is not an easy decision as it has a long-term impact on the economy of not only Malaysia but also the ASEAN region as a whole. The issues on energy investment strategies, be it the Bakun hydro project or the ongoing PGU, depend on the crucial oil and gas prices in a highly unstable global energy market, apart from the environmental considerations. The economics of natural gas use will, however, certainly be enhanced by a wider regional market. It is in this context that energy policy planners in the region - the ASEAN Council On Petroleum (ASCOPE) - agreed in a Bangkok meeting in November 1988 (Oil and Gas Journal, 1989) to study the feasibility of a TransASEAN gasline (Wan 1989) for optimal utilization of the abundant gas resources in the ASEAN region, given the rising energy demand in the Asian-Pacific region in the 1990s. Against the macroeconomic perspectives, this chapter provides an economic assessment of Malaysia's energy policy in relation to the overall objective of developing the nation's energy resources for economic growth. ECONOMIC GROWTH AND ENERGY DEMAND Malaysia comprises the states of Peninsular Malaysia (also known as West Malaysia), Sabah, and Sarawak (East Malaysia). Peninsular Malaysia, which is separated from East Malaysia by the South China Sea over a distance of 750 km, has a land area of 131,587 sq km out of the total land area of 330,434 sq km. Sabah and Sarawak occupy 74,398 and 12,449 sq km of land area respectively. The total population of Malaysia in 1985 was 15.8 million, at an average annual growth rate of 3 per cent for the period 1981-85. It is expected to increase to 17.8 million by 1990 (Table 1). The export-oriented economy of Malaysia has undergone significant changes, from being predominantly agriculture-based to a semiindustrialized economy, deriving its export earnings from the exports of manufactured goods, primary commodities, and a substantial share from oil and gas. Petroleum exports increased steadily from 4 per cent of total exports in 1970 to a peak of 27 per cent in 1982 following the oil price hikes in 1973-74 and 1979-80, declining somewhat to 12 per cent in 1988 after the slump in world oil price in mid-1980 (Table 2). In value terms,
Malaysian Energy Policy
83
TABLE 1 Population of Malaysia, 1980-90 1980
1985
Average Annual Growth Rate (o/o)
1990
(millions) Peninsular Malaysia
11.5
13.0
1981-85
1986-90
14.6
3.0
2.6 4.2
Sa bah
1.1
1.3
1.5
3.2
Sarawak
1.3
1.5
1.7
3.2
3.2
13.9
15.8
17.8
3.0
2.8
TOTAL
SOURCE: Fifth Malaysia Plan 1986-90.
TABLE 2 Malaysia: Composition of Exports, 1970-88
Total Exports (M$ million)
1970
1975
1980
1984
1986
1988
5,163
8,900
27,850
38,275
33,552
54,422
4 5 12 33 20 16
9 16 17 20 14
24 8
13
18 9 15
22 12 31 10 3 11
10
11
5
11
16 9 41 9 2 7 6 1 9
12 9 48 9 2 11 3 1 5
Share of Total Exports(%): Petroleum Palm Oil Manufactured Goods Rubber Tin Sawn Timber and logs LNG Cocoa Others
21
SOURCE: Ministry of Finance (1989).
export earnings from petroleum increased from M$726.9 million in 1975 to M$6,289.9 million in 1987 (Table 3). The growth of the manufacturing sector in the Malaysian economy from 12 per cent of total exports in 1970 to 48 per cent in 1988 reflects the success of economic diversification from an essentially primary commodity economy in the 1960s and 1970s to a semi-industrialized economy in the 1980s. Simultaneous to this structural change in the economy is the
TABLE 3 Malaysia: Exports of Petroleum, Petroleum Products, and LNG, 1975-87 1975
1980
1983
1986
1987
CRUDE PETROLEUM Export Volume ('000 tonnes) Export Value (M$ million) F.O.B. Unit Value (M$ per tonne)
3,239.8 726.9 224.4
11,226.9 6,709.1 597.6
14,224.0 7,871.0 553.4
18,791.9 5,400.9 287.4
18,039.0 6,289.9 348.7
PETROLEUM PRODUCTS Export Volume ('000 tonnes) Export Value (M$ million) F.O.B. Unit Value (M$ per tonne)
338.8 104.1 307.3
280.2 186.8 666.7
1,097.7 597.3 544.1
2,037.0 632.5 310.5
2,149.0 754.4 351.0
1,351.0 831.1 615.0
5,265.0 1,848.2 368.0
6,814.0 1,741.7 290.0
LIQUEFIED NATURAL GAS Export Volume ('000 tonnes) Export Value (M$ million) Unit Value (M$ per tonne)
SOURCES: Department of Statistics (Malaysia), various issues; and Ministry of Finance, various issues.
Malaysian Energy Policy
85
emergence of Malaysia as one of the leading exporters of LNG in 1983 with the completion of the Bintulu LNG project in Sarawak. LNG exports increased to 6 per cent of total exports in 1986, declining to 3 per cent in 1988 with the general decline in world oil price. Export earnings from LNG doubled from M$831.1 million in 1983 to M$1,741.7 million in 1987 (Table 3). The contributions of the petroleum industry to the Malaysian economy can be seen in terms of its rising share in total revenue, which increased from 5 per cent in 1976 to 21 per cent in 1986, declining to 16 per cent in 1988 (Table 4). The Malaysian economy has enjoyed sustained economic growth in the 1970s into the 1980s at an average annual growth rate of 8 per cent per annum. Between 1978 and 1988, Malaysia's final energy use doubled, from 5.1 million tonnes of oil equivalent (mmtoe) to 10.5 mmtoe, as shown in Table 5. The industrial sector had the largest share in final energy use (42 per cent) in 1988, followed by the transportation sector (41 per cent) and the residential and commercial sector (14 per cent). Energy use in the transportation sector more than doubled between 1978 and 1988 (Table 5). The share of petroleum products, however, continued to fall from 87 per cent of total final energy use to 75 per cent over the same period. Natural gas substituted for oil in its growing share from 0.6 per cent to 10 per cent during the same period (Table 6). Despite the declining share of petroleum in final energy use, oil consumption doubled from 94,000 bid in 1974 to 194,800 bid in 1986 (Table 7). Per capita energy consumption in 1986 was estimated at 4 barrels of oil equivalent, with an income elasticity of energy demand of 1.1:1 (Lucas 1987). A consumption rate of 14 barrels of oil equivalent per capita is projected by the year 2000. Several changes in the pattern of energy consumption can be observed as economic growth continues to advance. First, aggregate energy intensities of the economy increased by 33.2 per cent between 1973 and 1985 largely as a result of structural changes in the economy accompanying industrial growth. Secondly, sectoral intensity in energy use is observed in the almost 50 per cent reduction in energy intensity of the transport sector as the price of new vehicles escalates. ENERGY SUPPLY Malaysia's energy supply is derived from both fossil fuels - oil, gas, and coal - and renewable energy resources such as hydro-power and biomass. Current proven oil and gas reserves in Malaysia have been estimated at
TABLE 4 Malaysia: Contributions of Petroleum to Federal Revenue, 1976-88 1976 Sources of Revenue
1980
1984
1986
1988
MS
Share
MS
Share
MS
Share
%
mil
%
M$ mil
Share
%
M$ mil
Share
mil
%
mil
%
Income Tax Import Duties Excise Duties Export Duties Others
2,066 978 550 1,010 887
34 16 9 16 14
5,258 2,036 973 2,592 1,936
38 15 7 19 14
7,977 2,697 1,459 2,090 2,251
38 13 7 10 11
8,279 2,066 1,410 1,141 1,786
42 11 7 6 9
6,922 2,298 1,430 1,430 2,216
32 11 7 7 10
Total Tax Revenue Non-tax Revenue*
5,491 666
89 11
12,795 1,040
93 7
16,474 4,331
79 21
14,682 4,836
75 25
14,296 7,152
67 33
Total Federal Revenue Total Petroleum Revenue**
6,157 322
100
13,835 4,199
100
20,805 4,148
100
19,518 4,148
100
21,448 3,357
100
Petroleum Revenue as % of Federal Revenue
5
30
20
21
16
*Includes government commercial undertakings, interest and return on investment, licences, service fees, road tax, fines and forfeitures, rental revenue from Federal territories, contributions from foreign governments and international agencies and petroleum royalties/gas cash payments. **Estimated by summing up income taxes from petroleum and export duties on petroleum. SOURCES:
Nada Petronas, various issues; and Ministry of Finance (1989).
Malaysian Energy Policy
87
~--------------
TABLE 5 Final Energy Use by Sector, 1978-87 (In thousand tonnes of oil equivalent)
Year
Residential & Commercial
Industrial*
Transport
Non-Energy
Total
1978 1979 1980 1981 1982 1983 1984 1985 1986 1987 1988
712 794 826 884 942 1,040 1,099 1,123 1,224 1,297 1,435
2,294 2,622 2,892 3,238 3,183 3,320 3,331 3,508 3,890 4,399 4,377
1,928 2,135 2,398 2,587 2,794 3,190 3,300 3,477 3,726 3,929 4,278
180 231 269 270 314 320 315 386 382 358 366
5,114 5,782 6,385 6,979 7,233 7,870 8,045 8,494 9,222 9,983 10,456
*Includes gas used as feedstock. Ministry of Energy, Telecommunications and Posts
SouRCE:
(1989).
TABLE 6 Final Use of Commercial Energy by Fuel Type, 1978-88 (In thousand tonnes of oil equivalent) 1978
1980
1982
1984
1986
1987
1988
Petroleum Products Coal and Coke Natural Gas Electricity
4,456 23 31 604
5,550 53 35 747
6,228 93 46 866
6,622 270 134 1,019
6,880 268 910 1,164
7,271 327 1,132 1,253
7,816 189 1,058 1,393
TOTAL
5,114
6,385
7,233
8,045
9,222
9,983
10,456
SOURCE:
Ministry of Energy, Telecommunications and Posts
(1989).
2.9 billion barrels and 51.7 trillion cu. ft, with an estimated international ranking at twenty-second and thirteenth position respectively. In oilequivalent terms, gas reserves are four times as large as oil reserves, at an estimated life of a hundred years for gas and fifteen years for oil,
88
Wan Leong Fee
TABLE 7 Malaysia: Oil Consumption, 1974-88 (In barrels per day) Year
Consumption
1974 1975 1976 1977 1978 1979 1980 1981 1982 1983 1984 1985 1986 1987 1988
94,000 101,500 113,100 116,600 124,100 147,000 158,900 168,700 179,100 190,500 186,700 185,000 152,000 156,000 159,000
SOURCE: Ministry of Finance (1989).
assuming no major new discoveries take place and that the current oilproduction level of 540,000 bid is maintained. Major oil and gas production fields are located offshore in three producing areas in offshore Trengganu, Sarawak, and Sabah. Four types of crude oil are produced in Malaysia. The tapis crude is produced from offshore Trengganu, Miri Light and Bintulu from offshore Sarawak, and Labuan crude from Sabah. A total of fifty-four oilfields and fifty-two gas fields were located in Peninsular Malaysia, Sarawak, and Sabah in 1988, as shown in Table 8. Since the signing of production-sharing contracts between the National Oil Company of Malaysia (Petronas) and the contractors (ESSO, Shell, and others) in 1976, oil production had increased rapidly, from 81,000 bid in 1974 to 522,000 bid in 1988. Similarly, gas production had multiplied nearly sixfold from 272 million cu. ft per day to 1,614 million cu. ft per day over the same period, as shown in Table 9. Of the major sources of commercial energy supply in 1987, petroleum and petroleum products account for 63 per cent (8.9 mmtoe). The share of natural gas increased from 10 per cent in 1978 to 29 per cent in 1987 (Table 10).
Malaysian Energy Policy
89
TABLE 8 Location of Oil and Gas Fields in Malaysia, 1988 Oil fields
Gas Fields*
Number
%
Reserves (million barrels)
%
Number
%
ReservesT (trillion cubic feet)
%
17 25 12
948 509
50 33 17
29 20 3
56
Sabah
32 46 22
1,456
Sarawak
38 6
26.3 23.0 2.4
51 44 5
TOTAL
54
100
2,913
100
52
100
51.7
100
Location
Peninsular Malaysia
*Not including non-associated gas in oilfields. tAssociated and non-associated. SOURCE: Petronas.
TABLE 9 Oil and Gas Production in Malaysia, 1974-88. Crude Oil
Gas
Year
Production (thousand barrels per day)
Reserves (billion barrels)
Production (million cu. ft per day)
Reserves (trillion cu. ft)
1974 1975 1976 1977 1978 1979 1980 1981 1982 1983 1984 1985 1986 1987 1988
81 98 165 183 217 283 276 258 303 381 441 431 485 479 522
0.772 0.742 0.701 1.191 1.298 1.449 1.825 2.313 2.295 2.570 2.952 3.066 3.001 2.922 2.913
272 266 343 267 233 289 258 234 336 723 1,093 1,240 1,442 1,557 1,614
23.4 18.7 28.8 19.5 19.1 17.8 42.4 44.7 48.4 50.3 48.9 52.7 53.0 51.7 51.7
SOURCE: Petronas.
90
Wan Leong Fee
TABLE 10 Commercial Energy Supply, 1978-88 (In thousand tonnes of oil equivalent)
Natural Gas* Crude Oil Petroleum Products** Coal & Coke
1978
1980
1984
851
697 5,901
1,893
4,605
4,444
4,525
7,721
7,060
7,274
7,635
2,323 53
1,684 270
2,271 327
2,593
383
913
2,286 268 1,070
5,847 1,174
Hydro-power
23 244
Electricity***
1
7
7
8,140
9,364
10
7
Total Primary Supply % Share of Natural Gas
1986
1987
1988
0
1,212 -2
260 1,288 -6
12,488
15,289
15,526
16,295
15
30
29
28
*Net of flared gas, reinjection, and LNG production. **Excluding products from local refineries. ***Net imports, excluding amount generated from thermal stations (accounted for in crude oil and petroleum product supply). SouRCE: Ministry of Energy, Telecommunications and Posts (1989).
The share of crude oil and petroleum products in total primary energy supply continued to decline, from 86 per cent in 1978 to 63 per cent in 1988, largely in response to the government's policy to diversify from oil to other indigenous energy resources - natural gas, coal, and hydro. Malaysia exports its light and low-sulphur oil and imports about 70 per cent of its crude petroleum from the Middle-East countries - Iran, Kuwait, Saudi Arabia, and the United Arab Emirates. Crude oil produced in Malaysia is exported mainly to Japan, South Korea, Singapore, Thailand, and the Philippines (Table 11). The share of coal in total primary energy supply was only 1.6 per cent in 1988. It is used mainly in cement plants and the iron and steel industry. More than 80 per cent of the hydro resources are located in Sarawak, which has an estimated hydro potential of 20,000 MG compared to 1,150 MG in Peninsular Malaysia. For petroleum products, the demand for diesel oil has declined since 1982 as a result of the abolition of the diesel subsidy and sluggish industrial activities. The recent recovery in industrial activities has boosted both diesel and fuel oil demand. Liquefied petroleum gas (LPG) and kerosene are used mainly in households and commercial
Malaysian Energy Policy
91
TABLE 11 Malaysia: Export of Crude Oil by Destination, 1987 Amount (million barrels)
Destination Japan South Korea Singapore Thailand Philippines Australia United States of America Taiwan Others TOTAL
%
of Total
27.7 21.7 19.0 16.4 9.1 6.0 4.9 2.3 5.1
25 19 17 15
112.2
100
8
5 4 2 5
SOURCE: Petronas.
establishments. It was estimated in 1986 that only 25 per cent of the households used LPG, reflecting the future potential market for LPG. LPG is increasingly substituting kerosene as household fuel, and the switch from kerosene to electricity for lighting in rural areas causes further decline in kerosene use. The rapid growth in electricity consumption is taking place in the industrial, residential, and commercial sectors, as shown in Table 12.
TABLE 12 Electricity Demand, 1978-88 (In thousand tonnes of oil equivalent) 1978
1980
1982
1984
1986
1987
1988
Residential and Commercial
281
363
440
564
657
695
763
Industrial
323
384
426
455
507
558
630
TorAL
604
747
866
1,019
1,164
1,253
1,393
SOURCE: Ministry of Energy, Telecommunications and Posts (1989).
92
Wan Leong Fee
GROWTH IN ELECTRICITY DEMAND Power development in Malaysia is vested in three public power utility bodies: 1. the National Electricity Board (NEB or LLN) in Peninsular Malaysia; 2. the Sarawak Electricity Supply Corporation (SESCO) in Sarawak; and 3. the Sabah Electricity Board (SEB) in Sabah. Electricity generation, electrical installation, and the transmission and distribution of electricity are the exclusive functions of these statutory bodies to ensure the supply of energy to the consumers at reasonable economic prices. With the systematic expansion of its national grid, LLN's installed generating capacity increased from 360 MW in 1970 to 1,930 MW in 1988 for steam turbines and from 265 MW to 1,250 MW in the case of hydro (Table 13). Between 1978 and 1988, the number of electricity consumers more than doubled from 1.0 million to 2.6 million (Table 14). Domestic users account for as much as three-quarters of the total number, followed by commercial consumers. The mining sector is the least user of electricity. This is the result of the low price of tin during the mid-1980s. The current maximum demand on the integrated system is 2, 720 MW. According to LLN's forecast, electricity demand will increase from 17,575
TABLE 13 LLN: Installed Generating Capacity (In megawatts)
Year
1970 1975 1980 1985 1986 1987 1988 SOURCE:
Steam Turbines
Hydro
Diesel
360 540 1,218 1,570
265 265 613 1,147
2,090 1,930 1,930
1,250 1,250 1,250
38 51 118 284 190 169 169
National Electricity Board.
Gas Turbines
Combined Cycles
180 260 280
600 900
280 280
900 900
Coal
Rural 12-Hour Supply
6 18 11 11
300
11
Total
663 855 2,135 3,879 4,721 4,540 4,840
Malaysian Energy Policy
93
----··-------·
TABLE 14 Electricity Consumers by Type Public Year
Domestic
Commercial
Industrial
1978 1979
846,801
161,069
948,228
174,315
1980 1981
1,062,679 1,180,866
1982 1983
Mining
Lighting
Total
3,132
76
1,749
1,012,827
3,199
66
1,827
1,127,635
191,059 204,175
2,830 2,993
59 61
1,850 2,033
1,258,477 1,390,128
1,316,127
216,351
2,962
58
2,149
1,537,647
1,548,599
250,649
4,175
1984
1,687,594
270,033
2,820 3,009
1985
1,832,406
284,165
4,041 4,274
538 485 434
1,806,781 1,965,162 2,124,676
1986 1987
1,983,252 2,105,799
297,137
4,778
1988
2,242,831
308,495 322,812
5,158 5,745
271 237 227
3,936 4,443 5,199
SOURCE:
3,397
2,289,374 2,424,132 2,576,814
National Electricity Board.
Gwh in 1989 to 19,329 Gwh in 1990, and to 42,562 Gwh in the year 2000. This represents an average annual growth rate of 8.6 per cent from 1988 to 2000. The projected growth rates by different subsectors from 1985 to 2005 forecast in the World Bank's power sector study on Malaysia (1987) are shown in Table 15. TABLE 15 LLN's Forecast of Growth Rates in Electricity Demand (In percentage per annum) 1985-90
1990-95
1995-2000
2000-05
Residential Commercial Industrial Mining Public Lighting
8.8 4.7
7.4 5.5
6.4 5.7
5.7
8.0 3.0
7.9 3.0
5.3
8.7 3.0 4.2
3.5
2.8
TOTAL
6.6
7.2
6.9
6.5
SOURCE:
7.4 2.4
National Electricity Board.
4.6
94
Wan Leong Fee
RURAL ELECTRICITY Rural electrification programme in Peninsular Malaysia has constituted an important component of rural development to raise the standard of living of the rural poor since the 1950s. From a modest programme of transmission/distribution grid extensions or rural diesel stations, the number of rural households receiving electricity increased sixfold from 114,672 in 1970 to 697,825 in 1986 (Table 16). Current rural electrification programme is fully funded by the federal/state government, with the National Electricity Board (LLN) as the implementing agency. Current rural electricity projects can be classified broadly by the method of supply extensions into: 1. 24-hour supply from the LLN distribution grid; 2. 12-hour supply by the establishment of rural stations; and 3. 24-hour supply from mini hydro stations.
LLN's role in the selection and approval of rural electricity projects is restricted to the selection and approval of initial estimates and technical TABLE 16 Development of the Rural Electrification Programme, 1970-86 Year
No. of Households
No. of Villages
1970 1971 1972 1973 1974 1975 1976 1977 1978 1979 1980 1981 1982 1983 1984 1985 1986
114,672 125,575 149,372 175,993 210,010 205,123 223,686 246,178 292,644 351,181 410,453 423,147 475,842 549,250 601,475 649,679 697,825
1,223 1,411 1,766 2,033 2.400 2,451 2,667 2,938 3,583 4,344 5,088 5,330 6,157 7,395 8,181 8,865 9,649
SOURCE:
National Electricity Board.
Malaysian Energy Policy
95
advice. As the process of selection is based on political considerations and the equitable distribution of funds, a more integrated and systematic planning and extension of the distribution system is often not possible. Under the Fourth Malaysian Plan, a total of M$639.09 million was approved by the federal/state governments to supply electricity to 297,724 rural households. For the 1986-87 period, an estimated M$203.72 million was approved for 66,236 households distributed over 876 villages. The electrification level of rural households was assumed to increase from 70 per cent in 1985 to 100 per cent in 2005. The National Energy Planning Study (NEPS) estimated the cumulative investment requirements at M$1,819 .2 million (in 1980 prices) compared to the LLN estimate of M$1,888.9 million for the period 1986-2000. This difference of 4.4 per cent is due to LLN's assumption that the number of households to be electrified between 1986 and 1990 would be lower than for the five years thereafter owing to constraints on the state budget in financing rural electrification. The NEPS's cost estimate of rural electrification in Peninsular Malaysia is shown in Table 17. The estimated capital expenditures for rural electrification for Penjnsular Malaysia, Sabah, and Sarawak are shown in Table 18.
Mini Hydro for Rural Electricity To accelerate the rural electrification programme and as a fuel diversification strategy after the 1970 oil-price escalation, high priority was assigned TABLE 17 NEPS Cost Estimate of Rural Electrification in Peninsular Malaysia (In constant 1980 prices) Period
Households Electrified during Period
Cost in M$ (million)
1986-90 1991-95 1996-2000 2001-05 2006-10
221,300 275,350 184,700 135,950 50,000
590.9 735.2 493.1 363.0 133.5
TOTAL: 1986-2010
867,300
2,315.7
SOURCE: Economic Planning Unit (1985).
96
Wan Leong Fee
TABLE 18 Malaysia: Capital Expenditure for Rural Electrification by Utility, 1991-2010 (In 1980 M$ millions) Utility
1991-95
1996-2000
2001-05
115.5
2006-10
Sa bah Sarawak Peninsular Malaysia
135.8
166.9
22.0
217.8
235.0
31.8
31.8
635.4
423.6
363.0
133.5
TarAL
968.7
794.4
561.7
187.3
SOURCE:
National Electricity Board.
to the development of mini hydro resources. In 1982, twenty-two pilot mini hydro projects were identified for implementation in Peninsular Malaysia, in the states of Kelantan, Trengganu, Pahang, Kedah, Perak, Negeri Sembilan, and Johore. Approximately M$51.3 million was allocated to benefit 18,675 rural households. The total installed capacity is about 6,225 kW, with the unit sizes ranging between 25 kW and 1,870 kW, as shown in Table 19. TABLE 19 Mini Hydro Pilot Projects Installed Capacity State
(kW)
Kedah Perak N. Sembilan Johore Pahang Trengganu Kelantan TarAL SOURCE:
No. of Projects
No. of Consumers
Estimated Cost (M$ million)
438
4
1,314
7.80
1,495
8
4,485
14.50
100 25
2 1
300 75
1.68 0.93
1,404
3
4,212
9.27
893
2
2,679
6.99
1,870
2
5,610
10.13
6,225
22
18,675
51.30
National Electricity Board.
Malaysian Energy Policy
97
Under the Fourth Malaysian Plan, emphasis was given to accelerate the mini hydro programme. A total of eighty-two schemes were identified which were approved by the government for implementation at an estimated cost of M$220 million for an installed capacity of 33 MW. This would benefit 24,000 consumers in addition to improving the existing distribution system. The entire programme was originally scheduled for completion between 1983 and 1986 but was subsequently revised to 1988. Budget constraints led to further delay in the programme implementation, which is now divided into three phases. Phase 1, completed in December 1987, involved sixteen schemes at a cost of M$49.10 million, as shown in Table 20. In evaluating the targets achieved in Malaysia's rural electrification programme, the percentage of rural households receiving electricity is used as a rough guide. Even then, the problem of urban/rural dichotomy is further compounded by the failure of LLN in maintaining the record of rural/urban households electrified over time. Using the definition of rural area as an administrative unit with a population of less than 10,000 in the 1980 Population and Housing Census of Malaysia (Department of Statistics), the rural population for the base year 1980 was estimated by subtracting the urban population from the total population. The annual population growth rate was next determined. Based on this growth rate, the rural population was projected annually up to the year 2000. Using TABLE 20 Phase I Mini Hydro Projects, Peninsular Malaysia Cost M$ million Installed Capacity (kW)
No. of Projects
Kedah Perak Selangor Pahang Trengganu Kelantan
1,365 2,285 1,120 620 710 1,455
3 5 1 2 2 3
TarAt
7,555
16
State
*Includes Norwegian grant of US$4.95 million. US$1.00 = M$2.57 SOURCE: National Electricity Board.
No. of Consumers
Local
Foreign
Total
620 510 1,050
6.30 8.28 1.43 2.84 4.82 8.84
2.44 4.86 0.39 1.28 2.26 5.36
8.74 13.14 1.82 4.12 7.08 14.20
3,452
32.51
16.59*
49.10
941 331
98
Wan Leong Fee
-------------------
the national average family size of 5.5, the number of rural households was determined. From the 1980 housing census of the Department of Statistics, the number of rural households with electricity in 1980 was used as the base data. Table 21 shows that the percentage of rural area electrified in 1980 was 66.35 per cent, which increased to 79.43 per cent during the Fourth Malaysia Plan. An average family size of 5.5 and constant population growth rate at 1.13 per cent were assumed in the projection. REFINERY MIX In the face of world decline in oil prices since the mid-1980s, government policy in energy supply has been to: 1. step up oil production to maintain the level of export earnings needed to finance economic development; and 2. expand refinery capacity and upgrade existing facilities to reduce the dependence on crude oil processing in Singapore.
The total installed refinery capacity in 1987 was 215,000 barrels per day. Efforts are underway to increase the maximum capacity of the Petronas Kerteh refinery from 30.0 kbd to 32 kbd in 1988. Heavy dependence on TABLE 21 Peninsular Malaysia: Rural Electricity under the Fourth Malaysia Plan and Projected Growth in the Fifth Plan
Year
1980 1981 1982 1983 1984 1985 1986 1987 1988 1989 1990 SOURCE:
Rural Population
Rural Households
No. of Rural Consumers
Rural Electrification
('OOO)
('000)
('000)
(%)
7,025.6 7,104.8 7,184.8 7,266.1 7,348.1 7,431.0 7,514.8 7,599.6 7,685.3 7,772.1 7,859.7
1,277.4 1,291.8 1,306.4 1,321.1 1,336.0 1,351.1 1,366.3 1,381.7 1,397.3 1,413.1 1,429.8
847.5 902.2 969.1 1,023.0 1,057.2 1,073.2 1,118.3 1,163.4 1,208.6 1,253.7 1,298.9
66.35 69.84 74.18 77.44 79.13 79.43 81.85 84.20 86.49 88.72 90.89
Fifth Malaysia Plan, 1986-90.
Malaysian Energy Policy
99
imported crude from the Middle East has been reduced from 74 per cent of total refinery crude intake in 1978 to 21 per cent in 1987 (Table 22). Similarly, a significant shift from heavy to lighter distillates in refinery output has taken place, such that the share of fuel oil has decreased from 43 per cent in 1978 to 26 per cent in 1987 while the share of diesel has increased from 27 per cent to 33 per cent to become the largest component of refinery output mix (Table 23).
TABLE 22 Conversion in Refineries (In thousand tonnes of oil equivalent) 1978
1980
1982
1984
1986
1987
1988
INPUT: Crude Oil* Share of Imported Oil (%)
5,847 73.8
5,901 70.3
5,435 52.5
7,721 31.6
7,549 22.6
7,806 19.7
8,449 16.0
OUTPUT: Total Petroleum Products
5,735
5,693
5,275
7,608
7,523
7,706
8,088
*Includes about 5 per cent non-crude refinery intake from 1986. SOURCE: Ministry of Energy, Telecommunications and Posts (1989).
TABLE 23 Refinery Output of Selected Petroleum Products (In percentages) 1978
1980
1982
1984
1986
1987
1988
Fuel Oil
43.2
39.6
29.5
26.9
26.1
26.1
26.9
Diesel Oil
27.4
30.7
36.4
33.4
32.0
32.4
33.7
Motor Petrol Kerosene
17.1
16.4
18.0
15.9
16.2
16.6
17.1
4.1
4.1
5.4
10.7
9.2
9.0
7.6
ATF
2.7
3.8
4.9
3.4
4.2
3.8
3.6
LPG
2.0
1.5
1.6
1.9
1.7
1.6
1.9
SOURCE: Ministry of Energy, Telecommunications and Posts (1989).
100
Wan Leong Fee
INSTITUTIONS FOR ENERGY PLANNING AND DEVEWPMENT Malaysia's energy planning is structured on a three-tier framework. At the apex of the hierarchy is the Cabinet Committee on Energy, with various supporting ministries and energy-related agencies in the organizational structure (Figure 1). 1. Cabinet Committee on Energy Energy policy-making is centralized in the Cabinet Committee on Energy with the Prime Minister as its Chairman supported by the official level of the Implementation and Coordination Committee on Energy. Final decisions on all energy issues, policies, and guidelines are made by the Cabinet Committee on Energy. The Implementation and Coordination Committee on Energy, comprising the heads of institutions concerned, is entrusted with the evaluation of energy plans (for example, Malaysia's National Energy Planning Study, the National Energy Balances) before the final decision of the Cabinet Committee. The Energy Unit of the Ministry of Energy, Telecommunications and Posts acts as the secretariat. Three important planning, implementation, and coordinating bodies are directly under the Prime Minister's Department: the Economic Planning Unit, the Petroleum Development Unit, and the Nuclear Energy Unit. (a) Economic Planning Unit (EPU) The EPU is responsible for the coordination of all national economic planning. It has two divisions, one of which is the sectoral planning division. Two sections of the sectoral planning division deal with energy planning: the Commerce and Industry section is involved with all sectoral energy projects outside the power subsector (e.g. oil refining), while the Infrastructure and Utilities section manages power-related matters. (b) Petroleum Development Unit (PDU) Within the Implementation and Coordination Committee, PDU is primarily responsible for monitoring the functions and activities of Petronas and other agencies in the petroleum and gas industry. (c) Nuclear Energy Unit The Nuclear Energy Unit has a similar function in the nuclear subsector, directly responsible to the Prime Minister, like the PDU. 2. At the ministry level, energy policies are under the portfolio of various ministries:
FIGURE 1 Institutional Structure of Malaysian Energy Planning and Development
L_ __ ,-~~~__j-
Prime :viinister's Department
-,-------1-
~oleum--l
~---J
Development
L _lJ_I1lt_____j
~
Ndtiondl
I
Electncitv Bodrds -l
lllLN S~B~
_ _J
.----e---
~"MJ
Geological I S~rvey L__':'_ept _j
I
LLN
MIDA PO RIM
National Electricity Board Malaysian Industrial Development Authority Palm Oil Research Institute Malaysia
SEB SESCO SIRIM
Sabah Electricity Board Sarawak Electricity Supply Corporation Standards and Industrial Research Institute of Malaysia
102
Wan Leong Fee -----~~~~~~
-----
----
------
(a) The Ministry of Energy, Telecommunications and Posts prepares national energy balances and coordinates power-sector planning, with the National Electricity Board (NEB or LLN), the Sabah Electricity Board (SEB), and the Sarawak Electricity Supply Corporation (SESCO) directly responsible to the Minister; (b) The Ministry of Trade and Industry has a Domestic Trade Division which is responsible for energy pricing, oil price control, and subsidies on petroleum products; (c) The Ministry of Science, Technology and Environment deals with environmental pollution in energy use; (d) The Ministry of National and Rural Development has a special function in the implementation of rural electrification programme with technical assistance from LLN; (e) The Ministry of Primary Industries and the Ministry of Finance are involved in energy pricing and the financing of energy projects respectively; (f) Petronas, Malaysia's National Oil Corporation, has a unique function in the oil/gas subsector. It is entrusted with the exclusive rights in the ownership and operation of the nation's oil and gas resources under the 1974 Petroleum Act. It is directly responsible to the Prime Minister, like the other ministries. 3. Public energy sector agencies such as the NEB, SEB, SESCO, Department of Mines, Geological Survey Department, and the Institute of Forest Research, which implement programmes, as well as other agencies involved with research and development. This brief overview of the institutions in Malaysian energy planning and development does give the picture of a complex and fragmented sectoral planning organizational structure. For more effective coordination of the diverse agencies and ministries, integrated energy planning has been proposed by the National Energy Planning Study. The creation of an Energy Planning and Coordination Unit (EPCU) within EPU has been recommended. The recent move to privatize the Telecommunication Department and the proposed privatization of LLN is a recognition of the cumbersome planning structure in the public energy sector. In the same vein the myriads of agencies, units, and subsidiaries set up by Petronas in oil/gas exploration, production, and marketing tend to replicate the monolithic structure that has long burdened Malaysian energy planning.
Malaysian Energy Policy
103
MALAYSIA'S ENERGY POLICY It is not too much a generalization to assert that Malaysia's energy policy is gas-based and oil-predominant, although the government has emphasized on a four-fuel strategy - oil, natural gas, coal, and hydro. For the next two decades, Malaysia will be preoccupied with the completion of the three-phase Peninsular Gas Utilization Project and the timely implementation of the Bakun hydroelectric project in Sarawak. The crucial issues in energy policy will focus on the economic cost of natural gas and its pricing, power sector development, demand management, and conservation. The prospects of oil and gas trade and refinery development will feature prominently in the long-term energy planning programme in the year 2000. We shall discuss each of these issues in the light of changing domestic and international energy market conditions.
THE FOUR-FUEL STRATEGY The shift away from oil both as a major source of export revenue and domestic fuel to other indigenous energy resources crystallized into what is known as the "four-fuel" diversification strategy as the collapse of the primary commodity prices and slump in oil price worldwide in the mid-1980s affected the Malaysian economy adversely. The high economic growth rate of the 1970s and early 1980s slipped to zero rate in 1986 as the national debt multiplied threefold between 1980 and 1984. External borrowings were used to finance capital-intensive industrial projects in the face of revenue constraints as the oil price fell below US$10 per barrel in 1986. Rising energy consumption associated with economic growth makes further inroads into the diminishing oil reserves for financing economic development. The abundant natural gas offshore Malaysia and the vast potential of hydro and limited coal in Sarawak offer attractive options to the hitherto dependence on oil. Energy diversification becomes the magic catchword of panicky planners, and the path is set for a four-fuel strategy from the 1980s, even though oil and gas are by and large still the ace in the current development programme of Malaysia's energy resources.
NATIONAL ENERGY PLANNING STUDY (NEPS) In 1986 the NEPS projected an average annual growth rate of slightly above 6 per cent in total final energy consumption over the period 1985-2010. The share of petroleum products in final energy demand is expected to
104
Wan Leong Fee
decline to 55 per cent by 2010. Natural gas and electricity will be the fastest growing sectors, reflecting the importance of planning expansion of the gas and electricity sectors. The industrialization programme in Malaysia should lead to a considerably larger share of the manufacturing sector in total final energy demand, from 33 per cent in 1980 to 46 per cent in 2010. Fuel oil demand by the manufacturing sector is estimated at 87 per cent in 2010. Electricity share will increase from 43 per cent in 1980 to 58 per cent in 2010. About 95 per cent of the natural gas will be needed by the manufacturing sector in 2010. On energy supply, it is estimated that the share of petroleum products in final use will decrease from 70 per cent in 1980 to 58 per cent in 2010. Malaysia will still be a net energy exporter until the year 2005. Rapid expansion of the electric power sector is expected, at an average annual growth rate of 7.3 per cent for the period 1985-2010. The least cost analysis of the future power system expansion indicates that gas can play an important role for power generation and fuel diversification. Since gas competes with coal and hydro, and in the long run with nuclear, the pricing of natural gas to the power sector will be the crucial variable in determining gas utilization for power generation. EXPIDRATION AND DEVEIDPMENT The petroleum resources of offshore Malaysia are distributed over six sedimentary basins within a broad and shallow continental shelf. The Malay basin and the Penyu basin (Figure 2), located off the east coast of Peninsular Malaysia, produce both oil and gas currently. The hydrocarbon basins of Sabah and Sarawak are found to the north-west of the two states, off the island of Borneo. The Sabah basin contains mainly matured oilfields, while the Sarawak basin consists of matured oil and gas fields. The Sulu basin is located off the north-east coast of Sabah and is currently at exploration stage. The Tarakan basin is mainly in Indonesia, although part of it is found on the east coast of Sabah. This basin is primarily an oil province. Off the 414,000 square km of prospective continental shelf, only 20 per cent has been explored. Oil exploration in Malaysia began in 1910 when the Royal Dutch/Shell group of companies discovered oil onshore at Miri in Sarawak. This success was followed by the discovery of the first offshore field - Baram in Sarawak in 1964 - and other oil and gas fields off Sarawak and Sabah. At present, three major producing areas off the west coast of Borneo are operated by Shell. A pipeline links the oilfields off Sabah to the terminal
FIGURE 2 KAMPUCHEA
c·,.---·
,/"'"'.J
VIETNAM
MALAYSIA SEDIMENTARY BASINS
LEGEND KALIMANTAN (INDONESIA)
INTERNATIONAL BOUNDARY - - - -
200m BATHMETRY
c=:J CONTINENTAL SHEL
SOURCE: Nordin Ramli, "The History of Offshore Hydrocarbon Exploration in Malaysia", Energy 10, nos. 3/4 (1985): 457-73.
106
Wan Leong Fee
at Labuan Island, while the Miri terminal is fed by other oilfields off Sarawak. Shell also operates gas fields at Lauconia that provide feedstock for the LNG plant at Bintulu. In Peninsular Malaysia, the major exploration and development area is located offshore Trengganu where some of the largest oil and gas fields are located - the Duyong with estimated reserves totalling 100 million barrels; the Tapis field; and the Seligi field which started production in December 1988 with a production capacity of 180,000 b/d crude, potentially the largest oilfield yet to be discovered in Malaysia. PETRONAS - MALAYSIA'S NATIONAL OIL CORPORATION Under the Petroleum Development Act of October 1974, the national oil corporation of Malaysia - Petroliam Nasional Berhad (Petronas) - was incorporated and vested with the exclusive rights to own and develop oil and gas resources in Malaysia for the benefit of Malaysians. All companies undertaking exploration in Malaysia are required to enter into productionsharing contracts (PSCs) with Petronas. The Petroleum Development (Amendment) Act, 1985 further confers on Petronas the right to enter into any commercial activity or undertaking beyond the area of petroleum resources. Production-sharing agreement was signed in 1976 between Petronas and Shell when its first offshore field at West Lutong in Sarawak went onstream, and with Esso whose first production well commenced in 1974 at Tembungo, offshore Sabah. By mid-1977, Shell was operating six fields offshore Sarawak and one offshore Sabah. In early 1978, Esso's two fields - Pulai and Tapis - offshore Kuala Trengganu in Peninsular Malaysia, began production. These three areas turn out to be the largest producing fields. By 1980, fourteen fields were in production, and a total of 61,176 km were explored. Petronas, through its wholly owned subsidiary Petronas Carigali, began drilling off Trengganu in August 1980 with five exploration and appraisal wells and an exploration programme over 19,166 square km offshore Peninsular Malaysia. PRODUCTION-SHARING AGREEMENTS Modelled on similar concept in Indonesia, the oil companies that undertake exploration become the contractor that assumes exploration risk in a development programme approved by Petronas. The contract provides for 20 per cent cost recovery for oil and 25 per cent for gas, profit split
Malaysian Energy Policy
107
up to 70:30 in favour of Petronas. In addition, a royalty of 10 per cent of production is deducted as cash payment split between the federal and state governments. These terms were considered harsh and led to the withdrawal of Conoco in 1978. In December 1985, the government of Malaysia decided to relax the PSC terms in order to encourage more explorations from foreign oil investors in the face of strong competition from Indonesia and China. Cost recovery provisions were raised to SO per cent of oil sales and 60 per cent for sales of non-associated gas. The profit split between Petronas and the contractor was revised to 50:50 for the first 10,000 b/d, 60:40 for the next 10,000 b/d, and 70:30 in favour of Petronas for oil production exceeding 20,000 b/d. For gas fields, the first 2 tcf is split 50:50 between Petronas and the contractor. Beyond 2 tcf, the previous profit split of 70:30 is retained. The revision in the PSC terms received favourable response from oil companies. In 1988, Petronas was able to conclude ten new productionsharing contracts, the largest number of contracts signed in a year in the history of Malaysian petroleum industry. In the downstream sector, domestic refineries processed at the rate of 159,948 b/d of crude oil, an increase of 4.7 per cent from the 1987 level. The Petronas refinery at Kerteh processed 29,973 b/d of crude oil in 1988, a decrease of 3 per cent over 1987. Crude oil processing at the other three refineries at Port Dickson and Lutong increased by 6 per cent to 129,975 b/d. Substantial progress has been made to construct Petronas's second refinery at Tangga Batu, Melaka, which has a refining capacity of 100,000 b/d.
PETROLEUM PRODUCT PRICING, SUBSIDIES, AND TAXATION The pricing of oil and gas in Malaysia is linked to the international oil and gas markets, subject to periodic intervention by the Ministry of Trade and Industry in the case of petroleum products. Both kerosene and diesel have been heavily subsidized from 1973 until their removal at the end of 1983, which was then offset by the excise duties levied on the export of gasoline. Malaysian crude oil prices have commanded a higher premium over the Arabian light (34 degree) on account of its low-sulphur content. Malaysian crude oil prices jumped from US$2.36 in 1971 to a peak of US$34.00 in 1981, followed by a decline thereafter in line with the declining trend in world oil prices, as shown in Table 24.
108
Wan Leong Fee
TABLE 24 Oil Prices: Malaysian Crude Versus Arabian Crude Year
Malaysian Crude
Arabian Crude
(US$ per barrel) 1971 1972 1973 1974 1975 1976 1977 1978 1979 1980 1981 1982 1983 1984 1985 1986 1987 1988 SOURCES:
2.36 2.71 3.95 11.89 12.41 12.67 14.10 14.23 27.50 36.10 37.90 37.30 30.81 29.88 19.61 14.72 13.83 15.25
1.91 2.48 3.01 10.46 11.51 11.51 12.08 13.33 24.00 32.00 34.00 34.00 29.00 29.00 28.08 28.00 17.52 17.52
Lucas et al. (1987); Idemudia (198'1).
The major petroleum products consumed in Malaysia are gasoline, diesel, kerosene, and fuel oil. Price increases in Arabian, Kuwait, and domestic crudes during the 1970 oil crises have led to upward revision in domestic retail prices of gasoline. The licensing of gasoline, diesel, and kerosene as controlled items in 1974 and the provision of subsidies for diesel and kerosene are reflected in the widening of price differentials as shown in Table 25. NATURAL GAS DEVEIDPMENT STRATEGIES The development of natural gas in Malaysia is concentrated in four gas "districts": Kerteh in Trengganu on the east coast of Peninsular Malaysia; in Bintulu and Miri, both in Sarawak; and on the Labuan Island in Sabah.
Malaysian Energy Policy
109
TABLE 25 Petroleum Product Prices (M cents per litre)
Jan 1978 Jul 1978 Jan 1979 Jul 1979 Jan 1980 Jul 1980 Jan 1981 Jul 1981 Jan 1982 Jul 1982 Jan 1983 Jul 1983 Jan 1984 Jul 1984 Jan 1985 Jul 1985 Jan 1986 Jul 1986 Jan 1990 Jul 1990
Petroleum Gasoline
Regular Gasoline
Medium Fuel Oil
Kerosene
Diesel
74.25 74.25 76.55 76.55 76.55 88.82 88.82 107.78 107.78 107.78 107.78 104.00 106.00 106.00 107.00 114.00 111.00 93.00 103.00 102.00
66.00 66.00 69.19 69.19 69.19 84.03 84.03 102.07 102.07 102.07 102.07 98.00 100.00 100.00 101.00 107.00 103.00 85.00 94.00 95.00
n.a. n.a. n.a. n.a. n.a. n.a. n.a. n.a. n.a. n.a. n.a. 42.90 45.80 46.00 n.a. 42.00 42.00 15.90 n.a. n.a.
18.10 18.10 22.20 22.20 22.20 33.70 33.70 46.20 46.20 46.20 46.20 46.20 58.60 61.90 63.20 66.20 63.70 50.90 61.00 59.30
25.96 25.96 26.40 26.40 26.40 35.63 35.63 46.10 46.10 46.10 46.10 46.20 58.60 57.50 58.30 61.40 58.40 45.50 53.00 54.00
SouRCES: Ismail (1987); Petronas (1990).
Until1980 two-thirds of the associated gas produced was flared. By 1984, flaring of gas was reduced by half through reinjection. By 1985, flaring was limited to 154 mmcf /d from a total of 1,400 mmcf /d of associated gas produced. This is the result of piping the natural gas for the LNG plant at Bintulu. Since the 1980s, substantial investments have been made to harness the previously flared gas for export as LNG or domestic use. The first gas project was started in Bintulu, Sarawak, where 1,150 mmcf /d of nonassociated gas is utilized to produce 6 million tons of LNG per year for export to Japan. Gas was also supplied to feed the ASEAN Bintulu Urea Plant. In 1985, the first phase of the Peninsular Gas Utilization (PGU) Project (Figure 3) was completed to pipe the offshore gas to the gas-
FIGURE 3 Gas Distribution System, Peninsular Malaysia
MALAYSIA
CON NAUGHT BRIDGE
LEGEND
uzzzn
Gas Ppaline Stage I
-
Gas Ppaline Stage Ill
~
16M /:).
Gas PP.,Iine Stage II
Power Stations Industrial Estates
SOURCE: PetroMin, October 1990 p. 60.
Duyong
Malaysian Energy Policy
111
----·-------
processing plant at Kerteh in Trengganu, an LNG export depot. A gas pipeline was constructed to supply gas to the nearby Paka 900 MW combined cycle power plant and the HICOM steel mill at the new Cukai deep-sea port. Phase II of PGU will supply gas through the peninsular pipeline to the south and west coast of Peninsular Malaysia and to Singapore. Eighty per cent of the gas will be supplied to a new 600 MW power station and converted oil-fired stations (totalling 1,500 MW). In Labuan, Sabah, associated gas is supplied to a 600,000 tons/annum methanol plant (55 mmcf/d), a 600,000 tons/annum hot-briquetted iron plant (20-30 mmcf/d), and a 47 MW power plant (8 mmcf/d). It is estimated that gas development will eliminate 90 per cent of fuel oil consumption for electricity genera'tion by 1990. Several fundamental issues in Malaysia's gas utilization strategies can be broadly summed up as follows: 1. What is the most economic use of gas? 2. Which market should gas be produced for, exports as LNG or domestic uses for power generation or industrial/domestic purposes? 3. How should the gas market function, under free-market condition or regulated by the government? Strategies to develop Malaysia's gas resources are influenced by several important factors: 1. Malaysia's gas reserves are not only large in size but are also located close to urban consuming centres. Over 80 per cent of the gas reserves are non-associated, and this provides options for future depletion of oil reserves. 2. The power sector uses 88 per cent of the final oil consumption. The pace of conversion from oil to gas by the power sector can be accelerated in order to save oil for export. 3. The drive for industrialization in an era of high technology implies that energy consumption will continue to rise in the coming decades. 4. With further industrial expansion and rural electrification, electricity has become the fastest growing energy sector. Power sector expansion thus provides tremendous opportunities to substitute gas for oil in line with the government's energy diversification policy. In assessing the strategic options available for Malaysia's energy policy of diversification from oil to gas, the NEPS examined three options: unconstrained gas development, diversification, and self-sufficiency. In the first option, gas development is permitted to reach its maximum capacity
112
Wan Leong Fee
with no consideration for hydro development in Sarawak and the use of imported coal. The options of diversification and self-sufficiency would constrain gas development to the maximum pipeline capacity of 560 mmcf /d on the west coast of Peninsular Malaysia while providing scope for the increased use of hydro and coal. NEPS is in favour of the diversification strategy as it is consistent with the government's "Four-Fuel Policy" in developing the economy's resources on a mixture of oil, gas, hydro, and coal. GAS PRICING Changes in domestic and global energy environments have since altered the policy options proposed by NEPS. In the gas sector, the costs of gas development are known to be relatively low. Such information was not available at the time the NEPS was undertaken. In the world energy market, continued decline in oil prices implies that domestic investment in hydro resources becomes more costly. Furthermore, Malaysia's mounting national debt with continued low oil prices imposes constraints on major infrastructure investments. A review of Malaysia's power sector development strategy was undertaken by the World Bank mission in 1985. The interdependence between the power sector and the natural gas sector and hydro development is considered in toto. Natural gas provides low-cost energy for future power expansion, while the power sector acts as the major base-load consumer of gas. Gas penetration in the industrial sector in Peninsular Malaysia depends on the completion of the PGU which will serve the major industrial areas of the Kelang Valley and Pasir Gudang in Johore Bahru. The pricing of natural gas will crucially determine the extent of gas utilization in Peninsular Malaysia. Fuel demand in Peninsular Malaysia is projected to rise to 886,000 tons oil equivalent per annum in 1995, according to the NEPS study. For natural gas to be competitive with coal, it has to be priced as low as M$7.00-7.50 per million BTU. Given this competitive price, natural gas can increase its share from 16 per cent in 1995 to 26 per cent by year 2000. The substitution of fuel oil by pipeline gas in the industrial sector is estimated in Table 26. The pricing of natural gas at the moment is still in the discussion stage. Interim gas prices, however, have been set by the government at M$6.30 per mcf (US$2.50) for gas sales from Petronas Gas Sdn Bhd (PGSB), the wholly owned subsidiary of Petronas, to NEB at Paka power station.
Malaysian Energy Policy
113
TABLE 26 Substitution of Fuel Oil by Pipeline Gas, 1995-2010 1995
2000
2005
2010
14,200
19,500
26,600
37,500
16
26
28
25
Gas Demand (mmcf /d)
16.4
38.3
60.1
82.0
Fuel Oil Demand after Gas Substitution (barrels per day)
11,400
13,000
16,400
23,600
Fuel Oil Demand (barrels per day)* Gas Market Share (%) * *
*After coal substitution. '*Related to fuel oil demand before coal substitution. SOURCE:
Petronas.
The economic cost of gas consists of not only its long-run marginal production and transmission costs but should incorporate a depletion premium (Wan 1989, Razavi 1988) that reflects the opportunity cost of extracting the gas resource today rather than tomorrow. The World Bank's study has indicated that the economic cost of dry gas on the east coast is estimated at M$2.30, M$2.50, and M$3.50 per mcf for 1986, 1995, and 2005, respectively. The economic cost of gas on the west coast of Peninsular Malaysia exceeds the cost on the east coast by M$0.80 per mcf, which is the cost of gas transmission from coast to coast. In evaluating the options between gas and the development of the large Bakun hydroelectric project in Sarawak, which has an installed capacity of 2,400 MW at an estimated cost of US$6.8 billion, the mission concludes that the Bakun project, though technically sound and among the lowest cost hydro projects in Malaysia, is not economically viable until the period between 2000 and 2005. CONSERVATION The energy conservation policy in Malaysia has yet to be effectively implemented although the policy to improve the efficient use of energy resources in the industry, building, and transport sectors has been initiated since the 1980s. In 1983, the Ministry of Energy, Telecommunications and
114
Wan Leong Fee -----··--------
Posts undertook an energy audit in fifteen commercial buildings in Kuala Lumpur, as a continuation of a similar exercise in industry carried out in 1982 with the assistance of United Nations Industrial Development Organization (UNIDO). In 1985, a review of energy conservation potential in Malaysia was carried out by the World Bank. This study analysed the benefits and costs of industrial energy conservation, the scope of fuel substitution, and the policy instrument necessary for the establishment of a National Energy Efficiency Unit. The UN/ESCAP study on the energy issues in the industrial sector focusing on the ceramic industry was further extended to the feasibility study on energy conservation in the palm-oil processing industry in 1987. A total of M$82 million have been invested in energy saving in the industrial sector from 1981-86 (Table 27). Under the Fifth Malaysian Plan, the establishment of a National Energy Conservation Centre as a separate institution to develop conservation policies and legislation was being considered. The imposition of heavier road tax on motor vehicles exceeding 1,500 cc, the provision of accelerated depreciation allowances for energy-saving capital equipment, and the programme designed for public awareness and training in energy conservation are among some of the measures taken. TABLE 27 Energy Saving Investments in the Industrial Sector in Malaysia (1981-86) Amount Invested (M$ million)
Total Number of Respondents
Cement Food Beverages Rubber Products Textiles Chemical Paper Metal Timber Fabricated Metal Others
44.80 12.23 2.00 1.28 3.70 4.90 0.24 10.08 0.03 0.33 2.40
5 29 9
TOTAL
81.99
Type of Industry
SOURCE:
Mokhtar and Hazri (1987).
Investing Companies (%)
9 33 95
100 79 55 54 53 48 42 40 33 32 37
241
47
13
14 12 11 11
Malaysian Energy Policy
115
- - - - ---------·----------
Environmental concern on lead pollution in the highly industrialized countries - the United States, Western Europe, Canada, and Japan - is receiving attention in the ASEAN countries. Malaysia has reduced the maximum lead content in gasoline from 0.84 gm per litre in the early 1980s to 0.15 gm per litre in 1990 (The Star, 28 October 1990). Similar measures have also been planned in Singapore and Indonesia (Petroleum News, September 1989). CONCLUDING REMARKS Malaysia's energy policy in the 1990s and beyond is likely to be further diversification from oil to natural gas, hydro, and coal. The Peninsular Gas Utilization project, while economically sound in utilizing a depleting resource that was flared for well over SO per cent before the 1980s, will have to depend critically on a yet untested domestic market, especially in the industrial sector, although the power sector has sufficient scope for electricity generation using gas rather than oil. Gas development will probably eliminate 90 per cent of fuel oil consumption for electricity generation in the 1990s. In the international market, large expansion of gas development for LNG is fairly restricted until the surplus supply capacity in LNG is overcome. The pricing of natural gas remains a crucial issue in domestic gas utilization, as a competitive gas price must reflect not only the economic cost but also a depletion premium for a depleting resource. There exists, however, tremendous potential in the production of petrochemicals, and it is in this area that long-term natural gas development must rely on. Given the environment of a booming ASEAN economy, the prospect of large-scale hydro resource development as typified by the Bakun project in Sarawak must await further regional cooperation in energy resource development and utilization, including the joint development of natural gas resources of Thailand, Malaysia, and Indonesia, to the mutual economic interest of the ASEAN countries. ASEAN economic cooperation in energy resource development may perhaps be crystallized in the linking of the existing and planned pipelines in Malaysia, Thailand, and Indonesia into the proposed TransASEAN gasline, the feasibility of which ASCOPE, at the Bangkok meeting in 1988, had agreed to study. Finally, the complex and fragmented energy planning structure in Malaysia requires some forms of institutional innovation. While integrated energy planning has an edge in long-term national energy planning, the creation of another monolithic organization should be avoided. Private
116
Wan Leong Fee
participation in energy planning, including researchers and academicians in institutions of higher learning, must be assigned a rightful place. This must also extend to environmental planning and effective enforcement of environmental regulations that are sadly lacking in the past decades.
REFERENCES Danker, Millicent and Lisa Totto. Malaysia - An Energy Sector Study. Honolulu: Energy Program, Resource Systems Institute, East-West Center, 1988. Department of Statistics, Malaysia (various issues). Malaysia: Annual Statistics of External Trade. Economic Planning Unit, Prime Minister's Department. National Energy Planning Study. Government of Malaysia. Kuala Lumpur: 1985. Government of Malaysia. Fifth Malaysia Plan 1986-1990. Kuala Lumpur: Government Printer, 1986. Idemudia, Taiwo. "OPEC and the International Market: Continuity and Change in the 1990s". OPEC Review XIII, no. 2 (1989): 111-29. Ismail bin Mustapha. Energy Conservation Policy and Measures for Energy Management in Malaysia. Kuala Lumpur: Ministry of Energy, Telecommunications and Posts, 1987. Lucas, Nigel J.D. et al. Energy Policies in Asia: A Comparative Study. Singapore: McGraw-Hill Book Company, 1987. Malaysia Energy Outlook Towards 2005. Paper presented at the Malaysia National Committee World Energy Conference, Kuala Lumpur, 1986. Ministry of Energy, Telecommunications and Posts. National Energy Balances Malaysia, 1978-88. Kuala Lumpur, December 1989. Ministry of Finance. Economic Report 1989/90. Kuala Lumpur, 1989. Mokhtar, Hamdan and Ahmad Hazri Abdul Rashid. "Energy Conservation Potential in Malaysian Industry". Paper presented at the ASEAN-EC Energy Conservation Seminar, Bangkok, 14-18 December 1987. National Electricity Board. Annual Report, various issues. Oil and Gas Journal, 19 December 1989, p. 20. Petroleum News, various issues. Petromin, October 1990. Petronas. Nada Petronas. Various issues. Razavi, Hossein. Summary of Gas Pricing Issues. Washington D.C.: World Bank, 1988. Wan Leong Fee. "Economics of Natural Gas in ASEAN Energy Diversification". Paper presented at the International Symposium on the Development and Management of Energy Resources, Manila, 23-26 January 1989. ____ .Natural Gas Pricing: A New Perspective. Proceedings of ASCOPE 89, Singapore, 14-16 November 1989, pp. 497-502. ____ . "ASEAN Energy Investment Strategies in the 1990s". Paper presented at Energy '90, Manila, 23-26 January 1990. World Bank. Malaysia Power Sector Issues And Options. Washington D.C., 1987.
v PHILIPPINE ENERGY POLICY AND PROBLEMS IN A CHANGING WORLD Teodoro M. Santos
E
nergy is a vital factor which determines the well-being of a society. This is so because the use of energy such as electricity, along with appropriate devices, for example, electric washing machines, permits a person to be many times more productive than when he does not use such energy. Consequently, it is generally presumed that, everything else being the same, the wealth of a society correlates positively with its per capita energy consumption, the higher the consumption the wealthier the society. Owing to the critical role that energy plays in a country's economy, it is necessary to have a steady, reliable, and reasonably priced energy supply. Any disruption in supply or sharp increase in energy prices causes serious economic dislocations with attendant sufferings of the people, as experiences during the 1970s and early 1980s have shown. For this reason many governments have evolved energy policies designed to protect their societies against the ills engendered by disruption in energy supply or by unpredictable price spirals. Such policies include the management of energy demand, supply, and prices. When a sharp increase in energy prices occurs, massive wealth transfer takes place, aggravating the country's balance of payment problem and poverty, particularly in a developing country such as the Philippines. This chapter sketches the energy supply and demand situation in the Philippines during the 1970-88 period with the objective of identifying important problem areas along with the policies that evolved. In particular the problems implied by the aspiration of national leadership to transform the country into a newly industrializing economy (NIE) by the year 2000 are also examined. 117
118
Teodoro M. Santos
ENERGY DEMAND Under this heading are presented the aggregate energy consumption in the Philippines during the study period, the energy forms that comprised such aggregate, as well as the sectoral or industry source. The breakdown of consumption by economic sector and industry is also addressed. The interaction between energy consumption and the economy is also presented, together with conservation.
Total Energy Consumption Based on the occurrence of certain politico-economic events, the following periods are important to note in understanding the evolution of the Philippines' energy consumption: 1. period before 1973, characterized by generally low and relatively stable oil prices; 2. 1973-78, characterized by quadrupling of oil prices; 3. 1979-82, characterized by the second oil crisis; 4. 1983-87, characterized by generally declining oil prices, deep economic recession, and particularly by the emergence of a new political order in the country; and 5. 1988-present, characterized by gradual increase in oil prices, under a new political environment. A general picture of energy consumption during the 1974-87 period appears in Table 1. Total energy consumption grew from 75.185 million barrels of fuel oil equivalent to 99.353 million barrels in 1987. To emphasize the country's thrust for energy self-reliance, the forms of energy consumed are classified into imported and indigenous. It is evident that imported oil had been dominant during the period though its share in overall consumption declined from 80.1 per cent in 1974 to 51.3 per cent in 1985, then increased to 59.6 per cent in 1987. This is mainly the result of high prices, substitution by other energy forms, conservation efforts, and declining or negative economic growth rates during the 1974-85 period. The subsequent increase can be ascribed to a considerable decline in oil prices. Imported coal made its first appearance only in 1983, but it exhibited a dramatic annual growth rate of 31.41 per cent during the 1983-87 period. Under the indigenous category, consumption of which increased from 14.959 million barrels of fuel oil equivalent in 1974 to 37.469 million barrels in 1987, the most important forms of energy consumed are agriindustrial wastes, hydro, geothermal, coal, bagasse, and oil. Note that
TABLE 1 Energy Consumption (In thousands of barrels of fuel oil equivalent) Average Annual Growth Rate in% (1974-87)
1974
1975
1976
1977
1978
1979
1980
1981
1982
1983
1984
1985
1986
1987
IMPORTED ENERGY Oil % of Total Primary Consumption Coal
60,226 60,226
64,930 64,930
66,755 66,755
72,709 72,709
75,344 75,344
70,504 70,504
69,454 69,454
67,162 67,162
65,251 65,251
64,448 63,541
54,668 52,641
51,491 47,277
51,934 49,760
61,884 59,179
0.20 -0.13
80.1
81.8
79.6
81.0
80.0
72.4
71.7
71.9
68.4
64.5 907
56.1 2,027
51.3 4,214
53.3 2,174
59.6 2,705
31.41
INDIGENOUS ENERGY Oil Coal Hydro Geothermal Bagasse Agri-Industrial Waste
14,959
14,422
17,123
17,022
18,791
177 3,842
368 3,645
427 4,553
7,372 3,568
6,427 3,982
7,545 4,598
908 3,343 2 7,585 5,184
75,185
79,352
83,878
89,731
929 4,645 5 6,410 6,802
26,916 7,177 815 4,798 1,064 6,351 6,711
27,421 3,508 955 5,938 3,501 5,897 7,601 21
26,312 1,373 905 6,384 4,747 6,224 6,339 340
30,211 2,952 1,110 6,653 6,245 7,352 5,821 78
34,024 4,652 2,631 5,116 7,029 5,476 9,055 65
39,107 3,540 3,645 9.100 7,813 6,571 8,245 193
40,585 2,410 3,836 9,607 8,533 4,361 11,633 205
41,350 2,853 4,022 10,374 7,891 4,091 11,648 471
37,469 1,752 4,078 9,001 7,813 3,452 10,807 566
7.30 -16.16 27.29 6.77 28.30 -5.66 8.90 1.51
94,135
97,420
96,875
93,474
95,462
98,472
93,775
92,076
93,284
99,353
2.17
Non-conventional
TOTAL ENERGY
NOTES: 1. Oil includes energy fuels only (avgas, avturbo, premium and regular gasoline, diesel, fuel oil, kerosene and LPG) and refinery fuel and loss. 2. Assume all loaded domestic crude (Nido, Cadlao, and Matinloc) converted to energy use. 3. Hydro and geothermal energy in terms of gross generation. 4. Non-conventional energy includes alcohol, coconut oil, and other technologies. SouRCE: Bureau of Energy Utilization (various issues).
120
Teodoro M. Santos - - - - - - - - - -
geothermal appears in a meaningful amount only in 1979, when oil appeared. It is significant to highlight the large increase in the aggregate consumption of indigenous energy forms, which grew at an annual rate of 7.30 per cent during the period, in contrast to the 0.20 per cent annual growth rate in imported energy. Geothermal and coal exhibited the most dramatic annual growth rate of 28.30 per cent and 27.29 per cent respectively, among the indigenous energy resources. The decrease in consumption of domestically produced crude oil reflects the abnormally high initial rate of extraction, and the limited potential to fulfil local energy requirements. The various products into which petroleum or crude oil are transformed for final consumption appear in Table 2. Fuel oil, diesel, premium and regular gasoline, avturbo, LPG, and kerosene are the most important petroleum products consumed. Note the low or even negative growth rates in the consumption of petroleum products during the period which can be attributed to the dramatic increase in oil prices and poor performance of the economy. The distribution of energy consumption among the major sectors of the economy is portrayed in Table 3. About 45 per cent of total consumption is accounted for by industry, 35 per cent by transport, mainly in the form of petroleum products, and 10-16 per cent by the residential! commercial sector. It is important to note that consumption by the residential/commercial sector increased from 10.2 per cent of total in 1973 to 15.8 per cent in 1985 as industry consumption decreased, respectively, from 48.3 per cent to 44.4 per cent, and transport from 37.6 per cent to 34.8 per cent, suggesting the rechannelling of oil consumption away from productive activities. Furthermore, the growth of electricity consumption in the residential/commercial sector is phenomenal, 8.4 per cent in 1973 and 20.2 per cent in 1985. The rapid growth of electricity consumption by the residential/commercial sector indicates problem areas in providing for energy supply, for it is likely that consumption by industries will dramatically increase when the economy recovers or grows according to aspiration. However, the policy to phase out subsidies to small electricity consumers which is gradually being carried out may dampen the growth of demand, though in a small way. A similar effect may be achieved by pricing electricity based on long-run marginal costs. Major industrial consumers of petroleum products are identified in Table 4. Power generation, steel/metal/nickel processing, mining, and cement were the top consumers in 1977. Note the very impressive decrease in consumption during the period, which reflects the effects of petroleum product conservation and substitution by other energy forms, particularly
TABLE 2 Petroleum Product Consumption (In thousands of barrels) Average Annual
Growth Rate 1973
1974
1975
1976
1977
1978
1979
1980
1981
1982
1983
1984
1985
1986
1987
in% ( 1973-87)
Solvents Lubes Waxes & Petrolatum
158 2,035 4,171 12,290 12,753 28,257 3,320 1,842 435 212 221 1,135 16
172 1,992 4,177 10,436 12,216 26.987 2,879 1.839 295 240 221 906 55
185 2,165 5,124 10,132 13,227 29,829 3,154 2,086 425 262 244 912 68
176 2,145 5,530 9,268 14,027 31,418 3,236 2,177 458 204 237 900 105
151 2,320 6,102 8,791 14,836 35,784 3,393 2,407 377 183 214 905 128
140 2,597 6,832 8,395 15,582 36,838 3,683 2,593 397 211 230 999 137
112 2,668 6,652 7,805 16,952 38,659 3,463 2,734 418 236 371 1,064 2
62 2,605 5,866 5,299 17,428 37,129 3,179 2,411 343 233 312 965 2
59 2,583 5,700 3,942 17,787 34,385 2,860 2.437 359 210 312 903 2
59 3,436 5,941 3,270 18,568 32,971 2,803 2,524 482 105 297 914 2
51 2,659 6,206 2,971 18,879 33,696 2,569 2.533 538 185 270 1,038 1
39 2,824 5,954 2,717 17,090 24,390 2,269 2,225 347 147 155 775 0
36 2,712 5,885 2,562 15,702 20,039 2,074 2,234 284 0 160 693 0
35 2, 716 6,334 2,806 16,223 21,511 2,273 2,464 295 0 200 731 0
35 3,304 7,054 3,090 17,850 26,033 2,545 2,977 278 11 243 876 0
-10.21 3.5 3.82 -9.39 2.4 -0.58 -1.88 3.49 -3.15 -19.00 0.68 -183 -17.97
TOTAl
66,845
62.415
67,813
69,881
75,591
78,634
81,136
75,834
71,539
71,372
71,596
58,932
52,381
55,588
64,837
-0.22
4,036
3,759
3,533
3,314
3,639
3,608
3,569
3,283
2,847
2,993
2,853
2,479
2,098
2,139
2,415
-3.6
Avgas Avturbo Premium Gasoline Regular Gasoline Diesel Fuel Oil Kerosene
LPG Asphalts Process Gas
Refinery Fuel and Loss
SocRCE: Office of Energy Affairs.
TABLE 3 Distribution of Total Energy Consumption among Major Sectors of Economy (In percentages) Sectoral Share of Final Energy
1973
1974
1975
1976
1977
1978
1979
1980
1981
1982
1983
1984
1985
Residential/Commerce Oil Coal Gas Electricity
10.2 6.9 0.0 0.9 3.3
12.2 7.9 0.0 0.0 4.3
11.7 8.0 0.0 0.0 3.7
11.6 7.8 0.0 0.0 3.8
11.7 7.7 0.0 0.0 4.0
13.0 8.0 0.0 0.0 5.0
12.3 7.4 0.0 0.0 4.8
13.3 7.4 0.0 0.0 5.9
13.7 7.3 0.0 0.0 6.4
13.9 6.8 0.0 0.0 7.1
14.0 6.5 0.0 0.0 7.5
15.5 6.8 0.0 0.0 8.7
15.8 6.4 0.0 0.0 9.3
Industry Oil Gas Coal Electricity
48.3 43.1 0.0 0.1 5.1
45.8 38.7 0.0 0.2 6.9
45.2 39.2 0.0 0.3 5.6
46.9 40.3 0.0 0.4 6.3
48.0 42.1 0.0 0.8 6.1
46.2 39.6 0.0 0.9 5.7
48.0 40.9 0.0 0.7 6.3
46.9 39.7 0.0 1.0 6.2
44.7 36.4 0.0 1.1 7.2
47.7 35.2 0.0 3.7 8.8
42.4 27.0 0.0 5.3 10.0
44.4 29.0 0.0 4.5 10.9
Transport
37.6
37.8
38.3
37.0
35.9
36.2
35.5
34.6
46.7 38.9 0.0 1.1 6.8 34.4
36.5
33.5
37.3
34.8
Others
0.1
0.4
0.1
0.1
0.1
0.4
0.3
0.9
1.0
1.1
0.9
1.3
1.6
Non-Energy
3.8
3.8
4.7
4.4
4.2
4.1
4.2
4.2
4.2
3.8
3.9
3.4
3.3
100.0
100.0
100.0
100.0
100.0
100.0
100.0
100.0
100.0
100.0
100.0
100.0
100.0
SOURCE: Asian Development Bank (1987).
TABLE 4 Energy Consumption by Selected Industry Sectors (In thousands of barrels of fuel equivalent) Average Annual Growth Rate in%
Industry
1977
1978
1979
1980
1981
1982
1983
1984
1985
1986
(1977-86)
Cement Sugar Coconut & Vegetable Oil Mining Power G{,neration Fertilizer Logging/Wood Products Paper Processing Lube Refining Textile Mills Land Transport Domestic Marine Domestic Aviation Fishing Trade Glass Manufacturing Steel/Metal/Nickel Processing Contractors Ceramics Rubber & Tyres Chemicals Tobacco Food Processing All Others Refinery Fuel & Loss
3,126.3 1,213.3 625.8 3,305.4 17,083.5 431.0 2, 961.8
3,405.6 1,106.2 639.8 3,355.9 18.227.9 394.3 3,024.5 n.a. 1,371.6 1,135.5 1,361.2 1,916.1 1,540.5 731.1 968.5 4,533.1 1,081.6 175.9 206.0 466.5 100.5 1,066.4 4,409.1
3,441.0 1,199.9 1,109.2 3,882.8 18,167.0 486.9 1,655.1 1,659.0 1,658.6 1,100.7 1,582.0 2,171.3 1,081.6 802.0 901.9 4,761.6 1,475.0 223.0 214.8 671.2 102.3 754.1 3,892.1
n.a.
n.a.
3,030.0 1,166.0 983.0 3,788.0 16,726.0 527.0 1,220.0 905.0 472.0 859.0 1,622.0 1,817.0 801.0 702.0 642.0 4,524.0 1,116.0 178.0 154.0 520.0 99.0 567.0 4,674.0 2,847.0
3,186.0 1,119.0 772.0 3,248.0 17,778.0 158.0 1,058.0 725.0 428.0 754.0 1,942.0 1,872.0 778.0 743.0 504.0 2,894.0 1,235.0 157.0 163.0 523.0 95.0 639.0 4,730.0 2,993.0
2,117.2 952.3 652.9 2,385.2 19,442.7 371.7 1,041.0 998.2 605.1 763.0 2,100.9 1, 732.3 820.2 925.3 535.9 2,229.8 1,263.1 125.2 147.8 501.3 105.0 1,081.9 6,519.7 2,853.2
318.9 630.3 184.9 1,868.8 15,014.5 154.7 820.9 776.8 374.3 507.0 1,802.1 1,446.1 776.8 856.7 425.2 737.2 595.0 69.8 118.3 379.9 91.2 1,180.0 6,474.4 2,478.9
115.7 602.0 200.7 2,022.3 11,637.3 41.5 686.9 472.4 464.8 479.9 1,653.0 1,316.5 834.1 829.7 353.5 564.9 472.4 56.0 99.4 364.2 91.8 903.3 6,742.4 2,097.7
159.8 703.9 199.4 1,557.4 12,548.1 37.7 464.2 806.4 525.9 520.2 1,708.4 1,210.8 839.7 983.1 459.2 441.6 446.6 105.7 117.6 453.5 83.7 939.1 7,897.2 2,139.3
-28.1 -5.9 -11.9 -8.0 -3.4 -23.7 -18.6
n.a.
3,363.0 1,167.0 1,026.0 4,244.0 17,170.0 495.0 1,397.0 1,599.0 794.0 940.0 1,548.0 2,076.0 908.0 714.0 702.0 5,260.0 1,439.0 204.0 179.0 576.0 90.0 626.0 3,808.0 3,283.0
TOTAL
49,816.1
51,217.8
52,993.1
53,608.0
49,939.0
48,494.0
50,271.1
38,082.8
33,102.3
35,348.5
-3.7
n.a.
1,479.1 1,078.7 1,268.3 1,639.0 1,465.1 677.9 941.6 5,271.8 1,080.7 150.0 210.7 465.9 92.0 923.3 4,324.9
SoURCES: Mahal Kong Pilipinas Foundation, Inc. (various issues); Bureau of Energy Utilization (various issues).
n.a.
-10.9 -7.8 3.4 -3.3 -6.0 4.2 -7.7 -24.1 -9.4 -3.8 -6.3 -0.3 -1.1 0.2 6.9 n.a.
124
Teodoro M. Santos
indigenous, along with the low, or in some years negative, economic growth. This is particularly true of cement which shifted to coal, sugar which used bagasse extensively, and logging/wood products which used wood wastes. At least in the case of nickel and fertilizer, the negative growth rate in energy consumption captures the effect of shutdown in production apart from the deliberate shift to coal.
Selected Indicators Affecting Energy Demand Indicators considered relate energy consumption to price, efficiency of use, and national income. Table 5 presents the basic data. Energy intensity expressed in terms of the amount of energy used to produce a given value of national production reflects the efficiency in the use of energy. It is significant that the energy intensity increased during periods of low per capita income. Perhaps as significant is the strong influence of inflation on energy intensity. These observations seem to indicate that recession or high inflation rate can cause inefficiency in energy use, a behaviour for which there seems to be no ready explanation. Two measures of societal well-being used are the per capita GOP and per capita energy consumption. Per capita energy consumption ranged between 260 kg of oil equivalent in 1979 and 199 kg of oil equivalent in 1985. Note that per capita consumption was lowest during the recession years of 1984 and 1985 when per capita income was lowest too, at 302 and 254 constant 1980 U.S. dollars per year. The effect of income on energy consumption is reflected in income elasticities. In the long run the income elasticity for energy (per cent change in consumption of energy for every per cent change in income) was 1.29 for 1965-73 and 0.94 for 1973-81. This may be compared with 1.0 for developed countries and 1.30 for less developed countries (Villegas 1983, p. 15). The decrease in income elasticity from 1.29 or more in the 1960s to less than one in the early 1980s indicates decreasing dependence of income on energy consumption. Finally, the effect of price on energy consumption is reflected in price elasticity, the per cent change in consumption for every per cent change in price. During the 1973-81 period, price elasticity for the Philippines was -0.12, compared to -0.30 for less developed countries and -0.40 for developed countries. The value was -0.17 for the earlier years. This means that the Philippines has very little leeway in adjusting the amount of energy it consumes as price changes, even lesser than other developing countries (Villegas 1983, p. 15).
TABLE 5 Per Capita Energy Consumption and Intensity of Use 1973
Population (MM persons)
1974
1975
1976
1977
1978
1979
1980
1981
1982
1983
1984
1985
40
41.11
42.07
43.41
44.58
45.79
47.04
48.32
49.54
50.78
52.06
53.35
54.67
GOP in Current Market Prices (MM $)
10,701
14,658
15,825
18,185
20,830
24,125
29,481
35,226
38,647
39,883
34,564
32,301
32,789
[Using] Implicit RP GOP Deflator GOP in Constant 1980 Market Price (MM $)
0.41 25,910
0.54 27,044
0.59 26,959
0.64 28,370
0.69 30,320
0.75 32,124
0.87 34,082
1.00 35,226
1.11 34,786
1.20 33,125
1.35 25,679
2.00 16,118
2.36 13,894
[Using] U.S. PPI Deflator GOP in Constant 1980 Market Price (MM $)
0.46 23,357
0.56 26,190
0.62 25,357
0.66 27,397
0.71 29,339
0.76 31,660
0.86 34,255
1.00 35,226
1.11 34,923
1.14 35,094
1.15 30,086
1.17 27,515
1.17 28,043
Per Capita GOP (current $)
268
357
376
419
467
527
627
729
780
785
664
605
600
Per Capita GOP (constant 1980 $) [GOP Deflated by RP Deflator]
648
658
641
654
680
702
725
729
702
652
493
302
254
Per Capita GOP (constant 1980 $) [GOP Deflated by U.S. PPI Deflator]
584
637
603
631
658
691
728
729
705
691
578
516
513
Primary Energy Consumption ('000 toe) Oil Consumption ('000 toe)
9,748
9,362 8,216
10,108 8,858
10,515 9,107
11,276 9,919
11,737 10,279
12,252 10,598
12,071 9,954
11,680 9,350
11,827 9,305
12,082 9,303
11,192 7,665
10,903 6,779
Per Capita Energy Consumption (toe) Per Capita Oil Consumption (toe)
0.244
0.228 0.200
0.240 0.211
0.242 0.210
0.253 0.223
0.256 0.224
0.260 0.225
0.250 0.206
0.236 0.189
0.233 0.183
0.232 0.179
0.210 0.144
0.199 .0124
Energy Intensity (toe)'
0.376
0.346
0.375
0.370
0.372
0.365
0.360
0.342
0.336
0.357
0.469
0.694
0.787
0.304
0.329
0.321
0.327
0.320
0.311
0.283
0.269
0.281
0.362
0.476
0.488
Oil Intensity (toe)' NOTES:
Energy/oil intensity is measured by primary energy/oil consumption in toe per thousand. 1. U.S. dollars of GOP at 1980 constant market price (RP deflator used). 2. Oil consumption = indigenous + imported oil. 3. MM = million: toe = tons of oil equivalent. SoURCES:
Asian Development Bank (1987); Office of Energy Affairs.
126
Teodoro M. Santos
--------------------
ENERGY SUPPLY Energy supply consists of domestically produced and imported forms. The most important energy sources are crude oil, coal, hydro, and geothermal. Problems associated with energy supply are security, stability, adequacy, and affordability while preserving the environment. Development of indigenous energy resources is the major strategy for addressing these problems. On the other hand, minimizing the volume of imports and diversifying their forms and geographic sources are strategies for pursuing supply security, stability, and adequacy. Table 6 presents the available energy in the Philippines during the period 1973-85. Of the energy supply, only oil and coal are imported. Major indigenous energy resources, apart from coal and petroleum, appear in the form of electricity. Coal and crude oil also enter as thermal sources of electricity. Some of the important characteristics of supply are: 1. domestic crude oil production started in 1979 at 8.57 million barrels and progressively decreased over the years, reaching 2.671 million barrels in 1985; this reflects a very high rate of initial production and a very low rate of discovery; 2. significant commercial coal production started in 1975 at 0.105 million tons, which increased to 1.262 million tons in 1985; 3. significant geothermal production started in 1979 at 638 gigawatt-hour per year and grew to 4,929 gigawatt-hour per year in 1985; 4. coal import appeared in significant amount in 1977 at 0.188 million tons and grew to 1.258 million tons in 1985; 5. crude oil import declined from 71.623 million barrels in 1973 to 53.097 million barrels in 1985; 6. generation of electricity by thermal method increased from 6,854 gigawatt-hour in 1973 to 11,202 gigawatt-hour in 1985. These data indicate the effects of conservation efforts on the amount of imported oil and of substitution by indigenous energy supply, objectives which are high in the government's priorities. Table 7 shows the pattern of petroleum product importation during the 1975-86 period. Note that industrial fuel oil, diesel, lubes/additives/ basestock, and LPG comprise the most important components of imported petroleum products. Attempts at diversifying the sources of imported crude oil designed to address supply security and stability are evident in Table 8. In 1975, 80.8 per cent of the crude oil import originated from the Middle East, but
TABLE 6 Supply of Energy Resources Average Annual Growth Rate
Crude Oil & Products ('000 bbl) Crude Oil Production Import Coal ('000 tons) Production Import Electricity (gigawatt-hour) Generation Hydro-power Nuclear Geothermal Thermal Consumption
1973
1974
1975
1976
1977
1978
1979
1980
1981
1982
1983
1984
1985
in% (1973-85)
0 71,623
0 66,435
0 73,733
0 76,916
0 80,889
0 80,579
8,570 81,525
3,620 81,132
1,858 72,507
3,569 65,592
4,872 74,299
3,892 54,013
2,671 53,097
-17.6 -2.5
39 10
51 27
105 16
122 21
285 188
255 294
263 270
329 336
331 228
558 141
1,020 272
1,216 513
1,262 1.258
33.6 49.6
8,729 1,875 0 0 6,854 8,729
11,108 2,360 0 0 8,748 11,108
10,250 2,250 0 0 8,000 10,250
11,118 2,794 0 0 8,324 11,118
12,171 2,197 0 0 9,974 12,171
14,442 2,806 0 3 11,633 14,442
15,015 2,870 0 638 11,507 15,015
15,822 3,522 0 2,077 10,223 15,822
17,009 3,744 0 2,770 10,495 17,009
18,156 3,773 0 3,540 10,843 18,156
20,601 2,968 0 4,077 13,556 20,601
20,359 5,278 0 4,532 10,549 20,359
21,684 5,553 0 4,929 11,202 21.684
7.9 9.5 0 26.1' 4.2 7.9
.
Nons: For 1979 to 1985 only. 1. Consumption includes stock changes. 2. Electricity generation includes NPC, MECO, and NEA utilities. SOURCES: Asian Development Bank (1987); Local Oil Production: BED Oil & Gas Division (1986-88); BEU Quarterly Review for Coal Production '86.
TABLE 7 Petroleum Product Importations, 1975-86 1975
Products
Avgas Avturbo Premium Gasoline Diesel Industrial Fuel Oil Kerosene LPG Solvents Naphtha Special Oils Lubes/Additives/Basestock Heavy Vacuum Gas Oil Slop Fuel Oil Special Fuel Oil TOTAL PRODUCT IMPORTS
Volume M bbls 286
1976
CIF M$ 6,798
Volume M bbls 204
1977
CIF M$
Volume M bbls
4,967
85
1978
CIF M$ 2,143
-
Volume M bbls
1979
CIF M$
68
1,903
371
7,012 50,736 842 10,026 547 30,142
1980
Volume M bbls
Volume M bbls
CIF M$
CIF M$
68 97 843 1,113 9,788 54 1,076
5,362 2,127 26,856 30,069 189,009 1,268 23,925
75
10,107
335 1,120 10,486 131 774
13,644 45,930 287,349 6,060 26,173
1,268
33,102
64
1,686
2,769
29,427
4,698
50,628
7,118
84,780
174
2,252
222
2,999
494
6,974
2,818
33,887
29,478
10,428
26,468 86 12,031
2,148
236
1,954 3 334
4,195 44 745 24 2,076
194
10,948
126
9,220
170
14,376
133
17,369
6,283
82,792
7,415
97,179
10,039
134,323
7,649
110,428
14,477
326,094
13,118
408,318
TABLE 7 (cont'd) 1981
Products
Volume M bbls
Avgas Avturbo Premium Gasoline Diesel Industrial Fuel Oil Kerosene LPG Solvents Naphtha Special Oils Lubes/Additives/Basestock Heavy Vacuum Gas Oil Slop Fuel Oil Special Fuel Oil TOTAL PRODUCT IMPORTS NOTES: 1. M bbls 2. M $
= =
1982 CIF M$
Volume M bbls
1983 CIF M$
Volume M bbls
1984 CIF M$
Volume M bbls
1986
1985 C/F M$
Volume M bbls
CIF M$
Volume M bbls
CIF M$
58
4,099
40
2,707
47
2,540
29
1,534
36
1,610
36
1,214
934 9,336
38,696 322,069
1,953 5,220
78,382 157,693
1,044 12,401
35,669 354,248
490 3,121
16,525 88,055
139 3,051
4,070 77,037
600 4,182
9,554 48,528
1,344
35,952
1,273
30,864
876
24,136
608
14,170
615
13,053
584
10,473
211
6,244
74
10,191
103
14,843
104
19,355
86
17,185
55 336 38 39
10,626 8,249 569 798
62 924 14
13,800 17,242 62
11,746
411,007
8,589
284,489
14,472
435,948
4,545
143,713
4,309
116,012
6,402
100,873
thousand barrels. thousand U.S. dollars.
SOURCE: Office of Energy Affairs.
TABLE 8 Crude Oil Import by Country of Origin, 1975-86 1975
Source Country
1976
Volume M bbls
M$
CIF
MIDDLE EAST Saudi Arabia Kuwait Iran Iraq Abu Dhabi Qatar Dubai Oman Neutral Zone United Arab Emirates
54,519 34,911 13,863 2,797 2,516 432
611,913 391,110 156,714 31,028 27,874 5,187
OTHER REGIONS Indonesia Malaysia Brunei China (PRC) Mexico Australia
12,931 5,357 4,260
114,169 63,772 50,397
3,314
TOTAL IMPORTS
67,450
-
1977
1978
1979
Volume M bbls
M$
Volume M bbls
M$
Volume M bbls
M$
Volume M bbls
51,850 24,685 19,626 2,763 4,762
617,846 292,868 234,392 32,749 57,663
51,293 25,784 11,982 4,239 9,288
653,109 323,223 155,271 53,133 121,482
51,951 20,515 12,331 6,056 12,739
676,777 266,279 158,842 77,494 170,013
46,956 23,159 10,004 1,921 11,872
14
174 310
4,149
178,207 155,222 21,547 1,438
CIF
C!F
173,408 113,963 57,588 1,857
19,557 10,439 3,033
184,213 140,664 43,549
n.a.
17,651 9,150 4,450 143 3,908
n.a.
6,085
n.a.
20,979 11,478 1,472 99 7,930
726,082
69,501
791,254
70,850
837,322
72,930
CIF
1980
CIF
Volume M bbls
M$
888,891 418,422 188,163 39,822 242,484
49,952 27,831 9,385
1,516,219 819,159 285,143
7,843 602 1,344 2,021 926
245,675 20,994 46,310 67,696 31,242
n.a.
20,092 8,015 3,082 1,910 7,085
390,615 155,666 69,637 40,356 124,956
18,062 6,081 3,561 1,455 6,965
591,485 191,937 132,784 51,754 215,010
854,984
67,048
1,279,506
68,014
2,107,704
M$
CIF
TABLE 8 (cont'd) 1981
Source Country
1982
Volume M bbls
M$
Volume M bbls
M$
MIDDLE EAST Saudi Arabia Kuwait Iran Iraq Abu Dhabi Qatar Dubai Oman Neutral Zone United Arab Emirates
41,664 31,313 7,122
1,422,778 1,043,978 259,339
42,716 28,226 6,631
1,454,301 954,104 221,261
119,461
2,191 5,668
77,852 201,084
OTHER REGIONS Indonesia Malaysia Brunei China (PRC) Mexico Australia
19,097 5,202 3,514 3,215 4,527 2,639
TOTAL IMPORTS
60,761
3,229
NOTES: 1. M bbls = thousand barrels. 2. M $ = thousand U.S. dollars. SOURCE: Office of Energy Affairs.
CIF
1983
700,733 184,664 140,334 122,667 159,277 93,791
2,123,511
14,287 2,778 2,160 2,207 4,542 2,600
57,003
CIF
471,811 98,781 78,161 78,630 134,245 81,994
1,926,112
1984
CIF
1985
M$
Volume M bbls
42,821 25,521 5,676 1,206
1,269,372 751,525 160,658 34,904
28,011 12,838 11,270 680
796,931 367,998 317,557 19,886
23,870 8,855 8,068 2,157 889
1,815
55,141
7,123 1,000 480
224,417 29,745 12,982
1,825 602 796
51,939 17,434 22,117
17,006 5,881 2,596 1,841 4,074 2,614
59,827
493,663 175,777 81,312 56,826 108,536 71,212
1,763,035
21,420 5,258 8,002 1,823 6,337
49,431
CIF
Volume M bbls
Volume M bbls
M$
622,628 156,658 244,668 55,558 165,744
1,419,559
1986
CIF
Volume M bbls
M$
658,594 244,927 223,481 58,754 24,534
33,486 12,041 7,642 6,888 500
439,148 164,726 101,066 81,615 8,485
2,850
78,016
1,855 2,949
24,183 34,728
1,051
28,882 1,611
24,345
16,926 3,274 9,838 485 3,329
256,543 45,427 161,169 10,556 39,391
50,412
695,691
CIF
M$
24,973 4,417 10,498 545 8,088
678,856 125,192 295,267 14,927 204,754
1,425
38,716
48,843
1,337,450
132 -
Teodoro M. Santos
-----~------------
- - - - - - ---- - - - - -
by 1986 only 66.4 per cent came from that region. Other suppliers are Indonesia, Malaysia, Brunei, China (PRC), Mexico, and Australia with which the Philippines share common geography, culture, or economic interests. Even crude oil imported from the Middle East diversified from three to seven or more suppliers. A small volume of petroleum products is exported, dominated by gasoline/naphtha, as shown in Table 9. Such exports, along with the imports of industrial fuel, diesel, and others, result from the policy of "socialized" pricing of petroleum products under which products used by the "poorer" sector of society, such as diesel and kerosene, are priced much lower than products consumed by the more "affluent" sector, such as premium gasoline. Hence demand for cheaper petroleum products increased much more than the demand for the more expensive ones, necessitating imports of the lower-priced products and exports of higherpriced products even at prices lower than those prevailing locally. DEMAND AND SUPPLY BALANCE In order to highlight possible energy supply-demand problems in the future, we examine two broad groups of demand scenarios which are likely to occur in the future: (1) Demand grows based on historical experience; (2) Demand grows in accordance with the aspiration that the country becomes a newly industrializing economy (NIE) by year 2000. Local production of energy is presumed to grow at the same average growth rate as in the past. Hence production for any future year is obtained by using the regression of production with time for the years where data are available. It assumes that essentially similar levels of efforts as in the past shall be exerted to produce domestic energy, a relatively generous one in light of existing plans and policies. Local production for any future year is subtracted from the corresponding demand to obtain the amount that must be procured from abroad or from additional production.
Energy Demand Grows According to Historical Experience We identify two types of demand based on historical experience, D 1 and 0 2 • Under 0 1 we assume that the pattern of energy consumption from 1985 to 2000 shall follow the same pattern experienced from 1970 to 1985. In particular, this assumption presumes that the country shall experience the same spotty, unfavourable economic growth rates experienced during the last two decades. D 2 , on the other hand, presumes that aggregate
TABLE 9 Petroleum Product Exports by Product Type (In thousand barrels) Product Type
1975
1976
1977
1978
1979
1980
1981
1982
1983
1984
1985
1986
1987
ENERGY PRODUCTS Avgas Avturbo Gasoline/Naphtha Diesel Fuel Oil Kerosene Others
1,080
824
920
379
544
1,347
1,511
1,629
3,359
2,445
960
2,907
1,741
30 318 212 415 105
53 589 182
76 642 184 18
39 180 160
22 85 168 255
1,011 8 243
1,204 26
1,475 27
359 2,426
550 1,604 36 255
805 155
187 2,193
4 1,648 72 16
14
85
281
127
21 0
21
12
17
293
65 0
42 0
12
7
278
27
9
14
15
25
NON-ENERGY PRODUCTS Asphalts Refinery Process Gas Solvents Lubes Greases Waxes & Petrolatum Basestock TOTAL EXPORTS
Non: -
=
0
=
zero. less than 500 barrels.
SotrRCE: Office of Energy Affairs.
51 49
0
2
1
0 0 0
0 2
l
12
17
171 359 44
500 27
l
25
21 -
93 0
21
13
17
86
21
12
4
7
2,487
985
2,928
1,834
13 1,131
824
922
400
565
1,359
1,528
1,922
3,424
134
Teodoro M. Santos
energy consumption shall experience a constant growth rate of 3.7 per cent per year, presumably a growth rate considered desirable and achievable by government authorities. Table 10 presents the supply-demand balance for 0 1 and 0 2 • Data imply that under 0 1, the supply-demand balance shall remain almost stable. Under 0 2 conditions, the supply-demand balance grows substantially though perhaps tightly manageable. If a barrel of oil shall be valued at a moderate price of US$30 per barrel in year 2000, and if the deficit shall be covered by oil imports, the annual bill could easily reach US$4.0 billion, a considerable drain on the country's foreign exchange reserves. Even at a bargain price of US$20 per barrel, the import bill could reach about US$2.7 billion per year.
Energy Demand Grows According to Aspired Income Level Grim implications of economic growth being the same as in the past two decades do not make 0 1 and 0 2 acceptable planning benchmarks. Progress is desired. In fact there is the common desire among government officials and the citizens to make the country a NIE by year 2000. This
TABLE 10 Energy Supply-Demand Balance Based on Historical Production and Consumption (In million tons of oil equivalent) Year
Production"
Db 1
oc2
o~-sd
02-5
1985
3.030
13.305
13.305
10.275
10.275
1990
3.692
14.196
15.115
10.504
11.423
1995
4.353
18.126
10.734
13.773
2000
5.014
15.087 15.978
21.737
10.964
16.723
NarEs: " Projected domestic energy production assuming the same intensity of efforts exerted in the past shall prevail up to year 2000. b Projected consumption based on historical trends, that is, no major factor affecting energy consumption shall influence energy consumption up to year 2000. c Projected consumption assuming an annual growth rate of 3.7 per cent, as indicated by MOE National Energy Program 1986-1990, p. 11. d Supply (historical domestic energy production projected by time trend).
SOURCES: Same as Table 6.
Philippine Energy Policy and Problems
135
aspiration suggests an energy consumption pattern very different from 0 1 and 0 2 • To assess the possible pattern of energy demand as the country moves towards the NIE status, the following assumptions are made: 1. The country's economic growth between 1985 and 2000 shall follow the growth pattern experienced by South Korea during the 1965-80 period. 2. The per capita income-per capita energy consumption (GDP/N-EC/N) relationship during the last two decades shall continue to prevail up to year 2000. Three possible demand scenarios, 0 on these premises.
3,
0
4,
and 0
5,
are identified based
0 3 : This demand scenario is determined by assuming that per capita GOP (GDP/N) of South Korea from 1965 to 1980 shall be congruent to that of the Philippines during 1985 to 2000, and that the per capita energy consumption (EC/N) for the same period shall follow the pattern of the preceding two decades as embodied in the equation: GDP!N (1988 US$)
=
-173
+
3,922 EC!N (toe)
Table 11 indicates the corresponding calculation. 0 4 : Under this scenario it is presumed that the Philippine EC/N in the period 1985-2000 shall follow the South Korean EC/N during the 1965-80 period, provided the latter is "normalized" to the Philippine experience. The normalizing factor F is found by multiplying South Korean consumption in 1965 by F, then equating the product to the corresponding Philippine consumption, 200, in 1985. After determining F, the Philippine EC!N is determined by multiplying the corresponding South Korean ECIN by F. Normalization here implies that even if the same income growth pattern as South Korea may be experienced by the Philippines in the future the same efficiency in energy consumption as experienced by the Philippines in the decade before 1985 shall be reflected in future consumption. South Korea is chosen here as a model since it appears closer to the Philippines than the other neighbouring NIEs in terms of area and population and its income level and growth during the study period are more modest than the others. 0 5 : Considering the relatively higher per capita energy consumption experienced by South Korea during the study period, it is presumed that such level can be used to reflect the upper limit of per capita energy consumption as the Philippines journeys into the NIE status. This scenario
136
Teodoro M. Santos
TABLE 11 South Korean and Philippine Per Capita GOP and Per Capita Energy Consumption (In 1988 US$ and kilograms of oil equivalent) SOUTH KOREA Year
GDP!N (US$)
1965
PROJECTED EC!N
PHILIPPINES GDPC!N (US$)
EC!Nd (koe)
Normalizede (koe)
Non-normalized I (koe)
EC!N (koe)
Year
432b
287
1985
611
200
200
287
1970
766
537
1990
891
271
374
537
1975
1,106
686
1995
1,301
376
478
686
1980
1,928
983"
2000
1,900
529
685
983
NarEs: " Obtained by assuming constant growth rate between 1978 and 1981. EC/N for 1981 is 1,030 kce. b 1966 value. c Assume the Philippines' GOP grows to be like South Korea in corresponding year according to its aspiration to beaNIE by year 2000; assume uniform growth from 1985 to 2000. d Determined with the use of the equation derived from Philippine historical data, GDP!N (1988 $) = -173 + 3,922 EC!N (toe) and using projected GDP/N. e Normalized means South Korean consumption multiplied by factor F to find corresponding Philippine consumption, F(287) = 200. Non-normalized assumes Philippine consumption will develop exactly like South Korea in corresponding year, an upper limit case. Conversion used: 1 toe Abbreviations:
= 1.59 tee = 8.33 barrels of crude oil
koe = kilogram of oil equivalent toe = ton of oil equivalent kce = kilogram of coal equivalent tee = ton of coal equivalent
SOURCES: World Bank (1983); United Nations, World Energy Supplies, Series). New York: 1976, 1978, 1979; Fesharaki et al. (1982); NEDA (1986).
therefore assumes that the same per capita energy consumption experienced by South Korea in 1965-80 shall be experienced by the Philippines for the corresponding years of the 1985-2000 period. Table 12 shows the projected energy consumption for 1985-2000, based on projected population and per capita energy consumption in Table 11. The demand-supply balances based on the country's development aspira-
Philippine Energy Policy and Problems
137
---------- ------
TABLE 12 Projected Philippine Energy Demand Based on Development Aspiration (In million tons of oil equivalent)
Ds
N (million persons)"
10.934
15.690
54.67
22.908
32.891
61.25
32.805
47.080 75.583
68.63 76.89
Year
OJ
04
1985
10.934
1990
16.599
1995
25.805 40.675
2000
50.670
NOTES:
Population of the Philippines was 54.67 million in 1985, and assumed to grow annually at 2.3 per cent. 0, Projected consumption assuming that previous relation of GOP/N to EC/N shall prevail - in the future, and assuming further that growth in GDP/N shall follow corresponding South Korean experience. 0 4 Projected consumption based on South Korean data and normalized according to Philippine experience. 0 5 Projected consumption assumes that EC/N for the Philippines shall correspond with those for South Korea during comparable period. Values in this table are obtained by multiplying per capita consumption of Table 11 by corresponding population. SOURCE: Table 11 in this chapter.
tion are set down in Table 13. This table implies a number of serious problems: 1. Aspiration to be a NIE by 2000 suggests additional energy consumptions which are many times larger than domestic production. For instance, by 2000 projected energy consumptions vary from eight to fifteen times as much as domestic production. Such expansion in consumption is highly unlikely to be satisfied by local production. 2. The energy bill that the country shall have to pay may vary between US$9.0 billion and US$18 billion in year 2000, assuming all demand not covered by domestic production shall be imported as crude oil at US$30 per barrel. Even at US$20 per barrel the bill shall be US$6-12 billion per year. Such huge energy bills shall exert a strong pressure on the country's balance of payment and could stifle economic growth. 3. To lower the potential crude oil import, development of local energy resources must be carried out, particularly geothermal, coal, and to
138
Teodoro M. Santos
TABLE 13 Energy Supply-Demand Balance Based on Aspiration to be a Newly Industrialized Economy by Year 2000 (In million tons of oil equivalent) D4 -S
D,-5
Supply
D3
1985
3.030
10.934
10.934
15.690
7.904
7.904
12.660
1990
3.692
16.599
22.908
32.891
12.907
19.216
29.199
1995
4.353
25.805
32.805
47.080
21.452
28.452
42.727
2000
5.014
40.675
52.670
75.583
35.661
47.656
70.569
Year
D4
Ds
D3 -S
NarEs: 1. S - Supply, historical domestic production data projected by time trend to year 2000. 2. 0 3 , 0 4 , and 0 5 carried from Table 12. 3. Supply-demand balance indicates the amounts that must be imported or produced locally to cover energy requirements of the economy if development aspiration is to be realized.
a lesser extent hydro. This implies volumes of investments in such resources on a scale never experienced in the country before, not to mention the technologies which have yet to be introduced and adopted and the requisite infrastructures. These problems, along with many others, suggest that the journey towards the NIE status is likely to be rough as very serious energy and related problems are likely to arise. Clearly, exertion of the same efforts as in the past in producing domestic energy would not be adequate to satisfy the country's energy requirements. Unfortunately there is no basis in existing or emerging energy policies or developments for expecting production levels to grow much higher than historical. ENERGY POLICY AND PROBLEMS Before the oil crisis of 1973, energy policy as we understand it now was virtually non-existent. However two important lessons learned during the 1973 crisis and the few years preceding it impelled the government to adopt a well-defined energy policy: 1. Increase in oil prices is associated with serious social, economic, and political problems which translate into massive anti-government and anti-multinational demonstrations and related types of movements
Philippine Energy Policy and Problems
139
which are socially and politically destabilizing; this was exacerbated by the fact that the multinational oil companies, perceived rightly or wrongly as a cartel, determined the level of price increases, not the government; and 2. The local economy is highly dependent on imported oil from a small number ot countries which virtually have the power to cause the economy to grind to a hal~ when their supply is interrupted or stopped. Translated into economic terms tne problems and corresponding policies may be divided into three categories: (1) energy consumpc>'1 (or demand); (2) energy production or supply; and (3) energy pricing.
Energy Consumption Efficiency in the use of energy, form of energy consumed, and equity in the distribution of consumption are the most crucial problems linked to energy consumption. Consumption of energy, particularly of imported oil, was generally high and increasing in the decades before 1973, mainly as a result of declining oil prices. The declining oil prices were a reflection of the evolution of the world petroleum industry towards a competitive market with the rise of "independents" and national petroleum companies in addition to the "Seven Sisters". Finally energy consumption was further enhanced by the restoration of industries destroyed during World War II. The low price of oil during the period conduced to inefficient use of energy. The high degree of dependence on foreign oil sources made the economy highly dependent on external factors. Moreover, it gave rise to a formidable balance of trade problem when oil prices spiralled, as Table 14 indicates. Note that energy imports, which amounted to about 10 per cent of total exports in 1973 and earlier years, ballooned to as high as 43 per cent of total exports in 1981. This suggests that almost half of all foreign exchange earnings through trade had to be channelled to oil imports at the expense of other sectors. When the government stepped in to regulate oil prices, it had to make a hard decision in determining which of the petroleum products, hence sectors of society, should bear the bulk of the price increase. In response to the problems posed above the government adopted the following policies: 1. Diversification of sources of oil imports based on geography, cultural affinity, and other considerations;
140
Teodoro M. Santos ------
TABLE 14 Philippine Energy Import and Trade Data (In US$ millions FOB) A Year
1960 1965 1970 1971 1972 1973 1974 1975 1976 1977 1978 1979 1980 1981 1982 1983 1984 1985 1986 1987
Total Imports
624.5 835.2 1,159.3 1,260.8 1,333.6 1,596.6 3,143.3 3,459.2 3,633.5 3,914.8 4,732.2 6,141.7 7,726.9 7,945.7 7,666.9 7,486.6 6,069.6 5,110.7 5,043.6 6,737.0
B Total Exports
535.4 795.7 1,142.2 1,189.2 1,168.4 1,837.2 2,725.0 2,294.5 2,573.7 3,150.9 3,424.9 4,601.2 5,787.8 5,720.4 5,020.6 5,005.3 5,390.6 4,628.9 4,841.8 5,720.2
c Energy Import
59.8 75.7 118.9 141.2 148.8 187.6 653.4 769.9 890.7 993.2 1,030.2 1,385.2 2,248.4 2,458.1 2,104.7 2,122.7 1,648.6 1,442.9 869.3 1,249.1
D
E
Energy Import
Energy Import
Total Imports
Total Exports
(%)
(%)
9.6 9.1 10.3 11.2 11.2 11.7 20.8 22.3 24.5 25.4 21.8 22.6 29.1 30.9 27.5 28.4 27.2 28.2 17.2 18.5
11.2 9.5 10.4 11.9 12.7 10.2 24.0 33.6 34.6 31.5 30.1 30.1 38.8 43.0 41.9 42.4 30.6 31.2 18.0 21.8
NarE: Energy import consists of mineral fuels, lubricant, etc. SOURCE: NEDA (1986).
2. Conservation of oil and other energy resources used; 3. Development of indigenous energy resources; and 4. Creation of an integrated national energy corporation covering exploration, development, extraction, refining, transporting, and marketing. The creation of a national energy corporation provides the government with the medium for arranging import on a government-to-government basis, developing domestic energy resources, control over about a third of
Philippine Energy Policy and Problems
141
the local oil market which gives it the potential to be a price leader, and information on the various aspects of the energy business, particularly costs. The latter points are useful for a meaningful regulation of the industry, particularly of oil prices. As regards conservation, pricing of petroleum products was considered an important policy instrument. High prices were contrived through taxes and other government imposts to promote conservation of imported oil and the use of local energy resources. In addition, the following measures were resorted to by the government to promote conservation (PNOC 1976, Makasiar 1983): 1. A law (lDl No. 328) was promulgated in 1975 to spell out specific policies on conservation; 2. All major government offices and corporations were directed to reduce energy consumption by 10 per cent; 3. All industrial firms consuming at leastJ?1.0 million a year of energy were required to submit to the government their conservation programme for monitoring; 4. Additional taxes on big automobiles, sports cars, and luxury appliances were imposed; these luxury items were even banned later; 5. Incentives were given to investments in energy conservation or production; 6. Energy-related agencies were directed to pool experts to advise and assist the sector in developing and implementing conservation programmes; and 7. The public, through the mass media and school curricula, was educated on the value and ways of energy conservation.
While the measures taken by the government, along with high prices and economic recession, dampened demand during the study period, at least two factors are likely to expand dramatically the energy demand in the next decades. The lowering of energy prices compared to those during the past is likely to encourage even less responsible use of energy. Finally the country's aspiration to be a NIE by year 2000, if pursued vigorously, shall entail astronomical levels of energy consumption. Energy Supply Energy supply consists of imported and domestically produced energy. Imported energy consists mainly of petroleum, petroleum products, and coal. Before the energy crisis, domestically produced energy came mainly
142
Teodoro M. Santos
from hydroelectric power plants, agricultural wastes, and bagasse. The deliberate policy of the government to develop indigenous alternative energy resources catapulted to prominence geothermal, coal, and petroleum in addition to other lesser resources. Important policies responsible for this development are: 1. T~ •.: mtrnrlnrtion of service ccrztracts in the exploration, development,
and exploitation of petrolem.-:., coal, geothermal, and similar enert;y resources. Under the service contract scheme entry of foreign-owned corporations are made possible without violating the Constitution since the foreign firm works only as a contractor or tenant for the landlord or owner of the resource, which is the government. Costs incurred during operations are deducted from gross revenues ranging from 70 to 95 per cent, depending on the perceived economic quality of the resource, the remainder being divided between the government and contractor on a 60:40 ratio in favour of the government. In addition, imported equipment and materials required for operation are exempted from customs duties and taxes. Service contractors are also exempted from all kinds of taxes except income taxes. By allowing and encouraging the entry of 100 per cent foreign-owned corporations (where before only corporations at least 60 per cent of whose capital is owned by Filipino citizens were allowed), venture capital and technology became available. Combined with the very high and even escalating oil prices, the service contract has been credited with the discovery and exploitation of local petroleum, geothermal, and coal deposits. 2. Though direct government efforts in petroleum exploration have not shown any success, its record in geothermal exploration, development, and extraction appears impressive. Of the 894 MW installed geothermal capacity in 1987, the Philippine National Oil Corporation or PNOC accounted for 26 per cent, and Philippine Geothermal Incorporated (PGI), a Union Oil subsidiary, the rest. The National Power Corporation (NPC) buys all the steam, being the monopoly for installing and operating the national power grid.
In order to encourage further the exploration and exploitation of petroleum and geothermal resources the pertinent laws (PO 87 and PO 1442) are now being amended in favour of the investors. For instance the Geothermal Law or PO 1442 is being amended in a form which suspends the royalty to the government for the first six years of production, and allows cost and investment recovery from 60 per cent to 90-100 per cent
Philippine Energy Policy and Problems
143
of gross production. If implemented, these new policies are likely to expand geothermal and petroleum exploration and production dramatically. Generation and transmission of power from water resources have been vested by law with the NPC since 1972 by virtue of PO 40. Construction of hydroelectric power plants has been stopped in a number of places mainly owing to the objections of local residents who have to bear the flooding and other adverse ecological and cultural impacts as well as the huge capital outlay needed. Only limited growth in electricity generation can be expected from hydroelectric sources. The government, through the NPC, embarked on the utilization of nuclear energy for power generation in consonance with the policy of energy supply diversification. Construction of a 650 MW facility, costing about US$2.0 billion, started in 1979 and was completed in 1986. However the present government has decided to suspend its operation. It is highly likely though that this facility shall be put to use in the near future in the light of the current tight power situation in the country. In fact a bill is now pending in Congress to utilize this facility. As a consequence of the decision not to operate the nuclear power plant and in response to the current and expected surge in the demand for electricity, the government has decided to install an aggregate of about 750 MW gas turbines, as shown in Table 15. This act shall increase the country's dependence on imported oil and hence exacerbates associated problems such as the balance of payment and supply security. The private sector is now allowed to construct and operate power plants on a build, operate, and own (BOO) or build, operate, and transfer (BOT") basis. Even foreign firms are encouraged to build power facilities under the BOT policy. This policy is directed towards increasing power supply but is inadequate if not supported by proper pricing and related policies. Development of coal resources, it appears, has essentially become a private sector activity despite the mandate of PNOC to venture into it. The current interest of PNOC seems to centre on coal importation and trade. This perhaps explains why it has been selling all its coal mines, equipment, and related facilities (as of August 1989). Of course such sale is consistent with the privatization plan for PNOC, which includes divestment of part of its assets. This development tends to expand consumption of imported coal rather than expand domestic production. Despite the observed behaviour of PNOC which may conduce to coal importation, there are other plans designed to expand local coal production. For instance the Calaca II Power Project in Batangas, Luzon Island, is designed to use 100 per cent domestic coal while Calaca I, which is
144
Teodoro M. Santos
TABLE 15 Gas Turbine Installed or Planned (In megawatt) Location
Capacity
Date of Operation
Remark
120
26 August 1989
Four units of 30 MW each. J1852 million total cost, J;'508 million funded by Japan Export-Import Bank, balance from loan from France.
90
26 August 1990
Three units of 30 MW each. Total cost of J;'624 million, 85 per cent funded by Japan Export-Import Bank, the rest by Citibank.
Navotas Cebu
200 55
Mid-1990
Barge Mounted
282
Mid-1990
TOTAL .
747
(MW)
Limay, Bataan
Malaya, Pililla, Rizal
Construction started in 1989. For Luzon, Visayas, Mindanao. Construction ongoing.
NOTE: Gas turbines chosen to fill void left by non-operation of the 650 MW Bataan nuclear power plant. They have short delivery period, to meet immediate increase in power demand, fuel flexibility, and high efficiency. They are intended to operate mainly as a peaking plant. Diesel will be used to operate them. SOURCES:
Manila Bulletin (1989); Narisma (1989).
already operational, is designed to increase local coal consumption to at least 80 per cent. 3. The government, through PNOC, participates in the importation of crude oil, its refining, and distribution and sales of petroleum products. This provides the government with information on the various aspects of the petroleum business which it can use in regulating the industry more wisely. For instance, since all the oil companies operating in the country are vertically integrated, it is very difficult to determine the true cost of a barrel of petroleum products, owing to transfer pricing. That is, such companies secure the crude oil from subsidiaries abroad which did the
Philippine Energy Policy and Problems
145
exploration, development, and extraction. Under this situation it is easy to accuse such multinational companies, as they have been accused, of manipulating their local costs to maximize profits. The experience of the government in various facets of the business will give it information to check if the declared costs of the multinationals are comparable with those incurred by the national company. The tendency of PNOC to petition for oil price increases of similar magnitude as the other sellers has led certain sectors of society to accuse PNOC of betraying the purpose for which it is created and taking side with the foreign multinationals. The charge is probably unfair since PNOC has no choice except to reflect in its request for price increase (or decrease) the crude oil prices in the world market which affect all. Assuming PNOC's request reflects the true costs in the industry, then one can assume that the multinationals which make similar requests follow it as price leader, or at least reflect correctly the same world market conditions affecting PNOC, as intended.
Energy Pricing Problem areas in energy pricing in the Philippines may be grouped into: (1) pricing of locally produced petroleum, coal, and geothermal steam; (2) pricing of electricity; and (3) pricing of petroleum products.
Pricing Locally Produced Petroleum, Coal, and Geothermal Steam Although pricing of domestically produced energy resources is crucial to their development, very little work has been done in this area up to this time. Domestically produced petroleum is priced based on prevailing world prices, a scheme which appears acceptable to all parties concerned. The pricing of local coal was entrusted to the National Coal Authority before 1987. Apparently unable to set prices acceptable to producers and consumers, the government convened a Council of Coal Advisors (CCA), consisting of producers and consumers, to arrive at a pricing formula acceptable to them. It was agreed that locally produced coal, representing about half of total consumption, will have to be used first before imported coal, at a price slightly higher than that of the imported coal. With the recent abolition of the National Coal Authority, the Energy Regulatory Board which absorbed its functions shall be empowered to implement the agreement. As regards the pricing of geothermal steam, it is currently the object of discussion between Philippine Geothermal Incorporated, the first
146
Teodoro M. Santos
geothermal producer in the country, and two giant government corporations, PNOC, the second biggest steam producer, and NPC, the only buyer. The basis of geothermal pricing is the concept of "avoided cost", the basis used in pricing the steam from the Bacon-Manito Geothermal Project. Uncertainty in pricing geothermal steam has been a disincentive to private investment in geothermal energy, as indicated by the withdrawal of potential investors and the current lack of investors apart from PGI, the earliest investor, and PNOC, in contrast to the many investors in coal and petroleum.
Electricity Pricing The authority for large-scale generation and transmission of electricity was vested in the NPC under PO 40, which sells to local power utilities, cooperatives, and large industrial users. However, EO 215 of 1987 allowed the private sector to construct and operate electricity-generating plants and to sell electricity directly or indirectly. Pertinent rules and regulations, including pricing, however, are to be determined by NPC within the NPC grids, and by the National Electrification Authority (NEA) outside such grids. Such rules, however, are subject to approval by the Office of Energy Affairs (OEA) which consults the private sector and the general public before giving its imprimatur. Despite the series of reforms since 1986, NPC retains the authority to determine its selling price. Among others, the factors that determine power rates are the costs of oil and coal, exchange rates, taxes, cost of capital, and "politics". Oil and coal fuel many power-generating plants; hence their prices substantially affect overall power-generating cost. Since the bulk of oil and coal, as well as the loans used to finance the construction of old and new power plants, are secured from abroad, depreciation of the peso relative to the U.S. dollar or other pertinent foreign currencies correspondingly increases the peso cost. As regard taxes, NPC is exempted from paying income tax, though lately such income tax due is reflected as government subsidy. NPC is, however, required to pay ad valorem tax on imported oil. Since power generation is highly capital intensive, NPC incurs huge capital expenditures, which comprise about 53 per cent of its present production costs. Increase in capital expenditure and in the cost of capital therefore substantially increase power production cost. Finally, since NPC is directly under the Office of the President the rate it charges and the timing of rate increase have to be reconciled with prevailing political realities. NPC, along with other agencies such as National Economic and Development Authority (NEDA) and the OEA, has decided that the price
Philippine Energy Policy and Problems
147
---- ·--·---
of electricity must be based on the long-run marginal cost. However, NPC thinks that it cannot be implemented yet owing to its adverse effects on small consumers in the city and in the rural areas, although it must be implemented in the long term. Pricing by other power utilities has followed a "socialized" scheme whereby the small consumers are required to pay highly subsidized rates while the big consumers shoulder the cost of such subsidy. The attendant economic inefficiencies and expected abuses have prompted the government to phase out such socialized pricing gradually. This policy is currently being implemented in Metro Manila.
Petroleum Product Pricing Prices of petroleum products have been regulated since the passage of the Oil Industry Commission Act in 1971 because of their profound impact on national security and general welfare. At least two attempts have been made to do away with price regulation but failed in both cases. In regulating petroleum product prices the government has to balance two problems: 1. It has to keep the oil industry viable so that the industry can continue providing the country with petroleum products, for the industry has no option but to quit if it cannot recover its variable costs, an event which could lead to paralysis of numerous economic activities; and 2. It has also to minimize the adverse impact of high prices on the people's welfare to promote social and political stability. Despite the severe criticisms levelled at petroleum price regulation there are indications that it is going to stay in the foreseeable future with some refinements, as several pending bills in Congress on the matter suggest. Petroleum product pricing as conceived during the crisis years had the following objectives: (1) keep oil prices stable at reasonable levels; (2) promote energy conservation; (3) develop indigenous energy resources; and (4) protect the environment (Makasiar 1988). Setting prices high enough to discourage consumption on less valuable uses promotes conservation and reduces air pollution, while investing a portion of the price in exploration and development of indigenous energy resources can help minimize dependence on imported energy. The components of the petroleum product prices as of now are: (1) oil company take, consisting of crude refining and other costs plus allowable profit margin; (2) transportation cost plus retailers' margin; (3) taxes; and (4) Oil Price Stabilization Fund (OPSF) contribution. The proportion of
148
Teodoro M. Santos
these components varies from product to product, as Table 16 indicates. The taxes were originally earmarked for developing indigenous energy resources in pursuit of energy self-reliance, although lately they have been used as a medium for raising government revenues without mention about the need for funding the energy self-reliance programme. Petroleum product price stabilization is achieved with the use of the OPSF. The OPSF is supposed to grow when the actual peso price of the products is below the government set ceiling price. If, however, the actual price exceeds the government set price, it means that the oil companies are losing. Such losses are reimbursed from the OPSF until the fund is exhausted, a situation which signals a price increase. If, however, the government set price remains higher than the actual price for a considerable span of time, the OPSF shall reach a certain threshold value which signals a decrease in the government set price. Through the OPSF, therefore, the government is able to avoid frequent changes in petroleum product prices, as changes are attended by divisive, debilitating debates and conflicts. For the private sector the price stability achieved between price increases enables firms to predict and plan their expenditures and moves over a longer stretch of time, in contrast to the difficulties they experienced in the past when petroleum product prices increased, very frequently upsetting whatever plans were made. Critics of the OPSF argue that the government should not allow refund of losses incurred by the oil companies since it is natural for TABLE 16 Cost Structure of Fuel Prices, August 1987 (In percentage of retail prices)
Premium Gasoline Regular Gasoline Avturbo Kerosene Diesel Fuel Oil LPG Asphalts Solvents
Oil Company Take
Ad Valorem Tax
OPSF
Dealers' Margin
Retail Price
50.1 47.4 46.1 68.0 65.8 100.0 66.7 65.2 46.9
46.2 43.7 42.5 21.5 20.8 0.0 21.1 20.6 43.3
0.0 5.1 11.4 5.7 8.1 0.0 12.2 14.2 9.8
3.7 3.8 0.0 4.8 5.3 0.0 0.0 0.0 0.0
100.0 100.0 100.0 100.0 100.0 100.0 100.0 100.0 100.0
Sut·wT: Paderanga and Paderanga, Jr. (1988)
Philippine Energy Policy and Problems
149
business firms to incur losses. Such argument is valid only if the government does not intervene in pricing. This is so because without government intervention, the oil companies can charge prices to maximize their profits at levels which are much higher than the government set prices. If losses are continually incurred, such companies will be forced to quit, which in the short term could lead to paralysis of many economic activities, and in the long term could become a heavy burden on the government as it has to provide the necessary technology, organization, management, and financing which the oil companies used to provide. Such vast amount of resources needed to fill the gaps left by the oil companies could be employed in other sectors of the economy to increase general welfare and promote economic growth and development. The petroleum product price stabilization in effect keeps the profits of oil companies within certain maximum levels, stabilizes society at least between price increases, and makes available to other sectors of the economy vast amounts of resources that would have otherwise been used to provide the petroleum products needed by the people.
Change in Energy Policy and Development of Institutions Before the oil crisis of 1973 the oil industry operated essentially in a free enterprise environment. However, the social and political problems spawned by spiralling oil prices which occurred during the reign of an authoritarian regime gave rise to active government intervention in the energy market. The government saw it fit to regulate energy prices and control energy demand, supply, production, transportation, and marketing. This approach to energy management gave rise to new institutions to formulate plans and policies and execute them. Thus the Energy Development Board, a policy and planning body, was born and subsequently upgraded to become the Ministry of Energy in 1977. Under this new ministry, two bureaus were created - one to promote and develop indigenous energy resources, the Bureau of Energy Development (BED); the other to regulate energy consumption and prices, the Bureau of Energy Utilization (BEU). To underpin the importance of price stabilization three bodies were created in succession: the Oil Industry Commission (OIC) in 1971, followed by the BEU created by PD 1206 in 1977, then by the Energy Regulatory Board (ERB) by virtue of EO 172 of 1987. Finally two huge government corporations were created or restructured to carry out supply-related policies: the National Power Corporation (NPC) was transformed into a power generating and transmitting monopoly under PD 40 in 1972; and the Philippine National Oil Company (PNOC) was created in 1973 with
150
Teodoro M. Santos
vast authorities (though not quite a monopoly) to cover the entire range of the petroleum business from exploration, development, and exploitation to transportation and marketing. PNOC also has a similar mandate as far as geothermal and coal resources are concerned. The regime which took power in 1986 favours the restoration of free enterprise, as embodied in the 1986 Philippine Constitution. It wants to stay away from activities which the private sector can and is willing to do. Some of the indicators of this policy are: 1. downgrading of the former Ministry of Energy into the Office of Energy Affairs headed by an Executive Director and reporting to the President in 1986 which effectively stripped the former ministry of its regulatory power over the energy sector; 2. plan to privatize PNOC since 1987; 3. attempt to break the monopoly of NPC by allowing the private sector to generate and sell electricity under EO 215 of 1987; and 4. attempt to remove price control on petroleum products since 1986. Despite the inclination of the present regime towards free enterprise, political inertia prevents achieving 2, 3, and 4. For instance, while the government breaks the monopoly of NPC in generating and selling electricity by, among others, allowing the private sector to do the same, NPC retains its power in electricity pricing and in issuing the necessary rules and regulations affecting other firms in the private sector. (Several bills are now pending in Congress to further prune the monopoly power of NPC.) Similarly while the government had decided to sell PNOC to the private sector for more than two years, it still remains a government corporation. As for the pricing of oil products, a new development with serious economic, social, and political implication has evolved. While before the present regime the luxury of lowering oil prices was never experienced, the present government has allowed prices to go down several times, only to realize the need to increase again as world prices soar and the local currency depreciates. Surprisingly the government has been confronted by intense social protests, especially by organized labour and lawmakers, whether it seeks to lower or increase oil prices. As at 30 August 1989 the OPSF had been depleted since world prices had risen from about US$11 to US$16 per barrel while local prices had not increased yet. There were measures being mulled in the Executive and Legislative branches of government to avoid increasing oil prices, at least up to the end of 1989, by reallocating funds from various government agencies and corporations
Philippine Energy Policy and Problems
151
to subsidize oil consumption. Such act of government is likely to serve as signal to the people that oil price increases is unnecessary and that the government can underwrite it if it so desires, giving rise to stronger resistance when the government finally decides that it can no longer afford to subsidize the increase in oil price. A further implication is that any increase in oil price may henceforth be blamed on the government since it has the power to allow the increase or prevent it. This reluctance of the government to increase oil price could lead to dire consequences - that could arrest economic growth and development and lead to mass sufferings of the people - whether the government, with its huge budget deficits and foreign debts, subsidizes oil consumption over an extended period or let the foreign oil companies go bankrupt by not allowing oil price increase. It seems ominous that the government is already facing great difficulties in managing oil prices even when crude prices have stayed within a relatively low range. One can only contemplate with grave apprehension what it would be like should oil price spiral as in 1973-74 or 1979-80. In fact as of 15 October 1990 the government was facing a grave budgetary and balance of payment crisis owing to the increase in oil prices to about US$40 per barrel caused by political tension and threat of war in the Middle East. Current developments which lead to lower energy prices are likely to expand per capita consumption, increase oil imports, discourage the development of domestic energy resources, and increase air pollution. If this trend persists, then the very substantial increase in energy consumption in the next two decades, as a result of the country's drive towards the NIE status in year 2000, is very likely to be filled by imported energy.
Past, Present, and Future Energy Policies, Problems and Their Implications Experience since the early 1970s shows that the energy policies of the Philippines change in response to changes in the pattern of energy supply, demand, and prices. Such policy changes are likely to affect profoundly the Philippine economy and society in the future as they have done heretofore. A brief analysis of the past, present, and future policy changes and their implications is set down below.
The Past Energy Situation, Problems, and Policies The energy supplydemand situation of the 1970s and 1980s reflects the disconcerting price volatility, supply uncertainty, and the resultant social, political, and economic problems of the time.
152
Teodoro M. Santos
--------
-------~
---------------
Aggregate energy consumption in the Philippines grew from 75.185 million barrels of fuel oil equivalent in 1974 to 99.353 million in 1987, corresponding to 2.17 per cent annual growth rate. The most important component of domestic energy consumption is imported oil, which accounted for about 80 per cent in 1974, decreasing to 51.3 per cent during the recession year of 1985, and increasing to 59.6 per cent in 1987. Oil import bill took about 10 per cent of foreign exchange earnings from total exports in 1970, escalating to 43 per cent in 1981, reflecting the severe adverse effects on the development of other sectors of the economy. The study period also affirmed the positive correlation between per capita income and per capita energy consumption. During the crisis periods the country experienced the domineering and disturbing influence of its oil suppliers in the country's economy and political independence. During the period, presumably in response to the escalating oil prices, the dependence of income on oil consumption diminished, as expressed in the decrease in income elasticity with respect to energy consumption from 1.29 for 1965-74 to 0.94 for 1973-81. Similar decrease in price elasticity took place, from ~0.17 during the earlier years to ~0.12 during the 1973 to 1981 period (Villegas 1983). Policy: As a result of the experiences in the energy sector, particularly during the crisis years, a series of energy policies was adopted which centred on "energy self-reliance, supply security and stability ... ". Coupled with the supply objective are the policies for the management of consumption, including substitution and conservation. The more important strategies adopted to implement the above policies consist of the following: 1. Setting up of institutional structures for policy formulation and implementation, and monitoring of the sector, the most important being the creation of the Ministry of Energy with two line bureaus and two corporate arms; 2. Pricing of energy products; 3. Investment policies to attract local and foreign investors; and 4. Energy conservation and substitution. In response to the policies and high energy prices, dramatic changes in the pattern of consumption and supply took place. Energy self-sufficiency increased from 20 per cent in 1974 to about 50 per cent in 1985. This is achieved at the expense of decline in imported oil. Major industries such as cement, steel/metal/nickel, mining, and power deliberately shifted to indigenous sources or imported coal.
Philippine Energy Policy and Problems
153
Concomitant to changes in demand pattern were changes in supply pattern. Diversification of sources of imported oil occurred by buying more from countries which are geographically or culturally closer, or by importing more from smaller suppliers. Diversification in energy sources was also evident. Coal became an important import. A 650 MW nuclear power plant was constructed. Energy sources which never before played an important role in the economy, such as coal, geothermal, agricultural wastes, and petroleum among others, became important in the country's energy mix.
The Present Energy Situation, Problems and Policies Significant, though subtle, changes in energy policies have been taking place since the advent of the new political regime in 1986. At the top of the changes is the downgrading of the Ministry of Energy into the Office of Energy Affairs, including the abolition of vital offices such as the Bureau of Energy Utilization. This signifies that the government does not consider the energy affairs of the country to be as important as tourism or social work, both of which are accorded Cabinet importance. There is also a policy to privatize PNOC and to demolish the monopoly of NPC in power generation, as implied in the policy to allow private enterprises to own, generate, and operate power facilities, undoubtedly in pursuit of the free enterprise orientation of the government. Deviation from self-reliance, deliberate or not, is manifested in the installation of large gas turbine capacity for generating electricity, ostensibly as a stop-gap measure to fill the deficit caused by the non-operation of the 650 MW nuclear power plant. This will certainly reduce considerably the country's energy self-sufficiency in the near future. However, in the long term the effect of such plants on energy self-sufficiency is not likely to be great as they are to be operated as peaking plants because of their high operating costs and because the development of power plants fueled by indigenous resources remains a top priority at NPC. Pricing policies are likely to give rise to serious problems. The pricing of coal still seems unsettled, which is likely to hinder the full development of local coal resources. Similarly the pricing of geothermal steam is still to be determined by talks between NPC and PNOC, again seriously hindering private sector participation. Although the private sector is now authorized to build, own, and operate power facilities, NPC still determines the pricing of electricity, a condition which does not conduce to private participation.
154
Teodoro M. Santos
NPC, however, contends that its determination of electricity pricing under the BOT and BOO schemes does not seek to deter private participation per se, though it really discourages inefficient firms. This is so because EO 215 stipulates that the purchase price shall be set at the avoided cost of NPC. This means that any operator must be at least as efficient as NPC in producing electricity to make any profit. Bills to repeal the laws governing the service contracts on petroleum, geothermal, and coal, designed to make their exploration and exploitation more attractive to investors, are pending in Congress. There is even a pending bill in the Senate to promote the utilization of solar energy. Nevertheless it is not likely that these measures shall produce any dramatic effect on the supply of domestic energy. Oil pricing seems to have trapped the government into a no-win situation. The government has tampered with the pricing mechanism that worked even during the worst crisis. It lowered oil prices; it rolled back prices soon after they were increased; it recoiled from implementing oil price increase which it had decided and announced long before; it conducted hearing after hearing even if it had already announced its decision. The government has found itself beleaguered whether it decides to increase or decrease prices. It has failed to explain to the people that allowing oil price to increase is done on behalf of the people; the alternative of not doing so, the loss of oil supply should the oil firms go out of business, will force the economy to grind to a halt as experienced during the 1973-74 crisis, creating hardships many times more difficult than the prospective price increase. The government has allowed its detractors to make it appear that when it allows oil price to increase, it is serving the interest of the oil companies at the expense of its people. Despite the government's attempt at bringing down oil prices, it has remained reluctant to reduce substantially the tax components, which amount to more than 40 per cent of some of the petroleum product prices, lest it reduces considerably its tax revenues. With the decision to keep oil prices low even as actual production costs increase and the government retains its hefty share in prices, oil companies are likely to be driven to bankruptcy, thereby endangering stability of future supplies. At present the government is left with three unsavoury options aside from regulating oil prices with the OPSF mechanism or equivalent: 1. Deregulate oil pricing, and let prices fluctuate frequently according to the interaction of market forces, the situation avoided by price regulation (Congress in 1990 abolished the ad valorem tax on petroleum products, dramatically decreasing the tax component of oil prices);
Philippine Energy Policy and Problems
155
2. Disallow oil price increases but pay the oil companies the consequent losses, out of government funds at the expense of the delivery of essential public services; and 3. Disallow price increases until the oil companies quit, after which it will be compelled by necessity to take over all the oil facilities, in the process allocating huge public resources for that purpose at the expense of many other sectors of society. After it has taken over the functions of the oil companies, it shall find out later, as oil firms did earlier,that it has to increase prices when dictated by the market to avoid national bankruptcy. Under this situation it shall be perceived or portrayed by its critics as the principal proponent of oil price increase, not the mediator as in the past, and acting on its own behalf instead of protecting the people's interest. This situation is likely to lead to destabilizing confrontation between the government and the opposition, for now there can be no credible mediator. The large size of the oil industry can bring the government to bankruptcy if it decides to absorb price increases by subsidy. But disruption of oil supply is even more unacceptable as it is likely to destroy the entire economy. Reasonable oil price increase based on actual crude oil price increase in the world market, though it will decrease income directly or indirectly through inflation, is manageable, as past experience shows. In summary, the present pricing policy conduces to unnecessary expansion of consumption and inefficiency in energy use as well as environmental pollution. It likewise tends to discourage the development of indigenous resources and hence encourage imports. There is no evidence that investments in energy will go above the historical level. Finally the government's reluctance to increase oil prices as the market dictates could put the country in a situation where the oil bill siphons off the bulk of government resources at the expense of vital public services which are essential to promote economic growth and the people's welfare.
The Future Energy Situation and Potential Problems The Philippines' aspiration to be a NIE by year 2000 has brought to light energy demandsupply and related problems. For instance, assuming that by year 2000 the country enjoys a per capita income equal to that of South Korea in 1980, then its total energy consumption shall be about eight to fifteen times domestic production. Should such incremental energy requirement be imported, it would mean an annual energy bill of US$9-18 billion at US$30 per barrel of oil or US$6-12 billion at US$20 per barrel. Is this magnitude of oil bill affordable?
156
Teodoro M. Santos
Should the bulk of incremental energy required be provided locally, this implies investments and efforts about eight to fifteen times historical. It is not easy to figure out where such investments would come from. In any case the aspiration to be a NIE by year 2000 implies a large volume of energy requirement which is not likely to be fulfilled from domestic production, based on current trends in investments and policies. Extraordinary efforts are needed to provide the energy requirements in order to realize the country's development aspiration. The threat of an impending oil price increase, aggravated by endless public debates, had probably done more damage than if the price increase actually occurred. Such threat, for instance, can be used by oligopolists as a signal to increase the prices of their goods without fear of competition from their business rivals. Moreover the expectation of a substantial oil price increase induces people to buy a larger variety and quantity of goods than usual in anticipation of the inflation that usually follows an oil price increase; in the process it triggers inflation ahead of and in proportion to the expected price increase, whether the increase is realized or not. CONCLUSIONS This chapter aims to assess the energy situation in the Philippines during the last two decades with a view of identifying problems and policy responses. Potential future problems are also examined based on the country's aspiration to be a NIE by year 2000. Experiences during the last decades show that the country's energy policies are shaped by the problems brought about by the changing pattern of energy supply, demand, and prices. The energy crises of 1973-74 and 1979-80 showed the debilitating effects on the national economy of skyrocketing oil prices and unstable oil supplies. Crude oil prices escalated from less than US$2 per barrel in 1970 to more than US$30 per barrel in 1980, correspondingly increasing the country's annual oil import bill from 10 per cent of export earnings to more than 40 per cent. This brought about severe recession, inflation, massive unemployment, and the attendant social and political problems. Dependence on a few oil suppliers from the Middle East exposed the country's vulnerability to external political pressures which even threatened to compromise its sovereignty. In response to the problems brought about by the oil crises the government adopted policies to manage the country's energy demand, supply,
Philippine Energy Policy and Problems
157
and prices, with strong institutional support. Briefly, those policies can be summarized as follows: 1. Conservation of oil and other energy resources through government fiat, e.g. requiring large government and private corporations to reduce consumption by 10 per cent or banning the use of sports cars, big automobiles, and luxury appliances; and through pricing, e.g. some oil products were slapped ad valorem taxes which amounted to more than 40 per cent of prices; 2. Diversification of sources of oil imports to reduce dependence on a few suppliers; 3. Development of other energy sources, such as nuclear power, or indigenous energy resources of petroleum, coal, and geothermal; and 4. Creation of institutions that formulate energy policies, develop plans, and implement them, such as the Ministry of Energy, BED, BEU, and
PNOC. These policies were constrained only by considerations of equity and ecology. The energy situation as of 1986 was the product of the above policies. Some of the important highlights of the energy situation are: 1. Dependence on imported oil for energy sources declined from more than 80 per cent in 1974 to about 50 per cent in 1985; moreover, sources of imported oil increased from a few countries in the Middle East before 1973 to about sixteen, scattered in several regions, by 1985. Coal had been added to oil as an imported energy, an aspect of diversification; 2. Domestic energy resources which were virtually unknown before 1973, such as geothermal, coal, petroleum, agricultural wastes, and bagasse, became important in the country's energy mix; an important instrument that brought this about is the service contract, which made possible the entry of foreign firms in the exploration and exploitation of domestic geothermal, petroleum, and coal resources; 3. Except for domestically produced petroleum, pricing of energy had been based on uncertain formula for a long time, which adversely affected investments. Prices of petroleum products, with tax components reaching as much as nearly 50 per cent, had been regulated with the use of a "buffer fund" extracted from oil consumers. Such prices were structured so that the "affluent" pay more than the "poorer" segment of society.
158
Teodoro M. Santos
4. The Ministry of Energy, along with its bureaus, corporate arms, and related agencies, provided the policy framework, planning, and regulatory mechanism for the orderly operation of the energy sector. The present energy situation reflects the 1986 situation with some modifications, the more prominent being: 1. Downgrading of the Ministry of Energy into an Office of Energy Affairs run by a director with sub-cabinet rank, along with the abolition of BEU. 2. Management of energy demand is now less stringent, considering the tendency to bring down prices to as low a level as possible and the absence of restraint in the use of big cars and luxury appliances as well as in the use of energy by large firms and offices. 3. Attempt at stimulating private sector investments in energy as attested by (a) build, own, and operate and build, own, and transfer policies regarding electricity generation; (b) removing the electricity pricing monopoly from NPC and NEA; and (c) making the terms of service contracts for petroleum, geothermal, and coal more attractive to investors. 4. Either lowering or raising oil prices gives rise to bitter destabilizing debates, putting the government in an unfavourable light. This makes the government reluctant to allow price increases even when warranted, a situation which could drive away the multinational oil companies in the process, forcing the government to assume their role and requiring to siphon off huge financial and other resources into the energy sector at the expense of many other sectors of the economy.
Considering the country's aspiration to be a newly industrializing economy by year 2000 it is found that inadequate energy supplies can be a major barrier in attaining that goal. Despite the absence of any condition that can dramatically increase domestic energy supplies, this study has shown that attainment of NIE status by year 2000 implies energy requirements eight to fifteen times local production or an annual energy import bill of US$9-18 billion at US$30 per barrel of crude oil. Hence extraordinary efforts to dramatically increase production of domestic energy resources are imperative in order to attain NIE status by year 2000.
Philippine Energy Policy and Problems
159
ABBREVIATIONS AND ACRONYMS BED BEU BOO
Bar
EO GDP GNP koe
lDI M bbls MW N NIE NPC OEA OPSF PD PGI PNOC toe
Bureau of Energy Development Bureau of Energy Utilization build, own, and operate build, operate, and transfer Executive Order Gross Domestic Product Gross National Product kilograms of oil equivalent Letter of Instruction thousand barrels megawatt population in number of persons Newly Industrializing Economy National Power Corporation Office of Energy Affairs Oil Price Stabilization Fund Presidential Decree Philippine Geothermal, Incorporated, a Union Oil subsidiary Philippine National Oil Company tons of oil equivalent
REFERENCES Asian Development Bank. Asian Energy Problems. New York: Praeger Press, 1982. ____ . Energy Indicators of Major Developing Member Countries of ADB, 1987. Bureau of Energy Utilization. Quarterly Review, various issues. Fesharaki, F. et al. Critical Energy Issues in Asia and the Pacific, The Next Twenty Years. Boulder, Colorado: Westview Press, 1982. Habito, C. and P. Intal. "Some Observations in Petroleum Pricing and Taxation in the Philippines". Philippine Economic ]ournal27, nos. 1 & 2 (1988): 76-88. Mahal Kong Pilipinas Foundation, Inc. Philippines' Best 1000 Corporations. 1988 and various issues. Makasiar, G.S. "Government Intervention in the Energy Industry Crisis". Philippine Economic Journal 27, nos. 1 & 2 (1988): 108-26. ____ ."Structural Response to the Energy Crisis: The Philippine Case". In Energy and Structural Change in the Asia Pacific Region, edited by R.M. Bautista and S. Naya, pp. 307-39. Metro Manila: PIDS/ADB, 1983. Manila Bulletin. "NPC Memorandum", 25 August 1989. Merklein, H. and W.C. Hardy. Energy Economics. Houston: Gulf Publishing Co., 1977. Ministry of Energy. National Energy Program 1986-1990. Metro Manila, 1986. ____ .Five Year Energy Program 1981-85. Metro Manila, 1981. Narisma, Corrie S. "Power Pinch to Ease as Gas Turbine Plant Operates", Manila Chronicle, 24 August 1989, p. 22.
160
Teodoro M. Santos
National Economic and Developm ent Authority (NEDA). Medium Term Development Plan 1987-1992 . Manila, 1986. ____ . Comment s on the paper by T.M. Santos entitled "Philippin e Energy Situation in a Changing Environm ent". Manila, 26 October 1989. National Power Corporati on. Comment s on the paper of T.M. Santos entitled "Philippin e Energy Situation in a Changing Environm ent". Manila, 25 October 1989. Office of Energy Affairs. Productio n, Consumpt ion & Planning Staff Services. Metro Manila: Fort Bonifacio. Paderanga , A.R.W. and C.W. Paderanga , Jr. "The Oil Industry in the Philippine s". Philippine Economic Journal 27, nos. 1 & 2 (1988): 89-107. Philippine National Oil Co. Energy Conservat ion Guideboo k for Industry. Makati: PNOC - ENERCO N Council, 1976. Velasco, G.Z. Toward Energy Self-Reliance: The Philippine Reform to the Oil Crisis, 1973-1981 . Makati, 1981. Villegas, B.M. Strategies for Crisis: The Story of the Philippine National Oil Company. Metro Manila: Center for Research and Communi cation, 1983. United Nations. World Energy Supplies. New York: United Nations. World Bank. The World Tables, 1983.
VI THE ENERGY ECONOMY OF A CITY STATE, SINGAPORE Tilak Doshi
T
he energy economy of Singapore is unique. The country possesses no conventional energy resources and its primary energy needs are met entirely by imports, almost exclusively petroleum-based. 1 Yet, Singapore has deservedly been called the "Houston of Asia" as its petroleum industry has placed the nation at the heart of the Pacific Basin's energy markets (Fesharaki 1984, 1986; Doshi 1989a). Singapore ranks as the world's largest fuel oil bunkering centre. Its refineries collectively constitute the world's third largest refining centre, and its spot market is the focal point of oil trade in the Asian-Pacific time zone. In February 1989, the Singapore International Monetary Exchange (SIMEX) launched a High Sulphur Fuel Oil contract, the first petroleum futures instrument east of Suez. The first section of this chapter attempts an interpretative look at economic growth and structural change in Singapore with a view to setting the wider context of the country's distinctive energy economy. Section two, directed towards the domestic aspects of the energy economy, summarizes salient attributes of the growth and configuration of domestic energy demand. The third section surveys the Singapore petroleum industry which provides a wide range of petroleum-related products and services largely for export markets. The impact of the oil price shifts on the Singapore economy is examined in the fourth section. The fifth section provides a discussion of energy policy in Singapore. The chapter concludes with some remarks on the linkages between public policy, economic development, and the energy sector. 161
162
Tilak Doshi
ECONOMIC GROWTH AND STRUCTURAL CHANGE Classified by the World Bank as a high-income developing economy with a GNP per capita of US$7,940 in 1987 (IBRD 1989), Singapore's standard of living (as measured by this basic indicator) is next only to Japan's in all of Asia. 2 Since the late 1960s, Singapore has on the average achieved one of the world's best overall economic performance. 3 It boasts one of the highest average growth rates among all countries of the world. This has been accompanied by little inflation. Singapore's experience is exceptional in comparison to the weighted averages for the upper middle income and the industrial market economies. It is outstanding even by the standards of the other high-performance East Asian newly industrializing countries (NICs), namely Hong Kong, South Korea, and Taiwan. Singapore's achievements in economic development are well documented 4 and, for present purposes, only the broader aspects need be delineated. When Stamford Raffles founded Singapore in 1819, an island of 583 square km, it was endowed with a vital natural resource - its location. Situated at the southern tip of the Malay peninsula astride the major gateway between the Indian Ocean and the South China Sea and possessing a superb natural deep-water harbour, Singapore underwent a logical development as port of call and entrepot for the surrounding region (Huff 1987). The development of entrepot activities led to rapid urbanization and the establishment of a strong local banking sector. By the inter-war period, Singapore had developed into a full-fledged port and commercial city. It had also become the region's terminalling and distribution centre for petroleum. As the country attained self-rule in 1959, it faced some of the classic problems of underdevelopment: rapid population growth, high unemployment, political instability, and unruly industrial relations. Entrepot trade and its traditional supporting services offered few opportunities for productively absorbing surplus labour. Given the constraints of size, import substituting industrialization (lSI) based on a common market with Malaya was seen as the only solution to the development problems of Singapore (UN 1961). Singapore's merger with the Malaysian Federation in 1963, however, proved unworkable, and the separation of Singapore from the federation in 1965 led the country to adopt its present independent and sovereign republican status. The loss of a common market effectively ruled out lSI as a feasible development path. From 1967 onwards, the government adopted a concerted export-oriented industrialization (EOI) strategy.
The Energy Economy of a City State, Singapore
163
Singapore has been hailed as the most open country in the world. The country's merchandise exports and imports as proportions of GOP exceed by far the corresponding ratios for the NICs and Japan. The country's openness to the international economy is a result of a consistent and highly liberal policy regime governing international trade and foreign investments (Tan and Ow 1982, Lloyd and Sandilands 1986). The government's policy towards foreign investments has been guided by an EOI strategy. This was accompanied by the recognition that, given the absence of a nascent class of domestic industrial capitalists, only large multinational firms possessed the requisite technological and marketing capabilities to successfully penetrate competitive world markets. The predominance of foreign over local sources in manufacturing investments is overwhelming. In 1987, for instance, 83 per cent of net investment commitments in manufacturing carne from foreign sources, primarily Japan and the United States (Yearbook of Statistics Singapore 1987). The massive scale of foreign direct investrnents 5 (FDI) in Singapore has led the city-state to become "one of the few truly internationalized countries in the world" (Mirza 1986, p. 2). In 1975, for instance, almost half of all FDI in Asia was located in Singapore; in 1983, the country received about 32 per cent of FDI destined for Asia, and almost 15 per cent of FDI flowing into all non-oil exporting developing countries (ibid, p. 6). On a per capita basis, this scale of capital inflow is phenomenal. The role of foreign capital is greatest in manufacturing. According to the annual Report on the Census of Industrial Production data, foreignowned manufacturing establishrnents6 accounted for 21 per cent of all manufacturing establishments during the decade 1975-84, yet contributed disproportionately to the manufacturing sector's total value added (65 per cent), direct exports (84 per cent), gross output (73 per cent), capital expenditure (67 per cent). and employment (55 per cent) (Koh 1987, p. 24). Singapore's high degree of reliance on FDI sharply distinguishes its economic development experience from that of most developing countries, including the other East Asian NICs. Export-oriented manufacturing now constitutes a core component of the economy. Manufacturing increased its contribution to GDP from about 17 per cent in 1960 to 27 per cent in 1987. About half of Singapore's foreign exchange earnings are derived from manufactured product exports, and the sector accounts for over 25 per cent of total employment in the country. Since its origins as a British-ruled entrepot, Singapore's economy has been primarily services-based. Despite the expansion of manufacturing activity, Singapore remains services-oriented in comparison to other upper
164
Tilak Doshi
middle-income countries (with the exception of Hong Kong). In 1960, the tertiary sector constituted 73 per cent of GOP, and in 1987, about 63 per cent. 7 The sector, however, has undergone important qualitative changes. Singapore's entrepot role has been recast and expanded as a provider of sophisticated international business services. Thus, although commerce still accounts for a substantial part of GOP, its importance has declined relative to transport and communications, and financial and business services. The establishment of many foreign banks, the growth in financial markets, and the operation of offshore dollar accounts have accompanied Singapore's emergence as a major regional management and distribution base for financial services involving risk management, fund management, and capital and futures market operations. The country is also the favoured location of many large corporations specializing in that subsector of business services sometimes referred to as "brain services". These encompass legal services, accounting and auditing, advertising, market research and public relations, computer and data processing services, architectural and engineering services, and business and management consultancy services. A major policy goal of the Singapore Government has been to consolidate the rapid development of the financial and banking services sector that occurred during the 1970s by further upgrading and restructuring the country's infrastructure serving the tertiary sector. It is perceived that a vital component of the country's future economic dynamism lies in the transition to an "information society" which is internationally competitive in a comprehensive array of business, financial, and related services (Ministry of Trade and Industry 1986). Clearly, the Singapore economy has become more diversified since the 1960s and the heavy dependence on the gross margins of traditional entrepot activity has been much reduced. Manufacturing, commerce, transport and communications, and financial and business services are the four economic pillars of modern Singapore (lee 1984). Given Singapore's location and historical development as the region's entrepot, it has long enjoyed a comparative advantage in providing services such as transport, communications, warehousing, and distribution. The government has maintained this advantage by accumulating large fixed investments in the country's infrastructure, including its airport, deep-water port, other non-residential construction, and telecommunications network. Singapore's economic dynamism has been underpinned by rates of savings and investment which are unmatched by any other market economy. Gross domestic savings as a proportion of GOP averaged 41
The Energy Economy of a City State, Singapore
165
per cent for 1980-87. A similar measure for gross capital formation for that period averaged an even higher 45 per cent. The large investments of the public sector have been made possible by the high level of enforced domestic savings through the Central Provident Fund. On the other hand, large inflows of foreign resources as equity or real assets financed the excess of investments over domestic savings. 8 Singapore's exceptional macroeconomic performance has thus been achieved without the burden of budget deficits, external debt, or inflationary pressures. In 1985-86, the Singapore economy underwent an unusually severe recession. For the first time in two decades the economy declined when real GDP contracted by 1.6 per cent in 1985. Real GDP grew by 1.8 per cent in the following year, a marginal improvement by Singapore's standards. The investigation of the recession by the Economic Committee9 was followed by its policy recommendations which fell into two categories: immediate policy measures to reduce private sector operating costs and taxes, and longer-term strategic policies to ensure Singapore's comparative advantage in the evolving global economy as a "total business centre for manufacturing and services" (Ministry of Trade and Industry 1986). The committee also endorsed the government's policy to appropriately divest state-owned enterprises, reduce the role of government in business, and further encourage private sector participation. Improved world conditions and the rapid and flexible policy responses by the government have been accompanied by a resumption in Singapore's excellent growth performance. Real GDP grew by 8.8 per cent in 1987, 10.8 per cent in 1988, and 9.2 per cent in 1989. The prospects for 1990 appear bright, and private and public sources forecast a growth rate of 7 to 9 per cent or higher. As the Singapore economy approaches maturity, the long-run trend rate of real growth is expected to be within the range of 4 to 6 per cent per annum.
The Political Economy of Rapid Growth The East Asian NICs have become noted for their remarkable rates of economic growth and structural change since the early 1970s. An extensive literature has grown up around the issue of what lies behind these successes. The dominant view among economists (Krueger 1978, Balassa 1982) has cast analyses of the NIC experience on the theory of comparative advantage based on factor endowments. Free trade based on comparative advantage extends a country's production and consumption possibilities, allows it to exploit economies of scale and, via the forces of international competition, prevents price distortions and the development of inefficient industries.
166
Tilak Doshi
- - - - - - - - -
The gains of free trade grow over time if saved and invested efficiently along the frontiers of evolving comparative advantage. As economies develop, their factor endowments change from an emphasis on unskilled and semi-skilled labour towards physical and human capital which in turn change the output structure and comparative advantage of their leading exports. Furthermore, the introduction of new goods and techniques through trade will increase the country's rate of technological innovation. Empirical studies tend to support this interpretation. In the specific case of the resource-poor East Asian NICs, the early stages of development were marked by labour-intensive exports followed by increasingly physical and human capital-intensive exports 10 (Krause 1987d). The policy regimes that have accompanied the NICs' EOI strategy based on comparative advantage have on the whole minimized price distortions and relied on the market mechanism for efficient resource allocation and rapid economic growth. The major policy prescriptions are the adoption of realistic exchange and real interest rates, the liberalization of imports, and export promotion. The corresponding view of the appropriate role of the state is to provide public goods required for the efficient functioning of market processes, most important of which are law and order, price stability, and infrastructural investments. Free market, open economy, and a minimalist state, it is argued, constitute the basic parameters of economic success. While there is little doubt that this interpretation has correctly identified key variables of economic success, it is also clear that various aspects of policy regimes in countries such as Taiwan, South Korea, and Singapore have not been fully specified (Bradford 1987). In the case of Singapore, the role of government is as varied as it is pervasive (Chen 1983, Ow 1986, Krause eta!. 1987). The government has intervened in the labour and domestic savings markets via wage guidelines and obligatory contributions to the Central Provident Fund, in private sector investment decisions through discretionary incentives, in major socio-economic sectors through statutory boards 11 , and in directly productive activity via government-owned enterprises. Fiscal and other incentives, highly selective by product, industry, and sector, have played an integral role in export-oriented growth, and the government has clearly influenced resource allocation in favour of industries deemed desirable (Chung 1987). State-owned and -managed enterprises, numbering an estimated 490 in 1983 and involving considerable capital investments, operate in a large number of key industries including trade, transport, communications,
The Energy Economy of a City State, Singapore
167
finance, construction, shipbuilding and repair, petroleum and petrochemicals, electronics, and engineering (Low 1984). Analysts of the Singapore development experience suggest that Singapore's achievements are due to a mixture of both elements, government policies and markets, in effective interaction (for instance, Chen 1983, Krause 1987c). Emphasis is put on an atypical combination of strong state leadership and economic liberalism, of dirigisme and little price distortion, as the fundamental internal factor contributing to the rapid growth and structural change of the Singapore economy. It is not possible to prove the validity of this judgement. The theoretical debate over the relative contribution of market forces and governments to economic progress re-emerged in the wake of the NIC phenomenon as a new variant often dichotomized as "getting prices right" or "getting policies right" - is an old issue in economics. The relationship between cause and effect is an elusive one in economics generally, and particularly so in analysing aggregate performance. Arnold Harberger notes "the virtual impossibility of building a direct link of modern theory between the observed growth rate of a country and its overall economic policy" (cited in Bradford and Branson 1987, p. 16). And Frank Hahn has pronounced that "equilibrium theory in general and neoclassical analysis in particular has nothing causal to say" (cited in Deane 1978, p. 218). Nevertheless, the empirical evidence on government intervention (including an entrepreneurial role) in Singapore suggests that a neutral policy regime of the sort sanctioned by neoclassical economic theory is not a necessary condition for rapid economic growth (Wade 1988). The economic thinking of Dr Goh Keng Swee, which has informed the pace and direction of diverse policies into a coherent and workable development programme, relies little on the strictures of capitalism per se 12 (Goh 1977). The export-oriented development strategy pursued by Singapore's planners has sprung not out of any ideological predilection for free trade but a combination of the advantages of location, the sheer necessity of size, and the historical traditions of an entrepot city. The ruling ideology, expressed and consistently practised by senior political leaders whose honesty and integrity have seldom been questioned, is economic pragmatism for the survival of a city state. 13 Most crucially, the state has so disciplined itself as to effectively channel market processes in line with long-run developmental goals. The government has implemented largely market-conforming policies 14 at arms length from sectional interests, and institutions of the state have successfully suppressed unproductive rentseekingY
168
Tilak Doshi
THE PATTERN OF DOMESTIC ENERGY DEMAND The growth and pattern of energy use in Singapore has been dictated by the specific circumstances of a small, equatorial city-state which has undergone rapid economic growth. Singapore's energy consumption grew rapidly between 1960 and 1980. Consumption in 1980 was over ten times as large as that of 1960 if refinery fuel and losses and international aviation are included; 16 excluding the two use categories, 1980 consumption was almost seven times that of 1960 (Ang 1987, p. 267). The period 1960-73, when real oil prices steadily declined, marked a rapid and consistent growth in energy consumption in Singapore (Table 1). Singapore's average rate of growth of commercial energy consumption, including refinery fuel and losses and international aviation (16.7 per cent), was well above the average for the rapidly growing ASEAN 17 economies (9.9 per cent). If fuels for international aviation and petroleum refining both important categories of energy consumption in Singapore - are excluded, Singapore's energy consumption grew at an annual average of 12.5 per cent (ibid.). This is still remarkable by any standard. Singapore's annual average growth rate in energy consumption fell to lower levels during the following period 1974-80. Nevertheless annual energy consumption (excluding aviation and refinery fuel use) grew by 8.2 per cent, reflecting the country's rapid adjustment to the first oil price shock and continued achievements in real economic growth. The energy TABLE 1 Commercial Energy Consumption and Energy Coefficient (In annual average percentage growth)
Singapore (I) Singapore (II) ASEAN (average)
Growth in Consumption
Growth in GDP
Energy Coefficient
1960-73 1974-80
1960-73 1974-80
1960-73 1974-80
16.7 12.5
5.9 8.2
10.0 10.0
7.9 7.9
1.7 1.3
0.7 1.0
9.9
8.1
6.5
7.1
1.5
1.1
NarEs: 1. Energy coefficient is the ratio of growth of energy consumption to growth of GOP. 2. Singapore (I) includes and Singapore (II) excludes fuels for international aviation and refinery use. SOURCE: Ang (1986, p. 24, Table 2.3).
The Energy Economy of a City State, Singapore
169
coefficient, defined as the ratio of the rate of growth in energy consumption to that of GOP, fell from 1.3 in 1960-73 to 1.0 in 1974-80. If refinery and aviation fuels are included, the reductions in the rate of energy consumption growth and in the energy coefficient between the two periods are more pronounced. Table 2 describes energy demand by major petroleum product categoryt8 from 1980 to 1987. The annual average growth rate over 1980-87 for total domestic demand, excluding refinery fuel and losses and international aviation, was 7.5 per cent. Fuel oil constitutes the largest component of Singapore's domestic product demand through the period. In 1987, fuel oil constituted about 68 per cent of total domestic product consumption. Fuel oil is used primarily for electricity generation, and less so for industry and maritime transport. The next most important fuel category for domestic consumption is diesel. Diesel is used mainly in commercial transport, though it is also utilized in industry to some extent. The use of kerosene in Singapore is insignificant since residential energy requirements are met by electricity, liquefied petroleum gas (LPG), and piped gas. LPG, a small consumption item, is used largely for household cooking as bottled gas, and its high rate of growth in consumption reflects a small initial base. Gasoline (including naphtha) constitutes a relatively TABLE 2 Domestic Demand for Major Refined Products, 1980-87 (In thousands of barrels per day) LPG Gasoline***
Kerosene
Diesel
Fuel Oil
Total
Aviation*
1980 1981 1982 1983 1984 1985 1986 1987
1.5 2.0 2.0 2.3 2.3 2.5 2.8 2.9
6.3 9.0 9.0 8.8 9.4 8.6 9.5 11.2
1.0 1.0 0.0 0.3 0.3 0.3 0.2 0.2
11.1 12.0 12.0 12.6 14.3 14.8 14.9 17.4
40.1 34.0 37.0 39.9 45.0 42.6 57.1 67.8
60.0 58.0 60.0 64.0 71.3 68.7 84.5 99.3
16.9 17.0 20.0 21.2 20.9 21.4 24.1 24.5
% Change**
9.6
8.4
-20.5
6.6
7.8
7.5
5.5
*Jet fuel. **Annual average percentage change. ***Includes naphtha. SOURCES:
Industry sources.
170
Tilak Doshi
small share of total domestic demand, a result of the government's effective policy of discouraging private vehicle ownership and use. In 1987, for instance, gasoline demand as a proportion of total demand for petroleum products amounted to about 11 per cent. Jet fuel for international aviation constitutes an important energy consumption in Singapore. Over 24,000 barrels per day (b/d) were supplied to aircraft19 calling at Changi Airport in 1987. Table 3 gives the energy balance for Singapore in 1986. Total energy imports for the year were 959,700 b/d of oil equivalent, virtually all consisting of crude oil or its products. Reflecting Singapore's entrepot role in petroleum refining and trade, 756,000 bid or over 78 per cent of energy imports were exported. Marine bunker fuels supplied to vessels calling at port 20 accounted for about 162,000 b/d or 21 per cent of total energy TABLE 3 Energy Balance for 1986 (In thousands of barrels per day of oil equivalent)
Imports Exports International Marine Bunkers Stock Change TOTAL ENERGY REQUIREMENTS
Petroleum Refineries Electricity Generation Other Transformation*
Coal
Oil
0.4 -0.2
959.4 -594.1 -161.7 38.9
959.7 -594.3 -161.7 38.9
0.1
242.5
242.6
-0.1
-120.5 -45.9 -1.4
Gas
Electricity
Total
0.9
-1.7 18.2 -1.9
-122.1 -27.7 -2.5
TOTAL FINAL CONSUMPTION
74.7
0.9
14.6
90.2
Industry Chemical** Transport Road Air Public/Commerce Residential Non-Energy Use
29.9 18.9 41.1 16.9 24.2
0.0
7.3
0.4 0.5
4.6 2.7
37.3 18.9 41.1 16.9 24.2 5.0 4.9 1.9
1.8 1.9
*Includes returns, transfers, statistical difference, own use, and losses. **Primarily fuel use and feedstock for the petrochemical complex. SOURCE:
lEA (1988).
The Energy Economy of a City State, Singapore
171
-------------
exports. The domestic market's total energy requirements (excluding aviation fuel and marine bunkers)2 1 amounted to some 220,000 bid of oil equivalent in 1986. Transformation losses of the refining sector constitute about half of the country's total energy requirements. 22 Transformation losses in electricity generation amounted to 27,700 bid, and electricity output was equivalent to 18,200 bid. In 1986, 900 bid of oil equivalent of piped gas was produced. 23 Of the 90,200 bid of energy available for final consumption, over 16 per cent was in the form of electricity, about 1 per cent in the form of piped gas, and the rest as refined petroleum products. Industry consumed 37,300 bid or over 40 per cent of energy available for final consumption in the country. However if energy consumption of the chemical sector (primarily composed of energy and petroleum-based feedstock used by Singapore's petrochemical complex) is excluded, the energy input requirement of industry is drastically reduced. Excluding the petrochemical sector, the industry share of final energy consumption is about 20 per cent. Given that industry accounted for a quarter of GOP, energy consumption per unit of value added in industry is relatively low. According to the Report on the Census of Industrial Production 1985, the average energy consumption per unit value added for manufacturing industry in 1985 amounted to 55 koe (kilograms of oil equivalent) per 1985 S$1,000 and energy costs as a proportion of total output in the sector amounted to little over 2 per cent. As a country totally lacking in tangible natural resources, industrialization has favoured technology- and skill-intensive enterprises. 24 Furthermore, the lack of indigenous sources of conventional primary energy puts a comparative disadvantage on production processes that are energyintensive.25 There are no major smelters, and tin-smelting, at one time a major industry in the country, ceased to be important by the early 1960s. Brickmaking and glass and pottery manufactures are relatively small. Cement production does not include the basic kilning process and uses imported clinker. Steel production involves only the recycle of scrap. Since the mid-1970s the government's policy emphasis on high-technology, highskill, and high-precision industry has encouraged an evolving industrial output-mix which is not energy intensive. Although industry consumed only 7,300 bid of oil equivalent energy in the form of electricity, the latter constitutes a much larger share about 40 per cent of total energy utilized by industry - if the petrochemical sector is excluded. According to the estimates of an energy end-use analysis based on 1985 data (Ang 1988)2 6 , the proportion of
172
Tilak Doshi
electricity in total energy use by industry was 45 per cent, an even higher figure. The extremely large share of electricity in the sector's energy utilization is a result of several factors. The nature of production processes in the high value-added sectors emphasizing technology- and precisionintensive products favour electricity as the cleanest and most versatile form of energy available. Furthermore, the country's equatorial climate and high per capita income have led to increasing requirements for airconditioning at the work place. Leading growth sectors such as electronics and electrical components, precision tools, and sophisticated equipment necessitate amenable working environments for high labour productivity. A breakdown of electricity end-use in industry for 1985 estimates 55 per cent for production processes, 23 per cent for air-conditioning, and the rest for lighting and other purposes (Ang 1988, pp. 3-4). The transport category in the energy balance (Table 3) includes two components, air and road. As a focal point of international aviation routes with one of the busiest and most modern airports in the region, Singapore is Asia's major supplier of jet fuel. International aviation accounted for 24,200 b/d of fuel supplied to aircraft calling at the Changi International Airport. Internal transport is entirely road-based. Its energy requirements amounted to 16,900 b/d. About two-thirds of the sector's energy consumption is for passenger transportation and one-third for freight; 60 per cent of energy consumption is gasoline-based and the rest (primarily of buses, taxis, and heavy goods vehicles) diesel (Ang 1988, pp. 1-2). The public and commerce sectors consumed 5,000 b/d of oil equivalent energy, primarily in the form of electricity (92 per cent) and the rest in piped gas. These sectors include large commercial buildings (hotels, office blocks, and shopping complexes), public buildings (government departments, educational institutions, hospitals, airport, etc.), and smaller commercial establishments, public lighting, and other non-residential uses not classified elsewhere. End uses for electricity consumed by these sectors are primarily air-conditioning, lighting, lifts and escalators, and office equipment. Piped gas, along with smaller quantities of bottled LPG and diesel, is used for cooking and heating water systems. The residential sector accounted for little less than 5,000 b/d, over half of which was in the form of electricity. Given the high income elasticity of demand for air-conditioning, energy consumption for this use has been rising rapidly (Ang 1988, p. 5). Piped gas and bottled LPG are used by households for cooking purposes. Households account for about 55 per cent of gas consumed in the country, the rest being used in the commercial sector.
The Energy Economy of a City State, Singapore
173
Public Utilities: Electricity and Gas The Public Utilities Board (PUB), a statutory body, is responsible for the supply of electricity, town gas (piped gas), and water. Supervision of the PUB rests directly with the Ministry of Trade and Industry. The costs of maintaining and expanding electricity supplies, including fuel acquisition, are the responsibility of the board. When PUB was formed, it faced an unprecedented increase in demand for utilities to support Singapore's vigorous industrial and public housing developments of the 1960s and 1970s. Electricity and gas utilities underwent a period of rapid expansion. PUB's electricity supply is available to all parts of Sin~apore, including the major southern offshore islands. Electricity is generated at four power stations, namely Pasir Panjang, Jurong, Pulau Seraya, and Senoko. Table 4 describes the power plant development programme since 1960. Senoko, with an installed capacity of 1,610 MW, is Singapore's largest power station, accounting for about 48 per cent of PUB's total generating capacity of 3,371 MW in 1987. Two 100 MW generating units will be installed at Senoko Power Station by 1990. By end 1987, all three 250 MW generating units which form Stage 1 of Pulau Seraya Power Station had been synchronized and begun operations. Total cost was estimated at S$775 million inclusive of land costs, according to PUB's 1987 Annual Report. The PUB is proceeding with the construction of Pulau Seraya Stage 2, comprising three units of 250 MW turbine generators together with associated transmission facilities. Stage 2 will be operational by 1992/3 at a cost of S$1 billion. Total output grew from 2,205 million kWh to 10,466 million kWh between 1970 and 1986, representing a growth rate of about 10 per cent per annum (Ibrahim 1987). Generating capacity expanded from 644 MW to 2,821 MW over the same period (ibid.). Thermal efficiency of electricity generation improved from 27 per cent in 1966 to 36 per cent in 1987 (Kadir and Kim 1985, PUB Annual Report 1987). Transmission and distribution losses fell from 7.8 per cent of electricity generated to 4.9 per cent over 1960-82 (Kadir and Kim 1985). The improvements in efficiency reflect the use of larger and superior equipment and regular maintenance and inspection schedules. Of the total 2,696 MW capacity in 1983, 1,230 MW consisted of 250 MW generating sets (ibid., p. 19). Building construction for a new centralized control centre at Ayer Rajah was completed in 1987 at a cost of S$60 million. The Ayer Rajah premises will locate together the Power System Control Centre, Distribution Control Centre, and the Service and Operations Centre. These systems, which will remotely monitor power station operations and the
174
Tilak Doshi
TABLE 4 Power Plant Development Programme, 1960-85 Power Station StJames
Pasir Panjang A Pasir Panjang B Jurong Stage I Jurong Stage II Senoko Gas Turbines Senoko Stage I Senoko Stage II Senoko Stage III Pasir Panjang Jurong Puiau Seraya Stage I
Puiau Seraya Stage II
Installed Capacity (Steam/Gas Turbines) 58 MW gas turbines (6 X 6 MW) (2 X 11 MW) 125 MW steam turbines (5 X 25 MW) 240 MW steam turbines (4 X 60 MW) 240 MW steam turbines (4 X 60 MW) 360 MW steam turbines (3 X 120 MW) 40 MW gas turbines (2 X 20 MW) 360 MW steam turbines (3 X 120 MW) 750 MW steam turbines (3 X 250 MW) 500 MW steam turbines (2 X 250 MW) 201 MW gas turbines (96 MW & 105 MW) 210 MW gas turbines (2 X 10⁵ MW) 40 MW gas turbines (2 X 20 MW) 750 MW steam turbines (3 X 250 MW) 750 MW
Commissioned
Decommissioned
1960-64
1980-83
1962-63
1982
1965-66
1985-87
1969-71 1973-74 1972-73 1976 1978-79 1983 1982-83 1986 1987 1987-88 Planning being finalized, targeted for commissioning in 1992-93
SoURCE: PUB, Singapore.
distribution system and operate a 24-hour power failure and breakdown service, will constitute one of the most sophisticated remote control networks for electrical utilities in Asia. By early 1989, all street lights would be covered by the Ripple Control System, which allows remote adjustments for flexibility and energy conservation. Singapore and Malaysia have
The Energy Economy of a City State, Singapore
175
established a new 200 MW power link at a cost of S$41 million which allows the two countries to share reserve capacity and to draw on each other's supplies in emergencies. Demand for electricity by sector for the decade 1978-88 is given in Table 5. The number of accounts almost doubled from over 490,000 to 783,970. Domestic (residential) consumers accounted for 86 per cent of these accounts in 1987 (Yearbook of Statistics Singapore 1987). However, domestic consumption constituted only about 16 per cent of total electricity consumption in the same year. Growth of electricity use has been most rapid in manufacturing and other industries, which include the commerce, construction, and services sectors. Per capita consumption of electricity was 4,433 kWh in 1987, a tenfold increase over 1963 and second only to Japan among East Asian countries (PUB 1988). Table 6 displays the production and consumption of electricity on a per capita and per dollar GOP basis for the years 1978 to 1988. Consumption and production of electricity grew at an annual average of over 8 per cent through the decade. Given the low rate of population growth over the period, per capita production and consumption expanded by a high annual average of about 7 per cent. Despite increased efficiency in the generation and use of electricity, production and consumption of electricity per dollar GOP increased annually by an average of 1.1 per cent and 1.2 per cent respectively. The PUB proposed in 1987 a ten-year expansion and upgrading investment plan estimated to cost over S$6.2 billion (PUB Annual Report 1987). The bulk of the funds, about S$5.2 billion, will be channelled into electricity generation and supply to meet increased demands for electric power. Electricity demand is expected to grow at a rate of about 6 per cent over the next decade (Ibrahim 1987). Kadir and Kim (1985) forecast growth in generation capacity to about 5,700 MW by the year 2000. Since 1959, PUB's gas distribution network expanded rapidly along with the government's massive public housing programme. Between 1980 and 1985, however, the PUB ceased further development of the piped gas network, in order to foster private sector involvement in the gas supply industry. The industry supplied bottled gas (LPG) to the residential gas market during the years when the residential construction industry boomed. At present, the PUB supplies piped gas to an estimated 200,000 consumers who consume about 40 per cent of the gas used in Singapore. One in three households uses piped gas. The distribution network is fed by gas cracked from naphtha. Production is carried out in six gas units at the Kallang Gas Works and piped to consumers through 1,740 km of
TABLE 5 Electricity Production and Consumption, 1978-88 (In million kilowatt-hours) -
Consumption Year 1978 1979 1980 1981 1982 1983 1984 1985 1986 1987 1988
Production 5,898 6,483 6,968 7,462 7,883 8,665 9,452 9,917 10,577 11,814 13,018
Export Total
Domestic
Manufacturing
Other Industries
5,214 5,744 6,198 6,660 7,000 7,698 8,399 8,871 9,476 10,617 11,735
888 945 1,014 1,093 1,167 1,313 1,336 1,462 1,565 1,729 1,864
2,607 2,803 2,947 3,156 3,218 3,505 3,927 4,019 4,268 4,844 5,472
1,671 1,902 2,145 2,338 2,564 2,825 3,063 3,340 3,643 4,044 4,399
SOURCE: Yearbook of Statistics Singapore (1988).
48 93 92 74 52 55 73 50
-
-
No. of Consumer Accounts 498,994 526,669 556,224 575,250 591,416 611,449 670,736 712,450 731,163 750,860 783,970
TABLE 6 Electricity Production and Consumption, 1978-88 (Per capita and per $ GOP) Per Capita Per Capita Per 5$ GDP Per 5$ GDP Consumption Population Production Consumption Production Consumption Real GDP (kWh) (kWh) (kWh) (kWh) (million kWh) ('000) (5$ million)*
Year
Production (million kWh)
1978 1979 1980 1981 1982 1983 1984 1985 1986 1987 1988
5,898 6,483 6,968 7,462 7,883 8,665 9,452 9,917 10,577 11,814 13,018
5,214 5,744 6,198 6,660 7,000 7,698 8,399 8,871 9,476 10,617 11,735
2,354 2,384 2,414 2,443 2,472 2,502 2,529 2,558 2,586 2,613 2,647
24,046 26,285 28,833 31,603 33,772 36,537 39,573 38,924 39,641 43,141 47,908
2,506 2,719 2,886 3,054 3,189 3,463 3,737 3,877 4,090 4,521 4,918
2,215 2,409 2,568 2,726 2,832 3,077 3,321 3,468 3,664 4,063 4,433
245 247 242 236 233 237 239 255 267 274 272
217 219 215 211 207 211 212 228 239 246 245
8.2
8.5
1.2
7.1
7.0
7.2
1.1
1.2
Annual Growth(%) *In 1985 dollars. SOURCE: Yearbook of Statistics Singapore (1988).
178
Tilak Doshi
gas mains extending over major areas of the country. Table 7 gives figures for gas production and sales by sector from 1978 to 1988. Gas production totalled 681 million units in 1988. Overall thermal efficiency was 90.4 per cent and total feedstock consumption (naphtha and LPG) was 51,108 tonnes (PUB Annual Report 1987). The PUB's present production capacity is 735,000 cubic metres per day (m 3 /d), although demand is about 300,000 m 3 /d. The last plant put onstream in 1982 added 150,000 m 3 /d capacity to the system. A gas-making plant with a capacity of 150,000 m 3 /d was to be commissioned in 1989. There are three gas holders in use with a combined capacity of 98,000 m 3 • About 7 per cent of total gas sold by the PUB is piped LPG, supplied from LPG tanks installed in housing estates. Tanker trucks are used to refuel the LPG tanks. The present sectoral consumption breakdown is about 54 per cent for household use, 40 per cent for commercial service users (such as hotels and restaurants), and less than 10 per cent for industry. The PUB's Gas Department is planning to double its customer base over the next five years. Current plans are to connect 200,000 residential units to the distribution system between 1986 and 1990 at a total cost of US$19 million. TABLE 7 Town Gas Production and Consumption, 1978-88 (In million kilowatt-hours) Consumption Year
1978 1979 1980 1981 1982 1983 1984 1985 1986 1987 1988
Domestic
Production
539 597 614 626 625 605 609 570 577 624 681
Total
Public Housing
490 527 552 561 570 567 573 541 550 604 669
213 234 247 249 258 261 267 252 244 245 256
Others
Non-Domestic
73
204 221 235 245 250 245 245 233 254 310 363
SOURCE: Yearbook of Statistics Singapore (1988).
72 71
67 63 61 61 56 52 49 50
No. of Consumer Accounts
166,011 176,902 187,944 190,509 189,660 190,087 188,445 185,246 186,507 189,610 205,930
The Energy Economy of a City State, Singapore
179
AN OVERVIEW OF THE SINGAPORE PETROLEUM INDUSTRY Table 8 gives an overview of the petroleum industry, classifying the major activities under downstream and upstream sectors. 27 The downstream sector consists of the following major activities: petroleum refining, trading of crude and refined products, fuel oil bunkering, independent storage and blending, and petrochemicals. Upstream sector activities fall into two categories: the marine sector for rig and tanker building and repair, and the services sector comprising technical and support services for the region's offshore hydrocarbons industry.
Refining With a nominal primary distillation capacity of some 940,000 bid, Singapore is the world's third largest refining centre after the U.S. Gulf Coast and Rotterdam. As Asia-Pacific's premier entrep6t refining centre, Singapore refiners perform a "swing" role for the region by balancing disparities between supply and demand for a range of petroleum products and competitively filling specific product deficits of a large number of countries in the region. Measured by capital assets in place and by linkages to other downstream activities, Singapore's refineries constitute the heart of the country's petroleum industry. Shell, Esso, Mobil, the partly government-owned Singapore Refining Company (SRC), and BP constitute the five refinery establishments in the country. Singapore's small volume of domestic demand did not, in itself, justify the massive refinery investments. The industry initially developed in Singapore to supply the distribution networks of the majors'28 regional affiliates. The country's role as an entrep6t refiner essentially derived from four crucial features. First, there was an overall lack of refining capacity to fulfil regional product demand so that Singapore was surrounded by rapidly growing markets lacking refinery facilities. Second and equally important, there was an incompatibility of the technical configuration of existing refineries with product demand patterns. The region's refineries were simply incapable of producing an output mix that matched the demand composition of petroleum products. Third, the establishment of a stable socio-political climate hospitable to foreign enterprise by the Singapore government provided confidence to private entrepreneurial decisions which committed heavy investments in capital-intensive industries. A stable policy environment is essential to the maintenance of high rates of investment by private capital, particularly in capital-intensive
TABLE 8 Overview of the Petroleum Industry Activity
Agents Involved
Scale of Activity
DOWNSTREAM 1. Wet Barrel Trading
More than fifty trading entities, composed of refiners, independents, state and private oil companies
Focus of the Pacific Basin spot market. Estimated 1.9 million b/d average for first half of 1988.
2. Paper Barrel Trading *
Traders, refiners, large oil companies, regional electrical utilities, brokerage and finance firms
The first futures market east of Suez.*
3. Bunker Fuel Oil
Over thirty bunker suppliers, PSA, shipping clients, refiners, independent storage
World's largest bunkering centre. 8.5 million tonnes delivered in 1987.
4. Independent Storage I Blending
PakTank, Van Ommeren, Oil tanking**
Region's major independent oil storage centre. Over 900,000 m 3 current capacity.
5. Petrochemicals
PCS and downstream plants
Ethylene-based product capacity of upstream plant: 300,000 tons per year.
6. Refining
Five refinery establishments (Shell, Esso, Mobil, SRC, BP), contract refining clients
World's third largest refining centre. 1.1 million b/d nominal crude capacity.
UPSTREAM 7. Rig and Tanker Building & Repair
FELS, Bethlehem
Leaders in region's marine industry.
8. Other Offshore Support
Oilfield equipment manufacturers; repair, maintenance, and logistics services companies
Asia-Pacific's base of support services for offshore hydrocarbons industry.
*Fuel oil futures contract launched by SIMEX in February 1989. **Committed plans to build 210,000 m 3 storage capacity
The Energy Economy of a City State, Singapore
181
industries involving long amortization horizons. Finally, Singapore's geostrategic and infrastructural endowments - namely, the country's natural deep-water port and its focal position in the transport and communications network among the rapidly growing economies of East and Southeast Asia - provided the essential prerequisite for entrepot refining. The proximity to Vietnam during the period of the United States' military intervention in Indo-China also played an important role in the industry's early expansion. The contribution of the industry to total manufacturing output, though reduced in recent years, is substantial. For the last decade, it peaked at over 40 per cent for the years 1977 and 1982; thereafter, the contribution fell monotonically to a low of 16.3 per cent in 1987 (Yearbook of Statistics Singapore 1987). The industry's share of GOP attained its peak at 6.3 per cent in 1980 and 1981, thereafter diminishing progressively to under 2 per cent in 1987 (ibid.). This diminution in the industry's contribution to output and value added reflects the erosion in petroleum prices since 1981. The drastic fall in the industry's share of output from 29 per cent in 1985 to 19 per cent in 1986 was an outcome of the oil price collapse in 1986. Investment in the industry constitutes a major proportion of total investments in the manufacturing sector as a whole. In the late 1970s, investments in the petroleum industry as a proportion of total investments in the manufacturing sector ranged between 20 per cent in 1977 to over 28 per cent in 1980 (Report on the Census of Industrial Production 1986). Thereafter the share diminished to just under 7 per cent in 1986 (ibid.). These investments led to the growth in capacity and complexity of the republic's refining industry. Refinery investments totalling S$1.7 billion were made during 1980-86 primarily to upgrade facilities with computerized control systems, energy conservation equipment, and secondary processing units (Economic Survey of Singapore 1986). The refining industry, despite its relative diminution since 1981, figures prominently in the manufacturing sector. The industry, constituting 0.3 per cent of all manufacturing establishments (engaging ten or more workers) and employing 1.2 per cent of the total labour force in the manufacturing sector, contributed 3.9 per cent of labour's total remuneration in manufacturing, 16.3 per cent of total manufacturing output, and 5.5 per cent of the sector's value added (Economic Survey of Singapore 1987, p. 113). 29 As a capital-intensive industry, its value added per labourer was almost five times that of the average for the manufacturing sector as a whole, although its ratio of value added to output (11 per cent)
182
Tilak Doshi
is the lowest among all industries, compared to the average (32 per cent) for the manufacturing sector (ibid.). While the petroleum industry obviously ranks low in its contribution to employment, it has a leading role in the manufacturing sector in terms of material inputs utilized, output, value added, total sales, direct exports, and capital expenditure. Despite the drastic fall in oil prices during 1986, and the correspondingly reduced value of material utilization, output, sales, and exports, the petroleum industry still ranked either second or third in most of the categories listed among the thirty-one industry divisions analysed by the Report on the Census of Industrial Production 1986. In the series of traumatic events that marked the 1970s, affecting energy markets everywhere, the world refining industry was reduced to one of excess capacities and low or negative profit margins. Although world annual demand for refined products grew little more than 1 per cent over 1973-80, refining capacity proceeded to expand by 4.5 per cent over the same period (Fesharaki and Isaak 1984, p. 9). The continuation of capacity increase despite stagnating demand can be partly explained by the long investment lead times and response lags typical of a capital-intensive industry. However, the policy-induced distortions in major consumer nations which attempted to insulate domestic refiners from world conditions may have been no less important in this respect. Nevertheless, after a period of belated and forced adjustments, much of the huge capacity surplus of the 1970s and early 1980s in North America and Western Europe has been eradicated through a process of capacity shutdowns, attrition, rationalization, and modernization of facilities. The emerging refinery configuration of the Western industrialized nations is increasingly geared with high secondary conversion ratios towards producing premium fuels for transport and, to a limited extent, petrochemical feedstock. In this changed environment, the demise of entrepot refining in Singapore - based as it was on relatively simple processing facilities was often predicted. In the 1980s, with the construction of major source refineries in the Persian Gulf and Indonesia as well as import-substituting refineries among Asian countries with protected domestic markets, the conventional wisdom of industry observers continued to suggest a severe contraction of Singapore's refinery operations. Yet, in the months from August 1987 to March 1988, Singapore refiners announced a series of major investments totalling US$490 million in secondary conversion facilities. Industry spokesmen have cited these investments as "acts of faith" and "expressions of confidence" in the future of the Singapore refining industry (Singh 1988a).
----
The Energy Economy of a City State, Singapore
183
At first glance, this may seem a remarkable turnaround of expectations in the industry. A careful assessment of the region's evolving oil economy, however, indicates that the major investment commitments of the Singapore refiners have been strategic decisions forced upon the industry by the changing pattern of the regional demand barrel and the competitive pressures expected from source refineries. By enabling the use of cheaper feedstock and allowing greater flexibility in the selection of crude slates and in the variation of yields between light or middle distillates and residual fuel oil, the upgrading of the Singapore refining industry will serve to maintain the industry's competitive position. The prospects of buoyant demand for refined products in Asia-Pacific provide the underlying basis for the continued viability of Singaporebased refining. Indeed, the unprecedented rates of growth in oil demand throughout most of the region since 1987 have led Singapore refinery throughputs to attain capacity levels (of 870,000 bid to 900,000 bid) not experienced since 1982i83. The refining sector has experienced high levels of profitability with a sustained boom for most of 1988 and 1989. Tollprocessing clients now face costs almost double those of previous rates, with reported term-processing fees of about US$1.40 per barrel during the last quarter of 1989. By virtue of its location and competitive advantage, the Singapore refining industry should benefit from rapid growth in regional product demand, while the large investments in secondary processing facilities will undoubtedly place the industry in a better position to exploit the evolving composition of regional product demand. The growth in relative importance of light and middle distillates demand - the further "whitening" of the demand barrel - in the region also suggests that the upgrading investments of Singapore refiners should yield high dividends. The major consuming countries in the region have or are in the midst of expanding and ugrading refineries to meet growing domestic demand for refined petroleum products and a changing demand composition in favour of lighter products. Nevertheless, the sheer pace of growth in overall demand as well as the change in oil demand patterns, and the resulting imbalances with respect to refining yields, suggests a continued role for entrepot refining in Singapore. Given high rates of growth in demand for refined products in general and for the light and middle distillates in particular, the region's refining industry will neither have the capacity nor the flexibility to meet such requirements in the 1990s. While current refinery constructions may be adequate to meet projected demands for the next five years, further substantial investments would be required
184
Tilak Doshi - - - - - - - - - -
to restructure the region's industry to meet even part of the increased requirements for capacity and flexibility. The outlook for an expanding Asian-Pacific trade in refined petroleum products, and for Singapore's continued role as a competitive regional swing refiner, seems assured in the short and medium term.
Oil Trade Petroleum constitutes the single largest commodity in Singapore's foreign trade. Trade in petroleum constituted almost a fifth of total trade in 1987 (Yearbook of Statistics Singapore 1987). The figure was even higher during the early 1980s, at over 30 per cent, reflecting the higher prices of crude prevailing then. Refined products account for almost a quarter of the total value of domestic exports 30 which, in turn, constitute 65 per cent of the value of Singapore's total exports (Economic Survey of Singapore 1987). About two-thirds of the refining industry's output is exported, characterizing the outward-orientation of Singapore's refineries. Parallel to the developments in the world petroleum market, 31 trading activity proliferated in Singapore particularly after the second price shock of 1979/80. The expansion of Singapore-based trading operations has been striking. There are now over fifty traders, ranging from the oil majors and refiners to independents, state oil companies, and Japanese trading houses. It is estimated that the trade averaged 1.9 million b/d over the first half of 1988. The Singapore spot market is the focal point of the oil trade in the Asian-Pacific region. Around Singapore are located the major markets of the Pacific Basin - Japan, South Korea, Taiwan, Australia, India, etc. The republic is also in proximity to Asia's crude producers - Malaysia, Indonesia, China, and Brunei. Singapore's petroleum refining, blending, storage, and shipping capabilities provide the essential complements to its trading nexus. Being neither a producer nor a major consumer, and coupled with a stable policy environment hospitable to private enterprise, the country has the necessary ambience for a free market in petroleum trading. The effective provision of an infrastructure of international standing - which includes excellent port and shipping facilities, an advanced telecommunication and logistics network, a matured legal, accounting, and financial services base and, not least, a stable sociopolitical order - supports the role of Singapore as Asia-Pacific's premier oil trading centre. In conjunction with its role as the region's premier oil trading centre, the Singapore spot market serves as the pricing benchmark for most
The Energy Economy of a City State, Singapore
185
petroleum transactions in the regional market. The country's active spot market has made Singapore-quoted prices the key indicators for most supply contracts for crudes and refined products in the Asian-Pacific time zone. With an active trading enclave and extensive refining, storage, and shipping facilities, Singapore provides an ideal reference point against which to set prices for transactions in the Asian-Pacific time zone. However, the regional market is "opaque" relative to the Atlantic Basin (Krapels 1988) in that market fundamentals are largely a matter of informed guesses by participants. Current and regularly updated data (weekly and monthly) on stocks, production, refinery throughputs and so on are nonexistent for most countries in the region (including Singapore). 32 In this respect, the function of the Singapore spot market as the region's price indicator is especially crucial. Energy Futures In the last five years, energy markets have undergone a "revolutionary change" with the rapid growth of trade in energy futures contracts (Petroleum Intelligence Weekly Special Supplement, 5 September 1988). The emergence of the oil futures markets and their remarkable growth was an outcome of concurrent trends in the petroleum, financial, and commodity markets. After 1985 in particular, with enhanced price volatility in energy markets, there has been a mushrooming of trade in a variety of energy futures contracts. Singapore launched a futures contract in High Sulphur Fuel Oil (HSFO) on the Singapore International Monetary Exchange (SIMEX) in February 1989. The contract serves for 100 metric tonne lots of 4 per cent sulphur, 180 centistokes bunker fuel oil with a contract period of six consecutive months and FOB delivery at seller's ex-shore, ex-ship, or ex-barge facility in Singapore. 33 As the world's largest bunkering port delivering up to a million tonnes of fuel oil each month, Singapore has already developed an active physical bunker oil market. Besides providing a ready baseload of physical trade, Singapore's large bunkering industry already possesses an infrastructure capable of delivering small parcel sizes crucial to a viable trade in futures contracts. The large number of participants in the fuel oil trade provide a ready clientele for the contract. Traders, the major oil companies, refiners, and regional electrical utilities (including Singapore's Public Utilities Board) constitute potential candidates who would use the opportunity for risk management via the futures market. Interested parties would also include the large financial firms such as J.P. Morgan and Merrill Lynch, the "Wall Street refiners" Phibro and Morgan Stanley, the
186
Tilak Doshi
giant brokerage firm Refco, and the major Japanese trading houses such as Nomura, C. Itoh, and Sumitomo, all of which have established offices in Singapore. The rationale for launching an HSFO futures contract extends beyond the specifics of the Singapore fuel oil market. Fuel oil is the most widely traded and consumed product east of Suez. The volume of fuel oil traded in the Pacific basin exceeds that of either Western Europe or North America. The fuel oil market is also more competitive than that of other petroleum products and, hence, requires a higher level of risk management instruments. While it is currently possible to hedge the light and middle ends of the demand barrel, heavy fuel oil is conspicuous by its absence in any of the world's futures exchanges. 34 Furthermore the gap between the Asian-Pacific time zone and the Atlantic energy futures exchanges of New York and London poses obstacles to the intensive use of futures contracts on the NYMEX and IPE by regional interests. The petroleum industry in the Asia-Pacific already bears sufficient risk exposure to exert a considerable demand for new risk management instruments including energy futures contract (Krapels 1988). According to the Working Committee35 set up to study the feasibility of the futures contract, the Singapore oil industry has an expressed desire for a risk management facility in the Asian-Pacific time zone to limit exposure to volatile oil prices. While the attachment to conventional physical trading among members of the Singapore petroleum trading enclave has been noted by most observers, it is likely that the larger traders, oil companies, and refiners will increasingly perceive the advantages of deriving price transparency and hedging opportunities via the use of futures. After just about a year of being traded, the HSFO futures contract seems to have attracted a core of committed traders and, illustrating a growing confidence in the market, a volume of 99 million tonnes was recorded for the HSFO contract for the ten months of 1989 since its launch. While there remains the question as to what extent volumes of trade have been inflated by multiple sales among brokerage houses, and nagging liquidity problems have been reported for the first six months of the trade, it would seem that the futures trade has established itself in the region's trading enclave. Currently, proposals to launch another energy futures contract in SIMEX (for Dubai crude) is under consideration. A successful Singapore HSFO futures contract would fill the gap that currently exists in oil futures at the heavy end of the product barrel and widen the opportunities for hedging, for arbitraging against existing energy markets, and for speculating in the Pacific Basin markets. It would
The Energy Economy of a City State, Singapore
187
also fill an important time and regional gap in the global energy futures market, and act as a catalyst for boosting the regional market liquidity. Finally, a matured trade in the HSFO contract would add to price transparency. This last function is particularly relevant to the Pacific Basin market which is notably "opaque" relative to its Atlantic counterpart. Bunkering
The strategic location of the island of Singapore at the juncture of two oceans and the corner of the world's largest land mass has conditioned - indeed, formed the very basis of - the country's economic achievements. The Port of Singapore has developed into a major maritime service centre providing a comprehensive array of services ranging from cargo and container handling to ship supplies and repairs. The high level of shipping traffic has led the port to attain its status as the world's busiest since 1986. It is also one of the world's largest container ports. In 1987, 33,846 vessels of about 700 shipping lines from eighty countries stopped by the port. Vessels arrive or depart at the rate of about one every eight minutes. The delivery of bunker fuels to ships calling at the Port of Singapore has emerged as an important service industry in its own right. Over the period 1977-85, between 4 to 6 million tonnes of bunkers were delivered annually. 36 Throughout this period, the bunkering industry was dominated by six oil majors. In September 1985, the government removed customs duty on bunker fuel. This provided an impetus to the industry by allowing the forces of competition to lower prices and improve the quality specifications of bunker fuels supplied to ships. The volume of bunkers delivered expanded remarkably, from about 5 million tonnes in 1985 to 8.5 million tonnes in 1987. In that year, Singapore became the world's largest bunkering centre, overtaking Rotterdam's total delivery of slightly less than 8 million tonnes. The number of vessels taking on bunkers increased from 8,755 in 1984 to 11,623 in 1987, representing an increase of 30 per cent; the average intake per vessel increased from 600 tonnes to 800 tonnes. Bunkers are supplied to ships either through anchorage facilities or directly via shore pipes to Port of Singapore Authority (PSA) wharves. The anchorage facilities supply bunkers through barges, and have about an 80 per cent share of the bunker market. There are over thirty bunker suppliers currently operating in Singapore, including almost all the major international bunker traders and suppliers. Besides the geo-strategic
188
Tilak Doshi
location of the natural deep-water Singapore harbour, the factors most directly responsible for Singapore's emergence as the world's premier bunkering port include the effective endowment of port facilities with the requisite infrastructural investments by the PSA. The fiscal liberalization of the bunkering industry in September 1985 has also proved to be a major contribution to the growth of the industry, coinciding as it did with the sharp fall in crude prices and recovery in international shipping. With extensive petroleum refining, trading, and storage facilities to complement the bunkering industry, Singapore ex-wharf bunker fuel prices compare favourably with the U.S. West Coast, Rotterdam, and Persian Gulf bunkering centres (Kristiansen 1988). The rapidly growing export-oriented economies of East and Southeast Asia are expected to support a large expansion of trade in the AsianPacific region over the next decade. The demand for shipping services and requisite bunkering requirements will increase correspondingly. An annual growth rate of between 6 and 8 per cent in Singapore's bunker sales is expected over the next five years (Seah 1988).
Independent Storage and Blending The storage of crude petroleum and refined products constitutes an integral part of industry logistics beyond the mere holding of crude and refined products to be distributed. In refining centres, tankage capacity is required for intermediate products awaiting further processing. Storage depots also function as centres for client logistics and product blending. Storage facilities are a requisite in the breaking of bulk, where long-range shipments of cargoes to major distribution centres are disaggregated into smaller lots for delivery to regional and local receiving points. Access to storage tanks is essential for traders who need to hold cargoes in order to synchronize their transactions with price trends, i.e., to hold on to a cargo until "the price recovers". Without access to hired storage, traders are often forced to sell their cargoes at "distress prices" without the option of waiting for an upswing in pricesY Thus, a market glut might be accentuated by forced sales caused by the unavailability of tankage. Much of the world's oil storage capacity is owned by either governments or the oil majors, although in the last decade independent storage has become an increasingly important service industry in its own right. With the fragmentation of the petroleum industry since the mid-1970s, a multiplicity of agents, including the smaller oil companies, traders, distributors, and marketers, have become reliant on hired storage. Singapore
The Energy Economy of a City State, Singapore
189
has a long history as an oil terminalling and distribution centre. Indeed, storage for distribution had been Singapore's main petroleum-related activity since the nineteenth century - until the rapid growth of refining capacity over the last two decades. In addition to the storage facilities of the oil-refining companies, Singapore is the base for two independent storage majors - Paktank and Van Ommeren. The Paktank terminal is a 50150 joint venture between the government and Paktank Europe of the Netherlands. The Paktank floating terminal storage facility (a converted ultra-large crude carrier moored off Pulau Busing) has a total capacity of 300,000 m 3 for product storage. In 1987, Paktank announced its plans to move to a permanent tankyard on the reclaimed Pulau Busing and increase its storage capacity to 500,000 m 3 • The construction of the proposed terminal is expected to be completed by the end of 1990. The Van Ommeren Terminal Singapore (VOfS), with a total capacity of 720,000 m 3 , is based at Pulau Sebarok on 31 hectares of land. VOTS is 51 per cent owned by Van Ommeren of Holland with the remaining 49 per cent held by government-owned interests. VOTS had plans to increase its capacity by a further 75,000 m 3 , bringing its total storage to about 800,000 m 3 by 1989. After the downturn that affected all branches of the oil industry in 1985 and early 1986, the demand for petroleum storage services recovered strongly. At the end of 1987, oil storage facilities in the main centres of Rotterdam, Singapore, and the Caribbean were operating at full capacity (Hough 1988). The buildup of independent storage facilities in Singapore was originally motivated by the expected large flows of Middle East product exports into the region, flows which did not materialize. The surge of netback processing and the increased spot processing activity in Singapore by Japanese interests over 1986/87, however, led to high capacity utilization of the independent tank farms. The liberalization of Japan's market for imported refined products has further increased the demand prospects for independent storage facilities. The sustained growth in regional trade in crude and refined products since 1987 and the launch of the fuel oil futures contract in Singapore have increased demand for greater independent storage facilities. Oiltanking Gmbh, a West German company specializing in petroleum storage terminals, has made firm commitments to build a storage terminal with a capacity of 210,000 m 3 at Pulau Seraya. According to industry sources, Singapore's total storage capacity (i.e., owned by refiners and independents) will grow to about 11.5 million m 3 (over 72 million barrels) by 1990.
190
Tilak Doshi
The Petrochemical Complex The large excess capacity characterizing the world petrochemical industry since the late 1970s has been rationalized. With improved economic conditions in the latter part of the 1980s, production capacity and demand for olefins and their derivatives have converged to a balance over the last two years. The strong world demand for the basic olefins (ethylene and propylene) is derived from increased consumption requirements for the derivatives high and low density polyethylene (HOPE and LOPE respectively), vinyl chloride monomer and polyvinyl chloride (VCM and PVC respectively), ethylene oxide and ethylene glycol, styrene monomer, and polypropylene (PP). Current world plant utilization exceeds 90 per cent and petrochemical producers have experienced increased rates of profitability over the last two years with the firming of prices of olefinbased derivatives (Corbett 1988). The Petrochemicals Corporation of Singapore (PCS) began operations in March 1984. The complex, jointly owned by the Singapore Government (50 per cent), Japanese government (10 per cent) and a private consortium of Japanese companies, was built at a cost of S$2 billion (approximately US$1 billion) at Pulau Ayer Merbau. The design capacity of the upstream PCS plant is 300,000 tons per year of ethylene-based products utilizing feedstock of naphtha and LPG. The complex's downstream plants produce LOPE and HOPE, PP, ethylene black, ethylene glycols, and ethylene oxide, the gasoline additive MTBE, and ethoxylates. Shell plans to construct a S$84 million petrochemical facility adjacent to its refinery complex which will produce the chemical solvent isopropyl alcohol when it comes onstream in 1990. Since the PCS complex came onstream in 1984, the enterprise had been deemed a "white elephant", an outcome of an ill-timed plan to establish a petrochemical sector in Singapore. The petrochemical establishment suffered losses for the first three years of operation. 38 However, in 1987, the PCS reported a profit for the first time since it began operations. The gross profit of S$110 million recorded for fiscal 1987 yielded a net profit of S$5.7 million after adjusting for foreign exchange losses on its yendenominated outstanding loans. Gross profits for the 1988 calendar year were reported to have jumped to about S$340 million, with strong performances recorded for all downstream plants. The recovery is attributable to the worldwide boom in petrochemical demand. Strong demand and relatively tight supply conditions in the regional market have contributed to higher prices, full capacity utilization, and increased profits. According to the Oil and Gas Journal's Annual
The Energy Economy of a City State, Singapore
191
Petrochemical Report (1988). the current surge in world demand is not likely to spur excessive capacity buildup given the large surplus capacity that afflicted the industry in the recent past. However, despite the relative caution in petrochemical investments, there are a number of countries in East and Southeast Asia which have plans or firm commitments to build major world-scale petrochemical plants. The petrochemical industry, given the lumpiness of the large capital investments and long lead times involved, has long been noted for its propensity to cyclical booms and slumps. And there is no reason to suggest that the Singapore petrochemical complex is immune to the impact of international and regional ethylene production-capacity increases.
The Upstream Sector Singapore's marine industry - which includes ship-building and repair, oil-rig building and repair, marine engineering, and related activities is one of the country's largest, accounting for about 11 per cent of value added in the manufacturing sector in 1986 (EDB Annual Report 1986). The industry plays an important role as a supportive and servicing facility to several key industries, including shipping and transport, petroleum products, and the offshore hydrocarbons industry. The upstream sector of the Singapore petroleum industry developed as a result of three major factors: 1. strategic location with respect to the considerable hydrocarbons potential of the continental shelf under the South China Sea and surrounding waters; 2. excellent transport and communications infrastructure, including a deep-water port and service facilities of the PSA; and 3. linkages with key industries, including the marine industry and the offshore oil and gas industry dominated by the U.S. oil majors. Rig building and repair (including oilfield components) accounted for over a third of the output of the marine industry in 1981. At its peak, Singapore had five rig-building yards - Marathon Le Tourneau, Robin Shipyard, Promet, Bethlehem, and Far East Levingston Shipyard (FELS). Singapore was ranked as the world's leading builder of jack-up oil rigs and second only to the United States in total oil-rig construction in 1981 (Seow 1984). Rig building has been affected most adversely with the considerable decline of oil and gas exploration in the Asia-Pacific from the vigorous pace prior to the post-1981 erosion in oil prices. Currently, there
192
Tilak Doshi
are only two rig-building yards, Sembawang Bethlehem and FELS. While rig-building activity will not reach the peak levels of the latter part of the 1970s and early 1980s, rig and tanker repair business, as well as the building of smaller vessels and structures, has emerged as a major activity for the Singapore marine industry. The oilfield and gasfield machinery and equipment industry surveyed by the Census of Industrial Production 1986 consisted of thirty-eight establishments employing over 3,000 workers. The industry registered sales of almost S$500 million of which over 85 per cent was exported. Its output consisted of oil-drilling and oil-well equipment, oil-well and gasprocessing equipment, oil rigs, production platforms, storage and pressure vessels, supply vessels and barges, and the repair of oil and gas production structures. Some of the manufacturing concerns in the industry have become lead plants for components and subsystems in the world market while others have assumed a regional role (EDB Yearbook 1987/88). Service vendors which support the offshore hydrocarbons industry offer offshore platform elevating systems, warehousing and repair of oilfield equipment, core analysis and seismic data acquisition and analysis, design engineering, well-testing and measurement, and testing laboratories for offshore equipment. These companies are mainly subsidiaries of U.S. multinational firms which specialize in advanced technologies and products. Establishing an operational presence in Singapore has been a logical development for these subsidiaries, given Singapore's infrastructural facilities and the large involvement of the U.S. oil majors in East Asian offshore oil and gas exploration and development. Much like rig building, the slump in offshore oil and gas operations has reduced the demand for ~echnical support services offered by Singapore-based firms. THE ECONOMIC IMPACT OF OIL PRICES Ever since the major oil price shocks of the 1970s, the issue of import dependence has caused widespread concern. Singapore, as noted above, depends entirely on imported petroleum for its primary energy needs. Table 9 shows the value of petroleum (crude and product) import and export for the decade 1978-88. Crude oil and its products constitute the single largest commodity in Singapore's external trade. Petroleum import as a proportion of total commodity imports ranged from 24 per cent in 1978 to a peak of 34 per cent in 1981 and 1982. The petroleum import share of total commodity imports averaged 26 per cent over the decade. Since 1983, the erosion of oil prices led to a decreasing percentage share
TABLE 9 Oil Trade and Total Commodity Trade Values, 1978-88
Total Imports A S$ mn
Petroleum Imports B S$ mn
Petroleum Import Share C = BIA %
Total Exports D S$ mn
Petroleum Exports E S$ mn
Petroleum Export Share F = EID %
Trade Balance G = D-A S$ mn
Petroleum Balance H = E-B S$ mn
Petroleum Share of Trade Deficit I= HIG %
1978 1979 1980 1981 1982 1983 1984 1985 1986 1987 1988
29,601 38,334 51,345 58,248 60,245 59,504 61,134 57,818 55,545 68,415 88,227
7,075 9,668 14,880 19,819 20,471 18,601 16,949 17,020 10,994 12,526 12,422
24 25 29 34 34 31 28 29 20 18 14
22,986 30,940 41,452 44,291 44,473 46,155 51,340 50,179 48,986 60,266 79,051
5,279 7,337 11,828 13,981 14,437 12,762 12,992 13,456 10,146 12,198 12,353
23 24 29 32 32 28 25 27 21 20 16
-6,615 -7,394 -9,893 -13,957 -15,772 -13,349 -9,794 -7,639 -6,559 -8,149 -9,176
-1,796 -2,331 -3,052 -5,838 -6,034 -5,839 -3,957 -3,564 -848 -328 -69
27 32 31 42 38 44 40 47 13 4 1
Annual Growth Rate
11.5%
5.8%
(26%)*
13.1%
8.9%
(25%)*
Year
*Average share for the decade. SOURCE: Yearbook of Statistics Singapore (1988).
(29%)*
194
Tilak Doshi
of oil import in total imports with 1988 recording the lowest share during the decade. Petroleum export as a proportion of total commodity exports averaged 25 per cent over the same period. The export share registered 23 per cent in 1978, followed by a peak of 32 per cent in 1981 and 1982, and down to 20 per cent and 16 per cent in 1987 and 1988 respectively. Petroleum import grew at an annual rate of about 6 per cent over the decade, compared to an annual growth rate of over 11 per cent for total commodity imports. Petroleum export and total exports grew at an annual rate of 9 per cent and 13 per cent respectively. In other words, the value of both petroleum import and petroleum export has grown at a slower pace than that of total imports and exports, respectively, over the period concerned. The deficit in petroleum trade (i.e., petroleum imports less petroleum exports) increased progressively from 1978 to 1982, when it reached its peak of over S$6 billion. Since then, the deficit decreased until the oil price collapse of 1986 when it was drastically reduced to S$848 million. The deficit was at its lowest level of S$69 million in 1988. The deficit in petroleum trade as a proportion of the overall trade deficit, though varying from year to year, has been substantial for most years up to 1985. After the second oil price rise of 1979/80, it reached 42 per cent in 1981 and 44 per cent in 1983. The sudden downturn in the economy in the 1985 recession reduced the overall trade deficit, and the deficit in petroleum trade as a proportion of overall trade deficit reached the peak of 47 per cent. In 1986, the deficit in petroleum trade fell sharply due to reduced imports of the commodity. It fell further in the following years, to only 1 per cent of the total trade deficit in 1988, as a result of a higher overall trade deficit 39 and a small deficit on the oil account. The cost of petroleum imports per se is of limited analytical interest since the bulk of these imports are destined for the export market. What is of primary concern is the value of products destined for final use in the domestic economy, which have to be paid for eventually with export earnings. The most meaningful economic measure of the burden of imported energy is the cost, in terms of foreign exchange, of the domestic utilization of petroleum products. A study by ESCAP (1984) has derived cost estimates of domestic petroleum product utilization as shares of GOP and of total retained imports from 1974 to 1982. The importance of these costs is not negligible, ranging between 8 and 18 per cent of the entire bill for retained imports and from 5 to 13 per cent of GOP in the estimates utilizing United Nations (UN) data. The estimates utilizing official Singapore data yield lower costs that are, nevertheless, significant. They range
The Energy Economy of a City State, Singapore
195
from 5 to 10 per cent of retained imports and 3 to 7 per cent of GDP. Both series indicate that energy consumption costs escalated in the years following 1979. It is apparent that the two oil-price rises of the 1970s constituted severe balance of payments shocks for the world's net oil importers, causing a deterioration of the terms of trade and weakening world demand for exports. Despite heavy dependence on oil imports for domestic energy requirements, the outward-oriented East Asian NICs weathered the effects of the two oil-price shocks better than most countries pursuing an inwardlooking industrialization strategy. 40 Notwithstanding the severity of the two oil-price shocks on Singapore's economy, the country's real growth experience since 1965 has on the average outperformed that of most other countries, including the net oil exporters.
The Consequences of Falling Oil Prices The collapse in world oil prices in the first half of 1986 has been widely perceived as the "third oil shock" which has caused a fundamental reappraisal in the long-run oil market outlook. Indeed, "the oil market landscape with which the world has become familiar since 1973 has been fundamentally and irrevocably changed by the traumas of early 1986" (Morgan 1987, p. 325). Being almost completely petroleum-based, Singapore's energy economy has been profoundly affected by the impact of falling oil prices. The erosion of oil prices since 1981, particularly the 1986 price collapse, directly reduced the costs of domestic energy utilization. Assuming a domestic oil consumption level of 236,000 b/d, 41 each US$1 per barrel fall in the price of oil is estimated by the Development Bank of Singapore to reduce Singapore's energy costs by US$236,000 per day or over US$86 million per annum (DBS 1986). The cost saving resulting from the 1986 price collapse has been estimated at S$2.5 billion or US$1.12 billion (ibid.), 42 a substantial amount compared to the total commodity trade deficit of S$8.1 billion. Lower oil prices since 1981 have had two further positive consequences for the Singapore economy, beyond the direct benefits of reduced foreign exchange costs of domestic oil consumption. By raising real incomes, and hence import levels, of Singapore's major trading partners which consume large quantities of imported oil (such as Japan and the United States), lower oil prices have indirectly assisted Singapore's trade balance. Furthermore, having reduced the burden of foreign exchange costs of energy, low prices have made energy conservation and fuel substitution less urgent
196
Tilak Doshi
among the oil-importing countries. It has thereby increased the demand prospects for refined products in the Asian-Pacific region. The Singapore refining industry, as well as Singapore-based oil-trading interests, stands to gain from the increased export and trading opportunities for petroleum products. On the negative side, the fall in oil prices has adversely affected Singapore's two important neighbours - Indonesia and Malaysia. Both countries, heavily dependent on hydrocarbons for their export revenues, are important trading partners for Singapore, absorbing up to a fifth of the country's exports in recent years (Koh 1987)_43 According to one source, an oil price decline of US$1 per barrel is estimated to widen Singapore's total commodity trade deficit by S$184 million (DBS 1986). 44 The fall in oil prices since 1981, particularly the 1986 price collapse, also led to sharply reduced oil exploration and development expenditures worldwide. The upstream sector of the Singapore petroleum industry suffered the full impact of the downturn in oil and gas exploration activity. According to Lloyd's List, rig-building revenues were reported to have dropped to S$20 million in 1986, from S$52 million in 1985 and S$790 million in 1981 (Energy Asia, 19 September 1987). The demand for equipment and services supplied by Singapore-based firms to the region's offshore oil and gas industry has similarly declined, although quantitative estimates are not available. Petroleum Intelligence Weekly reports a "cautious optimism" returning to worldwide offshore oil and gas exploration and development (23 November 1988). This observation is shared by some with regards to offshore Southeast Asia as well (Tyler 1988). The concern among the developing countries in the Asian-Pacific region to encourage high levels of expenditure in hydrocarbon exploration and development in the face of falling and weak oil prices has been accompanied by significant changes in legislation and contractual terms covering offshore operations in a number of countries, including Indonesia, Thailand, Malaysia, and China (Singh 1988b). Papua New Guinea is emerging as a major new exploration theatre and observers have also noted the development possibilities of Vietnam's offshore hydrocarbon potential. Following a difficult period associated with falling oil prices, the upstream sector of the Singapore petroleum industry was able to achieve modest growth in 1987, aided by rationalization of operations and the modest oil price recovery (EDB Yearbook of 1987188). In sum, the lower oil prices since 1981 have had mixed effects on the Singapore economy. They have reduced the costs of energy consumption
The Energy Economy of a City State, Singapore
197
to both Singapore and its major oil-importing trading partners, thus conferring direct and indirect benefits. By improving the demand outlook for petroleum products, Singapore also stands to benefit from the enhanced opportunities in the refining and trade of crude petroleum and its products. On the other hand, the impact of lower oil prices on Malaysia and Indonesia has adversely affected Singapore's trade balance. The severe downturn in the oil and gas exploration and development expenditures in the region has also drastically reduced demand for drilling rigs as well as a wide range of products and services provided by Singapore-based vendors which support the offshore oil and gas industry in the region. The lack of empirical data does not allow an assessment of the net impact of lower oil prices since 1981 and the price collapse of 1986, although one observer has speculated that "the negative side was felt first and is probably the more powerful" (Krause 1987a, p. 11). Notwithstanding this considered judgement, it is apparent that the important developments occurring in the Asian-Pacific region - in particular, the high rates of economic growth, liberalization of government controls over the petroleum and other sectors in many countries, and the unprecedented rates of expansion in demand for petroleum products - augur well for the future of the Singapore petroleum industry into the 1990s (Doshi 1989a).
ENERGY PLANNING AND POLICY The Singapore Government's policy posture towards energy issues has been implemented within the specific circumstances of a small, open, and rapidly growing capitalist economy that is also the base off a petroleum industry which far exceeds domestic energy requirements. Policies towards the petroleum industry have been subordinate to the export-oriented industrialization programme pursued by the state's economic planners. With respect to domestic energy use, public policy has supported efficiency improvements via rational pricing rules and accelerated investments in the country's utilities infrastructure.
Energy Security and the Institutional Framework No official forecasts of energy demand are made in SingaporeY Since the domestic demand component is small compared to the size of refining capacity in Singapore, it is perceived that elaborate projections and forecasts of energy demand are unwarranted. The seeming lack of urgency over energy supply security is primarily because Singapore has been
198
Tilak Doshi
----··--------------
----
--------------
effectively cushioned from supply shocks owing to the presence of the large refining industry. The institutional apparatus necessary for administration and planning of energy matters has presented few problems of coordination in Singapore. No separate administrative body has been established to supervise the energy sector. The necessity for some form of centralized coordination felt in the aftermath of the second oil shock led to the establishment of an Energy Unit within the Ministry of Trade and Industry. The unit was to act as Secretariat for the Inter-Ministry Energy Coordination Committee, which included representatives from the ministries of Trade and Industry, Communications, Finance, National Development, and Foreign Affairs. Its original tasks were to advise on energy policy, monitor supplies of energy to ensure national security, institute energy conservation measures, and engender public consciousness on energy efficiency and conservation. Despite its rather comprehensive terms of reference over energy issues, the erosion of oil prices since the unit's establishment in 1980 has undermined its raison d'etre and limited its actual functions. The basic objective in the establishment of the Singapore National Oil Corporation (SNOC) as a fully government-owned corporation in 1980 was to ensure reasonable protection of Singapore's economy from the risk of sudden and serious disruption of normal supplies of oil and to "supplement" the role played by private refineries in ensuring and improving the security of petroleum supply. SNOCs official objectives notwithstanding, the company's activities have diminished in recent years. The stockpiling of crude, one of SNOCs first responsibilities, was discontinued in 1983 as falling oil prices caused the opportunity costs of the strategic reserve to outweigh perceived security benefits. The small volume of oil trade engaged by SNOC has also virtually ceased. As a member of the ASEAN Council on Petroleum (ASCOPE), SNOC is responsible for the maintenance of a cooperative relationship with other national oil companies in the ASEAN bloc. In June 1986, a petroleum security agreement entitled "Agreement on ASEAN Energy Cooperation" was ratified by the ASEAN delegates in Manila. The emergency plan in principal calls for the oil-producing members (Brunei, Malaysia, and Indonesia) to meet the emergency needs of oil-importing members (Philippines, Singapore, and Thailand) during scarcity, and for the latter to help absorb the surpluses of the former during gluts. In the protracted surplus period since 1982, ASEAN oil importers are less likely to implement the scheme, unlike the bloc's exporters. Most observers maintain that while the idea is complementary to regional and political cooperation, the
The Energy Economy of a City State, Singapore
199
number of qualifications admitted to the energy security agreement makes the pact less credible (given that all ASEAN declarations require full consensus of its members). Furthermore, ASEAN's lack of substantial economic cooperation since the organization was established detracts from the security value of the energy agreement. Another ASCOPE initiative that has received attention in the region is the possibility of building a gas grid for the ASEAN group. Singapore has already contracted for the import of natural gas via pipeline from Malaysia (see below) and has been reported to be negotiating a similar pipeline arrangement with Indonesia. Indonesia, with large gas reserves to be exploited, has expressed most interest in a pan-ASEAN gas grid, although the distance to the Philippines from the gas fields of Indonesia, Malaysia, and Brunei, as well as conflicting territorial claims, poses serious obstacles.
Some Policy Issues Concerning the Petroleum Industry The Singapore Government has relied mainly on market forces to shape the country's petroleum sector. The government's direct participation in the sector, with substantial stakes in refining, petrochemicals, and storage, consists of joint ventures with large multinational corporations. These concerns are clearly run along commercial lines. Although the private sector oil companies are obliged to fulfil affiliate and market requirements for profit, it is conceivable that a supply crisis would be accompanied by official directives requiring the industry to fulfil domestic market requirements (ESCAP 1984). Data on government revenue derived from the large refiners in the form of corporate and other taxes are unavailable, making it difficult to measure the fiscal impact of the industry. It is interesting to note, however, that one early study of effective protection and subsidy rates for all industry groups in 1967 found that the petroleum industry 46 had a zero effective protection rate (Tan and Ow 1982, p. 294). Based on data on profit rates, loan structure and interest payments, the study concluded that the industry received the highest subsidy among all industry groups, at 14 per cent relative to world market value-added, "because of its supposed spread effects to ship repairing (of tankers), its supply of by-products to the chemical industry, and its demand for domestically produced machinery and metal products" (ibid.). The government has been reported more recently to have provided fiscal incentives to the refining industry to promote capital investments in secondary processing facilities (Petromin,
200
Tilak Doshi
June 1987). Quantitative estimates of these investment incentives are unavailable. SIMEX enjoys the full commitment of the government to provide a conducive fiscal and regulatory environment. To encourage oil-trading activity, the government has solicited applications from international oil and finance companies for "approved oil trader" (AOf) status which enjoys significant tax privileges on international trading profits for both the physical and futures oil market. The approved oil traders as well as firms which join SIMEX as commercial associated members will be granted a concessionary tax rate of 10 per cent on profits from oil trading transactions (in contrast to the over 30 per cent corporate tax rate normally levied). AOf status (which stipulates a minimum volume of US$100 million in oil trade per annum, a minimum office expenditure of US$250,000 and at least three skilled oil traders operating from the Singapore office) has been granted to over twenty companies. These are primarily oil majors and large financial houses able to fulfil the application criteria of Singapore's Trade Development Board. Given the nature of trade in paper barrels, driven by potentially volatile price expectations, the successful launching of a futures contract is never assured however. 47 An earlier concern among industry participants as to whether the fuel oil trade was in fact large enough for the major players in the market (such as the refiners which hold large fuel oil stocks) not to be able to influence prices has not seemed to be an obstacle. Although an outright failure in the Singapore HSFO futures contract is an unlikely prospect, it will take about three to four years for trade in the futures contract to mature. Along the way, SIMEX will face a number of challenges confronting paper barrel trade in the region (Doshi 1989b). If successful, the Singapore oil industry will have added yet another dimension to regional energy markets. There are several supply-side aspects that constrain the bunkering industry's ability to exploit growing demand prospects (Hochstadt 1988, Takamiya 1988). While ex-wharf bunker prices quoted by Singapore suppliers are competitive, supplementary costs associated with barging, pipeline, and overside deliveries escalate total costs to a relatively high level with respect to the other major bunkering centres. Furthermore, pilotage requirements and the composite port dues tariff have made it uneconomic for large vessels to call into port solely for taking on bunkers. A policy decision on the part of the PSA to review such charges in order to ensure the competitiveness of delivered bunker price (within reasonable
The Energy Economy of a City State, Singapore
201
~~~~--~~--
constraints allowed by other objectives such as revenue collection and traffic safety) is required. 48 The barge fleet of the Singapore bunkering industry is an aged one. As a result, there is a relatively high frequency of breakdowns and overall poor performance. Loss in efficiency is accentuated by low pumping-rate capacities and the small size of the barge fleet. Terminal congestion, relatively low pumping capacity of shore pipelines, and the lack of a pooling system among barge operators have been identified as bottlenecks by industry clients (see, for instance, Takamiya 1988, Kristiansen 1988). The PSA is certainly aware of these conditions and is reportedly pursuing attempts to formulate standards for efficient bunkering (Seah 1988). The authority has plans to expand existing barging terminals and build new ones to improve the barge dispatch time. A new bunkering terminal at the offshore island of Pulau Brani is being considered. 49 An improvement in the quality of bunker fuels is also called for, 50 possibly via quality specification standards enforced by the PSA. Given PSA's continued emphasis on investments to improve the efficiency of its facilities and to maintain the port's position as the region's "total shipping centre", the prospects for the Singapore bunkering industry in the 1990s are generally positive. BP, Caltex, Esso, Mobil, ShelL and the PSA have formed a consortium called Common Users Bunkering Installation (CUBI) to handle bunkers in Singapore. This is in keeping with the recent trend in the petroleum industry towards the establishment of joint storage and distribution facilities to allow the sharing of overhead costs and the reaping of economies of scale among common users. CUBI is expected to operate the 106,000-tonne bunker fuel tank farm at Tanjong Pagar now run by Caltex, Shell, and the PSA. Bunker fuels stored at the installation are supplied to vessels calling at the Tanjong Pagar terminal and the Keppel Harbour wharves. In line with the government's current objectives of privatization, PSA is looking into the feasibility of allowing private oil companies and bunker suppliers to operate the tank farm as a joint venture. The Singapore Government also has an in-principal agreement to divest its 50 per cent stake in the Paktank petroleum storage terminal when the new tank farm on the reclaimed Pulau Busing becomes operational. In January 1988, Shell bid for the Singapore Government's US$500 million share in the US$1 billion petrochemical complex at Pulau Ayer Merbau in order to establish a substantial petrochemical manufacturing presence in the regional market. While the Shell bid fits in with the government's programme of divestment, the Japanese consortium led by
202
Tilak Doshi
Sumitomo Chemical objected to a total withdrawal by its government partner on the grounds that the complex is a "national project" requiring government participation. After protracted negotiations over two years, the Japanese partners have accepted Shell International Chemical Company as a new partner. Plans have been finalised for the Shell group to acquire a 30 per cent stake in PCS, leaving the Singapore Government a 20 per cent share in the upstream company. Shell will also purchase all of the Singapore Government's 30 per cent stake in the downstream Polyolefin Company. The proposed engagement with Shell as a major partner in the PCS complex would yield benefits of scale and linkages (with refinery facilities, marketing channels, and so on) which an oil major can provide. The recent strong performance of the corporation suggests a continued and viable role for Singapore in the region's petrochemical trade.
The Management of Domestic Energy Utilization The pricing regime governing the use of energy fuels has effectively ruled out explicit subsidies, though differential taxation to influence demand is not precluded. On the whole, variations in the cost of fuel imports are reflected relatively promptly in user prices (ESCAP 1984, pp. 129-30). In June 1987 price deregulation came into effect, with the government discontinuing the practice of setting ceiling prices for domestic retail. The PUB's tariff administration constitutes a major component of energy pricing policy. The PUB introduced a system of quarterly adjustments for electricity tariffs in 1982 and for gas tariffs in 1983. Under the system, power tariffs are regularly adjusted to reflect prevailing fuel prices. In formulating its tariff schedule for electricity, the board has traditionally aimed at collecting sufficient revenue to meet its total expenditure, including depreciation allowances and interest charges, as well as for financing a "reasonable" proportion of its capital expenditure. According to Kadir and Kim (1985), the PUB has maintained a minimum rate of return of 8 per cent on average net fixed assets. Since the 1985-86 recession, however, the need to increase the competitiveness of the Singapore economy has led the government to direct all revenue-earning statutory bodies to reduce user charges and lower operating costs of private enterprise in Singapore. In February 1987, the government revised and lowered the tariff schedule. The "non-domestic" and "low-tension industrial" categories were combined so that all non-domestic consumers taking supply at low tension (anything below 6,000 volts) pay the same tariff rate. The "high-
The Energy Economy of a City State, Singapore
203
tension industrial" and "high-tension non-industrial" categories were similarly combined so that all electricity consumption at high tension is charged the same tariff rate. The simplification and lowering of electricity tariffs imply a saving per annum of S$48 million for consumers (Singapore Economic Bulletin, March 1987). It is estimated that the monthly electricity bill of the Singapore refining industry will drop by S$3,500 (ibid.). Since the oil-price shocks of the 1970s, inter-fuel substitution has promoted efficiency improvements as well as source diversification and supply security in many countries. In the early 1980s, the PUB considered coal to be the prime candidate to substitute for fuel oil in power generation. Feasibility studies were carried out but, with falling oil prices, the decision was postponed. The nuclear option, given Singapore's limited land area and the major environmental constraints involved with radioactive fuels, is absent for the foreseeable future. Solar energy and waste material utilization for energy are insignificant and remain experimental. With the potential availability of natural gas from either Malaysia or Indonesia, coal ceased to be considered an option for fuel oil substitution. PUB and Singapore government officials have been engaged in protracted negotiations with Malaysian authorities for an agreement to pipe natural gas from the latter's peninsular east coast gas fields. (Singapore's Senoko and Pulau Seraya power stations can be converted to use natural gas.) Malaysia and Singapore finally concluded the negotiations with the signing of a memorandum of understanding in June 1988. Under the agreement, Malaysia has contracted to supply Singapore with 150 million cubic feet of natural gas per day (a little less than 25,000 b/d of oil equivalent) over fifteen years. The gas will be supplied to Singapore through pipeline which will run from the northeastern state of Kelantan south through Johore state. The pricing formula is based on gas prices on the spot market and posted prices of Singapore-based oil companies. Singapore is to pay a premium of not more than S$20 million for the first year of supply. The premium will be formulated as a proportion of Singapore's gas requirements. The contract, however, was concluded on the basis of a joint agreement for continued water sales by Malaysia to Singapore. Hence, the economic parameters of the natural gas supply contract are not entirely transparent. The Singapore Government is particularly well noted for its explicit policy to discourage private motor vehicle ownership and use. The ra~id increase in Singapore's car population accompanying increasing per capita income levels has led the Singapore Government to implement strict and highly effective system of disincentives and traffic management schemes.
204
Tilak Doshi
Among those introduced are high import duties, registration fees, and road taxes, area licensing to restrict entry into the Central Business District during peak hours, computerized area traffic control, and the encouragement of car-pooling.51 An efficient public bus transportation system serves an estimated half of passenger traffic in passenger-kilometres, the rest being carried by private modes (Ang 1988, p. 2). It should be noted that the primary rationale motivating the government's adoption of stiff disincentives with respect to private motor vehicle ownership has been the problem of traffic congestion, rather than energy conservation per se. Being highly urbanized with limited land space, Singapore has always faced potential road congestion problems. Nevertheless, besides improving traffic flow and reducing commuting time, Singapore's system of traffic management has led to significant energy savings. The operation of Area Traffic Control and Additional Registration Fee, for instance, has resulted in an estimated 8 to 9 per cent energy savings in road transport (Ang and Oh 1988). The construction of the Mass Rapid Transit (MRT) rail system, as it is being progressively brought into full service, will transform the mode of passenger traffic. Being far more efficient than private motoring, the MRT will effect substantial savings in energy use over the long run. There are several examples of energy conservation measures pursued by the government. To control energy use for air-conditioning in large buildings, the Development and Building Control Division of the Ministry of National Development enforces standards of thermal efficiency in public and government buildings. The PUB, which has been conducting energy conservation campaigns and educational programmes for some years, carries out energy audits for industrial and commercial buildings through its Energy Conservation Division. In 1987, 161 such audits were performed (PUB Annual Report 1987). Training on technical aspects of energy conservation has also been organized through seminars and workshops. THE ENERGY ECONOMY OF A GIDBAL CITY The energy economy of Singapore is both a reflection and an outcome of the country's development as a "global city". This phrase - favoured by a number of informed observers (Lee 1984, Krause 1987b) - is an apt one, given the city-state's extreme openness to the international economy, its modern infrastructure and amenities, and its cosmopolitan character. The structure of domestic energy utilization has been shaped by a policy
The Ene-r;gy Economy of a City State, Singapore
205
environment which is properly subordinate to the wider goals of an outw_ard-looking de~~lop_ment strategy. The government's overall pricing and mvestment poliCies m the energy sector are rational in that prices reflect appropriate social opportunity costs. Subsidies for politically favoured constituencies are explicitly ruled out. The basic premise underlying pricing policies is for actual costs to be borne by final users. Instructive in this respect is the fact that Singapore is the only big city in the world which has effectively priced the use of roads and automobiles to reflect the social costs52 imposed by private motorists. In the wake of the recent recession, the PUB has rationalized its tariff schedules and reduced user charges in order to cut business operating costs and promote a competitive cost structure for private sector investments. The public sector's continued programme of major investments in the electricity and gas utilities has promoted increasing levels of efficiency in the transformation and final consumption of energy fuels. The electric power facilities provided by the PUB constitute an integral part of Singapore's modern infrastructure, an essential complement to private sector investments in the country. The construction of the MRT for facilitating commuter traffic and the substitution of fuel oil with natural gas for electricity generation constitute major advances in developing an efficient configuration of domestic energy use. Energy conservation practices are effectively promoted, primarily by the enforcement of thermal efficiency standards and energy audits in the non-residential building sector. The Singapore petroleum industry has come a long way from its early status as a storage and transshipment centre for kerosene in the colonial Far East. It now plays a dominating regional role and encompasses the gamut of petroleum-related activities, from rig and tanker repair (and some new building), the manufacture of oilfield equipment, and the provision of technical and logistics support services for the offshore hydrocarbon industry on the upstream side, to refining (on contract and on refiners' own account), crude and product trading, storage, marketing, and distribution downstream. The downstream sector of the petroleum industry constitutes a whole which is greater than the sum of its constituent parts; it constitutes a synergy of industries and services, in which each major activity complements and supports the others. The downstream sector of the oil industry is in the process of achieving a "critical mass" capable of supporting vigorous and sustained growth in a wide range of complementary activities. Officials in Singapore often talk of a "total oil business centre" where interested parties can purchase, refine, store, and trade the commodity in
206
Tilak Doshi
a variety of ways. The economies of scope and scale53 made possible by such a "total oil business centre" are already evident in Singapore. The country is thus in a position to further consolidate its role as the hub of the Pacific Basin's energy markets. Impressionistic evidence of Singapore as the region's premier oil centre ranges from the long listings of Singaporebased petroleum-related firms in business and trade directories to the hosting of major annual conferences such as the Asia-Pacific Petroleum Conference and Oil and Money: Asia/Pacific. The recent establishment of the Petroleum Intelligence Weekly's Far East office in Singapore attests to the country's importance as a base for the collection and dissemination of information related to the Asian-Pacific petroleum industry. The growth of the downstream sector of the Singapore petroleum industry has been predicated on the prodigious expansion of Pacific Basin energy markets. Equally important, the efficiency of the industry's response to the needs of regional energy markets has ultimately been the result of two factors specific to Singapore: the natural endowment of a geo-strategic location, and the adoption by the state leadership of a consistent, outwardlooking and foreign investment-based economic development strategy. The industry, a creation of the oil majors (but now involving a multiplicity of interests) and primarily geared towards export, is the hallmark of a flexible and resilient economy that has itself traversed an export-led, foreign investment-based development path. Singapore's establishment as an oil centre has paralleled the island republic's development into a "global city" intimately linked to the flows of trade, investment, and information emanating from the world economy. The petroleum industry of Singapore, as an integral component of Singapore's development experience, continues to be a promising growth sector of the economy.
NOfES 1. As an urbanized island-state without an appreciable agricultural sector, Singapore's consumption of non-commercial energy materials is insignificant. 2. Brunei, an oil-producing kingdom with a tiny population and one of the world's highest per capita income levels, is an exception. 3. See, for instance, Euromoney (October 1984) which picked Singapore as having achieved the world's best economic performance over the decade 1974-84 on the basis of several weighted key economic indicators. 4. For instance, You and Lim (1984), Lim and Lloyd (1986), and Krause (1987a). 5. This excludes official capital flows and short-term movements of funds through the banking sector.
The Energy Economy of a City State, Singapore
207
6. Defined as majority ownership of more than SO per cent of capital assets of manufacturing establishments engaging ten or more workers. 7. The tertiary sector includes trade, transport, communications, finance, business, and other services. Imputed bank service charges and import duties are categorized as services. 8. It is only recently, in 1986 and 1987, that domestic savings exceeded gross capital formation in the country. 9. The committee was chaired by the Acting Minister of Trade and Industry, and together with many sub-committees, involved over 1,000 individuals from the public and private sectors. The report of the committee represents the outcome of the largest and most intensive survey of the economy to have been carried out in Singapore. 10. It should be noted that, in the case of Singapore, the term "resource poor" should not lead one to ignore its superb resource endowment of location. Furthermore, Singapore is an exception in the sense that its entrepot role for natural-resources rich neighbours meant that a relatively large proportion of its exports were natural-resource intensive. The classification of refined petroleum products as natural resource-intensive adds to this bias. Nevertheless, with the progress of export-oriented industrialization and the decline in importance of entrep6t trade, Singapore has experienced a sharp decrease in the proportions of such resource-based exports and a rapid increase in the proportion of technology-intensive exports over the 1970s (Krause 1987d). 11. These boards are corporate entities established by Acts of Parliament to implement government economic and social programmes, provide infrastructure and services, and perform regulatory functions. 12. This would include both the laissez-faire and welfare state liberalism variants. 13. The fact that the country is a predominantly Chinese-populated island in the midst of an Islamic and Malay region adds powerfully to such an ideology (see, for instance, Regnier 1989, forthcoming). I would like to express my appreciation to Dr Philippe Regnier of the Modern Asia Research Centre at Geneva for allowing me to cite his book in advance of publication. 14. Perhaps the most significant departure from this has been the 20 per cent across-the-board annual wage increases from 1979 to 1981, a novel policy initiated by the National Wages Council to "drive out" low-technology and labour-intensive industries. It is now accepted by the government that this drastic adjustment to relative factor prices contributed to the recession in 1985-86 (Ministry of Trade and Industry 1986). 15. The concepts of rent-seeking and directly unproductive profit-seeking have been used to analyse phenomena such as lobbying for protection, the inducement of legislatures to enact barriers to entry, the use of resources for gaining access to trade and import licences or to evade governmental regulations, and so on. Such activities yield pecuniary returns to the parties involved but do not produce goods and services; insofar as these activities absorb real resources, they represent a net welfare loss to society (Krueger 1974, Bhagwati 1982). 16. Bunker fuels, as exports supplied to ships calling at port, are excluded. 17. This refers to Malaysia, Indonesia, Philippines, Singapore, and Thailand.
208
18.
19. 20. 21. 22.
23. 24. 25.
26. 27.
28.
29.
30.
31.
Tilak Doshi
Brunei, which became the sixth member state of the Association of Southeast Asian Nations in January 1984, is not included. Non-energy products such as lubricants, solvents, and asphalt constitute small proportions of petroleum product demand. In 1987, for instance, this was 1.7 per cent. Refers to all aircraft, irrespective of flag. Refers to all ships, irrespective of flag. Total energy requirements as defined here include energy used to transform primary fuel (crude oil) into various secondary forms of energy. Transformation losses are defined as the difference between total energy input into refineries and the output of petroleum products. They include the refineries' own use of all fuels. LPG is classified as a petroleum product and excluded from the gas category. Singapore's industrialization strategy has generally been based along the lines of dynamic comparative advantage, as noted in the first section of this chapter. Singapore's advantages in location and infrastructure, however, constitute the prerequisites of an energy-intensive industry such as petroleum refining, as argued in section three. I wish to thank Dr Ang Beng Wah for allowing me to examine and cite this article in advance of publication. Upstream is defined as all related industries and services involved with the exploration and development of hydrocarbon resources; downstream covers the rest, from transport of crude oil or gas from source to refining and trading of petroleum products. The "majors" refer to the handful of large, mainly American, vertically integrated oil companies that controlled an overwhelming portion of the global petroleum industry prior to the 1970s (see Sampson 1975). The "Petroleum Refineries and Petroleum Products" industry is classified at the three-digit level (code 353/ 4) in the Singapore Standard Industrial Classification of All Economic Activities adapted from the ISIS of the UN. Of the eleven firms classified by the Department of Statistics under this category, five are refiners and the rest are smaller establishments producing non-energy commodities such as asphalt, lubricants, and grease. The importance of entrep6t activity in Singapore requires, on the export side, a distinction between re-exports and domestic exports. The latter is defined to cover goods "which have transformed, that is manufactured, assembled or processed in Singapore including those with imported materials or parts" (Yearbook of Statistics Singapore 1987, p. 157). Domestic exports of refined petroleum products thus refer to exports of the output of the refining industry and exclude the re-export of imported products. The value of re-exports of petroleum products constitutes less than 5 per cent of the value of total exports over the 1981-87 period (Economic Suroey of Singapore 1987). Despite the formation of OPEC in 1960, it was only with the upheavals associated with the price shocks and the nationalization of the major concessions during the 1970s that the international oil market was structurally transformed from the tight web of large oligopolies into its present relatively decentralized pattern with a multiplicity of buyers, sellers, producers, and
The Energy Economy of a City State, Singapore
32.
33. 34. 35. 36.
37.
38. 39. 40.
41.
42. 43.
44. 45. 46.
209
brokers. These structural changes contributed to the volatility of oil prices of the 1980s and gave a powerful impetus to the trading of oil in the spot market. From an activity relegated to the margins, the spot market emerged as an integral part of the world petroleum industry (see Fesharaki and Razavi 1986). Representatives of the ASEAN group have proposed the regular collection and circulation of data covering energy supply and demand, production, imports and exports, supply commitments, consumption and revenues derived from hydrocarbon processing as part of the overall implementation of the group's petroleum security agreement (Platts Oilgram News, 6 September 1988). Complete specifications of the contract and fuel oil quality are provided in an undated SIMEX publication entitled Oil Futures (SIMEX, n.d.). It has been reported, however, that both NYMEX and IPE are in the process of developing Low Sulphur Fuel Oil (LSFO) futures contracts. The committee consisted of government and industry representatives, including refiners, traders, major petroleum users, shippers, and SIMEX officials. The statistics in this section are extracted from the informative keynote address by Herman Hochstadt to the 1988 Singapore International Bunkering Conference (Hochstadt 1988). In 1984/85, for instance, 50 per cent of the business of the Van Ommeren independent storage facility was to handle "distress cargo", i.e., cargo which had no immediate destination, being unsuitable for trade due to adverse market conditions. The losses reported for the three consecutive years 1984-86 were S$33.6 million, S$66.3 million, and S$18.3 million (Oil and Gas News, 23-29 May 1988). The increase in the total commodity trade deficit was a result of the resumption of economic growth after the 1985-86 recession. Balassa (1981) provides an empirical analysis of the comparative experience in economic performance and policy response of NICs (including Singapore) and other developing countries after the 1973-74 oil price quadrupling. The reference (DBS 1986) does not indicate the components of domestic consumption that are assumed to aggregate to 236,000 b/d; presumably "domestic consumption" here includes marine bunkers, international aviation, and refinery fuel and loss. The estimate assumes a domestic consumption of 236,000 b/d and the average price of petroleum of US$28 per barrel in 1985 and US$15 per barrel in 1986. Singapore official statistics do not cover trade with Indonesia. Indonesian data on imports from Singapore are reported in the Direction of Trade Statistics of the International Monetary Fund. This estimate is based on calculations made by the consultants Phillip and Drew (DBS 1986). The PUB conducts annual reviews of demand forecasts for electricity, gas, and water. See footnote 29 for the definition of the petroleum industry. The definition does not cover the full range of petroleum-related activities and, to that extent, understates the broader contribution of the petroleum sector to the national economy.
210
Tilak Doshi
47. Both NYMEX and IPE have experienced failed launches of energy futures contracts. 48. The PSA announced tariff reductions for wharfage and labour on the supply pipelines at the Tanjong Pagar terminal and Keppel wharves in August 1988. It is not clear, however, whether these reductions have substantially changed the overall cost structure for bunkering in Singapore. 49. Shell has been awarded a Consultancy contract for the construction of the Pulau Brani bunkering facility to cater for increased bunker trade in the 1990s. The facility is to be jointly developed by the PSA, Shell, Esso, Caltex, Mobil, BP, and SPC at an expected cost of over US$30 million. Pulau Brani itself is being developed into a major container port linked to the main island by a causeway. 50. In a study of trends in bunker fuel density, carbon residue, asphalt, sulphur, and ash from 1984 to 1987 in Singapore, Rotterdam, and Los Angeles done by the Technological Research Centre of Mitsui (the shipping line), the quality of Singapore bunker fuel was characterized by increasing proportions of impurities and residues (see Takamiya 1988). One reason behind the drop in Singapore's bunker fuel quality has been the emphasis on increasing the yield of lighter refined products via secondary refining processes. Secondary refining processes, which extract greater yields of higher-valued lighter products, produce heavy fuels which are inferior in quality compared to the residual fuels derived from "straight-run" distillation processes. 51. More recently, the government has introduced further regulations, including a quota system to control the number of vehicles in the country. 52. Primarily, the direct and indirect costs of traffic congestion. 53. Very roughly, economies of scale when the production costs of a single product decrease with the number of units produced; economies of scope are cost-saving externalities between product lines, for example, production of good A reduces the costs of producing good B.
REFERENCES Ang Beng Wah. ASEAN Energy Demand. Singapore: Institute of Southeast Asian Studies, 1986. ____ ."Energy-output ratios and energy use in Southeast Asia". Energy Policy 15, no. 3 (June 1987). ____ . "Energy End-use Structure of an Urban Society: The Case of Singapore". The Energy Journal, October 1988. Ang Beng Wah and S.T. Oh. "Transport and traffic management schemes and energy saving in Singapore". Energy - The International ]ournal13, no. 2 (February 1988). Balassa, B. The Balance of Payments Effects of External Shocks and of Policy Responses to These Shocks in Non-OPEC Developing Countries. Paris: Development Centre of the OECD, 1981. ____ . Development Strategies in Semi-Industrial Economies. Baltimore: Johns Hopkins University Press, 1982.
The Energy Economy of a City State, Singapore
211
Bhagwati, J.N. "Directly Unproductive, Profit-seeking (DUP) Activities". Journal of Political Economy 90, no. 5 (1982). Bradford, C. I. "NICs and the Next-Tier NICs as Transitional Economies". In Trade and Structural Change in Pacific Asia (A National Bureau of Economic Research Conference Report), edited by C.I. Bradford and W.H. Branson. Chicago: University of Chicago Press, 1987. Chen, Peter S.J. "Singapore's Development Strategies: A Model for Rapid Growth". In Singapore Development Policies and Trends, edited by Peter S.J. Chen. Singapore: Oxford University Press, 1983. Chung Ming Wong. 'Trends and Patterns of Singapore's Trade in Manufactures". In Trade and Structural Change in Pacific Asia (A National Bureau of Economic Research Conference Report), edited by C.I. Bradford and W.H. Branson. Chicago: University of Chicago Press, 1987. Corbett, R.A. "Balanced petrochemical industry enjoys healthy profit potential", Oil and Gas Journal, 5 September 1988. Deane, Phyllis. The Evolution of Economic Ideas. New York: CUP, 1978. Development Bank of Singapore (DBS). Repercussions of Falling Oil Prices on the Indonesian, Malaysian and Singapore Economies. Occasional Paper Series no. 2. Singapore: DBS, 1986. Doshi, T. The Houston of Asia: A Study of the Singapore Petroleum Industry. Singapore: Institute of Southeast Asian Studies (for Institute of Southeast Asian Studies and Resource Systems Institute, East-West Center Joint Energy Project), 1989a. ____ .'Trading Paper Barrels", Far Eastern Economic Review, 2 March 1989b. Economic Development Board (EDB). Annual Report. Singapore: various years. ____ . Yearbook 1987188. Singapore: 1988. Economic Survey of Singapore (annual). Singapore: Ministry of Trade and Industry, various years. Energy Asia. Hong Kong: Petroleum News Southeast Asia Ltd. ESCAP (Economic and Social Commission of Asia and the Pacific). Energy in the ESCAP Region: Policies, Issues and the Potential for Regional Cooperation. Development Papers no. 4 (ST/ESCAP/306). Bangkok: ESCAP, 1984. Fesharaki, F. The Singapore Story: A Refining Center in a Transitory Market. Honolulu: Energy Programme, Resource Systems Institute, East-West Center, 1984. ____ . Singapore as an Oil Center. Honolulu: Energy Programme, Resource Systems Institute, East-West Center, December 1986. Fesharaki, F. and H. Razavi. Spot Oil, Netbacks and Petroleum Futures: The Emergence of a New Oil Market. The Economist Intelligence Unit Special Report no. 1063. London, 1986. Fesharaki, F. and D. Isaak. OPEC and the World Refining Crisis. The Economist Intelligence Unit Special Report no. 168. London, 1984. Goh Keng Swee. The Practice of Economic Growth. Singapore: Federal Publications, 1977. Hochstadt, R.H. "Singapore: Bunker Port of the 1990s". Keynote address at The Singapore International Bunkering Conference 1988, Singapore, 1988.
212
Tilak Doshi
Hough, G.V. "Independent Storage: A Vital Service Industry", Petroleum Economist, January 1988. Huff, W.G. "Patterns in the Economic Development of Singapore", The Journal of Developing Areas, no. 21 (1987). Ibrahim, A.R. "Sector Performance and Economic Development". Paper presented at the APO-RSI Seminar on Energy, Bangkok, August 1987. International Bank for Reconstruction and Development (IBRD or The World Bank). World Development Report 1988. New York: Oxford University Press, 1989. International Energy Agency (lEA). World Energy Statistics and Balances1971/87. Paris, 1988 (draft, publication forthcoming 1989). Kadir, A. and Y.H. Kim. The Electric Future of Singapore. Resource Systems Institute Working Paper WP-85-17. Honolulu: East-West Center, 1985. Koh Ai Tee. "Linkages and the International Environment". In The Singapore Economy Reconsidered, edited by LB. Krause, Koh Ai Tee, and Lee Tsao Yuan. Singapore: Institute of Southeast Asian Studies, 1987. Krapels, E. "Risk management: an art form in the Pacific Basin's 'opaque' market". Oil and Gas News, 18-24 January 1988. Krause, LB. 'Thinking about Singapore". In The Singapore Economy Reconsidered, edited by LB. Krause, Koh Ai Tee, and Lee Tsao Yuan. Singapore: Institute of Southeast Asian Studies, 1987a. ____ . "Industrialization of an Advanced Global City". In The Singapore Economy Reconsidered, edited by LB. Krause, Koh Ai Tee, and Lee Tsao Yuan. Singapore: Institute of Southeast Asian Studies, 1987b. ____ ."The Government as an Entrepreneur". In The Singapore Economy Reconsidered, edited by LB. Krause, Koh Ai Tee, and Lee Tsao Yuan. Singapore: Institute of Southeast Asian Studies, 1987c ____ . 'The Structure of Trade in Manufactured Goods in the East and Southeast Asian Region". In Trade and Structural Change in Pacific Asia (A National Bureau of Economic Research Conference Report), edited by C.I. Bradford and W.H. Branson. Chicago: University of Chicago Press, 1987d. Kristiansen, E.R. "Why Bunker in Singapore: A Shipowner's Perspective". Paper presented to the Singapore International Bunkering Conference 1988, Singapore, 1988. Krueger, A.O. "The Political Economy of the Rent-seeking Society". American Economic Review 64 (June 1974). ____ . Foreign Trade Regimes and Economic Development: Liberalization Attempts and Consequences. Cambridge, Mass.: Ballinger Press for the National Bureau of Economic Research, 1978. Lee Soo Ann. "Patterns of Economic Structure in Singapore". In Singapore: Twenty-Five Years of Development, edited by You Poh Seng and Lim Chong Yah. Singapore: Nan Yang Xing Zhou Lianhe Zaobao, 1984. Lim Chong Yah and P. Lloyd (eds.). Singapore: Resources and Growth. Singapore: Oxford University Press, 1986. Lloyd, P and R. Sandilands. 'The Trade Sector in a Very Open Re-Export Economy". In Singapore: Resources and Growth, edited by Lim Chong Yah and P Lloyd. Singapore: Oxford University Press, 1986.
The Energy Economy of a City State, Singapore
213
Low, L. "Public Enterprise in Singapore". In Singapore: Twenty-Five Years of Development, edited by You Poh Seng and Lim Chong Yah. Singapore: Nan Yang Xing Zhou Lianhe Zaobao, 1984. Ministry of Trade and Industry. The Singapore Economy: New Directions (Report of the Economic Committee, Government of Singapore). Singapore, 1986. Mirza, H. Multinationals and the Growth of the Singapore Economy. London: Croom Helm, 1986. Morgan, T. "Oil prices: a long-term perspective". OPEC Review (1987). Oil and Gas Journal. Tulsa: Penwell Publishing Co. Oil and Gas News (various issues). Hong Kong: AI Hila) Publishing, Ltd. Ow Chin Hock. "The Role of Government in Economic Development: The Singapore Experience". In Singapore: Resources and Growth, edited by Lim Chong Yah and P. Lloyd. Singapore: Oxford University Press, 1986. Petroleum Intelligence Weekly (various issues). New York: Petroleum & Energy Intelligence Weekly, Inc. Petromin. Singapore: Petromin Publishing Company (Asia) Pte. Ltd. Platts Oilgram News. New York: McGraw-Hill Inc. Public Utilities Board (PUB). 25th Anniversary Publication (1963-88). Singapore, 1988. ____ .Annual Report. Singapore: various years. Regnier, P. Singapour et Son Envirormement Regional: Etude d'une Cite-Etat au Sein du Monde Malais. 1989. (Forthcoming in English translation. London: C. Hurst Publishers.) Report on the Census of Industrial Production (various years). Singapore: Department of Statistics and Economic Development Board, 1986. Sampson, A. The Seven Sisters: the Great Oil Companies and the World They Made. London: Hodder and Stoughton, 1975. Seah Khen Hee. "Future Prospects for Bunkering in Singapore". Paper presented at the Singapore International Bunkering Conference 1988, Singapore, 1988. Seow, T.S. Shipbuilding and Shiprepairing Industry in Singapore. Vienna: United Nations Industrial Development Organization, ID/WG.413/14, 1984. Singapore Economic Bulletin. Singapore: Singapore International Chamber of Commerce, March 1987. Singapore International Monetary Exchange (SIMEX). Oil Futures. Singapore: SIMEX, undated. Singh, G. "Singapore: Facing up to Competition in Refining". Oil and Gas News, 11-17 July 1988a. ____ ."Expert Predicts Exploration Boom". Oil and Gas News, 4-10 January 1988b. Takamiya, N. Untitled paper delivered at the Singapore International Bunkering Conference 1988, Singapore, 1988. Tan, Augustine and Ow Chin Hock. "Singapore". In Development Strategies in Semi-Industrial Countries, edited by B. Balassa et al. Baltimore: Johns Hopkins University Press, 1982. Tyler, A. "OSEA [Offshore Southeast Asia, conference held in Singapore] in mood of cautious optimism", Oil and Gas News, 8-14 February 1988.
214
Tilak Doshi
United Nations (UN). A Proposed Industrialization Programme for the State of Singapore. UN Commission for Technical Assistance, Department of Economic and Social Affairs, 1961. Yearbook of Statistics Singapore. Singapore: Department of Statistics, various years. You Poh Seng and Lim Chong Yah (eds.). Singapore: Twenty-Five Years of Development. Singapore: Nan Yang Xing Zhou Lianhe Zaobao, 1984. Wade, R. "The Role of Government in Overcoming Market Failure: Taiwan, Republic of Korea and Japan". In Achieving Industrialization in East Asia, edited by H. Hughes. Cambridge, UK: Cambridge University Press, 1988.
VII DEVEIDPMENT OF THE ENERGY POLICY IN THAILAND Tienchai Chongpeerapien
The evolution of the energy sector, along with the transition of the (Thai) economy away from its agricultural roots towards a modern industrial state, calls for an adaptive and responsive energy policy. In particular, the best roles for the state and for the private sector are likely to shift as government institutions and infrastructure are established and as the importance of different fuels in the economy changes. The Sixth Plan (1987-1991) (NESDB 198Sa)
W
hat has happened to Thailand's economy during the past few years has caught many people, government planners included, by surprise. Led by the extraordinary performance of the manufacturing, agricultural, and service sectors, the economy began to move into an upswing cycle in 1987. Stimulated partly by the 1986 world oil price slump, economic growth in 1987 rose to 8.4 per cent from 4.5 per cent in the previous year. In 1988, the economic momentum continued: exceptionally high commodity prices pushed growth in the agricultural sector to 10.21 per cent, and the overall economy grew by 13.22 per cent. Despite the threat of trade barriers in overseas markets, Thai manufactured exports continued to perform well in 1989. The volume of exports grew 35 per cent in 1989 compared to the previous year. Although imports also grew strongly, the surplus in the service account and the healthy flow of funds from abroad contributed to a balance of payments surplus during the period. Coupled with a strong performance in the other economic sectors, the overall growth rate of the Thai economy was 12.2 per cent in 1989. 215
216
Tienchai Chongpeerapien
Though the economic surge of recent years seems sudden, the Thai economy has, in fact, undergone significant structural changes during the last two decades. From an agrarian society that depended upon a few main crops for export, Thailand has gradually transformed towards becoming a newly industrialized country. The share of agriculture in the GOP has been gradually shrinking and has been surpassed by that of the manufacturing sector. The construction and service industries have become the leading sectors in the Thai economy. Changes are occurring not only in the economy, but also in Thai society, which is gradually being transformed from being rural to urban in character. Economic prosperity and employment opportunities in cities, particularly in Bangkok, are attracting significant inflows of rural migrants. As a result, the average annual growth rate of population in urban areas has been 4.3 per cent, which is relatively high compared to the average growth rate of less than 2 per cent in rural areas. The industrialization of the Thai economy and the urbanization of Thai society have had a profound impact not only on the growth of energy consumption but also the types of energy consumed. "Modern" or "commercial" fuel consumption has been growing at an average rate of 8.4 per cent since 1981 compared to the 5.1 per cent rate of growth of total primary energy consumption (see Table 1). Foremost among the commercial fuels consumed in the past was petroleum, which in 1981 TABLE 1 Primary Energy Demand in Thailand (In thousands of barrels per day, crude oil equivalent) 1981
1989
Petroleum Natural Gas Coal, Lignite Hydro/Electricity
220.1 5.3 10.9 14.5
332.4 104.1 55.0 25.6
Modern (Commercial)
250.8
517.1
Traditional
213.4
230.6
TOTAL ENERGY DEMAND
464.2
747.7
National Energy Policy Office; National Energy Administration.
SOURCES:
Development of the Energy Policy in Thailand
217
accounted for 88 per cent of total commercial fuel consumption. However, government policies promoting indigenous resource development and utilization have resulted in the increased availability of natural gas and lignite. In 1989, natural gas accounted for 20 per cent of the commercial fuel demand while the share of lignite was about 10 per cent. Meanwhile, the share of petroleum dropped from 88 per cent in 1981 to 64 per cent in 1989. Whereas demand for "commercial" fuels has increased, the consumption of "traditional" fuels (charcoal, fuel wood, paddy husk, and bagasse) has been stagnant. The share of traditional fuels in the total primary energy demand thus decreased from 46 per cent in 1981 to 30.8 per cent in 1989. It is likely that the percentage will continue to fall throughout the 1990s because of continued migration to urban areas and increased availability of commercial fuels, such as electricity and LPG, to substitute for increasingly scarce traditional fuels in rural areas. Section 2 of this chapter reviews Thailand's energy situation by assessing energy demand and supply and analysing energy supply by source. The focus of this section is on commercial fuels with particular attention given to oil and gas. In addition, this section discusses the relationship between energy and the economy and the growth of energy demand by major economic sectors. Section 3 provides an analysis of energy policy that includes major issues such as energy institution, energy demand, and energy supply policies with emphasis on oil and gas. Development of possible future energy policies is discussed in Section 4. Finally, Section 5 provides a conclusion to the chapter.
THE ENERGY SITUATION Thailand's average annual growth rate of commercial energy consumption during 1981-89 was 9.5 per cent (see Table 2). However, the share of petroleum in the total demand fell from 88 per cent in 1981 to 64 per cent in 1989. This reduction came mainly as a result of a low rate of growth of petroleum consumption (5.3 per cent per annum) compared to the growth of total demand during the same period. On the other hand, the share of domestically produced natural gas grew from a mere 2 per cent in 1981 to 20 per cent in 1989 while the share of domestically produced lignite also rose from 4 to 9.8 per cent during the eight-year period. However, the share of hydroelectricity (including imports) dropped from 5.8 per cent in 1981 to 4.9 per cent in 1989.
Tienchai Chongpeerapien
218
TABLE 2 Primary Commercial Energy Demand and Supply Balance Thousand Barrels Per Day (Crude Oil Equivalent) 1981
1989
Growth Rate (% Average Annual Increase)
1988-89
1981-89
DEMAND Petroleum Crude Condensate Oil Products Natural Gas Lignite Imported Coal Hydroelectricity
220.10 164.70 1.20 54.20 5.30 10.10 0.80 14.50
332.41 225.51 2.32 104.58 104.08 50.75 4.20 25.61
24.8 28.4 -16.9 19.0 0.2 21.8 -6.9 48.9
5.3 4.0 8.6 8.6 45.1 22.4 23.0 7.4
TOTAL DEMAND
250.80
517.04
19.3
9.5
0.30
21.32
4.9
70.4
1.20 5.30 9.20 13.20
16.78 104.08 54.33 24.51
2.9 0.2 28.3 48.9
39.1 45.1 24.9 8.0
Import Crude Oil Oil Products Coal Electricity
164.40 54.20 0.80 1.30
204.18 104.58 4.20 1.10
31.5 19.0 -6.9 49.8
2.7 8.6 23.0 -2.1
Export Condensate Electricity
0.00 -0.02
-14.46 -0.04
7.0 0.0
9.1
TOTAL NET SUPPLY
249.88
520.57
19.9
9.6
SUPPLY
Domestic Production Crude Oil Condensate (Including Export) Natural Gas Lignite Hydroelectricity
SOURCES: National Energy Policy Office; National Energy Administration.
Primary commercial energy demand in 1989 was 517 kbd (coe), of which 206.56 kbd (coe) was supplied from indigenous sources. The main source of domestic energy supply was natural gas, followed by lignite, crude oil, hydroelectricity and condensate. Together they supplied 40 per cent of the 1989 demand. The rest of the demand (60 per cent) was satisfied by imports and stock draw down.
Development of the Energy Policy in Thailand
219
Of the 314 kbd (coe) of energy imported in 1989, 98.3 per cent was in the form of petroleum consisting of 204.2 kbd of crude and 104.6 kbd (coe) of oil products. The remainder consisted of coal and a small amount of electricity from Laos and Malaysia. Although the share of imports in the total primary commercial energy demand decreased significantly from 88 per cent in 1981 to 60 per cent in 1989, the amount of imported energy continues to be substantial. Furthermore, petroleum continues to dominate energy imports, implying that the Thai economy continues to be vulnerable to any future world oil price shock. In view of the diverse sources of energy demand and supply in Thailand, it is perhaps useful to analyse sectoral energy demand and supply in greater detail in order to determine the source of growth of energy demand and the development of energy supply.
Energy Supply There are two main sources of primary commercial energy supply: domestically produced and imported. The former accounts for about 40 per cent of the overall supply, and the latter 60 per cent.
Primary Commercial Energy Production (Oil and Gas) Thailand is not a petroleum resource-rich country, especially when compared with its ASEAN neighbours Malaysia and Indonesia. According to a Department of Mineral Resources (DMR) estimate, Thailand has about 107.4 million barrels of proven crude reserve, 8.67 trillion cubic feet of natural gas, and 224.5 million barrels of condensate (Surawit 1987). In terms of crude oil equivalent, the combined oil and gas reserve in Thailand is 1.87 billion barrels compared to 12.48 and 16.4 billion barrels in Malaysia and Indonesia, respectively (Lucas 1987). Spurred by government policy to accelerate indigenous petroleum development, production from the above-mentioned crude oil and gas reserves began to come on-stream in 1981-82. Though initial production of crude oil from an onshore field was only about 6,100 barrels per day (b/d) in 1983, it rose to 14,700 b/d in 1984, which is equal to an annual production of 5.37 million barrels. By 1985, production of crude reached its peak of 7.9 million barrels and declined slightly to 7.8 million barrels in 1989 (see Table 3). Production of natural gas was also small in the early 1980s. Unlike crude, however, production of natural gas ~teadily increased to 85.5
TABLE 3 Primary Commercial Energy Production
1984
Crude and Condensate Production (thousand barrels) Crude Oil Condensate
1985
1986
1987
1988
1989
Growth Rate 1984-89 (o/o Average Annual Increase)
5,372 3,008
7,933 5,202
7,739 5,207
6,535 5,542
7,437 6,556
7,783 6,731
7.7 17.5
79,321 6,185
122,252 10,023
117,129 10,636
167,330 11,271
200,568 10,980
199,655 11,680
20.3 13.6
Lignite (thousand tons) EGAT Non-EGAT
1,939 398
4,612 534
4,764 778
5,776 1,154
5,955 1,346
6,701 2,200
28.1 40.8
Hydroelectricity (GWh)
4,065
3,674
5,532
4,056
3,718
5,521
6.3
Natural Gas Production (mmcf) Offshore Onshore
SouRCE:
National Energy Policy Office.
Development of the Energy Policy in Thailand
221
billion cubic feet per year in 1984 and to 211.3 billion cubic feet in 1989. Currently, the gas is produced in fields in two separate basins. One is. the offshore Pattani basin, belonging to UNOCAL, which accounts for the greatest amount of natural gas production. Current production in UNOCAI.:s fields is about 544 mmcfd. These fields are also producing associated condensate, of which 6.7 million barrels were produced in 1989. The other area is the onshore Phitsanulok basin, where some associated gas has been recovered from Shell's crude oilfields. There, current production of the gas is about 40 mmcfd. As for non-petroleum energy, the country produced 8.9 million tons of lignite and 5,521 GWh of hydroelectricity in 1989.
Primary Commercial Energy Import (Oil and Gas) Petroleum imports constituted 98 per cent of total primary commercial energy imports in 1989. Most of the imported petroleum has been in the form of crude oil, which accounted for 66 per cent of total petroleum imports in 1989. In terms of volume, 74.5 million barrels of crude were shipped in from abroad in 1988, up significantly from 55.3 million barrels in 1987 (see Table 5). In terms of growth, crude import grew at an average rate of TABLE 4 Natural Gas Demand and Supply Balance (In million cubic feet)
DEMAND Feedstock Natural Gas Separation Plant National Petrochemical Corp. Industrial Uses Power Plants TOTAL SUPPLY Offshore Onshore
SOURCE:
UNOCAL PTTEP ESSO Shell
National Energy Policy Office.
1991
1996
2001
65,335 47,085 18,250 17,155 174,835
81,030 62,780 18,250 35,040 292,000
81,030 62,780 18,250 35,040 285,430
274,480
443,110
436,540
237,250 0 13,505 6,570
219,000 91,250 91,250 6,570
219,000 91,250 91,250 0
TABLE 5 Primary Commercial Energy Import and Export
IMPORT Crude Oil (thousand barrels) Petroleum Products (million litres) Gasoline Naphtha Kerosene Diesel Jet Fuel Fuel Oil LPG Coal (thousand tons) Electricity (GWh) EXPORT Condensate (thousand barrels) Electricity (GWh) SOURCES:
Growth Rate 1984-89 (o/o Average Annual Increase)
1984
1985
1986
1987
1988
1989
49,158
46,267
49,062
55,333
51,414
74,527
8.7
4,204 66 0 50 2,545 199 642 702
2,791 39 0 10 2,147 169 206 220
2,560 8 0 0 2,155 215 82 100
3,828 223 0 0 2,680 368 342 215
5,220 379 0 0 3,763 547 286 245
6,316 614 0 0 4,308 495 247 653
8.5 56.2
228
334
224
311
346
335
8.0
710
723
758
415
430
643
-2.0
1,010
3,237
3,988
3,582
5,433
5,799
41.8
22.0
20.1
17.2
18.0
19.9
23
1.0
National Energy Policy Office; National Energy Administration.
-100.0 11.1 20.0 -17.4 -1.4
Development of the Energy Policy in Thailand
223
8.7 per cent per year during 1984-89. This growth resulted primarily from the revamping of the Thai Oil and Bang Chak refineries during 1986-89 which raised the country's refining capacity from 173,000 bid to 214,500 bid during this period. (Details of refining capacity, throughput, and sources of crude imports are shown in Tables A1 and A2 in the Appendix.) The three main refineries in Thailand are basically hydroskimming refineries, except for Thai Oil's, which has a 14,000 bid thermal cracker. Efforts are now under way to modernize and install more conversion facilities at the Thai Oil and Bang Chak refineries. Thai refiners select their own crude in order to meet local demand. For example, refiners have had difficulties meeting the rapidly growing demand for middle distillates, particularly high speed diesel. One of the ways the refiners have increased the yield of middle distillates has been to alter the crude slate by purchasing more of the Far East crude, such as Tapis Blend, which provides a high yield of middle distillates. Far East crude has thus accounted for 30-50 per cent of Thailand's total crude imports in recent years. Though Thailand's refining capacity has been increasing, imports of finished oil products have continued to grow during recent years. Import of diesel fuel, accounting for 68 per cent of total product imports, grew at an average rate of 11.1 per cent during 1984-89 (see Table 5). In 1989, however, diesel imports grew 14.5 per cent to reach 4.3 billion litres. Jet fuel imports have also grown rapidly over recent years, while gasoline imports have been strong since 1987. Fuel oil and LPG imports have come down significantly, however, since 1984, when indigenously produced natural gas came on-stream to substitute for fuel oil in power generation and to feed the gas separation plant that produces LPG. Most oil products imported by Thailand arrive by barge from refineries in Singapore. In addition to petroleum, Thailand imported 335,000 tons of steam coal and 643 GWh of electricity in 1989.
Primary Commercial Energy Exports In 1989, 6.73 million barrels of condensate were produced at UNOCAL"s offshore gas fields. As domestic consumption is unable to utilize all of the product, however, UNOCAL has been allowed to export over half of the condensate produced at its gas fields. In 1989, exports of condensate by UNOCAL reached 5.8 million barrels. Oil (Petroleum) Import Bill Because Thailand has to rely significantly on imported oil, the oil import bill has been staggering. During the height
224
Tienchai Chongpeerapien
of the second world oil price shock, the country paid 58.7 billion baht for imported oil. This amount accounted for 31 per cent of overall imports and was equivalent to 44 per cent of total export value (or 5.3 months of export) and 8.9 per cent of GOP (see Table 6). Following the second oil price shock, the value of the oil import bill gradually came down despite a continuously rising volume of oil import. In 1989, the bill was 59.8 billion baht, which accounted for 9.03 per cent of overall imports and was equivalent to 11.6 per cent of export value and 3.34 per cent of GOP.
Energy Demand As mentioned in the introduction, Thailand's commercial energy demand has been growing at a very strong rate of 9.5 per cent per year since 1981. Rapid expansion of most of the economic sectors, especially industry and transportation, has been the driving force for higher growth in energy demand. The Thai economy is moving towards a more diversified industrial and service-oriented society, and the demand for energy is expected to increase further.
Past Economic Development and the Structural Change Following the implementation of the First National Economic and Social Development Plan (1961-66) and the Second Plan (1967-71), both of which emphasized the development of basic infrastructure and import-substitute industries, the Thai economy has gradually become more industrialized. The import TABLE 6 Oil Import Bill
Net Oil Import* (million baht) Crude Oil Net Oil Import as Percentage of: GDP at Current Price Total Import Total Export *Fuel and lubricants. SOURCE:
Bank of Thailand.
1980
1985
1986
1987
1988
1989
58,733 39,304
56,719 38,526
32,354 21,939
44,177 26,248
38,828 21,889
59,819 33,186
8.92 31.13 44.09
5.59 22.58 29.33
2.96 13.40 13.86
3.58 13.22 14.73
2.58 7.57 9.62
3.37 9.03 11.59
Development of the Energy Policy in Thailand
225
substitution policy successfully raised the share of manufacturing in the GOP from 11.7 per cent in 1960 to 15.5 per cent in 1970. However, this policy also caused an adverse trade balance due to a high level of imports of capital goods and raw materials (Chaisakul 1989). Additionally, the prices of these import substitutes were internationally uncompetitive owing to the small scale of domestic production. In the 1970s, during the Third and Fourth Plans, the emphasis of the economic policy shifted from import substitution to export promotion strategy and the economy became more vulnerable to external economic environment such as the oil shocks and the weakening of the U.S. dollar. However, despite these adverse external conditions and the explosiveness of domestic political development, along with high inflation in 1974 and a recession during 1975-76, the manufacturing sector continued to have a relatively high rate of growth that averaged 10.07 per cent during that period (see Table 7). The Thai economy as a whole grew at a moderate rate of 6.76 per cent during the 1970s, and the share of the manufacturing sector in GOP increased further to 20 per cent by 1980. TABLE 7 Thailand's Real GOP Growth (In percentage - average annual increase)
Agriculture Mining and Quarrying Manufacturing Construction Electricity, Water Supply Transport and Communication Wholesale and Retail Trade Banking, Insurance, Real Estate Ownership of Dwelling Public Administration and Defence Services TarAL GOP NarE: e
=
estimate.
SoURCE: NESDB.
1970-80
1980-85
1986
1987
1988
1989e
3.92 5.93 10.07 5.05 13.79
4.92 4.57 4.62 4.30 10.95
0.30 -0.88 10.80 -2.86 10.73
-0.22 7.46 13.32 13.29 12.19
10.21 21.28 16.79 21.30 13.51
6.28 20.44 14.72 26.85 19.45
7.15
7.04
7.17
8.31
10.73
11.46
6.47
4.83
5.37
12.94
15.05
16.19
7.98 5.08
7.28 3.97
1.53 3.86
32.06 5.24
24.27 6.50
19.02 6.66
8.39 7.47
6.71 8.37
4.09 4.83
3.21 11.01
4.51 8.96
0.18 6.79
6.76
5.65
4.92
9.47
13.22
12.21
226
Tienchai Chongpeerapien
During the first half of the 1980s Thailand, like many other countries, was hit hard by the second world oil price shock that subsequently led to recession in most developed countries. Despite the government's efforts to promote the manufactured export industry during the Fifth Plan, the industry suffered from world economic recession and growing protectionism in the international market, leading the industry growth to slow down to 4.6 per cent during the period. However, after the collapse of the world oil price in 1986 and the general economic recovery in developed countries that followed, the Thai economy in general, and the manufactured export industry in particular, began to move along an upswing path. In 1988 most economic sectors, including manufacturing, experienced high growth of more than 10 per cent. The share of the manufacturing sector in the GOP has continued to increase rapidly in recent years, reaching 23.8 per cent in 1989 (see Table 8). On the other hand, the share of the agricultural sector in the GOP eroded from 25 per cent in 1981 to 16 per cent in 1989. One significant result of the government's industrialization policies has been the growth of urban areas, particularly Bangkok. Most industries founded during the 1960s and 1970s centred on Bangkok because of the availability of basic infrastructure there. In turn, increased employment opportunities in Bangkok attracted significant inflows of migrants from rural areas and stimulated the rapid expansion of the city. However, urbanization has not been limited to Bangkok. Wishing to slow down the growth of the capital during the 1970s and 1980s, the government TABLE 8 Share of Real GOP by the Five Largest Sectors (In percentages)
Agriculture Manufacturing Wholesale and Retail Trade Services Banking, Insurance, Real Estate NorE: e = estimate. SoURCE: NESDB.
1981
1985
1986
1987
1988
1989e
25.0 20.7 16.4 11.0
19.9 20.7 16.3 13.9
19.1 21.8 16.4 13.9
17.4 22.6 16.9 14.1
16.9 23.3 17.1 13.6
16.0 23.8 17.8 12.9
6.2
3.0
2.9
3.5
3.8
4.1
Development of the Energy Policy in Thailand
227
formulated policies to create regional economic growth centres by promoting the relocation of small, agro-based industries to the provinces. The Fifth and Sixth Plans also emphasized the establishment of specific area development that saw the growth of industries along the eastern seaboard. In this way, other parts of the country have become increasingly urbanized.
Energy-Economy Relationship As a result of the urbanization and industrialization of the Thai economy, particularly during the 1980s, the demand for modern forms of energy has been growing at a rate exceeding that of the GOP. The average real GOP elasticity of demand for primary commercial energy was 1.23 during the first half of the 1980s (see Table 9). The value of elasticity has continued to be greater than one even after 1985 and is expected to remain so for the near future. Correspondingly, the value of primary commercial energy intensity also rose from 0.78 bid (coe) per million baht of GOP in 1981 to 0.9 bid (coe) per million baht (see Table 10).
TABLE 9 Average Real GOP Elasticity of Demand 1981-85
1985-86
1986-87
1987-88
Primary Commercial Energy
1.23
1.18
1.81
1.17
Total Energy
0.79
0.62
1.05
0.70
TABLE 10 Primary Commercial Energy Intensity (In barrels per day [crude oil equivalent] per million baht) 1981
1985
1986
1987
1988
1989
Liquid Petroleum Natural Gas Solid Fuels
0.68 0.02 0.03
0.52 0.17 0.08
0.53 0.15 0.08
0.54 0.20 0.10
0.55 0.21 0.09
0.58 0.18 0.09
Total Primary Commercial Energy
0.78
0.81
0.82
0.87
0.89
0.90
228
Tienchai Chongpeerapien
The increased energy intensity resulted from the expansion of the power and manufacturing sectors. In 1980, oil was the main source of energy that fueled power plants and factories in Thailand. However, the discovery of significant natural gas and lignite reserves coupled with the world oil price shocks led the government to launch a policy of imported oil substitution that induced natural gas and lignite consumption to grow from 15.4 kbd (coe) in 1981 to 154.8 kbd (coe) in 1989. New power plants were fired by natural gas or lignite and major energy-consuming industries, such as cement, modified their heating equipment to use natural gas or lignite. The resulting growth of natural gas and lignite utilization led to an increase of natural gas and solid fuel energy intensity from 0.02 and 0.03 b/d (coe) per million baht of GOP in 1981 to 0.18 and 0.09 b/d (coe) per million baht in 1989, respectively (see Table 10). On the other hand, oil intensity gradually came down from 0.68 b/d (coe) per million baht in 1981 to 0.52 b/d (coe) per million baht in 1985, and rose slightly to 0.58 b/d (coe) per million baht in 1989. Thus, in the 1980s, Thailand energy development had reached another important milestone in terms of energy demand and supply. Although oil continues to be the leading commercial fuel, its dominance in Thailand's energy demand and supply has diminished in recent years.
Natural Gas Demand Table 4 highlights current and projected natural gas demand by sector. As mentioned above, natural gas is primarily used to fuel the power plants located in or around Bangkok. The gas is produced in the Gulf of Thailand and transported via a 425-km pipeline to a 350 mmcfd gas separation plant. There, propane, butane, and heavier hydrocarbons are extracted from the gas to make LPG and chemical feedstock. The remaining methane and ethane are transported by pipeline from the gas separation plant to power stations and industrial plants. In 1991, power plants are expected to consume 174.8 billion cubic feet of natural gas, which would be equivalent to 64 per cent of the total gas demand. (The figure includes 6.6 billion cubic feet of associated natural gas from Shell's onshore crude fields which is used entirely for power generation.) The natural gas separation plant would utilize 47 billion cubic feet and industrial plants would burn 17 billion cubic feet of the gas. The petrochemical industry initially consumed 1.6 billion cubic feet of natural gas when a plant came on-stream in late 1989. However, consumption by power plants and other industries is expected to grow as greater supply of the gas becomes available in the future. By 2001, total
Development of the Energy Policy in Thailand
229
annual consumption of natural gas is expected to reach 436.6 billion cubic feet, 65 per cent of which will be used for power generation.
Petroleum Product Demand Table 11 highlights petroleum product demand in Thailand during 1984-89. Of the 17.8 billion litres of oil products consumed in 1989, 61 per cent were middle distillates, 18.6 per cent were gasoline, and 20 per cent were fuel oil. Of the 10.9 billion litres of middle distillates consumed in 1989, 80 per cent were diesel fuel, 19 per cent were jet fuel, and about 1 per cent were kerosene. Thus diesel fuel has been the most consumed oil product in Thailand, accounting for 49 per cent of total oil product demand in the country. Despite its large base, diesel consumption also has had a high growth rate. The average rate of growth for diesel fuel during 1984-89 was 10.4 per cent, but this has jumped in recent years to around 18 per cent. Jet fuel is another oil product with a high growth rate, averaging 11.8 per cent during 1984-89. A recent boom of air traffic to Thailand has raised the growth of jet fuel demand to 15.4 per cent in 1989. Gasoline is another transport fuel with a high growth rate in recent years. During 1984-89, gasoline demand grew 9.5 per cent annually, but the growth rate for 1988-89 rose to 13.6 per cent. On the other hand, the demand for fuel oil came down significantly in the mid-1980s partly because of the substitution by natural gas and lignite. However, a sudden surge of electricity demand in 1989, coupled with the expansion of manufacturing industries, caused the fuel oil demand to grow 31.6 per cent compared to its average annual growth rate of 2.8 per cent during 1984-89. The government rural electrification programme has now connected nearly 90 per cent of all villages to the power supp:ly system. The widespread availability of electricity - along with increased controls on the kerosene trade to prevent the adulteration of diesel fuel - has had a direct impact on the consumption of kerosene. Once the main source of lighting in rural households, consumption of kerosene has fallen at an annual average rate of 15.8 per cent. On the other hand, government policies to deter the use of wood fuels by subsidizing the use of LPG for household cooking have resulted in higher LPG consumption, which has grown by an average rate of 9.1 per cent per annum since 1984. A breakdown of oil consumption by economic sector reveals that transport and communications consumes about two-thirds of the oil in the country (see Table 12). A boom in the sale of motor vehicles,
TABLE 11 Oil Product Demand (In million litres)
1984
1985
1986
1987
1988
1989
Growth Rate 1984-89 (o/o Average Annual Increase)
Gasoline
2,109.2
2,089.4
2,268.9
2,596.7
2,922.9
3,321.7
9.5
Diesel
5,277.8
5,523.8
5,736.1
6,428.5
7,284.6
8,649.7
10.4
Kerosene
282.5
154.0
143.1
129.0
125.6
119.2
-15.8
Jet Fuel
1,201.0
1,229.4
1,356.6
1,477.5
1,820.5
2,101.0
11.8
Fuel Oil
3,162.6
2,280.8
2,410.2
2,395.7
2,761.4
3,635.3
2.8
549.0
608.2
636.7
679.7
756.4
846.7
9.1
LPG (thousand tons) SOURCE:
Ministry of Commerce.
Development of the Energy Policy in Thailand
231
TABLE 12 Share of Oil Product Demand by Economic Sector (In percentages)
Agriculture Mining and Quarrying Manufacturing Electricity, Gas and Water Construction Trade, Restaurant, Hotel and Residential Transport and Communications Financial, Insurance, Real Estate and Business Services Others TOTAL Oil Demand (kbd [coe])
1984
1985
1986
1987
1988
9.4 0.8 13.0 14.1 0.9
8.1 0.7 13.8 8.3 1.2
8.0 0.5 13.3 7.6 1.1
7.0 0.4 13.6 4.7 0.9
6.1 0.4 13.2 5.8 0.7
3.3 54.7
4.4 61.6
5.0 62.6
5.3 66.7
5.6 65.9
0.0 3.7
0.0 1.9
0.0 1.4
0.0 2.3
100.0
100.0
236.3
270.7
100.0
100.0
0.0 1.9 100.0
217.6
206.4
218.0
SOURCES: Oil and Thailand (1988); National Energy Administration.
particularly pick-up trucks, led to high growth of transport fuel demand for gasoline and diesel. When all taxis in Bangkok were converted to run on LPG in the early 1980s, demand for this product grew strongly. However, the demand for automotive LPG has tended to level off in recent years as a result of government policies to narrow the gap between automotive LPG and gasoline prices. The second major oil-consuming sector in Thailand is manufacturing. This sector's share in oil consumption has been about 13 per cent during the past five years. Manufacturing consumed about 1,600 million litres of fuel oil annually with a relatively steady growth rate, averaging 2.2 per cent per year, during 1981-88. The conversion of some cement factories to use lignite is one of the reasons behind the relatively low growth of fuel oil demand in the manufacturing sector during this period. In this sector major consumers of fuel oil are the textile, food processing, pulp and paper, and ceramic industries. Together they account for 73 per cent of total fuel oil consumption by the manufacturing sector. Other economic sectors are relatively minor consumers of oil in Thailand. Electricity generation and the other utilities have seen a declining share of oil consumption as a result of natural gas and lignite substitution
232
Tienchai Chongpeerapien
for fuel oil. Despite the increased mechanization of farming, the agricultural sector has had a lower share of oil consumption. Additionally, this sector has experienced slow growth of output in recent years resulting partly from government policies to limit forest area encroachment by farmers. The widespread availability of electricity has also helped to reduce kerosene consumption in this sector. On the other hand, the business and residential sectors have experienced relatively strong growth in oil consumption. These sectors consume significant amounts of fuel oil and LPG. ENERGY POLICY AND PROBLEMS IN THAILAND
Development of Energy Policy before the Current Plan Before 1973, during the era of "cheap energy", imported oil accounted for 97 per cent of the country's primary commercial energy consumption (NEA 1976). At that time, however, being dependent on imported oil was not of great concern to Thai planners except when discussed in the context of power generation. As the planners began to chart the course of future economic development in the early 1960s, a looming power shortage was seen as the main issue; therefore, policy in both the First and Second National Energy Plans (1961-71) was entirely geared towards expanding and modernizing the power generation and distribution system. (The National Energy Plan is a component of the National Economic and Social Development Plan.) In 1963, the country had 333.8 MW of decentralized electricity-generating capacity, 130 MW of which was powered by small, isolated diesel engines. Thermal power plants, fueled mostly by fuel oil and a small amount of lignite, accounted for the remaining capacity. Despite the vast potential offered by rivers and mountains, Thailand had no hydroelectricity generation at that time. To reduce operating costs and to increase the efficiency of the powergeneration system the government launched the Yanhee hydropower project on the Chao Phraya river, a large fuel oil thermal plant in Bangkok. and a lignite-fired plant in the south. Diesel power plants were being phased out, and by the end of the Second Plan in 1971 hydro, thermal, and diesel accounted for 38.6, 43.6, and 17.8 per cent of the 1,169 MW generating capacity, respectively. The Third Energy Plan, launched in 1972, continued to focus on centralizing power generation and expanding centralized power distribution to provinces still served by isolated diesel engines. However, a drought
Development of the Energy Policy in Thailand
233
that hit Thailand during 1967-69 had significantly reduced power generation by hydroelectric dams. This, together with the increased demand for water for irrigation, changed the employment of hydroelectric dams from base-load to peak-load power suppliers, starting with the Third Plan. The planners, therefore, focused on building large integrated thermal power plants in Bangkok and the provinces. By 1975, the generating capacity was raised to 2,438 MW, consisting of 1,334, 909, and 195 MW of thermal, hydro, and gas turbine/diesel, respectively. Following the first oil price shock in 1973, the government realized that energy planning as practised was inadequate, especially in dealing with such issues as energy substitution, supply security, oil pricing, and indigenous petroleum resource development. Even though the oil price shock raised the 1975 oil import bill threefold from the previous year's level, consumption continued to rise as the government was without direct or indirect measures to curb it. Worse, the government had practically no experience in dealing with most aspects of the oil business since oil importation, refining, and marketing were generally undertaken by foreign oil companies. The Fourth Energy Plan, launched in 1977, widened energy policy from power generation and distribution to reducing the country's dependency on imported oil through aggressive indigneous resource exploration and development. The plan called for the formulation of a "master plan" for long-term energy development that would take into account broader economic and social development goals. The plan stressed that petroleum resources be developed to the maximum extent possible. However, Thailand did not benefit from the plan until years later since petroleum development takes a long time to bear fruit. For example, though UNOCAI..:s gas field was first discovered in 1972, production did not come on-stream until1981. Meanwhile, the government drew up shortterm and long-term measures to curb oil consumption. The short-term measures included cutting oil selling time, adjusting oil prices, and reducing energy consumption by government agencies. The long-term measures included reducing oil consumption in the industrial and transportation sectors and adjusting oil prices to match world oil prices. Furthermore, the government continued to promote the use of lignite in power plants and planned to construct more hydroelectric dams. To further reduce the dependency on imported oil, nuclear power was, for the first time, included as an option for future power generation. Unfortunately, many of the planned objectives were not achieved. First, the energy "master plan" was never drafted. Second, energy conservation
234
Tienchai Chongpeerapien - -----------------
measures were ineffective since the government did not seriously enforce them; as a result, oil consumption continued to grow unabated. Since all of the oil consumed was imported, the country's oil import bill grew, along with the world oil price, to reach 44 per cent of total export earnings in 1981. This seriously jeopardized the country's balance of payments and its monetary position. Finally, the construction of hydroelectric dams was complicated by growing public concern about the environment; thus authorities had to rely on fuel oil for their base-load generation. The construction of a nuclear power plant was never seriously considered by the authorities. One of the main reasons that the government failed to curb growing oil consumption during the Fourth Plan was because the government had adopted a conciliatory pricing policy. Ever since the first oil price shock, oil pricing had become a very sensitive policy issue and the government had adopted measures to stabilize domestic oil prices in order to "delay" economic as well as political backlashes. Oil prices were placed under strict government control, and the Oil Price Stabilization Fund, or Oil Fund, was established.* Since taxes and marketing margins were normally held constant, the Oil Fund contribution was a balancing factor that kept retail oil price constant in the face of fluctuating world oil prices. Unfortunately, this kind of government pricing policy created a host of problems, the impact of which can still be felt today. Some of the problems were: 1. Oil prices in Thailand did not reflect the opportunity cost of the oil when they were fixed by the government. By keeping prices artificially low, excessive consumption of oil products was inevitable. 2. By keeping the price of fuel oil low in order to protect the power industry, plans for developing indigenous resources such as oil and natural gas were jeopardized.
*Controlled retail oil prices in Thailand are derived from the following components: ex-refinery (or import) price plus taxes plus Oil Fund contribution plus controlled marketing margin controlled retail price Taxes and Oil Fund contributions are entirely different. Taxes go to the government's General Revenue Fund, while Oil Fund contributions go to the separate oil fund reserve, managed by the Finance Ministry, to be used strictly for subsidizing oil prices (Amranand and Chongpeerapien 1988).
Development of the Energy Policy in Thailand
235
--------·------·
3. During the period of sustained oil price increase between 1979 and 1982, the Oil Fund reserve went into staggering deficit. Under the circumstances, the government had to adjust the oil price upward. However, as a political gesture, the government raised the prices of gasoline and automotive LPG at a much higher rate compared to those of diesel and fuel oil. Later, the pattern of oil consumption was distorted and oil product adulteration emerged. 4. The government experienced significant losses of tax revenue because of tax reductions to slow down the Oil Fund drain, and later because of oil product adulteration. 5. Refiners had to face an imbalanced growth of domestic oil demand that caused diesel consumption to expand disproportionally high, compared to gasoline. When the Fifth Plan was launched in 1982, the second world oil crisis was at its height. The government thus emphasized defusing the turmoil of the domestic energy situation brought about by the continuously rising world oil price. Restructuring the energy sector became the main objective of the plan. The planners believed that the world oil price would continue to rise and that the following actions would have to be taken to arrest growing demand and to accelerate indigenous energy resource development.
1. The government would institute immediate measures to conserve energy in the transportation, industrial, and residential sectors. Both the "carrot" and "stick" approaches were considered, with the former consisting of incentive schemes such as import tax exemption on energy conservation equipment, and the latter including road-use tax increases and switching off street lights. 2. The government would restructure domestic energy prices in order to reflect world oil price movements, to eliminate consumption distortions, and to promote conservation. 3. The government would promote indigenous energy resource development and support non-conventional energy research and human resource development. 4. The government would streamline the roles of government agencies in energy. 5. The government would formulate an energy "master plan". Many of the Fifth Plan objectives were similar to those of the Fourth Plan. Both plans also contained a vaguely written energy policy that
236
Tienchai Chongpeerapien
lacked details concerning how the objectives were to be implemented and who would be responsible for implementing them. As a result, urgent policy measures, such as conservation, failed to get off the ground. The only actions taken in this regard were the short-term restrictive measures mentioned above. When the world oil price came down after 1982, conservation measures gradually faded away or were largely ignored by the officials. In the area of petroleum resource development, the government's decision to impose stringent requirements on onshore petroleum investment by oil companies ran counter to its own policy of promoting the development of these resources. In addition to the existing 12.5 per cent royalty payment and 50 per cent income tax, the 1982 Ministerial Regulation stipulated that oil companies exploring onshore in Thailand must pay the government a "special bonus" calculated as a progressive rate on gross revenue ranging from 27.5 to 43.5 per cent. In addition, the regulation also imposed a cap on claimed expenses at 19 per cent of gross income. Over-the-limit claim would be levied by the government as "special benefit". The regulation disregarded the fact that Thai geological conditions are considered difficult because most petroleum reservoirs are small and fragmented. The imposition of the stringent requirements on investment, coupled with the fall of world oil price after 1982, had a detrimental effect on the country's oil and gas exploration efforts. According to the DMR, no company receiving concessions under the new Regulation performed onshore exploratory drilling during the period 1982-86. In the area of oil pricing, the weakening of the world oil price after 1982 provided the government with an opportunity to correct distortions that occurred during the Fourth Plan. First, domestic oil prices were adjusted downward slowly in relation to the fall in the world oil price. This was done mainly because the government wanted to build up the Oil Fund reserve. Second, when the world oil price collapsed in 1986, the government decreased the price of domestic gasoline 24 per cent and diesel 6 per cent, thereby narrowing the gap between the two fuels. Another important corrective measure on the price structure was to tax fuel oil for the first time in 1986. As a result, domestic oil consumption became more balanced. Finally, the measures covering the remaining elements of the Fifth Plan were less than successful. Efforts to streamline the role of government agencies were not seriously carried out. As for the formulation of an energy "master plan", foreign consulting firms were commissioned to
Development of the Energy Policy in Thailand
237
undertake the task under the auspices of the National Energy Administration (NEA) (R.R.N. Associates 1983). The NEA intended to use their plan report as a framework for the formulation of the upcoming Sixth Energy Plan. Unfortunately, the NEA kept the Master Plan report, completed in 1983, under study for many years. The report, which had never been publicly disclosed, became outdated, and was later shelved.
The Current Energy Plan (1987-91) The theme of the current Energy Plan is best described as an "echo" of the Fourth and Fifth Energy Plans. The main energy issues identified in the Fourth and Fifth Plans, but have not been resolved to satisfaction, reappeared in the Sixth Plan. Likewise, the Sixth Plan also recognizes the role of the private sector and the need to secure appropriate types of energy for rural consumption. More specifically, the main objectives of the Sixth Plan are as follows: 1. to reduce imported energy dependency by way of increased indigenous resource development; 2. to continue adjusting energy pricing structure in order to improve consumption efficiency; 3. to promote energy conservation; 4. to encourage private sector energy investment; and 5. to develop suitable forms of energy for the rural sector. Despite their common goals, however, the current plan differs from the previous plans in detail as well as in its approach to solving the energy problems. First, as mentioned in the excerpt at the beginning of the chapter, the plan is predicated on the uncertainty of the world oil price. Evidently the past two oil crises have taught planners a great deal about the petroleum business. The planners have also learned about the impact of the volatility of oil price movements and supply disruptions on the economy and, more importantly, about the cost of adopting inflexible policies. Planners were told to use a "prudent but dynamic approach" to planning and to learn to be adaptive in a fast-changing environment (Unakul 1988). In addition the current plan is much more comprehensive than its predecessors. Macroeconomic factors that are important in planning and receiving feedback from changing energy-economy situations were examined by using mathematical models.
238
Tienchai Chongpeerapien ~~~~~~~~~--~~~~~--
Included in the plan are numerous measures to carry out the planned policies. These measures can be grouped into three broad categories: first, the supply measures; second, the demand measures; and finally, the energy management measures (see Table 13).
Supply Measures The government has proposed two sets of measures to increase the country's oil supply security. As shown in Table 13, the first set of measures aims at increasing indigenous oil and gas exploration and development, particularly from small and high cost fields. First, the Petroleum Tax and Petroleum Income Tax Acts were revised to replace the fixed royalty payment with a so-called "sliding scale" rate. Fields that produce less than 2,000 b/d now pay only a 5 per cent royalty. The maximum rate of 15 per cent is applied to fields producing over 20,000 bid of petroleum. Furthermore, the 1982 Ministerial Regulation discussed above was replaced by a less stringent special benefit payment scheme. The concession holding period was also reduced to speed up exploration and production. These proposed measures were approved by Parliament in mid-1989 and have now become law. Second, the government has actively supported the use of natural gas in chemical and industrial plants to replace fuel oil. Despite the high cost of connecting pipelines, the private sector has shown strong interest in natural gas. By 1996, the amount of natural gas supplied to these plants is expected to reach 320 mmcfd. Third, the government is also studying the prospect of developing petroleum jointly with Malaysia in areas of the gulf claimed by both countries. Finally, the government also continues to pursue a policy of diversifying oil import in order to minimize the risk of supply disruption. Outlined in the second group of supply measures is the government's intent to expand and modernize domestic oil-refining capacity. The existing capacity of 214,500 b/d will possibly be expanded to 600,000-700,000 b/d by mid-1990s. This includes construction of two green-field refineries (by Shell and possibly by Caltex) on the Eastern Seaboard. All of the five refineries will have sophisticated conversion units. The government is also considering the building of a sixth refinery, possibly on the Southern Seaboard. To promote competition and refining efficiency, the government plans to deregulate the industry. As a first step, the government has begun to announce controlled ex-refinery and import prices once a week instead of once every one or two months as was done in the past. These prices are
Development of the Energy Policy in Thailand
239
TABLE 13 Sixth Plan Energy Policy Measures in Oil and Gas and Their Current Status Policy Measure
Current Status*
SUPPLY MEASURES 1. To accelerate indigenous petroleum supply exploration and development, and to diversify import: 1.1 Petroleum exploration and development; 1.1.1 to revise Petroleum Tax and Petroleum Income Tax Acts, 1.1.2 to diversify natural gas market to include nonpower users, and 1.1.3 to accelerate plan to develop petroleum in the Joint Development Area with Malaysia.
3
1.2 To diversify oil import sources to reduce the risk of shortage and to minimize price fluctuation.
1
1
2
2. To expand domestic oil refining capacity and to deregulate oil import: 2.1 To expand and modernize domestic oil refining industry.
2
2.2 Short-term measure: to establish local ex-refinery and import prices to reflect world oil prices.
1
2.3 Long-term measure: to deregulate ex-refinery ai'd import prices and to streamline oil import procedures.
2
DEMAND MEASURES 3. To revise the oil and gas pncmg structure in order to minimize consumption distortion and to improve utilization efficiency: 3.1 Oil product pricing; 3.1.1 to equalize excise tax rate on gasoline, diesel, and automotive LPG, 3.1.2 to abolish price subsidy, 3.1.3 to abolish two-tier pricing of LPG, 3.1.4 to adjust fuel oil tax to promote competition with fuel oil substitutes, and 3.1.5 to deregulate the oil price. 3.2 Natural gas pricing; 3.2.1 to introduce "basing point" pricing for natural gas,
2
2 2 1 2 2
240
Tienchai Chongpeerapien
TABLE 13 (cont'd) Policy Measure 3.2.2 to establish a clear procedure for the setting of natur?l gas pipeline tariff, and 3.2.3 to encourage direct negotiations between users and producers of natural gas while allowing ITT to charge only pipeline delivery cost established by the government. 3.3 Crude oil pricing; 3.3.1 to price domestically produced crude oil using the 'basing point" pricing procedure, and 3.3.2 to encourage exploration and development of petroleum by limiting government's take (royalty and taxes) to petroleum production stage only.
Current Status*
4
4
1
1
4. To promote conservation in the utilization of energy: 4.1 Conservation in transportation section; 4.1.1 to improve coordination among various government agencies responsible for traffic and transportation in Bangkok, 4.1.2 to improve public transportation system, including highways, in the capital city, 4.1.3 to strictly enforce traffic regulations, 4.1.4 to increase road use tax, and 4.1.5 to diversify freight transportation system to include waterways and air transportation. 4.2 Conservation in industrial, commercial, and residential sectors; 4.2.1 to establish the National Energy Conservation Center, and 4.2.2 to promote energy conservation by providing industries with low interest loans and an import tax exemption on energy conservation equipment. 4.3 To promote conservation awareness by using mass media;
3 2 4 4 3
1
2 3
4.4 To promote transferring of energy conservation
technology; 4.5 To develop efficient cooking stove for rural uses.
3 2
Development of the Energy Policy in Thailand
241
TABLE 13 (cont'd) Policy Measure
Current Status*
ENERGY MANAGEMENT MEASURES 5. Roles of the government: 5.1 To streamline the role of government agencies responsible for planning, regulating, and development of energy, and
2
5.2 To limit the government energy activities to planning and regulatory roles, and to minimize the government upstream investment risk by joint venturing with the private sector.
2
6. Roles of the private sector: 6.1 To promote the private sector involvement in all aspects of energy activities including exploration, development, transportation, and marketing; 6.1.1 upstream exploration and development, 6.1.2 refining, 6.1.3 oil importation, and 6.1.4 transportation and marketing. *1 2 3 4
2 2 2 2
The measure has been carried out. Serious efforts are being made to carry out the measure. The measure is being studied for possible future implementation. No serious action or consideration has been made on the measure.
based on the averaged posting and spot prices in Singapore of the week preceding each announcement. In the long run, the government plans to deregulate these prices as well as to free oil product imports. In effect, local refineries will be in direct corr petition with imports. The question is, however, can local refiners compete with Singapore? As a matter of fact, the government is still uncertain about the competitiveness of the local refining industry. Local refiners have voiced concern about deregulation as they are already "penalized" by having to keep mandatory crude oil reserve and to pay special benefits as well as import taxes to the government on equipment and chemicals. Refiners in Singapore do not face such requirements. Currently, the measure is being studied by the government.
242
Tienchai Chongpeerapien
Demand Measures The demand measures to increase the efficiency of energy consumption pertain to energy pricing and energy conservation. Some of these measures, however, had already been formulated in the Fourth Plan some ten years ago. (a) Oil product pricing Distortions in oil product consumption - a result of pricing policies set out in the Fourth Plan - have continued to be of major concern to the government. Although the government had undertaken measures to reduce the distortion in 1986, the oil price structure still needed further adjustment. First, the government has begun to tax fuel oil in order to ensure competition in industrial fuels. Second, the government has abolished the two-tier pricing of LPG, thereby narrowing the gap between cooking and non-cooking LPG prices. Third, the government plans to work towards equalizing taxes on all transportation fuels so that no particular group of consumers will be especially favoured. Finally, the government plans to abolish price subsidies and, ultimately, deregulate oil prices. The policy of oil price deregulation thus makes the Sixth Plan stand out from the previous plans. Extensive studies have been conducted on the competitiveness of the local oil industry, oil pricing and distribution, and the potential impact of deregulation on all parties concerned. Preliminary results of the studies indicate that the industry can be deregulated, but a few preparatory steps must be taken to ensure efficiency and fair competition. In fact, the government has issued a clear guideline for a qualified applicant who wants to apply for an oil trading licence. The licence allows an oil company to trade oil in excess of 100,000 metric tons per annum, and to import oil. The new guideline will help increase the number of established oil companies in Thailand. Furthermore, the government has also relaxed quota restriction on oil import, making it easier for licensed oil companies to import oil. Rules and regulations controlling the establishment of retail stations have been streamlined. The government has also relaxed its refinery expansion policy by allowing private oil companies to take the lead role in future refinery expansion. The policy controlling capacity expansion and the establishment of new refineries has also been liberalized. On petroleum pricing, the government introduced a retail pricing formula in August 1990 that allows retail oil price to rise automatically if the Oil Fund reserve and the excise tax revenue of the government fall below an established level. The reverse is also true if the reserve and
Development of the Energy Policy in Thailand
243
revenue go above the set ceiling. The launch of the formula coincided with the Gulf crisis and as a result, the retail oil price in Thailand was adjusted upward twice in September 1990. The introduction of the pricing formula is seen as an important step toward the deregulation of oil price in Thailand. (b) Natural gas pricing According to the PEIDA study (PEIDA 1984), which was subsequently supported by the World Bank (World Bank 1985), Thailand offers no clear guidelines for the pricing of natural gas to producers and consumers. Currently, gas prices are negotiated on a contract by contract basis between Petroleum Authority of Thailand (PTT), which acts on behalf of the government, and concessionaires. (In Thailand, the government has the first right by law to purchase indigenously produced petroleum resources.) The contracts are based on a "cost-plus" approach with gas or crude prices established at the field-gate (World Bank 1985). Prices are allowed to escalate. In the case of gas, the first contract between PTT and UNOCAL linked the gas price to the Singapore fuel oil price, U.S. and Thai inflation, and the baht exchange rate. According to the World Bank, the existing pricing procedure entails two major problems: 1. The cost-plus approach to pricing is "clumsy" and prone to cause
extensive delays in contract negotiations. It also often leads to a decrease in investment by oil companies. 2. The existing procedure creates an air of uncertainty, particularly for prospective investors and consumers, as to how their discoveries will be priced. There is a serious lack of "transparency" in the pricing procedure. The recommendations of PEIDA and the World Bank, later adopted by the Sixth Plan policy, were to establish a national petroleum resource pricing policy based on the Basing Point price in Bangkok. In other words, Bangkok would become a reference point for wholesale prices of gas on which selling prices to consumers are based. The price at the Basing Point would be linked to international prices of competing fuels expressed as a percentage (termed "discount parameter" by the World Bank) of fuel oil price in Singapore, and would be adjusted regularly. Consumer prices would be determined by factors such as volume and distance from the Basing Point. The establishment of a Bangkok-based price for natural gas implies that there must also be a clear pricing policy for natural gas pipeline
244
Tienchai Chongpeerapien
transportation. Currently, PTT owns and operates the pipeline and thus sets its own pipeline tariff. How the tariff is set by PTT has never been disclosed. Since PTT is also the sole purchaser of gas from producers, it virtually monopolizes natural gas distribution and trade. In order to promote natural gas utilization, the Sixth Plan aims to allow direct negotiations between users and producers of gas. PTT, however, will continue to deliver gas on the basis of a "standard" pipeline tariff. The government has taken some actions to implement the suggested pricing procedure. Negotiation on natural gas contract between ESSO and the government for the purchase of natural gas from ESSO's Nam Phong field has been based on Basing Point pricing. However, as yet there has been no serious action taken on the natural gas pipeline tariff measure mentioned above. (c) Energy conservation Despite the fall of the world oil price since 1983, the planners continue to recognize the importance of conservation. According to their view, imported oil would account for about half of the country's commercial energy demand during the late 1980s. In the 1990s oil consumption, if left unchecked, will far outgrow domestic production, resulting in an increasing dependency on imported oil. Conservation is perhaps one of the most logical ways to slow the growing demand. As shown in Table 13, the government has proposed a number of measures to promote conservation in the transportation, industrial, commercial, and residential sectors. Some of these measures aim towards solving Bangkok's traffic problems, improving public transportation, and increasing public awareness of the need to conserve energy. The NEA has recently been assigned to coordinate the implementation effort and has been instructed to formulate a detailed work plan. What has been accomplished so far in the area of conservation is the establishment of the National Energy Conservation Center under the NEA to promote energy conservation in industry. Limited industrial audits have been carried out by the NEA, and the government has waived import taxes on energy conservation equipment. In addition, the Cabinet has recently endorsed the NEA's plan for electricity conservation in industrial, commercial, and residential sectors. According to the plan, Thailand could potentially conserve about 600 MW of electricity generation during a five-year period by investing 3.8 billion baht in efficient energy-using equipment and improvement of energy utilization and maintenance process. Compared to the 12.1 billion baht
Development of the Energy Policy in Thailand
245
investment that would be required to build the 600 MW generating capacity, the energy conservation investment is relatively small.
Energy Management Measures The growth of energy demand requires increased investment in energy in order to meet demand in the future. Government investment spending in power generation alone will amount to 100 billion baht during fiscal years 1987-91. However, massive government investment in the energy sector has put a strain on the budget and has increased foreign debt to finance the energy projects. The government has thus been reconsidering its investment plan and will invite equity participation from private investors and the general public in governmentowned projects. The private sector is to continue taking a leading role in petroleum exploration and development, oil transportation, importation, and marketing. In refining, the government now plans to become a minor shareholder in future green-field refineries. Serious efforts are underway to promote private sector investment in energy while the government will be focusing more on planning and regulatory roles. To improve the overall energy management, however, the government must first streamline the organization of its energy agencies as well as the coordination among them. Energy-related agencies can be put into two categories: those involved in the formulation of energy plans and those involved in the implementation of energy policy (Chongpeerapien 1988). (a) Energy policy planning agencies As for the first group the government, in 1986, established the National Energy Policy Committee (NEPC) to be the supreme policy-making body for energy matters. This committee, chaired by the Prime Minister, includes all the relevant Cabinet ministers and has full power in policy-planning matters. It formulates policy according to the Sixth Plan guidelines and its responsibility is to see that these policies are carried out properly by the line agencies. The NEPC has appointed two sub-committees: the Petroleum Policy Sub-committee, which is authorized to formulate policy about petroleum regarding pricing, imports, refining, etc.; and the National Energy Policy Formulation Sub-committee, which formulates policy in all energy matters other than those concerning petroleum. The NEPC appointed the National Economic and Social Development Board (NESDB), the government's main economic planning agency, as its Secretary. The NEPC also established the National Energy Policy Office (NEPO) whose personnel have served as Secretary to the national energy
246
Tienchai Chongpeerapien
committees. NEPO has played an important role in policy planning since 1986. It has replaced the NEA as the energy policy planning coordinator for the country. (b) Implementing agencies Energy policies are carried out by line agencies which consist of six ministries that oversee a large number of departments and state energy enterprises. 1. Power Sector. There are three government enterprises which are responsible for the generation and distribution of electricity. Electricity Generating Authority of Thailand (EGAT) is responsible for the former and Metropolitan Electricity Authority (MEA) and Provincial Electricity Authority (PEA) together are responsible for the latter. However, while EGAT reports to the Prime Minister's Office, MEA and PEA report to the Minister of Interior. 2. Petroleum. The Petroleum Authority of Thailand (PTT) is responsible for the procurement and distribution of oil for government agencies. In addition PTT manages natural gas pipelines and a gas separation plant. This agency reports to the Ministry of Industry. Bang Chak is responsible for refining oil. The agency has the Ministry of Finance and PTT as its shareholders. PTT lifts most of Bang Chak's throughput. The two agencies also sell oil directly to the public. 3. Other Energy. The Department of Mineral Resources (DMR) is responsible for the surveying of energy resources in the country. It also issues various licences for energy resource exploration and development. DMR reports to the Ministry of Industry. 4. Regulation. There are several regulatory agencies. The Department of Commercial Registration issues permits for oil trading and storage. It also sets standards for petroleum products. The Department of Internal Trade oversees some aspects of oil pricing. These departments report to the Ministry of Commerce. There is also a Department of Public Works which regulates construction works (retail stations, depots, etc.) by the private sector. Yet another department, the Police Department, controls the safety procedures for oil and gas storage. Both the Public Works and Police Departments report to the Interior Ministry. Another department, the Defense Energy Department, procures energy for the Defense Ministry. 5. Development. The National Energy Administration (NEA) has been assigned a line function responsible for the development of small
Development of the Energy Policy in Thailand
247
hydroelectricity projects for rural areas. It is also responsible for the development of new forms of energy and for the water pumping projects which are intended to assist the irrigation of farms. In addition the NEA is responsible for the promotion of energy conservation in various economic sectors. The NEA reports to the Ministry of Science, Technology and Energy. Because of their diversity, the energy agencies cannot easily coordinate their operations. In fact, poor coordination in planning and development has led to the duplication of responsibilities, resulting in one task, such as lignite exploration and development, often being performed by several agencies. The establishment of an Energy Ministry, where the entire business of energy planning and development would be carried out under one roof, is seen as one of the ideal, long-term solutions to the coordination problems (R.R.N. Associates 1983). However, transferring energy agencies out from their respective ministries is a difficult task politically and, by itself, may require long-term planning. In the interim, the establishment of the NEPC in 1986 to coordinate all energy planning and development matters is a significant step towards cohesive energy policy planning and the improvement of Thailand's energy management.
THE FUTURE PLAN (1992-96) The government has just begun to formulate the Seventh Energy Plan. The planning process normally takes two years, but the government has decided to focus tentatively on the following policy areas: 1. 2. 3. 4. 5. 6. 7. 8. 9. 10.
Future energy situation Indigenous resource development Oil pricing Conservation The roles of the government and private sector in energy Electricity pricing and power development plan Oil refining Nuclear and non-conventional energy development Oil transportation Environment
The first seven areas have been cited in previous plans, including the Sixth Plan. The government will probably continue to pursue these policy
248
Tienchai Chongpeerapien
areas well into the future as the country will probably be increasingly dependent on imported energy to fuel its progressing industrial development. The private sector will play a greater role in the energy sector. Conservation will become an increasingly important issue and the government at some point in the future will have to consider it more seriously. Nuclear power, previously considered in the Fourth Plan, will resurface in the Seventh Plan as an alternative fuel. Improving the oil transportation system will receive high priority as the traffic condition around Bangkok's terminals is seriously deteriorating. Finally, the impact of energy development and utilization on the environment will be discussed for the first time. CONCLUSION By 1991, Thailand will have gone through six energy plans. The measures that have been devised to achieve various policy objectives have had varying degrees of success. First, efforts to reduce the dependency on imported oil have been fairly successful as the share of imported oil in commercial energy has been reduced from 87 per cent in 1981 to about 60 per cent at present. The reduction came about as a result of a policy to accelerate production of natural gas and lignite to fuel power plants. Power generation from fuel oil thus fell from 75 per cent in 1981 to about 20 per cent today. On the other hand, up until now energy consumption in the transportation and industrial sectors continues to rely significantly on imported oil as the application of lignite and natural gas in these sectors is still limited. Additionally, the impact of the 1982 Ministerial Regulation that significantly curtailed investment in concessions granted since 1982 will soon be felt as production from the older concessions will soon be depleted. In any case, Thailand's dependency on imported energy has begun to rise since the late 1980s as consumption has far outgrown domestic production. Second, measures to curtail energy consumption through conservation have largely failed. This can be attributed partly to the absence of a clear plan as to how the measures would be carried out and by whom. More importantly, the oil pricing policy that put a cap on oil price increases during the oil crises was hardly conducive to the conservation efforts. Third, oil prices in Thailand, for the most part, have not reflected the opportunity cost of the oil. Despite a well laid-down oil pricing policy to encourage efficient consumption, several governments in the past gave higher consideration to inflation, "equity", and political stability when
Development of the Energy Policy in Thailand
249
they actually priced the oil. The major oil price restructuring in 1986 can now be seen as a single opportunistic bid to reduce distortion. However, the introduction of an oil pricing formula in August 1990 was a step in the right direction as far as the oil pricing policy is concerned. If the formula is allowed to work freely as planned, retail oil price in Thailand will fluctuate more or less in line with the movements in world oil price. This will promote consumption efficiency of oil and will pave the way for oil price deregulation in the future. Fourth, there has been an improvement in the organization of government energy institutions. Government agency responsibilities have been more clearly defined, and coordination between the various agencies has been improved. However, much still needs to be done in this area. Finally, the role of the private sector in the energy business has been strengthened. Serious efforts are being made to increase private sector participation in power generation, refining, petroleum and lignite exploration, and downstream oil marketing. As mentioned earlier, the future plan will continue to address these policies as the country enters the 1990s. By most accounts, domestic petroleum consumption in most economic sectors will be much stronger in the future as Thailand moves towards its goal of attaining the status of a newly industrialized country. Oil pricing and conservation policies in the future plan need to be more clearly defined and, more importantly, observed, if the economy is to avoid possible energy-induced setbacks to its development path.
250
Tienchai Chongpeerapien
Appendix
TABLE Al Refinery Capacity and Production
REFINERY CAPACITY (barrels per day) Bang Chak Thai Oil ESSO
1984
1985
1986
1987
1988
1989
65,000 65,000 45,000
45,000 65,000 63,000
45,000 68,000 63,000
55,000 68,000 63,000
55,000 68,000 63,000
68,000 83,500 63,000
350
350
350
350
350
350
2,008.8 2,772.3 240.0 947.4 2,612.4
2,028.3 3,359.9 178.2 970.5 2,232.1
2,245.3 3,663.5 130.1 1,071.9 2,183.8
2,409.2 3,730.5 133.3 1,048.8 2,172.3
2,529.6 3,458.2 119.8 1,298.6 2,572.1
2,750.2 4,202.6 131.0 1,536.9 3,403.4
162.1
498.8
582.4
552.3
605.2
476.6
Gas Separation Plant (mmcfd) PRODUCTION (million litres) Gasoline Diesel Kerosene Jet Fuel Fuel Oil LPG (thousand tons)
SOURCE: Ministry of Commerce.
Development of the Energy Policy in Thailand
251
TABLE A2 Crude Oil Import by Source of Origin (In millions of barrels) 1987
1988
1989
1.214 2.610 0.000 0.000 0.649 0.617 0.655 0.613 0.972 0.901 4.348 0.502 0.000 0.605 5.809 2.095 6.509 0.000 0.000 0.000 0.000 0.000
2.442 0.660 1.248 2.515 0.000 0.380 1.289 0.000 5.422 1.320 6.950 0.000 3.138 0.454 4.571 0.000 5.401 0.000 0.000 0.000 0.000 0.000
10.963 1.299 0.000 0.000 0.689 0.000 0.000 4.603 4.952 1.749 3.750 0.000 0.889 4.663 6.775 0.000 2.772 4.514 1.341 0.425 1.961 0.630
TOTAL
28.099
35.790
51.978
FAR EAST Tapis Blend Labuan Miri Light Champion Brunei Light Seria Light
14.094 0.500 2.028 3.002 3.273 5.924
6.999 0.303 2.118 2.353 1.862 5.653
9.128 0.000 1.814 2.881 2.096 5.199
TOTAL
28.821
19.289
21.118
OfHERS Gippsland Jabairu Gulf of Suez Mix Cold Lake Blend
0.649 0.684 0.659 0.000
0.000 0.000 1.319 0.594
0.000 1.126 0.000 0.305
TOTAL
1.993
1.913
1.432
58.913
56.992
74.527
MIDDLE EAST Arabian Light Arabian Medium Arabian Heavy Arabian Light Berri Khafji Albukuch Umm Shaif Upper Zakum Lower Zakum Murban Dubai Qatar Qatar Land Qatar Marine Kuwait Kuwait Reconstitutes Oman Longresidue Iranian Heavy Iranian Light Basrah Light Fao Blend
TOTAL CRUDE OIL IMPORT SOURCE:
Ministry of Commerce.
252
Tienchai Chongpeerapien
ABBREVIATIONS bbl bid (coe) bid DMR EGAT GWh kbd (coe) ktoe MEA mmcfd mml mmcf NEA NEPC NEPO NESDB NSO PEA PTT PTTEP
barrel barrels per day (crude oil equivalent) barrels per day Department of Mineral Resources Electricity Generating Authority of Thailand gigawatt hour thousand barrels per day (crude oil equivalent) thousand tons of oil equivalent Metropolitan Electricity Authority million cubic feet per day million litres million cubic feet National Energy Administration National Energy Policy Committee National Energy Policy Office National Economic and Social Development Board National Statistics Office Provincial Electricity Authority Petroleum Authority of Thailand Petroleum Authority of Thailand Exploration and Development
REFERENCES Amranand, P. Thailand Energy Sector Review. Bangkok: NEPO, 1988. Amranand, P. and T. Chongpeerapien. "Petroleum Product Pricing in Thailand". Energy Journal, Special South and South East Asia Pricing Issue 9 (1988). Asian Development Bank. Energy Policy Experience of Asian Countries. Manila, 1987. Chaisakul, S. eta!., eds. Thailand's Economic Development in the 1980's. Tokyo: Institute of Developing Economies, 1989. Chongpeerapien, T. 'The Role of Policy Research in the Formulation and Implementation of Energy Policy in Thailand". Paper presented at the Institutional Relations in Development Seminar, Korean Development Institute, Seoul, 1988. Chongpeerapien, T. et a!. The Structure and Competitiveness of Thailand's Oil Industry. Bangkok: NESDBiNEPO, 1988. Hughs, G.A. The Impact of Fuel Prices in Thailand. Bangkok: National Energy Administration, 1983. Koomsup, P., T. Chongpeerapien, and C. Tantivasadakarn. An Economic Assessment of Thailand's Petroleum Resources. Bangkok: NESDBiDMRiNEPO, 1988. Lucas, N.J.D. et a!. Energy Policies in Asia: A Comparative Study. Singapore: McGraw-Hill, 1987. National Energy Administration (NEA). Electric Power in Thailand. Various issues.
Development of the Energy Policy in Thailand
253
____ .Fuels and Energy in Thailand (various issues). National Energy Policy Office (NEPO). journal of the Energy Policy in Thailand. Bangkok, various issues (in Thai). NESDB. Energy Issues and Policy Directions in the Sixth National Economic and Social Development Plan (1987-1991). Bangkok, 1985a. ____ . Macroeconomic Situation and Prospect for Energy Demand in Thailand (1985-2001). Bangkok, 1985b. ____ . Proceedings of the International Symposium on Thailand's Energy Policy. Bangkok, 1986. Pakkasem, P. Leading Issues in Thailand's Development Transformation: 1960-1990. Bangkok: NESDB, 1988. PEIDA. "Energy Pricing Studies in Thailand". 1984. Ramangkura, V. and P. Amranand. Thailand: Long-term Prospect for Economic Development, 1980-90. Bangkok: NESDB, 1981. Robert R. Nathan Associates Inc. et al. Thailand Energy Master Plan Project. Bangkok: NEA. 1983. Siddayao, Corazon M. ed. Criteria for Energy Pricing Policy. London: Graham & Trotman, 1985. Somboonpanya, P. et al. Oil, Natural Gas and Electricity Pricing Policies in Thailand. Bangkok, 1981. Somboonpanya, P. 'Thailand". In Energy in ESCAP Region: Policies, Issues and Potential for Regional Co-operation. Bangkok: ESCAP, 1984. Surawit, P. et al. Thailand Petroleum Assessment - Geological Aspect: A Preliminary Report. Bangkok: Department of Mineral Resources, 1987. Unakul, Snoh. Thailand's Development Strategies. Bangkok: Development Studies and Information Division, NESDB, 1988. United Nations. Structural Change and Energy Policy. Regional Energy Development Programme. Bangkok: ESCAP, 1987. World Bank. 'Thailand: Growth with Stability, A Challenge for the Sixth Plan Period". A Country Economic Report, no. 6036-TH, 1986. ____ . "Thailand: Issues and Options in the Energy Sector". Report no. 5793-TH, 1985.