Education for Development: Lessons from East Asia for Bangladesh 9789812306029
Notwithstanding the recent financial crisis in most of the East Asian countries, none can deny that the region was enjoy
248 63 444KB
English Pages 124 [120] Year 2002
Contents
Preface
Glossary
1. Introduction
2. Education and Development: Lessons from East Asia for Bangladesh
3. Education and Development with Particular Reference to Singapore and Japan
4. Implications of East Asian Education Policies for Bangladesh
5. Conclusion
Appendix
Notes
References
The Author
Recommend Papers


- Author / Uploaded
- Atiur Rahman
File loading please wait...
Citation preview
EDUCATION FOR DEVELOPMENT
This document is reproduced from Education for Development: Lessons from East Asia for Bangladesh , by Atiur Rahman (Singapore: Institute of Southeast Asian Studies, 2002). This version was obtained electronically direct from the publisher on condition that copyright is not infringed. No part of this publication may be reproduced, translated, stored in a retrieval system, or transmitted in any form or by any means, electronic, mechanical, photocopying, recording or otherwise, without the prior permission of the Institute of Southeast Asian Studies < http://www.iseas.edu.sg/pub.html >
The Institute of Southeast Asian Studies (ISEAS) was established as an autonomous organization in 1968. It is a regional research centre for scholars and other specialists concerned with modern Southeast Asia, particularly the many-faceted problems of stability and security, economic development, and political and social change. The Institute’s research programmes are the Regional Economic Studies (RES, including ASEAN and APEC), Regional Strategic and Political Studies (RSPS), and Regional Social and Cultural Studies (RSCS). The Institute is go verned by a tw enty-two-member Board of Trustees comprising nominees from the Singapore Government, the National University of Singapore, the various Chambers of Commerce, and professional and civic organizations. An Executive Committee oversees day-to-day operations; it is chaired by the Director, the Institute’s chief academic and administrative officer.
© 2002 Institute of Southeast Asian Studies, Singapore
OCCASIONAL PAPER NO. 96
Atiur Rahman
EDUCATION FOR DEVELOPMENT Lessons from East Asia for Bangladesh
INSTITUTE OF SOUTHEAST ASIAN STUDIES Singapore
First published in Singapore in 2002 by Institute of Southeast Asian Studies 30 Heng Mui Keng Terrace Pasir Panjang Singapore 119614 Internet e-mail: [email protected] World Wide Web: http://www.iseas.edu.sg/pub.html All rights reserved. No part of this publication may be reproduced, stored in a retrieval system, or transmitted in any form or by any means, electronic, mechanical, photocopying, recording or otherwise, without the prior permission of the Institute of Southeast Asian Studies. © 2002 Institute of Southeast Asian Studies, Singapore. The responsibility for facts and opinions in this publication rests exclusively with the author and his interpretations do not necessarily reflect the views or the policy of the Institute or its supporters. ISEAS Library Cataloguing-in-Publication Data Rahman, Atiur, 1951– Education for development: lessons from East Asia for Bangladesh. 1. Education and state — Bangladesh. 2. Education and state — East Asia. 3. Education and state — Singapore. I. Title LC94 B2R14 2002 ISBN 981-230-132-1 Typeset by International Typesetters Pte. Ltd. Printed in Singapore by Stamford Press Pte. Ltd.
© 2002 Institute of Southeast Asian Studies, Singapore
00 SEAsians_ASEM.indd 10
9/18/14 10:52:23 AM
Contents
v
Contents
Page Preface
vii
Glossary
ix
1
Introduction
1
2
Education and Development: Lessons from East Asia for Bangladesh
6
Education and Development with Particular Reference to Singapore and Japan
26
4
Implications of East Asian Education Policies for Bangladesh
48
5
Conclusion
68
3
Appendix
71
Notes
103
References
105
© 2002 Institute of Southeast Asian Studies, Singapore
Preface
vii
Preface
This study makes an attempt at finding the causal links between education and the unprecedented economic growth experienced by most of the Southeast Asian countries up to the present era. Despite the recent economic downturn in the region, most commentators agree that much of the success of these economies has been made possible by better human capital endowments, of course placed within the context of a favourable policy regime. The commitment of the leaders in investing heavily in people has, undoubtedly, been rewarded, as reflected in the favourable developmental outcomes. As a result, education did not only play a crucial role in accounting for high growth rates but some believe that it holds the key to the ultimate recovery from the economic crisis. How fast and ably these countries can move into the higher order technological capability curve, which again will be decided by the strength of educational development, will decide the fate and pace of the recovery. Given this broad perspective, the study tries to identify a number of lessons which could be learned from the educational and development experiences of East Asia, in particular from Singapore, which perhaps has done the best in the field of education. It then investigates whether some of these lessons are replicable in a resour ce-poor country like Bangladesh. The study concludes that while the East Asian educational experiences may not be replicab le in Bangladesh, valuable lessons can be learned from them, which can be emulated by the latter . However, these lessons ha ve to be placed in the o verall developmental and institutional context. Bangladesh should try to set its own development agenda where education should have its natural priority. I am indebted to the Institute of Southeast Asian Studies (ISEAS) for providing me the fellowship to undertake this study. I am equally thankful to the Director-General of the Bangladesh Institute of De velopment Studies (BIDS) for granting me the study leave to avail myself of this fellowship. I am particularly grateful to Dr Joseph L.H. Tan, formerly Senior Fellow at ISEAS,
© 2002 Institute of Southeast Asian Studies, Singapore
viii
Education for Development
for his intellectual support and co-operation throughout the study period. I also benefited from his comments on an earlier draft. I also thank Professors Mukul G. Asher and Bhanoji Rao for sharing their vie ws while I was formulating my analytical framework. Comments of the participants at the seminar on the topic organized by ISEAS were also helpful. I am particularly grateful to Mr Ashfaqur Rahman, the High Commissioner of Bangladesh in Singapore, and Dr My a Than, formerly Senior F ellow at ISEAS, for their detailed comments. Finally, I want to express my gratitude to Pallab Mazumder Anifur Rahman and Waliul Islam, three Research Officers at BIDS, for their help in collecting information from the secondary sources used in this study, and to the three referees who read my paper and made substantial comments on it. Finally, I am indeed v ery grateful to the staff of ISEAS, including those from the Administration, Library and Publications Unit for providing excellent support during my research, especially as the study had to be completed in only ten weeks. If there remains some shortcomings, these are entirely mine. Atiur Rahman
© 2002 Institute of Southeast Asian Studies, Singapore
Preface
ix
Glossary
ATEO BMED CPEIMU DDPE DG DNFE DPE DPEO GOB MNC MOE NFBE NFE NGO NIE OECD PMED PTA SMC TFO TVET UGC UPE
Assistant Thana Education Officer Bangladesh Madrasah Education Board Compulsory Primary Education Implementation Monitoring Unit Deputy Director of Primary Education Director-General Directorate of Non-Formal Education Directorate of Primary Education District Primary Education Officer Government of Bangladesh multinational corporation Ministry of Education non-formal basic education non-formal education non-governmental organization newly industrialized economies Organization for Economic Co-operation and Development Primary and Mass Education Division Parent-Teacher Association School Management Committee Thana Education Officer Technical and Vocational Education Training University Grant Commission Universal Primary Education
© 2002 Institute of Southeast Asian Studies, Singapore
This document is reproduced from Education for Development: Lessons from East Asia for Bangladesh , by Atiur Rahman (Singapore: Institute of Southeast Asian Studies, 2002). This version was obtained electronically direct from the publisher on condition that copyright is not infringed. No part of this publication may be reproduced, translated, stored in a retrieval system, or transmitted in any form or by any means, electronic, mechanical, photocopying, recording or otherwise, without the prior permission of the Institute of Southeast Asian Studies < http://www.iseas.edu.sg/pub.html >
Introduction
1
1
Introduction
My mission in life is education. I believe that all human problems find their fundamental solution in education. And outside of my own vocation as a poet, I have accepted this responsibility to educate my people as much as lies in my individual power to do so. I know that all the e vils, almost without e xception, from which my land suf fers, are solely owing to the utter lack of education of the people. Poverty, pestilence, communal fights and industrial bac kwardness make our path of life narrow and perilous owing to the meagreness of education. Nobel Laureate Rabindranath Tagore Letter from Russia Visva-Bharati Calcutta, 1984, p. 208 Elementary education is a central component of any kind of economic development... Economic powers such as Japan had high levels of education bef ore they advanced towards industrial development. Nobel Laureate Amartya Sen to group of educationists in New Delhi on 2 January 1999. Reuters
Introduction Notwithstanding the recent financial crisis and related uncertainties, the economies of most of the East Asian countries, including those in Southeast Asia, experienced unprecedented continuous high growth over the past three decades or so. Six f ast growing economies (J apan, South Korea, Taiwan, Hong Kong, Singapore, and China) achieved about 5 per cent annual per capita
© 2002 Institute of Southeast Asian Studies, Singapore
2
Education for Development
growth, while three others (Thailand, Malaysia, and Indonesia) experienced about 3.5 per cent growth per year during this period.1 The record for the rest of the developing countries was only 1.5 per cent per year . The Philippines was the e xception, performing poorl y unlike its other Southeast Asian neighbours. The East Asian countries are diverse: some are rich and others are poor , some with small populations and others populous, some abundantly endowed with natural resources while others not at all. They have also adopted diverse development strategies but have finally focused on an export-led growth strategy. For example, Malaysia and Thailand diversified their economies away from the sole dependence on agriculture and created a good base for exportled industrialization. On the other hand, Singapore cultivated the multinational corporations (MNCs) and higher order technologies for embarking upon an export-led growth process, thereby increasing value-added. Indonesia, on the contrary, opted for sub-optimal resource alloca tion, for e ye-catching investments (such as aerospace development), and ruthless exploitation of its natural resources. The first generation of success stories with miraculous growth was created by the four Asian “tigers” (South Korea, Taiwan, Hong Kong, and Singapore), followed by a second generation of Asian “calves” experiencing rapid industrialization, and finally joined by China, the new engine of regional growth. It is this sustained high growth pattern, rather than the current levels of per capita income, which distinguishes this region from the rest of the developing world. Besides this remarkable growth pattern, the region has been demonstrating achievements in a number of other areas, including primary health, education, and longevity.2 Table 1 (and also Table A25 in the Appendix) presents a comparative scenario between the countries of South and Southeast Asia with regard to some selected social and economic indicators. The East and Southeast countries have also enjoyed a rapid decline in the incidence of poverty. Singapore, for instance, had a r elatively low incidence of poverty at 25 per cent w ay back in the f ifties. The rate was reduced to an insignificant level of 0.3 per cent by 1982–83.The decline has been due to the phenomenal expansion of employment and income since the mid-sixties. In Korea, poverty has declined from a relatively high level of 40.9 per cent in 1965 to 23.4 per cent in 1970, and to 14.8 per cent in 1976, 9.8 per cent in 1980, and 4.6 per cent in 1984 (Rao 1998).The phenomenal reduction in poverty in Indonesia, a country plagued by political turbulence and economic and social chaos in late 1997 and much of 1998, should be mentioned especially . However, the country is currently struggling hard to sustain its success in poverty reduction mainly because of its political instability. Rao (1998) also adds that major changes have already taken place in the educational composition of the labour force in Singapore. For instance, while half of the labour force in 1966 comprised people with no education (or less than primary level), the proportion dropped to 19 per cent in 1989, and
© 2002 Institute of Southeast Asian Studies, Singapore
© 2002 Institute of Southeast Asian Studies, Singapore
92 91 98 94 84 90 93 84 82 94 83 38 52 38 28 42
0 — 0 — 6 2 7 10 8 — — — 38 — 48 18
Adult Children literacy reaching rate 1995 grade 5 (%) 1995
25 28 30 59 60 90 95 96 106 122 131 138 139 147 152 155
— 6.5 — 11.9 — 20.7 — 20.2 17.1 26.1 27.5 46.0 35.9 46.5 — 44.9 41.5 40.2 40.7 49.0 72.0 55.5 100.8 59.4 48.0 72.0 66.1 84.4 65.5 81.3 87.6 84.5 1.3 1.8 1.7 1.8 3.4 2.2 6.8 2.8 1.9 3.2 3.5 5.3 3.2 3.3 5.2 5.9 5812 4934 — 1778 1923 1348 — 1422 722 406 — 907 527 606 455 — 50666 47311 — 16732 22447 5954 — 6654 5114 2288 — 4288 2641 2445 1975 — 77.1 79.0 69.5 71.4 72.5 63.3 64.0 69.2 66.4 58.9 62.8 61.6 56.9 55.9 52.0 71.7 — — 7 11 22 43 4 38 33 57 40 26 19 3 37 42
— 0a 0 10a — 7a — 7 12 10 40 45a 15 55 — 35a
— — 0 4 6 37 34 49 76 79 57 53 71 52 82 30
HDI Human Dependency Total Real GDP per capital (PPP$) Life Population without access to rank poverty index ratio (%) family expectancy at Poorest 20% Richest 20% Safe Health Sanitation (HPI value) 1995 fertility birth (years) 1980–94 1980–94 water services (%) 1995 rate 1995 1995 1990–96 1990–96 1990–96
NOTE: aData refer to a year or period other than that specified in the column heading, and may cover only a part of the country in some cases. SOURCE: UNDP (1998).
Hongkong Singapore Korea, Rep of Thailand Malaysia Sri Lanka Maldives Indonesia China Vietnam Myanmar Pakistan India Bangladesh Nepal Bhutan
Country
TABLE 1 Some Selected Socio-economic Indicators of East and Southeast Asia, and South Asia Introduction 3
4
Education for Development
15 per cent in 1993. Soon, there will be practically none in the Singapore labour force with less than primary education. While those with post-secondary education made up less than 5 per cent of the labour force in 1966, it increased to 20.2 per cent in 1989, and 25.7 per cent in 1993. These changes may have been the result of the sizeable investments in human resources in Singapore since the late sixties. Given their remarkable successes in economic growth, as well as its social impact, it is natural that these countries have become the focus of global attention. The recent crisis has, in f act, increased rather than diminished interest in the af fairs of the East Asian countries as the f ate of the global economy is now tied so intimately with their perf ormance. The region, of course, has demonstrated its strong resilience in coping with this unprecedented crisis. Many believe that this inner strength may have originated from its earlier emphasis on human development, particularly on skill-based education. Besides the World Bank initiating major cross-country studies to understand the causal links to their success (W orld Bank 1991; 1993), others too ha ve been taking a keen interest on the outcomes of development initiatives taken in the re gion (Wade 1990; Leipziger 1997; Bir dsall and Jasperson 1997; ADB 1998; Rowen 1998; Kim 1998; Morris and Sweeting 1995; Petri 1997; Mundle 1995; Mingat 1995; Delhaise 1998; Ramesh andAsher forthcoming). Most of these commentaries are couched in economic analyses, except a few like Kim (1998) and Rowen (1998) who look beyond economic factors while explaining this pattern of East Asian success. While most of the commentators refrain from making single-factor analysis and go for multi-factor explanations for understanding this unprecedented growth process in East Asia, they often concentrate on a relatively smaller cluster of factors. Rowen (1998, p.4), for example, forwards three sets of explanations: a) better economic policies; b) greater social capabilities for fostering institutions which favour physical investment, formation of human capital, and acquisition of technology; and c) external influences emanating from Europe, J apan, and, lately, the United States. It should be recognized, however, that it is not easy to develop a plausible explanatory framework for understanding these success stories. If the credit is given to a set of authoritarian governments pushing relevant economic policies successfully then one may counter-argue why such an outcome could not be observed in many other countries with similar authoritarian regimes (Kim 1998; and Morris and Sweeting 1995). Again, the tendency to follow preferential industrial policies which give better access to credit, subsidies, and trade protection abounds in many countries, but no such positive outcome has been noted in those countr ies (Rowen 1998). The cultural explanation (a la Confucianism) forwarded by some does not a ppear strongly logical either . The elements of Confucianism were there three decades ago. Why then were
© 2002 Institute of Southeast Asian Studies, Singapore
Introduction
5
all the countries having Confucian traits, except Japan, so poor all these years? Some are still poor . Confucianism has not chang ed radically since then. Certainly, cultural factors may ha ve played some role, but surely only in conjunction with others, so they should not be over-blown. Yet others are keen to give enough credit to external influences and the strategic position of East Asia in the polarized global context (Kim 1998). In the absence of an accepted theory explaining the sources of sustained growth in East Asia, this study argues plausibly that the high quality of human resource derived from the formal educational system, as well as informal opportunities for the absorption of technologies through on-the-job and off-the-job training may ha ve been a necessary b ut certainly not sufficient cause for such an outcome (ADB 1998). Education alone could have achieved very little of this growth if there were no other complementary growthaugmenting factors like good governance, favourable legal framework, and national willingness to prosper even in difficulties. Development, indeed, is a difficult and clumsy process, the outcomes of which are dependent on multiple and interrelated factors covering economic, political, social, and cultural terrains. Thus, putting the burden on education alone for explaining this complex phenomenon may not be wise. Education, however desirable it may be, cannot go far in an institutional vacuum in achieving the high level of “development” experienced by the East Asian countries. Given this wider analytical and methodological context, this study plans to cover the following areas: • •
• • •
Understanding the role of education in augmenting growth and, hence, development in general; Identifying the contribution of education in economic development in the Southeast Asian countries (for e xample, Indonesia, Malaysia, Philippines, Singapore and Thailand). Important educational features of pioneers such as Japan, and then South Korea, will be identified as and when needed to strengthen the arguments. The policy issues related to access to dif ferent levels of education, funding suppor t from the government, and content of education will receive sharper focus in order to draw lessons from the educational experiences of these countries. A closer look will also be taken into the educational policy of Singapore and the value attached to it by the government and the people; Identifying important lessons fr om the Southeast Asian experiences in educational development. Identifying those lessons which may be replicable or inspirational for Bangladesh. Concluding remarks.
© 2002 Institute of Southeast Asian Studies, Singapore
This document is reproduced from Education for Development: Lessons from East Asia for Bangladesh , by Atiur Rahman (Singapore: Institute of Southeast Asian Studies, 2002). This version was obtained electronically direct from the publisher on condition that copyright is not infringed. No part of this publication may be reproduced, translated, stored in a retrieval system, or transmitted in any form or by any means, electronic, mechanical, photocopying, recording or otherwise, without the prior permission of the Institute of Southeast Asian Studies < http://www.iseas.edu.sg/pub.html >
6
Education for Development
2
Education and Development: Lessons from East Asia for Bangladesh
The Perspective Education has long been recognized as an important contributing input to development in most low-income countries, yet it remains one of the most dysfunctional sectors in many of them. As early as in 1966, the Education Commission in India noted: “The destiny of India is now being shaped in her class rooms”. Thirty-two years later, Amartya Sen had to remind the same nation that India needed to give a boost to basic education to speed up its economic development (Reuters, 2 January 1999). This means that very little attention has been given to educational development and related investments in India. Besides India, this is probably the usual story in most of the developing countries. In par ticular, the South Asian countries, unlike their East Asian neighbours, have been investing far less in education to realize their growth potentials. Even if they did make increased investments, they were not too concerned about the quality of education imparted to their future citizens. Haq (1997) compares these tw o parts of Asia, noting that both were a t approximately the same level of per capita income in the 1960s (seeTable A28 in the Appendix) but South Asia had failed to make progress in “improving the circumstances in which people are born, in building human capabilities, in opening up opportunities for income and employment or in sustaining a better environment from one generation to the next” (Haq 1997, p. 66). According to him, liberal investment in basic education marks the most cr itical difference between the two. The contribution of education to de velopment is, however, better understood if the latter is conceptualized in a broader framework going beyond
© 2002 Institute of Southeast Asian Studies, Singapore
Education and Development: Lessons from East Asia for Bangladesh
7
mere growth of output, which again is necessary but not sufficient for fulfilling the lofty goals of development. Development Redefined The notion of development has long been associated with economic growth. Economic growth, because of its very nature, is often seen in terms of industrial production and modern services. No doubt, in such a process, the share of the modern sector absorbing the capital is disproportionately high and, therefore, operationalized as such. However, such a notion of development is now being questioned b y many on a number of counts. The Asian Development Bank summarizes some of these shortcomings in the following paragraphs: 1.
2. 3.
It leads many people into believing that rich countries are more advanced in all fields of civilization and culture, and that developing countries are inferior in all respects. In fact, the very term “developing countries” used simply for poor countries implies this misconception. It disregards the intrinsic values of cultural identity and cultural diversity and favours, as an axiom, the concept of one modern universal industrial technological civilization. It is silent about the asymmetric character of interdependence between rich and poor countries, particularly the unequal patterns of production and distribution. It tends to ignore the question of an equitable participation in and distribution of benefits from the development process within a country. Thus, it does not tell much about the actual living conditions of the people, including the social and environmental costs of economic growth (ADB 1991, p. 15).
Banuri goes even deeper and raises some fundamental questions against conventional development based on unilinear modernization on the following grounds (see Banuri 1987, p. 7): 1. 2. 3. 4.
persistence of po verty amid incr easing affluence, increase in unemployment despite expanding production; increasing association of modernization and development with ecological disasters; increasing association of development with higher levels of conflicts and tensions in much of the Third World; onset of a period of confusion, ‘muddled groping and search for new paradigms in economics as well as political science, the two mother disciplines of development theory’ (ibid., p. 8).
Despite some “loss of hope” in the development project, economic development theories have tried earnestly to salvage it by introducing other
© 2002 Institute of Southeast Asian Studies, Singapore
8
Education for Development
variables like basic needs, redistribution with growth, and growth with equity. However, all these newer concepts still have primarily economic connotations and, hence, the complex problem of development is still trying to focus only on economic issues. As a result, all those theories ha ve been dubbed as “economistic” or “reductionist”. Instead, Dopfer is inclined to define development as “the change of the total-system in a desired direction” (Dopfer 1979, p. 114). He proposes, in line with the classical economists, a “holistic systems view” within the historical confines where a “total system behaviour” is sought after . Certainly, such a vie w presupposes a signif icant change in the existing mindset. This view has recently been further developed by Capra (1996) who too believes in an inte grated approach. With the onset of the ne w millennium, the issue of sustainability is becoming increasingly relevant in the contemporary global context. It is now dawning to most of us that the daunting problems of our time cannot even be comprehended in isolation. (See Capra 1982; and Escobar 1995 for a critique of the concept of de velopment.) These are interconnected and interdependent systemic problems. Not all of the major problems are so complex that they cannot be easily solved. Surely they can be solved, but they require a fundamentally different worldview, a new perception. Despite the campaign for socio-economic development made by UNIRSD, UNESCO and other international organizations (McGranahan et al. 1985), the imperative for such a change in perception is still lacking among the leaders who really matter. “Not only do our leaders fail to see how different problems are interrelated; they also refuse to recognize how their so-called solutions affect future generations. However, from the systemic point of view, the only viable solutions are those that are sustainable” (Capra 1996, p. 4). According to him, interdependence, recycling, partnership, and diversity are the “hallmar ks” of this concept of sustainability , which will graduall y unfold as the dominant paradigm in the coming years. At a time when the world is facing a crisis of survival, we will have to “respond creatively to all threats and to develop a great variety of adaptive strategy” (ibid., p. 236). The concept of development is thus a complex and balancing process which can be, and indeed should be, per ceived differently by different societies (or nations) encompassing various interrelated dimensions, in addition to economic aspects. Some of these dimensions may include: 1. A historical dimension: cultur al heritage, colonial legacy, weal and woe of a common past determine a society’s perceptions and aspirations and can mak e it opt for a style of lif e which may be dif ficult to understand by those who do not share the same historical experience. 2. A political–ideological dimension: societies ha ve chosen dif ferent concepts of how to organize themselves, not only involving different
© 2002 Institute of Southeast Asian Studies, Singapore
Education and Development: Lessons from East Asia for Bangladesh
9
economic systems, b ut also dif ferent social v alues, different views about the importance of material or spiritual g oods, and dif ferent metaphysical interpretations of human life. 3. A psychological dimension: people also differ significantly regarding their self-concept and the concept of their r ole in society. They have different attitudes to wards authority and co-operation, different ambitions and readiness for c hange and e xperiment, and dif ferent standards regarding the importance of “secondary” virtues, such as punctuality and orderliness (ADB 1991, p. 16). These dimensions, to mention only a few, define to a large extent the varying conditions for and the content of development of a nation. In defining developmental goals for a nation, it is imperative that these dimensions are considered and, if possib le, integrated in a balanced way . In a way , these dimensions draw the cultural contour of a nation that is aspiring to develop. Hence, since education is generally considered to be a major instrument of a society/nation “to transmit and further develop the common heritage from generation to generation” (ADB 1991, p. 16), it cannot be pursued in one form or another without putting it in the conte xt of these cultur al contours. This does not mean, however, that any educational reform is likely to be doomed from the beginning because of this cultural context (but it is better to be alerted about it) nor it would be wise to attach too much importance to a “taboo” which may actually hinder progress. Once again, a right balance has to be found in order to become sustainable. This is perhaps true for both education and development. More pragmatically, any development effort in a sector not onl y presupposes a certain level of literacy but also further supports education (that is, training), while at the same time, any educational effort has to be pursued within the cultural and economic context of the country in order to avoid controversy and wastage. In other words, educational development should not be determined by purely economic imperatives. It should be placed in a broader context, for achieving both ethnical and efficiency objectives. It is always better to avoid a narrow perspective while pursuing an educational de velopmental effort, given the complex non-economic and interrelated dimensions of development. However, while pursuing a broader perspective, the desire for improving the material conditions of living should not be totally ignored. The level of material deprivations among the majority of the people of many countries that aspire to “develop” drives home this point quite con vincingly. This is particularly true for South Asian countries, including Bangladesh. Indeed, there is now hardly any scope for a society to keep its people locked in a low-level material condition in the name of autarky. The imperative for an improved standard of living does not emanate only from the fast changing pattern of globalization
© 2002 Institute of Southeast Asian Studies, Singapore
10
Education for Development
but also from the desire of the people themselves to lead a better life. In that context, the technological content of the evolving development cannot be ignored either. This again should be placed in the endo genous context of each society’s own version and vector of modernity and the desire for change. All these reall y relate to an e ver-changing view of de velopment, where education is lik ely to play a crucial r ole. The better endowment of human capital will probably be the key player in the development scenario of the coming years. Education by its v ery nature is alw ays futuristic as it pr epares today’s generation for facing tomorrow’s world. Thus, education has to be concerned with anticipating alternative future scenarios of development and change, or adapt itself accor dingly. The major task of education is “to prepare young people for the task of both shaping the future and coping with the future” (ibid., p. 18). Development has its own inertia, which may not always welcome educational interference. Similarly, the pressure for maintaining the status quo may also come from within the educational sector itself. Hence, the onus will fall upon the policy-makers and educationists to design appropriate educational responses to enable the future adult generation to cope with the challenges of development that are unfolding rapidly. Given the pace of technological change and new organizations of production, transforming the w orld economy, and development, particularly growth, will require higher knowledge-intensive industries, agriculture, and services. Education, formal and informal, is the key to developing that knowledge. It will further prepare individuals with the perception and tools to adjust to a rapidly changing world. Even if we ignore the vast multitude of the illiterate, marginalized young population, the present educational system in most of the poor countries cannot provide the type of economic literacy and technical know-how which is needed for day-to-day operations in today’s globalized economy. The hope of South Asian countries like Bangladesh to get greater access to the global market in the areas of electronics, textiles, and leather now being gradually left behind by the Southeast Asian countries may not fully materialize unless they pick up higher order tec hnologies as well. The technological capacity for a mor e sophisticated design, the workmanship and finishing as will be demanded by the consumers of the twenty-first century, will be the deciding factor in making such a transition. The capacity to acquire, transmit, and apply knowledge to work and everyday life will contribute towards the level of competitiveness. Low wages alone will not be significant in the changed global context. A welleducated labour force which is flexible and at the same time technologically skilled will, therefore, be crucial in tomorrow’s trade and commerce. However, most developing countries are yet to wake up and move strategically in a direction that can reduce the “knowledge-gap” which is, in fact, widening. “The ‘knowledge-gap’ disparity in the capability of countries or groups within countries to participate in the gains of technological innovations and new
© 2002 Institute of Southeast Asian Studies, Singapore
Education and Development: Lessons from East Asia for Bangladesh
11
productivity process is growing. Many countries are falling further behind in providing the education and training needed by their youth to create and adapt available knowledge to their environment” (Haddad, et al. 1990, p. 1). This widening gap may have serious implications for the lagg ard countries. They may find it more difficult to enhance and shape their own development process. Consequently, the standard of living of the majority of their people, which is already very low, may further deteriorate. Even the initial gains made by some provinces of India (such as Kerala) by putting more emphasis on basic education may not be sustained because of underestimation of the impact of modern technology-oriented education (Majumdar 1997–98, p. 43). Simultaneously, conventional development policies, unless counteracted where necessary, and redesigned, can have serious negative impact on the state of the physical en vironment. Already, irreversible destruction of for estry, salinization of the coastal region, soil erosion, waterlogging, air and water pollution have started to af fect the health and li velihood of many. Although policy-makers have been alerted, and some of them are apparently responding positively in terms of legislation and appropriate development planning, the fact remains that they are yet to be more aware of the educational implications of those issues. “Without systematic environmental education integrated into health, social, scientific and technical education, and imparting the necessary knowledge and attitudinal changes to everybody as part of the regular curriculum, political and legal measures at the macro level are bound to be little successful in preventing an environmental disaster which would likely affect developing countries earlier and more traumatically than the economically advanced world” (ADB 1991, p. 20). Besides, there are additional positive gains in providing education to women in terms of reduction in child mortality, maternal mortality, and demographic pressure (Tilak 1994). The role of education in equalizing income through providing better opportunities for productivity improvement is also well recognized (Birdsall, Ross and Sabot 1997a). Education and Development: The Inter-relationships Given this broad perspective on the relationship between education and development, it will be appropriate to pinpoint the contribution of the former to the latter, especially in the context of the new demands for education in a constantly changing world economy. We will, therefore, focus on the following areas of this relationship: 1. 2. 3. 4.
education and economic growth education and productivity education, poverty, and income distribution education and women
© 2002 Institute of Southeast Asian Studies, Singapore
12
Education for Development
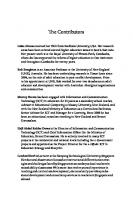
5. education, globalization, and technical change 6. education and environment Education and Economic Growth Schultz (1961) and Denison (1962; 1967) are normally cited as pioneers in establishing the relationship between education and economic growth. They attempted to account for the unexplained “residual” growth left when changes in labour (hours worked per day) and physical capital were included in the production function. While Schultz attributed 16 to 20 per cent of the economic growth in the United States during the early half of the last century, Denison found that between 1930 and 1960, 23 per cent of the increase in its output was due to increased education of its labour force. Subsequent studies noted wide variations in the contribution of education to growth from a low of 2 per cent in Germany to highs of 12 per cent in the United Kingdom, 14 per cent in Belgium, 15 per cent in the United States and 25 per cent in Canada (Haddad et al. 1990, p. 3). Similar variations have also been reported for developing countries. Based on Schultz’ s methods, Psachar opoulos and Woodhall (1985, Table 2.1) showed an educational contribution of 12 per cent to 23 per cent towards the output growth of Ghana, Kenya, Nigeria, Malaysia, and Korea. Cross-country comparisons of the contribution of education to growth have been reported by many other researchers while pointing out the transformation of low to high-income countries (Clark 1940; Kuznets 1966; Chenary and Syrquin 1975). They mostly argued in terms of the accumula tion of human capital in explaining the previous record of economic growth. However, until recently, these researchers could not identify the direction of causality implied by the positive correlation between educational attainments and per capita output. Hence, there were some concerns regarding the contribution of education to g rowth. However, Barro (1991) established a f irmer causal relationship between the two by using growth regressions. He estimated equations to explain the variation among 98 countries in the growth rate of real per capita income over the period 1960–85. He included per capita gross domestic product (GDP) at the start of the period and education enrolment rates in 1960, a crude proxy for the initial stock of human capital, as explanatory variables, among others. Birdsall, Ross and Sabot (1997) used a modified version of the Barr o regression to conduct counter -factual simulations and find a plausible basis for assessing the contribution of investment in human capital to economic growth (see Table A3 in the Appendix). Taking the average value of each variable in the Barro sample, Birdsall, Ross and Sabot (1997a) draw the growth path of per capita GDP for the quarter century referred earlier for a typical country.
© 2002 Institute of Southeast Asian Studies, Singapore
Education and Development: Lessons from East Asia for Bangladesh
13
Figure 1 shows the changes in growth and per capita GDP for that country, assuming that it had ac hieved a 1960 primary , or both 1960 pr imary and secondary enrolment rate one-half standard deviates above (or below) the mean. To quote Birdsall et al. (1997, p. 100), There is a 0.7 per cent gap in growth rates between the simulation which varies primary enrolments (GR(P)), and a 1.4 per cent gap in growth rates between the simulations which vary both primary and secondary enrolments (GR (P + S)). Illustrating the power of compounding, the cumulative effect of these differences in growth rates on 1985 per capita GDP is large: 20 per cent and nearly 40 per cent, respectively. Korea provides an example: had Korea’s enrolment rates been as low as Brazil’s were in 1960, its average annual growth rate would have been 5.6 per cent rather than 6.1 per cent, resulting in a 1985 per capita GDP 11.1 per cent less than that actually attained.
Does this mean that the supply of human capital alone can explain the contribution of education to growth? If there is no demand for human capital, the oversupply of it may, in fact, add more problems to a country in terms of unemployment, social unr est, and wastage of scarce f iscal resources. The development strategy of East Asia indeed responded complementar ily with the supply of human capital by opting for a labour -demanding export-led growth path. The real earnings, wage employment, and real wage bill in relation to gross national product (GNP) increased much faster in East Asia, allowing for FIGURE 1 Simulated Average Per Capita GDP Growth Paths, Varying 1960 Primary and Secondary Enrolment Rates
GDP/POP (1980 dollars)
4,000
GR(P+S) = 2.89% GR(P) = 2.56%
3,500
GR = 2.18% GR(P) = 1.79%
3,000
GR(P+S) = 1.46%
2,500 2,000
1960 1960
1965 1965
1970 1980 1985 1975 1970 1975
1980
1985
NOTE: GR represents the growth path for an a verage economy, GR(P) represents an economy one-half standard deviation above or below primary enrolment rates, and GR(P+S) represents an economy one-half standard deviation above or below primary and secondary enrolment rates. SOURCE: Birdsall et al. (1997a), p. 99, Figure 4.3.
© 2002 Institute of Southeast Asian Studies, Singapore
14
Education for Development
a greater demand for labour. The weak demand for labour in a countr y like Peru or Argentina yielded lo wer growth rates despite high human capital endowments in the 1960s (Birdsall et al. 1997, pp. 101–2). The demand for skill and the contribution of education to growth can be illustrated with a diagram (Figure 2). S and D represent the skill supply and demand functions of a typical low-growth performing country. S′ and D′ are the two counterparts of a typical high-growth performing country (for example, in East Asia). The level of poverty is low in the latter. Thus, most families as well as the government can commit more resources for education, which can be rewarding as there is demand for the same. Let us now shift S′ to the right. D′ also shifts to the right as there is demand for skilled workers. Despite the greater expansion of education, returns to investment has not diminished as the demand for skilled labourers remains higher than ‘r’ in a typically low-performing country X. Again in country X, where the enrolment rates are higher than the typically lo w-performing country, the returns to educa tion are even lower. This is because it does not f ace a similar demand function like the high-performing country. Thus, because of the lack of an appropriate development policy which could have facilitated a higher demand for skilled FIGURE 2 The Linkage Between Demand for Skills and Contribution of Education to Growth S S′ Rate of Return to Investment in Human Capital
High growth performing economy
r′ r
D′
Typi cal low Performing economy economy performing
Country x
rx
D
i d ll
i
S
S′
Quantity of Investment in Human Capital
SOURCE: Birdsall (1997).
© 2002 Institute of Southeast Asian Studies, Singapore
Education and Development: Lessons from East Asia for Bangladesh
15
labourers, country X failed to reap the benefits of its higher supply of human capital. Yet in another econometric e xercise, Park finds a causal link betw een government spending on education and the growth of GDP in Korea over three decades (1962–92). He categorically states that, “a causal relationship runs from education to output but not from output to education” (Park 1995, p. 14). He asserts that public spending on education causes GDP to increase in the Granger sense, meaning that although many developments can cause permanent changes in the variables, there is a long-term relation linking the two. According to him, the long-run elasticity of output with respect to government spending on education in Korea during this period is 1.12. Birdsall et al. (1997a) again support this through their regression runs and go a step further to assert that Koreans invested more on basic education compared to an y other country, a trend more or less followed by most East Asian countries, which in fact helped to stimulate the demand for higher education. Higher education was, of course, greatly supported by the private sector in Korea. Except for Singapore, this is perhaps the usual trend.
Education and Productivity The contribution of education to growth, as demonstrated above, can be explained in se veral ways. The most signif icant is, of course, ref lected in productivity gains. Education augments cognitive and other skills, which in turn augment productivity of labour. There may be spillover effects of education too. The education of one co-worker may actually help improve the productivity of the entire group (Becker, Murphy, and Tamura 1990; Lucas 1988). Although establishing a relationship between education and productivity is not straightforward, as individuals with different levels of education have different types of occupations producing different products, there is evidence that education results in higher output. Haddad et al. (1990) have consolidated the findings of at least nine studies on this interlinkage and on balance the relationship appears to be more positive in the rural context (see Table A4 in the Appendix). To illustrate: a survey for the World Bank of eighteen studies which try to measure the relationship between farmers’ education and their agricultural output in low-income countries, concluded that a farmer with four years of elementary education would produce 8.7 per cent higher output than a farmer without education (Lockheed, Jamison, and Lau 1980). The survey also found that the effect is greater if complementary inputs are made vaailable. The evidence on the effect of education on productivity in industry is not so conclusive for the urban areas. While Berry (1980) f inds no positi ve relationship between education and output, Fuller (1990) records a positive impact if in-firm training is given. According to Min (1987), workers in Beijing
© 2002 Institute of Southeast Asian Studies, Singapore
16
Education for Development
with vocational education have at least 7 per cent higher productivity than workers with academic qualifications. In the urban ar eas, educated work ers often “job-hop” to higher -paying jobs, as seen in Singapore (Hayashi 1998), and hence it would be wiser to compare the wage differentials to get the picture of returns to education. Indeed, Psacharopoulos and Tilak (1992) have established quite convincingly that there is a positive correlation between education and earnings. Blang (1972), of course, called this relationship a “striking finding” many years ago. In another study, Mincer (1979) draws a “learning curve” and shows that earnings are positively correlated with education at any given age (the higher-educated earn more) but the earnings rise with age up to a period, and then levels off. The Mincer function can be written as: In Y = α + β1S + β2EX + β3EX2 + ε Where, S = the years of schooling EX = the experience in the labour market Y = the annual earnings α = the intercept term βi = regression co-efficient ε = the error term to be estimated by the model β1 = the co-efficient of schooling = rate of return to education Psacharopoulos and Tilak (1992) ha ve calculated the rate of returns to education for more than thirty-four countries using the above equation. On the whole, according to this study, the rate of return from primary education was higher, up to 30 per cent and above. The social return was also close to 20 per cent. In the case of secondary education, the rates were even lower than higher education, mainly because of the low quality. Despite the fact that there are serious problems with many of the empirical estimates of rates of return, particularly on the question of how the cost of education is estimated,3 there is apparently an emerging consensus: 1. that the highest overall social rates of return to education (in urban areas) are generally in the lower income, agricultural economies, and in the marginally industrialized economies; 2. that the highest pay-of f to education in these lo wer-income and middle-income countries is at the primary level; and 3. that as countries industrialize, increase the GDP per capita, and invest more in education, rates of return to education tend to fall overall, and the pay-off to lower education levels tends to fall relative to the pay-off to higher education levels (Haddad, et al. 1990, p. 6).
© 2002 Institute of Southeast Asian Studies, Singapore
Education and Development: Lessons from East Asia for Bangladesh
17
Education, Poverty and Income Inequality Recognizing the fact that education itself cannot eliminate poverty and enhance equality of income, based on the persistence of structural and institutional rigidities, it can still be argued, based on insights from our discussion on the rate of returns to education, that expansion of education at the lower levels of schooling can lessen the burden of poverty. Alam reveals that the head-count ratio of poverty is inversely related to the educational level of the household head in Bangladesh (Alam 2000). According to him, in 1997 in rural Bangladesh, the head-count ratio representing the incidence of poverty was the highest (about 57 per cent) for the household head category with zero level of schooling, the incidence of poverty in terms of the ratio fell as the educational level rose, and the lowest ratio of poverty incidence (that is, 18.8 per cent) was exhibited by the category where the household head was educated up to ten years or more. Similarly, for urban Bangladesh, about 78 per cent of the sample households were below the poverty line in 1997, where the household head did not have any schooling, whereas the head-count ratio (or the percentage of households below the poverty line) consistently fell with the progressively higher levels of household head’s educational level. The highest educational category of ten years or more exhibited the lowest incidence of poverty (about 14 per cent. See column [ii] [f] of Table A1 in the Appendix). Table A2 in the Appendix also shows that there is a positive relationship between the education level of the household head and the per capita (monthly) income. This is true for both poor and well-off households. Education improves the quality of the population through advances in knowledge. This contributes decisively towards a grea ter income-earning capacity for the poor. Tilak (1994) argues that education can impact both at the micro and macro levels in the fight against poverty. At the micro level, according to Tilak (ibid., p.115), illiterate individuals or households are less productive, work in less paying jobs and remain below the poverty line. At the macro level also, illiterate nations cannot increase output substantially and remain at a low standard of living.4 Moreover, education and other basic needs reinforce each other and hence, the lack of the former can further impoverish an individual and the nation. In the United States itself, it has been recorded that with better education, Black and Hispanic males and females were able to increase their income, thus improving economic growth, and equalizing income distribution (Haddad et al., 1990). In a low-income country, the impact of basic education on poverty reduction can be more significant. In a recent study (Sen and Rahman 1998), it was found that the incidence of poverty was the highest among the illiterates in all the countries of South Asia (see Table A5 in the Appendix). Seventy per cent of rural households in Pakistan who were not exposed to formal education had about 2.5 times higher incidence of poverty than their educated counterparts.
© 2002 Institute of Southeast Asian Studies, Singapore
18
Education for Development
In Nepal, the proportion of poor among the illiterates was 4.3 times higher than among the better educated groups. In Bangladesh, those without exposure to formal education had about 6.7 times higher incidence of poverty than the households with access to higher education. Similarly, in India, the incidence of poverty among the literates was only half of that observed for the illiterates. The impact of education in reducing poverty among the very low-income earning households can be quite signif icant. However, if the demand f or educated people does not increase simultaneously because of stagnation in the economic growth process itself, it may not mean much to them. The income inequality may then persist or even worsen. According to Rao, “Typically, poverty alleviation takes place via high and sustained economic growth because of a number of processes complementary to such growth. First, it permits those who are skilled and semi-skilled to help themselves via direct employment expansion. Second, since a boom in construction inevitably accompanies rapid economic growth, unskilled workers benefit from jobs in the sector . Third, due to the sector’ s supply-side intersectional linkages, there will be indirect employment expansion. Fourthly, as the relatively well-to-do spend more and more on personal services, this too helps the unskilled and semi-skilled to f ind jobs. Finally, high and sustained growth sets a f avorable environment for targeted programmes for po verty alleviation, as government revenues expand at relatively high rates and as the concern for the poor naturally increases” (Rao 1998). As a country develops, the share of wage employment in total employment increases. So does the share of the inequality of pay in total income inequality. As the number of educated workers increases, the scarcity of rent which they earn declines. The resulting compression of the educational structure of wages may, in fact, reduce the inequality of pay. Thus, by reducing the inequality of pay, educational e xpansion may actually reduce total income inequality . However, if the more educated se gment of the labour -force hops into higher-paying jobs (opportunities per mitting) then, indeed, the inequality of income may be increased, unless counteracted by some other public policy (for example, housing in Singapore). This is called the composition effect of education on inequality. Whether the compression or composition ef fect dominates can be the clue to whether increased education enhances or reduces income inequality or not. Birdsall and Sabot (1994) carried out a cross-section study of more than 80 countr ies and found tha t the compression ef fect dominates. This means that a ne gative correlation emerges between basic education and enrolment rates and the level of income inequality (measured by the Gini co-efficient). Another very recent study by Saavedra-Rivano (1998) compared two countries, and has given significant credit to education in reducing inequality
© 2002 Institute of Southeast Asian Studies, Singapore
Education and Development: Lessons from East Asia for Bangladesh
19
in Korea, while at the same time there was lack of appreciation about this crucial factor by Brazil: Even now, there seems to be little realization among the Brazilian elites of the need for diminishing the inequalities which, if anything, have increased in recent years. Education or the lack of it is one powerful transmission channel for the reproduction of these inequalities. But educational improvement, which most analysis of the Brazilian social situation acknowledges to be vital, receives only lip service and no concrete measures are taken (Saavedra-Rivano 1998, p. 191).
The emphasis given here on improving education, to reduce inequality in income and hence augment gro wth for the Brazilian econom y, may not be unique. It has general implications as well. There is a strong argument that a reduction in inequality does, in fact, stimulate economic growth above and beyond affecting equity, because it enhances human capital development. This happens because: 1. Low and declining inequality is likely to provide stimulus for higher levels of savings and investment by the low-income groups. The poor refrain from making investments in human capital, which yield high returns, mainly because of liquidity constraints. Lower inequality may ease such constraints. 2. Lower inequality can stimulate growth by improving political and macroeconomic stability. If non-élites can also shar e the benefits of growth there will be less alienation and broader-based support for the government in charge. In ad dition, high inequality cr eates pressure for public spending on favoured groups (for example, spending more for tertiary rather than basic education), and continued support for “white elephants” instead of creating jobs for their children can constrain growth through grave fiscal mismatch. 3. Less inequality means greater incentives for the marginalized groups to respond to economic opportunities. If children from low-income households know from their experience that their academic achievement will not compensate for the low quality schools they attend, they are unlikely to make extra effort to improve their condition. The incentive for g reater effort can be related to the aspiration for greater equality of income. 4. More equal income distribution has a greater multiplier effect in the economy. Education, Health and Demographic Changes There is no doubt that education is itself a basic need . However, with increased access to education, other basic needs are further improved. For example, the
© 2002 Institute of Southeast Asian Studies, Singapore
20
Education for Development
provision of health services is vastly improved when there is greater consciousness of this need, which is facilitated by education, formal or informal. Persistent malnutrition can be attributed to both inadequate food intake and lack of health care. Sometimes, although there may be health-care facilities, the lack of concern for health needs among the poor can limit the use of the health care system. Basic education, makes a substantial difference. The basic level of education of the public can play an important part in the utilization of communal health care and of general medical facilities, and female education in particular is especially important in this (see Dréze and Sen 1989). For example, if we contrast the life expectancy at birth in different states of India, we find the state of Kerala despite being no richer — indeed rather poorer — than the Indian average has a remarkably longer life expectancy than the Indian a verage of 56 to 58 years. The latest estimates suggest a life expectancy in Kerala around 70 years — not far from European figures. There is much evidence that this is c losely connected with the high level of literac y — especially female literac y — in K erala. The massive educational expansion in what is now Kerala began as early as 1817 with a powerful call for mass literacy by Rani Gouri Parvathi Bai, the ruling female monarch of what was then the native state of Travancore (ibid., pp. 221–25). That policy of education and public health has been pursued fairly consistently ever since, and has been further consolidated in recent decades by state governments keen on public services in education and health (Sen 1992, p. 5).
Sen further argues that widespread education leads to a better under standing of the need for health-care and stronger popular demand for it. Public health programmes initiated after high public demand may not yield results or be sustained unless people are concerned about the quality of the health-care service provided. Once again, educational opportunities play a crucial role in determining the outcomes. The United Na tions Development Programme’s Human De velopment Reports (HDR) have consistently linked basic education with better health care. The latest HDR (1998) projects this interrelationship quite convincingly, as captured in Tables A6 and A7 in the Appendix. The positive role of education in determining rapid demographic transition, with falling birth rate and better health-car e, the latter preceding the for mer, led to a greater increase in the number of young people who save and invest more than other age cohorts, resulting in f aster economic growth. At a later period, the number of the working-age population may further increase, providing a demographic bonus. Haddad (1990) summarizes the findings of eleven studies which clearly relate education positively with fertility rate, life expectancy, and child health (see Table A10 in the Appendix).
© 2002 Institute of Southeast Asian Studies, Singapore
Education and Development: Lessons from East Asia for Bangladesh
21
Education and Women Despite women being the crucial link to achieving some of the developmental objectives highlighted above, the education of women received attention only very recently. Besides the obvious equity argument, it is now strongly felt that the low level of education for women hinders economic development and reinforces social inequality (Stromquist 1988; Si vard 1985). Women are enormous potential sources of human capital and the rate of returns in investing on them in the developing countries is higher than that for men even if one measures only income differentials (without accounting for other effects) (see Table A9 in the Appendix). Again, it can be argued that a higher proportion of women in the labour force is the likely outcome of a higher literacy rate for female adults (see Table A26 in the Appendix). The positive role of women in reducing fertility rates and ensuring better child health has already been emphasized in the preceding section. Moreover, providing education to women may lead to greater empowerment for them, leading to a faster transition to a virtuous cycle of opportunities away from the vicious cycle of poverty. Education, Globalization and Technical Change The rapid pace of globalization presupposes the integration of factor markets through trade and exchange. In order to survive in a highly competitive global economy, every firm has to be more ef ficient and fle xible. The economies with a highly educated, efficient, flexible labour force will be “quick to adapt and respond to changing challenges” (ADB 1998, p. 169) of globalization. They will be able to cope better with the imperatives of the ongoing revolution in information and technology. Apparently, the level of education is positively correlated with access to information (see Table A11 in the Appendix) and this asymmetry will be further accentuated unless societies at the lower end make efforts to increase their investment in education and technology. Therefore, it is imperative to make appropriate policy responses to develop human resources with the right skills and aptitude. Improved technological capability, nurtured through a responsi ve educational system, will hold the key for an economy wishing to make a transition to a more prosperous state. To adopt a more sophisticated knowledge system will obviously not be easy. Relying on the more industrialized countries for higher order technology will not only increase dependence, but there may also be a host of social and economic fallouts in this drive for globalization. Unless societies are prepared to invest in education to consolidate their own knowledge bases by reorienting it towards creativity and autonomy, they will continue to be net consumers of knowledge created elsewhere, and remain backward. Education is indeed the instrument of change. It not only changes the society, which may be backward
© 2002 Institute of Southeast Asian Studies, Singapore
22
Education for Development
and hesitant to interact with the modern world, but it also undergoes significant changes in the process of becoming “a bundant, efficient and producti ve and a part of the mainstream of the world’s growing knowledge” (Haq 1997, p. 3). Education and Environment The rapid pace of development using sophisticated modern technologies may lead many societies to a situation w hich may not e ven be li veable. The degradation of the physical environment and the destruction of natural resources may no doubt expedite the growth process, but the outcome may ultimately not be the desired one. Thus, a sensible option would be to try a growth process that is sustainable and not anti-environment in its content. Unless a wellintentioned environmental policy is pursued vigorously, some of the high growth performing economies may be caught. Most governments are responding quite sensibly to the environmental constraint to development. As an overall and complete education is lik ely to have positive implications on en vironmental hazards (Table A27 in the Appendix), there is a need for systematic environmental education to be integrated into all types of education to bring about the required attitudinal change to life-styles and to find the best ways to cope with likely environmental disasters. Mere lip service will not serv e the purpose. A well-planned public education programme with a responsive curriculum including environmental education must be put in place if policy-makers really want their environmental legislation and protective measures to succeed in achieving their policy objectives. We have analysed the critical role of education in development, focusing on the areas of g rowth, productivity, poverty alleviation, equity, health and demography, gender specificity, technological change, and the environment. Each of these elements does, of course, interact with the others, and education is perhaps the binding glue which hangs the frame. Both education and development are value-loaded concepts and they aim to change individuals and society, perhaps not only by changing the mindset but also adding material gains. While the purpose of education is to de velop and nurture indi viduals and generations, to instruct them, inculcate values, attitudes and behaviour deemed desirable, development aims at “acting upon society with explicit intention of modifying its evolution, which presupposes a series of value judgements as to what constitutes a desirable future” (Debeauvais 1981, p.20). The East Asian Context The interrelationships between education and development in the context of East Asia are presented here. To capture the inter-linkages between education,
© 2002 Institute of Southeast Asian Studies, Singapore
Education and Development: Lessons from East Asia for Bangladesh
23
poverty and income inequality, we can r efer to the stud y of Park, Ross, and Sabot (1996). It compares macroeconomic data for Brazil and Korea and confirms the negative correlation between education and inequality. The study notes that despite Brazil and Korea having similar levels of per capita income, they have marked differences in income inequality mainl y because of differences in educational attainment. The share of income of the top 20 per cent of workers in Korea is roughly eight times that earned by the bottom 20 per cent in 1976. The ratio for Brazil was 26 per cent in 1983. The study also notes that the educational composition of the labour force changed markedly from 1976 to 1985: the proportion of high school and post-secondary graduates increased sharply and the proportion of workers with elementary school or less declined by 8 per cent. As the supply of the educated w orkers increased, the wage premium earned by them in K orea declined. The same study found that Korean workers with high-school education earned 47 per cent more than pr imary school graduates in 1976. By 1986, however, this premium had declined to 30 per cent. Similarly, the premium earned by workers with higher education declined from 97 to 66 per cent (see Birdsall and Sabot 1994). Having a greater number of working age population does not automatically ensure growth. The society has to invest in them and make them ready for the challenges of growth by improving their level of education, health, and skills. In this, Southeast Asia has been reaping a bonus (except perhaps the Philippines) (ADB 1998). Obviously, the government has a crucial role to pla y here. The positive impact of education on demographic indicators has been captured here by some statistics from the HDR (1998, Table A8 in the Appendix). The early initiation of the export-led growth process in East Asia, and its subsequent relocation in the low-income countries, has benefited enormously from the participation of low-waged female labour available in the region. The high-tech industries in East Asia are again making very good use of welleducated female labour available in the region. The lack of an educated female labour force could be a serious constraining factor for a country which wants to move faster to high-tech industrialization. To cope with the information revolution as well as overall global challenges, there is certainly a need for greater investment in human resource development if an economy wants to reap the benefits of the technological revolution, which is moving at a speed beyond our comprehension. In fact, the willingness to invest more in education (particularly at the secondary level and above) with the specific intention of exploiting the advantages of this revolution will determine to a large extent how quickly and ably some of theAsian economies, which have been ravaged by the recent economic crisis, are on the road to recovery. Other economies that have not been affected so badly by the crisis will also have to invest in education so that they too can create an adequate stock of skilled labour f orce that can participate in the ever-changing global market.
© 2002 Institute of Southeast Asian Studies, Singapore
24
Education for Development
Southeast Asia’s educational policies and plans have apparently been able to appreciate the dual roles of education as an instrument of change as well as produce abundant and efficient knowledge workers. Most of the countries are, however, not fully aware of a systematic environmental education programme that can be integrated into all types of education (except perhaps Singapore to some extent). For example, it has been reported in the Straits Times (24 January 1999) that the pollution level of Hong Kong may reach a level that may not be liveable in fifteen years’ time despite its significant growth unless there is greater intervention in the environmental front. On the other hand, Singapore is apparently much more concerned about environmental fallout, and hence is pursuing a more environment-friendly growth process. However, at least recently, most of the go vernments of these countries are responding quite sensibly in trying to understand the importance of environmental education. Of course, there have been frustrations with both education and development. While education in many countries has failed to respond to the needs of rapid accumulation and distribution, development has also failed to address adequately the issue of poverty, unemployment, and shelter for many, despite remarkable economic growth, both at the national and per capita levels. In such a background, it is not surprising that in recent years conventional development concepts, theories, and practices have all been undergoing critical re-examinations, resulting in the rise and wide acceptance of a much broader, people-oriented notion of the nature and objectives of development, together with a broader education and its diverse roles in developing both individuals and society (Coombs 1985, p. 17).5 We have also discussed some of the roles of education in development in the above paragraphs. There are divergent views too (see, for e xample, Pritcher 1996). Ho wever, even such views do not altogether negate the contribution of education to development; instead, they caution policy-makers to be more aware of the fact that development is a “complex business” and education alone cannot achieve the goal. It works well only in a better policy environment and not in a vacuum (see Pritcher 1996, for a good critique on the role of education in economic development). Be it so, the focus of this study is to understand the state of the educational systems in East Asian countries in terms of access, funding , quality and relevance to development. In fact, the success of educational development in East Asia should really be placed in the conte xt of a very favourable exportled development strategy which is able to create demand for a well-educated labour-force coming out of the educa tion system. Mor eover, educational expansion in the region has been the result of a very strong commitment to education as a fundamental building block of the development process, which has been open, pragmatic, and strategic.
© 2002 Institute of Southeast Asian Studies, Singapore
Education and Development: Lessons from East Asia for Bangladesh
25
Methodology The study is essentially based on thorough research of the secondary literature. In the search, the early educational experiences of Japan and then South Korea were kept in mind. Besides looking into the secondary literatures on a comparative basis, an attempt was also made to generate some primary-level information from the of ficials of the Ministry of Education, Singapore, accessing Web pages through the Internet, and discussions with development economists and a number of teachers located in Singapore. The objective has been to locate appropriate lessons for Bangladesh, which too aspires to develop faster along the lines followed by some of the East Asian countries. As such, while researching for relevant information for this study, the author has tried to derive some policy lessons for Bangladesh, keeping in mind the dif ferent planes on which the Southeast and South Asian regions are placed. It is true that both regions were almost at the same level of economic development about three decades ago, and it is intriguing how they fell apart in terms of their material development. Notwithstanding the financial crisis, which has put the Southeast Asian region off the rails for a while, and South Asia, including Bangladesh, is still achieving a growth rate of about four percentage points, the fact remains that there are two parts of Asia with divergent levels of material well-being, as well as in their perceptions of graduation to the next level of development. These contrasting outcomes have been kept in perspective while drawing lessons from the Southeast Asian and East Asian educational and developmental experiences.
© 2002 Institute of Southeast Asian Studies, Singapore
This document is reproduced from Education for Development: Lessons from East Asia for Bangladesh , by Atiur Rahman (Singapore: Institute of Southeast Asian Studies, 2002). This version was obtained electronically direct from the publisher on condition that copyright is not infringed. No part of this publication may be reproduced, translated, stored in a retrieval system, or transmitted in any form or by any means, electronic, mechanical, photocopying, recording or otherwise, without the prior permission of the Institute of Southeast Asian Studies < http://www.iseas.edu.sg/pub.html >
26
3
Education for Development
Education and Development with Particular Reference to Singapore and Japan
Since the publication of the East Asian Miracle (World Bank, 1993) which emphasized the critical role of human resource development in conjunction with other relevant institutional factors in achieving unprecedented high growth rates in East Asia, a number of new researches have been undertaken to examine the contribution of education in explaining this phenomenon (see, for example, Mingat 1995; Rao 1995; Mundle 1995; Morris and Sweeting 1995; Stevenson 1998; Koo 1999). Primacy to Basic Education Almost all of these studies have emphasized the paramount role of primary education in providing a solid base of literacy, numeracy, and social cohesion in the early per iod of industrialization prior to economic tak e-off. This has been a common trait in almost all the high growth performing countries of East Asia. Japan has, of course, been the pioneer in this league,and it has been closely followed by South Korea and later by the newly industrializing countries (NIEs), and finally by other ASEAN countries. There are, of course, great variations within the countries of Southeast Asia in ter ms of the emphasis given to different aspects of educational policies beyond this broad commonality (see Ramesh and Asher, forthcoming). Apparently, the East Asian societies, including the Southeast Asian countries, have followed a straightforward strategy which has worked quite well in achieving the desired economic development: “develop an awareness in the culture of the importance of education, persuade students to study
© 2002 Institute of Southeast Asian Studies, Singapore
Education and Development with Particular Reference to Singapore and Japan
27
effectively, provide schools with well-trained, responsive teachers, make school an enjoyable place to be and maintain strong cultural interest and family support in education” (Stevenson 1998, p. 163–64). As the economy started to grow in this part of Asia, the governments of these countries anticipated that a well-educated workforce would be needed if the demands of complex industrial and manufacturing economies were to be met and, accordingly, they organized their educational systems with adequate budgetary support. In some countries, the role of the private sector in supporting education has also been commendable (for example, South Korea and Taiwan). Japan achieved universal primary education as early as 1900, and it continued to place emphasis on primary education even after other levels of education were developed (Japan National Commission for UNESCO 1966). By 1965, the enrolment roles of primary education in South Korea, Singapore and Hong Kong were well ov er 100 per cent of the of ficial estimated age cohort (Morris and Sweeting 1995, p. 245). This expansion of basic education covered both boys and girls — another distinguishing feature of East Asia. This newly literate workforce provided the fuel to the rapid labour -intensive export-led industrialization which occurred in Japan in the 1950s and 1960s, with a longer lag period between universal primary education and rapid industrialization (Hong Kong, Singapore, Taiwan, and South K orea in the 1970s, and Malaysia, Thailand, and China in the 1980s). In all these countries, the expansion of primary education took priority in the early phase of their gro wth and industr ialization. At this stage, proportionately much less was spent on secondary and higher education. Subsequently, however, “motivated both by c hanges in the econom y and by the rising expectations of parents whose children were completing their primary schooling, first secondary and then tertiary education became the focuses for expansion” (Morris and Sweeting 1995, p. 246). Access to Schooling Table A12 in the Appendix gives the comparative gross enrolment rates by level of schooling over the past f our decades. We notice a great v ariation in access to schooling in the different countries. As indicated earlier, Japan, Korea, the Philippines, and Taiwan had a good start. Singapor e too had a moderate start (77 per cent). The South Asian countries (India, Pakistan, Bangladesh, except Sri Lanka), Indonesia, and Taiwan had less coverage. If we compare the ratios between secondar y and primar y enrolment rates for the different countries, it becomes clear that Southeast Asian countries (such as Singapore, Malaysia, and Indonesia) have put relatively less emphasis on secondary education compared to the South Asian countries. The Philippines, of course, has followed the latter group. Japan again achieved near universal secondary education quite early.
© 2002 Institute of Southeast Asian Studies, Singapore
28
Education for Development
Although gross enrolment ratios broadly indicate access to schooling, they do not measure ef fective coverage. The inclusion of o ver-aged pupils and repeaters can inflate the ratio. Normally, four years of schooling is considered the minimum for permanent literacy/numeracy. If this is so,then the percentage of enrolled students who continue to fourth grade is crucial. Table A13 in the Appendix indicates that South Asian countries experience higher proportions of dropouts compared to the SoutheastAsian countries. As a result the adjusted primary enrolment ratio became as low as 17 per cent for Bangladesh and India in 1960, compared with 74 per cent for Malaysia, and 83 per cent for Singapore. While Sri Lanka’s rate was 91 per cent, Indonesia’s was only 38 per cent. Ho wever, on the whole , Southeast Asia did better in ter ms of effective enrolment at the primary level as early as 1960, and did not have to undergo collossal wastages of resources and learning time at the basic level. This level of achievement in primary education in 1960 had something to do with the subsequent growth performance in the 1990s. Mingat (1995) relates the growth ratio (GDP per capita in 1992 and 1960) to the enrolment rates at three levels of schooling at the beginning of the period 1950–60, controlling for the initial level of per capita GDP (1960), and provides estimates for five alternative specifications (see Table A14 in the Appendix). In all six relationships, he f inds a co-ef ficient that is both positi ve and sta tistically significant for the initial coverage of primary education; its numerical value is similar in different specifications. On average, a country that would have had a primary education coverage of 10 per cent higher than that in the initial period would have, according to the estimated relationship, a growth ratio of 0.75 higher. However, for secondary and higher education, he does not get a similar fit. Most Asian countries, of course, have increased their coverage of primary education in later decades, but those who achieved better coverage earlier was more successful too in terms of growth performance. The better access to schooling in the East Asian countries has also been supported by Koo (1999) (see Table A15 in the Appendix). He records that the age categories for pre-primary education are widely dispersed, ranging from three to six y ears of a ge. The primary schooling starts a t the a ge of six or seven. Primary education (up to five to six years) had been made compulsory in most of the East Asian countries (except Singapore, which does not enforce compulsory education but almost every child goes to school). China, Japan, and Malaysia have made education compulsory for up to nine years. Koo also reports on gross enrolment ratios in the above table, covering the age group of six to twenty-three. As can be observ ed, Japan does the best here too. It is followed by Korea, Hong Kong, and Singapore. The ASEAN-4 follow them quite closely. The table also shows the expected number of years of schooling. Japan, and the NIEs show figures which are closer to the developed countries (for example, New Zealand, France, Norway, the United States, and Canada average around 14.1–16.5 years). The figure for the Philippines is also
© 2002 Institute of Southeast Asian Studies, Singapore
Education and Development with Particular Reference to Singapore and Japan
29
significantly higher than all other lo w-income countries. However, Koo uses mostly UNESCO data, which are often dated and not covering all the countries. The data focus mostly on enrolment ratios and hence cannot be extrapolated for further policy discussions. If we break down further the gross enrolment ratio by levels of education, we find that this is abo ve 100 per cent in most of the East Asian countries (see Table A16 in the Appendix), although it is slightly below world average (99 per cent), but much above the average of the less developed countries (LDCs) (65 per cent) in Malaysia andThailand. Most of the EastAsian countries have also achieved gender balance in gross primary enrolment ratio. China, however, has not yet done so. Table A16 also reveals great variations in gross enrolment ratios among the East Asian countries. Japan and the NIEs ha ve achieved very high rates while the other ASEAN countries, except the Philippines, have lagged behind, though still far above the LDC level (17 per cent). The gross enrolment figures may often hide the real cause of noticeable differences in the access to schooling. F or example, suddenly in 1986, the enrolment at the tertiary level of education in Thailand increased to more than one million from only 55,000 existing in 1970 because two more universities were established around the mid-eighties. In the Philippines, college level instruction was added to existing secondary schools as a means to receive public funding during the 1950s and 1960s. In comparison with these countries, Singapore is highly selective in its admission policy at the tertiary level and committed to quality and employment. Thus, its enrolment ratios a ppear low. Indeed, more than half of the eligible students who apply for university seats in Singapore are turned away. The four polytechnics accept about two-thirds of the applicants. Mor eover, Singapore keeps aside a certain percentage of seats for foreign students at the tertiary level although this proportion is believed to be quite low compared with most universities in the United Sta tes. However, a hug e number of Singaporean students go abroad for higher studies. The streaming system of education has also helped to keep the enrolment ratio low. A high percentage of students in Singapore (nearly half the relevant age cohort) who gain admission into vocational institutions, polytechnics, and other training institutes may not have been captured by the enrolment data given by UNESCO. Morris and Sweeting (1995) go deeper and argue that besides the level of expansion, one should also kno w the timing of this e xpansion. According to them, the key periods were those which preceded each significant shift in the economic structure. The periods prior to industrialization saw systems of secondary education which, in general, were selective, elitist and academic with regard to curricular orientation and highly competitive with regard to admissions. They were in effect the centrepiece of a pyramid, one of their key goals being to prepare a
© 2002 Institute of Southeast Asian Studies, Singapore
30
Education for Development
minority of pupils for entr y to the f inal stage of formal education. Thus in 1965, the enrolment rates in secondary schools in South Korea, Singapore and Hong Kong were 35 per cent, 45 per cent and 29 per cent er spectively. As their economies grew, so people’s living standards and aspirations increased. This coincided with the increases in the government’s revenues. In the more interventionist societies of South K orea and Taiwan, the state responded to public demand and/or to its own desire to invest in human capital by rapidly expanding secondary education. Consequently, by 1986, the enrolment rates for secondary schools in Taiwan had risen to 92 per cent, in South Korea to 95 per cent and in Hong K ong to 69 per cent. Ho wever, this expansion was not always publicly funded (Morris and Sweeting 1995, p. 249).
At the tertiary level, the achievements of Japan and the NIEs ar e higher. Korea exceeds Japan and it is almost at the level of the developed countries. Singapore and Hong Kong, although showing lower achievements in 1980, later picked up and by 1992 the figures were 22 and 20 per cent respectively (see Table A12 in the Appendix). Japan and Korea also show higher numbers of students per one hundred thousand inhabitants. Again, the figures for the Philippines and Thailand are quite high (see Table A17 in the Appendix). However, one must remember that man y students in small countries lik e Singapore and Hong Kong study abroad and, if adjusted, the figures will obviously be higher for these countries. Looking at the enrolment data, it can be safely argued that a wide coverage of primary education in most of the high growth performing economies of East Asia acted as a multipurpose investment providing positive influences on economic efficiency in occupations which required flexibility and adaptability than anything else. As the economies mo ved to a higher le vel, the East Asian societies and governments responded more positively to the demand for secondary and tertiary education. This emphasis on, first, a strong basic education and then moving gradually to higher order education matched very cogently with the economic success of these countries. However, achieving universal coverage in primary educa tion early and then shifting gradually to the next levels of education would not have meant much unless a high quality education was offered to the children. In fact, what the students learn ef fectively in the schools become economically v aluable during their adult life. We, therefore, focus on the quality of education imparted in these countries in the next sub-section. The Quality of Education The quality of schooling can be examined from both input and output perspectives. The input side can ha ve in-school components such as teachers, curriculum, textbooks, and other facilities as well as of f-school
© 2002 Institute of Southeast Asian Studies, Singapore
Education and Development with Particular Reference to Singapore and Japan
31
components such as private educational expenses and the socio-economic background of the par ents. The output side may be measured by students’ achievements in in-school tools (test scores, repetitions, dropout rates, etc.) or off-school tools such as performance in the labour mark et. Certainly, the input aspects do influence the output but the relation between the two has not yet been clearly established. Koo (1999) cites at least five cases where this is so. Firstly, although the ef fect of of f-school input is not ne gligible, the net effect of in-school input is f ar greater in terms of students’ achievement test; this seems to be the case more so in developing countries than in developed countries such as the United States. School quality appears to have a substantial ef fect on subsequent ear nings of students in the United States but there is little evidence for or against this relationship in developing countries. Secondly, the ef fect of in-school input, whether measured in terms of school buildings, laboratories, textbooks, teacher qualifications, nature of curriculum, class size, composition of the student body or expenditure per people, does have an effect on enrolment, on student achievement, and on adult earnings. Thirdly, per student (in-school) expenditure does not adequately reflect quality of schooling because not only is its variation large but there is also considerable variation in unobservable inputs to schooling that do not have market prices. But micro studies in the United States indicate positive though diminishing returns to per pupil expenditure on schooling. Fourthly, the b ulk of cur rent expenditures goes to wards teachers’ salaries via three classes of inputs: class size, teachers’ experience, and teachers’ graduate education. Although teachers’ characteristics positi vely affect students’ achievement, class size and measures of teachers’ salaries seem to be less impor tant than e xpenditures per student. While the size of the class within the range of twenty to f orty makes little or no dif ference in average performance, the teachers’ attitude and experience seem to be more important than his or her academic qualifications in improving students’ achievement. Fifthly, in a countr y such as Thailand, where the portion of recurrent expenditure for education spent on teaching materials or textbooks is very low, there seems to be positi ve relationship between students’ achievement and availability of textbooks (Khoman 1988, p. 25) (Koo 1999, pp. 54–55).
Educational Expenditure On the input side, let us look into the expenditure pattern which can broadly capture most of the components discussed above, despite some reservations
© 2002 Institute of Southeast Asian Studies, Singapore
32
Education for Development
about it. The provision of primary and junior secondary educa tion (that is, basic education) has throughout been treated by most East and SoutheastAsian governments as a collective good with large externalities, and hence funded publicly. The public funding relates mostly to the operation of the school system. However, parents ha ve also been par ticipating in terms of the pur chase of books and uniforms, the payment of transportation fee, or financing private tuition. This is not the case, however, in post-basic educational expenditures. Table A18 in the Appendix shows the share of enrolment in public and private schools and the share of fees in expenditures in four high growth performing economies of Asia: Japan, Korea, Taiwan, and Singapore. Except for Singapore, the East and SoutheastAsian societies have been relying quite largely on private funding in providing higher secondary and tertiary education, primarily through the payment of direct user fees. Japan, Korea, and Taiwan show one pattern: the majority of students ar e enrolled in private schools and they raise funds mostly from private sources. The government’s contribution in terms of subsidy and infrastructural support increases in the case of higher education. While the above three economies have relied mostly on a market-driven strategy (with occasional state intervention in the development of junior colleges and technical schools), Singapore has taken an interventionist approach following the manpower requirement technique. Whatever approach followed, all of these countries have faired quite well, until recently, in fulfilling the demand for highly educated graduates driven by economic growth, which has been consistently very high. The Southeast Asian countries benefited from the relocation of Japanese industries following the Plaza accord in 1985, and shifted their emphasis to light exports and service sectors where the demand was growing by leaps and bounds. The transformation of the service sector required skill development, which was facilitated by the early emphasis on basic and secondary education by these countr ies. As the demand for more value-added goods increased, countries like Singapore opted for greater openness and collaboration with foreign capital for linking up their technology-based industrialization. At this phase, the y started to emphasiz e on quality tertiary education. In other words, education has been demand driven and the East Asian countries were willing to make adjustments to its content and supply based on the requirement. Quite a good balance has been maintained between the demand and supply of skilled labour (perhaps better in Singapore than most other countries, as cited earlier). The Asian crisis, however, created some “disequilibria” in this equation, even in Singapore, resulting in high rates of retrenchment and job losses r ecently. Nevertheless, the r egion has been recovering from this crisis precisely because of its timely investment in human capital. It is argued that the private financing of education in these countries has not only helped to develop human capital in line with market demands, but
© 2002 Institute of Southeast Asian Studies, Singapore
Education and Development with Particular Reference to Singapore and Japan
33
also achieved economic efficiency. The efficiency argument can be related to two aspects: 1. the curriculum is likely to reflect the needs of the labour market as students consider higher education as a private investment; 2. there may be a higher level of cost consciousness among school managers. This argument is particularly relevant for managers of private institutions. Now let us look into the e xpenditures of schools. This is mostly pub lic expenditure, and indicates the go vernment’s commitment to education. Table A17 in the Appendix provides the data on the share of public spending on education in GDP between 1950 and 1992. The table clearly shows that the high performing Asian economies consistently allocated higher levels of funds to education compared to most others. Malaysia has been spending high amounts on education too, and it has been achieving high growth rates in recent years. What is significant is that those countries that have been spending more on education have been rewarded with higher growth rates. They spent much more in the 1950s when most other Asian countries spent very little. As they spent more, they also achieved higher levels of schooling. While the average number of years of schooling in Bangladesh is only about five years (this was much lower in the past), the South Asian countries have nine to thirteen years of schooling, on average. Japan and the NIEs spend more on higher education. Ho wever, the ASEAN-4 still spend relatively more on primary education. Korea and Thailand emphasize primary education, while Hong Kong and Singapore spend much more on secondary education. Malaysia spends equally on both primary and secondary levels. Pupil–Teacher Ratio Let us now look into another input — the availability of teachers. Table A21 in the Appendix gives a comparative picture of pupil–teacher ratio over time. We observe the following: 1. as a country becomes more prosperous and attain demographic transition, the pupil–teacher ratio tends to fall. This has been true for most countries in Asia. 2. The four high perf orming East Asian economies show a declining trend in pupil–teacher ratios as the per capita GDP increases (35 when per capita GDP was US$4,000 at 1992, and falls to 25 at per capita GDP of US$15,000–US$20,000 in the same year) (see Figure 3). The teacher–student ra tio in primary education has, in general, been relatively high in high-performing Asian economies.
© 2002 Institute of Southeast Asian Studies, Singapore
34
Education for Development
FIGURE 3 Pupil–Teacher Ratio in Primary Schooling during the Stages of Development in HPAES Pupil -Teacher ratio
770
Japan Korea
60
Singapore 50
Taiwan
40 30 20 10 0 500
1000
2000
4000
8000
16000
32000
(1992 US$)
Per-capita GDP at different points in time
NOTE: HPAEs = High Performing Asian Economies SOURCE: Mingat (1995), p. 43, Table 6.
Mingat averages the pupil–teacher r atio at different levels of per capita GDP (1992, US$) for the secondary level and finds a declining ratio with increasing level of per ca pita GDP (see Table A24 in the Appendix). This relationship indicates that the high performingAsian economies improved their economic condition first, to effect a lower pupil-teacher ratio. On the other hand, as can be seen fromTable A21 in the Appendix, countries such as Pakistan, Indonesia, and Sri Lanka achieved lower pupil–teacher ratio even at a lower per capita GDP. Mingat has also r eported that all the high perf orming Asian economies made a special effort to pay teachers a r elatively high salary (almost 40 per cent above that of other Asian countries) (also higher in GDP per capita terms than the OECD countries) (Mingat 1995, p. 46). In other words, they have opted for a mix in which pupil–teacher ratio (and consequently class sizes) was high while using relatively highly paid teachers (Mingat 1995, p. 46). As a result, the quality of educa tion did not deteriora te in these countr ies. The well-paid teachers have been performing v ery satisfactorily despite a lar ger class size. However, the class size has been falling in recent years. Result-oriented Education Another input v ariable to consider is the curriculum. The nature of the curriculum in East Asian countries has been f airly uniform. Teaching and
© 2002 Institute of Southeast Asian Studies, Singapore
Education and Development with Particular Reference to Singapore and Japan
35
learning are viewed as equally instrumental in achieving maximum success in highly competitive selection examinations. Examinations are considered as the “conducting rod” of the education system in Southeast Asia. Since higher levels of education are rewarded with higher lifetime earnings within a socioeconomic context where there is generally no public safety-net, the education system had to be made meritocratic, competitive, and highly instrumental. However, countries like Singapore and South Korea innovated the streaming system to ensure the selective function of education even in the context of mass provision (for example, to academic/general or technical/vocational streams). The system has encour aged “results-oriented” education with sufficient hardwork and perse verance.6 The curriculum in most of these countries is centrally controlled and inculcates “a strong sense of social cohesion through the pr omotion of national identity , consciousness and purpose” (Morris and Sweeting 1995, p. 258). This takes a different form in the ethnically homogeneous and multicultural societies. For example, Singapore clearly promotes multicultural nationhood without compromising the quality of education, whereas Malaysia uses the educational system to promote the indigenous Malays. However, in all these societies there has also been an attempt to encourage a sense of globalization and competitiveness so that the younger generation can pick up the right skills to be job worthy and at the same time competitive. This attitude towards “economic literacy”7 has not, however, been assumed by all countries with the same enthusiasm. Singapore, South Korea, Taiwan, and Hong K ong, are far ahead of others in this aspect. China has recently adopted this attitudinal change quite fast. However, Thailand, Malaysia, and Indonesia still have miles to go in this respect. On the output side, we may now look into the intensity of schooling, internal efficiency, and students’ educational achievements. Juster and Stafford (1991) found that Japanese children spend 50 per cent more time in school than American children. They also study at least four to five times more than their American counterparts. However, the authors point out that this trend does not hold for the tertiary level where American students study more outside of classes than Japanese students. The Internal Efficiency of the Educational System The internal efficiency of the educational system is measured by the repetition and dropout rate. Japan and the NIEs have negligible numbers of repeaters and dropouts in a particular cohort reaching various grades of primary level education. Progression to the final grade is nearly 100 per cent in such economies. This means that there is very little wastage of educational resources in these economies. Malaysia has done quite well, with 96 per cent of students progressing to the f inal grade. Ho wever, Thailand, the Philippines and Indonesia have 10 to 30 per cent dropouts. Table A22 in the Appendix shows
© 2002 Institute of Southeast Asian Studies, Singapore
36
Education for Development
the coefficients of efficiency in primary education. This is defined as the ratio between the ideal number of pupil-years that graduates would have taken to complete the cycle of education had there been no repetition or dropout, and the number of pupil-year s actually spent by the cohort. The coefficients, as reported by Koo (1999, p. 69) are 1 for Japan and the NIEs, and 0.78–0.97 for Indonesia, Philippines, and Malaysia. Evaluation of the students’ educational achievements are based on the International Association for Evaluation of Educational Achievements (IEA) results. These results show that students in EastAsian countries perform better than those from other countries (Koo 1999). Mingat (1995) also reports on an international comparison of the overall achievement of students in school (see Table A23 in the Appendix). In general, students from low-income countries get less in terms of formal learning than students in de veloped countries. Globally, the OECD a verage was +.3. The East Asian high-performing students of age 9 and 13–15 got very high marks. Japanese and Koreans normally exceed the international mean. Singapore, with a deviation of +.25 is close to the OECD vaerage, but Thailand is far below the international mean (–.2) while the Philippines and Indonesia lag far behind. In other words, if these scores are any indication, the high-performing countries have been creating a wide pool of “well taught applicants for the further levels of schooling (and thus) helping to filter those that have the highest capacities” (Mingat 1995, p. 16). Secondary education is thus well grounded, providing equal opportunities to all children to move into the upper levels of education. Again, there are variations in quality within the region. External Efficiency of the Educational System Whether an education system prepares the young generation in relevant and economic ways for the needs of the future is the basic question of external efficiency, argues the Asian Development Bank (1991, p. 41). Indeed, Singapore has achieved an educational system which, according to Yee (1995) is “the best in Asia” by consciously adopting a polic y of attracting m ultinational companies (MNCs) to consolidate its drive to establish a knowledge-based economy. A good education system does not only provide an educated labour force which is adaptable (and hence liked by MNCs) but is also a source of attraction for the expatriates who are al ways worried about their c hildren’s education when they plan to move out of their home countries. Selvaratnam (1994) underscores this policy strategy of linking the economy , the labour market, and education and continuously upgrading the capabilities of tertiary institutes to meet the demands of market-driven technological changes.
© 2002 Institute of Southeast Asian Studies, Singapore
Education and Development with Particular Reference to Singapore and Japan
37
Of course, in recent year s most other Southeast Asian countries have moved gradually towards market-based outward-oriented economic policies. Most of them have improved their institutional set-up as well. Even after all these improvements, the region has been witnessing a slowdown in their growth rates mainly because of f alling exports. However, the ADB (1998) thinks that the East Asian countries ha ve been lac king human skills and technological capabilities to run an adequate prudential and regulatory framework for the financial sector. There was also a dearth of sophisticated economic management, which is so vital in running the economy in a globalized environment. The Educational Policy of Singapore Although Singapore inherited a British educational system, it quickly transformed it into a well-structured multi-functional demand-driven system which could meet the country’s need for an educated and skilled w orkforce. At present, education in Singapore is a highly prioritized sector steered by senior ministers. The hallmarks of the educational system her e are car eful planning, élitism, nationalism, racial harmony, and state pro visioning. It also inculcates sound moral values to live in a multicultural, rapidly changing progressing society.8 Koo (1999) describes well the educational system of Singapore. Singapore’s early growth strategy was formulated to work along two lines. The first concerned the development of human resources while the other emphasized the more technical methods accelerating the expansion of the manufacturing sector in an attempt to restructure and diversify the economy. The school structure was diversified in favour of technical and vocational education, which was structurally inplanted into the formal education system in 1968 (Low et al. 1991, p. 52). Accordingly, while the number of first tier (degree) students increased by seven-fold and that of the second-tier (diploma) six-fold in thirty years, the increase in student enrolment was markedly skewed towards science and technolo gy, accounting and b usiness management programmes, which was in line with Singapore’s manpower needs for its push towards high-technology-oriented manufacturing, trading, and the service sector. Admission into tertiary institutions is merit-based with the central ogal of building a needs-based pool of Singaporeans with the right mix of education and skills rather than a supply driven and bloated higher education system (Koo 1999, p. 72).
Every child in Singapore undergoes at least ten years of general education (six years of pr imary plus four years of secondary education). The system emphasizes on literacy, numeracy, bilingualism, physical and moral education, and creative and independent thinking.There is a continuous effort at improving students’ creative potential to meet the challeng e of the twenty-first century.
© 2002 Institute of Southeast Asian Studies, Singapore
38
Education for Development
Computer-based programmes are being intr oduced to take advantage of the flourishing information technology. Efforts are being made to reduce a part of the burden of the traditional curriculum to allow students to think and enjoy activities which foster bonds and develop a sense of responsibility and commitment to the f amily, community, and country. However, the entire educational tree is geared towards employment (see Figure 4). As far as achievement in the dif ferent levels of schooling is concerned, Singapore is now in the same league as J apan, Korea, Hong Kong, Taiwan, and China. The primary enrolment rate crossed 100 per cent as early as 1965. Both boys and girls have had equal access to schools. This has created a solid base for the subsequent e xpansion of secondary and ter tiary education. The gross secondary school enrolment more than doubled in thirty years, reaching nearly 70 per cent in 1992. Secondary education remains merit-based and almost entirely publicly funded. Pre-university education is also financed almost solely by the state. At least three-fourths of tertiary education is financed publicly. Government funding of education has been almost monotonic since 1979, averaging 14.7 per cent (Pec k 1996, p. 138). The rate of funding has been higher than the corresponding rate for gross national product (GNP) (11.3 per cent) and total recurr ent expenditure of the go vernment (11.6 per cent). Singapore’s expenditure on education increased 54 times, from S$63 million in 1959 to S$3,400 million in 1994 (Quah 1998, p. 110). Sing apore spent 5.4 per cent of GDP on education in 1992 when theAsian average was 3.8 per cent. Taiwan, China, of course, spent more than Singapore (7 per cent). Despite the economic slowdown, some countries in SoutheastAsia have been continuing their budgetary support for education. The recent financial crisis has forced Singapore to cut down government expenditure substantially, but with no axe on the educational budget. Singapore depends v ery little on pri vate financing. There are some independent schools in Singapore, but these again are outcomes of government initiatives allowing some operational autonomy. There are no private institutions at higher levels in Singapore, but private fees account for about 25 per cent of the total educational expenditure. To get a further insight into the input side , let us look into the current expenditure on education in the EastAsian countries. As can be observed in Table A20 in the Appendix, more than 60 per cent of current expenditure is for teachers’ salaries. Singapore spent nearly 86 per cent of expediture on this. Japan and Korea too spent more on teachers’ salaries. They, however, spent less on teaching materials. Singa pore has changed its policy thrust and more is now being spent on educational infrastructure and teaching materials, including IT facilities, in addition to paying teachers more attractive salaries. They have been promised additional study leave to prepare themselves to become better teachers.9 Singapore’s higher education has also been developed to make available a pool of high-level skilled personnel for the manufacturing and service sectors. The system has linked its for m and
© 2002 Institute of Southeast Asian Studies, Singapore
Education and Development with Particular Reference to Singapore and Japan
39
FIGURE 4 The Education System in Singapore
Typical Age
Universities
UNIVERSITY EDUCATION
Years of Schooling
Employment
Apprenticeship
GCE A-level POST SECONDARY EDUCATION
Institute of Technical Education
Polytechnics
Centralised Institutes Junior Colleges
19 — 14 18 — 13 17 — 12 16 — 11
GCE O-level
S 5N
GCE N-level
SECONDARY EDUCATION
Normal (Academic)/ Normal (Technical) course 4 years
Special/Express course 4 years
15 — 10 14 — 9 13 — 8 12 — 7
PSLE
11— 6 Orientation Stage P5-P6
PRIMARY EDUCATION
10 — 5
9 —4 Foundation Stage P1-P4
8 —3 7 —2 6 —1
S
i i
f d
i
Si
SOURCE: Ministry of Education, Singapore.
© 2002 Institute of Southeast Asian Studies, Singapore
40
Education for Development
size, output and quality to the rapidly changing needs of its export-oriented and high technology-driven economy. The research and development facilities provided in universities, polytechnics, and independent institutions such as Digital Labs or the Institute of Molecular Sciences are indeed quite lavish, and they maintain close contacts with the private sector to improve the technological base of industries. One of the major strengths of Sing apore’s education system has been its capacity to change in desired directions (Gopinathan 1995, p. 100). Since the mid-eighties the system has under gone a number of inno vations leading to greater decentralization, professionalism, and cur riculum flexibility. The government since then has been encouraging greater space for criticism and participation, and revealing hard facts like under-achievement by some groups. The greater use of school management committees and democratization of the school curriculum have been well received. At the polytechnic and university levels, a greater drive for quality, innovations, techno-preneurship, evaluations by highly competent external evaluators, followed by speedy actions, indicate the commitment of the leadership to prepare the nation for the challenges of the next millennium. However, there are concerns as well. The ADB’s Asian Development Outlook (1998) while giving enough appreciation to Singapore in its continuous effort to improve its R&D (research and development) status, feels that it will still require more sophisticated information infrastructure and basic scientific and technological development. At a time when the developed world is moving towards cyber business, Singapore has only less than half the number of Internet hosts per head of population than the United States, and the incidence of personal computer availability is equally inadequate. Singapore, of course, has a developed telecommunications system. It is now aiming to become one of the most dynamic international financial centres. A highly skilled workforce is a prerequisite for this and, apparently, Singapore is aware of this requirement. Moreover, very competent professionals suc h as accountants, lawyers, actuaries, economists, management consultants, system analysts, and computer programmers with easily available facilities for continuing education and training ha ve to complement such a w orkforce. The tertiary education system, though quite a ware of its responsibility , still has to c hange its gear more quickly to prepare the society f or such a gr eat transition. So far , the higher education system has been quite successful in producing a group of graduates who are knowledgeable and disciplined in learning and applying quickly imported technology and, if needed, modifying some of the designs and technique. And they ha ve proved themselves quite pr oductive when assigned redesigned jobs. The need for analytical skills and discipline was not critical in this phase of de velopment. However, if Singapore really wants to graduate as a developed nation, the old system of educa tion may not suffice. In the next century, a developed nation, in some cases even a developing nation, will have to face a globalized and technologically developed economy where
© 2002 Institute of Southeast Asian Studies, Singapore
Education and Development with Particular Reference to Singapore and Japan
41
there will be no option but to depend increasingly on innovation to initiate higher value-added processes of production in order to remain competitive. The education system then will have to shift its focus to develop the creative potential of students. Of course, this does not mean that the system will have to abandon the traditional system altogether. Instead, there will be a need for a new but balanced educational system which combines both appropriate traditional and new creative features. It seems that Singapore has been promoting the best of all these systems. University education in Singapore is highly supervised and yet students spend a lot of time outside their classes as well. Chieh (1999) foresees at least three major areas in the shift which the education system has to undertake if it really wants to play an effective role in transforming Singapore’s economy and society. 1. In the next phase, the education system will have to provide students with a broad base of cross-disciplinary knowledge to facilitate them in life-long, independent learning. The acquisition of pr ocess skills, that is “learning how to learn” will be crucial at this phase of transition. Both teaching and assessment objectives will then have to change as well. Instead of lecturing only , the teac hers will ha ve to stimulate students to explore open-ended alternative ways of approaching a new pattern. The tertiary institutions should, in f act, be the centre of continuing education, facilitating the updating of older knowledge and encouraging students to think and innovate. 2. The creative-thinking skills of students anchored in analytical plan and discipline will have to be developed through workshops and other forms of idea generation. The drive for technopreneurship should be pushed even further. 3. There should also be enough scope for a balanced development of non-academic aspects of education, such as interpersonal skills, emotional intelligence needed for good teamwork, and human networking. These traits will have to be acquired in order to compete effectively with the world class application of R&D and technological innovations. Singapore is apparently preparing itself to produce the required group of knowledge workers who will be creative individually but with the ability to work in groups, can tap global resources, and can retool themselves through lifelong learning (see Figure 5 for the expected outcomes of education that Singapore is planning to give to its future citizens). Despite some elements of extravagance in the claims made on behalf of the educational system, one positive factor is that it is a dynamic sector which tries hard to “contribute to enhanced human ag ency, greater civic tolerance and pluralism, and indeed in meeting the legitimate claims of the state for national cohesion and economic viability” (Gopinathan 1997, p. 52).
© 2002 Institute of Southeast Asian Studies, Singapore
42
Education for Development
FIGURE 5 Outcomes of Education All Post-Secondary and Tertiary Students
Potential Leaders
Students should:
Potential leaders should:
Be morally upright, be culturally rooted yet understanding and respecting differences, be responsible to family, community and country
Be committed to improving society
Believe in the principles of multiracialism and meritocracy, appreciate the national constraints but see the opportunities
Be pro-active in surmounting our constraints
Be constituents of a gracious society Be willing to strive, take pride in work, value working with others Be able to think, reason and deal confidently with the future, have courage and conviction in facing adversity Be able to seek, process, and apply knowledge Be innovative — have a spirit of continual improvement, a lifelong habit of learning, and an enterprising spirit in undertakings Think global, but be rooted in Singapore
Have compassion towards others Be able to inspire, motivate, and draw out the best Be able to chart Singapore’s destiny and lead
Be able to forge breakthroughs in a knowledge-based economy Be creative and imaginative
Have the tenacity to fight against the odds
SOURCE: Ministry of Education, Singapore, August 1998.
The need to focus more on en vironmental studies in Southeast Asian educational institutions can hardly be o ver-emphasized. Except perhaps Singapore, the other Southeast Asian countries have not yet given appropriate emphasis on the promotion of environment-friendly development. Despite its small size, Singapore has been expanding the green base of the country, putting adequate emphasis on the control of pollution, and providing students and the public alike with opportunities for knowing more about the environment through
© 2002 Institute of Southeast Asian Studies, Singapore
Education and Development with Particular Reference to Singapore and Japan
43
the Science Centre, natural conservation, zoological and botanical gardens, bird parks, etc. Everywhere, the need for preserving the environment is well emphasized. However, unless there is a regional effort for a better environment, a country like Singapore will remain vulnerable to others’ anti-environment actions. The haze problem in 1997 cost Singapore US$29.6 million (Siddiqui 1999), 88 per cent of which represented welfare loss. Countries like Singapore and Malaysia had to suf fer such a huge loss mainly because of the lack of policy awareness in Indonesia and its failure to control private greed from destroying a public good. The uncontrolled clearance of forests by burning caused such a crisis. Such environmental issues and many others ought to be included in the curriculum of tertiary educational institutions of the region. The Lessons Learned The discussion so far has revealed a number of key trends with regard to the contribution of educa tion to de velopment in East Asia in gener al, and in Southeast Asia in particular, which may be of interest to Bangladesh. We will first summarize these trends and then examine the educational features of Bangladesh in broad strokes. Next we will look for relevant lessons for Bangladesh from the above findings on East Asian/Southeast Asian education and development. Key Trends in the Contribution of Education to Development in East Asia/ Southeast Asia Although it is true that a single factor (for example, the role of education) cannot take us far in explaining the spectacular growth achieved until recently in East Asia/Southeast Asia, it still makes sense to focus on it as a very important player among many other factors interacting with each other in producing the outcome which we have observed in the region. Indeed, almost all commentators, including the World Bank (1993) which initiated the discussion on the miraculous achievement of East Asia, have given special credit to human resource development facilitated by, among others, a very well thought-out educational system. However, it should also be re-emphasized that education policy has always been encapsulated within the economic and development policies of the successful countries of Southeast Asia. These countries opted for outward-oriented industrialization, facilitated foreign direct investment, and increased technological capabilities steadfastly. Education, in fact, acted as an engine of the growth process which needed continuous formation and upgrading of human capital. But again, the relationship between economic growth and education, particularly secondary and tertiary education, is quite
© 2002 Institute of Southeast Asian Studies, Singapore
44
Education for Development
problematic. An increasing per centage of young people ar e joining the a ge cohort requiring quality secondary education but providing this will remain uncertain in some countries. The quality of tertiary education will also have to be continuously improved as the demand for skilled and scientific personnel conversant with technological and financial advances originating from industrialized countries will continue to gro w. These countries will ha ve to apply some of this knowledge to produce goods and services required by a global economy. In the light of the above discussion, the following key trends in educational contrib ution to development in East Asia/Southeast Asia in general, and Singapore in particular, can be cited. 1. Priority to Primary Education: The East Asian (including Southeast Asian) countries have in general given greater priority to primary education even at an early stage of their economic development. Almost all the East Asian countries which later demonstrated v ery high performance in the growth process actually achieved 100 per cent coverage of primary education as early as in 1965. Simultaneously , they have made efforts to retain the students in schools (not true for all of them) and to provide them with good quality schooling, as demonstrated by the achievements of their students in international competitions. 2. Positive Outlook towards Education: Both for cultural and economic reasons, the high performing societies in this par t of Asia have been able to create an environment where people attach high value to education. In other words, there is a positive social demand for education in this region. Here the education is not only geared to abstract academic learning but also tuned to their material condition of living. The education in Southeast Asia has been designed as a system and not an ad hoc arrangement, keeping in mind what the students are going to do after they leave the schooling system. For example, the streaming system in Singapore allows different types of education to young people according to their intellectual ability and aptitude, thus providing several options for everyone. As a r esult, students and their parents know their options in advance. In South Korea, Taiwan, and China the societies v alue education so m uch that they willingly participate by paying a major part of the cost even at the secondary level. However, the g overnments in these countries also pay dearly for the management of the system. It is because of this high value that people attach to education that there is no need for making it compulsory in some countries. Even today Singapore does not have legislation making primary education compulsory, and yet its record in achieving universal primary education is nowhere debated.
© 2002 Institute of Southeast Asian Studies, Singapore
Education and Development with Particular Reference to Singapore and Japan
45
3. Emphasis on Basic Education: The East Asian societies have also put special emphasis on lower secondary education which in combination with primary education has been pro viding basic education. The universal coverage of basic education for relevant cohorts, providing quality education without many dropouts is yet another striking achievement of the re gion. The sequencing of educa tional support, by putting additional emphasis on higher levels of education as these economies grew, is indeed a distinguishing feature of the region. 4. Public Spending on Education: The governments in Southeast Asia have never shied away from spending adequatel y on educa tion. As stated earlier, Singapore increased its educational expenditure 54 times within thirty-three years, starting from 1959. Even a late-comer like Malaysia has been spending lavishly on education. Most Southeast Asian countries, in particular Singapore, have not cut their educational budgets despite the Asian financial crisis, although they have severely cut other expenditures. Singapore, in fact, has increased its educational budget and uses it almost entirely on the primary and secondary levels. Only about a quarter of the expenditure at the tertiary level is shared by the parents through the contribution of fees. However, most other NIEs (for example, Hong Kong, Taiwan, and South Korea) have tapped private resources, even at the secondar y level, via user fees. The dependence on private financing has been remarkably high, even compared with most OECD countries.The private institutions in Japan, Korea, Taiwan, and China account f or 50–70 per cent of students in secondary and tertiary levels which, of course, receive government subsidies, but with some public monitoring and control. Sharing of the cost with private sources may have contributed towards the healthy management of an equilibrium between supply and demand for qualified labour at different stages of development in these countries. There are again some variations (see boxes). 5. Focus on Vocational Learning: These countries have in general placed some emphasis on v ocational courses in secondary education. The enrolment for vocational education was around 40 per cent at the upper secondary level in the first stage of development (Mingat 1995, p. 50) and this proportion gradually declined with the increase in the level of per capita GDP. At a higher level of development, the emphasis shifted back to a general type of education. However, Singapore innovated a quality technical education system through its polytechnics, which also put emphasis on general education. The technical education imparted here is greatly valued by the private sector which collaborates intensely with such institutions to develop new products and to train/retrain their workforce.
© 2002 Institute of Southeast Asian Studies, Singapore
46
Education for Development
6. Quality of Education: On the whole, these countries have been able to achieve a high level of educational outcomes (in terms of average duration of study of a cohort) and in quality (high retention rates and high level of formal learning) while keeping the burden on public finance at reasonable levels. Although at an ear ly stage of their development they had higher pupil-teacher ratios, as the economies improved the ratio dropped correspondingly . Even at the high ratio period, the system did not compromise on the quality of education. Highly motivated teachers, usually well paid, made this possible. 7. Equity Aspect of Educational Spending: The education system has been strictly merit-based and not allowed only the children of élites to grab the benefits of higher education. There has always been an element of equity built into the distribution of public resources because of its merit-based priority. In addition, suf ficient scope for schooling f or poor but meritorious students has been provided as part of the system. 8. Intangible Outcome of Education: It will be quite naive to look at only the budgetary elements of the educational system.There are many “intangibles” in the educational system of the high performing economies of this region. For example, the education system does give attention to detailed planning and design, provides real options to the people, and instills a sense of v alue and pride in one’s surroundings. The education is thus “result oriented” and geared to the needs of the society and economy. For example, Singapore’s education al ways reminds students about the smallness and the vulnerabilities of the country besides the need for maintaining racial harmony and competitiveness. 9. Upgrading the Knowledge Base: Most of these countries continue to upgrade the knowledge base of their high-level and mid-level manpower through training and continuing educa tion. This is particularly true for Singapore and Korea. 10. Practical Learning: They ensure that the under graduate level of education produces very high quality graduates who can take over the responsibility of leadership, including the bureaucracy. For example, in the National University of Singapore, there is one highly trained teacher for every ten students deeply involved in teaching through person-to-person contact (tutorial system) besides the formal lecture. The level of student care is indeed high here. The involvement of science teachers in lab-based teaching is also substantial. 11. Motivated Teachers: Teachers in gener al have been well paid and motivated to give the best to the students. Highly trained teachers from both within and outside the region have been attracted to the universities and polytechnics in Singapore. This is also true for Malaysia.
© 2002 Institute of Southeast Asian Studies, Singapore
Education and Development with Particular Reference to Singapore and Japan
47
12. Maintaining a Fine Balance: The tertiary education system in a highperforming country like Singapore strategized itself in relation to the importance of the linkage between education, the labour market and growth, the uncompromising pursuit of high quality, and the generation of new ideas and innovations to succeed in a competitive environment. Thus, emphasis was initially given to a diversified and need-based education system. As the economy of Singapore approaches the cyber age, the need for creativity and innovations is being further emphasized by the policy-makers. Support for technopreneurship and greater collaboration between higher educational institutions and Western universities speak eloquently about the vision and farsightedness of its leaders for a higher order educational development to cope with the challenges of a f ast-changing globalized economy. Its emphasis on R&D development, and further collaboration with the private sector via the MNCs also indicates Singapor e’s desire to remain on top of the ongoing innovations and technological change. While emphasizing high-tech educational achievements, Singapore has not abandoned the traditional skills-based secondary education either. It is maintaining a fine balance between the existing and emerging patterns of educational development. The system also k eeps students a ware of the environmental changes in and around the region through both curricular and extra-curriculur activities. However, the students, though hardworking and disciplined, have to be further initiated towards a more flexible and creative pattern of learning. As yet, they tend to be glued to pre-designed te xts and supervisor’s guidance. Befor e we comment on how far these lessons can be useful for a country like Bangladesh, let us first look into the broad features of its educational architecture.
© 2002 Institute of Southeast Asian Studies, Singapore
This document is reproduced from Education for Development: Lessons from East Asia for Bangladesh , by Atiur Rahman (Singapore: Institute of Southeast Asian Studies, 2002). This version was obtained electronically direct from the publisher on condition that copyright is not infringed. No part of this publication may be reproduced, translated, stored in a retrieval system, or transmitted in any form or by any means, electronic, mechanical, photocopying, recording or otherwise, without the prior permission of the Institute of Southeast Asian Studies < http://www.iseas.edu.sg/pub.html >
48
4
Education for Development
Implications of East Asian Education Policies for Bangladesh
Educational Features of Bangladesh The constitution of the People’ s Republic of Bangladesh ob ligates the government to adopt effective measures for the purpose of: 1. establishing a uniform, mass-oriented and universal system of education and extending free and compulsory education to all children to such stage as may be determined by law; 2. relating education to the needs of the society, and producing properly trained and motivated citizens to serve those needs; 3. removing illiteracy within such time as may be determined by law (Article 17, Bangladesh Constitution). Despite such a thrust on education, the sector has been performing dismally since independence. The adult literacy rate is effectively still hovering around 40 per cent (the latest government figure claims it as 60 per cent) compared with 70 per cent in the developing countries as a whole. This is an increasingly competitive race in which Bangladesh lags far behind . The government of Bangladesh had earlier declared its commitment to “Education for all by the year 2000” but progress has been far behind the targeted goal. The quality of education has also been far from satisfactory. To provide a better view of the educational architecture, let us now focus on the prime measures taken by the Government of Bangladesh (GOB) in the education sector since independence. The GOB has taken a number of measures, including taking over the responsibilities of private primary schools under the Primary Education (Taking Over) Act, 1974. Later on, the Pr ogramme of
© 2002 Institute of Southeast Asian Studies, Singapore
Implications of East Asian Education Policies for Bangladesh
49
Universal Primary Education (UPE) was initiated. A separate Directorate of Primary Education (DPE) was created in 1981 with its administrative structure down to the sub-district level. This action was followed by the promulgation of the Primary Education (Compulsory) Act, 1990, and the creation of the Primary and Mass Education Division (PMED) in 1992, which provides administrative support to policies and programmes for the universalization of primary education (UPE) and removal of illiteracy. In addition, a Compulsory Primary Education Implementation Monitoring Unit (CPEIMU) was created in November 1990, to help monitor the implementation of CPE and also to carry out the Child Education and Literacy Survey biennially. CPE committees have been established at ward, union, sub-district and district levels for social mobilization in favour of primary education at the grass-root level. For the implementation and management of non-formal education (NFE), a separate Directorate of Non-formal Education (DNFE) was established in 1995 (PMED 2000). Figure 6 portrays the strategic framework of basic education in Bangladesh. FIGURE 6 Strategic Framework of Basic Education in Bangladesh
Universal Primary Education 6–10 years
Compulsory Primary Education
Bangladesh Goal by 2000
Increased Enrolment and Access Preparedness for School/ECE 4–5 years Non-Formal Basic Education 8–14 years Adult Education 15–45 years
Increased Attendance/ Retention
Contributing To Basic Education for All
Enhanced Completion/ Achievement
Continuing Edcation SOURCE: PMED (2000)
© 2002 Institute of Southeast Asian Studies, Singapore
95% Enrolment 70% Completion 62% Adult Literacy Rate
50
Education for Development
In order to achieve education for all, Bangladesh has initiated programmes for: • • • •
Increasing the enrolment rate Reducing the dropout rate; Lowering the illiteracy rate; and Improving basic learning competencies.
Basic education in Bangladesh is delivered through two systems: the formal system, and the non-formal system.The existing Strategic Framework of Basic Education in Bangladesh (F igure 6) adequa tely reflects the g overnment’s policies for attaining maximum benefit out of public and private endeavours both in the formal and non-formal systems. The key agencies engaged here are the Directorate of Primary Education and the Directorate of Non-Formal Education under the Primary and Mass Education Division and the Bangladesh Madrasah Education Board (BMED) under the Ministry of Education (MOE). Apart from these, there are community and pri vate organizations, as well as non-government organizations (NGOs), who of fer basic education to the disadvantaged and children who have dropped out of non-formal education centres. The formal system is the predominant one, while the non-formal system is complementary and supplementary to it (Figure 7). Some NGOs also run adult education centres with financial support from the GOB and development partners. Formal Education Formal education is offered in Bangladesh for five years at the primary level, five years at the secondary level, and two years at the higher secondary level. Higher education comprises two to five-year courses, and beyond. A parallel system of religious education also exists, with similar steps through Ebtedayee, Dakhil, Alim, Fazil, and Kamil madrasah f or Muslims, Sanskr it Toles for Hindus; Pali Toles for Bud dhists, and English Seminary for Christians. According to official records, there are about 63,534 primary schools, 13,000 secondary schools, 10 cadet colleges, 1,700 general colleges, and 27 government and non-go vernment universities. There are 168 institutions offering technical and engineering education of different types and at different levels. The number of government medical colleges stands at 13 while that of private medical colleges is 5. In addition, there are 24 Homeopathic, 5 Ayurvedic and 10 Unani systems of medical colleges, and 68 teacher-training institutions of different categories. Besides these are the institutions for special types of education, such as 239 Sanskrit and P ali Toles, some 3,000 kinder gartens, 8,231 Ebtedayee madrasahs, and 78,821 mosque-based Maktabs/Hafezia/ Forkania madrasahs devoted to the early years of religious teaching (PMED 1999).
© 2002 Institute of Southeast Asian Studies, Singapore
Implications of East Asian Education Policies for Bangladesh
51
FIGURE 7 Organization of the Primary Education System in Bangladesh (B) Non-Formal Stream
(A) Formal National-Level Policy, Project Approval
Primary and Mass Education Division (PMED)
(C) Madrasah Edn. stream
CPEIMU NGO Affairs Bureau
DNFE (H.O) Agency Level Administration ○
○
○
○
○
DPE (H.O) ○
○
○
○
○
Division Level
○
○
○
○
○
○
○
○
○
○
○
○
○
○
○
○
○
○
○
○
○
○
○
○
○
○
○
○
○
○
○
○
○
○
○
○
○
○
○
○
○
○
Thana education Committees
TEO
○
○
○
○
○
○
○
○
○
○
○
○
○
○
○
○
○
○
○
○
○
○
○
○
○
○
○
○
○
○
○
○
Thana Implementation Monitoring Union
Thana CPE Committees ○
○
DPEO ○
Thana Level
○
○
District Offices
District CPE Committees
DDPE
District Level ○
○
○
Union Village Level
○
○
○
○
○
○
School (SMC, PTA)
○
○
○
○
○
○
○
○
○
○
Union CPE Committees
Ward CPE Committees
Children
Clientele Level
○
○
○
○
○
NFBE Centres
○
○
○
○
NGO Centres/ Schools
Children Youth and Adult
Children Youth and Adult
Assistant Thana Education Officer Compulsory Primary Education Implementation Monitoring Unit Director General Directorate of Primary Education Ministry of Education Non-Formal Basic Education Non-Government Organization Deputy Director of Primary Education District Primary Education Officer Primary and Mass Education Division Parent Teacher Association School Management Committee Thana Education Officer
© 2002 Institute of Southeast Asian Studies, Singapore
Madrasah
Centre Management Committee
Abbreviations: ATEO CPEIMU DG DPE MOE NFBE NGO DDPE DPEO PMED PTA SMC TFO
Madrasah Education Board
Children Youth and Adult
52
Education for Development
Madrasah Education in Bangladesh The madrasah education system is a formal one, in addition to the general education stream, and consists of a well-established Islamic religion-based education stream. It w as officially introduced in 1882 f ollowing the Hunter Education Commission Report. Madrasah education comprises five stages: Ebtedayee, Dakhil, Alim, Fazil and Kamil levels, ranging from five years for the first two stages to two years for the latter three stages.At present, Ebtedayee, Dhakil and Alim have been recognized as equivalent to primary, secondary (junior secondary and secondary education) and higher secondary levels, respectively. Besides, courses on religious education have an important place in the school curriculum of the formal education stream. It is a required subject of study up to Grade 8 and can be studied as an elective subject at higher levels. Efforts are now under w ay to inte grate general education with madrasah education. Ebtedayee madrasahs enrol children of 6 to 10 year s. The Ebtedayee curriculum/course includes (1) the Qur an and Tazbid, (2) Akaid and Fikah, (3) Arabic, (4) Bangla, (5) English, (6) Arithmetic, (7) Environment Study: Social Studies; and (8) Environment Study: Science. This curriculum resembles that of the general primary education where religious education replaces the Quran, Arabic, and Fikah. The madrasah education is subject to the highest dropout rate (Alam 2000). In addition, prospects of employment for the madrasah graduate in Bangladesh are limited. However, recently, the courses offered in the madrasahs have been updated and modernized so that the madrasah graduate may have access to higher studies in science and technology and ifnd gainful employment. Already, madrasah graduates are moving into medical and engineering courses as well as universities. To create opportunities for higher studies and research in Islamic Shariah, Arabic Language and Literature, Islamic History and Culture as well as a number of modern subjects, an Islamic University has been established. However, in today’s context, it would be necessary and desirable to introduce science and trade courses in all madrasahs, to provide training to the madrasah teachers, and to strengthen opportunities of higher education and research at the higher Islamic institutions. Presently, there are about 8,000 independent and 2,850 Ebtedayee madrasahs under the administrative control of the Ministry of Education. The number of Dakhil madrasahs is 4,487, Alim 949, Fazil 899, and Kamil 120. Almost all of these have been established by the community and are operated by a Managment Committee recognized by the Bangladesh Madrasah Education Board. The government pays the salaries of teachers of recognized madrasahs as well as provide development support on a limited scale.
© 2002 Institute of Southeast Asian Studies, Singapore
Implications of East Asian Education Policies for Bangladesh
53
Non-formal Education Education implies learning irrespective of where and how the learning takes place. Education is also a life-long process, assuming different forms, of which formal schooling is onl y a part of the whole pr ocess. As distinct fr om the hierarchically structured and chronologically graded formal education system, an accepted definition of non-formal education, according to the National Plan of Action, Government of Bangladesh, is: That form of educa tion which consists of an assor tment of or ganized and semi-organized educational activities operating outside the regular structure and routines of the formal system, aimed at serving a great variety of learning needs of different sub-groups of population, both young and old.
It is recognized that some non-formal education programmes cater to the same learning needs as the schools do, and could provide alternative channels of education which cannot be co vered by formal sc hooling. While the nonformal approaches have room for flexibility and innovation, their efficacy and wide acceptance is dependent on maintaining good quality standards. Children who cannot or do not get enrolled in primary schools, who drop out from schools, adolescents who lapse into illiteracy and who have never benefited from any schooling, would perpetually remain in darkness unless some non-formal opportunities ar e provided for their educa tion. The DNFE took the initiative to design programmes to cater to the needs of these segments of the population (for example, Integrated Non-Formal Education Programme) and engages NGOs on contract to impart basic education. A good number of NGOs have drawn up programmes for basic education. Stages and Duration of Education Counting the normal academic sessions, sixteen years of regular study are deemed necessary from entry into primary school to completion of a Masters degree for a general education, or a Bachelor’s degree for professional education, except for medicine which requires one extra year. Without repetition in any class or loss of any academic year for any reason, a boy or a girl gaining admission to Grade 1 of a primary school at the age of six should get his/ her M.A. / M.Sc. degree at twenty-one or twenty-two years of age (Figure 8). The stages of general education and the duration of the courses as well as the official age group of students are summarized in Table 2. Entry into formal technical vocational education takes place after the completion of Gr ade 8, and into pr ofessional education in engineer ing, agriculture, and medicine after completion of Grade 12.
© 2002 Institute of Southeast Asian Studies, Singapore
54
Education for Development
FIGURE 8 The Education Structure of Bangladesh Age Grade year 25
XX
24
XIX
23
XVIII
22
XVII
M Phil
21
XVI
M.Sc. MA/MSc/MSS/MCom
Ph.D
Post MBBS Dipl
PhD(Eng) Ph.D (Medical)
PhD (Education)
M.Com.
XIV
18
XIII
Bachelor Degree
17
XII
16
XI
HSC Examination
13
VIII
12
VII
11
VI
10
V
9
IV
8
III
7
II
6
I
BP ED
Kamil
Dip (Lsc)
Faxil Diploma (Engineering)
SSC Examination SECONDARY EDUCATION
TRADE Certificate
C in ED
C Diploma in in Agri Commerce
ARTISAN COURSE e.g CERAMICS
Alim
Dakhil
JUNIOR SECONDARY EDUCATION
Ebtedayee
IX
Secondary
X
14
MA (Lsc)
Diploma in Nursing
HIGHER SECONDARY EDUCATION 15
M.Ed & MA (Edun) B.Ed & Dip Ed.
B.Sc (Tech Edn)
BBA
XV
19
M.Sc(Agr)
B.Sc Eng. BOS B.Sc. Agr B.Sc. Text B.Sc. Leath
20
MBBS
LIM
M.Sc.(Eng)
MBA
M Phil (Medical)
PRIMARY EDUCATION
5
PRE-PRIMARY EDUCATION
4
TABLE 2 Stages of General Education and Official Age of Students Stage of General Education Early Childhood Education Primary Education, Grades 1–5 Junior Secondary Education, Grades 6–8 Secondary Education, Grades 9–10 Higher Secondary Education, Grades 11–12 Bachelor’s Degree (General Education) Master’s Degree(General Education)
Duration
Official Age
— 5-year course 3-year course 2-year course 2-year course 2/3/4 years 1/2 years
4–5 years 6–10 years 11–13 years 14–15 years 16–17 years 18–19/20/21 years 19/20–21/22 years
SOURCE: PMED (2000) p. 21.
From the above discussion, we get a picture of the basic framework of the education system of Bangladesh as well as the overall initiatives taken by
© 2002 Institute of Southeast Asian Studies, Singapore
Implications of East Asian Education Policies for Bangladesh
55
the government and other organizations to achieve the goal of education for all. Here, a look at the major trends in educational development will be helpful for future policy direction: 1. Bangladesh has one of the lowest enrolment rates in the world. Gross enrolment rates for primary education have averaged only 60 per cent since the 1970s. The secondary gross enrolment was 20 per cent, which is only about a quarter of Singapore’s. 2. The percentage of females in total students enrolled, though improving, still remains lower than males. The combined enrolment for females was 25 per cent in 1993, compar ed with 45 per cent for males. The dropout rate is also very high. 3. In Bangladesh, sex disparity is very strong in higher education. About 90 per cent of highly educated persons are male, whereas only 10 per cent of highly educated persons ar e female (Rahman and Ali 1995). 4. The adult literacy improved from 24 per cent in 1970 to 37 per cent in 1993. This is muc h below the a verage of e ven the de veloping countries (69 per cent). The female adult liter acy rate remains very low (25 per cent) compared with that of male (48 per cent). 5. The enrolment at the tertiary level has also not improved much, and increased to only 4 per cent in 1993 from 3 per cent in 1970. 6. The mean year of schooling has been hovering around 2 years for the last decade or so, which is lower than the South Asian (2.4 years) and developing countries average (3.9 years). 7. There is only one scientist/technician per 2,000 population. 8. The educational expenditure as a percentage of gross national product (GNP) has increased from 0.6 per cent in 1960 to 2.3 per cent in 1992, but is still lower than the average of South Asia (3.4 per cent) and the developing countries (3.9 per cent). It is not even half of Singapore’s average. 9. Bangladesh provides only US$5 a year per person for health and education compared with US$150 in Malaysia and US$160 in South Korea. 10. Bangladesh’s education system has f ailed to promote a unifor m, mass-oriented, and universal system of education. There is the English medium system for the privileged, a religious system for the underprivileged, and a secular system with wide variations in resources, quality of teaching, and school organization with differentiated access based on social status (Ahmad 1991). 11. Social and economic stratification has a significant impact on education in Bangladesh. The agricultural wage labour category which comprises about 20 per cent or more of the total population of the country contributed around 17 per cent of the total Grade 1 (primary) enrolment in 1995. Similarly, the non-agricultural wage labour (in both rural and
© 2002 Institute of Southeast Asian Studies, Singapore
56
Education for Development
12.
13.
14.
15. 16.
17.
18.
urban areas), which makes up more than 20 per cent of the total population, contributed about 14 per cent of the total Grade 1 enrolment in 1995. Thus, both the a gricultural and non-agricultural la bour household categories are under-represented (especially so in the case of non-agricultural labourers) in the pr imary schools of the country. Even the NFPE centres of the NGOs have not been able to fully cover these disadvantaged categories (Alam 2000). There also exist strong geographic disparities in the provision of education in Bangladesh. About 47 per cent of highly educated persons come from urban areas, and 53 per cent from rural areas. However, in Bangladesh, about 87 per cent of the total population live in the rural areas, and 13 per cent li ve in the urban areas. Therefore, the relative participation of urban people is much higher than that of rural people in higher education (Rahman and Ali 1995). In Bangladesh, the majority of the people speak Bengali, and the medium of instruction is also Bengali, in most cases up to secondary level, with some compulsory English courses at all levels. Besides these, there are some kindergartens and English medium schools where the medium of instruction is English. Students, mainly from the urban élite classes, are able to af ford to attend these institutions. In Bangladesh, the highest dropout rate prevails in madrasahs and the lowest in kindergartens and non-formal schools (Rahman andAli 1995). The system is rigid and compartmentalized with high dropout rates (60–70 per cent) and high repetition rates (20–30 per cent). The rates of dropouts and repeaters are much higher for the socio-economically disadvantaged than for their affluent counterparts. The secondary schools, largely non-government but subsidized by public funding, manifests the inadequacies of the basic education. The educational system of Bangladesh has not been based on social demand and does not respond to social aspirations. Thus, Sobhan rightly pointed out, “despite significant changes in the quantitative expansion of the educational system and a substantial increase in enrolment rates, the problem of access to standard quality has become more acute than before with the shift in the labour market” (Sobhan 1997, p. 319). The success rate of higher education has been quite poor despite enjoying a higher proportion of national expenditure for education. Tables A29 and A30 in the Appendix explain the higher shar e of educational budget for the tertiary sectors, with a low rate of return (6 to 7 per cent), and a lower share for the primary level. In Bangladesh, 24 per cent of the higher educated persons come from families with a monthly income of Taka 5,000 or below. About 55 per cent of them come from families with an income ofTaka 5,001– 15,000, and about 21 per cent of them come from families with an income of Taka 15,000 or above.
© 2002 Institute of Southeast Asian Studies, Singapore
Implications of East Asian Education Policies for Bangladesh
57
While South Korea spends US$390 per student at the primary level, Bangladesh spends only US$12.50. The picture is the same with secondary education. Expenditure on a primary student is not even 2 per cent of the corresponding government subsidy given to a university student (Khan and Hossain 1989, p. 141). Table A29 in the Appendix shows the gross expenditure on education in Bangladesh in different categories and tiers of education. Again, the access to higher education is highly skewed in Bangladesh. This is adequately reflected in Table A31 in the Appendix. The table is based on data generated from a sample of 600 graduates who appeared for an oral examination conducted by the Public Service Commission for recruitment into the Bangladesh Civil Service in 1990. From Table A31 in the Appendix, we can see that about 47 per cent of the graduates come from urban areas and 53 per cent from rural areas. In Bangladesh, about 87 per cent of the people live in the rural areas, and 13 per cent in the urban areas. Therefore, the relative participation of urban people is much higher than rural people in higher education. Here it can be noted that, if we consider all thana (subdistrict) headquarters as urban areas, then the figures would be about 66 per cent from urban and 34 per cent from rural areas. The table also shows that about 90 per cent of the graduates are male and only 10 per cent are female. In Bangladesh, the proportions of male and female in the population are almost equal. Thus, this tab le also sho ws the lo w participation of females in higher education. From this table, we can also observe that more than 50 per cent (about 55 per cent) of the higher educated candidates come from families with an income of Taka 5,001–15,000, and a bout 21 per cent of the gr aduates come from families with an income of Taka 15,001 and abo ve. The estimated per capita monthly income determining the absolute poverty line in Bangladesh in 1988–89 was Taka 370 for the rural areas, and Taka 500 for the urban areas. Based on this estimate, it was found that 50 per cent of the population are below the poverty line. Therefore, we can say that most of those with higher education come from high-income families. The findings of this table and the national statistics collected from the Household Expenditure Survey (HES) 1988–89 also show that about 76 per cent of the higher educated persons came from the top 17 per cent of the total population, and none came from the bottom 50 per cent. One of the redeeming features of the expansion of higher education is that higher technical education (engineering, medical, agricultural education) has also expanded very fast. The quality of technical education is reasonably good. The supply of technical graduates is good enough to meet the countr y’s demand. However, there is no dynamism in the demand for these skilled graduates. The poor quality of education in general is attributable to, among other factors, the poor b udgeting of educa tional funds. As can be seen from Table A32 in the Appendix, the major par t of the educational b udget goes
© 2002 Institute of Southeast Asian Studies, Singapore
58
Education for Development
to pay the expenditure for establishments (53.34 per cent in 1997–98) and allowances, that is, teachers’ salaries, etc. (32.68 per cent in1997–98). Very little of the educational budget is spent on books, teaching materials, and scholarship for students. The amount budgeted for basic education does not always reach the subsector. Only 62 per cent of the budgeted amount ultimately go to primary education (see Table A33 in the Appendix). On the contr ary, university education gets more than its due share. This is not surprising, given the predominance of urban élites in the national power structure, and that most of their children have access to higher education. Hossain (1989) finds that, except in facilitating some occupational mobility at the basic level, education in Bangladesh does very little to improve the productivity of the economy . He also f inds that there is no meaningful relationship between agricultural development (for example, the adoption of high yielding varieties) and the secondary level of education. Others have also observed a similar mismatch in higher education. A survey of 258 respondents from 29 organizations, both public and private, reveals that the graduates produced by the universities lack experience in research and the application of theoretical knowledge and hence cannot respond adequately to the needs of economic growth and social demand (Ahmed 1992, p. 24). Over 90 per cent of the respondents expressed this view. Respondents also identified the critical areas of manpower deficiency. The most commonly identified area (59.7 per cent of 231 respondents of fering opinion on this question) is marketing management. This is followed by technology (52.8 per cent of the respondents). This finding is quite consistent with the imperatives of a globalized economy. In another survey conducted in 1990 (Rahman andAli 1995) on 100 selected employees in the public sector with at least ten years working experience and 600 graduates appearing for the PSC examination, most indicated that the higher education imparted by the universities was not good enough for the developmental needs of the country. According to 85 per cent of the respondents, the current education system is not conducive to dynamic development. They opined for more enabling public policy which would put more emphasis on technology and vocation-based education. Fifty-five per cent of them felt that the existing higher education did not help to produce quality manpower. Simultaneously, they felt that the present education system did not make people innovative and inquisitive. While general education does not improve the income-earning capacity of the graduates, the performance of technical education is reasonably satisfactory. Taking income as dependent on the type of education, length of ser vice, regional status (urban/rural), family size and se x, Rahman and Ali (1995), ran a regression (not reported here) and found that technical education yielded a more significant relationship. It was also found that the income earning capacity of the urban graduates was higher than their rural counterparts.
© 2002 Institute of Southeast Asian Studies, Singapore
Implications of East Asian Education Policies for Bangladesh
59
Based on the abo ve findings, we may argue that the existing education system does not really match the needs of a dynamic econom y. Instead, it is strengthening income inequality and adding to the problem of unemployment. Are the Lessons from Southeast Asia Replicable in Bangladesh? We have now seen the realities of educational development in Southeast Asian countries and Bangladesh. We may now ask the question: are the experiences of the former replicable or transferable to the latter? Transferring a model or experience from one country to another is always problematic. However, one can still learn from foreign experience without trying to replicate the entire model. Woodrow Wilson, writing as early as 1887, suggested the usefulness of learning from other countries. He went as far as to say: ... it is necessary ... not to be frightened of the idea of looking into foreign systems of administration for instruction and suggestions .... But why should we not use such parts of foreign contrivances as we want, if they be in anyway serviceable? We are in no danger of using them in foreign way. We borrowed rice, but we do not ea t it with c hopsticks .... We have only to filter it (the science of administration) through our constitution (quoted in Quah 1998, p. 119).
The same is perhaps true for most other models. One need not transplant a high-yielding variety of any seed right into the field of a completely different country. The seed need to be acclimatized first, and perhaps “filtered” before getting the desired results. Though not a social scientist, the Nobel Laureate poet Rabindranath Tagore also expressed similar views while speaking about the danger of imitating some model. ... you can only copy things and external facts, you cannot assimilate truths which lie at the foundation of our human character. If any nation or a people have been successful in giving shape to ideals which are of perennial value, what we have to learn from them is their capacity to absorb and establish their ideals; we must not merely copy the results that others have produced .... I am not against absorbing truths which are of universal value; as a matter of fact, it is our human birthright to claim such truths as our own. But I am against borrowing ready-made models or emphasizing upon the need of imitating isolated external facts which are particular to a particular race or a nation (quoted in Sen and Rahman 1998, p. 120.).
Rose (1991) goes a step further and identifies five elements in this respect: copying, emulation, hybridization, synthesis, and inspiration, while talking about transferability. Quoting Pease (1996), he points out that the successful policy of one country cannot simply be replanted in the soil of another country. Instead, the latter country should direct careful attention to the policy context of the former. The synthesis and hybridization of successful policies have also
© 2002 Institute of Southeast Asian Studies, Singapore
60
Education for Development
not had the expected returns. Inspiration, of course, influences the latter to some extent in some specific areas of intervention. The presence of honest and competent leadership is, however, crucial in deciding the outcomes. One fact that emerges quite distinctly from the analyses done so far on the transferability of a successful programme is related to the critical role of human resource development. While commenting on the evolution of policy in East Asia, Ranis has observed that: “their overall success was due primarily to their ability to exploit something they did have: their human resources” (Ranis 1995, p. 2). Quah, while talking about the lessons which commonwealth countries can learn from the East Asian experience, has identified a few areas which also include investing in education heavily. He said, “their governments must improve and be committed to economic development and to minimizing corruption: they must also invest in educating and training their populations: and they must introduce comprehensive reforms in personnel management” (Quah 1993, p. 37). In a later study, Quah (1998), however, cautions that most countries will find it difficult to transplant a successful model lik e Singapore’s because of the cost factor alone. It is indeed costly to pay civil servants high salaries, invest heavily in education, invest in near universal housing, and curb corruption and crime. Thus, the most suitable option, according to Quah, is perhaps emulation. He argues that Singapore’s leaders learned lavishly from the successes of other countries (for example, foreign policy from Switzerland, vocational/technical education from Germany, the work ethics from Japan, etc.). While not adopting in toto, Singapore in fact learned from the institutions of these countries and subsequently improvised them in its own way. So, if Bangladesh wants to learn from the success story of Singapore or for that matter from any other country of SoutheastAsia in the field of education, it should not transfer the exact options followed by Singapore to Bangladesh. Instead, Bangladesh should try to emulate and adapt some features of the Singapore story, particularly in the field of education to suit its needs. However, even here education should not be seen in isolation. This has to be placed in the overall developmental context. Of course, this will require a group of honest, dedicated, and visionary political leaders and meritorious, motivated and patriotic administrators who would be willing to learn and then initiate policies which would benefit all citizens, and not only a few vested interest groups. Given this context, we can at least identify a few lessons which Bangladesh can learn from the success stories of Southeast Asia, particularly, in the field of education: 1. Bangladesh has already opted for a more outward-oriented development policy. However, nearly half of the population remaining below the poverty line is a major development challenge for the country.
© 2002 Institute of Southeast Asian Studies, Singapore
Implications of East Asian Education Policies for Bangladesh
61
Certainly, a g reater coverage of pr imary education can play an important role in both alleviating poverty and helping the country to move into a higher level of development. Bangladesh, in recent years, has been giving greater emphasis on primary education. Given the huge size of its population and the stupendous task of poverty reduction, it should continue to give more emphasis on primary education for both the high rate of return and equity considerations. Despite the danger of a budget crunch as a result of the global recession which is ravaging its Asian neighbours, Bangladesh should continue to invest heavily in primary education covering all the members of both sexes without any hesitation. Bangladesh is fortunate to have a number of very successful NGOs who too have directed their attention towards achieving universal primary education. The Government of Bangladesh should continue to support this strategic relationship with the nongovernment sector, if it really wants to pro gress towards achieving universal primary education. The top priority and goal must be to ensure that all children complete primary education and have attained minimum basic learning. This requires three things. First, the 10–15 per cent of eligible children not in school must be enrolled. Special programmes are also needed for the hard-to-reach r ural and urban poor . Secondly, student flow through the system and completion rates need to be increased.Thirdly, learning achievements on completion need to be substantially improved. Raising the quality is likely to be the key to achieving all three requirements; thus, quality improvements should have top priority. Improving the quality will require ad ditional investments in teacher incentive programmes, pedagogical inputs, learning assessments, and so forth.The share of primary education in the revenue and development budget should also not be allowed to decline, as has happened in recent years. These investments in raising quality could potentially result in r esource savings substantially lar ger than their original investment costs. In extending the co verage and ef fectiveness of non-formal education, equity reasons also compel greater investments in those bypassed by the formal system. These pertain to the segments of the population most in need of new skills and empowerment. Investments to extend and improve basic education through non-formal means should therefore have a high pr iority claim on r esources. However, additional investments for g reater coverage will not suf fice, as the effectiveness of learning needs to be sharply increased first. In addition, training programmes for the informal sector — based on models developed by NGO training institutions — should have priority. They should include training for self-employment and gainful income, as well as for wage employment.
© 2002 Institute of Southeast Asian Studies, Singapore
62
Education for Development
Like Singapore, Bangladesh must pay greater attention to the quality of education given to the future citizens of the country. If needed, it should divert some resources from other sectors to invest in improving the inputs needed to make the schools an attractive place for the children. The rate of dropouts, which now runs at 50 to 70 per cent, must come down to a respecta ble level. The quality of teachers, the level of their salaries, the supply of softwares for improvement of the content of education should also receive significant attention. Money alone will probably not be enough to generate success in this area. The commitment of the political leadership, the parents, and above all the teachers will be vital in making a dent in the quality of primary education. The community monitoring of primary education should, therefore, be improved. 2. The secondary education system in Bangladesh has been performing most dismally. Given its aspiration to do better in export-led growth, this tier of education deserves far more attention than it is now getting. In recent times, enrolment of female students has increased, but the quality of education is still very poor. The idea of streaming practised in Singapore may prove useful for Bangladesh in order to avoid wastage of resources and young talents in this developing country. In fact, secondary education requires a significant reorientation of the curricula. First, the objectives and content of lower secondary education should be reformed as an extension of compulsory basic education. Secondly, a ne w purpose should be de veloped for Grades 9–12 to focus on the knowledge, skills, and attitudes needed by the majority of students who terminate at this level to lead productive lives. Thirdly, external examinations should be de-emphasized and reoriented to test more useful skills, such as problem-solving rather than rote memorization. In addition to relevance, a second important objective should be to equalize access and quality in the secondary system. Public expenditures need to achieve better results. Budget allocations for secondary education should be linked with performance incentives, such as school improvement plans and performance indicators. Moreover, the distortion of private expenditures through payments for out-of-school tuition needs to be stopped and channelled into more productive in-school investments. Expanding the coverage of lower secondary education is also a desirable medium-term objective from a social point of view. This needs to be achieved through the less costly non-government secondary schools. Making lower secondary education universal at the existing quality levels, while financially feasible, would not be adequate without increased investments to improve the quality.
© 2002 Institute of Southeast Asian Studies, Singapore
Implications of East Asian Education Policies for Bangladesh
63
3. The polytechnics in Bangladesh are no match to the successful model in Singapore. Marine engineers from Bangladesh are coming to Singapore in great numbers every year to study in its polytechnics. It would benefit Bangladesh to emulate the teaching technique of such institutions? The resources needed would probably be a constr aint. However, that should not deter Bangladesh from e xperimenting on one or two campuses at least. If there is a will there should be a way as well. Reforms in technical and vocational education training (TVET) and higher education are also important for achieving efficiency and equity. Development allocations to TVET institutions need to be increased for the rehabilitation of these institutions. This, however, should be done together with basic management reforms, including the decentralization of authority to make the institutions more flexible and market-oriented. Additional funding f or skills training can be channelled for delivery through NGOs for better effectiveness. In higher education, the government needs to be very selective in development allocations to the public universities. Basic reforms are also needed in key institutions, such as the University Grants Commission (UGC) and the National University, especially in the internal governance and management of public universities. High priority should be given to lifting the hermitic public control over the expansion of private universities. Politically feasible ways should be sought to achieve greater cost recovery from the beneficiaries. 4. University education in Bangladesh is beset by not only academic but also a host of non-academic problems. The indulgence of the students in party politics, campus violence, and teachers getting involved in partisan politics are indeed crippling whatever is left of higher education in Bangladesh. While Singapore has a high-powered evaluation team to pick scholars from Harvard and MIT (Massachusetts Institute of Technology) to monitor the progress of its university, placing students on attachments with successful multinational companies all around the world, and encouraging technopreneurship projects on its campuses, the universities in Bangladesh are indeed not even thinking in terms of regaining their old glor y. They are f ar from g aining access to information technologies (except through some individual initiatives) and do not relate educa tion to the needs of the society . Bangladesh can indeed learn much from the commitment of Singapore’s university in terms of involving high quality teachers, low pupil-teacher ratio, and hence high level of contact through tutorials and laboratory guidance, and the thirst for higher level technological and advanced knowledge. A number of private enterprises are involved in encouraging research in places of higher education in Singapore, which can also be
© 2002 Institute of Southeast Asian Studies, Singapore
64
Education for Development
emulated by Bangladesh. The contribution of the pr ivate sector has been substantial in tertiar y education in Southeast Asia. Bangladesh could learn some useful lessons from this as well. To establish a more ef fective system of g overnance and management of higher education, the powers of the UGC must be strengthened. This includes accreditation of sub-units within universities, adopting normative financing, reviewing and modernizing university statutes to introduce outside representation on governing bodies, and strengthening the management role of the vice-chancellor. The system of degree colleges should be rationalized through stricter accreditation by the na tional university, by linking financing with performance, providing financial incentives for improvements, and reforming examination systems. Non-public resources should be mobilized to overcome chronic under-funding of higher education.There should also be better financial management of existing resources (such as increased tuition charges in parallel with loan funds, scholarships, and investment in better learning conditions). Public expenditures can be made more efficiently through the adoption of per student (normative) financing and linking subsidies to performance. The provision of private higher education should be encourged by easing the restricti ve regulatory framework on private higher education. Investment should also be made in new teaching technologies, including information technology, to improve linkages with world knowledge generation and application. 5. Besides formal aspects of education, Singapore has been trying hard to instill in the minds of young students about the problems associated with the smallness of the nation, the vulnerabilities arising out of the lack of natural resources, its multi-ethnic society, and the demand for competitiveness in the age of globalization. Focusing on “learning to think and thinking to learn” to become more creative and to attain the traits of good citizenship to face the challenge of the next millennium can be a source of immense inspiration for any country. Bangladesh is also multiracial, and vulnerable to natural disasters and political instability. The educational lessons of Singapore can surely be emulated even in Bangladesh if it really wants to get out of its present status of “least developed country”. 6. The emphasis given by Singapore in restructuring education and training to use information technology to mould the society to take advantage of electronic business and maintain a competitive edge can be a great source of learning for Bangladesh despite its low material base. Bangladesh need not stay condemned in a low level technological trap in this fast-changing global scenario and should take the cue from Singapore to attain global standards in at least some areas of business
© 2002 Institute of Southeast Asian Studies, Singapore
Implications of East Asian Education Policies for Bangladesh
65
and industrialization. Some young entrepreneurs in Bangladesh have already invested their time and energy in the knowledge industry. The youths in general are interested in getting into the IT mode.The progress so far in terms of access to the Internet, and computers, by youths in Bangladesh is encouraging. Ho wever, policy-makers need to move faster to equip educational institutions for providing a greater level of IT-based education. They should also try to impr ove telecommunications facilities, provide a stronger regulatory framework, and subsidized access to information technology for teachers, researchers, and students. 7. Singapore could move towards such a direction in education because of its sustained economic gr owth over decades. Thus, Bangladesh should also try to attain the fundamentals which could help it to achieve such a growth process if it really wants to emulate the successful features of educational attainment in Singa pore. The overall policy thrust is consistent with Southeast Asian development strategy. However, the institutional context varies widely between the two. The willingness to move fast in niche areas of development is also lacking in Bangladesh. It therefore needs to strengthen its institutional context first. Otherwise, there is no guarantee that a partial success in some areas like education can help sustain the momentum of the growth process. The sad experience of Indonesia should really remind us all about the sudden change in gear if institutions are not well-developed. Even the higher level of primary education and lower poverty figures achieved over the years have been slipping backwards because of the political and economic crises in Indonesia. Thus, the issue of governance is very important. Unfortunately, there has not been much c hange in the polic y response by the government. In recent years, the government has been putting more emphasis on universal primary education, but the budgeting reality does not always match policy utterances. A sizeable proportion of the de velopment allocated to each year’ s Annual Development Programme (ADP) for primary education remains unspent while tha t for higher education is usuall y overspent. The quality of secondary education is so poor that it neither helps agriculture nor industry with the supply of productive workers. The performance of higher education is also dismal. The presence of a bout 100,000 Bangladeshi students pursuing higher education in the neighbouring country is a glaring example of “educational disaster” for Bangladesh. The perpetual violence in the educational institutions, the failure of the educational authorities to complete the sessions in time, and the poor quality of manpower coming out of the universities are some manifestations of the failure of higher education. Yet technical higher
© 2002 Institute of Southeast Asian Studies, Singapore
66
Education for Development
education is doing quite well, both in terms of quantity and quality . This means that if a sincer e effort is made, Bangladesh can face the challenges of the educational crisis. It can adopt once again the spirit of the Quadrat-e-khuda commission report which set down the people’s aspirations for universal primary education and more appropriate higher education, as enshrined in the country’s constitution. Here, a reminder of some specific recommendations for the education system in Bangladesh can be helpful. Increased Public Expenditure An absolute increase in public expenditure in recent years has been notable. However, the limited progress can be attributed to, inter alia, the lack of increase in per pupil expenditure as a percentage of GDP per capita. It will be a significant step to increase the per pupil expenditure for the promotion of basic and continuing education, which is necessary for the development of human resources in the country. Such a policy decision is a demand of the time. The existing allocation of 2.1 per cent of GDP will not generate the resources required to achieve all of these priorities. Allocations for education need to be increased to about 3 per cent of GDP by 2003 and 4 per cent of GDP by 2008. Allocating a greater share of the incremental re venues from GDP growth to education would help achieve the targeted share by 2008. Discouraging Child Labour Parental poverty or destitution for any reason push children into engagement in labour instead of attending school. This is also a str ong reason for early dropout. Attempts should be made to attract the poor and destitute children to attend school, with necessary assistance to such children and discouragement of child labour. Local level school planning will be used as a technical measure in this regard. A long-term plan can be made attractive by offering opportunities for earning while continuing education in school. Social mobilization and advocacy should be strengthened against child labour and in favour of schooling for all. Ensuring Equitable Access to Quality Schooling There are number of areas in Bangladesh which remain under -schooled and unserved. To help ensure that equitable access to quality schooling is available to all children, establishment of new schools and classrooms will be targeted to under-schooled and unserved areas.
© 2002 Institute of Southeast Asian Studies, Singapore
Implications of East Asian Education Policies for Bangladesh
67
1. New schools should be established in underserved areas meeting certain criteria, such as: (a) no other school within 2 km, and (b) a minimum of 150 students and a minimum population of 2,000. Exceptions are to be made where natural barriers or high population density exists. These criteria apply to new government and non-government primary schools and community — and NGO — managed feeder and other schools. 2. Classrooms, furniture, toilets, and tube-wells should be added to or repaired at government and registered non-government schools, and a community-based school management programme should be introduced. 3. An expansion of facilities and hiring of additional teachers as well as deployment of all teachers should be appropriately targeted to ensure that no segment of the population is marginalized in terms of access to quality primary education. 4. Registration criteria for non-government primary schools should be adjusted over the next five years to ensure qualified teachers, accountability of performance, and ability to provide a minimum of five teachers. Registered non-government primary schools should receive subsidies for teacher salaries and supplementary needs. 5. Targeted programmes should pro vide resources, materials, and incentives to disadvantaged children to enrol in, remain, and complete their primary schooling. The School Attractiveness Programme and female teacher recruitment on the basis of female–male ratio of 60 : 40 should continue to ad dress the gender balance . The poorest 25 per cent of students should recei ve free stationery. The ongoing Food for Education subsidy aimed at increasing enrolments and attendance of children from the poorest families should continue, subject to other alternatives to meet the same educational needs. The state alone cannot meet this challenge, which is indeed fundamental to the existence of the nation. The whole society has to be involved in bringing back some order to education. Unless education is restructured, no amount of efforts can change the disor ganized and corrupted political culture . Once morality is re-established in education, it will ha ve snowball effects on all other spheres of society inc luding the economy. The world is changing fast. Unless a well-defined plan is put in place, the country will probably be sidelined by others.
© 2002 Institute of Southeast Asian Studies, Singapore
This document is reproduced from Education for Development: Lessons from East Asia for Bangladesh , by Atiur Rahman (Singapore: Institute of Southeast Asian Studies, 2002). This version was obtained electronically direct from the publisher on condition that copyright is not infringed. No part of this publication may be reproduced, translated, stored in a retrieval system, or transmitted in any form or by any means, electronic, mechanical, photocopying, recording or otherwise, without the prior permission of the Institute of Southeast Asian Studies < http://www.iseas.edu.sg/pub.html >
68
5
Education for Development
Conclusion
This study has clearly identified a number of areas where education plays positive roles, favouring economic growth in particular (for example, through raising cognitive skills, productivity, reducing income inequality , raising consciousness about better healthcare, ensuring sustainable environment, and enhancing technological innovations) and development in general (through changing mindsets, greater social cohesion, and greater citizenship in addition to providing creative options) for impro ving a nation’s material well-being. East Asia, including most countries of Southeast Asia, has been a ble to appreciate the virtuous role of education in development and thus has not only spent more but also more judiciously on education.As a common pattern, they first spent more on primary education, then on secondary and higher education. The education at all levels has been provided to augment material conditions, which are so vital for economic de velopment. After the initial success in expanding primary education, the countries are now moving towards better quality secondary and higher education. Among the East Asian countries, Japan w as no doubt the pioneer in achieving universal coverage of primary education. South Korea followed Japan. Others then started to follow the same pattern. Singapore has perhaps been most successful in achieving high expansion of quality education, both at the primary and secondary levels, without having problems of mismatch between the supply of and demand for education. An interventionist government read well the signals of the market and developed an education geared to the needs of the econom y and society. It is now moving gradually into a knowledge-based economy and reshaping its educational system accordingly. Not all other Southeast Asian countries have been able to plan and implement their educational development like Singapore. For example, the quality of secondary and higher education in Thailand has already fallen far short of the requirement of its more technology-based industrialization.
© 2002 Institute of Southeast Asian Studies, Singapore
Conclusion
69
The recent economic crisis in Southeast Asia has further revealed a truth, that only a good educational base can withstand the pressure of anver-changing e global economy. Singapore has not been af fected badly because of its w elleducated leaders, technocrats, entrepreneurs, and workforce who are willing to learn and change when faced with an adverse situation. Even then, when it comes to the question of access to the high-tech service sectors, business and creative enterprises, the country has been found to be still lagging compared with many of the developed countries. It is, of course, moving fast to prepare itself to graduate into a developed country. However, it still needs to go miles in strengthening its educational base to cope with a changed world. Its decision not to put an axe on the educational budget even during this period of great economic crisis only shows its determination to move in the right direction to compete in the f irst world. This “can do” spir it is seriously injected in the young minds of Sing apore’s educational system. Bangladesh can lear n substantially from this positive attitude of Singapore. In a report which was placed at the annual World Economic Forum, in Davos, Switzerland pointed out that the greatest long-term challenges toAsia lay not in the arena of ifnance or macroeconomy, but involve the need for better “social softw are such as quality of education, the overhaul of public institutions, the enhancement of science and technology and increasing democratization of political structures” (as quoted in the Sunday Times, 31 January 1999). Judged by these imperatives, for an early recovery from the Asian crisis, quality education appears to be the best bet. Singapore has apparently been betting on this judiciously. Bangladesh, though not caught up in the financial “hurricane” which has been ravaging Southeast Asia, is not doing significantly well in terms of poverty reduction and improving the living standards of the millions. It can surely learn some lessons by in vesting in the people as did some of the East Asian countries in its early phase of development. Bangladesh has no option but to become a learning society and use technological means if it really wants its vast number of people to become an asset rather than a liability in this globalized set-up. Bangladesh cannot af ford to delink itself from the global economic system but yet will have to participate judiciously, keeping in mind the relative strengths and weaknesses of its institutions. Education is one of its very weak sectors. It must concentrate on this sector if it really wants to participate in the global economy. Currently, it is far from this scenario. Bangladesh has to change its mindset and be prepared to change itself into a mode which is conducive to sustainable development. Bangladesh, however, has already shattered several development myths with its sheer resilience and creative skills. Its pioneering role in innovating a successful micro-credit system ( a la Grameen Bank), empowerment of poor women, providing non-formal education to school dropouts, near 100 per cent immunization of children, reduction in fertility and infant mortality, spectacular success in the export of ready-made garments,
© 2002 Institute of Southeast Asian Studies, Singapore
70
Education for Development
flourishing NGOs and civil society despite continuous political instability, and inability of the political leadership to come to a consensus on some broad national issues, only speak about the unrealized potentials of Bangladesh.The way that Bangladesh coped with the most devastating “flood of the century” in 1998, mainly with the whole-hearted co-operation and solidarity of the people from all walks of life, speaks eloquently of the wealth of the nation stored in terms of social capital which can be a valuable resource for the realization of its potentials, which have remained thwarted for a long time. Education, both formal and informal, can indeed play a very important role in arousing the dormant social capital in the people if it can be well strategized. Bangladesh has to invest more vigorously in its creative people and expand education along the lines already indicated ear lier. This will help to o vercome the r ural–urban and income dif ferences in Bangladesh. The urban households earned 150 per cent more in 1997 compared with their rural counterparts. Alam (2000) explains that the income differences between the households is due not only to the household ownership of asset configurations and human capital of the family members but also the location of the households. Though both urban and rural households definitely benefit from public investments in physical and social infrastructures, including schools, colleges, and so forth, it can surely learn from some of the successful educational experiences of Southeast Asia although it should ne ver try to replicate them in toto. It should rather try to study the education systems that have worked so well in SoutheastAsia and then develop an educational strategy which would meet the needs of Bangladesh society.Indeed, the education which Bangladesh should try to promote should not be something detached from life.10 The most important lesson for Bangladesh from Asia as a whole should really be in the area of basic education. “Liberal investment in basic education marks the most critical difference between South and EastAsia” (Haq 1997, p. 67). One part of Asia can learn from the other if it is pr epared to undertake significant reforms of its policy framework by laying strong foundations for growth, which can only be promoted through an educational system which is flexible and relevant in technological, social, and environmental terms. At the end of the day, Bangladesh should have its own educational policy within the context of its sustainable human development agenda.
© 2002 Institute of Southeast Asian Studies, Singapore
Appendix
71
Appendix
TABLE A1 Poverty Incidence by Educational Level of Household Heads, in Rural and Urban Bangladesh, 1995–97 Headcount Ratio of Poverty Incidence (percentage of households)
Educational Level (schooling years) of Household Heads
0 (Zero) 1 (One to five) 2 (Six to nine) 3 (Ten and above)
(i) Rural Areas
(ii) Urban Areas
(a) Dec. ’95 N = 3300
(b) April ’96 N = 3300
(c) April ’97 N = 3300
(d) Dec. ’95 N = 3300
(e) April ’96 N = 3300
(f) April ’97 N = 3300
54.6 (48.1) 41.2 (34.6) 27.4 (12.1) 13.8 (5.2)
57.8 (48.0) 43.8 (34.3) 31.4 (12.2) 17.2 (5.5)
56.8 (45.6) 42.2 (35.7) 30.0 (13.1) 18.8 (5.6)
71.7 (28.5) 54.5 (28.9) 40.8 (20.0) 11.5 (22.6)
75.3 (26.3) 63.0 (28.8) 41.8 (20.9) 14.5 (24.0)
77.8 (25.9) 57.2 (28.6) 35.0 (20.3) 13.8 (25.2)
NOTE: Figures in parentheses give percentage of sample households in each (schooling years of household head) SOURCES: Bangladesh Bureau of Statistics (BBS), Rural Poverty Monitoring Survey, (Dhaka, April 1997; No vember, 1998); BBS , Urban Poverty Monitoring Survey (Dhaka, April 1997; December 1998).
© 2002 Institute of Southeast Asian Studies, Singapore
72
Education for Development
TABLE A2 Monthly Per Capita Income of Poor and Well-off Households by Education of Household Head in Bangladesh, April 1997 (Figures in current taka) Monthly Per Capita Income Educational Level (schooling years) of Household Heads 0 1 2 3 4
(Zero) (One to five) (Six to nine) (Ten and above) (Average)
In Rural Areas
In Urban Areas
(a) Poor N = 1495
(b) Well-off N = 1805
(a) Poor N = 505
(b) Well-off N = 695
382 438 381 618 402
852 849 1332 1419 1001
485 546 623 655 539
1020 1373 2461 3094 2489
NOTE: N gives number of sample households. SOURCES: BBS, Rural Poverty Monitoring Survey (Dhaka, April 1997; November, 1998); BBS, Urban Poverty Monitoring Survey (Dhaka, April 1997; December 1998).
© 2002 Institute of Southeast Asian Studies, Singapore
Appendix
73
TABLE A3 Growth Regressions Dependent Variable Number of Observations Constant
(1) Basic Regression
(2) Gender-Specific Enrolment
98
108
(3) Manufactured Exports 100
0.0302
0.0137
0.0202
–0.0075 (–6.25)
–0.0056 (–4.000)
–0.0069 (–5.135)
Secondary School Enrolment Rate, 1960
0.0305 (3.861)
0.0357 (2.705)
0.0262 (1.723)
Primary School Enrolment Rate, 1960
0.0250 (4.464)
Per Capita GDP, 1960 (thousands of 1980 dollars)
0.0271 (4.532)
Female Primary School Enrolment Rate, 1960
0.0138 (1.340)
Male Primary School Enrolment Rate, 1960
0.0131 (1.159)
Ratio of Manufactured Exports to GDP, 1995
0.0007 (1.539)
Secondary School Enrolment-Export Interaction, 1960*
0.0005 (0.324)
R2
0.56
0.41
0.57
NOTE: The first column presents Barro’ s (1991) results. The other columns present results from Birdsall, Ross, and Sabot (1995a, 1995b). T-statistics in parentheses. *Ratio of manufactured exports to GDP multiplied by 1960 secondary school enrolment rate. SOURCE: Birdsall et al. (1997a), p. 127, Appendix Table 4.A.
© 2002 Institute of Southeast Asian Studies, Singapore
74
Education for Development
TABLE A4 Education and Productivity: Empirical Studies in Selected Countries Study
Database
Results
Patrick and Kehrberg (1973)
Five agricultural regions in Brazil in 1969, individual farmers
Education has a positive and significant effect. Value added in agriculture in modernizing areas, but not in traditional and already modern areas.
Pachico and Ashby (1976)
Four agricultural regions in Brazil in 1970, individual farmers
Additional productivity associated with more education much higher in the two modernizing zones, where additional, non-educational inputs are available.
Lockheed, Jamison, and Lau (1980)
Survey of 18 studies, meta-analysis
A farmer with four years of education had an average productivity of 8.7 per cent higher than one with no education. With complementary inputs, return was higher (13 per cent)
Jamison and Lau (1982)
Survey data on types of farms, education of farmer, physical inputs, and outputs in Korea, Malaysia, and Thailand
Effect of education on output is positive, significant, and quantitatively important.
Jamison and Data on prices of farm inputs Moock (1984) and outputs in Thailand
No significant effect of education on prices farmers receive for output or paid for inputs.
Jamison and Survey of 683 rural Moock (1984) households in two of Nepal’s 75 districts
Significant effect of education on farmer efficiency only in wheat production. Ability and family background controlled for.
Fuller (1970)
Survey of workers in two electrical machinery factories in Bangalore, India, 1970.
In-plant vocational training yields higher productivity increases than institutional vocational education.
Berry (1980)
Survey of productivity studies Results of such studies are inconclusive. on urban workers.
Min (1987)
Survey of workers in Beijing, China, factory.
SOURCE: Haddad (1990), p. 5, Table 1. © 2002 Institute of Southeast Asian Studies, Singapore
Workers with vocational education have 7 per cent higher productivity than workers with academic education. More years of education not significant.
Appendix
75
TABLE A5 Education and Poverty in South Asia Percentage of Households Bangladesh (Rural, 1995/96)
Incidence of Poverty (Percentage)
Share of the Poor (Percentage)
Level of Education of Household Head’s Spouse Illiterate Below primary Primary graduate Below secondary Secondary graduate HSC passed Graduate & above
64.1 51.6 45.6 30.2 20.0 11.6 9.5
57.3 21.4 10.1 8.7 1.8 0.4 0.3
Literacy Level of Household Head Cannot read Can read Cannot write Can write
59.7 34.9 59.3 34.3
75.3 24.1 77.1 22.9
Level of Education of Household Head’s Spouse Illiterate Below primary Primary graduate Below secondary Secondary graduate HSC passed Graduate & above
58.5 48.31 36.1 18.0 10.6 n.a. n.a.
82.0 9.6 6.8 2.4 0.2 n.a. n.a.
India (Rural, 1994)
Percentage Distribution of Households
Population below Poverty Line (measured by Headcount Ratio)
Sen Index of Poverty
Non-literate Female literate Male literate Both literate
29.7 3.1 32.2 35.1
45 43 39 27
0.2 0.2 0.2 0.1
© 2002 Institute of Southeast Asian Studies, Singapore
76
Nepal (Rural, 1996) Education of Household Heads Illiterate No schooling but literate Primary Secondary High school Above high school
Education for Development
Proportion of Sample
Proportion of Poor in Sample
Proportion below Poverty Line
63.34 20.33 7.17 3.87 3.77 1.52
75.88 15.68 6.87 2.50 1.68 0.40
51 34 43 29 20 12
Pakistan (Rural, 1993/1994) Share of HH Education of Household Heads (%) No formal education KG, Nursery Primary Middle Matric Intermediate BA, BSc. MA, MSc, LLB, etc.
70.9 2.5 12.8 5.3 5.1 1.7 1.2 0.4
Headcount Ratio
Income Gap Ratio
28.3 24.3 22.0 18.9 13.0 9.3 11.1 0.0
18.2 14.6 17.5 15.9 12.4 15.8 18.0 0.0
SOURCE: Sen and Rahman (1998), Annex Tables 13–16.
© 2002 Institute of Southeast Asian Studies, Singapore
Appendix
77
TABLE A6 Education Index and Expenditures vs. Selected Health Indexes
Country
Singapore Hong Kong, China Thailand Malaysia Sri Lanka Maldives Indonesia China Vietnam Myanmar Pakistan India Bangladesh Nepal Bhutan Korea, Rep. of
Public Expenditure Education on Index Education (as % of GNP) 1995 0.83 0.84 0.81 0.76 0.83 0.86 0.77 0.76 0.81 0.71 0.39 0.53 0.38 0.37 0.39 0.93
3.0 2.8 4.2 5.3 3.1 8.4 — 2.3 2.7 1.3 — 3.5 2.3 2.9 — 3.7
Under-five Maternal Life Daily per Mortality Mortality Expectancy Capita Rate (per Rate (per at Supply 1,000 live 100,000 live Birth of births) births) (years) Calories 1996 1990 1995 1995 4 — 38 13 19 76 71 47 44 150 136 111 112 116 127 7
10 7 200 80 140 — 650 95 160 580 340 570 850 1500 1600 130
77.1 79.0 69.5 71.4 72.5 63.3 64.0 69.2 66.4 58.9 62.8 61.6 56.9 55.9 52.0 71.7
SOURCE: UNDP (1998), pp. 156, 157, 162, 163, 128, 129, 130, 160, 161.
© 2002 Institute of Southeast Asian Studies, Singapore
— 3187 2247 2765 2302 2211 2699 2708 2438 2728 2471 2382 2001 2367 — 3159
© 2002 Institute of Southeast Asian Studies, Singapore
0.84 0.83 0.93 0.81 0.76 0.83 0.86 0.77 0.76 0.81 0.71 0.39 0.53 0.38 0.37 0.39
Country
Hong Kong, China Singapore Korea, Rep. Of Thailand Malaysia Sri Lanka Maldives Indonesia China Vietnam Myanmar Pakistan India Bangladesh Nepal Bhutan
— 6.5 — 11.9 — 20.6 — 20.2 17.1 26.1 27.5 46.0 35.9 46.5 — 44.9 2 2 4 10 5 6 13 13 7 11 19 15 16 21 22 28
Human People not expected Poverty Index to survive to (HPI-1) value age 40 (as % of (%) total population) 1995 1995 — 0 7 11 22 43 4 38 33 57 40 26 19 3 37 42
Safe Water (%) 1990–96 — 0a 0 10a — 7a — 7 12 10 40 45a 15 55 — 35a
Health Services (%) 1990–95 — — 0 4 6 37 34 49 76 79 57 53 71 52 82 30
Sanitation (%) 1990–96
Population without Access to
— 14a — 26a 23 38 39 34 16 45 31 38 53 56 47 38a
0 — 0 — 6 2 7 10 8 — — — 38 — 48 18
Under-weight Children Not Children Under Reaching Age Five Grade 5 (%) (%) 1990–97 1995
NOTE: a Data refer to a year or period other than that specified in the column heading, differ from the standard definition, or refer to only part of the country. SOURCE: UNDP (1998), pp. 146–47, 138.
Education Index
TABLE A7 Education and Health Features 78 Education for Development
Appendix
79
TABLE A8 Adult Literacy vs. Some Demographic Indexes of Selected Countries of Asia
Country
Adult Literacy Rate (%) 1995
Hong Kong Singapore Korea, Rep. of Thailand Malaysia Sri Lanka Maldives Indonesia China Vietnam Myanmar Pakistan India Bangladesh Nepal Bhutan
92 91 98 94 84 90 93 84 82 94 83 38 52 38 28 42
Total Annual Family Population Fertility Growth Rate Rate 1970–95 1995 1.8 1.9 1.4 2.0 2.5 1.5 3.0 2.0 1.6 2.2 2.1 3.0 2.1 2.3 2.6 2.1
Contraceptive Prevalence Rate, any method (%) 1990–95
1.3 1.8 1.7 1.8 3.4 2.2 6.8 2.8 1.9 3.2 3.5 5.3 3.2 3.3 5.2 5.9
SOURCE: UNDP (1998), pp. 176, 177, 148, 149.
© 2002 Institute of Southeast Asian Studies, Singapore
86 74 79 74 48 66 — 55 83 65 17 18 41 49 29 —
Population Doubling Dependency Date Ratio (at current (%) growth rate 1995 1995) 2081 2041 2075 2086 2029 2066 2015 2042 2072 2034 2033 2020 2038 2037 2022 2020
41.5 40.2 40.7 49.0 72.0 55.5 100.8 59.4 48.0 72.0 66.1 84.4 65.5 81.3 87.6 84.5
80
Education for Development
TABLE A9 Rates of Return to Education by Gender Country
Year
Educational Level
Men
Women
Australia Austria Colombia
1976 1981 1973
Costa Rica France
1974 1969
University All All-urban -rural All Secondary University Secondary University All All Secondary University All University University Primary Secondary, Gen Secondary, Tech University Secondary University All All All All Primary Secondary University Primary All All
21.1 10.3 18.1 10.3 14.7 13.9 22.5 14.8 20.0 13.1 13.6 10.0 8.0 4.7 6.9 5.7
21.2 13.5 20.8 20.1 14.7 15.9 13.8 16.2 12.7 11.2 11.7 8.0 12.0 4.5 6.9 5.8 12.0 8.0 8.5 15.5 16.9 22.9 1.7 5.0 7.9 8.4 18.4 40.8 9.0 16.1 13.0 13.5
1976 Germany Great Britain Greece Japan
1974 1977 1971
Peru
1977 1976 1980 1985
South Korea
1971
Sri Lanka Portugal Puerto Rico
1976 1980 1981 1977 1959
Taiwan Thailand Venezuela
1982 1971 1984
13.7 15.7 10.3 17.2 6.9 7.5 29.5 27.3 21.9 8.4 9.1 9.9
SOURCE: Haddad et al. (1990), based on Psacharopoulos, “Returns to Education: A Further International Update and Implications”, Journal of Human Resources 20, no. 4 (1985).
© 2002 Institute of Southeast Asian Studies, Singapore
Appendix
81
TABLE A10 Education, Mortality, Nutrition, and Fertility: Selected Empirical Studies in Developing Countries Study
Database
Results
Arriaga and Davis (1969)
Secondary data Prior to 1930, mortality decline was closely related to on Latin American improvements in living standards rather than medical mortality rates breakthroughs.
Cochrane et al. (1980)
Secondary data on mortality rates, by country
Literacy seems to be the most important variable explaining life expectancy, even higher than the number of physicians per capita. One additional year of a mother’s schooling results in a reduction of 9 per thousand in infant mortality. The effect of a husband’s education is about one-half of the wife’s.
Cochrane (1979)
Review of existing studies
Increased education tends to decrease fertility. The greater decrease in fertility can be related to two factors: a) education of women; and b) urbanization itself raising consciousness among eligible couples. But education is likely to increase fertility in countries with the lowest level of female literacy up to completed primary schooling. In societies with higher levels of female literacy, education lowers the demand for children by altering perceived costs and benefits.
United Nations (1983)
Data from the world fertility survey of 22 developing countries
Confirms negative influence of women’s (and husbands’) education upon marital fertility, desired family size in 20 out of 22 countries. But levels of national development and level of family planning programme efforts enhance or mitigate the strength of the education–fertility relationship. Differential fertility by education is highest in the countries with the highest levels of development. The negative relationship between education and fertility is stronger in urban areas than rural. Ethnic or regional differences in the education–fertility relationship are not of primary importance.
Zachariah & Patel (1984)
Fertility decline in India, 1961–81
Although family planning practice can account for 90 per cent of fertility decline, family planning input variables – manpower, budget, etc. – were much less important than socio-economic factors, such as female education and children’s health in explaining the practice of family planning.
Fertility Survey of Individuals in Thailand (1977) Thailand
For all women married less than 20 years, education is uniformly inversely related to fertility.
Cravioro & Delicardi (1975)
Survey in Southwestern Mexico
No significant difference in parental education between well-nourished and malnourished children.
Christiansen, et al. (1974)
Bogota, Colombia
Significant positive association between parental education and children’s nutrition.
Gans (1963)
Lagos, Nigeria
Children’s weight of literate mothers was greater than illiterate mothers.
Graves (1978)
Kathmandu, Nepal
Mothers with no schooling had more malnourished children than those with schooling.
Levinson (1974)
Rural Punjab, India
Literate mothers had smaller percentage of third-degree malnourished children.
SOURCE: Haddad (1990), Table 8, pp. 16–17. © 2002 Institute of Southeast Asian Studies, Singapore
© 2002 Institute of Southeast Asian Studies, Singapore
0.84 0.83 0.93 0.81 0.76 0.83 0.86 0.77 0.76 0.81 0.71 0.39 0.53 0.38 0.37 0.39
668 601 1024 189 432 206 118 149 185 106 89 92 81 47 36 17
Radios (per 1,000 people) 1995
SOURCE: UNDP (1998), p. 128–30, 166–67.
Hong Kong, China Singapore Korea, Rep. Of Thailand Malaysia Sri Lanka Maldives Indonesia China Vietnam Myanmar Pakistan India Bangladesh Nepal Bhutan
Country
Education Index 359 362 321 227 231 66 40 147 247 163 76 22 61 7 3 —
Television (per 1,000 people) 1995 — 24.2 7.7 7.3 12.4 23.0 — 5.4 — — — 11.5 17.6 — — 5.5
Post Offices (per 100,000 people) 1991 533 479 415 59 166 11 57 17 34 11 4 16 13 2 4 9
Main Telephone Line (per 1,000 people) 1995 46.3 — — — — — 14.3 0.4 0.2 0.2 — 1.2 — (.) — —
Fax Machines (per 1,000 people) 1995 48.5 30.1 6.5 0.7 2.0 (.) — 0.1 (.) — — (.) (.) — (.) —
Internet Users (per 1,000 people) 1995
TABLE A11 Education Index vs. Access to Information and Communications of Some Selected Countries
130.0 180.8 108.3 13.6 37.3 1.1 12.3 3.8 2.1 0.4 — 1.2 1.2 — — —
Personal Computers (per 1,000 people) 1995
82 Education for Development
© 2002 Institute of Southeast Asian Studies, Singapore
** 88 77 88
— 21 50 26 41 57 24 93 80 73
60
Japan Korea, Rep. Singapore Taipei, China
Bangladesh China Hong Kong India Indonesia Malaysia Pakistan Philippines Sri Lanka Thailand
“Asia Mean”
76
— 58 ** 42 60 74 33 91 95 83
** 96 ** 97
60
85
52 85 ** 73 74 87 40 ** 90 83
** ** ** **
70
91
58 ** ** 83 ** 93 39 ** ** 99
** ** ** **
80
Primary School (%)
94
79 ** ** ** ** 93 48 ** ** 97
** ** ** **
92
14
— 5 13 4 2 5 10 23 20 6
66 16 7 11
50
24
— 18 30 10 6 17 11 26 27 12
79 27 32 29
60
36
— 24 46 26 16 30 13 46 47 17
90 41 46 52
70
51
17 46 64 30 29 48 14 64 70 29
93 78 58 77
80
Secondary (%)
NOTE: ** 100 per cent and over; # below 1 per cent SOURCE: Mingat (1995), Table 3 (based on UNESCO Yearbook).
50
Years 19..
Countries
62
20 54 — 49 43 60 22 76 86 36
98 90 70 88
92
2
— # 1 1 # # 1 10 1 2
6 1 2 1
50
4
— # 4 2 1 1 2 12 1 2
9 4 6 4
60
6
2 # 7 4 2 2 3 20 1 2
17 8 7 7
70 92 46 42 22 21 4 2 20 9 10 8 3 27 9 19 14
80 31 16 8 10 4 1 11 6 3 4 3 26 3 13 9
Higher Education (%)
TABLE A12 Gross Enrolment Rates and Growth Ratios in Asian Countries (1950–92)
4.83
1.85 5.05 7.09 1.90 3.50 3.39 2.50 1.54 2.19 5.04
6.02 10.49 7.90 9.17
Growth Ratio 92/60
Appendix 83
84
Education for Development
TABLE A13 Internal Efficiency and Adjusted Enrolment Rates in Primary Education in Asian Countries
Countries
Proportion of Grade 1 Getting To Primary Grade 4 (%) Around 1980
Japan Korea, Rep. Singapore Taiwan Bangladesh China Hong Kong India Indonesia Malaysia Pakistan Philippines Sri Lanka Thailand “Asia Mean”
100 97 100 100 32 75 100 45 75 99 42 66 99 86 79.7
Around 1990 100 100 100 100 51 89 100 68 88 98 52 79 99 91 86.7
SOURCE: Mingat (1995), Table 4.
© 2002 Institute of Southeast Asian Studies, Singapore
Adjusted Primary Education Enrolment Rate (%) 1950 100 85 67 88 12 12 50 10 26 57 22 67 77 67 52.6
1960 100 93 87 96 17 32 95 17 38 74 31 65 91 76 65.8
Appendix
85
TABLE A14 Relation Between 1950/60 Educational Policy and Further Per Capita GDP Growth (dependent variable is the growth ratio 1960–92; mean 4.83, standard deviation 2.95) Model 1
Model 2
Model 3
Model 4
Model 5
Model 6
1960 Per-capita 0.0015 (1.8) 0.0010 (0.6) 0.0014 (1.6) 0.0008 (0.6) GDP Gross Enr. Rate Primary 50 –0.07 (2.7) Secondary 50 –0.09 (1.2) Higher 50 –0.55 (1.8) Primary 60 Secondary 60 Higher 60
–0.08 (2.2) –0.04 (0.4) –0.26 (0.9)
Adj. Enr. Rate Primary 50 Secondary 50 Higher 50
–0.06 (2.6) –0.10 (1.4) –0.36 (1.2)
Primary 60 Secondary 60 Higher 60 R2 (Adj R2)
–0.07 (2.9) –0.01 (0.3) –0.48 (1.6) –0.07 (2.2) –0.05 (0.4) –0.14 (0.5)
0.63 (0.47)
0.47 (0.24)
0.62 (0.46)
0.47 (0.23)
–0.07 (2.3) –0.01 (0.1) –0.15 (0.6) 0.51 (0.37)
0.45 (0.28)
NOTES: “Primary 50” means primary enrolment ratio (adjusted or not adjusted) for the year 1950; the t-statistics associated with each coef ficient are gi ven in parentheses; the obre of observation is 14. SOURCE: Mingat (1995), Table 5.
© 2002 Institute of Southeast Asian Studies, Singapore
© 2002 Institute of Southeast Asian Studies, Singapore
5–6 4–5 5–6 3–5
3–6 3–5 4–4 3–5
Philippines Malaysia Indonesia Thailand
China Laos Myanmar Vietnam
102 101 110 101a 130 88 115 94a 104 107 — 137a
CE
9 6 9 —
6 9 6 6
9 8 5 5 — — — —
37 — 12 —
0 6 — 1
%OA (1990)
u 183 — —
u u u —
— u u u
OOS (1990)
50 44 39 52
61 54 51 49
76 66 59 53
1980
GER
43 42 39 52
64 58 58 45
73 74 69 68
1990
— — — —
10.2 — — —
12.9 11.7 12 10.7
1980
All Levels e.sch.y
— — — —
10.5 — 9.7 —
13.3 13.3 — —
1990
NOTES: PP = Age group for pre-primary education CE =Years of compulsory education Ent = Apparent intake rate (%), that is, number of new entrants into first grade as a percentage of eligible age population %OA = Percentage overaged in Grade 1, that is, percentage of students enrolled in Grade 1, or first level, education who are above the official entrance age. OOS = Number of children out of school (in thousands) u = Universal primary education GER = Gross enrolment ratio (%) of children aged 6–23. e.sch.y = Expected number of years of formal education a Includes repeaters SOURCE: Koo (1999), Table 3.1 (based on UNESCO, World Education Report, 1993)
3–5 5 3–5 4–5
Japan Korea Hong Kong Singapore
PP
Ent (1990)
First Level
Access to Schooling
TABLE A15 Access to Schooling in East Asian Countries 86 Education for Development
© 2002 Institute of Southeast Asian Studies, Singapore
111 93 107 99
112 114 91 109
6 6 6 6
5 5 5 5
Philippines Malaysia Indonesia Thailand
China Laos Myanmar Vietnam
SOURCE: Koo (1999), Table 3.2.
101 110 107 108
6 6 6 6
1980
125 98 97 —
112 93 117 90
101 107 108 108
1990
Total
Japan Korea Hong Kong Singapore
No. of Years
121 123 93 111
112 93 115 100
101 109 108 109
1980
130 113 — —
113 93 119 92
101 105 — 110
1990
Male
Primary Level
103 104 89 106
110 92 100 97
101 111 106 106
1980
120 84 — —
111 93 114 88
101 109 — 107
1990
Female
3 3 4 4
— 3 3 3
3 3 5 4
1st
2 3 2 3
4 4 3 3
3 3 2 3
2nd
No. of Years
46 21 22 42
64 48 29 29
93 76 64 59
1980
48 22 24 —
73 56 45 33
97 87 75 70
1990
Total
54 25 — 44
59 50 35 30
92 81 63 57
1980
54 27 25 —
71 55 49 34
96 88 72 70
1990
Male
Secondary Level
TABLE A16 Primary and Secondary Level Education: Gross Enrolment Ratios
37 16 — 40
69 46 23 28
94 71 65 61
42 17 23 —
75 58 41 32
98 85 77 71
1980 1990
Female
Appendix 87
© 2002 Institute of Southeast Asian Studies, Singapore
1.2 0.4 4.7 2.1 1.7 1.2 4.8 —
24.4 7.2 9.2 15.7
28.7 37.7 — —
1990
1.8 0.6 — 3.4
22.1 5.2 5.3 —
40.4 21.3 14.0 9.1
1980
2.1 1.7 — —
— 7.4 — —
34.5 49.3 — —
1990
Male
0.6 0.3 — 0.9
26.3 3.1 2.4 —
20.3 7.5 6.3 6.3
1980
1.1 0.8 — —
— 6.8 — —
22.7 24.9 — —
1990
Female
34 28 — —
— 52 — 18
19 22 — —
1980
45 46 — —
21 41 — 36
35 31 — —
1990
Level 5
62 72 — —
— 44 — 79
78 72 — —
1980
50 54 — —
77 50 — 60
60 61 — —
1990
Level 6
% Students (1990)
4 — — —
— 4 — 3
3 5 — —
5 — — —
2 9 — 4
5 8 — —
1990
Level 7
NOTES: Stu-Inh = Number of students per 100,000 inhabitants % students (1980) = Percentage of students (and graduates) at ISCED level in 1990, and enrolment in higher education at each ISCED level as a percentage of total enrolment Level 5 = Education at the third level, first stage, of the type that leads to an award not equivalent to a first university degree Level 6 = Education at the third level, second stage, of the type that leads to a first university degree or equivalent Level 7 = Education at the third level, second stage, of the type that leads to a postgraduate degree or equivalent Stu = Student Grd = Graduate SOURCE: Koo (1999), Table 3.3
166 116 516 —
24.2 4.1 3.8 12.7
2,621 2,738 419 679 367 838 1,284 1,763
Philippines Malaysia Indonesia Thailand
117 44 478 214
30.5 14.7 10.4 7.8
2,065 2,328 1,698 3,899 1,201 — 963 —
Japan Korea Hong Kong Singapore
China Laos Myanmar Vietnam
1980
Total
1990
1980
Stu-Inh
Gross-Enrolment Ratio (GER)
TABLE A17 Third-Level Education: Enrolment Ratios and Distribution 88 Education for Development
46 82
45
% Private % Fees
% Priv. Fin.
© 2002 Institute of Southeast Asian Studies, Singapore
77 81
59
% Private % Fees
% Priv. Fin.
na
72 na
28 na
na
55 na
45 na
Korea
na
0 —
100 na
24
27 24
63 24
S’pore
na
63 na
37 na
na
40 na
60 na
Taiwan
62
77 82
23 10
42
44 80
56 19
Japan
59
75 72
25 36
69
59 88
41 58
Korea
na
0 —
100 na
10
27 10
63 10
S’pore
1980
62
68 100
32 16
44
47 92
53 10
Taiwan
64
77 83
23 15
40
42 77
58 17
Japan
64
81 75
19 34
43
61 58
38 29
Korea
75
0 —
100 25
4
32 4
68 4
S’pore
1993
47
70 69
30 14
45
51 91
49 6
Taiwan
NOTES: “% Public” (private) indicates the percentage of enrolment in public (private schools); “% Fees” indicates the percentage of financing for public or private schools via direct user fees; and “%Priv Fin.” indicates the overall percentage of the resources mobilized (in senior secondary and higher education) that are financed via direct user fees. SOURCE: Mingat (1995), Table 7, p. 19.
23 4
% Public % Fees
Higher Ed.
54 21
% Public % Fees
Senior Sec.
Japan
1970
TABLE A18 Share of Enrolment in Public and Private Schools, and Share of Fees in Expenditure in HPAEs Appendix 89
© 2002 Institute of Southeast Asian Studies, Singapore
2.9
2.8
1.7
“Asia Mean”
3.1
5.8 3.7 2.8 5.0 1.5 1.9 2.5 3.0 1.7 6.0 2.0 1.7 2.7 3.4
1980
3.8
4.9 4.4 5.4 7.0 2.3 1.7 3.1 3.9 2.2 5.5 2.7 3.0 3.3 3.6
1992
SOURCE: Mingat (1995), p. 33, Table 13 (based on UNESCO Yearbooks).
3.9 3.5 3.1 3.0 na 1.2 2.6 2.8 2.8 4.4 1.7 2.6 4.0 3.5
4.1 3.1 4.2 2.8 na 1.0 2.1 2.3 1.6 3.9 0.9 2.6 4.7 2.6
4.0 na na 2.6 na na 1.5 0.8 1.2 na 0.4 2.4 3.0 0.6
Japan Korea, Rep. Singapore Taiwan Bangladesh China Hong Kong India Indonesia Malaysia Pakistan Philippines Sri Lanka Thailand
1970
1960
1950
Share of Education in GDP (%)
Years
Countries
4.5
10.2 6.3 5.1 6.0 1.8 1.3 3.8 1.6 2.6 3.8 1.8 7.4 6.0 4.8
1950
6.0
11.1 7.5 8.2 7.7 2.3 3.8 8.0 2.7 4.0 5.5 2.3 7.5 7.4 5.8
1960
7.3
12.0 8.8 9.0 9.4 3.3 5.4 9.0 5.1 5.5 7.1 2.8 9.6 8.3 6.1
1970
8.6
12.8 11.3 9.8 11.0 3.9 7.3 10.3 5.9 7.9 8.6 2.8 10.9 10.3 8.2
1980
Average Duration of Studies (years)
TABLE A19 Share of Education in GDP (%) and Average Duration of Studies in Asian Countries (1950–92)
9.7
13.7 13.1 11.1 12.1 5.1 7.8 11.3 7.8 9.0 9.5 3.6 11.6 11.5 8.7
1992
90 Education for Development
Appendix
91
TABLE A20 Public Current Expenditure on Education % of CE in
% of CE (1990)
Emoluments
1980
Teaching Pre & Materials 1st
1990
2nd
3rd
Pre & 1st
2nd
3rd
Japan Korea Hong Kong Singapore
60.5a 61.2 — 85.9a
— 1.1 — 2.3
39.5 49.9 33.7 35.8
34.6 33.2 35.7 41.1
11.1 8.7 24.6 17.1
29.3 44.4 29.8 28.7
32.2 34.1 40.7 36.5
22.5 7.4 28.8 30.7
Philippines Malaysia Indonesia Thailand
72.0 64.4
0.5 4.8
77.1b 35.0
— 34.0
22.1 12.4
73.1b 37.9
— 37.7
15.1 14.9
China Laos Myanmar Vietnam
62.0
4.0
55.3
28.3
13.3
56.2
21.6
14.6
68.5a
5.8
27.6
34.3
20.0
32.7
34.4
16.6
—
—
—
—
—
85.6a
—
13.0
NOTE: a Emoluments of total number of personnel b Includes second-level education Pre & 1st = Pre-primary and first level CE = Total current expenditure PCGNP = Per capital GNP SOURCE: Koo (1999), Table 3.9
© 2002 Institute of Southeast Asian Studies, Singapore
© 2002 Institute of Southeast Asian Studies, Singapore
na 33 27 35 52 33 33 51 32 36
38
Bangladesh China Hong Kong India Indonesia Malaysia Pakistan Philippines Sri Lanka Thailand
“Asia Mean”
37
na na 30 29 39 29 39 36 31 36
35 58 33 44
36
46 33 33 41 29 31 41 29 na 35
26 57 30 41
34
54 27 30 43 32 27 36 30 31 23
25 48 31 33
80
31
64 22 28 48 23 20 41 34 29 18
20 33 26 26
92
24
na 26 16 23 21 16 26 26 na 20
26 30 27 28
50
24
na na 24 16 15 25 24 na na 20
24 37 29 26
60
22
na na 22 21 13 25 20 33 19 16
20 36 20 24
70
Secondary
23
24 18 29 na 15 22 17 34 26 21
19 39 19 20
80
SOURCE: Mingat (1995), Table 15 (based on various editions of UNESCO Yearbook).
37 57 28 47
Japan Korea, Rep. Singapore Taiwan
70
60
Years 19..
50
Primary Schooling
Countries
23
27 18 22 25 14 19 19 32 21 17
18 23 20 20
92
19
na na na 16 10 na na 22 25 33
27 30 na 10
50
17
na na 11 na na 9 26 27 13 15
23 24 16 11
60
17
16 4 15 20 12 15 34 23 8 8
27 19 12 23
70
17
19 5 12 15 10 10 34 29 9 14
24 28 10 20
80
Higher Education
TABLE A21 Pupil-Teacher Ratio in Primary and Secondary Schooling in Asian Countries
18
19 6 15 na 15 12 na na 16 14
23 28 na 17
92
92 Education for Development
© 2002 Institute of Southeast Asian Studies, Singapore
— 986 — —
925a 1,008a — 1,200a
858 825
—
— 204 — —
185 210 — 200
234 165
—
Japan Korea Hong Kong Singapore
Philippines Malaysia Indonesia Thailand
China Laos Myanmar Vietnam
—
— —
2 — 8 8
— — 4 7
1980
—
6 30
2 — 10 4
— — — —
1990
Repeaters
95b
96 —
87 100 97 100b
100 100 100b 100b
T
—
— —
87 99 — —
100 100 100b 100b
M
Grade 2
—
— —
87 100 — —
100 100 100b 100b
F
65b
89 —
79 98 88 91b
100 100 100b 100b
T
—
— —
79 98 — —
100 100 100b 100b
M
Grade 4
—
— —
79 98 — —
100 100 100b 100b
F
Percentage of Cohort Reaching
58
85 —
70 96 77 87b
100 99 97b 100b
T
—
— —
70 95 — —
100 99 96b 100b
M F
—
— —
70 96 — —
100 100 98b 100b
Final Grade
0.78b
0.86 —
0.84 0.97 0.78 0.95b
1.00 1.00 1.00b 1.00b
(1990)
COE
NOTES: a Length may vary from one region to another within a country, or from one grade to another within the first-level education. b Data on repeaters are missing so that the Apparent Cohort Method was used for estimating survival. T = Total; M = Male; F = Female COE = Coefficient of efficiency, that is, the ratio between the theoretical number of pupil-y ears that it w ould have taken the graduates to complete the cycle of education, had there been no repetition or dropout, and the number of pupil years actually spent by the cohort. COEs range from O (complete inefficiency) to 1 (maximum efficiency). SOURCE: Koo (1999), Table 3.13.
Hours
Days
Length of School Year (1990)
TABLE A22 First-Level Education: Internal Efficiency Appendix 93
94
Education for Development
TABLE A23 International Comparison of Overall Achievement of Students in School (Standardized deviation to the “international mean”) Achievement in School in Comparative Terms
Countries
Children aged 9–10 years
Children aged 13–15 years
“International Mean” “OECD Mean”
0.0 +0.30
0.0 +0.35
Japan Korea Singapore Taiwan
+0.8 +0.7 +0.2 +0.4
+0.7 +0.9 +0.3 +0.8
Brazil Canada France Indonesia Italy Nigeria Philippines Thailand
— +0.0 +0.3 –1.0 +0.4 –0.7 –0.4 —
–1.1 +0.2 –0.6 — +0.2 –1.0 –0.6 –0.2
SOURCE: Mingat (1995), Table 6, p. 16.
TABLE A24 Relation between Per Capita GDP (in 1992 US$) and Pupil-Teacher Ratio (secondary level) in Four East Asian High Performing Countries Per Capita GDP (1992 US$)
Pupil-teacher ratio (Secondary education)
650 1000 2000 4000 15000
32.5 29.7 29.0 25.0 20.0
SOURCE: Mingat (1995), p. 44.
© 2002 Institute of Southeast Asian Studies, Singapore
Appendix
95
TABLE A25 Adult Literacy vs. Some Demographic Indexes of the Selected Countries of Asia
Country
Hongkong Singapore Korea, Rep. of Thailand Malaysia Sri Lanka Maldives Indonesia China Vietnam Myanmar Pakistan India Bangladesh Nepal Butan
Adult Annual Literacy Population Rate (%) Growth Rate 1995 1970–95 92 91 98 94 84 90 93 84 82 94 83 38 52 38 28 42
1.8 1.9 1.4 2.0 2.5 1.5 3.0 2.0 1.6 2.2 2.1 3.0 2.1 2.3 2.6 2.1
Contraceptive Population Dependency Prevalence Rate Donating Date Ratio (%) any method (%) (at current 1995 1990–95 growth rate 1995) 1.3 1.8 1.7 1.8 3.4 2.2 6.8 2.8 1.9 3.2 3.5 5.3 3.2 3.3 5.2 5.9
86 74 79 74 48 66 — 55 83 65 17 18 41 49 29 —
SOURCE: UNDP (1988), pp. 176, 177, 148, 149.
© 2002 Institute of Southeast Asian Studies, Singapore
2081 2041 2075 2086 2029 2066 2015 2042 2072 2034 2033 2020 2038 2037 2022 2020
41.5 40.2 40.7 49.0 72.0 55.5 100.8 59.4 48.0 72.0 66.1 84.4 65.5 81.3 87.6 84.5
96
Education for Development
TABLE A26 Adult Female Literacy Rate vs. their Paid and Unpaid Acitvity Rates
Country
Adult Female Literacy Rate (%) 1995
Female Economic Activity Rate (as % of male rate) 1995
Female Unpaid Family Workers (as % of Total) 1995
Women’s Share of Adult Labour Force (%) aged 15 and above 1995
Singapore Korea, Rep. Of Thailand Malaysia Sri Lanka Maldives Indonesia China Vietnam Pakistan India Bangladesh Nepal Bhutan Myanmar Hong Kong
86.3 96.7 91.6 78.1 87.2 93.0 78.0 72.7 91.2 24.4 37.7 26.1 14.0 28.1 77.7 88.2
64 68 87 58 55 73 66 82 97 36 46 73 68 66 77 58
77 87 64 64 56 29 66 — — 33 — 6 55 — — 77
39 40 46 37 36 43 40 45 49 26 31 42 40 39 43 37
SOURCE: UNDP (1988), pp. 131, 132, 133, 154, 155, 164, 165.
© 2002 Institute of Southeast Asian Studies, Singapore
Appendix
97
TABLE A27 Education Index vs. Incidence of Environmental Hazards in Some Selected Countries Country
Education Index
Hong Kong, China Singapore Korea, Rep. of Thailand Malaysia Sri Lanka Maldives Indonesia China Vietnam Myanmar Pakistan India Bangladesh Nepal Bhutan
0.84 0.83 0.93 0.81 0.76 0.83 0.86 0.77 0.76 0.81 0.71 0.39 0.53 0.38 0.37 0.39
Annual Rate of CO2 Emissions Loss of Mangroves Deforestation Per Capita (%) 1980–90 1990–95 (metric tonnes) 1995 — 0 0.2 2.6 2.4 1.1 — 1.0 0.1 1.0 1.4 2.9 (—) 0.8 1.1 0.3
SOURCE: UNDP (1988), pp. 128, 129, 130, 180, 181.
© 2002 Institute of Southeast Asian Studies, Singapore
5.1 19.1 8.3 3.0 5.3 0.3 0.7 1.5 2.7 0.4 0.1 0.6 1.0 0.2 0.1 0.1
— 76 — 87 32 — — 45 — 62 58 78 85 73 0 0
98
Education for Development
TABLE A28 Trends in Human Development and Per Capita Income in South Asia and Southeast Asia (GDP per capita [1987 US$]) South Asia East Asia Life expectancy (years) 1960 1995 Infant mortality rate 1960 1996 Access to safe water (%) 1975–80 1990–96 Underweight children under age five (%) 1975 1990–97 Adult literacy rate (%) 1970 1995 Gross enrolment ratio for all levels (% age 6–23) 1980 1995 GDP per capita (PPP$) 1960 1995
South East Asia and Pacific
43.9 61.8
47.5 69.3
45.3 64.7
163 74
146 37
127 48
68 50
26 16
46 34
32 51
53 82
66 87
37 52
51 65
51 61
698 1,724
729 3,359
732 3,85
SOURCE: UNDP (1988), p. 206.
© 2002 Institute of Southeast Asian Studies, Singapore
© 2002 Institute of Southeast Asian Studies, Singapore
20098 46666 3759 — 3760
6554 — 105
260 35987 2710 540 2170 10301 3051
116013 17008
133021 1.80 11940
Others Secondary and Higher Education Govt. Secondary Schools Non-Govt. Secondary Schools Total
Govt. Colleges Non-Govt. Colleges Non-Govt. Madrasahs
Teacher’s Training College Others Technical Education Engineering Colleges Other Technical Institutions University Education Others
Total Revenue Expenditure Total Development Expenditure
Grand Total (Revenue and Development) Total Expenditure as % of GDP Per Capita Expenditure in Current Prices 160635 200 141.77
136002 24633
487 36906 3134 594 2540 122678 4639
8146 — 122
3892 50257 4596 — 4596
65706 61179 — 633
1991–92
SOURCE: BBS, Statistical Year Book of Bangladesh, 1998.
52685 50034 — 553
1990–91
Primary Education Govt. Primary Schools Mass Education Programme Primary Training Institutes
Revenue Expenditure
226743 276 196.30
167439 59304
584 50460 3770 710 3060 13300 7621
10732 — 145
4930 68031 6110 — 6110
74716 69033 — 753
1992–93
271550 310 231.71
182376 89174
594 53385 3822 720 3102 13500 13100
12154 — 152
5120 72516 6231 — 6231
79438 73525 — 793
1993–94
357327 366 298.01
197030 160297
588 62880 4148 900 3248 15330 88800
13483 — 160
6448 83645 6534 — 6534
85027 77746 — 833
1994–95
TABLE A29 Gross Expenditure on Education by Type of Educational Institutions
332398 255 272.23
209631 122767
— — 4414 — — 16939 5570
— — —
9049 90154 — — —
92554 825958149 — 910
1995–96 (Actual)
384694 274 309.48
229554 155140
— — 4763 — — 18170 8179
— — —
12819 98545 — — —
99897 86149 — 929
1996–97 (R E)
Appendix 99
100
Education for Development
TABLE A30 Public Expenditure Per Student on Primary and Secondary Education (US$) Primary South Korea Malaysia Thailand *Bangladesh India Pakistan
Secondary
389.8 351.2 133.0 12.5 38.1 21.1
352.5 572.5 — 47.1 — 122.6
NOTE: *Figures for Bangladesh are obtained for the year 1989–90 and the rest are for 1985. SOURCE: World Bank, The East Asian Miracle (New York: Oxford University Press, 1993); and BBS (1992).
TABLE A31 Higher Educated Persons by Region, Sex, and Income, 1995 Income Class (Tk. per month) Up to 5,000
Urban
80(54) (28) 5,001–15,000 118(36) (42) 15,001–35,000 74(69) (26) 35,001 & above 12(80) (26) Total 284(47) (100)
Region Rural
Total
Male
65(46) (21) 214(64) (68) 34(31) (10) 3(20) (10) 316(53) (100)
145(100) (24) 332(100) (55) 108(100) (18) 15(100) (18) 600(100) (100)
140(47) (26) 301(91) (55) 90(83) (17) 10(67) (17) 541(90) (100)
Sex Female 5(3) (8) 31(9) (53) 18(71) (31) 5(33) (31) 59(10) (100)
NOTE: Figures in parentheses are percentage value. Tk.40 = 1 US$ SOURCE: Rahman and Ali (1995).
© 2002 Institute of Southeast Asian Studies, Singapore
Total 145(100) (24) 332(100) (55) 108(100) (18) 15(100) (18) 600(100) (100)
NOTE: Percentages are given within parentheses. SOURCE: PMED, 2000.
Total
5. Grants
4. Supply and services/maintenance/contingencies
3. Allowances
2. Pay of establishment
1. Pay of officers
Major Heads 56715 (0.85) 4168840 (68.65) 2187190 (32.86) 73364 (1.10) 168000 (2.52) 6654106 (100)
1991–92 57515 (0.77) 4198370 (56.20) 2899775 (38.81) 91752 (1.12) 228200 (3.05) 7471612 (100)
1992–93 57400 (0.72) 4403365 (55.19) 3094005 (38.37) 129815 (1.62) 294200 (3.70) 7878785 (100)
1993–94 96255 (1.12) 4637020 (54.17) 3284045 (38.37) 168645 (1.97) 373640 (4.36) 8559605 (100)
1994–95 137345 (1.46) 5079430 (54.01) 3451411 (36.70) 183089 (1.95) 553161 (5.88) 9404430 (100)
1995–96 136030 (1.37) 5180715 (52.40) 3553713 (35.57) 540885 (5.41) 574196 (5.74) 9989706 (100)
1996–97
TABLE A32 Primary Units of Appropriation (Non-development) in Primary and Mass Education 1991/92 to 1997/98.
158120 (1.38) 6120400 (53.34) 3749916 (32.68) 381417 (3.52) 1065250 (9.28) 11475103 (100)
1997–98
Appendix 101
© 2002 Institute of Southeast Asian Studies, Singapore
102
Education for Development
TABLE A33 The Implementation of the Primary Education Budget vis-à-vis Other Components of the Education Budget Category
Adjust ADP Allocation as a % of Original ADP Allocation (1978–79)
Primary Education Secondary Education College Education Teacher Training Scholarships Technical Education Vocational Education University Grants Commission Miscellaneous
61.9 78.2 77.9 91.8 155.0 58.6 103.0 118.0 275.0
SOURCE: “Human Development in Bangladesh”, Report prepared under the UNDP (Dhaka, 1 March 1992), p. 125, Table 6.10.
© 2002 Institute of Southeast Asian Studies, Singapore
Notes
103
© 2002 Institute of Southeast Asian Studies, Singapore
Notes 1.
2. 3.
4.
5.
Though a growth rate of 5 per cent per capita for over three decades is unprecedented, Germany, Italy, and F rance came quite close in the 1950s and 1960s. However, there is no other comparab le performer. Even Japan, the much-acclaimed forerunner of the East Asian miracle, recorded only 1.5 per cent per capita growth during the period from the Meiji restoration to 1940. These achievements need to be adjusted against many other fallouts of development, such as pollution and other environmental degradations and infrastructural bottlenecks, as well as poverty (for example, in Indonesia). The problem arises from the fact that educational expenditures are considered as consumer spending as well as a contribution to higher income in the future, but these two cannot be easily separated. If we consider the factor of unrealized incomes, the problem becomes even more complex. Whether individuals realize their incomes or not from the investment in education, families and the state continue to spend on it. In such a situation, it is not easy to draw a balance between the two sources of spending. For this reason, some commentors argue that since micro returns are difficult to measure, it is better to estimate the macr o returns, which can be derived from the increase in material and intellectual capital. In macroeconomics apparently, the continued costs of education are compared with total individual incomes, or the national income. Shultz (1961) used both approaches but preferred the macroeconomic one. One should, however, assert this with a note of caution.The Philippines could not demonstrate higher levels in the standar d of living vis-à-vis its Southeast Asian neighbours despite having a higher rate of literacy. Education alone perhaps cannot guarantee a higher standard of living for a nation. However, it can still be argued that the situation could have been worse had there been lower levels of education in this country. Coombs (1985) indeed captures some of these changes of emphasis on development and education. Perceived anew, the basic objective of education was: ... to impr ove people’s quality of lif e — not just of some people b ut of all the people, with special emphasis on the poorest and the most
© 2002 Institute of Southeast Asian Studies, Singapore
104
Education for Development
disadvantaged who had thus far been bypassed by the development process. Economic growth based on increased productivity was still viewed as being of fundamental importance. But the broader end now in view was not simply a rise in the GNP. It was growth with equity, which militated against human exploitation and ensured a fair distribution of the fruits of development. Greater emphasis on more equitable distribution, the economists now argued, was not only a moral imperative but an imperative for healthy economic growth and future political stability. The new concept also rejected the old theoretical notion tha t economic and social development were distinct and separate processes and that the first must precede the second. Instead, the new thinking recognized that the two were inseparable and must go forward hand-inhand. Half-sick farmers could hardly be expected to have the stamina to boost their productivity, just as half starved children were in no condition to learn the intricacies of reading, writing and arithmetic (Coombs 1985, pp. 18–19). 6. 7. 8. 9.
See Speech by the Minister of Education, Singapore, on the Budget session given on 19 March 1998. Personal communication with Mukul G. Asher (January 1998). Personal communication with Mukul G. Asher and B. Rao (January 1998). The national education polic y, which is no w being vigorously pursued by the Government of Singapore, has the follo wing explicit purpose (see Webpage of Ministry of Education). To develop national cohesion, the instinct for survival and confidence in the future: • • • •
By fostering a sense of identity , pride, and self-r espect as Singaporeans; By knowing the Singapore story — how Singapore succeeded against the odds to become a nation; By understanding Singapore’s unique challenges, constraints and vulnerabilities, which make us different from other countries; and By instilling the core values of our way of life, and the will to prevail, that ensure our continued success and well-being.
10. “Thus when I hear, ‘what should we learn, how should we learn, which system of education is relevant and what way’, then I strongly feel that education is not something which is detached from life. What should we learn and what we want to be — these two are intimately interrelated. You cannot pour more water in a pot than what it can accommodate” (Rabindranath Tagore, Collected Works of Tagore, vol. 13, p. 694, translated by Atiur Rahman).
© 2002 Institute of Southeast Asian Studies, Singapore
References
105
References
Ahmad, M. Human Resource Development. Report of the Task Forces on Bangladesh Strategies for the 1990s , edited b y R. Sobhan. Vol. I. Dhaka: University Press Ltd., 1991. Ahmed, Q.K., ed. “A Market Survey of 265 Organizations of Employers in the Public and Private Sector in Bangladesh”. Mimeographed. Dhaka: Bangladesh Unnayan Parishad/Institute of Engineers, Bangladesh, 1992. Alam, M. “Poverty and Primary Educational Development in Bangladesh”. In “The Face of Human Deprivations”. Bangladesh Human Development Report 1999. Mimeographed. BIDS, February 2000. Asian Development Bank (ADB). Education and Development in Asia and the Pacific. Manila: ADB, 1991. . Asian Development Outlook. Manila. 1998. Banuri, T. Modernization and Its Discontents: A Perspective from Sociology of Knowledge. Helsinki: World Institute for De velopment Economics Research of the United Nations University, 1987. Barro, R. “Wage Inequality and Distribution of Education: A Study of the Evolution of Regional Differences in Inequality in Metropolitan Brazil”. Journal of Economic Development (July, 1991). Becker, G., K. Mur phy, and R. Tamura. “Human Capital, Fertility and Economic Growth”. Journal of Political Economy (October, 1990). Berry, A. “Education, Income , Productivity and Urban Po verty”. In Education and Income, edited by K.C. King. Washington, D.C.: The World Bank, 1980. Birdsall, N., and R.H. Sabot. “Inequality, Exports, and Human Capital in East Asia: Lessons for Latin America. In Redefining the State in La tin America, edited by C. Bradford, Jr. Paris: OECD De velopment Center and Inter -American Development Bank, 1994. Birdsall, N., D. Ross, and R.H. Sabot. “Inequality as a Constraint on Growth”. In Social Tensions, Job Creation and Economic Policy in Latin America, edited by D. Turnham, C. Foy and G. Larrain. Paris: OECD, 1995a.
© 2002 Institute of Southeast Asian Studies, Singapore
106
Education for Development
. “Inequality and Gro wth Reconsidered: Lessons from East Asia”. World Bank Economic Re view. Washington DC: World Bank, September , 1995b. . “Education, Growth and Inequality”. Pathways to Growth: Comparing East Asia and Latin America, edited by N. Birdsall and F. Jasperson. Washington: Inter-American Development Bank, 1997a. Birdsall, Nancy, and Fredr ick Jasperson. Pathways to Growth: Grouping East Asia and Latin America. Washington: Inter-American Development Bank, 1997b. Blang, M. “The Correlation Between Education and Earnings: What Does It Signify?” Higher Education 1, no. 1 (February 1972): 53–76. Capra, F. The Turning Point: Science, Society and the Rising Cultur e. New York: Bantam Books, 1982. Capra, F. The Web of Life. New York: Anchor Books/Doubleday, 1996. Chenery, H., and M. Syrquin. Patterns of Development 1950–1970. New York: Oxford University Press, 1975. Chieh, H.C. “What It Takes to Sustain Researc h and De velopment in a Small, Developed Nation in the 21st century”. InSingapore: Towards a Developed Status, edited by L. Low. Oxford/Singapore: Oxford University Press/Centre for Advanced Studies, 1999. Clark, C. “The Conditions of Economic Pr ogress”. London: The Macmillan Press, 1940. Coombs, P.H. The World Crisis in Educa tion — The View from the Eighties . New York: Oxford University Press, 1985. Debeauvais, M. Education and Development in the New International Economic Outlook. IIEP Occasional Papers, No 53. UNESCO: International Institute for Educational Planning, 1981. Delhaise, P. Asia in Cr isis: The Implosion of the Banking and F inance Systems. Singapore: John Wiley & Sons (Asia) Pte Ltd, 1998. Denison, E. The Sources of Economic Growth in the United States and the Alternatives before the US. New York: Committee of Economic Development, 1962. Denison, E. Why Growth Rates Differ: Post War Experience in Nine Western Countries. Washington, DC: The Brookings Institution, 1967. Dopfer, K. The New Political Economy of Development: Integrated Theory and Asian Experience. London and Basingstoke: The Macmillan Press Ltd, 1979. -Drézé, Jean and A. Sen. Hunger and Public Action. Oxford: Clarendon Press, 1989. Escobar, A. Encountering Development: The Making and Unmaking of theThird World. New Jersey: Princeton University Press, 1995. Fuller, W. “Education, Training and Worker Productivity: Study of Skilled Workers in Two Firms in South Asia”. Ph.D. thesis, Standford University, 1990. Gopinathan, S. “Singapore”. In Education and Development in East Asia, edited by P. Morris and A. Sweeting. New York and London: Garland Publishing, Inc., 1995. . “Education and De velopment in Singapore”. In Education in Singapore, edited by J. Tan, S. Gopinathan, and H.W. Kam. Singapore: Prentice Hall/Simon and Schuster (Asia) Pte Ltd, 1997.
© 2002 Institute of Southeast Asian Studies, Singapore
References
107
Haddad, W.D., M. Carnoy, R. Rinaldi and O. Re gel. Education and De velopment: Evidence for New Priorities. Washington, DC: The World Bank, 1990. Haq, M. Human Development in South Asia. Dhaka: University Press, Ltd, 1997. Hayashi, T. “Modified J-System” of Human Resource Development: A Case Study of Japanese MNEs in Singapore in Electric Machinery”. Paper presented at the International Symposium on F oreign Direct Investment in Asia, 22–23 October 1998. Mimeographed. Tokyo: Economic Research Institute, 1998. Hossam, M. “Education and Economic Performance in Rural Bangladesh”.Bangladesh Journal of Political Economy 9, no. 3 (1989). Japan National Commission for UNESCO. The Role of Education in the Social and Economic Development of Japan. Tokyo: Ministry of Education, 1966. Juster, F., and P. Stafford. “The Allocation of Time: Empirical Findings, Behavioural Models, and Problems of Measurement”. Journal of Economic Literature XXIX (June 1991): 471–522. Kim, E.M. The Four Asian Tigers: Economic De velopment and Global P olitical Economy. London and Sydney: Academic Press, 1998. Khan, A.R., and M. Hossain. The Strategy of Development in Bangladesh. London: Macmillan Press Ltd, 1989. Khoman, S.C. “The Education Sector in Thailand: Problems, Policy Dilemmas, and the Role of the Government”. Discussion Paper Series No. 95. Mimeographed. Faculty of Economics, Thammasat University, October 1988. Koo, Sung-Yeal. “Formal Education and the Quality of Schooling in East Asian Countries”. In Human Capital Formation as an Eng ine of Growth: The East Asian Experience, edited by Joseph L.H. Tan, pp. 34–78. Singapore: Institute of Southeast Asian Studies, 1999. Kuznets, S. Modern Economic Growth. New Haven, CT: Yale University Press, 1966. Leipziger, D.M. Lessons from East Asia. Ann Arbor: University of Michigan Pr ess, 1997. Lockheed, M., D. Jamison and L. Lau. “Farmer Education and F armer Efficiency: A Survey”. Economic Development and Cultural Change 29, no. 1 (1980). Low, L., T.M. Heng, and T. Wong. Economics of Education and Manpower Development Issues and Policies in Singapore. McGraw-Hill Book Co., 1991. Lucas, R. “On the Mechanics of Economic Development”. Journal of Monetary Economics (July 1988). Majumdar, T. “Economics of Indian Education f or the Next Centur y”. Indian Economic Journal 45, no. 4 (April–June 1997–98). McGranahan et al. Contents and Measurement of ‘Socio-economic De velopment. Praeger, 1985. Min, W. “The Impact of Vocational Education in Producti vity in the Specif ic Institutional Context of China: A Case Study”. Ph.D. thesis: Stanford University, 1987. Mingat, A. “Towards Improving Our Understanding of the Strategy of High Performing Asian Economies in the Educational Sector”. Paper presented at the International
© 2002 Institute of Southeast Asian Studies, Singapore
108
Education for Development
Conference on F inancing Human Resour ce Development in Advanced Asian Countries. Mimeographed. Manila: ADB, 1995. Mincer, J. “Human Ca pital and Earnings”. In Economic Dimensions of Education , edited by D.M. Windham, pp.1–31.. Report of the NationalAcademy of Education, 1979. Morris, P., and A. Sweeting. Education and Development in East Asia. New York and London: Garland Publishing, Inc., 1995. Mundle, S. “Financing Human Resource Development in Advanced Asian Countries: A Report”. Paper presented at the International Conference on Financing Human Resource Development in Advanced Asian Countries. Mimeographed. Manila: ADB, 1995. M. Ramesh and M.G. Asher. Welfare Capitalism in Southeast Asia: Social Security, Health and Education Policies. London: The Macmillan Press Ltd, forthcoming. Park, Soo-Bin. “Education and Economic Growth: The Case of Korea”. Paper presented at the Department of Economics, National University of Singapore, 1995. Mimeographed. Also available at the East Asia Institute Library, Singapore. Park, Y.B., D. Ross, and R.H. Sabot. “Educational Expansion and Inequality of Pay in Brazil and K orea”. In Opportunity Foregone: Education in Br azil, edited by N. Birdsall and R.H. Sabot. Washington, DC: Inter-American Development Bank, distributed by Johns Hopkins University Press, 1996. Pease, R.M. “Policy Learning: The Case of Sing apore Models for Ref orm in Urban China”. Mc. Soc. Sci. thesis. Mimeographed. Singapore: Department of Political Science, National University of Singapore, 1996. Peck, E.S. “Financing Education”. In Fiscal System of Singapore: Trends, Issues and Future Directions, edited by Mukul G.Asher and Amina Tyabji. Singapore: Centre for Advanced Studies/National University of Singapore, 1996. Petri, P.A. “Common Foundations of East Asian Success”. In Lessons from East Asia, edited by D.M. Leipziger. Ann Arbor: University of Michigan Press, 1997. Pritcher, L. “Where has all the education gone?”Policy Research Working Paper #1581. Washington, DC: The World Bank, Polic y Research Depar tment, Poverty and Human Resources Division, March 1996. PMED (Primary and Mass Education Division). “The Year 2000: Bangladesh Country Report”. Government of the People’s Republic of Bangladesh, December 1999. Psacharopoulos, G. and M. Woodhall. Education and Development: An Investment Choice. New York: Oxford University Press, 1985. Psacharopoulos and Tilak. “Education and Wage Earnings”. In Encyclopedia of Educational Research, edited by M.C. Alkin, pp. 419–23. New York: Macmillan, for the American Educational Research Association, 1992. Quah, J.S.T. “Human Resource Development in Four Asian Countries: Some Lessons for the Commonwealth Countr ies”. In Report Prepared for the Commonwealth Secretariat. London: Commonwealth Secretariat, 1993. Quah, J.S.T. “Singapore’s Model of Development: Is It Transferable?” In Behind East Asian Growth: The Political and Social Foundations of Prosperity, edited by H.S. Rowen. London: Routledge, 1998.
© 2002 Institute of Southeast Asian Studies, Singapore
References
109
Rahman, A. and Z. Ali. “Higher Education, Inequality and De velopment”. Mimeographed. Dhaka: Bangladesh Institute of Development Studies, 1995. Ramesh, M and Asher, M.G. Welfare Capitalism in Southeast Asia: Social Security, Health and Education Policies. London: Macmilan Press Ltd, forthcoming. Ranis, G. “The Evolution of Policy in a Comparati ve Perspective: An Introductory Essay. In The Evolution of Policy Behind Taiwan’s Development Success, edited by Kuo-Tying Li. 2nd edition. Singapore: World Scientific Publishing Company, 1995. Rao, M.G. “Public Expenditure Policies in High Perfor ming Asian Experience”. A paper presented at the international conference on Financing Human Resource Development in Advanced Asian Economies. Mimeographed. Manila: ADB, 1995. Rao, V.V.B. “East Asian Economies: Trends in P overty and Income Inequality”. Economic and Political Weekly 34, no. 18 (1999): 1029–39. Rao, V.V.B. “East Asian Economies: The Crisis of 1997–1998”. Economic and Political Weekly 33, no. 23 (6 June 1998): 1397–416. Rose, R. “What is Lesson Dr awing?” Journal of Public P olicy 11, no. 1 (January– March 1991): 19–21. Rowen, H.S. Behind East Asian Growth: The Political and Social F oundations of Prosperity. London and New York: Routledge, 1998. Saavedra-Rivano, N. “From Promising Be ginnings to Di vergent Paths: Brazil and Korea”. In Development Strategies in East Asia and La tin America, edited b y A. Hosono and N. Saavedra-Rivano. London: Macmillan Press Ltd., 1998. Selvaratnam, V. Innovations in Higher Education . World Bank Technical Paper No. 222. Asian Technical Department Series. Washington, DC: World Bank, 1994. Sen, A. Public Action to Remed y Hunger. Public Lecture given at Dhaka in 1989. Dhaka: Bangladesh Institute of Development Studies, 1992. Sen, B. and A. Rahman. “Fighting Poverty: Emerging Perspective — South Asia Poverty Monitor 1998”. Mimeographed. Regional Report prepared by Bangladesh Institute of Development Studies, with support from UNDP, New York, 1998. Shultz, T.W. “Investment in Human Ca pital”. American Economic Review 51, no. 1 (1961): 1–17. Siddiqui, Asif Igbal “An Economic Investigation into the Forest Fire and Haze in Southeast Asia”. Mimeographed. Singapore: Institute of Southeast Asian Studies, 1999. Sivard, R.L. Women — A World Survey. Washington: World Priorities Group, 1985. Sobhan, R. Crisis in Go vernance: A Review of Bangladesh’s Development. Dhaka University Press Ltd., 1997. Stevenson, H.W. “Human Capital: How the East Excels?” In Behind East Asian Growth: The Political and Social Foundations of Prosperity, edited by H.S. Rowen. London: Routledge 1998. Stromquist, N. Determinants of Educa tional Participation and Achievement of Women in the Third World. A Review of Evidence and a Theoretical Critique. Standford: CERAS, 1988. Tilak, Jandhyala B.G. Education for Development in Asia. New Delhi: Sage Publication, 1994. UNDP. Human Development Report. New York: Oxford University Press, 1998.
© 2002 Institute of Southeast Asian Studies, Singapore
110
Education for Development
Wade, R. Governing the Market: Economic Theory and the Role of Go vernment on East Asian Industrialization. Princeton University Press, 1990. World Bank. World Development Report. New York: Oxford University Press, 1991. . Bangladesh Education Sector Review, Volume 1: Synthesis, Discussion Draft. Dhaka, Bangladesh, 1999. . The East Asian Miracle: Economic Growth and Public P olicy. A World Bank Policy Report. New York: Oxford University Press, 1993. Yee, Albert H., ed. East Asian Higher Educa tion: Traditions and Transformations. Oxford and New York: Pergamon Press, 1995.
© 2002 Institute of Southeast Asian Studies, Singapore
The Author
cxi
The Author Atiur Rahman was a Visiting Research Fellow at the Institute of Southeast Asian Studies, Singapore, and is currently working as a Senior Research Fellow at the Bangladesh Institute of Development Studies, Bangladesh.
© 2002 Institute of Southeast Asian Studies, Singapore