Earth Materials: Introduction to Mineralogy and Petrology 0521761158, 9780521761154
The fundamental concepts of mineralogy and petrology are explained in this highly illustrated, full-color textbook to cr
525 121 521MB
English Pages 552 [550] Year 2012
Recommend Papers


![Introduction to Applied Mineralogy (Springer Textbooks in Earth Sciences, Geography and Environment) [1st ed. 2023]
3662648660, 9783662648667](https://ebin.pub/img/200x200/introduction-to-applied-mineralogy-springer-textbooks-in-earth-sciences-geography-and-environment-1st-ed-2023-3662648660-9783662648667.jpg)


- Author / Uploaded
- Cornelis Klein
- Anthony R. Philpotts
File loading please wait...
Citation preview
Earth Materials INTRODUCTION TO MINERALOGY AND PETROLOGY
The fundamental concepts of mineralogy and petrology are explained in this highly illustrated, full-color textbook, to create a concise overview for students studying Earth materials. The relationship between minerals and rocks and how they relate to the broader Earth, materials, and environmental sciences is interwoven throughout. Beautiful photos of specimens and CrystalViewer’s three-dimensional illustrations allow students to easily visualize minerals, rocks, and crystal structures. Review questions at the end of chapters allow students to check their understanding. The importance of Earth materials to human cultural development and the hazards they pose to humans are discussed in later chapters. This ambitious, wide-ranging book is written by two world-renowned textbook authors, each with more than 40 years of teaching experience, who bring that experience here to clearly convey the important topics. Cornelis (“Kase”) Klein is Emeritus Professor in the Department of Earth and Planetary Sciences at the University of New Mexico, Albuquerque. He received his B.Sc. and M.Sc. in geology from McGill University, Canada, and his Ph.D. from Harvard University, also in geology. He has been a member of the geology faculty at Harvard University; Indiana University, Bloomington; and the University of New Mexico; he has taught courses in mineralogy at all these universities. His published books include Manual of Mineralogy (19th–21st eds.); Manual of Mineral Science (22nd–23rd eds.); and Minerals and Rocks: Exercises in Crystal and Mineral Chemistry, Crystallography, X-Ray Powder Diffraction, Mineral and Rock Identification, and Ore Mineralogy (3rd ed., 2008). He has received two awards for excellence in teaching from the University of New Mexico.
Anthony R. Philpotts is Emeritus Professor of Geology and Geophysics at the University of Connecticut, a Visiting Fellow in the Department of Geology and Geophysics at Yale University, and Adjunct Professor in the Department of Geosciences at the University of Massachusetts. He received his B.Sc. and M.Sc. in geology from McGill University, Canada, and his Ph.D. from the University of Cambridge. He has taught igneous and metamorphic petrology courses at McGill University and the University of Connecticut for more than 40 years. His published books include Principles of Igneous and Metamorphic Petrology (2nd ed., 2009, Cambridge University Press) and Petrography of Igneous and Metamorphic Rocks (1989, 2003).
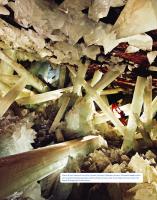
Cueva de Los Cristales (Cave of the Crystals) in Naica, Chihuahua, Mexico. The main chamber of the cave contains enormous gypsum (variety selenite) crystals, some of the largest natural crystals ever found. Photograph © Carsten Peter.
Earth Materials INTRODUCTION TO MINERALOGY AND PETROLOGY Cornelis Klein University of New Mexico, Emeritus
Anthony R. Philpotts University of Connecticut, Emeritus
32 Avenue of the Americas, New York, NY 10013-2473, USA Cambridge University Press is part of the University of Cambridge. It furthers the University’s mission by disseminating knowledge in the pursuit of education, learning, and research at the highest international levels of excellence. www.cambridge.org Information on this title: www.cambridge.org/9780521145213 © Cornelis Klein and A. R. Philpotts 2013 This publication is in copyright. Subject to statutory exception and to the provisions of relevant collective licensing agreements, no reproduction of any part may take place without the written permission of Cambridge University Press. First published 2013 Reprinted with corrections 2013 (twice) Reprinted 2014 (twice) Reprinted with corrections 2015 Reprinted 2016 Printed in the United States of America by Sheridan Books, Inc. A catalog record for this publication is available from the British Library. Library of Congress Cataloging in Publication data Klein, Cornelis, 1937– Earth materials : introduction to mineralogy and petrology / Cornelis Klein, Anthony Philpotts. p. cm. Includes bibliographical references and index. ISBN 978-0-521-76115-4 (hardback) – ISBN 978-0-521-14521-3 (paperback) 1. Mineralogy – Textbooks. 2. Petrology – Textbooks. I. Philpotts, Anthony R. (Anthony Robert), 1938– II. Title. QE363.2.K529 2012 553–dc23 2011044843 ISBN 978-0-521-76115-4 Hardback ISBN 978-0-521-14521-3 Paperback Additional resources for this publication at www.cambridge.org/earthmaterials Cambridge University Press has no responsibility for the persistence or accuracy of URLs for external or third-party Internet Web sites referred to in this publication, and does not guarantee that any content on such Web sites is, or will remain, accurate or appropriate. Cover: Photograph of a polished surface of a rock type known as garbenschiefer, from the German words Garbe, meaning sheaf, and Schiefer, meaning schist. It is a metamorphosed igneous rock and consists of coarse black hornblende sheaves and reddish-brown garnets in a fine-grained matrix of plagioclase, quartz, chlorite, and muscovite. This rock is quarried in Ashfield, Massachusetts, as “dimension stone,” and is commercially known as “Crowsfoot” Ashfield Stone. It is part of the Ordovician Hawley Formation, which has a minimum age of 462 million years. Field of view: ~15 cm by 20 cm. Photograph courtesy of Marc Klein.
Cornelis Klein dedicates this book to his two children and their immediate families. His son and daughter-in-law, Marc and Laura Klein, and their two children, Alaxandra and Hugh. And to his daughter and son-in-law, Stephanie and Jack Stahl, and Stephanie’s three sons, Max, Miles, and Bo Peponis. Anthony R. Philpotts dedicates this book to his three daughters, Liane, Marlaine, and Alison.
Contents Preface Acknowledgments
Summary Review questions Online resources Further reading
xiii xv
1 INTRODUCTION 1.1 Formation of Earth’s chemical elements in supernovae 1.2 Birth of the solar system and Earth 1.3 Accretion and early history of the Earth 1.4 Internal structure of the Earth 1.5 Cooling of the planet and plate tectonics 1.6 Plate tectonics and the formation of rocks 1.6.1 Divergent plate boundaries 1.6.2 Convergent plate boundaries 1.6.3 Transform boundaries 1.6.4 Mantle plumes and hot spots 1.7 Outline of subsequent chapters Summary Review questions Online resources Further reading
3
3 4 5 7 7 8 9 10 10 10 10 11 12 13 13 13
2 MATERIALS OF THE SOLID EARTH 2.1 Definition of a mineral 2.1.1 Examples of some familiar minerals 2.2 How are minerals classified? 2.3 How are minerals named? 2.4 What is a crystal, and what is the crystalline state? 2.5 What is a rock? 2.6 How do rocks form? Classification into igneous, sedimentary, and metamorphic 2.7 Examples of some familiar rocks 2.8 Plate tectonics and the generation of rocks 2.8.1 Midocean-ridge rock factory 2.8.2 Convergent-plate-boundary rock factory 2.8.3 Continental divergent-plate-boundary rock factory (rift valley) 2.8.4 Mantle plume hot-spot rock factory 2.8.5 Passive-margin rock factories 2.8.6 Epeiric-sea rock factories 2.8.7 Metamorphic rock factories
35 35 36 36
15 16 17 21 21
HOW ARE MINERALS IDENTIFIED? 3.1 Habit 3.2 State of aggregation 3.3 Color and luster 3.3.1 Reasons for color 3.4 Cleavage 3.5 Hardness 3.6 Specific gravity (relative density) 3.6.1 Specific gravity and atomic structure 3.7 Magnetism, solubility in acid, and radioactivity 3.8 Instrumental methods for the quantitative characterization of minerals 3.8.1 X-ray powder diffraction 3.8.2 Electron beam techniques: scanning electron microscopy, electron microprobe analysis, and transmission electron microscopy Summary Review questions Further reading
39 40 41 42 45 49 51 52 52
FUNDAMENTALS OF CRYSTAL STRUCTURES 4.1 Naturally occurring chemical elements 4.2 Atomic and ionic radii 4.3 What factors control the packing of ions (and atoms) in mineral structures? 4.4 Pauling’s rules 4.5 What forces hold crystal structures together? 4.5.1 Electronic configuration of atoms and ions 4.5.2 Chemical bonding 4.6 Atomic substitutions 4.6.1 Factors responsible for the extent of atomic substitution (solid solution) 4.6.2 Types of solid solution
63 64 64
53 53 54
57 60 61 61
4
22 24 24 27 31 31 33 33 34 34 34 34 vii
66 70 75 75 76 80 80 83
viii
Contents
Summary Review questions Further reading
84 85 85
Summary Review questions Online resources Further reading
5 INTRODUCTION TO CRYSTALLOGRAPHY 5.1 Symmetry elements and operations 5.2 Combinations of symmetry elements 5.3 The six crystal systems 5.3.1 Crystallographic axes 5.3.2 Hermann-Mauguin symmetry notation 5.3.3 Crystallographic notation for planes in crystals 5.3.4 Definition of crystal form 5.3.5 Crystallographic notation for directions in crystals 5.4 Crystal projections 5.5 Seven of the thirty-two point groups 5.6 Twins 5.7 Some aspects of space groups 5.7.1 Space groups 5.8 Polymorphism Summary Review questions Further reading
87 89 90 91 91
7
93 93 95 98 99 103 113 116 121 126 131 132 133
6 MINERALS AND ROCKS OBSERVED UNDER THE POLARIZING OPTICAL MICROSCOPE 135 6.1 Light and the polarizing microscope 136 6.2 Passage of light through a crystal: refractive index and angle of refraction 137 6.3 Passage of polarized light through minerals 139 6.4 Accessory plates and determination of fast and slow vibration directions 143 6.5 Extinction positions and the sign of elongation 144 6.6 Anomalous interference colors, pleochroism, and absorption 144 6.7 Mineral identification chart 145 6.8 Uniaxial optical indicatrix 146 6.9 Biaxial optical indicatrix 148 6.10 Uniaxial interference figures 148 6.11 Determination of optic sign from uniaxial optic axis figure 150 6.12 Biaxial interference figures, optic sign, and optic angle (2V) 150 6.13 Modal analysis 152
153 155 155 155
IGNEOUS ROCK-FORMING MINERALS 7.1 Common chemical elements in the Earth’s crust and in mineral and rock analyses 7.2 Calculation of mineral formulas 7.3 Triangular diagrams 7.4 Systematic mineralogical descriptions of common igneous minerals 7.5 Plagioclase feldspar 7.6 K-feldspar 7.7 Quartz and silica polymorphs 7.8 Nepheline 7.9 Leucite 7.10 Sodalite 7.11 Enstatite 7.12 Pigeonite 7.13 Augite 7.14 Aegirine 7.15 Hornblende 7.16 Muscovite 7.17 Phlogopite 7.18 Biotite 7.19 Olivine 7.20 Zircon 7.21 Tourmaline 7.22 Allanite 7.23 Melilite 7.24 Magnetite 7.25 Chromite 7.26 Hematite 7.27 Ilmenite 7.28 Rutile 7.29 Uraninite 7.30 Pyrite 7.31 Pyrrhotite 7.32 Chalcopyrite 7.33 Apatite Summary Review questions Further reading
157
HOW DO IGNEOUS ROCKS FORM? 8.1 Why, and how, does solid rock become molten?
193
158 159 161 162 164 166 167 168 169 169 170 171 172 174 174 175 177 178 179 179 180 181 182 182 183 183 184 185 186 187 187 188 189 189 190 191
8
195
Contents
8.2
8.3
8.4
8.5
8.6
8.7
8.1.1 Composition of the upper mantle 195 8.1.2 Melting range of upper-mantle peridotite 195 8.1.3 Geothermal gradient and the geotherm 197 Three primary causes of melting and their plate tectonic settings 198 8.2.1 Raising the temperature of mantle peridotite to the melting range over hot spots 198 8.2.2 Decompression melting at divergent plate boundaries 198 8.2.3 Fluxing with water at convergent plate boundaries (subduction zones) 198 Melting processes in rocks 199 8.3.1 Melting of a mixture of minerals 199 8.3.2 Melting of a pair of minerals: the eutectic 201 8.3.3 Congruent melting and the granite and nepheline syenite eutectics 204 8.3.4 Incongruent melting and the peritectic 206 8.3.5 Melting relations of solid solutions 207 Effect of pressure on melting 210 8.4.1 Effect of pressure on the anhydrous melting of rock 211 8.4.2 Hydrous melting of rock and the solubility of water in magma 211 8.4.3 Solubility of other gases in magma 213 8.4.4 Exsolution of magmatic gases and explosive volcanism 214 Physical properties of magma 217 8.5.1 Magma density 217 8.5.2 Magma viscosity 217 8.5.3 Diffusion in magma, crystal growth, and grain size of igneous rocks 219 Magma ascent 220 8.6.1 Buoyancy 220 8.6.2 Buoyant rise of magma 221 Processes associated with the solidification of magma in the crust 223 8.7.1 Cooling of bodies of magma by heat conduction 224 8.7.2 Cooling of bodies of magma by convection and radiation 225 8.7.3 Magmatic differentiation by crystal settling 227 8.7.4 Compaction of crystal mush 229 8.7.5 Assimilation and fractional crystallization 229 8.7.6 Liquid immiscibility 231 Summary 232 Review questions 233
Online resources Further reading
234 235
9 IGNEOUS ROCKS: THEIR MODE OF OCCURRENCE, CLASSIFICATION, AND PLATE TECTONIC SETTING 9.1 Why an igneous rock classification is necessary 9.2 Mode of occurrence of igneous rocks 9.2.1 Shallow intrusive igneous bodies: dikes, sills, laccoliths, cone sheets, ring dikes, and diatremes 9.2.2 Plutonic igneous bodies: lopoliths, batholiths, and stocks 9.2.3 Extrusive igneous bodies: flood basalts, shield volcanoes, composite volcanoes, domes, calderas, ash-fall and ash-flow deposits 9.3 International Union of Geological Sciences classification of igneous rocks 9.3.1 Mode and norm 9.3.2 IUGS classification of igneous rocks 9.3.3 Composition of common plutonic igneous rocks 9.3.4 IUGS classification of volcanic igneous rocks 9.3.5 Irvine-Baragar classification of volcanic rocks 9.4 Igneous rocks and their plate tectonic setting 9.4.1 Igneous rocks formed at midocean-ridge divergent plate boundaries 9.4.2 Igneous rocks of oceanic islands formed above hot spots 9.4.3 Continental flood basalts and large igneous provinces 9.4.4 Alkaline igneous rocks associated with continental rift valleys 9.4.5 Igneous rocks formed near convergent plate boundaries 9.5 Special Precambrian associations 9.5.1 Komatiites 9.5.2 Massif-type anorthosites 9.5.3 Rocks associated with large meteorite impacts Summary Review questions Online resources Further reading
237 238 238
238 243
247 258 258 258 263 264 265 266
266 270 270 271 274 280 280 281 283 285 286 287 287
ix
x
Contents
10 SEDIMENTARY ROCK-FORMING MINERALS AND MATERIALS 289 10.1 The interaction of the Earth’s atmosphere with minerals 290 10.2 Ice 292 10.3 Goethite 293 10.4 Kaolinite 295 10.5 Calcite 295 10.6 Aragonite 297 10.7 Dolomite 297 10.8 Magnesite 298 10.9 Siderite 299 10.10 Rhodochrosite 300 10.11 Halite 300 10.12 Sylvite 301 10.13 Gypsum 301 10.14 Anhydrite 303 10.15 Chert and agate 303 10.16 Phosphorite 305 10.17 Soil 305 Summary 306 Review questions 307 Further reading 307 11 FORMATION, TRANSPORT, AND LITHIFICATION OF SEDIMENT 11.1 Importance of sediments in understanding the history of the Earth 11.2 Sediment formed from weathering of rock 11.2.1 Role of carbon dioxide in weathering 11.2.2 Weathering products of rock 11.2.3 Detrital grain size 11.2.4 Detrital grain roundness and resistance to abrasion 11.3 Organically produced sediment 11.3.1 Formation of carbonate and siliceous sediment 11.3.2 Formation of hydrocarbons in sediment 11.4 Chemically produced sediment 11.5 Sediment produced by glacial erosion 11.6 Transport of sediment 11.6.1 Laminar and turbulent flow 11.6.2 Movement of particles by fluid flow 11.6.3 Movement of particles in turbidity currents 11.6.4 Movement of sediment in debris flows
309 310 311 311 312 313 315 316 316 319 319 320 321 321 322 326 327
11.7 Layering in sediments and sedimentary rocks 11.7.1 Law of superposition 11.7.2 Milankovitch cycles 11.7.3 Sediments related to tectonic processes 11.8 Sites of deposition and tectonic significance 11.8.1 Convergent plate boundaries 11.8.2 Passive continental margins 11.8.3 Rift and pull-apart basins 11.9 Conversion of unconsolidated sediment to sedimentary rock: lithification 11.9.1 Porosity and compaction 11.9.2 Cementation of sediment 11.9.3 Pressure solution 11.9.4 Recrystallization, replacement, dolomitization Summary Review questions Online resources Further reading
327 328 328 329 330 330 331 331 332 332 333 334 334 335 336 337 337
12 SEDIMENTARY ROCK CLASSIFICATION, OCCURRENCE, AND PLATE TECTONIC SIGNIFICANCE 12.1 Siliciclastic sedimentary rocks 12.1.1 Mudrocks (includes shales) 12.1.2 Sandstones 12.1.3 Conglomerates and breccias 12.2 Carbonate sedimentary rocks 12.2.1 Limestones 12.2.2 Dolostones 12.2.3 Tectonic settings of carbonate rocks 12.3 Coals 12.4 Oil and natural gas 12.5 Evaporites 12.6 Phosphorites 12.7 Iron-formations Summary Review questions Online resources Further reading
339 340 340 343 350 352 352 360 360 360 361 362 363 363 363 364 365 365
13 METAMORPHIC ROCK-FORMING MINERALS 13.1 Systematic mineralogical descriptions of common metamorphic minerals 13.2 Garnet 13.3 Andalusite
367 368 368 370
Contents
13.4 13.5 13.6 13.7 13.8 13.9 13.10 13.11 13.12 13.13 13.14 13.15 13.16 13.17 13.18 13.19 13.20 13.21 13.22 13.23 13.24 13.25 13.26 13.27
Sillimanite Kyanite Staurolite Diopside Anthophyllite Cummingtonite-grunerite Tremolite-ferroactinolite Glaucophane Wollastonite Rhodonite Talc Chlorite Antigorite Chrysotile Epidote and clinozoisite Cordierite Vesuvianite Titanite (sphene) Scapolite Lawsonite Pumpellyite Topaz Corundum Chabazite Summary Review questions Further reading
370 371 371 372 372 373 373 374 375 376 376 377 378 379 380 381 381 382 382 383 384 384 385 386 388 389 389
14 METAMORPHIC ROCKS 391 14.1 What changes occur during metamorphism? 392 14.2 Why do rocks change? 394 14.2.1 Thermodynamics and the reason for change 394 14.2.2 Rates of metamorphic reactions 396 14.2.3 Gibbs phase rule and the number of minerals a metamorphic rock can contain 396 14.3 Metamorphic grade and facies 398 14.4 Textures of metamorphic rocks 401 14.4.1 Textures of contact metamorphic rocks 401 14.4.2 Deformation and textures of regional metamorphic rocks 402 14.5 Simple descriptive classification of metamorphic rocks 408 14.6 Metamorphism of mudrock 408 14.6.1 Graphical representation of a simple metamorphic reaction 409 14.6.2 A simple pressure-temperature petrogenetic grid 410 14.6.3 Metamorphic field gradients 411
14.6.4 Graphical representation of mineral assemblages in metapelites 411 14.6.5 Mineral assemblages in Barrow’s metamorphic zones and part of the petrogenetic grid for metapelites 413 14.7 Metamorphism of impure dolomitic limestone 415 14.8 Metamorphism and partial melting: migmatites 419 14.9 Geothermometers and geobarometers 420 14.10 Plate tectonic significance of metamorphism 421 14.10.1 Pressure-temperature-time (P-T-t) paths 422 14.10.2 Plate tectonic setting of metamorphic facies 424 Summary 425 Review questions 427 Further reading 428
15 SOME ECONOMIC MINERALS, MAINLY FROM VEINS AND PEGMATITES 15.1 Gold 15.2 Silver 15.3 Copper 15.4 Diamond 15.5 Sulfur 15.6 Galena 15.7 Sphalerite 15.8 Bornite 15.9 Chalcocite 15.10 Marcasite 15.11 Molybdenite 15.12 Arsenopyrite 15.13 Bauxite 15.14 Fluorite 15.15 Barite 15.16 Spodumene 15.17 Lepidolite 15.18 Several gem minerals Summary Review questions Further reading
431 432 433 433 434 435 436 436 438 439 439 440 441 442 442 443 444 444 444 448 449 449
16 SOME SELECTED EARTH MATERIALS RESOURCES 16.1 Construction materials 16.1.1 Building stones 16.1.2 Bricks, cement, and concrete 16.1.3 Crushed stone, sand, and gravel
451 452 452 454 455
xi
xii
Contents
16.2 16.3 16.4 16.5 16.6 16.7 16.8
Iron ore Clay minerals Copper ore Lithium ore Rare earth elements Zeolites Energy resources 16.8.1 Oil, natural gas, and coal reserves 16.8.2 Nuclear energy 16.8.3 Geothermal energy Summary Review questions Online resources Further reading
456 457 459 460 461 461 462 462 464 464 465 466 467 467
EARTH MATERIALS AND HUMAN HEALTH 17.1 The human body’s need for Earth materials 17.2 Soils and human health 17.2.1 What constitutes a fertile soil? 17.2.2 Increasing crop production from agricultural land and soil depletion 17.2.3 The need for fertilizers 17.3 Carcinogenic and chemical hazards posed by Earth materials
469 470 470 470
17
17.3.1 17.3.2 17.3.3 17.3.4
Erionite 474 Asbestos minerals 474 Silica minerals 476 Arsenic, an example of a chemically hazardous Earth material 476 17.3.5 Health hazards due to radioactivity 477 17.3.6 Carbon sequestration to mitigate climate change 478 17.4 Hazards from volcanic eruptions 479 17.4.1 Monitoring active volcanoes 481 17.4.2 Lahars 482 17.5 Tsunamis 483 17.6 Ejecta from meteorite impacts 483 Summary 484 Review questions 486 Online resources 486 Further reading 487
Glossary Minerals and varieties Common igneous, sedimentary, 471 and metamorphic rocks 472 Index 474
489 515 517 519
Preface O
ver the past two decades, many curriculum changes have occurred in geology, Earth science, and environmental science programs in universities. Many of these have involved the compression of separate one-semester courses in mineralogy, optical mineralogy, and petrology into a single-semester offering that combines mineralogy and petrology, commonly called Earth Materials. Such a course is a challenge to the instructor (or a team of instructors) and the students. This is especially so when few, if any, textbooks for such a one-semester course have been available. This text, Earth Materials, is an introduction to mineralogy and petrology in which both subjects are covered with a roughly even balance. To keep this textbook reasonably short and applicable to a one-semester course, we decided against providing a shallow survey of everything and instead concentrated on what we consider the most fundamental aspects of the various subjects. In the writing of this text, we assumed that the students who enroll in an Earth materials course would have previously taken an introductory physical geology course, as well as a course in college-level chemistry.
Coverage Basic aspects of mineralogy must precede the coverage of petrology. This sequence is obvious from the chapter headings. After a brief, general introduction in Chapter 1, minerals and rocks are broadly defined in Chapter 2. That is followed by three chapters that relate to various mineralogical aspects and concepts. Chapter 3 covers the identification techniques that students must become familiar with to recognize unknown minerals in the laboratory and in the field. It also includes discussion of two common instrumental techniques: X-ray powder diffraction and electron beam methods. Chapter 4 covers the most fundamental aspects of crystal chemistry, and Chapter 5 is a short introduction to basic aspects of crystallography. Chapter 6 covers optical mineralogy. This subject is included so that instructors who plan to introduce thin sections of rocks in their course can give their students quick access to the fundamentals of optical mineralogy and the optical properties of rock-forming minerals. The sequencing of subsequent systematic mineralogy chapters is completely different from that most commonly used in mineralogy textbooks. In these chapters, minerals are discussed in groups based first on chemistry (native elements, oxides, silicates, and so on) and, subsequently, for the silicates, on structural features (layer, chain, and framework silicates, and so on). Here, the decision was made to group systematic mineralogy descriptions as part of the three major rock types: igneous, sedimentary, and metamorphic. This allows for the closest possible integration of mineralogy and petrology. Chapter 7 gives systematic mineralogical data on 29 of the most common igneous minerals, including, in order of decreasing abundance, silicates, oxides, a few sulfides, and a phosphate. This is followed by Chapter 8, which presents the most fundamental aspects of the formation of igneous rocks. Chapter 9 addresses the occurrence of igneous rock types, their classification, and plate tectonic settings. This approach is repeated with respect to sedimentary and metamorphic minerals and rocks. Chapter 10 gives systematic mineralogical descriptions of 14 common sedimentary minerals as well as phosphorite and soil. (The siliciclastic components of sedimentary rocks are discussed in Chapter 7, which deals with igneous minerals). Chapter 11 deals with the formation, transport, and lithification of sediment, and Chapter 12 discusses sedimentary rock classification, as well as the occurrence and plate tectonic setting of sedimentary rocks. Chapter 13 gives the systematic mineralogy of 26 of the most common metamorphic minerals, all of which are silicates, except for one, an oxide. Chapter 14 addresses the causes of metamorphism, gives rock classifications, and relates their occurrence to plate tectonic settings. Chapter 15 gives systematic mineralogical descriptions of selected minerals that are of economic importance. Chapter 16 gives a brief overview of some selected resources of Earth materials, and Chapter 17 discusses the health effects of several minerals and chemical elements, and the hazards presented by certain rock-forming processes. xiii
xiv
Preface
In the chapters that deal mainly with systematic mineralogy (Chapters 7, 10, 13, and 15), the main emphasis is on geologic occurrence (paragenesis), chemistry and atomic structure, physical properties that are pertinent to hand specimen identification (in laboratory sessions associated with an Earth materials course), and uses in industry and manufacturing. Hand specimen photographs and atomic structure illustrations are given for each mineral discussed. This text is meant to be not only a supplement to lectures but also a reference source in the applied laboratory sessions of the course. Basic concepts in crystal chemistry, crystallography, and the origin of various rock types are best presented by the instructor in lectures in the classroom. Mineral and rock identification and classification schemes, however, are best learned in the laboratory with hand specimens and thin sections, using those parts of the book that specifically address the applied aspects. All chapters begin with a boxed overview of what follows and end with a summary and set of review questions. When a new term is first encountered in the text, it is printed in bold type to signify that its definition is included in the glossary at the end of the text.
CRYSTALVIEWER The atomic structure illustrations, which are static images in this text, can also be viewed as interactive visualizations in CrystalViewer, a crystal structures visualization program for Mac and Windows. CrystalViewer is designed to provide the missing “third dimension” for crystal structure illustrations in the book. Each structure can be rotated and scaled with the computer mouse, and it is hoped that such interactive exploration will lead to an improved visual understanding of the complex three-dimensional atomic arrangements of minerals. The program contains 105 structure illustrations, which are distributed over two files. The PYROXENE first file, with the title “Learning,” contains 24 structures that are referenced with figure numbers from Chapters 2, 4, and 5. These 24 structures illustrate basic aspects of crystal chemistry. The other file, entitled “Reference” with 81 crystal structures, is arranged in alphabetical order, by mineral name. This file contains the structures of the rock-forming minerals discussed in Chapters 5, 7, 10, 13, and 15. These structures complement the structure illustrations in the text that show unit cell outlines, space group b
QUARTZ
a2
View down the c axis
a
notation, and legends with atomic site occupancies. The files and the CrystalViewer download are at www.cambridge.org/earthmaterials.
SiO4 a1
Our overall goal was the production of an accessible, highly illustrated and visually attractive, condensed and wellintegrated mineralogy-petrology textbook suitable for one-semester Earth materials courses. It is our hope that we have succeeded.
Acknowledgments C
ornelis Klein thanks Charles Langmuir, Professor in the Department of Earth and Planetary Sciences at Harvard University, for granting him permission (together with a professional photographer, David Nufer, of David Nufer Photography in Albuquerque, New Mexico) to access and photograph specimens from the Harvard Mineralogy Collections. David and I spent three full days there and with the full-time and very attentive help of Carl Francis (curator of the Harvard Mineralogy Museum and Collections) – whose enormous knowledge of the collections allowed us to locate the most appropriate specimens quickly – we completed all of the necessary hand specimen photography of the minerals for this text. Overnight lodging for our four nights in Cambridge, Massachusetts, was generously provided by Leverett House, one of the college houses of which I had been Allston Burr Senior Tutor between 1966 and 1970. We are most grateful to JoAnn DiSalvo Haas and Lauren Brandt for having provided us with some great student rooms. Throughout the two-year period devoted to the writing of my sections of this text, many colleagues, be it at the University of New Mexico or elsewhere, have been helpful and generous with their time in reviewing sections of text while still in progress. They appear here in alphabetical order: Adrian Brearley, Jonathan Callender, Brian Davis, Amy Ellwein, Maya Elrick, Dave Gutzler, Rhian Jones, Bruce Loeffler, Matt Nyman, Frans Rietmeijer, Malcolm Ross, Jane Selverstone, and Mary Simmons. I am grateful to David Palmer of CrystalMaker Software Limited, Yarnton, Oxfordshire, England, for providing expertise and guidance in the design of the crystal structure visualization program that accompanies this textbook. This book would not have been possible without the support and patient understanding of my wife, Shirley Morrison. The word processing of my part of this text was most efficiently and enthusiastically accomplished by Mabel Chavez of Santo Domingo Pueblo, New Mexico. Anthony R. Philpotts would like to thank the many reviewers who have painstakingly struggled through what we have written and suggested improvements. We have tried to incorporate as many of these as possible within the limits set by the length of the book. I would particularly like to thank Grant Cawthorn for one of the most thorough reviews I have ever received. His knowledge of igneous rocks and the photographs he provided have greatly benefited the book. Dan Kontak, Tony Morse, Brian Robins, and Jane Selverstone also offered valuable advice, as did numerous anonymous reviewers. I am grateful to all of them. While writing this book, I have greatly appreciated interactions with many colleagues. Jay Ague, Brian Skinner, and Leo Hickey at Yale University, and Sheila Seaman, Mike Rhodes, and Tony Morse at the University of Massachusetts have all provided me with geological insights. I have also learned a considerable amount about sedimentary rocks from Randy Steinen, formerly of the University of Connecticut, and Paul Olsen, of the Lamont-Dougherty Earth Observatory of Columbia University. I am grateful to the many petrology students I have had over the years. Their many questions and interests played a big role in how I taught the courses and in no small way have determined what, and how, petrology is presented in this book. Last, none of my part of this book would have been possible without the support of my wife, who allowed me to disappear into my study for fully two years. She is owed an enormous debt of gratitude, especially in view of the fact that when I finished revising my previous book (Principles of Igneous and Metamorphic Petrology), I promised her that it was definitely the last one!
xv
CHAPTER
1
Introduction
The Earth has had a long history – 4.56 billion years, give or take a few million – but most of its chemical elements were created at a much earlier time. Most of this book is devoted to how atoms (or ions) fit together to form minerals, the basic building blocks of the Earth, and how such minerals became part of what we refer to as rocks. In this introductory chapter, however, we briefly cover the evidence for where Earth’s chemical elements came from. Their creation occurred earlier in the history of the universe and was associated with processes taking place in stars and, in particular, those accompanying the death of massive stars. Material from these earlier stars was dispersed into space, and only much later did it come together to form the solar system and planet Earth. We also review the basic large-scale internal structure of the Earth. Although we never see material from deep in the planet, its composition and movement play important roles in determining processes that create the Earth materials that we see in the crust. Ever since its formation, the planet has been cooling, and a direct consequence of this process has been plate tectonics. We learn in later chapters that almost all new Earth materials are formed in specific plate tectonic settings, and it is, therefore, important to review this material before delving into the details of minerals and rocks.
This is a cross-section of a spherical chondrule composed mainly of the mineral olivine, Mg2SiO4, with interstitial glass and pyroxene. It is a piece of the Allende carbonaceous chondrite meteorite, which exploded over northern Mexico in 1969. The blue and yellow of the olivine are interference colors created by the interaction of transmitted polarized light with the crystal structure. Material such as this is believed to have accreted in the disk surrounding the Sun to form the planet Earth 4.6 billion years ago. Width of field is 2.6 mm. (Photograph courtesy of Rhian Jones, University of New Mexico.)
4
Introduction
This book provides an introduction to the study of the solids that make up planet Earth. These materials consist of naturally occurring chemical compounds, known as minerals, and their aggregates, rocks. Only through the study of minerals and rocks can we learn about the history of the Earth, and this knowledge is also important because of the extensive use made of Earth materials in everyday life, such as the fabrication of tools; the manufacture of vehicles; and their use as construction materials, sources of energy, and soils for agriculture. This knowledge is clearly important in the search for mineral resources, but the general public needs to know the finite nature of many of our natural resources to make informed decisions. Many different processes are involved in forming a rock from a group of minerals. These processes are normally divided into three general categories: ones involving molten material, which we call igneous; ones involving the weathering of rock and transport of sediment, which we call sedimentary; and those that modify rocks through changes in temperature, pressure, and fluids inside the Earth, which we call metamorphic. Throughout the book, we first introduce how to identify the minerals that are common in each of these main types of rock, and then we discuss the processes that lead to the formation of those rocks. These processes, many of which are intimately related to plate tectonics, have played important roles in the evolution of the planet. In the following chapters, we deal with these main types of Earth materials, but in this first chapter we look at where the materials that constitute the Earth came from, and we then review the Earth’s major structural units. The wide compositional range of the many minerals and rocks found on Earth must in some way reflect the composition of the Earth as a whole. It is natural, then, to wonder where the chemical elements that constitute the Earth came from and what determined their abundances. The Earth and solar system were formed 4.56 billion years ago, but none of the original planet has been preserved. The oldest rocks found to date are about 4 billion years old, although individual minerals have been found that are 4.4 billion years old. We are, therefore, missing about half a billion years of history. Fortunately, the study of distant stars provides glimpses into earlier times, and meteorites provide actual samples of material from which our planet is believed to have formed. Therefore, we start our study of Earth materials by briefly examining what astronomical and meteoritic studies tell us about the early history of the Earth.
their life fusing the hydrogen to form helium. Their lives can end in various ways depending on the mass of the star, with the more massive ones ending in cataclysmic explosions known as supernovae, during which elements heavier than iron are created. These explosions disperse material throughout space and form the raw material from which new stars and solar systems are formed. The Earth and other terrestrial planets in the solar system are formed from the chemical elements that were left over from these early supernovae and other evolved stars that collected together to form the Sun and solar system 4.6 billion years ago. When the universe began with the Big Bang ~14 billion years ago, only light elements such as hydrogen and helium and trace amounts of lithium, beryllium, and boron were formed. Subsequently, processes in stars formed heavier elements through nuclear fusion. Small stars, such as the Sun, fuse hydrogen atoms together to form helium, and late in their life, the helium atoms may fuse together to form carbon, but none of the heavier elements is formed. Stars that are more than eight times the mass of the Sun have greater gravitational attraction and can generate higher pressures and temperatures in their cores, which lead to additional nuclear reactions that create elements as heavy as iron. Once a star reaches the iron stage, it implodes under its own gravitational attraction and then explodes to form a supernova (Fig. 1.1). In these cataclysmic explosions, all the elements heavier than iron are formed.
1.1 Formation of Earth’s chemical elements in supernovae Earth materials are formed from chemical elements that have had a long history and whose origins we can explain through studies of distant stars and meteorites. Stars are born from the condensation mainly of hydrogen, and they spend most of
Figure 1.1 Cassiopeia A is a supernova remnant. This image, taken with NASA’s Chandra X-ray Observatory, allows us to identify the elements being created in the exploding star by the characteristic wavelengths of X-rays emitted by each element, which have been converted in this image to false colors. (Photograph courtesy of NASA.)
1.2 Birth of the solar system and Earth
Although supernovae occur in our part of the galaxy only once every few hundred years, they are relatively common in the center of the galaxy and in other galaxies. They have consequently been well documented. For example, NASA’s Hubble space telescope has provided spectacular photographs of these exploding stars, and the orbiting Chandra X-ray observatory allows us to identify the actual elements that are produced in a supernova (Fig. 1.1). The debris from a supernova initially forms clouds and jets of gas that are hurled out at enormous speeds from the exploding star (Fig. 1.1). These expanding clouds can remain visible for thousands of years. For example, the Crab Nebula is a supernova remnant from an explosion witnessed by Chinese astronomers in 1054 CE (common era). Today, this cloud is still expanding at the incredible velocity of 1800 km/s. Eventually, the material ejected from a supernova is dispersed throughout space, and it is from such material that our solar system was formed.
1.2 Birth of the solar system and Earth Most of the dispersed matter in the universe consists of hydrogen, with the heavier elements formed in stars constituting only a very small fraction. If the dispersed matter becomes clustered, it develops a gravitational field, which causes more material to be attracted to it. These gas and dust clouds contract under gravitational forces and form what is known as a nebula, which eventually collapses into a flattened rotating disk (Fig. 1.2). If
Figure 1.2 Hubble space telescope image obtained by the Near-Infrared Camera and Multi-Object Spectrometer (NICMOS) shows a star (IRAS 04302+2247) that is hidden by a nebular disc of material (diagonal dark region) similar in mass and size to the one that formed our solar system. Light from the star illuminates gas and dust that is still being pulled into the nebular disk. (NASA HST image.)
the nebula is sufficiently large, pressures and temperatures in its core are raised by gravitational collapse to a point at which nuclear fusion begins (10 000 000 Kelvin-degrees absolute), and a star is born. The critical mass required for fusion is ~80 times the mass of the planet Jupiter. The nebula that would become our solar system was formed slightly more than 4.56 billion years ago. Most of the material in that nebula collapsed inward to form the Sun, but some remained in the solar disc to form planets, moons, asteroids, meteorites, and comets. In the inner part of the disc, where temperatures were higher, elements like carbon, nitrogen, and hydrogen were present as gases, and solid material was composed of rock-forming elements such as silicon, magnesium, iron, and oxygen. Because silicon, magnesium, and iron are much less abundant than carbon, nitrogen, and hydrogen, the terrestrial planets (Mercury, Venus, Earth, Mars) and the asteroids, which formed in the inner solar system, are small. Farther out in the solar disc where temperatures were lower, ices of water, carbon dioxide, ammonia, and methane could also form, and because these involved the more abundant elements in the solar nebula, they formed the much larger outer gas giant planets (Jupiter, Saturn, Uranus, and Neptune). Because the Sun constitutes 99.9% of the mass of the solar system, its composition must be essentially the same as that of the nebula from which it formed. We can determine the composition of the outer part of the Sun from the strength of absorption lines in the electromagnetic spectrum that are characteristic of the elements. The Sun vigorously convects, so analyses of the photosphere, the light-emitting part of the Sun, are believed to represent a large part of the Sun. However, heavier elements are concentrated toward its core, so estimates of the solar system’s bulk composition from analyses of the photosphere take into account this distribution (Fig. 1.3(A)). The Sun is composed largely of hydrogen (74%) and helium (24%), with oxygen and carbon being the next most abundant elements, and all other elements being extremely minor. The planets, asteroids, meteorites, and comets were formed from particles in the solar nebula that accreted to form larger bodies. In the inner part of the solar disc, only the less volatile solids were available to form the terrestrial planets. Their compositions will differ from solar abundances in that they are depleted in the more volatile elements (Fig. 1.3(B)). Meteorites are natural objects from space that impact the Earth’s surface. During the early part of Earth’s history, these impacts led to the accretion of the planet. With time, the frequency of meteorite impacts decreased. Meteorites still impact the Earth and provide us with samples of the primordial material from which the Earth was most likely formed. Most come from the asteroid belt that lies between the orbits of Mars and Jupiter, but a very small number are composed of material that was blasted from the surface of the Moon and Mars by large meteorite impacts. Some meteorites are clearly fragments of planetary bodies
5
Introduction
Element H He O C Ne N Mg Si Fe S Ar Al Ca Na Ni Cr Mn P Cl K Ti Co
(A)
Bulk Solar System 2.431 x 10⁷ 2.343 x 10⁶ 14130 7079 2148 1950 1020 1000 838 445 103 84 63 58 48 13 9.2 8.4 5.2 3.7 2.4 2.3
8 Bulk Earth 6 3494 7 0.1 1061 1000 1066 169 97 71 10 58 15 2.5 11.5 0.1 0.6 3.2 2.6
7
log10 Element abundance in bulk Earth
6
6 5 4 Fe
3 Ca Al Ni Cr P Na
2 1
Ti Co
0 -1
O
Mg Si S
H
C
Mn K Cl
-1
0
1
N 2
3
4
5
6
7
8
log10 Element abundance in Solar System (where Si = 1000) (B)
that grew large enough to partially melt and undergo differentiation to produce iron-rich cores and silicate mantles, whereas others never grew large enough to differentiate. The most common type of meteorite is called a chondrite, because it contains small (millimeter-size) spheres known as chondrules, which consist of minerals composed mainly of silicon, oxygen, magnesium, and iron (Fig. 1.4 and chapteropening photograph). Chondrules are never found in terrestrial rocks. They are thought to have formed by flash heating and
Figure 1.4 A piece of the Axtell carbonaceous chondrite, which was found in Texas in 1943. The chondrite contains many small (millimeter-size), light-gray chondrules and a dark-gray matrix. The large white object in the center is an example of an inclusion, one of the oldest pieces of rock that formed in the solar system, 4.567 billion years ago. (Photograph courtesy of the Institute of Meteoritics, University of New Mexico.)
Figure 1.3 (A) Estimated abundances of elements in the bulk solar system (after Lodders, 2003) and the bulk Earth (after Newsom, 1995) based on the abundance of silicon in the solar system being 1000. (B) Logarithmic plot of element abundances in bulk solar system versus those in the bulk Earth. The less volatile elements have the same abundances in both bodies and hence plot near the red line (slope = 1), whereas the more volatile elements are depleted in the Earth.
melting of primordial dust particles in the solar disc at temperatures near 2000°C. What caused the heating is uncertain, but we know that the melting and subsequent cooling must have been rapid, over a period of hours, because of the form of the crystals, as, for example, the barred texture of the olivine in the chapter-opening photograph. Chondrules are among the first pieces of rock that formed in the solar system. The oldest objects in chondrites are so-called refractory inclusions (Fig. 1.4). These are made of exotic minerals rich in low volatility elements such as calcium, aluminum, and titanium. They are about 2 million years older than chondrules, and their formation ages are taken to be the age of the solar system itself, 4.567 billion years. Chondrites also contain rare, tiny mineral grains that are the debris from supernovae that took place before the solar system formed. The Earth is believed to have formed from accretion of material similar to that found in chondrites. Their composition is, therefore, used along with constraints set by the mass of the Earth, its moment of inertia, and known seismic discontinuities (see the following section) to estimate the Earth’s bulk composition (Fig. 1.3(A)). This estimate shows the Earth to be depleted in volatile constituents (e.g., H, C, N, O) compared with the bulk solar system, but the relative abundances of the less volatile elements are similar (Fig. 1.3(B)). For example, the abundances of magnesium, silicon, and iron are all about the same in the solar system (Sun) and the Earth. These three elements, along with oxygen, make up most of the Earth, with other elements being minor constituents. Therefore, it should not come as a surprise that many rock-forming minerals are compounds that include these four elements.
1.4 Internal structure of the Earth
1.3 Accretion and early history of the Earth Planet Earth is believed to have formed by the accretion of primordial solar material similar in composition to chondrites. As the planet grew larger, the kinetic energy of accreting material was converted to heat in the planet. Some of these early bombardments were so large that they actually knocked material off the planet. One such collision with a Mars-size body before 4.45 billion years ago removed material from Earth to form the Moon. During this early accretionary stage, the Earth was hot. Not only did accretion generate enormous amounts of heat, but also radioactive decay provided additional heat. Another important source of heat was the formation of the molten iron-nickel core. The oldest rocks on Earth indicate that a strong magnetic field already existed 4 billion years ago. The magnetic field is generated by convection in the molten metallic outer core, which must, therefore, have been present at that time. The energy released by sinking iron and nickel to form the core generated sufficient heat to melt a large fraction of the Earth. Arguments based on the abundance of radioisotopes of hafnium and tungsten indicate that the Earth accreted in about 10 million years and that core formation was completed by about 30 million years after accretion of the planet. The combined effects of accretion, radioactive decay, and core formation guaranteed that the Earth had an extremely hot birth, and early in its history the surface would have been completely molten. Since that time, the Earth has been cooling, and the dissipation of heat has been the most important planetary process, which has made the Earth a dynamic planet. The planet began to cool and solidify, and because of chemical variations and changes due to increased pressure with depth, a zoned planet was produced (Fig. 1.5). We have already seen that iron and nickel sank to form the core in the first 30 million years. As they sank, an equivalent volume of lower-density hot material would have risen toward the surface, which would have allowed its heat to be radiated into space and helped cool the planet. This cooling by transfer of hot material to cooler regions is known as convective cooling, and even though the outer part of the planet is now solid, convective cooling still remains the most effective way the planet has of getting rid of heat. The solidification of the planet has been a long, slow process, and it continues today, with the outer part of the core still molten. During this convective cooling of the planet, igneous processes redistributed elements, and the result is a compositionally layered planet.
1.4 Internal structure of the Earth The main evidence for layering in the planet comes from the study of the paths and velocities of seismic compressional (P) and shear (S) waves passing through the Earth. This evidence is
discussed in all introductory geology texts and is not repeated here. Instead, we simply review the main findings of these studies as they relate to the Earth’s internal structure (Fig. 1.5). The Earth’s radius is 6371 km, almost half of which (3483 km) is occupied by the metallic core, which is composed predominantly of iron and nickel but must also contain small amounts of light elements, such as silicon, oxygen, sulfur, and hydrogen. The core is slowly crystallizing from the bottom up, with the solid inner core having a radius of 1220 km. The temperature in the inner core is estimated to be above 5000 K, which is considerably hotter than the outer part of the core, which is about 4000 K. The inner core is solid not because of temperature but because of the extremely high pressure at the center of the Earth (364 GPa [billion pascal]; see Sec. 8.4). As the liquid in the outer core crystallizes onto the inner core, it liberates the latent heat of crystallization of iron and nickel, which helps drive the convection cells in the outer core, where the Earth’s magnetic field is generated. Above the core lies the largest unit in the earth, the mantle. Although the mantle is solid, it behaves as a plastic material that slowly convects. What is not clear is whether convection currents pass all the way through the mantle or convect in two separate layers, the lower and upper mantle. The division between these two parts of the mantle is the prominent seismic discontinuity at a depth of ∼660 km. The subduction of lithospheric plates into the mantle generates earthquakes that can be traced to a depth of 660 km but no deeper. Does this mean that material from the upper mantle cannot penetrate into the lower mantle, or does it simply mean that rocks below this depth are not sufficiently brittle to generate earthquakes? These two possible explanations have led to the two-layer mantle convection model and the whole-mantle convection model, which are illustrated in the left and right halves of Figure 1.5(C), respectively. Recent studies of seismic velocities in the mantle favor at least some subducted slabs penetrating to the depth of the coremantle boundary, where they may correlate with depressions on that boundary (Fig. 1.5(C)). Immediately above the coremantle boundary is the 100 km to 300 km-thick D′′ (D double prime) layer, which may be the graveyard of subducted slabs. This is a complex layer, but toward its base is a 5 km to 40 kmthick zone with ultralow seismic velocities, which undoubtedly indicate the presence of partially melted rock. It is possible that magmas that rise at hot spots such as Hawaii have their source in this zone. The upper mantle is bounded on its lower side by the 660 km seismic discontinuity. The region between this depth and another prominent discontinuity at 410 km is called the transition zone (Fig. 1.5(B)). Above this is the uppermost mantle, which terminates at the base of the crust at the prominent Mohorovicˇic´ discontinuity (or Moho). An extremely important zone marked by low seismic velocities occurs in
7
0 35 70
(A)
Lithosphere Asthenosphere Two-layer mantle Depth km 70 convection model Crust Upper 220 410 Midocean ridge Moho mantle 660 Transition ~1900 K tle zone Subduction zone r man 24 GPa ppe U Lower Back-arc mantle spreading axis Lower mantle
Whole-mantle convection model Delamination
Mantle
Lithosphere
Introduction
Asthenosphere km
8
~2500 K 136 GPa ~4000 K
D”
D” 2888 Liquid outer core
Hot spot
(B)
5151
Solid inner core 364 GPa 6371
Inner core
(C)
Geoid high
Depression on core-mantle boundary
Hot spot ~5000 K 329 GPa
Subduction zone Island arc
Outer core
Figure 1.5 Major structural units of the Earth. (A) Cross-section through the lithosphere. (B) Section through the Earth showing the depth, pressure, and temperature at major seismic discontinuities. (C) Cross-section through the Earth showing the two-layer and whole-mantle convection models (left and right, respectively). Bright green indicates parts of the mantle undergoing partial melting as it rises toward Earth’s surface.
the uppermost mantle between depths of 20 to 50 km beneath oceans and 70 to 220 km beneath continents. This zone is known as the asthenosphere, from the Greek word asthene-s, meaning “weak.” Its low velocities are attributed to the presence of very small amounts of melt, which weakens the rock. Above the asthenosphere, the uppermost mantle and overlying crust form the relatively strong lithosphere (Fig. 1.5(A)). The asthenosphere is of importance because it is on this weak layer that the lithospheric plates move around the surface of the Earth to give us plate tectonics. Finally, the crust is the outermost layer of the Earth. It is from 25 to 70 km thick beneath continents and 7 to 10 km thick beneath oceans. The rocks in the continental crust are less dense than those in the oceanic crust, and as a result of isostasy (buoyancy), continents stand higher than ocean floors.
1.5 Cooling of the planet and plate tectonics We know that the Earth’s interior is hot and that the planet is still cooling. Deep drill holes indicate that the temperature in the Earth increases by about 25°C per kilometer but can range from 10 to 60°C/km. This is known as the geothermal gradient. We also know that heat flows from high to low temperature and must, therefore, be escaping from the Earth. Knowing the thermal conductivity of rocks (0.005 cal/ cm s °C), we can calculate that a geothermal gradient of 25°C would result in 1.25 × 10⁻⁶ calories escaping from 1 square
centimeter of the Earth’s surface every second. By expressing this value as 394 kilocalories per square meter per year, we can better appreciate how small a quantity of heat this is. Recall that a calorie is the quantity of heat required to raise 1 gram of water 1 degree centigrade. We are perhaps more familiar with the calorie when used for the energy content of food, but the food calorie is actually a kilocalorie (kcal = 1000 cal). For example, when we see that a McDonald’s Quarter Pounder hamburger contains 410 calories, this is actually 410 kcal, which is almost the same as the amount of heat flowing from a square meter of the Earth’s surface in an entire year. Despite its low value, this heat flow is sufficient to make the Earth a dynamic planet. It drives convection in the mantle and the movement of lithospheric plates, which results in plate tectonics and the processes that create and destroy rocks. Calculations of the heat flow from the Earth have been performed on more than 24 000 drill holes over all of the continents and the ocean floor. These data have been synthesized by the International Heat Flow Commission to create the map shown in Figure 1.6 (see “Online Resources” at end of chapter). It uses SI rather than cgs units of heat flow; that is, milliwatts per square meter (mW/m2). If we convert the heat flow discussed in the previous paragraph (1.25 × 10⁻⁶ cal/cm2 s) to SI units, it becomes 50.2 mW/m2. On the map, this value can be seen to be at the high end of the pale blue regions and is typical of most continental areas. The heat-flow map shows that heat is not lost evenly from the planet. Indeed, most escapes from new ocean floor formed along
1.6 Plate tectonics and the formation of rocks
JF
PA
EA
NA
AR
CB
CC
I
PS
PA
AF SA
N
AU
S AA
0
40
60
85
120
180
240
350
Heat flow (mW m-2) Figure 1.6 Global heat flow as synthesized by the International Heat Flow Commission (www.geophysik.rwth-aachen.de/IHFC/heatflow.html). For discussion of the synthesis, see Pollack et al. (1993). Tectonic plate boundaries are shown by white lines, and the names of the plates are shown by letters, the full names of which are given in the text.
divergent tectonic plate boundaries. These regions, which constitute only 30% of the Earth’s surface, account for 50% of all heat lost from the planet. This shows that plate tectonics is intimately related to the planet’s cooling. Near the Earth’s surface, heat is transferred through rocks by conduction; that is, thermal vibrations of atoms are transferred to adjoining atoms down the temperature gradient. This is a slow process because rocks have such low thermal conductivity. In the Earth’s mantle, however, solid rocks are plastic and capable of moving, albeit very slowly. In this region, heat can be transferred by moving hot low-density rock from depth toward the surface to replace cooler higher-density rock that sinks. This sets up convection, which more efficiently transfers heat in the mantle than does conduction. The thermally driven mantle convection creates stresses in the lithosphere that result in plate tectonics. The motion of tectonic plates, in turn, controls processes that ultimately are responsible for the formation of igneous, metamorphic, and sedimentary rocks.
1.6 Plate tectonics and the formation of rocks The lithosphere, which consists of the crust and upper mantle, is about 100 km thick. It is broken into eight major plates and numerous smaller ones. The major plates, which are indicated
in Figure 1.6 by letters, include, in alphabetical order, the African (AF), Antarctic (AA), Australian (AU), Eurasian (EA), Indian (I), North American (NA), South American (SA), and Pacific (PA) plates. Some of the more important smaller plates include the Arabian (AR), Caribbean (CB), Cocos (CC), Juan de Fuca (JF), Nazca (N), Philippine Sea (PS), and Scotia (S) plates. Plate boundaries are of three types. At divergent plate boundaries, plates move apart and new crust is created by molten material rising from the mantle and solidifying to form new ocean floor, as occurs along the Mid-Atlantic Ridge and East Pacific Rise. At convergent plate boundaries, plates converge and crust is destroyed as it is subducted into the mantle, as happens to the Pacific plate, where it is subducted beneath the Aleutian Islands and Japan. Along transform plate boundaries, plates grind past each other along major faults, such as the San Andreas. Useful animations of these plate motions and reconstructions of past plate positions are given on the U.S. Geological Survey’s Web site referred to in “Online Resources” at the end of the chapter. The rates at which plates diverge from each other can be measured from magnetic anomalies on the ocean floor (see USGS animations). New crust formed at midocean ridges develops magnetic anomalies due to periodic reversals in the Earth’s
9
10
Introduction
magnetic field. As plates diverge, these anomalies are split apart, and by correlating similar age anomalies on either side of the spreading axis, the rate of divergence can be determined. These relative plate velocities can be as much as 160 mm/year but are typically about 40 mm/year, which is of the same order of magnitude as the rate at which your fingernails grow. Absolute plate velocities are not as easily determined but can be determined if we assume that hot spots, such as Hawaii or Yellowstone, have sources deep in the mantle that do not move relative to each other, which appears to be a good first approximation. As a lithospheric plate moves across a stationary hot spot, a string of volcanoes results that produce a hot-spot track. For example, the Hawaiian Island chain was created by the Pacific plate moving across the Hawaiian hot spot (Fig. 9.41). By dating the volcanoes along this track, the Pacific plate is shown to be moving at 95 mm/year in a direction N 59° W. Most rocks are formed by processes related to plate tectonics, and many are formed near plate boundaries. We can think of the location in which a rock is formed as a rock factory, and as we will see in later chapters, most of these factories are intimately related to specific plate tectonic settings. By way of introduction, we briefly describe these main plate tectonic settings.
1.6.1 Divergent plate boundaries The world’s most productive rock factories occur at divergent plate boundaries in oceanic regions, where molten material rises from the mantle and cools and solidifies to form new oceanic crust (Fig. 1.7(A)). The cooling gives these regions high heat flow (Fig. 1.6). While still hot, the new crust has lower density than older, colder crust, so it isostatically stands high and forms a midocean ridge. These ridges typically have a median valley, which slowly widens as the plates diverge and is the locus of much of the lava that erupts along these ridges. Much of the cooling of the new crust results from circulation of seawater through the rocks, which changes their minerals and results in metamorphism. As the plates diverge and cool, they become denser, and the ocean floor deepens. The new ocean floor receives a constant flux of sediment, which consists mainly of the bodies of pelagic organisms that sink to the bottom on dying. Because the ocean floor gets older away from a spreading axis, the thickness of this layer of sediment gradually thickens. If divergence occurs in a continental plate, the stretched lithosphere fails in the crust along normal faults to form a rift valley, whereas the asthenosphere rises from below (Fig. 1.7(B)). Sediment eroded from the highlands is washed into these basins, and magma formed in the rising asthenosphere forms igneous rocks. The sedimentary rocks are usually slightly metamorphosed.
1.6.2 Convergent plate boundaries The world’s second most productive rock factory occurs at convergent plate boundaries, where one plate is subducted beneath
another. If both plates involve oceanic lithosphere, the older, and hence denser, ocean crust is subducted beneath the younger ocean crust. If one plate is continental and the other oceanic, the oceanic plate, being denser, is subducted beneath the continent, as illustrated in Figure 1.7(C). When continental plates collide, the less dense crustal rocks resist sinking into the mantle and are crumpled to form major orogenic belts. Convergent plate boundaries have the greatest relief on the planet, ranging from the highest mountains to the deepest oceanic trenches. When oceanic rocks are subducted, the increased pressure causes metamorphism and release of water, which rises into the overriding plate, where it results in partial melting. The melt, being less dense than the solid rocks, rises toward the surface and forms the volcanoes that characterize most convergent plate boundaries. Radioactive decay in the thickened crust and the passage of magma through the crust raises its temperature and, along with the stresses caused by convergence, causes metamorphism in the orogenic belt. Erosion of mountains produces large amounts of sediment, much of which is rapidly transported to forearc basins. Behind many convergent plate boundaries, the lithosphere may be stretched, with formation of back-arc basins, which become sites of sediment deposition. If back-arc spreading continues, the lithosphere may rift apart and form new ocean floor. In oceanic trenches, deep ocean sediment may accumulate and, along with sediment spilling over from forearc basins, become intensely deformed and metamorphosed at the convergent plate boundary.
1.6.3 Transform boundaries Very few new rocks are formed at transform plate boundaries, but existing rocks become highly deformed by the shearing action of one plate grinding past the other. Irregularities along transform boundaries can result in formation of pull-apart basins, which become sites of sediment deposition (Fig. 1.7(D)).
1.6.4 Mantle plumes and hot spots Regions of long-lasting volcanism at relatively stationary positions on the planet are known as hot spots. As lithospheric plates pass over them, they leave a hot-spot track. The Hawaiian hot spot is one of the most prominent, but many others occur around the world. It has been postulated that hot spots form above mantle plumes that rise from deep in the mantle, possibly from as deep as the D′′ layer near the core-mantle boundary. On approaching the base of the lithosphere, these plumes are supposed to flatten out to form a large mushroom-shaped head (Fig. 1.7(E)). Considerable controversy surrounds the existence of mantle plumes. Early attempts to identify them seismically failed but did show that, if they exist, they must have small diameters at depth. Recent seismic studies, however, have been able to image the plume beneath Hawaii. The enormous amounts of heat
1.7 Outline of subsequent chapters
ridge cean Mido ial valley x and a
rm Transfo
lley Rift va
an
Divergent oceanic plates
o
Moh
(C)
Divergent continental plates
oo
r ro
cks
sin ba
(A)
(B)
n-fl
arc
in as cb ar h re nc Fo re ct ni
ho Mo
ea Oc
Oc ea
ic
rc -a ck Ba
Vo lc
cks tal ro inen Cont
Convergent oceanic and continental plates
New ocean floor
Terrestrial sediment
Failed arm Rift basin
rt basin
a Pull-ap
Marine sediment Deep ocean sediment Molten rock, magma
(D)
Metamorphism
(E)
Transform continental plate boundary
Mantle plume and triple junction
Upwelling mantle plume with some partial melt
Figure 1.7 Types of tectonic plate boundaries and sites of formation of igneous, sedimentary, and metamorphic rocks.
released at hot spots, such as Hawaii and Yellowstone, necessitate a deep source in the planet. Large mantle plumes in the geologic past are believed to have caused periods of extensive volcanism, during which huge volumes of new volcanic rocks were created in what are known as large igneous provinces (LIPs). The lithosphere above these plumes would have been heated and become less dense and hence risen to form large domes. As a plume head spreads, the lithosphere would have been rifted apart to form a triple junction (Fig. 1.7(E)). Commonly at these triple junctions, two of the rifts remain active and create new ocean floor, whereas the other rift becomes inactive or widens only slowly and is known as a failed rift. A mantle plume forming such a triple junction may be present beneath the Afar region of Ethiopia, with the Red Sea and Gulf of Aden being the active rifts and the East African rift being the failed arm (Box 8.4).
1.7 Outline of subsequent chapters In the following chapters, we discuss the mineralogical makeup of all the major rock types and discuss how and where they are formed and what uses we make of them. We start by learning
about the physical properties of minerals, which are used to identify them in hand specimens. Next we learn about the chemical makeup of minerals and the way atoms fit together to form crystalline structures, as well as their external crystal form and internal atomic arrangement. Another chapter provides instruction on how to use the polarizing petrographic microscope, one of the most useful tools for studying minerals and rocks. Armed with these tools on how to identify minerals, we proceed through the following chapters by first studying the common rock-forming minerals that occur in a particular rock type, which is followed by chapters dealing with the formation and classification of that rock type. We begin by discussing igneous minerals and rocks, because these would have been the first Earth materials formed and constitute the most abundant material in the crust. This is followed by sedimentary minerals and rocks, and finally we deal with metamorphic minerals and rocks. Throughout the book, we make reference to uses that are made of minerals and rocks, but in the penultimate chapter, we focus on some of the most important Earth materials that we make use of on a daily basis. This includes construction materials, clays for ceramics, metals from ore minerals, and energy sources.
11
12
Introduction
In the final chapter, we discuss the effects of Earth materials on human health, which can be positive or negative. This is a huge topic that we can only briefly touch on. Through food, we obtain nutrients from the Earth that are essential to our wellbeing. Feeding the ever-growing world population is an agricultural challenge that requires the use of fertilizers that come from the Earth. Some minerals are hazardous to our health. In some cases, these hazardous materials are part of the natural environment, but in others they are the result of human activity.
After reading this book, we hope that the reader will have an appreciation of how Earth materials came into existence and how we make use of them. A basic understanding of Earth materials is essential not only to the professional working with such materials but also to every human, because we interact with these materials every day, through tools we use, materials with which we construct, energy we use, and food we eat. Hopefully, this book will provide a basic understanding of Earth materials that will be useful to a wide spectrum of readers.
Summary This introductory chapter briefly summarized where the chemical elements that form the Earth came from, the planet’s main structural units, and the plate tectonic settings in which new rocks are generated.
• Most of the elements in the Earth, especially those denser than helium, were formed by processes occurring in stars and during explosion of massive stars (supernovae) early in the history of the universe.
• A solar system forms from the dispersed matter in space when a cloud of gas and dust collapses gravitationally into a rotating disc, with a star forming at the center of the cloud and the planets forming from the material in the disc.
• The Earth and solar system were formed from the debris from a supernova 4.56 billion years ago, but none of the earliest-formed material in the planet has survived, so we turn to meteorites to learn about the material that probably accreted to form the planet.
• The terrestrial planets are small because they are formed from the least abundant elements in the solar system, whereas the outer gaseous giant planets also include the more abundant elements.
• Chondritic meteorites, which contain small spheres of minerals composed of oxygen, silicon, magnesium, and iron, are thought to be composed of the same material that accreted to form the planet Earth. These four elements are the most abundant elements in the Earth.
• Heat from the accretion of the planet, radioactive decay, and core formation would have been sufficient to melt the outer part of the Earth early in its history. Since then, cooling has been the most important planetary process.
• The major divisions of the Earth are its core, mantle, and crust. The core, which is composed predominantly of iron and nickel, consists of an inner solid and an outer liquid core. The mantle is divided into upper and lower by a prominent seismic discontinuity at a depth of 660 km. The Mohorovicˇic´ discontinuity marks the boundary between the mantle and crust, at a depth of 7 to 10 km beneath oceans and 25 to 70 km beneath continents.
• The outer ∼100 km of the Earth forms the relatively strong lithosphere, which moves in a number of plates over the much weaker asthenosphere creating plate tectonics.
• The Earth is slowly ridding itself of internal heat at a rate of about 394 kcal/m2 year. As a result of plate tectonics, most of the internal heat is released from new ocean floor formed at divergent plate boundaries.
• Eight major and numerous smaller lithospheric plates have boundaries that are either divergent, convergent, or transform. • Relative velocities of plate divergence are on the order of 40 mm/year. • The largest volumes of new crust are formed at divergent plate boundaries, most along midocean ridges. • At convergent boundaries, oceanic crust is subducted into the mantle, but new crust is formed by the eruption of many volcanoes. • Sediments eroded from continents are deposited in basins that are formed at convergent plate boundaries, rift valleys at divergent plate boundaries and back-arc spreading axes, and pull-apart basins along transform boundaries.
• Mantle plumes are hypothesized to bring hot rocks up from deep in the mantle. Hot spots are believed to form from melts that rise from these plumes toward the surface.
• The spreading head of a mantle plume may be responsible for rifting of the lithosphere at triple junctions.
Review questions
Review questions 1. Where were most of Earth’s chemical elements formed? 2. Why are the terrestrial inner planets small compared with the outer gas giant planets? 3. What is a chondrule, and why do we use the composition of chondritic meteorites to determine the composition of the Earth? 4. What caused the Earth to be so hot early in its history that its outer part would have been molten? 5. What are the major divisions of the Earth? 6. What two important layers in the Earth are responsible for plate tectonics? 7. What are the main types of plate boundaries, and what types of rock might be formed there?
ONLINE RESOURCES www.geophysik.rwth-aachen.de/IHFC/heatflow.html – This is the Web site of the International Heat Flow Commission, where you can download the heat-flow map of the world and see other information relating to the Earth’s internal heat. http://www.nature.nps.gov/geology/usgsnps/animate/pltecan. html – This U.S. Geological Survey Web site provides useful animations of many aspects of plate tectonics.
FURTHER READING Cosmochemistry. Elements 7, no. 1 (2011). This issue comprises articles on the origin of the minerals and
elements that make up the planet Earth and the primordial solar nebula. Lodders, K. (2003). Solar system abundances and condensation temperatures of the elements. The Astrophysical Journal, 591, 1220–1247. Newsom, H. E. (1995). Composition of the solar system, planets, meteorites, and major terrestrial reservoirs. In Global Earth Physics: A Handbook of Physical Constants, ed. T. J. Ahrens, American Geophysical Union Reference Shelf 1, 159–189. Pollack, H. N., Hurter, S. J., and Johnson, J. R. (1993). Heat flow from the Earth’s interior: Analysis of the global data set. Reviews of Geophysics, 31, 267–280.
13
CHAPTER
2
Materials of the solid Earth
This chapter introduces minerals and rocks, the solid building materials of planet Earth. We define minerals and rocks and give examples of each from common daily uses. The main purpose of this chapter is to explain what minerals and rocks are with minor reference to specific names. Although we use several rock and mineral names in giving examples, these need not be memorized, because we encounter them in later chapters. In this chapter, it is important to understand what minerals and rocks are and to appreciate their differences. The examples of minerals and rocks that we encounter on a daily basis are given simply to emphasize the importance of Earth materials to our daily lives. Indeed, human cultural evolution is normally classified on the basis of the Earth materials used for making tools (e.g., Stone Age, Bronze Age, Iron Age). Although we have benefited from the use of Earth materials, some materials pose potential health hazards (e.g., asbestos). Rocks have provided the main source of construction material for large buildings throughout history, and even though modern buildings are mostly made of concrete and steel, the concrete is made with limestone. We end the chapter with a brief discussion of where rocks are formed. Rocks are the direct product of plate tectonic processes, and characteristic sets of igneous, sedimentary, and metamorphic rocks form in specific plate tectonic settings.
Ocean waves pounding the rocky coast of the Caribbean island of Aruba. Wave action is one of several physical processes that, together with chemical reactions, reduce rocks to fragments and mineral particles that are transported into deeper water, where they accumulate to form sedimentary layers on the ocean floor. The gently sloping terrace, part of which has recently collapsed, is an ancient wave-cut terrace formed during the former high stand of sea level in the last interglacial period 120 000 years ago. The terrace is cut into limestone that was formed by a coral reef that surrounded the igneous core of the island. A dark basaltic lava forms the coastal promontory just above the crest of the surging wave.
16
Materials of the solid Earth
This text has the title Earth Materials. An inclusive definition of Earth materials encompasses the following: minerals and rocks, which are the solid parts; soils, the unconsolidated materials above bedrock; fossil fuels, which include all the hydrocarbons used for fuel and energy – petroleum, natural gas, and coal; the various forms of H2O, in salt water and freshwater, in glaciers and ice caps; and the atmosphere, the mixture of gases that surrounds the Earth. This book is an introduction to the solid materials that compose the Earth, but short discussions of soils (Chapter 10), coal (Chapter 12), and H2O and fossil fuels (Chapter 16) are included. Solid materials are found abundantly underfoot on hiking trails in mountainous regions, but they are also present on beaches all around the globe. The solid materials in mountain chains, most commonly seen as outcrops in highway cuts, are rocks. Some common rock types are granite, basalt, limestone, and sandstone. The loose, solid materials on beaches consist mostly of the mineral quartz (with some minor components such as feldspar and mica grains mixed in) or calcite. Almost all beach sands are quartz rich, but some in the Caribbean consist mainly of granular calcite. This book deals extensively with various aspects of minerals and rocks, and our main objective is to understand their origin and identification. Therefore, we are concerned with the questions of why and how chemical matter (elements and ions) is organized into particular minerals and rocks, and how minerals and rocks react to physical changes (e.g., in temperature and/or pressure) in the Earth’s interior and to chemical changes in those exposed to the atmosphere. Parts of the text are also devoted to mineral and rock descriptions, because they are essential as basic knowledge for further discussion and for their identification in the laboratory or in the field.
2.1 Definition of a mineral A mineral is a naturally occurring solid, with an ordered atomic arrangement and a definite (but commonly not fixed) chemical composition. Almost all minerals are formed by inorganic chemical processes. This definition is most easily understood if we assess each of its clauses in sequence. Naturally occurring means that minerals are formed by processes that occur in nature and are not produced by laboratory processes. Many gemstones that occur naturally are today routinely manufactured in the laboratory. These are referred to as synthetic gems. Almost all reputable jewelers exhibit and sell naturally occurring gems such as emerald, sapphire, and so on. Specialty stores, however, might sell their synthetic counterparts. Such laboratory-produced materials should be identified with the prefix synthetic, as in synthetic emerald.
The word solid excludes liquids and gases. In solids, chemical elements (generally as ions, that is, electrically charged atoms) occur in fixed and regular patterns, which is not the case for liquids and gases. One very rare mineral that does occur as a liquid is mercury, Hg, in its elemental form. Mercury occurs in liquid spheres and globules and is a unique exception to the definition of a mineral as a solid. An ordered atomic arrangement requires that the internal structure of minerals consists of regularly repeated three-dimensional patterns of atoms, ions, or ionic groups that are held together by various chemical bonds. Solids that lack such a regular internal repeated pattern are referred to as amorphous. A definite (but commonly not fixed) chemical composition. The word definite means that all minerals have fixed ratios of cations (positive charge) to anions (negative charge). For example, in the simple mineral composition of quartz, SiO2, the cation (Si4+) to anion (O2–) ratio is 1:2. This is referred to as fixed because all quartz has this specific cation-anion ratio. A slightly more complex composition is shown by the mineral olivine, which is normally represented by the formula (Mg, Fe)2SiO4. The cationanion ratios in this formula are fixed as follows: (Mg2+, Fe2+) = 2, Si4+ = 1, and O2– = 4, which results in the ratio 2:1:4. Given that in the atomic structure of olivine the Si4+ occurs as (SiO4)4– anionic complexes with a tetrahedral outline, these ratios can be rewritten for (Mg, Fe)2SiO4 as 2:1. In olivine, the Mg2+ and Fe2+ ions (which have the same electrical charge and similar ionic sizes and can, therefore, be housed in the same atomic site in the olivine structure) can substitute for each other freely, which leads to the clause “but commonly not fixed.” Most mineral compositions have such chemical substitutions in their formulas; therefore, the majority of mineral compositions show considerable chemical variability, although the overall cation-anion ratios remain fixed. “Formed by inorganic processes” reflects the fact that all common rock-forming minerals are the result of inorganic chemical processes. This does not mean that there are no exceptions to this statement. The mineral calcite, CaCO3, which is the constituent of mollusk shells, has been deposited by the organic soft parts inside the shell, and as such it is of organic origin. Bones and teeth in the human body consist of a form of the mineral apatite, Ca5 (PO4, CO3)3 (OH, O, F), which in this instance is of organic origin. Those two examples are exceptions to the statement that minerals are formed by inorganic processes. These organically formed species are normally included in any listing, or catalog, of minerals. An example of an organic material that is definitely excluded, although commonly sold as a gem in jewelry stores, is amber. This is because amber does not fit most of the criteria outlined in the preceding mineral definition. It not only is always of organic origin but also is a hard, brittle, fossil resin that lacks an ordered atomic internal structure and has a highly variable (not fixed) chemical composition. Because it is a very attractive solid material, especially when polished, with an appealing yellow to brown
2.1 Definition of a mineral
1 mm Cl– Na+
(C)
(B)
Figure 2.1 (A) A standard container of table salt, NaCl, with some salt in a Petri dish. (B) A perspective view of the internal atomic structure of NaCl with an overall cubic outline. (C) Salt grains from the Petri dish in (A) photographed by scanning electron microscopy. This shows perfect cubic cleavage fragments with somewhat beveled corners and edges as a result of abrasion. The abrasion is due to the juggling of salt grains in the large container during transport. (Photograph courtesy of Adrian Brearley, University of New Mexico.)
(A)
color, it is sold among other gems, most of which are inorganic in origin and fit the definition of a mineral, as given already.
2.1.1 Examples of some familiar minerals At this stage, let us review a few minerals that you may have some familiarity with: halite, quartz, talc, chrysotile (one of
several “asbestos” minerals), and garnet. This brief overview of the five minerals will aid in your understanding of the definition of a mineral given in the prior section. All five minerals are naturally occurring inorganic solids. They also have regular atomic internal structures, and their composition (or range of composition) is a function of the 1 mm
O2– O2–
O2–
(A)
Si4+
O2–
(B)
(C) 1 cm
SiO4
(D)
(E)
Figure 2.2 (A) On the left, a drawing of a central Si4+ ion surrounded by four O2– ions; on the right, a schematic representation of the same, showing the outline of a tetrahedron (from the Greek tetra, meaning “four,” and hedron, meaning “plane”), a four-sided geometric shape. (B) Euhedral (meaning “well formed”) crystals of quartz, SiO2. (C) Beach sand consisting mainly of well-rounded translucent and milky quartz grains. Several of the colored grains are quartz with colored inclusions and/or feldspar. (D) A perspective view of the internal, atomic structure of quartz, consisting of a network of linked (SiO4)4– tetrahedra. (E) A synthetic crystal of quartz, which, due to the conditions of growth in high-temperature vessels in the laboratory, has a very different external shape from crystals that occur in nature (see Fig. 2.2(B)). Long dimension of crystal is 8 cm.
17
18
Materials of the solid Earth
internal structure as well as the chemical composition of the source from which each mineral crystallized. Halite, also known as table salt, has the composition NaCl (Fig. 2.1(A)). Halite is a member of a group of minerals known as halides in which the anion is Cl–, Br–, F–, or I–. Halite has a simple, highly symmetric structure (see Fig. 2.1(B)) that leads to a cubic external shape (the grains in saltshakers, when observed with magnification, are all little cubic fragments, known as cleavage fragments, not little cubic crystals; Fig. 2.1(C)). Naturally occurring halite has a composition very close to NaCl, because K+, which occurs in the mineral sylvite, KCl, with the same structure as NaCl, has an ionic radius much larger than that of Na+. The two cations, therefore, have difficulty substituting for each other in the same structural space. Halite is extracted from sedimentary rocks known as evaporite deposits. It is also extracted
from large evaporative ponds (created by the diking of shallow seas) along the coast of countries with arid, desertlike climates, through evaporation of seawater. This type of halite is produced by natural processes in a manmade system. However, it is still referred to by its mineral name. The other four minerals in our list are all silicates. In these the (SiO4)4+ ionic group is the basic building block, in the form of a tetrahedron (a four-sided geometrical body), which occurs in the structure of almost all silicates (Fig. 2.2(A)). The manner in which these tetrahedra are linked to one another and to cations in the silicate structure is what creates the large variety of silicates. Quartz, SiO2, is familiar in many ways (Fig. 2.2(B)). It forms the rounded sand grains on beaches (Fig. 2.2(C)); it is the loose granular material used in sandboxes; and as crushed,
(A)
Mg2+ Si4+
(B) 100 μm
(C) Figure 2.3 (A) Hand specimens of talc, Mg3Si4O10(OH)2. (B) Commercial containers of baby (talcum) powder and cosmetic facial powder. Two dishes, with talc and facial powder, respectively. (C) A perspective view of the layered internal atomic structure of talc. The Mg2+ ions are sandwiched between two opposing sheets of (SiO4)4– tetrahedra. (D) Talcum powder from the Petri dish in (B) photographed by scanning electron microscope. This shows the somewhat variable grain size of the tiny (very soft) flakes at about 400× magnification. (Photograph courtesy of Adrian Brearley, University of New Mexico.)
(D)
2.1 Definition of a mineral
angular grains, it is the abrasive component of many standard sandpapers. Its structure consists of a close linking of (SiO4)4– tetrahedra (Fig. 2.2(D)) that is devoid of any other chemical elements. It is so consistently of constant SiO2 composition that it is commonly referred to as a pure substance. This is in contrast to the compositional variability of many other silicates. Quartz sand is an important component of cement in the construction industry, and it is a source of material for making silica glass. The manufacture of synthetic quartz crystals is also an important industry. Because perfect quartz crystals (perfect meaning “no defects” of any sort in clear quartz; i.e., no cracks, no bubbles, no inclusions of fluids or of other minerals) are difficult to obtain consistently from natural occurrences, synthetic quartz is routinely manufactured (Fig. 2.2(E)). This quartz is used for highly specialized electronic applications, such as the timing mechanism in quartz watches. Talc, Mg3Si4O10(OH)2, is a chemically more complex mineral than quartz (Fig. 2.3(A)). This mineral, packaged and sold as talcum powder, is a material that has likely been part of your
life since birth (Fig. 2.3(B)). Talc is a versatile mineral used in cosmetic products, in ceramics, in the paper industry, in vulcanizing rubber, and in paint production. The atomic structure of talc consists of sheets of (SiO4)4– tetrahedra (cross-linked by Mg2+ ions in between), producing a flat sandwichlike arrangement (Fig. 2.3(C)). These structural layers are responsible for the thin, somewhat flexible folia that pure talc exhibits in nature. In the manufacture of cosmetic products, the original talc is ground very finely in roller mills to preserve the original platy structure of the mineral during milling (Fig. 2.3(D)). In most cosmetic products made mainly of talc, some minor other materials are added, such as coloring agents and scent. Talc has very little variation in its chemical composition; as such, the formula Mg3 Si4O10(OH)2 applies to most of its occurrences. Chrysotile, Mg3Si2O5(OH)4, is a mineral that you may not have heard of. Instead, you may have read articles, or seen programs on television, on the health issues associated with asbestos. The word asbestos is a commercial term that includes six naturally occurring minerals, of which chrysotile is by far the Tetrahedral layer
Mg-rich layer
(B)
(A) 100 nm
5 nm
(E) (D)
(C)
Figure 2.4 (A) A hand specimen of chrysotile, Mg3Si2O5(OH)4. Note the very fibrous and flexible nature of this naturally occurring substance. (B) A schematic representation of the coiling of the atomic layers that produce a tubelike habit (the fibrous habit) of chrysotile. The layers differ from that of talc (Fig. 2.3(C)) in that an opposing tetrahedral sheet is missing. (C) Transmission electron microscope image of synthetic chrysotile fibers showing that their internal structure is comparable to that of drinking straws. (D) High-resolution transmission electron microscope image of a cross-section of a drinking straw, showing the coiled nature of the structure. ((C) and (D) courtesy of Alain Baronnet, CINaM-CNRS, Centre Interdisciplinaire de Nanosciences de Marseilles, France.) (E) Laboratory gloves, used in high-temperature experiments, woven from very flexible and strongly insulating, naturally occurring chrysotile fibers.
19
20
Materials of the solid Earth
most common. About 95% of asbestos that was used commercially was chrysotile (Fig. 2.4(A)). The other 5% consisted of a very different structure type, known as an amphibole (with the mineral crocidolite being the most common constituent). The chrysotile structure consists of atomic layers that are coiled to form hollow tubes like a drinking straw (Fig. 2.4(B)–(D)). These flexible fibers can occur naturally as bundles, similar to yarn (Fig. 2.4(A)) and can, therefore, be woven into cloth, which was used in suits and gloves for firefighters (Fig. 2.4(E)) before it was banned in the United States. The main use of chrysotile was as insulation of the internal steel structures of skyscrapers (to protect against meltdown in case of fires) and in many building materials. It has long been shown that chrysotile is rather harmless, and it is clear that banning this material from many products has been unwise. The health controversy about asbestos is discussed in Chapter 17. The chemical composition of chrysotile is rather constant and is well represented by the formula Mg3Si2O5(OH)4. Garnet is the birthstone for January and has been commonly used as a red gemstone, especially in jewelry of the Victorian Era (1837–1901). Garnet often shows up in antique and estate jewelry (Fig. 2.5(A)). This common association of the red color in garnet jewelry gives the impression that garnet as a gem is generally of a reddish color. In reality, garnet includes a closely related group of rock-forming minerals of a wide range of colors, from pink to brown, yellow, green, orange, and black. Garnet commonly occurs in good crystal forms, one of which is known
as a dodecahedron, consisting of twelve parallelogram, diamond-shaped faces (dodeca, from the Greek meaning “twelve”; Fig. 2.5(B)). Garnet is also familiar because it is used in a variety of abrasive applications (because of its high hardness and sharp broken edges) as in garnet paper (used in specialized applications in the finishing of leather, hard rubber, and plastics). The internal, atomic structure of garnet is a compact and complex arrangement of independent (SiO4)4– tetrahedra (Fig. 2.5(C)) bonded to cations such as Ca2+, Fe2+, Mn2+, Mg2+, as well as Al3+, Fe3+, or Cr3+. The compactness of its structure is reflected in its density (or specific gravity), which is considerably higher than that of other silicates. As seen from the foregoing listing of ions that may occur in its structure, the chemical composition of garnet is highly variable. Six specific garnet compositions include the following: Mg 3 Al 2 (SiO 4 )3 Fe3 Al 2 (SiO 4 )3 Mn3 Al 2 (SiO4 )3 Ca 3 Al 2 (SiO 4 )
pyrope almandine spessartine grossular
Ca 3Fe 32+ (SiO4 )3 andradite Ca 3Crr2 (SiO 4 )3 − uvarovite In other words, garnets are a good example of a mineral group in which the cation-to-anion proportions are fixed, at 3:2:3, but
Pyrope - Mg3Al2(SiO4)3
(A)
Mg2+
(B)
Al3+ Si4+
(C) Figure 2.5 (A) A garnet necklace of Victorian design. This type of red garnet is referred to as Bohemian garnet in the trade. It is a red garnet of pyrope composition. (Courtesy of Ron Beauchamp, Beauchamp Jewelers, Albuquerque, NM.) (B) Examples of the relatively common occurrence of garnet in well-formed (euhedral) dodecahedrons. Two almost perfect crystals, as well as a small wooden model of the same dodecahedron, used in laboratory teaching of crystal forms. (C) A perspective view of the complex and densely packed atomic structure of a garnet of composition Mg3Al2(SiO4)3, known as pyrope. The overall outline of the structure is that of a cube.
2.3 How are minerals named?
the amounts of a specific cation, in a specific atomic (structural) site, are highly variable. Garnets have also been synthesized in the laboratory. The reason for such synthetic production was that some garnets with very unusual compositions (that do not occur in nature) were found to be fairly good imitations of diamond. These synthetic garnets (with an internal structure identical to that of natural garnet) have extremely unusual compositions that include elements such as yttrium (to produce YAG, an abbreviation for yttrium aluminum garnet) and gadolinium and gallium (GGG, a gadolinium gallium garnet). These synthetic simulants of diamond have been surpassed in popularity since the synthesis of cubic zirconia, ZrO2, in 1976, as an almost perfect inexpensive simulant for natural diamond, with the composition of carbon, C. The name garnet is very dear to one of the authors, Anthony R. Philpotts, because the maiden name of his wife, Doreen, is Garnet, and they now live in Connecticut, whose state mineral is garnet.
2.2 How are minerals classified? Since the mid-nineteenth century, minerals have been systematically grouped into different chemical classes on the basis of their chemical composition. Such groupings are based on the composition of the dominant anion or anion complex. For example, minerals with sulfur, S2–, as an anion are grouped under sulfides; those with (SiO4)4–, as an anionic group, are silicates. The broadest classification subdivisions used in all mineralogical literature are based on the anionic unit in the chemical formula as indicated in the following: • Native elements
Au, Cu, Pt
• Sulfides
ZnS, FeS2, CuFeS2
• Sulfosalts
Cu3AsS4, Cu12Sb4S13
• Oxides
Al2O3, Fe3O4, TiO2
• Hydroxides
Mg(OH)2, FeO(OH)
• Halides
NaCl, KCl, CaF2
• Carbonates
CaCO3, CaMg(CO3)2
• Phosphates
Ca5(PO4)3(F, Cl, OH)
• Sulfates
CaSO4·2H2O
• Tungstates
CaWO4
• Silicates
Mg2SiO4, Al2SiO5
Approximately 4150 minerals are known, of which 1140 are silicates; 624, sulfides and sulfosalts; 458, phosphates; 411, oxides and hydroxides; 234, carbonates; and 90, native elements.1
1
These data were provided by J. A. Mandarino, Toronto, Ontario, Canada in March 2006. A complete listing of all chemical classes is given in Klein and Dutrow, 2008, p. 333.
In this text, we systematically review only about 85 minerals, of which the majority are silicates. The remaining minerals are members of the carbonate, oxide, hydroxide, phosphate, sulfide, and native element classes. The reason for this small number is that these 85 represent the most common minerals that enter into the composition of the most abundant rock types. This small number of minerals is, therefore, referred to as the rock-forming minerals. Combinations of these minerals reflect the composition of the most common rock types, and they are the basis for rock classifications.
2.3 How are minerals named? The naming of minerals is an interesting but not a scientific process. Many common mineral names date from times when there were essentially no scientific tools to classify, define, or describe a mineral quantitatively. The name quartz is of obscure origin but dates back to the Middle Ages, when it was first applied to describe waste material produced during mining (such waste is now referred to as gangue). The name feldspar is derived from the word feldtspat, given in 1740 to the presence of spar (spath) in tilled fields overlying granite bedrock in Sweden. The name garnet is very likely derived from the Latin granatum, for “pomegranate,” because of its similarity in color to that of the fruit pulp. Since these early days, when quartz, feldspar, garnet, and other common mineral names were chosen, the process by which a new mineral species must be uniquely defined has become a very demanding, quantitative scientific process, but the naming of a new mineral is still left to the investigator who discovered the new mineral species. In the twentieth century, there has always been a clear set of regulations that mineralogists have had to follow in the characterization of a newly discovered mineral. Since 1959, the Commission on New Minerals and New Mineral Names of the International Mineralogical Association (IMA) has been internationally recognized for the purpose of controlling the introduction of new minerals and new mineral names and of rationalizing mineral nomenclature. This commission maintains a Web site (http://pubsites.uws.edu. au/ima-cnmnc/). The abbreviation CNMNC stands for its new name: Commission on New Minerals, Nomenclature, and Classification. If an investigator thinks that he or she has discovered a new mineral, a scientifically complete report on all aspects of the new mineral’s chemical and physical properties must be submitted for review to the commission. An international committee of mineralogists reviews the report. The naming of the mineral by the original investigator is by far the easiest and most fun part. Minerals can be named after the original locality of the find (e.g., aragonite, CaCO3, – with an internal structure that is distinctly different from that of calcite,
21
22
Materials of the solid Earth
also CaCO3 – after a locality in the Aragon region of Spain); after some major chemical constituent (as in molybdenite, MoS2, because molybdenum is the only cation in the structure); after all of the cations, K+, Al3+, and Si4+, in a mineral (as in kalsilite, KAlSiO4); or after a famous personality (as in sillimanite, Al2SiO5, after Benjamin Silliman, 1779–1864, professor of chemistry and mineralogy at Yale University). If you are so lucky as to discover a new mineral, the choice of the name is pretty much up to you.
2.4 What is a crystal, and what is the crystalline state? The majority of minerals occur as relatively small, irregular grains in an interlocking pattern with other minerals as the constituents of various rock types. These grains are generally less than 1 cm in diameter and are irregular in shape. So, where do the beautifully shaped large crystals come from that are commonly exhibited in natural history museums and highquality rock shops (Fig. 2.6)? These have most commonly been carefully extracted (mined) from unique geologic occurrences
known as veins (most desirable with open spaces known as vugs) and as pegmatites. Veins are lenticular or tabular bodies, commonly with some coarse-grained minerals, which may cut across the structure seen in the bedrock. Veins are mostly the result of mineral deposition in free spaces in a fracture (fissure) that either was opened or was gradually opening during the period of mineralization. Open spaces (or vugs) are commonly the sites from which prospectors and mineral collectors retrieve beautifully crystallized mineral specimens, with large crystals that grew in these open spaces (Fig. 2.7). Pegmatites are exceptionally coarse-grained igneous rocks, usually found as irregular dikes, lenses, or veins. In general, their mineral grain size is well more than 1 cm in diameter (see Fig. 8.22). All three – veins, vugs, and pegmatites – are the main source of well-formed large crystals. What is a crystal? A crystal can be defined as a mineral, or other crystalline chemical compound (a solid with a specific chemical composition), with an external shape bounded by smooth plane surfaces (Fig. 2.8). Such a crystal shape is the outward expression of its ordered internal, atomic arrangement. Crystals can be described as perfect, good, or malformed,
Figure 2.6 A hand specimen of beautifully crystallized green microcline feldspar (known as amazonite) and smoky quartz crystals. The crystals in this museumquality specimen grew freely in an open space (a vug) without interference from adjoining minerals.
2.4 What is a crystal, and what is the crystalline state?
Quartz crystals
Open space (vug) partially filled with well-formed (euhedral) pyrite, FeS2, crystals
Wall rock Wall rock
Open space (vug)
10 cm
Massive pyrite
Figure 2.7 A schematic cross-section of a vein that is the result of open space filling. Well-formed quartz crystals grew perpendicular to the walls of the host rock. Some open spaces (vugs) still remain. One is empty, and the other is partially filled with well-formed cubic crystals of pyrite.
depending on how well the external shape reflects the overall symmetry inherent in the internal atomic arrangement. Perfect crystals or crystal groupings are what museum curators collect for mineral exhibits open to the public. Three other terms that are commonly applied to crystals to describe the perfection (or lack thereof) of their external shape are euhedral, subhedral, and anhedral. Euhedral, interchangeable with perfect, describes a crystal with excellent crystal shape (eu, from the Greek, meaning “good,” and hedron, meaning “plane”). Subhedral describes mineral grains (and crystals) that are partly bounded by good crystal faces, as well as faces that may have been crowded by adjacent mineral grains (sub, from the Latin, meaning “less than”). Anhedral is applied to mineral grains that lack well-formed crystal faces as a result of having grown against adjacent minerals during their crystallization (an, from the Greek, meaning “without”). The majority of mineral grains that compose various rock types are anhedral to subhedral because such grains were generally in contact with neighboring grains (without open spaces) during their growth. The term crystalline is applicable to all solid materials that exhibit an internal, ordered arrangement of the constituent atoms
Figure 2.8 Examples of some very well-formed (euhedral) crystals. From left to right: a milky, translucent crystal of gypsum; a red crystal of tourmaline; a transparent, light blue crystal of aquamarine (a gem variety of the mineral beryl); and a red crystal of ruby (a gem variety of the mineral corundum).
23
24
Materials of the solid Earth
(or ions) forming a repetitive three-dimensional pattern. This crystalline state may be expressed in esthetically pleasing large, euhedral crystals (Fig. 2.8). Most rock-forming minerals that are part of various rock types occur as anhedral to subhedral grains, lacking any outwardly observable symmetry that might reflect their internal structure. Even these anhedral grains, however, have internal ordered atomic structures with specific chemical compositions that reflect their temperature or pressure of formation. In other words, all minerals (not just well-formed crystals) are part of the crystalline state. The crystallinity of smallgrained, anhedral minerals can be proved by optical techniques, by X-ray diffraction methods, electron beam methods, and others (see Chapter 3). Minerals (and other materials) that lack the ordered internal arrangement are referred to as amorphous.
2.5 What is a rock? A rock is simply a naturally occurring consolidated mixture of minerals. It is the solid material that makes up the Earth. We saw in Chapter 1 that the Earth’s composition reflects the abundance of elements formed in a supernova and later modified by accretionary process during formation of the solar system. We have also seen that a mineral has a restricted compositional range. It is unlikely, therefore, that in any given part of the Earth, this bulk composition can be incorporated into a single mineral. Instead, a number of minerals must form to accommodate all of the elements present, and this mixture is a rock. What do we mean when we say that rock is consolidated? In general, rocks are harder, and in many cases, much harder, than the soils that blanket the Earth’s surface. Where highways cut through rock, drilling and blasting are often required to remove the material. Some rocks are quite soft but are still more competent than loose surficial materials. It is the strength of rocks that allow high mountain ranges to stand tall or quarry walls or road cuts to stand at steep angles (Fig. 2.9). A rock’s strength is determined by the way the individual mineral grains are intergrown with one another and the strength of the individual minerals. For example, the grains of quartz in Figure 6.14(A) have sutured boundaries, so they fit together like the pieces in a jigsaw puzzle. The rock shown in Figure 6.5, from the Giant’s Causeway, in Northern Ireland, consists of an interlocking network of feldspar and pyroxene crystals. Because of the even distribution and random orientation of the crystals, this rock has no planes of weakness and, as a result, is one of the toughest rocks known. Quarrying of this rock type, which is popularly known as trap rock (from the Dutch word trap, meaning “stairs,” which often describes the topography on these bodies of rock) is a major worldwide industry because, when crushed, the rock forms the most durable aggregate to mix with asphalt for paving roads (Fig. 2.9). The way in which individual mineral grains are intergrown in a rock is referred to as texture (Fig. 2.10(A)). Larger-scale
Figure 2.9 The active north face of Tilcon’s North Branford quarry, Connecticut, where a thick basaltic lava flow is quarried for its extremely durable rock that is used as aggregate and mixed with asphalt to pave roads. This quarry produces 20 000 tons of crushed trap-rock aggregate per day.
features, which commonly reflect uneven distributions of minerals such as compositional layering, are referred to as structure (Fig. 2.10(B)). Textures and structures develop when rocks are formed, and hence they reveal much about their origin. The texture and structure of rocks, along with their composition and absolute age, preserve the record from which Earth’s history is revealed. Being able to correctly read the textures and structures in rocks is, therefore, of paramount importance. We discuss here only a few of the most important points about rocks and how they are formed.
2.6 How do rocks form? Classification into igneous, sedimentary, and metamorphic Although the solid Earth is made of rocks and rocks are found everywhere, the formation of a rock is a rare event. In all likelihood, if you look at a geological map of the region where you live, you will find rocks that formed a long time ago, and there may have been only a couple of times in all of Earth’s history that rocks were formed in your region. Rock formation is a rare occurrence because the conditions required for their formation occur only in a few places on Earth at any given time. Many rocks form in response to the Earth’s continuous attempt to cool down from its fiery beginning. We saw in Chapter 1 that early in Earth’s history the planet was almost totally molten. Its surface would have been covered by molten rock, a magma ocean. Since then, enormous amounts of heat have been lost into space, and almost all of the Earth’s crust and mantle have solidified. The cooling still causes the solid mantle to convect, which in turn moves lithospheric plates across the surface of the planet. This plate motion sets up conditions necessary for the formation of rocks.
2.6 How do rocks form? Classification into igneous, sedimentary, and metamorphic
1 mm
(A)
(B) Texture
Structure
Figure 2.10 (A) Texture refers to the way individual mineral grains are intergrown. It is seen best in thin sections of the rock under a polarizing microscope, as seen here in this photomicrograph of a basaltic rock from the Bird River Sill, South Africa. This texture is described as ophitic, meaning that small plagioclase feldspar crystals (gray) are completely embedded in larger crystals of pyroxene (brightly colored grains). Photograph taken under crossed polarized light (see Chapter 6 for explanation of polarized light). (B) Structure refers to larger-scale features that are commonly evident at the hand specimen or outcrop scale. This sample of granite from Kangasala, Finland, exhibits an orbicular structure, where concentrations of light and dark minerals form concentric rhythmic layers around a central inclusion. Swiss army knife for scale.
Throughout Earth’s history, the largest production of rocks has involved the partial melting of the mantle, followed by the buoyant rise of the melt into the crust, and the eventual solidification of the melt. Molten rock is known as magma, and rocks that form from the solidification of magma are known as igneous rocks. Most of the crust is made of rocks that were initially igneous. The formation of igneous rocks transfers heat from within the Earth to near the surface, where it can be more easily released into space. Although igneous rocks are the most abundant rocks in the crust as a whole, most shallow crustal rocks are formed from the consolidation of sediment and are known as sedimentary rocks. Energy from the sun drives the hydrologic cycle, which causes weathering and transport of sediment. A sedimentary rock forms if this sediment finds a basin in which to accumulate. Most sediment accumulates in the sea, but some can be
trapped in continental basins that develop in response to plate tectonics. Tectonic plates continuously move across the surface of the Earth at rates of centimeters per year. When rocks, whether of igneous or sedimentary origin, find themselves in new environments where pressures and temperatures are different from where they formed, minerals change to equilibrate with their new environment, and a new rock is formed. Rocks that are formed in response to changes in environmental factors, such as pressure, temperature, or fluid composition, are described as metamorphic rocks. Most of the reactions involved in metamorphism consume heat and, therefore, help cool the Earth. Although we began by saying that most rocks in the crust are of igneous origin, many of these have subsequently been metamorphosed and, along with metamorphosed sedimentary rocks, constitute ~60% of the crust.
25
26
Materials of the solid Earth
Distinguishing between igneous, sedimentary, and metamorphic rocks is usually simple at both the outcrop and microscopic scales. Most igneous rocks form relatively homogeneous massive bodies, which if crystallized in the crust may be relatively coarse grained. If the magma erupts onto the surface, the grain size is much finer, but the rock forms characteristic volcanic structures. Most sedimentary rocks are layered, with the layering generally paralleling the surface on which deposition occurs; this is usually close to horizontal, especially when the sediment is fine grained. Metamorphic rocks have textures that indicate recrystallization of minerals. If only heating is involved, the recrystallized grains form equidimensional polyhedra. If directed pressures are involved, as would occur, for example, at convergent plate boundaries, the metamorphic rocks commonly produce a prominent foliation, such as that found in slate, which is used for roofing tiles. Under the microscope, the three types of rock are usually easily distinguished. Igneous rocks typically consist of minerals that show a sequence of crystallization. The earliest crystallizing minerals tend to be well formed (euhedral), and because they start growing first, they tend to be larger than other crystals in the rock. These early formed crystals are known as
1 mm
(A)
phenocrysts. They are surrounded by other later crystallizing minerals that form a groundmass (Fig. 2.11(A)). In contrast, the grains of many sedimentary rocks show evidence of transport and rounding through abrasion (compare Figs. 2.2(C) and 2.11(B)). These grains are the most resistant minerals to abrasion, with quartz being by far the most common. The sedimentary grains are commonly cemented together by quartz or a carbonate mineral. Transport also tends to separate grains on the basis of size and density. As a result, most sedimentary rocks are layered, with material in individual layers sharing similar transport properties. The largest volumes of metamorphic rock are formed near convergent plate boundaries, where subducting slabs are raised to such high pressures that they release fluids that rise into the overriding slab, where they promote metamorphism. Because these rocks develop on a regional scale, they are described as regional metamorphic rocks. This is in contrast to metamorphic rocks developed on a local scale near igneous intrusions where heat and fluids escaping from the cooling body produce contact metamorphic rocks. Regional metamorphic rocks formed near convergent plate boundaries undergo recrystallization in a directed stress field, which causes elongate and platy minerals to align perpendicular
1 mm
Igneous
(B)
1 mm
Sedimentary
(C)
Metamorphic
Figure 2.11 Typical igneous, sedimentary, and metamorphic rocks as seen in photomicrographs of thin sections under low magnification. (A) Basalt from the 1959, Kilauea Iki, Hawaii, lava lake, containing phenocrysts of olivine (clear) in a groundmass of brown pyroxene and opaque ilmenite. The olivine phenocrysts have inclusions of a still earlier opaque chromium-rich spinel. Plane polarized light. (B) Photomicrograph of a thin section of sandstone showing subrounded grains of quartz surrounded by dark clay particles and quartz cement. Plane polarized light. (C) When Avalon and North America collided to form the Appalachian Mountains in southern New England, metamorphism of muddy sedimentary rocks resulted in the growth of mica crystals (bright blue and red) that were preferentially oriented perpendicular to the maximum compressive stress. The result was a strongly foliated rock that we call schist. Crossed polarized light.
2.7 Examples of some familiar rocks
1 cm
Figure 2.12 Sedimentary, igneous, and metamorphic rocks from Montreal, Quebec. The gray rock is Ordovician limestone, formed from the accumulation of calcium carbonate mud on the ancient continental shelf of North America. In the Cretaceous Period, this rock was intruded by hot mantle-derived basaltic magma, which solidified to form black igneous rock. Heat from the intrusion drove hydrocarbons out of the limestone at the contacts with the igneous rock to produce a white metamorphic rock, marble.
to the maximum compressive stress. Regionally metamorphosed rocks are, therefore, typically foliated (Fig. 2.11(C)), in contrast to contact metamorphic rocks, which typically exhibit no foliation whatsoever (Fig. 2.12). All three major rock types are illustrated in the sample shown in Figure 2.12 from Montreal, Quebec. The main rock type in this sample is a sedimentary rock formed by the accumulation of calcium carbonate (CaCO3) mud near the shore of North America during the Ordovician Period (450 Ma). Because it is composed of calcium carbonate, it is called a limestone (lime being CaO). It is dark gray because it contains hydrocarbons, which were formed from the remains of animal and plant matter that accumulated with the mud. During the Cretaceous Period (110 Ma), magma from the Earth’s mantle intruded this gray limestone along numerous fractures to form small black dikes. As the magma cooled and crystallized to form the black basaltic igneous rock, the liberated heat expelled the hydrocar-
bons from the limestone, converting it to a white contact metamorphic rock called marble. The relation between the three main rock types in this sample leads to a clear relative chronology; that is, the limestone is the oldest rock because it was intruded by the basalt, and the metamorphism is clearly a consequence of the intrusion of the basaltic magma. Although not evident in the photograph, the limestone contains fossils that are indicative of the Ordovician Period, and the igneous rock has been dated as Cretaceous by absolute methods based on the radioactive decay of uranium to lead. In this way, we piece together Earth’s history from the record preserved in rocks.
2.7 Examples of some familiar rocks Most people are familiar with a number of common rocks and their uses. The most familiar rocks are those used for building materials, but rocks have many other important uses in
27
28
Materials of the solid Earth
(A) Figure 2.13 Rapakivi granite is one of the most common decorative building stones. It is shipped from quarries in southern Finland all over the world. Its characteristic texture is created by large rounded pink crystals of alkali feldspar rimmed by grayish-green plagioclase feldspar.
everyday life, such as supplying us with a variety of raw materials, including fossil fuels, or acting as reservoirs for water and oil. In this section, we consider just a few familiar rock types. Perhaps the most familiar rock of all is granite. It has been used as a building stone since Egyptian times, and, because of its great durability, it has been popular for tombstones and other memorial structures. Even today when large buildings are made of steel and reinforced concrete, granite is still used as a decorative facing stone. One of the most common of these stones is rapakivi granite, which is shipped from southern Finland all over the world. It has a characteristic appearance with large round phenocrysts of pink alkali feldspar surrounded by narrow rims of greenish-gray plagioclase feldspar in a groundmass of pink alkali feldspar and quartz (Fig. 2.13). In the polished stone business, the word granite has come to mean any hard homogeneous igneous rock and includes rocks that are very different in composition from granite. In geological usage, granite refers to a coarse-grained igneous rock composed of approximately two-thirds alkali feldspar and one-third quartz. The continental crust has a composition very similar to granite. Most large bodies of granite have formed by melting of the lower crust. Although granite may be the most familiar igneous rock, by far the most abundant rock on the surface of the planet is the volcanic rock known as basalt. Most of the ocean floors and large parts of continents are underlain by basaltic lava flows. Because the lava cools quickly under water and on land, the rock is fine grained, and because it contains ~50% iron-bearing minerals, it is a dark color (see Sec. 3.3), in contrast to the light color of granite, which contains only small amounts of ironbearing minerals. We see basalt erupted from volcanoes such as those in Hawaii (Fig. 2.14), but the largest volumes of basalt, especially that on the ocean floor, have erupted from long
(B) Figure 2.14 Basaltic lava erupting from Pu‘u ‘O‘o in the east rift zone of Kilauea on the Big Island of Hawaii in March 2004. (A) Aerial view of the summit crater with steam rising from several small active vents. The crater rim was breached in the foreground and lava poured down the slope to produce the patchy light and dark colored rock. Once a crust had formed the lava continued to flow beneath the surface and extrude on the lower slopes of the volcano. (B) Molten lava that has traveled from the summit of Pu‘u ‘O‘o, which is seen in the background, extrudes from beneath the bulbous crust of the flow. By traveling beneath a surface crust, lava retains its heat and is able to flow greater distances.
fissures rather than central vents. Although basalt may not be as familiar a rock as granite, the chances are that you come in contact with it far more than any other rock type. Worldwide, basalt is the preferred rock for aggregate to be mixed with asphalt for paving roads (see trap-rock quarry, Fig. 2.9). It is by far the most durable rock for this purpose and is always used as long as a source is not too distant to make transportation costs prohibitive. It is also a dense rock, and hence the aggregate is commonly used for railway beds and to stabilize freshly excavated slopes along, for example, highway cuts through surficial material that may be prone to slump. A number of sedimentary rocks play important roles in modern life. Limestone is perhaps the most familiar sedimentary rock. Massive varieties have long been a popular building stone, because it is soft and easily quarried, yet is remarkably strong.
2.7 Examples of some familiar rocks
Unlike most other rocks, limestone slowly dissolves in rainwater – only rock salt is more soluble. When limestone is exposed to weathering, it rapidly develops solution features, which characterize what is known as karst topography (Fig. 2.15(A)). Beneath the surface, solution leads to the development of caves (Fig. 2.15(B)). Solution plays an important role in converting beds of limestone into important aquifers and reservoirs for oil. For example, the Cretaceous Edwards limestone in Texas was exposed to a period of weathering shortly after its deposition and developed extensive solution channels. The limestone was later covered by clay, which was formed from the weathering of volcanic ash. The clay was subsequently converted into an impervious rock known as shale. The shale now caps and confines the water in the Edwards limestone, making it one of the world’s largest aquifers, supplying water to more than 2 million people in south-central Texas. Caves, with their stalactites and stalagmites (Fig. 2.15(B)), attest to how easily CaCO3 can be moved around by solutions. In some regions where there is a source of heat, large convecting groundwater systems can be set up, and when the hot water comes out on the surface, it forms a geyser. If the circulating water passes through carbonate-bearing rocks, it is typically supersaturated in CaCO3 when it pours out on the surface and cools. The result is precipitation of layers of calcite to form a rock known as travertine. Travertine is commonly
(A)
(B) Figure 2.15 (A) Rainwater percolating through fractures in limestone causes solution and the development of karst topography. In this scene from the Cirque de Mourèze, Languedoc-Roussillon, France, pillars of dolomitic (CaMg(CO3)2) limestone have been left standing between the joints along which solution occurred. (B) Beneath the surface, solution of limestone forms caves. At times when the water becomes supersaturated with calcium carbonate, calcite is precipitated to form stalactites, where water drips from the roof, and stalagmites, where drips land on the floor of the cave. Large open channels, such as the one seen here in Harrison’s Cave, Barbados, make many limestones important aquifers.
(A)
(B)
(C)
Figure 2.16 (A) Statue of a lion in the Piazza della Signoria, Florence, carved from travertine limestone, which is formed by deposition of CaCO3 from hot springs. The layering seen in the lion is the result of the continuous buildup of successive layers of calcium carbonate. (B) Travertine tends to be highly porous and may precipitate around the roots of plants that later decay and disappear, leaving tubular holes as seen in this close-up of the pedestal beneath the lion’s tail. Photographs in (A) and (B), courtesy of Laura Crossey, University of New Mexico. (C) Michelangelo’s unfinished Blockhead Slave shows the partially completed sculpted body in a 9-foot-high block of Carrara marble. The statue is in the Galleria dell’Accademia, Florence, Italy.
29
30
Materials of the solid Earth
Figure 2.17 Spider rock, in Canyon de Chelly (pronounced “Shay”), Arizona, consists of hard cross-bedded sandstone that was formed from sand dunes that drifted across a desert on the western side of the Pangaea supercontinent during the Permian.
of sedimentary rocks that were formed when the vegetation in coastal swamps and deltas was buried beneath layers of sand and pebbles to form a rock sequence consisting of coal, sandstone, and conglomerate, respectively (Fig. 2.18). One of the most common metamorphic rocks is slate, which is a fine-grained rock that can be split into extremely thin but large sheets. It is composed largely of small crystals of mica, whose parallel alignment (see Fig. 2.11(C)) gives the rock its ability to cleave. It is also chemically resistant to weathering but is soft and can be easily cut into desired shapes. Before the relatively recent introduction of asphalt roofing tiles, slate was one of the most widely used materials for covering roofs. Huge quarries, such as those in Wales (Fig. 2.19), attest to the amount of material removed for this purpose. Perhaps the largest sheets of slate are used in the manufacture of high-quality pool (billiard) tables, where it is important to have an absolutely flat surface that will not warp. Blackboards in classrooms were also originally made from slate, but these are now usually made of green frosted glass. As the temperature of metamorphism increases, mica crystals grow larger and become visible in the hand specimen to form a rock known as schist. With further increases in temperature, mica reacts with other minerals and contributes to the formation of garnet (Sec. 2.1.1), which is one of the most common high-temperature metamorphic minerals. The appearance of garnet and other granular minerals at the expense of mica converts foliated schist into a hard layered rock known as gneiss, and if the temperature is high enough, the rock can actually begin to melt and form a mixed metamorphic-igneous
rather porous and, being made of the soft mineral calcite, is easily cut into blocks for building purposes or flooring tiles. It has also been used for statues, as seen in the example of the lion in Figure 2.16(A). Limestone is also the raw material from which cement is made. Cement, in turn, is mixed with sand and gravel in roughly 30:70 proportions to form concrete. Today, the construction industry uses, worldwide, a staggering 8 billion tons of concrete per year; that is, more than 1 ton of concrete for every person on the planet each year. This enormous production is accompanied by the release of carbon dioxide into the atmosphere, which is of concern because of its greenhouse effect on the climate. Sandstone is another familiar sedimentary rock. Most sandstone is composed of quartz (Fig. 2.11(B)), a mineral that is almost chemically inert. Sandstone is, therefore, a very resistant rock, commonly forming prominent cliffs (Fig. 2.17) and providing a source of building stone. When the grains of quartz in sandstone are not completely cemented, the rock can have a high porosity, which makes it a good aquifer or reservoir rock for oil. Another important sedimentary rock is coal, one of the main sources of fossil fuel. Coal beds occur in sequences
Figure 2.18 Coal bed in a syncline exposed in a road cut near McAdoo, Pennsylvania. At the far end of the road cut, alternating green and red sandstone and shale are overlain by a thin bed of coal, which in turn is overlain by lighter colored sandstone that coarsens upward and, at the top of the road cut, contains small pebbles of quartz (a rock known as conglomerate). Nearby, thicker beds of coal have been mined for the much-prized slightly metamorphosed coal known as anthracite. The syncline is cut by at least two thrust faults.
2.8 Plate tectonics and the generation of rocks
formed from the metamorphism of limestone (Fig. 2.12). It is used both as a construction material and as a decorative facing stone. It also is the favorite material of sculptors, because it is soft enough to carve easily, yet has considerable strength. One of the most famous sources of marble is from Carrara, ~100 km west-northwest of Florence, Italy. This is where Michelangelo spent considerable time looking for just the right piece of marble for his next statue (Fig. 2.16(C)).
2.8 Plate tectonics and the generation of rocks Figure 2.19 One of the many quarries in northern Wales from which slate has been extracted for roofing tiles.
rock known as migmatite. Migmatites commonly exhibit interesting structures that make them popular in the stone industry for use as decorative kitchen countertops. For example, the countertop illustrated in Figure 2.20 is of a garnet-rich migmatite from Brazil. The wispy white patches are composed of granite that segregated as a liquid from the solid garnet-rich part of the rock. The patches pinch and swell as a result of deformation that occurred at the time of melting. In contrast, a later dike of granite that cuts the rock can be seen to be un-deformed. The quarrying of high-grade metamorphic and igneous rocks for the manufacture of countertops has become a big business, with Brazil, India, and China being some of the major producers. Another common metamorphic rock is marble, which is
Plate tectonics, which is driven by the cooling of the planet, sets up the conditions necessary for the formation of igneous, sedimentary, and metamorphic rocks. Most rocks are formed at specific plate tectonic locations, which we can think of as rock factories – the places where rocks are made in response to plate tectonic-related processes. At each factory, suites of rocks are formed that are characteristic of the particular plate tectonic setting. In later chapters, we see specifically what these rock associations are, but in this section we outline where these rock factories are located with respect to plate tectonics and mention only briefly the rocks they produce. Figure 2.21(A) shows a schematic cross-section through the outer part of the Earth at a convergent plate boundary where an oceanic lithospheric plate is being subducted beneath a continental plate. At the left side of the diagram, the midocean ridge is a divergent plate boundary. Although the figure is static, it is important to keep in mind that the plates are moving (yellow arrows) at rates of centimeters per year. This motion develops relief on the surface of the planet and disturbs the temperature and pressure distributions in the rocks beneath. These disturbances are the primary causes for rock formation; rocks form in an attempt to eliminate the perturbations caused by plate motion. The main plate tectonic settings where rocks are formed are listed across the top of the cross-section in larger print, and the actual rock types formed are given below in smaller print. Photographs of particular rock types associated with particular settings are keyed to the cross-section by bold letters (B–G).
2.8.1 Midocean-ridge rock factory
Figure 2.20 Kitchen countertop made from high-grade metamorphic rock from Espirito Santo, Brazil. The rock contains abundant red garnet (see Fig. 2.5). It also contains irregular light-colored streaks of granite, which were formed when this rock reached a high enough temperature to begin melting. Much of the deformation that can be seen in this rock probably took place while it was partly molten. A straight, un-deformed granite dike cutting the metamorphic rock must have intruded at a later date. (Photograph courtesy of Tim Wawrzyniec and Amy Ellwein, University of New Mexico.)
By far the largest rock factories on Earth occur along midocean ridges, where tectonic plates move apart (Fig. 2.21(B)). The divergence makes room for magma to rise along fractures to form steeply dipping sheetlike bodies of igneous rock known as dikes and to erupt on the ocean floor along the rift valleys located on the crest of the oceanic ridges. As much as 20 km3 of new rock are formed per year along the 65 000-km-long midocean ridge system. This is an order of magnitude more than is erupted subaerially. The igneous rock formed here is always of
31
32
Materials of the solid Earth
(B)
(C) Midocean ridge
Mantle plume Hot spot
(D)
Subducting oceanic plate
Volcanic zone Delamination of base of crust Andesitic
Continent
volcanoes
Ocean water circulating through hot rock (B)
Sediments in oceanic trough
Forearc basin sediments
(C)
(E)
Granite batholith
Pillow b a
salt
50
0°C
High-K basalt
Sediments from shallow epiric seas
(F) (D) (G)
Moho 500°C
Lithosphere
High-T, high-P metamorphism
Low-T, high-P metamorphism with loss of H2O and CO2
Asthenosphere
Dense meta-basalt (eclogite) sinks
(A) (E)
Passive margin
High-T, low-P metamorphism
Moho
Asthenosphere
Ancient rift basins
(F)
(G)
Figure 2.21 (A) Cross-section of the lithosphere extending from a midocean ridge (left) through a convergent plate boundary (center) to a passive continental margin (right). Letters in the cross-section (B–G) refer to the photographs of rocks formed at specific plate tectonic settings. (B) Pillows of basaltic lava erupted on the ocean floor in an outcrop on the island of Cyprus, where part of the Mediterranean ocean floor is exposed. (C) When a subducting plate reaches a depth of about 100 km, water is released that rises into the overlying wedge and causes melting. This magma rises to form conical andesitic volcanoes, such as Osorno in Chile. (D) Volcanic rocks associated with rift basins are commonly erupted from long fissures to form thick basaltic lava flows, known as flood basalts, as seen here at Palouse Falls, in eastern Washington. (E) Steeply dipping beds of Ordovician Martinsburg shale and sandstone near Shippensburg, Pennsylvania. These sedimentary rocks were tipped on end during the Appalachian orogeny, which also began to convert the shale into a metamorphic rock with a slaty cleavage dipping to the left in the photograph. (F) Red arkosic sandstone and black shale in the Mesozoic Hartford Rift Basin in Connecticut. (G) Potsdam Sandstone in Ausable Chasm, New York, was deposited as a quartz-rich sand on the Cambrian shore of North America.
2.8 Plate tectonics and the generation of rocks
basaltic composition, and because it is formed at a midocean ridge, it is commonly called a midocean ridge basalt (or MORB for short). This is the most abundant rock on the surface of the planet, covering most of the ocean floor. Because it erupts beneath water, its surface cools rapidly and commonly develops meter-sized blobs of lava known as pillows (Fig. 2.21(B)). Almost no sedimentary rocks are formed in this environment. Midocean ridges are typically far from any continental source of sediment. The sediment that does eventually accumulate on this newly formed ocean floor consists of silica-rich mud formed from the skeletons of radiolaria, minute pelagic organisms that build their bodies from silica. This radiolarian ooze accumulates slowly, so only as the ocean floor gets older away from the divergent plate boundary does it attain significant thickness. Another important rock-forming process takes place in the vicinity of midocean ridges. The ridges stand high relative to older ocean floor because they are still hot and, thus, float higher than does older denser oceanic crust. Seawater circulates through the newly formed crust and helps cool it. As much as 34% of the total amount of heat lost through the ocean floor is estimated to be removed by this circulation, and the entire volume of water in the world’s oceans circulates through oceanic ridges every 8 million years. This enormous circulation of hot water through the rock leads to hydrothermal alteration, with many of the original igneous minerals being converted to hydrous and carbonate minerals. These newly formed minerals play an all-important role in triggering rock-forming processes when the oceanic plate is subducted at a convergent plate boundary.
2.8.2 Convergent-plate-boundary rock factory Although midocean ridges are the most productive rock factories on Earth, most rocks they produce are subducted back into the mantle at convergent plate boundaries (Fig. 2.21(A)). As slabs subduct, the increased pressure causes the hydrothermal alteration minerals that were formed in the basalt as it cooled at the midocean ridge to react and liberate water and carbon dioxide, which rise into the overlying mantle wedge. These volatile constituents, especially water, lower the melting points of rocks, and magma is formed. The magma rises toward the surface and forms a chain of conical-shaped volcanoes, which are built of lava and ash ejected during volcanic explosions. The main rock type is known as andesite, which contains a little more silica than does basalt but otherwise looks very similar (Fig. 2.21(C)). The higher silica content makes the magma more viscous than basaltic magma, which accounts for the steep slope on the volcanoes, but it also prevents gas escaping easily from the magma. These magmas typically contain a considerable amount of water, which was derived from the subducting oceanic plate, and when they approach the surface, exsolving gas can cause violent volcanic explosions, which
deposit layers of ash over large areas. Not all magma rises to the surface to form volcanoes. Some may pond near the base of the continental crust, where it causes melting of crustal rocks to produce granitic magma, which may solidify at depth to form large bodies known as batholiths (Fig. 2.21(A)). Granitic batholiths form the core of many mountain chains developed at convergent plate boundaries. The relief created in the overriding plate at convergent boundaries, both through folding and thrusting of existing rocks and through the growth of new volcanoes, creates ideal conditions for the generation of sediment. Rivers transport the sediment rapidly to the ocean, with the finest sediment making it out into the deep waters of the forearc basin formed above the subducting slab. The rapid accumulation of coarser sediment near the shore leads to unstable conditions, with the sediment slumping and moving to deeper water in the form of mudflows and turbidity currents. These dense suspensions are able to transport coarser sediment great distances out into the forearc basin. Deposition from turbidity currents results in graded layers that vary from coarse at the base to fine at the top. These sediments are converted to shales and sandstones that become highly deformed as they are scraped off the subducting plate and accreted to the orogenic wedge. Figure 2.21(E) shows steeply dipping shales and sandstones of the Ordovician Martinsburg formation in Pennsylvania, which were deposited in a forearc basin that developed during the closing of the Iapetus Ocean.
2.8.3 Continental divergent-plate-boundary rock factory (rift valley) Divergent plate boundaries can occur within continental plates, with formation of rift valleys. The East African Rift is a modern example of such a boundary. Figure 2.21(A) shows paleo-rift basins, such as those that developed in eastern North America and Morocco when Pangaea rifted apart to form the Atlantic Ocean. The relief along rift valleys results in rapid transport of sediment into the rift, and as these depositional basins are on continents, the oxygen in the atmosphere keeps iron in the sediment in its ferric state, which stains many of these rocks red. Some sediment containing organic matter, however, is black because it accumulates under anaerobic (no oxygen) conditions in deep lakes that develop along rift valleys (Fig. 2.21(F)). Because the transport distance from highland to basin is commonly short, the harder minerals, such as quartz, have insufficient time to abrade and eliminate the softer minerals such as feldspar. Consequently, the sandstones contain considerable amounts of feldspar and are known as feldspathic sandstone. As sedimentary basins form on the Earth’s surface in response to rifting, the mantle beneath rises, decompresses, and partially melts to form basaltic magma, which erupts from long fissures paralleling the rifts. This develops outpourings of basaltic magma that form large flat lava flows known as flood basalts (Fig. 2.21(D)).
33
34
Materials of the solid Earth
2.8.4 Mantle plume hot-spot rock factory Other important igneous rock factories occur at hot spots, which form above what are believed to be mantle plumes that rise from possibly as deep as the core-mantle boundary (Fig. 2.21(A)). Hot spots remain relatively stationary on the planet while tectonic plates move independently above them. This independence might suggest that hot spots are not part of the plate tectonic cycle, but they undoubtedly play a major role in the convective transfer of heat through the mantle and crust. The best-known hot spot is located beneath the island of Hawaii (Fig. 2.14), with its trail of islands and seamounts bearing witness to the motion of the Pacific plate across the hot spot (Fig. 9.41(A)). Basaltic rocks are the primary igneous rock formed above hot spots, but if the hot spot rises beneath a continental crust, as it does beneath Yellowstone National Park, for example, a wide range of igneous rocks can form, including granite (Fig. 9.20).
2.8.5 Passive-margin rock factories When continents rift apart to form an ocean, passive margins form; that is, the edge of the continent simply abuts the new ocean floor that was formed along the rift. The relief along such margins is typically low, and the supply of sediment to the newly formed continental margin is slow. Wave action along the shoreline has ample time to abrade soft minerals and to sort the sediment on the basis of grain size. The result is a sequence of flat-lying or gently dipping sedimentary rocks that range from quartz-rich sandstone to shale (Fig. 2.21(G)). Limestone may also be part of the sequence if the sediments accumulate where the climate is warm enough to promote abundant growth of organisms with carbonate skeletons or shells. The Bahamas is a modern-day example of such an environment. As passive margins migrate away from spreading axes, the oceanic crust cools and subsides, making room for deposition of considerable thicknesses of sediment.
2.8.6 Epeiric-sea rock factories The rate of tectonic plate motion is not constant and at times is significantly greater than at others, as indicated by variations in the width of magnetic anomalies on the ocean floor. For example, the Atlantic Ocean is opening at a couple of centimeters per year. In contrast, India split away from Madagascar at the end of the Cretaceous at ∼10 cm/year toward Asia. During periods of rapid plate motion, midocean ridges become more active and more new hot ocean crust is created. As a result, ocean ridges become larger and displace ocean water onto the continents to form shallow epeiric seas. Deposition in these shallow seas can result in extensive beds of flat-lying sedimentary rocks that do not owe their present location to a specific plate tectonic setting but nonetheless are formed in response to plate tectonic processes. Much of the central part of North America is covered with sedimentary rocks formed
in these shallow seas. Minor flooding of the continent can also occur as a result of the melt-back of continental ice sheets and to local tectonic conditions.
2.8.7 Metamorphic rock factories In a static Earth, the temperature everywhere would increase at the same rate with depth, so that a given temperature would always be found at the same depth. The Earth, however, is dynamic and the temperature variation with depth changes dramatically with plate tectonic setting. For example, if we were to drill a deep hole in a stable continental region, we would find that a temperature of 500°C would be reached at a depth of ~20 km (based on a common geothermal gradient of 25°C/km). The dashed line in Figure 2.21(A), which represents the location of this temperature, is known as an isotherm (equal temperature). If we trace the isotherm across the figure, we see that its depth changes considerably. Beneath the midocean ridge, it is much shallower because of the presence of all the new hot igneous rock. Where the oceanic plate is subducted beneath the continental plate, the isotherm is transported to considerable depth. In the overlying plate, the production and rise of magma into the crust causes the isotherm to move to shallower depths. The isotherm can also be perturbed if parts of the lower continental crust delaminate and sink into the mantle. The hot mantle that rises to replace the delaminated slab causes isotherms to be raised in that region. The result is that the 500°C isotherm occurs at very different depths, and consequently pressures, depending on the plate tectonic setting. Changes in temperature, pressure, and fluid composition produce metamorphic rocks. The main plate tectonic settings for the development of regional metamorphic rocks are shown in Figure 2.21(A). Oceanfloor rocks, on being subducted, experience a rapid increase in pressure with little increase in temperature. This produces metamorphic rocks that are characterized by minerals that are stable at low temperature and high pressure. One such mineral is the blue amphibole glaucophane, which makes many of these rocks blue. Water and carbon dioxide released from these metamorphic rocks rise into the overriding mantle wedge, where they help promote metamorphic reactions in the overlying rocks. The water is also essential in causing melting, and as magma rises into the overlying crust, it transports heat with it. This, in turn, brings about metamorphism at high temperatures and pressures. Above zones of delamination, the temperatures of rocks at relatively shallow depths (low pressure) can be raised to elevated temperatures to bring about metamorphism at high temperatures and low pressures. The rise of the mantle beneath rift valleys produces a slightly elevated temperature gradient, which can cause low-temperature metamorphism. In later chapters, we see what specific rock types are developed in these various plate tectonic settings. In the meantime, it is important to keep in mind the role that plate tectonic processes play in the formation of rocks.
Review questions
Summary This chapter introduced the solid materials that constitute the Earth, that is, minerals and rocks. We distinguished between minerals and rocks and gave some common examples of both that are encountered on a daily basis. We discussed how minerals and rocks are classified, and how their origin is closely related to plate tectonic processes. The following are the main points discussed in this chapter:
• Minerals are the basic building blocks of the Earth. A mineral is a naturally occurring solid, with a definite (but commonly not fixed) chemical composition and an ordered atomic arrangement. All minerals have a definite crystalline structure; that is, they have an ordered three-dimensional arrangement of the constituent atoms, which imposes the chemical restrictions on their composition.
• Minerals are classified into a number of chemical groups, with the silicates being by far the largest. Despite the large number of minerals on Earth, only 85 occur as essential constituents of rocks. These are known as the rock-forming minerals.
• Because of the restricted chemical composition of minerals, several minerals must normally be present to account for the composition of the Earth at any given locality. This assemblage of minerals is what we refer to as a rock. The assemblage is normally restricted to consolidated masses to distinguish it from loose surficial materials. The solid Earth is made of rock.
• Rocks can form by crystallization of molten rock known as magma, in which case they are known as igneous. They can form through the cementing and consolidation of sediment, in which case they are known as sedimentary. Rocks that undergo mineralogical and textural changes in response to changes in environmental factors such as temperature, pressure, and fluid composition create new rocks known as metamorphic.
• Rocks are formed in response to plate tectonic processes. As a result, common associations of igneous, sedimentary, and metamorphic rocks develop that are characteristic of specific plate tectonic settings.
• The largest quantities of new rock are formed at midocean ridges, where divergent plates cause basaltic magma to rise from the mantle.
• The second-largest production of new rocks occurs at convergent plate boundaries, where andesitic volcanoes are the surface expression of intense igneous activity at depth, with granite batholiths being emplaced into the core of orogenic belts. Sediment eroded from these belts and transported into forearc basins is accreted onto continents as it is scraped off the subducting slab.
• Hot spots, rift basins, passive continental margins, and flooded parts of continents are other important settings for rock formation. • All rocks, when exposed to changes in temperature, pressure, or fluid composition, can undergo mineralogical changes to produce metamorphic rocks. Changes in environmental factors are caused mainly by plate tectonic motion, but local changes can occur near igneous intrusions.
Review questions 1. What is a mineral, and why is it important to specify naturally occurring? 2. Why does table salt (NaCl) break into cubelike cleavage fragments? 3. What is the composition, shape, and electrical charge on the basic building unit of all silicate minerals? 4. What are some common uses for the mineral quartz (SiO2)? 5. How does the arrangement of silica tetrahedra in the crystal structures of quartz and talc differ? 6. Although the cation-to-anion ratio in garnet is fixed, what allows it to have a wide compositional range, and why are such
widely different compositions still classified as the same mineral? 7. Can minerals be synthesized in the laboratory? 8. On what basis are minerals classified into different chemical groups, and of these, which forms the largest group?
35
36
Materials of the solid Earth
9. What is a crystal, and does the crystalline state require that crystal faces be present? 10. What is a rock, and how does it differ from a mineral? 11. What is the difference between a rock’s texture and structure? 12. From a geological map of the area where you live, determine how many rock-forming periods your home area has
experienced and approximately what fraction of geologic time these periods represent. 13. What single process has been operating continuously since the beginning of the Earth and has been responsible for the
formation of most rocks and drives plate tectonics? 14. Give brief definitions of igneous, sedimentary, and metamorphic rocks, and describe how you might distinguish between
them. 15. What general distinction can you make between the igneous rocks of the ocean floor and those of the continental crust? 16. What sedimentary rock do we make the greatest use of in the modern world? 17. What feature characterizes most regionally metamorphosed rocks? 18. Where does the largest production of new rock take place on Earth? 19. Water plays what important roles when circulating through fractures in newly formed oceanic crust? 20. What common volcanic rock forms above subducting tectonic plates, and what role does water play in its origin? 21. Why are granite batholiths common above subducting tectonic plates? 22. What is the source of sediment in forearc basins and what is a common characteristic of these sedimentary beds? 23. Why are the sedimentary rocks of rift valleys commonly red colored and still contain a considerable amount of the
relatively soft mineral feldspar? 24. From where do mantle plumes derive their heat? 25. How are shallow epeiric seas that flood continents related to plate tectonics? 26. What plate tectonic processes deflect isotherms up or down in the Earth? 27. Trace the role played by water and carbon dioxide in metamorphic rocks in going from their formation near midocean
ridges to the production of granite by partial melting of continental crust above subducting plates.
ONLINE RESOURCES Useful tips on identifying rocks and minerals can be found on the Mineralogical Society of America’s Web site at http://www.minsocam.org.
Klein, C., and Dutrow, B. (2008). Manual of Mineral Science, 23rd ed., John Wiley and Sons, New York. Perkins, D. (2010). Mineralogy, 3rd ed., Prentice Hall, Upper Saddle River, NY. Wenk, H. R., and Bulakh, A. (2004). Minerals: Their Constitution and Origin, Cambridge University Press, Cambridge.
FURTHER READING In this book, we give only an introduction to the most important topics in mineralogy and petrology. Numerous books give in-depth coverage of these subjects. The following books provide the reader with extensive coverage of these subjects and lead to the relevant literature.
Mineralogy Dyar, M. D., Gunter, M. E., and Tasa, D. (2008). Mineralogy and Optical Mineralogy, Mineralogical Society of America, Chantilly, VA.
Petrology Blatt, H., Tracy, R., and Owens, B. (2006). Petrology: Igneous, Sedimentary, Metamorphic, 3rd ed., W. H. Freeman and Company, New York. This book gives a general coverage of igneous, sedimentary, and metamorphic rocks. Boggs, S., Jr. (2009). Petrology of Sedimentary Rocks, 2nd ed., Cambridge University Press, Cambridge. This book gives an in-depth coverage of sedimentary rocks. Davis, E., and Elderfield, H., eds. (2004). Hydrogeology of the Oceanic Lithosphere, Cambridge University Press,
Review questions
Cambridge. This book provides the reader with a selection of topics dealing with water in the oceanic crust. Neuendorf, K. K. E., Mehl, J. P., Jr., and Jackson, J. A., eds. (2005). Glossary of Geology, 5th ed., American Geological Institute, Alexandria, VA. A valuable resource for the definition of geological terms.
Philpotts, A. R., and Ague, J. J. 2009. Principles of Igneous and Metamorphic Petrology, 2nd ed., Cambridge University Press, Cambridge. A detailed and quantitative treatment of igneous and metamorphic rocks.
37
CHAPTER
3
How are minerals identified?
The ability to recognize common minerals in hand specimens is basic to much that follows in this text. The tests that you will become familiar with are exactly the same as those used worldwide by field and research geologists, be it in the field, in the research laboratory, or in the home office. Your course instructor may discuss the various techniques for the unique identification of a mineral (or several minerals as in a rock) in lectures, but personal expertise can be gained best by hands-on work that you will likely do in the laboratory that accompanies your course. There you will have small test samples that you will be allowed to scratch (to test hardness), to hold in your hand (“to heft” the specimen so as to assess its average specific gravity), and to evaluate their reaction to dilute HCl, and so on. Even better is that you will probably also see much larger, better mineral hand specimens in which you can observe other properties such as crystal form, habit, cleavage, range of color, and state of aggregation. You will learn to combine these observations and develop the skills to identify unknown minerals correctly. Once you know what mineral you are dealing with, or which several minerals, as most common rocks contain a mix of minerals, you will be well prepared for understanding how rocks are classified and the conditions under which different rock types (igneous, sedimentary, and metamorphic) are formed. For example, once you have identified all four major minerals in a specific, relatively coarse-grained, light-colored rock as (1) quartz, (2) two types of feldspar, and (3) a mica, you can conclude that you are dealing with a granite. Such knowledge of common rock-forming minerals is basic to much of what is presented in this text. The four later chapters that deal with the systematic mineralogy of igneous rocks (Chapter 7); sedimentary rocks (Chapter 10); metamorphic rocks (Chapter 13); and ore deposits, coarse-grained pegmatites, and quartz veins (Chapter 15) give detailed information on the diagnostic properties that allow us to identify minerals. We introduce you to various observations and tests that can be made of minerals in hand specimens. In many instances a combination of the results of several of these leads to the
Cornelis Klein with a hand specimen of white quartz edged by pink lepidolite (a lithium-containing mica) from the Harding Mine, near Taos, New Mexico. He is seated in front of an electron microprobe analysis instrument (see Box 3.1 and Sec. 3.8) manufactured by JEOL Ltd., Tokyo, that is located in the Department of Earth and Planetary Sciences and Institute of Meteoritics, University of New Mexico, Albuquerque, New Mexico.
40
How are minerals identified?
identification of the mineral at hand. If not, the use of additional instrumental techniques may result in a unique identification. The subjects discussed in this chapter are the following: Habit ⎫ ⎪ State of aggregation ⎬ visual observations ⎪ Color and luster ⎭ Play of color ⎫ ⎬ visual observations Chato oy ancy,labradorescence, asterism⎭ Fluorescence using anultraviole i t light source Streak using a streak pl p ate Cleavage breaking along crystallographi p c directions; visual observation Hardness s Specific gravity Magnetism, solubility inHCl,radioactivity
⎫ ⎪ u ent ⎬ using some test equipm ⎪ ⎭
Instrumental techniques X - ray powder diffraction Electro on beam techniques : SEM,EMPA, and TEM
Identification of minerals in hand specimens is the main emphasis of this chapter. The methods used are careful visual evaluation and basic tests with easily available tools. Only at the end of this chapter do we briefly introduce some sophisticated instrumental methods that are used in the quantitative characterization of minerals and other crystalline solids. Chapter 6 is devoted to the study of minerals with a polarizing optical microscope. The identification of an unknown mineral in a hand specimen begins with making observations that allow us to assess a specimen’s overall form (or crystal habit if it is well crystallized), state of aggregation, and color. Those properties that allow us to identify a mineral or at least narrow down the possibilities are said to be diagnostic. Color is probably the first property the observer sees, followed by the overall shape of the mineral. But, though instantly noted, color is not a reliable diagnostic property in most minerals, because many (chemically variable) mineral groups exhibit a range of colors. Important physical properties that characterize a mineral and allow us to separate one from another in hand specimens are the following: • • • • • • •
Habit State of aggregation Color Luster Cleavage Hardness Specific gravity (or relative density)
Each of these properties is discussed in this chapter, but it must be recognized that the actual process of mineral identification is best learned in the laboratory part of the course you are enrolled in. There you will tune your observational skills through the study of labeled mineral specimens as well as unknowns. Here, we first introduce those properties that can be evaluated by observation only – habit, state of aggregation, color, and cleavage – and subsequently discuss properties such as hardness, specific gravity, magnetism, radioactivity, and solubility in hydrochloric acid, all of which require testing tools.
3.1 Habit If a mineral specimen is well crystallized – meaning that it shows well-developed crystal faces – then the crystal form can be used to help identify the mineral, and we can say that the crystal form is diagnostic in our mineral identification. The external crystal form is an outward expression of the ordered internal atomic arrangement. We look at crystal forms and their inherent symmetry in detail in Chapter 5, but here we concentrate on properties that can be assessed without specific knowledge of crystallography. Various habits are described by different adjectives, and several of these are described here and illustrated with photographs in Figure 3.1. Prismatic means that the mineral has an elongate habit with the bounding faces forming a prismlike shape, as is common in members of the pyroxene and amphibole groups of silicates.
3.2 State of aggregation
(A)
(B)
(C)
(D)
(G)
(E)
(F)
(H)
Figure 3.1 Photographic illustrations of many of the mineral habits listed in Section 3.1. (A) Prismatic, as in diopside crystals. (B) Columnar, as in a pink tourmaline crystal. (C) Acicular (or needlelike), as in this tufted aggregate of mesolite fibers (mesolite is a member of the zeolite group of minerals). (D) A tabular crystal of barite. (E) A bladed crystal of kyanite. (F) Fibrous celestite. (G) A dendritic pattern of manganese oxide minerals on a flat surface of siltstone. (H) Foliated muscovite as a rosette of crystals.
Columnar exhibits rounded columns, as is common in tourmaline. Acicular means “needlelike,” as is common for natrolite, a member of the zeolite group. The word is derived from the Latin word acicula, meaning “needle.” Tabular describes crystal masses that are flat like a board, as commonly seen in barite. Bladed refers to crystal shapes that are elongate and flat, as in a knife blade. Kyanite shows this commonly. Capillary applies to minerals that form hairlike, or threadlike, thin crystals, as shown by millerite. Fibrous refers to threadlike masses, as exhibited by chrysotile, the most common mineral included in the commercial term asbestos (see Fig. 2. 4A). Dendritic describes minerals that show a treelike branching pattern, as is common in manganese oxide minerals. The term is derived from the Greek word dendron, meaning “tree.” Foliated refers to a stack of thin leaves or plates that can be separated from each other, as in mica and graphite. Massive describes a mineral specimen that is totally devoid of crystal faces.
3.2 State of aggregation Most mineral specimens, unless unusually well crystallized, appear as aggregates of smaller grains. Such occurrences are best
described by some additional adjectives (photographs of the appearance of several of these are given in Fig. 3.2). Granular applies to rock and mineral specimens that consist of mineral grains of approximately equal dimensions, as in the rock dunite, composed essentially of granular olivine grains. Compact describes a specimen that is so fine-grained that the state of aggregation is not obvious, as in specimens of clay minerals, or chert (flint). Banded is said of a mineral specimen that shows bands of different color or texture but that may or may not differ in mineral composition. A banded agate may show various differently colored bands, but each of the bands is composed of the same silica, SiO2, known as chalcedony. In contrast, banded ironformations commonly show banding, on a millimeter scale, of two or three different minerals, chert (light colored) and hematite (red) and/or magnetite (black). Mammillary is from the Latin word mamma, meaning “breast,” and describes minerals that occur as smoothly rounded masses resembling breasts, or portions of spheres. Examples are goethite and hematite. Botryoidal is from the Greek word botrys, meaning “band or cluster of grapes” or “having a surface of spherical shapes.” In a botryoidal appearance, the rounded prominences are generally of a smaller scale than those described as mammillary. Common as the outer surface of chalcedony, a microcrystalline variety of quartz, SiO2.
41
42
How are minerals identified?
(A)
(B)
(C)
(D)
(E)
(F)
(G)
(H)
Figure 3.2 Photographic illustrations of many of the states of aggregation listed in Section 3.2. (A) Granular grains of yellow-green olivine in a volcanic bomb of dunite (a rock type made up essentially of olivine). (B) Finely banded as in this polished slab of agate. (C) Botryoidal, as shown by the outer, almost-black surface of chalcedony. (D) Botryoidal goethite. (E) Reniform hematite. (F) A geode with an outer lining of slightly blue chalcedony and a cavity lined with milky white, translucent quartz crystals. (G) Oolitic and pisolitic limestones. (H) Pisolitic bauxite.
Reniform describes the surface of a mineral aggregate that resembles that of a kidney. Seen in hematite. Derived from the Latin word renis, meaning “kidney.” Stalactitic is a term used for a mineral that is made up of forms like small stalactites. Some limonite occurs this way, as does rhodochrosite. Geode is a rock cavity partially filled with minerals. Common mineral fill is well-crystallized quartz or the purple variety of quartz, amethyst. Agates may be partly or completely filled rock cavities, and they may show attractive color banding in the chalcedony, microcrystalline SiO2, that lines the outer cavity. Oolitic describes the occurrence of mineral grains in rounded masses the size of fish roe. Derived from the Greek word oön, meaning “egg.” This structure may occur in iron ore, made up mainly of hematite, and known as oolitic iron ore, or in sedimentary rocks known as oolitic limestone, which consists of millimeter-size spheres of rhythmically precipitated calcite. Pisolitic applies to rounded mineral grains the size of a pea. From the Greek word pisos, meaning “pea.” Bauxite, a major ore of aluminum, is commonly pisolitic. Pisolitic grains are larger than those described as oolitic.
3.3 Color and luster Of all the physical properties that a mineral possesses, color is the most easily observed. For some minerals, such as those shown in Figure 3.3, color is highly diagnostic. However, in
most minerals color can be variable and as such proves an unreliable diagnostic property. Color is the response of the eye to the visible light range of the electromagnetic spectrum (Box 3.1). Visible light ranges in wavelength from about 400 to 750 nanometers (where 1 nm = 10 Ångstroms, Å). White light is a mixture of all these wavelengths. The following equation relates the energy of radiation (E) to its wavelength (λ): E=
hc , λ
(3.1)
where c is the speed of light and h is the Planck constant, which has a value of 4.135 × 10⁻¹⁵ electron volts × seconds (in SI units: 1.054 × 10⁻³⁴ joule × seconds). What this equation shows is that when the wavelength becomes longer, the energy is reduced, and when the wavelength becomes shorter, the energy increases. When white light strikes a mineral, it may be scattered, or reflected; it may be refracted; and it may be transmitted and absorbed (Fig. 3.4). If almost all of the light is reflected and/or scattered, the mineral will have a luster described as metallic luster. This is exhibited by the surface of steel, copper, silver, and gold. Such materials are described as opaque because little light passes into the mineral. Metallic luster is also shown by many oxides and sulfides (if not tarnished). For example, pyrite (FeS2), galena (PbS), and hematite (Fe2O3) are all opaque to light and have a metallic luster (Fig. 3.5).
Figure 3.3 Examples of a few minerals that can be uniquely identified by their color. From left in a clockwise direction: turquoise, turquoise in color; malachite, green; rhodochrosite, pink; lazurite, blue (known in the gem trade as lapis lazuli); and sulfur, yellow.
When most of the light that impinges on a mineral is transmitted, as in most light-colored translucent minerals (meaning that it is capable of transmitting light but is not transparent), the luster is described as nonmetallic luster. There is no sharp division between metallic and nonmetallic, but after some experience in the laboratory with metallic and nonmetallic specimens, the eye evaluates these distinctions quickly. Nonmetallic luster is a distinguishing property of silicates and carbonates. The color of most minerals with a metallic luster varies little, but those with a nonmetallic luster may show a wide range.
The luster of nonmetallic minerals is commonly described by one of the following two terms: vitreous, from the Latin word vitrum, for “glass,” meaning with the luster of glass, and resinous, with the luster of resin. If the incoming light to a transparent, nonmetallic mineral suffers no absorption, the mineral will be colorless. If, however,
Light in Reflected light Scattered light
Scattered light
Refraction and absorption
Emitted light (fluorescence)
Transmitted light
Figure 3.4 The various processes that occur when light passes through a piece of a transparent substance (adapted from Nassau, 1980).
Figure 3.5 Metallic luster of hematite, Fe2O3. This type of hematite is commonly referred to as specularite.
44
How are minerals identified?
BOX 3.1
THE ELECTROMAGNETIC SPECTRUM
Visible light is only a small part of this spectrum (see illustration) and ranges from short wavelengths of 400 nm at the violet end to long wavelengths of 750 nm at the red end. This short spectral range has produced an enormous amount of scientific information about Earth materials, and the Earth itself, through the unaided eye, as well as with hand lenses, various types of optical microscopes, and many other optical instruments. Visible range
400 nm 3.1 eV
Energy (electron volts) 0.12 GeV
750 nm
1.2 MeV
1.65 eV 1.2 × 10⁻³ eV
124 eV X-rays
Gamma rays
Ultraviolet
Infrared
1.2 × 10⁻⁵ eV
Microwaves
1.2 × 10⁻⁸ eV Radio waves
Cu Kα 10–14
10–13
10–12
10–11
10–10
10–9
10–8
10–7
10–6
10–5
10–4
10–3
10–2
10–1
1
10
102
Wavelength (m)
Microwave oven
Geiger counter
X-ray of hand
UV lamp
Hand lens
Fluorescent minerals
Petrographic microscope
Radio telescope
X-ray fluorescence spectrometer for rock analysis Automated X-ray powder diffractometer
Electron microprobe with element mapping displays
The overall spectrum covers a wide range of energies and wavelengths, stretching from gamma rays that are given off during radioactive decay of minerals (with energies of millions of electron volts (MeV) and wavelengths of 10–13m), to radio waves detected by radio telescopes (with energies of only 10–7eV and wavelengths of meters). X-rays occur at wavelengths much shorter than the visible spectrum. These are used in medical applications as well as in X-ray diffraction studies of the crystalline state. An example of this is an X-ray powder diffractometer (Sec. 3.8). Other sources of still-higher-energy X-rays are used to bombard samples of unknown composition so as to cause
3.3 Color and luster
their atoms to give off X-rays that are characteristic of the constituent atoms. This is the technique used in X-ray fluorescence spectrometers for the chemical analysis of powdered rock samples. Atoms can also be caused to give off characteristic X-radiation by being bombarded with high-energy electrons. The electron microprobe analyzer (EMPA, Sec. 3.8) uses a focused beam of electrons to analyze very small regions (on the order of a few microns in size) in mineral grains, or very fine-grained minerals, under high magnification. Electromagnetic radiation that is slightly shorter than the visible range falls in the ultraviolet range. This is the radiation that causes your skin to burn, but it can also be used to make some minerals give of fluorescent radiation in the visible range. Radiation with wavelengths longer than red light passes into the infrared, which we commonly refer to as heat waves. At still longer wavelengths are the microwaves, which we make use of in microwave ovens and in telecommunications. Once wavelengths go beyond 10 cm, they enter the radio range, which is used primarily for communication. (The photograph of the X-ray powder diffractometer is courtesy of PANalytical, Chester, NY, and that of the electron microprobe is courtesy of Cameca SAS, Gennevilliers, France).
parts of the visible spectrum are absorbed, the mineral will be colored. The color of a mineral is the eye’s perception of the wavelengths of light that are either transmitted or reflected (by the mineral) before reaching the eye. When part of the visible light spectrum is absorbed, during its path through a mineral, the part that is not absorbed is responsible for the color perceived by the eye. The absorption of specific wavelengths of visible light inside a transparent, or translucent, mineral results from the interaction of the incoming electromagnetic radiation with specific chemical elements housed in the crystal structure. Most of the reactions that cause light absorption are the result of wavelengths of visible light inside a transparent, or translucent, mineral and the interaction of that incoming electromagnetic radiation with specific chemical elements housed in the crystal structure.1 For example, the mineral corundum, Al2O3, is normally colorless, but when it contains trace amounts of Cr3+, it becomes red, known as ruby, and when it contains trace amounts of Fe2+ and Ti4+, it is blue and is called sapphire. The blue color of fluorite, CaF2, is caused by the interaction of electromagnetic radiation with defects in its structure. Several major rock-forming mineral groups show specific colors because their structures contain large numbers of atoms of the transition elements. These occupy the central part of the periodic table (inside cover of book) with atomic numbers of 21-30, 39-48, 57-80, and 89-92, the first row containing the more abundant elements Sc, Ti, V, Cr, Mn, Fe, Co, Ni, Cu, and Zn. These are also known as the chromophore elements, with chromophore derived from two Greek words meaning colorcausing. Some of these elements (especially Cr, Mn, and Fe) are major components (not trace elements) in, for example, garnet, olivine, pyroxenes, and amphiboles. 1
A trace element is a chemical element that is not essential in a mineral but is found in small quantities in its structure. Although not quantitatively defined, it generally constitutes 7) generally survive well during the various chemical and physical processes that are part of such cycles. Quartz is abundant as a detrital constituent of sandstones and quartz conglomerates. Similarly, ruby and sapphire, gem varieties of the mineral corundum, with H = 9, are very resistant during weathering and are commonly mined from gravel deposits. Similarly, diamond, with H = 10, can be found in river gravels and sandy beaches. Gem minerals not only must have beauty, luster, and brilliance but also must be durable, which is a function of hardness, toughness, and stability. Ideally, therefore, gems should be harder than quartz, a qualification that is met by only 10 or 12 major gemstones. Gems of lesser hardness are subject to abrasion. This is particularly true when a gemstone is set in a ring. In practice, the hardness of an unknown mineral (one that you are trying to identify) can be approximated by the use of a few common objects: a fingernail, a penny, a pocketknife, and
Table 3.1 Mohs hardness scale minerals. Hardness number (H)
Mineral name
Chemical formula
Remarks
1
Talc
Mg3Si4O10(OH)2
Soft, greasy feel; flakes are left on the fingers
2
Gypsum
CaSO4·2H2O
Can be easily scratched by the fingernail fingernail hardness ∼2.2
3
Calcite
CaCO3
Can be easily scratched with a knife and just scratched by a copper penny copper penny hardness ∼3.2
4
Fluorite
CaF2
Less easily scratched by a knife than calcite
5
Apatite
Ca5(PO4)3(F, Cl, OH)
Is scratched by a knife with difficulty pocket knife hardness ∼5.1 glass plate hardness ∼5.5
6
Orthoclase
KAlSi3O8
Not scratched by a knife and will scratch ordinary glass
7
Quartz
SiO2
Scratches glass easily porcelain streak plate hardness ∼7
8
Topaz
Al2SiO4(F, OH)2
Scratches glass very easilya
9
Corundum
Al2O3
Cuts glassa
Diamond
C
Used as a glass cuttera
10 a
There are few minerals that are as hard as, or harder than, quartz, and these include several of the highly prized gems.
51
How are minerals identified?
1600
Diamond
1200
Absolute hardness (by sclerometer)
800
400 200 100
3
4
5
6
7
8
9
10
Fluorite
Apatite
Orthoclase
Quartz
Topaz
Corundum
Diamond
2
Calcite
1
Gypsum
50
Talc
52
Mohs scale (relative hardness) Figure 3.19 Comparison of the Mohs relative hardness scale to absolute measurements of hardness.
a glass plate. These objects all have different relative hardnesses and are useful in identifying minerals that have a hardness lower than that of quartz (7), as shown in Table 3.1. The Mohs hardness scale is nonlinear when compared to an absolute scale (Fig. 3.19) obtained by an instrument known as a sclerometer. This test consists of the microscopic measurement of the width of a scratch made by a diamond under a fixed load and drawn across the face of the mineral specimen. The hardness number is the weight in grams required to produce a standard scratch. Figure 3.19 shows that the absolute hardness of diamond is 15 times greater than that of quartz, and that of diamond is about 4 times harder than the next-hardest gemstones (ruby or sapphire, both gem varieties of corundum). Hardness plays an important role in the selection of natural and synthetic materials used as abrasives. An abrasive is a substance that is used to grind, polish, abrade, scour, and clean. Minerals commonly used as abrasives are industrial diamond, corundum, garnet, and quartz.
3.6 Specific gravity (relative density) Specific gravity (designated as G) is the comparative weight of a mineral and is an important diagnostic property. It is defined as the ratio of the weight of a volume of a substance to the weight
of the same volume of some other material taken as a standard. For solids, the standard reference material is water. Thus, a mineral with a specific gravity (G) of 4 weighs four times as much as the same volume of water. For accurate density determinations, the temperature of the water must be 4°C (39.2°F), the temperature at which water has its maximum density. Density and specific gravity are commonly used interchangeably, but density, defined as mass per unit volume (g/cm3), requires scientific units, whereas specific gravity is a number (without units) that expresses a unitless ratio. Although the G of galena would be given as 2.65, its density is 2.65 g/cm3. Accurate values for specific gravity of minerals that are insoluble in water can be obtained by a specially designed balance known as the Jolly balance (invented in 1874 by Phillip Gustav von Jolly, a professor at the University of Munich, Germany). Because specific gravity is a ratio, this balance allows for the direct measurement of this ratio, that of the mineral specimen in air versus that in water. These ratios, obtained by such a balance, are listed to two decimal places. For example, the G of quartz = 2.65, and the G of olivine (Mg2SiO4 to Fe2SiO4) ranges from 3.27 to 4.27. You may have access to such a Jolly balance in your laboratory work that accompanies your course, but here we introduce only the more qualitative assessment of specific gravity.
3.6.1 Specific gravity and atomic structure The specific gravity of a mineral is a function of the atomic weights of the chemical elements in its crystal structure and the way in which those elements (atoms or ions) are packed together, called atomic packing. The influence of the increasing weight of a cation in a group of isostructural minerals (isostructural meaning that the structures being compared are the same, from the Greek isos, meaning “same”) on their resulting specific gravity is shown by three oxides: Mineral
G
Cation atomic weight
Rutile, TiO2
4.2
47.9
Pyrolusite, MnO2
4.8
54.9
Cassiterite, SnO2
6.9
118.7
The influence of the atomic packing on the specific gravity of a mineral is clearly shown by the two different structural arrangements of carbon in graphite and diamond. The atoms in the soft mineral graphite are held together by two different bond types. One is strong within layers of the structure and one is very weak, which results in relatively large atomic spacings between closely bonded layers, thus giving rise to G = 2.2. In contrast, for diamond, which is tightly bonded throughout, G = 3.5. The specific gravity of a mineral can be helpful in its identification, and with practice one can develop a relative sense
3.8 Instrumental methods for the quantitative characterization of minerals Table 3.2 Some rock-forming minerals arranged according to light, average, and heavy values of specific gravity (G). Light
Average
Heavy
Bauxite (an ore of aluminum) 2.0–2.5
Microcline 2.5
Barite 4.5
Albite 2.6
Pyrolusite 4.7
Quartz 2.6 Calcite 2.7
Pyrite 5.0
Halite 2.1 Serpentine 2.2–2.6
Plagioclase 2.6–2.8
Magnetite 5.2
Sodalite 2.3
Dolomite 2.85 Tremolite 3.0–3.3 Apatite 3.1–3.2
Galena 7.4–7.6 Silver 10.5 Gold 15.0–19.3
of the difference in weight of homogeneous specimens (consisting of a single mineral, not an intergrowth). For example, a specimen of anhydrite, CaSO4, with G = 2.9, will seem light when compared with a specimen of barite, BaSO4, with G = 4.5. Because of its high specific gravity, barite is extensively used as a weighting agent for muds circulating in rotary drilling of oil and gas wells. These drilling muds are a mixture of water, clay, and barite. Minerals with a metallic luster have an average specific gravity of about 5. For example, pyrite, FeS2, has G = 5; chalcopyrite, CuFeS2, has G = 4.2; and native copper has G = 8.9. Nonmetallic minerals, which include most of the common rock-forming minerals such as quartz, feldspar, pyroxenes, and amphiboles, typically have specific gravities ranging from 2.6 to 3.3. The G of quartz = 2.6; for feldspar, it ranges from 2.6 to 2.7; and for diopside (a calcic pyroxene), it is 3.2. In assessing the relative G of a mineral specimen, one must keep in mind that the mass of the specimen is important because a large chunk of quartz may appear heavy even though its specific gravity is not high, just because it is a large piece. So, if assessed by hefting a specimen, experience will allow for distinctions among light, medium, and heavy, but specific gravity can be highly diagnostic only if it measured with an instrument such as a Jolly balance. Table 3.2 gives a listing of some rock-forming minerals arranged according to qualitative evaluations.
3.7 Magnetism, solubility in acid, and radioactivity The following are some additional quick and simple tests that allow us to identify, uniquely, some minerals and mineral groups. Magnetism
Two common minerals are distinctly magnetic: magnetite, Fe3O4, and pyrrhotite, Fe1–xS. Magnetite is strongly attracted to a magnet; pyrrhotite much less so. Both are opaque, but magnetite is black and pyrrhotite is bronze. A small hand magnet reveals their presence in a specimen that contains a
considerable amount of either mineral, but if they are present in only small quantities, then the removal of a few grains from the specimen (with a pocketknife or needle) for individual testing is often diagnostic. A full description of the various causes of magnetic behavior in minerals is given in various mineralogy textbooks, referenced at the end of this chapter. Especially informative and detailed discussions of magnetism are given in the journal Elements (Mineral Magnetism listed under “Further Reading” at the end of this chapter). Solubility in HCl
Several carbonate minerals show effervescence, also known as fizz or bubbling, when a drop of dilute HCl is placed on them. This is due to the following chemical reaction: 2H+ + CO32- → H2 O + CO 2 ↑ acid in calcite water gas
(3.2)
Calcite and the other structural form of CaCO3, aragonite, both react strongly. Several other carbonates, such as dolomite, magnesite, siderite, and rhodochrosite, effervesce only in hot dilute HCl. This test is especially useful when some fine- to mediumgrained, light-colored mineral, with no other discernible diagnostic properties, is distributed among other grains in a rock. If the fizz test works, the mineral is one of several carbonates. Radioactivity
Uraninite, UO2, and the massive variety known as pitchblende, may both contain U and Th as major constituents. These elements are radioactive; that is, they change into daughter elements by emitting alpha particles, beta particles, and gamma rays from the nucleus of the atom. These rays are easily detected with a Geiger or scintillation counter (Box 3.1). If the test is positive, one is clearly dealing with a radioactive mineral.
3.8 Instrumental methods for the quantitative characterization of minerals All the tests described in the previous sections may be helpful in the identification of some minerals, but many times the results are not specific and lead only to the broad conclusion that the mineral at hand is a member of some large mineral group. The test results may suggests that your unknown might be an amphibole, or a pyroxene, or some kind of feldspar, and commonly there is still the question of which of the amphiboles, which of the pyroxenes, or which member of the feldspars are present in the rock. Two instrumental tests that may quickly provide a unique answer to those questions are optical microscopy, which we discuss in Chapter 6, and X-ray powder diffraction. Equipment for both procedures is commonly present in many geology departments. Optical microscopy, using a polarizing microscope, is commonly a quick technique that helps in the unique identification of a mineral that is part of a mineral group, but only if
53
54
How are minerals identified?
you are familiar with both its theoretical background and use of the microscope and its manipulations, which you can learn in Chapter 6. Here it suffices to illustrate just two examples of the unique identification of two minerals that you have decided (as a result of applicable tests described earlier) belong to the feldspar group. One sample is nonmetallic; has a blocky cleavage; is light beige in color; has an H of about 6; and might be potassium feldspar (K-feldspar), KAlSi3O8. There are three types of K-feldspar, known as sanidine, orthoclase, and microcline. So which one might it be? If this feldspar is part of a rock that is under study, a thin section of that rock (a slice of a rock, about 0.03 mm thick, mounted between two glass slides) is probably available. Put the thin section under the microscope and a very diagnostic pattern (of twinning, see Chapter 6) is seen in doubly polarized light (Fig. 3.20(A)). This pattern uniquely identifies the K-feldspar as the microcline type. The other sample has a light grayish color with all the appropriate physical properties of a feldspar. If you put a thin section of it under the polarizing microscope, and if, with crossed polarizers, you see a fine pattern of repetitive thin lamellae, then it must be a member of the plagioclase series (Fig. 3.20(B)). If your course includes an introduction to optical microscopy, then you will learn aspects of this versatile identification technique. Optical microscopic techniques are used extensively in the research laboratories of companies involved in oil and gas exploration and in mining. Similarly, centers of materials research employ optical techniques in addition to many of the other instrumental methods.
(A)
1 mm
3.8.1 X-ray powder diffraction As noted earlier, X-ray powder diffraction equipment is available in most geology departments, and some instructors present students in an introductory course to this powerful mineral identification technique. So here, we give a short introduction to the underlying principles, the instrumentation, and the interpretation of the results of X-ray powder diffraction. In the brief introduction to mineral identification by optical microscopy in this chapter, we have seen how distinctive twin patterns (Fig. 3.20(A)–(B)) led to the unique identifications of two different feldspars. Here we use a similar approach, showing how two distinctly different X-ray powder diffraction patterns can lead to the unique identification of an unknown mineral. Suppose you have a dark green to black, fine-grained volcanic rock with some white mineral filling vesicles (gas cavities). You have scratched it and it has an H ∼ 7, but it is too finegrained to recognize any crystal form or cleavage. You think it might be quartz or one of its two high-temperature forms (known as polymorphs, from the Greek words poly and morpho, meaning “many forms”; the term implies different atomic structures), tridymite and cristobalite. If you had a thin section of this mineral assemblage, optical study would reveal the identity of the mineral in question. But if you do not have a thin
(B)
1 mm Figure 3.20 (A) A photomicrograph of a relatively large, single grain of K-feldspar, KAlSi3O8 (a photomicrograph is a photograph taken with a camera mounted on the vertical tube of an optical microscope). This photograph, which was taken in doubly polarized light (see Chapter 6), shows a distinctive tartan pattern. This uniquely identifies the K-feldspar as one of three structure types of KAlSi3O8, namely microcline. The pattern is the result of twinning (discussed in Chapter 5). (B) A photomicrograph of several intergrown feldspar grains, one of which displays a regular pattern of light and dark, parallel strips (known as twin lamellae, from the Latin word lamella, meaning “plate”). This pattern, known as albite twinning, was photographed in doubly polarized light. It is present in all members of the plagioclase feldspar (NaAlSi3O8 to CaAl2Si2O8) series.
section, you can pry out some of the light-colored grains from the vesicles, grind them to a fine powder, mount the powder on a glass slide (or in a special sample holder) in an X-ray powder diffractometer, and observe the results of the experiment on a graphical display. The last two illustrations in Box 3.2 show the distinctly different X-ray powder diffraction patterns for quartz and cristobalite. There are large numbers of files of
3.8 Instrumental methods for the quantitative characterization of minerals
X-ray diffraction patterns of minerals that can be searched online. You can compare your own pattern with these reference patterns, such that if your unknown produced the (B) trace, it
BOX 3.2
is cristobalite; if it resulted in the (A) trace, it is quartz; and if it resembles neither, it is likely to be tridymite. A brief introduction to X-ray powder diffraction is given in Box 3.2.
X-RAY POWDER DIFFRACTION TECHNIQUE
Intensity, I
X-rays are part of the electromagnetic spectrum (Box 3.1), with wavelengths ranging from about 100 to 0.02 Ångstroms, where 1 Å = 0.1 nm (nanometers). Visible light, by comparison, has wavelengths between 7200 Å and 4000 Å, and hence is much less energetic and penetrating than X-radiation. X-rays are generated in vacuum-sealed X-ray tubes in which electrons, under high accelerating voltage, bombard a target material. When the energy of the electron beam (inside the X-ray tube) is great enough to dislodge electrons from the inner electron shells of the target material, those electrons are expelled, leaving vacancies that are filled by other electrons from surrounding electron shells. When electrons transition from outer to inner electron shells, X-radiation is emitted of specific wavelengths, related to the target material. The radiation spectrum has a very intense K α (produced by transitions from L- to K-shells) and a less intense Kβ peak (resulting from transitions from M- to K-shells; see the first illustration). The intense K α peak (consisting of a very intense Kα1 and a much less intense, but close in λ, Kα2 peak that are averaged out as K α ) is the source of X-radiation used to irradiate crystalline materials and to produce X-ray diffraction effects. The most common target material in X-ray diffractometer instruments, used for general identification purposes, is copper, with a K α wavelength of 1.5418 Å. Other available target materials in X-ray tubes are iron and molybdenum. When an intense X-ray beam is aimed at a crystalline material, the X-rays are scattered by its ordered internal Kα1 atomic arrangement. These effects are known as diffraction. The relation of these diffraction effects to a crystal structure is expressed by the Bragg equation, so named after Sir W. L. Bragg (1862–1942), an English crystallographer who determined the first crystal structures by X-ray techniques in α2 1914. He and his son Sir W. H. Bragg (1890–1971) received the Nobel Prize in Physics in 1915. The Bragg equation is Kβ n λ = 2 d s in θ ,
which relates the interplanar (atomic) spacing (d) inside a crystalline material to a diffraction angle (θ) as a function of the wavelength (λ) of the X-rays used; n is an integer such
S
ous inu nt um o C pectr
(3.3)
Wavelength, λ
as 1, 2, or 3. The letter d is a symbolic representation of all possible distances between differently oriented crystallographic (planar) directions inside a crystalline substance. The second illustration shows some of the basic mechanical components of an X-ray powder diffractometer in which the powdered sample is rotated through angle θ while the detector moves at an angle of 2θ, beginning at about 5° 2θ in an increasing direction of 2θ. The third diagram is a schematic
Track of goniometer arm
X-ray detector Diffracted beam
150°
X-ray source θ
θ θ Powdered sample
Inclination of a set of parallel planes inside the crystal structure
Diffraction angle recorded by goniometer arm = 2θ 0°
55
How are minerals identified?
illustration of an enlarged powdered sample being irradiated. This finely powdered sample consists of an infinitely large number of tiny crystalline Incident particles that (because of their random orientation θ X-ray beam θ θ inside the sample) have a multitude of internal θ crystallographic planes in parallel positions. These Stack of planes, in combination, produce the diffraction Powdered sample parallel enlarged effects. The angle of incidence, θ, is the same as the planes angle of diffraction, θ. The instrument records the Short blue lines represent other random intensity of diffracted peaks as a function of 2θ. The particles that are not in the correct wavelength of the incoming radiation is a known position for diffraction quantity (as for Cu K α = 1.5418 Å), so d can be computed using the above Bragg equation (all of this is presently done by an online computer). The end result of all this is a listing of d’s against their intensity (I). Such a listing can be regarded as a fingerprint of the mineral that was X-rayed. The last two figures show the distinct qualitative differences in the diffractometer tracings (intensity of diffraction effect, I, versus 2θ angle) of two types of SiO2. The first is for low quartz, the common form of quartz. The second is for cristobalite, a high-temperature form of SiO2 (or quartz) found mainly in some volcanic rocks. Both patterns are obtained from the Powder Diffraction File™ and are used with permission from © JCPDS-International Centre for Diffraction Data, 2009. All rights reserved. A subsequent listing of d versus I provides a quantitative statement derived therefrom. Such listings, of d versus I for an unknown, can be compared with similar listings for all known crystalline materials, which are archived in the Powder Diffraction File (PDF) published by the International Center for Diffraction Data (ICDD). More than 291 000 calculated and experimental patterns for natural and synthetic crystalline materials are on file. In short, this X-ray technique provides, in most cases, a unique identification of the unknown mineral at hand. Diffracted X-ray beam
Intensity
56
105 100 95 90 85 80 75 70 65 60 55 50 45 40 35 30 25 20 15 10 5 0 −5 −10
Quartz
10
(A)
Short black lines represent particles in the proper alignment for diffraction
15
20
25
30
35
40
45
50
55
2θ
60
65
70
75
80
85
90
95
100
Intensity
3.8 Instrumental methods for the quantitative characterization of minerals
105 100 95 90 85 80 75 70 65 60 55 50 45 40 35 30 25 20 15 10 5 0 −5 −10
Cristobalite
10
15
20
25
30
35
40
45
50
(B)
3.8.2 Electron beam techniques: Scanning electron microscopy, electron microprobe analysis, and transmission electron microscopy If the mineral under study is very fine- to extremely finegrained (e.g., talc in talcum powder, clay minerals) and after having obtained test results that still do not completely characterize the unknown under investigation, you may want to obtain a very high magnification image of the unknown. Here is where an electron beam technique, known as scanning electron microscopy (SEM) comes in. A very useful aspect of SEM imaging is the large depth of field, resulting in high-definition photographs (Figs. 2.1(C), 2.3(D), and 3.9). Such photographs, especially of very fine-grained materials, can provide much information about the symmetry content (the crystallography) of the unknown. An SEM instrument has an electron optical column that produces a very fine electron beam that can be focused and rastered (i.e., swept back and forth) across a selected area of the specimen or over small particles (or grains) mounted on a specimen holder.
55
60
65
70
75
80
85
90
95
100
2θ
The maximum magnification that can be attained by a modern SEM is about 1 million times, at a resolution of about 1 nm. When the electron beam impacts the surface of a solid, it produces various types of radiation that are recorded by detectors inside the instrument. The detectors are capable of measuring the following signals: X-ray radiation, secondary electrons (SE), back-scattered electrons (BSE), and electrons absorbed by the specimen (known as specimen current). Mineral composition
This leads us to the question of the chemical composition of the mineral that we identified through a combination of techniques. Let us take a look at a possible identification sequence. We have a hand specimen of, for example, a very dark green to black mineral with well-developed cleavage directions of ∼90° to one another, giving rise to stubby shapes (Fig. 3.14(A)). It has an H of about 5½, so it may be a pyroxene, but which specific member of this large and complex mineral group? A thin section of this same mineral specimen or some loose grains mounted in an oil show a pronounced green color under the
57
How are minerals identified?
microscope. Measurement of an extinction angle under the microscope (see Chapter 6) gives a number of about 45°. All this information leads to the conclusion that the pyroxene at hand is probably augite. But what is its composition? Augites show a large range in major elements such as Al, Fe2+, Fe3+, Mg, Ca, and Na. So now that we have narrowed down the general name of the unknown, the next major question is still, What technique is most useful in determining its mineral chemistry? Quantitative chemical information on minerals is fundamental to all research in mineralogy and to understanding the formation and origin of rocks. Electron microprobe
Chemical compositions of minerals are nowadays most commonly obtained by the electron beam technique known as electron microprobe analysis (EMPA). This instrument was introduced in the 1960s and has since become a standard, qualitative and quantitative technique for the determination of the chemical composition of solids. An EMPA instrument uses a finely focused beam of electrons as the energy source. The incident high-energy electrons displace inner-shell electrons in the atoms of the solid under study. When outer-shell electrons fill these inner-shell vacancies, X-rays are produced with wavelengths that are characteristic of the elements present. These X-ray wavelengths can be identified by an X-ray spectrometer or by an energy-dispersive X-ray detector (EDS; Fig. 3.21). An energy-dispersive detector is used to separate the characteristic X-rays of different elements into an energy spectrum, and EDS software is used to analyze the energy spectrum to determine the abundance of specific chemical elements. Figure 3.22 is an illustration of the qualitative EDS spectrum of our unknown pyroxene that we suspect is
5000
Si
4000
Intensity
58
O
3000 2000
Mg Ca
1000
Fe C Al Na
0 0
Ca 2
4
Fe 6
8
10
Energy (keV) Figure 3.22 An elemental spectrum of augite, obtained through energydispersive X-ray spectroscopy (EDS) on an electron microprobe analyzer (EPMA). This qualitative spectrum identifies the presence of Si, O, Ca, Al, Fe, Mg, and Na. The C peak is due to the carbon coating on the specimen to make it conductive to the electron beam. (Courtesy of Mike Spilde, Institute of Meteoritics, University of New Mexico.) Electron gun
Condensor aperture
Objective aperture
Specimen port
Objective lens
High voltage supply Diffraction lens
To vacuum pump
Electron gun filament
Intermediate aperture
Electron beam path
Intermediate lens Projector lenses
Binoculars
Condenser lens
EDS detector Diffracting crystal
Objective lens
Adjustable stage
Fluorescent screen
X-ray spectrometer
Polished sample X-rays
X-ray counter Image recording system
To vacuum pump Figure 3.21 Schematic illustration of an electron microprobe analyzer (EMPA). It shows the electron optical column and the two possible read-out systems for X-ray analysis (X-ray spectrometer and EDS).
Figure 3.23 A schematic illustration of a transmission electron microscope (TEM). All lenses are electromagnetic lenses.
3.8 Instrumental methods for the quantitative characterization of minerals
augite. This spectrum shows the presence of six chemical elements, among them Si, Ca, Na, Al, Mg, and Fe. This suggests strongly that the specimen is indeed augite. A representative augite formula is (Ca, Na) (Fe, Mg, Al) Si2O6. Further evaluation of this spectrum (by comparison to that of a standard mineral of known composition) would lead to a quantitative estimate of each of these elements. Transmission electron microscopy
Transmission electron microscopy (TEM) is a microscopic technique whereby a beam of electrons is transmitted through an ultrathin specimen. The interaction of the electrons with the specimen produces a highly magnified image that is focused on a fluorescent screen or a camera. An illustration of the instrument is given in Figure 3.23. Transmission electron microscopy is capable of imaging objects as small as a single layer of atoms,
0.5 μm
which is a resolution of tens of thousands of times better than that of a light microscope. Examples of TEM images are in Figures 2.4(C) and 3.24. Figure 3.24 illustrates the application of the TEM to the study of microorganisms and nanoparticles that may be responsible for chemical reactions that have a dramatic effect on environmental safety. In this image the hematite nanoparticles range in size from 11 to 43 nm. High-resolution transmission electron microscopy (HRTEM) is an imaging mode of the TEM that allows for the resolution of the crystal structure of a sample on an atomic scale. At present, the highest resolution is at about 0.8 Å, and new developments will improve that to 0.5 Å. Examples of HRTEM images are in Figures 2.4(D) and 3.25. The former image illustrates, with very high resolution, the coiled nature of the structure of chrysotile. Figure 3.25 illustrates the results of a mineral reaction on an almost atomic scale. This is a hydration reaction of enstatite (a member of the pyroxene group) to form the hydrous mineral talc: MgSiO3 + SiO 2 + H2 O → Mg 3Si 4 O10 (OH)2 enstatite silica vapor talc
(3.4)
10 nm
TALC
ENSTATITE Figure 3.24 A transmission electron micrograph (TEM image) of hematite nanoparticles, Fe2O3, to which a specific species of bacterium is attached. This species respirates on oxygen, but in anoxic environments it can respirate on metal oxides. Therefore, in this picture, the bacterium literally breathes on the oxide mineral particles, without which the bacteria would die. In this respiration process, the Fe3+ in the hematite is reduced to Fe2+ and, as a result, the mineral particles dissolve. (Photograph courtesy of Michael Hochella, Virginia Polytechnic Institute; from Bose et al., 2009.)
Figure 3.25 A high-resolution transmission electron microscope (HRTEM) image of the hydration reaction of enstatite (a pyroxene) to form talc. The resolution in this image is so great that mineral domains are visible at an almost atomic scale. The blocky structure outlines (lower left corner) are enstatite, and the layered domains are talc. (Photograph courtesy of Adrian Brearley, University of New Mexico.)
59
60
How are minerals identified?
Summary This chapter introduced various aspects of what is involved in the observation and testing of an unknown mineral, in a hand specimen, so as to arrive at a positive identification thereof.
• Mineral descriptions make use of standard adjectives that relate to mineral habit and state of aggregation. These adjectives are worth learning because they are a part of many systematic mineral descriptions.
• Although the color of a mineral is instantly observed, color is not a good diagnostic property. • Two types of luster, metallic and nonmetallic, are easily assessed and very helpful in distinguishing metallic minerals such as some native elements, oxides, and sulfides from the majority of minerals that are nonmetallic.
• The overall color of a mineral is the result of that part of the visible spectrum that is least absorbed by the mineral as white light travels through the mineral specimen.
• Color in minerals can result from the presence of major elements but commonly results from the presence of trace elements. • The color of the streak of a mineral is that of its fine powder. • The play of color in opal results from diffraction of white light into its various colors as it passes through the well-layered arrangement of large amorphous spheres of SiO2 (with small amounts of water).
• Labradorescence, which occurs in a specific compositional region of the plagioclase feldspar series, is the result of white light that is scattered from microscopic, closely spaced parallel lamellae.
• Cleavage, the breaking of a mineral along crystallographic planes, can be a highly diagnostic property in minerals. The cleavage directions are directly related to crystallographic planes of weakness in the crystal structure.
• A hardness test assesses the reaction of a crystal structure to stress, without rupture. It is very useful in distinguishing between major mineral groups.
• The relative hardness scale that is numbered from 1 to 10 is named after its inventor, the Austrian mineralogist F. Mohs. • Specific gravity measurements, when done with a specialized balance on small and pure samples, are highly diagnostic. However, in hand specimens, the best you can develop is a sense of relative heft, which allows you to distinguish minerals with large differences in specific gravity.
• Magnetism is the force exerted between a magnet and a mineral specimen. Only two minerals are distinctly magnetic: magnetite and pyrrhotite.
• Solubility in cold or hot HCl is a very diagnostic test for carbonate minerals. • Radioactivity of hand specimens can be measured using a Geiger or scintillation counter. • X-ray powder diffraction instrumentation, which is available in most geology departments, can provide, fairly quickly, a unique mineral name for an unknown that had been elusive using other less sophisticated tests.
Review questions
Review questions 1. What is meant by each of the following adjectives: prismatic, acicular, dendritic, granular, botryoidal, and oolitic? 2. What distinguishes metallic from nonmetallic luster? 3. What is meant by vitreous? 4. What is meant by the term chromophore elements? 5. If in white light a specific mineral specimen exhibits a yellow-green color (e.g., the gem olivine called peridot), which part of the optical spectrum is least absorbed? 6. What is meant by the term labradorescence? 7. What is asterism? 8. Halite has excellent cubic cleavage – what does that mean? 9. Members of the mineral group mica have perfect planar cleavage – how does that show itself? 10. What is the name of the relative hardness scale? What is the range of numbers on that scale? 11. Metallic and nonmetallic minerals respond very differently to a hardness test. What are these differences? 12. Specific gravity (or density) is a function 1) of an atomic property as well as 2) a crystal structure arrangement? What are these? 13. What mineral groups tend to have high values of specific gravity? 14. A mineral is listed as having H = 1 and excellent planar cleavage. Which mineral is this? 15. Another mineral has H = 10 and perfect octahedral cleavage. Which mineral is this?
FURTHER READING The following journal references and mineralogy textbooks are further reading on the origin of color, play of color in opal, and magnetism. They also lead to further reading on instrumental techniques. The sixth entry is to a laboratory manual with many mineral related exercises. Bose, S., Hochella, M. F., Gorby, Y. A., Kennedy, D. W., McCready, D. E., Madden, A. S., and Lower, B. H. (2009). Bioreduction of Hematite Nanoparticles by the Dissimilatory Iron Reducing Bacterium Shewanella Oneidensis MR-1. Geochemica et Cosmochimica Acta, 73, 962–976. Darragh, P. J., Gaskin, P. J., and Sanders, J. V. (1976). Opals. Scientific American, 234, 84–96. Dyar, M. D., Gunter, M. E., and Tasa, D. (2008). Mineralogy and Optical Mineralogy, Mineralogical Society of America, Chantilly, VA. Goldstein, J., Newbury, D., Joy, D., Lyman, C., Echlin, P., Lifshin, E., Sawyer, L., and Michael, J. (2003). Scanning Electron Microscopy and X-Ray Microanalysis, 3rd ed., Kluwer Academic/Plenum Publishing, New York. Jenkins, R., and Snyder, R. L. (1996). Introduction to X-Ray Powder Diffractometry, John Wiley and Sons, New York.
Klein, C. (2008). Minerals and Rocks: Exercises in Crystal and Mineral Chemistry, X-Ray Powder Diffraction, Mineral and Rock Identification, and Ore Mineralogy, John Wiley and Sons, New York. Klein, C., and Dutrow, B. (2008). Manual of Mineral Science, 23rd ed., John Wiley and Sons, New York. Loeffler, B. J., and Burns, R. G. (1976). Shedding light on the color of gems and minerals. American Scientist, 64, 636–647. Mineral Magnetism: From Microbes to Meteorites. (2009). Elements 5, no. 4, 209–246. Nassau, K. (1978). The Origin of Color in Minerals. American Mineralogist, 63, 219–229. Nassau, K. (1980). The Causes of Color. Scientific American, 243, 124–156. Perkins, D. (2011). Mineralogy, 3rd ed., Prentice Hall, Upper Saddle River, NJ. Wenk, H. R., and Bulakh, A. (2004). Minerals: Their Constitution and Origin, Cambridge University Press, Cambridge. Williams, D. B., and Carter, C. B. (1996). Transmission Electron Microscopy, Plenum Press, New York.
61
CHAPTER
4
Fundamentals of crystal structures
In this chapter, we introduce various fundamental aspects of the architecture of crystal structures of minerals. We begin with their building blocks, which are the naturally occurring chemical elements, be they atoms or ions. We then discuss the size of the atoms and ions, and we point out that the size of ions is influenced by the number of an ion’s closest neighbors. This leads to the concepts of coordination number, C.N., and coordination polyhedron. We then discuss the five rules, known as Pauling’s rules, that relate to how polyhedra stack together to form a crystal structure. We also address the forces that hold crystal structures together, known as bonding forces. Finally, we address the various factors that influence the variability in the chemical composition of many mineral groups.
Examples of physical models used in the teaching of crystal structures. These models, built of wooden or plastic spheres, plastic polyhedra, and connecting rods are commonly available in the laboratories associated with mineralogy courses. Similar but interactive electronic images are available on CrystalViewer that accompanies this text. On the top left is a close-packed structure model of halite (common table salt). On the top right is a polyhedral model of muscovite, a mica (a layer silicate). On the bottom is a ball-and-stick model of chlorite, also a layer silicate. (David Nufer Photography, Albuquerque, New Mexico.)
64
Fundamentals of crystal structures
Crystal structures represent the most fundamental aspects of minerals. In classifications, minerals are organized by chemical groups (see Sec. 2.2) as well as structure types (see Sec. 7.4). Because there are about 1140 known silicates, this large chemical group is subdivided by structure type. Many of the minerals treated in this text are silicates, and gaining an understanding of their various structure types is essential. This text is accompanied by CrystalViewer, which incorporates all the crystal structures of the minerals that are systematically treated in Chapters 7, 10, 13, and 15. Furthermore, each systematic mineral description is accompanied by an illustration of its structure, its mineral name, its chemical formula, and a shorthand notation known as the space group. This chapter provides you with the basic aspects of crystal structures, which will provide you with a good understanding of the crystal structures both in CrystalViewer and in the crystal structure illustrations in this text.
4.1 Naturally occurring chemical elements In Section 2.1, we introduced the definition of mineral in which one of the clauses states with a definite, but commonly not fixed, chemical composition. That led to the concept of minerals with a fixed composition such as quartz, SiO2, and minerals with a variable composition, such as members of the olivine series, ranging from Mg2SiO4 to Fe2SiO4, with the general formula (Mg, Fe)2SiO4. If one were to ask, “What are the chemical elements that minerals are composed of?,” the first suggestion might be “Consult the periodic table of the elements” (inside front cover of this book). The periodic table lists 118 elements. An element is a substance that cannot be decomposed into simpler materials by chemical reactions. Of these 118 elements, 30 have been synthesized and do not occur naturally. Elements 43, 61, 85, 87, and 93–118 are radioactive, have no stable isotopes, and decay relatively quickly. Consequently, they are present in natural materials in only ultra-trace quantities. Many of the elements in the periodic table are also rare, and Table 4.1 lists 29 of the most common ones. This list, therefore, represents those naturally occurring elements that are most commonly incorporated into mineral structures at the time of their origin. Thirteen of these make up 99% of the Earth’s crust, as shown in Table 4.2
Table 4.1 The 29 most common, naturally occurring elements (excluding hydrogen) and their common ionic states. Atomic number
Element
Ion
Atomic number
Element
Ion
3
Lithium
Li+
24
Chromium
Cr3+
25
Manganese
Mn2+
2+
4
Beryllium
Be
5
Boron
B3+
Mn4+
4+
6
Carbon
C
8
Oxygen
O2–
26
Fluorine
F
11
Sodium
Na+ 2+
12
Magnesium
Mg
13
Aluminum
Al3+
Cobalt
Co2+
28
Nickel
Ni2+
29
Copper
Cu+ Cu2+
Zinc
Zn2+
P5+
38
Strontium
Sr2+
2–
40
Zirconium
Zr4+
S6+
47
Silver
Ag+
–
56
Barium
Ba2+
82
Lead
Pb2+
92
Uranium
U4+
Silicon
Si
15
Phosphorus
S
4+
27
30
14
Sulfur
Fe2+ Fe3+
–
9
16
Iron
17
Chlorine
Cl
19
Potassium
K+ 2+
20
Calcium
Ca
22
Titanium
Ti4+
of two different ions of very different size. This means that if we wish to gain an understanding of the various ways in which the internal structures of minerals are arranged, we must first look into the sizes of both atoms and ions. The sizes of both atoms and ions are determined by crystallographers by using specific X-ray diffraction techniques that are different from the X-ray powder diffraction method discussed in Section 3.8 and Box 3.2. In determining atomic and/ or ionic radii, a small, perfect single crystal of a mineral is irradiated by X-rays, and the resulting X-ray diffraction pattern becomes the basis for the measurement of distances between atoms and/or ions. Atomic radii are obtained from the X-ray diffraction spacing measured between atoms of pure metals.
Table 4.2 Thirteen of the most common elements (excluding hydrogen) that make up 99% of the Earth’s crust. O
Ti
4.2 Atomic and ionic radii
K
Al
Na
Si
In the crystal structures of minerals, atoms or ions are the basic building blocks. The manner in which these are arranged inside a crystal structure is strongly influenced by their size. The crystal structure of a native element such as gold, Au, in which all the atoms are of the same element, and therefore of the same size, is very different from that of quartz, SiO2, which consists
Ca
P
Mn
S
Fe
C
Mg Note:: Elements are listed in order of decreasing size of their most common ionic state. Ionic radii are given in Table 4.4.
4.2 Atomic and ionic radii
d d d = 2R Figure 4.1 Schematic illustration of the determination of the radius of a metal atom in a close-packed structure. RX = d/2 d
Figure 4.2 Schematic illustration of the determination of the radius of a cation (R RA) when the distance (d) between the centers of an anion-cation pair, as well as the radius of the anion (R RX), are known. RA = d – RX.
Figure 4.1 shows that the radius of an atom is half the length measured between the centers of two identical atoms, where the shape of the atom is assumed to be spherical. Table 4.3 gives atomic radii for some common elements. The determination of the size of ions in the internal structure of, for example, a silicate, is more complicated than determining the atomic radius of an element in a metal. In silicates, which are built of oxygen anions, O2–, and various cations, the ionic radius of a cation can be obtained only if the radius of the anion (O2–) is already known, as illustrated in Figure 4.2. The distance between the centers of the cation (A) and the anion (X) is the sum of the two different radii (R RA + RX; where R is the radius in Ångstroms or nanometers; 1 nanometer = 10Å). If the radius of one of the two is known, then the radius of the other can be obtained. Because so many common minerals contain oxygen as an anion (e.g., silicates, oxides, sulfates, phosphates), knowing the size of the anion radius of O2– allows for the determination of the radius of the various cations. In 1927, Linus Pauling established a radius for O2– as 1.40 Å when the oxygen anion is surrounded by six of the same cations (e.g., Mg2+) as neighbors. The number of neighboring ions surrounding a central ion has a considerable effect on its radius size. In other words, an ion inside a crystal structure cannot be assumed to behave as a rigid sphere. It expands somewhat as a function of an increase in the number of closest ion neighbors, and it shrinks as a function of a decrease in the number of ion neighbors. In other words, the size of a central ion is influenced by the space
provided by surrounding ions. From extensive review of the radius of oxygen in many oxygen-containing compounds, Shannon (1976) concluded that an oxygen anionic radius for O2– of 1.26 Å is preferable over the 1.40 Å radius originally established by Linus Pauling. Using the 1.26 Å radius allows for the calculation of cation radii (Fig. 4.2) from the equation RA = d – RX, where d = the interatomic distance (the distance between the centers of the two ions) and RA and RX are cation and anion radii, respectively. These calculated cation radii (referred to by Shannon as crystal radii or effective radii) appear to correspond best to the physical size of ions in solids. Table 4.4 is a listing of the 29 most common elements in their most common ionic state and gives the radius for each ion. The top of the table, at the right, notes that the radius is a function of the coordination number. A coordination number is the number of closest neighbors that surround a central ion. In other words, if a cation such as Fe2+, or Mg2+, is surrounded by six closest neighbors of O2− (as is the case in the crystal structure of olivine ((Mg2+, Fe2+)2SiO4), it is said to have a coordination number (C.N.) of VI (Roman numerals are most commonly used). In the case of C4+ in the (CO3)2– group of carbonates, the central C4+ cation is surrounded by three O2– anions; therefore, the coordination number, C.N., is III. The five columns on the right of Table 4.4 record the variability of the radii of ions in crystal structures as a function of C.N. As was noted earlier, these radii show that cations show an increase in size as a function of increasing C.N. In conclusion, it is instructive to compare the radius values in Tables 4.3 and 4.4. This shows that the radius of a cation is considerably smaller than its atomic radius. This results from the loss of one or more outer electrons in the formation of the cation, which leads to a reduction in the overall size of the electron cloud. An anion, because it gains electrons, is larger than the corresponding neutral atom. As we said earlier, elements (as atoms or ions) are the basic building blocks of crystal structures. Now that we have a clear picture of their size range, and the dependence of the size of an ion on the number of its closest neighbors, the question that arises is, “How do these building blocks arrange themselves inside a crystal structure?” That discussion follows.
Table 4.3 Atomic radii in Ångstroms for 12-fold coordination. Atom
Radius
Atom
Radius
Li
1.57
Cr
1.29
Be
1.12
Mn
1.37
Na
1.91
Fe
1.26
Mg
1.60
Cu
1.28
Al
1.43
Ag
1.44
K
2.35
Sn
1.58
Ca
1.97
Pt
1.39
Ti
1.47
Au
1.44
Source:: Wells (1991)
65
66
Fundamentals of crystal structures Table 4.4 Radii of common ions (in Ångstroms) as a function of coordination number. Radius as a function of coordination number
Atomic number
Element
Ion
3
Lithium
Li+
4
Beryllium
Be2+ 3+
III
IV
VI
VIII
0.73
0.90
1.06
0.30
0.41
0.59
5
Boron
B
0.15
0.25
0.41
6
Carbon
C4+
0.06
0.29
0.30
8
Oxygen
O
2–
1.22
1.24
1.26
9
Fluorine
F–
1.16
1.17
1.19
11
Sodium
Na+
1.13
1.16
1.32 1.03
2+
12
Magnesium
Mg
0.71
0.86
13
Aluminum
Al3+
0.53
0.68
14
Silicon
Si4+
0.40
0.54
15
Phosphorus
P3+
Sulfur
S
0.31
2–
0.26
–
Chlorine
Cl
Potassium
K+ 2+
Calcium
Ca
22
Titanium
Ti4+
24
Chromium
Cr3+
26 27
Manganese Iron Cobalt
0.43 1.67
1.51
20
25
0.52 0.51
S6+ 19
1.53
1.70
S4+ 17
1.28
0.58
P5+ 16
XII
0.56
1.52
1.65
1.78
1.14
1.26
1.48
0.65
0.88
0.76
2+
0.80
0.97
Mn4+
0.53
0.67
Fe2+
0.77
0.92
1.06
Fe3+
0.63
0.78
0.92
Co2+
0.72
0.88
1.04
2+
0.69
0.83
0.74
0.91
2+
0.71
0.87
0.74
0.88
1.04
1.32
1.40
Mn
28
Nickel
Ni
29
Copper
Cu+ Cu
1.10
30
Zinc
Zn2+
38
Strontium
Sr2+
40
Zirconium
Zr
4+
0.73
0.86
0.98
47
Silver
Ag+
1.14
1.29
1.42
56
Barium
Ba2+
1.49
1.56
1.75
2+
1.33
1.43
1.63
1.03
1.14
1.31
0.87
1.00
82
Lead
Pb
92
Uranium
U3+
1.17
U4+ U6+
1.58
0.66
Note:: These data represent the crystal radii reported by Shannon (1976). In textbooks such as Klein and Dutrow (2008) and Dyar et al. (2008), the traditional radii (based on the radius of oxygen = 1.40 Å) are reported. The difference between crystal radii and traditional radii is a constant factor of 0.14 Å.
4.3 What factors control the packing of ions (and atoms) in mineral structures? The best approach to this question is to consider atoms (and ions), as a first approximation, as variably sized spheres with specific electronic charges. This allows for an evaluation of how
ions (and atoms) surround themselves with neighboring ions (or atoms) without consideration of the details of their electronic configuration about a central nucleus. In a stable structure, the cation is the center of a geometric shape, and the locations of the adjoining anions describe what is known as a coordination polyhedron. As noted in the prior
4.3 What factors control the packing of ions (and atoms) in mineral structures?
section, the number of anions in the polyhedron is the coordination number (C.N.) of the cation with respect to the anions (expressed in Roman numerals, as in Table 4.4). The actual number (e.g., IV, VI) is a function of the relative sizes of the cations and anions involved. Each coordination number reflects a specific polyhedral shape. Here we illustrate the change in coordination number about a cation by keeping the size of the larger anion fixed throughout while increasing the size of the central cation from very small to that of the size of the anion. This mirrors the presence of the large O2– anions (assumed to be of constant radius) and a wide range of cation sizes in silicate, oxide, and carbonate structures. This approach is similar to using ping-pong balls, with a constant diameter of 40 mm (20 mm radius) as the anions and evaluating how ball bearings (of continually increasing size) can be packed between the ping-pong balls. The radius of the cation is denoted as RA; that of the anion as RX. Relative values of radius ratio (the ratio of the size of the cation divided by that of the anion: RA/R RX) are commonly good predictors of coordination. Here we approach this in a qualitative, visual fashion. Geometric derivations of the limiting radius ratio values are given in standard mineralogy textbooks. Figure 4.3(A) shows a linear array when the cation is very small with respect to the anion. Here the cation can have only two adjoining anion neighbors. The limiting value of RA/R RX (for this linear coordination) is 0.155. This means that when the radius of the cation is less than 15.5% of the radius of the anion, a linear arrangement (II) occurs. With a ratio bigger than this, the next-larger coordination results (as in Fig. 4.3(B)). With RA/ RX between 0.155 and 0.225, triangular coordination results.
(A)
(B) Triangular
Linear 90˚; α = γ = 90˚
(B)
Orthoclase
Gypsum (011)
c
(001) c
c b
(010) m
(110) m y
(001)
(001)
m
m
b
(C) Combination of two prisms and a side pinacoid
x
(010)
p
(110) p
b m
y (110) x
o
r
o
(111)
(011) r
(011)
p r
a
(130)
Hornblende
(001) (111)
p
zb
m
(D) Combinations of vertical prisms, basal and side pinacoids and {hol} pinacoids
Augite c
m
y
(010)
(201)
(120)
z
(010)
m
a
m
b
m
m
b
m o
o
r b
m a
(221)
m
e
(100)
(E) Combinations of prisms and pinacoids
(F) Combinations of prisms and pinacoids
Figure 5.16 (A) Monoclinic crystal axes. (B) Stereogram of the 2/m symmetry in the second setting and the distribution of face poles of the general form, {hkl}, known as a prism. (C) Very common habit of gypsum crystals. (D) Various typical crystals of orthoclase. (E) Augite crystals that show form combinations typical of most of the clinopyroxene group. (F) Hornblende crystals showing the development of forms common in clinoamphiboles.
111
112
Introduction to crystallography
location of the + end of a and the outer edge of the equatorial circle is a function of the β angle. If β were 90°, the projection point would lie on the outer perimeter of the circle. With β increasing in size, it moves toward the center of the stereogram. m is most The previously described orientation for the axes in 2/m commonly used in mineralogy textbooks. This is known as the second setting. In some of the crystallographic literature, the 2-fold rotation axis is taken as a vertical axis with the mirror coincident with the equatorial plane. This is referred to as the first setting. The general form, {hkl}, in this crystal class, is a four-faced prism, the face poles of which are plotted in the stereogram in Figure 5.16(B). There are also {0kl} and {hkk0} prisms, and several of these are shown in Figure 5.16(C)–(F). The only other form in this crystal class is the two-sided pinacoid. The most common of these are the {100} or front or a pinacoid; the {010} or side or b pinacoid; and the {001} or basal or c pinacoid. Several of these are shown in Figure 5.16(C)–(F). In addition, there are {h0l } and {h0l } pinacoids. Many minerals crystallize in this crystal class and several rock-forming minerals are illustrated in Figure 5.16. Orthoclase 1
Triclinic
is a monoclinic K-feldspar. Augite is a member of the large group known as clinopyroxenes and hornblende is an example of the large group of clinoamphiboles.
1 Crystals belonging to this crystal class are referred to three crystallographic axes of unequal lengths that make oblique angles with each other (Fig. 5.17(A)). Because of the low symmetry content of this point group, namely i (= inversion), which is equivalent to a center of symmetry, the only forms possible are two-sided pinacoids. The general form, {hkl}, pinacoid is shown in the stereogram in Figure 5.17(B). Other pinacoids that occur have Miller indices such as {100}, {010}, {001}, {0kl}, {h0l}, and {hk0}. k A number of these are illustrated in Figure 5.17(C)–(D). There are established rules for the orientation of crystals in the triclinic system. If the crystal is elongate in its habit, that direction is taken as the vertical c axis, as in Figure 5.17(C). If it is flat in its habit, then the large pinacoid is chosen as a basal pinacoid, as in Figure 5.17(D).
Pinacoidal class
+c –a –b
β
α
γ
c b
+b
+a –c
(A)
a
a≠b≠c α ≠ β ≠ γ ≠ 90˚
(B)
Plagioclase (001)
Rhodonite (110)
(110)
(010) (110) (001) (110) (100)
(111)
(101)
(C) Combination of five pinacoids in plagioclase
(D) Combination of six pinacoids in rhodonite
Figure 5.17 (A) Triclinic crystal axes. (B) Stereogram of the location of the three crystallographic axes and the two face poles of the general form, {hkl}, known as a pinacoid. These two face poles are related by inversion (ii). (C) and (D) typical crystal habits of plagioclase and rhodonite, respectively.
5.6 Twins
The most common rock-forming minerals that crystallize in this point group are members of the plagioclase series, microcline (a triclinic K-feldspar), rhodonite, and wollastonite.
5.6 Twins Mineral grains occur over a range of sizes (fine-, medium-, and coarse-grained) as the basic constituents of rocks. These grains are individual crystals that are generally tightly interlocked with neighboring grains. We call these mineral grains and not crystals because most of the time they lack well-developed crystal faces because of their close intergrowth with adjoining grains. We describe such mineral grains as anhedral or subhedral (Sec. 2.4). Euhedral grains, or well-formed crystals, of considerable size (about 3 cm in the long dimension) are relatively rare because they occur mainly in very coarse-grained assemblages found in pegmatites or quartz veins. More rare are wellformed twinned crystals or twins. They are not the result of random intergrowths with each other. Instead, they result from a rational, symmetrical intergrowth of two or more crystals of the same substance. The two or more individuals are related by a new symmetry element (known as the twin element) that was not already present in the untwinned single crystal. This twin element can be • A mirror plane or twin plane • A rotation axis or twin axis • An inversion about a point or twin center
m
The previous three operations are known as the twin laws. Let us first illustrate how twinning happens on the atomic scale, before we discuss twin operations as seen in the external
(A)
A′
A
form of crystals or under the optical microscope. The bottom right segment of Figure 5.18(A) shows a simple structural arrangement of identical atoms in a rectangular array, an orthorhombic lattice (a lattice is an imaginary pattern of points (or nodes) in which every point (or node) has an environment that is identical to that of every other point (or node) in the pattern). It shows the identical lattice on the left side but stacked in an inclined fashion. There is a perfect fit between these two lattices along the inclined plane marked as A-A′. This is the mirror plane (or twin plane), by which the two identical lattices (but in different orientations) are related. Figure 5.18(B)–(C) shows another twin operation, on an atomic scale, namely that of a twin related by a rotational axis, the twin axis. The lower right-hand side of the lattice is identical to that part of the lattice in Figure 5.18(A). The upper left part shows a segment of that same lattice but rotated 120° from its original right-hand position (Fig. 5.18(B)). Figure 5.18(C) shows the result of 180° rotation of the original lattice segment to its final position. One corner atom is differently colored in these three figures so as to show the distinction between a twin related by a mirror and by a rotational axis. These figures illustrate that the regular arrangement of atoms in the original lattice (lower right side) is interrupted in a nonrandom, very regular fashion. Such twins, known as growth twins or primary twins, are considered accidents or nucleation errors that occur during the free growth of a crystal. They are the result of the attachment of atoms, ions, or ionic groups on the outside of a growing crystal in such a way that the original pattern of the crystal structure is interrupted but in a regular way. Processes that modify a crystal after its formation (after its growth is completed) are called secondary. Secondary twinningg can result from mechanical ~120˚
(B)
B′
B
180˚
(C)
B′
Figure 5.18 (A) Two parts of the same orthorhombic lattice related by the inclined mirror plane (A-A´). The twin law, therefore, is a twin plane. One sphere (atom) has a different color to emphasize that the twin operation is indeed a mirror. (B) Partial rotation (about 120°) of a segment of the lattice about an axis of rotation (B-B´). (C) Complete (180°) rotation of the same segment as in (B) but in a location identical to that shown in (A). Note that (A) and (C) are different, as shown by the locations of the spheres (atoms) at the lower right and their relocation by mirroring (A) or 2-fold rotation (C). (Adapted from the CD-ROM Mineralogy Tutorialss that accompanies Klein and Dutrow 2008.)
B
113
114
Introduction to crystallography
deformation and from the displacive transformation of one polymorph into another (see Sec. 5.8). Twins are classified as follows: Contact twins: a regular composition plane joins the two individuals. Such individuals are separated by a twin plane. Penetration twins: appear to be intergrown with the individuals interpenetrating, and an irregular composition surface. Penetration twins are usually produced by rotation and defined by an axis of rotation. Multiple or repeated twins: three or more individual crystals are twinned according to the same twin law. A polysynthetic twin group results if all the composition surfaces are parallel. We will give some common examples of each of the above twin types beginning with contact twins. But first let us look back at a statement given at the beginning of Section 5.6: “The two or more twinned individuals are related by a new symmetry that was not already present in the untwinned crystal.” Figure 5.19(A) shows an octahedron, {111}, a common form in the isometric point group 4/m 3 2/m. Diamond and magnetite (a member of the spinel group) crystals commonly occur in such crystals. Figure 5.19(A) also shows an inclined plane that is one of four possible planar directions (all part of {111}) along which the octahedron may be twinned. This is a planar direction that is not a mirror already present in 4/m m 3 2/m. This is a new symmetry element introduced in the twinning operation. The resultant twin, known as a spinel twin, is shown in Figure 5.19(B) and a stereogram of the symmetry content of 4/m 3 2/m as well as the orientation of the new mirror (twin) plane is given in the stereogram in Figure 5.19(C). Additional examples of contact twins in some rock-forming minerals are shown in Figure 5.20. Penetration twins are generally the result of twinning along a specific direction known as a twin axis. The resulting twinned
intergrowth is intertwined having an irregular composition surface. Figure 5.21 illustrates the twin that results when a crystal of orthoclase (K-feldspar) is rotated about itself by 180° about the vertical c axis (identified by the direction symbol [001]). Figure 5.21(C) shows the resultant twin with the vertical c axis the twin axis. Orthoclase crystals are monoclinic with point group 2/m. This includes a 2-fold rotation axis parallel to bb, but not a 2-fold rotation axis along c. The 180° rotation about c, therefore, is the new symmetry element, or twin element (twin law). This is shown in the stereogram for 2/m m in Figure 5.21(D). Additional examples of penetration twins are shown in Figure 5.22. Photos of two minerals with contact twins and one with a penetration twin are given in Figure 5.23. Repeated or multiple twins consist of three of more individuals. When the composition surfaces are closely spaced and parallel, they are known as polysynthetic twins. This twin type is extremely common in triclinic plagioclase and in microcline (a K-feldspar). Figure 5.24(A)–(C) illustrates how a polysynthetic twin comes about. The first thin and planar triclinic unit of the twin with a well-developed {010} pinacoid is shown in Figure 5.24(A). This first basic unit is repeated as a twin by a mirror reflection parallel to (010), as shown in Figure 5.24(B). With many more consecutive parallel twin planes, a polysynthetic twin develops, as shown in Figure 5.24(C). This twin type, known as an albite twin, is very common in and highly diagnostic of triclinic feldspars. Note that the newly introduced symmetry element, the twin element, is a mirror plane parallel to (010). Triclinic minerals (1 or 1) do not have such a mirror already part of their symmetry content. However, monoclinic minerals with point group 2/m m do have such a mirror in the a-cc plane, perpendicular to the b axis. As such, only triclinic feldspars can have this type of twinning. Figure 5.24(D) is a hand specimen of a triclinic feldspar (a member of the plagioclase series) that shows fine lines or striations on a cleavage surface. These lines are the edges of the thin successively twinned parallel plates (as
-(111)
a3
(A)
(B)
(C)
a2
a1
Figure 5.19 (A) An isometric octahedral crystal (4/m m 3 2/m m) with a shaded plane (111) that is parallel to one of the four planar directions of the octahedron {111}. If this added plane acts as a mirror, a twin will result. (B) The twin, known as a spinel twin, is twinned along one of the four planar directions of {111}. (C) A stereogram of the symmetry of 4/m m 3 2/m m with the location of the newly added twin plane. Note that this mirror plane was not present in the symmetry content of 4/m m 3 2/m. m
5.6 Twins
Quartz
Staurolite
Hexagonal: 32
Pseudo-orthorhombic (monoclinic with β ~90˚): 2 m c
r m
m
r
m
m
m
r
m
– (A) Japan twin on {1122}
m
c
r c
b
m b
m
m
m
c
b
b
m
(B) Twin on {031}
Twin on {231}
Gypsum
Orthoclase
Monoclinic: 2 m
Monoclinic: 2 m
l
b c
M
b y y
l
(C)
(D)
Swallowtail twin on {100}
c axis
b
x m m
o
b
y y
Manebach twin on {001}
b m o
Bareno twin on {021}
~80˚
[001]
m
Figure 5.20 All drawings of these contact twins are idealized. (A) A quartz twin. (B) Two types of contact twins common in staurolite. Such twins are uniquely diagnostic in the identification of staurolite in rock types in the field and hand specimen. Staurolite is here referred to as pseudoorthorhombic because its external form is rectangular in outline along all three axial directions. It is in reality monoclinic, but the β angle is so close to 90° that it appears orthorhombic. (C) A swallowtail twin as seen in gypsum. (D) Two different types of contact twins in orthoclase.
~150˚ [001]
[001]
(A)
(B) 180˚ [001]
m c
a
(C)
(D)
b
Figure 5.21 (A) A single crystal of monoclinic orthoclase (K-feldspar) with symmetry 2/m. (B) Two intermediate stages of intergrowth of the two crystals as a result of rotation of crystal in (A) about the vertical c axis ([001] direction). (C) The final penetration twin, known as a Carlsbad twin . (D) Stereogram of the symmetry elements in 2/m m and the newly introduced 2-fold rotation axis along c.
115
116
Introduction to crystallography [001]
twinning. Deformation twins form in response to mechanical stress and inversion twins result from the structural change that happens when an earlier-formed crystal transforms to a lower symmetry, as a result of decreasing temperature (discussed in Sec. 5.8).
[111]
5.7 Some aspects of space groups Pyrite “Iron Cross”
Twin law: 90˚ rotation about [001]
Fluorite
Twin law: 90˚ rotation about [111]
Figure 5.22 Examples of two penetration twins and their twin laws. The rotations in both twins are 90° about the directions noted. The pyrite iron cross twin results from the regular intergrowth of two pyritohedra. The fluorite twin consists of two intergrown cubes.
in Fig. 5.24(C)). Albite twinning is very easily identified in thin sections, as shown in Figure 3.20(B). The low-temperature polymorph of KAlSi3O8, known as microcline, is triclinic and always shows albite twinning. However, microcline is also twinned, but according to the pericline law, it results in a pericline twin. The lamellae of albite and the pericline twins cross at about 90° on a basal pinacoid, {001}, giving rise to a characteristic tartan pattern on that face, as shown in Figure 3.20(A). If, in a multiple twin, the twin planes are not all parallel but instead parallel to other faces of the same form, it is called cyclic twin. Yet two other types of twinning are known as deformation and inversion twinning, g both of which represent secondary
In Section 5.1, we introduced four elements of symmetry (mirrors, rotation axes, center of symmetry, and rotoinversion axes) that in various combinations lead to the 32 crystal classes (or point groups). All these symmetry elements and their combinations are referred to as translation-free elements because they all intersect at one point (32 point groups) in the center of a crystal, or a stereogram thereof. Space groups, which represent the various ways in which motifs (e.g., atoms, ions, ionic groups in crystals), can be arranged in a homogeneous array (homogeneouss meaning that each motif in the pattern is equivalent to every other motif in the pattern) contain additional translational symmetry elements. These are the following: • Translation (t) t • Screw axes (a rotation axis combined with translation) • Glide planes (a mirror plane combined with a translation)
Space groups and their notation are shorthand for the translational and symmetry elements that define the location of atoms, ions, and/or ionic groups in crystal structures. In subsequent chapters on the systematic treatment of minerals in various rock types (igneous, sedimentary, metamorphic, and ore minerals in Chapters 7, 10, 13, and 15, respectively), each
Figure 5.23 Photos of three twin types. From left to right: a Japan twin in quartz (a contact twin); a Carlsbad twin in orthoclase (a penetration twin); and a butterfly twin in calcite (a contact twin).
5.7 Some aspects of space groups
(010)
(A)
0.1 mm
(010)
(010)
(B)
(C)
(D)
Figure 5.24 (A) A thin plate with a large pinacoidal development parallel to {010} is the original unit that is twinned into a pair in (B) through a mirror (or composition) plane parallel to (010). (C) Successively twinned parallel plates as in albite twinning in triclinic feldspars. (D) A hand specimen of plagioclase with albite twin lamellae on a cleavage surface. ((A)–(C) adapted from the CD-ROM Mineralogy Tutorialss that accompanies Klein and Dutrow 2008).
mineral structure illustration has a headline that consists of mineral name, composition, and space group notation. In the following discussion, we introduce basic aspects of space groups and their notation.
Translation Three-dimensional order (as inside a crystal structure) results from regular translations (t) in three different directions: x, y, y
BOX 5.6
and z. z It has been shown that in two-dimensional, regular patterns, there are only five unique planar translational patterns. Using these five patterns as a base, 14 three-dimensional lattice types can be developed that are known as space lattices, or the 14 Bravais lattices. A lattice is an imaginary pattern of points (or nodes) in which every point (or node) has an environment that is identical to that of every other point (or node) in the pattern. A lattice has no specific origin, as it can be shifted parallel to itself.
A FEW OF THE MILESTONES IN THE DEVELOPMENT OF CRYSTALLOGRAPHY
Presently, the science of crystallography, through the use of X-ray diffraction techniques, deals with the arrangement of atoms, their bonding, their symmetry, and translations in solid crystalline compounds. This has evolved from the study, in the nineteenth century, of the external (morphological) symmetry of well-formed (euhedral) crystals by refined optical instruments known as reflecting goniometers. These instruments permitted highly accurate and precise measurement of the positions of crystal faces. In the second half of the nineteenth century, Auguste Bravais (1811–1863) made an important contribution to the study of crystal geometry when he introduced a theory of crystal lattices in which he proved that only 14 different lattice types are possible. These are now referred to as the Bravais lattices, named in his honor. At the end of the nineteenth century, the Russian mineralogist F. Fedorow and the German mathematician Artur Schönflies independently developed a general theory of internal order and symmetry within crystals. They showed that there could be only 230 different types of structures based on symmetry and translational elements in crystal structures. Schönflies used the mathematical theory of groups and his work was responsible for calling the collective symmetries of spatial patterns space groups. This discovery forms the basis of our present classification of crystal structures determined by X-ray diffraction methods. An enormous change in the approach to the science of crystallography occurred in 1912 when Max von Laue, together with W. Friedrich and P. Knipping, showed in an X-ray experiment at the University of Munich, Germany, that crystals cause distinct X-ray diffraction patterns due to atoms and that crystals are composed of periodic arrays of atoms. X-rays had previously been discovered by Wilhelm Conrad Röntgen in 1895. In 1914, the first crystal structures were determined by X-ray diffraction techniques by Sir W. L. Bragg (1862–1942). Since then, all of our accurate and precise information about complex crystal structures has been the result of the development of more and more sophisticated X-ray diffraction instrumentation. All the crystallographic discoveries in the nineteenth century, on the basis of very careful study of the external symmetry of crystals, are now part of the knowledge base that was subsequently developed from X-ray diffraction studies.
117
118
Introduction to crystallography a3
Isometric α = β = γ = 90˚ a=b=c a2 a1
P C
F c
R
P
c
I P
a1
Hexagonal α = β = 90˚; γ = 120˚ a = b (≠ c)
C = c- face centered R = rhombohedral in the trigonal division of the hexagonal system
a2 a1
P or C
I = Bodycentered (from the German innenzentriert) c
a2 a2
R or P
a1
P = Primitive F = All-face centered
P
I Tetragonal α = β = γ = 90˚; a = b (≠ c)
Rhombohedral
c
b
a
P
C
F
I
Orthorhombic α = β = γ = 90˚(a ≠ b ≠ c) c
β
a
c
b
P
β
β
α γ
C (is equivalent to I) Monoclinic α = γ = 90˚( ≠ β; a ≠ b ≠ c)
a
b
P
Triclinic (α ≠ β ≠ γ; a ≠ b ≠ c) no symmetry imposed restrictions
Figure 5.25 The 14 unique lattice types, known as Bravais Lattices, arranged according to crystal system. In the structure illustrations of minerals in subsequent sections on systematic mineralogy (Chapters 7, 10, 13, and 15), each structure drawing is headed by a mineral name, its chemical formula, and its space group notation. The first letter entry in the space group is always the abbreviation for the Bravais lattice type, as shown here. In the hexagonal system, there are three different lattice choices: two for hexagonal structures (P P or C in hexagonal) and R in the trigonal division of the hexagonal system. Even though a space group may begin with R R, it is traditional to describe the unit cell in terms of a primitive hexagonal lattice (P). This hexagonal choice of axes is preferred because they are easier to visualize than the rhombohedral ones.
The 14 Bravais lattices represent 14 different ways in which nodes (atoms) can be arranged periodically in three dimensions. They are illustrated in Figure 5.25, and their abbreviations are explained there as well. Primitivee means that there
are nodes at the corners of the lattice only. There is a primitive choice in each of the six crystal systems. Centered lattice choices occur in five of the crystal systems. The various symbols (P, P F, I, C, and R) are the first entry in a space group notation. C
5.7 Some aspects of space groups
When a crystal structure is viewed as a regular repetition of nodes in three-dimensional space, it can be assigned the Bravais lattice appropriate to that crystal structure. This leads to the concept that a crystal structure is really an infinitely extending space lattice made up of an infinite number of unit cells, where a unit cell is defined as the smallest unit of structure that can be infinitely repeated to generate the entire structure.
41 - Right-handed screw motion
43 - Left-handed screw motion
t 4
t 4
Screw axes A screw axis is a rotational operation with a translation (tt) parallel to the axis of rotation. Figure 5.26 gives three-dimensional representations of two opposite screw motions. The screw axis symbols consist of digits (2, 3, 4, and 6) followed by a subscript, which when inverted represents the fraction of the translation (t) t inherent in the operation (Fig. 5.27). For example, 21 represents a 2-fold rotation with a translation of ½. The ½ results from placing the subscript over the main axis symbol, 2, to derive the fraction. In the case of 3-, 4-, and 6-fold screw axes, there are additional notations that relate to the handedness of the screw motion (whether the operation is right handed or left handed) or whether the operation is considered neutral. In Figure 5.26, there are drawings of two choices of isogonal screw axes, 41 and 43 (isogonal meaning “rotation through the same angle,” from the Greek words isoss, meaning “same,” and gonia, a meaning “angle”). The translation component in both screw operations is 1/4, but a convention allows for a distinction between the two different screw directions, 41 and 43. When the ratio of the subscript to the digit of the rotation axis (1/4 for 41) is less than ½, the screw is defined as right handed. A right-handed screw operation is one in which the unit of structure (an atom) moves away from the observer in a clockwise direction. When this ratio is more than ½, it is lefthanded, as in 43, where 3/4 is larger than ½. Therefore, 43 is the notation for a left-handed screw motion. The same holds for 31 and 32, which are an enantiomorphous pair of screw axes. Enantiomorphouss is derived from the Greek word enantioss, meaning “opposite.” Therefore, 31 and 32, 41 and 43, 61 and 65, and 62 and 64 are all enantiomorphous pairs of screw axes because each pair represents two screw operations in opposite directions (one right handed, the other left handed). When the ratio is exactly ½, as in 21 (fraction is ½), in 42 (fraction is 2/4 = ½), and in 63 (fraction is 3/6 = ½), the screw motion is considered neutral. This means that the structural unit, the atom, ends up at the same place irrespective of the direction in which the rotation occurs. Figure 5.27 gives the numbers with subscripts as well as the standard symbols used for screw axes in illustrations of crystal structures.
Glide planes A glide operation is a combination of a mirror reflection with a translation (tt/2 or t/4) parallel to the mirror. Figure 5.28(A) shows how a two-dimensional pattern of human tracks
(A)
41
43
41
43
(B) 0, +1
0, +1 +3 4
+1 4
(C)
+1 4 +3 4
+1 2
+1 2
Figure 5.26 (A) Vertical views of two screw motions (41 and 43) with the appropriate graphical symbols for each at the top of the figures. (B) Further three-dimensional representation of the two screw motions. (C) Twodimensional projections of both with fractions that reflect the positions of spheres along the vertical axes in (A).
illustrates a glide operation with translation t/2. Figure 5.28(B) shows a glide operation in a three-dimensional sketch. Figure 5.28(C) shows three octahedra that are related by a glide operation parallel to the vertical c axis. Figure 5.28(D) shows a more complex structural arrangement of a tetrahedral chain attached to an octahedral chain with a vertical glide operation parallel to the c axis (this is known as a c glide, see Fig. 5.29). Figure 5.28(E) is a polyhedral view of a tetrahedral-octahedral chain in the crystal structure of diopside, CaMgSi2O6, with a vertical, c glide. Figure 5.29 gives a listing of mirrors and glide
119
120
Introduction to crystallography Rotation axis
Isogonal screw axis
2
21
t 2
t
Neutral
t 3 3
t
31
t 3 32
Righthanded
Lefthanded
t 4 43
41
4
t 4 42
t 2
t
Righthanded
Lefthanded
t 6
t 6
61
6
65
Neutral
t 3 62
t 3 64
63
t 2
t
Righthanded
Lefthanded
Righthanded
Lefthanded
Neutral
Figure 5.27 This illustrates graphically the operation of rotation and screw motions on motif units, here depicted as small spheres. These may represent atoms, ions, or ionic groups inside structures. The internationally accepted symbols for these operations are shown in perspective sketches at the top of each graphic and flat on the page at the bottom. Circular arrows relate to right- and left-handedness (adapted from International Tables for Crystallographyy 1983, vol. A).
5.7 Some aspects of space groups c
c
c
c t 2 t
t 2
t 2
t
t 2
b
t 2 t
t
t 2 a
(A)
Glide line
(B)
Glide plane
(D)
(C)
(E)
Figure 5.28 (A) Human tracks show the relationship of footprints to a glide line with translation component tt/2. (B) A three-dimensional representation of a glide plane in which the spheres on one side of the vertical glide plane relate to those on the opposite side by a combination of a mirror and translation of t/2. (C) Schematic illustration of octahedra, in a chain, related by a glide plane that is vertical (shown by the dashed line). The vertical direction is shown as c. Each octahedron is reflected across the dashed line and moved by tt/2 , which results in the pattern shown. (D) A similar chain but with a tetrahedral chain attached to the octahedral chain. Same translation direction and distance as in (C). (E) The actual arrangement of tetrahedra and octahedra in a slightly kinked chain in the structure of a pyroxene of diopside, CaMgSi2O6, composition. This is the result of a glide plane parallel to the c axis, known as a c glide. The tetrahedra are occupied by Si4+ and the octahedra by Mg2+.
planes, their letter abbreviations, and graphical symbols. The letters define the direction in which the glide operation occurs as well as the distance of the glide translation. The letters, a, b, and c refer to glides that are parallel to one of the three crystallographic axes, with a glide translation of t/2. t n and d are known as diagonal and diamond glides, respectively, with more general
glide directions (e.g., aa/2 + b/2, or a/4 + b/4). Diamond glides in the structure of diamond are illustrated in Box 5.7.
5.7.1 Space groups When the 14 possible space lattice types (Bravais lattices) are combined with the symmetry elements inherent in the 32
Graphical symbol Symbol
m
Symmetry Plane
Direction and distance of glide translation
Mirror
none
a, b
Glide plane normal to plane of projection
a/2 along [100] or b/2 along [010]*
c
Axial glide plane (Parallel to one of three axial directions)
n
Diagonal glide plane
a/2 + b/2; a/2 + c/2; c b/2 + cc/2; or a/2 + b/2 + c/2 c (tetragonal and isometric)*
d
Diamond glide plane
a/4 + b/4; b/4 + c/4 c ; a/4 + cc/4; or a/4 + b/4 + c/4 c (tetragonal and isometric)*
c/2 along the c axis
* Axial directions and crystal systems are discussed in Section 5.3 Figure 5.29 Letters and symbols for mirrors and glide planes used in structure illustrations. Glide translations are given in the third column. (Adapted from International Tables for Crystallographyy 1983, vol. A).
121
122
Introduction to crystallography
crystal classes (point groups) as well as translational elements (translation, screw axes, and glide planes), a space group results. The 230 space groups are the 230 unique ways in which motifs (atoms, ions, and ionic groups in crystals) can be arranged in a homogeneous array (i.e., each motif is equivalent to every other motif in the pattern). This unique number was independently proved in the late 1800s by E. von Fedorov, a Russian crystallographer; Artur Schönflies, a German mathematician; and William Barlow, a British amateur mineralogist. All space groups are described and illustrated in volume A of the International Tables for Crystallographyy (1983). A complete listing is also provided in some mineralogy textbooks. In Table 5.3 we list only those space groups that are directly related to the seven point groups systemically discussed in Section 5.5. This table, with 76 of the total of 230 space groups, is included because it illustrates the elegance and information content of the Hermann-Mauguin system as used for both space groups and point groups (crystal classes). A space group may contain considerable translational information (Bravais lattice type, and symbols for screw axes and glide planes), whereas the related point group is the isogonal translation – free residue of, in general, a number of space groups. If, mentally, all the translational aspects of a space group are removed (i.e., lattice type, glides, screws) and replaced by nontranslational symmetry elements (mirrors and rotations), the appropriate point group notation results. This is illustrated in the last part of Box 5.7, using the structure and space group of diamond. The determination of the space group of a crystal is directly tied to the measurement of many aspects of its crystal structure. A crystal structure analysis, by an X-ray crystallographer, starts with a very small, perfect crystal that is irradiated by an X-ray beam yielding several thousand diffracted X-ray beams (see Box 5.6). The systematic measurement of the geometric distribution of these diffracted X-ray beams yields information about the geometry of the crystal’s unit cell, especially the lengths of the unit cell edges and the angles between them. Information about the space group, the coordinates of the atomic positions, and the overall symmetry of the atomic arrangement is contained in the intensities of the diffracted beams. Let us now illustrate the structures of two common rockforming minerals and derive from these some of their space group elements. This will help make the connection between the crystal structure and its space group notation. Figure 5.30 represents various views of the structure of low quartz, a polymorph of SiO2 that is stable below 573°C at atmospheric pressure. Although this particular polymorph is here referred to as low quartz, it is generally simply called quartz. The crystal shown in Figure 5.30(A) is that of a left-handed form of low quartz. The small x face at the top left of the (1010) prism face defines it as left handed. This relates directly to the presence of left-hand (32) screw operations in the structure of low quartz. Figure 5.30(B) is a view of the structure look-
Table 5.3 Tabulation of all the space groups that relate to the seven point groups discussed in Section 5.5. Isometric space groups P m32/m, P4/ P4/ P n32/n, P4 P 2/n32/n, P4 P 2/n32/m,
Isogonal point group 4/m32/m
F m32/m, F4/ F4/ F m32/n, F4/ F m32/c, F4 F 1/d3 d 2/m, F 1/d3 F4 d 2/c, c I4/ I m32/m, I4 I 1/a32/d Hexagonal and trigonal space groups P6/m2/m2/m, P6/ P P m2/c2/ c c, P6 P 3/m2/c2/ c m, P 3/m2/m2/c P6
6/m2/m2/m
P32m, P3 P P 12/c1, P3 P 2/m1, P3 P 2/c1, R3m, R32/m, R32/c
32/m
Tetragonal space groups P4/m2/m2/m, P4/ P P m2/c2/ c c, P4/ P n2/b2/m, P n2/n2/c, P4/ P4/ P m21/b2/n, P4/ P m21/n2/c, P n21/m2/m, P4/ P4/ P n21/c2/ c c, P4 P 2/m2/m2/c, P 2/m2/c2/ P4 c m, P4 P 2/n2/b2/c, P4 P 2/n2/n2/m, P 2/m21/b2/c, P4 P4 P 2/m21/n2/m, P4 P 2/n21/m2/c, P 2/n21/c2/ P4 c m, I4/ I m2/m2/m, I4/ I m2/c2/ c c, I 1/a2/m2/d, I4 I4 I 1/a2/c2/ c d
4/m2/m2/m
Orthorhombic space groups P2/m2/m2/m, P2/ P P n2/n2/n, P2/ P c2/ c c2/ c m, P b2/a2/n, P2 P2/ P 1/m2/m2/a, P2/ P n21/n2/a, P m2/n21/a, P2 P2/ P 1/c2/ c c2/ c a, P2 P 1/b21/a2/m, P 1/c2 P2 c 1/c2/ c n, P2/ P b21/c2/ c m, P2 P 1/n21/n2/m, P 1/m21/m2/n, P2 P2 P 1/b2/c2 c 1/n, P2 P 1/b21/c2 c 1/a, P 1/n21/m21/a, C2/ P2 C m2/c2/ c m, C2/ C m2/c2 c 1/a, C m2/m2/m, C2/ C2/ C c2/ c c2/ c m, C2/ C m2/m2/a, C c2/ C2/ c c2/ c a, F2/ F m2/m2/m, F2/ F d2/ d d2/ d d, I m2/m2/m, I2/ I2/ I b2/a2/m, I2 I 1/b21/c2 c 1/a, I 1/m21/m21/a I2
2/m2/m2/m
Monoclinic space groups P m, P P2/ P21/m, C C2/m, P2 P 1/c, C2/ C c
2/m
Triclinic space group P1
1
Source: e International Tables for Crystallographyy (1983), vol. A. Note: When a 1 appears in the space group notation, there is no symmetry element in that crystallographic location. All 230 space groups are listed in tables in Klein and Dutrow, 2008; Dyar et al., 2008; and Perkins, 2011.
ing straight down the c axis. This reveals the 3-fold rotational symmetry. Figure 5.30(C) is a perspective view of the structure that shows the outline of a primitive hexagonal unit cell. Figure 5.30(D) gives two different views of the helical arrangement of tetrahedra about 32 screw axes. As explained in the caption of Figure 5.30, these various space group components result in the space group notation P3221 (the 1 means that there is no symmetry element in this location of the notation). Figure 5.31 illustrates several views of the structure of diopside, CaMgSi2O6, a member of the pyroxene group of silicates. Diopside is monoclinic, as shown by the choice of crystal axes and β angle in Figure 5.31(A). A structural view, looking down the b axis (Fig. 5.31(B)) reveals the obliqueness of the structure and the resulting monoclinic outline of the unit cell. The locations of four 2-fold rotation axes are shown at the corners of the
5.7 Some aspects of space groups
BOX 5.7
THE STRUCTURE, SPACE GROUP, AND POINT GROUP OF DIAMOND
A unit cell of the diamond structure is shown in the first diagram. It shows the 1 cubic outline of the unit cell and the 1 ° location of the carbon atoms with the 3.56 A 1 1 height of each carbon labeled as a fraction 1 3 of the vertical dimension between the 3 4 4 base (at 0) and the top (at 1). Intermediate 1 1 1 2 2 levels are labeled as 1/ 4, 1/ 2, and 3/ 4. The 2 1 2 3.56 A° tetrahedral coordination polyhedron of 1 1 4 0 four carbons about a central carbon is 4 0 a2 shaded at the top right. The location of 0 atoms at the corners and at the center of the six faces of the cube is shown 0 0 3.56 A° in the next figure. This represents a Bravais lattice that is centered on all six faces and is, therefore, represented as F (all face centered; see Fig. 5.25). The a1 third illustration is one in which the structure of diamond is viewed along the vertical a3 axis 1 1 1 2 0 just about perpendicular to the page. It is not quite perpendicular a2 0 so as to show a perspective outline of the cubic unit cell with the atoms at the top (at 1) and those in the base (at 0). Inspection of 3 1 4 4 the locations of carbon atoms (at 1, 3/ 4, 1/ 2, 1/ 4 and 0) shows the presence of 41 and 43 (right- and left-hand) screw axes. These occur 1 1 throughout the structure, but here only two locations are noted. 43 2 0 1 2 Two diagonal mirror locations (m) are shown as well. The following diagram shows a diamond unit cell with the location of four 3 1 41 4 4 diamond glides (identified by the letter dd), stacked perpendicular to the vertical a3 axis. These occur at heights of 1/8, 3/8, 5/8, and 7/8 1 1 of the vertical dimension. Identical stacks also occur perpendicular 0 0 1 to a1 and a2. The next illustration shows the glide operation in just 2 one of these glide plane locations. The glide operation in a diamond a1 a2 / . glide (d) consist of a reflection and a translation of a1 /4 4 The dashed line shows the glide direction with the red arrows following the path of the glide operation. The last figure shows three common morphological forms of diamond (cube and octahedron, and a combination of both), its space group, F 41/d32/m, as well as its translation-free point group, 4/m 3 2/m. m
m
a3
m
m
a3
a3 7
8 (d)
5
8 (d)
3
1
1
8 (d) 1
1
8 (d)
1 1
a2 1
a1
1
8 4
4
1
4
1
4
1
4
1
8
4
4
4
8
a1
glide direction
a2
123
124
Introduction to crystallography
Some forms of diamond crystals
a a
a
Cube
Octahedron
Cube and octahedron
Space group notation: – F 41 d 3 2 m *
Point group notation: – 4 m 3 2 m
Refers to 6 directions between the edges of a cube
Lattice type Refers to the 3 crystallographic axes a1, a2, and a3
4-fold rotation Rotoinversion 2-fold rotation axis with a axis axis with a perpendicular mirror mirror perpendicular
Refers to 4 diagonal directions of 3-fold symmetry between the corners of a cube
*The symbol n m means there is a rotation axis with a mirror plane (m) perpendicular to it.
c
z s m
x
(1010) m s
Quartz
r
z
s m
x
a1
(A)
z
r
r
(Left-handed)
a2
120° a2
x s SiO4 tetrahedron (0001)
SiO2
(B)
a1
c
a2
32
P 322 c
(C)
a1
(D)
Figure 5.30 Derivation of some space group elements in low quartz using various views of its crystal structure. Low quartz is the polymorph of SiO2 that is stable below 573°C at atmospheric pressure, and the name quartzz is ordinarily applied to this polymorph. (A) A low quartz crystal that shows a small face marked x in the upper-left corner of the front prism face, (10 1 0), marked m. This is known as a trigonal trapezohedral face, and its location in the upper left corner of the prism face defines it as left-handed quartz. (B) A view of the quartz structure looking straight down the vertical c axis. This is equivalent to looking down on a basal pinacoid, (0001), or along the [0001] direction. (C) A perspective view of the same structure reveals the primitive hexagonal (P P) unit cell. (D) One of the vertical chain linkages, parallel to the c axis, isolated from the structure. The upper image reveals 3-fold rotation, and the right one illustrates that this 3-fold rotational axis has a translation with a left-handed screw (arrows indicate the downward, left-handed screw component along this axis). This, therefore, is a left-handed screw axis denoted as 32. Two-fold axes (2) are horizontal and coincide with the three crystallographic axes. The space group of quartz is P3221 or P3 P 121.
5.7 Some aspects of space groups c c SiO4
(001) (111)
MgO6 β
(010)
(100)
(110)
Ca2+
b a
a
(010) view
(A) Diopside - CaMgSi2O6 Ca2+
(B)
g
C 2/c
Mg2+
Si4+ c
g
b b
(C)
View down the c axis
(100) view
(D)
a
g
unit cell. Figure 5.31(C) is a view down the c axis of the structure, which reveals the presence of five identical structural packets made of vertical t-o-tt chains (see caption). The rectangular aspect of the unit cell outline in this view reveals five such t-o-tt chains, four at the corners and one in the center of the unit cell. This centering results in a unit cell choice known as cc-centered, or C. The third view of the structure (Fig. 5.31(D))
c
120˚
(A) a1
g
g
reveals vertical glide planes along the centers of the slightly kinked t-o-tt chains. The glide component in these is 1/2 cc, and as such is represented by a small c. The appropriate space group choice for the structure of diopside is C2/ C c. c Figure 5.32 gives a synopsis of some structural data for these two structures (low quartz and diopside) that are standard for the structural characterization of any mineral.
Low quartz SiO2
a2
Hexagonal Space group: P 3221 or P 3121 Point group: 32 Unit cell dimensions: a = 4.91 A˚ c = 5.41 A˚ Z=3
Figure 5.31 Diopside, CaMgSi2O6, and three different views of its crystal structure. (A) A crystal of diopside referred to monoclinic axes showing a β angle between the + ends of the a and c axes. (B) A view down the b axis of the structure. A monoclinic unit cell is outlined in the upper part of the structure. Two-fold rotation axes perpendicular to the page are inherent throughout the structure. (C) A view down the c axis. At the top left, a unit of structure is highlighted in gray and consists of two vertical Si2O6 chains that face each other and that coordinate an MgO6 chain between them. The blue chains are tetrahedral and the yellow chains consist of vertically linked octahedra. This unit of structure is referred to as a tt oo t chain (tetrahedral-octahedraltetrahedral). Note that this structural view reveals five such tt oo t packets end on. Four are at the corners of the outlined unit cell, and one is centered inside the unit cell. This leads to the choice of a centered unit cell, in this case c-centered, or C. C (D) The front of this perspective view shows the (100) prism face with infinitely extending t oto t chains parallel to the c axis. The tetrahedral chains are not perfectly straight but have a slight kinking pattern. The three vertical dashed lines locate vertical glide planes with a glide component parallel to c. The resulting space group is C 2/c.
c
β
(B)
a
Diopside Ca Mg Si2O6
b
Monoclinic Space group: C 2 c Point group: 2 m Unit cell dimensions: a = 9.73 Å b = 8.91 Å c = 5.25 Å β = 105˚ 30’ Z=4
Figure 5.32 (A) The hexagonal primitive lattice (and unit cell) choice for low quartz. Its space group and isogonal point group. Unit cell dimensions and Z, the number of formula units of SiO2 per unit cell. (B) The monoclinic c-centered lattice choice for diopside. Its space group, isogonal point group, unit cell dimensions and Z(= 4).
125
Introduction to crystallography
Some minerals can occur in more than one structural arrangement even though their composition does not change. Polymorphism is the ability of a specific mineral (or chemical compound) to occur in more than one type of structure as a function of changes in temperature, or pressure, or both. The different structures are then referred to as polymorphs. The term derives from two Greek words, poly, y meaning “many,” and morphoo, meaning “shape,” resulting in “many shapes” or “many structures.” Table 5.4 gives examples of some common polymorphic minerals, and Figure 5.33 depicts the stability fields (in terms of variable temperature and pressure) of various polymorphs of SiO2 and Al2SiO5. Which polymorph is stable over some specific T-P P region is determined by energy considerations (see Sec. 14.2.1). The higher-temperature forms have greater lattice energy and as a result have a more expanded structure reflected in lower values for specific gravity (G) and refractive index (see Table 5.4). The higher internal energy is a function of increasing temperature, which causes higher frequencies of atomic vibrations and leads to more expanded (open) structure types. Increasing pressure favors structures with closer atomic packing. High-pressure forms of SiO2 are coesite and stishovite; the high-pressure form of Al2SiO5 is kyanite (see Fig. 5.33(A)–(B)). The G values for these three minerals and their refractive indices are much larger than those of other respective polymorphs. There are four types of polymorphism: reconstructive, displacive, order-disorder polymorphism, and polytypism. Reconstructive polymorphism involves extensive structural rearrangement in going from one structure to the other. It requires the breaking of atomic bonds and a reassembly of structural units into different arrangements. Such transformations require a large amount of energy, they are not easily reversed, and they are sluggish. All the polymorphic mineral names listed for a specific chemical composition in Table 5.4 (except for the first two entries for low and high quartz) are the result of reconstructive transformations (the low to high quartz reaction is displacive, which we discuss later). The higher-temperature forms with greater lattice energy have the more expanded structure, which is generally reflected in lower values for specific gravity and refractive index. In laboratory experiments performed at atmospheric pressure, one can study how SiO2 transforms via various polymorphs as a function of increasing temperature. The sequence, as depicted along the temperature axis of Figure 5.33(A), is as follows: Low quartz is stable up to about 573°C, at which point it undergoes a reversible, rapid inversion to high quartz; at temperatures between 870°C and 1470°C, the stable polymorph is tridymite; above that, up to its melting point of 1723°C, cristobalite is stable. In general, these polymorphic reactions, as
(A) 100
Stishovite
90 80
Pressure (kilobars)
5.8 Polymorphism
70 Coesite
60 50 40
High quartz
30 20 10
Low quartz
Liquid Cristobalite Tridymite
300
900
0 0
600
1200
1500
1800
Temperature (°C) (B)
9 8
Pressure (kilobars)
126
7 6
Kyanite Al[VI] Al[VI] SiO5
5
Sillimanite Al[VI] Al[IV] SiO5
4 3 2
Andalusite Al[VI] Al[V] SiO5
1 0
300
500
700
900
Temperature (°C) Figure 5.33 (A) Experimentally determined stability fields for the polymorphs of SiO2. (B) Experimentally determined stability fields for the three polymorphs of Al2SiO5.
a function of increasing temperature, occur as noted because of the increasing thermal energy in the system. However, such responsiveness does not happen when a high-temperature polymorph is cooled to normal crustal conditions. For example, cristobalite and tridymite are formed at high temperature and relatively low pressures in SiO2-rich lava flows. Because a high activation energy is needed to break atomic bonds and convert the high-temperature forms to low quartz, both hightemperature minerals occur abundantly in very old terrestrial volcanic flows and in Precambrian lunar rocks. These minerals are metastable (see Sec. 14.2.1 and Box 14.1) at crustal conditions but transform to the stable SiO2 form of low quartz only when additional heat (activation energy) is supplied by an external heat source. Examples of the structures of four
5.8 Polymorphism Table 5.4 Common polymorphous minerals. Composition
Mineral Name
Crystal system and space group
G
SiO2
Low (α) quartz High (β) quartz Tridymite Cristobalite Coesite Stishovite
Hexagonal – P3221 (or P3121) Hexagonal – P6 P 222 (or P6 P 422) Monoclinic – Cc Tetragonal – P4 P 12 12 Monoclinic – C 2/c Tetragonal – P4 P 2/m 21/n 2/m
2.65 2.53 2.27 2.32 2.92 4.29
1.55 1.54 1.47 1.48 1.59 1.81
Al2SiO5
Andalusite Sillimanite Kyanite
Orthorhombic – P2 P 1/n 21/n 2/m Orthorhombic – P2 P 1/n 21/m 21/a Triclinic – P1
3.15 3.24 3.65
1.63 1.66 1.72
KAlSi3O8
Microcline Orthoclase Sanidine
Triclinic – C1 Monoclinic – C 2/m Monoclinic – C 2/m
2.58 2.57 2.57
1.52 1.52 1.52
C
Diamond Graphite
Isometric – F4 F 1/d 3 2/m Hexagonal – P6 P 3/m 2/m 2/c
3.52 2.23
2.42
CaCO3
Calcite Aragonite
Hexagonal (rhombohedral) – R 32/c Orthorhombic – P2/ P m 2/n 21/a
2.71 2.94
1.57 1.63
FeS2
Pyrite Marcasite
Isometric – P2 P 1/a3 Orthorhombic – P2 P 1/n 21/n 2/m
5.02 4.89
of the polymorphs of SiO2 are given in Figure 5.34. (Various views of the low quartz structure are given in Fig. 5.30.) The highest-pressure polymorph of SiO2 is stishovite, with Si in VI (octahedral) coordination with oxygen, not the normal SiIV (tetrahedral) coordination that exists in all other silicates known from crustal occurrences. The reconstructive transformations responsible for the three polymorphs of Al2SiO5 reflect changes in the coordination numbers of the constituent Al, as shown in Figures 5.33(B) and 5.35. All three are common constituents of medium- to highgrade metamorphic rocks with Al-rich bulk compositions. Andalusite commonly occurs in contact-metamorphosed assemblages; sillimanite is found in regionally metamorphosed terrains; and kyanite, by far the most closely packed of the three structures (G = 3.65; Table 5.4), occurs in regions that have undergone the highest lithostatic pressures. The structural rearrangement in displacive polymorphism is slight when compared with that of reconstructive polymorphism. In displacive reactions, the overall structure is generally left completely intact and no bonds between atoms are broken. There is only a slight displacement of the atoms (or ions) and some readjustment of bond angles between the atoms, which results in a “kinking” of aspects of structure. Only a small amount of energy is required, so transformations occur almost instantaneously and are easily reversed. As such, one polymorph transforms easily into another. The transformation of low quartz to high quartz, and vice versa, is a prime example of such a displacive polymorphic reaction. Figure 5.33(A) shows that low quartz (the normal structural type known as quartz) is stable from 0°C to a maximum of 573°C, at atmospheric pressure. Above that temperature, quartz instantaneously transforms to the structure
Average refractive index
displayed by high quartz. The reverse reaction, from high to low quartz, is instantaneous as well as temperature falls below 573°C. The difference between the two forms of quartz is shown in Figure 5.36. Low-quartz, with space group P3121 or P3221 (where 31 and 32 denote right- and left-handedness, and 1 in the notation means that there is no symmetry operator in that specific part of the Hermann-Mauguin notation) is shown in Figure 5.36(A) with obvious 3-fold (trigonal) open spaces. High quartz, with space group P6222 or P6422 (where 62 and 64 represent opposite handedness), as shown in Figure 5.36(B), has obvious hexagonal openings in this view of the structure. In the transition from high- to lowquartz, with high-quartz having a slightly higher symmetry than low-quartz, twinning may result. Such transformation twinning is known as Dauphiné twinning when the twin elements are obversed and reversed units of structure in low quartz. Such twinning can be seen only on basal, (0001), etched sections of quartz crystals. If low quartz with such twin patterns is heated to above 573°C, the Dauphiné twins instantly disappear. Order-disorder polymorphism may arise when solid solution of two elements occurs at a specific site in a crystal structure. The degree of ordering in the structure is a function of the temperature at which the mineral originally formed. Perfect order in a mineral structure occurs only at absolute zero (0 Kelvin = –273.15°C). An increase in temperature disturbs the perfect order, resulting at an intermediate temperature in partial order and at some higher temperature in total disorder. There is no definite transition point between order and disorder; instead, a continuum of structural states exists. The best example of different states of order is shown by potassium feldspar, KAlSi3O8, which occurs as three differently
127
128
Introduction to crystallography
Tridymite Monoclinic C c
Cristobalite Tetragonal P 41 21 2
c c
a2 a1
b
a
Stishovite Tetragonal P 42 /m 21/n 2/m
Coesite Monoclinic C 2/c
c c
a2 b
a1 a1 Figure 5.34 Structures of four polymorphs of SiO2 with a unit cell outlined in each. The structure of α quartz (low quartz) is illustrated in Figure 5.30.
5.8 Polymorphism
Andalusite Orthorhombic P 21/n 21/n 2/m c
Si4+
Al3+ b
(A)
Al3+ in 5-fold coordination
a
Sillimanite Orthorhombic P 21/n 21/m 21/a c
Kyanite Triclinic P 1 c
b
Al3+
Al3+ b
Si4+ a
a (B)
(C)
Figure 5.35 Structures of the three polymorphs of Al2SiO5 with a unit cell outlined in each. (A) In the andalusite structure, Al3+ is housed in chains of edge-linked AlO6 octahedra and in 5-fold coordination between the octahedral chains. (B) In the sillimanite structure, Al3+ occurs in edge-linked chains of AlO6 octahedra and in AlO4 tetrahedra. SiO4 and AlO4 tetrahedra cross-link the vertical AlO6 chains. (C) The kyanite structure in which all of the Al3+ is housed in AlO6 octahedra; Si4+ is in tetrahedra.
named minerals: microcline, orthoclase, and sanidine. All three of these are infinitely extending framework structures in which the Al and Si are distributed over tetrahedral sites. In microcline, the lowest temperature form, Al3+ fills one of the four tetrahedral sites and the three Si4+ ions (from the formula K+ = 1, Al3+ = 1, Si4+ = 3) fill the other three tetrahedral sites (Fig. 5.37(A)), resulting in a triclinic structure (C C 1 ). In this structure, there is a 100% probability of finding the Al in only one of the four tetrahedral sites, and such distribution is known as
total order. In the highest-temperature polymorph, sanidine, there is an equal probability of finding the Al3+ in any of the four tetrahedral sites. This is known as total disorder and means that statistically, on average, each tetrahedron contains 1/ 4 Al3+ and 3/ 4 Si4+. It is for this reason that all tetrahedra in the structure illustration of sanidine (Fig. 5.37(C)) are of the same color. Sanidine is monoclinic with space group C2/m. The intermediate structure type, known as orthoclase, has the Al3+ distributed over two equivalent sets of tetrahedral sites (see Fig. 5.37(B)).
129
130
Introduction to crystallography
Quartz P 31 21 or P 32 21
Microcline Triclinic C 1 c
a2
b a
a1
(A) A)
(A)
Si
High quartz P 62 22 or P 64 22
Al
K+
1/2 Al3+ 1/2 Si4+
1/4 Al3+ 3/4 Si4+
Orthoclase
Monoclinic C 2/m c
a2
b a
(B)
a1
(B) B)
Sanidine
Monoclinic C 2/m c
Figure 5.36 (A) The crystal structure of quartz (low quartz or α quartz) as viewed along the c axis, with (0001) the plane of projection. A primitive hexagonal cell is outlined. The large openings have a trigonal outline. Additional views of the quartz structure are given in Figure 5.30. (B) The structure of high quartz (or β quartz) from the same perspective as quartz in (A). Now the large openings are hexagonal in outline.
This structure is referred to as partially ordered and has monoclinic symmetry (C2/m). The preceding transformations require little energy and the more ordered structures tend to be stable at low temperatures. Polytypism is a special kind of polymorphism in which different structural arrangements result from the different ways in which identical sheets (or layers) of structure are stacked in three dimensions. Polytypes, also referred to as stacking polymorphs, are common in the structures of layer silicates, such as clay minerals and members of the mica group. Polytypism is extensively discussed in the mineralogy textbooks by Dyar et al. (2008) and Klein and Dutrow (2008). Animated stacking sequences of polytypes can be viewed on the CD-ROM, Mineralogy Tutorials, s which accompanies Klein and Dutrow (2008).
b a
(C C) Figure 5.37 Crystal structures of the three polymorphs of K-feldspar, KAlSi3O8, with a unit cell outlined in each. (A) The low-temperature structure known as microcline. Here the Al (one Al per four tetrahedral cations; (Al + Si3) = 4) is located in a specific tetrahedral site. This means that the Al distribution is completely ordered. (B) Orthoclase, the medium-temperature polymorph, shows the Al distribution in its structure as partially ordered (or partially disordered). The one Al per formula is distributed evenly over two tetrahedral sites (1/2 Al and 1/2 Si in each of these two sites). (C) Sanidine, the high-temperature polymorph, in which the Al is distributed randomly across all tetrahedral sites. This means that statistically, on average, each tetrahedron contains 1/4 Al and 3/4 Si. This is a completely disordered structure.
Summary
Summary This chapter introduced a range of concepts in crystallography. We began with symmetry aspects of the external form of crystals because these are easier to understand (and to locate in well-formed crystals) than the more complex symmetry operations that define the internal crystal structure:
• The four symmetry elements that can be observed in well-formed (euhedral) crystals, or in wooden models that imitate them, are mirrors, rotation axes, rotoinversion axes, and a center of symmetry (i ).
• Many crystals of minerals show combinations of these symmetry elements. Such combinations can be listed (in terms of how many there are of each) or can be expressed by an internationally accepted notation, known as Hermann-Mauguin notation.
• All the symmetry combinations (or single symmetry elements as in very low-symmetry occurrences) can be grouped into six crystal systems: isometric, hexagonal, tetragonal, orthorhombic, monoclinic, and triclinic.
• These six crystal systems have their own unique reference axes and angles between the axes. • The orientation of crystal planes in the external form of crystals is described by Miller indices or Miller-Bravais indices (in the hexagonal system).
• The term crystal form m or form m is not the same as the commonly used term shapee. A crystal form is defined as consisting of a group of like crystal faces, all of which have the same relation to the elements of symmetry (contained in the crystal).
• To get away from sketches of three-dimensional crystals, projection schemes were introduced that convey the location of perpendiculars to crystal faces (known as face poles) and symmetry elements in a two-dimensional projection known as a stereogram.
• All the combinations of symmetry elements (or some single symmetry elements) as exhibited by naturally occurring crystals can be expressed in 32 crystal classes.
• We described in some detail only those seven crystal classes in which many crystals of rock-forming minerals crystallize. • Most well-formed (euhedral) crystals occur as single units or in groups of random intergrowths. However, there are also the less common twinned crystals in which one crystal is related to the other by a symmetry element.
• This chapter ended with a brief introduction to the concept of space groups and their notation. Space group notation is a condensed shorthand for the symmetry and translational elements seen inside crystal structures.
• Crystal structures exhibit, in addition to the four symmetry elements seen in the external form of crystals, translation, screw axes, and glide planes.
• Space group notation, which is internationally accepted as a definition of a particular structure type, includes symbols for the lattice type (Bravais lattice), screw axes, and glide planes, as well as for the nontranslational symmetry elements seen in the morphology of crystals.
• Space group notation can mentally be converted to that of the crystal class (point group) by deletion of all of the translational components. In other words, a point group (or crystal class) is the translation-free derivative of the equivalent space group.
131
132
Introduction to crystallography
Review questions 1. Give a short definition of a mirror, rotation axis, center of symmetry, and rotoinversion axis. 2. In the evaluation of the symmetry content of a morphological crystal, you can make a list of all of the symmetry elements
or you can use an internationally accepted shorthand notation. Which of these two approaches did you use in your course (see Table 5.1)? 3. If you were introduced to the Hermann-Mauguin notation (Box 5.1), what is so useful about this approach? 4. All combinations of possible symmetry elements (and some single elements) are referred to six crystal systems. Which are
these six? 5. The concept of crystal axes is basic to the evaluation of the position of a specific crystal face on a morphological crystal.
Why is this so? 6. In the isometric system, all three crystal axes are of equal lengths. In the orthorhombic crystal system, the axes are all of
unequal lengths. Explain what determines the difference in crystal axis lengths in these two examples. 7. What is meant by Miller indexx and Miller-Bravais indexx? Explain why these two index systems differ. 8. What is the definition of form m? 9. What is meant by the term general form? m Give an example of its Miller index. 10. What is meant by a stereogram? 11. How does one arrive at the stereogram of a morphological crystal? Explain the process. 12. Why is a stereogram such a useful illustration? 13. What is meant by the term crystal classs (or point group)? 14. How many crystal classes are there in total, and how many are systematically described in this text. 15. Give an example of a point group (crystal class) notation, using the Hermann-Mauguin system, for an orthorhombic
crystal. 16. What is the definition of a twinned crystall? 17. What are the three different twin types? 18. What are the three new elements (or operations) encountered in space groups and what are their notations that were not
seen in point groups? 19. Pure translation is described by the first letter entry in a space group notation. Give some examples of this purely
translational element. 20. Some screw axis pairs are referred to as enantiomorphous. What is meant by that? Give an example of such a pair. 21. In the evaluation of the symmetry content of crystal classes (point groups), mirror operations are represented by m m. What
letters are used in space group notation for glide planes? 22. From Table 5.3 select two space groups from two different crystal systems (e.g., isometric and tetragonal) and derive the
appropriate (translation-free) point group therefrom. 23. What is meant by the term polymorph? h 24. Give the names for three different polymorphic processes. 25. What happens in the polymorphic transition from high to low quartz? 26. How many polymorphs are there for Al2SiO5? Give their mineral names.
Review questions
FURTHER READING Bloss, F. D. (1994). Crystallography and Crystal Chemistry: An Introduction. Reprint of the original text of 1971, Mineralogical Society of America, Chantilly, VA. Dyar, M. D., Gunter, M. E., and Tasa, D. (2008). Mineralogy and Optical Mineralogy, y Mineralogical Society of America, Chantilly, VA. International Tables for X-ray Crystallographyy (1983). Vol. 1, Symmetry Groups; s Vol. A, Space Group Symmetry, y Kynoch Press, Birmingham, UK, and D. Reidel Publishing, Dordrecht, the Netherlands. Klein, C. (2008). Minerals and Rocks: Exercises in Crystal and Mineral Chemistry, Crystallography, X-ray Powder
diffraction, Mineral and Rock Identification, and Ore Mineralogyy, John Wiley and Sons, New York. Klein, C., and Dutrow, B. (2008). Manual of Mineral Science, e 23rd ed., John Wiley and Sons, New York. Klein, C., and Hurlbut, C. S. Jr. (1993). Manual of Mineralogyy, 21st ed., John Wiley and Sons, New York. Perkins, D. (2011). Mineralogy, y 3rd ed., Prentice Hall, Upper Saddle River, NJ. Wenk, H. R., and Bulakh, A. (2004). Minerals: Their Constitution and Origin. Cambridge University Press, Cambridge.
133
CHAPTER
6
Minerals and rocks observed under the polarizing optical microscope
The study of rocks and minerals was revolutionized in 1850 when Henry Sorby invented the petrographic microscope, with which he examined extremely thin (30 µm) slices of rock using polarized light. The petrographic microscope is still the most useful instrument for identifying minerals and studying the texture of rocks. It is used by mining and petroleum geologists, environmental scientists, and even forensic scientists. In this chapter, we describe how minerals can be identified using the microscope. The microscope uses polarized light, and we describe how polarized light interacts with the crystal structure of minerals. When light passes through a mineral, it is slowed down, and we measure this slowing using a property called the refractive index of the mineral, which provides one of the most useful identifying properties of minerals. When polarized light passes through minerals that do not belong to the isometric crystal system, different refractive indices can be measured in different crystallographic directions. This variation of light velocity with direction in a crystal results in numerous optical effects, all of which provide additional properties that can be used to identify minerals. One of these is the production of interference colors, which gives minerals their spectacular colors under crossed polarized light in the microscope. By using special lenses and filters, it is possible to produce interference figures, which allow you to determine which crystal system a mineral belongs to and to give parameters that can be used in mineral identification. By the end of this chapter, you should be able to place a thin section of rock on the microscope stage and identify any of the common rock-forming minerals from their optical properties. Once minerals have been identified, their abundance can be determined under the microscope, and we will have taken the first step toward classifying rocks.
Photomicrograph of orthorhombic pyroxene (gray) and monoclinic pyroxene, augite (brightly colored), in a rock from the world’s largest igneous intrusion near Lake St. John, Quebec (width of field is 3 mm). The origin of the lamellar structure in the pyroxene is discussed in Section 7.12.
136
Minerals and rocks observed under the polarizing optical microscope
6.1 Light and the polarizing microscope In Chapter 3, we saw that the human eye is sensitive to that part of the electromagnetic spectrum known as the visible range. We also saw that the energy transmitted by electromagnetic radiation can be related to its wavelength through a simple equation (Eq. 3.1) involving the Planck constant and the speed of light. The speed of light – 186 000 miles per second – is perhaps one of the most familiar physical constants. This is actually the velocity of any electromagnetic radiation in a complete vacuum, and its precise value, in SI units, is 2.9979 × 10⁸ m/s, or ∼300 000 km/s. When light travels through material, it is slowed down, which results in the path of the light bending or refracting. This has two very important consequences: 1. It allows us to construct lenses that can be used to make
optical instruments such as telescopes, microscopes, or common reading glasses. 2. When light passes through a mineral, the amount the light is slowed varies from one substance to another. This retardation provides a useful property known as the refractive index, which helps us distinguish and identify minerals. The history of lenses is long, as Box 6.1 shows. It was in 1850 that Henry Sorby took a significant leap forward when he prepared slices of rock that were so thin that they could be examined under the microscope by light that passed through them. He used a polarized light source, which is light constrained to vibrate in only one plane, similar to the light you observe through a pair of polarizing sunglasses. Sorby then observed the magnified image through another polarizer oriented at 90° to the first one. The interaction of the polarized light with the crystal structure of minerals produced many optical effects that led to major advances in identifying minerals and to the modern polarizing petrographic microscope, such as that shown in Figure 6.1. With this microscope, it is possible to identify many different optical properties of minerals. We are interested in
BOX 6.1
those that allow us to identify minerals. These we refer to as diagnostic properties because they allow us to identify or at least narrow the possible choices when trying to identify an unknown mineral. A modern polarizing petrographic microscope is an expensive precision instrument that has many attachments to help deduce the optical properties of minerals and the textures of rocks. Despite this, it still does essentially the same thing as Henry Sorby’s microscope: provide an image of a thin section under crossed polarized light. Figure 6.1 shows a typical petrographic microscope, in this example, a Carl Zeiss research model with the components that are most commonly used and found on all petrographic microscopes labeled. We briefly run through these components, starting with the light source at the base and ending with the eyepiece at the top. The function and use of these components will become apparent when we discuss the optical properties of minerals and their effects on polarized light. The components of the petrographic microscope
The light source, which is commonly located in the base of the microscope, can have its brightness varied through use of a rheostat or a diaphragm. The light rises into the substage assembly, which consists of the lower polarizer, lower condensing lens, aperture diaphragm, and the upper swing-in condensing lens. The plane of polarization is normally east-west (right-left; we refer to this as E-W) but can be rotated to other orientations. The height of the whole substage assembly can be adjusted by means of a knob. Next comes the stage on which the thin section is placed. In petrographic microscopes, the stage can be rotated through 360°, with each degree being marked around the circumference of the stage. Most stages have a locking screw on the side that prevents rotation; be sure this is loose before trying to rotate the stage. The stage may have screw holes for attaching accessories, such as the mechanical stage shown in Figure 6.1, which allows a thin section to be moved incrementally in two mutually perpendicular directions.
HISTORY OF LENSES
Lenses have been known since the time of the Greeks. The Roman historian Pliny the Elder, who died escaping from the eruption of Pompeii in 79 CE, discussed lenses in his Naturalis Historia (Natural History). These early lenses, however, were of poor quality and were probably more often used as a burning glass to light fires than as a magnifying lens. Magnifying lenses were little used until 1300, when the first eyeglasses became available. By the beginning of the seventeenth century, Dutch lens makers had greatly improved the art of shaping, grinding, and polishing lenses, and they put together the first simple telescopes and microscopes. In 1609, Galileo built a telescope with which he observed moons orbiting the planet Jupiter, providing incontrovertible evidence that not all heavenly bodies orbit the Earth. The first microscopes gave magnifications of only several times, but by the middle of the seventeenth century, microscopes with magnifications of several hundred times resulted in remarkable biological discoveries. When the microscope was first used to study minerals and rocks, it served only as a simple magnifying device.
6.2 Passage of light through a crystal: refractive index and angle of refraction Eyepiece y p Eyepiece
Knurled ffocusing ring Alignment pin
Upper polarizer or analyzer
Bertrand lens B
Acccessory platte Objectives with centering rings
Mechanical X-Y stage Aperture diaphragm Lower condensing lens Lower polarizer
Knu urled turret for sele ecting objective lens
Ro otatable staage Up pper swing-in con ndensing lens Fin ne and coarse foccusing knobs Ad djusting knob for raising and lowering sub bstage assembly Lig ght source and diaphragm
Figure 6.1 Polarizing petrographic microscope. The example shown is a Carl Zeiss research model, but most petrographic microscopes have the features that have been labeled.
Above the stage are the objective lenses, which are commonly mounted on a turret that can be rotated so as to select the desired magnification. On some microscopes, only one lens can be mounted at a time, and this has to be removed and replaced with another lens to change magnification. Such lenses are held in place by a quick release clutch mechanism. Most microscopes have at least low (2×), intermediate (10×), and high magnification (40×) objectives, but some may have more, such as an oil immersion lens (100×) for extremely high magnifications. All objective lenses on petrographic microscopes are made so that they can be centered on the axis of rotation of the stage. Centering is done either by rotating the knurled rings on the lenses, as shown in Figure 6.1, or by adjusting centering screws where the lens attaches to the rotating turret. To center a lens, first observe a point under the cross-hairs in a thin section under the microscope as the stage is rotated. If the lens is centered, the point under the cross-hair at the center of the field will remain stationary under the cross-hair. When off-centered, it will sweep out a circle. By adjusting the knurled centering rings or screws on the lens, you can move the apparent position of the crosshair to where you perceive the center of rotation to be. This may require several attempts before the lens is centered. Under no circumstances should the objective-lens turret be rotated by
grabbing the lenses; this will almost certainly off-center the lenses. Always rotate the turret by means of the knurled wheel. The upper polarizer, or analyzer, as it is commonly called, is mounted above the objective lenses, with the plane of polarization being oriented N-S, at right angles to that in the lower polarizer. In some microscopes, such as the one shown in Figure 6.1, the plane of polarization in the analyzer can be rotated. Before the light passes through the analyzer, a small slot on the side of the microscope provides a place for insertion of accessory plates into the optical path. As we will see here, these accessory plates allow us to make important optical measurements. Next a knurled knob on the side of the microscope allows a small lens known as a Bertrand lens to be swung in and out of the optical path to observe interference figures (more about them in Sec. 6.10). The microscope image is viewed through the eyepiece, or ocular, which typically has a magnification of 8×, 10×, or 12×. The total magnification of the microscope is obtained by multiplying the eyepiece magnification times the objective lens magnification. The eyepiece also houses the cross-hairs, which are used as a reference for all centering and angular measurements made in the microscope. Each individual must focus the cross-hairs to suit his or her eyes. If this is not done correctly, considerable eyestrain can result. When your eyes examine an image in the microscope, they should be focused at infinity; the image of the cross-hairs, which will be superimposed on this image, should also be focused at infinity. The easiest way to ensure that this is the case is to carefully slide the eyepiece out of the microscope, and then, while observing a distant object, move the eyepiece in front of your eye to see whether the crosshairs are in focus. If they are not, adjust slightly the knurled ring on the eyepiece and check the focus again; make sure you are still looking at a distant object when you do this. When satisfied that the cross-hairs remain in focus when your eye is looking at a distant object, return the eyepiece to the barrel of the microscope making sure that the alignment pin slots into its grove; this aligns the cross-hairs in E-W, N-S directions. This completes a brief introduction to the various parts of the petrographic microscope. Remember, it is an expensive precision optical instrument and must be treated with care; do not force anything. Before we make use of this instrument, we must understand the behavior of light as it passes from one material to another and, in particular, the effects that crystalline material has on the passage of polarized light.
6.2 Passage of light through a crystal: refractive index and angle of refraction Light travels through a vacuum at the incredible speed of 300 000 km per second, fast enough to circle the Earth more than seven times in one second. When not in a vacuum, light travels slower, with the velocity depending on the material
137
138
Minerals and rocks observed under the polarizing optical microscope
Refractive index (R.I.) =
y ra ht Lig
through which it travels. For example, light is slowed more by traveling through quartz than it is through air. This slowing down provides a useful property that helps identify minerals. It is a difficult task, however, to measure the absolute speed of light, whether in a vacuum or in a mineral. Consequently, rather than measuring the absolute velocity of light in a mineral, we measure its velocity relative to that in air. This ratio is known as the refractive index and is defined as follows:
Medium 1 Angle of incidence
i
velocity of light in i air velocity of light in mineral (6.1)
For example, the R.I. of diamond is 2.4, which indicates that light travels 2.4 times slower in diamond than in air. The R.I. of quartz, on the other hand, is only 1.5, which indicates that light is slowed much less in passing through quartz than through diamond. The high R.I. of diamond gives the gem its sparkle. Equation 6.1 implies that we still need to measure the velocity of light in a mineral if we are to use the R.I. as a means of characterizing minerals. However, light has the peculiar property that it can be treated as traveling either as discrete bundles, or quanta, of energy or as waves (Eq. 3.1). For our purposes, light is most conveniently treated as traveling in waves. One of the immediate consequences of the wave propagation of light is that a light ray passing from one medium to another of different refractive index must bend (refract), and the amount it bends depends on the change of refractive index. The R.I. of a mineral can, therefore, be determined by measuring the angle of refraction rather than absolute velocities. Figure 6.2 shows light (the blue and white bands indicate wave fronts of light) meeting a boundary between two materials at an oblique angle, where the R.I. of medium 1 is less than that of medium 2; that is, the light travels faster in medium 1 than in medium 2. The path of the light ray is shown by red arrows, whereas the crests and troughs of the light waves are shown in shades of blue. The angle at which the ray impinges on the boundary is known as the angle of incidence (i) and is measured from a line perpendicular to the boundary. On crossing the boundary into the medium of higher refractive index, the light is slowed. At the same time, however, the waves must remain connected across this boundary, and as can be seen in Figure 6.2, this is possible only if the light ray bends toward the perpendicular to the boundary, to create what is known as the angle of refraction (r). The angles of incidence and refraction are related to the R.I. of medium 1 and 2 by the simple relation known as Snell’s law: sin i R.I. 2 = sin r R.I. 1
(6.2)
where sin is the trigonometric function, sine, of the angle of incidence or refraction. These angles, which can be measured with an instrument known as a refractometer, provide accurate
Angle of refraction r
RImedium 1 < RImedium 2
Medium 2
Figure 6.2 Refraction of light. Light waves (blue to white bands indicate wave fronts) are at right angles to the direction in which the light ray (red) travels. When light crosses the boundary between two materials of different refractive index (i.e., different light velocity), the light ray bends so that waves remain together along the boundary.
determinations of refractive index. Even though you may not get to use a refractometer, it is important to remember from Snell’s law that if light passes into a substance of higher refractive index, the light will be bent toward the perpendicular to the boundary between the two materials (Fig. 6.2), and if it passes into a substance of lower refractive index, it will be bent away from the perpendicular. You will have many opportunities to apply these general principles in determining relative refractive indexes of grains in thin sections under the microscope. The example of apatite
Let us consider what happens when light passes through a small grain of apatite that is included in a larger grain of quartz or feldspar, a common occurrence in many igneous rocks. Apatite has a relatively high R.I., around 1.65, whereas quartz and feldspar have a relatively low R.I., near 1.55. Consequently, when light passes into the apatite grain, it is bent toward the perpendicular to the interface between the minerals, but when it leaves the apatite grain and returns to the lower R.I. host mineral, it is bent away from the perpendicular (Fig. 6.3). The result is that light entering the apatite from below tends to focus or concentrate above the grain of higher R.I. Thus, while observing such a grain under the microscope, if the microscope stage is lowered slightly so that the plane of focus is slightly above the mineral, a slightly brighter light will appear just inside the boundary of the grain. This brighter line of light, which is known as the Becke line, can
6.3 Passage of polarized light through minerals
Becke lines Zones of brighter illumination due to focusing by high R.I. grains Focus at this level
Apatite
Apatite
Focus at this level
Feldspar or quartz host R.I. of apatite > R.I. of quartz or feldspar
Figure 6.3 When a mineral of relatively high refractive index, such as apatite, is enclosed in one of lower refractive index, such as quartz or alkali feldspar, refraction of the light tends to concentrate the light above the higher refractive index grain. The lower of the two photomicrographs shows a grain of apatite enclosed in quartz and feldspar. In the upper photomicrograph, the plane of focus is just above the apatite grain, so it appears slightly blurred, but the central part of the grain is bright because of light refracted away from the grain boundaries, which appear dark.
be made to move back and forth by slightly lowering and raising the microscope stage, the line moving into the grain of higher R.I. when the working distance is increased. The Becke line can be made more pronounced by closing down the aperture diaphragm or lowering the substage assembly (Fig. 6.1) The Becke line test provides a simple way of determining relative refractive indexes of adjoining mineral grains, which is one of the most useful optical properties in identifying minerals. Around the edge of thin sections, places can always be found where the R.I. of minerals can be compared with the R.I. of the mounting medium, which is commonly Canada balsam or an epoxy with a similar R.I. of 1.537. Minerals with higher R.I. than 1.537 are said to have positive relief, whereas those with lower R.I. have negative relief. Minerals such as quartz and feldspar have almost the same refractive index as that of common mounting materials, and so light is not bent in crossing the boundary between the two. This results in the grains having a clean smooth appearance under the microscope, because, although the surface of the ground rock may be quite rough, the glue with matching refractive index smoothes out these irregularities. In contrast, minerals with a much higher or lower refractive index than that of the mounting glue appear stippled. This effect is made more noticeable when the aperture diaphragm is closed down or the substage assembly is lowered.
6.3 Passage of polarized light through minerals The light we are familiar with coming from the open sky is free to vibrate in any direction. However, light that is reflected off the surface of water, for example, tends to vibrate in a
horizontal plane. Figure 6.4(A) shows a view of a pond in which blue sky and white clouds are reflected from the surface of the water. Figure 6.4(B) shows this same pond as viewed through a pair of Polaroid sunglasses. The sunglasses have lenses that allow light to pass vibrating only in a vertical direction. Because the light reflected off the surface of the water is vibrating in a horizontal plane, it is completely eliminated by the sunglasses. One of the features that makes the petrographic microscope different from other microscopes is that it uses a polarized light source; that is, all light that passes up through the microscope is constrained to vibrate in only one plane, which is normally oriented E-W. If you were to turn the light source on in a petrographic microscope and peer into the ocular, you would see a bright light. What your eye would not know is that this light is all vibrating in an E-W plane. If you were to look into the microscope through a pair of Polaroid sunglasses, the field would appear totally black. The N-S plane of polarization of the glasses would eliminate the E-W polarized light rising through the microscope, just as it did with the light reflected off the surface of the pool in Figure 6.4(B). The upper polarizer does exactly the same thing as a pair of Polaroid sunglasses, so that when it is inserted into the optical path, it cuts out all of the light rising from the lower polarizer and the field appears dark. The refractive index of a mineral was defined in Eq. (6.1) as the velocity of light in air divided by the velocity of light in the mineral. When we measure a refractive index, we find that for most minerals the value obtained depends on the direction in which the light passes through the mineral. It is only minerals belonging to the isometric system and amorphous material such as glass that have only one refractive index independent of the path of the light, and these minerals are said to be isotropic.
139
140
Minerals and rocks observed under the polarizing optical microscope
(A)
(B)
Plane of polarization of light reflected from surface of water
Plane of polarization in sunglasses
Figure 6.4 Light reflected off the surface of water tends to be polarized in a horizontal plane. As a result, the reflections of blue sky and white clouds from the surface of the pond in (A) are completely eliminated when viewed through a pair of Polaroid sunglasses (B) that only allow passage of light that is polarized in a vertical plane (photographs by Doreen Philpotts).
Minerals belonging to all other crystal systems have a refractive index that varies with crystallographic direction and are known as anisotropic or birefringent. The difference between the maximum and minimum refractive indexes is known as the birefringence. For example, the mineral calcite slows the passage of light considerably when it travels perpendicular to the c crystallographic axis, with the result that the R.I. in this direction is 1.66. In contrast, light traveling parallel to the c axis is slowed only slightly, and the R.I. in this direction is 1.49. The birefringence of calcite is, therefore, 0.17 (1.66 – 1.49). Birefringence is responsible for the spectacular colors exhibited by most minerals under crossed polarized light in the microscope, known as interference colors, which we learn more of in this chapter. Relief and birefringence are two of the most readily visible optical properties of minerals under the microscope. Figure 6.5(B)–(C) contains photomicrographs of one of the world’s most common types of igneous rock – basalt. The particular sample illustrated is from the Giant’s Causeway in County Antrim, Northern Ireland, a UNESCO World Heritage site famous for the spectacular development of columnar joints formed as the lava cooled and shrank (Fig. 6.5(A)). Under plane polarized light (Fig. 6.5(B)), the difference in relief between the plagioclase and pyroxene in this rock is evident. The refractive index of plagioclase (1.56) is almost the same as that of the mounting medium (1.537); its relief is, therefore, low and
the plagioclase appears clear. In contrast, the refractive index of the pyroxene (1.7) is much higher than that of the mounting medium, with the result that light is refracted by irregularities on the surface of grains to create a stippled appearance, and light near grain boundaries is refracted into the grains making their interiors brighter and their margins darker (Becke line). Under crossed polarized light (Fig. 6.5(C)), the birefringence of the grains is evident. Plagioclase has low birefringence (0.012) and hence has gray and white interference colors, whereas pyroxene has high birefringence (0.025) and produces yellow, red, and blue interference colors. To determine how the R.I. of a mineral varies with crystallographic direction, we need to know in which crystallographic plane the light is vibrating, and so we must use polarized light. The polarized light source in a petrographic microscope gives us a reference plane from which to make measurements. Light rising from the substage illuminator is constrained to vibrate in an E-W plane by the lower polarizer (Fig. 6.6(A)). We can think of this polarized light as a sinusoidal wave rising through the microscope. When we insert the upper polarizer, which allows light to pass vibrating only in a N-S plane, it completely cuts out all of the polarized light rising through the microscope. If, however, we were to rotate the plane of polarization in the upper polarizer to a NE-SW direction (Fig. 6.6(B)), as can be done with some microscopes, the E-W vibrating light coming from
6.3 Passage of polarized light through minerals
0.1 mm
(B)
(A)
(C)
Figure 6.5 (A) Giant’s Causeway basalt, County Antrim, Northern Ireland, showing columnar joints formed during cooling of the lava. Photomicrographs of a thin section of this basalt are shown under (B) plane-polarized light and (C) crossed-polarized light. Width of field, 1 mm.
the lower polarizer casts a component of vibration on the NESW plane of the upper polarizer, which would then allow light to pass but with a diminished amplitude (the distance from the crest to the trough of the wave would be less). Looking at anisotropic minerals
What happens when we insert a thin section of an anisotropic mineral into the microscope? First, when plane polarized light enters an anisotropic mineral, it is forced to vibrate in two mutually perpendicular planes, the light in one of these planes
(B)
(A)
(C)
Diminished amplitude N Upper polarizer
traveling faster than that in the other plane. In Figure 6.6(C), the two planes have been labeled fast and slow. The E-W polarized light rising from the lower polarizer sets light oscillating in the fast and slow vibration planes of the crystal. A crest of a wave arriving at the undersurface of the mineral would immediately create a crest in both the fast and slow vibration planes in the crystal. The amplitude of these waves would be less than that of the E-W polarized wave because only a component of that wave oscillates in the fast and slow vibration planes. The
Yellow interference color
NE
SW
S
S
slow
Amplitude of wave
Lower W polarizer
E
Illuminator
E
W
Illuminator
N
Thin section of birefringent mineral
fast E
W
Illuminator
Figure 6.6 Passage of polarized light through the petrographic microscope. (A) The E-W polarized light rising from the lower polarizer is eliminated by the N-S plane of polarization of the upper polarizer. (B) When the upper polarizer is rotated to a NE-SW direction, a component of the E-W oscillation (black construction line) passes through the upper polarizer. (C) When a thin section of an anisotropic mineral is placed on the stage of the microscope, the E-W vibration from the lower polarizer produces vibrations in two mutually perpendicular planes in the mineral that travel with different velocities. When these two components are recombined by the upper polarizer, they are slightly out of phase, which creates an interference color (yellow wave).
141
Minerals and rocks observed under the polarizing optical microscope
amplitude is given by dropping a perpendicular (black construction line in Fig. 6.6(C)) from the E-W sinusoidal wave (blue line) onto the fast and slow vibration planes. Light rising through the crystal sets up sinusoidal waves oscillating in the fast (light blue wave) and slow (dark blue wave) vibration planes. When these waves arrive at the upper polarizer, which will allow light to pass only vibrating in a N-S plane, the fast and slow vibration directions both set up components of oscillation in the N-S plane of the polarizer. However, the waves in the fast vibration plane have traveled faster than those in the slow vibration plane. Thus, a crest of a wave reaching the upper polarizer via the fast vibration plane through the crystal arrives slightly ahead of the same crest that has traveled through the slow vibration plane. Consequently, when the upper polarizer combines these two waves into a single N-S vibrating wave, the fast and slow vibrating waves are slightly out of phase, and their addition causes interference and the generation of an interference color. In Figure 6.6(C), this interference color is shown by the yellow sinusoidal wave rising from the upper polarizer. When the upper polarizer recombines the fast and slow light waves rising from the mineral, the waves are out of phase by an amount known as the retardation. The retardation is a function of the difference in the velocity of light vibrating in the two planes in the crystal and the thickness of the mineral. Most thin sections are ground to a thickness of 30 µm, so the retardation is usually a function only of the velocity difference between the two planes. If a mineral grain does not go all the way through a thin section, its retardation is less because of its reduced thickness. These interference colors are similar to those formed by
light reflecting off thin films of material, such as a thin film of oil spilled on a wet road (see Fig. 17.7(A)). Light that is reflected from the top and bottom surfaces of a thin film is slightly out of phase because the light that has passed through the thin film has been retarded by the refractive index of the film and by its thickness. The interference colors seen on a patch of oil are reflections of the thickness of the oil (see Fig. 17.7(A)). Interference colors are a function of the degree of retardation. A retardation of 100 nm, for example, creates a gray interference color. As the retardation increases, the color changes to yellow at 300 nm and then to red at 550 nm (Fig. 6.7(C)). This red is known as first-order red, and all the colors resulting from retardations between 0 nm and 550 nm are known as first-order interference colors. As the retardation increases above 550 nm, the interference color changes to second-order blue. The second-order colors increase through green and yellow and eventually reach second-order red, with a retardation of 1100 nm. The same sequence of colors repeats for higher orders of interference, with each red being a multiple of 550 nm. Successively higher order colors, however, are less intense, with third-order red appearing a pale pink compared with firstorder red (Fig. 6.7(C)). The interference color created by an anisotropic mineral is one of its most important optical properties when it comes to mineral identification. Figure 6.10, at the back of the book (see pp. 534–535), shows the interference colors that characterize the common rock-forming minerals in 30 µm-thick thin sections. You will make constant use of Figure 6.10 when identifying minerals.
(B)
(A)
(C) 1st order red
slo w st
fa
3rd order red
First-order red Quartz accessory plate
slo w
142
st
1
ed rr de or st fa
Quartz wedge
Figure 6.7 Accessory plates for determining the orientation of the fast and slow vibration directions in anisotropic minerals. (A) First-order-red interference filter. The color shown is first-order red under crossed polars. (B) Plagioclase laths in the Giant’s Causeway basalt (Fig. 6.5(C)) showing addition (blue) and subtraction (yellow) of interference colors. (C) Interference colors in a quartz wedge. The orientation of fast and slow vibration directions are the same as in the first-order-red plate.
6.4 Accessory plates and determination of fast and slow vibration directions
6.4 Accessory plates and determination of fast and slow vibration directions In Figure 6.6(C), it can be seen that if the mineral grain on the microscope stage were to be rotated, one of the vibration directions in the crystal could parallel the E-W plane of polarization of light rising from the lower polarizer. When this happens, the E-W polarized light vibrates directly in the crystal plane that it parallels, but when this light arrives at the upper polarizer, it is completely eliminated and the mineral appears dark in the microscope. It is said to be in extinction. When the stage is rotated through 360°, birefringent crystals go into extinction four times as the fast and slow vibration planes in the crystal coincide with the polarization planes of the lower and upper polarizers. The angular relation between these extinction positions and prominent crystallographic features, such as cleavage, twinning, or even crystal outline, is a measurable optical property that can be used to identify minerals. Before we can measure such angles, it is necessary to be able to distinguish the fast from the slow vibration direction, and this is done by using an accessory plate inserted into the optical path of the microscope between the thin section and the upper polarizer (Fig. 6.1). The most commonly used accessory plate is a first-order-red interference filter (Fig. 6.7(A)). This is a piece of quartz or gypsum that has been ground to a thickness that creates precisely a retardation of 550 nm; that is, first-order red. In addition, the thin slice of quartz is oriented so that its fast vibration ray parallels the length of the accessory plate and the slow vibration direction, which is commonly designated by the Greek letter gamma (γ), is across the length of the plate. The accessory plate slot on the microscope allows the accessory plate to be inserted at a 45° angle to the E-W plane of polarization of the lower polarizer. Light rising from the lower polarizer sets up vibrations in the fast and slow vibration directions in the quartz accessory plate, which, when recombined into the N-S plane of the upper polarizer, are out of phase by 550 nm and first-order-red results. If no thin section is present in the microscope, the first-orderred filter simply creates a field of red. When we place a thin section on the stage of the microscope, the interference colors of the various minerals are combined with the red interference color generated by the accessory plate, and several possible conditions can result. For example: • If the mineral grain is in extinction, it contributes nothing
to the interference color of the filter, and consequently such grains have a first-order-red interference color. • If the fast and slow vibration directions in the crystal coincide with the fast and slow vibration directions in the accessory plate, the retardation is increased and the interference color increases from first-order red to commonly second-order blue. • If, however, the fast and slow vibration directions in the crystal are opposed to those in the accessory plate, the
amount of retardation is decreased, and the interference color changes from first-order red to first-order yellow. Figure 6.7(B) shows the thin section of Giant’s Causeway basalt (Fig. 6.5(C)) with a first-order-red interference filter inserted in from the SE side of the field of view. The fast vibration direction in the accessory plate is, therefore, oriented NW-SE, and the slow vibration direction is at right angles to this. Note that all plagioclase laths that are oriented NW-SE (or nearly so) are colored blue; that is, the fast vibration direction in these crystals is oriented parallel, or nearly so, to the length of the crystals, and because this coincides with the fast vibration direction in the accessory plate, the retardation is increased from first-order red to second-order blue. In contrast, when the long axis of the plagioclase laths is at right angles to the long axis of the accessory plate (i.e., NE-SW), the retardation decreases and the laths are first-order yellow. For minerals that have high birefringence, the first-order-red interference filter may not add or subtract from the retardation a sufficient amount to make the effects readily detectable. For these minerals, a quartz wedge can be used (Fig. 6.7(C)). The wedge is similar to the first-order-red filter, but instead of being ground to one thickness that creates a first-order-red interference color, the wedge gives ever increasing degrees of retardation and the interference colors steadily increase, reaching third-order red in the wedge illustrated here. The fast and slow vibration directions in the wedge are oriented the same way as in the first-order-red accessory plate. By inserting the wedge in from the lower right, the fast or slow vibration directions in the crystals can be identified by whether the interference colors of the grains increase (fast and slow directions in crystals and accessory plate coincide) or decrease (fast and slow directions in crystals and accessory plate are opposed). The quartz wedge can also be used to determine the order of the interference color of a mineral, which is one of its most important diagnostic properties. If the fast and slow vibration directions in the crystal are opposed to those in the wedge, insertion of the wedge causes the interference colors to decrease and when sufficient wedge is inserted to counteract the retardation in the mineral, the mineral will appear black. By counting the orders of colors that change as the wedge is inserted, the interference color of the mineral can be determined. The order of the interference color of a mineral can also commonly be determined without the use of a wedge. Many grains in a thin section taper to a thin edge where they overlap with an adjoining mineral. By finding such thin edges, we can count the number of color fringes (orders) that we go through as the grain thickens to its normal thickness of 30 µm. In summary, an accessory plate is a useful tool to determine the orientation of the fast and slow vibration directions in a mineral and the order of the interference color. Knowledge of the orientation of the two vibration directions is essential to measuring a mineral’s extinction angle, which we consider next.
143
144
Minerals and rocks observed under the polarizing optical microscope
6.5 Extinction positions and the sign of elongation Many crystals in thin sections are elongate, and it is often useful when identifying minerals to know how the extinction direction and fast or slow vibration directions are related to this long axis. Measurements can also be made against other prominent crystallographic directions, such as cleavage planes or twin planes. The following are the steps taken in measuring the orientation of an extinction direction: 1. First, orient the long axis of the crystal or other prominent
2.
3.
4.
5.
6.
7.
crystallographic direction parallel to the N-S cross-hair in the microscope. Then, with the polarizers crossed, rotate the stage back and forth until the crystal goes into extinction. If the crystal goes into extinction when the long axis of the crystal precisely parallels the N-S direction, the crystal is said to have parallel extinction. This commonly is the case for crystals belonging to the tetragonal or hexagonal systems. Other crystals may go into extinction when the long axis is not N-S. These crystals are said to show inclined extinction, and the angle between the extinction position and the long axis of the crystal (or other reference line) is known as the extinction angle. To measure the extinction angle, rotate the crystal to the extinction position and record the angular measure on the microscope stage. Next, rotate the crystal until the long axis (or other reference line) is parallel to the N-S cross-hair, and record the angle on the microscope stage. The difference between these two angles is the extinction angle. Depending on how the crystal is oriented in the thin section, the measured value may fall well short of the true extinction angle. If you were able to rotate the crystal about its long axis on the stage of the microscope, you would find that your extinction measurements would pass through a maximum and this would be the true extinction angle. Because we cannot rotate the crystal about its long axis, this maximum value is determined by measuring numerous grains and choosing the maximum value. To determine whether the extinction angle we have measured is from the fast or slow vibration direction, we need to determine which of the two vibration directions is parallel the N-S cross-hair. Return the crystal to the extinction position that we have just measured, and visualize light vibrating in a N-S plane. Place your index finger on the stage of the microscope pointing in this N-S direction, and rotate the stage of the microscope counter clockwise 45°. Now the vibration direction that previously paralleled the N-S polarizer is oriented in a NW-SE direction and parallel to the fast vibration direction of the accessory plate.
8. Insert the accessory plate and observe how the interference
colors of the mineral in question behave. If the interference colors increase, then our finger is pointing in the direction of the fast vibration ray; if the colors decrease, our finger points along the slow vibrating ray. Some minerals have the fast vibration direction parallel, or nearly parallel, to the long axis of the crystal and are described as length fast (also known as negative elongation), whereas others have the slow vibration direction parallel to the long axis and are described as length slow (also known as positive elongation). The plagioclase laths shown in Figure 6.7(B), for example, are length fast, whereas mica flakes are always length slow.
6.6 Anomalous interference colors, pleochroism, and absorption A small group of minerals exhibits what are known as anomalous interference colors. These minerals have very low birefringence and would be expected to give gray interference colors, but in most of these minerals, the red end of the white light spectrum can be in extinction while the blue end of the spectrum is not. In this case, the mineral exhibits an anomalous blue interference color known as Berlin blue (Fig. 6.8). In some minerals, the blue end of the spectrum can be in extinction while the red end is not. This produces an anomalous brick red to brown interference color. Only a small group of minerals exhibits these anomalous colors including melilite (Fig. 6.8), the iron-poor epidote clinozoisite, and some chlorite, so this is a useful means of deducing the presence of these minerals.
Figure 6.8 Anomalous blue interference color exhibited by zoned crystals of melilite under crossed polars. Width of field is 2.5 mm.
6.7 Mineral identification chart
Two other optical properties are readily apparent under plane polarized light in the microscope and these are color and absorption. These are important because they are two of the first properties you see when you look in the microscope, and for many minerals, the color and absorption allow you to narrow your search when identifying unknown minerals. For this reason, color and absorption are included in Figure 6.10 for the common rock-forming minerals. The causes of color in minerals discussed in Chapter 3 (Sec. 3.3) apply equally to the color of minerals observed in transmitted light under the microscope. The white light generated by the substage illuminator of the microscope may or may not be affected by passage through a mineral. If the mineral has no effect on the light, the mineral will appear colorless (white). In contrast, if the mineral preferentially absorbs certain wavelengths of light, the remaining wavelengths will give the mineral its color. In Section 3.3, the transition elements were shown to be the most important chemical components causing color in minerals. As a result, minerals in which iron is an essential component generally are colored under the microscope. When polarized light is used, the color of a mineral can change depending on the orientation of the crystal with
respect to the plane of polarization of the light. The resulting variability in color is referred to as pleochroism. The various colors result from absorption of different wavelengths of light in different directions in the crystals. Commonly the pleochroism of a mineral is a diagnostic property. One such case is the manganese epidote known as piemontite, which is pleochroic from canary yellow in one direction through amethyst to red in the other (Fig. 6.8(A)–(B)). In addition to pleochroism, minerals can show variable absorption of polarized light in different crystallographic directions. For example, the ironbearing mica biotite shows the maximum absorption when the cleavage is parallel to the lower polarizer and least absorption when it is at right angles (Fig. 6.9(C)–(D)). In contrast, elongate crystals of tourmaline show their maximum absorption when their length is perpendicular to the lower polarizer (Figs. 6.9 (E)–(F)).
6.7 Mineral identification chart The optical properties we have discussed so far allow us to create a diagnostic scheme for identifying unknown minerals, which is shown in Figure 6.10 (see pp. 534–535). This
(A)
(C)
(E)
(B)
(D)
(F)
Figure 6.9 Anisotropic minerals may exhibit pleochroism and variable absorption. The manganese epidote piemontite appears yellow in one orientation (A) and amethyst color at right angles to this (B). The iron-bearing mica, biotite, always absorbs light more strongly when the cleavage direction parallels the polarizer (C) than when it is at right angles to the polarizer (D). Tourmaline always absorbs more light when the long axis of the crystal is perpendicular to the polarizer (E) than it does when parallel to the polarizer (F). The polarizer in each of these figures is oriented E-W.
145
146
Minerals and rocks observed under the polarizing optical microscope
includes almost all of the minerals discussed in this text arranged with increasing refractive index from left to right and increasing birefringence from top to bottom. The only minerals not included in this chart are carbonates and titanite, which have much higher birefringence than the range covered by this chart. But their high birefringence serves to identify them, and titanite is always a dark brown compared with relatively colorless carbonates. The interference colors shown in the central strip of this chart are those that would result for the indicated birefringence in a 30 µm-thick thin section, which is the standard thickness. Figure 6.10 is divided in half by this central strip of interference colors, with colored minerals listed to the left and colorless minerals to the right. Most of the colored minerals are silicates that contain iron and magnesium (ferromagnesian minerals). As the iron content increases, the refractive index also increases. The R.I. of these minerals is, therefore, represented by a bar covering the range of R.I. The general relief of the minerals with respect to a mounting medium with R.I. of 1.537 is shown by the stippled box along the top of the figure. The box indicating the R.I. range is colored to show the mineral’s typical color, and if the mineral is pleochroic, these colors are shown as well. The birefringence shown for the mineral is the maximum birefringence it can exhibit. Remember that the birefringence exhibited by a mineral depends on the orientation of a crystal and can be less than the maximum, so it is important to examine numerous grains before deciding on the birefringence of the mineral. The colorless minerals are arranged in a similar manner to the right of the birefringent strip. In general, colorless minerals contain no iron and their R.I. is less than that of the colored minerals, although there are a few exceptions, such as corundum (Al2O3) with a R.I. of 1.77. An unknown mineral can normally be narrowed down to a couple of choices in this figure on the basis of color, relief, and birefringence. In the following sections, we learn of several other optical properties that are listed in the figure and which will almost certainly lead to an identification of an unknown mineral.
6.8 Uniaxial optical indicatrix In discussing the measurement of extinction angles, we saw that it was very unlikely that any one grain would be lying on the stage of the microscope in an optimal position to give the true extinction angle. We saw that it was, therefore, necessary to measure the extinction angle in numerous grains and to take the maximum value as being closest to the true value. You may have thought that it would be useful to have a device that could be attached to the stage of the microscope that would allow you to tilt the thin section and so get the grain into the optimum position to measure the extinction angle. Such universal stages do exist, but they are very expensive and are not readily available for routine petrographic work. The standard petrographic microscope does have two other features that partially solve our
problem of grain orientation – the upper swing-in condensing lens and the Bertrand lens. Before we can discuss how these two sets of lenses provide a certain degree of three-dimensionality to our measurements, we must introduce the concept of the optical indicatrix. Crystals belonging to the tetragonal and hexagonal systems have maximum and minimum refractive indexes, and crystals belonging to the orthorhombic, monoclinic, and triclinic systems have maximum, intermediate, and minimum refractive indexes. It is convenient to represent these variations in refractive index with direction by an ellipsoid, which is known as an optical indicatrix. The vector from the center of the ellipsoid to its surface gives the magnitude of the refractive index for light vibrating in that particular direction (Fig. 6.11). The indicatrix for tetragonal and hexagonal crystals is an ellipsoid of revolution, with the axis of revolution being the c crystallographic axis. Light that vibrates in a plane including this axis of rotation is referred to as the extraordinary ray and its refractive index is designated by the letter e. Light vibrating in a plane at right angles to this (the equatorial plane of the indicatrix) is referred to as the ordinary ray and its refractive index is designated by the letter o. The extraordinary ray can be the major refractive index, in which case the indicatrix is prolate (shaped like a tall football or cigar), or the extraordinary ray can be the minimum refractive index, in which case the indicatrix is oblate (short). The prolate indicatrix is described as positive, whereas the oblate indicatrix is said to be negative (Fig. 6.11). For example, the extraordinary ray in the mineral quartz has a refractive index of 1.55, whereas that of the ordinary ray is 1.54, so its indicatrix is prolate and the mineral is optically positive. In contrast, the extraordinary ray in calcite has a refractive index of 1.49, which is significantly less than that of the ordinary ray, which is 1.66; so the indicatrix of calcite is markedly oblate and the mineral is said to be optically negative. The example of zircon
Let us see how the indicatrix helps us understand the vibration of light passing through a thin section of a grain of zircon, which has tetragonal symmetry. Zircon is optically positive (e = 2.0, o = 1.94), so the indicatrix is prolate. We can visualize this indicatrix as embedded in the grain and sliced through by the plane of the thin section. The actual orientation of the indicatrix depends on the crystallographic orientation of the zircon grain. Let us first assume that the extraordinary vibration direction (c crystallographic axis) lies exactly on the stage of the microscope. Our positive prolate indicatrix would be lying flat on the stage of the microscope and sliced through by the plane of the thin section. Polarized light rising from the lower polarizer and passing into such a zircon grain would set up two rays vibrating in mutually perpendicular planes, one plane paralleling the extraordinary vibration direction and the other the ordinary vibration direction. The refractive indexes of these two rays would be given by the length of the lines from
6.8 Uniaxial optical indicatrix
Biaxial
Uniaxial OA
z
OA e
e
OA
o
o
x
2V
y
eo Positive Figure 6.11 The optical indicatrix is an ellipsoidal figure indicating how the refractive index in a crystal varies with the orientation of the plane in which light is vibrating. The uniaxial indicatrix is an ellipsoid of revolution that has one optic axis (red) perpendicular to the circular section through the ellipsoid. Light vibrating in a plane containing the axis of rotation is said to be the extraordinary ray (e), whereas that vibrating at right angles to it is the ordinary ray (o). The biaxial indicatrix is a triaxial ellipsoid (R.I. z > y > x) with two circular sections at right angles to which are two optic axes.
e′
Plan view
Oblique view
e′
Thin section
the center of the indicatrix to its surface in the extraordinary and ordinary vibration directions (i.e., e and o, respectively). As the stage of the microscope is rotated, the extraordinary and ordinary rays would move into parallelism with the polarizers and the grain would go into extinction; this would occur four times in a full rotation. Next consider a more generally oriented grain of zircon where the indicatrix has some oblique orientation. For example, let us say that the extraordinary axis of the indicatrix pierces the plane of the thin section by rising from the lower right to the upper left as seen in the microscope, as shown in Figure 6.12. In this orientation, the thin section would cut an elliptical section through the indicatrix (see plan view in Fig. 6.12). Again, polarized light rising through this grain would be forced to vibrate in two mutually perpendicular planes, one corresponding to the minimum refractive index and the other to the maximum refractive index. Recall that the refractive index in any given direction is simply the distance from the center of the indicatrix to its surface where cut by the plane of the thin section. With an ellipsoid of revolution, the minimum radius of any section cut through the center of the ellipsoid, regardless of its orientation, is equal to the equatorial radius of the ellipsoid; that is, the ordinary vibration refractive index o. The other vibration direction, though having a higher refractive index than the ordinary vibration direction, is not the full magnitude of the extraordinary refractive index but only a component of it. We, therefore, designate this refractive index as e′ (Fig. 6.12).
o
o
e Figure 6.12 Oblique section through a uniaxial positive indicatrix shows the two mutually perpendicular vibration directions that polarized light must vibrate in. One of these directions corresponds to the equatorial radius of the ellipsoid and is the refractive index of the ordinary ray (o), whereas the other direction has a greater refractive index but is less than that of the extraordinary ray (e) because e is not lying in the plane of the thin section. Its refractive index is designated e′.
147
148
Minerals and rocks observed under the polarizing optical microscope
Let us consider one other special orientation of the zircon grain. If the grain were oriented so that its c crystallographic axis were parallel to the axis of the microscope, the positive indicatrix would be standing on end, as shown in Figure 6.11, and the plane of the thin section would cut a circular section through the indicatrix. This circular section tells us that the refractive index for light vibrating in any direction would be the same and would be that of the ordinary ray. Polarized light rising through such an oriented grain would be free to vibrate in any two mutually perpendicular planes, and because the refractive indexes in these two planes would be the same, no interference would occur, and the grain would appear as if it were in extinction. This special direction for propagation of light through the indicatrix is designated the optic axis (red axis in Figs. 6.11 and 6.12). An ellipsoid of revolution has only one such direction (i.e., perpendicular to the equatorial plane) and, therefore, the indicatrix is described as uniaxial.
6.9 Biaxial optical indicatrix Minerals that belong to the monoclinic, orthorhombic, and triclinic crystal systems have three different refractive indexes. We represent their indicatrix with a triaxial ellipsoid (Fig. 6.11) with the major axis being the maximum refractive index (z), the intermediate axis being the intermediate refractive index (y), and the minimum axis being the minimum refractive index (x). In a triaxial ellipsoid, it is always possible to find two circular sections, which include the intermediate axis. Light traveling normal to either of these planes (shaded gray in Fig. 6.11) has the same refractive index no matter which plane it vibrates in. Consequently, no interference occurs and the grain remains in extinction as it is rotated. The direction normal to the circular section is defined as an optic axis. Because a triaxial ellipsoid has two such circular sections, it has two optic axes, and the indicatrix is said to be biaxial. The acute angle between the two axes is referred to as the optic angle and designated 2V, and the plane containing the two axes is the optic plane. If the slow vibration direction z (major refractive index) lies in the acute angle, the mineral is said to be biaxial positive. If the fast vibration direction x (minimum refractive index) lies in the acute angle, the mineral is said to be biaxial negative. A random section through a biaxial ellipsoid is not likely to have the maximum, minimum, or intermediate vibration directions lying on the stage of the microscope. Nonetheless, polarized light on entering a biaxial mineral must vibrate in two mutually perpendicular planes, one being a faster vibration direction (lower refractive index) and the other a slower vibration direction (higher refractive index). If we have no way of knowing the orientation of the indicatrix, the vibration directions can be designated simply as x′, y,′ or z′, with the prime indicating that these are only relative differences and do not
reflect the true values of x, y, or z. In the next section, we see that we can determine the orientation of the indicatrix through use of what are known as interference figures. The indicatrix is a representation of how the refractive index varies with direction in a crystal, which is determined by how light interacts with the atoms in a crystal. The indicatrix is, therefore, bound by the same symmetry elements that control all other aspects of the crystal. We have already seen that in tetragonal and hexagonal crystals symmetry requires that the axis of rotation of the uniaxial indicatrix must coincide with the c crystallographic axes. In crystals with mirror planes, as for example those with monoclinic and orthorhombic symmetry, the biaxial indicatrix must be symmetrically disposed about the mirror plane. The mineral olivine, for example, is orthorhombic (see Sec. 7.19) and, therefore, the principal axes of the indicatrix must correspond with the crystallographic axes (Fig. 6.13). In addition, the optic plane parallels (001), and the optic axes are equally disposed on either side of crystallographic a. Only in the triclinic system is the indicatrix free to have any orientation.
6.10 Uniaxial interference figures When discussing the measurement of extinction angles, we saw that it was unlikely that any given grain would be lying on the stage of the microscope in exactly the right orientation to give the
y=c 001
101 021
Optic axis
2V
x=b
=8
z=a 2–
0
120 01
13
4°
110
Optic axis
Figure 6.13 The orthorhombic symmetry of olivine requires that the principal axes of the biaxial indicatrix coincide with the crystallographic axes. Most olivine crystals are bounded by the (010), (021), and (110) faces. The x, y, and z axes of the indicatrix correspond to the b, c, and a crystallographic axes, respectively, and the optic axes lie in the mirror plane (001) with the axes equally disposed on either side of x and z.
6.10 Uniaxial interference figures
correct angle and that it would be desirable to rotate the crystal into the correct orientation. Although we cannot do this on a flat stage (we need a universal stage for that), we can look at light that passes through a crystal at an angle to the axis of the microscope by using some of the additional lenses on the microscope. This gives us the ability to examine optical properties in directions other than those parallel to the axis of the microscope and provides additional optical properties that are useful in identify unknown minerals. The light we have discussed so far rising through the microscope travels essentially parallel to the axis of the microscope. The lower condensing lens does bend the light slightly toward the axis of the microscope, but we can still think of most of the light as traveling essentially parallel to the axis. When we flip in the upper swing-in condensing lens, a strongly convergent beam of light is focused on the central part of the field of view. Light traveling near the center of the field is still essentially parallel to the microscope axis, but the light in the outer part of the field passes through the thin section at an oblique angle. For example, light in the southeast quadrant rises from the southeast, passes through the thin section and exits toward the northwest. Such a path of light experiences a different transit through a mineral grain than light traveling vertically along the axis of the microscope. If we could view what happens to this oblique light, we would gain knowledge of the optics of the grain in these other directions without having to physically tilt the grain, as might be done using a universal stage. The Bertrand lens allows us to examine, under crossed polars, what are known as interference figures that are produced by the convergent beam of light as it leaves the grain. The example of quartz
The simplest interference figure is obtained when we look down the optic axis of a uniaxial mineral. Let us consider the mineral
o
o
e′
e′
er rd st o d re t s fa
(B)
1
e′
st fa
(A)
o
o
slo w
o
ow
e′ e′
fa
o o
sl
o
e′
o
o
ow sl
e′
st
e′
quartz, which is uniaxial positive, and if its optic axis were parallel to the axis of the microscope, its indicatrix would be oriented as shown in Figure 6.11. A thin section cut through such an indicatrix would give a circular section; that is, the refractive index of light vibrating in any plane would be the same and would have the value of the ordinary ray, o. As the refractive index is the same in all directions, no interference results, and the grain remains in extinction even when the stage is rotated. In a thin section containing many grains of quartz, a grain with such an orientation is easy to find by looking for one that remains dark under crossed polars as the stage is rotated (Fig. 6.14(A)). Such a grain remains in extinction because the lower polarizer sets up light vibrating in an E-W plane in the mineral that is eliminated by the upper polarizer. If we flip in the upper swing-in condensing lens, light passes through the indicatrix in many different directions, but when this light exits the mineral and arrives at the objective lens, most of it is lost and only the light traveling parallel to microscope axis is transmitted to the ocular. However, by inserting the Bertrand lens, we can focus this oblique light into the focal plane of the ocular. The same effect can be obtained without the Bertrand lens by simply looking down the microscope without an ocular. This image can be sharpened if we insert a simple pinhole in place of the ocular. Let us examine the property of this convergent light that has traveled through the indicatrix in these different directions. Light traveling straight up the axis of the microscope in the center of the field is parallel to the optic axis and, therefore, gives a circular section through the indicatrix (Fig. 6.14(B)). This light is in extinction. Convergent light rising from the south side of the field passes through the indicatrix at an angle that creates an elliptical section with the vibration directions being o and e′. However, because these two vibration directions parallel the polarizers, this light is eliminated by the polarizers. The same
(C)
(D)
Figure 6.14 Uniaxial optic axis interference figure. (A) Photomicrograph of a thin section showing numerous orientations of quartz grains. The grain in the center is correctly oriented to give an optic axis figure because it remains in extinction when the stage is rotated, so its optic axis must parallel the microscope axis. (B) Ellipses show orientation of the o and e′ vibration directions for light that has passed obliquely through the crystal. (C) We see this oblique illumination by using the Bertrand lens. Where the vibration directions parallel the polarizers (shaded ellipses in (B)), light is in extinction, but between these regions light passes through. The result is a uniaxial optic axis figure consisting of a diffuse dark cross separating quadrants with white interference color. (D) When a first-order-red interference filter is inserted, the dark cross turns to first-order red, the NW and SE quadrants turn first-order yellow, and the NE and SW quadrants turn secondorder blue, which indicates that e > o and, therefore, quartz is uniaxial positive.
149
150
Minerals and rocks observed under the polarizing optical microscope
argument applies to light rising from the east, north, and west. These elliptical sections through the indicatrix are shaded gray in Figure 6.14(B) to indicate that this light is eliminated by the polarizers. Light rising from the SE, NE, NW, and SW, however, produces elliptical sections through the indicatrix, in which the vibration directions are oblique to the polarizers, and therefore components of light are transmitted and produce interference colors when recombined in the upper polarizer. Insertion of the Bertrand lens brings these oblique paths of light into the focal plane of the ocular, and we obtain an interference figure. The N-S and E-W aligned elliptical sections through the indicatrix, which are in extinction, produce two dark diffuse stripes across the field, which are known as isogyres (Fig. 6.14(C)). They intersect in the center of the field to produce a cross, which is the uniaxial optic axis interference figure. In the four quadrants between the isogyres, the elliptical sections through the indicatrix show light vibrating in planes that are not parallel to the polarizers, which produces interference colors in these quadrants. In the case of quartz, this interference color is first-order white, but it may reach a cream color on the extreme outside of the field of view. In minerals with higher birefringence, such as muscovite, the interference colors may increase sufficiently to produce what are referred to as isochromatic rings that are concentric about the optic axis (see Fig. 6.16). In the example shown in Figure 6.14, the grain is oriented with the optic axis parallel to the axis of the microscope. If the grain were tilted slightly, an optic axis figure would still be obtained, but the cross would be off centered, and its center would rotate around the center of the field of view as the stage is rotated. If the grain were tilted still more, the center of the cross might be outside the field of view, but as the stage was rotated, the off-centered optic axis figure could still be identified as the two isogyres sweep sequentially across the field of view. What would a uniaxial mineral look like and what type of interference figure would be obtained if its optic axis were lying on the stage of the microscope? In this orientation, a section through the indicatrix would have light vibrating in the ordinary and extraordinary vibration directions. Consequently, the difference in refractive index between these two directions would be a maximum, and the grain would show the maximum birefringence. If we rotate such a grain into the extinction position and insert the Bertrand lens, a flash figure is obtained. This is a cross that looks just like the optic axis figure, but as soon as the stage is rotated through only a few degrees, the cross splits apart, and two curving isogyres exit the field of view rapidly (hence flash figure). The centered flash figure is useful for proving that a grain exhibits the maximum birefringence, which is what is shown for each of the minerals in Figure 6.10. Interference figures can be obtained from grains with any orientation between the two extreme cases that we have just considered, but when they are far away from these two orientations, they are more difficult to interpret. In general, the nearer the figure is to that of the optic axis, the isogyres tend to be
straight and oriented N-S or E-W. However, as the flash figure is approached, the isogyres become curved and move across the field of view more rapidly. If you are uncertain about which figure you are looking at, it is best to search for another grain with a more identifiable interference figure.
6.11 Determination of optic sign from uniaxial optic axis figure An optic axis figure provides a convenient way of determining the optic sign of a mineral (i.e., positive or negative), which is one of the important optical properties used to identify minerals. If an accessory plate is inserted into the microscope when we are observing an optic axis figure, its fast and slow vibration directions interact with the fast and slow vibration directions in the different parts of the optic figure and cause the interference colors to change. In Figure 6.14(B), the vibration directions have been labeled in each section through the indicatrix. Take, for example, the elliptical section in the NW quadrant. The ordinary ray (o) vibrates in a NE-SW plane. Light vibrating at right angles to this direction contains a component of the extra-ordinary ray and is designated e′. When the first-order-red accessory plate is inserted, the interference color in this part of the optic figure is lowered from red to yellow. The fast vibration direction in the accessory plate parallels e′, which must, therefore, be the slow vibration direction in quartz; that is, light vibrating in e′ is slower than light vibrating in the ordinary plane. Therefore, the refractive index of e′ must be greater than that of o, making quartz positive. All uniaxial positive minerals show retardation in the NW quadrant of the optic axis figure (creating first-order yellow in the case of quartz) and addition in the NE quadrant (creating second-order blue in the case of quartz). Even when the optic axis figure is badly off center, the sign of the mineral can still be determined as long as you can identify which quadrant you are looking at.
6.12 Biaxial interference figures, optic sign, and optic angle (2V) Let us now consider the interference figures that we obtain from a biaxial mineral. First, consider a biaxial mineral lying on the stage of the microscope with any two of the principal axes of the indicatrix (x, y, or z) lying on the stage: • First, we rotate the grain into extinction and insert the
Bertrand lens, and the interference figure we obtain resembles the cross of the uniaxial optic axis figure. • When the stage is rotated, the isogyres split apart and move out into two of the quadrants. • At 45° of stage rotation, the isogyres reach their maximum separation, which may or may not have the isogyres still in the field of view, depending on the optic angle and the orientation of the grain. • By 90° of stage rotation, the isogyres come back together and form a cross.
6.12 Biaxial interference figures, optic sign, and optic angle (2V)
The various interference figures that result from light traveling in different directions through the biaxial indicatrix are shown in Figure 6.15 for a 45° rotation of the stage from the extinction position. The acute bisectrix figure (BXA) is obtained looking down the axis halfway between the two optic axes. The obtuse bisectrix figure (BXO) is obtained at right angles to this looking down the center of the obtuse angle between the two optic axes. In the extinction position, the BXA forms a centered cross resembling the uniaxial optic axis figure. When the stage is rotated the cross splits apart and curved isogyres separate into two opposing quadrants, which contain the optic axes. At 45° of stage rotation, the isogyres reach their maximum separation (Fig. 6.15(A)). If the optic angle (2V) is less than about 55°, the isogyres remain in the field of view, but if it is larger, the isogyres leave the field of view. The BXA figure provides a convenient way of determining the optic sign of a mineral:
vibration direction must be slow, and therefore the other vibration direction must be fast and is, therefore, x. • We can conclude that the z vibration direction must be coming up the axis of the microscope and falling in the acute angle between the optic axes. The mineral is, therefore, biaxial positive. It will be noticed that if the BXA figure is rotated into the extinction position where it forms a cross and you pretend that it is a uniaxial optic axis figure, the method outlined above for determining signs of uniaxial minerals gives the same result for the biaxial mineral, that is, positive. The BXO figure is similar to the BXA figure but the optic axes move completely out of the field in the 45° position. When the 2V is large (>55°), it is difficult to distinguish the BXA and BXO figures because the isogyres go completely out of the field. When the 2V becomes 90°, the BXA and BXO are identical. When the 2V is large, it is preferable to find a centered optic axis figure if you wish to estimate the 2V or determine the sign of the mineral. A centered optic axis figure has an isogyre that passes through the center of the field of view and rotates around like a propeller as the stage is rotated (Fig. 6.15(A)– (C)). When the isogyre is rotated into the 45° position, it shows the maximum curvature, which can be used to estimate the 2V (Fig. 6.15(D)). When the 2V is 90° the isogyre is straight, and as the 2V approaches 0°, the isogyre approaches the right angle bend of a uniaxial optic axis figure. Because of the diffuse nature of isogyres, a 2V of less than 10° is difficult to distinguish from a uniaxial optic axis figure. For example, the feldspar sanidine (Sec. 7.4.2), which is found in some volcanic rocks, has a small 2V (1.537 and negative if 90 foidite
70 60 50 % M 40 30 20 10 0
MELA-
9' 8'
7' 13 6' & 11 12
0 A
10
20
30
LEUCO-
40
50
60
70
80
70 60 50 10' & 14 40 30 20 10 0 90 100 P
% Mafic minerals in feldspathoidal rocks
260
Figure 9.25 IUGS classification of igneous rocks containing less than 90% mafic minerals. The heavy horizontal line goes from alkali feldspar (A), which includes plagioclase 90%). Abbreviations are the same as in Figure 9.27.
50
Pyroxene Hornblendite hornblendite
9.3 International Union of Geological Sciences classification of igneous rocks
should be applied. Although the boundaries between the fields are arbitrary, they were positioned so that rocks with a particular name plot near the center of each field rather than near a boundary. The coarse-grained plutonic rock names are given in each field in upper case, and equivalent volcanic rock names are given in lower case. For example, granodiorite is the plutonic equivalent of the volcanic rock dacite. For convenience, each of the fields is numbered. If you wish to indicate additional mineralogical information about a rock, especially if it is transitional between fields, you can do so by adding mineral names to the rock name, with the most abundant mineral closest to the root name. A biotite-hornblende granodiorite, for example, would contain more hornblende than biotite. Figure 9.25 does not uniquely define all rocks. For example, as rocks become more plagioclase rich (toward the right in Fig. 9.25), plagioclase tends to become more anorthite rich, but in some rocks it becomes more anorthite rich than in others. For example, gabbro and diorite both plot in field 10, but plagioclase in gabbro is more anorthite rich and in diorite less anorthite rich than An50. In addition, as rocks plot farther to the right in Figure 9.25, they become more mafic. Separate graphs indicating the typical mafic mineral content of rocks in the different fields are plotted above and below the diagram for quartz-bearing and feldspathoid-bearing rocks, respectively. For rocks containing exceptionally high or low contents of mafic minerals, the prefix mela- (dark) and leuco- (light), respectively, can be added to the rock name. Another term used to indicate the mafic mineral content is the color index, which is simply the total percentage of dark minerals in a rock. Figure 9.26 shows typical hand specimens of each of the plutonic rock types in the IUGS classification. The colors of the rocks shown are typical, but it should be emphasized that granites and quartz syenites could just as easily have been illustrated with pink samples. Alkali feldspar is commonly pink because of the presence of small amounts of ferric iron. The IUGS classification subdivides gabbroic rocks on the basis of their major mafic minerals, which include clino- and orthopyroxene, olivine, and hornblende. Most gabbroic rocks consist of plagioclase, pyroxene, and olivine (Fig. 9.27(A)), but in many plutonic bodies, compositional layering can give rise to rocks that are enriched in any of these minerals. If the rock consists of more than 90% pyroxene or olivine, it is designated an ultramafic rock. If it contains more than 90% plagioclase, it is named anorthosite. Names of rocks consisting of intermediate mixtures of these minerals are indicated in Figure 9.27(A). Gabbroic rocks are also subdivided on the basis of the type of pyroxene (Fig. 9.27(B)). The pyroxene in normal gabbro is the clinopyroxene augite (Sec. 7.13), but in some, orthopyroxene predominates, in which case the rock is called norite. In some gabbroic rocks, especially those we classify as alkaline (see Sec. 9.3.5), hornblende can be a major constituent. Figure 9.27(C) shows the rock names that should be applied to hornblende-bearing gabbroic rocks.
Ultramafic rocks are also subdivided on the basis of mafic minerals (Fig. 9.28). Peridotites, for example, are composed predominantly of olivine and pyroxene. If ortho- and clinopyroxenes are present in approximately equal amounts, the peridotite is called lherzolite. This is the type of peridotite brought up in diatreme breccias from great depth along with diamond-bearing nodules (Fig. 15.5) that we believe are representative of the upper mantle (see Sec. 8.1.1 and Fig. 8.1). The mantle peridotite immediately beneath midocean ridges from which basaltic magma has been extracted is composed of olivine and orthopyroxene and is called harzburgite. In many lopoliths, layers consisting almost entirely of one mafic mineral can be found. For example, if the layer is composed of olivine, it would be referred to as dunite. No volcanic equivalents are given for the ultramafic rocks, because for the most part, no magmas of these compositions ever existed. Ultramafic rocks are formed by the accumulation of early crystallizing minerals from magma or by the redistribution of minerals in crystal mush. However, one important exception, which is discussed in Section 9.5.1, is the ultramafic lava known as komatiite, named from its occurrence in the Komati River of South Africa. It has the composition of a lherzolite, but its texture and mode of occurrence indicate that it crystallized in lava flows.
9.3.3 Composition of common plutonic igneous rocks Table 9.1 lists average chemical analyses of some common plutonic igneous rocks compiled by Le Maitre (1976). The averages are based on large numbers of analyses, as indicated in the table. The abundances of the major (>1.0%) and minor (1.0– 0.1%) elements in rocks are normally presented in analyses as weight percent oxides. Trace elements ( Al2O3, which means that the rock contains more alkalis than can be accommodated in feldspar or nepheline; therefore, they also contain the sodic pyroxene aegirine or a sodic amphibole. At the top of each of the series in Figure 9.30 is a rock type formed from magma that can be thought of as parental to the other rocks in the series. The subsequent rocks in the series are formed through differentiation of the parental magma, mainly as a result of crystal fractionation, but assimilation of crustal rocks and even liquid immiscibility may play a role at late stages. In general, rocks at the top of each series are dark colored because of abundant mafic minerals and contain relatively anorthite-rich plagioclase. Rocks become lighter colored toward the bottom of each series as the content of quartz or feldspathoid increases, and the plagioclase becomes progressively more albitic and is accompanied by increasing amounts of alkali feldspar. Rocks belonging to each of these series occur in definite plate tectonic settings. Tholeiitic rocks are characteristic of active divergent plate boundaries where considerable melting takes place in response to adiabatic decompression of the mantle. Basalts erupted from midocean ridges and covering most of the ocean floor are tholeiitic. Divergent plate boundaries on continents are also characterized by tholeiites, as long as spreading rates are significant. Volcanism over hot spots and hypothesized mantle plumes is also tholeiitic until the waning stages, when it can become alkaline. Calcalkaline rocks are characteristic of
265
266
Igneous rocks SUBALKALINE ROCKS Tholeiitic basalt series
ALKALINE ROCKS
Calcalkaline series
Alkali olivine basalt series
Olivine tholeiite
Tholeiite Quartz tholeiite Tholeiitic andecite Icelandite
Nephelinic, leucitic and analcitic rocks
Alkalic picritic-basalt Ankaramite
Tholeiitic picrite-basalt
High-alumina basalt High-alumina andesite Andesite
Nephelinite Melilite nephelinite
Alkali olivine basalt Basanite
Sodic series
Analcitite Hawaiite Nepheline hawaiite
Dacite
Mugearite Nepheline mugearite
Rhyolite
Benmoreite Nepheline benmoreite
Potassic series Trachybasalt Leucite trachybasalt
Leucitite Wyomingite
Tristanite
Trachyte Phonolite Divergent plate boundaries and hot spots
Convergent plate boundaries
Leucite tristanite PERALKALINE ROCKS K-rich trachyte
Pantellerite
Leucite phonolite
Comendite
Slow moving divergent boundaries, rift valleys
convergent plate boundaries. The sequence of basalt, andesite, dacite, rhyolite (BADR) is typical of lavas erupted from composite volcanoes generated above the subducting plate when it reaches a depth of 100 km, and the plutonic equivalents – gabbro, diorite, granodiorite, and granite – are the rock types found in the batholiths of orogenic belts. Alkaline rocks form when the degree of melting in the mantle is far less than in the case of tholeiitic rocks and the source is deeper. Where plate divergence rates are low, such as rift valleys in continents, the rocks formed are alkaline. As a tholeiitic shield volcano moves off a hot spot, as has happened to each of the volcanoes in the Hawaiian chain, the degree of melting in the source decreases and moves to greater depth, and the magma changes from tholeiitic to alkaline. In the following section, we describe typical examples from each of these plate tectonic settings.
9.4 Igneous rocks and their plate tectonic setting In Section 8.2, we saw that the Earth’s crust and mantle are normally solid, and only on rare occasions do conditions allow them to partially melt. These conditions result from plate tectonic processes. Magma is generated in response to heating over mantle plumes, decompression at divergent plate boundaries, or fluxing with water above subducting oceanic plates. Each of these processes involves different ways of crossing the solidus and generating magmas of slightly different compositions (Sec. 8.2). These magmas then rise toward the surface and, through
Figure 9.30 General classification scheme for volcanic rocks based on genetically related series (modified from Irvine and Baragar, 1971). Lines joining boxes link commonly related rocks. Each main series has a specific plate tectonic association, which is indicated in the background gray boxes.
differentiation and assimilation, generate the wide range of rock types found in the Earth’s crust. It is not surprising, therefore, that these rocks reflect the plate tectonic setting in which they form. We now discuss the major rock types that typify the various plate tectonic settings where rocks are created.
9.4.1 Igneous rocks formed at midocean-ridge divergent plate boundaries Midocean ridges are the most productive rock factories on Earth. More than 10 km3 of tholeiitic lava (MORB) is erupted worldwide each year from the 65 000 km-long midocean ridge system, and still more magma solidifies at depth. Despite extensive sampling with dredges and shallow drill holes, we know little about these deeper rocks because most of them are subducted into the mantle at convergent plate boundaries. On rare occasions, however, fault-bounded slices of ocean crust have been thrust onto continents as a result of obduction to form what are known as ophiolite suites. The rocks making up these suites can be correlated with seismic studies of modern ocean floor to give the clearest picture of the nature of the oceanic crust. Figure 9.31 shows a cross-section of oceanic crust in the vicinity of a midocean ridge based largely on knowledge gained from ophiolites, which typically consist of three major rock types: • An ultramafic rock composed largely of serpentine • Pillowed basalt (often badly altered) and its plutonic
equivalent gabbro • A silica-rich sedimentary rock known as chert
(Secs. 10.15 and 11.3.1)
9.4 Igneous rocks and their plate tectonic setting
Siliceous sediment
Midocean ridge cooled and hydrothermaly altered by circulating ocean water
Pillow lavas
Sheeted dikes
Troctolite Wehrlite Dunite
Isotherms
Zoned magma lens
Moho Chromitite
Depleted mantle harzburgite
Compaction
Mantle flow
Zone of partial melt
We illustrate this sequence with rocks from the Troodos massif, in the core of the Mediterranean island of Cyprus, which has brought to the surface a complete section through the oceanic crust (Fig. 9.32(A)).
(A)
Figure 9.31 Crosssection through the oceanic lithosphere near a midocean ridge based on seismic data and oceanic lithosphere that is obducted onto continents to form ophiolites.
The sedimentary rocks surrounding the Troodos massif (light color in Fig. 9.32(A)) were formed from deepwater marine sediments. Some of these consist of radiolaria, which on compaction was converted to the silica-rich rock known as
(B)
S
(E)
(C)
(D)
Figure 9.32 (A) The dark area in this NASA satellite image of the island of Cyprus in the eastern Mediterranean is the Troodos massif, which exposes a complete section through the oceanic crust. S indicates location of the Skouriotissa mine. (B) Pillow lavas exposed on the north side of the Troodos massif. (C) Sheeted dikes with chilled contacts only on their left side (see Fig. 9.33(F)). (D) Copper mine at Skouriotissa (place of slag). (Photograph courtesy of Colin Wilkins.) (E) Roman slag from smelting copper ore at Skouriotissa.
267
268
Igneous rocks
chert, a cryptocrystalline variety of quartz (Fig. 9.33(A)–(C)). Below the sediments are the MORBs, which are olivine tholeiites (Fig. 9.30 and field 10 in Fig. 9.25). Because they are erupted onto the seafloor, they are commonly pillowed (Fig. 9.32(B)). Rapid quenching by water produces an extremely fine-grained rock (Fig. 9.33(D)–(E)). Ocean water circulating through this basalt hydrothermally alters the plagioclase to albite and the mafic minerals to hydrous minerals. This altered sodium-rich basalt is known as spilite. Immediately beneath the pillows is a zone composed almost entirely of dikes intruding dikes to form a sheeted dike complex (Fig. 9.32(C)). These dikes typically have only one chilled contact, with the other chilled contact occurring on the other side of the divergent plate boundary, having been separated by sequential intrusions of new magma in the center of a previous dike. Figure 9.33(F) shows a photomicrograph of the chilled margin of one of the dikes in Figure 9.32(C), which contains small vesicles that were sheared into ellipses by the flow of magma. Figure 9.33(G) shows how the ellipticity of the vesicles indicates the magma flow direction. The sheeted dikes pass down into layered gabbroic to ultramafic rocks (Fig. 9.33(H)–(M)), grading from troctolite (plagioclase + olivine) to wehrlite (olivine + clinopyroxene) to dunite (olivine) at the base (Fig. 9.31). These layers can be laterally extensive, which might suggest formation in huge magma chambers, but seismic surveys across active oceanic ridges, such as the East Pacific Rise and the Galapagos Spreading Axis, reveal chambers only 1 km wide and 100 m thick. The size of the chambers probably remains relatively small at all times, but continuous spreading from the axis produces layers that are laterally far more extensive (see isotherms in Fig. 9.31). All these igneous rocks are hydrothermally altered, but their primary igneous textures are still clearly visible (Fig. 9.33(H)– (J)). However, the rocks beneath the dunite appear quite different in that they are highly deformed and are composed largely of the mineral serpentine; they are, therefore, referred to as serpentinites. Before serpentinization, these rocks were harzburgites (olivine + orthopyroxene), as can be identified from their textures (Fig. 9.33(K)–(L)). Olivine, when converted to serpentine, shows curving fractures that are commonly decorated with magnetite grains. The serpentine along these fractures is the fibrous chrysotile variety. Serpentine formed from
orthopyroxene has a very different appearance and in many respects still resembles the original orthopyroxene grains. For example, the original cleavage of the pyroxene may still be preserved, and the serpentine shows the same parallel extinction under crossed polars that characterizes orthopyroxene. The serpentinized harzburgite is believed to be the refractory mantle residue from which the basaltic magma was extracted during decompression melting. Its deformation is thought to result from flow in the mantle associated with the rise of the asthenosphere beneath the divergent plate boundary. According to this interpretation, the boundary between the layered gabbroic rocks and the underlying harzburgite is the Mohorovic˘ ic´ (Moho) discontinuity. Several economic mineral deposits are associated with ophiolites. The name Cyprus is from the ancient Greek word for “copper,” kypros, which has been mined on the Island for more than 4000 years (Fig. 9.32(D)–(E)). The copper deposits are associated with the pillow lavas and formed on the ocean floor from hydrothermal vents. Modern equivalents of these vents are the black smokers that have been identified along midocean ridges where superheated steam rising from newly formed ocean floor precipitates iron, copper, and zinc sulfides on entering the cold ocean water (Fig. 9.34). The sulfides build meter-high chimneys from which plumes of dark, suspended sulfide particles rise through the cold, dense ocean water until they find a level of neutral buoyancy, whereupon they spread laterally and slowly settle out the suspended sulfide particles onto the ocean floor. In this way a strata-bound sulfide deposit is formed, which can be contrasted with hydrothermal vein deposits, which cut across the strata. Ophiolites also host important economic chromite deposits. Rocks composed largely of chromite are known as chromitites. They occur both as layers in the dunite and as lenses and pods in the harzburgite. The chromitite in the layered rocks appears to have formed as crystal cumulates from the magma beneath the spreading axes. They form laterally continuous layers and have textures consistent with having accumulated through crystal settling. The world’s main source of asbestos comes from the chrysotile in the serpentinites of ophiolites, as in the Eastern Townships of Quebec. This mining industry was dramatically reduced after some forms of asbestos were linked to lung cancer (see Sec. 17.3.2).
Figure 9.33 Photographs of hand specimens and thin sections of rocks through the oceanic crust as exposed in the Troodos ophiolite suite, Cyprus. Samples are arranged in stratigraphic order from sediment at the top to mantle peridotite at the bottom. (A) Radiolarian chert. (B) and (C) Photomicrograph of radiolaria in chert under plane and crossed polarized light, respectively. (D) and (E) Photomicrograph of pillowed basalt under plane and crossed polarized light, respectively. (F) Chilled margin (left) of one of the dikes in Figure 9.32(C). The white spots are vesicles, whose elliptical shape indicates that magma flowed upward. (G) Laminar flow of magma past a contact shears a spherical vesicle into an ellipsoidal shape. (H) Hydrothermally altered gabbro from beneath the sheeted dike complex. (I) Photomicrograph of sample (H) under plane light showing that most of the original pyroxene has been altered to green amphibole. (J) Same as (I) but under crossed polars. (K) Hand sample of serpentinized harzburgite from Mount Olympus at the core of the Troodos massif. Serpentine formed from olivine is stained red and that formed from orthopyroxene is green. (L) Photomicrograph of (K) showing green serpentine, with that formed from olivine being full of small opaque magnetite grains, whereas that formed from orthopyroxene is a smooth green color. (M) Same as (L) but under crossed polars. The small veins in the serpentinized olivine are filled with fibrous chrysotile asbestos (white).
9.4 Igneous rocks and their plate tectonic setting
(A)
1 cm
(B)
(C)
1 mm
(E) Dike contact
(D) (F)
0.1 mm
1 mm
(G)
(I)
(K)
A
B'
B A'
1 mm
1 cm
Flow direction
1 cm
(H)
(J)
(L)
1 mm
(M)
269
270
Igneous rocks
main rock type is alkali olivine basalt (AOB), which belongs to the sodic series in Figure 9.30. As the name implies, olivine is abundant and forms phenocrysts, but this basalt also contains phenocrysts of augite and plagioclase. Moreover, AOB never contains pigeonite or orthopyroxene, and the augite differs from that in tholeiites in that it is titanium rich. The titanium content of titanaugite is a reflection of the silica deficiency in the magma, which is, of course, why these rocks are classified as alkaline (Sec. 9.3.2). In coarser-grained intrusive rocks, this silica deficiency causes nepheline to form as a late-crystallizing mineral (Fig. 9.35). Differentiation of alkali olivine basalt magma can lead to the eruption of less mafic lavas on oceanic islands. One of the most common of these is known as trachyte, which is the volcanic equivalent of syenite (Fig. 9.25). Figure 9.34 A black smoker hydrothermal vent on the East Pacific Rise (17° 37.2′ S, 113° 15.1′ W) at a depth of 2591 m below sea level, as seen from the window of the research submersible Alvin. The 353°C hydrothermal fluids are depositing anhydrite (CaSO4) and chalcopyrite (CuFeS2) on the wall of the chimney. (Photograph courtesy of Woods Hole Oceanographic Institution (WHOI); M. Lilley and K. Von Damm, chief scientists.)
9.4.2 Igneous rocks of oceanic islands formed above hot spots Before research vessels sampled the ocean floor, rocks of oceanic regions were thought to be predominantly alkaline. This was because so many oceanic islands (excluding those of island arcs; see Sec. 9.4.5) are made of alkaline rocks. We now know that the ocean floor is underlain predominantly by MORB, which is tholeiitic, and even large oceanic islands are mainly tholeiitic, although they often have a late capping of alkaline rocks. As plate motion moves a volcano off a hot spot, cooling and densification cause the volcanic island to sink, and it is not surprising, therefore, that the rocks found on these islands are late-stage alkaline rocks. Tholeiitic rocks of oceanic islands have a wider compositional range than do MORBs. This is in part because of differentiation of magma in chambers beneath volcanoes, but it is also because the basalts come from a greater range of depth. The tholeiitic magmas result from relatively large-scale partial melting at shallow depths, whereas alkaline magmas are the result of smaller-scale melting at greater depth. Clearly, large volumes of magma must be generated and erupted just for a volcano to build from the ocean floor to sea level. This is normally achieved through the eruption of olivine tholeiite. We have already seen what this rock looks like in our discussion of the eruption of Kilauea Iki (Fig. 8.26). The only mineral that commonly forms phenocrysts in these basalts is olivine. The groundmass contains plagioclase, augite, and pigeonite, and magnetite typically crystallizes very late. In slowly cooled intrusive bodies, quartz may form in the final residue. The alkaline rocks of oceanic islands are strikingly different in both hand specimens and thin sections from the tholeiites. The
9.4.3 Continental flood basalts and large igneous provinces At various times throughout geologic history, parts of continents have been covered by vast outpourings of flood-basalt flows that were the precursor to continental rifting and formation of new ocean floor. For example, eruption of the early Triassic flood basalts of eastern North America was the harbinger to the breakup of Pangaea to form the North Atlantic Ocean, and the eruption of Tertiary flood basalts across Greenland, Iceland, and the northwestern coast of Britain led to the opening of the North Atlantic Ocean between Greenland and Europe. In many cases, flood basalts on continents have been traced via oceanic ridges to oceanic islands located over hot spots. This led to the idea that these vast flood-basalt provinces formed over possible mantle plumes (Fig. 1.7(E)) that supplied the heat necessary for such large-scale melting. Associated with flood basalts are large volumes of intrusive rocks. Feeder dikes to the flows can form radial patterns around the plume head, such as those of the McKenzie region of northwestern Canada. Sedimentary basins form during rifting, and when magma enters these, it commonly spreads laterally to form sills (Fig. 9.4). Because all of these related igneous rocks can cover large areas, the regions are referred to as large igneous provinces (LIPs). We should add that some LIPs form on oceanic crust, thus creating large plateaus such as those of Kerguelen in the southern Indian Ocean and Ontong-Java in the southwestern Pacific. The Ontong-Java Plateau was formed by 100 million km3 of flood basalt that erupted about 120 million years ago. The origin of these vast outpourings on the ocean floor is still poorly understood, but they represent some of the largest igneous events in the Earth’s history. The flow of the mantle away from a plume head leads to rifting of the lithosphere in much the same way that magma convecting beneath the crust of a lava lake rifts its surface (see photograph at beginning of this chapter). The rifts intersect at a triple junction above the plume (Fig. 1.7(E)). Normally, two of
Nph
(A)
(B)
1 mm
Figure 9.35 Photomicrograph of a thin section of porphyritic nepheline basalt from Tahiti. (A) Under plane light, a phenocryst of titanaugite, showing titanium-rich pink sectors, is surrounded by groundmass containing light-colored plagioclase and nepheline, deep-brown hornblende, and opaque magnetite. (B) Under crossed polars, the titanaugite exhibits anomalous blue and brown interference colors and oscillatory zoning. Large areas with gray interference color are nepheline (Nph).
the rifts become dominant and open to form new ocean floor, whereas the third becomes a failed arm and either stops moving or moves very slowly. Such a plume and rift system is thought to be centered in the Afar region of Ethiopia (Box 8.4), where the Red Sea and Gulf of Aden rifts are opening to form new ocean floor, with the Arabian plate moving northeastward away from the African continent at 16 mm/year. The East African Rift is spreading more slowly at only 4 mm/year. The geologic record shows that igneous activity associated with the development of a new plume peaks early, with huge initial outpourings of flood basalt. The first basalts erupted are what are referred to as continental flood basalts. This rock type, which has remained remarkably constant in composition from the Precambrian to the present, is a quartz tholeiite. Although it may contain phenocrysts of olivine, its silica content is high enough that olivine should react to form orthopyroxene or pigeonite if given sufficient time. In Figure 8.8, continental flood basalts plot to the right of enstatite, whereas MORBs plot to the left of it. Some flood basalts can be alkaline, but these are not common. Figure 9.36(A)–(B) shows photomicrographs of a thin section of typical continental flood basalt. It has plagioclase phenocrysts in a groundmass of clusters of small plagioclase laths, augite, and pigeonite. Dark patches of mesostasis, formed from the residual liquid, consist of dendritic magnetite crystals and immiscible iron-rich and silica-rich glassy droplets (Fig. 8.30). This same magma, when cooling more slowly in sills, such as those of the Karoo region of South Africa (Fig. 9.36(C)– (D)), crystallizes the same minerals as in the flood basalts, but they have time to develop the ophitic texture, where plagioclase laths are enclosed in larger crystals of pyroxene or olivine (Sec. 8.3.2). This coarser-grained basaltic rock is referred to as diabase (dolerite in Britain). The photomicrograph under crossed polars (Fig. 9.36(D)) shows that augite and pigeonite crystals are much larger than the enclosed plagioclase crystals.
These same magmas can form other intrusive bodies that cool more slowly and undergo significantly more fractionation during solidification. The Skaergaard intrusion in East Greenland, formed during the initial breakup of Greenland from Europe, is one of the world’s most strongly differentiated intrusions. Most of its gabbroic rocks show prominent layering that point to active magma convection during solidification (Fig. 8.28(A)–(B)). The grain size is considerably coarser than in sills, and even though the same minerals are present, slower cooling allows minerals to equilibrate to lower temperatures. Figure 9.36(E)–(F) shows a Skaergaard gabbro that initially crystallized plagioclase, augite, and pigeonite, with a few olivine grains preserved in the pigeonite. On cooling slowly, the pigeonite inverted to orthopyroxene (pale yellow interference color) and at the same time exsolved small patches of augite (red dots throughout the yellow) to form inverted pigeonite (see photomicrograph opening Chapter 6). Slower cooling also allows for differentiation processes to segregate late-stage liquids that contain significantly more silica than the initial basaltic magma. Both quartz and alkali feldspar crystallize from these late liquids, forming an intergrowth called a granophyre (Fig. 9.36(G)–(H)). Some granophyres consist almost entirely of quartz and alkali feldspar and are light colored, but those in the Skaergaard contain significant amounts of iron-bearing minerals and are dark. The pyroxene shown in Figure 9.36(G) is rich in the iron end member hedenbergite, and the olivine (top center) is rich in the fayalite end member. Note that fayalitic olivine can coexist with quartz, whereas forsteritic olivine reacts to form orthopyroxene (Fig. 8.8).
9.4.4 Alkaline igneous rocks associated with continental rift valleys Igneous rocks associated with failed arms of triple junctions (Fig. 1.7(E)) or along slowly diverging continental plates tend to be alkaline. For example, tholeiitic flood basalts were erupted near the Afar triple junction, where rifting successfully opened the Red Sea and Gulf of Aden, but farther south along the
272
Igneous rocks
(A)
1 mm
(B)
Pgt Aug Pgt
(C)
(D)
Aug
1 mm
Aug
Ip Ol
(E)
1 mm
Ip
(F)
Fa
Ap
Ol
Fa
Gran Gran Ap
Ap
(G)
Aug
1 mm
(H)
Aug
Figure 9.36 Photomicrographs of thin sections of rocks associated with large igneous provinces as seen under plane and crossed polarized light. (A) and (B) Holyoke flood-basalt flow from the Mesozoic Hartford Basin, Connecticut. (C) and (D) Karoo diabase from the Birds River sill, South Africa. Plagioclase laths are ophitically enclosed in large crystals of augite (Aug) and pigeonite (Pgt). (E) and (F) Gabbro from the Skaergaard intrusion (Fig. 8.28), East Greenland, composed of augite and olivine (Ol), which is surrounded by a reaction rim of pigeonite that has changed to inverted pigeonite (Ip). (G) and (H) Granophyre from the Skaergaard under plane light containing intergrown quartz and alkali feldspar (Gran) between crystals of iron-rich augite (Aug), fayalitic olivine (Fa), plagioclase, magnetite, and apatite (Ap).
9.4 Igneous rocks and their plate tectonic setting
East African Rift system igneous activity is distinctly alkaline. Mount Kilimanjaro (K in Box 8.4(A)), for example, is a large volcano built of alkali basalt, trachyte, and phonolite. The alkaline nature of these magmas is due to smaller degrees of partial melting in the source region, which is also at greater depth than tholeiitic sources. The most common mafic intrusive rock of this alkaline association is nepheline gabbro, the plutonic equivalent of alkali olivine basalt. Olivine, titanaugite, and deep reddish-brown hornblende and biotite are the main mafic minerals. Magnetite is an abundant accessory mineral and contains a large percentage of ulvöspinel (Fe2+2TiO4). Ilmenite (FeTiO3) may also be present and is distinguished from magnetite by its elongate crystal shape (magnetite is equant). Titanite, CaTiSiO5 (also called sphene), is another common titanium-bearing mineral in these rocks. It is identified by its wedge-shaped crystals, which, because of extremely high birefringence, appear the same brownish color under plane or cross-polarized light. Alkaline rocks have much higher phosphorus contents than do tholeiitic rocks, and consequently apatite is an abundant accessory. The main felsic rock of this series is nepheline syenite. It is composed largely of nepheline and alkali feldspar but may also contain sodalite. The main mafic mineral is the sodic pyroxene aegirine, which in thin sections is bright green (Fig. 7.26). Greenish-blue sodic amphiboles are also common. Apatite is an extremely abun-
dant accessory and may even be present as phenocrysts. Alkaline rocks tend to be rich in zirconium, and consequently zircon is a common accessory, as are other rarer zirconium minerals. Mafic dike and sill rocks associated with alkaline intrusions commonly contain large phenocrysts of hornblende or biotite. These rocks are known as lamprophyres (Fig. 9.37(A)–(C)). They have essentially the same composition as alkali olivine basalt. The presence of hydrous phenocrysts testifies to the high volatile content of the magma from which they form. Some alkaline rocks are so silica-poor that nepheline, NaAlSiO4, forms in place of albite, NaAlSi3O8, calcium melilite, gehlenite, Ca2Al2Si2O7, forms in place of anorthite, CaAl2Si2O8, and calcium magnesium melilite, åkermanite, Ca2MgSi2O7, forms instead of pyroxene, CaMgSi2O6. The magnesium-rich mica, phlogopite, can also be present, forming a major mineral in the rock known as kimberlite (Fig. 9.38), which hosts mantle xenoliths that bring diamonds (Fig. 15.5) to the surface. Another economically important alkaline rock is carbonatite (Fig. 9.39), which is composed largely of calcite with only small amounts of silicate minerals,including diopsidic pyroxene,phlogopitic mica, forsteritic olivine, and monticellite, CaMgSiO4. The high Fe3+/Fe2+ in these rocks causes the silicate minerals to be magnesium rich, with most of the iron entering magnetite. Magnetite, apatite, and perovskite are common accessories.Many carbonatites contain
Hbl
(B)
1 mm
Hbl
Aug
(A)
1 cm
Hbl
(C)
Figure 9.37 (A) Lamprophyric dike rock from Montreal, Quebec, containing large black phenocrysts of hornblende (Hbl). (B) Photomicrograph of a thin section under plane light showing the upper tip of the large hornblende phenocryst in the lower left of (A) in a groundmass of titanium-rich hornblende, titanaugite (Aug), magnetite, and late crystallizing plagioclase. (C) Same as (B) under crossed polars.
273
274
Igneous rocks
1 mm
(A)
(B) Phl
Opx
Figure 9.38 (A) Photomicrograph of a thin section under plane light of kimberlite, which reacted with an orthopyroxene-rich (Opx) mantle nodule (left) from a diatreme pipe on Isle Bizard, Quebec (see Fig. 8.1(A)). The kimberlite has light-colored millimeter-size phlogopite (Phl) crystals in an extremely fine-grained matrix. (B) Same as (A) under crossed polars.
pyrochlore, a complex calcium, sodium, niobium, tantalum oxide, which forms small red octahedra (Fig. 9.39(A)). This mineral, which provides the main source of niobium and tantalum, is also a valuable source of rare-earth elements, which substitute into the mineral’s structure.
9.4.5 Igneous rocks formed near convergent plate boundaries Convergent boundaries are the second-largest rock factory on Earth. However, in contrast to the more productive midocean ridge system whose rocks are subducted back into the mantle, rocks produced at convergent plate boundaries have slowly built the continents throughout geologic time. They are, therefore, of immense importance, because they not only provide the primary rocks of continents but, through their weathering, also create the soils on which our agriculture depends and the sediment to form sedimentary rocks. The rise of magma into the crust near convergent boundaries also brings heat with it
that causes metamorphism and circulation of fluids that form ore deposits. Without the igneous rock production at convergent plate boundaries and the formation of continents, life on our planet would have remained largely marine. Let us briefly review the fundamental processes discussed in Section 8.2.3 that lead to formation of igneous rocks at convergent plate boundaries. New ocean floor created at midocean ridges is cooled and hydrothermally altered by circulating ocean water. By the time these rocks reach a subduction zone, they contain hydrous minerals and are overlain by a thin veneer of sediment, which also contains considerable water (Fig. 9.40). The pressure increase that accompanies subduction compacts the sediment and drives off water and eventually causes metamorphic reactions that convert hydrous minerals to anhydrous minerals, releasing still more water. This water rises into the overlying mantle wedge, where its fluxing action causes partial hydrous melting of mantle peridotite. The critical release of water that causes melting occurs at a depth of about 100 km.
5 mm
Mag
Di
Pych Phl Cal Ap Cal
(A)
(B)
Figure 9.39 (A) Photomicrograph of a thin section under plane light of carbonatite from Oka, Quebec, containing clear calcite (Cal) with intersecting twin lamellae, small colorless high-relief crystals of apatite (Ap), opaque magnetite (Mag), pale green diopside (Di), orange to green zoned phlogopite (Phl), and red pyrochlore (Pych). (B) Under crossed polars, small apatite grains (low birefringence) outline original coarse grains of calcite that subsequently recrystallized to smaller polygonal grains.
9.4 Igneous rocks and their plate tectonic setting
We know this because the Benioff seismic zone of earthquakes in the descending slab always occurs ~100 km beneath the volcanic arc that forms above the subducting plate (Fig. 9.40). However, if the Benioff zone dips at less than 25°, as occurs along part of the Andes in South America, no volcanism occurs. Perhaps at these shallow angles water is released over too great a distance or the temperature in the mantle wedge is too low to cause melting. Volcanic arcs
The line of volcanoes above a subducting plate can form an island arc on oceanic plates, or a volcanic arc atop a mountain range on continental plates. Along these arcs, volcanoes are regularly spaced. For example, those along the Aleutian arc are spaced ~70 km apart, whereas those along the adjoining Kamchatka arc are ~30 km apart (Fig. 9.41). This spacing is best explained as a result of a Rayleigh-Taylor instability (Sec. 8.6.2 and Fig. 8.23). Magma generated above the subducting plate would segregate to form a sheet parallel to the boundary that would be gravitationally unstable as a result of buoyancy of the magma. Diapirs would develop along this sheet that would determine the spacing of the volcanoes along the arc. Based on typical volcano spacings (30–70 km) and the viscosities of the magma and the lithosphere, we can calculate that the thickness of the magma sheet that segregates above the subducting plate is only 100–500 m thick. Subduction can involve convergence of oceanic, oceanic and continental, or continental plates. When oceanic plates converge, the older, cooler, and hence denser ocean floor subducts beneath the younger less dense ocean floor. When oceanic and continental plates converge, the denser oceanic plate subducts beneath the continent. Continental plates can be subducted
beneath continental plates if carried along on a subducting oceanic plate that transports the continent as if it were on a conveyor belt. India, for example, is following the ocean floor that is being subducted beneath Tibet. The convergence of continents, however, presents problems because the buoyant continental rocks do not sink as easily as dense metamorphosed ocean-floor rocks, so continent-continent collisions result in considerable thickening of the crust. A subducting slab consists of cold dense rocks, and the metamorphic reactions that accompany subduction increase its density still more and provide the main driving force for subduction. Coupling between the subducting plate and the overlying mantle wedge sets up convection in the wedge (Fig. 9.40), which not only drives plate convergence but also brings in a constant flux of new hot mantle from beneath the overriding plate. This same convection creates tensional forces in the lithosphere behind the arc, which can result in rifting and formation of a back-arc basin and possibly creation of new ocean floor (Fig. 9.40). Not all convergent plate boundaries, however, have back-arc spreading. For example, none is seen in the Bearing Sea behind the Aleutian arc (Fig. 9.41). Calcalkaline magma production above a subducting plate
The release of the hydrous fluids from the subducting plate, the convection in the mantle wedge, and the possible back-arc spreading all lead to perturbations that generate a wide variety of igneous rocks near convergent boundaries. These rocks are generally referred to as calcalkaline, but they show a wide range of composition depending on the type of plates involved (oceanic versus continental), the distance behind the primary volcanic arc, and whether back-arc spreading has played a role in their generation. The main rocks in the volcanic arc
Regularly spaced composite volcanoes along volcanic arc
Back arc basin Alkaline series or MORB if new ocean floor is formed
ch
n Tre
Turbidite sedi ment Accretionary wedge Ocean floor sediment
Hy droth e r ma alte red oc e an lly ic cr u st
L it h o s p
A sth e
nos
ph
e re
her
e
Calcalkaline series
Potassic series Continental crust
Continental crust
100 km
Me tam orp Ben i his m off se Su an d d ismic bd uc eh tin ydr zone gl ati ith on osp he ric pla te
Figure 9.40 Cross-section showing magmatic activity associated with subduction of an oceanic plate beneath a continental plate.
Lithosphere
Asthenosphere
275
Igneous rocks
(B)
(A)
tka ha mc a K
K
Al Emp eror Seam oun t Ch ain
276
h enc il Tr Kur
eut
rc i a n I s l a nd A
ench M GS Aleutian Tr
Haw aiia n Ri dge
Hawaii
are high-alumina basalt (Al2O3 > 16.0%), andesite, dacite, and rhyolite, and their plutonic equivalents gabbro, diorite, granodiorite, and granite. However, the proportions of these rocks vary considerably depending on whether continental plates are involved in the convergence. Island-arc volcanoes produced at the convergence of oceanic plates are composed predominantly of high-alumina basalt, basaltic andesite, and andesite, with only minor amounts of more felsic rocks. When a continental plate is involved, the proportion of felsic rocks increases. This variation in the proportion of rock types is well documented along convergent boundaries that change from ocean – ocean convergence to ocean – continent convergence along their length, such as the Aleutians passing into Alaska at their eastern end (Fig. 9.41). Along the western half of the Aleutian arc where oceanic plates converge, basalts and andesites predominate, but toward the eastern end where oceanic plate converges with continental plate, larger quantities of felsic rocks occur. For example, the 1912 eruption near Katmai (K in Fig. 9.41(A)) produced 7 km3 of rhyolitic pumice, the world’s largest eruption of the twentieth century (Fig. 9.21(B)). As magma rises through thicker and thicker sections of continental crust, the proportion of felsic rocks increases. This implies that the felsic magmas are derived largely from the melting of crustal rocks, a conclusion supported by isotopic studies. Volcanoes continue to form as a subducting plate goes deeper than 100 km, but with diminishing size and frequency. One feature found worldwide is that as the Benioff zone deepens, magmas become progressively more potassium rich. The
Figure 9.41 (A) The 2500 km-long Aleutian volcanic arc, formed by subduction of the Pacific plate beneath the North American plate. Volcanoes shown are Katmai (K), Moffett (M), and Great Sitkin (GS). The Hawaiian Hot Spot track follows the Hawaiian Ridge and Emperor Seamount Chain. (Image from Planetary Visions Ltd./ Science Photo Library.) (B) View looking east from Moffett volcano toward Great Sitkin, which is 45 km away. (Photograph courtesy of Bruce Marsh.)
increase might relate to mica playing a more significant role at greater depth or to the magma’s ability to scavenge potassium from the rocks through which it passes on route to the surface. When a back-arc basin develops, the lithosphere is thinned, and decompression melting may occur in the ascending asthenosphere beneath the basin (Fig. 9.40). If the scale of melting is small, alkaline magmas form, but if the extension leads to rifting and the generation of new ocean floor, the increased degree of melting leads to the eruption of tholeiitic MORBs. Calcalkaline volcanic rocks
The earliest rock erupted in volcanic arcs is subalkaline basalt that tends to have higher alumina (>16 weight %) than do tholeiitic flood basalts of LIPs, which typically contain about 15% Al2O3. They are, therefore, called high-alumina basalt. A complete gradation exists from high-alumina basalt to andesitic basalt and then basaltic andesite to andesite. The basaltic members of this series form a major component of the calcalkaline series of island arcs but are less abundant on continental arcs, or if they are initially abundant, later, more siliceous, lavas obscure them. The typical high-alumina basalt contains abundant plagioclase phenocrysts, which can be as calcic as An90 and account for the rock’s high alumina content. These phenocrysts typically show complex zoning patterns and commonly contain zones of melt inclusions, which are trapped during periods of rapid crystal growth (Fig. 9.42(A)–(B)). These features are consistent with repeated fluctuations in magma temperature, which probably result from surges of magma entering and
9.4 Igneous rocks and their plate tectonic setting
Pl
Ol
(A)
(B)
1 mm 1 mm Pgt Opx
Pl
Aug
(C)
(D)
Figure 9.42 (A) and (B) Photomicrographs of a thin section of vesicular porphyritic high-alumina basalt from Mount Fuji, Japan, under plane and crossed polarized light, respectively. Phenocrysts of olivine (Ol) and plagioclase (Pl), occur in a brown glassy matrix containing small crystals of plagioclase, pyroxene and magnetite. (C) and (D) Photomicrographs of a thin section of vesicular porphyritic andesite from the Hakone Volcano, Japan, under plane and crossed polarized light, respectively. Phenocrysts of plagioclase (Pl), augite (Aug), orthopyroxene (Opx), and magnetite (opaque) occur in a groundmass of small crystals of plagioclase, pyroxene, magnetite, and brown glass. The orthopyroxene phenocrysts are rimmed by highly birefringent pigeonite (Pgt).
mixing with older magma in chambers beneath the volcanoes. The main mafic phenocryst is olivine, but augite and magnetite may also occur. The groundmass contains augite as well as pigeonite, magnetite, feldspar, and residual siliceous glass. Andesite is the most abundant volcanic rock of the calcalkali series (Fig. 9.42(C)–(D)). Most andesite is strongly porphyritic, with abundant plagioclase phenocrysts, which show both normal and oscillatory zoning. They contain many glassy melt inclusions, which are trapped in zones when the crystals grew rapidly. Plagioclase phenocrysts commonly show evidence of having been melted along cleavage planes to produce what is called a sieve texture. Although the average plagioclase composition in andesites is andesine (An50–30), the cores of some crystals can be much more calcic. Olivine phenocrysts may be present, but they are typically replaced by orthopyroxene, which may have olivine inclusions in its core. Orthopyroxene phenocrysts, in turn, are rimmed by pigeonite (Fig. 9.42(C)– (D)). Augite and magnetite also form phenocrysts. The groundmass of andesites is commonly glassy, which indicates
its high silica content. Many andesites contain as much as 50% phenocrysts, which approaches the limit that allows magma to move. Complex phenocryst assemblages, zoning patterns, and sieve texture indicate that magma mixing has played an important role in the generation of andesites. Magmas more silica rich than andesite erupt to form progressively more glassy rocks. Dacite and rhyolite, for example, commonly form the glassy rock known as obsidian (Figs. 9.19 and 9.43(A)). Most obsidian exhibits layering, which is produced by concentrations of extremely small crystals that are barely visible, even under the microscope. In Figure 9.43(B), layering in the Glass Mountain obsidian flow from the Medicine Lake Highlands of California can be seen in a thin section to produce slightly darker bands in a clear glassy host. Small laths of feldspar have been rotated into parallelism with this flow layering, thus giving the rock a trachytic texture. The layers wrap around the phenocryst of sanidine. Close inspection of the sanidine phenocryst reveals that it is surrounded by a rim of brown glass, which, because of its color, must be richer in iron than the clear glass in
277
278
Igneous rocks
(B)
(A)
1 mm
(C)
1 cm
Figure 9.43 (A) Hand specimen of layered obsidian from Glass Mountain, Medicine Lake Highlands, California (see Fig. 8.21), showing conchoidal fracture. White crystals are sanidine phenocrysts. Photomicrographs of a thin section of this obsidian under plane (B) and partially crossed (C) polarized light. Layering is due to concentrations of minute crystals of pyroxene in clear glass.
the rest of the sample. Compositionally different glasses in many obsidians indicate magma mixing. It is likely that the intrusion of basalt into a rhyolitic magma chamber provides the influx of thermal energy necessary to trigger eruption of the obsidian. In this respect, obsidians share the same feature that characterizes most plutonic bodies of granite; that is, the ubiquitous presence of basaltic inclusions (see Sec. 9.2.2 and Fig. 9.10). As rocks become more siliceous, increasingly larger proportions of them erupt as either ash falls or ash flows. The rocks formed from these deposits are known as tuffs. The differences between the ash-fall and ash-flow tuffs were discussed in Section 9.2.3 and illustrated in Figure 9.23. As calcalkaline rocks become more potassium rich with increasing depth to the Benioff zone, potassium feldspar becomes more abundant and biotite appears. At the basic end of the series, biotite-bearing lamprophyres may be present. In intermediate andesitic compositions, phenocrysts may include biotite and hornblende in addition to plagioclase, augite, and magnetite. At the felsic end, extremely potassium-rich volcanic rocks may contain phenocrysts of leucite, as at Vesuvius.
Calcalkaline plutonic rocks
Erosion of volcanic arcs on continental plates exposes the underlying stocks and batholiths, which contain the plutonic equivalents of the overlying volcanic rocks. This includes the typical calcalkaline suite of rocks, ranging from diorite through granodiorite to granite. A complete compositional gradient exists between the most mafic and most felsic members. In the Sierra Nevada (California) and Idaho batholiths, for example, rocks vary from predominantly diorite on the western side through granodiorite to mainly granite on the eastern side (Fig. 9.44). This variation most likely reflects the type of rocks through which the magmas rose and the amount of felsic material assimilated. We describe here a few of the main rock types. The most mafic rocks are typically gabbro and diorite, the distinction between which is based on whether the plagioclase is more or less calcic, respectively, than An50. However, many diorites whose average plagioclase is less than An50 contain phenocrysts whose cores are extremely anorthite rich. This distinction is, therefore, sometimes difficult to apply, unless you have a chemical analysis and CIPW norm. Diorite tends to be more
9.4 Igneous rocks and their plate tectonic setting
Opx
(A)
Aug Hbl
Pl
1 cm 1 mm
Qz
Ttn
Hbl
(B)
Hbl Qz Pl
Or 1 mm
1 cm Bt
Qz
Pl
(C)
Mc Qz 1 cm
Or 1 mm
Pl
Figure 9.44 Hand specimens and photomicrographs of thin sections under crossed polars of diorite (A), granodiorite (B), and granite (C) from the Sierra Nevada batholith, California (plagioclase (Pl), orthoclase (Or), microcline (Mc), quartz (Qz), orthopyroxene (Opx), augite (Aug), hornblende (Hbl), biotite (Bt), and titanite (Ttn)).
plagioclase rich than gabbro and is, therefore, a lighter color (Fig. 9.44(A)). Plagioclase crystals in diorite have complex zoning patterns, such as that shown at the bottom of the photomicrograph in Figure 9.44(A). The zoning records a long history of magma recharge and mixing. The main mafic minerals in diorite are olivine, orthopyroxene, and augite. Olivine reacts with magma at an early stage to form orthopyroxene, which is, therefore, more common than olivine in diorite. In many diorites, late-stage liquid reacts with the earlier crystallizing pyroxene to form rims of hornblende. Quartz and biotite crystallize from the residual liquid to fill interstices between the earlier-formed minerals. Accessory minerals include titanite and apatite. The most abundant member of the calcalkaline series is granodiorite. For example, it is the major rock type in the Sierra Nevada batholith of California (Fig. 9.44(B)). This rock contains both zoned plagioclase (An50–25) and orthoclase, which are easily distinguished in thin sections but may require a hand lens to identify in a hand specimen. The plagioclase
crystals tend to be euhedral and are surrounded by orthoclase and quartz. Orthoclase, therefore, crystallizes later than plagioclase, which is the normal sequence in these rocks, but is different from the sequence in rapakivi granite, where the plagioclase rims the orthoclase (Fig. 2.13). Pleochroic green hornblende is usually the most abundant mafic mineral in granodiorite, but in potassium-rich varieties, biotite is a major mafic mineral. Several percent of titanite, with its characteristic highly birefringent wedge-shaped crystals, can be present (Fig. 9.44(B)), which indicates the relatively high titanium content of the rocks. Apatite and magnetite are common accessories. Granite forms the felsic end member of the calcalkaline series and is, therefore, the lightest colored. The feldspar and quartz grains tend to be of the same size. Some feldspar grains, especially plagioclase, if present, develop crystal faces, but other grains are anhedral. The feldspar is rich in the alkali components and can be present as single alkali feldspar
279
280
Igneous rocks
crystals in hypersolvus granite or as separate potassium-rich (orthoclase or microcline) and sodium-rich (albite) crystals in subsolvus granite (Sec. 8.3.5 and Fig. 8.11). In the example shown in Figure 9.44(C) from the Sierra Nevada batholith, two separate feldspars are present, a subhedral zoned albiterich plagioclase and an anhedral microcline. Biotite is the main mafic mineral, but hornblende can also be present. Accessories include apatite, magnetite, and zircon.
9.5 Special Precambrian associations Geology, as a modern science, began when James Hutton (1726–1797) broke with eighteenth-century ideas on the origin of rocks through catastrophic processes and introduced the uniformitarian approach, which interpreted rocks as having formed through the same processes operating today but acting over extended periods of time. The uniformitarian approach, “the present is the key to the past,” formed the main principle expounded in Sir Charles Lyell’s (1797–1875) Principles of Geology, the first geology textbook. The principle of uniformitarianism has served us well in unraveling the geologic record. However, in the last three sections of this chapter, we deal with
(A)
rocks that appear to be at odds with this principle. We discuss rocks that were formed only in the Precambrian or were formed through truly catastrophic processes. These are komatiites, which formed only during the Archean; anorthosites, which formed only during the Proterozoic; and impact rocks produced by catastrophic meteorite impacts.
9.5.1 Komatiites In Section 9.3.2, we saw that most plutonic igneous rocks have volcanic equivalents, but ultramafic rocks (i.e., >90% mafics) do not. This has a simple explanation. Most ultramafic rocks never existed as a liquid; instead, they form by the accumulation of mafic minerals from less mafic magma. For example, in the Kilauea Iki lava lake, olivine crystals sank to produce an olivine-rich rock in the lower part of the lake (Fig. 8.26(C)). No rapidly quenched glassy lava having the composition of the olivine-rich rock is found in Hawaii. We can melt the olivine-rich rock in the laboratory, but this requires temperatures well above 1200°C, typically the highest temperature recorded during volcanic eruptions. We conclude, therefore, that ultramafic rocks are cumulates, formed typically from basaltic magma, and they have never existed as liquids.
(B)
1 mm
(C)
1 mm Figure 9.45 (A) Long blades of olivine formed by rapid crystallization in the top of a komatiite lava flow, Monroe Township, Ontario. (B) Photomicrograph of a thin section of komatiite in (A) showing skeletal crystals of olivine under crossed polars. (C) Skeletal crystals of olivine in Roman slag produced during smelting of copper ore at Skouriotissa, Cyprus (Fig. 9.32(E)).
9.5 Special Precambrian associations
accumulated near the base of the flow to form massive concentrations of nickel, copper, and PGE sulfide ore.
9.5.2 Massif-type anorthosites The IUGS classifies rocks containing more than 90% plagioclase as anorthosite (Fig. 9.27). Anorthosite occurs as layers in large lopolithic intrusions, such as the Bushveld Complex of South Africa (Fig. 9.8), but it also forms huge intrusive bodies of batholithic proportions, which are referred to as massiftype anorthosites. It also forms a large part of the lunar highlands (the light-colored areas on the moon, in contrast to the dark areas, or maria, which are underlain by basaltic rock). Most plagioclase in anorthosite layers in lopoliths is more calcic than An70, as are lunar anorthosites, whereas that in massiftype anorthosites is between An65 and An40. Another feature of massif-type anorthosites is that they formed only in the Proterozoic between 1.45 billion and 0.9 billion years ago. In this section, we discuss massif-type anorthosites. Massif-type anorthosites form large diapiric bodies of lowdensity rock that have risen in Proterozoic terranes through denser high-temperature, high-pressure metamorphic rocks. The most prominent belt of these massifs extends northeastward from the Adirondack Mountains in New York State, through the Grenville and Nain geological provinces of the Canadian Shield to the coast of Labrador (Fig. 9.46). If we
Meteorite impact structure Paleozoic rocks Anorthosite massif
Hudson Bay
Grenville Province Nain Province Churchill Province Superior Province
gh rou or T rad Lab
CL
Nain
M
S
le vil en Gr Ot taw aR .
nt Fro Lake St. John
rence Riv e Law St.
r
Komatiites are an exception. These remarkable rocks, which were first described in detail from the Komati River in South Africa, are ultramafic lavas. They have been found worldwide but are restricted almost entirely to Archean greenstone belts, where they occur along with normal tholeiitic basalt. Komatiites contain more than 18% MgO, but many have as much as 33% MgO. Basaltic lava, by contrast, rarely contains more than 10% MgO. Basaltic lava can contain exceptionally high contents of olivine phenocrysts, which can elevate its MgO. These are known as picrites. In thin sections, they resemble the rock from the lower part of the Kilauea Iki lava lake (Fig. 8.26(C)). The olivine crystals are euhedral and clearly had time to grow to a large size and accumulate in a groundmass that quenches to normal basalt. In contrast, the upper rapidly quenched part of komatiite lava flows has no euhedral olivine crystals. Instead, olivine forms long thin needles or blades up to a meter in length that radiate downward in clusters from the upper surface of the flow (Fig. 9.45(A)). Because these splays resemble tufts of the Australian grass known as spinifex, they form what is known as the spinifex texture. In thin sections, this olivine is seen to form skeletal dendritic crystals (Fig. 9.45(B)), which is the typical morphology of crystals that grow rapidly from a liquid. Compare their shape with those that must have grown in only seconds in slag formed when the Romans smelted Cypriot copper ore (Fig. 9.45(C)). Although regularly shaped olivine crystals are found in the lower part of komatiite flows where cooling was slower, the thin quench crystals in the upper part of the flow are what show that these magnesium-rich lavas existed as liquids. Melting experiments at one atmosphere indicate that komatiites become liquid around 1650°C (basaltic lava becomes liquid about 1200°C). Such high temperatures imply that the Archean geotherm must have been higher than in later times, which is consistent with a cooling Earth. As the pressure on mantle peridotite is increased, the first-formed melts become progressively more magnesium rich, reaching greater than 30% MgO at 7 GPa, which corresponds to a depth of 200 km. It is concluded, therefore, that komatiite magmas formed at depths greater than 150 km and basaltic magmas form at depths less than 100 km. Komatiites are of economic importance because of associated sulfide ore deposits of nickel, copper, and platinum group elements (PGE), such as those at Kambalda, Western Australia. These deposits occur at the base of komatiite flows, where the high-temperature lava appears to have thermally eroded a channel in the underlying sedimentary rocks. Whether komatiite assimilated sulfur from sulfide-bearing sediments or derived it from other sources, they became so rich in sulfur that an immiscible sulfide liquid formed, into which the nickel, copper, and PGE partitioned (Sec. 8.7.6). Because the immiscible sulfide liquid was denser than the silicate liquid, it sank and
Gulf of St. Lawrence
C
Morin h lac pa Ap
Adirondacks
s ian
Atlantic Ocean
Figure 9.46 Map of northeastern North America showing distribution of Proterozoic anorthosite massifs. Also shown are four large meteorite impact structures: Manicouagan (M), Charlevoix (C), Sudbury (S), and Clearwater Lakes (CL).
281
282
Igneous rocks
(C)
(A)
(B) Figure 9.47 (A) Large single meter-size crystal of labradorescent plagioclase from Nain, Labrador (for location, see Fig. 9.46). (B) Single crystal of orthopyroxene showing kink bands from the Lake St. John anorthosite massif, Quebec. (C) Ophitic intergrowth of decimeter-long plagioclase laths in a single crystal of pyroxene (dark) from the Lake St. John massif.
reassemble Pangaea, this belt continues through southern Greenland into Scandinavia, and to the west, it probably extends beneath the younger sedimentary rocks of the central United States to reappear in Wyoming. Other belts can be traced through Pangaea, such as the one from India through Madagascar to South Africa. One of the most striking features of massif-type anorthosites is their coarse grain size. At the type locality for the mineral labradorite at Nain, Labrador (Fig. 9.46), plagioclase crystals are up to a meter in diameter (Fig. 9.47(A)). The main mafic mineral in anorthosites is orthopyroxene, which can form decimeter-size crystals (Fig. 9.47(B)). Where plagioclase and pyroxene are intergrown, they form an ophitic intergrowth, which resembles that seen in diabase (Fig. 9.36(D)), but the grain size, instead of being millimeters, is decimeters (Fig. 9.47(C)). These coarse grain sizes characterize the primary igneous rock in the core of the massifs. Toward the margins these rocks are deformed and recrystallized to finer-grain size. Recrystallization also changes the color of
anorthosite from dark to light as a result of the expulsion of minute exsolved grains of magnetite, ilmenite, and hematite. Whiteface Mountain in the Adirondack Mountains of New York State, for example, is made of recrystallized anorthosite. Also found in the recrystallized margins of many massifs are intrusive bodies of rock composed largely of ilmenite. These rocks, and their weathering products, provide the world’s main source of titanium ore. Another remarkable feature of anorthosite massifs is the limited compositional range of plagioclase in any one body. Plagioclase rarely changes by more than a few percent anorthite across an entire massif, but each massif can be characterized by a different plagioclase composition. The Nain anorthosite on the coast of Labrador, for example, is a labradorite anorthosite, whereas the Morin anorthosite north of Montreal (Fig. 9.46) is an andesine anorthosite. In thin sections, crystals lack zoning, which is in striking contrast to the complex zoning seen in plagioclase crystals in diorites (Fig. 9.44(A)). The large plagioclase crystal in Figure 9.47(A) exhibits iridescence (Secs. 3.3.1 and
9.5 Special Precambrian associations
7.5) in shades of green to blue, which indicates that its anorthite content is 55 ±0.04%, a remarkably constant composition for such a large crystal. The lack of zoning in the plagioclase crystals is difficult to explain given the nature of the plagioclase phase diagram (Fig. 8.10(A)) and the common occurrence of zoning in other slowly cooled intrusive rocks such as diorites (Fig. 9.44(A)). Homogenizing a crystal as large as the one shown in Figure 9.47(A) would take more than all of geologic time, given the low diffusion rates in plagioclase. We can conclude only that these crystals must have grown initially with a constant composition. Why crystals would not show some compositional variation across a huge massif remains a puzzle. There are no lavas of anorthosite composition, so we must conclude that the plagioclase in anorthosites is a cumulus mineral. Unfortunately, we do not know the composition of the magma from which they crystallized. If it was basaltic, where are all the mafic minerals that must also have crystallized? Gravity surveys indicate that no large bodies of mafic rock underlie anorthosite massifs, so this mafic fraction would have to have been left behind at considerable depth. However, anorthosites cannot have been formed at too great a depth, because plagioclase is not stable at high pressure. The magma may have been closer to granodiorite in composition, which would explain the common occurrence of quartz monzonite and granite capping anorthosite massifs. Although the contact of these rocks with anorthosite is gradational, isotopic studies show that a large part of these more quartz-rich rocks formed by partial melting of the surrounding metamorphic rocks and did not form by differentiation of the magma from which the anorthosite crystallized. Finally, there remains the problem of why massif anorthosites formed only between 1.4 billion and 0.9 billion years ago. The origin of anorthosites remains one of the biggest unsolved problems in geology, and it is unlikely that evidence from the “present” will provide “the key to the past.” The conditions and processes must have evolved as the Earth has aged.
9.5.3 Rocks associated with large meteorite impacts One of the most dramatic events in the history of life on our planet was the extinction of dinosaurs at the end of the Cretaceous Period (66 Ma). Although many other species disappeared at this time, the extinction of dinosaurs is what has captured the popular imagination. How could gigantic beasts such as Tyrannosaurus rex suddenly become extinct? The discovery of an anomalously high concentration of the rare element iridium on the Cretaceous-Tertiary boundary (K-T boundary), led Luis and Walter Alvarez to postulate that the extinction resulted from a large meteorite impact. Meteorites are known to contain elevated concentrations of iridium, an element that on Earth sank to the core early in the planet’s history. Correlating the extinction with this catastrophic event added to the popu-
(A)
(B)
(C)
Figure 9.48 (A) Meteor Crater, Arizona. (Photograph courtesy of U.S. Geological Survey.) (B) Hypothetical cross-section of a meteorite crater, with relative dimensions based on the meteorite being a stony variety with a density of 3500 kg/m3 traveling at 20 km/s. (C) Shatter cones in fine-grained Ordovician limestone at Charlevoix, Quebec (C in Fig. 9.46).
lar mystique surrounding dinosaurs. At first, no appropriately aged meteorite impact structure was known, but eventually the smoking gun was found at Chicxulub on the northern tip of Mexico’s Yucatán Peninsula. Unfortunately, younger sedimentary rocks cover this 100 km-diameter impact structure, and its presence can be demonstrated only through geophysical surveys and samples recovered from oil-exploration drill holes. Its lack of exposure is disappointing considering the dramatic
283
284
Igneous rocks (A)
(B) Chelmsford sandstone Onwatin slate Granophyre Norite Onaping tuff Sudbury breccia Older rocks
N
nt Fro le l i v en Gr
10 km
Direction of shock wave based on shatter cones
(C)
(D)
artz
f qu
is o c ax
1 mm
0.1 mm
Figure 9.49 (A) Generalized geological map of the Sudbury lopolith and meteorite impact structure, Ontario (S in Fig. 9.46). (B) Sudbury impact breccia. (C) Photomicrograph of a thin section of Onaping tuff under plane light, showing small glassy fragments of impacted rock that were flash melted. (D) Quartz grains in Onaping tuff, showing shock-induced planar features.
effect it had on life on the planet. However, numerous other impact structures of similar size are well exposed on land and provide samples of rocks that allow us to gauge the magnitude of such a catastrophic event. Most large meteorite impacts are preserved on Precambrian cratons. Impacts that occur in younger orogenic belts are destroyed by deformation. It is appropriate, therefore, to discuss rocks formed by meteorite impact in this section dealing with Precambrian associations, even though impact-generated rocks are not necessarily confined to the Precambrian period. Small meteorites enter the Earth’s atmosphere every day and burn up as shooting stars. Occasionally, some are large enough to survive this fiery transit and produce small impact craters on reaching the surface. More rarely, larger meteorites, which are not slowed perceptibly by their passage through the atmosphere, impact the Earth with the velocity they had in space, about 20 km/ second. The kinetic energy of a meteorite only a meter or two in diameter traveling at this velocity is enormous (kinetic energy = 1 /2 mass × velocity2) and is sufficient to completely evaporate the
meteorite. This is why you will never see a meteorite larger than a meter or two in diameter in museums. On impacting the Earth, a meteorite’s velocity suddenly drops to zero, and its kinetic energy is converted to heat and shock waves, which produce an explosion crater and evaporate the meteorite (Fig. 9.48). We have learned much about explosion craters from underground nuclear tests, which generate similar amounts of energy (Fig. 9.48(B)). The depth of an explosion crater is approximately one-tenth its diameter. The crater is surrounded by a blanket of ejecta, with the size of particles decreasing rapidly away from the crater. Rocks in the crater rim may actually be turned upside down from the force of the explosion, as seen in the rim of Meteor Crater in Arizona (Fig. 9.48(A)). Upon impact, about 20% of the kinetic energy of a meteorite is converted to heat, which evaporates the meteorite and melts the impacted rock. Particles of melt may be ejected into space by the explosion to later fall back to Earth as tektites, small centimeter-scale glassy droplets whose surfaces indicate the effects of frictional heating and ablation during reentry through the
Summary
atmosphere. Beneath the melt zone, rock is totally crushed to a depth of approximately one-third the crater diameter. Beneath this, rock is intensely fractured to a depth of two-thirds the crater diameter. A characteristic type of fracture that is unique to meteorite impact sites is known as shatter cones because of the conical sets of fractures that develop with their apex pointing in the direction from which the shock wave came (Fig. 9.48(C)). Meteor Crater in Arizona (Fig. 9.48(A)) is the world’s bestpreserved impact structure. It has suffered little erosion since its formation 49 000 years ago. With a diameter of only 1.2 km, however, it is extremely small compared with older impact structures that might correlate with mass extinctions. Erosion, however, has removed most of the upper part of these older craters, and all that remains is their lower part, whose diameter may be only a third of the original crater diameter. For example, the 100 km-diameter structure at Chicxulub, with which dinosaur extinction has been associated, may originally have had a diameter of 300 km, which would dwarf the crater in Arizona. We illustrate the rocks formed during these cataclysmic events by discussing the impact structure at Sudbury, Ontario, which is of particular interest because it is associated with the world’s largest nickel deposit. The impact occurred 1.85 billion years ago, leaving a circular structure that was later deformed into an ellipse (Fig. 9.49(A)) during the Grenville orogeny, which occurred just to the south of the structure (S in Fig. 9.46). Shock waves from the impact created shatter cones that are generally radial and point back toward the center of the explosion, except in a few places where rocks have been overturned. The transient shock wave also formed irregular veins of breccia, which contain fragments of country rock up to meters in diameter in a matrix of smaller fragments and a black aphanitic rock formed by flash melting (Fig. 9.49(B)).
Following the impact, ejecta from the explosion were deposited back into the crater to form what was originally mistakenly mapped as a volcanic rock, the Onaping tuff. Thin sections of this rock (Fig. 9.49(C)) reveal that it contains many rock fragments, most of which have been melted and then quenched to a glass that has subsequently devitrified to extremely fine feathery crystals. It also contains quartz grains that contain closely spaced planar features produced by the passage of the shock wave. These are made visible by minute inclusions on the planes or by differences in refractive index or crystallographic orientation (Fig. 9.49(D)). The tuff also contains microscopic diamonds, which formed during the passage of the shock wave, where pressures would have momentarily exceeded 103 GPa, which is well into the diamond stability field. We do not know the diameter of the original Sudbury crater, but it was probably on the order of 200 km. Rocks would, therefore, have been fractured all the way to the base of the crust, which likely triggered melting through decompression to produce magma that may have been as hot as 2000°C. This melt then differentiated to produce a lower mafic part (norite) and an upper felsic part (granophyre), which intruded into the Onaping tuff (Fig. 9.49(A)). An immiscible sulfide melt also formed, probably from crustal rocks, and this dense liquid sank and accumulated along the base of the lopolith to form the nickel ore bodies. Many other large meteorite impact structures have been found worldwide. Three additional ones, Manicouagan (Fig. 17.9), Charlevoix, and Clearwater Lakes, are seen in the area covered by the map in Figure 9.46. Although an iridium anomaly was first identified on the K-T boundary, others have subsequently been found at other boundaries marked by mass extinctions. It is likely, therefore, that catastrophic meteorite impacts have played an important role at many times during the evolution of life on our planet.
Summary This chapter first dealt with where intrusive and extrusive rocks are formed. We then saw that igneous rocks are classified on the basis of their mineralogy. We learned that groups of rocks form common associations that are characteristic of the plate tectonic setting in which they form. Finally, we discussed two rock types that were formed only in the Precambrian and rocks that were formed by large meteorite impacts. The following list presents the main points in this chapter:
• Igneous rocks are classified as extrusive or intrusive, with the latter being subdivided into plutonic (formed at great depth) and hypabyssal (formed near surface). Generally, extrusive and hypabyssal rocks are fine grained or glassy, whereas plutonic rocks are coarse grained.
• Magma rises buoyantly and pushes aside the intruded rock to form bodies ranging from narrow sheets to large batholiths. • Extrusion of magma produces a variety of volcanic rocks, ranging from lava flows to volcanic ash, depending on how explosive the eruption is. As the silica content of magma increases from basalt (∼50%) to rhyolite (73%), viscosity increases, which makes it more difficult for gas bubbles to escape from the magma and increases the likelihood of explosive eruptions.
• The largest eruptions are from long fissures to form flood basalts. Magma extruded from a central vent forms gently sloping basaltic shield volcanoes, steep-sided andesitic composite cones, and rhyolitic domes.
• Collapse of the roof of a batholith produces a caldera with expulsion of magma commonly as ash flows that become welded during solidification.
285
286
Igneous rocks
• The International Union of Geological Sciences (IUGS) classifies igneous rocks on the basis of their mineral content (mode). • Rocks fall into three main series that have distinct plate tectonic settings: tholeiitic rocks are associated with divergent plate boundaries; calcalkaline rocks, with convergent plate boundaries; and alkaline rocks, with continental rift valleys and late stages of volcanism on oceanic islands.
• The largest production of igneous rocks occurs at midocean ridges, where tholeiitic midocean ridge basalt (MORB) is erupted. Where ocean crust has been obducted onto continents (ophiolite suites), MORBs are underlain by sheeted dike complexes, layered gabbro, and serpentinized ultramafic rocks.
• Ocean-floor rocks are hydrothermally altered by circulating ocean water that cools them when they are formed at midocean ridges. Economic mineral deposits of iron, copper, and zinc sulfides, chromite, and asbestos are found with these rocks.
• Oceanic islands formed over hot spots are mostly tholeiitic, but as they move off the hot spot, they are commonly capped by alkaline rocks.
• At numerous times during Earth’s history, huge eruptions of tholeiitic flood basalt have occurred over extensive areas to form large igneous provinces (LIPs).
• At convergent plate boundaries, a volcanic arc forms as soon as the subducting plate sinks to ~100 km, as long as the subduction angle is greater than 25°. Water released at this depth from the hydrothermally altered ocean-floor rocks acts as a flux to cause melting in the overlying mantle wedge.
• Igneous rocks formed above subducting plates include high-alumina basalt, andesite, dacite, and rhyolite, as well as their plutonic equivalents gabbro, diorite, granodiorite, and granite. The felsic rocks are more abundant where convergence involves a continental plate. Calcalkaline rocks have slowly built the continents over geologic time.
• Two igneous rock types are exclusively of Precambrian age, the ultramafic lava komatiite, and large massif anorthosites (An65–40). • Large meteorite impact structures contain rocks that bear testament to huge explosions that appear to have played an important role in the evolution of life on the planet.
Review questions 1. How do intrusive igneous bodies make room for themselves? 2. From the crosscutting relations in Figure 9.2, deduce the chronology of intrusive events seen in this outcrop. 3. How do magma density and viscosity affect the shape of intrusive bodies? 4. Contrast the eruptive styles of Hawaiian, Strombolian, Vulcanian, Plinian, and Peléan volcanoes. 5. How does magma viscosity affect the shape of volcanoes? 6. What is the difference between a mode and a norm? 7. Using the normative compositions of rocks in Table 9.1, plot each rock in Figure 9.25 and determine whether it has been
correctly named according to the IUGS classification of igneous rocks. 8. What name would you give to a rock composed of 50% olivine, 25% orthopyroxene, and 25% clinopyroxene? Much of the
Earth’s upper mantle is thought to have this composition. 9. What are the main rocks in an ophiolite suite, and how are they formed? 10. Why are igneous rocks at midocean ridges so altered to hydrous minerals? 11. How are sulfide ore deposits formed near midocean ridges? 12. Why are so many oceanic islands generated over hot spots capped with alkaline rocks, even though the main volcano-
building period erupts tholeiitic rocks? 13. What is a large igneous province, and what rock type characterizes such regions?
Review questions
14. What is inverted pigeonite, and how does it form? 15. What are some titanium-bearing minerals that form in alkaline rocks as a result of their high titanium content? 16. What is kimberlite, and why is it of economic interest? 17. What is carbonatite, and what economic mineral deposits are associated with it? 18. What are the main calcalkaline rocks erupted in the volcanic arc above subduction zones, and what are their plutonic equivalents? 19. What difference is there between volcanic rocks erupted on island arcs involving convergent oceanic plates and volcanic
arcs developed on continental plates, and what is the likely cause of the difference? 20. What can you conclude about the history of an andesite (or diorite) from the complex zoning patterns in its plagioclase
phenocrysts? 21. What importance is attached to the ubiquitous occurrence of basaltic inclusions in rhyolite and granite? 22. What is a komatiite, and what textural evidence shows that it was derived from an olivine-rich liquid? 23. What distinguishes plagioclase in massif-type anorthosites from plagioclase in most other plutonic rocks?
ONLINE RESOURCES The National Institutes of Health’s ImageJ software program can be downloaded for free from http://rsb.info.nih.gov/ ij. This is a very useful program for doing a variety of measurements on digital images of photomicrographs. It can be used for measuring grain size and orientation and the modal abundance of minerals that have distinctive gray-scale values. The CIPW norm calculation found on the U.S. Geological Survey’s Volcano Hazards Program site (http:// volcanoes.usgs.gov/yvo/aboutus/jlowenstern/other/ software_jbl.html) gives reliable results, whereas many others on the Web do not. NASA’s Moderate Resolution Imaging Spectroradiometers (MODIS), carried on the Earth Observing System (EOS) satellites, surveys the entire surface of the planet every 48 hours at a resolution of 1 km/pixel and indicates regions of elevated temperature, such as new volcanic eruptions and forest fires. This near-real-time satellite coverage is available at http://modis.higp.hawaii.edu.
FURTHER READING Christiansen, R. L. (1979). Cooling units and composite sheets in relation to caldera structure. In Ash Flow Tuffs,
ed. C. E. Chapin and W. E. Elston, Geological Society of America Special Paper, 180, 29–42. de Boer, J. Z., and Sanders, D. T., 2002. Volcanoes in Human History, Princeton University Press, Princeton, NJ. This entertaining and instructive book discusses nine major historic volcanic eruptions and the effects they had on humans, both positive and negative. Irvine, T. N., and Baragar, W.R.A. (1971). A guide to the chemical classification of the common volcanic rocks. Canadian Journal of Earth Science, 8, 523–548. Le Maitre, R. W. (1976). The chemical variability of some common igneous rocks. Journal of Petrology, 17, 589–598. This paper presents the average compositions of common igneous rock types based on 26,373 analyses. MacKenzie, W. S., Donaldson, C. H., and Guilford, C. (1982). Atlas of Igneous Rocks and Their Textures, Longman Group Ltd., Harlow, Essex, UK. This book contains beautiful colored illustrations of igneous rocks and their textures as seen under the microscope. Wager, L. R., and Brown, G. M. (1967). Layered Igneous Rocks, Oliver & Boyd, Edinburgh. This book gives a survey of all major layered igneous intrusions in the world.
287
CHAPTER
10
Sedimentary rock-forming minerals and materials
This chapter presents the systematic descriptions of uniquely sedimentary rock-forming minerals and materials. These are mainly the newly formed minerals that result from interactions of preexisting minerals with the atmosphere or precipitation from the oceans. Detrital minerals such as quartz, feldspar, and the micas, which were discussed in Chapter 7, are the major constituents of sedimentary rocks such as sandstones, arkoses, and graywackes. By studying hand specimens of these minerals in the laboratory while referring to the appropriate specimen descriptions in this chapter, you will further develop your mineral identification skills.
A deep gorge showing cliffs of well-banded, brown (oxidized) Precambrian iron-formations in the Hamersley Range of Western Australia. These consist mainly of finely banded chert-magnetite-hematite and are the result of widespread deposition of iron-rich chemical sediments during a long time span in the Precambrian when the atmosphere-ocean system was essentially anoxic. This iron-rich formation is the host to many vast open pit mines in northwestern Western Australia producing enormous amounts of iron ore for the steel industry worldwide (see Fig. 16.7).
Sedimentary rock-forming minerals and materials
In the prior three chapters (Chapters 7–9), we addressed many aspects of minerals and rocks of igneous origin. They are the result of crystallization from a liquid magma over a wide range of high temperatures (∼1400 to 600°C) in an environment in which oxygen gas (O2) is nonexistent and in which H2O is generally a minor constituent. This chapter deals with minerals that (1) are newly formed as a result of chemical reactions (under atmospheric conditions) that slowly destroy earlier minerals (e.g., feldspars) and recombine various ions in solution in water to form clay minerals, and oxides or hydroxides, and (2) those that are chemical precipitates in depositional basins such as carbonates, evaporite minerals, and Precambrian iron-formations. However, we must also mention those minerals that have survived the physical and chemical weathering processes while exposed to the atmosphere; these are known as detrital minerals. We systematically treat 13 sedimentary rock-forming minerals. These include ice, the solid form of H2O; a hydroxide; a clay mineral (representative of the large clay mineral group); two polymorphs of CaCO3; four more carbonates; two halides; and two sulfates. Clearly, this group of common sedimentary minerals is totally different from the igneous rock-forming minerals discussed in Chapter 7. We close with discussions of three sedimentary materials: chert and agate, phosphorite, and soil.
10.1 The interaction of the Earth’s atmosphere with minerals The Earth’s atmosphere is composed mainly of nitrogen (78%), oxygen (21%), argon (0.93%), and carbon dioxide (CO2; 0.039%) and variable amounts of water vapor, ranging from 1 to 5%. This mixture of gases, combined with the processes of physical weathering, leads to the disintegration of earlier-formed igneous, metamorphic, and sedimentary rock constituents. Some primary (igneous and/or metamorphic) minerals are more susceptible than others to chemical disintegration under atmospheric conditions. Table 10.1 lists the relative stabilities of some common igneous rock-forming minerals discussed in Chapter 7. This table shows that quartz is one of the most chemically and physically stable minerals, whereas olivine is easily altered chemically, mainly through oxidation and hydration (see Equations (10.1) and (10.2)). The positions of the minerals between quartz and olivine represent intermediate stabilities during weathering. This order shows that, in general, igneous minerals that form at the highest temperature (e.g., olivine) are the most unstable, whereas minerals formed at lower temperatures (e.g., quartz, muscovite, K-feldspar) are more stable under atmospheric conditions. Quartz, K-feldspar, and muscovite are common constituents of detrital sedimentary rocks such as arkose and greywacke (see Sec. 12.1.2).
Table 10.1 Relative stabilities of some igneous rock-forming minerals during weathering. High stability
Quartz Muscovite
Increasing stability
290
K-feldspar
Low stability
Biotite
Albite
Hornblende
Intermediate plagioclase compositions
Augite
Anorthite
Olivine
The position of olivine in Table 10.1 indicates that it is the least stable of the ferromagnesian minerals listed. Figure 10.1 shows a high-resolution transmission electron microscopy (HRTEM) image of a partially oxidized olivine grain in a basalt. The oxidation of the Fe-containing olivine results in a
20 nm
Olivine
Mt
En
Mt Mt
En Mt En Figure 10.1 A high-resolution transmission microscopy (HRTEM) image of a partially oxidized iron-containing forsterite (an olivine) in a basalt flow. The oxidation products are enstatite (En) and magnetite (Mt) in a crystallographically controlled intergrowth. For the equation that describes this chemical reaction, see Reaction (10.1). (Photograph courtesy of Hiromi Konishi and Huifang Xu, University of Wisconsin-Madison.)
10.1 The interaction of the Earth’s atmosphere with minerals
crystallographically oriented intergrowth of enstatite and magnetite, according to the following reaction: 15(Mg 0.8 Fe0.2 )2 SiO4 + 13O 2 iron-co c ntaining forsterite oxygen → 24MgSiO3 + 2Fe 3O 4 + 3SiO 2 enstatite m gnetite ma amorphous silica
(10.1)
Olivine is also highly susceptible to hydration, by hydrothermal fluids, as follows: 2Mg SiO4 + 3H2 O → Mg 3Si 2 O5 (OH)4 + Mg(OH)2 forsteri te t serpentine brucite
(10.2)
New mineral formation, as shown on the right-hand side of the two above equations, is the result of the chemical breakdown of the more unstable minerals in Table 10.1 as a result of oxidation and hydrolysis. A hydration reaction for the breakdown of K-feldspar to form kaolinite is as follows:
2KAlSi 3O8 +11 H2 O → Al 2 Si 2 O5 (OH)4 + K-feldspar kaolinite 4 H4 SiO 4 + 2(OH)- + 2K + silicic acid
(10.3)
The reaction products are kaolinite and several ions and compounds that go into solution (silicic acid, hydroxyl ion, and K+). In similar breakdown reactions of Ca2+- and Na+containing silicates, such as members of the plagioclase feldspar series, the Ca2+ and Na+ go into solution as ions as did the K+ in reaction (10.3). These ions may become so concentrated in ocean water that new minerals are precipitated out, such as halides (NaCl and KCl) and carbonates (CaCO3, CaMg(CO3)2), as a result of reactions with anions such as Cl– and (CO3)2-. Pyrite, FeS2, a common accessory mineral in some igneous rocks and a major constituent of sulfide-rich ore deposits, is highly unstable under atmospheric conditions and will react as follows:
Figure 10.2 The weathered surface of an aa lava flow on the south coast of Molokai, Hawaii, which was covered by a later flow. Although the structure and texture of the older flow top is still visible, with clinkerlike fragments containing white plagioclase phenocrysts, all the primary igneous minerals have been converted to soft red iron oxides and hydroxides and clay minerals.
291
Sedimentary rock-forming minerals and materials
(10.4)
We begin with ice, the crystalline form of water, because it fits all the criteria included in the definition of mineral, as discussed in Section 2.1.
Temperature (°C) –80 –40 0
0
40
Ice I Ice II Ice V
120
240
Water vapor (steam) 360
Shaded region enlarged in Figure 10.3(B)
Ice III
10 Ice VI
Liquid water
20 Ice VII 30
(B)
Temperature (°C) 0.0099
374.3 Triple point
t
0.006 Ice I
221
Vap
Water vapor (steam) or p
Liquid water
rve cu re
10.2 Ice: H2O
(A)
u ss re
The Fe2+ in solution is immediately oxidized to Fe3+ and may be precipitated as the Fe3+-containing hydroxide, goethite, FeO(OH), or it may form a mixture of hydrous iron oxides called limonite, which is a field term that refers to an amorphous mixture of iron hydroxides, of yellow to brown color, and of uncertain identity. Such yellow-brown weathering products commonly overly sulfide deposits and are known as gossan. Such occurrences are of much interest to prospectors and exploration geologists because they help locate possible underlying sulfide deposits of economic value. A brownish hue on the weathered surface of a granite is due to a microscopically thin layer of limonite. Many soils exhibit such a color as well. Trace amounts of Fe2+ in minerals such as feldspar may oxidize in an environment of oxygen-rich groundwater to produce a microscale coating of hematite, which results in the red hue of many granites and sandstones in rock exposures. In addition to the oxides (and hydroxides) formed as a result of Equations (10.1) and (10.2), H+ and (SO4)2– produce acidic and sulfate-rich waters. These are generated in the waste dumps of sulfide-rich mining districts and coal mines, which commonly contain pyrite. This, then, is the main reason for what is known as acid mine drainage (AMD), which can cause extensive pollution that requires expensive and complex remediation procedures. Major highway construction commonly involves leveling the topography by filling valleys with material cut from hilltops (cut and fill). If the cut rocks contain sulfides, as is the case in many igneous and metamorphic rocks, the freshly broken rock provides a ready source of extremely acid leachate, which can cause major environmental problems in the water system adjoining the highway. The result of the foregoing reactions acting on a fresh igneous rock is to convert it to an assemblage of clay minerals, iron oxides and hydroxides, a few chemically resistant minerals (e.g., quartz, if present), and soluble products (Na+, K+, Ca2+, and Mg2+) that are carried away in groundwater and eventually reach the ocean. The effect of these reactions on a relatively young igneous rock can be seen in the example of an aa lava flow on the Hawaiian Island of Molokai (Fig. 10.2). The prominent weathering profile in the lower (older) flow that grades from gray at the base of the road to red at the top of the flow is the result of the production of iron oxides and hydroxides from the primary dark ferromagnesian minerals in the basalt.
Occurrence: Most of the natural ice on Earth is located at extreme latitudes: in the Greenland ice sheet and sea ice at the North Pole and in the Antarctic ice sheet at the South Pole. Also found in high-mountain glaciers and present as permafrost in very large polar and subpolar regions of the globe. Chemical composition and crystal structure: Pure H2O occurs in many polymorphs, as shown in Figure 10.3. The crystal structures of two of these ice polymorphs are illustrated in Figure 10.4. The first is the structure of ice that forms naturally under freezing conditions. This is ice I, also known as Ih, because it has a hexagonal ring structure, with a low G = 0.915. The second structure is that of ice VIII, a cubic structure with G = 1.6, which is the densest form of ice. Crystal form: Normal ice, ice I, exhibits hexagonal crystal form, 6/m m 2/m 2/m, as shown in snowflakes (see Fig. 10.5). Physical properties: H = 1.5, but the hardness varies with temperature. At –70°C, H = 6, but in most glaciers, the temperature is –30°C. The G of ice at O°C is 0.915, which is extremely
Freezing point curv e
Fe 2+ + 2H+ + 2(SO 4 )2i on o s in solution
Pressure (kilobars)
FeS 2 + 3.5O 3 5O2 + H2 O pyrite
Pressure (bars)
292
c Critical point
Figure 10.3 Stability diagrams for H2O. (A) Stability fields of six polymorphs of ice (ice I, II, III, V, VI, and VII) and that of liquid water (modified after Figs. 1915 and 1916 in Phase Diagrams for Ceramists, s 1964, and reprinted with permission of the American Ceramic Society, http://www.ceramics.org; all rights reserved). (B) An enlargement, not to scale, of the shaded region in (A).
10.3 Goethite
light for a mineral (ice floats in water). The G of pure water at 0°C is 0.999. At –30°C the G of ice is 0.920. Ice is generally colorless and transparent, but it may also be bluish white and opaque as in glaciers. Some ice appears white because of the inclusion of air bubbles. Transparent. Crystals are hexagonal (Fig. 10.5). Fracture is conchoidal. Distinguishing features: Melts quickly, upon the touch of a hand, to make water. Uses: Until the second half of the nineteenth century, ice harvesting was a big business, using block ice, mainly for the cooling of food and food products. Since the advent of artificial refrigeration, the harvesting and delivery of block ice has become obsolete. Artificial ice production is a large business because of the use of ice in food storage and processing, in the curing and mixing of concrete, and in the use of packaged ice by consumers. Ice I, H2O Hexagonal, P 6/m 2/m 2/m
c a2
oxygen hydrogen a1 (A)
a3
Ice VII; Isometric, P 42/n 3 2/m
Figure 10.5 Two examples of hexagonal snowflakes. There are seemingly endless variations in the hexagonal shape of snowflakes resulting from constantly changing temperature and humidity when a snowflake forms. Many of these can be seen on http://www.snowflakes.com. (These photographs courtesy of Kenneth G. Libbrecht, California Institute of Technology; from http://snowflakes.com.)
10.3 Goethite: FeO(OH) a2
(B)
a1
Figure 10.4 (A) A ball-and-stick representation of the crystal structure of ice I, the normal, everyday type of ice. A hexagonal unit cell is outlined. (B) A ball-and-stick representation of the crystal structure of ice VII. A cubic unit cell is outlined.
Occurrence: Goethite is a common oxidation product formed during the weathering of iron-bearing minerals. It may be present in bogs and springs as a result of inorganic or biogenic precipitation from groundwater. Together with hematite it constitutes the most common commercially mined iron ore. Such iron-rich ores are the product of oxidation of earlier iron-rich minerals (e.g., carbonates, silicates) and the leaching away of silica, which is a major constituent of Precambrian banded iron-formation. Chemical composition and crystal structure: Closely approaches FeO(OH) with variable Mn content of up to about
293
294
Sedimentary rock-forming minerals and materials
c
Goethite: FeO(OH) P 21/n 21/m 2/a
Fe3+ b
H+
Figure 10.6 Polyhedral representation of the structure of goethite with Fe3+ in octahedral coordination with oxygen and (OH)– groups. An orthorhombic unit cell is outlined.
Figure 10.7 Goethite with a radiating, fibrous texture.
5 weight %. The crystal structure is shown in Figure 10.6 with (OH)– groups in hexagonal closest packing (HCP) and Fe3+ in octahedral coordination between them. Crystal form: Orthorhombic; 2/m 2/m 2/m m. Is rarely in crystals. Commonly massive, stalactitic with radiating fibrous texture (Fig. 10.7). So-called bog ore is porous and loose. Physical properties: H = 5–5½; G = 4.37, but may be as low as 3.3 for impure and/or porous varieties. Color is yellowish brown with a silky luster in fibrous varieties (Fig. 10.7). Streak is yellow brown. Limonitee is a field term that refers to a yellow-brown to brown oxidation and/or hydration product consisting of amorphous hydrous iron oxides of uncertain identity.
10.5 Calcite
Distinguishing features: Distinguished by its yellow-brown streak and its common occurrence in massive to fibrous textures. Hematite, by contrast, has a red-brown streak. Uses: Goethite, together with hematite, is the major source of iron worldwide from oxidized portions of Precambrian iron-formations.
10.4 Kaolinite: Al2Si2O5(OH)4 Occurrence: Kaolinite is a common mineral and is the main constituent of kaolin or clay. It forms at low temperature and pressure as an authigenic mineral (authigenicc meaning that the mineral formed in place and was not transported there from elsewhere; from the Greek words authi, i meaning “in place,” and genesiss, meaning “origin”). Also a secondary weathering product of aluminosilicates such as feldspar (see Equation 10.3). A common constituent of soils, and as massive clay deposits. Two other clay minerals, montmorillonite and illite, with compositions and structures different from that of kaolinite, are also common in soils (see Sec. 10.17). Chemical composition and crystal structure: The composition of most kaolinite is essentially Al2Si2O5(OH)4. The crystal structure is shown in Figure 10.8, in which the octahedral sheet is dioctahedral (see Sec. 7.16) with one out of three tetrahedra in the sheet being vacant. Crystal form: Triclinic; 1. Occurs as minute (submicroscopic), thin plates. Usually massive in claylike masses. Can be pseudomorphous after K-feldspar (Fig. 10.9). Physical properties: H = 2; G = 2.6. Perfect {001} cleavage. Dull, earthy luster. Color most commonly white. Other colors are due to impurities. Becomes plastic when wetted.
c
Kaolinite: Al2Si2O5(OH)4 C1
Si4+ Al3+
a
Figure 10.8 A perspective, polyhedral view of the structure of kaolinite showing infinitely extending tetrahedral and octahedral sheets bonding together to make tetrahedral-octahedral (tt oo) layers. Two identical monoclinic unit cells are outlined.
Figure 10.9 Very fine-grained kaolinite pseudomorphous after two intergrown Carlsbad twins of orthoclase. One twin is horizontal, the other inclined at a high angle.
Distinguishing features: Very low hardness and claylike character. Without X-ray powder diffraction tests, kaolinite cannot be uniquely identified or distinguished from several other clay minerals. Uses: Commercial clays, or clays used as raw materials in manufacturing, are among the most important nonmetallic mineral resources (see Sec. 16.3). Major commercial products are common brick, paving brick, sewer pipe, and draining tile. High-grade clays known as china clayy or kaolin are major constituents of pottery and chinaware. A very large use is as filler in paper. It is also used in the manufacture of refractories and in the rubber industry. Other related clay minerals such as montmorillonite and vermiculite have very specific industrial applications. Montmorillonite is used in drilling muds and as a catalyst in the petroleum industry. It is also used as a bonding clay in foundries and in bonding iron-ore pellets. Vermiculite is used extensively in agriculture for soil conditioning. When vermiculite is rapidly heated, it becomes a lightweight expanded product used in potting soil and thermal insulation.
10.5 Calcite: CaCO3 Occurrence: Calcite is the main constituent of limestone, the most abundant chemically precipitated sedimentary rock. Limestone is also the result of organic precipitation. Many organisms that live in the oceans extract calcium carbonate from the water to build their protective shells, and on death their hard parts accumulate on the sea floor. Coquinaa is a loosely cemented, fragmental limestone made of fossil shells and fragments. Chalk k is a soft, fine-grained limestone mainly made of foraminiferal shells. Marble is the metamorphic equivalent of limestone. Hydrothermal veins commonly contain calcite. It is also the main constituent of the igneous rock carbonatite (see Sec. 9.4.4, Fig. 9.39).
295
Sedimentary rock-forming minerals and materials
Calcite: CaCO3 also siderite: FeCO3 R 3 2/c magnesite: MgCO3 rhodochrosite: MnCO3
c c
a2
a2
a1 (A)
a1
(B) (CO3)2– group
Ca2+ (or Fe2+, Mg2+, Mn2+)
Chemical composition and crystal structure: Most calcites are close to the formula CaCO3. The structure of calcite is shown in Figure 10.10, with triangular (CO3)2– groups in planes at right angles to the vertical c (3-fold) axis. The Ca2+ ions, in alternate planes, are in 6-coordination with oxygens of the (CO3) groups. Magnesite (MgCO3), siderite (FeCO3), and rhodochrosite (MnCO3) exhibit the same structure. These four common carbonates, therefore, are referred to as isostructural. A polymorph of calcite, aragonite, which is stable at high pressures (Fig. 10.11), is discussed in Section 10.6.
Temperature (°C) 0
200
400
600
800
0
5
Pressure (kilobars)
296
(C)
a1
a2
Figure 10.10 Three different views of the crystal structure of calcite. (A) A view down the vertical c axis. (B) A perspective, vertical view of the same structure. In both illustrations a primitive hexagonal unit cell is outlined for this rhombohedral structure. (C) A third view of the calcite structure in a ball-and-stick representation. This shows the two different Bravais lattice choices: P for the hexagonal and R for the rhombohedral lattice choice. See caption for Figure 5.25 for further explanation.
Crystal form: Commonly occurs in good crystals of varied habit. Rhombohedral and scalenohedral crystals (Fig. 10.12) are most common. Also occurs in coarsely crystalline masses, as well as in fine-grained, compact, and stalactitic forms. Physical properties: H = 3 (on cleavage surface); G = 2.71. Perfect rhombohedral {1011} cleavage. Color is usually white to colorless but may show other colors. Transparent to translucent. Distinguishing features: Effervesces readily in cold, dilute HCl. Characterized by its H = 3, excellent rhombohedral cleavage, and light color. Uses: The main use for calcite is in the manufacture of cements and mortars. Limestone is the chief source, which when heated to about 900°C forms CaO, quicklime, by the reaction CaCO3 → CaO+CO2. The CaO, when mixed with water, forms one of several CaO hydrates (slaked lime), which swell, give
Calcite
10
15
Aragonite
20 Figure 10.11 The approximate locations of the experimentally determined stability fields of two polymorphs of CaCO3: calcite and aragonite.
Figure 10.12 Three intergrown scalenohedral crystals of calcite.
10.7 Dolomite
off heat, and harden. Quicklime when mixed with sand forms common mortar. The most widely used cement is known as Portland cement, which consists of about 75% calcium carbonate with the remainder being silica and alumina. Limestone is the main raw material for the production of various inorganic Ca-containing compounds. When finely crushed, it is a soil conditioner, and it is a component in whiting and white wash. It is also a flux in smelting various metallic ores. Limestone and marble are used extensively in the building industry as dimension stone.
10.6 Aragonite: CaCO3 Occurrence: Aragonite is less common than calcite because it is less stable at atmospheric conditions. It is an inorganic precipitate in near-surface conditions of relatively warm ocean waters as found in the Bahamas. CaCO3, as aragonite, is secreted by mollusks, but with time it changes to calcite, resulting in calcite pseudomorphous after aragonite. It is also present in metamorphic rocks that have been subjected to high pressure. Figure 10.11 shows the relative stabilities of calcite and aragonite. Chemical composition and crystal structure: Most aragonite is close to the composition CaCO3. The structure of aragonite is somewhat denser than that of calcite. Figure 10.13 shows the orthorhombic crystal structure of aragonite. In the aragonite structure, the (CO3)2– groups occur, as in calcite, in planes perpendicular to the c axis, but now in two different structural planes, with the triangular carbonate groups pointing in opposite directions to each other. Ca2+ is in 9-fold coordination with oxygens from adjoining (CO3)2– groups. Crystal form: Orthorhombic; 2/m 2/m 2/m m. May occur in acicular pyramidal crystals, as well in tabular crystals. Usually in radiating groups of large to very small crystals. Also as Aragonite: CaCO3 P 21/n 21/m 21/a a
Figure 10.14 A cluster of white pseudohexagonal twins of aragonite forming a hexagonal-like prism terminated by a basal plane. This results from the intergrowth of three individual aragonite crystals twinned on {110} forming cyclic twins. The yellow mineral in the background is sulfur.
pseudohexagonal twins (Fig. 10.14) showing a hexagonallike prism terminated by a basal plane. These result from the twinned intergrowth (a cyclic twin) of three individuals twinned on {110} with {001} forms in common. Physical properties: H = 3½–4; G = 2.94. Usually occurs in radiating groups of smaller acicular crystals. Also in reniform, columnar, and stalactitic aggregates. Generally colorless or white. Distinguishing features: Effervesces in cold HCl. Distinguished from calcite by higher specific gravity and lack of rhombohedral cleavage. Uses: Because of the extensive availability of CaCO3 in the form of calcite in limestones, and because of the lack of large deposits of aragonite, this polymorph of calcite has little to no commercial use.
10.7 Dolomite: CaMg(CO3)2
b
Ca2+ (CO3)2– group c Figure 10.13 View down the vertical c axis of the structure of aragonite. As in calcite, the triangular (CO3)2– groups lie perpendicular to the c axis. Here, however, the triangular groups in one plane point in opposite directions to those in the other. An orthorhombic unit cell is outlined.
Occurrence: Dolomite occurs as extensive sedimentary rock sequences and as its metamorphic equivalent, dolomitic marble. Dolomite (also referred to as dolostone, a rock type) is commonly the result of replacement of preexisting limestone with relict calcite grains, calcitic fossils, and sedimentary structures still preserved in the dolomitic matrix. Also found in hydrothermal veins. Chemical composition and crystal structure: An essentially complete solid solution exists between dolomite and ankerite, CaFe(CO3)2 (see Fig. 10.15). The dolomite composition is halfway between calcite and magnesite (Fig. 10.15). The
297
298
Sedimentary rock-forming minerals and materials Calcite CaCO3 100 90 80 70 60 50
Dolomite CaMg(CO3)2
Ankerite CaFe(CO3)2
40 30
20 10 Magnesite MgCO3
Molecular %
0 Siderite FeCO3
Figure 10.15 Graphical illustration of the extent of solid solution among carbonates in the system CaO-MgO-FeO-CO2. Tie lines connect commonly coexisting carbonates. Calcite-dolomite pairs occur in Mg-containing limestones. Ankerite-siderite pairs are common in Precambrian banded iron-formations (adapted from Essene, E. Z., 1983, Solid solutions and solvi among metamorphic carbonates with applications to geologic thermobarometry, Reviews in Mineralogyy, 11, 77–96, Mineralogical Society of America, Chantilly, VA).
compositional field of dolomite-ankerite is halfway between that of calcite and the solid solution field of magnesite-siderite. These compositional fields are separated by miscibility gaps, as shown by pairs of coexisting compositions in Figure 10.15 Dolomite: CaMg(CO3)2 R3 c
Ca2+ Mg2+ (CO3)2– group
a2
Figure 10.17 A hand specimen of dolomite showing the intergrowth of many, slightly pink, curved rhombohedral crystals.
connected by tie lines. The crystal structure of dolomite is similar to that of calcite but with separate layers of Ca2+ and Mg2+ alternating along the vertical c axis (Fig. 10.16). The large difference in size between Ca2+ and Mg2+ is the cause for the cation ordering into separate layers of the structure. Crystal form: Hexagonal; 3. Crystals are commonly curved rhombohedra (“saddle shaped”; see Fig. 10.17). Generally in coarse, cleavable masses. Physical properties: H = 3½–4; G = 2.85. Shows perfect rhombohedral cleavage, {10 11}. Color ranges from colorless to flesh colored to pink; also white, gray, and black. Distinguishing features: Crystals commonly show curved rhombohedra and flesh color. Dolomite reacts only very slowly in cold HCl but effervesces in hot HCl. Uses: In the manufacture of some cements. Also in the extraction of magnesia, MgO, for refractory linings used in the steelmaking process. Also used in the glass industry and in metallurgical fluxes. Agricultural applications include soil amendment and feed additive. Used as dimension stone in the construction industry.
10.8 Magnesite: MgCO3
a1 Figure 10.16 Perspective view of the crystal structure of dolomite. In the calcite structure (see Fig. 10.10) all octahedra are occupied by Ca2+. In dolomite, the Ca2+ and Mg2+, on account of their large difference in size (about 33%), are ordered, appearing in alternating levels of the structure. A cluster of four primitive hexagonal unit cells is outlined for this rhombohedral structure. See caption for Figure 5.25 for further explanation.
Occurrence: In sedimentary rocks as a primary precipitate or as a replacement of limestone by Mg-rich solutions, forming dolomite as an intermediate product. Also a common constituent of hydrothermal veins. It also occurs in metamorphosed igneous rocks, such as peridotite, pyroxenite, and dunite. Chemical composition and crystal structure: The most common magnesites are rich in magnesium, with only minor substitution of Fe2+ for Mg2+. However, a complete solid solution exists between magnesite and siderite, FeCO3 (see
10.9 Siderite
may resemble dolomite but have higher specific gravity. The massive white variety resembles chert but has a lower hardness. Uses: Magnesite may be mined for the production of Mg metal and other Mg compounds. However, most of the magnesium produced is from seawater brines (Mg being the third most common element in seawater, after chlorine and sodium). A major use of Mg is as MgO, which is a basic component of some refractories.
Rhodochrosite MnCO3
Magnesite MgCO3
0 10 20 30 40 50 60 70 80 90 100
Siderite FeCO3
Molecular % Figure 10.18 The approximate extent of solid solution among three isostructural carbonates: magnesite (MgCO3)–siderite (FeCO3)–rhodochrosite (MnCO3) (adapted from Essene, E. Z., 1983, Solid solutions and solvi among metamorphic carbonates with applications to geologic thermobarometry, Reviews in Mineralogyy, 11, 77–96, Mineralogical Society of America, Chantilly, VA).
Figs. 10.15 and 10.18). The iron-rich compositions are common in Precambrian iron-formations. Magnesite is isostructural with calcite (see Fig. 10.10). m Rhombohedral crystals are Crystal form: Hexagonal; 3 2/m. rare (Fig. 10.19). Usually compact and fine grained. Physical properties: H = 3½–5; G = 3.0–3.2. Perfect rhombohedral {1011} cleavage. Color ranges from white to gray, yellow, and brown (the latter two colors result from variable substitution of Fe2+ for Mg2+). Distinguishing features: Reacts only very slowly to cold HCl but dissolves with effervescence in hot HCl. Cleavable varieties
Figure 10.19 A cluster of light beige-colored tabular (discoid) crystals of magnesite. These crystals are combinations of almost flat rhombohedra terminated by basal pinacoids. Most magnesite is commonly massive.
10.9 Siderite: FeCO3 Occurrence: Siderite may be a major primary constituent of Precambrian banded iron-formation, in association with other iron-rich minerals such as magnetite, pyrite, and Fe-rich silicates. It is also present in metamorphosed iron-formations. Hydrothermal veins commonly contain coarsely crystalline siderite. Chemical composition and crystal structure: Siderite that occurs in iron- formations is generally low in Mg, although a complete solid solution series exists between siderite and magnesite (Fig. 10.18). There is also a complete series toward rhodochrosite, MnCO3. Siderite is isostructural with calcite, magnesite, and rhodochrosite (see Fig. 10.10). Crystal form: Hexagonal; 3 2/m. Crystals are usually rhombohedral in form (Fig. 10.20). Commonly cleavable, granular. Physical properties: H = 3½–4; G = 3.96 (for pure FeCO3). Shows perfect rhombohedral {1011} cleavage. May be compact or botryoidal. Color usually light to dark brown. Distinguishing features: Distinguished from other carbonates by its brownish color and high specific gravity. Soluble in hot HCl with effervescence. Uses: In only a few countries is siderite mined as an iron-ore mineral. The bulk of all global iron is extracted from Precambrian iron-formations rich in magnetite, hematite, and/or goethite. A source of brown pigments used in paints.
Figure 10.20 A group of yellowish-brown rhombohedral crystals of siderite with composite and somewhat curved faces.
299
300
Sedimentary rock-forming minerals and materials
10.10 Rhodochrosite: MnCO3
10.11 Halite: NaCl
Occurrence: Sedimentary, low-temperature rhodochrosite, of diagenetic origin, occurs in finely laminated sediments or concretionary aggregates in manganese formations (diagenesis refers to all the chemical, physical, and biological changes that take place in a sediment after its initial deposition). It is also present in some manganese-rich iron-formations. It may be of hydrothermal origin, commonly in association with sulfide minerals. There is a unique occurrence of rhodochrosite at Capillitas in Argentina, where it is present as stalagtites and stalagmites in a former silver mine. Its metamorphic, high-temperature reaction product is commonly rhodonite, MnSiO3. Chemical composition and crystal structure: Most rhodochrosites are close to MnCO3 in composition, but there is a complete solid solution series between rhodochrosite and siderite (Fig. 10.18). Rhodochrosite is isostructural with calcite (Fig. 10.10). Crystal form: Hexagonal; 3 2/m. Occurs only rarely in welldeveloped rhombohedral crystals. Generally massive, granular. Physical properties: H = 3½–4; G = 3.5–3.7. Color is usually some shade of rose red (Fig. 10.21). It cleaves with rhombohedral cleavage. Distinguishing features: Pink color, rhombohedral cleavage, and H ≈ 4. Rhodonite resembles rhodochrosite in color but is much harder (H = 5½–6½). Rhodochrosite effervesces in warm HCl and rhodonite does not. Uses: Because of its rose-red color, rhodochrosite is a desirable ornamental stone. On account of its low hardness and good cleavage, it does not make a good material for jewelry. However, the banded variety (Fig. 10.21) is popular in beads and pendants.
Occurrence: Halite is dissolved in the waters of oceans and salt lakes. It is a common constituent of evaporites, which are the result of the evaporation of restricted bodies of seawater or saline lakes, where it is associated with gypsum, sylvite, calcite, and anhydrite. It is a major constituent of playa deposits. It also occurs in salt domes, which are nearly vertical pipelike masses of salt that have risen upward to the surface from an underlying salt bed (salt is less dense than the overlying rock). Chemical composition and crystal structure: Generally close to NaCl in composition but may contain inclusions of other minerals and saline water. The crystal structure of halite is shown in Figure 10.22. Each Na+ is in 6-fold coordination with Cl–, and similarly each Cl– is surrounded by six Na+ neighbors. Crystal form: Isometric; 4/m 3 2/m. Most commonly occurs in cubes (Fig. 10.23), with other crystal forms rare. Physical properties: H = 2½; G = 2.16. Cubic {001} cleavage is perfect. Readily soluble in water. Generally transparent to translucent. Salty taste. Color is most commonly colorless or white, but when impure may be yellow, blue, or purple. Distinguishing features: Characterized by its salty taste, cubic cleavage, and low hardness. Distinguished from sylvite by its less bitter taste. Uses: The most extensive use of halite is in the chemical industry for the production of sodium and chlorine as well as hydrochloric acid. In its natural state, it is used in tanning hides, in stock feeds, in fertilizers, in salting icy highways, in
Halite: NaCl and sylvite: KCl F 4/m 3 2/m a3
Na+ Cl–
a2
a1 Figure 10.21 Section through a concentrically banded stalactite of rhodochrosite. This material originates from Capillitas, Catamarca Province, Argentina. This locality supplies the world market with ornamental rhodochrosite.
Figure 10.22 Perspective view of a close-packed model of the structure of halite, NaCl. The three crystallographic axes outline a cubic unit cell.
10.13 Gypsum
Physical properties: H = 2; G = 1.99. Perfect {001} cubic cleavage. Commonly transparent. Color is colorless to white. Readily soluble in water. Has a salty taste but is more bitter than halite. Distinguishing features: Distinguished from halite by its more bitter taste. Uses: It is the chief ore mineral for the production of potassium compounds. Soluble potassium is a major constituent of fertilizers. A mixture of sylvite and halite, known as sylvinite, is the highest-grade potassium ore.
10.13 Gypsum: CaSO4·2H2O
Figure 10.23 Translucent, cubic crystals of halite.
pharmaceuticals, and as a weed killer. It is used at home in meal preparation, and it finds extensive use in the preservation of prepared foods, as well as of cheese, butter, fish, and meat.
10.12 Sylvite: KCl Occurrence: A constituent of marine evaporite deposits but less common than halite. The precipitation of sylvite from a brine requires a great deal more evaporation than does halite. Chemical composition and crystal structure: Because the radii of Na+ (VIII coordination, 1.32Å) and K+ (VIII coordination, 1.65Å; see Table 4.4) are so far apart, there is little substitution of these elements for each other. Sylvite is isostructural with halite (Fig. 10.22). Crystal form: Isometric; 4/m 3 2/m. Commonly found in crystals that combine cube and octahedron (Fig. 10.24). Usually granular.
Occurrence: Gypsum is a common mineral in evaporite deposits, in association with halite, sylvite, calcite, dolomite, anhydrite, and clays. It also occurs in saline lakes and as an efflorescence on desert soils. Chemical composition and crystal structure: Almost all gypsum has the composition CaSO4·2H2O. A mainly polyhedral image of the structure is given in Figure 10.25. It consists of strongly bonded layers of (SO4)2– and Ca2+ parallel to {010} alternating with layers of H2O molecules. The Ca2+ in 8-fold coordination shares edges with the tetrahedral (SO4)2–– groups. Because the bonds between H2O molecules and the neighboring layers are weak, it has excellent cleavage parallel to {010}. m Commonly in crystals of Crystal form: Monoclinic; 2/m. simple habit, tabular on {010}. Somewhat more complex crystals of selenite are shown in Figure 10.26 (see book-opening photograph). The name selenitee is used for colorless and transparent varieties. Physical properties: H = 2; G = 2.32. Perfect {010} cleavage. When not in crystals it is massive and cleavable. Color is most commonly colorless, white, or gray. May have other colors due to impurities.
c
Gypsum: CaSO4 . 2H2O C 2/c CaO8 polyhedrom (SO4)2– group H+ b
a
Figure 10.24 Cubo-octahedral crystals of sylvite.
Figure 10.25 Perspective view of the crystal structure of gypsum with the c axis vertical. The location of water molecules is that of the H+ ions. Successive layers of (SO4)2– tetrahedra bonded to Ca2+ are separated by sheets of the H2O molecules. The bonds between the H2O molecules and the neighboring ions are weak giving rise to excellent {010} cleavage. A monoclinic unit cell is outlined.
301
Figure 10.26 Several monoclinic crystals of colorless and transparent gypsum also known as selenite. The crystals show {010} side pinacoids, {hk0} k prismatic bevels, and {001} basal pinacoids.
Number of molecules of H2O
10.15 Chert and agate
2
Ca SO4 · 2H2O gypsum
1
Ca SO4 · 1/2H2O
γ Ca SO4 0 0
25
50
75
100
Temperature (°C) Figure 10.27 Dehydration curve of gypsum illustrates the formation of a metastable phase, CaSO4.½H2O at about 65°C. At about 100°C, with complete dehydration, a metastable γ polymorph of CaSO4 appears.
Distinguishing features: Characterized by its low hardness and excellent cleavage. Uses: Gypsum is used mainly in the production of gypsum board or wallboard, also known as Sheetrock or drywall. In the manufacture of wallboard, gypsum is heated to drive off a large part of the water, resulting in the production of the hemihydrate of calcium sulfate, CaSO4·½H2O (Fig. 10.27). This is subsequently ground to form a material called stucco (similar to material sold as plaster of Paris). Stucco mixed with water, reinforcing fibers, aggregates, and some additives produces a watery slurry that is cast into a narrow paper envelope. This produces a gypsum core with specially prepared paper bonded to both sides, known as wallboard.
10.14 Anhydrite: CaSO4 Occurrence: Anhydrite is a common constituent of evaporite deposits in association with halite, calcite, dolomite, and gypsum. Also found in salt deposits in the cap rock of salt domes and in limestone. Also present as filling of vesicles in basalt flows. Anhydrite: CaSO4 C 2/m 2/c 21/m c
Ca2+ (SO4)2– group b a
Figure 10.28 Perspective view of the crystal structure of anhydrite. An orthorhombic unit cell is outlined.
Figure 10.29 A cluster of equant anhydrite crystals each with three sets of different pinacoidal faces.
Chemical composition and crystal structure: Essentially CaSO4. The crystal structure of anhydrite is given in Figure 10.28, which consists of (SO4)2– tetrahedra and distorted CaO8 polyhedra. A metastable polymorph of anhydrite, γ Ca SO4 (Fig. 10.27), is formed as the result of slow dehydration (during heating) of gypsum. Crystal form: Orthorhombic; 2/m 2/m 2/m. Crystals are rare but appear blocky (Fig. 10.29) when present. Physical properties: H = 3–3½; G = 2.89–2.98. {010} cleavage perfect; {100} cleavage nearly perfect; {001} good. Color is generally colorless to gray to bluish white. Distinguishing features: The three good cleavages result in equant, blocky cleavage fragments. It has a higher H than gypsum. It may appear similar to calcite but does not effervesce in HCl. Uses: In ground form as a soil conditioner. In some parts of the world, anhydrite is used in the production of cement as well as sulfuric acid.
10.15 Chert and agate: both made of very fine-grained SiO2 Occurrence: Most chert is of marine origin. It is abundant in Precambrian banded iron-formations. In Phanerozoic rocks, it forms beds in ophiolite suites overlying pillow lavas. It may also occur in limestone, especially chalk. Agates commonly occupy vugs (cavities) in volcanic rocks and cavities in other rocks as well. They may be the result of silica deposition from groundwater percolating through the host rock slowly filling the original cavities with banded chalcedony (the main constituent of agate). They may also originate from silica deposition that is simultaneous with the crystallization of the matrix (host) rock. Chemical composition and crystal structure: The composition is that of quartz, SiO2. Grain size ranges from microcrystalline to cryptocrystalline with the structure of low quartz (Fig. 5.36(A)). Cryptocrystallinee (from the Greek word krypto, o meaning “hidden”) means that it consists of crystals that are too small to be recognized even under an optical microscope,
303
10.17 Soil
although the crystallinity can be proved by X-ray diffraction techniques or electron microscopy. Shape: Chert occurs in bedded deposits and as nodules in sedimentary sequences. Agates are commonly in rounded shapes that reflect the original cavity that was filled with chalcedony. Fine banding tends to parallel the outline of the cavity in which the silica was deposited (Fig. 10.30). Physical properties for chalcedony: H = 6½–7; G = 2.60 ± 0.10. For microcrystalline quartz, these are: H = 7; G = 2.66. Chert is usually grayish white, occasionally dark gray. In agates, color banding is commonly in thin parallel bands, in irregular clouds, or in mosslike forms. It can be found in many natural colors, but the very vivid blues, greens, and pinks seen commercially in shops that sell agate for ornamental purposes is due to artificial coloring. Distinguishing features: Hardness essentially that of quartz. In most agates, the banding is concentric and the chalcedony completely fills the cavity. In others, the banded portion only partially fills the cavity and the central portion is void, or filled completely, or in part, by coarsely crystalline quartz (Fig. 3.2(F)). Uses: Cut and polished agates, as well as polished slices thereof, are sold as ornaments. Uniquely textured material is used in the jewelry industry.
10.16 Phosphorite Phosphorite is a sedimentary rock with a high enough phosphate mineral content to be of economic interest. Phosphorites are defined as having more than about 20% P2O5. Most commonly, it is a marine rock composed of microcrystalline fluorapatite, Ca5(PO4)3(F), in the form of pellets; laminae; oolites;
nodules; and skeletal, shell, and bone fragments. The mineral apatite was discussed in Section 7.33. Figure 10.31 illustrates (on the left) a black, granular hand specimen of phosphorite and on the right a specimen of phosphatic limestone. Other sedimentary rocks with less than 15% P2O5 but still more than the average phosphorus content of sediments are referred to as phosphatic, as in phosphatic limestone. The total volume of sedimentary phosphates in the world is small. But like very iron-rich sedimentary rocks (iron-formations), phosphorites are of great economic importance (see Sec. 17.1). They contribute more than 80% of the world’s phosphate production and make up about 96% of the world’s total resources of phosphate rock. The origin of marine sedimentary phosphate-rich formations is not yet clearly understood. It is generally believed that such sedimentary rocks are the result of upwelling of phosphorousrich waters from deeper parts of the ocean and that the (PO4) was biologically used to form soft body tissue. When such organic materials are deposited and decomposed on the seafloor, the (PO4) is released to the seawater. When this is re-precipitated on or replaces limestone, it becomes part of the precursor materials of the present-day phosphorites. Apatite may also have precipitated diagenetically from phosphate-rich pore waters, forming phosphate grains and cement, and replacing skeletal and carbonate grains. Yet another view of the origin of phosphorites is that they are the result of direct precipitation from concentrated phosphorus solutions that originated from deep-ocean hydrothermal activity admixed with seawater. This would represent an inorganic chemical instead of biogenic source. Precambrian iron-formations are considered the chemical sedimentary result of such deep-ocean hydrothermal sources as well. Uses: About 90% of phosphate rock production is used for fertilizer and animal feed supplements, with the balance used for industrial chemicals (e.g., phosphoric acid). A typical fertilizer used for garden soil might have the three bold digits printed on the outside of the container or bag: 16-8-8. This means that 16% of the material is nitrogen, 8% is phosphoric acid (P2O5), and 8% is soluble potassium (K2O) (see Sec. 17.2.3). The United States is the leading producer of phosphate fertilizers, but Morocco may have the largest reserves of phosphate raw material. Presently, the United States, China, and Morocco together produce about 75% of the world’s phosphorus.
10.17 Soil Figure 10.31 On the left, a black, granular hand specimen of phosphorite (the dark color is probably due to inclusions of organic matter); on the right, a phosphatic (apatite-rich) limestone.
Soil is mentioned in this text because it is an extremely important Earth material. Soil is essential to our survival. Engineers may define soil as the unconsolidated materials above the bedrock, but to soil scientists it is the medium for growth of land plants.
Figure 10.30 An agate consisting of translucent, cryptocrystalline quartz known as chalcedony. The delicate pattern of banding suggests the shape of a flame at the lower part.
305
306
Sedimentary rock-forming minerals and materials
Soils exhibit subtly colored, usually horizontal layers that are related to the weathering of surficial deposits or bedrock. Plants and soil are closely linked. Plants grow up from the surface, but their roots penetrate down into soil. Decaying organic matter accumulates on top and is mixed by organisms into the top layers of the soil. Air and water, also mixed into the soil, aid in plant growth. As shown in Figure 10.32, soils can be described in terms of soil horizons that differ from each other in particle size, chemical composition, and other soil characteristics. The upper layer of the A horizon is usually enriched in organic matter relative to other horizons. This organic matter, also referred to as humus, produces the dark brown to gray color and earthy odor of moist soil. The lower, main part of the A horizon lacks minerals that are most susceptible to dissolution. The B horizon is typically richer in clays, such as kaolinite as well as montmorillonite and illite. This horizon may have distinctive red, orange, and yellow hues caused by the presence of oxides and hydroxides of iron, such as microcrystalline hematite and goethite, as well as amorphous limonite. This soil horizon is one of accumulation of clays and soluble or suspended material brought down by water into the B horizon. The C horizon is the lowermost horizon of the soil and consists generally of the essentially unmodified parent material for soil formation. In Figure 10.32, this is the horizon that consists of bedrock. Uses: In agriculture soil is normally the primary nutrient base for plants, by providing minerals as well as water. In construction projects soil serves as the foundation; massive amounts of soil (usually called fill) are used in road building and dam construction. Soil absorbs rainwater, thus slowing runoff, and releases it later, thus preventing floods and drought. Soil also cleans water as it percolates through. Organic soils such as peat are used as a fuel resource in many countries.
Soil horizon Humus layer (generally dark due to organic compounds) Soluble minerals absent
(A)
Precipitation of some matter dissolved from A
(B)
Bedrock (granite)
(C)
Figure 10.32 Typical soil profile developed in sediments overlying granite bedrock under temperate climatic conditions. Soil characteristics depend on (1) climate, (2) organisms, (3) relief, (4) parent material, and (5) age of the soil.
Summary This chapter introduced 13 common sedimentary minerals and 3 sedimentary materials. It mentions the importance of several detrital minerals that were systematically described in Chapter 7, namely, quartz, feldspars, and members of the mica group. The majority of minerals described in this chapter are carbonates, halides, and sulfates. Only one, kaolinite, is a silicate, but this is part of a large mineral group known as the clay minerals, which, among others, includes montmorillonite, illite, and vermiculite.
• Oxidation and hydration reactions are common under atmospheric conditions. • Soluble products (Na+, K+, Ca2+, and Mg2+) build up in the oceans and subsequently lead to precipitation of carbonates, halides, and sulfates that incorporate the originally soluble cations.
• Ice is a mineral but is not commonly thought of as such. • Goethite and limonite are common oxidation and/or hydration products of all rocks, even those that carry only traces of iron.
Review questions
• Kaolinite is a common alteration product of originally high-temperature feldspars. • Calcite and dolomite are the most common rock-forming carbonates. • Aragonite is secreted by mollusks, but with time aragonite converts to calcite. Aragonite also occurs in metamorphic rocks that have been subjected to high pressures.
• Halides and sulfates are common constituents of evaporite sequences. • Agates, consisting of extremely fine-grained (microcrystalline to cryptocrystalline) quartz, are the result of silica deposition by groundwater in open spaces.
• Phosphorites are the main global source of phosphorus used in fertilizer. • Soil is a complex material on which all global agriculture is dependent.
Review questions 1. What is the number of polymorphs exhibited by ice? 2. What is the crystallographic system of ice that forms normally under freezing conditions? 3. What is the crystal form of ice and how is it exhibited? 4. What is the chemical formula of goethite? 5. What is the oxidation state of iron in goethite? 6. Kaolinite can be pseudomorphous after what feldspar? Give the chemical formulas of both minerals. 7. Kaolin is a major constituent of what commercially produced products? 8. Calcite and three other carbonates are isostructural. What does that mean, and which are the other three? What are their names and chemical formulas? 9. What is the main commercial use of limestone or calcite? 10. What is the chemical formula of dolomite? 11. What is different in the dolomite crystal structure as compared with that of calcite? 12. Halite is also known as table salt. What other major commercial uses does halite have? 13. Agates can be very aesthetically appealing and are commonly on exhibit in museums of natural history and for sale in rock and mineral shops. What is so appealing about them? 14. Phosphorites are mined for their content of what mineral? Give that mineral’s name and chemical formula. 15. Soils commonly show various horizontal soil horizons. How do these various layers differ?
FURTHER READING Please refer to the listing at the end of Chapter 7.
307
CHAPTER
11
Formation, transport, and lithification of sediment
Sedimentary rocks form through the compaction and cementing together of loose sediment, which can be derived from the weathering of preexisting rocks, the hard parts of organisms, or chemical precipitates. Most sediment is formed from weathered rock, and this detrital material must be transported by water, wind, or ice to depositional sites before it can begin the process of turning into solid rock. Grain size is an important property of sediment because it determines how easily sediment can be moved. During transport, sediment is sorted by grain size. In rivers, which are the main agent of sediment transport, the coarser fraction travels on the bottom, whereas the finer fraction travels in suspension, which leads to separate deposits of coarser sand and gravel and finer mud, respectively. Most detrital sediment is transported to the sea, but some accumulates in basins on continents. Along shorelines, wave action further abrades and sorts sediment. In warm climates, coastal sediments may consist almost entirely of the hard parts of calcareous organisms. Sediment eventually accumulates in basins, most of which have a specific plate tectonic setting, such as forearc basins at convergent plate boundaries, subsiding passive continental margins, and rift and pull-apart basins on continents. Sediments accumulating in these basins begin to compact under their own weight as pore fluids are expelled. These fluids are commonly saturated in the minerals with which they are in contact, and as the fluids rise, they precipitate minerals that cement the detrital grains together to form a rock. In this chapter, we discuss the formation, transport, deposition, and eventual solidification of sediment to form sedimentary rock.
Gorges du Verdon in the south of France cuts through Jurassic limestones that were thrust out of the sea by the Alpine orogeny onto the low terrain seen in the upper left of the photograph. As the mountains grew, the Jurassic rocks were exposed to weathering, and rivers, such as the Verdon, moved the weathering products back to the sea and created the gorge in doing so. The milky turquoise color of the Verdon River is testament to the large quantity of solids it carries in suspension, to say nothing of the amount carried as bed load and in solution.
Sedimentary rocks, which are the topic of Chapter 12, are formed by the accumulation and burial of sediment in depositional basins. Most sediment is formed from the weathering of preexisting rocks as a result of physical, chemical, and biological processes. Some sediment is formed directly by organisms, and some may be a direct chemical precipitate. Sedimentary rocks have a diverse compositional range, not only because of differences in the type and source of the sediment but also because of processes associated with the transport and burial of sediment. Before we discuss sedimentary rocks, we must, therefore, understand how sediment is formed, transported, deposited, and turned into rock (Fig. 11.1). The formation of sediment, its transport, and deposition are dependent on topographic relief, which in large part is produced by plate tectonic processes. High relief at convergent and divergent plate boundaries promotes weathering and transport of sediment, so many sedimentary rocks are related to these regions. When rocks weather, some minerals, such as quartz, remain stable, but most become unstable and are changed into new minerals characteristic of the weathering zone (see Table 10.1). Disintegration of the primary minerals is promoted by biological activity, with organisms feeding on the nutrients provided by the primary minerals. Because most of the weathering products of rock are silicate minerals, this type of sediment is referred to as siliciclastic sediment. It is the most abundant type of sediment, but sediment derived from organisms and chemical precipitates is also important. These various types of sediment are transported to sites of deposition by water, wind, and ice. Water also carries the soluble ions produced during weathering. During transport, sedimentary particles tend to separate on the basis of size and density. Most sediment eventually makes its way to the sea, where wave action and currents on beaches may further process sand-sized and coarser particles. The sorting of grains during transport leads to formation of the main types of siliciclastic sedimentary rocks (conglomerates, sandstones, and mudrocks). The soluble ions are removed from seawater by precipitation, especially as a result of evaporation in restricted basins, and by organisms that build shells and other hard parts of CaCO3 and SiO2. Along some shorelines, carbonate grains formed from the breakup of shells and other animal hard parts form calcareous gravel, sand, and mud. These accumulate to form limestones. On reaching a site of accumulation, sediment is buried by more sediment and slowly, through compaction, recrystallization, and cementation, undergoes lithification, to form sedimentary rock. Topographic relief is necessary to provide sources of sediment and basins in which it can be deposited. The importance of uplift and subsidence to the formation of sedimentary rocks was
Zone of weathering
11.1 Importance of sediments in understanding the history of the Earth
Primary rock Igneous sedimentary or metamorphic
Input of energy from plate tectonics to create topographic relief
Input of solar energy mainly through the hydrologic cycle
Physical and chemical weathering ~20%
~80 % Detritus
Zone of transport
Formation, transport, and lithification of sediment
Zone of deposition and lithification
310
Solution Transport by water
Transport by water, wind, and ice
Precipitated by organisms
Sorted detritus
Deposited directly as chemical precipitate
Broken, transported, and sorted by wave Remains action and currents in situ Deposition, compaction, dewatering, cementation, recrystallization
Conglomerate Sandstone Mudrock Siliciclastic rocks
Reef Limestone Biogenic carbonate rocks
Evaporite and iron-formation
Figure 11.1 Flow chart showing the various paths that sediment can take from its source in the zone of weathering to its final site of deposition where it is turned into solid sedimentary rock.
one of the pillars of the modern science of Geology as laid out in James Hutton’s Theory of the Earth (1788). At Siccar Point, on the east coast of Scotland near the border with England, Hutton discovered an angular unconformity between underlying vertically dipping Lower Silurian sandstones and overlying gently dipping Upper Devonian “Old Red Sandstone” (Fig. 11.2). By identifying such features as ripple marks and cross-bedding in the rocks, he correctly interpreted that they formed from sediment deposited by water in near horizontal layers. The underlying sandstone was formed from deepwater marine sediment, whereas most of the Old Red Sandstone was deposited by rivers on a coastal plain. Although Hutton did not have the benefit of
Figure 11.2 Anthony Philpotts standing on the angular unconformity discovered by James Hutton at Siccar Point on the east coast of Scotland. Vertically dipping Lower Silurian sandstone is overlain by gently dipping Upper Devonian Old Red Sandstone.
11.2 Sediment formed from weathering of rock
our knowledge of plate tectonics, he understood that the unconformity recorded periods of crustal deformation and uplift followed by erosion, and then subsidence, more deposition, and finally uplift again. Based on his observation of the rates of these processes in nature and applying the principle of uniformitarianism, he concluded that the unconformity proved that the geologic record must cover an enormous time span. And so began the modern science of geology. Today, we know that plate tectonics is the main cause of topographic relief, and without it, continents would soon be eroded away. The elevation of a mountain belt represents a balance between constructive and destructive processes. The rate of uplift depends on plate convergence rates, which are on the order of 50 mm/year (about as fast as our fingernails grow) and the types of plates involved (oceanic or continental). The rate the surface is lowered by erosion depends on many factors, including climate (wet or dry, cold or warm), latitude, and elevation, but is on the order of 0.3 mm/year. If the terrain undergoing weathering consists of granite with a density of 2750 kg/m3, this amount of surface lowering corresponds to removal of 1000 tonnes of weathered granite per square kilometer each year. Such large amounts of sediment being eroded from mountain ranges may sound excessive, but if, for example, you look at the Verdon River flowing out of the Alps through the Gorges du Verdon in the chapter-opening photograph, you can see from the river’s milky color that it is carrying a considerable suspended load. In addition, sediment is moving along the bed of the river and the water is carrying ~20% of the sediment load as dissolved ions. This part of France is underlain predominantly by Mesozoic shallow marine limestones that were raised out of the sea to form the Alps when the African plate collided with the Eurasian plate beginning at the end of the Mesozoic era. As the mountains rose, rivers, such as the Verdon, kept removing the weathering products from the newly elevated terrains and transporting them to the sea, where they accumulate as sediment that is ultimately buried and converted to new sedimentary rock. In this chapter, we examine the history of sediment from its source to its final site of accumulation and conversion to sedimentary rock. The processes of weathering and sediment transport lead to major redistributions of the elements in the crust. The resulting sedimentary rocks are, therefore, of great importance in adding to the diversity of Earth materials.
11.2 Sediment formed from weathering of rock Most sediment is formed from the physical and chemical weathering of igneous, sedimentary, and metamorphic rocks. Physical weathering involves the breaking apart of rocks along fractures such as joints that release stresses generated
by tectonism, cooling of igneous rocks, or simply exhumation during erosion. Even the boundaries between mineral grains or the cleavage planes in individual grains are potential surfaces along which physical weathering can occur. Freezing and thawing of water or the growth of salt crystals in such fractures can break rock apart. The growth of plant roots in fractures can augment this breakage. Physical weathering is important because it provides avenues for the access of water, which is the chief chemical weathering agent. Many minerals react with rainwater, which contains dissolved oxygen and carbon dioxide, to produce hydration, oxidation, or carbonation reaction products, whereas other minerals, such as quartz, remain stable. This mixture of new minerals and stable minerals forms the detritus that becomes sediment that is transported to sites of deposition to form the majority of sedimentary rocks. In Section 10.1, we discussed hydration and oxidation reactions and their role in forming soils. Before discussing the weathering of rock to form sediment, we must first consider the role played by carbon dioxide in chemical weathering.
11.2.1 Role of carbon dioxide in weathering In reactions (10.2) and (10.3), we saw how olivine and feldspar (respectively) can react with water in the weathering zone to form new hydrous minerals. In these reactions, water was taken to be pure H2O, but in nature, water is rarely pure. Rainwater, for example, contains many dissolved gases that make it acidic. When droplets of rain condense and fall through the atmosphere, they equilibrate with the carbon dioxide (and other gases) in the atmosphere, which reacts with the water to form carbonic acid according to the reaction: CO 2 + H2O carbo b n dioxide rain
H2 CO3 carbonic acid
(11.1)
At normal atmospheric concentrations of CO2 (∼390 ppm by volume), this reaction makes rainwater slightly acidic, with a pH of about 5.3, which means that the concentration of hydrogen ions (H+) in rainwater is more than ten times greater than in pure water (pH = 7; pH is a negative logarithmic scale of the hydrogen ion concentration). The presence of CO2 in the atmosphere and the acidity it creates in rainwater accelerates the weathering of minerals through carbonation and hydration reactions. The following is a simple carbonation reaction that would destroy olivine: Mg 2SiO4 +2CO 2 forsterite
2MgCO3 + SiO2 magnesite amorphous silica (11.2)
If we combine water with this reaction, olivine breaks down as follows: Mg 2SiO4 + 4CO 2 + 4H 2O → forsterite rainwater 4HCO-3 + H4 SiO 4 bicarbonate ion silicic acid
2 Mg 2+ + Mg ion
(11.3)
311
312
Formation, transport, and lithification of sediment
All of these reaction products are removed in solution. We can write a similar reaction for rainwater’s effect on potassium feldspar: 2KAlSi 3O8 + 2CO 2 + 11H 2O → Al 2Si 2O5 (OH)4 + K-feldspar rainwater kaolinite (11.4) 2K + + 2HCO3 + 4H 4 SiO 4 K ion bicarbonate ion silicic acid This reaction produces both solid kaolinite and soluble products. Most of the soluble products eventually find their way to the sea, where they may be precipitated as chemical sediment or used to build the shells and tests of organisms that eventually form biogenic sediment. Reactions (11.3) and (11.4) are examples of hydrolysis reactions because the water molecule is split into hydrogen and hydroxide ions (H2O → H+ + OH–). They are similar to reactions (10.2) and (10.3), but the inclusion of CO2 dramatically increases reaction rates. It is such reactions, therefore, that are primarily responsible for weathering of rocks. Because these reactions remove CO2 from the atmosphere, weathering plays an important role in determining the concentration of this greenhouse gas in the atmosphere. It is estimated that at normal weathering rates, all CO2 in the atmosphere would be removed by weathering in slightly more than 3000 years if it were not for other processes that restore CO2 to the atmosphere. This rate of consumption of CO2 during weathering is so high that weathering plays an important role in buffering the CO2 content of the atmosphere. For example, if the temperature of the planet were to increase, weathering rates would increase, and hence CO2 would be consumed more rapidly, and this greenhouse gas would be removed from the atmosphere and cause global cooling. However, if large amounts of limestone are exposed to weathering, as for example, in the rise of the Tibetan Plateau, CO2 is released into the atmosphere, which would cause warming. This illustrates some of the complex interactions that must be taken into account in modeling the carbon cycle to predict climate change. The fact that weathering reactions can remove CO2 from the atmosphere has also led to serious thought being given to sequestering CO2 by pumping it into rocks where it could be stored as carbonate reaction products (Sec. 17.3.6).
(A)
(B)
11.2.2 Weathering products of rock Early in the Earth’s history, igneous rocks were the dominant source of sediment, but with time, sedimentary and metamorphic rocks have made ever-increasing contributions. The weathering products from these different rock types are essentially the same; only their proportions differ. We chose to illustrate the weathering process by focusing on granite. In Section 9.3.2 (Fig. 9.25), we saw that granite is composed essentially of one-third quartz, two-thirds alkali feldspar, and small amounts of a mafic mineral, usually biotite or hornblende (Fig. 11.3(B)). It also contains accessory amounts of
(C) Figure 11.3 (A) View from the top of Cadillac Mountain, near Bar Harbor, Maine. This granite mountaintop was scraped clean of weathering products during the Wisconsin Ice Age. Since becoming free of ice 16 000 years ago, the fresh granite has begun to weather, especially along joints. (B) Cadillac Mountain granite is composed of white to pink weathering feldspar, gray quartz, and black hornblende. (C) Quartz, feldspar, and hornblende grains weathering out of the granite form detritus that accumulates in the differentially weathered joints. The outcrop surface is covered with gray, green, and black lichens that help weather the granite.
11.2 Sediment formed from weathering of rock
minerals such as magnetite, apatite, and zircon. On weathered surfaces, these minerals undergo oxidation, hydration, and carbonation reactions. Let us illustrate the development of these weathering products by examining the Devonian granite of Cadillac Mountain near Bar Harbor, Maine, on the northeastern coast of the United States. During the Wisconsin Ice Age, all of the weathered granite on this mountain was removed by glacial erosion. When ice left the area 16 000 years ago, the mountain was a smooth polished outcropping of fresh granite rising 470 m above the sea (Fig. 11.3(A)). Since then, the granite has begun to weather. Its alkali feldspar has turned chalky white to pink on the weathered surface as a result of the formation of kaolinite (Sec. 10.4) and the oxidation of trace amounts of iron (Fig. 11.3(B)). These are examples of hydrolysis and oxidation reactions. The granite is relatively impervious, so water is able to penetrate only short distances below the surface except along joints where it can descend hundreds of meters, thus allowing reactions to occur well below the present surface. As a result, the granite is more weathered along joints than in the massive part of the outcrop (Fig. 11.3(A)). On the outcrop surface, lichens help accelerate weathering (Fig. 11.3(C)). Lichens are a symbiotic association of a fungus with photosynthesizing green or blue-green algae (cyanobacteria), the former giving the lichen a green color and the latter a blue-gray color, but other pigments can be present. Lichens are capable of deriving nutrients directly from the rock, which in the granite is mainly potassium from the feldspar. They penetrate into the cleavage planes in feldspar and other minerals. Lichens also release acids that help weather rocks. Despite the evidence for weathering on the surface of the Cadillac Mountain granite, weathering has not progressed far beneath the surface in the 16 000 years since the ice left the region. On breaking open a piece of this granite, perfectly fresh rock is found less than a centimeter beneath the surface. This is in striking contrast with the depth of weathering of granite in regions that have not experienced recent glaciation. For example, a recent road cut through granite near the gold-mining town of Sumpter, Oregon, shows that weathering extends to a depth of more than 10 m (Fig. 11.4). This region did not experience continental glaciation, and so the weathering zone is much older and hence deeper. The small amount of weathering on Cadillac Mountain shows that granite weathering is a slow process, which probably requires on the order of hundreds of thousands of years to develop a thick weathering zone, at least in this temperate climate. Weathering rates in tropical climates are noticeably faster. Weathering products consist of grains of chemically resistant minerals and products of hydrolysis, hydration, oxidation, and carbonation reactions, which include clay minerals, iron hydroxides, and soluble ions. In Figure 11.3(C), we see the detritus formed from weathering of the Cadillac Mountain granite accumulating in the depressions along differentially weathered
Figure 11.4 Road cut through deeply weathered granite near Sumpter, Oregon. Although original joints are still visible, weathering is so advanced that the mineral grains lack cohesion and are forming detritus (granite grus) along the base of the outcrop.
joints. This detritus obviously consists of grains of the minerals in the granite; that is, quartz, alkali feldspar, hornblende, and magnetite (too small to be seen in the figure). Similarly, at the base of the outcrop of granite near Sumpter, Oregon (Fig. 11.4), detritus consists of the weathered grains in the granite. However, if you pick up a handful of this detritus, you find that your hands are covered with fine dust; this is the kaolinite formed from the weathering of the feldspar. Despite its fine grain size, it too is part of the detritus.
11.2.3 Detrital grain size The grain size of detritus produced from weathering of the Cadillac Mountain and Sumpter granites is clearly related to the grain size of the granites, except for the newly formed kaolinite, which is extremely fine. As this detritus is transported to lower elevations and moved by water and wind, its grain size is reduced by abrasion and actual breakage of grains. The finer a particle, the more easily it is moved by water or wind. However, different minerals abrade at different rates, creating grain-size variations that ultimately result in sorting of grains on the basis
313
Formation, transport, and lithification of sediment Table 11.1 The Udden-Wentworth detrital grain-size scale. Particle name
Grain diameter (mm)
Gravel
Boulders
256
Cobbles
64
Pebbles
4
Granules
2
Very coarse sand
1
Sand
Coarse sand
0.5
Medium sand
0.25
Fine sand
0.125
Very fine sand
0.0625
Silt
Mud
314
0.0039
Clay
of size, and consequently type of mineral, during transport. The grain size of detrital sediment is, therefore, one of its most important properties, and we must have a definite way of quantifying this property. The most widely used scale for measuring the grain size of sediment is the Udden-Wentworth scale (Table 11.1). This is a simple geometric scale, in which a grain diameter of 1 mm is taken as the boundary between coarse and very coarse sand, and other boundaries are found by multiplying or dividing by 2.
0.0625 mm
Silt 18 weight % P2O5 (Sec. 10.16). They are composed largely of the mineral apatite, which is often cryptocrystalline and referred to as collophane. Some clay minerals and carbonate shell fragments may also be present, so they straddle the division of sedimentary rocks between siliciclastic mudrocks, bioclastic limestones, and chemical precipitates. Most phosphorites are black (Fig. 10.31), fine grained, and well bedded on the millimeter to meter scale, and they are commonly interlayered with marine limestones, siliciclastic mudrocks, and green sandstones that contain glauconite, a type of clay mineral that grows in the sediment (authigenic)
rather than being of detrital origin. The phosphate minerals form small pellets (>0.05 mm) to larger nodules (several centimeters), and some form ooids, but they do not form by the same process as carbonate ooids. These are cemented together by apatite, chert, carbonate minerals, or even a clay matrix. Phosphorus is not an abundant element in the crust, so phosphorite beds are a remarkable concentration of this element. The phosphorus is probably derived from animal remains that accumulate mainly in shallow marine environments and occasionally in lakes (recall that bones and teeth are made of apatite; see Sec. 7.33), but it moves around in pore fluids, because we find fossils that we know must have initially been composed of aragonite or calcite and are now replaced by apatite. Phosphorites are the main source of phosphorus, which is one of the important ingredients of fertilizer (Sec. 17.2.3). They are mined in many places in Europe (France, Belgium, and Spain), North Africa (Egypt, Tunisia, Algeria, and Morocco), and in North America (Tennessee, Wyoming, Idaho, and coastal South Carolina, Georgia, and Florida).
12.7 Iron-formations Iron-formation is defined as a chemical sedimentary rock, typically thin banded or laminated, containing 15 weight %, or more, total iron of sedimentary origin, commonly but not necessarily containing layers of chert. The average composition of a large number of these formations ranges from about 45 to 55 weight % SiO2, a total Fe content of about 30 weight %, of which ~20% is Fe2O3 and 25% is FeO. The only other major chemical components are CaO and MgO, both ranging from about 3–8 weight %. Although iron-formations are generally considered the result of inorganic precipitation, much ongoing research focuses on the possibility of their precipitation having been mediated by biogenic activity. Iron-formations have a high relative iron content, but they are not, in themselves, iron ores. Most iron ores (see Sec. 16.2) are the result of supergene enrichment of the original iron-formation together with leaching of silica, producing hematite-goethite-rich ores in iron-formation sequences. Other iron ores are obtained through beneficiation, which involves the improvement of the ore grade by milling, flotation, magnetic separation, and gravity concentration of iron-formations that have undergone metamorphism.
Summary This chapter discussed the classification of sedimentary rocks into three main groups, the siliciclastic sedimentary rocks, the biogenic sedimentary rocks, and the chemical sedimentary rocks. The sites of deposition and plate tectonic settings of each of the main types of sedimentary rock were discussed. The value of sedimentary rocks as sources of fossil fuel, construction materials, and various ores of elements such as iron, gold, uranium, copper, phosphorus, potassium, and sodium was also discussed. The following are the main points covered in this chapter:
• Sedimentary rocks fall into three main categories based on the type of sediment from which they are formed: siliciclastic, biogenic, and chemical. These include the most abundant rock types: mudrocks, sandstones, conglomerates, limestones, dolostones, and the less abundant but important coals, evaporites, phosphorites, and iron-formations.
363
364
Sedimentary rock classification, occurrence, and plate tectonic significance
• Siliciclastic sedimentary rocks are the most abundant, with mudrocks forming about two-thirds of all sedimentary rocks. Mudrocks with prominent fissility are called shales.
• Mud-size particles settle only in still water, which is normally found below wave base in lakes and seas or on river floodplains. • Fine-scale laminations in mudrocks are normally preserved only under anoxic conditions where burrowing organisms do not live. • The color of mudrocks ranges from red through green to black. The red is due to oxidized iron, whereas the black is due to organic matter that is preserved under reducing conditions.
• • • •
The thickest mudrocks are formed at convergent plate boundaries in forearc and foreland basins. Mudrocks are also formed on the outer part of continental shelves along passive margins and on continents in epeiric seas. Mudrocks are of importance because they are the source of hydrocarbons. Sandstones, which constitute ~25% of all sedimentary rocks, are classified using their relative contents of detrital quartz, feldspar, and lithic fragments. The most common types are quartz arenites, feldspathic arenites, and lithic arenites. Most sandstones contain very little matrix, but if the matrix exceeds 15%, it is called a wacke or graywacke. The type of cement in sandstone is not used in classifying them, but it is added to the name as a qualifier.
• Mature sandstones are quartz-rich because unstable feldspar and lithic fragments have been removed by abrasion and weathering. In supermature sandstone, quartz grains become rounded, especially in eolian deposits.
• Mature quartz arenites characterize passive continental margins; immature wackes characterize forearc basins at convergent plate boundaries; and feldspathic arenites are typical of continental rift valleys.
• Wackes typically form graded beds, which are interpreted to indicate deposition from turbidity currents. • Conglomerates, which consist of gravel-size particles, are formed in high-energy environments, such as river channels, alluvial fans, beaches, submarine fans, debris flows and glacial deposits. They can be clast supported or matrix supported, which indicates very different depositional environments.
• Placer deposits of gold and hydrothermal deposits of uranium and copper are associated with conglomerates. • Carbonate sedimentary rocks are commonly formed in shallow, warm clear water where calcareous organisms flourish. They tend not to form where the input of detrital sediment is great.
• Carbonate rocks are classified on the basis of the proportions of primary carbonate grains (allochems) and the relation of these grains to the matrix or cement that binds them together.
• Most limestones are of marine origin, but they can also form in lakes where they tend to be mixed with clay to form a rock known as marl. • Limestone also forms around both cold and hot springs to form tufa and travertine. • Most dolostones form as a replacement of limestone, but some may form as a primary precipitate. • Coal is classified by rank, which reflects the amount of heat released during combustion. With increasing rank, coal changes from brown lignite, to black bituminous coal, to anthracite with almost a metallic luster.
• Oil is generated in an organic-rich source rock, such as black shale. It accumulates in a reservoir rock, usually a porous sandstone, limestone or dolostones. And it is capped by an impermeable rock, such as shale.
• Evaporites commonly contain a basal layer of limestone, overlain by gypsum or anhydrite, and capped by salt, but many evaporite deposits never reach the salt-precipitating stage.
• Phosphorites are mainly marine sediments composed largely of apatite. • Iron-formation is an iron-rich, well-banded chemical sedimentary rock that was formed only in the Precambrian when the atmosphere-ocean system was anoxic, allowing for the solution, transport, and chemical precipitation (in such oceans) of Fe2+ (and mixed Fe2+ and Fe3+) mineral phases.
Review questions 1. Sedimentary rocks can be divided into three main groups. What are these groups, and what are the main rock types in each? 2. What are siliciclastic sedimentary rocks, and from what type of sediment are they formed? 3. What simple test allows you to determine whether mudrock contains silt- or clay-size particles?
Review questions
4. What makes shale fissile? 5. What destroys fine-scale laminations in mudrocks? 6. What determines the color of mudrocks? 7. How do rip-up clasts form? 8. Where do the thickest mudrocks occur, and what plate tectonic significance do such deposits have? 9. The object of this question is to determine the percentage of clay matrix in the photomicrograph of Potsdam Sandstone
shown in Figure 12.7(A) using the NIH ImageJ program. First, download the photomicrograph from the textbook’s Web site (www.cambridge.org/earthmaterials) and import the image into the ImageJ program. Follow the instructions given in Box 6.2 to determine the percentage of clay matrix. (Answer ∼9.2%) 10. If your answer to question 9 had indicated more than 15% matrix, what would you have called this sandstone? 11. What features indicate that a sandstone is chemically and texturally mature? 12. What are the differences between quartz arenite, feldspathic arenite, and litharenite? 13. What bedding differences distinguish feldspathic arenite from wacke, and what does this tell you about the site of deposition? 14. What is the difference between a clast-supported and a matrix-supported conglomerate, and what do these rocks tell you
about the environment of deposition? 15. Why are mudrocks, sandstones, and conglomerates commonly interlayered in fluvial deposits? 16. What conditions favor the growth of calcareous organisms that form limestone, and what restrictions does this place on
their sites of deposition? 17. How do we classify carbonate sedimentary rocks? 18. How would you distinguish carbonate cement from an allochem or calcareous mud? 19. What is the connection between the enormous amount of chalk formed during the Cretaceous Period and plate tectonics? 20. What are the three main types of coal, and which releases the most heat upon combustion? 21. What three types of rock are needed to form an oil field? 22. What is the difference between porosity and permeability? 23. What are some typical traps in which oil reservoirs may form? 24. What is the sequence of precipitation of evaporite minerals from seawater as it evaporates? 25. What is the probable source of phosphorus in phosphorites? 26. What is banded iron-formation and what must happen to it to make it iron ore?
ONLINE RESOURCES The Society for Sedimentary Geology’s Web site (http:// sepmstrata.org) provides useful information about sedimentary petrology. The National Institutes of Health’s ImageJ software program can be downloaded for free from http://rsb.info.nih.gov/ij.
FURTHER READING Blatt, H., Tracy, R. J., and Owens, B. E. (2006). Petrology, W. H. Freeman, San Francisco. This book provides an excellent general coverage of sedimentary processes and rocks. Boggs, S., Jr. (2009). Petrology of Sedimentary Rocks, 2nd ed., Cambridge University Press, Cambridge. This
book provides an in-depth coverage of sedimentary rocks. McBride, E. F. (1963). A classification of common sandstones. Journal of Sedimentary Research, 33, 664–669. Pufahl, P. K. (2010). Bioelemental sediments. In Facies Models, 4th ed., ed. N. P. James and R. W. Dalrymple, Geological Association of Canada, St. Johns. Stow, D. A. V. (2006). Sedimentary Rocks in the Field – A Color Guide, Elsevier Academic Press, Burlington, VT. Scoffin, T. P. (1987). An Introduction to Carbonate Sediments and Rocks, Chapman & Hall, New York. Tucker, M. E. (1991). Sedimentary Rocks: An Introduction to the Origin of Sedimentary Rocks, 2nd ed., Blackwell Scientific Publications, Oxford, U.K.
365
CHAPTER
13
Metamorphic rock-forming minerals
This chapter, like Chapters 7 and 10, provides systematic descriptions of minerals but only for those that occur most commonly in metamorphic rocks. As was noted already, the best way for you to acquire basic skills in mineral identification is to read each mineral description while you have one or several examples of this same mineral on a tabletop where you are working. Clearly, this is best accomplished in a place where your instructor has mineral collections available for study. In most courses, this is in the laboratory that accompanies the course. Observe, study, and handle as many examples of the same mineral species as are available. If possible, also look at coarse-grained examples of metamorphic rocks that may contain some representative metamorphic mineral associations.
Large euhedral kyanite and staurolite crystals in a paragonite schist (paragonite is isostructural with muscovite but with Na+ instead of K+ in the interlayer position). From Alpa Sponda, Switzerland. The size of the field of view is 12 × 19 cm. (David Nufer Photography, Albuquerque, New Mexico.)
368
Metamorphic rock-forming minerals
This chapter presents the systematic mineral descriptions of 26 of the most common metamorphic minerals. All of these are silicates except for one, corundum, an oxide. Such minerals are the result of chemical reactions involving preexisting minerals in sedimentary, igneous, or metamorphic rocks. These reactions may result from changes in temperature, pressure, fluids, and shearing stress at considerable depth in the Earth (see Chapter 14). Mineral reactions that are the result of an increase in temperature are referred to as prograde, whereas those that result from falling temperatures are retrograde. Retrograde metamorphic reactions commonly involve the addition of fluids.
13.1 Systematic mineralogical descriptions of common metamorphic minerals The order in which metamorphic minerals are discussed in this chapter reflects their relative abundance. We begin with minerals that are common in some of the most abundant metamorphic rock types. An example of such an abundant rock type would be what is known as a pelitic schist. A pelitic schist is a rock derived by metamorphism of an argillaceous (meaning composed of clay-sized particles or clay minerals) or fine-grained aluminous sediment. Prograde metamorphic reactions in such a rock may produce sequentially metamorphic assemblages rich in chlorite and muscovite; subsequently garnet-staurolite-biotite-muscovite assemblages; and at the highest temperature, sillimanite-garnet-cordierite-feldspar assemblages. Members of the mica group (muscovite and biotite) and the feldspars are major constituents of these metamorphic rocks but their systematic descriptions are given in Chapter 7 because they are also major constituents of igneous rocks. Similarly quartz, abundant in igneous, sedimentary, and metamorphic rocks, was discussed in detail in Chapter 7. This means that because the systematic mineralogy in this text is arranged by common occurrence in igneous, sedimentary, and metamorphic rock types, those minerals that are common to two or all three of these lithologic divisions are described only once. Therefore, although micas, quartz, and feldspar may be common constituents in metamorphic rocks, you must refer to these minerals in Chapter 7, where they were first described. Here we concentrate on those minerals that are newly formed as a result of metamorphic reactions.
Chemical composition and crystal structure: The highly variable chemical composition of members of the garnet group is best expressed by a generalized chemical formula, A3B2(SiO4)3, where the A site houses Ca2+, Mg2+, Fe2+, or Mn2+ and the B site is the location for Al3+, Fe3+, or Cr3+. In terms of end member compositions, this leads to six formulas with specific species names: Mg 3 Al 2Si 3O12 − pyrope Fe 3 Al 2Si 3O12 − almandine Mn3 Al 2Si 3O12 − spessartine
⎫ ⎪ s te group ⎬ pyralspi ⎭⎪
Ca 3 Al 2Si 3O12 − grossular ⎫ ⎪ Ca 3Fe 2Si 3O12 − andradite ⎬ ugrandite group Ca 3Crr2Si 3O12 − uvarovite ⎪⎭ The group names are derived from parts of the three mineral names in each group: Pyrr (from pyrope), e all (from almandinee), and spp (from spessartinee). Similarly, u (from uvarovite), e gr (from grossular), r and andd (from andradite). e These group names are used because solid solution among the three member of the pyralspite group is extensive, as among the three of the ugrandite group, but little solid solution occurs between these two major groups (Fig. 13.1). The crystal structure of one of the garnet species, grossular, Ca3Al2Si3O12, is illustrated in Figure 13.2. It consists of alternating (SiO4) tetrahedra and (AlO6) octahedra that share corners to form a continuous three-dimensional network in a dense structural pattern. The A site in this garnet is occupied by Ca2+ in an irregular 8-fold coordination polyhedron. Garnets, as well as olivine, and the three polymorphs of Al2SiO5 (kyanite, sillimanite, and andalusite) are part of the structural group of silicates known as nesosilicates. In these, the (SiO4) tetrahedra are independent, or islands, which means that they are not linked to any other (SiO4) tetrahedra in the structure. (Mg, Fe, Mn)3 Al2 Si3 O12 pyralspite 100 90 80 70 60 Molecular % 50 40 30
13.2 Garnet: (Mg2+, Fe2+, Mn2+)3 Al2Si3O12 and Ca3(Fe3+, Al3+, Cr3+)2Si3O12 Occurrence: Garnet is one of the most common metamorphic minerals. Those rich in Fe2+, known as almandine, are common in metamorphosed pelitic and mafic igneous rocks. Ca-rich garnets such as grossular occur in the metamorphosed equivalents of carbonate-rich rocks. Some aluminous granites may contain almandine.
20 10 0 Ca3 Al2 Si3O12 grossular
Ca3 Fe2 Si3 O12 andradite
Figure 13.1 The limited extent of solid solution between the two compositionally distinct garnet groups. Pyralspite includes pyrope, almandine, and spessartine. Grossular and andradite, together with uvarovite, are part of the ugrandite group.
13.2 Garnet
Grossular: Ca3Al2Si3O12 I 41/a 3 2/d a3
Si4+
Al3+
Ca2+ a2
a1 Figure 13.2 Perspective view of the crystal structure of grossular. All other garnet species have similar overall structures but different site occupancies. A cubic unit cell is outlined.
Crystal form: Isometric; 4/m 3 2/m. m Common crystal forms are dodecahedra (Fig. 2.5(B)) and trapezohedra (Fig. 13.3). Commonly in distinct crystals but also occur as rounded grains (see photograph on front cover of this text). May be massive, granular, coarse to fine. Physical properties: H = 6½–7½; G = 3.5–4.3. These physical parameters vary as a function of composition. Dodecahedra and trapezohedra are common crystal forms. Conchoidal fracture with many angular corners and edges. Color is highly variable but most common garnets range from red to reddish brown to brown, and black. Distinguishing features: Good isometric crystal forms, relatively high hardness, and general red to brown to black color. Uses: The angular fracture pattern of garnet and its relatively high hardness make it desirable for a range of abrasive purposes, including garnet paper. Because of the wide range of colors shown by garnets (most commonly red – see Fig. 2.5(A) – but also pink, orange, yellow, green and brown) due to their highly variable chemical composition, clear and transparent material of good color is extensively used in the jewelry industry. Figure 13.4 shows a very attractive orange-red crystal of grossular. All garnet species of gem quality are used except uvarovite, a brilliant, dark-green variety that occurs in small crystals generally too
Figure 13.3 Large euhedral, trapezohedral crystals of almandine garnet in mica schist.
369
370
Metamorphic rock-forming minerals
Figure 13.4 An orange-red, distorted dodecahedral crystal of grossular. Although this crystal has a most attractive color, it contains many imperfections (inclusions and microfractures), which makes it unusable as a gemstone.
small for cutting. Demantoid, a dark-green to yellow-green variety of andradite (with the green color caused by small amounts of chromium) is a highly sought-after gemstone.
13.3 Andalusite: Al2SiO5 Occurrence: Commonly found in low- to medium-grade metamorphosed aluminous rocks referred to as pelitic schists. Also in the contact aureoles of igneous intrusions into aluminous rocks. It is one of three polymorphs of Al2SiO5 with a temperature-pressure stability field (Fig. 5.33(B)) in the lowtemperature and low-pressure region. The higher-temperature sillimanite and higher-pressure kyanite polymorphs are discussed in Sections 13.4 and 13.5, respectively. Chemical composition and crystal structure: Essentially of constant composition, Al2SiO5. The structure (shown in Fig. 5.35(A)) consists of chains of edge-sharing (AlO6) octahedra parallel to the c axis, that are cross-linked by independent (SiO4) tetrahedra. A second set of Al atoms occurs in 5-fold coordination between the octahedral chains. Crystal form: Orthorhombic; 2/m 2/m 2/m m. Commonly in square prisms. Physical properties: H = 7½; G ∼3.2. Transparent to translucent. Color white when pure but commonly grayish to flesh colored to reddish-brown because of inclusions. The variety chiastolite (Fig. 13.5) contains graphite inclusions arranged in a regular pattern with a cruciform outline.
Figure 13.5 Crystals of the chiastolite variety of andalusite as seen in a polished piece of beige phyllite (a metamorphic rock intermediate between slate and mica schist). The black cruciform pattern results from crystallographically arranged graphite inclusions.
Distinguishing features: Square prisms and hardness. Chiastolite is easily recognized by the symmetrical pattern of inclusions. Uses: All three polymorphous of Al2SiO5 (andalusite, sillimanite, and kyanite) are mined to produce mullite, a hightemperature reaction product that is a major component of high-temperature refractories used in the smelting and processing of ferrous metals. This reaction is as follows: 3Al 2SiO5 + heat → 3 Al 2O3 ⋅ 2 SiO 2 + andalusite mullite
SiO2 amorphous silica
Mullite is also used in glass making and in the production of ceramics such as found in spark plugs.
13.4 Sillimanite: Al2SiO5 Occurrence: Present in aluminous high-temperature metamorphic rocks. At lower temperatures andalusite is stable, and at lower temperatures and higher pressures kyanite occurs (Fig. 5.33(B)). Chemical composition and crystal structure: The chemical composition is essentially Al2SiO5. A polyhedral representation of the structure of sillimanite is given in Figure 5.35(B). It consists of chains of edge-linked (AlO6) octahedra parallel to the c axis cross-linked by (SiO4) and (AlO4) tetrahedra.
13.6 Staurolite
Figure 13.6 Slender, parallel crystals of beige to brown sillimanite.
Crystal form: Orthorhombic; 2/m 2/m 2/m. Most commonly in long, slender crystals (Fig. 13.6). Also fibrous. Physical properties: H = 6.7; G = 3.23. Perfect {010} cleavage. In slender crystals; commonly fibrous. Color ranges from beige to brown, pale green, and white. Distinguishing features: Characterized by its fibrous nature or slender crystals and one cleavage direction. Uses: In the production of high-temperature refractory materials as discussed under uses for andalusite.
13.5 Kyanite: Al2SiO5 Occurrence: A mineral produced during high-pressure metamorphism of aluminous (pelitic) rocks. Commonly associated with staurolite (see chapter-opening photograph and Fig. 13.7)
Figure 13.7 Euhedral blue crystals of kyanite together with dark reddishbrown euhedral crystals of staurolite in fine-grained mica schist.
and garnet. Andalusite is the lower pressure polymorph of Al2SiO5 and sillimanite the high-temperature polymorph (Fig. 5.33(B)). Chemical composition and crystal structure: The composition of kyanite is Al2SiO5. A polyhedral representation of its structure is shown in Figure 5.35(C). It consists of chains of (AlO6) octahedra parallel to the c axis that are cross-linked by additional (AlO6) octahedra and (SiO4) tetrahedra. In this Al2SiO5 polymorph, all the Al is in octahedral coordination. Crystal form: Triclinic; 1. Usually in long, tabular crystals (Figs. 13.7 and 3.1(E)). Also in bladed aggregates. Physical properties: H = 5 (parallel to the length of crystals); H = 7 (at right angles to that direction); G = 3.6. Cleavage {100} perfect. The color is usually light blue with a slightly darker blue color in the center of crystals. Also white and gray, the gray being due to minute graphite inclusions. Distinguishing features: Characterized by good planar cleavage, patchy blue color and different hardnesses in two perpendicular crystallographic directions. Uses: In the production of high-temperature refractory materials as discussed under uses for andalusite.
13.6 Staurolite: Fe3–4Al18Si8O48H2–4 Occurrence: A strictly metamorphic mineral in aluminous rocks formed in prograde reactions under mediumtemperature conditions. Commonly associated with kyanite (see chapter-opening photograph) and garnet. Chemical composition and crystal structure: The formula given shows variable amounts of Fe2+ as a result of vacancies that replace Fe2+ up to several percent. Small amounts of Zn, Co, Mg, and Al may replace Fe2+ as well. A perspective view of a polyhedral representation of the crystal structure of staurolite is given in Figure 13.8. It consists of (SiO4) and (FeO4) tetrahedra connected to (AlO6) octahedra. The (AlO6) octahedra form edge-sharing chains parallel to the c axis but not all these Al sites are occupied. Octahedral sites that may not be fully occupied, or may contain atoms other than Fe (e.g., Zn, Ca) are shown in yellow in Figure 13.8. Silicon occurs in isolated (SiO4) tetrahedra. Crystal form: Monoclinic; 2/m. Crystals appear pseudoorthorhombic because the β angle is essentially 90°. Prismatic crystals are common (Fig. 13.7). Also occurs as two types of cruciform twins: (1) with a twin angle of nearly 90° making square crosses and (2) with a twin angle of about 60° resulting in inclined crosses (see Fig. 5.20(B)). Physical properties: H = 7–7½; G ∼3.7. Commonly in prismatic crystals. Also as cruciform twins. Color reddish brown to brownish black. With a resinous to vitreous luster on a fresh broken surface. Distinguishing features: Prismatic red-brown crystals and cruciform twins are highly diagnostic. Relatively high hardness.
371
372
Metamorphic rock-forming minerals
Staurolite: Fe3–4Al18Si8O48H2–4 C 2/m c
b Figure 13.9 Three prismatic, dark-green diopside crystals. Two of the three (left and right front) show well-developed parting parallel to {001}.
a Si4+
Al3+
Fe2+
Vacant or V partially occupied by Zn2+, Mg2+, CO2+ Figure 13.8 Perspective polyhedral representation of the structure of staurolite. A monoclinic unit cell is outlined.
Uses: It is used as an abrasive, as an alternative to garnet, such as in sand blasting and abrasive papers. Well-formed right-angle twins are sold as fairy-stone pendants and earrings; however, most of the crosses are imitations carved from finegrained rock (i.e., subsequently dyed) or molded plastic. In Sections 13.2–13.6, we have systematically treated five silicates (among them a group, the garnets) that are common in metamorphic alumina-rich rocks. In subsequent sections, we describe several other silicates that can be common in metamorphic assemblages as well. These are diopside, a member of the pyroxenes, and several members of the amphibole group, such as anthophyllite, cummingtonite-grunerite, tremolite-actinolite, and glaucophane. Other members of both of these chain silicate groups have already been described in Chapter 7, including enstatite, pigeonite, augite, and aegirine (members of the pyroxene group) and hornblende (a common member of the amphibole group, both in igneous and in metamorphic rocks). Related chain silicates, wollastonite and rhodonite, both members of the silicate group of pyroxenoids, follow glaucophane.
13.7 Diopside: CaMgSi2O6 Occurrence: Diopside is a common constituent of marble as well as other metamorphosed carbonate-rich rocks, where it occurs in assemblages such as diopside-tremolite-grossularepidote-dolomite-calcite and diopside-forsterite-wollastonitedolomite-calcite.
Chemical composition and crystal structure: A complete solid solution series exists between CaMgSi2O6, diopside, and CaFeSi2O6, hedenbergite (see Fig. 7.18). The crystal structure of diopside is shown in Figure 7.23(A) and consists of infinitely extending single chains of tetrahedra parallel to the c axis that are cross-linked to octahedral chains containing Mg2+ and/or Fe2+. The Ca2+ ions are located in an irregular 8-coordinated site. Crystal form: Monoclinic; 2/m. Commonly in prismatic crystals with square or eight-sided cross-sections (Fig. 13.9) with well-developed parting. Physical properties: H = 5–6; G ∼3.25. Crystals show blocky, prismatic habit. Also granular and/or massive. Generally good cleavages at 87° and 93°. Color ranges from white to light green, becoming darker green with increasing Fe2+ content. Hedenbergite is dark green to black. Distinguishing features: Prismatic crystals with square or eight-sided outline. Good prismatic cleavage at 87° and 93°. Color generally white to light or dark green. Uses: No commercial uses.
13.8 Anthophyllite: Mg7Si8O22(OH)2 Occurrence: A common mineral in metamorphosed Mgrich, ultramafic rocks of medium to high grade. Unknown in igneous rocks. It also occurs in cordierite-bearing schists and gneisses. Chemical composition and crystal structure: Anthophyllite is an end member in a partial solid solution series that extends from Mg7Si8O22(OH)2 to about Fe2Mg5Si8O22(OH)2 (Fig. 13.10). More iron-rich compositions, from Fe2Mg5Si8O22(OH)2 to Fe7Si8O22(OH)2, are part of a separate amphibole solid solution series known as cummingtonite-grunerite. An aluminum-rich variety of anthophyllite is known as gedrite. Members of the anthophyllite series are orthorhombic, whereas cummingtonitegrunerite compositions are monoclinic. The crystal structures
13.10 Tremolite-ferroactinolite “Ca7 Si8 O22 (OH)2” 50 60 Tremolite Ca2 Mg5 Si8O22 (OH)2
Molecular %
70 Actinolite
80
Ferroactinolite Ca2 Fe5 Si8O22 (OH)2
90 Cummingtonite – grunerite Mg7 Si8 O22 (OH)2
100
Fe7 Si8 O22 (OH)2 Anthophyllite
Figure 13.10 Extent of several amphibole solid-solution series in the chemical system Mg7Si8O22(OH)2-Fe7Si8O22(OH)2-“Ca7Si8O22(OH)2.” The Ca-rich composition is given in quotation marks because it does not occur in nature. This diagram should be compared with a similar illustration for common pyroxene compositions in Figures 7.18 and 7.24. Tie lines connect coexisting amphibole compositions across a miscibility gap. (Adapted from Klein, C. (2005) Some Precambrian iron-formations (BIFs) from around the world: Their age, geologic setting, mineralogy, metamorphism, geochemistry, and origin. American Mineralogistt, 90, 1473–1499).
of orthorhombic and monoclinic amphiboles are similar, and for this reason we refer back to an illustration of a common monoclinic amphibole, hornblende, in Figure 7.27(A). In the orthorhombic structure of anthophyllite, Mg2+ is housed in the blue sphere site that houses Ca2+ in hornblende. In the orthorhombic structure, this site is slightly smaller than in hornblende, so as to accommodate Mg2+ in a tighter, smaller 6-coordinated space. m. Rarely in disCrystal form: Orthorhombic; 2/m 2/m 2/m tinct crystals. Generally fibrous (Fig. 13.11). Physical properties: H = 5½–6; G = 2.85–3.2. Rarely in good crystals. Commonly fibrous as well as lamellar. Color ranges from beige to brown to greenish brown. Distinguishing features: Fibrous habit and beige to brown color are diagnostic. In hand specimens, it cannot be distinguished from members of the cummingtonite-grunerite series. Uses: Small amounts of fibrous anthophyllite were mined in the past for the asbestos industry. Now it is of no economic importance.
Figure 13.11 Fibrous beige anthophyllite.
13.9 Cummingtonite-grunerite: Fe2Mg5Si8O22(OH)2-Fe7Si8O22(OH)2 Occurrence: Members of this amphibole solid solution series are of metamorphic origin. In amphibolites, cummingtonite commonly coexists with hornblende or members of the tremolite-actinolite series (see tie lines in Fig. 13.10). The more ironrich compositions (toward the grunerite end-member) are common in metamorphosed Precambrian iron-formations. Chemical composition and crystal structure: A complete solid solution series extends from Fe2Mg5Si8O22 to Fe7Si8O22(OH)2, (see Fig. 13.10). The crystal structure is monoclinic (that of a clinoamphibole) and is very similar to that of hornblende shown in Fig. 7.27(A). In the composition Fe2Mg5Si8O22(OH)2 most of the Fe2+ is preferentially housed in the large Ca position in hornblende. In grunerite, Fe7Si8O22(OH)2, the Fe is housed across all available octahedral sites. Crystal form: Monoclinic; 2/m. Rarely in distinct crystals. Commonly lamellar or fibrous (Fig. 13.12). Physical properties: H = 5½–6; G = 3.1–3.6. Most commonly fibrous but when in crystals shows perfect {110} cleavage at 56° and 124°. Color ranges from light to darker brown. Distinguishing features: Light brown to brown color and fibrous habit are diagnostic. In hand specimens, it cannot be uniquely distinguished from anthophyllite. Uses: A rare and highly fibrous (asbestiform) variety of cummington known as amosite was mined in the Penge region of South Africa as part of the asbestos industry. This mining district was closed in 1993 on account of the serious health hazard posed by amphibole asbestos.
13.10 Tremolite-ferroactinolite: Ca2Mg5Si8O22(OH)2-Ca2Fe5Si8O22(OH)2 Occurrence: Tremolite and actinolite (both compositional members of the tremolite-ferroactinolite series; see Fig. 13.10) are found in low-grade metamorphic rocks and in metamorphosed limestones and metamorphic ultramafic rocks.
Figure 13.12 Fibrous light-brown cummingtonite.
373
374
Metamorphic rock-forming minerals
Uses: Except for earlier use of small amounts of fibrous actinolite in the asbestos industry, tremolite, actinolite, and hornblende have no industrial uses.
13.11 Glaucophane: Na2Mg3Al2Si8O22(OH)2
Figure 13.13 Green prismatic crystals of actinolite in muscovite schist.
Hornblende, an aluminum-containing member of the series is common in igneous rocks (see Sec. 7.15) but is also a major constituent of metamorphic amphibolites. Chemical composition and crystal structure: The magnesian end-member, Ca2Mg5Si8O22(OH)2, is known as tremolite. An intermediate region of this solid-solution series is referred to as actinolite (see Fig. 13.10). All members of the tremoliteferroaclinolite series are Al-poor clinoamphiboles. These compositions extend into the range of Al-rich clinoamphiboles known as hornblende. A crystal structure illustration of hornblende is shown in Figure 7.27(A). Crystal form: Monoclinic; 2/m. Commonly in prismatic crystals (Fig. 13.13). Physical properties: H = 5–6; G = 3.0–3.2. Commonly in prismatic crystals. Also fibrous. Perfect {110} cleavages at 56° and 124°. Color white in tremolite but green in actinolite. Color deepens with increasing Fe2+ content. Hornblende is normally dark green to black (Fig. 7.28). Distinguishing features: Good amphibole cleavage and slender prismatic crystals. Green actinolite cannot be distinguished from green hornblende in hand specimens (compare Figs. 13.13 and 13.14).
Figure 13.14 Dark-green acicular crystals of hornblende in a feldspar matrix.
Occurrence: Glaucophane is a member of the clinoamphibole group and occurs in metamorphic rocks formed at low temperatures and high pressures. It is commonly found in association with lawsonite and jadeite, NaAlSi2O6 (a clinopyroxene). This assemblage characterizes the blueschist facies. Hand specimens rich in glaucophane are commonly referred to as blueschists because glaucophane is blue. Chemical composition and crystal structure: Most glaucophane contains some Fe2+ substituting for Mg2+, and Fe3+ in place of Al3+. Therefore, the chemical formula given here is that of a pure end member. The structure of glaucophane is similar to that of other clinoamphiboles such as hornblende (Fig. 7.27(A)), with Na+ in the Ca2+ position in hornblende and (Mg3Al2) in the five octahedral positions between the double tetrahedral chains. Crystal form: Monoclinic; 2/m. m In slender, acicular crystals. Physical properties: H = 6; G = 3.1–3.4. Color blue to blue black to black, becoming darker with increasing iron content. Distinguishing features: In hand specimens, it is generally fibrous or acicular and shows a blue color. Distinctly blue pleochroism (Fig. 13.15) distinguishes glaucophane from most other minerals. Uses: There is no commercial use for glaucophane. However, a similar clinoamphibole, rich in Fe2+ and Fe3+, known as riebeckite occurs in a highly fibrous (asbestiform) habit and is known as crocidolite (Fig. 13.16). This mineral, also known as blue asbestos, represented about 2–3% of the total global production of asbestos; about 95% was chrysotile, also known as white asbestos. Crocidolite is a much greater health hazard than chrysotile (see Sec. 17.3.2). Brown crocidolite (colored brown
Figure 13.15 Glaucophane in a thin section as seen in plane polarized light. It is highly pleochroic and shows the typical lavender-blue color in one crystallographic direction. Width of field of view is 3 mm.
13.12 Wollastonite
Wollastonite: CaSiO3 P1 c
Si4+ Ca2+
Figure 13.16 Two broken parts of a hand specimen of crocidolite, a highly fibrous (asbestiform) variety of riebeckite known in the trade as blue asbestos.
due to oxidation) and replaced by quartz, known as tiger’s eye, shows attractive chatoyancy and is used in jewelry.
13.12 Wollastonite: CaSiO3 Occurrence: A high-grade metamorphic mineral commonly in contact metamorphic zones in impure limestone. It is the result of the following reaction: CaCO3 + SiO 2 → calcite quartz
CaSiO3 + CO 2 wollastonite
Chemical composition and crystal structure: Most chemical analyses are close to the end member composition CaSiO3. Its crystal structure is similar but not identical to that of the pyroxenes, with single tetrahedral chains. However, its structure with regular kinks in the tetrahedral chains, is known as a pyroxenoid. An illustration of the crystal structure of wollastonite is given in Figure 13.17. It consists of infinitely extending tetrahedral chains parallel to the c axis, in which the smallest repeat unit in the chains consists of three adjoining tetrahedra. In other words, there is a kink in the chain after every third tetrahedron. The chains are cross-linked by distorted CaO octahedra. Crystal form: Triclinic; 1. Rarely in tabular crystals. Commonly massive. Physical properties: H = 5–5½; G = 2.9. Perfect {100} and {001} cleavages producing splintery fragments. Commonly in cleavable masses (Fig. 13.18). Color ranges from colorless to white, or gray. Distinguishing features: Characterized by two perfect cleavages at ∼84°. May resemble white to light-colored tremolite but is distinguished by different cleavage angles.
b a Figure 13.17 Perspective view of the polyhedral crystal structure of wollastonite. A triclinic unit cell is outlined.
Uses: Wollastonite with a fibrous habit, but with fibers that are not flexible as in chrysotile (i.e., white asbestos) is used commercially as a substitute for asbestos. Wollastonite is not considered a health hazard. Wollastonite is used in fire-resistant products such as floor and roofing tiles and insulation. It also has a major use in the ceramics industry and in glazes. It is a filler in paint and paper production.
Figure 13.18 Massive white wollastonite exhibiting well-developed cleavage surfaces parallel to {100} and {001}.
375
376
Metamorphic rock-forming minerals
13.13 Rhodonite: MnSiO3 Occurrence: Rhodonite is strictly a metamorphic mineral and is restricted to assemblages in metamorphosed manganese deposits and manganese-rich iron-formations. It is commonly the result of the following reaction: MnCO3 + SiO2 → MnSiO3 + CO2 rhodochrosite quartz rhodonite Chemical composition and crystal structure: Rhodonite is seldom pure MnSiO3 and up to 20 molecular % of the Mn may be replaced by Ca, Mg, or Fe. The perspective polyhedral structure illustration in Figure 13.19 is that of a calcium-containing rhodonite. It consists of tetrahedral SiO3 chains parallel to the c axis with a unit repeat of five twisted tetrahedra (wollastonite has a repeat of three twisted tetrahedra; see Fig. 13.17). Both rhodonite and wollastonite are part of the silicate group known as pyroxenoids. The Mn is distributed over the octahedral sites, with Ca in an irregular site with 7-fold coordination. Crystal form: Triclinic; 1. Crystals commonly tabular parallel to {001}. Physical properties: H = 5½–6; G = 3.4–3.7. Two perfect cleavages, parallel to {110} and {1 1 0} (Fig. 13.20). Color ranges from rose red to pink to pinkish brown. Distinguishing features: Recognized by its pink color and two cleavage directions at about 90°. Distinguished from rhodochrosite by greater hardness. Uses: Its pink color and relatively high hardness make it a desirable material for small carvings. Massive material is used to fashion beads and cabochons.
Rhodonite: MnSiO3 with about 14 molecular percent CaO P1 c
Figure 13.20 Massive rhodonite showing well-developed cleavage surfaces parallel to {110} and {1 10}.
13.14 Talc: Mg3Si4O10(OH)2 Occurrence: Talc is common as a retrograde mineral in metamorphosed ultramafic rocks formed by the alteration of magnesium silicates, such as olivine, pyroxenes, and amphiboles. Characteristic of low-grade metamorphic rocks, where, in massive form, soapstone, it may compose the entire rock mass. Also in schists, such as talc schist, and in shear zones in metamorphic rocks. Chemical composition and crystal structure: There is little variation in the chemical composition of talc as given in Mg3Si4O10(OH)2. The crystal structure of talc consists of infinitely extending trioctahedral sheets sandwiched between two opposing infinitely extending tetrahedral sheets resulting in t-o-tt layers (Fig. 13.21). In a trioctahedral sheet, all TTalc: Mg3Si4O10 (OH)2 C1 c
SiO4 MnO6 Ca
Si4+ Mg2+
b Figure 13.19 Perspective view of the polyhedral crystal structure of a calcium-containing rhodonite. The c and b axes of a triclinic unit cell are shown.
Figure 13.21 Perspective view of the polyhedral crystal structure of talc, which consists of infinitely extending t-o-tt layers. Only the c axis direction of the triclinic unit cell is visible.
13.15 Chlorite
the octahedral positions are fully occupied by Mg2+ without any intervening vacancies (see Sec. 7.17 for further discussion). Talc is a member of the group of layer silicates, or phyllosilicates. Crystal form: Triclinic; 1. Crystals rare. Usually in foliated masses (Fig. 13.22). Physical properties: H = 1 (marks cloth); G ∼2.75. Generally found in foliated masses, but also massive. Color ranges from apple green to gray and white. Commonly with a pearly luster. Distinguishing features: It is identified by its foliated (micaceous) habit, softness, excellent cleavage, and greasy feel. Uses: Talc is an extremely versatile mineral. In the paint industry, it is used as an extender and filler that improves the integrity of the paint. It serves as a filler in the paper industry to
Figure 13.22 Massive foliated talc.
improve ink receptivity. It is a common constituent of ceramic tiles in the United States, where wall tiles are made of a mixture of 50–70% talc, 25–35% ball clay, with the remainder wollastonite. It is a filler in the production of plastics. In the cosmetics industry, talc is used in baby and body powders, facial products and creams and lotions. Soapstone, a metamorphic rock composed essentially of fine-grained talc, is used extensively for carving of ornamental objects such as Inuit carvings.
13.15 Chlorite: (Mg, Al, Fe)6(Si, Al)4O10·(OH)8 Occurrence: A common constituent of low-grade metamorphic rocks that are part of the greenschist facies. The term greenschistt describes a fine-grained, greenish rock that derives
377
378
Metamorphic rock-forming minerals
its color from abundant green chlorite. Chlorite is present in many types of metamorphic rocks. It also occurs in igneous rocks as a retrograde alteration product of ferromagnesian minerals as a result of the cooling process. It is present in hydrothermal veins and ore deposits. Chemical composition and crystal structure: A generalized formula for chlorite, in which there is considerable variation among Mg, Fe, and Al, is given here. The structure of a magnesian chlorite is shown in Figure 13.23 and consists of infinitely extending t-o-tt layers of composition [Mg3(AlSi3O10) (OH)2]– alternating with brucitelike sheets of composition [Mg2Al(OH)6]+. The composition of brucite is Mg(OH)2, but because chlorite has Al3+ as well in this sheet structure, it is referred to as brucitelike. Crystal form: Triclinic or monoclinic depending on the stacking pattern of the layers along the c axis. Such stacking polymorphs are referred to as polytypes (see Sec. 5.8); 1, 1, m, m or 2/m. Crystals have a habit similar to that shown by members of the mica group (Fig. 13.24). Usually in foliated masses. Physical properties: H = 2–2½; G = 2.6–3.3. Cleavage {001} perfect. Folia flexible but not elastic. Color is commonly in various shades of green. Distinguishing features: Characterized by its micaceous habit and green color, as well as good cleavage, and low hardness. Uses: Chlorite is used as a catalyst or as a raw material in the commercial production of zeolites. Chlorite: (Mg,Al)6(Si,Al)4O10 . (OH)8 C1 c
[Mg3(AlSi3O10(OH)2)]1–
[Mg2Al(OH)6]1+
Si4+
Al3+
Mg2+
Al3+
Figure 13.23 Perspective view of the polyhedral structure of chlorite of composition (Mg, Al)6 (Si, Al)4O10·(OH)8. This structure consists of infinitely extending t-o-tt layers with brucitelike interlayers of composition (Mg2Al(OH)6)+. Only the vertical c axis of the triclinic unit cell is visible.
Figure 13.24 A random intergrowth of dark green, tabular (pseudohexagonal) chlorite crystals with prominent {001} basal pinacoids. This crystal habit is similar to that of the mica group.
13.16 Antigorite: Mg3Si2O5(OH)4 Occurrence: Antigorite, lizardite, and chrysotile are three members of a silicate group known as serpentine minerals. Together, in various mixtures, they compose a rock known as serpentine, or serpentinite. This is a rock type that results from the hydrothermal alteration (and retrograde metamorphism) of olivine- and pyroxene-rich rocks such as in peridotites and pyroxenites. Serpentine may occur as pseudomorphs of these high-temperature magnesian minerals. Chemical composition and crystal structure: Antigorite, lizardite, and chrysotile are three polymorphs of the essentially constant composition, Mg3Si2O5(OH)4. All three are different structural arrangements of infinitely extending tetrahedral-octahedral (t-oo) layers (Fig. 2.4) without any interlayer cations (as in the micas, Figs. 7.29 and 7.31) or an interlayer sheet (as in chlorite, Fig. 13.23). In antigorite, the (t-oo) layers are not straight but corrugated as in the diagrammatic sketch in Figure 13.25(A), which is based on the HRTEM image in Figure 13.25(B). Crystal form: Monoclinic; 2/m or m. Never in well-formed crystals. Commonly massive and fine grained (Fig. 13.26). Physical properties: H ∼4; G ∼2.55. Massive and fine grained. Color ranges from light to darker shades of green, commonly with a waxlike luster. Distinguishing features: Relatively low hardness and greenish color. Occurs commonly in association with fibrous chrysotile (Fig. 13.28). Uses: The massive variety of serpentine (a very fine-grained mixture of antigorite and lizardite) is commonly used in carvings. Verd antique is an ornamental stone consisting of serpentine mottled or veined with white marble.
13.17 Chrysotile
13.17 Chrysotile: Mg3Si2O5(OH)4
Brucite layer, Mg (OH)2
(A)
TTetrahedral layer, Si2 O5
1.4 nm
(B) Figure 13.25 (A) Diagrammatic sketch of the curved and corrugated (t-oo) layers in antigorite, as deduced from the high-resolution transmission electron microscope (HRTEM) image given in B. (B) HRTEM image as seen along the b axis of the antigorite structure. The vague black dots are images of the locations of Mg and Si. (Courtesy of Alain Baronnet, CINaM-CNRS, Centre Interdisciplinaire de Nanoscience de Marseilles, France.)
Figure 13.26 Hand specimen of massive antigorite with a polished and smoothly striated surface that is the result of friction along a fault plane. This surface is commonly referred to as slickensided.
Occurrence: Chrysotile is commonly closely associated with antigorite and lizardite in serpentine and occurs in the same geological associations as described for antigorite (Sec. 13.16). Chemical composition and crystal structure: Chrysotile is the polymorph of Mg3Si2O5(OH)4 in which the (t-o) o layers are tightly curled in the shape of drinking straws (Fig. 13.27). Additional illustrations of this unique crystal structure are given in Figure 2.4(B)–(D). Crystal form: Orthorhombic or monoclinic depending on the stacking of the (t-o) o layers. Always as fine fibers or matted intergrowths. Physical properties: H = 2½; G ∼2.5. Fibrous habit with fibers flexible but with great tensile strength. White to light gray to light green in color (Fig. 13.28). Distinguishing features: Recognized by its fibrous and flexible habit, light greenish color and low hardness. Uses: Chrysotile (i.e., white asbestos) constituted about 90 to 95% of all asbestos production before 1980, but with the public’s concern about the risk of environmental exposure to “asbestos” in the early 1970s, consumption of chrysotile declined rapidly. At present, strict regulations by the Environmental Protection 20 nm
Figure 13.27 Transmission electron microscope (TEM) photograph of the cross-sections of tightly packed chrysotile fibers. (Courtesy of Alain Baronnet, CINaM-CNRS, Centre Interdisciplinaire de Nanoscience de Marseilles, France.)
379
380
Metamorphic rock-forming minerals
Epidote: Ca2Fe3+Al2O(SiO4)(Si2O7)(OH) P 21/m c Si4+ Al3+ Fe3+ Ca2+
a
Figure 13.28 Thin veins of fibrous chrysotile that cut across a specimen of massive serpentine. The nonfibrous part of the specimen consists of a mixture of antigorite and lizardite.
Agency (EPA) has stopped all mining of chrysotile in the United States. Canada, however, still has extensive chrysotile asbestos deposits in the Eastern Townships of the province of Quebec that are actively worked as open-pit mines (see Sec. 17.3.2).
13.18 Epidote: Ca2Fe3+Al2O(SiO4)(Si2O7)(OH) Clinozoisite: Ca2Al3O(SiO4)(Si2O7)(OH) Occurrence: Epidote is a common mineral in medium grades of regional metamorphism, especially in mafic igneous rocks metamorphosed to amphibolites. It also occurs as the filling of vesicles and fractures in basalts. Clinozoisite shows similar occurrences and is also found as a retrograde alteration product of calcic feldspar. Chemical composition and crystal structure: There is a complete solid-solution series from the epidote formula given here to that of clinozoisite, Ca2Al3O(SiO4)(Si2O7)(OH), through the substitution of Fe3+, in epidote, by Al3+ in clinozoisite. The structure of epidote is illustrated in Figure 13.29. It consists of edge-sharing (AlO)6 octahedra parallel to the b axis that are linked by (SiO4) tetrahedra and (Si2O7) double tetrahedral groups. Ca is in 8-coordination and Fe3+ is in octahedral coordination. Clinozoisite is isostructural with epidote. Crystal form: Monoclinic; 2/m. Crystals are commonly prismatic parallel to the b axis. Physical properties: H = 6–7; G = 3.2–3.5. {001} cleavage perfect, and {100} imperfect. Epidote ranges in color from pistachio green (Fig. 13.30) to yellowish green to black. Clinozoisite occurs in pale green to gray colors.
b
Figure 13.29 Perspective view of the polyhedral crystal structure of epidote. A monoclinic unit cell is outlined.
Distinguishing features: Epidote is characterized by its distinctive green color and one direction of perfect cleavage. In hand specimens, it is impossible to distinguish clinozoisite from epidote, unless the epidote is distinctly pistachio green in color. In thin sections, clinozoisite exhibits distinctive blue interference colors. Uses: Some epidote, of gem quality, is cut as faceted stones or as cabochons and beads. Clinozoisite has no commercial use. Tanzanite, a purple-blue colored vanadium-bearing variety of zoisite (with orthorhombic symmetry) is a popular gemstone.
Figure 13.30 Pistachio-green epidote crystals lining a vug with white albite in its center. White calcite lines the lower left side.
13.20 Vesuvianite
13.19 Cordierite: (Mg, Fe)2Al4Si5O18·nH2O Occurrence: A common metamorphic mineral in pelitic rocks, resulting from the metamorphism of fine-grained aluminous sediments. Its occurrence is favored by low pressures or high temperatures. It is, therefore, common in contact metamorphosed rocks and in low-pressure regional metamorphic assemblages. Chemical composition and crystal structure: Although there is some substitution of Mg2+ by Fe2+, most cordierites are Mg-rich. Most analyses show appreciable but variable H2O. The structure of the common, low-temperature form of cordierite, given in Figure 13.31, is orthorhombic (pseudohexagonal) with 6-fold tetrahedral rings. Thus, cordierite is a member of the silicate group known as ring silicates, or cyclosilicates. Mg and small amounts of Fe occur in the octahedral sites, with Al and Si distributed among the tetrahedral sites. In the 6-fold rings, two of the tetrahedra are occupied by Al and the other four by Si. Crystal form: Orthorhombic; 2/m m 2/m 2/m. Crystals are usually short prismatic. Physical properties: H = 7–7½; G ∼2.65. Cleavage {010} poor. Most commonly massive or as embedded grains. Color is generally some shade of bluish to bluish gray (Fig. 13.32). Distinguishing features: Cordierite may resemble feldspar as well as quartz, and it is distinguished with difficulty from these two minerals in hand specimens. In thin sections, the different optical properties clearly distinguish the three. Uses: Cordierite, because of its extremely low coefficient of thermal expansion, is used in the manufacturing of kiln furniture. It is also used for honeycomblike catalyst supports in auto-emission reduction devices.
Figure 13.32 Massive cordierite with bluish-gray color.
13.20 Vesuvianite: Ca19(Al, Mg, Fe)13(Si2O7)4 (SiO4)10(O, OH, F)10 Occurrence: Vesuvianite is a common constituent of contact metamorphosed limestones. It also occurs in regionally metamorphosed limestones and serpentinites. Chemical composition and crystal structure: In the formula here, there is some substitution of Na for Ca and Mn2+ for Mg. Figure 13.33 illustrates the structure that contains independent (SiO4) tetrahedra as well as double (Si2O7) tetrahedral groups. Al3+ is in octahedral coordination, and so is (Mg2+, Fe2+) in a separate octahedral site. The sites occupied by Ca2+ are irregular 7- and 8-fold polyhedra. Vesuvianite: Ca19(Al,Mg,Fe)13(Si2O7)4(SiO4)10(O,OH,F)10 P 4/n 2/n 2/c c
Cordierite: (Mg,Fe)2Al4Si5O18 . n H2O C 2/c 2/c 2/m b
a2
Al3+ and Si4+
Si4+
Mg2+(Fe2+)
Al3+ Mg2+, Fe2+ a c Figure 13.31 Polyhedral structure of cordierite in a perspective view along the c axis. Two adjoining orthorhombic unit cells are shown.
Ca2+ a1 Figure 13.33 Perspective view, along the c axis, of the polyhedral structure of vesuvianite. A tetragonal unit cell is outlined.
381
382
Metamorphic rock-forming minerals
Titanite(sphene): CaTiSiO5 C 2/c c
Si4+
Ti4+ b
Ca2+
a Figure 13.34 Prismatic, vertically striated, brown crystal of vesuvianite in a white marble matrix full of fine-grained green diopside.
Crystal form: Tetragonal; 4/m m 2/m 2/m. Crystals are commonly prismatic with vertical striations (Fig. 13.34). Physical properties: H = 6½; G ∼3.4. Poor {010} cleavage. Common as striated columnar aggregates. Color is usually brown or green. More rarely yellow, blue, or red. Distinguishing features: Brown tetragonal prisms and striated columnar masses are characteristic. Uses: No commercial applications.
13.21 Titanite (sphene): CaTiSiO5 Occurrence: A common accessory mineral in metamorphic and igneous rocks, and as detrital grains in sedimentary rocks. It can be a major constituent in metamorphic rocks rich in Ca and Ti, such as in metabasalts and pyroxenites. Titanite is the accepted mineral name, but the name sphene is used in the jewelry industry. Chemical composition and crystal structure: The composition is essentially that of the formula given here, with small amounts of rare earth elements and of Fe, Al, Mn, Mg, and Zr in substitution. The structure of titanite, given in Figure 13.35, consists of corner-sharing TiO6 octahedra that form kinked chains parallel to the a axis. These chains are cross-linked by independent (SiO4) tetrahedra. The Ca is housed in 7-coordinated sites. Crystal form: Monoclinic; 2/m. m Wedge-shaped crystals are common (Fig. 13.36). Physical properties: H = 5–5½; G ∼3.45. Distinct {110} cleavage. Color ranges from gray, to brown, yellow or black. Luster is resinous to adamantine. Distinguishing features: Characterized by wedge-shaped crystals and high luster. Hardness is greater than that of sphalerite, ZnS, and less than that of staurolite.
Figure 13.35 Perspective view of the polyhedral structure of titanite. A monoclinic unit cell is outlined.
Uses: Sphene is a rare gem with exceptional brilliance and fire. Because of its relatively low hardness, it is not suitable for many jewelry applications but is much prized by gem collectors.
13.22 Scapolite: 3NaAlSi3O8·NaCl– 3CaAl2Si2O8·CaSO4 (or CaCO3) Occurrence: Common in marbles and some amphibolites, as well as in contact metamorphic assemblages. It is a metamorphic mineral that forms instead of feldspar in some metamorphic rocks that have a high concentration of sulfate or carbonate. Chemical composition and crystal structure: Scapolite is a metamorphic mineral with compositions suggestive of that of the feldspars. The two end-member compositions given here have specific species names; the sodium end member
Figure 13.36 Light greenish-yellow transparent wedge-shaped crystals of titanite (sphene).
13.23 Lawsonite
Scapolite: 3 NaAlSi3O8 . NaCl I 4/m a2
Si4+ or Al3+ Na+ Cl–
a1
c Figure 13.37 A perspective view, along the c axis, of the crystal structure of the Na-rich end member of the scapolite group of minerals. A tetragonal unit cell is outlined.
composition is known as marialite and the calcic composition is meionite. The name scapolitee refers to the whole series. The formulas are written such that they are immediately reminiscent of the two plagioclase feldspar end members: albite, NaAlSi3O8, and anorthite, CaAl2Si2O6, with one formula weight of NaCl, CaSO4, or CaCO3. The crystal structure of the Na end member is given in Figure 13.37. It is a relatively open framework (tectosilicate) structure with large cavities that house the Na+ and Cl– ions. Al and Si are housed in the tetrahedra. It is a member of the group known as feldspathoids. Crystal form: Tetragonal; 4/m. m Crystals are usually prismatic (Fig. 13.38). Physical properties: H = 5–6; G ∼2.65. {100} and {110} cleavages distinct but imperfect. Crystals exhibit a prismatic habit with square cross-section. Color ranges from white to pale green and rarely yellow or bluish. Distinguishing features: When massive, it resembles feldspar but has a fibrous appearance on cleavage surfaces. Square crystal habit and four cleavage directions at 45° are characteristic. Uses: Scapolite has no industrial uses, but transparent crystals have been used as gemstones.
13.23 Lawsonite: CaAl2(Si2O7)(OH)2·H2O Occurrence: Lawsonite is a common mineral in high-pressure, low-temperature metamorphosed basaltic rocks. It is typical of the blueschist facies. Chemical composition and crystal structure: The composition of lawsonite is essentially that of anorthite, CaAl2Si2O8 + H2O. Upon heating, lawsonite converts to anorthite. The crystal
Figure 13.38 White prismatic crystals of scapolite. They are a combination of {010} and {110} prisms capped by {011}, a tetragonal dipyramid.
structure (Fig. 13.39) consists of chains of edge-sharing (AlO6) octahedra parallel to the b axis that are linked by double (Si2O7) tetrahedral groups. Large cavities house the Ca2+ ions in 8-fold coordination with oxygen. Crystal form: Orthorhombic; 222. Usually in tabular (Fig. 13.40) or prismatic crystals. Physical properties: H = 6; G ∼3.1. Perfect {010} and {010} cleavages that intersect at right angles. Color ranges from colorless to white, pale blue to grayish blue. Translucent. Distinguishing features: Most easily recognized in thin sections. Association with other minerals that are part of
383
384
Metamorphic rock-forming minerals
Pumpellyite: Ca2MgAl2(SiO4)(Si2O7)(OH)2 . H2O A 2/m c
Lawsonite: CaAl2(Si2O7)(OH)2 . H2O C 2 2 21 c
Si4+
Si4+
Al3+
Al3+and Mg2+
Ca2+
Al3+ or Fe2+ Ca2+
a
b
Figure 13.39 Perspective view of the crystal structure of lawsonite. An orthorhombic unit cell is outlined.
glaucophane schists, such as glaucophane, jadeite, garnet, and pumpellyite, is most diagnostic. Uses: None.
13.24 Pumpellyite: Ca2MgAl2(SiO4)(Si2O7) (OH)2·H2O Occurrence: Pumpellyite is a common constituent of glaucophane schists in association with glaucophane, lawsonite, and epidote. It also occurs as a low-grade metamorphic product in amygdaloidal basalts. Chemical composition and crystal structure: The composition of pumpellyite is essentially that of the formula given above with some substitution of Fe3+ for Al, and Fe2+ and Fe3+ for Mg. The crystal structure (Fig. 13.41) consists of edgesharing octahedra, parallel to the b axis, occupied by Mg and Al. Ca is located in an irregular 7-coordinated site. Si occurs in (SiO4) tetrahedra and double tetrahedral groups (Si2O7).
Figure 13.40 White to light-gray crystals of lawsonite.
a b Figure 13.41 Perspective view of the polyhedral crystal structure of pumpellyite. A monoclinic unit cell is outlined.
Crystal form: Monoclinic; 2/m. Crystals are bladed, commonly elongated along the b axis. Physical properties: H = 5.5; G = 3.2. Commonly in stellate clusters (Fig. 13.42), fibrous, or in dense mats. Color ranges from green to bluish green, greenish black to brown. Distinguishing features: Difficult to distinguish in a hand specimen from clinozoisite or epidote. Better characterized in thin sections, although X-ray diffraction may be needed for positive identification. Uses: None.
13.25 Topaz: Al2SiO4(F, OH)2 Occurrence: As a metamorphic mineral, it is the result of the metamorphism of bauxite. It also occurs in association with kyanite and sillimanite. It is found in both volcanic and intrusive
Figure 13.42 Stellate, green crystals of pumpellyite filling vesicles in basalt.
13.26 Corundum
TTopaz: Al2SiO4(F,OH F )2 P 21/n 21/m 21/a c
Si4+
Al3+ F–
b
a
Figure 13.43 Perspective view of the crystal structure of topaz. An orthorhombic unit cell is outlined.
felsic rocks. It is also present in hydrothermal ore deposits that carry tungsten, tin, and molybdenum mineralization. Chemical composition and crystal structure: The composition of topaz is essentially as stated in the formula here, with most of the (OH)– generally replaced by F–. The structure (Fig. 13.43) consists of chains parallel to the c axis of (AlO4F2) octahedra cross-linked by independent (SiO4) tetrahedra. F is coordinated only to Al. Crystal form: Orthorhombic; 2/m m 2/m 2/m. Commonly in prismatic crystals terminated by dipyramids (Fig. 13.44).
Physical properties: H = 8; G ∼3.5. Perfect {001} cleavage. Transparent to translucent. Color ranges from colorless, to yellow, pink, bluish and greenish. Distinguishing features: Recognized by its crystal form, high hardness (8), basal cleavage, and high specific gravity. Uses: Topaz of various colors is used as a gem (see Section 15.18).
13.26 Corundum: Al2O3 Occurrence: Formed by extremely high-grade contact metamorphism of aluminous (pelitic) rocks. Can be associated with spinel to form emery. y Also found in some syenites and nepheline syenites. Chemical composition and crystal structure: The composition is essentially pure Al2O3 but trace amounts of Cr (in ppm) are responsible for the red gem variety known as ruby, and trace amounts of Fe and Ti are the cause for the blue color of the blue gem variety known as sapphire (see Fig. 3.7). The structure of corundum is based on oxygen in approximately hexagonal closest packing with Al in octahedral coordination (Fig. 13.45). Only two-thirds of the octahedra in each layer are occupied by Al and one-third are vacant (known as dioctahedral; see Sec. 7.16). Crystal form: Hexagonal; 3 2/m. Crystals are commonly hexagonal prisms that taper toward the ends. Also as tapering hexagonal dipyramids (Fig. 13.46), rounded into barrel shapes with horizontal striations. Physical properties: H = 9; G ∼4. Parting on {0001} and {10 1 1}. Color ranges from colorless to some shade of brown, pink, or blue. Corundum: Al2O3 R 3 2/c c
Al3+
a2
a1 Figure 13.44 Prismatic crystal of translucent topaz terminated by a dipyramid, surrounded by light-gray mottled quartz.
Figure 13.45 Perspective view of the polyhedral structure of corundum. A primitive hexagonal unit cell is outlined for this rhombohedral structure. See caption for Figure 5.25 for further explanation.
385
386
Metamorphic rock-forming minerals
Chabazite: Ca2Al2Si4O12 . 6H2O R 3 2/m
a2
(A)
Si4+ or Al3+
a1
Ca2+
Figure 13.46 Bluish gray barrel-shaped dipyramidal crystals of corundum with horizontal striations. The white matrix mineral is feldspar.
Distinguishing features: Characterized by its barrel-shaped crystal form, high hardness, specific gravity, and parting. Uses: Emery, a granular intergrowth of corundum, magnetite, and spinel has been used extensively as an abrasive. The hardness of emery ranges from 7 to 9 depending on the mineral composition. Because of the much better purity and uniformity of synthetic abrasives such as silicon carbide, the commercial market for emery has declined. Ruby and sapphire are two of the most important gemstones (Section 15.18).
13.27 Chabazite: Ca2Al2Si4O12·6H2O Occurrence: Chabazite, in association with other members of the zeolite group of silicates, occurs in cavities (vesicles) of basalt flows. Zeolites are the result of low-temperature hydrothermal alteration and/or metamorphism in the zeolite facies. Chemical composition and crystal structure: The ideal composition is as given here, but there is considerable replacement of Ca by Na and K. Zeolite compositions can be thought of as approximating hydrated feldspars and feldspathoids. All members of the zeolite group of silicates have framework structures with large openings that house the Ca(Na, and/or K) as well as variable percentages of H2O, ranging from 10–20 weight %. The structure of chabazite is shown in Figure 13.47(A). The H2O molecules that reside in the large openings are not shown. It shows the presence of channels with diameters of ∼3.9 Å. The
~3.9Å
(B) Figure 13.47 (A) Perspective view, along the c axis, of the polyhedral structure of chabazite. A rhombohedral unit cell is outlined. (B) Enlarged view of the 6-fold rings of tetrahedra in this structure.
presence of these atom-sized openings allows zeolites to be used as molecular sieves, such that molecules too large to pass through are excluded, but molecules of a size smaller than the openings can flow through (see Sec. 16.7). Figure 13.47(B) gives an enlargement of one structural ring with its internal diameter. Crystal form: Hexagonal; 3 2/m. Usually in rhombohedral {10 1 1} crystals (Fig. 13.48). Physical properties: H = 4–5; G ∼2.10. Color ranges from white to yellow, pink, and red. Transparent to translucent. Distinguishing features: Usually recognized by its rhombohedral crystal habit. Distinguished from calcite by lack of effervescence in HCl and much poorer cleavage. Uses: There are ~60 naturally occurring members of the zeolite group. In addition, other zeolite structure types are manufactured synthetically. The industrial applications of zeolites derive from their spacious channels and the water molecules and variable amounts of Ca2+, Na+, and K+ that
Figure 13.48 Pink rhombohedral crystals of chabazite in a small vug that is lined with white calcite crystals.
are housed in the channels. The water molecules are so weakly bonded that when a zeolite is heated, the water in the channels is driven off easily and continuously as the temperature rises, leaving the framework structure intact. Such a dehydrated zeolite structure can be completely rehydrated when immersed in water. Zeolites in their dehydrated state can absorb molecules,
other than water, as long as their overall size is compatible with the channel dimensions in the specific structure. Zeolites, as mentioned earlier, are used as molecular sieves as well, so as to separate hydrocarbon molecules that are smaller or larger than the sieve size of the channels (see Sec. 16.7).
388
Metamorphic rock-forming minerals
Summary This chapter systematically introduced 26 minerals found in metamorphic rocks. The first 18 are common constituents of metamorphic assemblages, and the last 8 represent accessory minerals. The majority are of prograde metamorphic origin, with a small number the result of retrograde reactions. Members of the mica group and quartz and feldspar are common constituents of metamorphic rocks as well, but because they are also abundant in igneous rocks, they are discussed in Chapter 7.
• We began with garnet, which has a wide range of chemical composition and is found in many metamorphic mineral assemblages. • The composition Al2SiO5 occurs as three different polymorphs, each of which has a very different, well-determined pressuretemperature stability field. It is important that you are familiar with the phase diagram for these polymorphs, as you will use it in Chapter 14.
• Staurolite is common in association with kyanite and is best recognized by its dark-brown color, prismatic crystal habit, and occurrence in crosslike twins.
• Diopside, a member of the pyroxene group and, therefore, a chain silicate, is common in metamorphosed carbonate-rich rocks such as marble.
• Several amphiboles, also chain silicates but with double chains (instead of single chains as in pyroxenes), are common metamorphic minerals. They occur over a wide range of metamorphic conditions with the metamorphic rock known as amphibolite consisting mainly of hornblende and plagioclase with little or no quartz.
• Tremolite and actinolite are typical low-temperature metamorphic amphiboles. Their composition grades into that of hornblende by extensive substitution of Al3+ for Si4+, as well as Al3+ for Mg2+ and/or Fe2+. Hornblende, which is also common in igneous rocks, was systematically discussed in Chapter 7.
• Glaucophane, yet another amphibole member, is unique to metamorphic rocks. It is sodium rich and occurs in glaucophane schists, which tend to be blue in color because of the abundant glaucophane. They are also known as blueschists.
• Riebeckite, an amphibole similar in composition to glaucophane but with much Fe2+ and Fe3+ replacing Al3+ in the glaucophane structure, occurs in a highly fibrous (asbestiform) habit and is known as crocidolite. This is one of several asbestos minerals. Crocidolite, with an amphibole structure, is completely different in structure and composition from the much more common asbestos known as chrysotile.
• We introduced two members of the pyroxenoid group, wollastonite and rhodonite. Pyroxenoids are chain silicates that have chains with kinks at different repeat units of the vertical chains. Wollastonite is common in high-temperature metamorphic assemblages formed from calcium carbonate-rich rocks. Rhodonite is a constituent of metamorphosed manganese formations and manganesecontaining iron-formation.
• Four members of the layer silicate group are talc, chlorite, antigorite, and chrysotile. Chlorite is a major component of metamorphic rocks belonging to the greenschist facies, which are green because of the chlorite.
• Antigorite and chrysotile are two polymorphs of the mineral serpentine. Antigorite has a corrugated layer structure and chrysotile consists of rolled up layers forming drinking straws. This is the most common asbestos, known in the trade as white asbestos. Crocidolite, an amphibole, which is blue, is known as blue asbestos.
• Epidote-clinozoite forms a metamorphic mineral series. Epidote is recognizable in hand specimens by its pistachio-green color. • Cordierite is common in metamorphosed pelitic rocks but is difficult to distinguish from feldspar.
Review questions
Review questions 1. How would you define the term metamorphic mineral? l 2. List six very common metamorphic minerals and/or mineral groups. 3. What metamorphic minerals are common in Al-rich bulk compositions? 4. What metamorphic minerals develop in calcium carbonate-rich bulk compositions? 5. What type of amphibole (name and composition) might you expect in a metamorphosed iron-formation? 6. What are the acronyms for the two major compositional series of the garnets? 7. How were the acronyms for the two major groups of garnet arrived at? 8. What are some of the commercial uses of garnet? 9. What are the structural differences among the three polymorphs of Al2SiO5? 10. Which of the three polymorphs of Al2SiO5 is indicative of high-pressure metamorphism at low to moderate temperature? 11. What is chiastolite? 12. Staurolite is monoclinic in symmetry but is commonly referred to as pseudo-orthorhombic. Why? 13. What is the compositional difference between diopside and augite? 14. Give some examples of light beige to brown amphiboles. 15. Dark-green actinolite closely resembles dark-green hornblende. What are the main compositional differences between
the two? 16. What is the most common amphibole asbestos? 17. Rhodonite is commonly recognized by its pink color. What is another Mn-containing pink mineral? 18. The crystal structure of talc, a layer silicate, is said to be trioctahedral. What is meant by that? 19. What are some of the commercial uses of talc? 20. What type of illustrations in this chapter show conclusively the very different crystal structures of the two polymorphs of
serpentine? 21. What is chrysotile? 22. Cordierite is classified as a ring silicate. What is meant by that? 23. Among all the minerals listed as metamorphic only one is an oxide. What is its name and composition? 24. The oxide referred to in question 23 forms very high-end gemstones. Which are they? 25. One of the gemstones in question 24 is blue. What is that color due to? Refer to Figure 3.7 to obtain your answer.
FURTHER READING Please refer to the listing at the end of Chapter 7.
389
CHAPTER
14
Metamorphic rocks
Metamorphism includes all changes that affect rocks as a result of changes in pressure, temperature, or composition of fluids in the environment. These changes occur in sedimentary, igneous, and even former metamorphic rocks. The Earth’s tectonic plates are constantly on the move, and consequently most rocks experience change at some time in their history. Metamorphic rocks are abundant, constituting ~60% of the continental crust. Even igneous rocks of the ocean floor are metamorphosed by circulating ocean water that cools them near midocean ridges. Metamorphic rocks preserve an important record of past conditions in the lithosphere, so it is important that we learn how to read that record. In doing this, we address the following important questions: Why do metamorphic rocks change when they find themselves in a new environment? Do these changes go to completion; that is, do they reach equilibrium under the new conditions? Do minerals in the rock tell us what those conditions were? And what are the chances that new minerals formed at depth in the Earth survive the trip to the surface during exhumation? We will learn that metamorphic rocks closely approach thermodynamic equilibrium and, as a consequence, contain only a small number of minerals. Mineral assemblages can be used to determine pressures, temperatures, and fluid compositions at the time of peak metamorphism. These assemblages are normally preserved during exhumation. Textures of metamorphic rocks provide important information about stresses in the crust during metamorphism.
Photomicrograph of a thin section of muscovite (bright colors)–chlorite (dark colors)–quartz (white-gray) schist under crossed polarized light. The prominent mineral grain alignment developed when this rock, which was originally a shale, was metamorphosed during the Acadian orogeny in southern New England. Width of field 5 mm.
392
Metamorphic rocks
Metamorphism is the sum of all changes that take place in a rock when it experiences changes in temperature, pressure (both lithostatic and directed), or composition of fluids in the environment. The important word in this definition is change. e The changes may be physical, chemical, isotopic, or any combination of these. The original rock, known as the protolith, can be igneous, sedimentary, or a previous metamorphic rock. Most metamorphic reactions are very slow, so time is important in determining how complete a change may be. Some rocks are more reactive than others, and higher temperatures and the presence of fluids also speed up reactions. Changes that take place while rocks are heating are referred to as prograde and those occurring during cooling are referred to as retrograde. Changes that take place at low temperatures during the compaction and lithification of sediments could, in the broadest sense, be considered metamorphic, but normally only reactions taking place above about 150°C are dealt with in metamorphic studies, but the division is arbitrary. Reactions have a greater chance of going to completion at the higher temperatures experienced by metamorphic rocks than they do in sedimentary rocks. At the highest temperatures, metamorphic rocks begin to melt, producing mixtures of metamorphic and igneous rocks known as migmatites.
14.1 What changes occur during metamorphism? Most metamorphic rocks undergo both physical and chemical changes during metamorphism. Physical changes may involve simple recrystallization of existing minerals, which may occur under lithostatic load or under directed pressure. These physical changes play an important role in determining the texture of the resulting rock. Chemical changes occur when new minerals form, because atoms must be exchanged between reacting minerals. In contrast, fluids passing through a rock may bring in new elements that replace former elements and change the bulk composition of the rock, a process known as metasomatism. Changes in temperature, pressure, and fluid composition have numerous causes. Intrusion of magma causes heating, and changes that occur in thermal aureoles around igneous bodies are referred to as contact metamorphism (Fig. 2.12). Recrystallization during contact metamorphism normally occurs under lithostatic pressure, and rocks do not develop a prominent foliation. Fluids escaping from cooling magma may cause metasomatism in contact aureoles. At convergent plate boundaries, folding and thrusting thicken the crust. Rocks that were once close to the surface are buried to greater depth, where they are heated by the geothermal gradient. Crustal rocks, especially continental ones, are richer in radioactive elements than are mantle rocks. Heat generated by radioactive decay from this thickened radioactive blanket causes temperatures to rise on
a regional scale. In addition, the ascent of magmas generated by melting in the mantle wedge above subduction zones raises temperatures in orogenic belts still more. This leads to metamorphism, but because of plate convergence, new minerals grow in a directed stress field and consequently develop prominent foliations. Because this type of metamorphism occurs on a regional scale, it is called regional metamorphism. The textures and mineral compositions of regional metamorphic rocks preserve a record of the processes associated with thickening of the crust in zones of plate convergence. Rocks buried by thrusting and folding experience everincreasing pressures and temperatures, which lead to prograde metamorphic reactions. Eventually, as a result of tectonism, erosion, and isostasy, rocks find their way back to the Earth’s surface, where we can examine them. On returning toward the Earth’s surface, rocks experience decreasing pressures and temperatures, and we might expect reactions that occurred during burial to reverse themselves. However, most metamorphic rocks preserve the mineral assemblages they produced at maximum temperature, and retrograde reactions are often only local and commonly associated with fault zones or other prominent fractures. If it were not for this stranding of metamorphic rocks in their high-temperature form, metamorphic petrologists would have little to study, and much of the Earth’s geologic history would be lost. With the growth of new metamorphic minerals, the nature of the protolith may be lost. In some cases, the protolith is readily apparent because of the rock’s bulk composition. For example, metamorphic rocks rich in carbonate minerals (marble) are almost certainly metamorphosed limestones, although there is a very small chance they may have been the igneous rock carbonatite. The aluminous composition of mudrocks makes them readily identifiable, even when intensely metamorphosed, because of the production of large numbers of alumina-rich minerals. These alumina-rich rocks, which are referred to as pelites, contain some of the most diagnostic metamorphic minerals. Metamorphosed granite and arkose, however, are difficult to distinguish. In some cases, primary igneous and sedimentary textures may be preserved. Bedding is one of the most characteristic features of sedimentary rocks. Unfortunately, the foliation that develops during regional metamorphism is commonly accompanied by a compositional layering that is difficult to distinguish from sedimentary bedding. An example of metamorphic change
As emphasized already, the key word in the definition of metamorphism is changee. We illustrate these changes by examining the transformation of black shale into a regional metamorphic rock known as schist. Figure 14.1(A)–(B) shows, respectively, a typical black shale and its metamorphic equivalent, a muscovite schist. This particular shale was formed from organicrich mud that accumulated under anoxic conditions in a
(B)
(A)
Figure 14.1 (A) Black shale exhibiting bedding-parallel fissility. (B) Garnet (red)-staurolite (dark brown)-muscovite schist produced from metamorphism of shale. The parallel alignment of muscovite grains in the plane of the photograph defines the plane of schistosity.
deep lake. It is composed largely of clay minerals but also contains fine detrital grains of quartz, alkali feldspar, muscovite, and biotite (see the photomicrograph in Fig. 12.2(A)). During compaction of the sediment, clay minerals and micas rotated into the horizontal plane, giving the shale a prominent fissility parallel to the bedding. This, then, is the protolith. The schist was formed from black shale by regional metamorphism that accompanied the Acadian orogeny in the northern Appalachian Mountains of New England. One of the first changes to occur to shale during regional metamorphism is the reaction of clay minerals to form muscovite. Muscovite grows as platelike grains, and those oriented perpendicular to the maximum compressive stress grow more easily than do those oriented parallel to it. As a result, new muscovite crystals grow with a preferred orientation that creates a foliation known as slaty cleavage (see Sec. 14.4.2), which is usually at a high angle to the original sedimentary bedding. Thus, one of the first signs of metamorphism in shale is a physical change, with bedding fissility being replaced by a metamorphic foliation (see, e.g., Fig. 14.7(A)). As the grade of metamorphism increases, muscovite grains continue to grow, and when they become coarse enough to be visible to the unaided eye, the foliation they create is known as schistosityy and the rock is called a schist. In Figure 14.1(B), the schistosity is the reflective surface parallel to the plane of the photograph. The chapter-opening photomicrograph is of a thin section of this same rock under crossed polarized light in which the parallel alignment of the muscovite grains is obvious. As black shale is heated above the oil and gas windows (Sec. 11.3.2), its organic constituents are converted to graphite. Like muscovite, graphite forms small platelike grains that grow preferentially perpendicular to the maximum compressive stress. The gray sheen seen in the schist (Fig. 14.1(B)) is due, in part, to the presence of minute graphite grains. If this schist is dragged across a piece of paper, its graphite leaves a gray streak.
As metamorphic temperatures and pressures increase, the growth of muscovite grains is accompanied by the appearance of other minerals that form through various chemical reactions. At the highest temperatures reached by the metapelite in Figure 14.1(B), garnet and staurolite grew to form large crystals known as porphyroblasts. Note that staurolite, which forms long prismatic crystals (Sec. 13.6), preferentially grows with its long axis in the plane of the micaceous foliation, perpendicular to the major compressive stress (Fig. 14.1(B)). The spacing between the porphyroblasts (∼1 cm) indicates that elements needed for their growth were able to diffuse over distances of ∼ 5 mm. Diffusion through rocks is extremely slow, so the presence of large, widely spaced porphyroblasts indicates that this schist remained at elevated temperatures for an extended period of time and only a few staurolite and garnet crystals nucleated. The resulting garnet-staurolite-muscovite schist records this maximum thermal event. Eventually, the mountains formed during the Acadian orogeny began to erode, and isostatic adjustments brought the garnet-staurolite-muscovite schist back toward the surface. During this ascent, mineral assemblages formed at high temperatures and pressures tried to change back into lowertemperature and pressure mineral assemblages, but important ingredients needed for such reactions, namely H2O and CO2, had been lost from the rock during peak metamorphism and, therefore, were not available for retrograde reactions. Although not evident from the photographs shown in Figure 14.1, the bulk composition of the shale and the schist differ in one important way: The schist contains much less water. Typical shales contain ∼5 weight % H2O. Most prograde metamorphic reactions liberate water (or carbon dioxide). The H2O released by metamorphic reactions is a supercritical fluid (i.e., liquid and gas are indistinguishable) whose density is nearly the same as room-temperature water (∼1000 kg/m3). This fluid’s density is less than that of the surrounding rock, so
394
Metamorphic rocks
it rises toward the surface during metamorphism. The amount of volatiles released during metamorphism is staggering. For example, the conversion of shale into high-temperature metamorphic rock involves the loss of a volume of H2O that is approximately equal to the volume of the rock itself. Other metamorphic reactions involving carbonate-rich sedimentary rocks liberate large volumes of CO2. Loss of volatiles is one of the major consequences of prograde metamorphism. As these volatiles are no longer present in the metamorphic rock, their importance is easily overlooked. When volatiles escape from rocks undergoing metamorphism, they take with them heat and dissolved constituents. The heat helps promote metamorphism in higher levels of the crust. As the fluids cool on rising through the crust, they precipitate their dissolved constituents. Fluid escaping from the garnetstaurolite-muscovite schist would have carried silica in solution, so as it traveled toward the surface, it would have precipitated quartz. Because these escaping fluids become channelized into fractures, the silica is deposited to form quartz veins. The ubiquitous occurrence of quartz veins in lowtemperature metamorphic terranes is testament to the large flux of fluids generated from higher-temperature metamorphic zones beneath (Fig. 14.2). In summary, metamorphism includes all those changes that occur to rocks in response to changes in the environmental factors of temperature, pressure, and fluid composition. Although reactions can occur during both rising and falling temperatures (prograde and retrograde, respectively) most metamorphic rocks consist of minerals formed near the maximum temperature to which they were exposed. Most prograde metamorphic reactions liberate volatiles, which migrate toward the surface, carrying heat and dissolved constituents into the overlying rocks.
Figure 14.2 Highly deformed quartz veins in low-grade metamorphic rock from Vermont. The veins are deposited by fluids escaping from highertemperature metamorphic zones below.
14.2 Why do rocks change? We have seen that the most important word in the definition of metamorphism m is changee. It is reasonable to ask why do rocks change? In fact, we can ask the more general question, why does any reaction take place? The answer is given by thermodynamics. Although a full thermodynamic explanation is beyond the scope of this book, it is possible to give a brief answer to the question in terms that are readily appreciated from everyday experience. The answer to this question is important because it determines how we study and describe metamorphic rocks.
14.2.1 Thermodynamics and the reason for change Thermodynamics deals with the relations between energy and work. It developed during the Industrial Revolution when people were interested in the conversion of thermal energy to work. Much of its terminology relates to heat and work of expansion as might occur when coal is burned to heat water to drive steam engines. Thermodynamics was also interested in the efficiency of these processes. During the last half of the nineteenth century, Josiah Willard Gibbs of Yale University showed that thermodynamic laws developed to deal with the conversion of thermal energy to mechanical work applied equally to the energy associated with chemical reactions. Almost single handedly, he developed the field of chemical thermodynamics. In recognition of his contributions, the energy that determines the direction in which a chemical reaction proceeds is known as Gibbs free energyy. Box 14.1 outlines how this energy determines the direction of a reaction and how it defines equilibrium, both of which are important when looking at the changes that occur in metamorphic rocks. With the explanation of Gibbs free energy given in Box 14.1, we are in a position to answer our original question of why metamorphic changes take place. Any reaction that can take place naturally must lower the Gibbs free energy, y and the reaction does not reach equilibrium until the free energy reaches a minimum. In our boulder analogy in Box 14.1, we see that equilibrium is achieved when the boulder reaches the valley bottom and cannot get any lower in the gravitational field. Similarly, equilibrium in a chemical reaction is achieved when the Gibbs free energy reaches a minimum. Minimizing the free energy brings about other conditions that must be met at equilibrium. First, the temperature must be the same everywhere. There can be no temperature gradients; otherwise heat would flow, which lowers the free energy still more. Nor can there be any pressure gradients; otherwise material could expand or contract to eliminate the gradients, which, in turn, lowers the free energy. Finally, there can be no chemical potential gradients, for they cause material to diffuse and this also lowers free energy. This final point can be appreciated by returning to a gravitational analogy. Figure (C) in Box 14.1 shows a U-tube filled with water. If the water on either
14.2 Why do rocks change?
BOX 14.1
THERMODYNAMIC EXPLANATION FOR CHANGE
Supplying activation energy
Rapidly moving mud flow
ov Slo in w g so ly il c re e
p
(A)
Rain (fluid)
m
Activtion energy Potential energy
By analogy, chemical potential
Thermodynamics is based on observations of the way nature operates. We see, for example, that heat always flows from regions of high temperature to regions of low temperature, never the reverse, and when we stir cream into coffee the two mix, and reversing the stirring direction does not cause them to unmix. Nature behaves in predictable ways. Thermodynamics quantifies these observations and, after much mathematical juggling, arrives at fundamental laws that we believe are applicable throughout the universe. Let us illustrate these laws by examining a familiar situation in which we know the direction in which natural reactions take place. Figure (A) shows a cross-section of a valley with a large boulder resting on a ledge high on the valley side. If the stick figure is successful in pushing the boulder toward the edge of the ledge, it will roll to the valley bottom. We expect this to happen from everyday experience, so this is a natural reaction. We do not expect the boulder to roll uphill to the ledge; this would be an unnatural reaction. We accept the falling of the boulder to the valley floor as natural because the Earth’s gravitational field pulls the boulder down. The boulder on the ledge has a certain potential energyy because of its height in the Earth’s gravitational field, and by falling to the valley floor the potential energy is lowered. The natural direction of this process is, therefore, to decrease the potential energy. Center of gravity
(B) Metastable
Unstable
Stable Water level or Chemical potential level
(C) Disequilibrium Equilibrium
Gravitational potential energyy is just one form of energy in nature. Another is chemical potential energyy. By analogy, we can think of the boulder rolling to the valley bottom as a chemical reaction that lowers the chemical potential energy. This is the so-called Gibbs free energyy. Just as the gravitational potential energy decreases when the boulder rolls to the valley floor, the Gibbs free energy must decrease in a natural reaction. If it were to increase, the reaction would be unnatural and, therefore, would not occur. If the stick figure did not push the boulder over the lip of the ledge, the boulder could remain on the ledge indefinitely. The stick figure must expend a certain amount of energy to push the boulder over the lip, but as soon as the boulder crosses the threshold and begins falling, this same amount of energy is released as the boulder falls back to the elevation it had on the ledge. The amount of energy needed to cross the threshold is known as the activation energyy. In Figure (A), the activation energy is determined by the height of the lip on the ledge. By analogy, chemical reactions also have activation energies. For example, a match must be rubbed on a rough surface to generate a small amount of heat before it ignites. The activation energy required to start metamorphic reactions is commonly provided by slight overheating or mechanical deformation. If the activation energy is large, a reaction may never take place. Diamond, for example, should react with oxygen in air to form carbon dioxide, but diamonds are found in sediments that have been exposed to the atmosphere for extended periods of time with no signs of reaction. Material that is prevented from reacting by a large activation energy are said to be metastable. The simple mechanical model shown in Figure (B) illustrates the relation among metastable, unstable, and stable. If the stick figure pushes hard enough on the vertical block to make its center of gravity go beyond the lower corner, the metastable block becomes unstable and falls to the stable position, where the center of gravity is at the lowest possible position in the gravitational field. We have argued that when a chemical reaction takes place, the chemical potential energy is lowered in an analogous manner to the decrease in the gravitational potential energy when a boulder rolls to a valley floor. Chemical potential energy is very real, as can be testified to by anyone who has accidentally touched the terminals of a car battery. The electric shock you receive is a direct result of the chemical potential energy of the reaction in the battery.
395
396
Metamorphic rocks
In reactions involving complex minerals such as those in metamorphic rocks, each of the individual components making up the minerals contribute to the overall chemical potential change during reactions. Gibbs recognized that each component had a certain chemical potential, which he defined by the Greek letter µi (mu), with the subscript i indicating the particular component. For example, µNa and µCa could indicate the chemical potentials of Na and Ca in plagioclase. Chemical potential has units of joules per mole, so when multiplied by the number of moles of the particular component (ni) we obtain the contribution that component makes to the total free energy, which can be expressed as follows:
μa
a
+ μbnb + μc
c
+
+ μi ni = Gibbs free energy ,
(14.1)
where each of the subscripts (aa, b, b c … i) identifies each of the components that makes up the whole. Chemical potential is as important as temperature and pressure in driving metamorphic reactions. Diffusion, for example, is driven by chemical potential gradients; that is, atoms diffuse from regions of high chemical potential to regions of low chemical potential. Chemical potentials also determine the composition of metamorphic minerals.
side of the tube is at different heights, it cannot be at equilibrium and must flow until the heights become the same at equilibrium. Similarly, chemical potentials must be the same at equilibrium. A zoned plagioclase crystal, for example, cannot be at equilibrium because the chemical potentials of Na and Ca vary through the crystal. We can conclude, therefore, that thermodynamics tells us why reactions take place and which conditions must be met to achieve equilibrium. The important points to remember are the following: • Reactions always take place in a direction that lowers Gibbs
free energy. • Equilibrium is achieved only when Gibbs free energy
reaches a minimum. • At equilibrium, temperature, pressure, and chemical potentials of all components must be the same throughout.
14.2.2 Rates of metamorphic reactions Thermodynamics explains why reactions should take place and what is required to achieve equilibrium, but it does not tell us how rapidly the reaction takes place; this is a question of kinetics. Let us return to the example of the boulder on the valley wall given in Figure (A) in Box 14.1. If we assume that the activation energy needed to start the boulder rolling is available, then we would expect the boulder to roll rapidly to the valley floor. Soil on the valley wall would also try to move to the valley bottom, but soil creep is a slow process. If the valley received heavy rainfall and the soil became water saturated, a mud slide could result, which would move material to the valley bottom more rapidly. In each of these cases (falling boulder, soil creep, and mud slide), material strives to lower its potential energy, but each does so at a different rate. Metamorphic reactions similarly progress toward thermodynamic equilibrium at different rates. In general, reaction rates increase dramatically with increasing temperature, because of
increased diffusion rates. Diffusion is also more rapid through fluids than through solids, so the presence of fluids along grain boundaries increases reaction rates. Prograde metamorphic reactions are, therefore, more rapid than retrograde ones because temperatures are rising and fluids are being released by reactions. Retrograde reactions, in contrast, are very much slower because temperatures are falling and fluids are generally lacking. Indeed, most retrograde reactions occur only where faults or prominent fractures allow water to infiltrate the rock. Although higher temperatures and fluids increase reaction rates, diffusion through solid grains remains a slow process, and large grains (porphyroblasts) are commonly zoned, with cores preserving compositions generated during earlier stages of metamorphism. These zoned minerals prove useful in determining the metamorphic history of a rock. Most environmental changes that affect rocks are sufficiently slow that metamorphic reactions have time to keep pace with them, at least during prograde metamorphism. The rate of contact metamorphism is determined by the rate at which heat is liberated from an intrusion, and as we saw in Section 8.7.1, this is a very slow process. The rate of regional metamorphism is dependent on the rates of tectonic plate convergence, folding, thrusting and erosion, which again are all slow. The slowness of these processes, consequently, allows metamorphic rocks to approach closely thermodynamic equilibrium, which greatly simplifies their study.
14.2.3 Gibbs phase rule and the number of minerals a metamorphic rock can contain The close approach of metamorphic rocks to thermodynamic equilibrium results in their containing a relatively small number of minerals, which greatly simplifies their classification. The number of minerals that can possibly coexist at thermodynamic equilibrium is given by the Gibbs phase rule, which is explained in Box 14.2.
14.2 Why do rocks change?
BOX 14.2
THE GIBBS PHASE RULE
The Gibbs phase rule explains the quantitative relations between the numbers of phases, components, and degrees of freedom or variance that exist at equilibrium. We start by giving precise definitions of these three terms: • Phases are individual minerals, fluids, or even magma. You can think of them as the different objects that, given a
pair of tweezers or other device, you could separate one from another. We designate the number of phases in a rock by the Greek letter φ (phi). • Components are the building units of phases, but instead of listing every element present, components are the minimum number of constituents needed to describe all phases present. This allows elements to be grouped together if they appear in the same ratios in each phase. For example, if all phases contain silicon and oxygen in the proportions of 1:2, then Si and O would be grouped together to form a single component, SiO2. The important point is that components must be the minimum number of building units needed to account for the composition of all of the phases present. You must know what the phases and their chemical compositions are before you can choose components. We designate the number of components by the letter c. c • Degrees of freedom (variance) indicate how many variables can be changed without changing the phases present. For example, if we can change both the temperature and pressure without affecting the mineral assemblage, there would be two degrees of freedom. We designate the number of degrees of freedom by the letter f • The Gibbs phase rule, which applies to assemblages of phases at thermodynamic equilibrium, is written as follows: f
c + 2−φ
(14.2)
Divariant field Kyanite Pressure (GPa)
We can illustrate the Gibbs phase rule and the relation between the number of components (cc), phases (φ), and degrees of freedom (f ) by examining the stability relations between an important group of metamorphic polymorphs, all of which have the formula Al2SiO5; these are andalusite, kyanite, and sillimanite (Secs. 13.3–13.5). If these are the only phases present, we need only one component to describe all three phases; that is, Al2SiO5 (c = 1). According to the Gibbs phase rule, the maximum number of phases that can be present is three (cc + 2), because c = 1. Thus, when andalusite, kyanite, and sillimanite are all present, the assemblage is invariant; that is, this mineral assemblage can exist at only one temperature and pressure. Figure 14.3 shows this invariant triple point is at 500°C and 0.38 GPa, which corresponds to a depth of ~13 km. If only two polymorphs are present, f = 1, and the mineral assemblage must exist along one of the univariant lines extending from the triple point, along which either kyanite and sillimanite, andalusite and sillimanite, or kyanite and andalusite coexist. If only one polymorph is present, f = 2, and the polymorph can exist anywhere in the divariant fields that are bounded by the univariant lines. It is worth familiarizing yourself with this diagram and the invariant point at 500°C and a depth of 13 km, because it
Un iva ria nt lin e
The maximum number of phases a rock can contain is (c + 2) when f is 0, which means that this assemblage of minerals could exist at just one pressure and temperature; that is, the mineral assemblage is invariant (f = 0). If the number of phases decreases to (cc + 1), then f = 1. This means that one variable could be changed, but all others would be fixed. For example, you might vary the temperature, but the pressure could not be independently changed. Such a relation is said to be univariant (f = 1).
Invariant point 0.38
(Depth of 13 km)
Sillimanite
Andalusite
500°C Temperature Figure 14.3 Pressure-temperature plot showing stability fields of Al2SiO5 polymorphs. All three polymorphs coexist at only one temperature and pressure. Surrounding this invariant point, three univariant lines indicate the conditions along which two polymorphs can coexist.
397
398
Metamorphic rocks
is a useful reference point when trying to determine the conditions under which a metamorphic rock formed. In conclusion, the close approach of metamorphic rocks to thermodynamic equilibrium causes them to contain a small number of minerals, with the maximum number being two more than the number of components. Rocks containing the maximum number of minerals form under very restricted conditions of temperature, pressure, and other environmental variables such as fluid compositions.
14.3 Metamorphic grade and facies When discussing metamorphic rocks we commonly refer to their metamorphic grade, which loosely expresses the intensity of metamorphism, with increasing grade being thought to relate mainly to increasing temperatures. One of the first attempts to map the grade of metamorphism was the study by Barrow (1893) in the southeastern Scottish Highlands. He noted that mudrocks (pelites) in this region become progressively more metamorphosed toward the north. He mapped the increasing metamorphic grade by recording the first appearance of particular metamorphic index minerals, which included chlorite, biotite, garnet, staurolite, kyanite, and sillimanite. This sequence of minerals, though extremely common and found in metamorphic terranes worldwide, is not the only sequence that can occur. The fact that other sequences are found indicates that metamorphism is not a simple phenomenon and must involve numerous factors that can differ from region to region. Later, the boundaries between Barrow’s index mineral zones were termed isograds, which implies that points along these lines underwent equal intensities of metamorphism. When examined in detail, however, such lines cannot truly represent equal intensities of metamorphism, because the first appearance of an index mineral is strongly dependent on a rock’s bulk composition or fluid compositions. Although isograds are not rigorous lines of equal metamorphic intensity, they are still mapped and provide a useful general measure of metamorphic grade. The big advance in measuring metamorphic intensity came when thermodynamics was first applied to the study of metamorphic rocks. In 1911, Goldschmidt, noted that contact metamorphic rocks around igneous intrusions near Oslo, Norway, rarely contained more than four or five minerals and that the mineral assemblages were consistent with the Gibbs phase rule, which implied that the assemblages approached thermodynamic equilibrium. He emphasized that it was the mineral assemblage rather than the first appearance of a single mineral that was a measure of metamorphic grade. In 1920, Eskola, carrying out similar studies of contact metamorphic rocks around bodies of granite at Orijärvi in Finland, noted that rocks contain small numbers of minerals that are consistent with the Gibbs phase rule but that the mineral
assemblages are different from those around the Oslo intrusions. He concluded that metamorphic rocks in both areas had approached thermodynamic equilibrium but under different conditions. This led him to propose the metamorphic facies concept. He defined a metamorphic mineral facies as comprising all rocks that have originated under temperature and pressure conditions so similar that a definite bulk rock chemical composition results in the same set of minerals. The metamorphic facies concept has two very important consequences. If two rocks of identical bulk composition have different mineral assemblages, they must have been metamorphosed under different conditions. Conversely, if two rocks that have been exposed to the same metamorphism (e.g., found side by side in the field) contain different minerals, they must have different bulk compositions. Eskola’s facies approach used the entire mineral assemblage and avoided the problems associated with different bulk compositions, which plagued the application of Barrow’s index minerals. Eskola originally proposed five different metamorphic facies to which a few extra were added subsequently. He showed the relative positions of these facies on a pressure-temperature diagram. Modern experimental studies allow us to give approximate pressure and temperature ranges for these facies (Fig. 14.4). The boundaries between facies are broad zones because of the complex nature of the reactions separating them and the fact that many of the minerals belong to solid solution series. In addition, because most prograde metamorphic rocks release water, the activity of water (relative humidity; see Sec. 8.4.2) plays an important role in determining the conditions under which the reactions occur. In Figure 14.4, the activity of water is taken to be 1; that is, the minerals coexist with a pure water fluid. If the activity were less than 1, the boundaries would occur at lower temperatures. The names of the facies are based on the typical hand specimen appearance of metamorphosed basalt in each of these facies. Thus, a metabasalt at low grade would contain abundant chlorite and so is called a greenschist, whereas at higher grade it would contain abundant amphibole and is called an amphibolite, and at the highest grade it would contain granular pyroxene and plagioclase and is called a granulite. Eskola recognized that the changes in temperature and pressure associated with progressive metamorphism led to three common sequences of metamorphic facies or metamorphic facies series. A low-pressure, high-temperature series, including the albite-epidote hornfels, the hornblende hornfels, the pyroxene hornfels, and the sanidinite hornfels facies (Fig. 14.4), is typically associated with contact metamorphic aureoles but is also found in regional metamorphic terranes. A common metamorphic facies series found in many regionally metamorphosed orogenic belts includes the zeolite, greenschist, amphibolite, and granulite facies. This series shows a progressive increase toward both high temperature and pressure, e with both
14.3 Metamorphic grade and facies Temperature (°C) 300
400
500
Albite-Epidote Hornfels
PP
600
700
Hornblende Hornfels
PA
800
900
Pyroxene Hornfels
Sanidinite Hornfels
Amphibolite Granulite
Geot
herm
al gr adie
nt of
1
oth Ge
Blueschist
25°C
/km
erm n die gra al
Ultrahigh temperat ure
Greenschist
Pressure (GPa)
1000 0
50
Depth (km)
100 200 0 Zeolite
f5
to PP - Prehnite-Pumpellyite PA - Pumpellyite-Actinolite
3
Eclogite
/km °C
2
Quartz Coesite Ultrahigh pressure
rising approximately along a geothermal gradient of ∼25°C/ km (Fig. 14.4). A third series, marked by high pressures at low temperaturess includes the prehnite-pumpellyite, blueschist, and eclogite facies. Although these are the most common series, intermediate series also occur. Recently, ultrahigh-pressure (UHP) metamorphic rocks have been found in subduction zones in which the high-pressure polymorph coesite is the stable form of silica rather than the low-pressure polymorph quartz (Sec. 7.7). These rocks form at pressures of ∼3 GPa, which correspond to depths of ∼100 km. Some UHP rocks have even been found to contain diamonds, which indicates depths of 200 km. How rocks from such great depth return to the surface remains a puzzle and is the subject of current research. In addition, ultrahigh-temperaturee (UHT) rocks have been found that equilibrated near 1000°C. These temperatures are attained in rocks that lack a low-melting fraction or have had all of a low-melting fraction removed at an earlier stage of metamorphism. The large latent heat of fusion of rocks normally puts a cap on metamorphic temperatures. Assigning a rock to a particular metamorphic facies requires careful study of the mineral assemblage, usually through the use of thin sections. Some of the most common minerals found in the different metamorphic facies are given in Table 14.1. These may help you determine an approximate metamorphic grade, but it is important to emphasize that assignation
100
Figure 14.4 Approximate pressure and temperature ranges of metamorphic facies when the activity of water is 1 (modified from Philpotts and Ague, 2009).
to a metamorphic facies is dependent on an entire mineral assemblage and not the presence of a single mineral. This table is given only for reference purposes; it is not something you need memorize. The following general tips may help you focus your search in assigning a rock to a metamorphic facies. Metamorphosed basaltic rocks in the greenschist facies are characterized by an abundance of green chlorite. They may also contain the aluminapoor amphibole actinolite, but this is difficult to distinguish from the aluminous variety, hornblende, which characterizes the amphibolite facies. Plagioclase in the greenschist facies is always of albitic composition, whereas in the amphibolite and granulite facies, it can have any composition. Determining plagioclase compositions, however, requires thin sections, and even then it is not easy, because most metamorphic plagioclase does not exhibit twinning from which to measure extinction angles. The reason plagioclase is restricted to albitic compositions in the greenschist facies is that calcic plagioclase is converted to epidote at this grade, and epidote is readily identified in hand specimens by its pistachio green color (Sec. 13.18). The metamorphic facies approach to estimating metamorphic grade was a marked improvement over earlier methods, but the complexity of metamorphic minerals and the possible variable activity of water still prevented precise metamorphic temperatures and pressures being determined. This became
399
400
Metamorphic rocks Table 14.1 Common minerals in metamorphic facies. Facies
Mafic protolith
Pelitic protolith
Carbonate protolith
Zeolite
Chlorite, serpentine, clay minerals, zeolites, analcite, albite, quartz, prehnite, pumpellyite, calcite, dolomite
Chlorite, illite, clay minerals, quartz, albite, calcite, dolomite
Calcite, dolomite, quartz, chlorite, illite, clay minerals, albite
Prehnitepumpellyite
Chlorite, serpentine, prehnite, pumpellyite, quartz, albite, calcite, dolomite
Chlorite, muscovite, clay minerals, quartz, albite, calcite, dolomite
Calcite, dolomite, quartz, clay minerals, albite
Blueschist
Glaucophane, lawsonite (or epidote), quartz, garnet
Glaucophane, Si-rich muscovite, lawsonite (or epidote), quartz, garnet
Aragonite, dolomite, glaucophane, epidote, albite
Greenschist
Chlorite, actinolite, epidote, albite, quartz
Chlorite zone: chlorite, muscovite, quartz, albite Biotite zone: chlorite, muscovite, biotite, quartz, albite Garnet zone: muscovite, biotite, garnet, quartz, albite
Calcite, dolomite, muscovite, quartz, albite
Albite-Epidote hornfels
Albite, pyrophyllite, epidote, actinolite, chlorite, quartz
Muscovite, chlorite, biotite, albite, quartz, pyrophyllite
Calcite, epidote, actinolite, quartz
Amphibolite
Hornblende, plagioclase, quartz, garnet
Staurolite zone: muscovite, biotite, quartz, garnet, staurolite, plagioclase Kyanite zone: muscovite, biotite, quartz, garnet, kyanite, staurolite, plagioclase Sillimanite zone: muscovite, biotite, quartz, garnet, sillimanite, plagioclase
Calcite, dolomite, quartz, biotite, amphibole, diopside, K-feldspar, wollastonite
Hornblende hornfels
Cordierite, plagioclase, anthophyllite, hornblende, diopside, garnet, quartz
Andalusite, muscovite, cordierite, quartz, biotite
Calcite, diopside, grossular, biotite, quartz
Pyroxene hornfels
Diopside, orthopyroxene, plagioclase, biotite, quartz
Andalusite, cordierite, orthoclase, biotite, quartz
Wollastonite, grossularite, diopside, biotite, quartz
Granulite
Clinopyroxene, orthopyroxene, plagioclase, garnet, quartz
Quartz, K-feldspar, plagioclase, sillimanite, garnet, biotite, orthopyroxene, cordierite
Calcite, dolomite, quartz, diopside, wollastonite, K-feldspar, forsterite
Sanidinite
Sanidine, clinopyroxene, orthopyroxene, plagioclase, quartz
Sillimanite or mullite, spinel, sanidine, quartz
Monticellite, melilite, diopside, calcite
Eclogite
Pyrope-rich garnet, jadeiterich pyroxene, quartz, kyanite, rutile
Si-rich muscovite, quartz, jadeite-rich pyroxene, pyrope-rich garnet, kyanite, rutile
Aragonite, dolomite, jadeite-rich pyroxene, epidote, quartz, Si-rich muscovite, pyrope-rich garnet
possible only after sufficient thermodynamic data became available to calculate the precise conditions under which each metamorphic reaction can take place. The resulting reaction curves, when plotted on a pressure-temperature diagram, create a grid that allows a particular metamorphic mineral assemblage to be assigned a precise pressure and temperature range at
any given activity of water. The resulting plot, which is referred to as a petrogenetic grid, is introduced in Section 14.6. Finally, some metamorphic reactions involving minerals belonging to solid-solution series are particularly sensitive to changes in temperature, and the composition of these minerals can be used to determine metamorphic temperatures, in
14.4 Textures of metamorphic rocks
some cases to within a few degrees. These reactions are known as geothermometers. A much smaller number of reactions are sensitive to pressure, and are known as geobarometers. Geothermometers and geobarometers are discussed in Section 14.9.
14.4 Textures of metamorphic rocks Metamorphism brings about the growth of new mineral grains that generate characteristic textures that can be used to distinguish metamorphic rocks from igneous and sedimentary rocks. New grains may appear as a result of recrystallization of former grains in the protolith or as products of metamorphic reaction. In either case, grain growth can occur under lithostatic pressure (pressure equal in all directions), directed pressure, or even a shear stress. Regardless of the conditions, grain growth is controlled by the general principles that we outline here. Grain growth is a natural process and, therefore, must involve a decrease in the Gibbs free energy; that is, once a grain has grown, the free energy of the rock must be lower than it was before. Grains have all sorts of energy associated with them other than the simple chemical energy. For example, a detrital mica grain in a sedimentary rock that was bent during compaction of the sediment would have stored elastic energy. Twins in crystals are another source of excess energy. By recrystallizing, g these excess energies are released. All grains have boundaries, which are sources of excess energy. At grain boundaries, the crystal structure of a grain must terminate and come in contact with the crystal structure of adjoining grains. The mismatch of structures across boundaries results in surface free energies. The surface area of a large grain is less than the combined surface area of two smaller grains with the same total volume. Thus, by recrystallizing to a coarser-grain size, rocks reduce their surface free energies. This explains why metamorphic rocks typically become coarsergrained during metamorphism (see exception in the following paragraph). Although recrystallization decreases the free energy of a rock by eliminating energies associated with strain, twinning, and grain surfaces, the process typically has an activation energy (see Box 14.1) that must be overcome before new strain-free grains can begin to form. The energy needed to overcome this threshold may come from rocks being overheated. In regional metamorphic rocks, deformation associated with folding and thrusting may supply the activation energy. Deformation of mineral grains can create small regions of intense strain that have a much greater tendency to recrystallize than do less deformed regions. These high-strain regions are the sites of nucleation of new grains. Once a new strain-free grain has nucleated, material diffuses to it from nearby deformed grains. We mentioned in the previous paragraph that recrystallization generally coarsens metamorphic rocks, but in zones of intense shear, so many new nucleation sites may form that the eventual
Table 14.2 Crystalloblastic series. Magnetite, rutile, titanite, pyrite Sillimanite, kyanite, garnet, staurolite, tourmaline Andalusite, epidote, zoisite, forsterite, lawsonite Amphibole, pyroxene, wollastonite Mica, chlorite, talc, prehnite, stilpnomelane Calcite, dolomite, vesuvianite Cordierite, feldspar, scapolite Quartz
strain-free rock contains so many grains that it becomes finer grained. Finally, the shape of metamorphic mineral grains is also determined by surface free energies. Some crystal faces have lower free energies than others, and as a result, during metamorphism, these faces grow larger at the expense of the highenergy faces, thus giving mineral grains characteristic shapes. Of course, not all grains can develop crystal faces if they are to fit together with no pore space. Minerals with the highest surface energies bring about the largest decrease in surface free energy by coarsening and generating low-energy faces, so those are the ones that produce euhedral crystals. Metamorphic minerals can be arranged in what is known as the crystalloblastic series (Table 14.2), where a mineral in the series can form euhedral crystal faces against any mineral below it in the series. The series reflects decreasing surface free energies from top to bottom.
14.4.1 Textures of contact metamorphic rocks Heat liberated from igneous intrusions provides the energy to drive recrystallization and create new metamorphic minerals. Activation energies are easily overcome, because of the proximity of the heat source, and the rocks recrystallize. Because the pressure is usually close to lithostatic, there is little driving force for minerals to grow with preferred orientations. Even elongate minerals formed by metamorphic reactions grow with random orientations. As a result, contact metamorphic rocks typically lack foliation, which makes them hard to break (commonly they do so with conchoidal fracture). They are referred to as hornfels, from the German for horn n (or hard) stone (Fig. 14.5). Many hornfelses consist of polygonal-shaped grains that are bounded by faces intersecting at ~120° (Fig. 14.5(B)). This is a direct consequence of the minimization of surface free energies during recrystallization. We can think of surface energies as surface tensions pulling along grain boundaries. You actually experience such surface tension when you inflate a balloon. If three grains come together at a triple junction, the surface tensions can be represented by arrows pulling away from the triple junction, with the length of the arrows indicating the magnitudes
401
402
Metamorphic rocks 1 cm
(A)
1 mm
(B)
γ1
θ2
γ3
θ3
θ1
Figure 14.5 (A) Photomicrograph of a thin section under crossed polarized light of large grains of cordierite (gray) and small grains of spinel (black) in hornfels at the contact of the Stillwater Igneous Complex, Montana. (B) Photomicrograph of a thin section of contact metamorphic marble under crossed polars showing ∼120° grain boundary junctions. (C) The angles between grain boundaries (θ) are related to the surface tensions between the grains (γ) γ by the law of sines.
of the surface tensions (γ1, γ2, and γ3 in Fig. 14.5(C)). When the rock undergoes recrystallization, the triple junction is able to move by adjusting the angles subtended by the three grains (θ1, θ2, θ3) to bring surface tensions into balance. According to the law of siness (Fig. 14.5(C)), if the three surface tensions are of equal magnitude, the angles subtended by the grains must also be equal and hence each must be 120°.
14.4.2 Deformation and textures of regional metamorphic rocks The characteristic feature of almost all regionally metamorphosed rocks is a prominent foliation formed by the growth of platy and needlelike minerals with a preferred orientation. Foliation first appears in the lowest grades of metamorphism and becomes more pronounced as metamorphism continues. Only at the highest grades of metamorphism, where micas and amphiboles become unstable, does foliation become less distinct. Slate, phyllite, schist, and gneiss
Muscovite and chlorite are two of the first minerals to appear in metamorphosed pelitic rocks, and because both form platy
(C) γ2 γ1 sin θ1
γ3
γ2 =
Law of sines
= sin θ2
sin θ3
grains, their growth with a preferred orientation imparts to the rock a foliation known as slaty cleavage. Figure 14.6(A) shows an outcrop of steeply dipping Martinsburg shale near Shippensburg, Pennsylvania, that shows the first signs of regional metamorphism, as evidenced by the weak development of slaty cleavage. New muscovite and chlorite grains did not grow large enough to be visible at low magnification under the microscope, but their general alignment can be seen to have produced a foliation (Fig. 14.6(B)). This foliation, or slaty cleavage, developed perpendicular to the maximum compressive stress (Fig. 14.6(C)), which also deformed the rocks into folds with axial planes parallel to the slaty cleavage (Fig. 14.6(D)). Although the slaty cleavage in Figure 14.6(A) is clearly evident, the foliation planes are not developed well enough to cause the rock to break into large flat slabs. With continued growth and coarsening of micaceous minerals, the characteristic slaty cleavage develops where slabs large enough to make roofing tiles or even billiard tables can be quarried (Fig. 14.7(A)). As micaceous minerals coarsen still more, the foliation planes develop a reflective sheen and the rock is referred to as phyllite (Fig. 14.7(B)). Individual mica grains are still not large enough
14.4 Textures of metamorphic rocks
(C) se llip e ain Str
ty Sla ge a av cle
ld
Maximum
compressive stress
f fo
la
lp
ia Ax
o ne
(A) (B)
(D) 0.1 mm
1 mm
Figure 14.6 (A) Steeply dipping Martinsburg shale near Shippensburg, Pennsylvania, showing slaty cleavage dipping to the left. (B) Photomicrograph of a thin section under crossed polars of the shale in (A) where bedding is marked by opaque streaks of organic material and the slaty cleavage by pinkish birefringent muscovite. (C) A strain ellipse showing how mica grains preferentially grow in a plane perpendicular to the maximum compressive stress. (D) Slaty cleavage parallels the axial plane of folds.
to be visible to the unaided eye in phyllite, but once they are, the rock is called schist (Figs. 14.1(B) and 14.8(A)). Foliated metamorphic rocks that contain few micaceous or needlelike minerals are referred to as gneiss (Fig. 14.8(B)). The foliation in gneisses is usually defined by layers of slightly different composition. Micaceous minerals and amphiboles become unstable and react to form granular minerals at higher grades of metamorphism, so gneisses become more common in higher-grade
(A)
terranes. For example, the gneiss shown in Figure 14.8(B) is the high-grade equivalent of the schist shown in Figure 14.8(A). The distinction between schist and gneiss is arbitrary, but as a general rule, if you can pull the rock apart with your fingernails, it is a schist, but if you can’t, then call it a gneiss. Schists are usually formed from platy minerals such as micas and chlorite, but the preferred alignment of elongate minerals such as amphiboles can also create schistosity. Blueschists, for
(B)
Figure 14.7 (A) The large perfectly planar surface in this road cut is produced by breakage along slaty cleavage planes. (B) As micaceous minerals grow larger, the foliation plane develops a sheen, which is characteristic of the rock known as phyllite.
403
404
Metamorphic rocks
1 mm
1 cm
(B)
(A)
Figure 14.8 (A) Photomicrograph of a thin section of the schist shown in Figure 14.1(B) and chapter-opening photograph under crossed polarized light. The alignment of highly birefringent muscovite grains defines the schistose foliation. Low-birefringent grains are chlorite and gray grains are quartz. (B) Hand specimen of gneiss belonging to the granulite facies composed of light-colored quartz and feldspar, red garnet, and dark pyroxene. This rock is essentially the anhydrous equivalent of the schist in (A).
example, have a schistosity caused by the alignment of sodic amphibole grains (Fig. 14.9). Figure 14.10 shows a schist from western Massachusetts in which sheaflike clusters of amphibole crystals lie in the plane of the foliation. Such rocks are commonly referred to as garbenschiefer, from the German words Garben n and Schieferr, meaning “sheaves” and “schist,” respectively. Metamorphic foliation in slates and schists can be shown to develop perpendicular to the maximum compressive stress where deformed fossils or other objects are present whose
original shape is known. For example, reduction spots in mudstones (Sec. 12.1.1) and oolites in limestone (Sec. 11.3.1) are initially very nearly spherical, but after deformation they become ellipsoidal. From measuring the shape of such objects, we can determine the directions of maximum and minimum compressive stresses and how much deformation the rock has undergone. Such measurements show that slaty cleavage is oriented perpendicular to the maximum compressive stress.
1 cm 1 mm
Figure 14.9 Photomicrograph of a thin section under plane polarized light of glaucophane (blue) schist from the Franciscan Complex, California. The green to beige pleochroic grains are jadeite-rich clinopyroxene (NaAlSi2O6).
Figure 14.10 Mica-garnet-hornblende schist of the Ordovician Hawley Formation of western Massachusetts with sheavelike clusters of hornblende (garbenschiefer). This rock is the same as the one shown on the cover of the book.
14.4 Textures of metamorphic rocks
When a variety of different rocks are deformed together, it is quite likely that some deform more easily than others. Some rocks are strong and resist deformation, whereas others are weak and deform easily. Figure 14.11 shows a greenish-colored layer in a gray gneiss made of biotite, quartz, and feldspar. The green layer was originally an impure limestone that was metamorphosed to green calcium aluminum silicates; the rock is, therefore, referred to as a calcsilicate. During deformation and metamorphism, the calcsilicate resisted deformation more than the surrounding gneiss. Consequently, as the host rock flattened and developed a foliation, the resistant calcsilicate layer was stretched and began to form lenses by necking down at points where, eventually, it ruptured. As segments of the calcsilicate layer were pulled apart, the surrounding gneiss tried to flow in to fill the gaps. However, this was not fast enough to keep pace with deformation, so feldspar from the surrounding rock diffused in to fill the gaps between segments. The resulting structure resembles a string of sausages, so it is referred to as boudinage, as a boudin n is a type of French sausage. Migration of material during the development of foliation
Figure 14.11 Boudins of calcsilicate rock in gray biotite-feldspar-quartz gneiss. Feldspar (white) migrated from the gneiss to fill gaps between the boudins.
1 cm
(A)
The migration of feldspar from the gneiss into the gaps between boudins in Figure 14.11 is evidence of the mobility of some minerals during the formation of metamorphic foliation. In some rocks, the generation of foliation involves large-scale loss of material from the rock. Limestone is particularly susceptible to such losses due to pressure solution. We have already seen that during compaction, limestone dissolves along 10 cm
(B)
Figure 14.12 (A) Limestone containing fossil foraminifera that are truncated (arrows) by solution cleavage planes, which are marked by dark vertical lines of insoluble residue. (B) Folded marble with dark axial plane solution cleavage (arrow) developing in the marble to the right as it approaches the shear zone in the center of the photograph.
405
406
Metamorphic rocks
Second
1 mm
foliation
(A)
(B) First foliat ion
First foliat ion
Before compression
(C)
After compression Figure 14.13 (A) Quartz-muscovite schist showing an early gently dipping foliation cut by a later steeply dipping foliation in which all quartz has disappeared. (B) Drawing showing the early foliation prior to development of the second foliation. Quartz is lost from the shaded area during formation of the second foliation. (C) Compression results in the loss of quartz and development of the second foliation.
roughly horizontal planes on which insoluble residue accumulates to form stylolites (Sec. 11.9.3 and Fig. 11.33). When limestone is folded and metamorphosed, solution continues but along surfaces that parallel the axial plane of folds. Figure 14.12(A) shows a foraminiferal limestone in which a steeply dipping widely spaced (∼1 cm) solution cleavage has developed. The ends of foraminifera can be seen to have been removed by solution along these cleavage planes. The insoluble residue, consisting largely of clay minerals, accumulates on these planes and defines a dark axial plane foliation, as can be seen in the folded marble in Figure 14.12(B). Measurements of the amount of insoluble residue in folded limestones indicate that large volumes of rock are removed by solution during deformation, which again attests to the importance of fluids during metamorphism. Pelitic schists can also lose large quantities of quartz during development of foliation. Figure 14.13(A) shows a quartzmuscovite schist with two ages of foliation. The earlier foliation dips gently, whereas the second dips steeply. The second foliation is more widely spaced than the first, and because it folds the first foliation, it is often referred to as crenulation schistosityy. The second foliation is marked by zones consisting almost exclusively of muscovite; all the quartz grains have vanished from these zones. From the geometry of the two foliations, it is easy to see what volume of rock was removed during the development of the second foliation (Fig. 14.13(B)–(C)). The quartz removed from such foliation planes accounts for part of the quartz deposited in quartz veins in overlying rocks (Fig. 14.2).
Growth of metamorphic minerals during shear
Metamorphic minerals commonly are sheared and rotated during growth. Some porphyroblasts preserve a record of this rotation if they contain inclusions of minerals that were parallel to the original foliation prior to the shear. Figure 14.14(A)– (B) shows two garnet porphyroblasts that have undergone different degrees of shear during growth, as indicated by trails of quartz and opaque inclusions that were parallel to the original foliation. In Figure 14.14(A), the garnet porphyroblast grew for an extended period overgrowing layers of quartz and opaque grains that were initially parallel to the foliation. Toward the end of its growth, the garnet crystal experienced a counterclockwise shear that rotated the included quartz layers through 20°. The porphyroblast in Figure 14.14(B) also experienced counterclockwise shear, but in this case, the garnet continued growing as it rotated, with the result that it contains quartz inclusions that show folds indicating 120° of rotation. Porphyroblasts with folded trails of inclusions are said to have a helicitic texture, from the Greek word helix. x Some porphyroblasts with a helicitic texture may not have been formed by rotation but may have simply grown over a preexisting crenulation. However, if the inclusions are twisted through more than 180°, the helicitic texture must have been caused by rotation. Shear can also reduce the grain size of crystals during metamorphism. Figure 14.15 shows a metamorphosed granite composed of perthitic alkali feldspar and quartz that underwent considerable deformation, as evidenced by the large bent grain of feldspar. The deformation caused new un-deformed grains
14.4 Textures of metamorphic rocks
1 mm
1 mm
(A)
(B)
Figure 14.14 Garnet porphyroblasts with trails of quartz and opaque inclusions indicating counterclockwise shear through 20° in (A) and 120° in (B). The porphyroblasts have retrograde green chlorite developed on their rims.
to nucleate and grow. All the quartz completely recrystallized into thin lenses that define the foliation in the rock. Some of the original feldspar grains still remain, but finer grains of recrystallized feldspar surrounded them. The relict grains are shaped like eyes, so this rock is referred to as augen gneiss after the German word for “eye.” Rocks that contain relict large grains are said to have a porphyroclastic texture to distinguish them from the porphyroblastic texture, in which grains grew to a large size during metamorphism. 1 mm
Figure 14.15 Augen gneiss, consisting of large deformed feldspar grains surrounded by finer recrystallized feldspar and lenses of recrystallized quartz that define the foliation.
When shear becomes intense near fault zones, large amounts of strain can cause so many new grains to nucleate that the rock becomes extremely fine grained. The grain size may be so fine that individual grains are not visible to the unaided eye. Such rocks are known as mylonites, from the Greek word mylos, s meaning “mill,” because their fine grain size was thought originally to result from grinding and breaking of grains. Fault zones near the Earth’s surface may contain fine ground up rock known as gouge, but the fine-grained rock developed along faults in the ductile part of the crust are now known to form by recrystallization. As large grains in the protolith recrystallize to finer-grain size, they produce thin monomineralic layers that may contain relics of the original mineral (Fig. 14.16). These are streaked out along the shear plane and cause most mylonites to exhibit fine-scale layering. As a result, mylonites are easily mistaken for bedded chert. In extreme cases, rapid shear can generate sufficient frictional heat on fault planes to cause melting. The liquid is injected into fractures in the surrounding rock where it freezes rapidly to a glass or extremely fine-grained rock (Fig. 14.17(A)–(B)). This rock is known as pseudotachylite because it resembles basaltic glass (tachylite) but has the composition of whatever rock was frictionally fused. In summary, regional metamorphic rocks are characterized by foliations that can be due to the parallel alignment of platelike or needlelike minerals. Foliations typically develop perpendicular to the maximum compressive stress and, therefore, parallel to the axial plane of folds. Foliation can also be
407
408
Metamorphic rocks
generated by shear, the sense of which may be preserved by trails of inclusions in porphyroblasts that grow during deformation. Although grain size typically increases during regional metamorphism, intense deformation can cause recrystallization to finer-grained rocks.
1 mm
14.5 Simple descriptive classification of metamorphic rocks
Figure 14.16 Plagioclase-hornblende mylonite from a thrust fault in southeastern Connecticut. Small eye-shaped grains of plagioclase are surrounded by extremely fine grains of plagioclase, which are streaked out by shear to produce the foliation.
(A)) (A
The description of metamorphic rocks is straightforward and involves the listing of the most abundant minerals attached to a textural term, such as hornfels, slate, schist, or gneiss. For example, the rock in Figure 14.1(B) is a staurolitegarnet-muscovite schist, whereas the rock in Figure 14.5(A) is a cordierite-spinel hornfels. In addition, a number of special terms are used for rocks that have a specific protolith. Marble, for example, is used for metamorphic rock formed from relatively pure limestone. If the limestone is a marl or is interbedded with shale, it typically is converted to an assemblage of calcium aluminum silicates (anorthite, grossular, actinolite, diopside) and hence is referred to as calcsilicate. Calcsilicaterich rocks are commonly developed at the contact of igneous bodies, where their composition may be affected by metasomatism, especially due to the introduction of iron. These rocks, which can form iron-ore deposits, are known as skarns. Metamorphism of quartz-rich sandstone produces a metamorphic rock known as quartzite. Finally, metamorphism of ultramafic igneous rocks produces a mixture of serpentine and talc, which is known as soapstone. The classification of metamorphic rocks according to metamorphic facies can be made only after mineral assemblages have been carefully identified. This is normally done under the microscope, because even the presence of a small amount of a mineral is as important to defining an assemblage as a large amount. This will become apparent after we discuss the graphical representation of mineral assemblages in the following section.
14.6 Metamorphism of mudrock
1 mm
(B) Figure 14.17 (A) Black veins of pseudotachylite formed by frictional fusion along a fault 100 km northeast of Montreal, Quebec. (B) Photomicrograph of a thin section under plane light of pseudotachylite from (A). Unaltered yellow glass (far left) contains rounded grains of quartz. The red glass (center) at the margin of the vein has oxidized. The granite on the right is reduced to a mylonite at the contact with the pseudotachylite.
Although metamorphic facies were originally named on the basis of mineral assemblages in a basaltic protolith, sedimentary rocks containing an abundance of clay minerals (pelites) are far more useful for recording metamorphism, because many more reactions take place and produce many more minerals with which to subdivide P-T T space. Moreover, mudrock is the most abundant type of sedimentary rock. Muscovite is one of the earliest minerals to form in metapelites, and it continues to exist up to the top of the amphibolite facies, where it reacts with quartz to form Kfeldspar and an Al2SiO5 polymorph. We can write this reaction as follows:
14.6 Metamorphism of mudrock
KAl 2 AlSi 3O10 (OH)2 + SiO 2 = KAlSi 3O8 muscovite quartz K-feldspar + Al 2 SiO5 + H2 O andal a usite f id flu kyanite sillimani n te
The first question we must ask is, What is the minimum number of components needed to account for the composition of all of the phases? Inspection of the formulas reveals that we would require four components to create all of the phases. We can write these in terms of oxides containing one cation, which simplifies plotting minerals in diagrams. These components are the following:
(14.3)
As do many prograde metamorphic reactions, this one liberates a fluid. Because the fluid is pure H2O, the activity of water in the environment affects the temperature at which the reaction occurs. For our discussion, we assume the activity to be 1, but if the metapelite were interbedded with limestone that liberated CO2 during metamorphism, the fluid in the environment would not be pure water and, therefore, the activity would be less than 1. An Al2SiO5 polymorph is produced by the reaction, the specific one being determined by the pressure and temperature at which the reaction occurs relative to the stability fields of the three polymorphs (Fig. 14.3). We next develop a simple graphical way to analyze this reaction and show the relations T space. between the various minerals in P-T
HO1/2 , SiO2 , AlO3/2 , and KO1/2 To show the composition of the phases in terms of these four components, we require a tetrahedral plot, which is given in Figure 14.18(A). The phases are shown by the black dots. Note that although the Al2SiO5 polymorphs, quartz, and K-feldspar plot on the front-right face of the tetrahedron, muscovite plots inside the tetrahedron because it is the only mineral that contains water. None of the minerals contains large amounts of KO1/2, and, as a result, all plot near the front edge of the tetrahedron. We also note that the ratio of KO1/2 to SiO2 in K-feldspar and muscovite is the same (1:3). This allows us to make Kfeldspar the potassium-bearing component rather than KO1/2, which then expands the front part of the tetrahedron, making a more convenient plot. Remember, there is nothing sacred about the way components are defined, as long as they are the minimum number needed to account for all the phases present. We, therefore, choose the more convenient set of components:
14.6.1 Graphical representation of a simple metamorphic reaction Let us apply the Gibbs phase rule (Box 14.2) to a metapelite that could possibly contain all of the minerals given in Reaction (14.3); that is, quartz, muscovite, andalusite, kyanite, sillimanite, and K-feldspar. We start by writing the formula of each phase: Quartz
SiO2
Muscovite
KAl2AlSi3O10(OH)2
Andalusite, kyanite, sillimanite
Al2SiO5
Potassium feldspar
KAlSi3O8
Water
H 2O
HO1/2 , SiO2 , AlO3/2 , and KAlSi 3O8 We still have four components, which require a tetrahedral plot, as shown in Figure 14.18(B), but the region of interest has been expanded. Again, the Al2SiO5 polymorphs, quartz, and
AlO3/2
AlO3/2
Al2SiO5 Ms HO1/2
Kfs Qz
(A)
AlO3/2
Ms’ projected
+ H2O
Ms
KO1/2
Al2SiO5
HO1/2
Al2SiO5 Kfs KAlSi3O8
SiO2
Ms’ (projected) x
Kfs
Qz Qz
(B)
SiO2
SiO2
KAlSi3O8
(C)
Figure 14.18 (A) Quartz (Qz), K-feldspar (Kfs), Al2SiO5 polymorphs, muscovite (Ms), and water (HO1/2) plotted in the four-component compositional tetrahedron HO1/2-SiO2-AlO3/2-KO1/2. (B) Plotting of the same phases in the compositional tetrahedron HO1/2-SiO2-AlO3/2-KAlSi3O8. Compositions in this tetrahedron can be projected from the HO1/2 corner onto the AlO3/2-SiO2-KAlSi3O8 face of the tetrahedron as shown for the case of muscovite (Ms). (C) Minerals in (A) plotted in terms of AlO3/2-SiO2-KAlSi3O8 with muscovite (Ms′) being projected as shown in (B).
409
Metamorphic rocks
14.6.2 A simple pressure-temperature petrogenetic grid The pressure and temperature conditions for Reaction (14.3) under an activity of water of 1 are shown in Figure 14.19 (blue line), with quartz and muscovite being stable on the lowtemperature side of the reaction curve. The plot also shows the univariant lines separating the stability fields of the three Al2SiO5 polymorphs (red lines), which are independent of water activity. These various reactions divide pressure-temperature space into regions where particular mineral assemblages are
KAl2AlSi3O10(OH)2 + SiO2 = KAlSi3O8 + Al2SiO5 + H2O
Ms + Q Kfs + Ky
(aH O = 1) 2
0.9
AlO3/2
0.7
Qz SiO2
0.6
Ky
30
Ms’
Ky
Kfs
2
0.5
Sil
Ms + Q Kfs + Sil
0.8
35
25
3 20 Sil
I
0.4
ite Kyan usite l a And
0.3
And
15 Sill An imani dal t usi e te
Depth (km) (ρ = 2700 kg/m3)
1.0
Sil Kyan lim it an e ite
K-feldspar plot on the front-right face of the tetrahedron, but muscovite now plots on the back face of the tetrahedron. Three-dimensional plots such as the tetrahedron in Figure 14.18(B) are not easy to read because the positions of compositions within the tetrahedron are difficult to show. For example, if you had not been told that the dot representing muscovite plotted on the back face of the tetrahedron, it could have plotted anywhere in the tetrahedron along a line of sight toward your eye. For this reason, we search for ways to simplify three-dimensional plots by projecting them into two dimensions. We can do this if we restrict our discussion to rocks that coexist with pure water. This is equivalent to saying that the activity of water is 1. During metamorphism, Reaction (14.3) releases water. It is true that most of this escapes from the rock, but as long as small amounts of pure water remain along grain boundaries, it is valid to assume that its activity was 1. By making this assumption, we are saying that water was present as a phase, even though we may not list it in our mineral assemblage. If all mineral assemblages coexist with water, it is unnecessary to show water in our plot. We can eliminate it by projecting mineral compositions within the tetrahedron from the water apex onto the AlO3/2-SiO2-KAlSi3O8 triangular face. This is shown symbolically by the flashlight shining from the HO1/2 apex and casting a shadow of the muscovite composition on the triangular face. This shadow is then the projected composition of muscovite. Figure 14.18(C) shows the resulting triangular plot, with the minerals that actually plot on the face being shown as black dots and the projected composition of muscovite as the open circle (Ms′). We have written +H2O beside the triangle to remind us that these minerals must coexist with pure water. We can use the triangular plot to illustrate the mineral assemblages associated with Reaction (14.3). For example, a rock composed of muscovite, andalusite, and quartz (+ water) would plot in the triangle bounded by these minerals (e.g., x in Fig. 14.18(C)). When Reaction (14.3) takes place, the tie line between muscovite and quartz is broken and switches to a tie line between K-feldspar and andalusite (dashed line). Our previous rock would, therefore, plot in the triangle quartz-andalusiteK-feldspar.
Pressure (GPa)
410
10
0.2 + Q And Ms And + Kfs
0.1 0.0 400
500
600 700 Temperature (°C)
5
800
0
Figure 14.19 Pressure-temperature plot of the reaction muscovite + quartz = K-feldspar + Al2SiO5 + H2O (blue line) and the Al2SiO5 polymorphs (red lines). Triangular plots show mineral assemblages in the divariant fields between the reaction lines (mineral abbreviations are the same as in Fig. 14.18). The heavy dashed line shows a sequence of mineral assemblages that might occur across a progressively metamorphosed terrane.
stable. The intersecting reaction lines are referred to as a petrogenetic grid, because they set limits on the pressure and temperature ranges over which a given metamorphic mineral assemblage could have formed. Reaction (14.3) involves three minerals and water, but one of the minerals (Al2SiO5) has three polymorphs, so the total number of phases is seven. However, according to the Gibbs phase rule, the maximum number of phases that can coexist is (c + 2) which in this case is six. When six phases are present, the system is invariant; that is, these six phases can exist at only one temperature and pressure. Three such invariant points are shown in Figure 14.19 by black dots. For example, where Reaction (14.3) intersects the line separating the field of andalusite and sillimanite, the six coexisting phases are quartz, muscovite, andalusite, sillimanite, K-feldspar, and water. Where this reaction intersects the line separating the field of kyanite and sillimanite, the six phases are quartz, muscovite, kyanite, sillimanite, K-feldspar, and water. And at the Al2SiO5 polymorph triple point, the six phases are quartz, muscovite, andalusite, kyanite, sillimanite, and water. When a phase is not plotted in a diagram, such as water in Figures 14.18(C) and 14.19, the phase rule is commonly simplified by reducing the number of components and phases by one. If water is not plotted, one less component is required to describe the remaining phases. This reduces the number of
14.6 Metamorphism of mudrock
components from four to three, and the maximum number of phases that coexist at an invariant point is five. This is just a simplification, and it is understood that water is still present as a phase and a component, as indicate by writing in Figure 14.19 that aH O = 1. Surrounding each of the invariant points in Figure 14.19 are univariant lines along which four minerals (+ water) coexist. These univariant lines separate divariant fields in which three minerals (+ water) coexist. By saying the fields are divariant, we are indicating that the pressure and temperature can be varied over some range without changing the mineral assemblage. In each of these fields, we can place a triangular plot such as that shown in Figure 14.18(C) in which we can indicate the possible mineral assemblages. Let us start by determining the possible mineral assemblages that occur in the divariant field in the top left of Figure 14.19 (high pressure, low temperature). Because this region is on the low-temperature side of Reaction (14.3) (blue curve), quartz and muscovite are stable together. In the phase triangle, we join the minerals with a tie line to show that they stably coexist. Under these pressure and temperature conditions, kyanite is the stable polymorph of Al2SiO5, so we indicate this on the phase triangle by joining it with tie lines to muscovite and quartz. This creates a tie triangle; in other words, a divariant assemblage of three minerals, which could be either quartz-muscovitekyanite or quartz-muscovite-K-feldspar depending on the bulk composition of the rock. A line does not join kyanite and K-feldspar because that tie line does not form until we cross to the high temperature side of Reaction (14.3) (blue curve). If we move to the divariant field in the center of Figure 14.19, we see that the only change that occurs is that sillimanite is the stable polymorph of Al2SiO5, instead of kyanite. All the other minerals remain the same. This illustrates an important point in these types of diagrams; that is, only one change can occur in crossing from one divariant field to another. Moving to higher temperature, we cross the line for Reaction (14.3), where muscovite and quartz react to form K-feldspar and sillimanite, which involves the tie line between quartz and muscovite switching to one between sillimanite and K-feldspar. On moving around the diagram, we cross other univariant lines at which a single change occurs in the mineral assemblages. It is left to the reader to work out what these changes are as indicated by the phase diagrams in each field. 2
14.6.3 Metamorphic field gradients One of the uses of a petrogenetic grid, such as that shown in Figure 14.19, is that it allows us to set pressure and temperature limits for the formation of mineral assemblages found in metamorphic rocks. For example, a rock consisting of quartz, sillimanite, and muscovite and coexisting with a pure water fluid phase is stable only under the pressure and temperature conditions of the central divariant field in Figure 14.19; that
is, between 500°C and 700°C and 0.22–0.82 GPa. A rock containing quartz, kyanite and muscovite would be stable only at pressures above 0.82 GPa and temperatures above 700°C, and a rock containing andalusite and K-feldspar would be stable only below 0.22 GPa. The petrogenetic grid in Figure 14.19 is very simple because it involves only one reaction and the three Al2SiO5 polymorphs. If more reactions are considered, pressure-temperature space can be subdivided into more and smaller regions, which narrows down the conditions under which any particular metamorphic rock was formed. With a more complex grid, for example, it might be possible to determine that the temperatures and pressures recorded across a progressively metamorphosed terrane, such as that mapped by Barrow in the southeastern Scottish Highlands, fell along a line such as the heavy dashed line in Figure 14.19. The triangles numbered 1, 2, and 3 would represent tightly constrained mineral assemblages. Because these assemblages indicate increasing temperature with increasing pressure and depth, they were initially interpreted as representing the geotherm during metamorphism. However, this would be true only if the assemblages in the three different areas attained equilibrium at the same time. We recognize that rocks at different depth reach their maximum temperatures at different times. The gradient shown by the dashed line in Figure 14.19 is, therefore, time transgressive and is not a fossil geotherm, so instead it is referred to as a metamorphic field gradient. Field gradients vary considerably between different metamorphic belts and record important information about how metamorphism and plate convergence are related (see Sec. 14.10).
14.6.4 Graphical representation of mineral assemblages in metapelites We have seen in Figure 14.19 how a simple petrogenetic grid can be constructed to analyze the mineral assemblages in pelitic rocks. This grid was of limited use, however, because it did not include minerals such as chlorite, biotite, garnet, staurolite, cordierite, and chloritoid, all of which are common constituents of metapelites. These minerals all contain significant amounts of iron and magnesium and possibly small amounts of manganese. The question we must address is, How can we analyze rocks containing a large number of components, and can we possibly represent the mineral assemblages on simple diagrams? Let us start by writing down all of the oxides needed to form these minerals. We know that some of these may be grouped together to define components according to the Gibbs phase rule, but the list gives us something to start with. The main oxides are the following: SiO2 , TiO2 , Al 2 O3 , Fe 2 O3 , FeO, MnO, MgO, K 2 O, O and H 2 O We saw in Section 14.6.1 that if pure water existed as a phase in the rock, we need not plot it or count it as a component. We
411
412
Metamorphic rocks Biotite
(A)
(B) Al2O3
And, Ky, Sil
+ H2O + Quartz + Muscovite
Muscovite
St
K-feldspar
d Cr
hl
Al2O3
And, Ky, Sil
St
C Cld
FeO
Crd
Cld
MgO
e tit Bio rt G
K2O
Chl
Grt e tit
Opx
FeO
Bio
Biotite Kfs
apply the same rule to this long list of components. Most pelitic rocks also contain quartz, so we need not plot it in our assemblage and we can eliminate SiO2 as a component. Similarly, if the rock contains rutile, as many pelites do, we need not count rutile as a phase nor TiO2 as a component. If the rock contains hematite, then Fe2O3 need not be counted as well. When eliminating these components from our list, we should not forget that our arguments concerning possible mineral assemblages apply only to those rocks that contain these phases. Many ferromagnesian minerals form solid solutions between iron and magnesium end members. Unfortunately, many of the metamorphic ferromagnesian minerals show only limited solid solution, and some such as staurolite are limited to relatively iron-rich compositions, and others such as cordierite are restricted to magnesium-rich compositions. Iron and magnesium can, therefore, not be treated as a single component. Manganese, however, does substitute readily for iron, and so the manganese can be added to the iron and treated as a single component. Our list of components is now reduced to four; that is, Al2O3, (FeO + MnO), MgO, and K2O. These are shown in the tetrahedral plot in Figure 14.20(A). All the minerals except muscovite, biotite, and K-feldspar plot on the front right face of this tetrahedron, which is commonly referred to as the AFM face. As stated previously, three-dimensional tetrahedral plots are not easy to read composition from, so it is useful to project compositions from the tetrahedron onto one of the triangular faces. J. B. Thompson Jr. of Harvard University proposed that because most pelitic rocks, at least at low to medium grades of metamorphism, contain muscovite, compositions should be projected from muscovite. At higher temperatures above Reaction (14.3),
MgO
Figure 14.20 (A) Common minerals in metapelite plotted in terms of Al2O3, MgO, FeO, and K2O. Minerals include muscovite, K-feldspar, andalusite (And), kyanite (Ky), sillimanite (Sil), staurolite (St), chloritoid (Cld), cordierite (Crd), biotite, garnet (Grt), and chlorite (Chl). (B) Minerals from the tetrahedral plot in (A) projected onto the Al2O3-FeO-MgO face of the tetrahedron. The shaded line marked Opx shows the compositional range of orthopyroxene in the granulite facies. Tie lines between coexisting phases represent the arrangement at only one grade of metamorphism (after Thompson, 1957, American Mineralogist). t
where quartz and muscovite react to form K-feldspar and an Al2SiO5 polymorph, projection can be made from K-feldspar. Although no projection is required for most of the minerals, as they plot on the AFM face, biotite plots within the tetrahedron and when projected from muscovite falls below the FeO-MgO base of the triangle. The resulting triangular plot is shown in Figure 14.20(B) with tie lines joining coexisting phases for just one possible assemblage in the amphibolite facies. This type of projection is the most widely used one for illustrating mineral assemblages in metapelites, and it is named the Thompson projection in recognition of its originator (Fig. 14.21).
Figure 14.21 J. B. Thompson Jr., who proposed the commonly used projection for pelitic rocks (see Fig. 14.20), holding a large cleavage book of muscovite.
+ H2O Al2O3 + Qz + Ms Cld
Kaolinite Pyrophyllite
+ H2O Al2O3 + Qz + Ms Cld
Pyrophyllite
Chl FeO
MgO
Biotite
Kfs Chlorite zone
Chl FeO
MgO
+ H2O Al2O3 + Qz + Ms Cld Grt
+ H2O Al2O3 + Qz + Ms St
Ky
Chl
FeO
MgO
Biotite
Biotite
Kfs Biotite zone
Kfs Garnet zone
Grt
+ H2O + Qz Al2O3 + Kfs
Ky
Chl
FeO
MgO
Sil
Grt FeO
MgO Biotite
Biotite
Kfs Staurolite zone
Sil Sillimanite zone
Figure 14.22 Sets of possible mineral assemblages in metapelites in Barrow’s chlorite, biotite, garnet, staurolite, and sillimanite zones of regional metamorphism plotted in the Thompson projection. Minerals are projected from muscovite, except in the sillimanite zone where they are projected from K-feldspar.
14.6.5 Mineral assemblages in Barrow’s metamorphic zones and part of the petrogenetic grid for metapelites Now that we have a convenient way of plotting metamorphic mineral assemblages, we can show some of the common assemblages that form during regional metamorphism. We have chosen five assemblages from Barrow’s chlorite, biotite, garnet, staurolite, and sillimanite zones (Fig. 14.22). Remember that in addition to the minerals shown in the Thompson projection, quartz and muscovite (and water) are also present, except in the sillimanite zone where quartz and K-feldspar are present and projection is from feldspar rather than from muscovite. Three different types of compositional field are shown in these triangular diagrams. First, there are fields representing the composition of a single mineral (shaded gray). Many of the minerals belong to solid-solution series that can have a wide compositional range. Second, there are compositional fields in which two minerals coexist (+ quartz and muscovite) and these are ruled by tie lines joining the coexisting minerals. Third, there are compositional fields in which three minerals coexist, with their compositions joined by tie triangles. When three minerals coexist, their compositions are fixed (corners of the triangles), but when only two minerals coexist, the decreased number of phases increases the degrees of freedom by one, which allows the composition of one of the minerals to vary. Once the composition of that mineral is fixed, however, the composition of the other mineral is determined by the tie line (i.e., its composition is not independently variable). Minerals that belong to Fe-Mg solid-solution series, such as chlorite, biotite, and garnet, show a progressive enrichment in magnesium with increasing metamorphic grade. For example, at low metamorphic grade, chlorite can have any composition between the iron and magnesium end members, but as the grade increases, iron-rich chlorites become unstable and react to form garnet. As the grade increases, the remaining chlorite becomes progressively richer in magnesium until eventually it totally disappears. When garnet first appears, it is iron rich (also manganese rich) and with increasing grade it can reach
progressively more magnesium-rich compositions. Biotite is also iron rich when it first appears in the chlorite zone but becomes progressively more magnesium rich with increasing grade. In the sillimanite zone, it tends to approach phlogopite in composition. These changes have a simple explanation that we can illustrate by referring to the melting loop for olivine solid solutions (Fig. 8.9). When the temperature rises to the solidus, a reaction starts that converts solid olivine to liquid olivine, but the liquid is more iron rich than the solid and, thus, the remaining olivine becomes progressively more magnesium rich. Metamorphic reactions involving solid solutions behave in exactly the same way, except that the reaction product is an assemblage of minerals rather than a liquid. So as the temperature rises, the composition of the low-temperature mineral is forced to move to more magnesium-rich compositions. For example, in the Thompson projection shown for the sillimanite zone (Fig. 14.22), a tie triangle shows the assemblage sillimanite + biotite + garnet (+ quartz and K-feldspar), with the compositions of these minerals indicated by the corners of the triangle. We could have shown a diagram for a slightly higher temperature that would have looked similar except that the tie triangle would have shifted to the right with both garnet and biotite having more magnesium-rich compositions. As we will see in Section 14.9, this gradual shift in composition with temperature is the basis for some geothermometers. The assemblages shown in Figure 14.22 for the various metamorphic zones are only one possible set of assemblages. In each zone, many other assemblages can occur, and many reactions separate the assemblages shown for adjacent zones, with each reaction accompanied by a new assemblage. To unravel all the possible assemblages that can occur would involve the creation of a complete petrogenetic reaction grid, which is beyond the scope of this book (for a more complete development, see chapter 18 in Philpotts and Ague, 2009). We can, however, illustrate the use of such a grid in determining metamorphic conditions by considering a very small part of the grid that involves the mineral staurolite.
Metamorphic rocks
together to give two new minerals as long as the new tie line intersects the original line. For example, the line between staurolite and biotite cuts the line between chlorite and garnet, and, therefore, we can write the following reaction:
Figure 14.23 shows a pressure-temperature petrogenetic grid for pelitic rocks covering a range of temperatures from 400–700°C and pressures up to 0.6 GPa (depth of ∼23 km). The plot shows the stability limits of the three Al2SiO5 polymorphs in red lines and all of the reactions that can occur between the minerals shown in the inset Thompson projection. These reactions are shown in green except for one that is colored blue, which is the reaction of quartz with muscovite to create K-feldspar and an Al2SiO5 polymorph. On the hightemperature side of this reaction, compositions are projected from K-feldspar rather than from muscovite in the Thompson projections. The minerals involved in these reactions are shown along the reaction lines. Discovering what reactions can occur is actually quite simple. Any two minerals joined by a line can react
If we were to write the complete chemical formulas for these minerals, we would find that it is necessary to add muscovite to the left-hand side to provide the potassium needed for biotite on the right-hand side. In the Thompson projection, quartz and muscovite are always present (or K-feldspar at high temperature) and so are available to balance reactions. Reaction (14.4) is known as a tie-line switching reaction for obvious reasons. Can you locate it in Figure 14.23?
Sil
Sil
Ky d An
And
Sil Sil
Sil
il +S d Bt + Cr t Gr
And
Cr d + Chl Bt +A nd St
C Bt hl + + S An t d
Cld + And Chl + St
And
Cld + B Ch + t Grt
And
0.2
15
Sil
And
And
20
And
10
Sil
Qz d s + An M d + An Kfs + Bt t+ d Gr An + Crd Bt t + Gr And
And
Sil An d
Depth (km) (ρ= 2700 kg/m3)
0.4
C Crd hl +B t+
Sil
Chl + Cld St + Grt Chl + G Bt rt + St
Ky
Ky
Sil
Sil
Sil
Sil
St +B t+
Biotite
Ky
Grt
Cld + Chl Ky + St
And, Ky, Sil Cld St Crd Grt Chl MgO FeO
Ms Kfs + Q +S z il
Ky
Al2O3
(14.4)
chlorite + garnet = staurolite + biotite
Chl + S Bt + t Sil
0.6
Pressure (GPa)
414
5
And
0.0
0 400
600
500
700
Temperature (°C) Figure 14.23 Petrogenetic grid showing reactions in metapelites in the greenschist and amphibolite facies. Mineral compositions are plotted in the Thompson projection from muscovite except above the reaction curve of muscovite + quartz = K feldspar + Al2SiO5 (blue line) where the projection is from feldspar. The inset at the top left shows the plotted positions of andalusite (And), kyanite (Ky), sillimanite (Sil), garnet (Grt), chloritoid (Cld), staurolite (St), cordierite (Crd), chlorite (Chl), and biotite (Bt). Reactions are written on the reaction lines, but quartz and muscovite may be needed to balance the reactions (modified from Spear and Cheney, 1989).
14.7 Metamorphism of impure dolomitic limestone
1 mm
1 mm
1 mm
Ms
Grt St Bt
Sil
Ms Chl Cld
St
Kfs Crd
St
(A)
(B)
Bt
Grt
(C)
Figure 14.24 Photomicrographs of thin sections under plane light of metapelite from three different grades of metamorphism. (A) Chloritoid-muscovitechlorite-quartz schist. (B) Staurolite-garnet-muscovite-biotite-quartz schist. (C) Sillimanite-cordierite-K-feldspar-biotite-quartz hornfels.
Another type of reaction can be found by locating a mineral that plots in a tie triangle between three other minerals. In this case, the mineral in the triangle can break down to form the three minerals in the surrounding triangle. For example, staurolite plots in the triangle formed by garnet, biotite, and an Al2SiO5 polymorph. Consequently, we can write the following reaction: staurolite = garnet + biotite + Al 2 SiO5
(14.5)
Biotite contains potassium, so to balance this reaction, we would need to add muscovite on the left-hand side, but again this is not a problem because muscovite and quartz are always present. Reaction (14.5) is an example of what is known as a terminal reaction, because it terminates the existence of a mineral. This particular reaction sets the absolute upper stability limit of staurolite. You should locate it in Figure 14.23. We do not write out all the reactions, but they can be derived in exactly the same way we derived Reactions (14.4) and (14.5). These reactions subdivide Figure 14.23 into relatively small temperature regions, but they do not limit the pressures to the same degree. A specific set of minerals coexists in each field, as indicated by tie lines and tie triangles. When you move from one field to the next, only one change can occur in the diagrams. If you wish to check this, start with the Thompson projection in the upper-left (high pressure and low temperature) field of the diagram and work your way clockwise around the diagram. Every time you cross a reaction line, one of the lines in
the Thompson projection changes, as indicated by the reaction you have just crossed. If you continue around the diagram, you eventually return to the phase triangle in the upper left corner. A petrogenetic grid such as that in Figure 14.23 allows you to analyze mineral assemblages found in rocks and to assign pressure-temperature ranges to the assemblages. Some mineral assemblages can have restricted ranges, whereas others are stable over wide ranges. Figure 14.24 shows three photomicrographs of thin sections of pelitic rocks formed at very different temperatures. It is left to the reader to use the mineral assemblages in each of these rocks to determine their possible temperature and pressure ranges as indicated by the petrogenetic grid.
14.7 Metamorphism of impure dolomitic limestone Impure carbonate rocks, like pelites, are useful in monitoring metamorphism, because of the large number of minerals and mineral assemblages that can form with increasing grade (Fig. 14.25). In addition, many of these reactions involve both CO2 and H2O; thus, they provide an ideal opportunity to illustrate the role of fluid composition in metamorphism. We discuss these reactions by using a quartz-bearing dolomitic limestone as the protolith. Metamorphism of carbonate rocks at the margin of igneous intrusions had long been recognized to produce a variety of metamorphic minerals, but in 1940, N. L. Bowen proposed that these minerals appeared in a definite order that resulted
415
416
Metamorphic rocks SiO2
forsterite, diopside, periclase (MgO), wollastonite, monticellite (CaMgSiO4), spurrite (Ca4Si2O8·CaCO3), merwinite (Ca3MgSi2O8), and larnite (Ca2SiO4). To help remember this sequence, he suggested using the following mnemonic:
SiO2 Qz
Qz
Wo
MgO
CO2
Dol’
Cal Cal’
Wo
CaO Lrn Spu, Tly, Rnk
Di
Tr
Tremble, for dire peril walks, Monstrous acrimony’s spurning mercy’s laws.
Tlc En
Ak
Fo Mw
Mtc
Cal
Per MgO
Dol
CaO
Figure 14.25 Projection of minerals in the SiO2-CaO-MgO-CO2 (H2O) tetrahedron onto the SiO2-CaO-MgO face. The minerals that are found in metamorphosed quartz-bearing dolomitic limestone, include quartz (Qz), calcite (Cal), dolomite (Dol), wollastonite (Wo), diopside (Di), tremolite (Tr), talc (Tlc), enstatite (En), forsterite (Fo), monticellite (Mtc, CaMgSiO4), åkermanite (Ak, Ca2MgSi2O7), merwinite (Mw, Ca3MgSi2O8), larnite (Lrn, Ca2SiO4), spurrite (Spu, Ca4Si2O8·CaCO3), tilleyite (Tly, Ca3Si2O7·2CaCO3), and rankinite (Rnk, Ca3Si2O7).
from a sequence of reactions that took place at progressively higher temperatures (Fig. 14.26). His pressure-temperature plot of these reactions was important because it was one of the first examples of the use of a petrogenetic grid. Bowen believed that the reactions caused the following sequence of minerals to appear with increasing temperature: tremolite,
1 mm
1 mm
When Professor Tilley of Cambridge University, who had studied the famous contact metamorphic rocks at Scawt Hill in Northern Ireland, pointed out to Bowen that talc actually appeared before tremolite, Bowen suggested altering the mnemonic by stuttering at the beginning; that is, “Ta … tremble.” We now know that this sequence of minerals is only one of a number that can occur and that it is far more common for diopside to appear before forsterite. The question is, Why should different sequences of minerals appear at different localities? The answer to this lies in the composition of the fluids that coexist with the minerals. Let us start to answer this question by examining one of the simplest of reactions to occur in impure limestones; that is, the reaction of calcite with quartz to form wollastonite. This reaction can be written as follows: CaCO3 + SiO2 = CaSiO3 + CO2 ccalcite quartz wollastonite flu f id
(14.6)
This reaction releases CO2 fluid that was previously in the solid state in the crystal structure of calcite (see Sec. 10.5 and Fig. 10.10). The reaction is, therefore, accompanied by a large
1 mm
1 mm
Fo
Cal Tr Di
Wo Ak
Tr
Di
Fo
Ak Wo
Tr
Mtc
Ak
Cal
(A)
(B)
(C)
(D)
Figure 14.26 Photomicrographs of thin sections under crossed polarized light of metamorphic rocks formed from impure dolomitic limestone, with increasing grade from (A) to (D). (A) Temolite (Tr) and diopside (Di). (B) Partially serpentinized forsterite (Fo) and calcite (Cal). (C) Wollastonite (Wo). (D) Akermanite (Ak), monticellite (Mtc), and forsterite (Fo).
14.7 Metamorphism of impure dolomitic limestone
XCO2 = 0
0.25
1.0
the fluid in metamorphic rocks is H2O, so we can think of decreasing mole fraction of CO2 as increasing mole fraction of X H O ). Figure 14.28 shows how the temH2O (i.e., X CO perature at which wollastonite forms from calcite plus quartz decreases as the fluid phase becomes more water rich. Let us consider another important reaction in the metamorphism of impure carbonate rocks by which tremolite and calcite react to form diopside and dolomite as follows: 2
Pressure (GPa)
0.2
SiO2 Qz
Calcite + Quartz
Wo CO2 Cal
SiO2 Qz
0.1
400
Ca 2 Mg 5 Si 8 O 22 (OH)2 + 3CaCO3 t re r molite calcite = 4CaMgSi 2 O6 + CaMg(CO3 )2 + H2 O + CO2 diopside s dolomite fluid i
Wollastonite + CO2
CO2 Cal CaO 0 300
CaO
500
600
700
800
900
Temperature (°C) Figure 14.27 Pressure-temperature conditions for the reaction calcite + quartz = wollastonite + CO2. The red reaction curve applies when the fluid in the environment is pure CO2. The other two curves apply when the mole fraction of CO2 in the fluid is 0.25 and 0. The horizontal line and black dots indicate the temperatures of the reaction at 0.2 GPa (see same dots in Fig. 14.28).
volume increase, which means that as the pressure rises, higher temperatures are needed to make the reaction proceed to the right. Figure 14.27 shows the shape of the reaction curve in a pressure-temperature plot (red line). It is typical of any metamorphic reaction releasing a fluid phase. The temperature of the reaction increases rapidly as pressure first begins to rise, because the fluid is very compressible at low pressures but becomes less compressible at higher pressures. The phase triangles (SiO2-CaO-CO2) show the switch in tie lines from calcite + quartz to wollastonite + CO2 in crossing the reaction curve. The fluid produced in this reaction is pure CO2. If the fluid in the environment contained some water (mole fraction of CO2 is less than 1; X CO < 1), the reaction would take place at lower temperatures. For example, if the total pressure is 0.2 GPa (horizontal dashed line in Fig. 14.27), calcite and quartz react to form wollastonite at 750°C, if the fluid in the environment is pure CO2. However, if there is enough water in the environment to reduce the mole fraction of CO2 to 0.25, the reaction occurs at 612°C, and if the fluid in the environment is pure water ( X CO = 0), the reaction occurs at 412°C. Clearly, the mole fraction of CO2 in the fluid phase makes a huge difference to the temperature at which wollastonite will form from quartz and calcite. This in part explains why Bowen’s sequence of metamorphic minerals is only one of several that can occur. The effect of the fluid phase on the temperature of a reaction at a given pressure is conveniently shown in a plot of temperature versus mole fraction of CO2 in the fluid. Such a plot applies to only one pressure, so it is said to be isobaric. The isobaric plot in Figure 14.28 is for a pressure of 0.2 GPa, the same as the horizontal line in Figure 14.27. The other major component of 2
2
2
(14.7)
In this reaction, CO2 and H2O are produced in the ratio of 1:1, so if the ratio in the fluid in the environment differs from this value, the reaction occurs at lower temperatures. The resulting reaction curve has a temperature maximum when the fluid in the environment has a CO2:H2O ratio of 1:1 (X CO = 0.5) and falls to lower temperatures on either side of this (Fig. 14.28). Diopside can also form from tremolite reacting with calcite and quartz according to the following reaction: 2
Ca 2 Mg 5 Si 8 O 22 (OH)2 + 3CaCO3 + 2SiO 2 tremolite calcitee q uartz = 5CaMgSi 2 O6 + H2 O + 3CO2 diopside fluid
(14.8)
In this reaction, CO2 and H2O are produced in the ratio of 3:1, so this reaction shows its maximum stability when the fluid in the environment has a CO2:H2O ratio of 3:1; that is, X CO = 0.75. The resulting reaction curve is shown in Figure 14.28, with its maximum at a mole fraction of CO2 of 0.75. Let us consider one more important reaction that forms tremolite from dolomite and quartz according to the following reaction: 2
5CaMg(CO3 )2 + 8SiO 2 + H2 O dolomi te t quartz fluid = Ca 2 Mg Si 8 O22 (OH)2 + 3CaCO3 + 7CO2 tremolite calcite fluid
(14.9)
This reaction differs from the previous ones in that, although CO2 is a reaction product, water appears on the left-hand side as a reactant. In Figure 14.28, this reaction produces a sigmoidshaped curve going to progressively higher temperatures as the mole fraction of CO2 increases. Reactions (14.7)–(14.9) all intersect at an invariant point on the extreme right side of Figure 14.28. In each of the divariant fields between these univariant reaction curves, a triangular diagram shows the possible coexisting phases. If we start with the lowest-phase triangle and go clockwise around the invariant point, we see that when we get to the phase triangle in the upper right, it does not match the one we started with. There must still be one more reaction curve that needs to be crossed before we return to the initial phase triangle. We can determine what this
417
Metamorphic rocks Pressure = 0.2 GPa
6
700 Wo
z +Q Cal Di + Dol Tr + Cal
7
600
Temperature (°C) T
418
8
Di
Di
z al + Q Tr + C
10 Dol + Qz
500 Tr + Cal Dol + Qz
9
SiO2 Qz 400 Wo Cal CaO
Di Tr
MgO
Dol
300 0
0.1
0.2
0.3
0.4
0.5
0.6
0.7
Mole fraction of CO2 in fluid
H2O (
CaMg(CO3 )2 + 2SiO2 = CaMgSi 2 O6 + 2CO2 do lo l mite quartz diopside fluid
(14.10)
This reaction releases only CO2, so, like the wollastoniteforming reaction (14.6), it reaches a maximum when the mole fraction of CO2 is one, and it passes through the invariant point. Many more reactions involving all the minerals shown in Figure 14.25 could be added to Figure 14.28, thus producing a much denser petrogenetic grid, but this is beyond the scope of this book. The few reactions shown in this figure suffice to illustrate how the variation in the composition of fluid in the environment dramatically affects the temperature at which
0.9
1.0 CO2
Increasing mole fraction of H2O in fluid)
reaction is by inspecting the two phase triangles. We can also determine it by doubling the amounts in Reaction (14.9) and then adding to it Reactions (14.7) and (14.8). This then simplifies to the following reaction:
0.8
Figure 14.28 Temperature versus fluid composition plot for the wollastoniteforming reaction of Figure 14.27 and four other reactions in metamorphosed quartz-bearing dolomite at 0.2 GPa. Reactions are numbered according to their number in the text (black dots on reaction 6 are from Fig. 14.27).
metamorphic minerals form but also the sequence in which they form. For example, if the protolith consisted of calcite + dolomite + quartz and the fluid in the environment was pure CO2, then diopside would form as soon as the temperature rose above Reaction (14.8); that is, at ∼500°C at 0.2 GPa. However, if the fluid in the environment had a mole fraction of CO2 of 0.75, dolomite and quartz would react to form tremolite and calcite at 475°C and diopside would not form until the temperature reached 550°C when Reaction (14.8) was crossed. In summary, most prograde metamorphic reactions liberate a fluid phase, and if that fluid differs in composition from the fluid in the environment, the reaction temperature is lowered. Water and CO2 are the main fluids released during metamorphism. In carbonate rocks, we can expect metamorphic reactions to release large amounts of CO2, whereas pelitic rocks release primarily H2O. The fluids are less dense than rocks and, therefore, rise toward the surface, thereby producing a regional
14.8 Metamorphism and partial melting: migmatites
fluid flux of highly variable composition. The composition of this environmental fluid plays an important role in determining the temperature of reactions and the sequence in which they occur during prograde metamorphism.
14.8 Metamorphism and partial melting: migmatites Regional metamorphism is brought about by elevated temperatures and pressures that result from thickening of the radiogenic continental crust, the intrusion of mantle-derived magmas, and the flux of fluids near convergent plate boundaries. As temperatures rise, prograde reactions take place and eventually the temperature may rise high enough to cause partial melting. Only a small amount of melt normally forms because the latent heat of fusion of rocks is so large that it consumes a large quantity of heat. The rock formed from the mixture of melt and metamorphic rock is known as migmatite, from the Greek word migmaa, meaning “mixture.” Only the lowest possible melting fraction forms during metamorphism, and this invariably is of granitic composition. We saw in Section 8.3.3 and Figure 8.7 that partial melting occurs only at grain boundaries between quartz and alkali feldspar. This melt must soon segregate into layers, because the granitic fraction in migmatites tends to be concentrated in layers that are interspersed with layers of the refractory residue (Fig. 14.29). The granite layers are light colored and are referred to as the leucosome, and the refractory residue, which is usually rich in plagioclase, hornblende, and biotite, is darker colored and is referred to as the melanosome. Deformation plays an important role in segregating the melt generated along grain boundaries. Experiments show
Figure 14.29 Migmatite consisting of pink granite, formed by melting of the protolith, interlayered with the refractory residue consisting of gray plagioclase-biotite-hornblende gneiss. The granite migrated into the nose of the folds.
Figure 14.30 Migmatite in which the molten granitic fraction was moved by deformation into veins and ductile fault zones.
that when partially melted crystal mush is sheared, the liquid tends to segregate into lenses. Most migmatites show evidence of considerable deformation. The migmatite in Figure 14.29 is folded, and the liquid can be seen to have moved into the nose of the folds. Ductile shear zones are also extremely common in migmatites, and the liquid can often be seen to have migrated into these zones (Fig. 14.30). As the viscous granite melt segregates into larger sheets, it is able to travel more easily, and eventually it collects to form granite batholiths that rise through the crust. Metamorphic temperatures are normally prevented from rising higher than the onset of migmatite formation because of the large latent heat of fusion of rock. The temperature at which the first possible melt can form is at the beginning of melting (solidus) of water-saturated granite, which occurs in the middle of the amphibolite facies (Fig. 14.31). However, as soon as this melt begins to form, it absorbs all the water from the environment so that none is available to continue forming water-saturated melt. As a result, very little melt is formed at this temperature, and most probably solidifies to form pegmatites as soon as it starts to rise (Fig. 14.32). Once all the water in the environment has been consumed by the water-saturated melting of granite, only
419
Metamorphic rocks
Temperature (°C) 700
500
900 0
Pyx + H2O
2
10
Hbl
1
Sil
Water-satura ted granit e
Ky
solidu s Amphibolite
And
20 30 Granulite 40
Depth (km)
300 0
Pressure (GPa)
420
50 60 70
Figure 14.31 Water-saturated beginning of melting of granite relative to metamorphic facies. A broad zone of hbl ⇒ pyx + H2O separates the amphibolite and granulite facies and provides water for melting (see Fig. 14.4).
water-undersaturated melt can form, which requires higher temperatures (see, e.g., Fig. 8.12). As a result, metamorphic temperatures continue to rise through the amphibolite facies until the boundary of the granulite facies is reached. At this boundary, hornblende reacts to form pyroxene and water (Fig. 14.31). The large amount of water released by this reaction allows for large-scale melting to occur, and this is where most migmatites form. For temperatures to rise into the granulite facies, rocks must either be extremely dry or have lost all low-melting fraction.
14.9 Geothermometers and geobarometers One of the main goals in studying metamorphic rocks is to determine the temperatures and pressures under which they formed so that we can reconstruct past conditions in the Earth.
Figure 14.32 Deformed granite pegmatites formed by partial melting in the amphibolite facies south of Middletown, Connecticut.
By assigning rocks to metamorphic facies, we obtain approximate temperature and pressure ranges, and these can be refined by identifying where specific mineral assemblages plot in petrogenetic grids. However, we have also seen that the composition of the fluid in the environment can have a dramatic effect on metamorphic reactions, and without knowledge of the fluid composition, accurate temperatures and pressures cannot be obtained from these grids. The boundaries between the Al2SiO5 polymorphs (Fig. 14.3) are an exception to this because their positions are a function only of pressure and temperature. The question is, Can other metamorphic reactions provide independent measures of metamorphic temperatures and pressures? The answer is yes, and we refer to these reactions as geothermometers and geobarometers, respectively. We have seen that many metamorphic minerals belong to solid-solution series and that their compositions change with metamorphic grade. Coexisting garnet and biotite, for example, become progressively more magnesium rich with increasing metamorphic grade. With geothermometers and geobarometers, we quantify this chemical change and, through the use of thermodynamic data, determine temperatures and pressures. Metamorphic rocks containing coexisting biotite and garnet are common from the garnet zone of the greenschist facies to the granulite facies, and both minerals belong to solid-solution series, with biotite having compositions between annite (KFe3AlSi3O10(OH)2) and phlogopite (KMg3AlSi3O10(OH)2) and garnet with compositions between almandine (Fe3Al2Si3O12) and pyrope (Mg3Al2Si3O12). These compositions are shown in the Thompson projection in Figure 14.33. If biotite and garnet are both present in a rock, their compositions in the Thompson plot can be joined by a tie line. Figure 14.33 shows three such tie lines. One shows almandine coexisting with phlogopite and another shows pyrope coexisting with annite. These represent extreme compositions, and it is much more likely that the biotite and garnet would have intermediate Fe-Mg compositions such as those represented by the red tie line. Analyses of biotite and garnet in a rock using an electron microprobe (Sec. 3.8.2) would allow us to determine the precise compositions of these minerals and be able to draw the tie line. Assuming we can do this, what significance can be attached to the tie line? To answer this, we write what is known as an Fe-Mg exchange reaction, which can be easily pictured by looking at the two extreme sets of tie lines in Figure 14.33. We have seen previously that intersecting tie lines in a diagram equate to a reaction. We can write this reaction as follows: Fe 3 Al 2 Si 3O12 + KMg AlSi 3O10 (OH)2 ⇔ almandine phlogopite Mg 3 Al 2 Si 3O12 + KFe 3 AlSi 3O10 (OH)2 ) pyrope annite
(14.11)
14.10 Plate tectonic significance of metamorphism
In K = In
Al2O3
Almandine
Garnet
MgO
FeO
Annite
Pyrope
Biotite
Phlogopite
Figure 14.33 Thompson projection showing the compositional range of garnet and biotite. The compositions of coexisting garnet and biotite, shown by the tie lines, are a function primarily of temperature and, therefore, create a geothermometer.
This reaction would not go all the way to the right or all the way to the left, but it would equilibrate at some intermediate composition, with the garnet and biotite having compositions such as those represented by the red tie line in Figure 14.33. In a reaction where the reactants and products form solid solutions, we can write what is known as an equilibrium constant (K K) for the reaction in terms of the product of the concentrations of the reaction products divided by the product of the concentration of the reactants. If we express the concentrations in terms of mole fractions (X), we can write the equilibrium constant as follows: K =
X Alm X Phlog X pyr X Ann
(14.12)
On rearranging, this gives the following: K =
X Alm / X Pyr X Ann / X Phlog
(14.13)
In Section 14.2.1, we saw that for a reaction to occur naturally, it must involve a decrease in Gibbs free energy. Reaction (14.11) would certainly occur naturally, as the Fe and Mg distributed themselves between the coexisting garnet and biotite, and this would be associated with a definite decrease in free energy. If we designate the free-energy change of this reaction by ΔG G, then it can be shown that the natural logarithm of the equilibrium constant K is equal to – ΔG G, divided by the gas constant R and the absolute temperature T T; that is:
X Alm / X Pyr X Ann / X Phlog
=−
ΔG RT
(14.14)
The volume change accompanying this reaction is very small, G, which is deso pressure has little effect on the value of ΔG termined mainly by temperature. The right-hand side of this equation is, therefore, predominantly a function of temperature and serves as a geothermometer known as GARB for coexisting garnet and biotite. Thus, from an analysis of the Fe/ Mg ratios in coexisting garnet and biotite we can calculate the temperature of equilibration from the value of ΔG G, which can be obtained from thermodynamic tables. Even when the total pressure is unknown, this geothermometer gives temperatures accurate to ±50°C and this can be improved considerably if estimates of the pressure can be made. To determine pressures, we need reactions that have a large change in volume. Most metamorphic reactions that liberate a fluid phase have large volume changes, but the reactions are sensitive to the composition of the fluid in the environment, and if this is unknown, these reactions cannot be used. We, therefore, need a reaction that does not involve a fluid and that has a large volume change. One such reaction involves garnet, rutile, Al2SiO5, ilmenite, and quartz, and is known as GRAIL. The following reaction relates these minerals: Fe 3 Al 2 Si 3O12 + 3TiO2 ⇔ 3FeTiO3 almandin i e rutile ilmenite + Al 2 Si S O5 + 2SiO 2 kyanite quartz
(14.15)
Because rutile, Al2SiO5 polymorphs, and quartz are essentially pure minerals (X X ≈ 1), the equilibrium constant for this reaction, can be written in terms of the concentrations of almandine in garnet and ilmenite in a rhombohedral oxide (solid solution with hematite). This reaction is almost independent of temperature and, therefore, from analyses of coexisting garnet and rhombohedral oxide (hematite-ilmenite solid solution) that occur with quartz and Al2SiO5 polymorphs pressures can be measured with an accuracy of ∼0.05 GPa. We have given only two examples of a geothermometer and a geobarometer, but they illustrate how metamorphic temperatures and pressures can be obtained from electron microprobe analyses of minerals belonging to solid-solution series.
14.10 Plate tectonic significance of metamorphism Metamorphism is the sum of all those changes that occur to a rock in response to changes in its environment, many of which are a direct consequence of plate tectonic processes. Metamorphic rocks potentially preserve an important record of past tectonic events.
421
Metamorphic rocks
D
lite hibo
Depth (km)
Amp
ist
20
C
Bl
ue
30
C
ch
sc
hi
st Granulite
D A
Sil
B
Ky
Figure 14.34 Hypothetical pressure-temperature-time path followed by a sedimentary rock during metamorphism. Only the highest temperature parts of this path are normally preserved by metamorphic rocks (adapted from Philpotts and Ague, 2009).
-s ta te
s en
Zoned porphyroblasts
dy
m
Burial during orogeny
Peak metamorphic mineral assemblage
10
e Gr
P-T-tt path
Retrograde reactions
ea
d An l Si
E
er
Fluid inclusions
in
B
th
Blocking temperatures ffor various radioactive minerals used ffor dating
nt
St
eo
T Temperatur e
co
lg
Figure 14.34 shows a hypothetical PP TT t path that a sedimentary rock might follow during an orogenic event and the parts of the path that might be recorded in metamorphic rocks. Metamorphism that occurs during burial would be obliterated by metamorphism at higher temperatures. As the rock approaches the highest temperatures along the PP TT t path, the cores of large porphyroblasts, such as garnet and staurolite, might preserve some early record of the penultimate prograde metamorphism. With erosion of the orogenic belt, isostatic adjustment causes the rock to begin returning toward the surface, and this is when the rock reaches its highest temperatures and develops the mineral assemblage that we see when the rock returns to the surface. As the rock’s ascent continues, retrograde reactions may occur, especially where faults and fractures allow water access. Where the rock is cracked, fluid inclusions may become trapped in mineral grains, preserving another part of the record. Eventually, the rock returns to the surface.
An d Ky
ta
14.10.1 Pressure-temperature-time (P-T-tt) paths
0
en
One of the largest metamorphic rock factories is at convergent plate boundaries where orogenic belts develop. During plate convergence, sedimentary rocks formed at the Earth’s surface may be buried to considerable depths as a result of thrusting and folding in orogenic belts where they undergo metamorphism. Eventually, as a result of erosion and isostatic rebound, exhumation returns them to the surface of the Earth. During this history, they are exposed to changing pressures and temperatures as a function of time. With information about pressures and temperatures extracted from metamorphic rocks, we can construct what are known as pressure-temperature-time paths (P-TT t). These paths provide important information about processes at convergent plate boundaries.
Depth or pressure
422
40
Eclogite 50 0
100
200
300
400
500
600
700
800
900
Temperature (°C) T Figure 14.35 Pressure-Temperature-time paths determined from metamorphic rocks in various orogenic settings. (A) Low-temperature, high-pressure rocks of the Franciscan Complex, California (Ernst, 1988). (B) High-temperature, high-pressure rocks of the Tauern Window, Eastern Alps (Selverstone and Spear, 1985). (C) and (D) High-temperature, highpressure rocks of central Massachusetts (Tracy and Robinson, 1980). (E) Hightemperature, low-pressure rocks of northern New England (Lux et al., 1986) and the Pyrenees (Wickham and Oxburgh, 1985).
Through careful documentation of mineral assemblages and the use of geothermometers and geobarometers, P-T-t paths have been determined in a number of orogenic belts. Figure 14.35 shows a sample of the range of possible paths that have been found (A–E) relative to the Al2SiO5 polymorph stability fields and a steady-state continental geotherm. P-TT t path (A) was obtained from rocks belonging to the Franciscan Complex of California. Here, graywacke type sediments were subducted by a cold oceanic plate, which also cooled the rocks above the subduction zone. Metamorphic reactions created low-temperature, high-pressure minerals of the blueschist facies (Fig. 14.9). Rocks that were subducted to the greatest depth entered the eclogite field (blue dashed line). Subduction took these rocks into the mantle, but because they were less dense than the mantle rocks, they buoyantly rose back to the surface, following almost the reverse of the pressuretemperature path that they followed during subduction. This type of P-TT t path is characterized by large changes in pressure with very little heating (HP/LT). When continental crust is involved at convergent plate boundaries, the thickened crust acquires higher temperatures due to the thicker blanket of radioactive rocks, and the intrusion of magmas and flux of fluids from the lower crust. P-TTt
14.10 Plate tectonic significance of metamorphism
BOX 14.3
HOW IS TIME OF METAMORPHISM DETERMINED?
Assigning times to the various steps around a P-T-t path is difficult. Fossils in a sedimentary rock may tell us when the sediment was deposited, but other times along the path must be determined by absolute dating methods using radioactive elements. Most absolute dating methods rely on the decay of a radioactive parent isotope to 206 235 207 87 87 S , a stable daughter element. Some of the most common pairs are: 238 92 U ⇒ 82 P b, 92 U ⇒ 82 Pb, 37 Rb ⇒ 38 Sr 40 40 and 19 K ⇒ 18 Ar , where the superscript indicates the atomic mass of the isotope and the subscript, the atomic number. To determine the age of a metamorphic mineral assemblage, a mineral must form that contains one of the radioactive isotopes. Zircon and monazite (rare-earth phosphate) commonly contain small amounts of uranium, and rubidium substitutes for potassium in many potassium-bearing silicates. If the minerals containing these radioactive isotopes are formed at the same time as the metamorphic mineral assemblage, the amount of daughter product formed will be a measure of the time lapsed since metamorphism. However, metamorphic rocks typically form at temperatures where elements are able to diffuse, especially over short distances. The absolute age may, therefore, not be the age of metamorphism but the age since the rock cooled below a temperature at which diffusion became insignificant. This temperature, known as the blocking temperature, varies from isotope to isotope and mineral to mineral. For example, argon formed from the decay of 40K is one of the least tightly held daughter products, and its blocking temperature is about 350°C but varies depending on the host mineral. The blocking temperature for rubidium-strontium dating is usually a couple of hundred degrees higher than that for K-Ar. Some minerals in metamorphic rocks, such as zircon may have been detrital grains in the original sediment and their isotopic signature may provide information about when the grain was originally formed and the age at which metamorphism occurred. Another absolute dating technique involves measuring the number of fission tracks found in minerals formed by the spontaneous fission of 238U. The massive fission products damage the structure of the surrounding mineral, and when etched with appropriate chemicals, produce small tracks that can be counted. The older a mineral is, the more fission tracks it contains. However, the damage caused by fission is soon annealed at higher temperatures. This dating method, therefore, gives the age since a rock dropped below the annealing temperature. Fission tracks in apatite, for example, are annealed out above ∼120°C, but they remain in zircon up to ∼350°C. Fission tracks are, therefore, useful only for dating the final stages of exhumation along a PP TT t path. Assigning times to a P-T-t path is difficult, but it can be done with sufficient accuracy to provide a reliable history of the path rocks follow in orogenic belts.
paths in these regions not only pass through zones of high pressure because of the thickened crust but through zones of higher temperature (HP/HT). PP TT t path (B) is from the Alps where thrust faults and huge nappes (large recumbent folds) greatly thickened the continental crust. These structures would have raised pressure rapidly with little heating and the rocks would have passed through the blueschist facies, but radiogenic heating would soon have raised temperatures, obliterating most evidence of this early stage of metamorphism. Rocks that were buried deepest passed into the amphibolite facies (PP TT t path (B)), whereas shallower ones passed through the greenschist facies. Continental crust was also involved in the plate convergence that formed the Devonian Acadian orogeny in New England. P TPT t paths from central Massachusetts (C and D) show how deformation plays an important role in controlling the paths. As in the Alps, thrust faults and large nappes formed early in the
collision and buried cold near-surface rocks to sufficient depth to place them in the kyanite stability field (beginning of PP TTt path (C)). These same structures brought hot rocks from depth and piled them on the cold shallow rocks, giving rise to high temperatures at shallow depths where andalusite was stable (beginning of PP T-t path (D)). With radiogenic heating, temperatures began to rise. In central Massachusetts, the Bronson Hill anticlinorium (large regional anticline) brought the deeply buried rocks back toward the surface, producing a typical counterclockwise PP T-t path (C). However, immediately to the east of this anticlinorium the high-temperature shallow rocks were lowered into the Merrimack synclinorium, which caused pressures to rise, and produced a clockwise PP T-t path (D). In regions where metamorphism involves rising temperatures with little increase in pressure (LP/HT), P-TT t paths remain in the stability field of andalusite (E in Fig. 14.35). In
423
424
Metamorphic rocks High-P, High-T metamorphism
Midocean ridge Ocean water circulating through hot rock causes zeolite facies metamorphism
High-P, Low-T metamorphism Greenschist Moho
PrehniteAmphibolite pu mp ell 500°C yit e Bl ue sc his t
Asthenosphere
High-T, Low-P metamorphism
High-T, Low-P metamorphism
50
0°C Moho
Delamination of base of crust Rise of fluids
Ec log ite
Lithosphere
Asthenosphere
Typical plate tectonic settings for the development of metamorphic rocks shown in a cross-section of the lithosphere extending from a midocean ridge, through a convergent plate boundary, to a stable continental interior. The depth of the 500°C isotherm shows how plate motion results in very different P-T conditions in different parts of the plates.
many regions, such as northern New England, the high temperatures at shallow depths can be attributed to the intrusion of large quantities of magma. In the Pyrenees, however, LP/HT metamorphism is not associated with abundant igneous activity and has, instead, been linked to thinning of the crust and rise of the hot asthenosphere. Delamination and sinking of the base of the crust would also cause the asthenosphere to rise and might cause LP/HT metamorphism.
14.10.2 Plate tectonic setting of metamorphic facies Unlike most planets, the Earth is dynamic, with a lithosphere that is in constant motion, as tectonic plates diverge, converge, and glide past one another. The motion of tectonic plates, which is driven by the cooling of the planet, results in pressure and temperature changes in rocks and also causes large fluxes of fluids to pass through the lithosphere, all of which result in metamorphism. Figure 14.36 shows a cross-section through the lithosphere passing from a midocean ridge, through a convergent plate boundary into a continental plate. The cross-section also shows an isotherm (500°C) to illustrate how plate motion causes temperatures to vary with depth. For example, 500°C is found at shallow depths beneath midocean ridges but at great depth in subduction zones and then again at shallow depths where magmas rising beneath volcanic arcs bring heat near to the surface. We now examine some of the major plate tectonic sites in which metamorphic rocks are formed. Midocean ridges
The largest volumes of new rock are formed at midocean ridges, where basalts (MORB), dike rocks, and intrusive bod-
ies create new oceanic crust (Sec. 9.4.1). These hot rocks are cooled by ocean water circulating through them. It is estimated that the entire volume of water in the Earth’s oceans circulates through this new crust every 8 million years. This huge flux of water through hot rocks brings about what we refer to as hydrothermal alteration but is, in fact, low-pressure, low-temperature metamorphism (Fig. 9.31). Primary igneous minerals are altered to hydrous minerals, such as chlorite, serpentine, and zeolites, all belonging to the zeolite facies of metamorphism. This metamorphism results in anhydrous igneous rocks being converted to hydrous metamorphic rocks that contain about 10 weight % H2O. Although most of these rocks are eventually subducted at convergent plate boundaries and are not preserved in the geologic record, the water they release during subduction plays an important role in driving magmatism and metamorphism at convergent plate boundaries. Convergent plate boundaries
At convergent plate boundaries where the ocean floor begins to subduct, zeolite facies minerals react to form assemblages in the prehnite-pumpellyite facies. Cold oceanic crust subducts faster than heat can diffuse into the slab, so pressures rise at almost constant temperature. As subduction continues, rocks develop mineral assemblages of the blueschist facies and eventually the eclogite facies (Fig. 14.36). Most of these rocks are subducted back into the mantle, but some return to the surface and do so remarkably quickly. Blueschist and eclogite facies T conditions where aragonite is the stable rocks form under P-T polymorph of CaCO3 (Sec. 10.6 and Fig. 10.11). This mineral is commonly found in these rocks, yet experimental studies
Summary
show that aragonite changes to the low-pressure polymorph, calcite, if held at a couple of hundred degrees at low pressure for hundreds of years. Bodies of blueschist and eclogite facies rocks are always bounded by fault surfaces, and it appears that they are emplaced tectonically, being squeezed to the surface by the convergent plate stresses. The speed of their emplacement is commonly likened to the speed at which a grapefruit seed will shoot sideways when squeezed slowly between your fingers. Rocks containing the ultrahigh-pressure metamorphic minerals coesite and diamond have to rise still farther, and it remains a puzzle how they do so rapidly enough to preserve the high-pressure polymorphs. Metamorphic reactions taking place in the subducting oceanic slab release water that was added to the rock while cooling at the midocean ridge, with essentially all of it being released by the time the rocks become eclogites. This water rises into the overlying mantle wedge and causes melting. These melts and fluids rise into the overlying crust, adding heat to that which already exists due to the thickened more radioactive continental crust. This brings about the typical Barrovian sequence of greenschist – amphibolite metamorphism. Where large quantities of magma rise high into the crust, low-pressure, high-temperature metamorphism results. Rifting and delamination of continental crust
Continental rifting involves thinning of the lithosphere, and as hot asthenosphere rises to fill the gap, geothermal gradients rise and cause metamorphism at low pressure. This normally brings about metamorphism in the zeolite facies, but it has also been invoked to explain the low pressure, high-temperature metamorphism in the Pyrenees (E in Fig. 14.35). Delamination of the base of the crust caused by dense material sinking into the asthenosphere (Fig. 14.36)
would also result in hot material rising, and this would raise the geotherm and cause low-pressure, high-temperature metamorphism. Overview of metamorphism and plate tectonics
In 1961, before plate tectonics came into vogue (post 1963), Miyashiro pointed out that metamorphic rocks in Japan occurred in paired metamorphic belts, with a blueschist to eclogite facies series occurring on the side nearest the Pacific and a lowpressure, high-temperature series to the west of this. Granite batholiths were found in the low pressure, high-temperature belt but never in the high-pressure, low-temperature belt. He further showed that paired metamorphic belts characterized all younger orogenic belts around the Pacific. We can see how plate tectonics provides a simple explanation for these belts, with the high-pressure, low-temperature facies series occurring where ocean-floor rocks and graywacke sediments are transported into the subduction zone, and the low-pressure, high-temperature facies series occurring where magma, generated by water released from the subducting slab, rises high into the continental crust causing contact metamorphism on a regional scale (Fig. 14.36). Miyashiro also pointed out that blueschist facies rocks become less common with increasing age and there may be none older than the late Proterozoic, although one 2.8 billion-yearold eclogite has recently been reported from the Fennoscandian shield. Ultrahigh-pressure metamorphic rocks also become scarcer with age. In contrast, rocks belonging to the low-pressure, high-temperature facies series are particularly common in the Precambrian, as are the ultrahigh-temperature metamorphic rocks. The reasons for these difference in the pressures and temperatures of metamorphic rocks with age is not yet clear but may be related to cooling of the planet and thickening of the lithosphere.
Summary Metamorphism is the sum of all changes that occur in a rock in response to changes in pressure, temperature, and composition of fluids in the environment. In this chapter, we looked at what these changes are, why they take place, whether reactions reach equilibrium, and how we can study metamorphic rocks to determine what the pressures and temperatures were at the time of metamorphism. Most metamorphic reactions are caused by plate tectonic processes, so unraveling the metamorphic history of a rock can provide information about the Earth’s dynamic past. The following are the main points of this chapter:
• Changes in a metamorphic rock can be physical, chemical, or combinations of these. Changes that occur while a rock is heating are described as prograde and those while cooling as retrograde.
• Any rock type can be metamorphosed. The original rock type is known as the protolith.
425
426
Metamorphic rocks
• Changes in pressure result from plate tectonic process. In zones of plate convergence, thrusting and folding thicken the crust and increase pressure. In zones of crustal extension, rocks are brought closer to the surface and pressures decrease.
• Changes in temperature result from burial, heating from radioactive elements in a thickened crust, heat from fluids rising from below, the intrusion of magma, and exhumation.
• Contact metamorphism occurs near igneous intrusions and produces rocks that typically lack foliation and are called hornfels. • Regional metamorphism typically occurs near convergent plate boundaries due to regional changes in pressure and temperature; the rocks typically have a prominent foliation.
• Large volumes of fluids are released during prograde metamorphism that rise toward the surface taking with them heat and dissolved constituents, which may alter overlying rocks or be deposited as veins.
• Changes in metamorphic rocks take place in order to lower the Gibbs free energy. A natural reaction must decrease this energy and the reaction reaches equilibrium when the Gibbs free energy is a minimum.
• The contribution each component in a complex mineral makes to the Gibbs free energy of that mineral is known as the chemical potential of that component.
• At equilibrium, temperature, pressure, and chemical potentials of all components must be the same throughout the rock. • Reaction rates are more rapid at high temperature and in the presence of fluids. As a result, prograde reactions are very much faster than retrograde reactions.
• Gibbs phase rule relates the number of components needed to describe the composition of the phases to the number of phases and the number of environmental variables that can be changed at equilibrium.
• Metamorphic grade loosely refers to the intensity of metamorphism. The first appearance of certain easily recognized metamorphic index minerals was used by Barrow to map metamorphic grade. These were later equated to equal grades of metamorphism or isograds.
• A metamorphic mineral facies comprises all rocks that have originated under temperature and pressure conditions so similar that a definite bulk rock chemical composition results in the same set of minerals.
• A metamorphic facies series is a sequence of metamorphic facies encountered across a progressively metamorphosed terrane. Each series reflects different changing pressures and temperatures. Eskola recognized three main series, a low-pressure, hightemperature series; a high-pressure, high-temperature series; and a high-pressure, low-temperature series.
• Metamorphism usually results in coarsening of grain size, because this lowers the rock’s overall surface free energy. Exceptions occur where rocks are strongly deformed and many new centers of recrystallization are formed that lead to a fine-grained rock.
• Minerals can be arranged in the crystalloblastic series, where any mineral in the series forms euhedral faces against minerals lower than it in the series. Garnet and staurolite, for example, are high in the series and commonly form euhedral crystals.
• Recrystallization commonly leads to grains coming together at triple junctions with angles of ∼120°. This minimizes surface free energies.
• Regionally metamorphosed pelitic rocks develop a foliation, which, with increasing metamorphic grade, passes from slate, through phyllite, and schist, to gneiss. Foliation can also result from alignment of needlelike minerals, such as amphibole. These foliations develop perpendicular to the maximum compressive stress.
• During the development of foliation, metamorphic rocks undergo considerable flattening due to the change in the shape of grains and solution and removal of material from the rock.
• Graphical representations of metamorphic mineral assemblages on either side of a metamorphic reaction commonly require projecting compositions from three-dimensional tetrahedral plots into more convenient two-dimensional triangular plots. This is done by projecting from a mineral that is common to all assemblages.
Review questions
• Reactions between minerals in triangular plots are indicated by the tie line between the reactants switching to form a tie line between the products.
• A petrogenetic grid is a pressure-temperature plot of all possible reactions that can take place between a given set of minerals. The univariant reaction curves intersect at invariant points to produce a grid that divides P-TT space into divariant fields in which unique mineral assemblages are stable.
• Metamorphic minerals in pelitic rocks are conveniently projected from quartz and muscovite into a triangular diagram of Al2O3-FeO-MgO. This AFM projection is known as the Thompson projection.
• Metamorphic reactions that release a fluid phase are strongly dependent on the composition of the fluid phase. Only when the composition of the fluid in the environment matches the composition of the fluid produced by the reaction does the reaction take place at its highest temperature. Fluids composed of variable amounts of H2O and CO2 can cause metamorphic reactions in impure carbonate rocks to occur at very different temperatures and to produce very different prograde sequences of minerals.
• The normal upper limit of metamorphism occurs when melting first occurs to form migmatites. The latent heat of fusion is so high that it uses up all available heat, and temperatures do not normally rise higher.
• Geothermometers and geobarometers are assemblages of minerals that belong to solid solution series whose compositions are sensitive to temperature and pressure, respectively.
• From zoned porphyroblasts and mineral assemblages in metamorphic rocks it is possible to construct partial pressure-temperaturetime (P-T-t) paths that rocks follow during metamorphism. The P-T-t paths of regionally metamorphosed rocks are determined largely by plate tectonic processes.
• At midocean ridges, ocean water circulates through, and cools, newly formed crust and in so doing adds up to 10 weight % water, as previously anhydrous igneous rocks are converted to zeolite facies metamorphic rocks. This water is later released when oceanic rocks are subducted and converted to blueschist and eclogite facies rocks. As the water rises back toward the surface, it causes melting in the mantle wedge and metamorphism in the overlying orogenic belt.
• At convergent plate boundaries, metamorphic rocks commonly form two belts, one close to the subduction zone where highpressure, low-temperature metamorphic rocks are formed (blueschists), and another a little farther into the overriding plate where low-pressure, high-temperature metamorphic rocks are commonly associated with abundant igneous intrusions.
Review questions 1. What is metamorphism, and what are the main factors that cause it? 2. What is the difference between regional metamorphic rocks and contact metamorphic rocks? 3. What major constituents are lost during prograde regional metamorphism and what important roles do they play? 4. What is the Gibbs free energy and what happens to it during a metamorphic reaction? 5. How can we define equilibrium in the case of a metamorphic reaction? 6. What determines the rate of a metamorphic reaction? 7. What does Gibbs phase rule tell you about the number of minerals you might expect to find in a metamorphic rock? 8. What are metamorphic index minerals and how do they relate to isograds? 9. What is a metamorphic mineral facies, and how is it used to determine metamorphic grade? 10. What is a metamorphic facies series?
427
428
Metamorphic rocks
11. What causes most rocks to become coarser-grained during metamorphism and are there exceptions? 12. Why do contact metamorphic rocks known as hornfels commonly consist of polygonal grains that are bounded by faces
that intersect at ∼120°? 13. What textural feature characterizes most regionally metamorphosed rocks? 14. What evidence indicates rocks can lose material during the development of metamorphic foliation? 15. Although the rock name mylonitee comes from the Greek word for a “mill,” the fine grain size of this rock is not due to
breaking and grinding of grains. What causes mylonite to be extremely fine-grained? 16. What is a petrogenetic grid, and how can it be used to determine the conditions under which a metamorphic rock
formed? 17. Starting with the triangular diagram indicating the stable mineral assemblages in any divariant field in Figure 14.19 work
your way clockwise around the diagram until you come back to the starting diagram and check that only one change occurs in the mineral assemblages in crossing from one divariant field to the next. 18. The Thompson projection is a convenient way of showing pelitic mineral assemblage in terms of Al2O3-FeO-MgO. From
what mineral is the projection made, and what other minerals must be present in the rock in addition to those shown in the projection? 19. From the Thompson projections for any two of Barrow’s adjoining zones in Figure 14.22, write a reaction that must take
place in going from one grade of metamorphism to another. Recall that reactions can be spotted from a switch in tie lines or if a mineral plots within a phase triangle. 20. Using the petrogenetic grid in Figure 14.23, determine the possible pressure and temperature ranges over which the mineral
assemblages in the three different pelites in Figure 14.24 are stable. 21. Write a balanced reaction for tremolite reacting with calcite to produce diopside and forsterite. From the proportions of
CO2 and H2O produced in the reaction, calculate the mole fraction of CO2 in the fluid at the reaction’s maximum stability, and what would be the shape of the reaction in Figure 14.28? To balance the reaction, let the amounts of tremolite, calcite, diopside and forsterite be a, b, c, and d respectively. Then write equations equating the amounts of Ca, Mg, and Si on both sides of the reaction, and solve for the coefficients. 22. Why does migmatite formation normally put a cap on metamorphic temperatures? 23. What are Fe-Mg exchange reactions, and how are they used as geothermometers? 24. Why do metamorphic rocks in some young mountain belts occur in paired metamorphic belts, with a high-pressure,
low-temperature belt nearest the subduction zone and a low-pressure, high-temperature belt farther into the overriding plate?
FURTHER READING The first three articles are of historical interest to the development of ideas about metamorphism: Barrow, G. (1983). On an intrusion of muscovite-biotite gneiss in the southeast Highlands of Scotland, and its accompanying metamorphism. Quarterly Journal of the Geological Society of London, n 49, 330–358.
Bowen, N. L. (1940). Progressive metamorphism of siliceous limestone and dolomite. Journal of Geologyy, 48, 225–274. Eskola, P. (1920). The mineral facies of rocks. Norsk Geologisk Tidsskrift, t 6,143–194. Philpotts, A. R., and Ague, J. J. (2009). Principles of Igneous and Metamorphic Petrologyy, 2nd ed., Cambridge University Press, Cambridge. This book presents a detailed and quantitative coverage of metamorphic petrology.
Review questions
Spear, F. S., and Cheney, J. T. (1989). A petrogenetic grid for pelitic schists in the system SiO2-Al2O3-FeO-MgO-K2OH2O. Contributions to Mineralogy and Petrology, y 101, 149–164. This article presents a full development of a petrogenetic grid for pelitic rocks. Thompson, J. B. Jr. (1957). The graphical analysis of mineral assemblages in pelitic schists. American Mineralogist, t 42, 842–858. This article describes the projection scheme used to analyze mineral assemblages in metamorphic rocks.
Vernon, R. H. and Clarke, G. L. (2008). Principles of Metamorphic Petrology, y Cambridge University Press, Cambridge. This book provides an in-depth treatment of metamorphic petrology. Yardley, B. W. D., MacKenzie, W. S., and Guilford, C. (1990). Atlas of Metamorphic Rocks and Their Textures, s Longman, Harlow, U.K. This book contains beautiful colored illustrations of metamorphic rocks and their textures as seen under the microscope.
429
CHAPTER
15
Some economic minerals, mainly from veins and pegmatites
In Chapters 7, 10, and 13, we provided systematic treatments of minerals according to their most common origin, such as igneous, sedimentary, and metamorphic. This classification omits a number of minerals that are of major economic importance, such as some native elements, sulfides, and a few silicates, as well as barite, fluorite, and some gem minerals. The minerals in the prior three mineralogical chapters include a large number of silicates, with fewer carbonates, oxides, and sulfides. Many of these are of economic importance and are referred to as industrial minerals. An industrial mineral includes any rock, mineral, or other naturally occurring substance of economic value, exclusive of metallic ores, mineral fuels, and gemstones. In this chapter we include a variety of metallic ore minerals consisting of native elements and sulfides. The term ore mineral refers usually to a metallic mineral that is part of an ore and is economically desirable, in contrast to those minerals that are part of the gangue. Gangue is the valueless rock or mineral aggregate in an ore deposit that is not economically desirable but cannot be avoided in mining. We also discuss several nonmetallic minerals that are of economic importance but could not be included in the mineral classification used prior. We close the chapter with examples of several important gem minerals.
Coarse-grained vein mineralization consisting of white quartz, brown sphalerite and metallic gray galena. From Lautenthal, Hartz Mountains, Germany. The size of the field of view is 8 cm by 13 cm. (David Nufer Photography, Albuquerque, New Mexico.)
432
Some economic minerals, mainly from veins and pegmatites
The minerals discussed in this chapter are commonly found in either hydrothermal veins or pegmatites. Hydrothermal deposits result from precipitation of ore and gangue minerals in fractures, faults, breccia openings, and other spaces, by replacement or open-space filling, from water-rich fluids ranging in temperature from 50° to 700°C but generally below 400°C and ranging in pressure from 0.1 to 0.3 GPa; the fluids are of diverse origin. Pegmatites are exceptionally coarse-grained igneous rocks (Fig. 8.22), usually found as irregular dikes (Fig. 9.5(A)), lenses or veins, commonly at the edges of batholiths. Their most common overall composition is that of granite, with grains 1 cm or more in size. Pegmatites represent the last and most hydrous portion of a magma to crystallize and, therefore, may contain high concentrations of minerals that occur only in trace amounts in granites and are concentrated in the hydrous-rich residue. The first five minerals of this chapter are native elements, Au, Ag, Cu, C (diamond), and S. Gold in its native state is the most important ore mineral in gold occurrences. However, Ag as a native element, is less important as an ore mineral than acanthite, Ag2S; proustite, Ag3AsS3; and pyrargyrite, Ag3SbS3. Similarly, native copper is a minor ore mineral when compared with several copper sulfides described in this chapter. Carbon, as diamond, is the only source of diamond and bort. Native sulfur is the major source for the production of sulfuric acid, H2SO4, and hydrogen sulfide, H2S, but large amounts are produced as the byproduct from the processing of numerous sulfide ore minerals. After these native elements come seven sulfides (one sulfarsenide among them), six of which are the major ore minerals for Pb, Zn, Cu, Mo, and As. One of these sulfides, marcasite (one of two polymorphs of FeS2; the much more common being pyrite), is present in many hydrothermal sulfide vein associations. This is followed by descriptions of bauxite (a mineral mixture that is the main source of Al), fluorite (the main source of fluorine for the production of hydrofluoric acid, HF), and barite (a major component of drilling muds). After that come two lithium-containing minerals, spodumene, and lepidolite. We end the chapter with a selection of some important gem minerals: ruby and sapphire, gem varieties of corundum; topaz; tourmaline; emerald, heliodore, and aquamarine (gem varieties of beryl); precious opal; jade; and turquoise.
lump of placer gold). A placer deposit is defined as a surficial mineral deposit formed by the mechanical concentration of mineral particles from weathered debris. Much of the world’s gold production is from deposits where the gold is classified as invisible gold because it is so fine grained that it cannot be seen by the naked eye. Chemical composition and crystal structure: There is a complete solid solution series between Au and Ag, and most native gold contains some Ag, Cu, or other metals. Electrum is the name given to a solid solution series between Au and Ag. Small amounts of Cu and Fe may also be present. The proportion of pure gold in an alloy is expressed in karat (k). Pure gold is 24 karat, whereas 18 k gold consists 18 parts gold and 6 parts of other metals. The crystal structure of gold is given in Figure 15.1. It is isometric with an all-face-centered lattice (F) and consists of Au atoms in cubic closest packing (see Box 4.2). Gold, silver, and copper are isostructural. Crystal form: Isometric; 4/m 3 2/m. Gold is seldom in good crystals such as well-developed octahedra. Commonly in irregular plates, scales, or masses. Very attractive, museum-quality specimens consist of arborescent crystal groups and irregular dendritic shapes, as shown in Figure 15.2. Physical properties: H = 2½–3; G = 19.3 (when pure) with the presence of other metals in solid solution lowering the G to as low as 15. Malleable and ductile. Fracture is hackly. Metallic luster and opaque. Color ranges from various shades of yellow to very pale yellow as a function of increasing Ag content. Gold-Au; Silver-Ag; Copper-Cu F 4/m 3 2/m a3
Au, or Ag, or Cu
a2
15.1 Gold: Au Occurrence: Most gold occurs in the native state and is of hydrothermal origin in gold-quartz veins, together with pyrite and other sulfides. Such gold is the result of deposition from ascending mineral solutions. When such primary gold occurrences are weathered the liberated gold remains as an alluvial deposit as part of the soil or is transported to form a placer deposit, which may be the source of nuggets (a nugget is a large
a1 Figure 15.1 Perspective view of the crystal structure of gold as seen in a ball-and-stick representation. A cubic unit cell is outlined. Each gold atom is surrounded by 12 closest neighbors in cubic closest packing (see Box 4.2). Silver and copper have identical structures and are, therefore, referred to as isostructural.
15.3 Copper
Figure 15.3 Native silver in a complex intergrowth of arborescent and wiry forms.
Distinguishing features: Gold is distinguished from yellow sulfides such as pyrite and chalcopyrite by its high specific gravity and sectility. Pyrite is sometimes referred to as fool’s gold. Uses: Gold has drawn the attention of many cultures since the earliest of time because of its color, indestructibility, and ease of fabrication into beautiful objects. About 51% of all gold exists as jewelry and decorative artifacts, about 34% is retained by investment houses and/or individuals as bullion and coins, and about 12% is used in industry. About half of this amount is used in electrical components because of its resistance to corrosion and high electrical and heat conductivity. In dentistry, alloyed with silver and other metals, it is used in dental crowns.
mined as an ore, most of the world’s supply of silver is extracted from minerals such as acanthite, Ag2S, and proustite, Ag3AsS3. Chemical composition and crystal structure: Native silver is commonly alloyed with some Au, Cu and Hg. Amalgam is a solid solution between Ag and Hg. The crystal structure of Ag is the same as that of gold (Fig. 15.1) with Ag atoms in cubic closest packing. Crystal form: Isometric; 4/m 3 2/m. Crystals commonly malformed and generally in branching, reticulated, or arborescent groups (Fig. 15.3). Also in irregular masses and in wirelike forms. Physical properties: H = 2½–3; G = 10.5 (when pure). Malleable and ductile. Fracture hackly. Color and streak silver white, commonly tarnished to brown or gray black. When untarnished, it has a metallic luster. Distinguishing features: Native silver is characterized by the silver-white color on a fresh surface, high specific gravity, and malleability. Uses: Silver is extensively used in decorative items such as jewelry and silverware. Its use in coinage has been much reduced because of its price and been replaced by metals such as copper and nickel. In dentistry, it is used in the alloy amalgam for dental fillings. It is applied as a coating to mirrors that require exceptional reflectivity of visible light such as in solar reflectors. Some musical instruments such as flutes are made of silver or are silver plated. It is also used as a catalyst in the chemical industry.
15.2 Silver: Ag
15.3 Copper: Cu
Occurrence: Native silver deposits are the result of deposition from hydrothermal solutions. These may consist of native silver in association with other silver minerals, sulfides, zeolites, calcite, barite, fluorite, and quartz. Also with silver arsenides and sulfides of nickel and cobalt. Although native silver is
Occurrence: Native copper is only a minor ore of copper worldwide. Most copper ores are of hydrothermal origin and consist of various mixtures of copper sulfides such as chalcopyrite, CuFeS2; bornite, Cu5FeS4; and chalcocite, Cu2S. Most native copper is associated with basaltic lavas where
Figure 15.2 A highly valuable, museum-quality exhibit specimen of native gold. It consists of a branching network with some sporadic, poorly developed octahedral crystals. The transparent, colorless-to-white crystals are quartz.
433
434
Some economic minerals, mainly from veins and pegmatites
Figure 15.4 Native copper in an arborescent intergrowth.
copper was deposited because of the interaction of hydrothermal fluids with iron oxide minerals. The famous native copper deposits in the Lake Superior district of the United States have copper in interstices of sandstones and conglomerates and filling the cavities of amygdaloidal lavas. Chemical composition and crystal structure: Native copper may contain small amounts of Ag, As, and Fe. The crystal structure of native copper is the same as that of gold and silver (Fig. 15.1) and is based on cubic closest packing of Cu atoms. Crystal form: Isometric, 4/m 3 2/m. Crystals are distorted cubes, octahedrons, and dodecahedrons. Commonly in branching and arborescent groups (Fig. 15.4). Usually in irregular masses and scales. Physical properties: H = 3½–3; G = 8.9. Highly malleable and ductile. Hackly fracture. Color is copper red on a fresh surface but is usually dark as a result of tarnish. It has a metallic luster and is opaque. Distinguishing features: Native copper is recognized by its high specific gravity, malleability, and red color on a fresh surface. Uses: Copper finds many applications because it is malleable and ductile, is a good conductor of heat and electricity, and is resistant to corrosion. It is widely used in the piping of water supplies and in refrigeration and air conditioning. It is extensively used in electrical applications and in electronics, as electrical wire, and in integrated circuits and printed circuit boards. In architecture, it has been used as roofing material since ancient times. It is a component in ceramic glazes, gives color to glass, and is a constituent of many copper-based alloys such as bronze and brass.
15.4 Diamond: C Occurrence: Diamonds originate below 200 km in the Earth’s upper mantle. They are transported to the Earth’s surface by unique volcanic eruptions that drill narrow explosive vents or pipes through the Earth’s crust. The rock types that fill such vents are known as kimberlites and lamproites (Sec. 9.4.4),
which consist of peridotitic or ultramafic rock fragments set in a fine-grained groundmass (Fig. 15.5). These fragmental rock types may contain olivine, phlogopite, spinel, and diopside (Fig. 9.38). Large quantities of synthetic diamonds, for use in drilling and cutting tools, are produced commercially. Chemical composition and crystal structure: The composition of diamond is pure carbon. The crystal structure, illustrated in Box 5.7, shows that each carbon atom is surrounded by four neighboring carbons in tetrahedral coordination with covalent bonding. Carbon is common in two different polymorphs, diamond and graphite, with diamond the high-pressure and graphite the low-pressure polymorph. The structure of graphite, shown in Figure 4.20, is completely different from that of diamond. Crystal form: Isometric; 4/m 3 2/m. Crystals are commonly octahedral with curved crystal faces (Fig. 15.5). Also found in cubes and dodecahedrons. Gem-quality diamonds are classified according to the four Cs: color, clarity, cut, and carat weight (1 carat = 0.2 gram). Bort, a gray to brown variety of diamond, is poorly crystallized and has rounded forms and a rough exterior (see opening photograph for Chapter 5). Physical properties: H = 10 (the hardest known mineral); G = 3.52. Perfect octahedral {111} cleavage. Adamantine luster. The very high refractive index, 2.42, and strong dispersion of light are the reason for the brilliancy and fire of cut gemquality diamonds. Color ranges most commonly from pale yellow to colorless, but may also be gray to black. The term fancy color is used for strongly colored (pink, orange, green, and blue) gem-quality diamonds. Distinguishing features: Diamond has great hardness, commonly octahedral crystal habit, excellent octahedral cleavage, and adamantine luster. Uses: Apart from the use of diamond as a gem, there are many industrial applications in which natural and synthetic diamonds are both used. Diamond crystals, fragments, and powders are used in drill bits for oil and mineral exploration as well as dental work. It is impregnated into wheels for cutting dimension stone for building purposes. Diamond grit and powder are extensively used as abrasives. Very fine diamond powder is part of lapping compounds and fine finishing tools. The high thermal conductivity of diamond finds its application as a heat-sink in electronics. Synthesis and imitation: There is no law against the imitation of gemstones and synthetic gemstones are an important part of the gemstone trade. Synthetic diamonds are extensively used in industry. Synthetic diamonds of considerable size and exhibiting all the required properties of a gemstone are also being produced. In addition, there is an excellent diamond imitation known as cubic zirconia, synthetic ZrO2, also known as CZ. Its various physical properties make it visually essentially indistinguishable from natural gem diamond.
15.5 Sulfur
Figure 15.5 Clear, transparent, distorted octahedron of diamond (top center) in a matrix of kimberlite, which consists of angular fragments or xenoliths of mantle-derived rocks.
15.5 Sulfur: S Occurrence: Sulfur, of volcanic origin, is found in almost all volcanic regions of the world (Fig. 8.15(A)). In such settings it occurs as replacement deposits in lens-shaped ore bodies in tuffs and volcanic breccias, and as sublimation deposits resulting from fumarolic activity (Fig. 15.6) near volcanic craters. Such volcanic deposits are generally small compared to those that are part of evaporite basins. It is commonly present in the cap rock of salt domes where it is thought to be the result of the action of sulfate-reducing bacteria in the presence of a sulfate source, consisting of gypsum and anhydrite, and hydrocarbons. It is of the same origin in bedded (stratiform) anhydrite-gypsum deposits. Chemical composition and crystal structure: Native sulfur may contain small amounts of selenium in solid solution. The crystal structure of the most common orthorhombic polymorph is shown in Figure 15.7 and consists of covalently bonded, puckered S8 rings. The unit cell contains 128 sulfur atoms distributed over 16 such rings.
Figure 15.6 An irregular intergrowth of euhedral sulfur crystals inside the neck of a small fumarole. The beige rock on the outside is what the fumarolic vent intruded into.
435
436
Some economic minerals, mainly from veins and pegmatites
Sulfur - S F 2/d 2/d 2/d
a3
c
Galena - Pb S F 4/m 3 2/m
S
Pb S
a2
b
a1 Figure 15.8 Perspective view of the crystal structure of galena in a ball-andstick model. An isometric unit cell is outlined.
a Figure 15.7 Perspective view of the orthorhombic crystal structure of sulfur. An orthorhombic unit cell is outlined which contains 128 sulfur atoms in 16 puckered springs.
Crystal form: Orthorhombic; 2/m 2/m 2/m. Occurs in crystals with orthorhombic dipyramids. Most commonly in irregular masses and as encrustations. Physical properties: H = 1½–2½; G = 2.07. Fracture conchoidal to uneven. Color sulfur-yellow, ranging from yellow to green, and red shades on account of impurities. It has a resinous luster and ranges from transparent to translucent. Distinguishing features: Sulfur is recognized by its yellow color, low hardness and brittleness, and lack of good cleavage. Uses: Most sulfur is used in the production of sulfuric acid, H2SO4, which is a primary component in the production of sulfur-bearing phosphatic fertilizers. It is also used in the production of inorganic chemicals, in synthetic rubber and plastic materials, and in petroleum and coal refining.
15.6 Galena: PbS Occurrence: Galena is a common sulfide in hydrothermal veins in association with sphalerite (see opening photograph to this chapter), pyrite, chalcopyrite, marcasite, calcite, quartz, barite, and fluorite. It also occurs in veins associated with silver minerals, in which case it may contain silver as an admixture, and is then mined as a source of silver as well as lead. It also occurs in low-temperature hydrothermal replacement deposits, in association with sphalerite, in limestone. Chemical composition and crystal structure: Most commonly, the composition is close to PbS but may contain small amounts of Zn, Cd, Sb, and As in inclusions. The crystal structure of galena, which is the same as that of halite, NaCl, with Pb
in place of Na and S in place of Cl, is shown in Figure 15.8. Both Pb and S are in 6-fold (octahedral) coordination with their closest neighbors. Crystal form: Isometric; 4/m 3 2/m. The most common form is that of the cube, frequently truncated at the corners by the octahedron, as shown in Figure 15.9. Physical properties: H = 2½; G = 7.4–7.6. Perfect cubic {100} cleavage. Opaque. Color and streak lead-gray. Luster bright metallic if not tarnished. Distinguishing features: Galena is characterized by good cubic crystal habit, excellent cubic cleavage, low hardness, high specific gravity, and lead-gray color and streak. Uses: The most important commercial use of lead is in the manufacture of electric storage batteries for fossil-fuel powered cars and trucks. It is part of alloys such as solder and type metal, and it is a principal component in ammunition. It is also used as a sheathing of cables and is employed as protective shielding against X-rays and radiation from nuclear reactors. The “lead” of a pencil does not contain lead but is a mixture of graphite and clay. Because lead can be a highly toxic element to human health, lead-based paints and lead as an antiknock additive in gasoline have been outlawed. Lead is also no longer used in plumbing.
15.7 Sphalerite: ZnS Occurrence: Sphalerite and galena are most commonly found together in hydrothermal ore deposits, and, therefore, the occurrence and mode of origin of sphalerite are essentially the same as those given for galena (Sec. 15.6). It is found in assemblages consisting of galena, sphalerite, marcasite, chalcopyrite, pyrrhotite, pyrite, calcite, dolomite, and quartz. Chemical composition and crystal structure: The chemical composition of sphalerite commonly reflects the presence of
15.7 Sphalerite
Figure 15.9 An intergrowth of euhedral crystals of galena showing well-developed, large cubes truncated by octahedral faces. The purple color of several cubes on the right is a natural tarnish.
some iron in substitution for zinc, as shown by a range of colors from colorless for pure ZnS to dark brown or black with considerable Fe content. The crystal structure of isometric sphalerite is shown in Figure 15.10. It has a high-temperature hexagonal polymorph known as wurtzite, which occurs in various polytypes. The isometric structure of sphalerite is similar to that of diamond, in which one-half the carbon is replaced by Zn and the other half by S. Zn is in tetrahedral coordination with S. Crystal form: Isometric; 4 3m. Tetrahedrons, dodecahedrons, and cubes are common forms. Some crystals may show highly complex morphology. Physical properties: H = 3½–4; G = 3.9–4.1. Perfect dodecahedral {011} cleavage. Luster nonmetallic and resinous. Color ranges from colorless when pure ZnS to various shades of yellow, yellow-brown, to brown, and black as a function of
increasing iron content (Fig. 15.11). Streak ranges from white, yellow, to pale brown. Transparent to translucent. Distinguishing features: Sphalerite has perfect dodecahedral {011} cleavage and resinous luster. Very dark varieties can be recognized by a reddish-brown streak. Uses: About half of all zinc produced is used to make galvanized steel, in which thin coatings of zinc prevent corrosion. Galvanized steel is a major component of power transmission towers, tanks, culverts, and nails, and it is extensively used in automobiles. A large percentage of zinc production goes into brass (copper alloyed with between 3% and 45% Zn) and other zinc alloys. It is also used in the pharmaceutical and cosmetic industries. Zinc is an essential element of biologic and public health importance. Zinc deficiency affects many people in the developing world and is associated with many diseases.
437
438
Some economic minerals, mainly from veins and pegmatites
Bornite - Cu5FeS4 P 4 21 c
Sphalerite - Zn S F43m c
a3 Zn
Cu and Fe S
S
a2 a2
a1 Figure 15.10 Perspective view of the crystal structure of sphalerite. A cubic unit cell is outlined.
15.8 Bornite: Cu5FeS4 Occurrence: Bornite is a widely distributed copper ore mineral commonly associated with other sulfides such as chalcopyrite, chalcocite, pyrrhotite, and pyrite. Two major types of copper deposits are porphyry copper and volcanogenic massive sulfide (VMS) deposits. Porphyry copper deposits formed around intrusions that fed volcanoes as a result of magmatic waters expelled from the intrusions, whereas VMS deposits consist of massive lenses of Cu, Zn, and Pb sulfides deposited as sediments from hydrothermal systems (as hot springs) that vented onto the ocean floor (Fig. 9.34 and Sec. 16.4). Chemical composition and crystal structure: Bornite shows considerable variability in its contents of Cu and Fe, and is, therefore, somewhat variable in composition. It occurs in two polymorphic forms; a tetragonal polymorph at low temperature
Figure 15.11 An intergrowth of coarsely crystalline sphalerite showing a range of color from yellow brown on the inside to dark brown (to black) on the outer surface.
a1 Figure 15.12 A perspective view of the tetragonal crystal structure of the lowtemperature form (polymorph) of bornite. A tetragonal unit cell is outlined. All the cation sites are colored blue, which means that Cu and Fe are randomly distributed (disordered) over these sites. They are in tetrahedral and trigonal (planar) coordination with S. The coordination number of S with adjoining Cu and Fe ranges from 4 to 6.
(below 228°C) and an isometric form above that. Figure 15.12 is a perspective view of the tetragonal, low-temperature polymorph of bornite, with Cu and Fe distributed randomly (disordered) over the tetrahedrally coordinated sites. Crystal form: Tetragonal; 4 2 m. Good crystals are uncommon. Usually massive (Fig. 15.13). Physical properties: H = 3; G ∼5.1. Usually massive with brownish-bronze color on the fresh surface which is quickly tarnished to a mixture of purple and blue colors (peacock ore; see Fig. 15.13). May become almost black on further exposure. It has a metallic luster and gray-black streak. Bornite is commonly in association with other Cu-Fe sulfides (Fig. 15.14).
Figure 15.13 Massive bornite with a fresh surface of brownish-bronze color. The tarnished portion shows variegated purples and blues, also known as peacock ore.
15.10 Marcasite
Chalcocite - Cu2S P 21/c or P c
S Native sulfur
Atomic %
10/90
20/80 30/70
c
Fe S2, Pyrite
40/60 and Marcasite Fe1–x S, 50/50 Pyrrhotite
Cu5 Fe S4, Bornite
Cu
60/40 Cu Fe S2, Chalcopyrite Cu2 S, Chalcocite Cu Native copper
S
70/30 80/20 90/10 Fe Native iron
b
Figure 15.14 A triangular composition diagram using Cu, Fe, and S as end members. This allows for the graphical representation of the compositions of several Cu-Fe sulfides. Tie lines (bold lines) connect coexisting minerals.
Distinguishing features: Most easily recognized by the unique variegated colors on a tarnished surface with the brownish-bronze color of a fresh surface (see Fig. 15.13). Uses: Bornite being a major copper ore mineral has the same uses as those given for native copper (Sec. 15.3).
a Figure 15.15 Perspective polyhedral representation of the crystal structure of chalcocite. Nine adjoining monoclinic unit cells are outlined. Copper atoms are distributed over the two colored (green and blue) sites.
15.9 Chalcocite: Cu2S
15.10 Marcasite: FeS2
Occurrence: Chalcocite is an important copper ore mineral that is of supergene origin. This means that it is the result of oxidation, at the surface, of primary copper sulfides, and the subsequent downward movement of soluble sulfates reacting with primary copper sulfides to form chalcocite. This produces a zone of supergene enrichment where the water table is the lower limit of such a zone. This zone is commonly referred to as chalcocite blanket. Chemical composition and crystal structure: The composition of chalcocite is generally close to Cu2S, with only minor amounts of Ag and Fe in substitution. A perspective view of the polyhedral crystal structure is given in Figure 15.15, with Cu atoms distributed over two different sites (colored blue and green). Sulfur atoms are in octahedral coordination with neighboring Cu atoms. A group of nine monoclinic unit cells is shown. Crystal form: Monoclinic; 2/m or 2. Crystals are uncommon; generally massive and fine grained. Physical properties: H = 2½–3 (imperfectly sectile); G ∼5.7. Poor {110} cleavage. Conchoidal fracture. Color shining lead gray on fresh surfaces, but tarnishes to dull black on exposure (Fig. 15.16). Metallic luster. Distinguishing features: Chalcocite is recognized by its lead-gray color on a fresh surface and its low hardness (somewhat sectile). Uses: Chalcocite being a copper ore mineral has the same uses as those given for native copper (Sec. 15.3).
Occurrence: Marcasite and pyrite are two polymorphs of FeS2 (pyrite is discussed in Sec. 7.30). Marcasite is less stable and more easily decomposed than pyrite and, therefore, less common. It is part of primary lead-zinc deposits and is also found in supergene ore deposits. It occurs as flattened spheres in black shales, referred to as pyrite suns. It is also found as nodules or concretions in clays and shales with a radiating fibrous structure.
Figure 15.16 Massive black chalcocite with fractures filled by dark-green brochanthite, Cu4SO4(OH)6, an alteration product.
439
440
Some economic minerals, mainly from veins and pegmatites
Marcasite - FeS2 P 21/n 21/n 21/m
S Fe b
a Figure 15.17 Perspective view, essentially along the c axis, of the crystal structure of marcasite. Fe atoms are in 6-fold coordination with S. An orthorhombic unit cell is outlined.
Chemical composition and crystal structure: Of constant composition as one of two polymorphs of FeS2, the other being pyrite. The stability relations between marcasite and pyrite are not well established, but geological occurrences suggest that marcasite is the polymorph stable at low temperature. The crystal structure of marcasite is shown in Figure 15.17. Iron atoms are in octahedral coordination with sulfur, the same as in pyrite. In marcasite, the octahedra are linked in chains parallel to the c axis, joined along their edges. Crystal form: Orthorhombic; 2/m 2/m 2/m. Crystals commonly tabular; also twinned giving cockscomb and spearshaped groups (Fig. 15.18). Physical properties: H = 6–6½; G = 4.9. Metallic luster. Opaque. Color pale bronze yellow to almost white on a fresh surface; yellow to brown when tarnished. Streak grayish black. Distinguishing features: Distinguished from pyrite by its paler yellow color, its very different crystal form (pyrite is very common in cubic crystals), and a fibrous or radiating habit. Uses: May be mined locally as a source of sulfur. The uses of sulfur are given in Section 15.5.
Figure 15.18 Platy, spear-shaped twin crystals of marcasite in clay.
Chemical composition and crystal structure: It is essentially MoS2 in composition. A ball-and-stick view of the crystal structure of molybdenite is given in Figure 15.19 with sheets of Mo atoms sandwiched between two sheets of S atoms. The bond strength in these S-Mo-S sheets is strong but adjacent sheets are weakly bonded by van der Waals bonds, which gives rise to excellent cleavage along the basal {0001} plane. Crystal form: Hexagonal; 6/m 2/m 2/m. Crystals occur as hexagonal plates grouped in foliated masses (Fig. 15.20). Molybdenite - MoS2 P 63/m 2/m 2/c c
a2
a1
15.11 Molybdenite: MoS2 Occurrence: Molybdenite is the most common ore mineral of molybdenum, which is a very scarce element in the Earth’s crust, with an average abundance of 1 ppm. Molybdenite is present in some porphyry copper deposits associated with felsic intrusive rocks. These have a porphyritic texture consisting of larger crystals in a fine-grained matrix. Molybdenite may also be an accessory mineral in granites and pegmatites, and occurs in high-temperature vein deposits.
Figure 15.19 Perspective view of a ball-and-stick representation of the crystal structure of molybdenite. The large spacing, along the c axis direction, reflects the weak van der Waals bonding between successive layers of S-Mo-S. A primitive hexagonal unit cell is outlined.
15.12 Arsenopyrite
Arsenopyrite - FeAsS P 21/c c Fe As S
b
Figure 15.20 Crystals of molybdenite with hexagonal crystal outlines as part of a larger composite crystal that shows slightly rounded hexagonal edges.
Physical properties: H = 1–1½; G ∼4.7. Perfect {0001} cleavage. Sectile with a greasy feel. Laminae are flexible but not elastic. Color lead gray with a bright metallic luster. Streak grayish black. Opaque. Distinguishing features: Resembles graphite, C, but is distinguished from it by its higher specific gravity (graphite: G = 2.2). The molybdenite color has a blue tone, whereas graphite has a brown tinge. On a porcelain streak plate molybdenite leaves a greenish streak and graphite a black streak. Uses: Molybdenum is used in steel alloys for its high corrosion resistance and weldability. High strength steel alloys contain between 0.25% and 8% molybdenum. Examples of such are stainless steel, tool steel, cast iron, and high-temperature superalloys. The sulfide itself, MoS2, is used as a solid lubricant and a high-pressure, high-temperature, antiwear agent, forming strong films on metallic surfaces. Small amounts are used in fertilizers.
15.12 Arsenopyrite: FeAsS Occurrence: Arsenopyrite is the most common As-containing mineral. It is found in high-temperature deposits that contain tungsten and tin minerals, and in copper and silver ores in association with sulfides such as chalcopyrite, pyrite, galena, and sphalerite. Because of its relatively widespread occurrence in association with sulfides in various ore types, arsenic is commonly recovered as a by-product in the smelting of such ores. Chemical composition and crystal structure: Close to FeAsS in most occurrences but may show some variability in both As and S contents. A perspective polyhedral view of the crystal structure of arsenopyrite is given in Figure 15.21. Crystal form: Monoclinic; 2/m. Commonly in prismatic crystals (Fig. 15.22). Physical properties: H = 5½–6; G = 6.1. Poor cleavage. Silver-white color with metallic luster. Opaque. Streak black.
a Figure 15.21 Perspective polyhedral representation of the crystal structure of arsenopyrite. A monoclinic unit cell is outlined. Iron atoms are at the center of octahedral coordination polyhedra with three arsenic and three sulfur atoms at the corners.
Distinguishing features: Distinguished from marcasite by its silver-white color. Unique identification may require a chemical test for arsenic. Uses: Arsenic and its compounds are mainly used as an alloying agent for lead batteries, but historically it was part of pesticides, insecticides, herbicides, and used in the preservation of wood. All these applications have declined because of toxicity. Another use of arsenic is as a doping agent in solid state devices such as transistors. Doping is the process by which an impurity such as arsenic is added to a semiconductor to increase its conductivity. Arsenic is also used in some medical treatments. The arsenic content of public water supplies where arsenic is derived from surrounding rocks and soils is carefully monitored because of potential health effects (see Section 17.3.4).
Figure 15.22 Short prismatic crystals of arsenopyrite randomly distributed throughout a schist.
441
442
Some economic minerals, mainly from veins and pegmatites
15.13 Bauxite: a mixture of diaspore, gibbsite, and boehmite Occurrence: Bauxite is a mixture of hydrous aluminum oxides in varying proportions, and as such, it is not a mineral but a rock name. The three minerals are diaspore, α AlO(OH); gibbsite, Al(OH)3; and boehmite, γ AlO(OH). Diaspore and boehmite are two polymorphs of AlO(OH). Bauxite is the result of supergene enrichment under tropical to subtropical climatic conditions, by prolonged weathering and leaching of silica of aluminum-bearing rocks such as granites. The original feldspar and other minerals initially break down to form clay, commonly kaolinite, which, after silica removal, leaves behind the three insoluble Al hydroxides. Chemical composition and crystal structure: Because bauxite consists of a mixture of minerals it does not have a specific, or predictable, chemical composition. Most bauxites range between 40% and 60% weight percentage Al2O3, with the rest made up of clay minerals, iron hydroxides, silt, and some silica. State of aggregation: Commonly pisolitic in round concretionary grains (Fig. 15.23) but also massive, claylike. Physical properties: H = 1–3 (highly variable as a function of mineral content); G ∼2–2.5. Dull to earthy luster. Color white, gray, yellow brown, red. Distinguishing features: Best recognized by its pisolitic character. Uses: Bauxite is the ore from which aluminum metal is produced. Aluminum metal is remarkable because of its low density and resistance to corrosion. Structural components made from aluminum and aluminum alloys are extensively used in
the aerospace industry, in transportation, and building. Examples of use in transportation are aircraft, automobiles, railway cars, and bicycles. It is extensively used in packaging, such as in cans and aluminum foil. In construction, it appears as frames for windows and sliding doors and as aluminum siding for covering outer walls. It is also found in a wide range of cooking utensils. In the chemical industry, it is used to produce a large variety of Al-containing chemical compounds.
15.14 Fluorite: CaF2 Occurrence: Fluorite is common in hydrothermal mineral deposits in association with sulfides such as galena, sphalerite, and/or pyrite. Other associations are with calcite, dolomite, gypsum, barite, and quartz. It also occurs in granites and pegmatites, where it is a late crystallization product. It may be present in geodes. Chemical composition and crystal structure: The composition is generally close to CaF2. A perspective view of a ball-and-stick illustration of the crystal structure is shown in Figure 15.24. The Ca2+ ions are arranged at the corners and face centers of a cubic unit cell and the F– ions are at the centers of the eight small cubes into which the unit cell may be divided. Each Ca2+ is coordinated to eight F– ions at corners of a cube; the Ca2+ ions surround F– at the corners of a tetrahedron. Crystal form: Isometric; 4/m 3 2/m. Commonly in good cubic crystals (Fig. 15.25). Fluorite - CaF2 F 4/m 3 2/m a3
Ca2+ F
a2
a1
Figure 15.23 A sawed block of pisolitic bauxite.
Figure 15.24 Perspective view of the crystal structure of fluorite. A cubic unit cell is outlined with Ca2+ at the corners of the cube and at the centers of each of the cube faces. This results in an all-face centered unit cell, F.
15.15 Barite
Barite - BaSO4 P 21/n 21/m 2/a c Ba SO4
b
Figure 15.25 Euhedral, light-purplish cubes of fluorite with fine-grained encrustations (known as a drusy overgrowth) of milky quartz crystals.
Physical properties: H = 4; G = 3.2. Perfect octahedral {111} cleavage. Color varies widely from colorless to wine yellow, green, blue, and violet blue, but also white or gray. Vitreous luster. Distinguishing features: Distinguished by cubic crystals, perfect octahedral cleavage, vitreous luster, and commonly fine coloring. Its hardness of 4 allows it to be scratched by a knife. Uses: The commercial name for fluorite is fluorspar. It is the main source for the production of hydrofluoric acid, HF. It is used as a flux in the steel and ceramic industries, in iron foundries, and in the making of ferroalloys. Fluorides are also used in insecticides, preservatives, and antiseptics, and in fluoridating public water supplies. Fluorine is part of many compounds produced by the chemical industry.
15.15 Barite: BaSO4 Occurrence: Barite is a common mineral associated with many types of ore deposits, especially in hydrothermal veins that are mined principally for other minerals, such as sphalerite, galena, gold, silver, fluorite, and rare earth elements. The commercially most valuable deposits occur in sequences of sedimentary rocks in association with what are known as massive sulfide deposits. Chemical composition and crystal structure: Most barite is close to the composition of BaSO4, but a complete solid solution series extends to SrSO4, celestite. The crystal structure is given in Figure 15.26. The (SO4)2– groups are represented by the tetrahedra. The large Ba2+ ions, with a radius of 1.75 Å, are in 12-fold coordination with surrounding oxygens. Crystal form: Orthorhombic; 2/m 2/m 2/m. Crystals are commonly tabular on {001} and may be complex. May occur in divergent groups of tabular crystal forming crested barite or barite roses (Fig. 15.27).
a Figure 15.26 Perspective view of the crystal structure of barite. The yellow tetrahedra represent (SO4)2– groups. An orthorhombic unit cell is outlined.
Physical properties: H = 3–3½; G = 4.5 (heavy for a nonmetallic mineral). Perfect {001} cleavage. Vitreous luster. Color ranges from colorless to white to light shades of blue, yellow, or red. Distinguishing features: Recognized by its high specific gravity, tabular crystal habit, and excellent {001} cleavage. Uses: About 90% of the world’s production of barite is used in the petroleum industry as a major ingredient of the heavy fluid called drilling mud. This is a carefully formulated heavy suspension, commonly in water but may be in oil, used in rotary drilling of oil and gas wells. It commonly consists of clays, chemical additives, and barite. This mud is used to lubricate and cool the drill bit; to carry the rock cuttings up from the bottom; to prevent blowouts and cave-ins of friable or porous
Figure 15.27 An intergrowth of tabular barite crystals known as crested barite.
443
444
Some economic minerals, mainly from veins and pegmatites
rock formations; and for maintaining a hydrostatic pressure in the borehole. The remaining 10% of barite production is used in glass, and as a pigment, and in the manufacture of barium chemicals. Some of these chemicals are used in medicine, as in barium milk shakes or barium enemas for obtaining X-ray images of the intestinal tract.
15.16 Spodumene: LiAlSi2O6 Occurrence: Spodumene is a relatively rare mineral found mainly in lithium-bearing pegmatites, in which it may occur with quartz, albite, lepidolite, muscovite, and locally tourmaline. Chemical composition and crystal structure: The chemical composition of spodumene is generally close to that of the formula LiAlSi2O6, with some substitution of Na for Li. Spodumene is a monoclinic member of the common silicate group known as pyroxenes. As such, it is a clinopyroxene of which the structure is shown in Figure 7.23 with the typical single tetrahedral silicate chains parallel to the c axis and both Li and Al in 6-fold (octahedral) coordination with oxygen. Crystal form: Monoclinic; 2/m. Commonly in prismatic crystals with deep vertical striations. Physical properties: H = 6½–7; G ∼3.2. Perfect prismatic {110} cleavage with typical pyroxene cleavage angles close to 90° (actually, 87° and 93°). Color ranges from colorless to grayish white to pale pink, green, and yellow. A complex crystal of a lilac-colored, gem-quality spodumene is given in Figure 15.28. Distinguishing features: It has relatively high hardness compared with that of another pyroxene, diopside (with H = 5.6), and excellent {110} cleavage.
Uses: Lithium is used commercially in three different forms: as a lithium ore or concentrate, in the making of glass, ceramics, and porcelain enamel; as lithium metal in lithium-aluminum and lithium-magnesium alloys, in which it imparts high-temperature strength, and improves elasticity; and in lithium battery applications (see Section 16.5). It is used in the production of lithium-based grease for the lubrication of automotive and other industrial and military equipment. It is also used in various lithium compounds made by the chemical industry, in sanitation and bleaching products, and in pharmaceuticals. The pink, transparent variety of spodumene, named kunzite, is used as a gemstone (Fig. 15.28).
15.17 Lepidolite: K(Li, Al)2–3(AlSi3O10)(OH, F)2 Occurrence: Lepidolite is a relatively rare mineral found in pegmatites, together with another Li-bearing mineral, spodumene, and quartz, albite, microcline, and muscovite. Chemical composition and crystal structure: Chemical analyses show that there is a range of Al and Li contents in the octahedrally coordinated site. Lepidolite is a member of the layer silicate group known as micas. Its structure is similar to that of phlogopite (Fig. 7.31), with an octahedral sheet sandwiched between two opposing tetrahedral sheets forming a t-o-t layer. This layer is trioctahedral because all adjacent octahedral sites are occupied by Al3+ (see Sec. 7.17). Crystal form: May be monoclinic or hexagonal depending on the polytype. For the monoclinic form: 2/m. Crystals are platelike or in books with hexagonal outlines. Physical properties: H = 2½–4; G = 2.8. Perfect {001} cleavage. Color ranges from grayish white to pink and lilac (Fig. 15.29). Pearly luster. Distinguishing features: Characterized by the lilac to pink color and excellent micaceous cleavage. Uses: Same as those given for spodumene (Sec. 15.16).
15.18 Several gem minerals
Figure 15.28 A complex prismatic crystal of the lilac-colored gem variety of spodumene known as kunzite.
In prior sections (Secs. 15.1–15.17), we presented systematic treatments of several important ore and industrial minerals. Two of these, diamond and spodumene, are used as gems in addition to their industrial applications. Diamond is generally considered the most highly prized of gemstones, but pink spodumene, as kunzite, is a rarely used gem. Here, we provide brief discussions of some other selected minerals that are retrieved from the Earth mainly because of their aesthetic quality. A gem mineral becomes a gem only after careful cutting and polishing. The most valuable and desirable gems are rare and durable, as well as beautiful. Factors that contribute to beauty are color; luster; transparency; fire and brilliance. Most gems have several of these qualities, but in some, as in turquoise, color alone is the basis of its attractiveness.
15.18 Several gem minerals
Topaz Topaz is described in Section 13.25 because it is a mineral that results from the metamorphism of bauxite, but it is also found in volcanic and intrusive felsic rocks. Its composition is Al2SiO4(F, OH)2. The colors of topaz range from light blue to light pink, to yellowish orange brown (Fig. 15.30(B)). Trace amounts of iron and chromium are the coloring agents. Topaz is recovered from pegmatites and placer deposits. The state of Minas Gerais, Brazil, is the most important source. A highly prized yellow-orange to orange-brown variety known as imperial topaz is found near Ouro Prêto, Minas Gerais, Brazil. Topaz is the birthstone for November.
Tourmaline
Figure 15.29 A random intergrowth of books and plates of light pink to lilac lepidolite.
Because most gems are used as objects for personal adornment, they must resist abrasion and scratching so as not to lose the reflectivily and luster of their polished surfaces. This means that they must be hard, and the most desirable gems have a hardness of that of quartz (H = 7) or more. Other factors that affect the desirability of a gem are rarity and fashion. Some of the most prized gems such as emerald, ruby, and sapphire are also rare. Turquoise, however, is not so rare but depends much on the whims of fashion, as seen in the demand for silverturquoise jewelry that compliments the U.S. Southwestern cowboy look. Here follow brief descriptions of seven selected gem minerals.
Ruby and sapphire (gem varieties of corundum, AlsO3) Corundum is described in Section 13.26 because of its occurrence mainly in high-grade contact metamorphosed Al-rich rocks. Its most important industrial use, on account of its high hardness (H = 9), is as an abrasive, or as emery. Both red rubies and sapphires, of various colors, but most commonly blue (see Figs. 15.30(A) and 3.7 for an optical spectrum of blue sapphire), are recovered from sands and gravels, as well as soils where they have been preserved because of their hardness and chemical inertness. Famous sources of ruby are Burma (officially known as Myanmar), Thailand, and Sri Lanka. The most desirable blue sapphires come from Kashmir in the northwestern region of the Indian subcontinent. Ruby and sapphire are July and September birthstones, respectively.
Tourmaline was introduced in Section 7.21 because of its common occurrence in granite pegmatites. It has a complex chemical composition that allows for many elemental substitutions causing a wide range of colors. This has resulted in a number of varietal names used in the jewelry industry such as rubellite (for orange to pink and red), verdelite (for green to yellow green), and indicolite (for violet blue to greenish blue). The name watermelon is a term applied to tourmaline that is pink to red in the center and green on the edge (Fig. 15.30(C)). Tourmaline and opal are both birthstones for October.
Emerald, heliodor, and aquamarine (gem varieties of beryl, Be3Al2Si6O18) Beryl can be an accessory mineral in granitic rocks and it may be a major constituent of Be-rich pegmatites. The crystal structure of beryl is given in Figure 15.31 (see also Fig. 4.28). It is a ring (or cyclo) silicate with vertically stacked Si6O18 rings inside of which small amounts of H2O, (OH)–, F–, Cs+, and Na+ may be housed. It occurs frequently in hexagonal (6/m 2/m 2/m) prismatic crystals. H = 7½–8; G = 2.65–2.8. Common colors range from light bluish green to white or colorless. Emerald, the dark green and most highly prized gem variety of beryl (Fig. 15.30(D)), owes its color to trace amounts of Cr3+ in the crystal structure. The yellow color of golden beryl, the darker yellow of heliodor, and the blue of the aquamarine variety of beryl are due to trace amounts of Fe. The most famous emerald mines are Chivor and Muzo, Colombia. The main sources of aquamarine and other gemcolored varieties of beryl are from pegmatites in Brazil and Madagascar. Emerald and aquamarine are May and March birthstones, respectively. Beryl is the main source of the element Be, which is used extensively for its light weight, high strength, and high thermal conductivity, in a large number of industrial applications such as metal alloys and oxides. Figure 15.32(A) is an example of the use of a variety of colored gemstones that are available at very reasonable prices in a
445
446
Some economic minerals, mainly from veins and pegmatites (B)
(A)
(C)
(D)
Figure 15.30 (A) Ruby crystal in a white calcite matrix and a sapphire crystal showing tapering hexagonal pyramids. (B) Three crystals of topaz. A multifaceted crystal of blue topaz; a prismatic crystal of pink topaz; and a yellow-brown prismatic crystal. (C) Prismatic tourmaline crystals commonly have trigonal (3-fold) cross-sections, as seen in the slice cut across the length of a prismatic crystal. This slice is an example of watermelon tourmaline with a pink core and green margin. The central crystal is solid green, and the crystal on the right has a pink zone at the base. (D) A hexagonal prismatic crystal of golden beryl, and a dark-green prismatic crystal with a basal pinacoid of emerald in calcite.
modern design pendant. In addition to several of the gems discussed above, it contains two gem varieties of quartz (amethyst and citrine) as well as the gem variety of olivine known as peridot.
Opal The play of color that precious opal is so famous for was discussed in Section 3.3.1 together with the arrangement of large (∼3000 Å in diameter) amorphous spheres of composition SiO2·nH2O responsible for this unique phenomenon (Figs. 3.9 and 3.10). Precious opal includes material that displays play of color as well as transparent to translucent opal of a single color but without play of color (Fig. 15.32(B)). Common opal is generally milky white without internal reflections. Opal occurs in near-surface deposits resulting from precipitation from groundwater or low-temperature hydrothermal
solutions. It occurs as fillings and linings of cavities in the host rocks. The largest source of precious opal is Australia, but some important locations occur in Mexico as well. Opal is the October birthstone.
Jade The gem name jade includes two distinct and unrelated species, jadeite and nephrite. Jadeite is discussed here and is a member of the pyroxene group with the chemical formula NaAlSi2O6. Nephrite is a member of the amphibole group. The crystal structure of jadeite is very similar to that of the clinopyroxene diopside, CaMgSi2O6, shown in Figure 7.23 and discussed in Section 13.7. The Na+ in jadeite is housed in the same atomic location as Ca2+ in diopside, and Al3+ is housed in the same site as Mg2+. Jadeite is a metamorphic mineral formed in terrains that have undergone
15.18 Several gem minerals
Beryl - Be3Al2Si6O18 P 6/m 2/c 2/c c
(A)
a2
a1 Be2+
Al3+
(inside vertical – H2O,Na+,Cs+ hexagonal channels)
(B)
Figure 15.31 Perspective view of a polyhedral image of the crystal structure of beryl. A primitive hexagonal unit cell is outlined.
high pressures but relatively low temperatures (Fig. 14.9). It has a H = 6½–7 and is extremely tough and difficult to break. Its primary occurrence is in nodular and rounded masses in serpentine. It is mined from alluvial deposits, where it occurs as boulders in rivers (Fig. 15.32(C)). The most prized jadeite comes from Burma (Myanmar). A vivid green, transparent to translucent variety is most valued. It is used both in carvings and in jewelry.
(C)
Turquoise The chemical formula of turquoise is CuAl6(PO4) (OH)8•5H2O in which considerable Fe2+ may substitute for Cu. Turquoise with a strong sky-blue (Fig. 15.32(D)), bluish-green, to apple-green color is easily recognized by its color and is most commonly used as a gem. It is a secondary mineral, generally formed in arid regions by the interaction of surface waters with high-alumina igneous or sedimentary rocks. It occurs most commonly as small strings or veins traversing more or less decomposed volcanic rocks (Fig. 15.32(D)). Since antiquity, fine-quality material with a vivid, evenly colored medium blue color, known as Persian turquoise, has originated from near Nishapur in the province of Khorasan, Iran (Persia). In the United States, localities in Arizona and Nevada produce high-quality material. Although turquoise can be used in any type of jewelry, it is probably best known in the United States because of the distinctive silverturquoise designs produced by Native Americans. Turquoise, together with zircon and tanzanite (a gem variety of clinozoisite), are December birthstones.
(D) Figure 15.32 (A) A contemporary pendant designed by Horst Lang, IdarOberstein, Germany. It consists of two pink tourmalines, two blue topaz, one golden beryl, one amethyst (purple variety of quartz; Sec. 7.7), one citrine (yellow-brown variety of quartz), and two green peridots (the gem variety of olivine; Sec. 7.19). (B) Two types of precious opal. On the left, a fire opal with an orange body color; on the right, a black opal with play-of-color and a dark body color. (C) An irregular boulder of jade with a grayish weathering surface. The sawed and polished cut shows the dark-green color of the gem material. (D) Turquoise in small veins traversing rock matrix.
447
448
Some economic minerals, mainly from veins and pegmatites
Summary This chapter introduced 17 ore and industrial minerals that did not fit our earlier classification of minerals being of igneous, sedimentary, or metamorphic origin. These minerals are prevalent in either hydrothermal vein deposits or pegmatites.
• Native gold is the prime ore mineral in the production of gold, although some gold is recovered from gold tellurides, such as AuTe2, calaverite. • Native silver is an ore of silver although most of the world’s supply is derived from Ag sulfides and arsenides. • Native copper is only a minor ore of copper, with Cu sulfides being the principal Cu ore. • Diamond is used as an industrial mineral and is the most highly prized gemstone. • Native sulfur is mined mainly for use in the chemical industry for the manufacture of sulfuric acid, H2SO4. After these five native elements, we discussed six sulfides that are the main ore minerals of lead, zinc, copper, molybdenum, and arsenic:
• Lead and zinc mineralization occurs commonly together because of the association of galena and sphalerite (see chapter-opening photograph). • Major copper ore minerals are bornite; chalcopyrite (introduced in Sec. 7.32); and chalcocite, in common association with pyrite, marcasite, and pyrrhotite in hydrothermal vein deposits (see Fig. 15.14).
• Pyrite was introduced in Section 7.30, pyrrhotite in Section 7.31, and marcasite was discussed here. These three iron sulfides are commonly closely associated with the copper sulfides but are not mined for their iron content.
• The last mineral in this group is arsenopyrite, an ore of arsenic. This was followed by the discussion of five important industrial minerals: bauxite, fluorite, barite, spodumene, and lepidolite:
• Bauxite, a mixture of three aluminum hydroxides, is the major Al ore worldwide. • Fluorite, commonly found in vein deposits associated with sulfides, is the major source of fluorine used in the chemical industry to produce hydrofluoric acid, HF.
• Barite is used mainly as an additive to make heavy mud for oil- and gas-well drilling, to support drill rods and to prevent the blowing out of gas.
• Spodumene and lepidolite are both industrial minerals that are mined for their Li content. Lithium is a component of lithium batteries and is used in a range of electronic devices. With the development of electric cars that run on lithium batteries, Li mining can be expected to increase (see Sec.16.5). The last seven minerals are gem minerals, which in most instances are the gem-quality equivalents of rock-forming minerals, most of which were discussed in prior chapters:
• Ruby and sapphire are the gem varieties of corundum (Sec. 13.26). • Topaz is a well-known gem but also occurs as a metamorphic rock-forming mineral (Sec. 13.25). • Tourmaline is an accessory mineral in granite, granodiorite, and other felsic rocks but occurs in various gem varieties mainly in pegmatites (Sec. 7.21).
• Beryl was not described in prior chapters but is fairly common as an accessory in granitic rocks and Be-rich pegmatites. Gem varieties of this ring silicate include emerald, aquamarine, golden beryl, and heliodor.
• Opal is classified as either common opal or precious opal. Common opal is generally milky white in color without internal reflections. Precious opal has a brilliant internal play of color or an intense orange to red body color. The origin of play of color in opal was discussed in Section 3.3.1.
• Jade, a tough and hard-to-break gem variety of jadeite, a member of the pyroxene group of silicates, is used extensively in carved oriental ornaments.
• Turquoise, a hydrous copper-aluminum phosphate is a blue to blue-green gem that originates from Iran (Persia) as well as Arizona and Nevada in the U.S. Southwest, where it is most commonly seen in Native American jewelry designs set in sterling silver. In Europe, Persian turquoise is commonly set in gold.
Review questions
Review questions 1. Which five chemical elements are found in the native state, namely as native elements? 2. Three of the native elements are referred to as native metals. These have unusual physical properties. What are these, and
what type of chemical bond do these properties reflect? 3. Diamond is one of the above five native elements. What is its hardness and what is the bonding type that causes the
hardness? 4. The space group of diamond is F41/d 3 2/m. What is the equivalent point group (crystal class)? 5. What is the meaning of F in this notation? Explain the arrangement of the carbon atoms. 6. What do 41 and d, respectively, represent? 7. What are the two main uses of diamond? 8. What are the two main ore minerals for lead and zinc? Give their names and formulas. 9. What are the two copper sulfides described in this chapter? Give their names and formulas. 10. What is an additional copper sulfide that was described earlier in Chapter 7 among igneous minerals? Give its name and
formula. 11. The foregoing three Cu-Fe sulfides commonly occur together in hydrothermal vein deposits. What is meant by the phrase
“of hydrothermal origin”? 12. We described two additional metallic, gray minerals. One is a sulfide and the other a sulf-arsenide. Give their names and
formulas. 13. What is the name of the Earth material that is the main source of aluminum? Explain its makeup with names and formulas. 14. Give the chemical formula for fluorite and describe its most common crystal habit. 15. Which mineral is the main source of barium? Give its name and formula. 16. What is barite most commonly used for? 17. We described two lithium silicates. Give their names. 18. For what application will lithium be in great demand in the near future? 19. Give the names of three gem minerals that are commonly green? 20. Ruby and sapphire are gem varieties of which relatively common oxide? Give its name and formula. 21. Emerald is a highly prized variety of which rock-forming mineral? Give its name and formula. 22. Which rock-forming mineral, in its gem varieties, displays a very wide range of colors? 23. Precious opal is commonly referred to as amorphous in the literature. This is not really correct. Explain why with reference
to its internal architecture.
FURTHER READING Please refer to the works listed at the end of Chapter 7 as well as the following: Gems (2009). Elements 5, 3, 147–180.
Gold (2009). Elements 5, 5, 277–313. Diamonds (2005). Elements 1, 2, 73–108. London, D. (2008). Pegmatites, Special Pub. 10, Mineralogical Society of Canada, Quebec City, Canada Schumann, W. (2009). Gemstones of the World, 4th ed., Sterling Publishing, New York.
449
CHAPTER
16
Some selected Earth materials resources
In four prior chapters that deal with systematic aspects of minerals (Chapters 7, 10, 13, and 15) each discussion begins with occurrence and ends with uses. The paragraphs on occurrence dealt mainly with the types of rocks in which a specific mineral occurs most commonly, and under uses we listed some of the most important applications of that same mineral. Here, we give a few brief descriptions of some mineral and ore deposits that are the source of rocks, minerals, and chemical elements commonly used in everyday life. A mineral deposit is a concentration of minerals that was formed by geologic processes. An ore deposit is a geologic occurrence of minerals (and chemical elements) from which minerals (or elements) of economic value can be extracted at a reasonable profit. Our most basic essential resources are water and soil. It is instructive to assess what materials you are surrounded by in your own house that are the result of mining of Earth materials and their subsequent transformation into metals (or alloys and other materials) used in the house. The house’s foundation, or basement, is probably poured concrete, which consists of an aggregate of sand and gravel in Portland cement. Steel beams that support the structure are derived from iron ore, which consists mainly of hematite, magnetite, and/or goethite. The brick, drain pipes, and roof tiles are made from common kaolinitic clays and shales. The ceramic products such as bathroom toilets, sinks, and wall tiles are made from essentially pure white kaolin clays. So is the chinaware in the kitchen cabinets. The stainless steel cooking pots and utensils, as well as kitchen and bathroom fixtures, are made of various metal alloys, and much of the plumbing and all electrical wiring is made of copper. There may be aluminum frames around windows, the glass of which is the product of the high-temperature melting in furnaces of pure quartz sands. The kitchen and bathroom counters may be fitted with dimension stone, such as granite or marble. Even the gems and gold used for adornment are extracted from the Earth. The fertilizer used in the yard, consisting of various ratios of P2O5, K2O,
Examples of earthenware in which members of the clay mineral group (also known as kaolin, and including the mineral kaolinite) are major components. From top left in a clockwise direction: a pot by Wendell Kowemy, Laguna Pueblo, New Mexico; a dinner plate from Fez, Morocco; a black pottery jar by Maria Martinez (1887–1980), San Ildefonso Pueblo, New Mexico; and a small terrine in a classic Wedgwood design, United Kingdom. For further discussion, see Box 16.1. (David Nufer Photography, Albuquerque, New Mexico.)
452
Some selected Earth materials resources
and S, is extracted from apatite, silvite, and native sulfur, respectively. The house may be heated with a furnace that runs on natural gas, and the electricity is probably supplied by a coal-fired or nuclear power plant. The car in the garage probably runs on gasoline, which is refined from crude oil. A barrel of crude oil (42 gallons) makes about 19.5 gallons of gasoline, in addition to numerous other products such as heating oil, plastics, and fertilizer. Most of these examples illustrate the intensive use of what are called nonrenewable resources. These are natural resources that cannot be produced, grown, generated, or used on a scale that sustains their consumption rate. Timber, when harvested sustainably, or metals, when recycled, are considered renewable resources.
In this chapter, we provide short discussions of some selected major Earth material resources that are used in our everyday existence. The construction industry is the biggest user by far of sand and gravel, together with cement, dimension stone, and common clay. Sand and gravel is mined in every country in the world. Steel is a major component in high-rise construction, ships, cars, bridges, appliances, and armaments. Energy supplies cannot be effective without pipelines, furnaces, and engines, which are usually made of steel. The original source of the iron used in steel making is found in iron-ore deposits, which are the iron-enriched products of sedimentary iron-formations. Iron deposits occur in most countries but large to very large iron deposits are restricted in number. Clay minerals are hydrous aluminum silicates with layered structures that occur with a grain size of 20:1, with chrysotile fibers reaching 10 000:1. Amosite is the asbestiform variety of cummingtonitegrunerite, (Fe, Mg)7Si8O22(OH)2 (Sec. 13.9). Anthophyllite, Mg7Si8O2(OH)2 (Sec. 13.8), and tremolite-actinolite, Ca2(Mg, Fe)5Si8O22(OH)2 (Sec. 13.10) are major rock-forming silicates with a slender prismatic habit or, more rarely, a fibrous habit. Amosite (also known as brown asbestos in the trade) was commercially produced from 1914 until 1992 in the region of Penge in Limpopo, South Africa; anthophyllite and tremoliteactinolite, as well as chrysotile asbestos, made only small contributions to the South African asbestos industry. The major
17.3 Carcinogenic and chemical hazards posed by Earth materials
mining regions for crocidolite (also known as blue asbestos) were in the Wittenoom area of the Hamersley Range of Western Australia and the Kuruman region of the Northern Cape Province of South Africa. Both of these mining districts are associated with Precambrian banded iron-formation (Secs. 11.4 and 12.7). Amosite occurs in amphibolite facies rocks, and crocidolite is of low-grade metamorphic origin. Mining of crocidolite was stopped in 1966 in Western Australia and in 1995 in South Africa. The main mining regions for chrysotile are in the Thetford Mines area of the eastern townships of the province of Quebec, Canada, and in the central and southern Urals of Russia. Chrysotile occurs as hydrothermal alteration of ultramafic rocks, such as dunite, in veins and mats of fibers replacing serpentine host rock (Fig. 13.28). Approximately 95% of asbestos that was produced commercially is chrysotile, also known in the trade as white asbestos. About 5% or less was made up of crocidolite (blue asbestos). In the legal and regulatory definition of asbestos given already, a layer silicate (chrysotile) and five chain silicates (amphibole species) are grouped together. This grouping causes a serious fundamental problem. Chrysotile is a hydrous magnesium silicate with the roll structure of a drinking straw (Figs. 2.4(B)–(D) and 13.27), whereas the five amphiboles have very different and more variable chemical compositions and a totally different crystal structure (Fig. 7.27). These basic chemical and structural differences result in very different toxicologies. A pertinent example of the different behaviors of chrysotile and crocidolite is provided by experimental studies of biopersistence, which defines the time of residence of a particulate material in the body. Chrysotile fibers that are introduced into solutions that replicate those of the biological environment of the lung, dissolve completely in about 9 (±4.5) months, whereas crocidolite fibers may persist for more than several years, releasing Fe to the lung during this time. This biopersistence is much longer than that estimated for chrysotile fibers and is consistent with the lifetimes of these two very different minerals observed in asbestos lung-burden studies. Why did asbestos become such a contentious and overly expensive problem? Let us begin with some examples of the earlier wide range of applications of asbestos commercially. Long fibers of chrysotile asbestos can be woven into cloth that resists heat and corrosion as in fireproof suits, asbestos gloves used in high-temperature experiments (Fig. 2.4(E)), and theater curtains. Short fibers are used to increase tensile strength in cement pipe for transporting water in municipal waterworks, asphalt shingles, automotive brake linings, electrical insulation materials, in wall and ceiling coatings, as filler in vinyl and asphalt floor tile, in joint cements, roof coatings, plastics, and caulking compounds. Both chrysotile and crocidolite were extensively used as insulating materials for the steel structures inside high-rise buildings and inside navy vessels, as a protection against the heat generated by fires. This insulation consisted
of a mix of asbestos fiber and a cementlike binder that was sprayed onto the steel structural elements. Amosite was used in loosely compacted mats as a covering for steam locomotives, jet engines, and marine turbines. Long-fiber crocidolite was used mainly in asbestos cement pipe, in acid-resistant packings and gaskets, and to cover steam boilers and pipes. During World War II, it was used extensively in navy shipyards in Britain to fireproof the inside of naval vessels. Although federal policy in the United States does not differentiate the various asbestos types (as noted earlier), medical studies on the pathogenicity of the different types of asbestos show that crocidolite (blue asbestos) poses much greater health hazards in occupational settings (e.g., asbestos mining, the manufacture of asbestos-containing products) than chrysotile. Nonoccupational exposure to chrysotile asbestos has not been shown by epidemiological studies to be a significant health hazard. Occupational exposure to asbestos can cause the following types of disorders: asbestosis a respiratory disease brought on by the inhaling of asbestos fibers causing scar tissue inside the lung, lung cancer, malignant mesothelioma, an uncommon cancerous tumor of the lining of the lung, chest cavity, or lining of the abdomen that results typically from long-term as well as short-term asbestos exposure, benign changes in the pleura, Crocidolite fibers, as well as other fibrous amphiboles, appear to be the most pathogenic, especially with respect to mesothelioma. Smoking is a strong contributor to the incidence of the above diseases, especially lung cancer. Although asbestos has caused disease in occupational settings (in the workplace), one must consider the following three questions: 1. What was (or still is) the main type of asbestos in U.S.
buildings? 2. Does airborne asbestos dust present in schools and other
buildings present a risk to the occupants? 3. What does the natural ambient air (from outside the
building) contribute to the fiber count inside a building? The answer to question 1 is simple. The asbestos fiber found in buildings is about 95% chrysotile. The answer to question 2 is also simple. Available data do not support the concept that low-level (nonoccupational) exposure to chrysotile asbestos is a health hazard in buildings and schools. The answer to question 3 is that natural erosional processes contribute background concentrations of fibers to the global air mass. Abelson (1990) stated: “We live on a planet on which there is an abundance of serpentine – and amphibole-containing
475
476
Earth materials and human health
rocks. Natural processes have been releasing fibers (mainly chrysotile) throughout Earth history. We breathe about 1 million fibers per year” (see also Klein 1993). The U.S. government decision to ban asbestos is not simple, but misunderstanding how very different chrysotile is from amphibole asbestos and the public’s fear of asbestos (“one fiber kills”) generated an explosive growth in asbestos identification and removal companies over the past 30 years. During that same period, there has been a total reduction in asbestos mining (at least in the United States) and in the production of asbestos-containing products. Chrysotile mining, from very large open pits, continues in the eastern townships of Quebec, Canada, in the vicinity of two mining towns, named Thetford Mines and Asbestos. The chrysotile mine in Thetford Mines is almost exhausted, and the Jeffrey open-pit mine in Asbestos has been operating only sporadically over the past few years. Asbestos litigation in the United States has been enormously expensive, with about 35% of the total cost having gone to plaintiffs and the rest going to legal costs. Such litigation is ongoing, and the future of asbestos-related products is extremely uncertain.
17.3.3 Silica minerals In Section 7.7, we discussed quartz, SiO2, and four polymorphs, tridymite, cristobalite, coesite, and stishovite. Of these, quartz is the second most common mineral after feldspar in the Earth’s crust (Fig. 7.1). Quartz is a major constituent of many rock types and may constitute 100% of many beach sands. In some occupational settings, such as the mining of granite, and in the use of quartz powder in sandblasting, workers are exposed to large quantities of respirable quartz dust. The main disease related to long-term (occupational) exposure to quartz dust is silicosis, a progressive lung disease characterized by the development of fibrotic (scar) tissue. Some lung cancer cases also appear to have been associated with exposure to quartz dust. In 1987, the International Agency for Research on Cancer (IARC) declared quartz a carcinogen on the basis of some animal experiments in which rats, mice, and hamsters were exposed to intense airborne quartz dust. The results of these experiments were highly inconsistent, and there is always the fundamental question of how well such animal studies relate to human beings. As a result of the IARC decision, the U.S. Occupational Safety and Health Administration (OSHA) requires that any U.S. product with more than 0.1% “free silica” display a warning label. For example, bags of sand bought at a construction supply or hardware store for use in a children’s sandbox or in cement mix may have the following label: “This product may contain silica. Silica dust if inhaled may cause respiratory or other health problems.
Prolonged inhalation may cause delayed lung injury, including silicosis and possibly cancer.” Ross et al. (1993) review the epidemiology of workers employed in the mining industry since 1950 and in sandblasting. These high-dust occupational settings can clearly lead to silicosis. However, they found no evidence for malignant chronic disease, such as silicosis, and no justification for the prediction of cancer risk due to nonoccupational (ambient) silica dust exposure. There is no evidence of excess mortality among humans who live long-term near quartz-rich beaches or in the desert regions of Arizona, Nevada, California, New Mexico, and Mexico, which commonly have fierce dust storms. The declaration of quartz as a carcinogen is confusing and alarming to the public at large.
17.3.4 Arsenic, an example of a chemically hazardous Earth material A number of elements, such as arsenic, selenium, mercury, lead, manganese, chromium, and copper, can occur in soils or groundwater at concentrations that are high enough to cause health problems. Hazardous concentrations of these elements often result from human activities, such as mining and various industrial processes, but in other cases they can be natural in origin. As an example of a natural occurring problem, we discuss arsenic poisoning in Southeast Asia, which the World Health Organization has declared “the greatest mass poisoning in human history.” Much of the material in this discussion is from the 2006 issue of Elements (vol. 2, no. 2) referred to in “Further Reading” at the end of this chapter, and interested readers should refer to that material for further details. Arsenic in the general environment
Arsenic is one of the most poisonous elements known, and ingestion of no more than 100 mg of colorless and odorless As2O3 is lethal. At concentrations well below the lethal dosage, arsenic still poses serious health threats. Long-term exposure to ingestion or inhalation of low doses can result in lesions on the hands and feet (black-foot disease – gangrene); cirrhosis of the liver; heart muscle degeneration leading to cardiac arrest; and cancer of the bladder, kidney, lung, and skin. Arsenic can occur naturally as a native element, but this is rare. Instead, most occurs as sulfides, sulfarsenides, and arsenides, combined with other elements such as iron, as in arsenopyrite (Sec. 15.12). These minerals occur along with other sulfides in many hydrothermal vein deposits (Sec. 16.4). Because of its position in the periodic table (see inside front cover of the book), arsenic has five different valence states, which allows it to have a wide range of properties in the environment. In groundwater, arsenic can be present under reducing
17.3 Carcinogenic and chemical hazards posed by Earth materials
conditions as arsenide, H3As3+O3, and under oxidizing conditions as arsenate, H3As5+O4. Under oxidizing conditions, the soluble arsenate bonds strongly with Fe3+(OH)3, and as a result, ferric hydroxide is commonly used to remove arsenic in drinking water remediation schemes. Given its toxicity, arsenic has been used widely in agriculture as an insecticide, pesticide, and weed killer. Large quantities have been used in preserving pressure-treated lumber. This treatment makes use of chromated copper arsenate (CCA), which gives the preserved wood a greenish color. It is also used in chemotherapy for treatment of some types of cancer. In addition to arsenic’s toxic uses, it has application in small quantities as an additive to change the physical properties of some materials. Since antiquity, it has been used to harden bronze, an otherwise soft metal. For the same reason, arsenic is used to strengthen the lead in car batteries. It is used as a doping agent in many solid-state electronic devices and is used to clarify glass. As knowledge of the toxicity of low dosages of arsenic has grown, health organizations have warned of impending health crises, and governments have passed legislation controlling its use. For example, CCA pressure-treated lumber can no longer be used for residential construction in North America and Europe, but many other countries still use it. Even where it is banned, old CCA-treated wood can cause problems if, for example, it is burned. The amount of arsenic used in agriculture has also been dramatically reduced. In the United States, in 2002, the EPA reduced the permissible level of arsenic in public drinking water from 0.05 to 0.01 mg/l (milligrams per liter) or 10 parts per billion (ppb), which is three orders of magnitude less than is common in most rocks. Arsenic in groundwater in Southeast Asia
In some parts of the world, concentrations of arsenic in groundwater are so high as to cause major public health problems, and nowhere is this problem more serious than in Southeast Asia. In Bangladesh alone, 60 million people are exposed to drinking water with high arsenic contents. The most seriously affected areas are the deltas of the Ganges, Mekong, and Red rivers, where there has been a rapid influx of new sediment from the young Himalayan Mountains. The rocks in the source region are not unusually rich in arsenic, and much of the arsenic formed from weathering of primary minerals is adsorbed in ferric hydroxide coatings on sedimentary grains. However, in the deltas, rapid sedimentation traps large amounts of organic material along with the sand grains (see discussion of the origin of coal in Sec. 11.3.2), and this produces anoxic conditions. When the ferric hydroxide coating on sand grains is reduced, it goes into solution and releases adsorbed arsenic. Although the arsenic in these deltas is not a result of industrial pollution, the hazardous conditions have, strangely enough, developed as a result of endeavors to improve people’s health. Much of the drinking water in these regions previously
came from hand-dug wells and ponds that were shared with cattle and were full of pathogens, which caused an enormous number of deaths from cholera and diarrhea. During the 1960s and 1970s, governments and international agencies funded the drilling of shallow wells from which clean, bacteria-free groundwater could be extracted. These wells, unfortunately, tapped more reducing groundwater at depth where arsenic is more soluble. Precisely how the arsenic gets into the groundwater is the subject of much current research. Arsenic can be removed from water supplies, but at a cost. The EPA Web site given at the end of this chapter provides information about the processes and costs. Commonly, the arsenic is removed by being adsorbed onto activated alumina, iron or manganese hydroxides, or anion exchange resins. Glauconitic sands (Sec. 12.6) can also be used, and recent research indicates that bottom ash from coal-fired power plants is effective and available at a fraction of the cost of the other arsenic scavengers. Water softening to remove calcium and magnesium also removes arsenic. These methods remove As5+ more effectively than As3+, so water needs to be oxidized before treatment. Although cities can remediate their water supplies, small villages and farms may find the cost prohibitive, especially because some of the countries affected by arsenic poisoning are among the poorest.
17.3.5 Health hazards due to radioactivity Radon gas
Radioactive elements are normally very minor constituents of rocks and consequently do not pose hazards to most people. For example, the average continental crust contains only 1.55 ppm uranium. Granite, however, contains on average 4.7 ppm uranium, and some black shales and coal deposits can contain as much as 100 ppm uranium. Uranium miners, of course, are exposed to greater risks, especially because of the accumulation in the mine of dense radon gas, one of the daughter products of uranium decay. Inhalation of this gas gave these miners an exceptionally high incidence of lung cancer until regulations forced mines to install adequate ventilation, and then the incidence of lung cancer attributed to mining dropped to the same level as in the general population. Radon (222Rn) is considered the second leading cause of lung cancer after smoking, and it is the number one natural cause of lung cancer. It is an extremely dense inert gas that can accumulate in the basement of poorly ventilated houses. Based on the early studies of the exposure of uranium miners to radon gas, the U.S. EPA considers levels of radon gas in a house above 4.0 picocuries per liter to be hazardous; this limit is based on a 70year residence time with 75% of the time spent indoors. Tests for radon can be performed inexpensively, and problems can be solved with appropriate ventilation. The amount of radon escaping from the ground depends on the uranium content of
477
478
Earth materials and human health
underlying rocks. Some granites, for example, have high uranium contents, and among sedimentary rocks black shale and coal are high radon producers. Many hot springs have high concentrations of radon gas. It is ironic that many hot springs in Europe, around which huge health spas have developed, contain extremely high levels of radon. Maps showing the potential hazard from radon are commonly available. In the United States, for example, the EPA has a map showing the radon risk across the country, and individual states have detailed radon maps. The risk from radon can be extremely local, depending on fractures in the bedrock and even within a single dwelling can vary from one room to another depending on air circulation. Inexpensive testing is really the only way to be certain that radon does not pose a hazard. Radioactive waste disposal from nuclear power plants
Nuclear power plants, while providing electrical power, pose numerous health hazards because of the highly radioactive nature of the fuel they use. In 1979, a major accident occurred in the reactor at Three Mile Island near Harrisburg, Pennsylvania. Fortunately, the problem was confined to the reactor, and no one was injured. However, in 1986, two explosions at the Chernobyl nuclear power plant in the Ukraine sent radioactive material over large parts of Eastern Europe and Russia and were blamed for many deaths due to cancer. In 2011, a tsunami (see Sec. 17.5) generated by an offshore magnitude-9.0 earthquake destroyed the nuclear reactor at Fukushima, Japan, causing considerable release of radioactive material. These have been the only serious accidents, but all nuclear power plants generate high-level radioactive waste, which, to date, no one has successfully devised a method of getting rid of. At present, most nuclear waste is stored at the power plant where it is generated, where it awaits a solution to the problem of its longterm storage. After 5% of a nuclear fuel rod has reacted, it can no longer be used because of the buildup of fission products. It, therefore, becomes high-level radioactive waste, which remains dangerously radioactive for thousands of years. In France, Britain, and Russia, spent nuclear fuel (SNF) is reprocessed to make new fuel rods, which reduces the amount of radioactive waste, but the amount of high-level nuclear waste still remains large. The United States is opposed to this reprocessing, because it believes that the waste could be used to create nuclear weapons. Whether the SNF is recycled or disposed of directly, the waste must eventually be buried in a permanent repository. In what form should the waste be sequestered and where it should be buried are two of the most important questions being investigated at present. Long-term storage of SNF is an engineering problem that requires geological input and knowledge of Earth materials. How minerals behave in the presence of radioactive material and how tight a seal entombing rocks can provide against circulat-
ing groundwater are important factors in designing a successful long-term repository. In addition, the use of nuclear power requires the mining of uranium, which presents its own special environmental problems, which again requires knowledge of Earth materials. The storage of SNF presents a far more serious problem than the hazards associated with mining, because of the much higher level of radiation from the extremely radioactive fission products in the SNF. Several hundred thousand years are required for the radiation from SNF to decay to the level in the uranium ore used to make the fuel. Predicting what will happen to SNF over thousands of years is a complex problem because of the ever-changing nature of the material as a result of radioactive decay, changes in its chemical stability with respect to groundwater, and changes in its mobility both through diffusion and transport in groundwater. The main component of SNF is UO2, which is unstable under oxidizing conditions, reacting to form U6+ minerals and releasing fission products into the environment. Reducing conditions are, therefore, preferred in long-term storage sites. High-level radioactive liquid waste from reprocessing of SNF has been immobilized by dissolving it in molten borosilicate liquids that solidify to form glass, which is essentially insoluble in groundwater. The glass does crack during cooling, which increases the surface area from which radioactive elements could be leached. Research is also being done to immobilize these elements in ceramics that contain such minerals as perovskite, CaTiO3, which is known to remain stable and be insoluble in groundwater for geologically long periods of time despite high contents of radioactive elements. These ceramics may prove more stable than glasses for long-term storage of waste products. High-level radioactive waste eventually needs a repository for long-term storage. Several of these sites have been proposed and are undergoing testing. In Finland, a repository is being built 500 m beneath the granite island of Olkiluoto in the Gulf of Bothnia. In the United States, considerable research was done in evaluating Yucca Mountain, Nevada, as a possible nuclear waste repository, but funding for the project was terminated in 2010. Currently, the United States has no long-term storage site for SNF, although several localities are being considered. Predicting how material will behave and how geological conditions may change at any given site over the next 10 000 years, which is the regulatory compliance period, is presenting Earth scientists with a major challenge. Until satisfactory answers are given to these questions, radioactive waste continues to accumulate on the Earth’s surface.
17.3.6 Carbon sequestration to mitigate climate change Although CO2 in the atmosphere is not directly hazardous to human health, the burning of fossil fuels is increasing its atmospheric concentration, which is generally accepted as
17.4 Hazards from volcanic eruptions
Parts per million CO2
380
17.4 Hazards from volcanic eruptions
Scripps Institution of Oceanography NOAA Earth System Research Laboratory
360
340
320 1960
1970
1980
1990
2000
2010
Figure 17.4 Monthly mean atmospheric CO2 content at the Mauna Loa Observatory, Hawaii. The black curve is the corrected seasonal average. (Graph courtesy of NOAA.)
contributing to global warming. Measurements over the past half century at the National Oceanic and Atmospheric Administration’s (NOAA) observatory on Mauna Loa, Hawaii, indicate a steady increase in the atmosphere’s CO2 content (Fig. 17.4). Although CO2 has natural sinks, these are currently unable to cope with the quantity of CO2 being released. As a result, major efforts are being made to use more efficient vehicles and to have cleaner-burning fossil fuel power plants. In addition, considerable research is being done to find ways in which CO2 could be removed from the atmosphere and stored in the Earth, a process known as carbon sequestration. These sequestration schemes require an extensive knowledge of the behavior of Earth materials and of Earth systems. Geological carbon sequestration involves taking CO2 released from fossil fuel-burning power plants or captured from the air, and pumping it into the ground, where it can be trapped either in the same way that natural gas is trapped beneath impervious layers of shale (Sec. 12.4 and Fig. 12.36), dissolved in formations containing dense saline water, or reacted with primary igneous minerals to create carbonates. This latter process mimics the weathering of igneous rocks (Sec. 11.2.1), with magnesium in ferromagnesian minerals reacting with CO2 to produce magnesite, MgCO3 (Eq. 11.2), and calcium in plagioclase reacting to form calcite. Another proposal is to pump CO2 deep into the ocean, where it would dissolve in the ocean water. At depths below 3000 m in the ocean, CO2 forms a liquid that is denser than seawater, so it would sink to the bottom where it could react with water to form solid CO2 hydrates. The study of these various techniques is in its infancy, but with the continued burning of fossil fuels, we can expect interest in them to grow. The Web site provided at the end of this chapter will lead interested readers to efforts of the U.S. Geological Survey in this field.
Nine percent of the world’s population lives within 100 km of an active volcano and is at risk of being affected directly by an eruption. The deleterious effects of volcanoes, however, can extend far beyond the local environment and can even be global, depending on the magnitude and style of the eruption. When this particular paragraph was being written in April 2010, the eruption of the Eyjafjallajökull volcano in Iceland had emitted so much ash that airports across most of Europe were forced to close, resulting in 17 000 flight cancellations in a single day. Although this was a relatively minor eruption, it illustrates how widespread the effects of an eruption can be. Volcanoes are not equally hazardous, because of differences in eruptive style, which depends largely on magma viscosity (Sec. 9.2.3). The more viscous a magma the more hazardous is the volcano, because of the increased probability of explosive eruptions. Habitations near volcanoes can be slowly engulfed by lava (Fig. 17.5(A)) or buried rapidly by ash falls or ash flows. Lava flows slowly enough that people can escape from it, but this is not possible with ash flows, which can have velocities as high as 100 m/s. Inhalation of sharp particles of pumice causes death through laceration of the throat and lungs (Fig. 17.5(B)). Volcanic gases are also noxious. For example, in 1986, CO2 that had slowly accumulated in the bottom of crater Lake Nyos in Cameroon suddenly escaped as a result of a density inversion in the lake and killed 1700 people and 8000 animals in the immediate surroundings. Volcanic gases also kill vegetation and crops, which can lead to starvation. Sulfur dioxide ejected into the stratosphere (>10 km) combines with water to form frozen aerosol droplets (0.1–1 µm) of sulfuric acid that backscatter and absorb incoming solar radiation, which results in global cooling. Finally, lahars (mud slides; Sec. 9.2.3) descending the slopes of volcanoes are one of the greatest causes of volcanorelated deaths. The effects of all these hazards are magnified by the fact that soils surrounding volcanoes are fertile and form prime agricultural land, which explains why such a large fraction of the world’s population lives near volcanoes. We have clear historic evidence that volcanic eruptions can have global effects. El Chichón volcano in southern Mexico is unusual in that it erupts extremely sulfur-rich magma, which is able to crystallize anhydrite, CaSO4, a mineral that normally forms in evaporite deposits (Sec. 11.4). The SO2 released during the eruptions produces sulfuric acid droplets that cause global cooling and produce acid rain. The volcano last erupted in 1982, killing 2000 local inhabitants, but its effects were detected over the entire Northern Hemisphere. The NOAA’s observatory at the summit of Mauna Loa, Hawaii, in addition to monitoring the composition of the Earth’s atmosphere monitors the influx of solar radiation. The 1982 eruption of El Chichón caused the solar radiation received at this observatory to decrease by 16%. In addition, ice cores collected in Greenland record the El
479
480
Earth materials and human health
(A)
(B)
Figure 17.5 (A) The roof of a car that was slowly engulfed by the basaltic lava that descended the slope in the background from Pu‘u ‘O‘o, Hawaii. (B) A fossil cast of a resident of Pompeii who died apparently while putting hands to mouth to prevent inhalation of the volcanic ash and noxious gases.
Chichón eruptions with a sudden spike of high acidity caused by the fallout of sulfuric acid aerosols. Deeper samples from the ice core record earlier eruptions of this volcano extending back through the Holocene. This volcano clearly affected the entire Northern Hemisphere. The damage done by a volcanic eruption depends on the scale of the eruption, and this can vary considerably (see VEI in Sec. 9.2.3). We have historical records of some large eruptions, but these are dwarfed by the magnitude of eruptions in the geologic record. These huge eruptions come from what have come to be known as supervolcanoes, which spew out huge volumes of volcanic ash and leave behind large calderas where the crust has sunk into the underlying magma chamber (e.g., Yellowstone; see Sec. 9.2.3 and Fig. 9.20). Although no such volcano has erupted in historic times, their occurrence in the geologic record indicates an eruption frequency of from 10 000 to 100 000 years. The largest eruption of lava in historic times was the 1783 basaltic fissure eruption at Lakagigar in Iceland (Sec. 9.2.3 and Fig. 9.13(C)). Here, 14 km3 of basalt erupted over several months, releasing as much as 120 megatons of SO2. Although few people were killed directly by the eruption, the gas released stunted vegetation, which caused the starvation of 24% of Iceland’s population. In 1784, Benjamin Franklin attributed the “fog” that hung over Europe to this eruption in Iceland. This “fog” resulted in the lowest mean temperatures since records
have been kept, and ice cores from Greenland indicate that the eruption created the highest acidity in the last 1000 years. In 1815, Tambora, in Sumbawa, Indonesia, erupted with a VEI of 7 to create the most deadly eruption in recorded history. This composite volcano killed 12 000 people directly with ash falls and ash flows, but the resulting devastation to agricultural land caused starvation, which raised the death toll to more than 70 000. The gas and ash sent into the stratosphere took years to settle. The resulting cooling in the Northern Hemisphere made 1816 the “year without a summer.” Crop failures and animal deaths resulted in the worst famine of the nineteenth century. That year, Mary Shelley was vacationing in Switzerland with her husband, the poet and philosopher Percy Shelley, and Lord Byron, and the weather was so bad that they had to stay inside, and to keep themselves entertained they told “ghost stories.” Later, Mary’s story was published as the now-famous Frankenstein (one of the benefits of a volcanic eruption). The eruption of the Toba volcano, in nearby Sumatra, ~75 000 years ago was very much larger than Tambora and is estimated to have had a VEI of 8, making it a supervolcano. It erupted 2800 km3 of magma and, hence, was two orders of magnitude greater than the Lakagigar eruption. Ash and aerosols erupted into the atmosphere from this eruption are estimated to have caused significant global cooling, creating winterlike conditions for at least ten years. It has been proposed that the climatic
17.4 Hazards from volcanic eruptions
changes brought about by this eruption may have drastically reduced the human population. Even the amount of magma erupted from a supervolcano pales by comparison with the volumes of basaltic magma erupted as flood-basalt flows in large igneous provinces (Sec. 9.4.3). Admittedly, these lavas are erupted over a considerable time span (800°C). Metabasalt in this grade consists of granular pyroxene and plagioclase, hence the name of the facies. Graphic granite: An intergrowth of small quartz crystals in large crystals of alkali feldspar, named for its resemblance to cuneiform writing. It may be a eutectic intergrowth of these minerals. It is common in pegmatites. Gravel: Sedimentary particles that have a grain size greater than 2 mm.
Graywacke: See wacke. Greenschist facies: A set of metamorphic mineral assemblages containing chlorite, muscovite, epidote, and/ or actinolite, reflecting metamorphic conditions of about 300–500°C and 2–8 Kb. Greenhouse gas: Any gas in the atmosphere that can absorb infrared radiation and by so doing causes global warming (e.g., carbon dioxide). Green Revolution: The twentieth-century agricultural revolution that dramatically increased world crop production through the introduction of new types of cereal grains and the use of fertilizers and pesticides. Groundmass: The fine-grained crystals that surround phenocrysts in a porphyritic rock. Growth twin: A twin that is the result of nucleation errors, or accidents, during the free growth of the crystals involved. Habit: The characteristic appearance of a mineral reflecting crystal form, crystal intergrowth, or other physical aspects of its occurrence. Halide: A mineral with halogen anions such as F−, Cl−, or I−. Hand specimen: A piece of mineral or rock that can be held in the hand for evaluation of its macroscopic properties. Hard mineral: Any mineral with a hardness (H) greater than 7. Hardness: The resistance of a mineral to scratching by a sharp point, edge, or other mineral. Designated by H. Harzburgite: A variety of peridotite composed of olivine and orthopyroxene. Hawaiian eruption: A style of volcanic eruption involving mainly lava with very little explosive activity. Heat conduction: See thermal conduction. Heft: The estimation of the specific gravity (G) of a mineral specimen by holding it in the hand. Helicitic texture: Curving inclusion trails in metamorphic porphyroblasts such as garnet and staurolite. These trails may indicate that the porphyroblast rotated during growth. Hermann-Mauguin notation: A symbolic representation for the symmetry content of a point group, or crystal class, as well as space group. Also known as the international notation. Hexagonal closest packing (HCP): The packing of atoms of the same size (as spheres) in a three-dimensional array with hexagonal symmetry. Results in an ABAB sequence. Hexagonal dipyramid: A closed form consisting of 12 faces at the top and 12 identical faces at the bottom, related by a horizontal mirror plane. Hexagonal prism: In the hexagonal system, there are two prisms of six vertical faces that intersect the horizontal axes at different locations. The Miller-Bravais indices for these two prisms are {1010} and {11 20}. Hexagonal scalenohedron: The general form in point group –3 2/m. It consists of 12 scalene triangular faces with a zigzag appearance of the middle edges.
Glossary
Hexagonal system: The crystal system in which a crystal is classified if it contains one unique 6-fold rotation axis, 6-fold rotoinversion axis, or one unique 3-fold rotation axis, or 3-fold rotoinversion axis. Those crystals with unique 3-fold symmetry are commonly referred to as rhombohedral (a subdivision of the hexagonal system). A hexagonal point group example is 6/m 2/m 2/m. Hexoctahedral class: The highest symmetry class (point group) in the isometric system, 4/m 3– 2/m, in which the hexoctahedron is the general form. Hexoctahedron: A form in the isometric systems with 48 crystal faces. High-alumina basalt: Basalt containing more than 16 weight % Al2O3. It is typical of the calcalkaline series of rocks that characterize convergent plate boundaries. High-level radioactive waste: After 5% of a nuclear fuel rod has reacted, the buildup of highly radioactive fission products makes the fuel no longer usable. This spent nuclear fuel is referred to as high-level radioactive waste, to contrast it with low-level radioactive waste, which could be produced, for example, from medical procedures. High-resolution transmission electron microscopy (HRTEM): This is an imaging mode of the transmission electron microscope (TEM) that allows the imaging of a crystal structure of a material at the atomic scale. Hornblende hornfels facies: A set of metamorphic mineral assemblages characterized by aluminous hornblende, formed at moderate temperature and low pressure in contact metamorphic aureoles. Hornfels: A contact metamorphic rock lacking foliation. Hot spot: A region on the Earth’s surface marked by a lengthy period of igneous activity. They have been interpreted to be located above plumes that have sources deep in the mantle. Hot-spot track: A chain of volcanoes or igneous centers created by the motion of a tectonic plate across a fixed hot spot (e.g., Hawaiian-Emperor seamount chain). Hubble space telescope: NASA’s space telescope orbits 575 km above the Earth’s surface, where it is free of the distorting effects of the atmosphere. Hydraulic fracturing (hydrofracking or fracking): The fracturing of rock caused by pumping water into a well under high pressure. It is used to increase extraction rates of oil, natural gas, and water, and to increase the volume of dry rock from which geothermal energy can be extracted. Hydraulic radius: A term used in fluid mechanics in calculating the resistance to flow caused by friction of a fluid against the banks and bed of a channel. The hydraulic radius is equal to the cross-sectional area of the channel divided by its wetted perimeter, which is normally taken to be twice the depth of the channel plus its width.
Hydrolysis reaction: Reactions that involve the breaking of the water molecule into H+ and OH– ions. Hydrostatic pressure: The pressure at depth in a fluid (such as water) that has no shear strength. The pressure is due entirely to the weight of the overlying fluid. At depth in the Earth, rocks have little shear strength, so pressures can be calculated assuming rocks behave like a fluid (see lithostatic pressure). Hydrothermal: Refers to hot, water-rich fluids that are commonly the source of mineral and/or ore deposits. Hydrothermal alteration: The process by which minerals in a rock are altered, usually to hydrous minerals, by reaction with hot water. Hydroxide: A mineral in which the anionic group is (OH) as in brucite, Mg(OH)2. Hydroxylapatite: The type of apatite found in bones, which differs from that in rocks by having considerable substitution of hydroxyl ions for chlorine and fluorine ions. Hypabyssal: Is an adjective that indicates that an intrusive body or rock is formed at shallow depth in the Earth. Hypabyssal rocks are fine grained and resemble volcanic rocks more than they do plutonic igneous rocks. Hypersolvus: A term used to describe crystallization of liquids above a solvus. Hypersolvus granites, for example, crystallize above the alkali feldspar solvus and therefore contain only one type of alkali feldspar (contrast with subsolvus). Igneous: An adjective describing rocks, minerals, gases, textures, structures, and processes that are related to magmas. Igneous rock: A rock formed by the solidification of molten rock (magma). Ignimbrite: Another word for ash flow. Immiscibility (liquid): The process whereby a homogeneous liquid splits into two liquids of different compositions. Incongruent melting: Melting in which a solid breaks down to a liquid and another solid, both of which have different compositions from that of the initial solid. Industrial mineral: Any mineral of economic value except mineral ores, fuels, and gemstones. Inner core: The inner core of the Earth is solid and is composed primarily of iron, but small amounts of lighter elements must also be present. Its radius is 1220 km. Inorganic: Not of biological origin. Inosilicate: A silicate crystal structure that contains infinitely extending tetrahedral chains. Also known as chain silicate. Interference colors: Colors that result from the interference of two waves of light that are slightly out of phase with each other as a result of passing through the two different vibration directions in an anisotropic mineral or from being reflected off the top and bottom of a thin film. Interferometric synthetic aperture radar (InSAR): An image created by superimposing two satellite radar images of
499
500
Glossary
the Earth taken at different times, and in which differences in elevation are rendered as interference colors. International Heat Flow Commission: A commission that has the task of compiling heat-flow measurements from the Earth. International notation: A symbolic representation for the symmetry content of a point group, or crystal class, as well as space group. Also known as the Hermann-Mauguin notation. Interstice: A space between close-packed atoms (ions) in a crystal structure. Interstitial solid solution: The substitution (entry) of an element into an atomic site in a crystal structure that is normally empty. Intrusive: An adjective indicating that an igneous body or igneous rock is formed in the Earth’s interior by the intrusion of magma. Inversion twinning: Twinning that happens when an earlierformed crystal transforms to a lower symmetry, as a result of decreasing temperature. Inverted pigeonite: An orthorhombic pyroxene containing exsolution lamellae of augite whose orientation indicates that the orthopyroxene initially crystallized as the higher-temperature monoclinic pyroxene pigeonite. On cooling, the pigeonite inverts to orthopyroxene and exsolves augite lamellae. Ion: An atom that as a result of gaining or losing one or more electrons has acquired a positive or negative electric charge. Ionic bond: A chemical bond in which electrons are exchanged between adjoining ions, thus resulting in electrostatic forces between two oppositely charged ions. Iridescence: An optical phenomenon in which the hue of a surface changes as a function of the angle at which the surface is seen. Isinglass: Muscovite in thin transparent sheets used in furnace and stove doors. Island arc (volcanic arc): An arc of regularly spaced composite volcanoes that form above a subducting oceanic plate when it reaches a depth of ~100 km. Isodesmic: Describes a crystal structure in which all the bonds are of equal strength. Isogonal: Describes the relationship between screw axes and the equivalent rotational axes. For example, a 3-fold screw axis has the same angle of rotation (120°) as the equivalent 3-fold rotational axis. Isograd: A line drawn on a geological map indicating the first appearance of a metamorphic index mineral that is believed to join points of equal grade of metamorphism. Isogyre: A dark, diffuse line seen in an interference figure in the polarizing microscope when using strongly convergent light. The isogyre indicates those parts of the optical figure where light is vibrating parallel to the polarizers in the microscope.
Isometric system: The crystal system in which a crystal is classified if it contains four 3-fold rotation or four 3-fold rotoinversion axes. As in the crystal class (point group) 4/m –3 2/m. Isostasy: The state of buoyant equilibrium between masses of rock with different densities. Lower-density continental rocks, for example, float higher than denser oceanic rocks in the asthenosphere. Isostructural: A term used to describe that two minerals of different chemical composition have identical structural arrangements. Isotherm: A line on a map, cross-section, or phase diagram joining points of equal temperature. Isotopes: One or several species of the same chemical element. They have the same number of protons in the nucleus but differ from each other in having different numbers of neutrons. Isotropic: In optics, it indicates that the refractive index of a substance remains constant regardless of the direction of the passage of light. Isometric minerals and glass are isotropic. IUGS: International Union of the Geological Sciences. Jolly balance: A balance used to determine the specific gravity (G) of a solid material. Joule (J): The SI unit of energy equal to a newton·meter. It is equivalent to 0.239 calories in the cgs system of units. Kame: A stratified meltwater deposit formed in a river flowing along the side of a glacier or in a crevasse. Kaolin: A soft, earthy, usually white or nearly white clay composed principally of kaolinite. Karat (k): The proportion of gold in an alloy. Pure gold is 24k; 18k gold is 18 parts pure gold and 6 parts of other metals. Not to be confused with carat. Karst: A type of topography characterized by solution features that develops on carbonate rocks. Kerogen: A complex organic substance formed from fossilized organic matter. It is from kerogen that oil and natural gas are formed. Kimberlite: A phlogopite-rich igneous rock that commonly contains mantle xenoliths in which diamonds occur. Kinetics: The rate of processes, such as the rate of a metamorphic reaction or rate of cooling of magma. Komatiite: Ultramafic lava that grows long bladelike crystals of olivine on cooling. Most are of Archean age. Labradorescence: An optical phenomenon consisting of flashes of laminated iridescence of a single bright hue that changes gradually as the mineral is moved about in reflected light. Seen commonly in labradorite, a member of the plagioclase series. Laccolith: A near-surface, mushroom-shaped concordant intrusive igneous body. Lahar: A mudflow that descends the flanks of a volcano.
Glossary
Laminae: In sedimentary rocks, a term used to describe beds that are thinner than 1 cm. Laminar flow: The property of a fluid to flow as if it were a series of sheets or laminae parallel to the surface over which it flows and whose relative distances from that surface do not change. Lamination or laminae: Sedimentary beds thinner than 1 cm. Lamprophyre: A basaltic dike rock characterized by large phenocrysts of amphibole or biotite. Lapilli: Particles ejected from a volcano that have diameters between 2 mm and 64 mm. Large igneous province (LIP): A large region (>100 000 km2) within a tectonic plate characterized by extensive and long lasting (50 million years) igneous activity, which is usually predominantly basaltic in composition. Believed to form over large mantle plumes and to often lead to the rifting apart of tectonic plates (e.g., the Central Atlantic Magmatic Province was the precursor to the breakup of Pangaea). Latent heat of crystallization: The amount of heat that must be dissipated for a liquid to change into a crystalline solid at constant temperature: ~400 kilojoules/kg for most magmas. Latent heat of fusion: The amount of heat needed to convert a crystalline solid into a liquid at constant temperature. Lattice: An imaginary pattern of points (or nodes) in which every point (or node) has an environment that is identical to that of every other point (or node) in the pattern. A lattice has no specific origin as it can be shifted parallel to itself. Lava: Magma that is erupted onto the Earth’s surface and flows as a coherent mass. Lava tube: A tunnel formed when the supply of lava to a crusted-over lava flow is cut off and the molten lava drains from the flow’s interior. Law of superposition: Sedimentary layers are deposited in a sequence with the oldest at the bottom and youngest at the top. Layer silicate: A silicate crystal structure with infinitely extending tetrahedral sheets. Also known as a sheet silicate, or phyllosilicate. Leachate: A solution that results from leaching. It involves the dissolving out of the soluble constituents of a rock or ore body by percolating water. Left-handed: Describes a screw axis operation in which the motif (e.g., unit of structure, atom) moves away from the observer in a counterclockwise direction. Lenses: In sedimentary rocks, this refers to layers that do not have great lateral extent (less than few meters). Leucosome: In a migmatite, the light-colored igneous part is referred to as the leucosome. Level of neutral buoyancy: The level at which the density of magma buoyantly rising through the density stratified crust matches the density of its surroundings. Magmas are thought to spread laterally at this level.
Lever rule: A rule that makes use of the principles of a lever to determine the quantities of coexisting phases in a given bulk composition in a phase diagram. Lherzolite: A variety of peridotite containing approximately equal proportions of orthopyroxene and clinopyroxene along with olivine. Lignite (brown coal): A low-rank coal. Liquid immiscibility: See immiscibility (liquid). Liquidus: The temperature above which a mixture of materials is completely liquid. Limestone: A sedimentary rock composed predominantly of calcite or more rarely aragonite. Linear coordination: Describes a cation with only two adjoining anion neighbors. Lithic arenite (litharenite): Sandstone containing more than 25% rock fragments. Lithification: The process by which unconsolidated sediment is converted into sedimentary rock. It involves compaction, cementation, and recrystallization. Lithosphere: The relatively rigid outer part of the Earth, including the crust and upper mantle down to the asthenosphere. It is broken into large plates that move relative to one another and generate plate tectonics. Lithostatic pressure: The calculated pressure at depth in the Earth based on the assumption that rocks have almost no shear strength (i.e., they behave the same as water). Lodgement till: Till deposited beneath glacial ice and hence extremely compact. Loess: A sedimentary deposit of fine-grained wind-blown sand and silt formed on the lee side of a desert. Lopolith: A large saucer-shaped igneous intrusion. Luster: The reflection of light from the surface of a mineral, described by its quality and intensity. Examples are metallic or resinous luster. Maar: A shallow volcanic explosion crater surrounded by fragmental material blown from the crater. Typically the explosion is not accompanied by the eruption of lava. Magma: Molten rock. Most magma is not totally molten but contains some solids that are carried along in the liquid. Magma chamber: A body of magma inside the Earth. Magma chambers can have many different shapes from thin sheets (e.g., dikes, sills) to large diapirs (e.g., batholiths). Magma ocean: The name given to the huge body of molten rock that is believed to have covered the outer part of the Earth early in its history. Magmatic differentiation: A process that causes magma to change its composition. This is most commonly the result of mineral grains separating from the magma. Magnetic quantum number: This is the third of a set of quantum numbers symbolized by m. It defines the energy levels in an atomic subshell.
501
502
Glossary
Magnetism: The physical phenomenon of attraction of a mineral to a magnet. Major element: A chemical element that constitutes over one weight % of a mineral or rock analysis. Malleable: Said of a mineral that can be plastically deformed under compressive stress such as hammering, such as gold, silver, and copper. Mammillary: Applies to a mineral specimen that has a breastlike appearance. Mantle: That part of the Earth lying between the Mohorovicˇic´ discontinuity and the core-mantle boundary. It is divided into the upper and lower mantle by the seismic discontinuity at a depth of ∼660 km. Mantle plume: A narrow column of rock that is hypothesized to rise buoyantly from deep in the mantle (possibly as deep as the core-mantle boundary) and on reaching the lithosphere mushrooms out to form a plume head. Hot spots are believed to be located above mantle plumes (e.g., Hawaiian hot spot). Marble: A rock formed from the metamorphism of limestone and composed predominantly of calcite, but it may also contain dolomite. Marl: A limestone containing a significant proportion of siliciclastic mud. Massif-type anorthosites: Large Proterozoic intrusive igneous rock bodies composed of anorthosite, a rock composed largely of intermediate composition plagioclase. Massive: A mineral, or mineral aggregate, without obvious crystal habit, or other distinguishable physical characteristics. Maturity: When applied to sediment, it can refer to textural or chemical maturity. As sediment is transported and abraded, less chemically resistant minerals are weathered out, leaving mainly quartz, and grains become rounder. Matrix-supported: An adjective indicating that sedimentary detrital particles, such as pebbles in a conglomerate, do not touch one another but are supported by the matrix that surrounds them. Contrast this with clast-supported. Mélange: A mixture of highly deformed marine sedimentary rocks that form accretionary wedges at convergent plate boundaries. Melanosome: In a migmatite, the refractory part of the rock is typically dark colored and consequently is referred to as the melanosome. Mesodesmic: Describes a crystal structure in which the bond strengths of all the bonds reaching a cation from surrounding anions are exactly one-half the charge of the anions. Metagraywacke: A metamorphosed graywacke (wacke). Most graywackes are slightly metamorphosed. Metallic bond: A chemical bond between atoms in which their outer valence electrons are free to drift through the metal crystal structure.
Metallic luster: A luster that results from strong reflection of white light by the bright surface of metals and metallic minerals. Metamict: Describes a mineral that has undergone structural damage from radioactive elements housed in its structure but has retained its original external morphology. Metamorphic: An adjective describing rocks, minerals, textures, structures, and processes that involve a change in a previously existing rock due to changes in temperature, pressure, or fluid composition in the environment. Metamorphic facies: A metamorphic mineral facies comprises all rocks that have originated under temperature and pressure conditions so similar that a definite bulk rock chemical composition results in the same set of minerals. Metamorphic facies series: A series of metamorphic facies that indicate specific conditions of pressure and temperature in progressively metamorphosed regional metamorphic terranes. Three main series are recognized: low pressure and high temperature, high pressure and high temperature, and high pressure and low temperature. Metamorphic field gradient: The gradient of temperature and pressure indicated by the mineral assemblages preserved in metamorphic rocks. Metamorphic grade: A loose term that refers to the intensity of metamorphism. Higher-grade rocks have experienced higher temperatures and pressures. Metamorphic index minerals: A sequence of common metamorphic minerals that indicates increasing metamorphic grade. The most common sequence in pelitic rocks includes from lowest to highest grade: chlorite, biotite, garnet, staurolite, kyanite, and sillimanite. Metamorphic rock: Any rock that has been changed in texture, mineralogy, or chemical composition as a result of changes in environmental factors such as temperature, pressure, directed stress or shear, and composition of fluids. Metamorphism: The change that takes place in rocks either in texture, mineralogy, or chemical composition as a result of changes in temperature, pressure, or composition of fluids in the environment. Metasomatism: A metamorphic process whereby the bulk chemical composition of a rock is changed. Metastable: A condition that is not ultimately stable but does not result in change because of a large activation energy that prevents the system from changing into the stable form. Metapelite: One of the most common types of metamorphic rock, formed from the metamorphism of alumina-rich sedimentary rocks such as mudrock and shale. Meteorites: Natural objects from space that impact the Earth’s surface. A meteor is a similar object that burns up while passing through the atmosphere and does not reach the Earth’s surface.
Glossary
Microcrystalline: Said of crystals that can be seen only with the aid of a microscope. Microlite: Extremely small crystals found in volcanic glass. Midocean ridge: The topographic high produced by the creation of new hot oceanic crust at a divergent plate boundary. Ridges are often located near the center of an ocean, as in the case of the Mid-Atlantic Ridge, but they need not be, as in the case of the East Pacific Rise. Midocean ridge basalt (MORB): A type of basalt erupted at midocean ridges and forming most of the ocean floor. Migmatite: A mixed metamorphic and igneous rock formed when the rock was raised to a temperature at which partial melting occurred. The melt tends to be granitic in composition and forms light-colored layers in the darker refractory metamorphic rock. Milankovitch cycles: Cyclical climate changes caused by variations in the Earth’s orbital eccentricity about the Sun (∼100 000 years), and the tilt (∼40 000 years) and precession (19 000–23 000 years) of its axis. Miller-Bravais index: This index system was developed for the hexagonal system only and is different from the Miller index system because it refers to four crystallographic axes instead of just three. An example is (112–1). Miller index: A set of three digits (or four, as in the hexagonal system) that describe the orientation of a crystal plane with respect to a set of crystallographic axes. These digits are normally inside parentheses, for example (110). Mineral: A naturally occurring solid with an ordered atomic arrangement and a definite (but commonly not fixed) chemical composition, and of inorganic origin. Mineral deposit: A concentration of a mineral formed by geologic processes. If the mineral can be extracted at a profit, the deposit is called an ore deposit. Minimum: The liquidus of some solid solutions passes through a minimum, toward which liquids tend to fractionate. Many granites have a composition close to a minimum in the alkali feldspar and quartz system. Minor element: A chemical element that constitutes between 1.0 and 0.1 weight % of a mineral or rock analysis. Mirror plane: Causes the reflection of a specific crystal face, or a unit of structure, into its mirror image. Miscibility gap: A compositional range in a temperaturecomposition diagram in which a single homogeneous mineral is not stable. Modal analysis: Determination of the mode of a rock. Modal layering: Layering in rocks resulting from variations in the modal abundance of minerals. Mode: The volumetric abundance of minerals constituting a rock. In a microscope thin section, this is equivalent to the areal abundance of the minerals. Mohorovicˇic´ discontinuity (also Moho or M discontinuity): The seismic discontinuity defining the base of the Earth’s
crust. The sharp increase in seismic velocities across this boundary is believed to result from a change from crustal rocks to mantle peridotite. Mohs hardness scale: A relative hardness scale of 1–10, based on the hardness of ten common minerals used to evaluate a mineral’s hardness. Molecular sieve: A mineral (or material) with tiny pores, of uniform size, used as an absorbant for gases and liquids. Molecules that are small enough pass through the pores and are absorbed, whereas larger molecules are not. Molecular orbital transition: The result of the transfer of electrons between cations, of variable charges, in a crystal structure. They result in the blue color of several rockforming minerals. Monoclinic system: The crystal system in which a crystal is classified if it contains a single 2-fold axis and/or a single mirror. An example is 2/m. Monzonite: A plutonic igneous rock composed of approximately equal proportions of alkali feldspar and plagioclase. Moonstone: Refers to an albite-rich plagioclase that shows iridescence caused by exsolution lamellae across the peristerite miscibility gap. Morphology: Includes an assessment of the geometric aspects of the crystal faces and their symmetry as seen on the outside of crystals. It also refers to the prediction of the external shape (morphology) of crystals based on their internal structure. Mud: Sedimentary particles that have a grain size less than 0.0625 mm. Mud cracks: A polygonal pattern of cracks generated in a layer of mud as it dries and shrinks. Mudflow: A flow of debris with particles of various size carried along in a mud matrix. Mudstone: A calcareous sedimentary rock composed of more than 90% mud-size particles (