Defects in Optoelectronic Materials 9789056997144
Defects in Optoelectronic Materials bridges the gap between device process engineers and defect physicists by describing
218 34 17MB
English Pages 425 [426] Year 2022
Cover
Half Title
Series
Title
Copyright
Contents
About the Series
Foreword
Preface
Defects in Device Fabrication
1 Saturation of Free Carrier Concentration in Semiconductors
2 Point Defect Formation Near Surfaces
3 Optical Characterization of Plasma Etching Induced Damage
4 Dry Etch Damage in Widegap Semiconductor Materials
5 Generation, Removal, and Passivation of Plasma Process Induced Defects
6 Defects Induced by Metal Semiconductor Contacts Formation
7 Electrical Characterization of Defects Introduced in Epitaxially Grown GaAs by Electron-, Proton- and He-Ion Irradiation
Defects in Device Operation
8 Instability and Defect Reaction
9 Defects and Device Degradation
Index
Recommend Papers
![Voids in Materials: From Unavoidable Defects to Designed Cellular Materials [2 ed.]
0128192828, 9780128192825](https://ebin.pub/img/200x200/voids-in-materials-from-unavoidable-defects-to-designed-cellular-materials-2nbsped-0128192828-9780128192825.jpg)


- Author / Uploaded
- Kazumi Wada
- Stella W. Pang
File loading please wait...
Citation preview
Defects in Optoelectronic Materials
Optoelectronic Properties of Semiconductors and Superlattices A series edited by M. 0. Manasreh, Dept. of Electrical and Computer Engineering University of New Mexico, Albuquerque, USA Volume 1 Long Wavelength Infrared Detectors Edited by Manijeh Razeghi Volume 2 GaN and Related Materials Edited by Stephen J. Pearton Volume 3 Antimonide-Related Strained-Layer Heterostructnres Edited by M. 0. Manasreh Volume4 Strained-Layer Quantum Wells and Their Applications Edited by M. 0. Manasreh Volume 5 Structural and Optical Properties of Porous Silicon Nanostructures Edited by G. Amato, C. Delerue and H.-J. von Bardeleben Volume 6 Long Wavelength Infrared Emitters Based on Quantum Wells and Superlattices Edited by Manfred Helm Volume 7 GaN and Related Materials II Edited by Stephen J. Pearton Volume 8 Semiconductor Quantum Wells Intermixing Edited by E. Herbert Li
Volume 9 loP and Related Compounds: Materials, Applications and Devices Edited by M. 0. Manasreh See the back of this book for other titles in Optoelectronic Properties of Semiconductors and Superlattices.
Defects in Optoelectronic Materials Edited by
Kazumi Wada Massachusetts Institute of Technology Cambridge, Massachusetts, USA and
Stella W. Pang University of Michigan Ann Arbor, Michigan, USA
~ ~~r?F~~~~~up V
Boca Raton London New York
CRC Press is an imprint of the Taylor & Francis Group, an informa business
First published 2001 by Gordon and Breach Science Publishers Published 2021 by CRC Press Taylor & Francis Group 6000 Broken Sound Parkway NW, Suite 300 Boca Raton, FL 33487-2742 © 2001 by Taylor & Francis Group, LLC CRC Press is an imprint of Taylor & Francis Group, an Informa business No claim to original U.S. Government works ISBN 13: 978-90-5699-714-4 (hbk) This book contains information obtained from authentic and highly regarded sources. Reasonable efforts have been made to publish reliable data and information, but the author and publisher cannot assume responsibility for the validity of all materials or the consequences oftheir use. The authors and publishers have attempted to trace the copyright holders of all material reproduced in this publication and apologize to copyright holders if permission to publish in this form has not been obtained. If any copyright material has not been acknowledged please write and let us know so we may rectify in any future reprint. Except as permitted under U.S. Copyright Law, no part of this book may be reprinted, reproduced, transmitted, or utilized in any form by any electronic, mechanical, or other means, now known or hereafter invented, including photocopying, microfilming, and recording, or in any information storage or retrieval system, without written permission from the publishers. For permission to photocopy or use material electronically from this work, please access www.copyright.com (http://www.copyright.com/) or contact the Copyright Clearance Center, Inc. (CCC), 222 Rosewood Drive, Danvers, MA 01923, 978-750-8400. CCC is a not-for-profit organization that provides licenses and registration for a variety of users. For organizations that have been granted a photocopy license by the CCC, a separate system of payment has been arranged. Trademark Notice: Product or corporate names may be trademarks or registered trademarks, and are used only for identification and explanation without intent to infringe. Visit the Taylor & Francis Web site at http://www.taylorandfrancis.com and the CRC Press Web site at http://www.crcpress.com British Library Cataloguing in Publication Data
CONTENTS About the Series
VII
Foreword
ix
Preface
xi
Defects in Device Fabrication 1
Saturation of Free Carrier Concentration in Semiconductors W Walukiewicz
2
Point Defect Formation Near Surfaces K. Wada
33
3
Optical Characterization of Plasma Etching Induced Damage E. L. Hu and C.-H. Chen
43
4
Dry Etch Damage in Widegap Semiconductor Materials S. J. Pearton and R. J. Shu!
87
5
Generation, Removal, and Passivation of Plasma Process Induced Defects S. W Pang
6
Defects Induced by Metal Semiconductor Contacts Formation T. Okumura
7
Electrical Characterization of Defects Introduced in Epitaxially Grown GaAs by Electron-, Proton- and He-Ion Irradiation F. D. Auret
145 205
255
Defects in Device Operation 8
Instability and Defect Reaction Y. Shinozuka
345
9
Defects and Device Degradation K. Wada and H. Fushimi
369
Index
409
ABOUT THE SERIES The series Optoelectronic Properties of Semiconductors and Superlattices provides a forum for the latest research in optoelectronic properties of semiconductor quantum wells, superlattices, and related materials. It features a balance between original theoretical and experimental research in basic physics, device physics, novel materials and quantum structures, processing, and systems-bearing in mind the transformation of research into products and services related to dual-use applications. The following sub-fields, as well as others at the cutting edge of research in this field, will be addressed: long wavelength infrared detectors, photodetectors (MWIR-visible-UV), infrared sources, vertical cavity surface-emitting lasers, wide-band gap materials (including blue-green lasers and LEDs), narrow-band gap materials and structures, low-dimensional systems in semiconductors, strained quantum wells and superlattices, ultrahigh-speed optoelectronics, and novel materials and devices. The main objective of this book series is to provide readers with a basic understanding of new developments in recent research on optoelectronic properties of semiconductor quantum wells and superlattices. The volumes in this series are written for advanced graduate students majoring in solid state physics, electrical engineering, and materials science and engineering, as well as researchers involved in the field of semiconductor materials, growth, processing, and devices.
FOREWORD
Defects in Optoelectronic Materials contains a valuable collection of reports that are an excellent demonstration of the value of basic research in the semiconductor industry. The coverage ranges from fundamental physics to its applications in devices and processing. Each chapter gives vivid examples of how the understanding of materials behavior has enabled the introduction of new materials and the surmounting of perceived processing limits. Defects in solids are an ideal subject to demonstrate this value chain. The defect, though determinant in the function of an electronic material, is not an independent species, but is dependent in its influence on the response of the host to its existence. New phenomena are encountered for the first time; perceived as barriers to implementation of a technology; understood; and later employed in commercial success. Section one describes the behavior of point defects in the bulk and near surfaces. Walukiewicz develops the concept of the chemical potential of charge carriers in the free energy of the electronic materials system. In compound semiconductors this chemical potential can be the driving force for bond reconstruction and sublattice site exchange to give rise to amphoteric doping behavior. This understanding has been key to the current utility of wide band gap semiconductors and the process challenge of hydrogen passivation of dopants. Wada provides an approach to dealing with the surface as a defect and its interaction with point defects in the bulk. Since processing is usually initiated or terminated at a surface, the slow diffusing species can accummulate in near-surface regions and homogeneously precipitate in the form of dislocation loops, voids and gaseous bubbles. Section three addresses plasma process-induced damage. Hu and Chen give a thorough review of both the chemical and defect contributions to the etch process. They give insight into defect engineering for dry etch applications with discussions of defect generation, in-diffusion and interaction with microstructure. Pearton and Shul follow with excellent case studies of engineering applications of dry etch processing to wide band gap semiconductors. Pang presents the key issues in dry etch process design and the related approaches to defect control. Section six addresses electrical contact formation. Okumura presents the fundamentals of metal semiconductor reactions for Schottky barrier and ohmic contact formation. The roles of interfacial phases, defects and material work functions are related to contact performance. In particular, the realworld issue of interface inhomogeneity is considered. Auret gives a thorough
FOREWORD
review of charged particle displacement damage in III-V compound semiconductors. The electrical properties of defects are covered in detail including carrier compensation in GaAs and the defect state parameters of point defects. Section eight addresses the role of defects in device behavior. Shinozuka provides a fundamental approach to the metastability of defect configuration within a host in terms of bond reconstruction, thermodynamic equilibria and kinetic effects for both open and closed systems. This basis is then cast in the context of device operation and reliability. Wada and Fushimi describe the tendency of injection mode, compound semiconductor devices to degrade under operation. Heterostructure bipolar transistors and double heterostructure lasers are considered and defect engineering approaches such as dopant selection are described. This book is a valuable resource for both academic and commercial environments. The reader has here a well-constructed reference for fundamentals and a handbook for applications. L. C. Kimerling Massachusetts Institute of Technology
PREFACE This book will be of interest to device process engineers, defect physicists, and students. To device process engineers, this book explains possible origins of problems arising during materials processing based on current defect physics and provides fundamental ideas to control them. To defect physicists, this book highlights the problems concurrently challenging device process engineers. To students, this book introduce defect issues in current industries related to materials science and engineering. The scope of this book ranges from anomalous phenomena in III-V and II-VI compound semiconductor growth and processing to device degradation. They are described by the defects involved and by defect behavior under electronic excitation of materials. Defects in device processing are described. Device processing covered consists of crystal growth, plasma processing and ion-implantation. Fundamentals of defect incorporated during crystal growth are described, plasma-process induced defects are explained and characterized, and defects introduced by radiation damage of electron beams and their characterization methods are shown. Materials analyzed are Si and III-V compound semiconductors including group III nitrides. Defects generated during device operation are described. Device degradation is a serious problem in future integrated circuits development. Current understanding of instability and defect reaction under electronic excitation (i.e., device operation) is presented and device degradation ofGaAs/AlGaAs heterojunction bipolar transistors is described. With all these chapters, this book provides a perspective look at a range of defect issues in materials and devices. Finally, we thank all of the authors who have put together the wellorganized chapters for this book. We are also indebted to the reviewers for their helpful comments and suggestions. The editorial help from Concetta Seminara-Kennedy at Gordon and Breach Science Publishers is also greatly appreciated. Kazumi Wada, Cambridge, Massachusetts
Stella W Pang, Ann Arbor, Michigan February 1999
CHAPTER 1
Saturation of Free Carrier Concentration in Semiconductors W. WALUKIEWICZ Materials Sciences Division, Lawrence Berkeley National Laboratory 1 Cyclotron Rd. Berkeley, CA 94720
I. Introduction
2. The Amphoteric Defect Model 3. Maximum Doping Limits in GaAs
4. Other Group III-v· Semiconductors
5. Group III-Nitrides .
6. Group II-VI Semiconductors
7. Group I-III-Vh Ternaries 8. Other Semiconductors
9. Unintentional Doping 10. Amphoteric Dopants . II. Conclusions References .
1 3 7 II
13 15 20 22 23 25 27 28
1. INTRODUCTION Ability to control the type and magnitude of conductivity is the most important and unique feature that distinguishes semiconductors from all the other solid state materials. Practically all applications of semiconductor materials rely on the availability of reproducible and well controlled doping. In principle, doping can be achieved by introduction of any point or extended
defects that can contri1:mte free electrons to the conduction band or free holes
to the valence band. However, with few exceptions, in all practical cases doping is realized only by the intentional incorporation of foreign atoms that substitute host crystal lattice sites. It has been realized very early that many of the large variety of semiconductor materials are difficult to dope. The problem has been especially severe in wide-gap semiconductors where in
2
W. WALUKIEWICZ
many instances n- or p-type doping cannot be achieved at all, significantly limiting the range of applications of these materials [ 1-5]. Over the years several methods have been developed to dope semiconductor materials. Dopants can be introduced during the growth. They can also be incorporated during post-growth processing via ion implantation, diffusion and neutron transmutation doping. There are several reasons that can prevent a semiconductor material from being efficiently doped. In some instances foreign atoms cannot be incorporated in large enough concentrations into the semiconductor crystal. In other cases dopants incorporated into the crystal lattice tend to form electrically inactive defects by substituting the wrong sites or by forming precipitates. Finally, even if dopants are incorporated on the proper sites their electrical activity can be reduced or completely eliminated by compensation and/or passivation by other dopants or native defects. Although the studies of doping issues have a long history, the problems of the limitations in electrical activity of dopants have become even more important in new emerging device technologies that put stringent demands on a nanoscale control of electronic and structural properties of semiconductor materials. Such devices require preparation of small size structures with very high doping levels and abrupt doping and composition profiles. The limits of the maximum doping levels and the question of the stability of dopant and compositional profiles are becoming central issues for the new device technologies. The doping issues in epitaxially grown III-V compound semiconductors have been reviewed in a recently published book [6]. The past few years have witnessed spectacular progress in development of a new generation of short wavelength optoelectronic devices based on group III nitrides [7-10] and wide gap II-VI semiconductors [ ll-14]. In both cases the progress was made possible by discovering more efficient ways to activate acceptor impurities in these material systems. Despite this progress the high resistance of p type layers is still a major hurdle in the development of the devices requiring high current injection levels. There have been numerous attempts to understand the maximum doping limits in semiconductors. Most ofthese were aimed at explaining limitations imposed on a specific dopant in a specific semiconductor. Thus, it has been argued that in the case of amphoteric impurities in III-V compounds, doping is limited by the impurities occupying both acceptor and donor sites. Redistribution of impurities can also lead to limitations of the maximum doping level in the materials with impurity diffusion strongly depending on the Fermi energy [6]. Since in most instances diffusion occurs only in the presence of defects this mechanism is closely related to the more general concept of compensation by lattice defects. It has been proposed recently that in semiconductors with the surface Fermi energy pinned in the bandgap, the electrostatic repulsion between charged impurities can lead to limitations on the maximum concentrations of dopants [15].
SATURATION
3
Formation of new stable solid phases involving dopant atoms can be a severe limitation in achieving high doping levels. This limitation depends on the chemical identity of the dopants and the host lattice elements and may be critical in the cases where only a limited number of potential dopants is available [16, 17]. Passivation of donor and acceptor impurities by highly mobile impurities is another major mechanism limiting the electrical activity of dopants. Hydrogen, Lithium Fluorine and Copper are known to passivate intentionally introduced dopants in semiconductors. Hydrogen has been an especially extensively studied impurity as it is a common contaminant in all the growth techniques involving metalorganic precursors [ 18, 19]. In some cases hydrogen can be removed during a post-growth annealing. Magnesium doped p-type GaN is frequently obtained by thermal annealing of MOCVD grown, hydrogen passivated films [20, 21]. However in other instances, as the case of N doped ZnSe, hydrogen is too tightly bound to the N acceptors and cannot be removed by a thermal annealing cycle [22]. This eliminates metalorganic precursor based epitaxial techniques as methods to grow a p-type ZnSe [23]. In this chapter, the saturation of the doping levels in semiconductors will be discussed in terms of the amphoteric defect model (ADM). In recent years, the model has been successfully applied to numerous doping related phenomena in semiconductors. It has been used to explain doping induced suppression of dislocation formation [24] as well as impurity segregation [25, 26] and interdiffusion [27] in semiconductor superlattices. We will show that ADM provides a simple phenomenological rule capable of predicting trends in the doping behavior of a large variety of semiconductor systems.
2. THE AMPHOTERIC DEFECT MODEL Preparation of semiconductor materials unavoidably leads to the incorporation of crystal lattice defects. The defects may take the form of isolated point imperfections or they may interact with each other forming extended defects. It is obvious that a proper treatment of defect formation and defect interactions is an immensely complex problem. Incorporation of dopants will complicate it~ven further, making any effort to consider it in its full generality extremely difficult. This is why in most cases, the attempts to describe incorporation and activation of dopants have only been qualitative. To obtain a more quantitative description, a large number of approximations and simplifications need to be introduced, making such determinations much less reliable. Here we introduce a simple phenomenological description of defects and their interactions with dopants. All the point defects and dopants can be divided into two classes; delocalized shallow dopants and highly localized defects and dopants.
4
W. WALUKIEWICZ
Shallow hydrogenic donors and acceptors belong to the first class. Their wave functions are delocalized and formed mostly out of the states close to the conduction band minimum or the valence band maximum. As a result the energy levels of these dopants are intimately associated with the respective band edges, conduction band for donors and the valence band for acceptors. In general the energy levels will follow the respective band edges when the locations of the edges change due to external perturbation such as hydrostatic pressure or changing alloy composition. In contrast, wave functions of highly localized defects or dopants cannot be associated with any specific extremum but are rather formed from all the extended states in the Brillouin zone with the largest contribution coming from the regions of large density of states in the conduction and the valence band. Consequently the energy levels of such defects or dopants are entirely insensitive to the location of the low density of states at the conduction and valence band edges. It has been shown that transition metal impurities with their highly localized d shells belong to this class of dopants [28, 29]. The insensitivity of the transition metal energy levels to the position of local band extrema has led to the concept of using these levels as energy references to determine the band offsets in III-V and II-VI compounds [29] and the band edge deformation potentials in GaAs and InP [30]. A good illustration of the difference in the behavior of delocalized and highly localized centers is represented by donor dopants in compound semiconductors. When these dopants substitute proper sites they form shallow hydrogenic levels. However they can also exist in a highly localized DX center configuration [31-33] in which the center is occupied by two electrons [34-36]. Formation of DX centers is associated with a large lattice relaxation that involves displacements of the impurity and/or the nearest neighbor host lattice atoms [34]. The difference in the dependence of these two types of states on external hydrostatic pressure and alloy composition is used to change the ground state of such a system by changing the relative location of the DX center and the shallow donor energy levels [35, 37]. Properties of intentionally introduced dopants have been studied extensively and are quite well understood. Much less is known about native point defects. The main reason for this is the difficulty of identifying specific defects. In fact, with few exceptions, the energy levels of most native point defects are not known. Measurements of the pressure dependence of the energy levels of anion antisites defects in GaAs [38] and InP indicate [39] that they are highly localized and have pressure dependencies similar to the transition metal impurities. Even more compelling evidence for the localized nature of the native defects has been provided by studies of semiconductor materials heavily damaged with high energy particles [40-46]. It has been found that for sufficiently high damage density i.e. when the properties of the material are
5
SATURATION
Ec
-5
1 >,
~
C1>
c:
w
-6
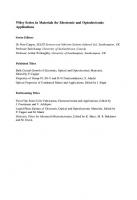
Fig. 1. Band offsets and the Fermi level stabilization energy ( E F s) in lll-V compounds. The energy is measured relative to the vacuum level. The filled circles represent stabilized Fermi energies in heavily damaged, high energy particle irradiated materials. The open circles correspond to the location of the Fermi energy on pinned semiconductor surfaces and at metal/semiconductor interfaces. The dashed lines show the location of the Fermi energy for a maximum equilibrium n- and p-type doping in GaAs and InP.
fully controlled by native defects, the Fermi energy stabilizes at certain level and becomes insensitive to further damage. The location of this Fermi level stabilization energy, E F s, does not depend on the type or the doping level of the original material and therefore is considered to be an intrinsic property of a given material. As is shown in Figure 1 the Fermi level stabilization energies for different III-V semiconductors line up across semiconductor interfaces and are located approximately at a constant energy of about 4.9 eV below the vacuum level [47]. This is a clear indication that the native defect states determining the electrical characteristics of heavily damaged materials are of highly localized nature. As is seen in Figure 1 the location of the stabilized Fermi energy in heavily damaged III-V semiconductors is in a good agreement with the Fermi level pinning position observed at the metal/semiconductor interfaces [48]. This finding strongly supports the assertion that the same defects are responsible for the stabilization of the Fermi energy in both cases.
W. WALUKIEWICZ
6
The mechanism explaining the defect induced stabilization of the Fermi energy is based on the concept of amphoteric native defects. The stabilization of the Fermi energy can be understood if we assume that the type of defects formed during high energy particle irradiation or metal deposition on the semiconductor surface depends on the location of the Fermi energy with respect to EFS· For Fermi energy EF > EFs (EF < EFS) acceptor-like (donor-like) defects are predominantly formed resulting in a shift of the Fermi energy towards EFS· Consequently, the condition EF = EFs is defined as the situation where the donor and acceptor like defects are incorporated at such rates that they perfectly compensate each other leaving the Fermi energy unchanged. Such an amphoteric behavior of simple native defects is supported by theoretical calculations that show that depending on the location of the Fermi energy vacancy like defects can acquire either negative or positive charge acting as acceptors or donors, respectively. In the case of GaAs it was shown that both gallium and arsenic vacancies can undergo the amphoteric transformation [49]. For example, as is shown in Figure 2 VGa is a triple acceptor for EF > Ev + 0.6 eV. However for lower Fermi energies this configuration is unstable and the vacancy undergoes a relaxation in which one of the first neighbor As atoms moves towards the vacant Ga site. The transformation is schematically represented by the reaction, VGa -¢> (VAs+ AsGa)
..........
(1)
EFS
4.0
>
Cl) .._, >.
3.0
O'l ..... Cl) c Cl) 2.0 c
0
·p ro
E .....
1.0
0
u.
0.0
0
Ev
0.3
0.6
0.9
Fermi energy (eV)
1.2
1.5
Ec
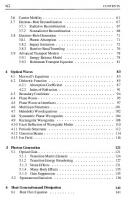
Fig. 2. Formation energy of a gallium vacancy and the related donor defect as function of the Fermi energy in the GaAs band gap [49, 50).
SATURATION
7
In arsenic rich GaAs the calculated formation energy of Vca is below 1 e V for E F at the conduction band edge [50] A similar amphoteric behavior is also predicted for VAs where the transformation is given by the reaction [49], (2)
In this case the VAs donor that is stable in GaAs with E F larger than about + 0.8 eV and transforms to an acceptor-like (Vca + GaAs) configuration for Ep < Ev +0.8 eV [27]. It is worth noting that these theoretical values of Eps are very close to experimentally determined ranging from Ev + 0.5 eV to Ev + 0.7 eV [41]. Most recent theoretical calculations have shown that the amphoteric behavior of native defects is a feature common to many different compound semiconductor systems, including II-VI and III-V semiconductors and the group III-Nitrides [51]. The calculations have confirmed that the reaction (1) is responsible for the amphoteric behavior of Vca· However it has been found that in the case of VAs a transformation from a donor like VAs to an acceptor like configuration occurs through a dimerization of the three-fold coordinated Ga atoms surrounding the As vacancy rather than reaction (2). Although, a different type of a structural relaxation is predicted in this case it does not change the overall conclusion that both cation and anion site vacancies are amphoteric defects and, when introduced in large concentrations, will lead to a stabilization of the Fermi energy. Since Eps is associated with highly localized defects, its location has no correlation with the conduction or valence band edges. Thus as is seen in Figure 1, Eps can be located anywhere in the gap or even in the conduction band. In the case of GaAs, Eps is located close to the midgap energy. Therefore high energy particle damage always leads to a high resistivity GaAs [41]. On the other hand, in the unusual case of InAs, Eps is located deep in the conduction band. Consequently any high energy particle damage leads to high n-type conductivity in this material [44]. We will show in this chapter that the location of E F s relative to the band edges is the single most important factor affecting defect-related phenomena in semiconductors. Ev
3. MAXIMUM DOPING LIMITS IN GaAs Numerous electronic and optoelectronic applications have made GaAs one of the most extensively studied compound semiconductor. It has been realized very early that it is rather easy to dope GaAs with acceptors. Very high concentrations, in excess of 1020 cm- 3 , can be readily obtained by doping with group II atoms [52]. Even higher concentrations close to 1021 cm- 3
8
W. WALUKIEWICZ
were obtained by doping with carbon [53]. On the other hand n-type doping is much more difficult to achieve. The doping becomes less efficient for donor concentrations larger than about 3 x 10 18 cm- 3 and the maximum electron concentration saturates at a level slightly above 10 19 cm- 3 [54-57]. The maximum concentration does not depend on the dopant species or the method by which the dopants are introduced into the crystal therefore it appears to be an intrinsic property of the material rather than a feature attributable to the chemical or electronic characteristics of the dopants. Over the years numerous attempts were undertaken to understand the nature of this limitation. For example it has been proposed that at high concentrations Se donors form electrically inactive complexes [54]. In the case of group IV dopants an obvious explanation was based on the amphoteric nature of these impurities. It was argued that at high doping levels the dopants begin to occupy both sites forming donors and acceptors that compensate each other [57]. It would be rather surprising if these dopant specific explanations could account for the universal nature of the electron concentration limits. An obvious absolute limit for free electron concentration is set by the location of the DX centers associated with a specific donor impurity. It is now generally accepted that in its ground state DX center is occupied by two electrons therefore it behaves as a negatively charged acceptor that compensates shallow hydrogenic donors. Consequently the Fermi energy cannot lie higher than the DX center level [58]. This intrinsic instability of the donor sites to the transformation to the DX like configuration is again donor specific and would therefore lead to the free carrier concentration limit that is dependent on the donor species. A more general explanation of the doping limits in n-GaAs was based on the concept of Fermi level induced formation of compensating native defects. The most obvious choice for the compensating acceptor defect was VGa· A photoluminescence line at about 1.2 eV whose intensity was found to increase with the doping levels was attributed to a donor- Vca complex [59]. The complex appears to be responsible for the additional local modes found in GaAs heavily doped with Si [60]. In considering compensation of donors by native defects one needs to know the temperature at which the defects are frozen. It can be argued that this temperature should be somewhat lower than that required to remove the radiation damage in and activate dopants in ion implanted material. In GaAs this temperature appears to be in the range 900 K to 1100 K [61]. Under thermal equilibrium conditions the concentration of gallium vacancies is given by [50], (3) [Veal= NsireCenr exp[ -Etf kT] where Nsire is the concentration of Ga site in GaAs crystal, Cent is the temperature independent term associated with entropy contributions and Ef
SATURATION
9
is the formation energy of Vca- Theoretical calculations predict that in GaAs with the Fermi energy above EFs. Vca is a triply negatively charged center [49, 50]. Therefore its formation energy depends on the Fermi energy and can be written as,
(4) The Fermi energy is determined by the concentration of free electrons that is equal to the net-concentration of donors, (5)
where Nc is the conduction band density of states, F1;z(x) is the Fermi-Dirac integral and Nd is the concentration of intentionally introduced donors. It is commonly assumed that electrons in the conduction band can be described by nondegenerate electron gas statistics for which the Fermi-Dirac integral has the form FJ;z(x) = (rr) 112[exp(x)]/2. It has been found however, that this assumption is not always accurate and can lead to significant errors, especially for high electron concentrations in semiconductors with small effective masses of the conduction band electrons [62]. Substituting (3) and (4) into Eq. (5) one obtains an equation for EF or an equivalent equation for free electron concentration in the conduction band. To solve this equation one needs to know the location of E F s with respect to Ec at elevated temperatures. In GaAs at 900 K Ec is located at about 0.46 eV above the intrinsic level [63]. At room temperature EFs = Ec- 0.8 eV. Using arguments of ref. 24 about the temperature shift of Ec we find EFS = Ec- 0.68 eV at 900 K. The results of the calculations are shown in Figure 3. They were obtained assuming Cent = 1. A good fit to experimental data was obtained adopting the value Ef = 2.4 eV for the Fermi energy located at the intrinsic level, E F = Ei. As is seen in Figure 3 the results of the calculations quite well reflect the overall dependence of the electron concentration on the doping level, Nd. At low Nd the Fermi energy is located well below the conduction band, Ef is large and the concentration of VGa small. Under these conditions all donors are electrically active and n = Nd. With increasing doping the Fermi energy shifts upwards towards the conduction band resulting in a lower Ef and higher [Vca]. Gallium vacancies compensate the donors and n becomes a sublinear function of Nd. In fact, it can be shown that in a limited concentration range, n is proportional to ( N d) 113 . The 1/3 power reflects the
fact that Vca is a triply charged acceptor. Such dependence is expected when electrons can still be described by nondegenerate statistics. At even higher doping levels the Fermi energy enters the conduction band and becomes strongly dependent on electron concentration. This leads to a rapid reduction of Ef, an increase of Vca and as a consequence saturation of n.
W. WALUKIEWICZ
10
.......... 0
1021
E
u .....,
c 0
Q)
Te
Se
+
Se
Si
Jo.
Se
A
ca
u
0
0
•
1020
·.;:;
........c
• s
--Theory
Si n
1 019
oc
N 113 d
c 0
u
c
0 ........
1018
u
Q)
w
10
17
10
17
1018
1 019
Donor concentration
1020 (cm" 3 )
1021
Fig. 3. Electron concentration as a function of donor doping in GaAs. The data points represent experimental results for several different donor species (•- S [55), o- Se [55), Si [54], /:;- Si [57), ()- Te [55],+- Se [54) and A - Se [56)).
+-
It is important to note that the value of Ef = 2.4 eV appears to be consistent with other determinations of the formation energy of Vca in intrinsic GaAs. Detailed studies of Ga self-diffusion in undoped GaAs provided the value of the diffusion activation energy, that is a sum of the formation and migration energies of Vca. Ef+m = Ef +Em = 3.7 eV [64]. The entropy of S = 3.5 k has also been determined in this study. In addition extensive investigations of Vca facilitated diffusion of Asca defects in non-stoichiometric, low temperature grown GaAs have provided the values of VGa migration energies ranging from 1.4 to 1.7 eV [65, 66]. This leads to EJ ranging from 2.0 to 2.3 eV that is somewhat lower than the value of Ef = 2.4 eV needed to explain the free electron concentration limits. The difference can easily be accounted for by the entropy contribution that has been neglected in the present considerations. At 900 K the entropy of 3.5 k leads to an effective formation energy difference of about 0.27 eV. The success in explaining the doping limitations in n-type GaAs raises the question whether a similar mechanism is responsible for doping limits in p-type GaAs. As is shown in Figure 1 Vca is an unstable defect for EF < EFS· It relaxes to the VAs+ Asca donor like configuration with the formation energy Ef = Efo+3(EF-EFs). With Efo = Ef(EFs) = 3.1 eV
SATURATION
II
one finds that at a temperature T = 900 K for EF located at the valence band edge Ev, the formation energy, Ef = 1.8 eV. This formation energy gives a very low value of less than 10 13 cm- 3 for the concentration of the defect donors. Since for E F = Ev the concentration of free holes is equal to about 4 x 10 19 cm- 3 , it is evident that (VAs+ Asaa) donors are not expected to play any role in compensation of intentionally introduced acceptors. This is consistent with experiments that indicate that rather high hole concentrations can be relatively easily achieved in p-type GaAs. However, it has also been shown that in GaAs doped with column II acceptors the hole concentration saturates at the doping levels slightly above 1020 cm- 3 [67, 68]. This saturation has been attributed to the fact that column II atoms can act either as acceptors, when they substitute Ga atom sites or as donors when they occupy interstitial sites. The concentration ratio of substitutional to interstitial atoms depends on the location of the Fermi energy. At low concentrations all dopant atoms substitute Ga sites acting as acceptors. With increasing doping level the Fermi energy shifts down towards the valence band and more and more dopants occupy interstitial sites acting as donors. As has been shown before [25, 62] this mechanism leads to a saturation of the position of the Fermi energy level and thus also of the concentration of free holes in the valence band. In the case of GaAs, with the maximum hole concentration of 1020 cm- 3 the Fermi energy saturates at about Ev - 0.2 e V or at E Fs - 0.67 e V when measured with respect to E Fs as a common energy reference. Vacancy-like defects do not appear to play a significant role in limiting the hole concentration in GaAs doped with group II acceptors. It has been demonstrated however, that under some conditions arsenic vacancies play a critical role in reducing of the electrical activity of C acceptors in GaAs/AIGaAs heterojunction bipolar transistors [69].
4. OTHER GROUP 111-V SEMICONDUCTORS The above results on the saturation of electron and hole concentrations in GaAs can be interpreted in terms of limitations on the maximum and minimum Fermi energy that can be achieved by doping. In GaAs at room temperature the allowed Fermi energies range approximately from E FS 0.8 eV to EFS + 1 eV.It has been shown that similar limits apply as well to other III-V compounds providing a simple and convenient way to estimate maximum doping limits not only in other binary compounds but also in their alloys. The limiting Fermi energies EFmin and EFmax for various III-V compounds are shown in Figure I. It becomes readily evident from this figure which one of the semiconductors will be easily doped p- or n-type. Thus in InP E F max is located deep in the conduction band whereas E F min lies at about
W. WALUKIEWICZ
12
0.16 e V above the valence band edge. This suggests that, in contrast to GaAs, it should be much easier to dope InP n-type rather than p-type. This indeed is observed experimentally. Electron concentrations approaching 1020 cm- 3 were reported in Si [70] and Sn [70, 71] doped lnP. On the other hand the hole concentration is limited to mid 10 18 cm- 3 in t~is material [68, 72]. It has been shown that a similarly strong correlation exists between the location of E F s and the maxirtmm doping level is found for all III-V semiconductors [73]. An important feature of the present approach is that it provides an easy way to determine the doping limits in alloys. For example a study of Zn doping of Ino.s(Gal-xAlx)o.sP lattice matched to GaAs has shown that the maximum hole concentration decreases with increasing x [74]. For x ranging from 0 to 0.7 the maximum hole concentration decreases from about 5 x 10 17 to I x 10 17 cm- 3 • Figure 4 shows the location of the Fermi energy calculated for the maximum hole concentration as a function of the AI content for the growth temperature of about 1000 K [75]. As expected the maximum hole concentration corresponds to constant EF relative to Eps. Similar behavior of decreasing maximum hole concentration with decreasing x has been also observed for Mg doping of these alloys.
.-.
>Cl.l
.........
-0.2
T = 1000 K
-0.4
----- .. ----------E • F
(/)
u..
UJ
w
u..
>:
-0.6 -0.8
C)
'Cl.l
c
w
-1.0 1.0
0.0 Composition, x
Fig. 4. Composition dependent location of the Fermi energy relative to E F s for the maximum free hole concentration in Zn doped lno.s(Gal-xAlx)o.sP [73, 74]. Also shown is the position of the valence band edge, E v.
SATURATION
13
Since the incorporation of dopants at the levels close to the maximum doping limits leads to the formation of defects it is expected that it may also lead to an enhanced diffusion of the dopants and the host lattice atoms. This issue is especially important for superlattices were the structural integrity of the superlattice and/or distribution of dopants can be affected by such diffusion. As has been shown above, when the concentration of column II acceptors reaches the saturation level an increasing number of them transfer to energetically more favorable interstitial sites. It has been shown that in the uniform case of a single material the interstitials lower their energy by forming precipitates or reacting with host lattice atoms to form new compounds [68]. In the case of heterostructures consisting of layers with different free hole saturation levels one can expect that the interstitials can also lower their energy diffusing into the layers with higher free hole saturation levels. This is exactly what is observed experimentally. A pronounced redistribution of column II acceptors has been found in lattice matched InGaAs/InP/InGaAsP/InP [76], InP/InGaAs [77] and AlGaAs/GaAs [78] heterostructures. The acceptors segregate to the layers with larger maximum hole concentration limits. As an example, Figure 5 shows the profile of free holes in the InGaAs/InP/InGaAsP/InP structure after Zn diffusion [78].
.,
~
E
~
.
c•
1020
N 0
Jl0
....0
.c
1019
c
.2
~c u 0
c
1018
0 0
InP 1017
0
1.0
l.S
2.0
depth (j.un) Fig. 5. Hole concentration profile (solid line) in Zn diffused InGaAs/InP/InGaAsP heterostruc· ture lattice matched to InP [78]. The dashed line represents a calculated Zn concentration profile for the substitutional-interstitial Zn diffusion mechanism [79].
14
W. WALUKJEWICZ
Calculations show [79] that the dramatic segregation of Zn atoms can be explained considering the difference in the location of the Fermi level stabilization energy or, equivalently, the valence band offsets in different layers. The well-known band offsets of 0.36 eV for InGaAsllnP and 0.19 e V for InGaAsP!InP heterointerfaces have been used in these calculations [80]. The deviation between the calculated Zn concentration and the free hole concentration in the top InGaAs layer can be attributed to an incomplete activation of Zn acceptors for the concentrations exceeding the free hole saturation level of 2 x 1020 cm- 3 .
5. GROUP III-NITRIDES Recent years have witnessed an unprecedented growth of interest in the Group III-Nitrides as a new distinct class of III-V compounds with strongly ionic bonds, smaller lattice constants and large band gaps. These materials form the foundation of a new technology for short wavelength optoelectronic [9] and high power, high-speed electronic devices [81, 82]. Group III-Nitrides have by now been studied for many years. As with many other wide gap materials the main impediment in practical applications was their propensity to exhibit only one type of conductivity. Typically, as grown GaN or InN are found to be highly n-type conducting and for a long time it was impossible to dope them with acceptors. In the case of AIN neither type of doping was possible. These trends in the doping behavior of the nitrides can be again understood in terms of the amphoteric defect model. Figure 6 shows the band offsets of group III-Nitrides. The band edges were located relative to EFs using the fact that there is a negligibly small conduction band offset between GaAs and GaN. It is seen in Figure 6 that E F s is located in the upper part of the bandgap in GaN and slightly above the conduction band edge in InN. Therefore it is expected that it should be relatively easy to dope those materials with donors and much more difficult to dope with acceptors. Free electron concentrations exceeding 1020 cm- 3 [83, 84] and 1021 cm- 3 [85] have been reported in unintentionally doped GaN and InN, respectively. These concentrations correspond to approximately the same Fermi energy at EFs + 1.3 eV in both materials. The large difference in the maximum electron concentration is consistent with the large conduction band offset between GaN and InN. Also the very large conduction band offsets of 2 eV between GaN and AIN explains why the n-type doping efficiency decreases with increasing AI content [83]. A saturation of free electron concentration has been recently observed in GaN intentionally doped with Se [86]. At low doping levels all Se atoms were electrically active donors. With increasing doping level the
SATURATION
15
-1 -3
Ec
......._
>
Q)
EFS
Ev
-5
'-"
>. C'l 1...
Q)
-7
c
UJ
-9 GaAs InN
GaN
AIN
Fig. 6. Band offsets for group III-Nitrides. The dashed lines represent Fermi energy for the maximum achievable free electron concentration in GaN and InN.
electron concentration tends to saturate, showing the characteristic ( N d) 1/ 3 dependence on the donor concentration. Similarly, as in GaAs, the saturation of the electron concentration has been explained by incorporation of triply ionized VGa acceptors. This result confirms the universal nature of the group III vacancies as compensating centers inn-type III-V compounds.
6. GROUP II-VI SEMICONDUCTORS Wide gap group II-VI semiconductors are the group of materials that exhibit the most severe limitations on the doping efficiency. It is this family of materials for which the problem of doping has been recognized first [3, 4]. Early studies have shown that all wide gap II-VI compounds show a propensity for either n- or p-type conductivity. As grown ZnO, ZnS, HgSe, CdSe and CdS show n-type conductivity and p-type doping is very difficult if not impossible to achieve in these compounds. On the other hand ZnTe typically exhibits p-type conductivity only. It was recognized at that time that the doping limits could originate from compensating native defects that are formed when the Fermi energy shifts towards the band edges [2-5]. It was not
16
W. WALUKIEWICZ
clear, however, how within this picture one could explain differences between apparently similar materials exhibiting completely different doping behavior. Recent advances in the utilization of II-VI compounds for short wavelength light emitting devices have brought the issue of the doping limitations to the forefront and led to intensive efforts aimed at understanding the mechanisms responsible for the limited dopability of these materials [74, 87-91]. Because of its importance for the blue-green light emitters, ZnSe has been considered a prototypical material to study the doping limitations. It can be relatively easily doped n-type but p-type doping is very difficult to accomplish and only recently doping with reactive nitrogen was successful in achieving p-type conductivity. However, even in this case the free hole concentration is limited to 10 18 cm- 3 [87, 89]. One explanation of the effect is based on the argument that it is energetically favorable for the dopant species to form new compounds with the host crystal atoms rather than substitute lattice sites and act as donors or acceptors [16]. In the case of N doped ZnSe the calculations suggested that Zn3N2 should be easily formed preventing N from acting as a substitutional acceptor [16]. Also these first principle calculations seemed to indicate that the formation energies of native defects are too large and the concentrations are too small to explain low electrical activity of N atoms in ZnSe with compensation by native defects [16]. Later, improved calculations have shown that incorporation of lattice relaxation lowers the formation energy of native defects so that they are likely to play a role in compensation of N acceptors in ZnSe [91]. The concept that the doping with N is limited by formation of new phases has been recently used to explain differences in the doping behavior of a number of II-VI tellurides [92]. Native defects were frequently invoked as the centers compensating electrical activity of intentionally introduced dopants. It was very difficult, however to identify the defects responsible for the compensation or to account for the trends in the doping behavior observed in different II-VI compounds and their alloys. There is evidence that, in the specific case of ZnSe:N, Vse or Vse-N defect complexes are responsible for the compensation of p-type conduction [88, 93]. This finding however, does not provide any guidance on how to identify the compensating defects in other II-VI compounds. It has been shown again that the trends in the doping behavior of different group II-VI compounds can be understood within the amphoteric defect model without any need to know the specific identity of the compensating defects [94, 95]. The conduction and valence bands for various II-VI semiconductors are shown in Figure 7 [94]. The Fermi level stabilization energy is again located at about 4.9 eV below the vacuum level. As in the case of III-V compounds, it is assumed that there is a band of allowed Fermi energies !:J.EF = EFmax- EFmin determining the maximum electron and hole concentration that can be achieved in a given material.
17
SATURATION
2.0 3.0 4.0
Ec
5.0
> ~ >.
f:l
(1)
c
LU
6.0 7.0
E
v
.
en c cu
I I I I I I I
c
c
0
I
I 0 16 L---l---L.:___L_..J..___J
0
0.2
0.4
0.6
Depth (p.m l
0.8
1.0
10 5 ~------------------~ lnP I InGaAs HBT
en
-
c
...
:I
..ci
subcollector 4 x 10 18 cm- 3 4 x10 19 cm- 3
0
-
>.
-en c
102
cu
c
c
0
10 1
\
\ \
\ \ \
,,,,, ,,. " \1 ,11
,I I
I
I
IO~OL.2---..J.O...JIr.__O.l--l.._O..J... .:. .I--0..1...2--0-'.-3---J0.4
Distance (p.ml Fig. 5. Zn redistribution during epitaxial growth. (a) GaAs Based HBT [10] and (b) lnP based HBT[I2].
POINT DEFECT FORMATION
41
Base layer. The difference from the GaAs/AlGaAs system is possibly due to the time required for establishing the Ga vacancy equilibrium concentration. Their InP system is grown at 450 A, which is a much lower temperature than used for the GaAs system. Kobayashi et al., have succeeded in minimizing the Zn redistribution by utilizing growth interruption by which self-interstitials on column III sub-lattice formed in the n+ collector contact layer are eliminated at the growth interrupted surface [13]. The time for the growth interruption was 30 min.lt is open to question whether this time is necessary for attainment of the equilibrium concentration of the vacancy on the column III sub-lattice via Frenkel-type defect formation. Marioton et al., have recently shown that dislocations are active with a limited efficiency as point defect sources and sinks [14]. An introduction of their results is beyond of this work, but the phenomenon should be related to the bottleneck effect in the bulk, called this "bulk" bottleneck effect.
5. CONCLUSION Current understanding on point defect equilibria and kinetics near the surface is reviewed. The equilibrium concentration of intrinsic point defects near the surface of GaAs is analyzed by extending the Amphoteric Defect Model. The equilibrium concentration of Ga vacancies at surface is intrinsic equilibrium concentration which should be several orders of magnitude lower than in the bulk. The surface bottle neck effect is, thus, presented, in which point defects can not be provided to the bulk due to kinetic limit, since the point defect diffusion flux is too small to attain equilibrium concentration in the bulk from the surfaces. Based on this effect, a model is proposed in which the Frenkel-type defect formation would be dominantly working to attain an equilibrium concentration in some cases. The model is consistent with delays in disordering of GaAs/AlAs superlattices near the surface and the phenomenon of redistribution of Zn in the hetero-junction bipolar transistor structures based on the GaAs/AlGaAs and InGaAs/InP systems.lt is proposed that dislocations which pin the Fermi level induce the bottleneck effect in the bulk. This bottleneck effect might be a clue to understand unsolved problems in GaAs and related compound semiconductors. References I. See 1.1.1 in this book, W. Walukiewicz, Appl. Phys. Lett., 54, 2094 (1989). 2. G.A. Baraff and M. Schulter. Phys. Rev. Lett., 55, 1327 (1985), and G.A. Baraff and M. Schulter, Phys. Rev., B33, 7346 (1986). 3. R.W. Jansen and O.F. Sankey, Phys. Rev., B39, 3192 (1989). 4. W. Walukiewicz, Phys. Rev., B14, 10218 (1990).
42
K. WADA
5. W. Walukiewicz, Phys. Rev., 837, 4760 (1988). 6. E.H. Nicollian and J.R. Brews, MOS Physics and Technology (John Wiley & Sons, New York, 1982) p.54. 7. K. Ogawa and M. Kawabe, Jpn. J. Appl. Phys., 29, 1240 ( 1990). 8. K. Wada, Appl. Sut:( Sci., 85, 246 ( 1995). 9. P. Enquist, J.A. Hutchby and T.J. de Lyon, J. Appl. Phys., 63,4485 (1988). 10. P. Enquist, G.W. Wicks, L.F. Eastman and C. Hitzman, J. Appl. Phys., 58,4130 (1985). II. D.G. Deppe, Appl. Phys. Lett., 56, 370 (1990). 12. K. Kurishima, T. Kobayashi and U. Goesele, Appl. Phys. Lett., 60,2496 (1992). 13. T. Kobayashi and K. Kurishima, Appl. Phys. Lett., 62, 284 (1993). 14. B.P.R. Marioton, T.Y. Tan and U. Goesele, Appl. Phys. Lett., 54, 849 (1989).
CHAPTER 3
Optical Characterization of Plasma Etching Induced Damage EVELYN L. HU AND CHING-HUI CHEN Department ofElectrical and Computer Engineering, University of California, Santa Barbara, CA 93106 1. 2. 3. 4.
Introduction Ion-assisted Etching: Understanding the problem Optical Damage Assessment Techniques: Choosing a Method The Range of Ion-Induced Damage 4.1. The Role of Channeling: A Major Discrepancy Removed 4.2. Diffusion of Defects: Beyond Channeling Alone 4.3. Channeling and Diffusion in Ion Damage: A CHANDID Approach 4.4. Radiation-Enhanced Defect Diffusion -The Final Link? 4.5. Etch-rate Dependence of Damage 4.6. Ion Damage to Etched Sidewalls 5. Engineering Materials for Greater Robustness to Ion Damage 5.1. Etch Damage of InP 5.2. Non-stoichiometric GaAs 5.3. Strained Layer Materials 5.4. Quantum Dot Structures 6. Summary References
43 44 45 50 51 53 57 59 64 64 66 67 72
78 79 84 84
1. INTRODUCTION Ion-enhanced dry etching techniques have proven to be a critical enabling technology for shaping optoelectronic materials into devices. The ability to produce well-controlled and accurate pattern transfer having high spatial resolution has been used to etch waveguides [ 18], define in-plane and vertical cavity laser structures [28, 35, 47], and to form mirrored facets for lasers and waveguides [15, 31]. The power of such dry-etch technology lies in the combination of chemical reactivity and selectivity afforded by the appropriate 43
44
E.L. HU and C.-H. CHEN
choice of etch gases, together with the enhanced control of etch profile and rate achieved through the directionality and energy of ion beams. (In addition to this ion-assisted chemistry, electron beam [25], or photon-enhanced [6] gas phase chemical etching can also be effective. Since ion-assisted etching technology is the one in most widespread use, we will focus our discussions in this area). Nevertheless, the reduced dimensions and increased sensitivities of current devices render them more susceptible to the possibilities of materials damage introduced by the etch process. This forms the motivation for the discussions undertaken in this Chapter. Beginning with a very brief consideration of the ion-assisted etching process and the means of ion interaction with the substrate (Section 2), we will then select out a particular means of optical characterization (Section 3) in order to more sensitively explore the issues of etch-induced damage. Section 4 will systematically trace a series of studies that identify the most important components in etch- induced damage, also following the progressively better correspondence between experiment and simulation. Finally, we will consider in Section 5 the issues of etch-induced damage in a variety of different material structures. We do this in order to better extract out general trends of damage propagation, but also to understand how we might engineer material structures to better withstand etch-induced damage. 2. ION-ASSISTED ETCHING: UNDERSTANDING THE PROBLEM
There are currently a number of different techniques available to achieve ionassisted etching, including Reactive Ion Etching (RIE), Electron Cyclotron Resonant Etching (ECR), and Inductively Coupled Plasmas (ICP). These techniques differ in the characteristics and the formation of the plasmas that give rise to the reactive ions, and can be used to obtain high etch rates, greater etch uniformity, and other desired etch features. Further information about these specific processes, as well as information about the design and optimization of ion-assisted etch processes can be found in a number of references. Our intention here is to extract the basic features of any etch process that will help us to better understand the origins of etch-induced damage in optoelectronic materials. Therefore, we will begin with a very simple schematic of a gas-phase etch process, shown in Figure 1, which delineates the role that the ions may play in the etch process. We use the chlorine etching of GaAs as a model, highlighting the steps corresponding to (I) physisorbtion, then chemisorption of the reactive gas onto the substrate, (2) reaction with the substrate to form a product molecule which if sufficiently volatile, will subsequently desorb from the substrate (3). The kinetic energy of ions can dramatically enhance the set of processes shown in Figure I by increasing the speed of the rate-limiting step in the etch
OPTICAL CHARACTERIZATION
Fig. 1.
45
Simple schematic of the components of a gas-phase etch process.
process. For example, with product molecules that are relatively non-volatile under the etch conditions, ion bombardment may assist in the removal of those products from the surface. Since the direction of the ions can be controlled through the use of electric fields, so then can the directionality of the ion-promoted etch process. Using the simple mechanisms shown in Figure I, it would seem reasonable that ion enhanced etching would be effective for ion energies on the order of, or a few times larger than typical bond strengths,. say tens of electron volts of energy. In fact, most ion-assisted etching processes utilize ion energies of about I 00 to a few hundred electron volts. With energies this high, it is reasonable to imagine that the ion interaction with the substrate material may result in the creation of defects in the material. Figure 2 represents schematically the multiplicity of ways in which ions may interact with the substrate to produce material damage. 3. OPTICAL DAMAGE ASSESSMENT TECHNIQUES: CHOOSING A METHOD Etch-induced damage in materials pragmatically encompasses the range of deleterious modifications introduced to the material through the processing, and may be manifested as changes in conductivity, optical efficiency, or modifications of interfaces with other materials, such a metals. Although chemical modification of the surface, shown in Figure 3, may have undesirable consequences on device performance (for example, a change in the stoichiometry of the surface material), we will focus in this
46
E.L. HU and C.-H. CHEN
sputtered particle
'D
chemical reaction
reflected particle
t
r-!r • l l J/ impinging ions •
•
'"'"""""" ---~o~~~r~~~~t~~-
x-rays electrons
o·br:~rate o ~ooe Q 0 interstitial~ tgQgQ 0 _do_
vacancy IONINDUCE DAMAGE
photons
-
·a· ..
surface
'4
stress strain
implanted atom amorphization
---...........
radiationenhanced diffusion
Fig. 2. A schematic representation of ion-solid interactions that can lead to material degradation, after Malherbe [Malherbe, 1994].
REACTIVE IONS
chemical modification of the surface
ion-induced damage
Fig. 3.
Modification of the ion-etched material.
OPTICAL CHARACTERIZATION
47
chapter on the better understanding of the physical component of damage introduced by the use of energetic ions in the etch process. And although a variety of sophisticated characterization techniques have been employed in the study of etch-induced damage, we will focus on a particular strategy for assessing the optical efficiency of ion-bombarded materials. Schottky Barrier measurements [51, 52], Deep Level Transient Spectroscopy [20], Raman Spectroscopy [34], Rutherford Backscattering [3], and Transmission Electron Microscopy, in addition to examination of device characteristics, are among the other techniques that have been used to better understand the consequences of ion-assisted etching processes. Full understanding of the complexity of interactions that propagate ion damage into the etched material, that accounts for variations in material composition, etch gas chemistry, etch technique, is as multi-faceted a problem as understanding the detailed reactions and components of the etch process itself. Nevertheless, there have been some clear trends and general progress made in recent years, and we hope that the presentation of this chapter will illuminate some important advances in understanding made over that time period. Photoluminescence (PL) measurements of optoelectronic materials before and after ion-assisted etching should provide an excellent measure of possible optical damage introduced into the material. A number of early papers did indeed carry out such studies [1, 33, 65]. A major concern for simple assessments of luminescence efficiency of bulk materials is the sensitivity of the technique, and the minimal levels of damage detectable. Initially, it was believed that the ion range, and hence the damage range of these few hundred eV ions would be no deeper than a few tens or hundreds of angstroms. Compared with absorption lengths of'"" 1 f.Lm for the laser lines used for the PL measurements, one might expect to see a modulation of the PL intensity of less than a fraction of a percent. In addition, such measurements do not yield information about the profile of the damage: how the concentration of defects may vary with increasing distance from the surface. It would be extremely useful to somehow be able to place discrete optical 'markers' at varying depths into the substrate material, which would carry that spatial information, as well as information about the optical efficiency of the material at that point. The capability of epitaxial growth techniques like Molecular Beam Epitaxy (MBE) and Metalorganic Chemical Vapor Deposition (MOCVD) to 'routinely' grow multiple quantum well material, such as that shown in Figure 4(a), produced that ideal marker structure for ion damage studies: quantum wells of differing widths, situated at different depths from the substrate surface, would each give a unique signature in energy position of their luminescence peak. The cathodoluminescence (CL) spectra of Figure 4(b) show the material signature before and after ion bombardment conditions, and allows us to generate profiles in depth of the damaging
E.L. HU and C.-H. CHEN
48
250A!>IAO
20A
GaAI
250A AIGaAI
60A GaAI
1osoA
30A GaAI
137oA
supedattice
....o
50oA 7soA
40A GaAI
.. ,;
=-= -_----=--~-
2500
~
2000
. ~
200oA AJG aA1
soA GaAI
....
_ _retennce
3000
!!.
~
-
subltrate
3000
1000
...
UXIO
buffer layer GliAl subltr.lte
en.,w(aV)
(a)
(b)
Fig. 4. (a) Schematic of multiple quantum well (MQW) probe material and (b) corresponding photoluminescence spectra for a reference sample and a substrate bombarded by argon ions at 500 eV for 3 minutes at SO f.LA/cm 2
------1,.;'.§
1.0 ~ -~
Jg
-=
...J (.)
0.8
.f[./ argon bombardment at 350V
0.6
"t:l Q)
.bl iij
0.4
I
~
0.2 0.0
,I
;
I
~
E
z
/
(
I
/ 0
200
/
400
/
(
/
600
) argon bombardment at SOOV
600
1000
4465
Quantum Well Depth (A) Fig. 5.
Normalized CL damage profiles for incident Ar ions of 350 eV and 500 eV.
OPTICAL CHARACTERIZATION
1.0
bombarded and annealed
, _....i/ 500°C, 20 min
0.8
/r
l~~
0.6 0.4 0.2
49
I
A
bombardJd and annealed
35o"C, 20 min
';i' 1 / Argon-bombarded at soov
1
It
Quantum Well Depth (A} Fig. 6.
Effect of post-bombardment anneals on damage profile.
effects of ion bombardment, such as shown in Figure 5. All the CL and PL measurements that will be shown in this chapter are taken at low temperature ( ~4 K-1 OK). These data provided an exciting new vision ofthe propagation of etch-induced defects into the material, and allowed systematic comparisons to be made for changing etch/bombardment parameters, and for different post-etch treatments (Figure 6). The MQW probe technique is an extremely powerful one, with excellent sensitivity, and spatial resolution that is in many senses limited only by the number and proximity of quantum wells placed within the MQW structure. Not surprisingly, the data of Figure 5 show the increased damage (i.e. reduction in CL luminescence), at a given material depth, for increased ion bombardment energy. Figure 6 shows the effects of various postbombardment anneals on the material quality. Although the luminescence of the deeper quantum wells (presumably the 'less damaged' material) improves slightly upon annealing at 350°C and 500°C, full recovery of luminescence is not achieved for these conditions, and no recovery of the most heavily damage quantum well is observed for either annealing condition. The principal strategy that we shall follow in the development of experiments and ideas in the rest of the chapter will be to continue to utilize various multiple quantum well materials, such as that shown in Figure 4(a),
so
E.L. HU and C.-H. CHEN
subjecting the material to argon ion bombardment to simulate the physical component of ion-assisted etching, and utilizing the comparison of CL or PL spectra before and after the bombardment to trace the propagation of etch induced damage. Aware that a 'dynamic', chemically amplified etch process is far more complex, and that the chemical component may alter the actual damage profiles obtained, we nevertheless seek to lay the groundwork of understanding by working with as simple a representative system as possible. We will briefly consider the effects of etch-removal of the substrate surface, but will primarily work in a regime where the actual removal of material through ion bombardment is negligible. We note that experiments have been carried out that do seek to compare the effects of chemical etching on the damage profile [57, 58] and that Deng and Wilkinson have offered a model of etch damage that differentiates among the ion species in more complex etch gases [17]. A number of research groups have by now made use of such quantumwell substrates in their etching experiments [ 14, 23, 70]. One surprising, but general result that emerged is the unusually deep penetration of the damage profile into the material: about 1000 A for incident ion energies of only a few hundred electron volts. The new data on damage profiles therefore immediately stimulated further questions concerning the nature of the damage propagation.
4. THE RANGE OF ION-INDUCED DAMAGE Estimates of the extent of ion damage introduced into a substrate can be guided by the approach of Lindhard, Scharff and Schiott (LSS), whose 'unified' energy-range calculations formed the basis for the understanding of ion range and straggle in ion implantation processes [41, 42]. Such calculations form the basis of generally available simulation programs like TRIM (The Range of Ions in Matter). Using those calculations, and extrapolating to the much lower ion energies (few hundred eV) characteristic of ion-assisted etching processes, we would estimate that the ion range extends no more than a few hundred angstroms below the surface of the substrate. Although the ion and defect distributions are not necessarily coincident [48], we will operate on that premise, as a first approximation. In a 'dynamic' etching situation, where the substrate surface is being chemically removed at some rate, at the same time that ion damage is being introduced into the substrate, we might expect that the ion-damaged 'zone' would actually be more shallow. This estimate is obviously in contradiction to the experimental results obtained. We might question the accuracy of calculations generally applied to ion implantation energies, of lO's or hundreds of keV: there is no guarantee that the calculations will be accurate for our ion
OPTICAL CHARACTERIZATION
51
1.2
normal incidence 1.0
,..>II)
c:
0.8
..J ()
0.6
$ .E
-g N
'ffi
E ....
--~-------~~-:• ;
11
, (1
0.4
45° incidence
0
z
0.2 0 250
550
850
1150
1450
1750
Quantum Well Depth {A) Fig. 7. Difference in MQW damage profiles obtained for 450 eV argon ions at normal and 45° angle of incidence to substrate.
bombardment processes, with ion energies about a 1000 times lower. Secondly, we have not taken into account a phenomenon known to occur in ion implantation: ion channeling through the crystalline substrate.
4.1.
The Role of Channeling: A Major Discrepancy Removed
Perhaps one of the first experiments to clearly point out that ion channeling might be the reason for these deep damage profiles, was that carried out by Germann et al. [23], where a single quantum well probe structure was used, and the PL of that well was measured as a function of the angle of the ion gun with respect to the substrate surface. A clear dip in the luminescence was observed for an angle of incidence of 45°, corresponding to the (011) direction in the substrate, in apparent confirmation of the role of channeling in the propagation of ion damage. Our own multiple quantum well data, shown in Figure 7, also shows the greater optical degradation at 45° ion incidence. Despite this confirmation, puzzles remained: Germann's experiment utilized a focused ion source, where there was a clearly definable angle and direction between the ion source and the substrate. However, this deep
52
E.L. HU and C.-H. CHEN
Ar+ ions
c 0
.:: ctl
.. . ..
0'1
ctl
c..
e
a. c
.Q ctl 0
.-•' .... ..
.,
[i01]
t:
Q)
>
,.
[Oi1]
..··. \
.·:, ..·:,.
··. .. ··~.
~.
't
[ 1 01]
~
[011]
Projected Lateral lon Propagation Fig. 8. Schematic of SCHLEICH simulation, illustrating how ions can channel and penetrate more deeply into the substrate material.
ion-damage range had been observed for a variety of groups, using differing ion sources (parallel plate reactive ion etchers, ion guns) on substrates which may not have been oriented in a particular manner during the etch process. How do we reconcile the importance of the channeling process, which seems so critically dependent on orientation, with the general results obtained by different research groups, with experiments done in a variety of ways, carried out without particular thought being given to substrate orientation? The answer was provided by N. Stoffel, in his molecular dynamics simulations of low energy ion introduction into a substrate [64]. Stoffel's program, SCHLEICH (SCattering ofHeavy, Low Energy Ions into CHannels)
showed that some small percentage of ions, initially incident perpendicular to
the substrate surface, were fortuitously scattered into a channeling direction. This situation is represented schematically in Figure 8. Although a very small percentage of the incident ion flux, once scattered into the channeling direction, these 'lucky ions' were able to penetrate deeply into the substrate material. Stoffel used Germann's data for program calculations, and found far better agreement between experiment and model than had previously been possible using 1RIM calculations. However, the experimentally determined ranges still exceeded the calculated ranges by a factor of two or so.
OPTICAL CHARACTERIZATION
53
1.2
1.0 0
~
a:
...J
() "C CD
I
0.6
.!::!
I
(ij
E
l5
z
1.5min, 160}JA/cm2
---SiJ--
3m in, BO}JA/cm2
__..._ Bmin, 30~Ncm2
increased time
0.8
-·-
-0-
20min, 12~Ncm
-.-
60min, 4~Ncm2
I
I
I I I
0.4
I I
I
0.2
0.0
250
500
1250
1500
1750
Quantum Well Depth (A) Fig. 9. Normalized cathodoluminescence intensities for substrates bombarded by argon ion beams at 400 e V. Varying times and current densities were used to produce a constant total dose of9 x 10 16 ions/cm2 .
4.2.
Diffusion of Defects: Beyond Channeling Alone
In addition to channeling, another mechanism that would introduce defects more deeply into the substrate might be that of defect diffusion. In order to explore this possibility, we designed some experiments that would highlight diffusion effects [26]. MQW structures were used to assess the effect of varying temperature or varied time of irradiation (but with total dose constant) on the resulting profiles of damage. To first order, channeling probabilities should be insensitive to these variations, and therefore there should be no difference observed in damage distributions for these samples. Figure 9 shows the damage profiles obtained for a succession of ion bombardment conditions, having a constant total dose (9 x 10 16 cm- 2 ), but with differing values of instantaneous current density and total irradiation time. Quite clearly, for the longest irradiation time, the reduction in the luminescence intensity is the most profound, and the damage profile appears to extend more deeply into the substrate. One could argue that high instantaneous ion impingement rates could either change the nature of the substrate surface, or alter channeling probabilities (i.e., two ions coincident along the same channel). Our bombardment rates are quite low, however; moreover SCHLEICH simulation results indicate that only about 0.22% of the ions directed at. normal incidence will channel into the deeper regions of the material, further reducing the actual instantaneous flux of ions.
E.L. HU and C.-H. CHEN
54
Superlattice-MQW Probe AIGaAs x=0.35
AIAs/GaAs superlattice
_.::;r
SL AIGaAs
QW1
620A
AIGaAs QW2
900A
AIGaAs
QW3
1200A
AIGaAs
QW4
1495A
(a) 1.20 0
"ia cr: __J
()
-g N
«! E ..... 0
z
1.00 0.80
,
0.60
I
r
0.40 0.20 0.00
500
I
/
I I
,
I ,,
1000
,
_ ._ 1.5min, 160uNcm2 ~ 3min, 80uNcm2 -• 8min, 30uNcm2 - ._ 20min, 12uNcm2 -• 60min, 4uNcm2
1500
Quantum Well Depth (A) (b)
Fig. 10. (a) Use of the 'superlattice-MQW-probe' with the interposition of a lattice-matched AIAs/GaAs superlattice, resulting in the damage curves shown in (b).
OPTICAL CHARACTERIZATION
55
1.2 1.0 0
~
II:
0.8
....J (.)
"0 Q)
0.6
~...
0.4
.!::l 0
z
0.2
0 500
1000
1500
Quantum Well Depth (A) Fig. 11. Damage profiles for samples with (filled) or without (open) SL, following Ar ion bombardment at various energies for 3 minutes at 50 J..l.Ncm2 .
The incorporation of a superlattice into the MQW structure (Figure 10(a)) produced unusual damage profiles. By interposing a AlAs/GaAs (10 periods of 1 nm/1 nm AlAs/GaAs), between the substrate surface and the first quantum well, an improved damage profile resulted (comparing Figure lO(b) to Figure 9) but the improvement was observed primarily for the uppermost quantum well. Furthermore, as either the total irradiation time, or the energy of the incident ions is increased (Figure 11 ), the effect of the superlattice is diminished. SCHLEICH simulations of the ion ranges were not able to delineate any differences for the two different structures [27]. This indicates that the introduction of a lattice-matched superlattice does not alter the channeling probabilities for the incident ions. However, superlattices have been shown to be effective in gettering defects, and have been used in the epitaxial growth of high quality optoelectronic materials to prevent propagation of defects from the substrate material into the overlying device layers [53]. Using this information, we can begin to construct a framework of understanding of the 'superlattice data', and more clearly single out the contribution of defect diffusion.
E.L. HU and C.-H. CHEN
56
ions at normal incidence
(001) Surface
e
Quantum Well 1
Quantum Well 2 Fig. 12. Schematic of damage propagation from low energy ions. Ions incident normal to the substrate are scattered along a channeling direction, and propagate deeply into the substrate. Defects created by the stopping ions diffuse more deeply into the substrate; their presence is 'probed' by proximal quantum wells. The interposition of a superlattice may retard defect propagation into the adjacent quantum well.
Channeling allows the passage of low energy ions deep into the substrate. Particularly at the end of the range, transfer of ion energy to the material leads to displacement and defect creation. Assuming that there is appreciable diffusion of those defects, the QWs in our structures probe the defects that are spatially generated within a diffusion length of their position. This is indicated schematically in Figure 12. The superlattices used in these experiments have the ability to getter and retard the transport of defects. The effect of the superlattice will only be sensed by the quantum well probe in closest proximity to that superlattice (in our case, QW1 ). If we compare the SCHLEICH-calculated ranges of ions of 400 eV, 500 eV, and 600 eV with the position of the superlattice (Figure 13), we can provide a first interpretation of the data of Figure 11: defects created within the spatial extent of the superlattice may be gettered, and their further propagation into the material retarded. The range of the 600 e V ions extends beyond the superlattice, hence a relatively small percentage of generated defects are expected to be affected by the presence of the superlattice.
OPTICAL CHARACTERIZATION
57
2000
-
.
1.2
.~ 0
1.0
0
c
==
Q) Q)
0.8
0
c
Q)
0
en Q) c
0.6
:::::s
0.4
--o-
Ar bombarded
0.2
__._
Ar + 4mW HeNe
.E
'0 Q)
.!:::!
....~ 0
z
0.0
500
1500
1000
Quantum well depth
(A)
Fig. 18. Damage profile for the GaAs MQW for samples with (dots) and without (circles) 250 mW/cm2 HeNe laser illuminations during ion exposure (above bandgap).
;;g e....
10
""t1S "0
0
E ~
Cl Q)
-10
"0 Q) (,)
c
Q)
Ar bombarded only
(,)
fJ)
Q)
c
.E
.2 "0
............
-20
............... i
' ''
-30 -40
QW1
Q)
.!:::!
~..... z0
·50 ·60 10
Fig. 19.
''\
'
' ''!
100
1000
Degradation of QW luminescence efficiency versus HeNe laser power density.
OPTICAL CHARACTERIZATION
63
;? ~
~
1.0
Q)
= :s::2
Q)
0.8
Aronly
Q)
g Q)
0
0.6
Ar + 65mW lnGaAs
In
·e!!!
0.4
~
'0 Q)
.~
0.2
(ij
E ....
z0
0 500
1000
1500
Quantum well depth (A) Fig. 20. Damage profile for the GaAs MQW for samples with (dots) and without (circles) InGaAs laser illumination during ion exposure (below bandgap).
in luminescence, with no significant increase in damage as the laser power density is increased (see Figure 20). Below-bandgap illumination results in a minimal increase in damage profile. Rather than radiation-enhanced diffusion, one might question whether the effect of the laser would be to provide local heating of the material, thereby augmenting defect diffusion. In fact, the laser-induced temperature rise is negligible at the power density used in the experiments. The spot size of the laser beam used in the experiments is "'1 mm. or even larger. Lax's theoretical calculations [37] of temperature rise induced by Gaussian laser beam irradiation absorbed in the solid indicate that the maximum temperature rise is "' 0.1 oc at the MQW surface for the 4mW HeNe laser used in the experiments. This is not expected to be high enough to produce a change in the MQW damage profile. It is also important to note that laser illumination of samples that were not carried out concurrently with ion bombardment produced no change in the PL
intensity of the sample. That is, laser-induced changes in the PL spectra could only be brought about during ion bombardment. Ion bombardment creates an environment local to the defects that lowers the effective barrier to defect diffusion. The energy transfer between lattice and incident ions in collision cascades will result in increased lattice vibration and local heating. This can
64
E.L. HU and C.-H. CHEN
be far more effective on a local scale than changes in defect diffusion and annealing brought about by temperature changes made to the entire substrate. Our results show clear evidence of radiation-enhanced diffusion of etch induced defects, but it is not yet clear if recombination enhanced diffusion alone can explain the high mobility of ion-induced defects. Further analysis and experiments are clearly required to better understand the enhanced diffusion of etch-induced defects.
4.5.
Etch-Rate Dependence of Damage
Our discussions of damage propagation, and the simulations have up to now not taken into account the chemical component of the ion-assisted etch process, and the possibility of removal of defects during the etch process. Intuitively, shifting the balance of the etch process to a more chemically (rather than physically) driven process should also produce a lower damage process. Experiments carried out by Skidmore et al. showed improvements in both surface quality and bulk damage when utilizing a greater chemical component in the etch process [57]. We have used CHANDID to calculate the effect of a finite etch rate and etch-removal of surface damage; in this case, the surface of the substrate moves with a velocity corresponding to the sputter/etch rate, Re, and the position of the surface is therefore 'reset' at each time interval of the numerical calculation. Figure 21 shows the results of that calculation on the defect profile and the total accumulated damage in the material. The faster sputter (or etch) rate results in lower total accumulated damage. In our case, the total ion dose is the same in all cases: the simulations are not simply reflecting lower integrated ion dose (that is, a faster etch rate at the same ion dose results in a lower integrated ion dose to produce a give etched depth). The critical process in this case is the rapid removal of the highly defect-ridden surface region, on a time scale that is fast compared to the time required for diffusion of those defects away from the surface. However, although the total integrated damage is reduced in samples with higher argon sputtering (etch) rates, the damage at the surface is higher.
4.6.
Ion Damage to Etched Sidewalls
The discussion up to now has centered on the introduction of ion damage directly into the bulk of the substrate. In many cases, the critical, device-active material will be covered by a mask during the etch process, which should impede the introduction of the defects into the underlying material. However, in spite of the highly anisotropic nature of the process, etch damage can be introduced to the sidewalls of the structures being etched, either through chemical modification of the surface, or through some amount of ion
OPTICAL CHARACTERIZATION
-
65
-
0.25 A/sec 1 A/sec - - 4Aisec
850
0
1000 (a)
8, ~
0. 7
E
0.65
"'0
0.6
~
.s~ ::J E
5
(.)
0
..:. 0.45
-
r-r""T"""r--r",.....,...-r-r-T""T""T--r",.....,...-r-lr"""T""T""T""T"",.........~
2
4
6
8
Etch rate (A/sec)
10
oQ)
{g ::J
1 .2 (/)
12
(b) Fig. 21. CHANDID simulations of (a) the influence of the etch-rate on the time dependent damage distribution, and (b) time dependence of accumulated damage in the bulk and at the surface of the etched sample. The simulations correspond to 500 eV Ar ion exposure, at various current densities to achieve a constant etched depth of I 00 A .
66
E.L. HU and C.-H. CHEN
scattering that attacks the sidewalls. This is particularly critical for structures that have a large ratio of surface to volume, and has limited the minimum diameter of etched vertical cavity surface emitting lasers (VCSELs) [15]. Utilizing PL data taken from InGaAs/InP and GaAs/AlGaAs wires etched through a various dry etch processes, Maile et at. determined that the ion-assisted etching could give rise to optically inactive sidewall layers on the order of "-'lO's of nms [45, 46]. Wet etch-removal of the optically 'dead' layer, followed by passivation through surface treatment and regrowth has been used to overcome this process-induced materials limitation. 5. ENGINEERING MATERIALS FOR GREATER ROBUSTNESS TO ION DAMAGE A fairly consistent picture of ion-induced defect generation is emerging, with important implications for the design of low-damage etch processes. The experiments described earlier in this chapter have confirmed the wisdom of designing etch processes with high chemical component, and low ion energies. They have provided some guidelines for carrying out in situ, effective annealing out of defects. Simulations and interpretations are still very much at the phenomenological stage: much more work remains to be done to identify particular defects, understand their formation and interactions with the lattice and with other defects. Use of techniques such as Deep Level Transient Spectroscopy (DLTS) has helped to trace the evolution of particular ion bombardment-induced traps during low energy ion exposures, and shown that the highly mobile defects generated during low energy ion exposures are basically associated with the components of primary point defects, such as such as interstitials and vacancies [ 11, 32, 73]. There is a great deal of work going on in the development of dry-etch schemes that will minimize damage to the substrate. We will proceed in this chapter, not by consideration of defect behavior associated with various etch schemes, but by further examining defect behavior in different materials, having different microstructure. The goal here is twofold: (I) to be able to ultimately extend our simulations and insights from the Ga(Al)As materials to other important optoelectronic materials, and to thereby augment the
accuracy of the simulations and begin to test its predictive capabilities. The second goal is to see if we can engineer materials, like the superlattice structures discussed earlier, which may either be themselves more robust with respect to etch-associated damage, or which may serve as barriers to or getters of defects. In the next section, we describe some of our initial studies in this area, examining the damage profiles of InP-based materials, nonstoichiometric GaAs (or low temperature-grown GaAs), strained quantum well material, and finally, quantum dot materials.
OPTICAL CHARACTERIZATION
67
1.2 ;
0 ctS ....
_J
c..
""0 Q)
.!::! ctS
....0E
z
1 0.8 0.6
GaAsOWs
, ~,
0.4
lnGaAsQWs
0.2 0
500
1000
1500
Quantum well depth (A) Fig. 22. Damage profiles for GaAs QWs and lnGaAs QWs after 500 V Arion bombardment for 3 minutes, at 50 J,LNcm 2 .
5.1.
Etch Damage of InP
InP-based materials are critical optoelectronic materials, particularly for the longer wavelength (1.3, 1.55 JLm) device applications. Multiple quantum well probe materials can be grown in this material system, utilizing InGaAs quantum wells. We have carried out a number of comparative studies between GaAs and InP-based MQW s, subjecting samples to the same conditions of ion bombardment, and subsequently using PL to analyze the resulting damage profiles. Figure 22 gives a comparison of the damage profiles for GaAs and InP bombarded by 500 V Argon ions for 3 minutes at 50 JLA/cm 2 . Clearly, there is a more profound effect on the InP sample than on the GaAs material. If we monitor the effects of increased irradiation time (with constant total dose) on the PL intensity, we see in Figure 23 that the InP material degrades more rapidly with increased ion exposure. Finally, laser-illumination during ion bombardment, produces a degradation in the InP MQW damage profile, similar to that observed for the GaAs MQW material. The most extensive comparisons of ion damage in compound semiconductors have been carried out for ion energies in the keV and MeV range, characteristic of energies used for ion implantation. Using Rutherford Backscattering Channeling (RBC), and optical absorption measurements, Wesch et al. have reported higher defect densities in the phosphides,
68
E.L. HU and C.-H. CHEN
1.2
;
0
~
..J
a.
"C Q)
.!:::l
0.6
ctS
0.4
0
0.2
E ....
z
.. ,
0.8
"
GaAs QWs
..
" ..
lnGaAs QWs
0 0
Exposure time (minutes) Fig. 23. Time dependence of PL degradation of QW3 in the GaAs and InP-based MQW samples. 500 V Arion bombardment was carried out at varied ion currents and exposure times to maintain a constant dose, 4.5 x I0 16 tcm2 .
compared to the arsenides, for incident ion energies >200 keY [68]. The primary defects created in GaAs are believed to be point defects, such as vacancies and interstitials, with sufficient mobilities that a substantial fraction of the defects are annealed out during the bombardment process itself, at room temperature. Such self-annealing is believed not to take place for defects and defect clusters in InP. Williams subjected Si, GaAs and InP to argon ion bombardment at energies of 1, 2 and 3 keY [69]. Total doses were on the order of I 0 15 -10 16 cm2 • InP was found to be the most sensitive to ion bombardment, with differential sputter removal ofP, as well as 'bombardment driven' defect diffusion. At 1 keY, and for the same ion dose, the amount of damaged material (as determined by RBC) was twice as great for InP as for GaAs. These results are consistent with the values of displacement energy calculated by Bauerlein [4] and incorporated by Stoffel into his SCHLEICH program. A partial listing of the derived displacement energies derived is listed in Table I. The asymmetry in the sizes of the In and P, compared to GaAs, produces the asymmetry and lowered displacement energies. We can follow up these trends in the lower ion energy regime of interest to us by using SCHLEICH calculations to compare the channeling depths and number of
OPTICAL CHARACTERIZATION
69
TABLE I Displacement Energy of Semiconductors [4] Substance
Si
Displaced Atom Displacement Energy (eV)
Si 12.9
InP In 6.7
GaAs
P 8.7
Ga 9.0
As 9.4
InAs In 6.7
As 8.3
InSb In 5.7
Sb 6.6
atomic displacements in GaAs, and InP subject to incident Ar ions of varying energy. The results are plotted in Figure 24(a) and (b). At each ion energy, the channeling depth in InP is slightly larger than for GaAs; more noticeable is the difference in the number of atomic displacements in the two materials, and the different rates of increase of atomic displacements with increasing energy. These differences may manifest themselves in the rate of formation, and ultimate concentration of defects, per incident ion. Having seen that SCHLEICH itself can indicate the trends of damage to be observed experimentally in the various materials, let us go further and compare experiment and simulations that invoke diffusion as well as channeling in the defect propagation. In a manner similar to the experiments carried out for GaAs MQWs, we designed InGaAs MQW structures, with and without the interposition of a lattice-matched superlattice comprising 4 periods of 10 A InGaAs QWs separated by 150 A InP barrier layers. (Another SL structure was designed and used, having twice as many QWs and half the thickness in the barrier layer to maintain the same overall material thickness. Within experimental error, the results obtained for the two superlattice structures were the same). The SL and NSL samples were then subject to the same conditions of Ar ion bombardment: different total irradiation times for a fixed constant dose (2.25 x I 0 16/cm 2 ) at 500 eV energy (See Figure 25). As in the case of the GaAs MQW s, the introduction of the SL layer improved the luminescence properties of the material; in the case of the InGaAs MQWs, the superlattice seemed to have a larger, and longer range effect than was true for the GaAs material. Figure 26 compares the percentage improvement introduced by superlattices in the two materials. These data were then used in CHANDID to extract a value for effective defect diffusion constant. The best fit to these data yielded D1nP = 4 X w- 15 cm2 /s- 1 X w- 14 cm2 /s, and DsL = 1 X w- 16 cm 2 /s. The defect diffusivity in InP is slightly larger than that fitted to the data for GaAs. In summary, these experiments have shown that under comparable ion bombardment conditions, the InP-based material seems to degrade more substantially. This is borne out by the simulations and data that give deeper channeling ranges, a higher number of displacements, and yields a larger
70
E.L. HU and C.-H. CHEN
1000
~
~
800
-
400°C), the excess arsenic begins to form As precipitates embedded in the GaAs matrix. For GaAs/AlAs or GaAs/AlGaAs heterostructures, As precipitates are preferentially formed in GaAs or AlGaAs layers with lower AI composition. The size and density of precipitates are strongly dependent on the annealing temperature [67]. The lattice constant returns to the normal GaAs value after thermal annealing and the resistivity increases to 106-107 Q-cm. The unusual microstructure and electronic properties of the LT GaAs has led to a number of device applications: Incorporating an LT GaAs buffer layer between the substrate and active region can eliminate backgating in GaAs MESFETs [59]. In addition to serving as a buffer layer, LT-GaAs has been also employed as a surface passivation layer in a MISFET type structure to enhance the breakdown voltage or reduce the 1/f noise at frequencies below 100 Hz of a GaAs FET [49, 71]. Because of a high concentration of defects situated at midgap, the lifetime of photo-induced carriers typically is of the order
73
OPTICAL CHARACTERIZATION
'"
-
~
1
;.r;,.·.:-
~
'•
10A GaAs
~50AAIAs
1 - - - - - - - - - - - i ~ soA AlAs
AIGaAs X=0.35 530A
QW1 (20A)
810A
QW2 (40A)
1110A
QW3 (60A)
1405A
QW4 (30A)
Fig. 27. MQW structure with LT GaAs capping layer. A similar structure with a normally grown, rather than LT GaAs cap was used for comparison.
of a few hundred femtoseconds [60] leading to applications as high speed LT-GaAs photodetectors [13]. We have previously established the two main phenomena giving rise to deeply penetrating damage profiles: channeling of ions, and rapid diffusion of ion-created defects. It is possible that the LT GaAs may serve as an effective barrier to the propagatio·n of ion damage, both because of its non-crystalline structure, and because of an ability to getter defects. A number of experiments were undertaken to explore this possibility. The material structures used in this study were standard MQW structures, grown on semi-insulating (100) GaAs substrates by molecular beam epitaxy (MBE). Above the quantum wells, a thin layer of LT-GaAs (21 0 A ) and 50 A AlAs were grown at 250°C. The AlAs layers on either side of the LT-GaAs act as diffusion barriers for point defects during the subsequent thermal annealing (Figure 27). The control sample differs only in that the top thin layers of AlAs and GaAs were grown at 600°C. After growth, the LT-GaAs capped sample was cleaved into pieces, covered with a GaAs wafer, and then separately annealed in a rapid thermal annealer (RTA) at 600°C for 30 s in a forming gas environment (90% Nz and 10% Hz). Annealed samples together with control samples, were exposed to the Ar+ ion beam at room temperature in a RBIBE system for 3 minutes at beam energies of 500 eV or 600 e V with an ion beam current of 50 ~-tNcm 2 at normal incidence. As shown in Figure 28, samples covered
74
E.L. HU and C.-H. CHEN
1.2 1.0 0
+:::
0.8
a..
0.6
_,~
"0 Q)
.!::!
«i
0.4
z
0.2
E 0
0.0
500 eV bombardment energy
500
1000
1500
Quantum well depth (A) (a)
1.2 1.0 0
~
co _,....
a..
"0 Q)
.!::!
«i E .... 0
z
0.8 0.6 0.4
'normal' cap 600eV bombardment energy
0.2 0.0
500
1000
1500
Quantum well depth (A) (b) Fig. 28. Damage profiles for samples with a thin capping layer of LT-GaAs (dots) or regular GaAs (circles), following 3 minute argon ion beam exposure at ion energies of (a) 500 eV and (b) 600 eV, 50 11-Aicm2 at normal incidence.
OPTICAL CHARACTERIZATION
75
1.2 1.0 0
...
0.8
"0
0.6
:;:;
CIS
...J
a.. Q)
.!::!
...E
(ij
z
0.4
0
0.2 0.0
(1)
(2)
(3}
(4}
(5)
Fig. 29. The variation of QW PL efficiency, after 500 eV Arion bombardment for 3 minutes at 50 ~-tNcm 2 • MQW samples were either (I) as-grown without a LT cap, (2) as-grown with a LT cap, and annealed at (3) soooc (4) 600°C and (5) 700°C.
with a thin layer of LT-GaAs showed a great improvement in the quantum well luminescence by about 70% for a 600 V bombarded sample, indicating that the annealed LT GaAs layer can effectively reduce the deep penetration of ion damage. To better understand the role played by the LT GaAs, we attempted to systematically vary the microstructure of the LT GaAs through post-growth anneals at various temperatures: 500°C, 600°C, and 700°C for 30 sin a Rapid Thermal Annealer (RTA). LT-GaAs layers annealed at different temperatures produced varying degrees of improvement in the PL of the underlying QWs. As shown in Figure 29 the best improvement in PL efficiency of QWl and QW2 was observed for samples annealed at 600°C. The data also show a reduction of photoluminescence, compared to the control for the LT-GaAs capped sample that did not undergo a post-growth thermal annealing. This may be due to the out-diffusion of point defects from LT-GaAs capping layer into the underlying QW material, a process that may in turn be accelerated by the ion bombardment process. Figure 29 also shows a correlation of damage profiles with the microstructure of the capping LT-GaAs layer. Increased annealing temperatures will increase the precipitate size, at the same time decreasing the precipitate density in LT-GaAs layers, that is, increasing the separation between precipitates. Table II summarizes the average sizes and spacings between the arsenic precipitates at the various
E.L. HU and C.-H. CHEN
76
TABLE II Characteristics of As precipitates in the thin layer ( ~210 A) of LT-GaAs annealed at various temperatures from 500-700°C for 30 s, assuming the individual precipitates to be spherical with a diameter of d. Annealing Temperature ("C for 30 s)
Density (1016 cm-3)
500 600 700
152 22 5.7
Diameter
Spacing
0.2 2.0
0.6
DRY ETCH DAMAGE
121
by the presence of native defects with shallow ('"'-'30 meV) energy levels. By grading through Inx Ga 1-xN to an n+ InN layer, we can therefore produce low resistance ohmic contacts to GaN. Similarly, InGaN is also a potential channel material for heterostructure field effect transistor structures capable of high temperature operation. The problem of unintentional hydrogen passivation of dopants in GaN and related alloys has previously been observed during cool-down after MOCVD growth [49], and during dry etching processes [50]. An understanding of the role of hydrogen in both InN and InGaN is necessary for control of the conductivity of these materials during steps such as annealing in Hz, dielectric deposition with Sif4, wet etching in acids, or dry etching with CH4/H2 discharges, all of which are known to introduce hydrogen into other III-V semiconductors [51]. To study these effects, layers of"' 0.3 J-Lm thick InN or Ino.sGao.sN were grown on semi-insulating GaAs layers at 500°C in an Intevac Gas-Source GenII system [51]. The nitrogen source was an electron cyclotron resonance discharge (2.45 GHz, 200 W), and triethylgallium and trimethylindium transported by He provided the group-III flux. The films contain both cubic and hexagonal phases and were n-type with carrier concentrations of "' 2 x 1020 cm- 3 for InN and 5 x 10 19 cm- 3 for InGaN. Ohmic contacts were placed at the four corners of 5 x 5 mm 2 sections using alloyed (420°C, 5 min) Hgln eutectic. Hydrogen plasma exposures were performed in a Plasma-Therm SLR 770 reactor using an ECR source and separate RF (13.56 MHz) biasing of the sample position. The RF power was held fixed at 100 W, corresponding to a DC bias of "'125 V, while the microwave power was varied for 0-1000 W. The process pressure was varied form 1.5 to 10 mTorr. Vander Pauw geometry Hall measurements were used to obtain the sheet resistance of the layers after various hydrogenation treatments. Figure 32 shows the ratios between the post-hydrogenation resistance of InN and InGaN films and their initial values, against the microwave power used to create the hydrogen discharge. In the case of InGaN, the passivation efficiency of the native donor states increases with microwave power, which is consistent with the increased concentration of atomic hydrogen in the plasma. This was confirmed by monitoring the 656 nm emission line of this species using optical emission spectroscopy. For InN however, there is a fall-off in passivation efficiency at higher microwave powers. This coincides with the observation of severe degradation of the InN surface. Preferential loss of N leads to a very rough morphology and its subsequent effects are two-fold: first, it prevents efficient permeation of further atomic hydrogen into the InN and secondly, the additional nitrogen vacancy concentration may increase the apparent n-type conductivity of the material. The dependence of the layer resistance on the process pressure during hydrogenation is shown in Figure 33. For both InN and InGaN, the effect of hydrogen is decreased as the presence is increased. At higher pressures,
S.J. PEARTON and R.J. SHUL
122
6 40sccmHz lOOWrf l.SmTorr
5
4 0
~
3
2
1
-e-
InN
-
InGaN
0+---~--~--~--~--~--~
0
200
400
600
800 1000 1200
Microwave power (W) Fig. 32. Sheet resistance ratio of nitrides before and after ECR H2 plasma exposure for I min, as a function of ECR source power.
6.-------------------------------, 5
40sccmH2 IOOWrf IOOOWECR
4
3
•
InGaN
e InN
2
0
2
4
6
8
10
12
Pressure (mTorr) Fig. 33. Sheet resistance ratio of nitrides before and after ECR H2 plasma exposure for 1 min, as a function of process pressure.
DRY ETCH DAMAGE
123
6
5
4 Q
~
~
-InN - - - InGaN
3
2
1
0
-+--',T---~---.---.---...-1
0 350
400 450 550 500 Anneal temperature (°C)
Fig. 34. Sheet resistance ratio of ECR H2 plasma exposed nitrides as a function of subsequent annealing temperature.
the efficiency of plasma dissociation under ECR conditions is subsequently reduced and recombination of hydrogen atoms into molecules decreases the passivation efficiency. We emphasize that the changes in the layer sheet resistance are dominated by hydrogen passivation effects since exposure of the samples to Ar plasmas under the same conditions produced no significant changes. This indicates that chemical (passivation) effects are much more important than physical (damage) induced changes in resistance. Hydrogen passivation of the shallow donors in both materials can be reversed by subsequent annealing. Figure 34 shows the annealing temperature dependence of the reactivation (1 min anneals). The initial conductivity in both materials is recovered with similar characteristics, with slightly higher stability for the wider bandgap InGaN. This would be expected if the native donors have a common origin, either as defects or impurities, whose electrical properties are altered slightly by the different matrixes in which they are incorporated. Similar thermal stabilities have been reported for passivated shallow native donors in InAIN and lnGaAIN, with reactivation energies of ~2.4 eV [52]. In conclusion, shallow native donors in InN and InGaN are passivated by atomic hydrogen, but with much lower efficiencies, than acceptors in the 111-V nitrides where changes in resistance of> 6 orders of magnitude can be obtained.
S.J. PEARTON and R.J. SHUL
124
ANODE
•
SCHOTTKY
SOURCE
GATE
~
n- .type p
DRAIN
'YP•
n+ SiCSUII-
n ·SiC •unu.te ·,
CATHODE
(b) MESFET
(a) Thyristor SOURCE
SOURCE
+
n• n+
DRAIN
(c) Static Induction Transistor Fig. 35.
drUINt~lon
SiC aubstrate
DRAIN
(d) UMOSFET
Schematic of various SiC electronic devices.
3. DAMAGE IN SIC 3.1.
Background
There has been a revival of interest in SiC-based high power, high temperature (> 250°C) devices and circuits for applications ranging from advanced
avionics, automobiles and space exploration to bore-hole logging [53-72]. SiC is the most mature of the candidate semiconductors, which include diamond and GaN, and has the advantage of high thermal conductivity and availability in both bulk, single-crystal and thin-film form. The two most common polytypes are 6H and 4H, although cubic material (3C) is also available. There are a wide variety of device structures that have been fabricated in 6H, including thyristors, static induction transistors, Schottky
DRY ETCH DAMAGE
125
diodes, metal-semiconductor field effect transistors (MESFETs) and carious vertical Metal-Oxide-Semiconductor (MOS) devices. Schematics of some of these structures are shown in Figure 35. In all of these structures there is a need for pattern transfer capability. While some success has been obtained with photo-chemical etching in electrolytes that oxidize the SiC surface and subsequently dissolve this oxide [73, 74], it is generally agreed that conventional wet chemical etching is not possible at practical temperatures. The absence of practical wet chemical etches for SiC has focused attention on the development of dry etching for device fabrication [75]. Some of the particular process steps performed using dry etching include deep mesa isol,ation ( ~ I 0 tLm) and shallow recess etching to expose a buried n-ohmic contact layer in high-voltage thyristors, formation of narrow trenches in vertical MOSFET devices and exposure of gate contact regions in MESFETs or static induction transistors. Both Si and C form volatile etch products in either F2 [54-71] or Ch-based [63, 72] plasma chemistries and some of the mixtures employed to date include CHF3, CBrF3, SF6, CF4 or NF3 in the former category and Ch. BCl3 and SiCl4 in the latter. Addition of 02 is often found to improve the removal efficiency of C (as CO or C02) [66] and to reduce surface residues when using CHF3, which is known to form polymers on some etched surface. There have been two general classes of plasma reactor reported for pattern transfer in SiC. The first is conventional reactive ion etching (RIE) at pressures from 10--225 mTorr. Under these conditions there is often a relatively high de self-bias, which can cause problems with mask erosion, damage to the semiconductor lattice and micromasking through back-sputtering of the electrode materials. The second general class is the so-called high density plasma sources, including Electron Cyclotron Resonance (ECR) [83-87, 90, 91], magnetron-enhanced RIE [87, 91] and Inductively Coupled Plasma (ICP) [95, 96]. These tools operate at lower pressure (1-2 mTorr) and with ion fluxes several orders of magnitude higher than for RIE. Etch rates of SiC with RIE tools are quite low (typically I-
1o-2
CJ)
zw
10"4
0 I-
10"6
z w a: a:
/~
100
I {
_(~ ~~~ -
I I - - - - - -
/ II
\1 I I I I
I
(b) ECR etched -----
1o-a
-
--\1I
II
::::>
()
-4
-3
-2
-1
0
2
BIAS (V) Fig. 41.
1-V characteristics of Pd Schottky diodes on dry etched SiC.
15 to 20 diodes were measured. Out of these a small number on each sample exhibited unusually high leakage current which were presumed to be related to defects in the as-grown SiC layers. Disregarding the outlying characteristics, Figure 41 shows I-V characteristics 0.59 W/cm 2 ) and ECR (-100 V, 800 W) etched surfaces. For these samples approximately 500 nm of material was etched away, and for rf-RIE H2 was added to obtain a smooth surface. Most notable is the large increase in the reverse bias leakage current for the etched samples. This increase is approximately two orders of magnitude for ECR etched samples and approximately six orders of magnitude for the rf-RIE samples. The Schottky diodes on the as-grown sample show average values of = 1.05 ± 0.02 eV and n = 1.34 ± 0.08, with the errors representing the standard deviations. The high ideality factor may arise from the presence of a thin interfacial layer between the Schottky contact and the SiC. The existence of such a layer is consistent with AES results showing 0 and N on the RCA-cleaned SiC surface. Schottky diodes on the as-grown sample show average values of = 0.637 ± 0.004 and n = 1.27 ± 0.03. The very high leakage current and low barrier height are consistent with the occurrence of significant lattice damage to the SiC caused by rf-RIE. In contrast, Schottky diodes on the ECR etched surface show values of = 0.874 ± 0.002 and n = 1.09 ± 0.05. The barrier height is lower than that of the as-grown sample, but much higher than that of the rf-RIE sample. This result together with the fact that less degradation is seen in the leakage
DRY ETCH DAMAGE
ICP Power 700 W Etch time 20 min. Pressure 7 mTorr 0 2 9 seem CF. 20 seem
133
.-·:~ t,O
tP ~
eo 7
/d"
1I 1 •; , Substrate bias voltage •; I -·-10V d -50 v -0- -120V --Control IQ fl
/o v f -·-
-20 -15 -10 -5 0 0.5 VOLTAGE (V) Fig. 42.
1.0
1.5
1-V characteristics of Au Schottky diodes on ICP dry etched SiC.
currents suggests that the ECR etching process is far less damaging to the underlying SiC than the rf-RIE process. Cao et al. [96] performed similar experiments on ICP CF4/02 etched SiC surfaces. Figure 42 shows 1-V characteristics (Ni rear contacts, annealed at 1050°C, and Au front Schottky contacts) from diodes etched at different substrate bias voltages. For biases of -50 V, the characteristics are similar to those for control samples that were not etched. Interestingly, diodes etched at -10 V had higher leakage currents, perhaps due to residues that are not removed under these conditions. ICP etching was employed to fabricate 4H-SiC gate turn-off thyristors with blocking voltage of "-'460 V without gate current.
3.4.
Effects of Hydrogen
Hydrogen is a component of virtually every gas or chemical involved in the growth and processing of SiC. For example, silane (SiH4) and propane (C3Hs) diluted with hydrogen can be employed as the sources for SiC epitaxial growth [101], and alternative organo-silanes are also gaining attention [102]. Boron doping can be accomplished with diborane (BzH6) diluted with hydrogen [101]. The extremely good chemical stability of SiC requires that dry etching be employed for patterning, and hydrogen is generally added to the plasma chemistry to avoid rough surfaces [ 103-1 05]. High temperature
134
S.J. PEARTON and R.J. SHUL
( 1500-1700°C) annealing in H2, followed by quenching to room temperature produces hydrogen passivation (up to "-75% decrease in carrier density) in both n-type (N-doped) and p-type (Al, B) SiC [106]. This effect was reversed by sybsequent annealing in He at the same temperatures. Annealing at 1700°C of chemical vapor deposited 6H-SiC epilayers increased the net hole concentration by a factor of approximately three and was accompanied by outdiffusion of hydrogen, and was consistent with residual passivation of B acceptors in the as-grown films. Theoretical studies of the properties of hydrogen in SiC have suggested that a tetrahedral interstitial site is the lowest energy site in undoped 3C-SiC, with a barrier to diffusion to the bond centered site of 1.5 eV [107-109]. In 6H-SiC, it was suggested that another interstitial position (the R-Site) was the lowest energy site, with the diffusivity being slightly slower in Si [107-109]. Thus, unintentional incorporation of hydrogen may occur at virtually any stage during the growth and processing of SiC, as it does in Si [110-112]. This will produce uncontrolled changes in the near-surface resistivity of the material through dopant passivation. The resistivity and breakdown voltage of this surface region are inversely dependent on doping density and therefore device characteristics may be strongly affected by the hydrogenation effects. In Si, acceptor passivation is a more efficient and thermally stable process than donor passivation because hydrogen occupies a more strongly bound bond-centered position between the acceptor and the nearest-neighbor Si atom, whereas in n-type material the hydrogen is at a less strongly bonded, anti-bonding interstitial position. It is, therefore, also of interest to examine differences in susceptibility of hydrogen passivation of n- and p-type material. Nominally undoped SiC (n "' 8 x 10 17 cm- 3 ) substrates cut 3.5° off (0001) towards the middle of [1010] and [1120] were implanted into the polished Si face with 100 keV 2H+ ions to a dose of2 x 10 15 cm- 2. Sections from these substrates were annealed under N2 for 20 mins at temperatures up to 950°C in a tube furnace, or for 1 min at 1000°C in a Heatpulse 41 OT system. Other substrates were exposed to an Electron Cyclotron Resonance 2H plasma (500 W microwave power, 10 mTorr Pressure) for 30 min at 300°C. The deuterium profiles were measured by Secondary Ion Mass Spectrometry (SIMS) using a cs+ ion beam [113]. The concentrations were quantified using implant standards, while the depth scales were established from stylus profilometry measurements of the analysis craters. In Figure 43 are shown the 2H atomic profiles in the plasma exposed sample before and after annealing at temperatures up to 1000°C. For as-treated samples, the incorporation depth is :::; 0.1 J.Lm and the peak 2H density at the surface is "' 1020 /cm 3 . The deuterium concentration in the plasma-treated material is reduced by "-90% with annealing at 800°C, and
1 min as measured by PL [32] and cathodoluminescence [33]. Cathodoluminescent intensity was reported to decrease after an etch time of 7 min compared to a sample etched for I min. The competition between creation and removal of damage by dry etching determines whether the devices will have low damage or not. Slow etching of Si has been shown to lead to accumulation of damage [10] while faster etch rates for GaAs have been shown to lead to a denser but shallower damage layer near the surface [34]. Etching damage extends deeper than the predicted
S.W.PANG
158
c
a:
e
1.3
300 W rf POWER
0
~ 1.2 ~
:J
..
120 s were not possible because the 1 fLm thick epitaxial layer would have been etched through. With the 100 and 300 W rf power, the etch rates were constant with etch time at 110 and 204 nm/min, respectively. The !Vdcl was 80 and 240 V for 100 and 300 W rf power, respectively. At these IVdc I and having a vacuum tight system with load lock, the native oxide and surface residue on GaAs can probably be removed instantaneously once dry etching starts. Therefore, no induction time was observed under these etch conditions. The changes in n and ¢h could be related to the diffusion of dry etching induced defects. As GaAs is etched, defects created at the surface could diffuse farther into the material due to defect enhanced diffusion, therefore lowering surface damage at longer etch times. On the other hand, the defects generated during the beginning of the etch could be etched away more easily at longer etch time due to disorder generated at the surface. Disorder at the surface caused by the etching may be responsible for the reduction in channeling [38]. The effects of the etch chemistry on the time dependent diode degradation were investigated. It was found that increasing the percentage of Ch during the etch improved the diode characteristics. Figure 9 shows the changes in ¢h with etch time for different Cl2 percentages in Ar. The etch condition used was similar to the one used in Figure 8 with the rf power fixed at 100 W. The diodes etched with Ar only showed a decreasing ¢h with etch time. The ¢h was 0.61 eV after 10 sand continued to degrade to 0.53 eV after 120 s. With the addition of only 5% Cl 2, the decrease in ¢h was less compared to Ar sputtering and the diode characteristics improved with etch time. At 10 s etch time, maximum degradation was observed and ¢h changed from 0.67 to 0.70 eV from 10 to 120 s. Less damage was induced with 10% Chin Ar and further increases in Ch percentage did not affect the barrier height etch time dependence. When the samples were etched by Ar sputtering, the ¢h continued to degrade with etch time. However, the addition of 5% Ch to Ar improved the diodes with etch time. The GaAs etch rate for 5% Ch in Ar was 40 nrn!min, substantially faster than the typical sputter rate of 5 nm/min when only Ar was used for etching. Thus, if the damaged layer was removed during the faster etching, the GaAs diodes tended to show better electrical characteristics [6]. This illustrates the competition between damage creation and damage removal that occurs during etching. Capacitance-voltage measurements of diodes etched for different times did not show a time dependence. There was some carrier depletion of 24% near the intrinsic depletion region and it extended as deep as 400 nm below the etched surface. However, neither the degree or depth of depletion changed with etch time. This may be due to the large intrinsic depletion layer near the surface that makes C-V measurements insensitive to changes in defect density very close to the top surface. This indicates that the time dependent effects may be related to surface changes only.
S.W. PANG
160
0.80
-
> 0.75
_.-CONTROL
Cl)
1:I: 0.70
t::I
I
, _ _ AIInAsllnGaAs QW
c
z
0
(J
1
o· 9 ....__...............1
1 o-1 o ......'-'__..-'-............_...._.~.....L....I__.,--~..............__._..~............'-'_. 0 200 400 600 800 1000 WIRE WIDTH (nm) Fig. 13. Comparison of the etch induced sidewall damage in AIGaAs/lnGaAs and AllnAs/lnGaAs QW conducting wires. The etch condition was 500 W source power, 50 W stage power, Cl2 flowing at 6 seem with a chamber pressure of 0.15 mTorr and a source to sample distance of 12 em.
GENERATION, REMOVAL, AND PASSIVATION
165
than that for the A1GaAsllnGaAs QW structure. Wires were defined by electron beam lithography with widths of 100 nm to I f-LID and etched to a depth of 700 nm in an etch condition of 500 W source power, 50 W stage power, Ch flowing at 6 seem, a chamber pressure of 0.15 mTorr, and a source to sample distance of 12 em. The IVdcl was 80 V and the etch rate for both materials was 280 nm/min. The conductance of the I f-LID wires was 2.2 X w- 5 and 1.3 X w- 5 n- 1 for the AllnAs/InGaAs and A1GaAs/lnGaAs QW structures, respectively. The AllnAs/InGaAs QW wires became non-conducting (9.9 X 10⁻⁹ Q- 1 ) at a width of 193 nm while the AIGaAs/lnGaAs QW structures were still conductive (5.7 X w- 7 n- 1). The electrical cutoff width for AIGaAs/lnGaAs QW wires was 146 nm, while it was 243 nm for the AllnAs/lnGaAs QW structures. Thus, when the effect of etch rate or damage removal rate can be neglected from the residual damage profile, the AllnAs/lnGaAs QW structures still show a greater degradation from etching than the AIGaAs/lnGaAs QW structures. Previously, it has been reported that the presence of a strained layer tends to getter defects [ 14] and cause higher degradation of strained quantum wells. In Figure 13, a lower degree of damage was observed for the strained AIGaAs/lnGaAs QW than the unstrained AllnAs/lnGaAs QW materials. The difference could be due to the small strain in the AIGaAs/lnGaAs QW structures and the different barrier materials.
3.3.
Electrical Degradation of Heterostructure Bipolar Transistors and In-plane Gated Transistors
Although wet chemical etching is often used for self-aligned AllnAs/GalnAs HBTs, the sidewall etch rate is difficult to control and the dimensions of the emitter must be kept larger than what is desirable. A controllable sidewall profile can be obtained by dry etching. One disadvantage to dry etching is the potential for ion-induced damage to the etched surface. There are also several advantages to using a high ion energy. For example, a high ion energy has been found to minimize the roughness that would otherwise occur due to the low-volatility of the InClx (x =I to 3) etch products [43]. High ion energy also assists in minimizing the etch initiation time by efficiently removing the surface oxide at the start of etching [44]. However, the use of high ion energy promotes damage to the etched surface. The effects of ion energy on specific contact resistivity (Pc) for lightly doped n-type GalnAs has been studied [13]. The base layer is heavily doped p+ -GalnAs and so the effects of ion energy on the contact resistance of this material needs to be determined. Damage to GalnAs has been found to increase the sheet resistance ( Rs) for IVdc I above I 00 V when only Ar or Hz was used to etch the material [45]. We have found that for n-type material, increasing ion energy decreases the Pc· However, the Pc increases with
S.W. PANG
166
.r-
.
2.5
2.0
2.0
1.8
E u Cl
1.5
~
1.0
1.4
0.5
1.2
b...
u
____.. ---
1.6
0
5
10
15
20
25
)(
....
0,
Q.
0
. :a
30
"'
[0
n
.!
1.0
C 1 PERCENTAGE IN Ar (%) 2
Fig. 14. Effect of microwave power on specific contact resistivity and sheet resistivity of GalnAs. The samples were etched with IVde I of 130 V, 13 em, C(z/Ar at 1/9 seem, I mTorr and 30°C.
increasing ion energy for p-type material. Also, the amount ofdamage and the depth of the damage into the material increase as the ion energy is increased. For samples etched with microwave power ranging from 50 to 150 W, Pc and Rs remain mostly constant as shown in Figure 14. As microwave power was varied from 0 to 150 W, the rf power was varied from 42 to 48 W to maintain constant IVdc I at 130 V. Meanwhile, the etch rate increased from 6 to 45 nm/min as the microwave power was increased from 0 to 150 W. For 5 r.lcm 2 and R. · is the wet etched GalnAs control sample, Pc is 7.5 x 1 2 1.45 X 10- r.l-cm. The results indicate that surface damage is independent of ion flux since Pc and Rs do not change with microwave power. Even though it is possible for more damage to be generated at higher ion flux, the faster etch rate at higher microwave power may remove the generated defects more efficiently and compensate the increased damage. However, Pc is only 2.1 x 1o- 5 Q-cm 2 over this range of microwave power, approximately 70% lower than the control sample due to defect generation. When only rf power was applied and no microwave power was used, Pc decreased further to 1.1 X 10-S Q-cm 2 . The increased surface damage when no microwave power was applied may be related to more damage accumulation since the etch rate is reduced. It has been previously shown that a balance exists between defect generation and removal, and the value of IVdc I determines whether increasing microwave power enhances or degrades device performance [6].
w-
GENERATION, REMOVAL, AND PASSIVATION
10 8
-4-+-- CONTROL , ,' ,
.rE
y
a
b,...
~
,,
, ,,
,
300 250 200
4
150
u
Q.
b of GaAs diodes at the etched surface was lower for shorter etches. When the etch time was increased from 10 to 60 s, the degradation in ¢b was reduced. The results show that the damage creation was greatest near the top 5 to 10 nm of the etched surface for GaAs and the etch time dependent changes may be confined to this layer. After removing 15 nm from the dry etched surface, the diode characteristics were completely recovered to the original levels. The depth profiling for Ino.53Gao.47As obtained using wet chemical removal is shown in Figure 30. In contrast to the GaAs, the damage as measured by contact resistance was more intense for the longer etch. This shows that the defects in Ino.s3Gao.47As tend to stay near the top 10 nm of the etched surface. While the samples dry etched for 10 and 60 s showed large variation in contact resistance at the surface, after wet etching 5 nm,
the difference in contact resistance was much less. In contrast to the GaAs, wet etching to 20 nm did not fully return the material to the control sample level. Typically, wet chemical etching is effective in removing dry etching induced damage. The damage depth, and hence the layer thickness to be removed by wet chemical etching, depends on the dry etch conditions.
S.W. PANG
184
0 .8 0
.'T"1.,
I"""'"'T"T"T"''r"T"'I"'T'T"1"'T"I"""'"'T"T"T"''r"T"r-r"T"T"T"''r"T"'I"'T
CONTROL
> o. 75 r------==~-----1 ....r_-,:J.---
.!,.
1::1: 0.70 CJ
-
60 s ,..~,..-
r-
•
,..
•
••
iii ~-" ••••• ::1: 0.65 r-
ffi
a:
~ CD
0.60
__•••••
••
~·
-
10 s
-
0.55 0.50
•
•
I
'
5
0
-• I
15
10
WET ETCH DEPTH (nm) Fig. 29. Slow wet etching of GaAs for damage depth evaluation. Barrier height is plotted for different wet etch depths after dry etching for I 0 and 60s. Etch condition was 50 W microwave power, 300 W rf power, Chi Ar flowing at 3/27 seem, 1.5 mTorr chamber pressure and stage position of 12 em.
....... OJ
c
~
w
0
z
ct
1-
U)
c;; w a:
10
ct
1-
z
10000
I
I
-
8000
~\• 6000 - \ • \ 4000
I"
•,......-so s
•
..... '· .. 2000 f• •
0
(,)
0
--
10 s
~CONTROL •• -'=""... ,...
0
5
10
15
20
WET ETCH DEPTH (nm) Fig. 30. p-lno.s3 Gao.47 As damage depth profiling for I 0 and 60s etch times. Contact resistance was measured after wet etching to different depths. Etch condition was the same as in Figure 29.
GENERATION, REMOVAL, AND PASSIVATION
185
1 o·2
-cc
1-
z
w a: a:
:::» 0
1 0-3 1 o-4 1 0-5 1 0-6 1 o·7 1 0-6 0.2
0.3
0.4
FORWARD BIAS (V)
0.6
Fig. 31. Effects of etching temperature on the forward 1-V characteristics of GaAs diodes. The samples were etched at 0.6 mTorr with 30% Ch in a Ch/Ar plasma, 50 W microwave power and 200 W rf power.
The drawbacks of damage removal using wet chemical etching include difficulties in controlling etch rate, achieving smooth surface morphology, and avoiding undercut profile.
4.2.
Thermal Annealing
The 1-V characteristics of GaAs Schottky diodes etched at temperatures between -130 and 350°C are shown in Figure 31. The samples were etched with a Ch/Ar mixture with 30% Ch, 50 W microwave power, 200 W rf power at 0.6 mTorr and 18 em source to sample distance. Lower leakage current was observed for samples etched at higher temperatures. This is possibly caused by the more efficient removal of the surface damage due to the faster etch rate as well as the annealing effects at higher temperature. The GaAs etch rate increased from 77 to 398 nrn/min as the temperature was increased from -130 to 350°C. Figure 32 shows the 1-V characteristics of the GaAs diodes after dry etching and rapid thermal annealing (RTA). The samples were etched at 25°C under similar condition as described above. After etching, RTA was carried out at temperatures between 400 and 540°C in a N2/H2 ambient for 2 min. The ideality factor improves from 1.23 to 1.07 and the barrier height increases from 0.63 to 0.70 eV after the etched sample were annealed at 480°C. This suggests that etch-induced damage could be
S.W. PANG
186
1 o-2
--< .z..
w
a: a:
::J 0
1 0-3 1 o-4 1 0-5 1 0~ 1 o-7
1 o_.
Fig. 32. Forward 1-V characteristics of GaAs after dry etching and RTA. The samples were etched at 25°C under similar condition as described in Figure 31. Rapid thermal annealing was carried out in a N2/H2 ambient for 2 min.
partially removed by annealing. No further recovery was observed by using annealing temperatures > 480°C or longer annealing time. The unalloyed contact resistance of GaAs transmission lines etched at different temperatures is shown in Figure 33. The samples were etched with 20% Ch in a Cl 2 / Ar plasma using 50 W microwave power and 200 W rf power at 0.5 mTorr. The contact resistance decreased from 2.8 to 1.6 kr2 as the etch temperature was increased from 25 to 350°C, indicating that less damage was induced on the surface at higher temperature. The improvement of the contact resistance may be related to the defect annealing effects and the faster GaAs removal rate at higher etch temperature. The etch rate increased from 221 to 292 nrn/min as the temperature was increased from 25 to 350°C under this etch condition. Figure 33 also shows the reduction of W:f measured from the conducting wires etched at higher etch temperature. The samples were etched under similar etch condition as the transmission lines except that I 0% Ch was used. As the etch temperature was increased from 25 to 350°C, W:f decreased from 13.1 to 2.7 nm. 4.3.
Two-Step Etching
The motivation for using two different etch conditions to remove the emitter layer was to reduce roughness and damage simultaneously. The roughness
187
GENERATION, REMOVAL, AND PASSIVATION
-a
.!11:
w 0 z < 1~
tn
w a:
10
~ 16 c
3.0
14
2.5
...
2.0 1.5
...
1.0
10
8 6
0.5
4
0 0
0.0
2 100 150 200 250 300 350 400 TEMPERATURE (°C)
0
50
:e>
r 12 r
< 1z
m
c
> > G)
::::::
m
,mc -f :::t
-
:I
3
Fig. 33. Unalloyed contact resistance of transmission lines (•) and Ws of conducting wires as a function of etch temperature. The samples were etched with 50 W microwave power and 200 W rf power at 0.5 mTorr in a Cb/Ar plasma.
B for the control sample were 1.03 and 0.76 eV, respectively. After dry etching, n and if>B degrade to 1.32 and 0.63 eV, respectively, but they recover to the same level as the control sample after passivation with a C)z plasma with no Ar addition, as shown in Figure 40. As more Ar was introduced in the C)z plasma during passivation, however, the passivation becomes less effective. With 60% Ar addition, n and if>B recover only to 1.26 and 0.64 eV, respectively. These results show that Ar addition in C)z is not desirable for plasma passivation, and this may be related to the dilution effect. The additional Ar can also occupy some of the surface sites on GaAs, and less chlorine species can be accommodated on the GaAs surface to form a good passivating layer. The pressure used for Clz plasma passivation was also varied in order to find the optimal conditions for this passivation technique. Figure 42 shows the changes in the electrical characteristics of the unalloyed GaAs transmission lines after dry etching and passivated with C)z plasma at different pressure has been studied. The samples were passivated under similar condition shown in Figure 40 for 30 s with pressure ranging from 2 to 8 mTorr. After dry etching, the unalloyed contact resistance increases from 0.1 to 3.8 kQ, but it recovers back to the control level after 30 s C)z plasma passivation at pressure ranging from 2 to 8 mTorr. This agrees with the results obtained above from the Schottky diode measurements and shows that C)z plasma was indeed very effective in passivating the etch-induced damage on GaAs. The pressure used for C)z plasma passivation has no significant effect on the electrical characteristics of GaAs diodes or transmission lines. For device applications, it is also important that the passivated surface remains stable at high temperature. For this purpose, the thermal stability of the C)z passivated surface has also been investigated. Samples of GaAs were first dry etched and then passivated for 30 s in a C)z plasma under the
GENERATION, REMOVAL, AND PASSIVATION
a:
0
1(,)
1- 1.15
:D
0.62 0
10
20
30 40 50 Ar IN Cl (%) 2
60
70
-1
(;"
.!5
800.60
Fig. 41. Ideality factor and ¢B extracted from diodes etched and passivated in a Ch plasma with Ar addition for 30 s. The plasma for passivation was generated under similar condition as in Figure 40 with 0 to 60% Ar.
8
-
7
w
5
~
.lie:
0
z < t-
en en w a:
6
4 3
2 1 0
0
5
10 15 L (J.Lm)
20
25
Fig. 42. Contact resistance of the unalloyed GaAs transmission lines that were etched and passivated with a Cl2 plasma at different pressure for 30 s.
198
S.W. PANG
same conditions as shown in Figure 40. After passivation, the samples were subjected to temperatures between 200 and 450°C in a N2 ambient for 3 min. Diode measurements on these samples showed that the Ch passivation was stable and there was no change in electrical characteristics of the passivated samples at temperatures up to 450°C. This result suggests that the GaAs surface passivated with the Ch plasma has good thermal stability and is suitable for device fabrication. The electrical characteristics of the dry etched GaAs after N2 or N2/H2 plasma passivation were also investigated. Table I shows the changes in the I-V characteristics of the dry etched GaAs diodes after being passivated in a N2 plasma at different temperature and microwave power. The samples were first dry etched in a Ch/Ar plasma under similar conditions as before, and then passivated with a N2 plasma generated at 5 mTorr for 2 min. Unlike the Ch plasma passivation, passivation with N2 plasma is not effective at 25°C or with 50 W microwave power. However, with 500 W microwave power, the I-V characteristics improve with higher passivating temperatures, and become similar to the control sample at 350°C. Compared to Ch plasma, N2 plasma passivation of dry etched induced damage requires much higher temperature and microwave power. Annealing the dry etched samples at 350°C without the N2 plasma only results in partial recovery of the diode characteristics. Therefore, the improvements shown in Table I are not just an annealing effect, but rather the reactive species in the N2 plasma are also responsible for the complete recovery observed. The recovery of the electrical characteristics in a N2 plasma could be related to the formation of a nitride layer which passivates the dangling bonds on the surface. It probably requires high temperature to promote the nitride formation and/or partially anneal out the etch-induced damage, it also needs high microwave power to provide high concentrations of reactive species for the nitridation. Since H2 could remove the excess As203 and As that are responsible for the formation of the AsGa antisite defects [64], the effects of adding H2 to the N2 plasma were also investigated. GaAs samples were first dry TABLE I Changes in the diode characteristics as a function of temperature and microwave power during Nz plasma passivation. The diodes were passivated for 2 min
in a N2 plasma generated at 5 mTorr.
Temperature Control Dry Etched 250°C 350°C 350°C
Microwave Power (W)
500 500
so
n
' i= 0 w LL
.
10
~
I
NjH:-PASSIVA,TION I
I
I
I
I
I
•
150 200 250 300 350 400 450 500 550 DISTANCE (nm)
Fig. 43. Doping profiles extracted from C-V measurements showing re-activation of the dopants after annealing in N2 for 3 min. The diodes were first dry etched and passivated with a N2/H2 plasma, generated with 50% H2 and 500 W microwave power at 2 mTorr for 2 min.
etched under the same condition as before, and then passivated for 2 min using a Nz/Hz plasma with Hz% ranging from 0 to 100%. The plasma was generated with 500 W microwave power at 2 mTorr. The addition of Hz has no effect on the 1-V characteristics and the results are similar to passivation by Nz plasma. However, the C-V measurements reveal significant dopant passivation when Hz is added, as shown in Figure 43. After passivation with 50% Hz in the Nz plasma, the dopants were depleted from the surface up to a depth of 400 nm. This dopant passivation effect, however, can be annealed out. Figure 43 shows that the doping concentrations of the etched and Nz/Hz passivated diodes recover after being annealed at 450°C in a Nz ambient for 3 min. The hydrogen in the passivated samples are probably being driven out at high temperature and this re-activates the Si-dopants, resulting in the recovery observed. Passivation of dry etched GaAs using a Hz S plasma was studied. Figure 44 shows the changes in IVnRI and tPn for the dry etched GaAs diodes after passivation in HzS plasma and then annealed for 2 min at different temperatures. The samples were first dry etched in a C}z/Ar plasma under similar condition as before, and then passivated in a HzS plasma generated with 100 W rf power at 200 mTorr for 5 min. It can be seen that annealing at 300°C is needed after HzS plasma passivation, and even then the recovery is not complete. Measurements on transmission lines showed a decrease of the unalloyed contact resistance from 3.8 to 2.8 kn after being etched and passivated with the HzS plasma. Similar to the diode results in Figure 44,
S.W. PANG
200
0.78
20
--
0.76
18
0.74 0.72
> 16 a:Ill
>
m 0.70 lJ 0.68
14
::z::
!!!
0.66 G) ::z:: -1 0.64
12 10
tD
)>
lJ lJ
0.62 0
50
100
150
200
250
300 ANNEAUNG TEMPERATURE (oC)
0.60 350
-.s (11
Fig. 44. Changes in IVB R I and¢ B with annealing temperature on diodes etched and passivated with a H2S plasma generated using 100 W rf power at 200 mTorr for 5 min. Annealing was carried out in situ after the passivation for 2 min.
the recovery is not complete since the unalloyed contact resistance for the control was only 0.1 kr.l. The improvement in the electrical characteristics after HzS passivation could be related to the formation of a thin protective S layer on the GaAs surface. It has been reported that the Ga-S bonds can reduce surface state density on GaAs [65]. However, high temperature annealing is needed to desorb the excess S on the GaAs surfaces [66, 67]. Similar to Nz/Hz plasma passivation, a large decrease in dopant concentration near the surface is observed from the C-V measurements for the H2 S passivated samples due to the presence of Hz in HzS. However, this effect can be alleviated by using lower rf power to generate the HzS plasma for passivation. The effectiveness of Clz plasma passivation on dry etched lPG transistors were demonstrated [68]. The lPG transistors were first dry etched with 20% Clz generated using 50 W microwave and 200 W rf power at 0.5 mTorr. After the dry etching, the samples were exposed to air for ,...., 2 hrs which allows native oxide to form on the surface. The dry etched lPG transistors were then passivated with a Clz plasma generated with 50 W microwave power at 2 mTorr for time ranging from 1 to 2 min. The gate leakage current as a function of Vcs for these transistors were shown in Figure 45. For the lPG transistors with Wg = 400 nm, the gate leakage current at Vcs = 2 V was 40 nA, and it decreased to 4.4 and 3.5 nA after being passivated with the low-energy chlorine species for 1 and 2 min, respectively. Since no rf
GENERATION, REMOVAL, AND PASSIVATION
201
1~5 r-r-r-r-~~~~~~~~~~~~~~~~~
NO PASSIVATION ...... ·-·······································
..................................... ····
::: //:>' ....·
g., -"'
:C :C : '-'' '
;,~~~~~~:~:~",~;:.;' c
i // 1
o· a f 1
1 min
!/
2 min
!/
--w
"
1
o· •
0
=400 nm
.......·-W =100 nm
!!
2
4
6
g 8
8
10
Vo s (V)
Fig. 45. Reduction of the gate leakage current for dry etched lPG transistors after being passivated with low energy chlorine species for different time. All transistor were first dry etched with 20% Ch using SO W microwave power and 200 W rf power at O.S mTorr. The Clz plasma for passivation was generated using SO W microwave power at 2 mTorr.
power was used for generating the plasma for passivation, the ion energy of the chlorine species is very low, and no etching can be measured during the passivation step due to the presence of the native oxide on the surface. Therefore, the decrease in the gate leakage current shown in Figure 45 is not caused by the removal of the surface damaged layer or changes in the etch depth, but is probably related to passivation. It is possible that the etch-induced defects that caused the gate leakage current were passivated with the low-energy chlorine species. 5. SUMMARY Dry etching induced surface damage has been characterized using various electrical, surface analysis, and optical techniques. The surface damage depends mainly on the ion energy, ion flux, concentration of reactive species, etch temperature, etch time, and etched materials. High ion energy or sputtering with inert gases results in high defect density and the formation of a non-conducting damaged layer on the surface. It is found that higher ion energy, higher ion flux, or lower etch temperature causes a larger W,,., and these are similar to the results observed on the Schottky diodes and unalloyed
202
S.W. PANG
transmission lines. Enhanced defect diffusion has been observed from TEM for GaAs etched at higher temperature. However, the electrical characteristics of Schottky diodes, unalloyed transmission lines, and conducting wires actually improve due to lower defect density by annealing. Degradations could be observed after dry etching HBTs or lPG quantum wire transistors. However, the device degradation can be minimized by using optimized etch conditions. Dry etched mirrors have high reflectivity up to 93%. The reflectivity is independent of the ion energy or the ion flux used as long as smooth sidewalls and vertical profile were maintained. Surface damage can be removed by wet chemical etching or thermal annealing. However, two-step etching provides better control of etch profile and surface morphology while maintaining low surface damage. Damage removal using low-energy chlorine species has been demonstrated to lower the contact resistance of the transmission lines as well as reduce W.,. of the conducting wires. Complete recovery to damage free surface can be obtained for both dry etched surface and sidewalls. The low-energy chlorine species can also passivate the surface damage with minimal etching if native oxide is allowed to form on the etched surface prior to passivation. With Clz plasma passivation, no further etching is needed to reduce surface damage. This provides more precise control ofthe dimensions and profile of nanostructures. Typically, dry etching induced surface damage depends on the balance between defect generation rate and defect removal rate (etch rate). Surface damage can be minimized by etching with low ion energy, low ion flux, high etch temperature, low pressure, high Clz concentration, fast etch rate, and damage removal or passivation using low-energy chlorine species. Acknowledgements The author would like to thank her students K.T. Sung, K.K. Ko, S. Thomas III, and E.W. Berg for their significant contributions to the work presented in this chapter. References I. S.W. Pang, G.A. Lincoln, R.W. McClelland, P.O. Degraff, M.W. Geis and W.J. Piancentini, J. Vac. Sci. Technol., Bl, 1334 (1983). 2. S.W. Pang, M.W. Geis, N.N. Efremow and G.A. Lincoln, J. Vac. Sci. Technol., B3, 398 (1985). 3. S.W. Pang, "Radiation damage in dry etching", Microelectronic Engineering, 5, 351 (1986). 4. H.F. Wong, D.L. Green, T.Y. Liu, D.G. Lishn, M. Bellis, E.L. Hu, P.M. Petroff, P.O. Holtz and J.L. Merz, J. Vac. Sci. Techno!., B6, 1906 (1988). 5. R. Cheung, S. Thoms, M. Watt, M.A. Foad, C.M. Sotomayor-Torres, C.D. W. Wilkinson, U.J. Cox, R.A. Cowley, C. Dunscombe and R.H. Wiliams, Semicond. Sci. Techno!., 7, 1189 (1992).
GENERATION, REMOVAL, AND PASSIVATION
203
6. K.K. Ko, S.W. Pang, T. Brock, M.W. Cole and L.M. Casas, J. Vac. Sci. Techno/., 812, 3382 (1994). 7. K.T. Sung and S.W. Pang, J. Vac. Sci. Techno/., A12, 1346 (1994). 8. E.L. Hu, C.H. Chen and D.L. Green, J. Vac. Sci. Techno/., 814,3632 (1996). 9. K.K. Ko and S.W. Pang, J. Electrochem. Soc.,141, 255 (1994). 10. K.T. Sung, S.W. Pang, M.W. Cole and N. Pearce, J. Electrochem. Soc.,142, 206 (1995). II. S. Yapsir, G. Fortuno-Wiltshire, J.P. Gambino, R.H. Kastl and C.C. Parks, J. Vac. Sci. Techno/., AS, 2939 (1990). 12. N.G. Stoffel, J. Vac. Sci. Techno/., B10, 651 (1992). 13. S. Thomas III and S.W. Pang, J. Vac. Sci. Techno/., B12, 2941 (1994). 14. H. Nakanishi, K. Wada and W. Walukiewicz, J. Appl. Phys., 78, 5103 (1995). 15. M.W. Cole, K.K. Ko and S.W. Pang, J. Appl. Phys., 78,2712 (1995). 16. M. Hafizi, W.E. Stanchina, R.A. Metzger, J.F. Jensen and F. Williams, IEEE Trans. Elec. Dev., 40,2178 (1993). 17. K.K. Ko and S.W. Pang, J. Electrochem. Soc.,141, 255 (1994). 18. S. Thomas Ill, E.W. Berg and S.W. Pang, J. Vac. Sci. Techno/., 814, 1807 (1996). 19. S. Thomas III, H.H. Chen and S.W. Pang, J. Vac. Sci. Techno/., 815,681 (1997). 20. E.W. Berg and S.W. Pang, J. Vac. Sci. Techno/., B15, 2643 (1997). 21. E.W. Berg and S.W. Pang, J. Vac. Sci. Techno/., B16, 3359 (1998). 22. J.W. Coburn, Plasma Etching and Reactive Ion Etching, (American Vacuum Society Monograph Series, New York, 1982). 23. G.S. Oehrlein, Handbook (Jf' Plasma Processing, ed. by S.M. Rossnagel, J.J. Cuomo and W.O. Westwood, (Noyes Publications, New Jersey, 1990). 24. J. Asmussen, R. Mallavarpu, J.R. Hamman and H.C. Park, Proc. IEEE, 62, 109 (1974). 25. J. Hopwood, O.K. Reinhard and J. Asmussen, J. Vac. Sci. Techno/., B6, 268 (1988). 26. J. Hopwood, Plasma Sources Sci. Techno/.,1, 109 (1992). 27. J.H. Keller, Plasma Sources Sci. Techno/., 5, 166 (1996). 28. P. Collot, C. Gaonach and N. Proust, Mat. Res, Soc. Symp. Proc.,144, 507 (1989). 29. M. Knoedler, L. Osterling and H. Shtrikman, J. Vac. Sci. Techno/., B6, 1573 ( 1988). 30. S. Agarwala and I. Adesida, Sixth International Conf on Indium Phosphide and Related Materials, 391 (1994). 31. Forchel, B.E. Maile, H. Leier and R. Germann, Physics and Technology (!I' Submicron Structures: Proceedings of the Fifth International Winter School, 26 ( 1988). 32. C.-H. Chen, D.L. Green and E.L. Hu, J. Vac. Sci. Techno/., B13, 2355 (1995).33. M. Rahman, N.P. Johnson, M.A. Foad, A.R. Long, M.C. Holland and C.D.W. Wilkinson, Appl. Phys. Lett., 61, 2335 (1992). 34. E.L. Hu, C.-H. Chen and D.L. Green, J. Vac. Sci. Techno/., B14, 3632 (1996). 35. S. Murad, M. Rahman, N. Johnson, S. Thoms, S.P. Beaumont and C.D.W. Wilkinson, J. Vac. Sci. Techno/., 814, 3658 (1996). 36. G. Yu, C.-H. Chen, A.L. Holmes, Jr., S.P. DenBaars and E.L. Hu, J. Vac. Sci. Techno/., 815, 2672 (1997). 37. R.S. Williams, Solid State Comm., 41, 153 (1982). 38. N.G. Stoffel, J. Vac. Sci. Techno/., B10, 651 (1992). 39. H. Linke, I. Maximov, D. Hessman, P. Emanuelsson, W. Qin, L. Samuelson, P. Omling and B.K. Meyer, Appl. Phys. Lett., 66, 1403 (1995). 40. M. Rahman, N.P. Johnson, M.A. Foad, A.R. Long, M.C. Holland and C.D.W. Wilkinson, Appl. Phys. Lett., 61, 2335 (1992). 41. H. Chen, D.G. Yu, E.L. Hu and P.M. Petroff, J. Vac. Sci. Techno/., B14, 3684 (1996). 42. Blakeslee, Chemistry and Defects in Semiconductor Heterostructures, Mater. Res. Soc. Sym. Proc., 148,217 (1989). 43. S. Thomas III and S.W. Pang, J. Vac. Sci. Techno/., 813, 2350 (1995). 44. D.J. Kahaian, S. Thomas III and S.W. Pang, J. Vac. Sci. Techno/., 813,253 (1995). 45. Ren, T.R. Fullowan, S.J. Pearton, J.R. Lothian, R. Esagui, C.R. Abernathy and W.S. Hobson, J. Vac. Sci. Techno/., All, 1768 (1993). 46. Y. Hirayama, A.D. Wieck and K. Ploog, J. Appl. Phys., 12,3022 (1992). 47. J. van Wees, H. van Houten, C.W.J. Beenakker, J.G. Williamson, L.P. Kouwenhoven, D. can der Mare! and C.T. Foxon, Phys. Rev. Lett., 60, 848 ( 1988).
204
S.W. PANG
48. Y. Ochiai, T. Onishi, J.P. Bird, M. Kawabe, K. Ishibash, Y. Aoyaki and S. Namba, Jpn. J. Appl. Phys., 30, 3859 (1991). 49. K. Ismail, W. Chu, D.A. Antoniadis and H.l. Smith, Appl. Phys. Lett., 52, 1071 (1988). 50. K. Ismail, D.A. Antoniadis and H.l. Smith, Appl. Phys. Lett., 54, 1130 (1989). 51. J. Nieder, A.D. Wieck, P. Grambow, H. Lage, D. Heitmann, K.V. Klitzing and K. Ploog, Appl. Phys. Lett., 51, 2695 (1990). . 52. Y. Takagaki, F. Wakaya, S. Takaoka, K. Garno, K. Murase and S. Namba, Jpn. J. Appl. Phys., 28, 2188 (1989). 53. D. Wieck and K. P1oog,Appl. Phys. Lett., 56,928 (1990). 54. Y. Feng, T.J. Thornton, M. Green and J.J. Harris, Superlattices and Microstructures, 11, 281 (1992). 55. J.J. Yang, M. Sergant, M. Jansen, S.S. Ou, L. Eaton and W.W. Simmons, Appl. Phys. Lett., 49, 1139 (1986). 56. J.J. Liang and J.M. Ballantyne, J. Vac. Sci. Techno/., B12, 2929 (1994). 57. P. Buchmann, H.P. Dietrich, G. Sasso and P. Vettiger, Microelectron. Engin., 9, 485 (1989). 58. N.C. Frateschi, M.Y. Jow, P.D. Dapkus and A.F.J. Levi, Appl. Phys. Lett., 65, 1748 (1994). 59. K.K. Ko, K. Kamath, 0. Zia, E. Berg, S.W. Pang and P. Bhattacharya, J. Vac. Sci. Techno/., B13, 2709 (1995). 60. Thirstrup, S.W. Pang, 0. Albrektsen and J. Han berg, J. Vac. Sci. Techno/., Bll, 1214 (1993). 61. K.K. Ko and S.W. Pang, J. Vac. Sci. Techno/., B13, 2376 (1995). 62. M.A. Foad, S. Thoms and C.D.W. Wilkinson, J. Vac. Sci. Techno/., Bll, 20 (1993). 63. K.K. Ko and S.W. Pang, J. Vac. Sci. Techno!., Bll, 2275 ( 1993). 64. E.S. Aydil and R.A. Gottscho, Mat. Sci. Forum,l48--149, 159 (1994). 65. T. Ohno, Phys. Rev., B44, 6306 (1991). 66. Y. Gu, E.A. Ogryzlo, P.C. Wong, M.Y. Zhou and K.A.R. Mitchell, J. Appl. Phys., 12, 762 (1992). 67. J.S. Herman and F.L. Terry, Jr., J. Vac. Sci. Techno!., All, 1094 (1993). 68. K.K. Ko, E. Berg and S.W. Pang, J. Vac. Sci. Techno/., B14, 3663 ( 1996).
CHAPTER 6
Defects induced by Metal-Semiconductor Contacts Formation TSUGUNORI OKUMURA
Department of Electrical Engineering, Tokyo Metropolitan University, 1-1 Minami-ohsawa, Hachioji, Tokyo 192-0397, Japan
1. Importance of Schottky-barrier Control . 1.1. Introduction 1.2. Ohmic Contacts in Compound Semiconductor Devices 1.3. Schottky Contacts in Compound Semiconductor Devices 2. Models of Schottky Barrier Formation 2.1. Schottky and Bardeen Limits 2.2. Fermi-level Pinning Strength 2.3. Metal-induced Gap State (MIGS) Model 2.4. Extrinsic Models for Fermi-level Pinning 3. Inhomogeneous Reaction and Contact Properties . 3.1. Inhomogeneous Metal-Semiconductor Reaction 3.2. 1-V and C-V Characteristics of Inhomogeneous contacts 3.3. Internal Photoemission Spectroscopy and Its Microscopy 3.4. Case Study 1: Al-GaAs Interfaces Characterized by IPE Spectroscopy . 3.5. Case study II: Thermal Degradation of Au/Ptffi-GaAs Schottky Contacts Characterized by IPEM 4. Effect of Process-related Defects on Contact Properties 4.1. GaAs Schottky Contacts Fabricated in a Standard Device Process 4.2. Effect of Defects on the SBH Measurements 4.3. Surface Defects . 4.4. Defects or Impurities in Sub-JLm Region From the Surface 4.5. Amorphous Surface Layer 4.6. Electrochemical Fabrication Process of Schottky Contacts Free From Process Damage . 5. Summary
205
206 206 206 208 209 209 210 211 212 214 214 215 218 223 228 234 234 236 238 243 244 244 248
206
T.OKUMURA
1. IMPORTANCE OF SCHOTTKY-BARRIER CONTROL 1.1.
Introduction
In order to transfer signal and/or power into and out ofsemiconductor devices, virtually all kinds of devices must have an "interface". The interface is a plane where two different materials are brought into contact with each other. Whenever two different materials are brought into contact, a potential barrier is established at the interface. Such a potential barrier gives rise to asymmetry in an electrical characteristic of the interfaces. The larger the potential barrier, the more remarkable asymmetry becomes. At the interface between a metal and a semiconductor, this energy barrier is usually called a Schottky barrier, which is characterized by its value, Schottky barrier height (SBH). From a device point of view, metal-semiconductor interfaces are divided into two categories: a low-resistance ohmic contact and a rectifying Schottky contact. For both contacts, SBH is one of the most important parameters to be controlled as described below. Over the past decade, there has been significant progress in understanding mechanisms of Schottky barrier formation owing to the development of various analytical techniques for clean and atomically-controllable surfaces in ultrahigh vacuum condition. Such studies also lead to various new techniques to control the properties of metal-semiconductor contacts at the atomic scale. However, practical contacts for device application are not devoid of imperfections introduced during device fabrication processes. The interfacial structure is generally modified by reaction and diffusion upon heat treatment during processing, and such modification might rarely occur homogeneously. From the practical point of view, we should understand the details of such device processing-related issues in the Schottky contacts. This chapter deals with the effects of inhomogeneity in the metal-semiconductor interface as well as imperfections in the sub-surface region of semiconductors on the characteristics of the Schottky contacts to compound semiconductors, mainly GaAs.
1.2.
Ohmic Contacts in Compound Semiconductor Devices
An ideal ohmic contact can flow current without any voltage drop through it, i.e., zero contact resistance. In optoelectronic devices, realization of low-resistance ohmic contacts is a critical issue for low-voltage as well as high-efficiency operation. If the contact resistance is high, for instance, in laser diodes, an actual applied voltage becomes large due to a voltage loss at the contacts, which might heat up the devices and hence degrade the device performance and reliability. In representative electronic devices with compound semiconductors, such as metal-semiconductor field effect transistor (MESFET) and high electron-mobility transistor (HEMT), source
METAL-SEMICONDUCTOR CONTACTS
207
and drain contacts must be ohmic. If their contact resistance is high, a parasitic series resistance decreases the effective transconductance [ 128]. Now let us discuss how to decrease the contact resistance at the metalsemiconductor interface. From the current-voltage characteristic of the metal-semiconductor junction the ohmic contact resistance is given by, r = dV c dl
I V=O
~ 0,
(l)
because only small voltage should be applied over a low-resistance contact. Here, rc is usually referred as the specific contact resistivity. When the doped-impurity concentration is rather high in semiconductors, the current flowing through the contact is determined predominantly by the thermionicfield emission (TFE) mechanism [122]. Under certain conditions specified by Padovani and Stratton, the specific contact resistivity in the TFE regime is approximately given by [ 115],
r - - -ks - e x (q¢s) -c - q A** T p Eoo ' h ( N, )1/2 Eoo---
- 4rr
m*es
'
(2) (3)
where ks is the Boltzmann constant, q the electronic charge, A** the effective Richardson constant, T the absolute temperature, q¢s the Schottky barrier height, h Plank's constant, N, the impurity concentration, m* the effective mass, andes the static dielectric constant of the semiconductor. This equation indicates that a good ohmic contact is realized by either lowering the Schottky barrier height or increasing the doping concentration. The specific contact resistivity is inversely proportional to exponential of the doped-impurity density, exp(N,) 112 . Actually, this relationship was experimentally confirmed for GaAs ohmic contacts by Bras! au [15]. However, it is known that the maximum doping concentration in compound semiconductors depends strongly on the conductivity type [ 154]. The highest doping densities are in the range of 10 19 cm- 3 for n-GaAs smaller than for p-GaAs, and for both n- and p-Si. If we assume a typical SBH value of 0.8 eV for n-GaAs, the doping density should be as high as 1020 cm- 3 in order to realize rc = w- 6 Qcm 2 . On the other hand, p-GaAs can be doped to a carbon acceptor as high as the order of 1021 cm- 3 by using metal-organic sources [179]. Since the SBH is, furthermore, rather low (typically 0.6 eV) for p-GaAs, realization of good ohmic contacts is much easier than for n-GaAs. The situation is definitely inverse for InP. The doping limit for InP is much lower for p-type than for n-type. The SBH is much higher for p-InP than for n-InP [55]. Therefore, further reduction of SBH is still challenging for ohmic contacts of some devices.
208
1.3.
T. OKUMURA
Schottky Contacts in Compound Semiconductor Devices
As for a rectifying contact, a Schottky contact to compound semiconductors is indispensable for gate electrodes in MESFET as well as HEMT devices to which an input signal is applied [23]. The Schottky-gate contact is a key element of such gated-devices. An ideal gate electrode controls the current flow in an underlying semiconductor channel without drawing current through the gate electrode. For Schottky contacts, the current-voltage characteristic (J- V) is empirically expressed as [ 122], J
= lsexp (~) nkBT
{1-
exp
(-~)}, kBT
(4)
where n is the ideality factor which can be close to unity ifthe current through the barrier consists solely of the thermionic emission current. In general, n becomes greater than unity due to a variety of reasons as will be discussed later. J s is the saturation current density under reverse bias voltage and given by, (5)
Hence, the SBH used in the FET gates will be expected to be high to reduce the saturation current density ls. Since the drift mobility is much higher for electrons than for holes in most semiconductors, n-channel devices are more attractive for high-speed-circuit application. Most metals give rather high SBH of 0.8--0.9 eV to n-GaAs. Unfortunately, a SBH greater than 0.4 eV is, on the other hand, rather often difficult to obtain on n-InP [99], and as a result, several techniques have been reported for increasing the effective SBH on n-InP [127, 147, 166]. The Schottky barrier height is also important in MESFET as well as HEMT, since it is directly related to the threshold voltage of the PET's. The width of a current channel is controlled by changing the depletion-layer width expanding from the Schottky contact. The depletion-layer width W is determined by the SBH ¢B. the applied bias V and the doping density N D in the channel. If the impurity is uniformly doped through the channel, W becomes,
W=
2es ( Vhi - V qND
¥)
(6) (7)
METAL-SEMICONDUCTOR CONTACTS
209
where Vb; is the built-in-potential, cs the dielectric constant of the semiconductor, and Nc the effective density-of-states of the conduction band. For an MESFET, the threshold voltage can be obtained with equation (6) when the depletion-layer width is equal to the channel thickness. The threshold voltage VrH of n-channel HEMT devices is given by, [83] qNDd 2 !:lEe VrH=¢B------. 2cs q
(8)
Here, N D and d are the doping density in the carrier-supplying layer and its layer-thickness, respectively, and !:lEe the discontinuity of the conduction band. Equation (8) tells us that uniformity of SBH in addition to doping, the layer thickness, and the hetero-interface should be a key issue for VLSI application of HEMT's as well as MESFET's. As described above, Schottky barrier height (SBH) is the most important parameter at metal-semiconductor interfaces regardless of a "Schottky" gate contact or an ohmic contact. In addition to realize a proper SBH value for each device application, uniform and thermally stable materials are required to realize reliable compound semiconductor devices.
2. MODELS OF SCHOTTKY BARRIER FORMATION
2.1.
Schottky and Bardeen Limits
From a historical consideration by Schottky [124], the potential barrier at metal-semiconductor interfaces is determined by the difference between the metal work function q¢M and the electron affinity of a semiconductor q xs as, q¢Bn = q(r/JM- Xs)
for n-type semiconductors,
(9)
q¢Bp = Ea - q(¢M - xs)
for p-type semiconductors,
(10)
where Ea is the energy band gap for semiconductors. Such relationship was also derived by Mott independently [90]. Schottky's prediction indicates that the barrier height can be controlled using metals with different work functions, yet the following experimental results have shown work-function independence of the barrier height for most of covalent semiconductors,
including Si, GaAs, InP, etc. [66]. This phenomenon is usually refered to as "Fermi-level pinning" at the metal-semiconductor interface. High-density of surface states, whether they are intrinsic or extrinsic, are induced in the vicinity of the metalsemiconductor interface, and hence the Fermi-level at the semiconductor
210
T.OKUMURA
surface is pinned at a certain position which is determined by the nature of the states. In the very early stage of the development of field-effect transistors, Bardeen postulated continuum states at the semiconductor surface before metal deposition [7]. If the Fermi level moves across a certain energy position within the gap upward or downward, the surface states are charged negatively (acceptor-like) or positively (donor-like), respectively. This energy position is called as the charge-neutrality level (CNL). In the extreme of high density of states, the surface states screen the effect of a metal overlayer and the Fermi level at the semiconductor surface is stabilized (pinned) at the CNL. In this Bardeen limit, the barrier height is independent of metals. 2.2.
Fermi-level Pinning Strength
In actual metal-semiconductor interfaces, SBH dependence on the metal work-function lies in between two limits described in the above section. The strength of the Fermi-level pinning is given by the index of interface behavior (or called as the slope factor) S¢ defined by, B¢Bn
S¢=--.
(11)
B¢M
S
Bn
= q(r/>ejj
- Xs),
(15)
T. OKUMURA
214
where ¢eff is a weighted average of the work functions of the different interface phases. For most ofiii-V compound semiconductors, metallization and/or oxidation results in the presence of excess anion species segregated to the intimate. For a typical example, heating a gold film deposited on GaAs results in release of free arsenic and formation of Au-Ga compounds, such as Au7Ga2, Au2Ga, and a hexagonal gold-gallium phases [70]. In an ordinary device processing, the substrate surface is covered with native oxides. Thurmond et at. determined the Ga-As-0 phase diagram showing that there is no tie-line between arsenic oxides (As203 and As20s) [153]. The arsenic oxides cannot be, therefore, stable in contact with GaAs, and metallic As will be segregated as, 3 · AsxOv
+ 2y
· GaAs-+ y · Ga203
+ (3x + 2y)
·As.
(16)
The condition for driving this reaction to the right is that the Gibbs free energy is negative. The free energies of As203, As20s and Ga203 are -138, -184 and -237 Kcal/mol, respectively. Therefore, the surface of GaAs exposed to air is brought in contact with Ga203 and free As at thermal equilibrium. Such oxide reactions were examined for GaAs, InAs and InSb [32, 126].
3. INHOMOGENEOUS REACTION AND CONTACT PROPERTIES
3.1.
Inhomogeneous Metal-Semiconductor Reaction
The control of Schottky barrier heights at metal-semiconductor interfaces is critical to the design of high performance electronic and optoelectronic devices. Good contacts for device application require well-controlled barrier height proper to either ohmic or rectifying contacts, thermal stability and uniformity. In the LSI application of compound semiconductors, particularly, both metallurgical and electrical uniformity are significantly important, not only among contacts but also within an individual contact. Therefore, it is still challenging to establish the process technology of routinely making a large number of homogeneous contacts. The interfacial structure is generally modified by reaction and diffusion upon heat treatment used during device fabrication processes [137]. Such modification might occur inhomogeneously. In general, the deposited metal-film consists of polycrystal grains rather than a single crystal. In the polycrystalline case, fast diffusion of atoms through grain boundary plays a very important role in the intermixing which takes place on heating. In the AI-GaAs system fabricated in a usual manner, gallium can migrate through AI polycrystalline films at 250°C [19] and accordingly the electrical characteristics will change. On the other hand, Missous et at. [86] showed that an in situ AI-GaAs contact prepared molecular
METAL-SEMICONDUCTOR CONTACTS
215
beam epitaxy survived even at 500°C. The AI films formed in this manner were almost perfect single crystals with the ( 100) AI plane parallel to the ( 100) GaAs plane, and were therefore almost free from grain boundaries, which are responsible for inhomogeneous reaction at low temperatures. Miyazaki and Okumura [88] showed direct evidence of inhomogeneity of Schottky barrier heights (SBH's) at the Al/(lll)Si interface due to inhomogeneous reaction through grain boundaries. Depending on the deposition condition, the Al/(111)Si interface consists either exclusively of the so-called type B (single grain) or mainly of type A with partial type B grains (mixed grains). The interface consisting of a single grain was thermally stable and the SBH's determined by the/- V and C- V methods did not change up to 550°C (slightly below the eutectic point of Al-Si, 577°C) for such single domain interfaces [87]. The SBH mapping can be obtained by scanning internal photoemission microscopy (IPEM) described below. Practical contacts are composed of multiple materials, which are either in the form of alloy or multi-layered structure. Upon heat treatment, various compounds might be phase-segregated between the contact material and the semiconductor. These phases are randomly distributed in the vicinity of the interface, and hence the interface becomes rough and inhomogeneous in composition. For example, Au-Ge-Ni, one of the most practical ohmic contact materials to n-GaAs, reacts with GaAs resulting in formation of NixGaAs, Ni3Ge, ,8-AuGa, NiAs(Ge) and NiGe, whose composition and distribution depend on the annealing temperature [97]. Braslau pointed out that the contact resistance at alloyed Au-Ge-Ni/n-GaAs contact is determined by the protrusion ofNiAs(Ge) nonuniformly formed [15]. Kuan et al. [67] and Shih et al. [131] showed the detailed interfacial structure studied by cross-sectional TEM and a good correlation between the contact resistance and the total area of the NiAs(Ge) patches. On the other hand, components with high surface tension, such as indium, tend to be phase segregated inhomogeneously upon reaction, sometimes balling up [56, 73]. Native oxides on the semiconductor substrate promote the inhomogeneous interfacial reaction. The semiconductor surface is exposed to atmosphere during fabrication process of devices and hence covered with native oxides, which are not, of course, guaranteed to be uniform in thickness as well as composition, sometimes are in the form of patches. Therefore, the insertion of thin near-noble metal (Ni, Pd, Pt) layers can be effective to suppress the interface irregularity due to native oxides [89, 137]. 3.2.
I-V and C- V Characteristics of Inhomogeneous Contacts
Over several decades, the relationship between SBH and microscopic structure of metal-semiconductor interfaces has been of fundamental as well as practical interest in the semiconductor science and technology.
T.OKUMURA
216
Now, importance of the studies in this field has been increasing, since minuatualization and integration of semiconductor devices still proceed in high pace. Cross-sectional images of transmission electron microscopy (1EM) are very powerful in revealing metallurgical inhomogeneity, i.e., interfacial phases, bonding structures (epitaxial relationship) or the existence of thin intervening layers [74]. For example, the identification of the phases formed at the Au-Ge-Ni/GaAs interface and their correlation to the specific contact resistance were done by 1EM as pointed out in the previous Section 3.1. Tung showed that the Schottky barrier height at NiSiz/Si(lll) depends on the microscopic bonding structure at the interface; the type A and type B interfaces, where the NiSiz film shares the surface normal axis [Ill] with the Si substrate and rotated 0 and 180°, respectively, around this axis with respect to the Si substrate, have different Schottky barrier heights (0.65 and 0.79 eV, respectively) [155, 156]. Other analytical techniques, such as x-ray standing wave [162], medium energy ion scattering (MEIS) [77] and x-ray interference measurements [123], also reveled atomic information on the detailed structure of such epitaxial interfaces. While structural as well as compositional analyses of the semiconductor interfaces are now available in a microscopic or even in an atomic scale, the SBH is usually characterized by using "macroscopic techniques", such as current-voltage(/- V) and capacitance-voltage ( C- V) methods. Ohdomari et at. [103] pointed out that a transition metal silicide forms in patches on Si during the early stage of reaction, resulting in formation of a parallel contact (diode). Figure 1 schematically shows the parallel Schottky contact. For the parallel contact, the SBH's determined by the I-V and C- V methods consequently become apparent. If the size of mixed patches is not as small as either the Debye length or the depletion layer width of the barrier region, a simple model based on linear combination of two different interfacial phases can be applied to evaluation of the apparent barrier height [ 104]. In the I-V measurements, the apparent I-V barrier height ¢~%P becomes,
¢/,%P =
k~T In [ ( s ~ sh) exp (- ::~) + ( St : 1
Sh) exp (- ::; )
J'
(17)
when the thermionic emission mechanism alone is a current flowing over the barrier. Here, St or Sh is the area and ¢1 or ¢h the barrier height, respectively, where the subscript l and h correspond the low- and high-barrier phases, respectively. This equation suggests that a small size patch does significantly affect on the lowering of apparent Schottky barrier height due to the nature of the exponential function. When the barrier height varies spatially on a scale less than, or comparable to, the depletion layer width, Tung gave analytical expressions for the potential and the current transport at inhomogeneous metal-semiconductor interfaces [157, 158]. The potential
METAL-SEMICONDUCTOR CONTACTS
217
(a) schematic picture of parallel Schottky contact lowSBH region high SBH region
metal
semiconductor
(b) Screening effect on the potential profile at the M/S interface
Ec at MIS interface Debye screening
C/ll>h
1
.
~
• •
•
~·
:~ •
• I
simple model
q hv ::=: q¢BL·
(22)
For the parallel contact, the simple Fowler plot of the measured photoyield does not give a straight line at all. Okumura and Tu [ 105] showed that plotting the first derivative of the photoyield, dYfd(hv), as a function of h v is also capable of determining the barrier height in place of the square-root plot, and,
METAL-SEMICONDUCTOR CONTACTS
221
(a) uniform contact
light illumiantion
.... 0
~--------~------------~hv
q¢8
(b) parallel contact
I
__ .....
:/-E 'i
--.--1I
~-----=~----~------~~hv
q¢81
q¢Bh
Fig. 3. Schematic illustration of the internal photoemission (IPE) spectrum for (a) a uniform
Schottky contact and (b) parallel Schottky contact. For the parallel contact, the first derivative plot of the photoemission yield consists of two straight portions. If the area of the low-barrier phase decreases, the slope ratio will be changed as shown in the figure.
222
T.OKUMURA
furthermore it is effective for quantitative evaluation for parallel contacts. The first derivative of equations (21) and (22) are, dY
d(hv)
and
0.8
Q)
:c
ffi
0.7 0.6 as dep.
50
100
150
200
(b) Change in ideality factor (n-value)
1.2 Q)
::::1
~ C::
1.1
1.0 as dep.
50
100
150
200
Annealing temperature (OC) Fig. 6. Change in SBH's of AVn-GaAs upon annealing. The GaAs surface should be covered with native oxides in the as prepared state, because the substrate was cleaned and etched in a standard procedure followed by evaporation of aluminum.
226
T.OKUMURA
The barrier height for the as-deposited diode was around 0.65 eV, which was low compared with the Au Schottky contacts fabricated on the same substrate: 0.82-0.88 eV. Such a low barrier height for Al/n-GaAs contacts has usually been observed and discussed in relation to native oxide(s) at the interface [47]. A poor ideality factor of 1.15 in the as-deposited state can be interpreted by a thin insulating layer at the interface [122] as well as inhomogeneity at the interface [158]. The annealing at 50°C for 90 min did not change the apparent barrier height very much, but improved the ideality factor slightly. The increase in barrier heights started around 100°C. As the annealing temperature increased, the diode characteristics improved. The barrier height for the diode annealed at 200°C became comparable to, but slightly lower than, that for Au/n-GaAs contacts. The ideality factor was around 1.03 for the diodes annealed at 200°C. The barrier height determined by the C- V measurements showed the same trend as that deduced from the forward I-V curves, while the former was slightly higher than the latter. The first derivative spectra of the photoresponse are shown in Figure 7 for the Al/n-GaAs contacts in the as-deposited state as well as after annealing at four different temperatures. The spectra are aligned with the lowest portion of each curve in order to place emphasis on the kink around 0.9 eV. The lowest threshold energy was determined to be 0.7 eV by extrapolating the linear portion of the spectrum for the as-deposited contact which shows no obvious 7
~ :l
.e.!."'!. s:!2
..
200 c 100C 150 c
6
...
...
soc
5
as-depo .
... ... ... :
4
;:..
3
)..
-o
2
0
qrp,
1 0.7 0.8 0.9
1
1.1 1.2 1.3 1.4
Photon energy (eV)
Fig. 7. Internal photoemission spectra of Al/n-GaAs in the as-deposited state and after annealing at various temperatures. The first derivative plot of the internal photoemission yield with respect to photon energy clearly shows that the Al/GaAs interface fabricated by a standard process consists of two phases with different SBH's, 0.7 and 0.9 eV.
227
METAL-SEMICONDUCTOR CONTACTS
1.0 0.8
u)~
0.6 0.4 0.2 0
I as dep.
50
100
150
200
Annealing temperature (°C) Fig. 8. Change of the low-SBH phase fraction in the AVn-GaAs interface as a function of annealing temperature.
kink. As illustrated in Figure 3, the kink in the spectrum as well as the change in slope by annealing give evidence of the parallel contact in these Al/GaAs Schottky contacts; the spectrum with two linear portions means a two-phase mixture in the contact. The lowest threshold energy, 0.7 eV, corresponds to the barrier height for the lower-barrier phase. The energy at the kink, 0.9 e V, corresponds to the barrier height for the higher-barrier phase. The increase in the slope above 0.9 eV with increased annealing temperature indicates the dissociation of the lower barrier portion or the conversion to the higher phase. The fraction ofthe lower barrier portion, SL/(SL + Sh), was calculated by applying equation (23) to the data shown in Figure 7. The result is shown in Figure 8. The area fraction of the lower-barrier phase decreased from about 0.9 in the as-deposited state to 0.1 after annealing at 200°C. One can estimate the apparent barrier height in the I-V and C- V measurements by using equations (17) and (18) with the results shown in Figure 8. Table I summarizes these values, ¢~JP and cp~P~' as well as the corresponding experimental ones. All apparent barrier heights with the C- V technique are larger than those with the I-V technique in any annealing stage, which agrees with discussion in Section 3.2. Relatively low Schottky barrier is often observed in AI diodes deposited on intentionally oxidized GaAs [47]. Christou and Day studied interdiffusion between AI thin films and GaAs by using Auger electron spectroscopy [ 19]. Their sputter-depth
T.OKUMURA
228
TABLE I Summary of the low-barrier phase fraction in Al/n-GaAs Schottky contacts. The experimental and theoretical values of SBH's determined by the I-V and C- V techniques are also included. Theoretical values are calculated by using equations ( 17)-( 19). Sample
SI/(S,
as. depo. 50°C l00°C 150°C 200°C
0.88 0.72 0.40 0.22 0.12
+ S,.)
.!!!.
"' J: co f/)
Pt~B}
Al(1.12) • NI(:B) • •
0.9
•
•
Ag(1.03)
c: Ec/2) for a sufficient amount of minority carriers at the metal-semiconductor interface, the minority carrier injection occurs even in the Schottky contact [52]. Therefore, the recombination current component might be visible in the forward I-V curve of the contacts with high SBH. Generally, an efficient recombination center sits near the middle of the bandgap, and pulls the Fermi level toward itself. If such a compensated and high-resistive region exists between the metal and depletion region, the measured capacitance will be decreased with concomitant raise of the c- 2 - V curve. Consequently, the estimated built-in-voltage becomes larger than the real one. In a lower bias-voltage region of the c- 2 - V curve, the effect of the compensation might be seen. In the IPE spectrum, the slope, i.e., the photoemission yield, might be decreased. The reverse I-V curves shown in Figure 16 are improved after plasma exposure from the viewpoint of a saturation characteristic. The deep levels
244
T.OKUMURA
discussed above cannot account for such a good saturation characteristic. Then, defects or impurities deactivating dopants in Table II( d) will be considered next. During dry etching and plasma-assisted deposition of dielectric's, hydrogen is well known as an impurity inevitably incorporated into semiconductors [120]. Hydrogen deactivates or passivates the activity, of dopants in semiconductors. Due to deactivation, the carrier density and the space charge density in a depletion region is decreased, apparently just like the compensation case; so is the c- 2 - V curve. In the I-V characteristics, the effect of the dopant deactivation on the thermionic-emission current is quite similar to (c). However, hydrogen is also known as a deactivator of deep-level defects [ 120]. If the generation-recombination centers in the original crystal are deactivated by hydrogen, the reverse characteristic of the diode might be improved. In fact, the saturation characteristic of the reverse current in Si-Schottky diodes can be improved by introduction oflow-energy atomic hydrogen [4].
4.5.
Amorphous Surface Layer
Sputtering is a well-known technique for the deposition of good adherence metal layers, particularly refractory metals (W, Mo, Ti etc.) and their silicide or nitride (WSi, WN, WSiN, TiN) on compound semiconductors. An amorphous surface layer [2, 102] or a highly non-stoichiometric layer [138, 171], were identified on GaAs suffered from ion bombardment. At an ion energy of 100--200 eV and a total dose around 10 15 ion/cm 2 , an amorphous layer 2 to 3 nm deep is produced on GaAs surfaces [41]. Disordering of the subsurface layer is suggested to have a significant effect on the carrier transport through the metal-semiconductor interface. Some experiments tend to show that radiation damage produces semi-insulating layers [37, 160]. Loss of exponential relationships in the I-V curves were reported in the Schottky diodes with ion-sputtered GaAs surfaces (see Table II(e)) [2, 180]. Trap-assisted tunneling, hopping or space-charge limited currents are considered in order to account a relationship such as I ex vm [149, 180]. As the thickness or the resistance of the disordered subsurface layer increases, the contact will become just like an MIS structure. Therefore, this resistance absorbs an appreciable amount of the voltage drop between the diode terminals, and the slope of the c- 2 - V curve will be decreased; the resultant impurity concentration will apparently increase.
4.6.
Electrochemical Fabrication Process of Schottky Contacts Free From Process Damage
Formation of such imperfections near the metal-semiconductor interface is greatly dependent on the process of metal deposition. On the other hand, various efforts to suppress the formation of extrinsic defects on the compound
METAL-SEMICONDUCTOR CONTACTS
245
semiconductor surface have been made, because the mechanism of Schottky barrier formation has been of fundamental interest in semiconductor physics [9]. Low temperature (LT) deposition of metals in an ultrahigh vacuum is one of attractive approaches to distinguish between intrinsic and extrinsic mechanisms, and a number of interesting results have been reported [ 146, 163]. On the other hand, electrochemical deposition of metals, namely electroplating, is an alternative process to the LT deposition in order to form good Schottky contacts to compound semiconductors. Heat of condensation [144] and electron or ion bombardment effects [2, 106], which are regarded as serious problem during vacuum deposition, are not significant during electroplating. Allongue et al. demonstrated that good Schottky contacts to n-GaAs have been fabricated by electroplating [1]. However, it was not obvious in their experiments whether the GaAs substrate surface was free from oxides before metallization. Okumura and his coworkers demonstrated that in situ anodic etching was effectively used in the electrolytic solutions to remove surface oxides on GaAs just prior to the electrochemical deposition of metals [61, 109, 110]. The resultant Schottky diodes showed nearly ideal characteristics in current-voltage curves. They determined the conditions in which the GaAs surface becomes free from oxides in electrolytic solutions for electroplating. The oxide thickness on the GaAs surface is precisely controlled by photoelectrochemical process. The results indicate that the anodic potential for the in situ anodic etching is critical for complete removal of the oxides. The photocurrent transient measurements can be helpful in determining the applied potentials for photoanodic etching. Figure 17 shows surface images and tunnel spectra taken by electrochemical scanning tunneling microscopy (EC-S1M) for the GaAs surfaces (a) with and (b) without residual oxides. In an acidic solution of about pH=2, the applied potential to n-GaAs of +0 V (vs. Ag/AgCl reference) provides a smooth and oxide free (no gap-state) surface, while +0.5 V gives a rough surface covered with anodic oxides. Figure 18 shows the I-V plot for the Ni Schottky contact metallized on n-GaAs surface just after anodic etching at +0.1 V. The plot is also shown in the manner proposed by Missous and Rhoderick (see equation (4)) [85]. Linearity in a semilogalithmic plot holds over 25 orders of magnitude. The determined n-value was 1.00 ± 0.004, which is expected for lightly doped GaAs (n = 1 x 10 16 cm- 3 ) used here. Electrical abruptness of this interface can be verified by coincidence in the barrier heights determined through three independent methods(/- V, C- V and J5 -T): 0.80 ± 0.013 eV, 0.81 ± 0.015 eV, and 0.80 ± 0.015 eV, respectively. The ls-T measurement gives the value of A** = 7.03- 8.65 Acm- 2 K- 2 , which is very close to the theoretical value of 8.16 Acm- 2 K- 2 [ 122]. This fact also suggests that the fabricated metal-semiconductor interface consisted of very thin, if any, intervening layer.
246
T. OKUMURA
(a) n-GaAs surface with oxides
(b) n-GaAs surface without oxide
STMimage
STMimage
STS
STS 10
10
:::·c:
~
.e" :;"' :!2
.e"
6
~
::. :!2
4
4
'l:;
'l:; 0 -1.5
-1
·0.5
0
Tip Voltage (V)
0.5
-1
-0.5
0
0.5
Tip Voltage (V)
Fig. 17. In situ STM observation of anodized n-GaAs surfaces in Ni-salt solutions with pH=2.0. (a) If anodic reaction is carried out at a GaAs potential of +0.5 V (vs. Ag/AgCI), the resultant GaAs surface becomes rough and covered with native oxides. (b) When choosing a proper GaAs potential, such as +0.1 V (vs. Ag/AgCl), STS shows no gap state on the GaAs surface. The Schottky contact can be formed in situ on such an electrochemically etched GaAs surface, which might be free from process-related damage and native oxides.
The same photoelectrochemical process was applied to fabrication of Sn, Pb and Au Schottky contacts to n-GaAs. The electrical abruptness for these contacts were also verified in terms of coincidence in the Schottky barrier heights determined through I-V and C- V measurements. The Schottky barrier heights were0.68 eV, 0.74 eV and 0.88 eV, respectively. In the analysis of chemical trends of Schottky barrier height, the slope set> = a¢Bnla¢M, becomes about 0.1, which is close to the value of 0.102 calculated by using equation (14) and not inconsistent with the MIGS model. However, the values of SBH's are by about 0.1 eV lower than Mooch's prediction [91, 92].
METAL-SEMICONDUCTOR CONTACTS
247
(a) I-V curve 1 o-3 1 0-4 1 o-s
~
-
1 0-6
"::::::1
1 o-s
c Q)
"-
(.)
Ni/n-GaAs in situ electrochemically etched
1 o- 7 1 o-9
1 o-1o 1 o-11
-0.5
-1
0
0.5
Voltage (V)
(b) Rhoderick plot of /-Vcurve 10"3 1 o- 5 1 o- 7 1 o-9
1 o- 11
r-r-r-r-~~~~~~~~~~~~~
Ni/n-GaAs in situ electrochemically etched
1 o-13
1 o-15 1 o-17 1 o-19 1 o-21 1 o-23 1 o-25 1 o-27
n = 1.00± 0.004
-1
-0.5
0
0.5
Voltage (V) Fig. 18. Current-voltage characteristics of Ni/n-GaAs fabricated by in situ photoelectrochemical etching and succeeded electrodeposition technique. (a) the conventionallog(J) vs. V plot and modified plot based on Equation (4) in the text. The resultant ideality factor (n-value) is very close to unity (the substrate donor concentration is as low as I x 10 16 cm- 3 ).
248
T.OKUMURA
Wu et al. tried to apply a similar process to fabrication of GaAs Schottky diodes [177]. They obtained work-function independence of the SBH (about 1.0 eV) for Ag, Cu, Co, Pd and Pt. The discrepancy between two results is still open for question; strain at the interface and/or hydrogen incorporation into GaAs from electrolytic solution might be the cause of the difference.
5. SUMMARY In conclusion, we have examined the effects of inhomogeneity in the metal-semiconductor interfaces as well as imperfections in the sub-surface region of semiconductors on the characteristics of the Schottky contacts to compound semiconductors. For practical contacts for device application, processing issues are responsible for the electrical performance of the contact rather than the mechanism of the Fermi-level pinning at the interface. In addition to finding new contact materials which form a stable and uniform interface with compound semiconductors, it is still challenging to develop advanced metallization processing technology free from introducing damage. Electrical inhomogeneity in the Schottky contact with a thick metal can be evaluated in the order of f.Lm scale by using IPEM, yet development of experimental techniques with a nm resolution and applicable to practical contacts is expected. In understanding the characteristics of practical semiconductor contacts, the experimentally observed deviations from the ideal characteristic should be interpreted by taking multiple effects relating to imperfections at or near the interface into account. Table II is indicative that application of two or three electrical characterization techniques, although they are neither modern nor surface sensitive tools, to the same sample can ascertain the imperfections introduced in the semiconductor surface, if any, during processing.
References P. Allongue and E. Souteyrand, J. Vac. Sci. & Techno/., B5, 1644 (1987). A. Amith and P. Mark, J. Vac. Sci. Techno/., 15, 1344 (1978). D.E. Aspnes and A. Heller, J. Vac. Sci. Techno/., Bl, 602 ( 1983). S. Ashok and K. Giewont, Jpn. J. Appl. Phys., 24, L533 (1985). R. Audino, G. Destefanis, F. Gorgellino, E. Pollino and S. Tamagno, Thin Solid Films, 36, 343 (1976). 6. F.D. Auret, L.J. Bredell, G. Myburg and W.O. Barnard, Jpn. J. Appl. Phys., 30, 80 (1991). 7. J. Bardeen, Phys. Rev., 71,717 (1947). 8. P.M. Batev, M.D. Ivanovitch, E. I. Kafediiska and S.S. Simeonov, Phys. Status Solidi a, 45, 671 (1978).
I. 2. 3. 4. 5.
METAL-SEMICONDUCTOR CONTACTS
249
9. J.P. Batra (ed.), Metallization and Metal-Semiconductor Interfaces, NATO AS! Ser. Ser. B, 195, Plenum Press, New York ( 1988). I0. E. Beam, III and D.D.L. Chung, Thin Solid Films, 128, 321 ( 1985). II. L.D. Bell and W.J. Kaiser, Phys. Rev. Lett., 61, 2368 (1988). 12. L.D. Bell, M.H. Hecht, W.J. Kaiser and L.C. Davis, Phys. Rev. Lett., 64, 2679 (1990). 13. 0. Y. Borkovskaya, N.L. Dmitruk, R.V. Konakova and M.Y. Filatov, Electron. Lett., 14, 700 (1978). 14. L.J. Brillson, G. Margaritondo and N.G. Stoffel, Phys. Rev. Lei!., 44, 667 (1980). 15. N. Braslau, J. Vac. Sci. Techno!., 19,803 (1981). 16. L.J. Brillson, Thin Solid Films, 89,461 (1982). 17. L.J. Brillson, Contacts to Semiconductors: Fundamentals and Technolo/!,y. ed. by L.J. Brillson, p.333 (Noyes Pub., New Jersey, 1993). 18. J.A. Calviello and J.L. Wallace, IEEE Trans. Electron Devices, ED-24, 698 (1977). 19. A. Christou and H.M. Day, Appl. Phys. Le/1., 47, 4217 (1976). 20. C.C. Chang and G. Quitana, Thin Solid Films, 31,265 (1976). 21. D.J. Chidi, Surf: Sci., 99, I (1980). 22. H. Cheng, X.-J. Zhang and A.G. Milnes, Solid-State Electron., 27, 1117 (1984). 23. C.Y. Chang and F. Kai (eds.), GaAs Hi!!.h-Speed Devices (John Wiley & Sons, New York, 1994). 24. C.-P. Chen, Y.A. Chang, J.-W. Huang and T.F. Kuech, Appl. Phys. Lett., 64, 1413 (1994). 25. A.M. Cowley and S.M. Sze, J. Appl. Phys., 36, 3212 (1965). 26. J. Comas and C. B. Cooper, J. Appl. Phys., 37, 2820 ( 1966). 27. J.W. Corbett and J.C. Bourgoin, D~f'ect creation in semiconductors, in Point defects in solids, 2 (eds. J.H. Crawford, Jr. and L.M. Slifkin), (Plenum, New York, 1975). 28. E.D. Cole, S. Sen and L.C. Burton, J. Electron. Mater., 18,527 (1989). 29. W.J. Devlin, C.E.C. Wood, R. Stall and L.F. Eastman, Solid-State Electron., 23, 823 (1980). 30. M.E. Edweeb, E.J. Charlson and E.M. Charlson, Appl. Phys. Lett., 43,563 (1983). 31. S.J. Eglash, M.D. Williams, P.H. Mahowald, N. Newman, I. Lindau and W.E. Spicer, J. Vac. Sci. Techno!., 82,481 (1984). 32. R.L. Farrow, R.K. Chang, S. Mcroczkowski and F.H. Pollak, Appl. Phys. Lett., 31, 768 (1977). 33. C. Feldman, Phys. Rev., 117,455 (1960). 34. A. Fernandez, H.D. Hallen, T. Huang, R.A. Buhrman and J. Silcox, J. Vac. Sci. Techno/., 89, 590 (1991). 35. T. Figielski, Appl. Phys., A35, 255 (1984). 36. R.F. Fowler, Phys. Rev., 38, 45 (1931 ). 37. A. Foyt, W. Lindley, J. Donnelly and C. Wolfe, Solid-State Electron., 12,209 (1969). 38. C. Fontaine, T. Okumura and K.N. Tu, J. Appl. Phys., 54, 1404 (1983). 39. J.L. Freeouf and J.M. Woodall, Appl. Phys. Lett., 39, 727 (1981). 40. K.F. Galloway and S. Mayyo, Solid State Techno!., 22, 96 ( 1979). 41. P. Gut!tin and G. Schnider, J. Appl. Phys., 43,549 (1972). 42. H.R. Grinolds and G.Y. Robinson, Appl. Phys. Lett., 34,575 (1979). 43. S. Guha, B.M. Arora and V.P. Salvi, Solid-State Electron., 20,431 ( 1977). 44. M. Hamasaki, Solid-State Electron., 26,299 (1983). 45. H. Hasegawa and H. Ohno, J. Vac. Sci. Techno!., 84, 1130 (1986). 46. H. Hasegawa, Li He, H. Ohno, T. Sawada, T. Haga, Y. Abe and H. Takahashi, J. Vac. Sci. Techno/., 85, 1097 (1987). 47. F. Hasegawa, M. Onomura, C. Mogi andY. Nannichi, Solid-State Electron., 31, 223 ( 1988). 48. H. Hasegawa, H. Ohno, H. Ishii, T. Haga, Y. Abe and H. Takahashi, Appl. Surf Sci., 41142, 372 (1989). 49. Y. Hasegawa, K. Kuk, R.T. Tung, P.J. Silverman and T. Sakurai, J. Vac. Sci. Techno!., 89, 578 (1991). 50. H. Hasegawa, T. Sato and T. Hashizume, J. Vac. Sci. Techno/., 815, 1227 (1997). 51. V. Heine, Phys. Rev., A138, 1689 (1965). 52. H.K. Henish, Semiconductor contacts: An approach to ideas and models, p.l46 (Clarendon, Oxford, 1984).
250
T.OKUMURA
53. 54. 55. 56. 57. 58. 59. 60. 61.
G.J.A. Hellings, A. Straayer and A.H.M. Kipperman, J. Appl. Phys., 57,2067 (1985). E. Ikeda, H. Hasegawa, S. Ohtsuka and H. Ohno, Jpn. J. Appl. Phys., 27, 180 (1988). A. Ismail, A. Brahim, J.M. Palau and L. Lasabatere, Surt: Sci., 168,409 (1986). A. Ismail, A. Brahim, J.M. Palau and L. Lasabatere, Vacuum, 36,217 (1986). R.L. Jacobson and G.K. Wehner, J. Appl. Phys., 36,2674 (1965). N.M. Johnson, T.J. Magee and J. Peng, J. Vac. Sci. Techno/., 13, 838 ( 1976). K. Kajiyama, S. Sakata and 0. Ochi, J. Appl. Phys., 46,3221 (1975). W.J. Kaiser and L.D. Bell, Phys. Rev. Lett., 60, 1406 ( 1988). C. Kaneshiro, M. Shimura and T. Okumura, Control of' Semiconductor Interfaces, p.l81 (Elsevier, Amsterdam, 1994). C. Kaneshiro and T. Okumura, J. Vac. Sci. Techno/., 815, 1595 ( 1997). H. B. Kim and G.G. Sweeney, Gallium Arsenide and Related Compounds 1974, Inst. Phys. Cont: Ser., 24, p.307 (1975). R. Kleinhenz, P.M. Mooney, C.P. Schneider and 0. Paz, 13th International Conference on Defects in Semiconductors, ed. L.C. Kimerling and J. Parsey, p.627 (Coronado, CA, 1984). S.P. Kowalczyk, J.R. Waldrop and R.W. Grant, Appl. Phys. Lett., 38, 167 (1981). S. Kurtin, T.C. McGill and C.A. Mead, Phys. Rev. Lett., 22, 1433 (1969). T.S. Kuan, P.E. Batson, T.N. Jackson, H. Rupprecht and W.L. Wilkie, J. Appl. Phys., 54, 6952 (1983). H. Kukimoto and S. Miyazawa (eds.), Semi-Insulating 111-V Materials, Hakone, 1986, pp.403-420 (Ohm & North-Holland, Tokyo, 1986). H. Leamy, J. Appl. Phys., 53, R251 (1982). S. Leung, L.K. Wong, C.L. Bauer and A.G. Milnes, J. Electrochem. Soc .. 132, 898 ( 1983). S. Leung, T. Yoshiie, D.D.L. Chung and A.G. Milnes, f. Electrochem. Soc., 130,462 (1985). M.S. Lin, W.H. Su, J.C. Lou and T.F. Lei, Proceedings (Jf' the 14th Conference on Solid State Device, Tokyo, 1982, p.397 ( 1983). T.-C. Lin, H.T. Kaibe, C. Kaneshiro, S. Miyazaki and T. Okumura, Proc. JnP and Related Materials (IPRM5), Paris, p.691 (IEEE, New Jersey, 1992). Z. Lillientai-Weber, E.R. Weber and N. Newman, Contacts to Semiconductors: Fundamentals and Technology, ed. by L.J. Brillson, p.416 (Noyes Pub., New Jersey, 1993). S.G. Louie and M.L. Cohen, Phys. Rev., 813,2461 (1976). S.G. Louie, J.R. Chelikowsky and M.L. Cohen, Phys. Rev., 815,2154 (1977). E.J. van Loenen, J.W.M. Frenken, J.F. van der Veen and S. Valeri, Phys. Rev. Lett., 54, 827 (1985). D.C. Look, Electrical Characterization of'GaAs Materials and Devices (Wiley. Chichester, 1989). R. Ludeke, T.-C. Chiang and T. Miller, J. Vac. Sci. Techno/., 81, 581 (1983). C.J. Madams, D.V. Morgan and M.J. Howes, Electron. Lett., 11,574 (1975). K. Matsumoto, N. Hashizume, H. Tanoue and T. Kanayama, Jpn. J. Appl. Phys., 21, L393 (1982). C.A. Mead and W.G. Spitzer, Phys. Rev., 134, A713 (1964). T. Mimura, K. Joshin and S. Kuroda, FUJITSU Scientific Tech. J., 19, 243 (1983). M. Missous, E.H. Rhoderick and K.E. Singer, Electron. Lett., 22,241 (1986). M. Missous and E.H. Rhoderick, Electron. Lett.. 22,477 (1986). M. Missous, E.H. Rhoderick and K.E. Singer, J. Appl. Phys., 59,3189 (1986). Y. Miura, K. Hirose, K. Aizawa, N. Ikarashi and B. Okabayashi,App1. Phys. Lett., 61, 1057 (1992). S. Miyazaki, T. Okumura, Y. Miura and K. Hirose, Jnst. Phys. Conf Ser. No. 149, p.307 (lOP, Bristol, 1996). S. Miyazaki, T.-C. Lin, C. Nishida, H.T. Kaibe and T. Okumura, J. Electronic Mater., 25, 577 (1996). N.F. Mott, Proc. Cambr. Phil. Soc., 34,568 (1938). W. Monch. Phys. Rev., 837.7129 (1988). W. Monch, Metallization and Metal-Semiconductor Interfaces (NATO AS! Series B· Physics, 195), ed. I.P. Batra, p.ll (Plenuim, New York, 1989).
62. 63. 64. 65. 66. 67. 68. 69. 70. 71. 72. 73. 74. 75. 76. 77. 78. 79. 80. 81. 82. 83. 84. 85. 86. 87. 88. 89. 90. 91. 92.
METAL-SEMICONDUCTOR CONTACTS
251
93. W. Monch, Control of' Semiconductor lntetj'aces, eds. I. Ohdomari, M. Oshima and A. Hiraki, p.169 (Elsevier, Amsterdam, 1994). 94. S.P. Murarka, Solid-State Electron., 17,869 (1974). 95. S.P. Murarka, Solid-State Electron., 17,985 (1974). 96. F.H. Mullins and A. Brunnschweiler, Solid-State Electron., 19,47 (1976). 97. M. Murakami, K.D. Childs, J.M. Baker and A. Callegari, J. Vac. Sci. Technol., 84, 903 (1986). 98. G. Myburug and F.D. Auret, J. Appl. Phys., 71, 6172 (1992). 99. N. Newman, T. Kendelewicz, L. Bowman and W.E. Spice, Appl. Phys. Lett., 46, 1176 ( 1982), 922 ( 1983). 100. M. Net and F.D. Auret, Jpn. J. Appl. Phys., 28,2430 (1989). 101. T.H. Ning, J. Appl. Phys., 49,4077 (1978). 102. 0. Oelhafen, J. Vac. Sci. Techno/., 81,787 (1983). 103. I. Ohdomari, T.S. Kuan and K.N. Tu, J. Appl. Phys., 50, 7020 (1979). 104. I. Ohdomari and K.N. Tu, J. Appl. Phys., 51, 3735 (1980). 105. T. Okumura and K.N. Tu, J. Appl. Phys., 54, 922 (1983). 106. T. Okumura and K.N. Tu, J. Appl. Phys., 61, 2955 (1987). 107. T. Okumura and T. Shibata, Jpn. J. Appl. Phys., 27, 2119 ( 1988). 108. T. Okumura and K. Shiojima, Jpn. J. Appl. Phys., 28, LJI08 (1989). 109. T. Okumura, S. Yamamoto and M. Shimura, Jpn. J. Appl. Phys., 32,2626 (1993). 110. T. Okumura, C. Kaneshiro, M. Shimura and S. Yamamoto, Electrochemical Microf'abrication, ECS Proceedings, 94-32, M. Datta, K. Sheppard and J.O. Dukovic (eds.), p.374 (Electrochemical Soc., Pennington, 1995). Ill. T. Okumura, lnst. Phys. Conf Ser., No. 149, p.287 (lOP, Bristol, 1996). 112. T. Okumura, Sci. Rep. of Research Institute ofTohoku University, A44, 187 (1997). 113. T. Okumura, SOTAPOCS XXXlll, ECS Proceedings, 98-2, H.Q. Hou, R.E. Sah, S.J. Pearton, F. Ren and K. Wada (eds.), p.400 (Electrochemical Soc., Pennington, 1998). 114. A. Olbrich, J. Vanceaq, F. Kreupl and H. Hoffmann, Appl. Phys. Lett., 70, 2559 ( 1997). 115. F.A. Padovani and R. Stratton, Solid-State Electron., 9, 695 (1966). 116. J.M. Palau, E. TestemaJe and L. Lassabatere, J. Vac. Sci. Technol., 19,202 (1981). 117. J.M. Palau, E. TestemaJe, A. Ismail and L. Lassabatere, J. Vac. Sci. Technol., 21, 6 (1982). 118. H. Palm, M. Arbes and M. Schulz, Phys. Rev. Lett., 71, 2224 (1993). 119. S.J. Pearton, U.K. Chakrabarti, A.P. Perley and K.S. Jones, J. Appl. Phys., 68, 2760 ( 1990). 120. J. Pearton, W. Corbett and M. Stavola, Hydrogen in Crystalline Semiconductors, (Springer, Berlin, 1992). 121. D. Pons and J.C. Bourgoin, J. Phys. C: Solid State Phys., 18, 3839 (1985). 122. E.H. Rhoderick and R.H. Williams, Metal-Semiconductor Contacts, 2nd ed. (Clarendon Press, Oxford, 1988). 123. I.K. Robinson, R.T. Tung and R. Feidenhans'l, Phys. Rev., 838, 3632 (1988). 124. W. Schottky, Naturwiss., 26, 843 ( 1938). 125. M. Schulillter, Phys. Rev., 817,5044 (1978). 126. G.P. Schwartz, G.L. Gualtieri, J.E. Griffiths, C.D. Thurmond and B. SchwaltZ, J. Electrochem. Soc., 127,2488 (1980). 127. G.P. Schwartz and G.J. Gualtieri, J. Electrochem. Soc., 133, 1021 (1986). 128. A.S. Sedra and K.C. Smith, Microelectronic Circuits, 4th ed. p.604 (Oxford University Press, New York, 1998). 129. J.M. Shannon, Appl. Phys. Lett., 24, 369 (1974). 130. J.M. Shannon, Appl. Phys. Lett., 25, 75 (1974). 131. Y.C. Shih, M. Murakami, E.L. Wilkie and A. Callegari, J. Appl. Phys., 62, 582 ( 1987). 132. K. Shiojima and T. Okumura, Jpn. J. Appl. Phys., 30,2127 (1991). 133. K. Shiojima and T. Okumura, Proc. IEEE International Reliability Physics Symposium, Las Vegas, p.234 (1991). 134. S.-Q. Shao, H.-T. Kaibe and T. Okumura, !nsf. Phys. Conj: Ser., No. 129, p.657 (lOP, Bristol, 1993). 135. A.K. Sinha and J.M. Poate, Appl. Phys. Lett., 23, 666 ( 1973). 136. A.K. Sinha, T.E. Smith, M.H. Read and J.M. Poate, Solid-State Electron., 19, 489 (1976).
252
T.OKUMURA
137. A.K. Sinha and J .M. Poate, This jilms-lnterdiffusion and Reactions, eds J .M. Poate, K.N. Tu and J.W. Mayer, Chap. II (Wiley, New York, 1978). 138. I.L. Singer, Surf: Sci., 7, 108 (1981). 139. H. Sirringhaus, E.Y. Lee, H. von Kiinel, J. Vac. Sci. Techno/., B12, 2629 (1994). 140. H. Sirringhaus, E.Y. Lee, U. Kafedar and H. von Kiinel, J. Vac. Sci. Techno/., B13, 1848 (1995). 141. W.E. Spicer, I. Lindau, P.E. Gregory, C.M. Garner, P. Pianetta and P.W. Chye, J. Vac. Sci. Techno/., 13,780 (1976). 142. W.E. Spicer, P.W. Chye, P.R. Skeath, C.Y. Su and I. Lindau, J. Vac. Sci. Techno/., 16, 1426 (1979). 143. W.E. Spicer, P.W. Chye, P.R. Skeath, C.Y. Su and I. Lindau, J. Vac. Sci. Techno/., 17, 1019 (1980). 144. WE. Spicer, I. Lindau, P.R. Skeath, C.Y. Su and P.W. Chye, Phys. Rev. Lett., 44, 420 (1980). 145. W.E . Spicer, Z. Liliental-Weber, E. Weber, N. Newman, T. Kendelewicz, R. Cao, C. McCants, P. Mahowald, K. Miyano and I. Lindau, J. Vac. Sci. Techno/., B6, 1245 (1988). 146. K. Stiles, A. Kahn, D. Kilday and G. Margaritondo, J. Vac. Sci. & Techno/., B5, 987 (1987). 147. T. Sugino, Y. Sakamoto, T. Sumiguchi, K. Nomoto and J. Shirafuji, Jpn. J. Appl. Phys., 32, Lll96 (1993). 148. S.M. Sze, Physics of' Semiconductor Devices, 2nd ed. (Wiley, New York, 1981 ). 149. P.C. Tayler and D.V. Morgan, Solid-State Electron., 19,473 (1976). 150. C. Tejedor, F. Flores and E. Louis, J. Phys., C10, 2163 (1977). 15 I. J. Tersoff, Phys. Rev. Lett., 52, 465 ( 1984 ). 152. J. Tersoff, Phys. Rev., B32, 6968 (1985). 153. C.D. Thurmond, G.P. Schwartz, G.W. Kammlott and B. Schwartz, J. Electrochem. Soc., 127, 1366 (1980). 154. E. Tokumitsu, Jpn. J. Appl. Phys., 29, L698 (1990). 155. R.T. Tung, J.M. Poate, J.C. Bean, J.M. Gibson and D.C. Jacobson, Thin Solid Films, 93, 77 (1982). 156. R.T. Tung, Phys. Rev. Lett., 52,461 (1984). 157. R.T. Tung, Appl. Phys. Lett., 58, 2821 (1991). 158. R.T. Tung, Phys. Rev., B45, 13509 ( 1992). 159. M.S. Tyagi, Proceedings (Jf'the 8th Conference on Solid State Device, Tokyo, 1976 ( 1977), p.333. 160. R.G. Unsperger, O.J. Marsh and C.A. Mead, Appl. Phys. Lett., 13,295 (1968). 161. L.M.O. Van Den Berghe, R.L. Van Merhaeghe, W.H. Laflere and F. Cardon, Solid-State Electron., 29, 1109 (1986). 162. E. Vlieg, A.E.M.J. Fischer, J.F. van der Veen, B.N. Dev and G. Materlik, Sur( Sci., 178, 36 ( 1986). 163. R.E. Viturro, S. Chang. J.L. Shaw. C. Mailhiot, L.J. Brillson, A. Terrasi, Y. Hwu, G. Margaritondo, P.D. Kirshner and J.M. Woodall, J. Vac. Sci. & Techno!., B7, 1007 (1989). 164. 0. Wada, S. Yanagisawa and H. Takanashi, Jpn. J. Appl. Phys., 12, 1814 ( 1973). 165. 0. Wada, S. Yanagisawa and H. Takanashi, Appl. Phys. Lett., 29, 263 ( 1976). 166. 0. Wada and A. Majorfeld, Electron. Lett., 14, 125 (1978). 167. J.R. Waldrop, S.P. Kowalczyk and R.W. Grant, J. Vac. Sci. Techno/., 21, 607 ( 1982). 168. J.R. Waldrop, Appl. Phys. Lett., 41, 352 (1982). 169. J.R. Waldrop, J. Vac. Sci. Techno/., B2, 445 (1984). 170. J.R. Waldrop, Appl. Phys. Lett., 44, 1002 (1984). 171. Y.-X. Wang and P.H. Holloway, J. Vac. Sci. Techno/., B2, 613 (1984). 172. Y.G. Wang and S. Ashok, J. Vac. Sci. Techno!., A6, 1548 (1988). 173. T. Wada, T. Kanayama, S. lchimura, Y. Sugiyama and M. Komuro, Jpn. J. App/. Phys., 33, 7228 (1994 ). 174. E.R. Weber, H. Ennen, V. Kaufmann, J. Windschief, J. Schneider and T. Wosinski, J. Appl. Phys., 53, 6140 (1982). 175. T. Wilson, W.R. Osicki, J.N. Gannaway and G.R. Booker, J. Mater. Sci., 14, 961 ( 1979). 176. C.S. Wu, D.M Scott, W.-X. Chen and S.S. Lau, J. Electrochem. Soc., 132, 918 (1985). 177. N.-J. Wu, H. Hasegawa and T. Hashizume, Jpn. J. Appl. Phys., 33, 936 (1994).
METAL-SEMICONDUCTOR CONTACTS
253
178. N.-J. Wu, T. Hashizume, H. Hasegawa andY. Amemiya, Jpn. J. Appl. Phys., 34, 1162 (1995). 179. Y. Yamada, E. Tokumitsu, K. Saito, T. Akatsuka, M. Miya, M. Konagai and K. Takahashi, J. Crystal. Growth, 95, 145 (1989). 180. L.L.-M. Yeh, Y.-J. Xie and P.H. Holloway, J. App/. Phys., 65, 3568 (1989). 181. M.A. Zaikovskaya, A.E. Kiv and O.R. Niyazova, Phys. Stat. Sol. A, 3, 99 ( 1970). 182. D. Coulman, N. Newman, G.A. Reid, Z. Lilienta1-Weber, E.R. Weber and W.E. Spicer, J. Vac. Sci. & Techno/., AS, 1521 (1987).
CHAPTER 7
Electrical Characterization of Defects Introduced in Epitaxially Grown GaAs by Electron-, Proton- and He-Ion Irradiation F.D. AURET Physics Department, University of Pretoria, Pretoria 0002, South Africa
1. Introduction 2. Particle Irradiation of Semiconductors 2.1. Energy-loss Mechanisms 2.2. Range Distribution of Implanted Ions 2.3. Radiation Damage and its Distribution 3. Defect Characterisation by Deep Level Transient Spectroscopy 3.1. Characteristics of Deep Level Defects 3.2. Deep Level Transient Spectroscopy 3.3. Summary 4. Electron Irradiation Induced Defects in GaAs 4.1. Overview 4.2. Electron Irradiation Using a 90 Sr Radio-Nuclide 4.3. Electron Irradiation in Linear Accelerators 4.4. Near Mid-Gap Levels Introduced by High Energy Electron Irradiation
4.5. Sub-Threshold Energy Electron Irradiation 4.6. Summary
5. Proton Irradiation 5.1. Overview 5.2. Dependence of Defect Introduction on Proton Energy . 5.3. Summary 6. He-Ion Irradiation 6.1. Overview 6.2. Alpha-particle Irradiation Using an 241 Am Radio-Nuclide 6.3. Low Energy He-Ion Bombardment . 6.4. Low Temperature Experiments 255
256 258 258 261 263 264 265 268 274 275 275 277 282 283 285 288 289 289 291 296 297 297 298 301 305
F.D. AURET
256
7.
8.
9.
10.
6.5. Impurity Related a-particle Irradiation Induced Defects 6.6. Summary Metastable Radiation Induced Defects in GaAs 7.1. Background 7.2. Silicon-doped Epitaxially Grown n-GaAs 7.3. Sulphur-doped Epitaxially Grown GaAs 7.4. Summary Effect of an Electric Field on Emission From Radiation Induced Defects . 8.1. Background 8.2. Defects in n-GaAs 8.3. Defects in p-GaAs 8.4. Summary Effect oflrradiation on GaAs Free Carrier Density and SBD Characteristics 9.1. Low Energy Electrons 9.2. Low Energy He-ions . 9.3. High Energy Electrons . 9.4. High Energy Protons and a-particles 9.5. Summary Summary and Conclusions Acknowledgements References
306 307 308 308 308 315 315 316 316 318 321 325 325 326 329 331 331 335 335 338 339
1. INTRODUCTION Radiation of semiconductors has been studied for several decades and the two main thrusts of these investigations were, firstly, determining the effects of irradiation on semiconductor properties as a function of projectile type, energy and dose and, secondly, establishing the properties and structure of the defects introduced during irradiation. The results obtained from these studies served as a basis for several areas in semiconductor materials modification and device fabrication, such as doping, isolation and carrier lifetime control. In many early studies, the focus was on the undesirable effects of radiation induced defects in electronic devices which have to function in radiation environments, for example, near radiation sources or in outer space where they are exposed to cosmic rays. Radiation induced defects were also shown to be particularly harmful during doping by ion implantation, where they compensate the doping effect. Some insight into the significance of this problem may be gained by considering that, when doping GaAs by implantation of light ions, for example Be+ at I MeV, approximately 200 carriers are removed per implanted ion [1], i.e. significantly more than the
ELECTRICAL CHARACTERIZATION
257
4 carrier per 150-200 keV protons [ 1]. Thus, even if all the implanted doping ions become electrically active, one residual defect per implanted ion is sufficient to totally compensate the doping effect. Consequently, much of the early research was directed towards determining the optimum annealing conditions required to remove the radiation damage, and thus allow the implanted atoms to dope the semiconductor. Whilst solving this problem, it was realized that the defects introduced during ion implantation could be valuable for device isolation applications, and subsequently there was a shift in emphasis towards optimizing ion implantation induced isolation procedures. In GaAs, for example, particle radiation was found to introduce defects which were effective compensating centers, stable at room temperature, and, if present in high enough concentrations, able to convert doped GaAs into its semi-insulating form [2, 3]. The realization that radiation induced defects can beneficiate electronic materials and devices by altering their properties, lead to new fields of research and novel applications. In the development of new processes for fabrication of Si integrated circuits, the use of ion implantation with energies in the MeV range has steadily increased. This includes, for example, formation of retrograde wells [4], luminescence centers for electro-optical devices [5], conductive silicides and insulating oxides and nitrides [6, 7]. Moreover, irradiation with high energy electrons, protons, alpha-particles and heavier ions has received growing interest as a technique to control the carrier lifetime in silicon power devices [8, 9]. Compared to gold diffusion traditionally used for lifetime control, irradiation can provide either a uniform lifetime tailoring (when using MeV electrons), or a limited-depth lifetime alteration (when employing keV- MeV ions). Localised layers with a high density of lifetime "killers" can be created at any depth within the device by varying the ion energy [10]. Most ofthese experiments have been conducted using Si, and in comparison, little attention has been paid to altering the properties, for whichever purpose, of GaAs. It has, however, recently been suggested that metastable defects created by particle irradiation of GaAs, may be significant in realizing optical non-linear devices [11]. For successfully realizing these applications, it is imperative to understand the effect of radiation on electronic materials and devices fabricated on them, firstly, in order to avoid the deleterious effects of some defects and, secondly, to utilize the beneficial effects of others, depending on the application. To fully understand the role of any defect in a particular electronic or optoelectronic device, several properties of the defect need to be known, namely its energy level(s) in the band gap, concentration, and thermal and optical capture and emission rates for electrons and holes [12]. This allows the effect of a defect on the properties of electronic materials and devices to be predicted by modelling. In addition, the structure, introduction rate, introduction mechanism and thermal stability of the defect should be
258
F.D. AURET
determined so that it can be reproducibly introduced, avoided or eliminated, depending on the application. Deep level transient spectroscopy (DLTS) [13, 14] has been instrumental in determining most of the above mentioned properties of defects introduced in several different semiconductors during crystal growth, radiation with different particle types and processing during device fabrication. DLTS has also provided important information pertaining to the behaviour of defects in electric and magnetic fields and under uniaxial stress. The latter type of study provides valuable information about the symmetry of defects, which in turn aids in determining their structure. In the case of GaAs, electron and proton irradiation have attracted the most interest and comprehensive reviews of electron irradiation induced defects have appeared [15, 16]. Finally, DLTS is particularly attractive because it can be used to characterize defects using various kinds of space charge based devices, ranging from simple Schottky barrier diodes (SBDs) and p-n junctions to device structures with higher degrees of complexities [ 17]. In Section 2, the terminology and key concepts underlying the field of particle-solid interaction are introduced, with special reference to the irradiation of GaAs with protons and He-ions. In Section 3, a description of some characteriztics of deep level defects and the DLTS technique is presented. Sections 4-6 deal with the defects introduced in GaAs by electron-, proton- and He-ion irradiation, respectively. Metastable irradiation induced defects in GaAs are discussed in Section 7, while the effect of an electric field on the emission of carriers from radiation induced defects in n- and p-GaAs is the topic of Section 8. In Section 9, the effects of radiation induced defects on GaAs free carrier density and device properties are elucidated. The main results discussed in these sections are summarized in Section 10.
2. PARTICLE IRRADIATION OF SEMICONDUCTORS When energetic particles enter a material, they are decelerated and the energy thus transferred to the material can modify its structure and properties. In the case of crystalline semiconductors, partiCle induced materials modification, traditionally known as radiation damage, will occur as long as the projectile particles can transfer energy, E, larger than the displacement energy, Ed, of the lattice atoms. The extent to which a material is modified, depends on the energy deposited per unit volume. The main energy-loss mechanisms of energetic ions in a solid are discussed below. 2.1.
Energy-loss Mechanisms
Energetic particles primarily transfer energy by two mechanisms: (1) screened Coulomb collisions with target atoms (nuclear stopping), and (2)
ELECTRICAL CHARACTERIZATION
259
interactions with bound or free electrons in the solid (electronic stopping). The relative effect of the two mechanisms depends on the energy and the mass of the incident particle, as well as the mass of the target atoms. Figure I depicts the velocity (ex, t: 112 ) dependence ofthe two energy-loss processes, nuclear stopping v = (dt: I dp )n and electronic stopping (dt: I dp )e, in terms of the reduced energy, t:. Both t: and the reduced path length, p [ I8], are dimensionless and can be expressed in terms of laboratory units E and x as: (I)
and (2)
where M1 and M2, and Z1 and Z2 are the mass numbers and atomic numbers of the incident particle and target atoms, respectively, e is the electronic charge, N is the number of atoms per unit volume, t:o is the permittivity of free space and a is the screening radius. Several expressions exist for the screening radius [I9, 20], with the most frequently used being that given by [2I]: 0.8853ao
(3)
where ao = 0.529 A is the Bohr radius. The values of Elt: (keY) required to quantitatively interpret Figure I are tabulated in Table I for some typical ions implanted into GaAs. Using the reduced energy has two advantages, namely: (I) nuclear stopping and associated quantities, such as damage production and sputtering, can be approximated by a universal curve for all particle-target combinations (Figure I), and (2) ion bombardment studies can be separated into two distinct regimes. In the first regime, called the ion implantation regime (t: < 10), both nuclear and electronic stopping significantly contribute to energy loss, and theoretical treatments in this regime are complex. In the second regime, referred to as the nuclear analysis regime (t: » 10), where ions are sufficiently fast so that they are virtually stripped of all their electrons, electronic stopping is the dominant energy-loss process. In this regime, the ion trajectory is almost linear, sputtering and collision cascade effects are practically negligible, and the Bethe-Bloch formalism can be used for determining energy loss and penetration [22]. Figure I shows that at low energies (relevant to sputtering and ion beam etching), nuclear stopping is the more important process and that it reaches a maximum value (t:J) around t: 112 = 0.6, and thereafter decreases. From Table I and Figure I it is seen that for protons and He-ions in GaAs this corresponds to energies of approximately I.2 keY and 2.5 keY, respectively.
F.D. AURET
260
lon Implantation Regime E!':10
.l9
·c: :::1 u.:
r-:
.!:
Nuclear Microanalysis Regime
0.6 0.4
~
::!2 w :E!..
0.2
0 ..::::.._ _...__ _.....__ ____..-\
0
2
3
e'rz Fig. 1.
(de!dp)n
10
(Energy (e) in T.F. units)
Nuclear and electronic stopping versus the reduced energy of an implanted ion [I].
20
3
E~ .~:.As va~ca;;J
'?
E (.)
2 (£2) and that it increases linearly with velocity up to about £ 112 = 14 (£ 3 ). It should be pointed out
that whereas (d&jdp)n is only a function of£ (i.e., independent of incident particle type and host atoms), the electronic stopping can be written as:
(4) where k is a function of Z 1, Z2, M 1 and M2. Consequently, electronic stopping does not exhibit true £-scaling and can consequently not be described by a universal curve. 2.2.
Range Distribution of Implanted Ions
The deceleration of a projectile in an amorphous solid is a statistical process. The range, R, ofthe projectile is related to its mean track length before coming to rest, while the projected range Rp gives the mean penetration depth of the projectile relative to the surface and is the parameter of practical significance. The range, R, of a bombarding ion with initial energy, £;, is given by: 0
R =
f
1 (d&jdp)total
where (d&jdp)total = (d&jdp)n
d£,
+ (d&jdp)e.
(5)
(6)
For M1 2:: M2, the projected range, Rp. is obtained by multiplying the range, R, with the projection factor, approximately equal to (1 + M2!3M1 )- 1 [21]. In the case of a monocrystalline target, the deviations in predicted and measured projected ranges can be significantly different (more than 20%) when channelling effects occur [23]. A more exact knowledge about the depth distribution calls for an evaluation of the range straggling. If the spatial distribution of implanted ions is approximately gaussian, then the straggle can be described by the standard deviation !!.R. According to the Lindhard-Scharff-Schiott (LSS) theory [24], the total straggling per ion path length, i.e. !!.Rj R, for£ < 3 approaches a
262
F.D. AURET
105
a - proton range b - He-ion range c - proton straggle d - He-ion straggle
a
10-2 102
Energy (keV) Fig. 3. Range and straggle of protons and He-ions in GaAs as function of energy, calculated using TRIM [20].
constant value of: ll.Rj R
= 0.35
2(M 1 M 2 ) 112 M 1 +M2
(7)
As electronic stopping increases at higher energies, the relative straggling becomes smaller. The relative straggling in projected range, ll.Rp/ Rp, is almost identical to !:J.R/ R since the path length correction terms for the numerator and denominator are virtually identical. Simulations of implantation profiles and ranges can be computed by using Monte Carlo based techniques, for example, the TRIM (TRansport of Ions in Matter) code of Biersack and Haggmark [20]. For example, Figure 2 depicts the distribution profiles of 1 MeV protons and the vacancies that they create as a function of distance into GaAs, calculated using TRIM. Figure 3 depicts the range and straggle of protons and He-ions in GaAs as a function of projectile energy, calculated using TRIM, and gives the ranges of 1 MeV protons and He-ions as 11.7 ~-tm and 3.0 ~-tm, respectively. An extensive review of computer simulations of ion-solid interactions can be found in [25]. Although being widely employed, these codes should be used with caution, especially in crystalline substrates, as they generally do not take channelling into account and do not make provision for possible diffusion effects during and after the implantation. One of the exceptions to this is the
ELECTRICAL CHARACTERIZATION
263
Marlowe code [26, 27, 28], which takes account of the crystallinity of the material and includes channelling effects. 2.3.
Radiation Damage and its Distribution
Radiation damage will be created in crystalline materials as long as the energy that the projectile can transfer, E, exceeds the displacement energy, Ed, of the lattice atoms. Atomic replacements and interstitials can occur for Ed < E < 2Ed, while vacancies and interstitials are formed forE > 2Ed. In the case of electron irradiation, only Ed is required to form a vacancy since, after having knocked an atom off its site, the electron is mobile and rapidly diffuses away, leaving behind a vacancy. This is not necessarily the case for protons and heavier atoms. The energy transferred in an elastic collision depends on the masses of the particles involved and the impact parameter. The maximum energy, Tmax. transferred in a head-on collision, is given (in the non-relativistic limit) by: 4MIM2 E max - (MI + M2) 2 '
T.
(8a)
where E is the energy of the bombarding particle with mass MJ. In the case of electron irradiation, the relativistic expression: 2 1 Tmax = ( M ) M2
2 (~) (E + 2M1c ) M1c
(8b)
must be used, which can be written in the convenient form:
2147.8)
Tmax = ( - A -
(E
+ 1.022)E,
(8c)
where A is the atomic number of the target atom, E is in MeV and Tmax in eV. If the energy of an atom which is knocked out of its lattice site is large enough, this atom may in turn displace other atoms, and if this process continues, a cascade of atomic collisions is created. This results in a distribution of vacancies, interstitial atoms and higher order defects in the region surrounding the ion track. The extent of collision cascades is governed by nuclear and electronic energy-loss processes. However, only the nuclear component, v, contributes to the production of energetic recoil atoms. For e < I (linear cascade regime for sputtering), a constant fraction of approximately 80% of the total energy (vIe ~ 0.8) is consumed in recoil processes, whereas the ratio vfe decreases rapidly when e > 1. The number of displaced atoms, N d, in a collision cascade can be estimated from v(E) through the Kinchin-Pease relationship [29]: Nd =
v(E)
~ 2Ed'
(9)
264
F.D. AURET
where Ed is the displacement energy threshold of the lattice, which for GaAs is approximately 9-10 eV [30] and v(E) = Evjt: is the total energy deposited in atomic motions. For the original derivation of Eq. (9), hard sphere collisions were assumed in which case~ = I. The value of~ ~ 0.8 was introduced by Sigmund [31] to account for the effect of more realistic (not hard sphere) interatomic potentials. It is further important to note that Eq. (9) often overestimates the amount of disorder, since it overlooks the effects of ion channelling and of vacancy-interstitial recombination within the cascades. The amount of energy deposited into energetic recoils and the total number of vacancies produced for a given ion-target interaction can also be simulated using TRIM. Since an ion requires an amount of energy greater than 2Ed for the production of vacancies and interstitials via elastic collisions, the maximum of the damage distribution profile is always closer to the surface than the maximum of the ion depth distribution, as indicated in Figure 2. An additional mechanism of creating defects, which has not received much attention, occurs when positively charged ions entering a solid have enough energy to surmount the coulombic energy barrier of the host nuclei. The threshold energy for a positively charged ion with atomic and mass numbers, Z 1 and A 1, respectively, to enter the nucleus with atomic and mass numbers Z2 and A2, respectively, is the energy, E P• required to surmount the coulombic barrier and can be written as: (10)
where R = Ro(A:/3 + A~ 13 ) with Ro = 1.2 x 10- 15 m [32]. Calculations based on this, show that protons and He-ions require about 6 MeV and 11 MeV, respectively, to enter the nuclei of Ga and As nuclei. Once in the nucleus, a multitude of nuclear reactions are possible, including, for example, neutron emission by (p, n) reactions. The fact that neutrons can be emitted is important, because the mechanism for damage formation by neutron irradiation is different to that by charged particles, and consequently some different defects can expected to be formed. 3. DEFECT CHARACTERIZATION BY DEEP LEVEL TRANSIENT SPECTROSCOPY Defects in the crystal lattice are the consequence of the intentional or unintentional introduction of impurities or damage into the crystal structure. These imperfections introduce electronic states in the band gap which lie further away from the band edges than dopant levels, and these states are
ELECTRICAL CHARACTERIZATION
265
commonly referred to as "deep levels". Deep level defects are present in all semiconductors in concentrations that depend on the semiconductor and the method by which it was grown and processed, and these deep levels affect the electronic properties of semiconductors. Sometimes deep level defects are intentionally introduced in order to modify a specific materials property. For example, it has been shown that radiation induced defects can be used to reduce the lifetime of carriers in Si [8, 9, 33], thereby enhancing the switching time of high frequency oscillators fabricated on it. The challenge in the area of radiation induced materials modification lies in innovative defect engineering through which the deleterious effects of defects can be avoided, and their beneficial effects harnessed to tailor the properties of materials and devices for specific needs and niche applications. Clearly, this requires an intimate knowledge of the properties and behaviour of defects. In the next few sections, the most important aspects of deep level defects and of deep level transient spectroscopy (DLTS), used for the determination of the electronic properties of these defects, are reviewed.
3.1.
Characteristics of Deep Level Defects
Defects with deep states in the band gap are often referred to as traps, recombination centers, generation centers or deep level defects. In a neutral semiconductor an electron trap can be defined as a defect for which the electron capture rate, en, is much larger than the hole capture rate, cp. In contrast, a recombination center is one for which both en and cp are about the same. The capture cross section, an. for electron capture is related to the electron capture rate, Cn, by [12]: (II)
where n is the electron concentration and (vn) its average thermal velocity. An analogous expression holds for cp in terms of ap. Note that the capture rates depend on the doping concentration of the material. Traps are further categorised as majority or minority carrier traps. An electron trap is a majority carrier trap in n-type material and a minority carrier trap in p-type material. The thermal emission rate, en. of carriers from traps is proportional to a Boltzmann factor, exp( -D.E I kT), and, for traps which emit electrons to the conduction band, en can be written as [34]: (12)
where D.E = Ec - ET, with Ec and ET the energies of the conduction band and the trap respectively, Nc is the effective density of states in the conduction band, g is the degeneracy of the defect level and T is the absolute
266
IE,
F.D. AURET
Ev
Electron trap
Recombination center
Cn » Cp
Cn- Cp
(b)
(c)
---e-"~1--~r-C-~-T------------l-C_p_E__ ; E, eP
1-
---------------------L--L----Ev (a)
Fig. 4. (a): Thermal emission and capture processes at deep levels, and (b) and (c): difference between electron trap and recombination center.
temperature. An analogous expression holds for hole emission to the valence band. The quantity (vn)Nc varies as T 2 , and therefore, if en can be measured as function of temperature, an Arrhenius plot of en/T 2 vs l/T will yield !::,.£ and CJn. The thermal emission and capture processes at deep levels are illustrated in Figure 4(a). The electron and hole capture cross sections, an and ap, are generally temperature dependent [12, 34]. In the case of deep level defects, this is often the result of carrier capture by multiphonon emission via lattice relaxation [35, 36], in which case the capture cross section, a, has the form: (J
= CJoo exp [
t:,Ea J -u
(13)
where t:,Ea is the thermal activation energy of the capture cross section. Thus, a more general expression for the thermal emission rate of electrons to the conduction band is: CJn(Vn)Nc [ (!::,.£ + !::,.£)] en= exp -------,--(14) g kT The thermal activation energy for emission of an electron to the conduction band, t:,Ea = !::,.£ + !::,Ea. determined from an Arrhenius plot, therefore, has two components: the energy difference between the trap level and the bottom of the conduction band,!::,.£, and the thermal activation energy ofthe capture cross section, t:,Ea (Figure 5).
267
ELECTRICAL CHARACTERIZATION
Configuration co-ordinate, Q Fig. 5. Configuration co-ordinate (CC) diagram depicting the energy level of the defect below the conduction band, t;.E, the thermal activation energy of the capture cross section, t;.E", and the total energy an electron requires to escape from the trap level to the conduction band, /';.Ea.
The activation energy for thermal emission is the most commonly used parameter to characterize a deep level. However, the physical parameter 11E in Eqs. (12) and (14) is the Gibbs free energy:
11E = Ec - Er
= 11H -
T 11S
(15)
where 11 H and 11 S are the changes in enthalpy and entropy due to the change in charge state of the level. When combining Eqs. (12) and (15), it follows that:
en= an(v;)Nc exp [ ~SJ exp [ _
~:]
(16)
Therefore, the slope of an Arrhenius plot yields the enthalpy of the deep level, not the free energy, which can only be determined from optical measurements (34, 37, 38). However, from Eq. (16) it can be seen that the activation energy obtained from the slope of an Arrhenius plot is equal to the free energy obtained at T = 0 K. This is generally not the same as the free energy at the measurement temperature, due to the temperature dependence of the band gap energy. For temperatures greater than absolute zero, therefore, the energy position of the trap can only be accurately determined when the temperature dependence of the band gap energy is known [ 12].
268
F.D. AURET
Finally, in addition to being emitted by thermal excitation, carriers may also be emitted from defect states by optical excitation. Optical emission rates can be determined from photocurrent or photocapacitance measurements. The two optical cross sections involved, an(hv) and a%(hv), which are functions of the photon energy, and define the optical properties of a defect state. In n-type material an(hv) is the optical absorption spectrum of the defect and u%(hv) is equivalent to the photoluminescence spectrum, while in p-type materials the roles of u~(hv) and a%(hv) are reversed [34].
3.2.
Deep Level Transient Spectroscopy
In this section the concepts required for DLTS measurements and the interpretation of the results will be briefly reviewed. With DLTS, defects in semiconductors are analyzed by probing the space-charge layer, also referred to as the depletion region, which exists in a p-n junction or Schottky barrier diode [34, 39], as illustrated in Figure 6. The width, w, of the depletion region of a SBD or p+ -n junction varies with the applied voltage according to: w=
2t:(Vbi
+ V)
qN
(17)
where c: is the dielectric constant of the depleted semiconductor, Vhi is the built-in voltage of the junction, V is the externally applied voltage, q is the charge on the electron, and N is the density of the ionized impurities due to dopants and other imperfections. The junction capacitance due to the depletion layer is: t:A
C=-=A w
2(Vbi
+ V)
(18)
where A is the area of the junction. It is clear from Eqs. (17) and (18) that if N changes in the depletion region, w and C will also change, and therefore the junction capacitance is a direct measure of the total charge. If the concentration of electrons or holes trapped at deep levels is changed by the thermal or optical emission of carriers to the conduction or valance bands, this change can be monitored by measuring the variation in the junction capacitance at constant applied voltage [40, 41]. The variation in junction capacitance as a result of the temperature dependent variation of N forms the basis of capacitance-based DLTS. Carrier capture and emission is shown schematically in Figure 7 for a SBD having an electron trap in the upper half of the band gap. In equilibrium, when a defect level is below the Fermi level, it is filled with electrons, while it is empty when above the Fermi level. Under a steady-state
ELECTRICAL CHARACTERIZATION
metal
269
semiconductor ---w(O)--~
••••••••••••••..•••••••••••••..••••••••~F
----~------------------------Ev Llw ----w(V) ---+1
Fig. 6. Depletion region of a Schottky bm:rier diode with built-in voltage Vb;, on n-GaAs under zero bias and reverse bias, V. The widths of the depletion layer (w) and transition region (A) are defined in Eqs. (17) and (23), respectively.
270
F.D. AURET
w
©
I~+-•----+~•1...
@ metal
metal
semiconductor
t
~
-----
-T-------P~~~
@ -+--~~~~;;, Ec Er
metal
semiconductor
Ev
©
Er
semiconductor
w
®
w
metal
semiconductor
Ev
• filled defect state o empty defect state
Fig. 7. Variation of depletion region width and trap population of an electron trap in n-type semiconductor for a DLTS bias and filling pulse cycle. (A) and (B) are during reverse bias and the filling pulse, respectively, whereas (C) and (D) are directly, and at a time t, after removing the filling pulse. The resultant capacitance transient is qualitatively shown in the center of the figure.
reverse bias voltage (A), the traps in the depletion region, above the Fermi level, are therefore empty. Reducing the applied voltage to V - Vp, (B), reduces the width of the depletion region and allows electrons to be trapped at the deep levels. Electron capture into an initially empty trap is given by: N(t)
= Nr[l
- exp( -cnt)]
(19)
where Nr is the trap density and en is the capture rate as defined in Eq. (11). When the voltage is restored to its original steady-state value, V, the filled traps lie within the depletion region, as shown in (C). The emission of trapped electrons to the conduction band, where they are instantaneously swept away by the junction electric field, is observed as a majority carrier capacitance transient (D). Experimentally, the electron emission rate can be determined from the time dependence of the capacitance transient. The density of occupied traps at time t after removing the filling pulse is: N(t)
= Nr exp( -ent)
(20)
ELECTRICAL CHARACTERIZATION
271
where en is the thermal emission rate and Nr is the trap concentration, assuming all the traps to be initially occupied. From Eqs. ( 12) and (20) it can be shown that the change in trap population gives rise to a corresponding change in diode capacitance, which is time dependent, and if Nr « N D· can be expressed as: C(t)
= Co-
t-.C0 exp( -ent)
(21)
Here Co is the equilibrium reverse bias (V) capacitance and !3.C0 the change in capacitance directly after removal of the filling pulse. The procedure for determining the energy level, Er, and capture cross section, an, of a defect is to extract en from the transient, C(t), in Eq. (21) at several temperatures and then use Eq. (12) to obtain Er and an, commonly referred to as the defect's "signature". The key step in this process is to obtain en from the transient for which several analogue and digital methods exist. Most of the early DLTS experiments were performed using boxcar averagers [13, 14] or lock-in amplifiers [34] to analyze the transient resulting from the application of a repetitive bias/pulse sequence. For both these methods, DLTS proceeds by scanning the sample temperature and feeding the repetitive thermal emission transient, which varies with temperature, into the analyzer (boxcar or lock-in amplifier). A DLTS spectrum is obtained by plotting the output signal of the analyzer vs temperature. The resulting signal is a maximum when the thermal emission rate matches the "rate window" of the analyzer. Each peak on the DLTS spectrum is indicative of an energy level with a specific Er and an. The emission rate of the transient at the peak temperature is a function of the analyzer used. For example, for a lock-in amplifier with a sine wave mixing function, the emission rate is en = f /0.424 (provided that the filling pulse width is much shorter than the pulsing period), where f is the pulse frequency [42]. By varying the frequency of the lock-in amplifier (or "rate window" in the case of the boxcar analyzer), the peak temperature value shifts, and thus the emission rate can be measured as a function of temperature. From Eq. (12) it follows that an Arrhenius plot of log(en/T 2 ) vs I/T yields Er and an. Note that the an thus obtained, is an apparent capture cross section. The real capture cross section may be temperature dependent and has to be determined by measuring the transient at a fixed temperature when the pulse width is varied [13]. An attractive alternative to these techniques is to digitize the full transient, which is readily achievable using modern electronics. This approach forms the basis of isothermal DLTS measurements, and various methods to analyze the transients have been reported [43, 44]. A digital method that is rapidly gaining interest, is the inverse LaPlace transform analysis, which yields a substantial improvement in energy resolution, thereby facilitating the separation of closely spaced defect levels [45].
272
F.D. AURET
The sensitivity of the junction capacitance to trapped charge depends on the location of the charge in the depletion region. The relative capacitance change, ( /:!;.. C I C) x, due ton (x) trapped electrons in the interval !:!;.x at a depth x < w below the interface, is given by [39]: n(x)x!:!;.x
(22)
Nw 2
Note that the sensitivity of the junction to trapped charge increases linearly from zero at the junction (x = 0) to a maximum at the edge of the depletion region (x = w). In order to obtain the defect concentration, NT, the total signal due to a majority carrier pulse of amplitude Vp, superimposed onto the reverse bias, V, and duration long enough to fill all traps below the Fermi level, has to be determined by integrating Eq. (22). The limits of this integration are determined by the location in the space-charge layer where emission takes place (Figure 6), i.e. from w(Vp) -A. to w(V) -A., where e is the width of the transition region: 'A=
(23)
For a constant free carrier density, NT can be related to the magnitude of the total signal, !:!;.CjC, thus found by [46]:
NT(Xm- A.)= 2N(x)
(C) [ !:!;.C
t=O
X- A (-x )
2
Xp- A - (-x )
2]-1
(24)
where x and x p are the depletion widths during application of the reverse and filling pulses, respectively, and Xm -A. is the mean distance from the interface to the region from which traps emit carriers. If the edge region is neglected and C(V) « C(Vp). Eq. (24) reduces to the frequently used approximation [14, 34]:
NT
!:!;.C
c
~2-N
(25)
However, neglecting the edge region may cause significant underestimation (~50%) of the trap concentration, especially at low reverse bias voltages. In a noise-free environment, !:!;.CjC values of w- 5 - w- 6 can readily be achieved, implying that defect concentrations of as low as 10 10 cm- 3 can be detected.
ELECTRICAL CHARACTERIZATION
273
When determining spatially varying trap concentrations, it is essential to take into account the effect of the transition x,egion. Using Eq. (24), the deep level concentration profile can be measured through the variation of the depletion width with applied bias, if the shallow level concentration profile is known. Trap concentration profiles can be measured either by using a filling pulse that extends to a constant voltage level and varying the reverse bias voltage, or by using a constant reverse bias and varying the filling pulse amplitude [39]. The average electric field of typically 105 V m- 1 - 107 V m- 1 in the depletion layer can influence the shape of defect potentials as well as enhance charge emission from potential wells, by, for example, the Poole-Frenkel effect [47]. Detecting the Poole-Frenkel effect establishes an important characteriztic of a defect: it evidences the presence of donor-like electron traps in an n-type semiconductor or acceptor-like hole traps in a p-type semiconductor, i.e. states which are neutral when occupied and charged when empty (Section 8). It has, for example, been shown that oxygen-related thermal donors in Si exhibit Poole-Frenkel enhanced emission [17]. A phonon assisted tunnelling model has been proposed to explain electric field enhanced electron emission from deep states in GaAs which do not exhibit Poole-Frenkel enhanced emission [48, 49]. Both models have been used to investigate electron irradiation induced traps in GaAs [50, 51, 52]. When the thermal emission rate is strongly field dependent, non-exponential transients occur due to the variation of the electric field in the space-charge region. This must be carefully considered when interpreting emission rate data and comparing the electronic properties of defects (Section 8). Ideally, any comparison of defect properties should be done under equal electric field conditions in a narrow spatial region to limit the electric field variation. This is the essence of the double DLTS (DDLTS) measurement technique [53]. For a complete electrical characterization of a defect, its majority as well as minority carrier capture cross sections must be determined. Minority carrier capture in SBDs is usually achieved either optically, by illuminating semi-transparent Schottky contacts with above band gap light, or electrically, by applying a large forward bias to the SBD. For p-n diodes, minority carrier injection occurs when the filling voltage pulse causes the diode to be forward biased. After minority carrier injection, the occupation of the traps in the depletion region is the net result of the capture of both types of carriers. Note that the sign of the resulting capacitance transient is negative for the emission
of majority carriers, as in Figure 7(e), and positive for minority carriers, since their charge has the opposite sign [34], making it easy to distinguish between the type of carriers being emitted. From a knowledge of the energy level, ET, concentration, NT, and capture cross section, Un and up, of a defect for minority and majority carriers, it is
274
F.D. AURET
possible to establish whether the defect will act as a trap (and thus cause carrier reduction according to Eqs. (12) and (20)), or whether it will act as a recombination center. Markvart et al. [54] have demonstrated that a modified version of DLTS, referred to as recombination DLTS, can be used to identify defects which act as recombination centers. These centers act as "stepping stones" for carriers and contribute to the current-voltage characteristics of rectifying junctions (Section 9) at a recombination rate, U, [55]: apanVth(pn- nJ)NT
U=--------~------~--~--~------------------
an[n- n; exp{(ET- E;)/kT}]
+ ap[n + n; exp{-(ET- E;)/kT}]
(26)
where E; and n; are the intrinsic Fermi level and intrinsic carrier density, respectively, and the other symbols have previously been defined. Clearly, the most efficient recombination centers are those with levels close to the middle of the band gap, and with approximately equal capture cross section for electrons and holes. 3.3.
Summary
The spectroscopic nature of DLTS allows independent studies of different defect species in the same semiconductor. Furthermore, because DLTS is a space-charge related technique, it facilitates control of the charge state of defects in the space charge region which enables charge state dependent processes to be studied and metastable defect configurations to be revealed. DLTS is further attractive because it can be used to characterize defects using various kinds of space charge based devices. This includes simple Schottky barrier diodes (SBDs), as well as device structures with higher degrees of complexity. Finally, sensitivity of DLTS for detecting defects in concentrations of 10 10 cm- 3 is superior to any other electrical characterization technique. Since its introduction, DLTS has become a widely accepted technique to determine the electronic properties of defects in semiconductors. It has been applied to study growth induced defects, impurities, radiation induced defects and metastable defects in various semiconductors. Particle irradiation
induced defects of III-V compounds have been studied intensively using DLTS and several extensive reviews have appeared [15, 56, 57]. In these studies the electronic properties of numerous radiation induced defects were determined. Finally, it should be pointed out that DLTS in itself cannot directly provide the structure of a defect. This has to be obtained by structuresensitive techniques, such as electron paramagnetic resonance (EPR) or local vibrational mode (LVM) spectroscopy. However, structural defect
ELECTRICAL CHARACTERIZATION
275
identification via DLTS is possible by comparing defect properties, e.g., annealing kinetics, which can be measured by DLTS as well as by structuresensitive techniques.
4. ELECTRON IRRADIATION INDUCED DEFECTS IN GaAs This section begins with a brief overview of some aspects related to defect introduction in GaAs by MeV electron irradiation, and the characterization of these defects by DLTS. Whereas most investigations of defects introduced by high energy electron irradiation to date have been performed by electron irradiation in Van de Graaff accelerators, it will be shown that the same defects can be produced by beta-particle (electron) irradiation using radionuclides and linear accelerators. Finally, defect introduction by low energy (0.3-20 keV) electrons is demonstrated and discussed.
4.1.
Overview
Using DLTS, five electron traps (El-E5) and one hole trap (HI) were first reported by Lang [58] after 1 MeV electron irradiation at 300 K ofLPE grown GaAs. After analyzing the dependence ofthe introduction rates ofE1-E3 and H 1 on the crystallographic direction of the incident electron beam, Pons and Bourgoin [59] concluded that these defects arise from displacements in the As sublattice. In a review on electron irradiation induced defects in GaAs, Pons and Bourgoin [ 15] reported the introduction of several more hole traps, HO and H2-H5. From the results of several studies, it was concluded [16] that El-E5 in n-GaAs and HO and HI in p-GaAs are intrinsic primary defects because: (1) the total measured introduction rate (4 em -I) of all electron radiation induced defects in n-GaAs is equal to the calculated introduction rate, assuming that the defects all belong to the same sublattice [15], (2) all the main defects can be introduced at 4 K [15], (3) they are all removed by annealing at about 220°C with the same first order kinetics [60]; and (4) the energy liberated during annealing, 8 eV per defect [61], is equal to the theoretical estimation of the energy stored in a vacancy-interstitial pair [62]. More specifically, it has been proposed that defect levels El and E2 are the -/0 and 0/+ charge states of the isolated arsenic vacancy, VAs. [15, 63] and that E3 is related to close arsenic vacancy- interstitial pairs, VAs-As;, [15, 16]. More recently, von Bardeleben [64] proposed, based on EPR measurements, ab initio self-consistent pseudopotential calculations and self-consistent tight binding Green's function calculations, that the E1 and E2 levels belong to the distorted arsenic antisite defect, Asoa (or As- As3).
276
F.D. AURET
It was reported that the introduction rates of E1-E5 in n-GaAs are independent of the dopant used [ 15], implying that all defects thus observed are "pure" lattice defects and do not involve foreign atoms. In p-GaAs, however, only HO and HI were found to be impurity independent while the presence of H2-H5 was found to depend on the nature of the material [65, 66]. It was argued that the H2-H5 complexes may involve native impurities and, possibly, the arsenic interstitial [66]. In particular, H2 has thus far only been observed in p-GaAs containing copper in detectable concentrations before irradiation [66, 67]. The proposed defect assignments are summarized in Tables III and IV for n- and p-GaAs, respectively. In the light of the above mentioned defect assignments, it was not clear why the anion antisite, Asoa. or defects in the Ga sublattice, which must be created at about the same rate as defects on the As sublattice, could not be observed by DLTS. In a search for antisite related defects, Lim et al. [68] irradiated n-GaAs to a relatively high electron dose (10 17 e-cm- 2 ). They used highly doped (3 xI 0 17 cm- 3 -I x I0 18 cm- 3 ) GaAs to ensure that sufficient carriers remain after irradiation to allow for accurate DLTS measurements. From their DLTS results, combined with theoretical considerations, they proposed that E4 (at 0.75 eV below the conduction band [68]) is the energy level of the Asoa - VAs complex. The effect of annealing on radiation induced carrier removal in n-GaAs, irradiated at low-temperatures (5 K-77 K) with I MeV electrons, was studied by Thommen [69] using electrical resistivity measurements. This study revealed that annealing recovered the carrier density in three temperature stages, centered at 235 K ("stage I"), 280 K ("stage II") and 520 K ("stage III"). Using DLTS, it was shown that the El-E5 can be removed by annealing at about 520 K [60], corresponding to the "stage III" of Thommen. In this temperature range, the annealing of E l-E5 obeys first order kinetics, and their removal are accompanied by the introduction of the Pl-P3 defects [60]. Lang [70] showed thatEl and E2 can be removed at lower temperatures under recombination conditions. In order to study the defects responsible for the annealing stages I and II of Thommen, Rezazadeh and Palmer [71] irradiated AI SBDs on Sn-doped (to 2 x 10 15 cm- 3 ), VPE grown n-GaAs, with I MeV electrons at 80 K. They found that irradiation at 80 K and subsequent annealing to I40 K, produced an electron trap, E(0.23), resulting in a broad energy level centered at 0.23 eV below the conduction band, which can be removed by heat treatment in the 235 K range (stage II). They proposed that this defect is a plural defect, such as the (V oa-VAs) divacancy, or the combination of such a divacancy with a trapped interstitial, and that annealing at 235 K involves internal recombination and/or dissociation of E(0.23) into simpler defects. A further effect of the 80 K-300 K heating was that the concentrations ofE 1 and E2 increased, probably as a result of internal recombination or dissociation of plural defects.
ELECTRICAL CHARACTERIZATION
277
Irradiation at 300°C, where primary defects are unstable, introduced several defects of which the I 1, with an energy level and capture cross section very close to that of EL2, is the most prominent [72]. The introduction rate of II is about 1 cm- 1, i.e., about half that of E1 and E2 for room temperature irradiation, and about two orders of magnitude higher than those of the P1-P3 traps present after annealing between 200°C-300°C, i.e., after removing E1-E5. From a technological point of view, this is an important observation, because defects with levels near midgap are generally more efficient recombination centers than shallow levels. I 1 can therefore be expected to be important when irradiating GaAs with electrons with the purpose of reducing its free carrier concentration. From the results obtained after irradiating at elevated temperatures, Lim et al. [73] concluded that the introduction of the P2 and P3 defects, which accompanies the removal of the E1-E5 defects, result from the creation of multi-displacement defects and the recombination of VAs-As; Frenkel pairs.
4.2.
Electron Irradiation Using a
90
Sr Radio-nuclide
In this section we describe defect introduction in GaAs by ,8-particle (electron) irradiation using a 90 Sr radio-nuclide, and demonstrate that this introduces the same defects as 1-2 MeV electron irradiation in Van de Graaff accelerators. In Table II, some electron irradiation sources and typical conditions employed to introduce defects, as well as some prominent irradiation induced defects using these sources and the nomenclatures used to identify them, are summarized. In the first reported DLTS investigation of defects produced by electron irradiation from radio-nuclides, epitaxially grown layers with free carrier densities of 4 x 10 14 cm- 3 (undoped) and 1 x 10 16 cm- 3 (Si-doped), grown by OMVPE on n++_type bulk-grown 10 18 cm- 3 doped GaAs substrates, were used [74]. Pd SBDs, fabricated on these layers, were irradiated with ,8-particles (electrons) emitted from a 20 mCi 90 Sr radio-nuclide, at a dose rate of 1.9 x 10⁹ e-cm- 2 s- 1 and a dose of 1.1 x 10 14 e-cm- 2 . For a dose rate as low as this, the temperature and Fermi level remain unperturbed during irradiation, preventing any dose rate effects on the introduction rate during irradiation. The DLTS spectrum in curve (a) of Figure 8 shows the presence of three well defined radiation induced defect peaks, labelled E,B 1, E,B2 and E,B4, in undoped GaAs. The electronic properties of these defects, measured in the undoped material under low electric field conditions to avoid electric field-enhanced emission rate, are summarized in Table III, where they are compared to the properties of the same defects determined in doped n-GaAs under higher electric fields. The properties of the El-E5 irradiation induced defects reported after pioneering investigations using DLTS, as well as defects observed in recent studies involving electron-,
278
F.D. AURET TABLE II
Defects, particles, radiation sources and radiation conditions for typical studies of radiation induced defects in GaAs. Defects
References
Particles, radiation sources and radiation conditions
Particles
Energy
Dose (cm- 2)
Dose rate
(cm-2 s-1)
Source
0.1 11A cm- 2 Van de Graatl accel. 2nA cm- 2 0.1 11A cm- 2
0.5-2 MeV
1013-1016
0.5-2MeV
0.1 flU 103 -I o 16
E,BI -E,B5 H,Bl-H,B5 EEl -EE5
115, 16, 56,8, above58, 120] threshold [15, 16, electrons 58, 66] 174] [76] [77, 86]
Introduction rate decreases rapidly below surface Jntroduced during electron irradiation at 300 'C. Calculated from the a and E, values in references in table.
ELECTRICAL CHARACTERIZATION
281
TABLE III (Continued) Electronic properties of prominent particle induced defects in undoped and doped epitaxially grown n-GaAs. Error margins can be found in the referenced texts. No :::I x 1016 cm- 3 Ec- Er (eV)
CTa
(cm2 ) 4.8 6.8 2.1 1.6 1.2
0.14 0.127 0.129 0.123 0.122 0.128
1.1 x 10- 13 2.9 x 10- 14 4.3 x 10- 14 1.8 x 10⁻⁴ 1.8 x w- 4 2.7 x 10⁻⁴
0.36 0.357 0.355 0.36 0.341
J.O 1.0 8.8 1.2 2.8
0.35 0.361 0.350 0.362 0.353
6.2 X 10 15 1.0 x 10- 14 4.8 x 10- 14 1.9 x 10- 14 1.2 x 10- 14
0.617 0.614 0.630 0.635 0.525 0.83 0.783 0.77 0.840
x x x x x
10_ 17 10- 17 10- 17 10- 17 10- 17
0.031 0.032 0.029 0.027 0.027
x w-13 x 10- 13 x 10- 14 X 10- 14 x 10- 14
T.
peak (a) (K) 32 31 31 30 30
17(d)
75 75 74 74 74
2 1056 2963 (b)
1.5 2 1706 9638 (b)
Ref. 1741 1771 )99, 105) )99, 116) )1161
)741 1771 )99, 1051 )99, 1161 )99, 116)
0.14 1.2
1751 1771
3060
)99) )116)
0.4 0.7 0.9 470 3060
)161) 174) 1771 )99) )991
318(d) 3.1 x 10- 14 0.08 Seems to be same as EE6 and E4 2.5 x 10- 14 311 1.2 x 10- 13 309 127 13 1.6 x 10305 1737
)1611
3.9 1.9 Tpcak = 1.1 9.4 2.3 Tpeak =
184 183 183
~
(cm- 1)
184 202(d) 204 205 199 198
(b)
(b) x 10- 15 299 358(d) X 10- 12 0.1 249K (at I mHz), i.e. the same as for EE6 X IO-I 2 344(d) x 10_ 13 341 357(d) x 10- 12
260K (at I mHz), i.e. the same as for E5b
VAs )15), Asoa (or As- As3) 1641, C3v symmetry )1041
Meta stable )1171 In Si:n-GaAs )74), but not in S:n-GaAs )137)
VAs-As; )15), C3 v symmetry )1041
Asoa- VAs )681
)105) )161)
Defect band II 161
1771 11051 1771
4.0 x
290
11051
0.650
4.5 x
10- 13
301
)1051
0.72
1.2 x 10- 14
380
"'I
VAs )15), Asoa(or As- As 3 ) )64), C3v symmetry )104)
1771 )99) )99)
w- 12
0.68
Notes and suggested
assignment
1721
1771
1771 "U-band")l071
Similar to EL2)72)
At a lock-in amplifier frequency of 46Hz, i.e. an emission rate of 107 s- 1 (time constant of 9.23 ms.)
u
10"' 10"'
l
I •
I/.. :
:
0
0 0
;·
T
• J... •g• • • • • • • • • • • • • •
•
,. 90" ............ ,. " , .. ,. ... ., .,
•
'I'
0
oooooooooooooooo 0
10
0
-"a".o,--~~_.-...__o..L..s-~~_.-..._-='1.0 Voltage (V)
Fig. 33. Typical 1-V curves of control (unbombarded) SBDs on I x 10 16 cm- 3 Si-doped OMVPE grown GaAs (open circles), as well as of SBDs on surfaces bombarded with doses of 5 x 10 13 He+cm- 2 (filled triangles) and 5 x 10 14 He+cm- 2 (filled circles) [163].
0.95
1.30 0.90 1.25
0.85 0::
~ 1.20
~
0.80
~ ~ 1.15
~
E .!2>
"'Q;
I
.E
"'
0.75 ro
:;:
1.10
0.70
1.05
0.65
1.00
'-:::-'--'-'-'"""-~'"'"'"""--'-'-'"""'--'--'-".wL-'-'-"""" 0.60 1Q10 1Q11 1Q12 1Q13 10'" 1015
Dose (cm-2 )
Fig. 34. Ideality factor, n, and effective barrier height, rp,, ofSBDs on I x 10 16 cm- 3 Si-doped OMVPE grown GaAs as function of He-ion dose for different dose rates, as indicated in the inset [163].
ELECTRICAL CHARACTERIZATION
331
However, one of the main defects introduced during He-ion bombardment of GaAs, EHe3, is metastable (Section 6), and such defects may be significant in realizing optical non-linearity in compound semiconductors [11].
9.3.
High Energy Electrons
Numerous studies ofdefect introduction rates and of the effect of these defects on materials and device properties have been reported since the extensive study of Auckerman [153]. Kol'chenko and Lomako [164] showed that the carrier removal rate in n-GaAs irradiated at room temperature with 2.5 MeV and 28 MeV electrons is independent of both the initial carrier concentration and the chemical nature of the donor. The carrier removal rate also does not depend strongly on the conductivity type [56]. It is significant to note that there is a rather wide spread in the carrier removal rate reported by different researchers. Closer inspection reveals that the larger carrier removal rates were for rather larger beam fluxes: 2 11A cm- 2 [165] and 48 11A cm- 2 [166]. Rezazadeh and Palmer [71] have reported that the carrier removal rate of n-GaAs irradiated with 1 MeV electrons is 0.65 cm- 1 and 2.9 cm- 1 at 293 K and 92 K, respectively, which are in good agreement with the 0.6 cm- 1 measured at room temperature by Lang and Kimerling [58]. The effect of electron irradiation on the mobility profile in GaAs FATFETs have been discussed by Szentpali et al. [154] who found that irradiation with 0.65 MeV electrons at doses of 6 x 10 15 to 1.2 x 10 16 e-cm- 2 changed the drift mobility profiles in the active layer. These changes were attributed to radiation induced defects, acting as scattering centers, which they detected by DLTS and DLOS. Shaw et al. [155] demonstrated that 1 MeV electron irradiation caused increases in the dark currents of Ino.53 Gao.47As photodiodes measured at various temperatures. Their calculations showed that the increase in dark current is the result of a generation current due to a single defect level at 0.29 eV below the conduction band, which they also detected by DLTS.
9.4.
High Energy Protons and a-particles
Rezazadeh and Palmer [71] reported that 4.1 MeV a-particle irradiation resulted in a carrier removal rate of (1.2 ± 0.4) x 104 cm- 1 at 293 K and (2.0 ± 0.6) x 104 cm- 1 at 85 K. For 1 MeV protons they found the carrier removal rates to be (2.75 ± 0.5) x 103 cm- 1 at 293 K and 4.5 x 103 cm- 1 at 85 K. Several other reports followed (e.g., [109]), in which the focus was mainly on irradiation induced carrier reduction. Umemoto et al. [156] reported on the influence of alpha-particle induced damage on the performance ofMESFETs. Galashan and Bland [111] reported that 52 MeV proton irradiation caused changes in resistor and FET threshold voltages,
332
F.D. AURET
which are nearly an order of magnitude higher than those due to 1 MeV neutron irradiation. Recently, de Souza et al. [ 162] reported a comparison of the thermal stability of the electrical isolation layers in n-GaAs introduced by H, He, and B irradiation. These authors also reported the H, He, and B irradiation doses required for a complete removal of carriers by traps, as well as for significant hopping conduction to take place [ 162]. In the following section some detailed examples of the influence of the defects introduced during MeV proton and He-ion bombardment on the free carrier density of epitaxially grown GaAs, as well as on the properties of SBDs fabricated thereon, are illustrated and discussed. Goodman et at. [99] compared the defects, change in SBD properties and free carrier removal in proton and He-ion (a-particle) bombarded epitaxially grown, n-type GaAs films, doped with Si to 1.2 x I 0 16 cm- 3 . Alpha-particle irradiation was performed at doses of 10 10 -10 12 a cm- 2 using an 241 Am source, and at doses ranging from 10 12 -10 14 a cm- 2 in a Van de Graaff accelerator, while proton (2 MeV) irradiation was performed in the Van de Graaff accelerator at doses ranging from 10 11 -10 14 H+cm- 2 . From the results depicted in Figure 35, the carrier removal rate (at 298 K) was calculated as ( 1.37 ± 0.05) x I 04 em - 1 for a-particles and (7 .1 ± 0.2) x 102 em - 1 for protons. The results for a-particle irradiation are in good agreement with those of Rezazadeh and Palmer [71], but the carrier removal of protons is significantly lower than that reported by Rezazadeh and Palmer [71]. This may be due to the fact that Goodman et at. used 2 MeV protons for which the average defect introduction rate is about 1.5-2.2 times lower than for 1 MeV (Figure 14). In addition, Goodman et at. probed only the first 0.5 J.Lm below the surface, and it is known (Section 2) that as the protons are slowed down by penetrating deeper into the materials, nuclear stopping becomes more important and therefore the rate of defect (carrier trap) creation is increased. The radiation induced carrier removal is due to trapping of carriers by the radiation induced defects with energy levels at various positions in the band-gap. Blood [157] argued that the traps responsible for carrier removal at 77 K are the E3 and E4 irradiation-induced defects, the equivalents offu4 and Ea5 in a-particle irradiated GaAs (Section 6) and Ep4 and Ep5 in proton irradiation GaAs (Section 5). At room temperature, however, the emission rates of these defects are too high to trap and retain carriers. It is instructive to note that if the introduction rates of a-particle induced hole traps Hal - HaS (of which the energy levels lie below the Fermi level in n-GaAs at room temperature [67]) are summed, it approximately amounts to the carrier removal rate inn-type GaAs, calculated from Figure 35. Figure 35 also shows that the increase in reverse current (1)./R) is almost directly proportional to the particle dose, both for a-particles and protons. The 1)./R for a-particles is about an order of magnitude higher than
333
ELECTRICAL CHARACTERIZATION
• • • •
I I 10-'
1~ 1
10°
10g
10"
Particle dose (cm-2 )
Fig. 35. Decrease in free carrier density (carrier removal) of 1.2 x 10 16 cm- 3 Si-doped OMVPE grown GaAs, and increase in reverse current of SBDs fabricated on it, as function of proton and a-particle (He-ion) irradiation dose [99].
for protons. From 1-V measurements it was seen that the ideality factor (n) for the irradiated samples did not exceed 1.05, indicating that thermionic emission is the dominant current transport mechanism in the forward bias region (0.15-0.40 V). Further, there was no significant decrease in the barrier height, so the increase in reverse current cannot be accounted for by a reduction in the barrier height, but rather by a generation-recombination contribution to the thermionic emission current. To determine the barrier height, series resistance and the recombination current after a-particle irradiation, a modified version of the model proposed by Donoval eta!. [158] was used. According to this model, which avoids the use of the ideality factor n, the current through the diode is the sum of thermionic emission, generation-recombination and shunt leakage: I= Is {exp
cq(V ;/ Rs)])- 1}
+ Ic {exp (
[q(V-/Rs)])} 2kT
+
(V-/Rs)
(42)
Rsh
The thermionic emission saturation current pre-factor Us) can be expressed as: (43)
F.D.AURET
334
10'3 10..
1o·• ~
i
~
10.. 1Q-7
::>
(.) 10.. 10•9 1Q·10
...../......... . Reverse
Voltage (V)
Fig. 36. Measured (symbols) and modelled (line) /- V characteristics of Si-doped (to I x 10 16 cm- 3 ) OMVPE grown n-GaAs irradiated with a dose of 8.5 x 10 13 H+cm- 2 [99].
with A the area of the diode, A* the experimentally measured Richardson constant (equal to 4.8 x 10⁴ A m- 2 K- 2 [159], CfJe the effective barrier height with image force lowering taken into account, Rsh being the shunt leakage resistance (important in low voltage regions, q V « k T), Rs the series resistance and /G the generation-recombination pre-factor. The barrier height and series resistance are obtained by fitting the experimentally obtained forward I-V characteristics to Eq. (41 ). The results of this modelling for a-particle irradiated n-GaAs is depicted in Figure 36 which shows that, after irradiation, the recombination current dominates the current characteristics in the low forward bias region (0-0.2 V). It was found that the recombination component increased with increasing irradiation dose. Although the most effective recombination centers are those with energy levels located near the middle of the band-gap [55], they are not the only centers which can contribute to recombination. For example, it was shown that, although the H(0.17) level of the divacancy in electron irradiated Si lies far below the middle of the band gap, it is the dominant recombination center in solar cells with p-type substrates [54]. The recombination current seen in Figure 36 is due to the presence of defects introduced during irradiation, of which the concentration increases with increasing particle dose, as discussed in Sections 5 and 6. This analysis further showed that the control sample has the lowest series resistance, whereas the
ELECTRICAL CHARACTERIZATION
335
diode that received the highest particle dose has the highest series resistance. The increase in series resistance is a result of the reduction in free carrier concentration in the depletion region.
9.5.
Summary
I-V measurements performed on Pt and Ti SBDs, deposited with and without shielding the n-GaAs epitaxial layer from stray electrons during EB metallization, revealed that the use of a shield is essential for the fabrication of high quality devices. The poorer properties of devices formed in the presence of stray electrons can be understood in terms of the results in Section 4, which showed that EB deposition introduces defects at and close to the GaAs surface. Low energy He-ion bombardment was shown to have a profound influence on the surface and near-surface properties of GaAs, and consequently on the rectification properties of SBDs fabricated on the bombarded surfaces. Despite the adverse effects of He-ion bombardment on SBD performance, it does, however, introduce a prominent metastable defect in Si-doped n-GaAs which may be useful in advanced applications. It was also shown that high energy a- and H+ -particle irradiation removes free carriers at much higher rates than electrons. For the 10 16 cm- 3 doped GaAs, the onset of a detectable carrier reduction and generation current which exceeds the thermionic emission current (at 298 K), occurs for doses of about 10 10 cm- 2 and 10 11 H+cm- 2 , respectively. This free carrier removal is essential for device isolation but can cause severe degradation in the performance of depletion layer based devices, such as MESFETs, in radiation environments. A final important point that should be borne in mind is that one of the main defects introduced during proton and He-ion bombardment of GaAs is metastable (Section 6). The effect that such a defect has on the GaAs free carrier density may be of significance in realizing optical non-linear devices in compound semiconductors [11].
10. SUMMARY AND CONCLUSIONS Radiation induced defects play an important role in several areas of semiconductor device fabrication. In order to avoid the deleterious effects of some of these defects and utilize the beneficial effects of others, depending on the application, it is imperative to understand the effect of radiation on electronic materials and devices fabricated on them. To achieve this, it is essential that the electronic properties and concentration of radiation induced defects should be known, allowing calculation of their effect on the properties of electronic materials and devices. In addition, the structure,
336
F.D. AURET
introduction rate, introduction mechanism and thermal stability of the defects should be determined so that they can be reproducibly introduced, avoided or eliminated, depending on the application. The spectroscopic nature of DLTS, which allows independent studies of different defect species in the same semiconductor, has rendered it a key characterization technique in providing most of this information. Below, we summarize the most recent advances pertaining to the introduction defects in GaAs by electron-, proton- and He-ion irradiation, and the results obtained from DLTS characterization of these defects. and 90 Sr) are useful, yet inexpensive, sources for providing a- and ,8-particles (He-ions and electrons) to introduce irradiation induced defects, since irradiation from these sources create essentially the same set of defects as electron, proton, and He-ion irradiation in Van de Graaff accelerators. The first radiation induced metastable defects in epitaxially grown GaAs were detected after a-particle irradiation from an 241 Am source. 2. Electrons, protons and He-ions produce essentially the same set of defects, with the relative defect concentration depending on the particle type. A general trend that was observed, is that the ratio of the concentration of the deep defect centers, located near mid-gap, to that of the shallower centers, increases with particle mass. This is important for applications such as device isolation based on carrier reduction due to defect trapping because deep defect levels are more effective than shallow centers in retaining carriers at room temperature. 3. The E5 defect, which was previously reported to be introduced by 1 MeV electrons, protons and He-ions, has been shown to have different signatures for 1 MeV electrons (E5a), and for 12 MeV electrons, protons and a-particles (E5b). The E5a defect is speculated to be created by collision cascades produced by knock-on Ga and As atoms. For electron irradiation, the abundance and energy of these knock-on atoms increase with increasing electron energy, explaining why 1 MeV electrons result mainly in E5b, whereas 12 MeV electrons introduce mainly the E5a. Collision cascades occur easily for protons and a-particle irradiation because these particles transfer much more energy during collisions (owing to their larger mass) than electrons with the same energy. Hence, E5a is the dominant of the two E5 defects for MeV proton and a-particle irradiation. 4. Metastable defects have been detected and characterized in epitaxially grown n-GaAs irradiated with electrons, protons and He-ions. The metastable defects detected in n-GaAs doped with Si- and S are different, suggesting the involvement of these dopants, or impurities specific to their introduction during doping, in radiation induced metastable I. Radio-nuclides (e.g.,
241 Am
ELECTRICAL CHARACTERIZATION
337
defect complexes. Metastable defects are important because they can be instrumental in realizing optical non-linear devices in compound semiconductors. 5. Contrary to what was reported in previous reviews, recent investigations showed that some irradiation induced electron traps in n-GaAs involve impurities. This was clearly demonstrated for the metastable irradiation induced defects in Si- and S-doped epitaxially grown GaAs. In p-GaAs, several impurity related irradiation introduced defect complexes have been known to exist. The most recently reported of these is a prominent radiation induced hole trap which is introduced in Be-doped MBE p-GaAs, but not in identically irradiated Zn-doped OMVPE grown pGaAs. Impurity-specific radiation induced defects present an additional element of defect engineering to tailor the properties of electronic materials for specific applications. This is particularly important when the impurity related defects are metastable. 6. Whereas the El and E2 have for a long time been assumed to be two charge states of the isolated arsenic vacancy, VAs• this assignment has recently been proved to be incorrect by uniaxial stress measurements combined with DLTS. This experiment revealed that El and E2 have C3v symmetry, and can therefore not be simple arsenic vacancies, VAs. with Td symmetry. However, for E3, the uniaxial stress data are consistent with its original assignment as an As Frenkel pair, e.g., V As-Asi, provided that the interstitial-vacancy direction is along the (Ill) direction. Similar studies on metastable radiation defects should be undertaken to cast more light on their structure. 7. All radiation induced defects in n- and p-GaAs thus far investigated, exhibit electric field enhanced emission, with the degree of emission enhancement depending on the individual defect. No radiation induced defect in n-GaAs has yet been reported to exhibit the classical Poole-Frenkel emission enhancement, eliminating the possibility of establishing their donor or acceptor nature using the field assisted emission. The electric field enhanced emission of carriers from several radiation induced defects in n-GaAs can be explained by phonon assisted tunnelling, which facilitated the determination of their Frank-Condon shifts. For p-GaAs, field assisted emission provided information regarding the range of the potentials of irradiation induced defects. Since electric field assisted emission can cause incorrect or non identification of defects, it is important to note the field conditions (determined by
the free carrier concentration, reverse bias and pulse amplitude) when comparing DLTS defect signatures. 8. The defects introduced in epitaxially grown GaAs by sub-threshold energy electron irradiation have similar, but not identical, signatures as the defects introduced by high energy (above-threshold) electron
338
F.D. AURET
irradiation. The important role that low energy electrons play in the microelectronics manufacturing industry, and the harmful influence that the defects they produce have on SBD properties, necessitate further investigations to determine the structure and introduction mechanisms of sub-threshold electron irradiation induced defects. 9. We have presented some examples as to how radiation induced defects influence the GaAs free carrier density and the properties of SBDs fabricated on it. In particular, it has been shown that stray electrons impinging on GaAs during electron beam metallization of Schottky contacts have a pernicious influence on the quality ofSBDs.lt is therefore imperative to shield the GaAs from these electrons during fabrication of high quality devices. Low energy He-ion bombardment was shown to have a profound influence on the surface and near-surface properties of GaAs, and consequently, on the rectification properties of SBDs fabricated on the bombarded surfaces. It was also shown that high energy a-particles and H+ -ions remove free carriers at much higher rates than electrons. This free carrier removal is essential for device isolation but can cause severe degradation of the performance of depletion layer based devices in radiation environments. The defects introduced during high energy particle irradiation also result in high recombination currents in rectifying devices, which are detrimental in detector applications. I0. Finally, although the electronic properties of irradiation induced defects in GaAs, determined by DLTS and similar junction spectroscopic techniques, have been reported in significant detail, no indisputable evidence has yet been presented for the structure of any of these defects as determined by, for example, EPR. The converse is also true. Clearly, this is an area that needs to be addressed. Acknowledgements I express my sincere gratitude to Prof. G. Myburg for the fabrication of numerous SBDs and ohmic contacts, and for initiating studies of defect introduction in semiconductors using radio-nuclides in our laboratory. I thank Prof. S.A. Goodman for his inestimable contribution to the DLTS
measurements of radiation induced defects and for the low temperature irradiation studies that he initiated. I am grateful to the Physics Department of the University of Port Elizabeth for supplying the sulphur-doped GaAs. I would also like to express my sincere gratitude to Prof. J.B. Malherbe for the low energy ion bombardment, M. Hayes and T. Hauser for proton and He-ion implantation in the Van de Graaff accelerator at the University of Pretoria, Dr. M.C. Ridgway of the Australian National University for the ion-implantation of samples in their Pelletron implanter, the National Accelerator center
ELECTRICAL CHARACTERIZATION
339
(NAC) at Faure (South Africa) for proton irradiation, and the H.F. Verwoerd and Bloemfontein National Hospitals for electron irradiation in their linear accelerators. I am is deeply indebted to W.E. Meyer for invaluable assistance with computer hickups, numerical modelling, and variable temperature I-V, C-V and TSCAP measurements, P.N.K. Deenapanray for the low temperature irradiation and DLTS of p-type GaAs and to P. de Villiers for priceless technical assistance in preparing the manuscript. Finally, I gratefully acknowledge the financial assistance of the South African Foundation for Research Development (FRD) and the Carl and Emily Fuchs Institute for Microelectronics (CEFIM). References 1. D.E. Davies, J.F. Kennedy and A.C. Yang,Appl. Phys. Lett., 23,615 (1973). 2. A.G. Foyt, W.T. Lindley, C.M. Wolfe and J.P. Donnelly, Solid State Electronics, 12, 209 (1969). 3. J.C. Dyment, J.C. North and L.A. D'Asaro, 1. Appl. Phys., 44,207 (1973). 4. R.D. Rung, C.J. Dell' occa and L.G. Walker, IEEE Trans. Electron. Devices, 28, 1115 ( 1991 ). 5. J.L. Benton, J. Michael, L.C. Kimerling, D.C. Jacobson, Y-H. Xie, D.J. Eaglesham, E.A. Fitzgerald and J.M. Poate, J. Appl. Phys., 70,2667 (1991). 6. E.A. White, K.T. Short, R.L. Dynes, J.P. Garno and J.M. Gibson, Appl. Phys. Lett., 50, 95 (1987). 7. A. Grab, J.J. Grab, P. Thevenin and P. Siffert, Nucl.lnstrum. Methods, 858,236 (1991). 8. A. Mogra-Campera, R.P. Love, M.F. Chang and R.F. Dyer, IEEE Trans. Electron Devices, 33, 1667 (1986). 9. D.C. Sawka and J. Bartko, IEEE Nucl. Sci., 30, 1756 (1983). 10. C. Jagadish, B.G. Svensson and N. Hauser, Semicond. Sci. Techno/., 8, 481 (1993). II. K. Wada and H. Nakanishi, Materials Science Forum, 258-263, I 051 ( 1998). 12. H.G. Grimmeiss, Deep Levels in Semiconductors. Ann. Rev. Mater. Sci., 7, 341-376 (1977). 13. D.V. Lang, J. Appl. Phys., 45, 3014 (1974). 14. D.V. Lang, J. Appl. Phys., 45, 3023 (1974). 15. D. Pons and J.C. Bourgoin, J. Phys., CIS, 3839 (1985). 16. D. Stievenard, X. Boddaert, J.C. Bourgoin and H.J. von Barde1eben, Phys. Rev., 841,5271 (1990). 17. L.C. Kimerling, Materials Research Society Proceedings, \-bl2: Defects in Semiconductors (Edited by Narajan, J. and Tan, T. Y. North Holland, New York), p.85, (1981 ). 18. J. Lindhard, V. Nielsen, M. Scharff and P.V. Thompsen, Kgl. Dan. Vid. Selsk. Mat. Fys. Medd., 33, 10 (1963). 19. O.B. Firsov, Zh. Eksp. Teor. Fiz., 34,447 (1958). 20. J.P. Biersack and L.G. Haggmark, Nucl. lnstrum. Methods, 174, 257 (1980). 21. J. Lindhard and M. Scharff, Phys. Rev., 124, 128 (1961). 22. H.Z. Bethe, Phys., 76,293 (1932). 23. J. Lindhard, Kgl. Dan. Vid. Selsk. Mat. Fys. Medd., 34, 14 (1965). 24. J. Lindhard and M. Scharff and H. Schiott, Kgl. Dan. Vid. Selsk. Mat. Fys. Medd., 33, 14 (1963). 25. W. Eckstein, Computer Simulation ofJon-Solid Interactions, Springer Ser. Mat. Sci., Vol. I 0 (Springer, Berlin, Heidelberg), (1991 ). 26. M.T. Robinson, Nucl.lnstrum. Methods in Phys. Res., 867, 396-400 (1992). 27. M.T. Robinson, Nucl.lnstrum. Methods in Phys. Res., 848,408-413 (1990). 28. M.T. Robinson, Phys. Rev., 840, 16, 10717-10726 (1989). 29. G.H. Kinchin and R.S. Pease, Rep. Prog. Phys., 18, I (1955).
340
F.D.AURET
30. D. Pons, 1. Appl. Phys., 55, 2839 (1984). 31. P. Sigmund, Appl. Phys. Len., 14, 114 (1969). 32. P. Marmier and E. Sheldon, in "Physics of Nuclei and Particles, Volume I" (Academic Press, New York), p.314 (1971). 33. A. Hallen and M. Bakowski, Solid-State Electron., 32, 1033 (1989). 34. G.L. Miller, D. V. Lang and L.C. Kimerling, Capacitance Transient Spectroscopy. Ann. Rev. Mater. Sci., 7, 377-448 (1977). 35. D.V. Lang and C.H. Henry, Phys. Rev. Lett., 35, 1525 (1975). 36. C.H. Henry and D.V. Lang, Phys. Rev., Bl5, 989 1977. 37. J.A. Van Vechten and C.D. Thurmond, Phys. Rev., Bl4, 3539 (1976). 38. C.O. Almbladh and G.J. Rees, J. Phys. C: Solid State Phys., 14, 4575-4601 (1981). 39. D.V. Lang, Space-Charge Spectroscopy in Semiconductors. In "Thermally Stimulated Relaxation of Solids" (P. Braunlich, ed., Springer-Verlag. Berlin), pp.93-133 (1979). 40. L.C. Kimerling, J. Appl. Phys., 45, 1839 (1974). 41. J.J. Shiau, A.L. Fabrenbruch and R.H. Bube, J. Appl. Phys., 59, 2879 (1986). 42. F.D. Auret and M. Nel, J. Appl. Phys., 63, 973 (1988b). 43. PD. Kirchner, W.J. Schaff, G.N. Maracas, L.F. Eastman, T.l. Chappell and C.M. Ransom, J. Appl. Phys., 52, 6462 (1981). 44. A. Cola, M.G. Lupo and L. Vasanelli, J. Appl. Phys., 69, 3072 (1991). 45. L. Dobaczewski, P. Kaczor, M. Missous, A.R. Peaker and Z.R. Zytkiewicz, J. Appl. Phys., 76, 194 (1994). 46. Y. Zohta and M.O. Watanabe, J. Appl. Phys., 53, 1890 (1982). 47. J. Frenkel, Phys. Rev., 54, 647 (1938). 48. D. Pons and S. Makram-Ebeid, J. de Physique, 40, 1161 (1979). 49. S. Makram-Ebeid and M. Lannoo, Phys. Rev., B25, 6406 (1982). 50. S.A. Goodman, F.D. Auret and W.E. Meyer, Jpn. J. Appl. Phys., 33, 1949 (1994). 51. F.D. Auret, S.A. Goodman and W.E. Meyer, Semicond. Sci. Techno/., 10, 1376 (1995). 52. W.E. Meyer, F.D. Auret and S.A. Goodman, Jpn. J. Appl. Phys., 35, Ll (1996). 53. H. Lefevre and M. Schultz, Appl. Phys., 12, 45 (1977). 54. T. Markvart, D.P. Parton, J.W. Peters and A.F.W. Willoughby, Materials Science Forum, 143-147, 1381 (1994). 55. S.M. Sze, Physics ofSemiconductor Devices 2 Ed, (John Wiley & Sons), p.37 (1981). 56. D.V. Lang, lnst. Phys. Conf Ser. No. 31, p.70 (1977). 57. J.C. Bourgoin, H.J. von Bardeleben and D. Stievenard, Phys. Stat. Sol. (a), 102,499 (1987). 58. D.V. Lang and L.C. Kimerling, Lattice Defects in Semiconductors 1974, (lnst. Phys. Conf. Ser. 23), p.581 (1975). 59. D. Pons and J.C. Bourgoin, Phys. Rev. Lett., 47, 1293 (1981). 60. D. Pons, A. Mircea and J.C. Bourgoin, J. Appl. Phys., 51, 4150 (1980). 61. H. Lim, H.J. von Bardelben and J.C. Bourgoin, J. Appl. Phys., 62, 2738 (1987). 62. G.A. Baraii and M. SchlUter, Phys. Rev. Lett., 55, 1327 (1985). 63. B. Ziebro, J.W. Hemsky and D.C. Look, I. Appl. Phys., 72,78 (1992). 64. H.J. Von Bardeleben, C. Delerue and D. Stievenard, Materials Science Forum, 143-147, 223 (1994). 65. S. Loualiche, A. Nouilhat, G. Guilliot, M. Gavand, A. Laugier and J.C. Bourgoin, J. Appl. Phys.• 53. 8691 (1982). 66. D. Stievenard, X. Boddaert and J.C. Bourgoin, Phys. Rev., B34, 4048 (1986). 67. S.A. Goodman, F.D. Auret and W.E. Meyer, J. Appl. Phys., 75, 1222 (1994). 68. H. Lim, K.N. Kang and H.Y. Park, J. Korean Phys. Society, 23, 38 (1990). 69. K. Thommen, Radial. E.ff., 2, 201 (1970). 70. D.V. Lang, L.C. Kimerling and S.Y. Leung, J. Appl. Phys., 47, 3587 (1976). 71. A.A. Rezazadeh and D.W. Palmer, Defects and Radiation Effects in Semiconductors 1980 (Inst. Phys. Conf. Ser. 59) p.317 (1981). 72. D. Stievenard, J.C. Bourgoin and D. Pons, Physica, 116B, 394 (1983). 73. H. Lim, H.S. Kim, B. Choe and H.Y. Park, J. Korean Phys. Society, 23, 45 (1990). 74. F.D. Auret, S.A. Goodman, G. Myburg and W.E. Meyer, Appl. Phys., A56, 547 (1993). 75. F.D. Auret, S.A. Goodman and W.E. Meyer, Appl. Phys. Lett., 67, 3277 (1995d).
ELECTRICAL CHARACTERIZATION
341
76. F.D. Auret, S.A. Goodman, W.E. Meyer, R.M. Erasmus and G. Myburg, Jpn. J. Appl. Phys., 32, L974 (1993). 77. F.D. Auret, S.A. Goodman and W.E. Meyer, unpublished, (1998). 78. J.C. Slater, J. Appl. Phys., 22, 237 (1951). 79. F.L. Vook, Phys Rev.,135A, 1742 (1964). 80. F. Seitz and J. Koehler, Solid State Phys., 2, 305 (1965). 81. R. Kleinhenz, P.M. Mooney, C.P. Schneider and 0. Paz, 13th International Conference on Dejects in Semiconductors, edited by L.C. Kimerling and J. Parsey, Colorado, CA. p.627 (1984). 82. F.D. Auret and P.M. Mooney, J. AppL Phys., 55, 984 (1984). 83. F.D. Auret and P.M. Mooney, J. Appl. Phys., 55, 988 (1984). 84. M. Nel and F.D. Auret, J. AppL Phys., 64, 2422 (1988). 85. M. Nel and F.D. Auret, Jpn. J. Appl. Phys., 28, 2430 (1989). 86. F.D. Auret, L.J. Bredell, G. Myburg and W.O. Barnard, Jpn. J. Appl. Phys., 30, 80 (1991). 87. K Kanaya and S. Okayama, J. Phys. D (Appl. Phys.), 5, 43 (1972). 88. F.D. Auret, G. Myburg, L.J. Bredell, W.O. Barnard and H.W. Kunert, Materials Science Forum, 83-87, 1499 (1992). 89. J.W. Corbett and J.C. Bourgoin, "Defect Creation in Semiconductors", in Point Dejects in Solids, Vol2, Edited by Crawford, J.H. and Slifldn, L.M. (Plenum Press, New York) p.1 (1975). 90. J.C. Bourgoin and J.W. Corbett, Radiation Effects, 36, 157 (1978). 91. C. Christensen, J.W. Petersen and A.N. Larsen, Appl. Phys. Lett., 61, 1426 (1992). 92. S.S. Li, D.W. Schoenfeld, F. Llevada and K.L. Wang, Solid State Electron., 21, 1616 (1978). 93. G. Guillot, S. Loualiche and A. Nouailhat, Dejects and Radiation Effects in Semiconductors 1980 (Inst. Phys. Conf. Ser. 59) p.325 (1981). 94. Y. Yuba, K Garno, K. Murakami and S. Narnba, Defects and Radiation Effects in Semiconductors 1980 (Inst. Phys. Conf. Ser. 59), p.329. (1981). 95. D. Pons, A. Mircea, A. Mitonneau and G.M. Martin, Defects and Radiation Effects in Semiconductors 1978 (Inst. Phys. Conf. Ser. 46), p.352 (1979). 96. S.S. Li, K.L. Wang, P.W. Lai, L.Y. Loo, G.S. Kamath and R.C. Knechtli, IEEE Trans. Electron Devices ED, 27,857 (1980). 97. F.D. Auret, M. Nel and H.C. Snyman, Radiation. Effects, 105, 225 (1988). 98. F.D. Auret, S.A. Goodman, M. Hayes, G. Myburg, W.O. Barnard and W.E. Meyer, S. Aft J. Phys., 16, 153 (1993). 99. S.A. Goodman, F.D. Auret and W.E. Meyer, Nucl. Instr. and Meth. in Phys. Res., 890, 349 (1994). 100. W.O. Siyanbola and D.W. Palmer, Semicond. Sci. Techno/., 5, 2038 (1990). 101. W.O. Siyanbola and D.W. Palmer, Solid State Communications, 74, 209 (1990). 102. W.O. Siyanbola and D.W. Palmer, Phys. Rev. Lett., 66, 56 (1991). 103. A.C. Irvine and D.W. Palmer, Phys. Rev., 849, 5695 (1994). 104. S.J. Hartnett and D.W. Palmer, Materials Science Forum, 258-263, 1027 (1998). 105. S.A. Goodman, F.D. Auret, M.C. Ridgway and G. Myburg, Nuclear Instr. and Meth. in Phys. Res. Sect. B, 148, 446 (1999). 106. F.D. Auret, A. Wilson, S.A. Goodman, G. Myburg and W.E. Meyer, Nucl. Instr. and Meth. in Phys. Res., B90, 387 (1994). 107. G.M. Martin, E. Esteve, P. Langlade and S. Makram-Ebeid,J. Appl. Phys., 56,2655 (1984). 108. B.G. Svensson, B. Mohadjeri, S. Hallen, J.H. Svensson and J.W. Corbett, Phys. Rev., 843, 2292 (1991). 109. M.A. Hopkins and J.R. Srour,IEEE Trans. Nucl. Sci., NS-30, 4457 (1983). 110. A.R. Knudson, A.B. Cambell, A.B. Stapor, P. Shapiro and G.P. Mueller, IEEE Trans. Nucl. Sci., NS-32, 4388 (1985). Ill. A.F. Galashan and S.W. Bland, J. Appl. Phys., 67, 173 (1990). 112. L.F. Zakharenkov, V.K. Kozlovskii and B.A. Shustrov, Phys. Status Solidi (a), 117, 85 (1990). 113. V. Raineri, G. Fallica and S. Libertino, J. Appl. Phys., 79, 9012 (1996). 114. I.L. Singer, J.S. Mudray and J. Comas, J. Vac. Sci. Techno/., 18, 161 (1981).
342 115. 116. 117. 118. 119. 120. 121. 122. 123. 124. 125. 126. 127. 128. 129. 130. 131. 132. 133. 134. 135. 136. 137. 138. 139. 140. 141. 142. 143. 144. 145. 146. 147. 148. 149. 150. 151. 152. 153. 154. 155. 156. 157. 158.
F.D.AURET N.J. Devlin, Electron. Lett., 16, 138 (1980). F. D. Auret and S.A. Goodman, Appl. Phys. Lett., 68, 3275 ( 1996). F. D. Auret, R.M. Erasmus, S.A. Goodman and W.E. Meyer,Phys. Rev., 851, 17 521 (1995). F.D. Auret, S.A. Goodman, R.M. Erasmus, W.E. Meyer and G. Myburg, Nucl. lnstr. and Meth. in Phys. Res., 8106,323 (1995). S.A. Goodman and F.D. Auret, Jpn. J. Appl. Phys. Lett., 32, Lll20 (1993). A.A. Rezazadeh and D.W. Palmer, J. Phys., CIS, 43 (1985). F.D. Auret, P.N.K. Deenapanray and S.A. Goodman, unpublished, (1998). G. Hoffman, J. Madok, N.M. Haegel, G. Roos, N.M. Johnson and E.E. Haller, Appl. Phys. Lett., 61, 2914 (1992). D. Pons, Physica, 8116,388 (1983). W.R. Buchwald, N.M. Johnson and L.P. Trombetta, Appl. Phys. Lett., 50, 1007 (1987). A.W.R. Leitch, Tb. Presca and J. Weber, Phys. Rev., 844, 1375 (1991). A.W.R. Leitch, Th. Presca and J. Weber, Phys. Rev., 845, 14400 (1992). A. Chantre and L.C. Kimerling, Appl. Phys. Lett., 48, 1000 (1986). M. Levinson, M. Stavola, J.L. Benton and L.C. Kimerling, Phys. Rev., 828,5848 (1983). T.l. Kol'chenko and V.M. Lomakoi, Semiconductors, 28, 501 (1994). F.K. Koschnick, M. Hesse, K. Krambrock and J.-M. Spaeth, Proceedings rJl the 8th Conference on Semi-insulating lll-V Materials, Warsaw ( 1994 ), (edited by M. Godlewski, World Scientific, Singapore), p.229 (1994). F. D. Auret, R.M. Erasmus and S.A. Goodman, Jpn. J. Appl. Phys., 33, L491 (1994). J.L. Benton and M. Levinson, In Defects in Semiconductors II., ed. by S. Mahajan and J.W. Corbett (North-Holland, New York) p.95 (1983). D.L. Scharfetter, Solid-State Electronics, 8, 299 (1964). F.D. Auret and M. Nel, J. Appl. Phys., 64,2422 (1988). A. Chantre, Appl. Phys., A48, 3 (1989). S.A. Goodman, F. D. Auret and G. Myburg, Appl. Phys., A59, 305 ( 1994). M.J. Legodi, F.D. Auret and S.A. Goodman, J. Physics 8, 273-274,762 (1999). J.C. Bourgoin and M. Lannoo, Point Defects in Semiconductors II, Experimental Aspects (Springer, New York), pp.I91-202 (1983). K.L. Wang and G.P. Li, Solid State Commun., 41,233 (1983). S.J. Pearton, A.J. Tavendale and A.A. Williams, Electronics Letters, 16,483 (1980). J.L. Hartke, J. Appl. Phys., 39,4871 (1968). G. Vincent, A. Chantre and D. Bois, J. Appl. Phys., 50,5484 (1979). G. Pensl, G. Roos, C. Holm and P. Wagner, Proceedings r~f'the Fourteenth International Conference on Defects in Semiconductors, edited by von Bardeleben, H.J., Materials Science Forum (Transworld Technology, Switzerland), Vol. 10-12, pp.911-916 (1986). G.P. Li and K.L. Wang, Appl. Phys. Lett., 42, 838 (1983). D. Pons and J.C. Bourgoin, Phys. Rev., 843, 11840 (1991). Q.S. Zhu, K. Hiramatsu, N. Sawaki, I. Akasaki and X.N. Liu, J. Appl. Phys., 73, 771 (1993). W. Csaszar and A.L. Endros, Phys. Rev. Lett., 73,312 (1994). G.A. Sai-Halasz and J. Gazecki, Appl. Phys. Lett., 45, 1067 (1984). K. Bhattacharya, A. Reisman and M.C. Chen, J. Electron. Mater., 17,273 (1987). G. Myburg and F.D. Auret, J. Appl. Phys., 71,6172 (1992). F.D. Auret, G. Myburg, H.W. Kunert and W.O. Barnard, J. Vac. Sci. Techno/., 810, 591 (1992). S.W. Pang, J. Electrochem. Soc., 133, 784 ( 1986). L.W. Aukerman and D.O. Graft, Phys. Rev., 127, 1576 (1962). B. Szentpali, B. Kovacs, D. Huber, C.D. Kourkoutas, P.C. Euthymiou and G.E. Zardas, Solid State Communications, 80,321 (1991). G.J. Shaw, S.R. Messenger, R.J. Walters and G.P. Summers, J. Appl. Phys., 73, 7244 (1993). Y. Umemoto, N. Masuda and K. Mitsusada, IEEE Elect. Dev. Lett., EDL-7, 396 (1986). P. Blood,/nst. Phys. Conf Ser., 56,251 (1981). D. Donoval, J. de Sousa Pires, P.A. Tove and R. Harman, Solid-State Electron., 32, 961 (1989).
ELECTRICAL CHARACTERIZATION
343
159. R.M. Erasmus, W.E. Meyer, F.D. Auret and G. Myburg, S. A.fi: J. Phys., 16,89 (1993). 160. E.M. Verbitskaya, V.K. Eremin, A.M. Ivanov, E.S. Ignatenko, N.B. Strokan, U.Sh. Turebekov, J. von Borany and B. Schmidt, Sov. Phys. Semicond., 25(5), 516 (1991). 161. D. Pons, P.M. Mooney and J.C. Bourgoin, J. Appl. Phys., 51, 2038 ( 1980). 162. J.P. de Souza, I. Danilov and H. Boudinov,J. Appl. Phys., 81,650 (1997). 163. M.J. Legodi, F.D. Auret, S.A. Goodman, J.B. Malherbe and NJ. Swart, Nuclear Jnstr. and Meth. in Phys. Res. Sect. B, 148,441 (1999). 164. T.l. Kol'chenko and V.M. Lomakoi, Sov. Phys. Semicond., 9, 1153 (1975). 165. P.L. Pegler, J.A. Grimshaw and P. Banbury, Radiat. Effects, 15, 183 (1972). 166. A. Kahan, L. Bouthillette and H.M. DeAngeles, Radiation Eff"ects in Semiconductors (New York: Gordon and Breach), pp.281-285 (1971). 167. P.N. Brunkov, V.S. Kalinovsky, V.G. Nikitin and M.M. Sobolev, Semicond. Sci. Techno/., 7, 1237 (1992).
CHAPTER 8
Instability and Defect Reaction YUZO SHINOZUKA Department ofMaterial Science and Chemistry Faculty of Systems Engineering, Wakayama University Sakaedani 930, Wakayama 640-8510, Japan yuzo@sys. wakayama-u.ac.jp
1. 2. 3. 4. 5.
Electronic-Atomic Processes in Semiconductors Electron Localization: Shallow-Deep Instability Symmetry Breaking Stability of the Position of an Impurity Structural Change of a Tetrahedral Point Defect 5.1. Vacancy 5.2. Substitutional Impurity . 6. Defect Reaction . 6.1. Annihilation of an Impurity Complex 6.2. Impurity Diffusion 6.3. Successive Carrier Captures and Induced Transient Lattice Vibration 6.4. Recombination Enhanced Defect Reaction
345 346 348 350 352 355 358 359 361 361 362 366
1. ELECTRONIC-ATOMIC PROCESSES IN SEMICONDUCTORS
The present semiconductor technology is based on a physical hypothesis where carriers (conduction electron and valence hole) move in an almost static lattice and sometimes interact with static (vacancy, impurity, ... ) and dynamical (lattice vibrations) crystal imperfections. It has long been considered that the electron-lattice interaction in semiconductors can be treated as a small perturbation. Recently, however, there have been found various phenomena which break this hypothesis. A carrier trapping at a defect sometimes induces large atomic displacements, such as structural change of a point defect, bond breaking, creation of a defect, desorption of an atom from a surface and so on [1]. One of the most striking phenomena might 345
346
Y. SHINOZUKA
be the off-center instability of a substitutional impurity, which has been found at several donors in III-V semiconductors [2, 3]. This phenomenon invalidates the traditional common sense of the valence control using shallow impurity doping, and is considered as a key mechanism of defect reactions in semiconductors. Degradation of light emitting semiconductor diodes and lasers is caused by the climb and glide motions of dislocations [4]. The control of defect reactions is an important key to achieve the high efficiency and reliability of devices. The purpose of this chapter is to give an overview on various electronicatomic processes at defects in semiconductors. First, I will discuss the strong localization of a carrier in semiconductors caused by interactions with the lattice in connection with the shallow-deep instability. Next I will discuss the symmetry breaking structural changes at point defects recalling the Jahn-Teller effect. Because of a strong electron localization at deep-level defects, the effects of the electron-electron interaction as well as the electron-lattice interaction becomes important. The cooperation and competition of two interactions at point defects will be precisely discussed with a tetrahedral T -U-S model. Finally, I will discuss mechanisms of electronically induced (enhanced) defect reactions. Proposed mechanisms so far are reexamined including the structural instability and the recombination enhanced. These two mechanisms can be treated in a unified scheme by using the correct configuration coordinate diagram, which enable us to treat correctly the correlation in successive captures of electrons and holes. The mechanism of the energy conversion during the reaction is discussed paying attention to the relation between the lattice relaxation mode and the symmetry breaking reaction coordinate. 2. ELECTRON LOCALIZATION: SHALLOW-DEEP INSTABILITY In condensed matter, a crystalline structure is realized when the electrons and the atoms are in the ground state- the absolute minimum of the total energy. If a carrier (conduction electron, valence hole) is created in a semiconductor, the balance of interatomic forces mediated by valence electrons is disturbed and then the atomic configuration is rearranged. This is the so-called electron-lattice interaction [5]. Since carriers move almost freely in normal semiconductors, it has been considered that strong electron-lattice interaction is absent there and is realized only in ionic materials. Recent experimental studies have shown that this is not true. If the electronic excitation is spatially localized by a point defect, impurity, or due to self-trapping as the secondary process, and if the change of the electronic charge density is sufficiently large, then the surrounding atoms are affected by the induced force and
INSTABILITY AND DEFECT REACTION
347
are displaced significantly, as has been found in some deep-level defects in covalent semiconductors [ 1]. Let us estimate the strength of the electron-lattice interaction using a continuum model proposed by Toyozawa [6]. Suppose a point defect in a semiconductor, which attracts a conduction electron (valence hole) with an effective mass m. The strength of the attractive potential is Ut for the long-range part and U.,. for the short-range part. The lattice is regarded as a superposition of the elastic medium and the dielectric medium, representing the acoustic phonon field and the optical phonon field, respectively. If an electron is localized around a point defect with a radius a of the wave function, rp(r)
rv
exp ( -rr
:~) ,
(1)
both mediums deform so as to relax the elastic strain and induced polarization. The lattice relaxation energies caused by two interactions are given by (2)
where Ed is the deformation potential, C is the elastic constant, c- 1 = c~1 + c01 with co and c 00 are the static and high frequency dielectric constants, respectively. Both Ef'k(a) and EZ~(a) increase as the electron radius a decreases. Their maximum values are realized at a = d, where d is the lattice constant of the crystal, since the wave function (1) is an envelope function of Wannier orbitals. For a typical semiconductor with Ed = 6 eV, C = 4x 10 10 N/m 2 ,c = 4andd = 3A,themaximumsareE~~(d) = 1.2eV and Ef'R(d) = 2.7 eV. Adding the increase of the electron kinetic energy by localization and the potential gain by a defect, the total energy is given by E(a)
=
B(dla) 2
- (U.,.
+ Ef'R)(dla) 3 - CUt+ EZ~)(dla),
(3)
where B = 3rr !i2 12md 2 [6]. The stable electron radius a is determined so as to give the minimum of E (a) in the region of 0 _:: : d 1a _:::: 1. '!'he value of depends on two strengths for electron localization: intrinsic ELRI B = (Ef'RIB, EZ~IB) and extrinsic UIB = (U.dB, Ut/B). Figure 1(a) shows typical behaviors of E(a) and Figure l(b) shows the phase diagram of an electron in the deformable lattice. In the region Sh, an electron is shallowly localized around a point defect (a » d) with small lattice distortion. In the region De, it is deeply localized (a = d) with strong lattice distortion. If there is a metastable state, it is indicated in the parenthesis. For a typical donor in nonpolar semiconductors such asP in Si, E~~(d) rv 0, Us rv 0, c » 1 and m is light, then a » d and Ef'k (a) rv 0 in spite of large Ef'k (d). As a result, the effect of the electron-lattice interaction can be negligible for shallow donor (acceptor) impurities. On the other hand, it is possible that even if both ELRI Band UI B locate in the region
a
Y. SHINOZUKA
348
\
(b)
\
0
dla
1/3
2/3
dla
(U,+~)IB
Fig. I. (a) The total energy and (b) the phase diagram of an electron interacting with a point defect and the lattice.
Sh but the cooperation locates in the region De or De(Sh) as is shown in Figure 1(b). Then the ground state is a deep state with strong lattice distortion. This mechanism is called the extrinsic self-trapping [7, 8]. Here, a strong electron-localization and a strong lattice distortion are the cause and the result each other. A nitrogen impurity in Si [9, 10] might be an example of this extrinsic self-trapping (De(Sh)), which accompanies a metastable shallow state with small lattice distortion. Thus we have seen that strong electron-lattice interaction, mainly due to the short-range interaction by acoustic phonons (see the a dependence in eq. (2)), induces a shallow-deep instability at point defects in semiconductors.
3. SYMMETRY BREAKING So far we have assumed a spherical symmetry in electron localization. When an electron is strongly localized (a '"" d), it feels the lattice structure and also interacts with other valence electrons. Then we must explicitly consider the lattice structure and its symmetry to discuss the lattice distortion in real space. In this section we discuss symmetry breaking structural changes recalling the Jahn-Teller (J-T) instability, which has been first proposed to discuss the stability of molecular structures [ 11]. Let us consider a point defect in a semiconductor, whose point symmetry is characterized by a symmetry group denoted by G. The adiabatic Hamiltonian of the system is given by H = He({r})
+ V({r}, {R}) + UL({R}).
(4)
INSTABILITY AND DEFECT REACTION
349
Here {r} denotes the set of the position of electrons {r 1 , r 2 , ... } and {R} represents the displacement {Ro, R 1 , ... } of atoms around the defect. We must distinguish the relevant electrons and the other valence electrons that are combined with ions to form the lattice medium [5]. UL({R}) is the elastic energy for the displacements of atoms. The set of displacements {R} can be transformed into the set of normal modes {Q r} in the irreducible representation r of G [12]. The electron-lattice interaction term V({r}, {R}) V({r}, {Qr}) can be expanded as a power series of Rj's or Qr's. V({r}, {R}) =V({r}, {R}
= 0) +
=V({r}, {Qr} = 0)
av L BRRj + ... j
+L
.I
av
-Qr r BQr
+....
(5)
In the rigid lattice {R} = 0, all electronic states IJI ({r}) which obey the SchrOdinger equation [He({r})
+
V({r}, {R} = 0)]\ll({r}) = E\ll({r}),
(6)
are classified by the irreducible representation r e of Gas lllr,. ({r }). Next, we allow the displacements of atoms. The generalized force Ff with respect to Qr for the electronic state IJ!r, (r) is given by ' (7)
If \llr, ( {r}) is degenerate, the symmetric representation [fe X f e] always contains at least one non-identity representation r [12]. This means Ff, ¥= 0 and then atoms are always displaced to lower the symmetry. Figure 2 shows an example of the J-T distortion at a square molecule of D4h· When the electronic state is doubly degenerate Eg. it distorts to D2h· It should be noted that there are several equivalent stable configurations: in Figure 2 there are two equivalent J-T distortions (QB!g > 0 and Qs!g < 0), thus the total symmetry remains conserved in some sense. Table 1 shows typical examples of the relation between electronic states and the J-T distortion modes for some point symmetries. A vacancy (V) in the diamond structure has the Td symmetry. In Si crystal when a vacancy is positively charged V~, the electronic ground state is triply degenerate (f = T) then the £-type J-T distortion takes place to lower the symmetry to D2d. which has triple equivalent minimums. This J-T distortion at V~ has been observed experimentally by EPR measurements [13] and the potential barrier height between equivalent minimums is estimated as 0.07 eV [14].
Y. SHINOZUKA
350
(b)
(a)
I
Eg electronic state
Qat 0
y2+ v
n =I
oH
n=7 A2+
n=5
v+
yo
v-
y2-
3
4
5
6
v~.
v~n
v:.~
Vj;l
4
5
6
7
y+ v
2
yo v
3
vv 4
y2v
5
o+
oo
o-
oz-
n=O n =8
I
2
3
A+
Ao
A-
A2+
6 for antibonding
n=O
+ 7
8
Ql >0
Qe here represents a linear combination of the displacements of three host atoms next to the host atom ate (Figure 3(a)). The vacancy (Y) in Si has been found to have different stable structures depending on its charge [ 13, 14]: D2d for Y0 and y+, C2v for y-, and T d for y++. The neutral Y0 corresponds to n = 4 in the present model, the parameters for Y Si may fall into the third case (U IT = 1, SIT = 2.4) in Table II. Since only the diagonal type electron-lattice interaction has been taken into account, the D2d type structure does not appear here. It is stabilized by the off-diagonal electron-lattice interaction: modulation of the electron transfer T ( Qf).
5.2.
Substitutional Impurity
As a first step of approximation we only take account of electrons occupying the bonding and the antibonding orbitals between an impurity and four nearest neighbor host atoms. If four bonding orbitals are partially filled by electrons, we concentrate the electrons in the bonding orbitals and neglect the anti bonding orbitals. The lattice distortion Qf (Figure 3(b)) then represents a contraction mode between the impurity and one of four host atoms (Table III). On the other hand, if four bonding orbitals are completely filled by eight electrons, we will combine them with ions into the lattice and concentrate
INSTABILITY AND DEFECT REACTION
C2v clstortion
Fig. 6.
C5 distortion
359
C3v (1) distortion forantibonding C3v (2) distortion lor bonding
Several types of the displacement of an impurity at Td site.
only electrons in the antibonding orbitals. Then the lattice distortion Qe (Figure 3(c)) represents a stretching mode between the impurity and one of four host atoms. Since singly ionized donor (D+) and acceptor (A-) correspond ton = 0 or 8, then the Td structure is stable there. But when the electronic occupation is changed, a structural instability may take place, which is different for donor and acceptor, because there is no electron-hole symmetry. The displacement of an impurity atom in real space are illustrated in Figure 6. For D0 donor, T d is stable for SIT < 6 and Cw (I) is stable for SIT > 6. Nitrogen impurity in Si, which has been found to show an off-center configuration for a neutral state, may correspond to the latter case. For n- donor, C3v(l) type off-center configuration is more stable when SIT > 3 and S > U. DX center in AlJ-xGaxAs may correspond to this case: Td structure for neutral donor and C3v(l) off-center structure for nx- state. On the other hand, for neutral acceptor A0 , Td is always unstable and C3v(2) type off-center is always stable. Then we can conclude that the on-center type deep-acceptor A 0 is absent in tetrahedrally bonded semiconductors. This is not the case for a shallow acceptor A0 , which should be regarded as A- + one shallowly bound hole in the present approximation. It is also noted that we have used a crucial approximation where a "defect molecule" has been cut out of the crystal.
6. DEFECT REACTION So far, we have seen that the stable structure of a point defect will change when the electronic state has changed. Then a carrier capture or an electronic excitation can induce atomic motions around a defect towards a new stable
Y. SHINOZUKA
360
0
Electronic Excitation
• •
0 G
0 ~ 0
C)
0
0000
0~00 00~0
•
photon carrier capture particle beam
Fig. 7.
off-center
(1)
e-h pair creation intra"defect" excitation defect ionization recombination
diffusion
,_. . . multiplication
0 ,_..
creation
• ,_. 0
annihilation
~ocationclimb glide
Defect reaction induced by electronic excitation (DRIEE).
structure. During the lattice relaxation an amount of the electronic energy is converted to the kinetic energy of atoms, which may induce defect reaction. In this section, we will discuss the dynamics of defect reactions. Figure 7 schematically shows typical examples of defect reactions [21]: impurity diffusion, structural change of a defect (creation, annihilation and multiplication), and climb and glide motions of a dislocation. It has been shown that defect reactions are induced or enhanced by photoexcitation, electron beam excitation and carrier injection [22]. Hereafter we will call these phenomena DRIEE in abbreviation and indicate the reaction symbolically as D;--+ Dt· Several models have been proposed so far, which can be classified into two categories as schematically shown in Figure 8. One is the structural instability mechanism [23, 24] (Figure 8(a)) where a particular electronic state of a defect induces a symmetry breaking atomic motion such as the off-center distortion. For example, if the relaxation mode Q 1 is nothing but the reaction coordinate QR (D;--+ Dt) itself, an electronic excitation to ex1 promptly induces the reaction or generates a precursor of a new defect configuration.
An excitation to ex2 decreases the potential barrier height (£1 --+ E7) of the reaction. The other mechanism is the recombination enhanced (or phonon kick) mechanism (Figure 8(b)), where an electron-hole recombination at a defect induces a transient atomic motion in the reaction coordinate Q R [25, 26]. The first mechanism (a) stresses why and how the instability takes place toward a "defect" configuration. The second mechanism (b) stresses how the electronic energy converts to the lattice vibration energy and the motion in the reaction coordinate to overcome the potential barrier.
INSTABILITY AND DEFECT REACTION
(a) Structural Instability Mechanism
36I
(b) Recombination Enhanced Mechanism (Phonon Kick)
w
Fig. 8.
Two mechanisms for DRIEE.
Though two mechanisms look different, they can be treated in a unified scheme as follows.
6.1.
Annihilation of an Impurity Complex
A hydrogen atom can passivate or activate donors, acceptors and other impurities in semiconductors. In silicon, a hydrogen impurity can occupy several stable positions in the diamond lattice. If it occupies a bond center position between a substitutional carbon (isoelectronic) impurity and a silicon atom, this H-C complex acts as a shallow donor whose thermal depth is E~h = 0.15 eV. The positively charged H-C complex is stable above the room temperature, while the neutral state is unstable at room temperature and the activation energy for the annihilation is estimated as 0.5 ,. . ., 0.7 eV [27]. Since the "united atom" of a H-C complex is a nitrogen atom in the molecular chemistry, the effective potential seen by a conduction electron away from the (H-C)+ complex is similar to those by theN+ impurity. Then we can derive an analogy between the stability of a N impurity and that of a H-C complex in Si. For a shallow donor state or a positively charged state (an electron is away) the central position is stable for aN impurity, and the H-C complex is stable. If an electron comes close to them, on the other hand, it induces the off-center displacement of a N impurity, and the off-center displacement of a hydrogen atom. That is, a hydrogen atom is pushed away from a carbon: the annihilation of a H-C complex. This would be a typical example of a defect reaction caused by the structural instability mechanism. 6.2.
Impurity Diffusion
Let us next discuss the impurity diffusion, especially the interstitial mechanism, where an impurity atom diffuses via interstitial positions. An interstitial
362
Y. SHINOZUKA
00 0 0 0
o.o fJ
0
e
00 000
g
(a)OOOO
Fig. 9.
(b)
A
B
A
B
A
(a) Interstitial positions in a lattice. (b) Electronically enhanced impurity diffusion.
impurity may occupy a larger vacant site such as A and Bin Figure 9. Then they have a high point symmetry and we can apply the results in Section 4. If a localized electronic state which shows the off-center J-T instability at position A continuously changes into a state which does not show at position B and vice versa (Figure 9(b) ), the diffusion is enhanced by the electronic excitation and deexcitaion. The self-interstitial in Si is shown to be this type [ 17]. This mechanism is similar to the Bourgoin-Corbett mechanism [23] (Figure 10), but the number of bound electrons (holes) here remains constant. The B-C mechanism is proposed for an enhancement of an impurity diffusion, where the stable position of an impurity is unstable for another charged state and vice versa.
6.3.
Successive Carrier Captures and Induced Transient Lattice Vibration
Carrier captures by a defect as well as localized electronic excitations take place via a localized electronic state whose level is located in the band gap. Therefore it is convenient to introduce a configuration coordinate diagram (CCD) [5]. A typical example is illustrated in Figure 11: for simplicity the defect is assumed to have and charged states.lt has been suggested that a carrier capture induces a transient lattice vibration, which then enhances the following capture of an opposite carrier. These coherent captures are considered as a key mechanism for recombination enhanced defect reactions, which are observed in many optical semiconductor devices [4]. Let us study the transient lattice vibrations around a deep-level defect in a semiconductor and its role in the defect reaction [28]. The normal mode of the lattice vibration is denoted by qk with an angular frequency Wk. The suffix k runs over the modes and the wave numbers for the bulk mode and also over localized modes if any. Without loss of generality we assume that the system is a p-type, and the equilibrium positions are qk = 0 when the defect is positive (Df) and qk = qk when the defect is neutral (D?).
Di
D?
INSTABILITY AND DEFECT REACTION
Total Energy
363
l
r
Fig. 10.
The Bourgoin-Corbett mechanism for impurity diffusion.
Fig. 11.
The configuration coordinate model for a deep-level defect with many carriers.
364
Y. SHJNOZUKA
The interaction mode Q1 defined by (9)
represents the total effect of all the lattice distortions (qk = 0 --+ iik) induced by the electronic change. Before the capture of an electron, the lattice qk vibrates thermally around each equilibrium qk = 0 and is sometimes activated to distort Q, = Qe, at which a nonradiative electron capture can takes place [29, 30]. If we assume the minimum activation energy for each mode qk so as to reach Q, = Qe [26], the time evolution of the interaction mode after the capture, which has occurred at t = 0, is given by, (10)
Since the interaction mode Q 1 is a linear combination of many normal modes
qk with different frequencies wt, Q, (t) shows a damping oscillation, which lasts in a period T ~ 2rr I t:.w where t:.w is the width of the frequency distribution. While in the normal modes, qk(t) vibrate harmonically (no
damping and no energy dissipation). If the electronic system couples mainly with the localized lattice vibrational mode, the transient oscillation lasts very long. Let us simulate the dynamics of the transient vibration and a series of carrier captures. We use following assumptions:
= 0 or qk = iik depending on the charge of the defect (Df or D?). The time dependence of Q,(t) is determined by {qk(t)} through the equation (9). The first electron capture takes place by a thermal activation Q, --+ Qe. If the motion of the interaction mode, Q1 (t), crosses the point Qe (Qh) in the adiabatic potentials, there arises a large probability Pe (Ph) per time to capture an electron (hole) nonradiatively. If the motion Q1 (t) has been damped out before the next carrier capture, the coherence in successive captures is quitted. The next capture is again thermally activated process.
(1) Each normal mode qk vibrates around either qk
(2) (3) (4) (5)
Figure 12 shows typical examples of the time evolution of Q, (t) with parameters Pefwo ~ Phfwo ~ 0.05, where wo is the mean frequency [28]. A small black circle indicates the time of a carrier capture. Figure 13 shows the time evolution of the adiabatic potential W(QI). It is readily seen that the vibronic energy, i.e. the kinetic energy of the vibration of Q1 (t), increases every time when the defect captures a carrier. If P; T < 1, it is damped out
INSTABILITY AND DEFECT REACTION
61111 a~,-o.ot, Q, -2.
365
a; •3, a. -s
15
15
10
10
+IIHHI-tH:Ht-1fHHrf.H::I-H+ttH:HHttH+I:Hffi- +~] -HI-II.ti-IH~if.l/1rf.H1.1-V-IfH1rAI-5 -10
-10
-15
-15
+r:]
Fig. 12. Time evolution of Q1 (t) during a series of captures [28].
AO>Im,-o.t, Q,•-2, Q;•3, Q.•S
Fig. 13. Time evolution of W(Qt) during a series of captures [28].
before the next capture. The amount of the thermal depth E;h is dissipated by a capture of i = e, h. On the other hand, if P;r: > 1 the energy dissipation is weak and the amplitude of Q, (t) increases as time goes. The induced vibration in turn enhances the following carrier capture process. If Per: > 1 and Ph r: > 1 are satisfied, coherent captures can take place. Thus the carrier captures and the transient lattice vibration are highly correlated processes (capture enhanced capture), which depend on the carrier densities ne and nh, the capture cross sections ere and O'h, the activation energies E~ct and E~cl' and the frequency distribution l:l.w of phonons. We have assumed that an electron (hole) can be athermally captured just when Q 1(t) crosses the intersection Qe(Qh) of two adiabatic potentials. The probability P; (i = e, h) is related to the prefactor of the capture cross section ui = cr/x, exp(- E~crl kB T) for the nonradiative multiphonon process as P; = n; v~cr/x, [29]. Here n; is the carrier density, v~ the thermal velocity and ui the capture cross section. If the transient vibration enables Q 1 (t) to cross Qe (Qh), it is theoretically shown that P; "'wo/2rr [26]. Then the condition for the coherent captures turns out to be Per: rv Ph r: "' wo/ l:l.w > I. The
Y. SHINOZUKA
366
• w
w
!the
--~""-'--...-~;-hh_l 0
Ql• QR
Ql
capture
~
QIIIQR
QR
hole thermally activation electron
-··-'----·
enhanced' ~
......
defect reaction
::::00
if Ethe_ Eg
Eg
-----.!~~- -~~th_e_l
electron ~ struct. instability thermally activation if Ethe_ Eg phonon kick p-type hole enhanced
n-type
n-type )
i Eg
QR
(
recomb. enhanced
Ql. QR
QI/1-QR
if Ethh- Eg
recomb. enhanced
struct. instability if Ethh-Eg
phonon kick
Fig. 14. An example ofthe configuration coordinate diagrams for the same defect in p-type and n-type semiconductors. Thick adiabatic potentials are for the interaction mode Q1 (relaxation mode) and thin adiabatic potentials for the reaction coordinate QR. The table summarizes the most probable path for DRIEE.
details depend on the parameters: Qe, Qh, Q1 , .... If several pairs of electrons and holes are captured within a short period ~ 2rr I tl.w, the amplitude of the interaction mode Q1 (t) increases remarkably, and it may overcome the potential barrier E 1 for a defect reaction (D;-+ Df). More than the band gap energy E g = E~h + E~ can be supplied for this phonon kick mechanism.
6.4.
Recombination Enhanced Defect Reaction
There are many situations depending on the variety of charged states of a defect, the magnitude of E:h and E~h, the relation between the relaxation mode Q1 and the reaction coordinate QR, the magnitude of capture cross sections, and so on (Figure 14). If the relaxation mode Q 1 is a symmetric mode such as a breathing mode, Q1 is then orthogonal to QR that is a symmetry breaking mode by definition. Then the symmetrical relaxation process does
INSTABILITY AND DEFECT REACTION
367
not affect defect reactions. When Q1 is not orthogonal to QR, Sumi [26] has shown theoretically that the transient lattice vibration by a capture reduces the activation energy E 1 for a defect reaction to E 1 - (E~ct + E;h) or
(,JE; -
Icos() 1.jE~ct + E:h /I (1 -
cos 2 ()) where () is the angle between
Q1 and QR.
When the off-center instability takes place by the charge change of a defect, it is important which corresponds to the off-center configuration, Q1 = 0 or Q 1 ? If the reaction coordinate Q R is almost parallel to Q 1, a defect reaction in p-type semiconductors occurs by the structural instability mechanism induced by a minority electron capture. If E~h is large and Q 1I I Q R but there is a potential barrier, the phonon kick mechanism takes place with the aid of E~h induced by an electron capture. If E~h is large and Q1II- QR, the phonon kick mechanism takes place by a hole capture which has been enhanced by an electron capture. If a capture of a majority carrier occurs very quickly within the local transient vibration, the band gap energy E g = E~h + E~h can be used for an excitation of a defect reaction. This could be the most effective path to the defect reaction and nothing but the so-called recombination enhanced mechanism. In an n-type semiconductors, defect reactions can be discussed in a similar way as above, starting from Q 1 = Q 1 and D? + e +h. In contrast to a p-type, the first capture of a minority hole by a neutral center D? is not accelerated by the Coulomb attraction while the second electron capture by Di is accelerated. We have assumed that the initial defect has D? and Di charged states. If it has Dj and D?, the above discussion can be also valid with respective translations D?--+ Dj and Di--+ D?. As we have shown, either in n-type and p-type, the capture of a majority carrier always enhanced by a minority carrier capture, and vice versa. But only a hole capture is accelerated by the Coulomb attraction of Dj.
References I. Y. Shinozuka, "Relaxations of Excited States and Photo-Induced Structural Phase Transitions", Proc. 19th Taniguchi Symposium (Springer, 1997) ed. K. Nasu, 229. 2. J. Dabrowiski and M. Scheffler, Phys. Rev. Lett., 60,2183 (1988). 3. D.J. Chadi and K.J. Chang, Phys. Rev. Lett., 60,2187 (1988). 4. 0. Ueda, "Reliability and degradation of JIJ-V optical devices" (Artech House Publishers, Boston-London) 1996. 5. Y. Shinozuka, Jpn. J. Appl. Phys., 32,4560 (1993). 6. Y. Toyozawa, Physica, 1168,7 (1983). 7. Y. Toyozawa, Solid State Electron., 21, 1313 (1978). 8. Y. Shinozuka andY. Toyozawa, J. Phys. Soc. Jpn., 46,505 (1979). 9. K.L. Brower, Phys. Rev., 826,6040 (1982). 10. K. Murakami, H. Kuribayashi and K. Masuda, Phys. Rev., 838, 1589 (1988). II. H.A. Jahn and E. Teller, Proc. Roy. Soc., A161, 220 (1937).
368
Y. SHINOZUKA
12. See for example, Y. Onodera, "Group Theory and Application to Quantum Mechanics", (Springer, I 995). 13. G.D. Watkins, Proc. Delects in Semiconductors, 1972, 228; Physica, 1178 & 1188, 9 (1983). 14. M. Sprenger, S. Mutler, E. Sieverts and C. Ammerlaan, Phys. Rev., 835, 1566 (1987). 15. Y. Shinozuka, Materials Science Forum, 83-87,527 (1992). 16. D.J. Chadi and K.J. Chang, Phys. Rev. Lett., 61,873 (1988), Phys. Rev., 839, 10063 (1989). 17. M. Saito, A. Oshiyama, and 0. Sugino, Phys. Rev., 847, 13205 (1993). 18. Y. Toyozawa,J. Phys. Soc. Jpn., 51,1861 (1981). 19. M. El-Maghraby and Y. Shinozuka, Proc. Materials Science Forum, 258-263, 647 (1997). 20. M. El-Maghraby andY. Shinozuka, J. Phys. Soc. Jpn., 67, 3524 ( 1998). 21. Y. Shinozuka, Proc. MRS 1996 Fall Meeting, 442, "Defects in Electronic Materials II", ed. J. Michel, T. Kennedy, K. Wada, and K. Thonke, p.225 (1996). 22. K. Maeda, M. Sato, A. Kubo and S. Takeuchi, J. Appl. Phys., 54, 161 ( 1983). 23. J.C. Bourgoin and J.M. Corbett, Phys. Lett., 38A, 135 (1972), and Radiation Effects, 36, 157 (1978). 24. M.K. Sheinkman, JETP Lett., 38, 330 (1983), and M.K. Sheinkman and L.C. Kimerling, "Defect Control in Semiconductors", ed. K. Sumino (North-Holland, 1990) p.97 (1983). 25. J.D. Weeks, J.C. Tully and L.C. Kimerling, Phys. Rev., 812,3286 (1975). 26. H. Sumi, Phys. Rev., 829,4616 (1985), J. Phys., C17, 6071 (1984). 27. Y. Kamiura, M. Tsutsune, M. Hayashi, Y. Yamashita and F. Hashimoto, Materials Science Forum, 196-201,903 (1995). 28. Y. Shinozuka and T. Karatsu, Materials Science Forum, 258-263,659 (1998), and Physica 8273-274, 999 (1999). 29. C.H. Henry and D.V. Lang, Phys. Rev., 815, 989 ( 1977). 30. Y. Shinozuka, J. Phys. Soc. Jpn., 51,2852 (1982).
CHAPTER 9
Device Degradation KAZUMI WADA 1 AND HIROSHI FUSHIMI 2 1Department ofMaterials Science and Engineering, Massachusetts Institute of Technology, 77 Massachusetts Avenue, Cambridge, MA 0.2139 USA 2 Nippon Telephone and Telegraph Corporation, Atsugi, 243-0/98, Japan
1. HBT Structures and Their Degradation 2. Hydrogen Related Degradation of HBTs 3. Thermal Behavior of Hydrogen Impurity 3.1. Isolated Hydrogen Interstitials 3.2. C-H Complexes . 4. Electronic Excited Hydrogen Behavior- Hydrogen Induced Degradation 4.1. Isolated Hydrogen Related Degradation 4.2. CH Complex Related Degradation 5. Carbon Related Degradation of HBTs 5 .1. Thermal Behavior of Carbon Related Defects 5.2. Carbon Related Degradation 6. Conclusion References .
370 372 372 372 374 379 379 382 388 390 403 406 407
Extremely high density of carriers is often injected into their microscopic structures in recent electron and optoelectronic semiconductor devices in order to achieve higher performances. This however often enhances device degradation. There are various modes in device degradation: Degradation of device extrinsic structures such as resistivity increase of metallic wires by electromigration, and degradation of device intrinsic structures such as deterioration of device performances. Main factors governing the degradation are semiconductor-material-related, but the device-structure-related factors are present and make phenomena complex. In the present chapter, materialrelated degradation of the device intrinsic structures is described. Devices 369
370
K. WADA and H. FUSHIMI
discussed here are minority carrier injection devices, and materials are Ill-Y compound semiconductors, especially GaAs. It is well known that a long-term operation of semiconductor laser diodes (LDs) results in increase in non-radiative recombination between electrons and holes at elevated temperatures, leading threshold current increase, i.e., . so called rapid degradation [1]. History of LDs development is a challenge how to suppress degradation. In course of such development, it became clear that dislocations in the active layers degraded LDs. All LDs have thus been subjected to initial screening tests prior to the market. In other words, those survived are being supplied to the market. It is reasoning why stable LDs are commercially available. However, slow degradation became noticeable. Micro dislocation loops were reported in light emitting diodes, LEDs. Thus, it can be said that point defect aggregation occurs in these degradation during minority carrier injection. However, physics behind slow degradation as well as rapid degradation have not been clarified. Accordingly, no fundamental solution has been prepared for suppression of possible degradation of next generation devices, except for recipe for dislocation suppression. Recently, similar phenomena have again been reported in high performance transistors, i.e., heterojunction bipolar transistors (HBTs) and not suppressed yet [2]. No dislocations have been observed in the base layers of degraded HBTs but micro-defects have been reported in the base layer. These features are similar to the slow degradation in LDs. However, there is a essential difference between slow degradation of LDs and degradation of HBTs: The former occurs in a nominally undoped luminescent layer, whereas the latter occurs in a heavily doped base layer. In other words, Fermi level effect or chemical effect by impurities would take part in degradation of HBTs. What should be clarified for suppression of device degradation? Is it impurity or intrinsic point defect? Is it on As sublattices or Ga sublattices? How they diffuse and react under thermal ground states or under electronic excitation? Which is enhanced, diffusivity or reaction? Is the mechanism recombination enhanced defect reaction (REDR) or charge state effect (CSE) [3]? We have plenty of questions to answer. In this chapter degradation ofHBTs is described, especially GaAs/AlGaAs HBTs with heavily carbon doped base layer. Here, two types of the device degradation are found, i.e., hydrogen-related degradation and carbon related
degradation. The mechanisms governing the degradation are discussed from the frame work of REDR and CSE. 1. HBT STRUCTURES AND THEIR DEGRADATION
HBTs are bipolar transistors whose emitter/base structures are hetetojunctions. Figure 1 shows a typical structure of n- p-n HBTs based on
DEVICE DEGRADATION
371
Emitter
Fig. 1. Typical structure of n-p-n HBTs based on GaAs/AIGaAs systems.
GaAs/AlGaAs systems, where the emitter is n-AlGaAs:Si, the base is p+ -GaAs:C, and the collector is undoped GaAs. Employment of the widegap emitter provides the following advantages over homojunction bipolar transistors: (1) Suppression of hole injection from the base layer into the emitter. (2) High current gains even at heavily doping of the base layer for decrease in the base resistance. This should allow high current gain at high current density. Recently, it has been reported that HBTs show degradation [2]. In the current voltage characteristics, so called Gummel plot, the base current increases and the collector current decreases by a high current injection for a long time. In Figure 2 typical examples of changes in Gummel plot is shown. This leads current gain decrease with time, i.e., degradation. It is interesting to note that the base current increase at low voltage was accompanied with current gain decrease at high voltage. In the following section, for simplifying the degradation behavior to extract fundamental essence of degradation physics, emitter/base junction diodes are used instead of real HBTs structures. In this diodes the base current increase is induced by forward biasing at elevated temperatures as shown later. Thus, the bias current increase at low bias voltage will be monitored for quantitative analysis of HBTs degradation. It is found that there are two factors dominating the degradation, hydrogen and carbon. In the next two sections, these two degradation factors are described more in detail.
K. WADA and H. FUSHIMI
372
1 o·2
--= ct
_u
10... 10-6 10-8
1 o·10
-
... ......
296 .,h ,
"" .. ""
!
"1-;
..g
~ "E
2
g1
0 (.)
0
(.)
0 o~---0.~2---0~.~4---0~.~6---0~.~~--~
2 1
0'-----'-----'-----'-----'--'---' 0
0.2
Depth (l!m) a)
0.4
0.6
Depth (l!m)
0.8
b)
Fig. 4. (a) Depth profiles of both hydrogen and hole concentrations in the as-grown state. The concentration profiles of both the hydrogen impurities and holes are slope-like. The hole concentration profile, however, is inverted from the hydrogen profile. This suggests that hydrogen play a dominant role in carbon deactivation; (b) Depth profiles of both hydrogen and hole concentrations after annealing at 450°C for 5 min. Both slope-like profiles, hydrogen and hole concentration, clearly disappear. This shows that hydrogen deactivates carbon.
Concentration of C-H complexes measured by Localized Vibrational Mode (LVM) Infrared Absorption Spectroscopy is not changed before and after 380°C annealing (Figure 5). Diffusivity of hydrogen estimated by employing simple square root Dt relation is in a good agreement with the data reported so far [ 16-19]. This is shown in Figure 6. This is further confirmed in Section 3.2. The fact that interstitial hydrogen donors do not form complexes with carbon acceptors suggests that there should be a reaction barrier between interstitial hydrogen donors and carbon acceptors. The barrier is high enough at temperatures below 450°C where interstitial hydrogen donors are to be introduced. Recently Stockman and others reported annealing temperature dependence of hole concentration of p+ -GaAs:C [20]. Their samples were post-growth annealed in the MOVPE furnace at temperatures between 280°C and 440°C for 5 min. Hole increased starts at 320°C and finished at 400°C. It is strongly suggestive that hydrogen behavior they observed is of interstitial hydrogen donors, not of C-H complexes.
3.2.
C-H Complexes
In GaAs:C used in this chapter, carbon concentration is 7 x 10 19 cm- 3 , as shown in Figure 7. However, hole and hydrogen concentration after 450°C annealing in Figure4 is 3.5 x 10 19 cm- 3 and 2.5 x 10 19 cm- 3 . This indicates that hydrogen still remains in the epilayer. Indeed, further annealing at 530°C dramatically increases hole concentration to 7 x 10 19 cm- 3 which corresponds to carbon concentration. This increase is accompanied with
DEVICE DEGRADATION
375
C-H Complex
!
380"C, 5mln
as-grown
2740
2720
2700
2680
2660
2640
2620
2600
2580
2560
Wavenumber (em')
Fig. 5. LVM spectra relate to C-H complex in GaAs:C at 2643 cm- 1 before and after annealing. The concentration of C-H complexes is not changed before and after 380°C annealing.
10"9 .-------------------,
...c
0
-~ 10-11
8=10-12
0 This work • Zavada et al. + Pearton et al. .a. Rahbi et al. X Rahbi et al. 'Y Johonson et a!.
Cl)
-..:. . '
.. ,
"·..'~··~.
10 -14
'---L---'---'----''---'----''---'
1.4 1.6 1.8 2.0 2.2 2.4 2.6 2.8 1000/T (K" 1)
Fig. 6. The diffusion coefficients ofhydrogen in GaAs. The data are replotted from the previous reports [17-19].
376
K. WADA and H. FUSHIMI
.-. 8
C') I
[C)
E ()
Cll .,..
0 ,.. 6 .....
c
....c
0 ;
CIS
Cll
()
c 0 0
4
• as-grown
+ 380"C
.,. 420"C X 450"C
Cll
0 0 ::z::
0
A
480"C
• soo·c • 530"C
10 20 30 40 50 60 70 Annealing Time (min)
Fig. 7. Hole concentration changes due to annealing at temperatures between 380°C and 530°C obtained by Hall effect measurements. The hole concentration abruptly increases within 5 min and then the increasing rate becomes slow; the rapid process and the slow process. There should be at least two mechanisms dominating the hole concentration.
decrease in LVM peak (2643 em -t) intensity of C-H complexes, indicating dissociation of C-H complexes. Thus, the hole increase is due to hydrogen dissociation. However, there are two-hole recovery stages in Figure 7: slow and rapid recovery. The slow recovery is due to decomposition of C-H complexes and the fast recovery is to isolated hydrogen interstitials. This is confirmed by Hall effect measurements. Figure 8 shows hole mobility dependence on hole concentration with theoretical prediction by Walukiewicz [22]. It is clear that the samples without annealing and annealed at low temperatures have mobility lower than the prediction. These samples are in a state of rapid recovery. The samples annealed at temperatures higher than 450°C have mobility corresponding to the prediction. These samples are in the slow recovery stage. Thus, it is evidently shown that the sample in the rapid recovery stage contains ionized hydrogen donors, while those in a slow recovery stage do not. This is confirmed by LVM FTIR. The absorbance intensity due to C-H complexes exponentially decreases with annealing time at various temperatures, as shown in Figure 9. The rate constants are identical to those of hole concentration increase shown in Figure 7. In other words, carrier reduction mechanism by hydrogen is neutralization of carbon acceptor, i.e., C-H complex formation in the samples in the slow recovery
377
DEVICE DEGRADATION
-J!
140
- - Walukiewicz • as-grown + 380"C T 420"C
0
E (.)
>-
:!:::::
.c
120
C1)
0
450"C 480"C
•
530"C
X
• soo·c
100
0
:E
.to.
•
80
First Region Second Region
:l:
60
--H-·
0
2 4 6 8 10 Hole Concentration (1 0 19 cm"3 )
Fig. 8. Relation between hole concentration and mobility at room temperature. Solid curve is the theoretical calculation by Walukiewicz [23]. This calculation was done under assumption of no compensation. These data are divided into two regions. The samples with the flat profiles of hydrogen concentration are in the slow process and the samples with the slope-like profiles of hydrogen concentration are in the rapid process. This shows that hydrogen showing the slope-like profiles acts as a donor.
-
....•
:I
cU
... X
•
>-
as-grown 420 oc 450 oc 480 oc 500 oc
1 o·2 f·-7 . ·;~·:-~> "iii 10 3 c
... ...c
•
G)
.J Q.
• 10 2 10 ·11
Fig. 32.
10·10 Lifetime (sec)
10"9
Relation between the luminescence lifetime and the PL intensity.
DEVICE DEGRADATION
399
..
>-
..
·~ 0.1 Cl)
.5
•
.J
c.
Y
+ • •
580'C 600'C 650'C 680'C 700'C
•
0.01~----~------~----~
0.1
Fig. 33.
1
10
Annealing Time (min)
100
PL intensity decrease with annealing time.
""':"
100~====~----------, • 580'C Y 600'C
:I
ni
~
..
10
'iii c
:=:~.~
Cl)
c
.J
e: ,...
1
0.1L------L----~~----~
0.1
1
10
100
Annealing Time (min) Fig. 34. The increase in recombination center by high-temperature annealing.
K.
400
WADA and H. FUSHIMI
centers do not increase, which is probably due to pre-existing recombination centers. In addition, at 700°C hole concentration saturates within I min while PL intensity keeps decreasing after I min. T,his concludes that defects or defect reactions responsible for the hole decreases is not the same as those for recombination centers. In other words, the Frenkel defect formation is over within 1 min at 700°C, then, recombination centers are dominantly formed. This can be understood by assuming that defects through the Frenkel defect formation mechanism are used to form recombination centers. It can be said that recombination centers are secondary defects, not primary defects. The candidates for the recombination centers are discussed as follows. As is described above, it can be assumed that using defects in terms of the Frenkel defect formation would form recombination centers. Following this assumption, the possible reactions are: CAs+ ct CAs+
¢>
vts #
ct+ + v,ts + 4e-
(17)
(2C;)+, 0
{VAsCAs) •
#CAs"
(18) (19)
The reaction (19) should be excluded, since this reaction is the reverse reaction of the reaction (9). If this is the case, carbon on the As sublattices must act as a recombination center, which is not plausible. Accordingly, dicarbon interstitials and/or complexes of carbon interstitials and As vacancies would be recombination centers. Indeed di-carbon interstitials has been experimentally confirmed [44, 45] and theoretically predicted to be favorable [35]. Figure 35 illustrates a di-carbon interstitial theoretically predicted, i.e., (I 00) split interstitial. C; + C;
¢>
2C;.
(20)
2C; + C;
¢>
3C;.
(21)
Here, 2C; denotes a di-carbon interstitial, 3C; a tri-carbon interstitial. Formation rate and concentration of 2C; can be expressed by d[2C;] ------;u-
=K 1 [C;)
[2C;] =
(LI
2 K
(K-J
+ K2[C;])
+ Kz •
· [2C;]) · [2C;).
[C;] 2 · ( 1- exp(LI + K2 · [C;] ·
(22)
t)). (23)
Based on this expression, the concentration of 2C; saturates with time at the concentration of [2C·] I 1--+00 -
[C; f + K2 · [Ci ]) •
K! . (
K-J
(24)
DEVICE DEGRADATION
401
[1 00]
i Ga Fig. 35. Illustrates adi-carbon interstitial theoretically predicted. This illustrates is (100) split interstitial.
and the initial formation rate is proportional to time: [2C;]t-+O =
KJ.
[C;] 2 . t,
(25)
In fact Figure 31 shows defect concentration is proportional to annealing time in the initial stage and shows its saturation as predicted by these equations. This is strongly suggestive that 2C; would act as recombination centers. In order to further confirm the difference between centers for hole decrease and for recombination centers, rate constants of hole and of PL decreases are compared each other. As shown in Figure 36, the activation energy is about 2 e V for the hole decrease. On the other, it is 3.8 eV for PL intensity decrease, as shown in Figure 37. This agrees well with the conclusion that decrease in PL intensity is not due to hole decrease. Here it is worth to compare degradation due to hydrogen and to carbon, in order to focus the minority carrier injection effect. In the degradation due to hydrogen, HI. Decomposition of C-H complexes in terms of charge state effect (CSE) due to Fermi level effect in terms of minority carrier injection. H2. Aggregation of hydrogen interstitials released to form platelets, here, hydrogen diffusion should be enhanced most likely by charge state effect, less likely by recombination enhanced defect reaction (REDR). It has not been experimentally confirmed.
402
K. WADA and H. FUSHIMI
10 '2 . - - - - - - - - - - - - - .
•
•
10~~---~---~
1
1.1
1000/T
1.2
(K'1)
Fig. 36. The activation energy for the hole decrease. The activation energy is 2.0 eV.
10 2 , . . . - - - - - - - - - - ,
10°~------~--------~
1
1.2
Fig. 37. The activation energy for PL intensity decrease. The activation energy is 3.8 e V.
DEVICE DEGRADATION
403
H3. Formation of minority carrier recombination paths to degrade devices. In the degradation due to carbon related defects as follows. C I. Carbon interstitials are formed in terms of the Frenkel defect formation mechanism by high temperature annealing. This is purely thermal effect. C2. Aggregation of carbon interstitials to form microprecipitates. In this process it is unclear whether or not diffusion of carbon interstitials is enhanced by minority-carrier injection and, if enhanced, what mechanism is working behind diffusion enhancement of carbon interstitials. C3. Formation of minority carrier recombination paths to degrade devices. Both H3 and C3 processes are unclear, but it is not possible to discuss the formation mechanism of minority carrier recombination paths in this section. Now, the C2 process is focused.
5.2.
Carbon Related Degradation
Here, before we get into these topics, we propose new concept for device degradation which is related to point defects. The point defects generation can be written by dN -=kN dt ' N =No exp(k · t),
(26)
(27)
where N denotes point defect concentration, No initial point defect concentration, k rate constant, t times. This idea has an essential problem. The defect density ceaselessly increases whereas in reality it saturates in most cases. This is obvious, because source of point defects is not unlimited. In the hydrogen case, hydrogen concentration is mid 10 19 cm- 3 . A new way to formulate the saturation kinetics is needed. In the present chapter, the following rate equation is employed to express the saturation. dN
dt Under initial condition t
= k(N00
-
N),
(28)
= 0, N(t) = 0, the solution can be written by
N
=N
00
{I- exp(-k · t)},
(29)
denotes saturation of defect increase. N can be approximated to be in initial stage. Based on this model, we discuss the increase in the leakage current. Figure 38 shows leakage current increase by minority-carrier injection. This results shows that the increase in the leakage current saturate. Figure 39 shows
404
K. WADA and H. FUSHIMI
--
1 o-s
.----------------. 2 M. C. 1: 200'C, 1.3 kA/cm Measurement at 26'C
cs:
• soo·c
o 650'C
1 o-9 ~-------~------L-----~ 1 10 100 1000 Injection Time (hr) Fig. 38. Injection time dependence of the leakage current at 0.7 V at room temperature. Injection minority carrier density is 1.3 kA/cm 2 at 200°C. The increase in the leakage current saturate.
1 o·6
--.. o·