Day trading with short term price patterns and opening range breakout 0934380171
1,586 82 12MB
English Pages 298 Year 1990
Recommend Papers


![Long-Term Secrets to Short-Term Trading [1 ed.]
0471297224, 9780471297222](https://ebin.pub/img/200x200/long-term-secrets-to-short-term-trading-1nbsped-0471297224-9780471297222.jpg)

- Author / Uploaded
- Toby Crabel
File loading please wait...
Citation preview
DAY TRADING WITH SHORT TERM
PRICE PATTERNS AND OPENING RANGE BREAKOUT By TOBYCRABEL
~~r.w."'
TRADERS PRESS, INC. P.O. Box 10344 Greenville, S.C. 29603
'~
Copyright© 1990 by Toby Crabel. All rights reserved. No part of this publication may be reproduced in any form or by any means without the permission of the publisher. Publications of Traders Press, Inc,: Commodity Spreads: A Historical Chart Perspective {Dobson) The Trading Rule That Can Make You Rich• {Dobson) Viewpoints of a Commodity Trader (Longstreet) Commodities: A Chart Anthology (Dobson) Profitable Grain Trading (Ainsworth) A Complete Guide to Trading Profits {Paris) Traders Guide to Technical Analysis {Hardy) · The Professional Commodity Trader {Kroll) Jesse Uvermore: Speculator-King (Sarnoff) Understanding Fibonacci Numbers (Dobson) Wall Street Ventures & Adventures through Forty Years (Wyckoff) Winning Market Systems {Appel) Commodity Spreads (Smith) How to Trade in Stocks {Livermore) Stock Market Trading Systems (Appel & Hitschler) Study Helps in Point and Figure Technique (Wheelan) Commodity Spreads: Analysis, Selection and Trading Techniques (Smith) Comparison of Twelve Technical Trading Systems (Lukac, Brorsen, & Irwin) Day Trading with Short Term Price Patterns and Opening Range Breakout (Crabel) Understanding Bollinger Bands (Dobson) Reminiscences of a Stock Operator (Lefevre)
ISBN: 0-934380-17-1
TRADERS PRFSS™
INCORPORATED P.O. BOX 6206 GREENVILLE, S.C. 29606
Books and Gifts for Investors and Traders
/1C/() .
'
DAY TRADING WITH SHORT TERM PRICE PATTERNS AND OPENING RANGE BREAKOUT
FOREWORD
The ·original and unique research by Toby Crabel in this book has come to be highly regarded as some of the most valuable and useful information available to the short-term futures trader. Legendary traders such as Linda Bradford Raschke who recognize its true value and incorporate the concepts herein into their own trading have wholeheartedly endorsed and recommended this book. The material will prove substantially more beneficial to the knowledgeable, experienced, and well-informed reader than to the inexperienced neophyte. Those who find themselves in this category should take this into account. TRADERS PRESS™ publishes a 56-page Traders Catalog which describes hundreds of books, tapes, courses, and gifts of interest to investors and traders. Write today for your free copy: Traders Press, Inc., P.O. Box 6206, Greenville, S.C. 29606.
Edward D. Dobson Greenville, S.C. November, 1994
MAR.KET ANALYTICS
INTRODUCTION HOW THIS BOOK DEVELOPED
This book began as a series of research reports presented in the Market Analytics Monthly Market Letter. The book is divided into five sections, titled 1) Opening Range Breakout. 2) Short Term Price Patterns. 3) Contraction and Expansion. 4) The Integration. 5) Other Useful Patterns. Each chapter appears in the original form of the research report. While I hope to have minimized any problems which may arise from the article format, the reader should note that there may still be certain redundancies and omissions which have gone uncorrected. THE FRAMEWORK
The purpose of my research is to determine tradable market tendencies. I say these are tendencies because as of yet I have not been able to determine full cause. I began with the premise that the market followed mechanical laws, but have since taken a more moderate view and will say only that there are some aspects of price action that are predictable and only within the context that we are not omniscient. In statistical testing, my purpose is to derive general principles, rather than specific applications. The tests are excellent quantificatons of price action, but they are incomplete, and the reader should apply _them to his trading in the context of his own baoader knowledge. · It should be noted that, though I have made extensive use of statistics, my focus is not on the rigorous application of stati~tical methods. As a trader, my purpose is to develop a framework for understanding the market. The statistics can provide an indication, but can only be integrated by an understanding of the market. It is this understanding, and not statistical tests for non-randomness, which is the best guide for analyzing the tests I have provided here. These tests have passed statistical analysis, but I have deliberately avoided including extensive digressions on such testing. OPENING RANGE BREAKOUT(ORB)
Opening range breakout is defined as a trade taken at a predetermined amount off the open •. It
I
MARKET ANALYTI~
should be noted that when I introduce this trading concept in Chapter One I use a mathematical technique, called the stretch, to determine the point of entry. In later testing you will notice that I use a constant value off the open rather than the stretch point. Experience has shown this to be a better method. As long as I used the same value throughout, I could generalize about market activity. In other words, all comparisons are made with similar values so as to develop a consistent context. Chapter Three, "Moves Off The Open", is very important as a starting point in the testing. This chapter provides a control group for comparison with all other tests. Here, I have conducted tests on trades taken on the indicated amounts off the open on any day that a move of that size occurred. Conclusions about other tests throughout the book should be reserved for a comparison with this control group. This will provide a better understanding of the testing. SHORT TERM PRICE PATTERNS A short term price pattern is an analysis of recent price action in terms of previous closes, openings, range size and moves off the open. They attempt to quantify market action so as to test for significant directional movement. This section was inspired by Arther Merrill's work conducted on the Dow Jones Industrial Index over a 20 year period from 1960 to 1980. He used closing prices only and tested all combinations with volume for each day. There are two main differences between my work and his. First, I have not included volume in my analysis. Second, I have found it to be much more fruitful to use direction of the open as the last piece of information in a pattern, rather than closing prices. In the futures market there i~ .actually a supply/demand battle taking place on 'the open, whereas the structure of the Dow Index mtkes this impossible. The price patterns allow us to take large amounts of information about the market and condense it into a workable unit. Market action can thus be tested. The tendencies found within the testing can then be used as a partial basis for taking action in the market place. CONTRACTION/EXPANSION that
II
The Contraction/Expansion Principle states the market is constantly changing from a
MARKET ANALYTICS
period of movement to a period of rest and back to a period of movement. This interchange between the phases of motion and rest is constantly taking place. It would seem that one phase is directly responsible for the other's existence, but has not been proven in the general case. The evidence in this book suggests strongly that this principle applies to the particular case of price action off the open. There is an explicit proof for this in the first chapter of this section, "The Principle of Contraction/Expansion," on pages 105-114. Along with chapter three, this chapter sets a framework for the rest of the book. INTEGRATION OF ORB, PRICE PATTERNS CONTRACTION/EXPANSION
The three concepts, ORB, price patterns, and contraction/expansion, provide the basic framework for viewing the market. However, their power as tools for trading can be multiplied by integrating them into one system. The combination of these three can capture the essential action of the marketplace. These categories can provide a logical dividing line between different types of price action. There is still work to be done, but this provides an excellent starting point. In this section, you will note a reference to daily bias. This is the present working application of the work in the book, the aspect of the work which is most helpful in day-to-day trading. If I were to summarize the outcome of my studies, it would be: daily bias. This is not meant to be a mechanical technique, but a tool for analyzing the actions of the market. OTHER PATTERNS OF INTEREST
The patterns which have previously been discussed are not the only ones which I have discovered. There have been many other pat~rns, which could be considered in the nature of side-roads. I have not found these t~·be as clearly applicable to the current work, and. thus have not yet developed these in full. These patterns can be quite valuable, and should provide a direction for future research and integration.
.
.
III
MAR.KET
ANALYTI~
•
IV
•
MARKET ANALYTI~
TABLE OP CONTENTS
SECTION' I OPENING RANGE BREAKOUT(ORB)
I.OPENING RANGE BREAKOUT I
1-8
2.0PENIN'G RANGE BREAKOUT II (EARLY ENTRY)
9-I4
3.MOVES AWAY PROM THE OPEN
15-26
4.PRICE ACTION OFF THE OPEN (CATTLE)
27-34
SECTION II SHORT TERM PRICE PATTERNS
5.PRICE PATTERN' STUDIES I (BONDS OPEN TO CLOSE)
35-40
6.PRICE PATTERN STUDIES II (BONDS CLOSE TO CLOSE)
41-44
7.PRICE PATTERN STUDIES III (BEANS OPEN TO CLOSE)
45-50
8.PRICE PATTERN STUDIES IV (CATTLE & S&P OPEN TO CLOSE)
5I-54
9.PRICE PATTERN STUDIES V (CLOSE TO OPEN)
55-58
IO.RANGE EXPANSION (BONDS) II.RANGE EXPANSION (S&P,BEANS and CATTLE) 12.PRICE PATTERN STUDIES VIII (OPEN TO CLOSE AND RANGE EXPANSION OTHER MARKETS) 13.TWO DAY PATTERNS 14.THREE DAY PATTERNS
'59-66
, '67-76
77-96 97-100 IOl-104
v
MARKET ANALYTI~
SECTION III CONTRACTION/EXPANSION
15.THE PRINCIPLE OF CONTRACTION/ EXPANSION
105-114
16.INSIDE DAY (S&P)
115-122
17.INSIDE DAY AND ORB
123-130
18.DOJI AND NR
131-138
19.DOJI
139-142
20.NARROW RANGE 4 (NR4)
143-148
21.DOJI AND NR4
149-152
22.INSIDE DAY AND NR4
153-158
23.NARROW RANGE 7 (NR7)
159-162
24.TWO BAR NR
163-176
25.THREE BAR NR
177-190
SECTION IV INTEGRATION OF ORB, PRICE PATTERNS AND CONTRACTION/EXPANSION
26.TWO DAY PATTERNS AND ORB WITH CONTRACTION/EXPANSION
' 191-206
27.THREE DAY PATTERNS AND ORB WITH CONTRACTION/EXPANSION
·.207-218
28.DAILY BIAS (GOLD)
VI
I. 219-226
MARKET ANALYTICS
SECTION V OTHER PRICE PATTERNS
29.FIVE SEGMENT STUDY AND ORB
227-234
30.THREE SEGMENT STUDY AND ORB
235-242
31.S&P GAPS AND ORB
243-248
32.GAPS AND ORB
249-260
33.UPTHRUST AND SPRING REVERSAL
261-270
34.BEAR HOOK
271-276
35.BULL HOOK
277-280
36.GLOSSARY
281-287
I
I.
VII
MARKET ANALYTI~
----- . ,
VIII
MARKET ANALYTI~
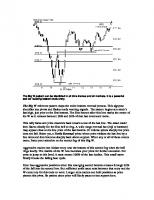
OPENING RANGE BREAKOUT (ORB) An Opening Range Breakout (hereafter called ORB) is a trade taken at a predetermined amount above or below the opening range. When the predetermined amount (the stretch) is computed, a buy stop is placed that amount above the high of the opening range and a sell stop is placed the same amount below the low of the opening range. The first stop that is traded is the position and the other stop is used as a protective stop. The Stretch is determined by looking at the previous ten days and averaging the sum of the differences between the open for each day and the closest extreme to the open on each day. There are days when a trade in only one direction is taken, this is called an Opening Range Breakout Preference (ORBP). Usually this is done in a market with a strong bias in one direction or just after a clear supply or demand indication. The procedure is similar to the ORB but the only order entered is the stop in the direction of the entry. The protective stop is entered only after the trade has been entered. One qualification to this is if the market trades to the stretch in the opposite direction first; the ORBP is nullified and the resting order is cancelled. This requires you to moniter the market during the session. Intraday market monitoring is not a sacrifice by any means and serves to enhance the system in most cases. The ORB is effective after inside days that have a smaller daily range than the previous four or five days and for that matter after any day that has a daily range less than the previous six days (NR7) whether an inside day or not. Hook days also tend to precede big moves in one direction. A Hook day is any day that opens above or below the previous day's high or low then proceeds to reverse the previous day's close but does so with a narrowing daily range relative to the previous day. The March Copper chart marked Hook, NR7 and IDnr4 displays examples of all the above mentioned patterns. Inside days with the narrowest range in four days (IDnr4) occur at c,e,g,i,n,b-)- anii t. NR7's occur at a,d,f,g,h,j,m,n,p, ands. Hook days are b,q, and r. Notice the proximity of the next day's open to one of the extremes for that day and the general tendency of the close of the same day to be at the opposite extreme. The ORBP provides an effective trade entry at times of a clear bias in one direction. In
1
MARKET ANALYTICS
.particular, a running market when defined provides a very clear bias. On any inside day the ORBP should be taken. Inside days act as springboards for an immediate continuation in the direction of the run. The July Bean Oil Chart displays a running market between numbers one and two. Within that run inside days a thru e all resulted in successful ORB's with the open on or near the low of the session in each case. Direction is not as predictable at ID days; f., g. and h. but the ORB the following day in each case provides an excellent entry. A gap in the direction of the run is a strong indication of continuation and an ORBP can be taken in the direction of the gap with an overnight position held if a big day follows. The October Sugar Chart shows three gaps (a,b,c) within a very defined upward run. Note the tendency for the open to act as the low of the day in each case. If an ORB to the downside had occurred, in this case, no trade would have been taken. Logically, any of the patterns preceding entry mentioned for the ORB can be utilized in an ORBP when the bias is clear. Upthrust/Springs, Reversal Gaps, or any sharp reversal should be followed up with an ORBP in the direction of the reversal for at least two days afterwards if it confirms the intermediate trend. The Nov. Bean Chart displays upthrusts at 1,3 and 5 and Springs at 2,4 and 6. Note openings the days after the Springs and the marked tendency for them to occur near one extreme of the day. The upthrusts were not as successful. A clear upward bias did exist. Again, this is most effective after an inside day or NR7s'. In general the earlier in the session the entry is taken the better the chances for success. In fact , the ideal is an entry within the first ten minutes of the session. In that case an immediate continuation in the direction of the breakout is likely. When you get action like that the protective stop can be moved to break even very quickly and the trade is free. The more time that passes between the open an~ trad~ entry the lower the probability of success.\Ad]ust the size of your position downward as the day qoes on. The worst entry is just before the close when time is running out and it is difficult to realize a profit. It should be kept in mind that the objective of these entry techniques is to establish a position for a two to three day run, but this can be considered only if a substantial profit is realized by the end of the session. After the trade is entered the clock starts
2
MARKET ANALYTICS
HIGH 127.80 on LOW 60.70 on 148AR RSI• 42.39 UP AVG• 1.08
ON AVG•
12131187 08118188 14 SAR STO•• 30.72 Slow %0 • 39.27 1.48 Slow %K • 29.64 AS OF 02/25188
MARCH 88 COPPER Contract 25,000 Lbs. Trading: 8:25-1 :OO Central Min. Tick: 5e-$12.50 50 points per grid unit
Ctr. Exp: Mar 29
·········=······
. . :.. -132
Option Exp: Feb 12
. :~
·: .·-unt above or below the open of a given day is called an Opening Range Breakout. This report covers trades of this sort on the day following an NR 4 pattern. NR 4 is defined as a day with a daily range that is narrower than the previous three days daily ranges compared individually. Diagram A and B demonstrates the NR 4 and the Opening Range Breakout technique implemented on the day following the NR 4. NR 4's occur in both diagrams on Day 2 with ORB's following on Day 1. As in previous studies the hypothesis is that the NR 4 tends to precede trend day activity and consequently successful Opening Range Breakouts. The Table titled Opening Range Breakout (NR 4) tests this hypothesis (Table A). It displays results for four markets during varying tine periods. There are four tests per market, with the only difference between them the point of entry above or below the open. After you have familiarized yourself with ORB in the Market Concepts and Definitions section, you should find this to be self-explanatory. Trades were assumed to be entered on stop at the indicated level with exit on the sane day's closing. A chart labeled NR 4 (October 1 88 Cattle) is included to display_ the NR 4. The day's action following the NR 4 and the position of the open of that day relative to the high or low is instructive. NR4 's are displayed on the days indicated by letters. The tests on Table A were consistent throughout for all the markets. No tests exceeded 7C/%. All tests but two show 6C/% or better. The best results occur in the Bean market. Cattle shows surprising success on entry 25 points off the open in either direction. It has been my observation that the Cattle is not as reliable as the other markets with this technique. The number of trades was high indicating the frequency of the pattern. This pattern and a resulting move off the open appears on average once in every 8-10 market days. The win/loss ratio is not that good. Gross profits were high because of the frequency of the pattern. The canparison of NR 4 with any day shows a general increase in reliability for ORB after the NR 4. This canparison is demonstrated in Table B. In 15 of 16 canparisons the NR 4 showed a higher percentage of winning trades than the control group. The only exception was a buy 50 points above the open in the Cattle market. In that case, Cattle tested 63% after an NR 4 and 65% on any day. This is very strong evidence that NR 4' s have some immediate relationship with trending action. With results as consistent as this it is safe to attribute cause of trending to the NR 4. Obviously this is not an exclusive
l43
MARKET ANALYTICS
attribute and other patterns have been indicated to have a causal effect. The general principle that is appearing again and again throughout the testing is contraction/expansion. There is a relationship between any narrow, directionless day with trending action on the following day. If one observes a bar chart it becomes apparent that this contraction occurs almost always just before a trend move. There are times when a trend move takes place without contraction. For instance, in the case of a 2-3 day run but in most cases the first day out in a run is usually preceded by a noticeable contraction. A word of warning about the tests. Gross profits are not supported of system trades and when commission and slippage is added profits are reduced dramatically. My intention is not to provide a close-end system. I intend only to define the market's nature using these elementary statistical techniques. If a high percentage system (75%) is found with a win/loss ratio of over 2 : 1, a mechanical trade can be considered.
144
p
MARKET ANALYTICS
13
OPEN[NG RANGE BREAKOUT NO. TRADES
{HR 4)
:PROFIT ~ AVG.LOSS II Hf/LOSS - RATIC!.
GROSS PROFITS
148
64:
S418
S366
1.14
S20,346
OPEN PLUS 8 TICS
263
63
416
444
.93
26,916
OPEN MINUS 8 TICS
289
64
424
403
1.05
36,596
OPEN MINUS 16 TICS
162
65
402
409
.98
19 ,779
S+P OPEN PLUS 160 PTS. 82-88 OPEN PLUS 80 PTS.
145
62
Sl,093
Sl,021
1.07
42,224
233
57
1,060
865
1.22
54,550
OPEN MINUS 80 PTS.
231
59
790
961
.82
16,195
OPEN MINUS 150 PTS.
140
61
750
l, 116
.Si
2,395
OPE:t PLUS 10 CE1HS
204
62
5321
S458
.70
4,712
OPEN PLUS 5 crnTs
416
66
316
375
.34
32,625
OPEN MINUS 5 CENTS
400
63
417
313
1.33
58,956
OPEN MINUS 10 CENTS
183
68
470
304
1.54
40,406
CATTLE OPEN PLUS 50 PTS.
329
53
Sl42
5132
1.07
12,948
OPEN PLUS 25 PTS.
606
61
164
l:o
1. 09
24,492
OPEN MINUS 25 PTS.
607
60
159
141
1.12
22,702
OPEN MINUS 50 PTS.
315
64
151
146
1. 03
14,'154
BONDS OPEN PLUS 16 TICS 78-86
BEANS
7o-se
l0-88-
!!.R_4: The nar!"owest daily range !"elative to the previous 3 day's daily ranges compa!"ed individually.
c
I
NR 4 \
r
BUY ("
•\ OPEN
~I
~
~
OREN
NR 4
:-.....t:. __
I
I
f
r
c:;
4
1
A:
An NR4 (2) with an Opening Range 3reakout up (1). After the NR4 on Day 2 the market opens on Day 1 and ra 11 i es predetermined amount above the open. A Juy is made on a stop at the predetermined level with an exit on the close of Day l. The l"esults are shown in the rable provide&.
iJ l A(,'RA/!/ 8:
An NR4 (2) '"ith an Ooening Range Breakout ,JO'"" (1). After the NR4 on Day 2 the market opens on Day : and declines a predetermined amount ~elow the ooen. A sale is made on a stop at the predetermined le~el with an exit on the close of
iJIAES
AVG. WIN
AVG.
LOSS
GROSS
P~nrs
JPEN PWS 16 TICS
5
B
56\
3..
$1.... 3
$1358
$ ..156
OPEN PWS 16 TICS
2
B
56
3..
1103
112..
..09..
OPEN PWS 16 TICS
l
B
62
3..
791
0....
82 ..6
OPEN PWS 16 TICS
0
B
76
311-
.. 32
605
6..06
OPEN PWS 8 TICS
5
..9
57
1..29
1323
1663
OPEN PWS 8 TICS
2
s s
56
57
901
11..8
121
OPEN PWS 8 TICS
l
B
5..
57
796
616
7813
OPEN PWS 8 TICS
0
B
68
57
..83
611
787..
OPEN MINUS 8 TICS
0
s s s s
75
67
.. 23
384
15,085
66
67
670
577
16,221
64
67
971
852
21,285
6..
67
1363
1152
30,96..
79
..2
350
330
8584
62
42
687
285
13,311
62
42
llll
875
14,901
64
42
1546
1381
21,526
n:cs
l
OPEN MINUS 8 TICS
2
OPEN MINUS 8 TICS
5
OPEN MINUS 8
o:tu=
1
S 16 TICS
2
OPEN MINUS 16 TICS
5
OPEN MINUS 16 TICS
OPEN
0
s s s s
169
MAllKET ANALYTia
SOYBEANS 1970-88 GROSS NO. OF NO. OF DAYS BUY/SEIL (B) (S) % PROFIT TRADES AVG. WIN AVG. lDSS PROFTI'S IN TRADE 53%
60
$1403
$1057
$15,300
2
s s
45
60
330
264
187
OPEN PLUS 10 CENTS
1
B
50
60
587
561
775
OPEN PLUS 10 CENTS
0
s
45
60
330
264
187
OPEN PLUS 5 CENTS
5
B
56
123
1214
1096
23,525
OPEN PLUS 5 CENTS
2
B
57
123
753
620
20 ,618
OPEN PLUS 5 CENTS
1
B
60
123
540
486
15,662
OPEN PLUS 5 CENTS
0
B
70
123
262
390
8075
OPEN MINUS 5 CENTS
0
68
107
331
235
17,281
OPEN MINUS 5 CENTS
1
64
107
648
420
28, 787
OPEN MINUS 5 CENTS
2
68
107
873
581
28,000
OPEN MINUS 5 CENTS
5
s s s s
57
107
1486
734
56 ,925
OPEN MINUS 10 CENTS
0
76
52
339
321
8700
67
52
777
340
21,437
56
52
1182
482
23,212
62
52
1903
675
47 ,412
OPEN PLUS 10 CENTS
5
OPEN PLUS 10 CENTS
OPEN MINUS 10 CENTS
;,-
OPEN MINUS 10 CENTS
5
OPEN MINUS 10 CENTS
s s s s
170
MAR.KET ANALYTIQ
D
CATI'LE 197o-88 !I). OF 'l'!!ADES
GROSS
IN TRADE
llJY/SELL CB) CS>
\ PROFrr
OPEN PUJS SO PIS.
s
B
SI+\
9S
$S84
$52'+
$ 6728
OPEN PUJS SO PIS.
2
B
S8
95
38'+
339
7S80
OPEN PUJS SO PIS.
1
B
6"
9S
26'+
280
65S2
OPEN PUJS 50 PIS.
0
B
69
95
117
lSl
3364
OPEN PU.JS 25 PIS.
s
B
55
162
S02
556
4160
OfEN PUJS 2S PIS.
2
0
S2
·.i.62
363
3SS
3Sl2
162
285
290
5332
l'«l. OF !lf.YS
AVG. WDI
AVG. LOSS
PROFrrS
OPEN PUJS 25 P1'S.
1
B
S6
OPEN PUJS 25 P1'S.
0
B
61
162
158
174
4664
OPEN MIWS 2S PTS.
0
58
1'+6
149
13S
4512
OPEN MIWS 25 i"I'S.
1
57
1'+6
311
2Sl
9972
HJllJs 25 Pl'S.
2
59
146
373
33'+
12,088
OPEN MIWS 25 PTS.
s
s s s s
S3
1'+6
641
516
l'+,927
OPEN MI?IJS 50 Pl'S.
0
SS
80
1'+0
139
...180
OPEN MIWS SO PI'S.
1
s s s s
Sl
80
338
211
5619 6220 10,368
OPEN
OPEN MIWS SO PTS. OPEN MIWS SO P1'S.
2
SI+
80
377
270
56
80
684
583
l71
MAR.KET ANALYTICS
EUIDOOLLARS 1984 - 89
NO. OF DAYS
IN TRADE
172
BUY/SELL (B) (S)
00. OF
%PROFIT TRADES AVG. WIN AVG. LOSS
OPEN PLUS
8 TICS
5
B
63%
27
OPEN PLUS
8 TICS
2
B
78
27
OPEN PLUS
8 TICS
1
B
67
OPEN PWS
8 TICS
0
B
OPEN PLUS
4 TICS
5
OPEN PLUS
4 TICS
OPEN PWS
574
G~S
PROFIT
460
$ 5174
347
445
4624
27
280
272
2599
67
27
177
108
2249
B
64
59
590
463
10824
2
B
68
59
336
411
5649
4 TICS
1
B
64
59
252
278
3824
OPEN PLUS
4 TICS
0
B
66
59
150
123
3399
OPEN MINUS
4 TICS
0
s
61
56
153
131
2324
OPEN MINIB
4 TICS
1
s
61
56
182
247
4399
OPEN MINUS
4 TICS
2
s
62
56
280
330
2849
OPEN MINIB
4 TICS
5
B
54
56
479
346
5099
OPEN MINUS
8 TICS
(
0
s
76
21
168
145
1974
OPEN MINIB
8 TICS
\
1
s
71
21
261
141
3074
OPEN MINUS
8 TICS
2
s
57
21
318
230
1749
OPEN MINIB
8 TICS
5
s
56
21
484
359
1974
$
$
MAR.KET ANALYTICS
s NO. OF DAYS
IN TRADE
& p 1982 - 88
BUY/SELL (B) (S)
NO. OF
%PROFIT TRADES
GOOSS AVG. WIN
AVG. LOSS
PROFIT
OPlll PLUS
180 PTS.
5
B
61%
28
$ 2535
$ 1397
$ 27724
OPEN PWS
180 PTS.
2
B
64
28
1536
1285
14799
OPlll PLUS
180 PTS.
1
B
61
28
1183
777
11224
OPEN PWS
180 PTS.
0
B
75
28
721
460
11924
OPEN PLUS
80 PTS.
5
B
49
51
2296
1800
10600
OPEN PWS
80 PTS.
2
B
61
51
1408
1465
14375
OPEN PLUS
80 PTS.
1
B
51
51
1232
1060
5520
OPEN PWS
80 PTS.
0
B
59
51
839
752
9375
OPEN MINUS
80 PTS.
0
s
58
67
812
4033
20375
OPEN MINUS
80 PTS.
1
s
60
67
1128
1371
8125
OPEN MINUS
80 PTS.
2
s
55
67
1228
1525
299
OPEN MINUS
80 PTS.
5
B
52
67
2235
1598
27099.
OPEN MINUS
160 PTS.
0
s
62
45
635
475
9724
OPEN MINUS
160 PTS.
1
s
51
45
1222
1207
1549
OPEN MINUS
160 PTS.
2
B
53
45
1533
1378
7850
O~EN
160 Pl'S.
5
B
51
45
2659
1580
26275
I
MINUS
I
173
MAR.KET ANALYTIQ
JAPANESE YEN 1979 - 88
IN TRADE
BUY/SEU. (B) (S)
NO. OF Il!l.YS
GimS PmFIT
OPEN PLUS
18 TICS
s
B
Sl%
39
$ 11S3
$ S83
$12S37
OPEN PWS
18 TICS
2
B
S9
39
88S
S97
3899
PllJS 18 TICS
1
B
S9
39
491
314
6274
OPEN PWS
18 TICS
0
B
74
39
246
201
5124
PllJS
9 TICS
s
B
43
83
1007
611
8600
OPEN PWS
9 TICS
2
B
S8
83
S04
609
2862
PllJS
9 TICS
1
B
S4
83
410
4SO
1387
OPEN PLUS
9 TICS
0
B
S4
83
248
211
3137
MINUS
9 TICS
0
62
87
lSS
206
1575
OPEN MINUS
9 TICS
1
SS
87
418
437
3012
OPEN
MINUS
9 TICS
2
s s s
60
87
4S8
61S
2325
OPEN
MINUS
9 TICS
s
B
49
87
870
600
11012
OPEN
MINUS 18 TICS
0
S2
44
17S
141
1850
OPEN
MINUS 18 TICS
1
s s
64
44
34S
S96
124
. ~ MINUS 18 TICS
2
B
43
44
703
430
2612
MINUS 18 TICS
s
B
61
44
92S
742
12350
OPEN
OPEN
OPEN
OPEN
OPEN
174
NO. OF
%PRJF1T TRADES AVG. WIN AVG. WSS
MARKET ANALYTICS
CRUDE OIL 1983 - 89
NO. OF DAYS
IN TRADE
BUY/SEU. (B) (S)
'00. OF %PROFIT TRADES
OPEN PLUS
20 TICS
5
B
67%
21
OPEN PllJS
20 TICS
2
B
62
21
OPEN PLUS
20 TICS
1
B
62
OPEN PllJS 20 TICS
0
B
OPEN PLUS
10 TICS
5
OPEN PllJS 10 TICS
Gross AVG. WIN
463
AVG. WSS
POOFIT
637
$ 2029
286
267
1580
21
288
122
2749
76
21
182
133
1219
B
64
44
454
469
5209
2
B
61
44
259
402
159
OPEN PLUS 10 TICS
1
B
70
44
227
290
3269
OPEN PLUS 10 TICS
0
B
66
44
143
154
1849
OPEN MINUS 10 TICS
0
s
73
33
159
164
2339
OPEN MINUS 10 TICS
1
s
70
33
345
311
4839
OPEN MINUS 10 TICS
2
s
76
33
404
225
8299
OPEN MINUS 10 TICS
5
s
70
33
566
749
5539
OPEN MINUS 20 TICS
0
s
69
16
191
76
1729
OPEN MINUS 20 TICS
1
s
69
16
381
390
2250
OPEN MINUS 20 TICS
2
s
81
16
406
250
4540
OPEN MINUS 20 TICS
5
s
56
16
593
367
2770
$
$
175
OOLD 1975 - 88
ti>. OF DAYS
IN TRADE
tl>.OF %PRJFIT TRADES
GR:SS
AVG. WIN
AVG. LOSS
mJFIT
OPEN PIDS
$2.00
5
s
47%
76
$ 1508
$ 1244
$ 4525
OPEN PIDS
$2.00
2
B
59
76
773
806
9835
OPEN PIDS
$2.00
1
B
54
76
755
557
11475
OPEN PUJS
$2.00
0
B
62
76
367
388
6005
OPEN PIDS
$1.00
5
s
54
148
1196
1017
26545
OPEN PLUS
$1.00
2
s
52
148
670
704
1685
OPEN PLUS
$1.00
1
B
45
148
664
517
1435
OPEN PLUS
$1.00
0
s
53
148
357
327
5594
OPEN MINUS
$1.00
0
s
59
155
465
261
25570
OPEN MINUS
$1.00
1
s
59
155
609
515
22479
OPEN MINUS
$1.00
2
s
54
155
814
567
28139
OPEN MINUS
$1.00
5
s
57
155
1409
922
62240
OPEN MINUS
$2.00
0
66
103
507
314
23495
OPEN MINUS
$2.00
1
s s
57
103
720
631
14705
OPEN MINUS
$2.00
2
s
60
103
892
748
24635
OPEN MINtJS
$2.00
5
s
62
103
1679
1087
61195
\
176
BUY/SEU. (B) (S)
MAR.KET ANALYTICS
THE FORMATION OF MARKET CONCEPTS: 3 Bar NR and ORB
In this report I have introduced another contraction pattern called 3 Bar NR. Three Bar NR is defined as the narrowest 3 day range relative to any 3 day in range within the previous 20 market days. Trade was assumed on a stop on either side of the opening range the day after the pattern formed (ORB). The trade had four different exit points as follows, the close of the same day, the next days close, the close 2 days out and the close 5 days out. The pattern is exhibited in the chart marked 3barNR. The results of the tests on 8 markets are shov.n in table A thru I. The 3 Bar NR is a market concept that defines a period of rest (contraction). Tests suggest that after a defined period of rest persistent trends follow (expansion). This idea is a derivative of Wyckoff's Last point of Supply and Last point of Support. The concept that I have introduced quantifies the Contraction/Expansion principle and the above Wyckoff concepts and allows for objective testing. The psychological implications of a pattern of this type is interesting. In general, as the pattern is forming speculators are absent. In fact they tend to ignore a market that has contracted to such an extent. This is the point where the market is most ready to move and presents an explosive opportunity. It is ironic that so little initial interest is given to the move out of this pattern. It is well-trained traders that recognize these opportunities and provide for the force that takes the market into a trend. I suggest that the patterns be looked at very carefully as they form in order to anticipate the upcoming action. Again the quantification of this pattern allows you to do just that. The tests show several things 1) That there is a marked tendency for the market to trend intraday the day after the pattern has formed 2) That the overall trend of the market has an impact on the patterns ability to continue the trend 2 to 5 days after the pattern has formed. This is different from the 2 Bar NR which shows trending in the direction of the breakout regardless of the trend (chapter 2 Bar NR). 3) Each market behaves differently after this pattern forms. Some markets work better with a 3 Bar NR (a contraction of greater duration) than with a 2 Bar NR.
177
MAR.KET ANALYTI~
A practical application of the tests is as follows: Trades should be considered on an ORB just after the pattern forms and positions taken if a profit is visible on the close of the first day. The market should continue to move in the direction of the breakout for the period of the position. A move back to the pattern should not occur. If it does, the position should be re-evaluated.
178
MAR.KET ANALYTICS
02/09189
AUGUST 89 LIVE CATILE
04/19/89
14 BAR STO.• 7.32 Slow%0• 48.44
Contract 40000 Lbs. Trading: 9:05-1 :00 Central 1pt • $4.00 Min.Tock: 2.Spts 10pts per grid unit
1st Notice: July 27 e ri ht1
Opt. Exp: July 21 r
•
80 60 31
7
t4 21 Nov
28
5
12 19 26 Dec
2
9
t2 19 Jun
A59
179
MAR.KET ANALYTI~
AR N
L
~
I-
r
3 BAR NR: Is the narrowest range from high to low of any three day period-relative to any three day period within the previous 20 market days.
180
MAR.KET ANALYI'IQ
A EXJR:)IXJLIARS 1984 - 89
N'.>. OF Di\YS
IN TRADE
BOY/SEU. (B)
(S)
%ProFIT
R>. OF TRADES
OPEN PLUS
8 TICS
5
B
73%
22
OPEN PUJS
8 TICS
2
B
73
OPEN PWS
8 TICS
1
B
OPEN PLUS
8 TICS
0
OPEN PLUS
4 TICS
OPEN PLUS
ma;s AVG. WIN
AVG. IDSS
PROFIT
675
$ 366
$ 8599
22
403
345
4374
64
22
358
209
3349
B
59
22
175
108
1324
5
B
66
44
643
280
14474
4 TICS
2
B
64
44
396
275
6699
OPEN PWS
4 TICS
1
B
68
44
280
230
5199
OPEN PLUS
4 TICS
0
B
61
44
149
123
1924
OPEN MINUS
4 TICS
0
s
54
46
187
82
2949
OPEN MINUS
4 TICS
1
65
46
256
201
4474
OPEN MINUS
4 TICS
2
s s
63
46
299
266
4149
OPEN MINUS
4 TICS
5
B
48
46
665
421
4520
OPEN MINUS
8 TICS
0
78
18
192
112
2249
OPEN MINUS
8 TICS
1
67
18
314
112
3099
OPEN MINUS
8 TICS
2
s s s
72
18
357
260
3349
OPEN MINUS
8 TICS
5
B
33
18
916
422
425
$
J
181
MAR.KET ANALYTICS
81 JnIDS
NO. OF DAYS
IN TRADE
~
182
BUY/SELL (B) (S)
1978 - 86
Gross
NO. OF %POOFIT
TRADES
AVG. WIN
AVG. IDSS
POOFIT
OPEN PLUS
16 TICS
5
s
60%
30
$ 1663
$ 1223
$ 15249
OPEN PLUS
16 TICS
2
s
60
30
1052
1174
4843
OPEN PLUS
16 TICS
1
s
50
30
681
675
92
OPEN PllJS
16 TICS
0
B
73
30
251
652
312
OPEN PLUS
8 TICS
5
s
53
70
1549
1120
20374
OPEN PLUS
8 TICS
2
s
63
70
734
1076
4310
OPEN PLUS
8 TICS
1
B
53
70
567
611
818
OPEN PllJS
8 TICS
0
s
44
70
439
329
844
OPEN MINUS
8 TICS
0
s
71
70
421
270
15691
OPEN MINUS
8 TICS
1
s
57
70
684
565
10411
OPEN MINUS
8 TICS
2
s
59
70
851
878
9450
OPEN MINUS
8 TICS
5
s
57
70
1410
1368
15342
OPEN MINUS
16 TICS
0
s
70
47
321
285
6627
OPEN MINUS
16 TICS
1
s
49
47
762
458
6531
OPEN MINUS
16 TICS
2
s
51
47
908
843
2409
OPEN MINUS
16 TICS
5
s
53
47
1662
1265
13716
MAR.KET ANALYTICS
82
BCNDS 1987 - 89 - NIGHT SESSICN CMITl'ED
NO. OF DAYS
IN TRADE
BUY/SELL (B) (S)
NO. OF %POOF:IT TRADES AVG. WIN AVG. LOSS
GROSS
PR:>FIT
OPEN PllJS
16 TICS
5
s
70%
10
$ 1781
$ 1890
OPEN PIDS
16 TICS
2
B
50
10
787
700
437
OPEN PWS
16 TICS
1
s
40
10
742
416
468
OPEN PIDS
16 TICS
0
B
80
10
175
375
656
OPEN PWS
8 TICS
5
s
64
22
2026
1117
19437
OPEN PllJS
8 TICS
2
s
50
22
1497
883
6750
OPEN PLUS
8 TICS
1
s
50
22
960
590
4062
OPEN PIDS
8 TICS
0
s
59
22
324
388
718
OPEN MINUS
8 TICS
0
s
52
19
518
263
2813
OPEN MINUS
8 TICS
1
s
63
19
1080
656
8375
OPEN MINUS
8 TICS
2
s
68
19
1502
1109
12702
OPEN MINUS
8 TICS
5
s
63
19
1903
1129
14938
OPEN MINUS
16 TICS
0
s
55
11
520
406
1093
OPEN MINUS
16 TICS
1
s
82
11
1041
937
7500
OPEN MINUS
16 TICS
2
s
82
11
1625
1593
11437
OPEN MINUS
16 TICS
5
s
73
11
2253
802
15625
$
6781
l83
MARKET ANALYTI~
c
CRUDE OIL 1983 - 89
00. OF DAYS IN TRADE
184
BUY/SELL (B) (S)
00. OF %PROFIT TRADES AVG. WIN AVG. I.OSS
OPEN PLUS
20 TICS
s
B
67%
24
OPEN PLUS
20 TICS
2
B
7S
24
OPEN PLUS
20 TICS
1
B
so
OPEN PLUS
20 TICS
0
B
OPEN PLUS
10 TICS
s
OPEN PLUS
10 TICS
OPEN PLUS OPEN PLUS
$
GR:lSS PROFIT
31S
$11849
361
12S
S7S9
24
400
lOS
3S29
67
24
147
7S
3S29
B
S7
S8
6S7
367
11279
2
B
S7
S8
3SS
288
4039
10 TICS
1
B
64
S8
246
217
4239
10 TICS
0
B
66
S8
139
141
2329
OPEN MINUS 10 TICS
0
s
66
29
13S
184
729
OPEN MINUS 10 TICS
1
s
S8
29
268
249
1569
OPEN MINUS 10 TICS
2
s
52
29
392
2S3
2339
OPEN MINUS 10 TICS
s
B
S2
29
6S2
S66
640
OPEN MINUS 20 TICS
0
s
S8
12
1S8
124
490
OPEN MINUS 20 TICS
1
s
so
12
448
238
1260
OPEN MINUS 20 TICS
2
s
S8
12
408
292
1400
OPEN MINUS 20 TICS
s
s
33
12
940
463
50
898
$
··-
MARKET ANALYTICS
D JAPANESE YEN 1979 - 88
NO. OF DAYS IN TRADE
BUY/SELL (B)
(S)
NO. OF %PIDFIT
TRADES
GRJSS
AVG. WIN
AVG. LOSS
PROFIT
OPEN PLUS
18 TICS
5
B
59%
49
$ 1072
$ 663
$17849
OPEN PlilS
18 TICS
2
B
55
49
739
588
7012
OPEN PLUS
18 TICS
1
B
59
49
543
421
7312
OPEN PlilS
18 TICS
0
B
63
49
251
238
3499
OPEN PLUS
9 TICS
5
B
44
99
1015
716
5250
OPEN PLUS
9 TICS
2
B
42
99
742
544
162
OPEN PLUS
9 TICS
1
B
52
99
480
394
5600
OPEN PLUS
9 TICS
0
B
54
99
232
173
4350
OPEN MINUS
9 TICS
0
s
61
95
196
224
3075
OPEN MINUS
9 TICS
1
s
57
95
422
412
5887
OPEN MINUS
9 TICS
2
s
55
95
540
547
4575
OPEN MINU3
9 TICS
5
s
62
95
600
875
3887
OPEN MINUS 18 TICS
0
s
61
54
193
125
3737
OPEN MINUS 18 TICS
1
s
63
54
406
449
4849
!PEN MINUS 18 TICS
2
s
52
54
544
510
1962
. PEN MINUS 18 TICS
5
s
52
54
661
635
1987
/
l85
MAR.KET ANALYTICS
E s
& p
1982 - 88
ID. OF OF DAYS BUY/SELL (B) (S) %PROFIT TRADES AVG. WIN AVG. LOSS IN TRADE
ID.
186
GIDSS PROFIT
OPEN PLUS
160 PTS.
5
B
55%
38
$ 2323
$ 1529
$ 22799
OPEN PLUS
160 Pl'S.
2
B
61
38
2103
1425
26999
OPEN PLUS
160 PTS.
1
B
66
38
1565
948
26799
OPEN PLUS
160 Pl'S.
0
B
74
38
914
727
18324
OPil\I PLUS
80 PTS.
5
B
56
63
2056
1987
16325
OPEN PWS
80 PTS.
2
B
62
63
1879
1482
37725
OPil\I PLUS
80 PTS.
1
B
54
63
1722
1063
27725
OPEN PWS
80 PTS.
0
B
62
63
989
875
17575
OPEN MINUS
80 PTS.
0
58
64
839
685
12550
OPEN MINUS
80 Pl'S.
1
s s
53
64
1333
1467
1300
OPEN MINUS
80 PTS.
2
B
48
64
1827
1452
8724
OPEN MINUS
80 Pl'S.
5
B
56
64
2078
1736
26199
OPEN MINUS
160 PTS.
0
s
67
42
637
585
9649
OPEN MINUS
160 PTS.
1
s
60
42
1260
1447
6899
OPEN MINUS
160 PTS.
2
B
50
42
1690
1565
2625
OPEN MINUS
160 Pl'S.
5
B
55
42
2480
1858
22125
MARKET ANALYTICS
F
GOID
ID. OF DAYS
IN TRADE
BUY/SELL {B) (S)
1975 - 89
ID. OF
%PROFIT TRADES
GOO.SS AVG. WIN
AVG. LOSS
PROFIT
OPEN PLUS
$2.00
5
B
56%
98
$ 1305
$ 1075
$25550
OPEN PLUS
$2.00
2
B
61
98
713
604
19859
OPEN PLUS
$2.00
1
B
59
98
462
382
11550
OPEN PWS
$2.00
0
B
72
98
351
225
18850
OPEN PLUS
$1.00
5
B
53
154
1133
1150
10110
OPEN PUJS
$1.00
2
B
55
154
673
644
11459
OPEN PLUS
$1.00
1
B
54
154
463
458
5980
OPEN PWS
$1.00
0
B
65
154
333
336
15160
OPEN MINUS
$1.00
0
s
51
146
373
290
7315
OPEN MINUS
$1.00
1
53
146
579
396
17245
OPEN MINUS
$1.00
2
s s
55
146
705
647
13725
OPEN MINUS
$1.00
5
s
56
146
1287
1013
40685
OPEN MINUS
$2.00
0
s
56
93
417
385
5885
\OPEN MINUS
$2.00
1
s
55
93
639
458
13385
i )OPEN MINUS
$2.00
2
s
53
93
841
727
9205
OPEN MINUS
$2.00
5
s
56
93
1639
1017
43524
187
MARKET ANALYTICS
G SOYBEAN 1970 - 88
NO. OF DAYS BUY/SELL IN TRADE (B) (S)
188
ID. OF %PROFIT TRADES AVG. WIN AVG. LCSS
Gross PROFIT
OPEN PliJS
10 CENTS
5
B
52%
56
$ 1702
$ 1243
$ 15787
OPEN PLUS
10 CENTS
2
B
52
56
1037
614
13500
OPEN PliJS
10 CENTS
1
B
48
56
803
404
9962
OPEN PllJS
10 CENTS
0
B
48
56
344
171
4350
OPEN PliJS
5 CENI'S
5
B
56
124
1214
1096
23520
OPEN PLUS
5 CENTS
2
B
57
124
753
620
20618
OPEN PliJS
5 CENTS
1
B
60
124
540
486
15662
OPEN PWS
5 CENTS
0
B
69
124
258
304
10662
OPEN MINUS
10 CENTS
0
s
70
107
357
214
19937
OPEN MINUS
10 CENTS
1
s
64
107
648
420
28787
OPEN MINUS
10 CENTS
2
s
58
107
873
581
28000
OPEN MINUS
10 CENTS
5
s
57
107
1486
734
56925
0
s
77
52
322
211
10375
1
s
67
52
777
340
21437
=1
OPEN MINUS
5 CENTS
OPFN
s cmrs
OPEN MINUS
5 CENTS
2
s
56
52
1182
482
23212
OPEN MINUS
5 CENTS
5
s
62
52
1903
675
47912
MAR.KET ANALYTICS
H LIVE CATI'LE 1970 - 88
NO. OF DAYS IN TRADE
BUY/SELL (B) (S)
NO. OF %PIDFIT TRADES AVG. WIN
50 PTS.
5
B
52%
97
OPEN PLUS
50 PI'S.
2
B
56
97
367
333
5540
OPEN PIDS
50 PTS.
1
B
58
97
310
253
6980
OPEN PIDS
50 PI'S.
0
B
79
97
135
173
6992
OPEN PllJS
25 PTS.
5
B
55
161
623
536
16904
OPEN PIDS
25 PI'S.
2
B
60
161
331
307
12496
OPEN PllJS
25 PTS.
1
B
58
161
305
232
12584
OPEN PLUS
25 PTS.
0
B
66
161
183
152
11056
OPEN MINUS
25 PTS.
0
s
59
133
152
153
3779
OPEN MINUS
25 PTS.
1
s
52
133
307
215
7451
OPEN MINUS
25 PTS.
2
s
54
133
346
329
4823
OPEN MINUS
25 PI'S.
5
s
52
133
582
528
4299
oP~rs
SO PTS.
0
s
64
70
131
132
2596
OPEN MINUS
50 PTS.
1
s
51
70
315
228
3564
OPEN MINUS
50 PTS.
2
s
53
70
357
339
2036
OPEN MINUS
50 PI'S.
5
B
53
70
556
567
1860
$
616
GroSS PIDFIT
OPEN PLUS
$
708
AVG. LOSS
$
6472
189
< -
190
TWO DAY PATTERNS AND ORB WITH CONTRACTION/EXPANSION CONTRACTION/EXPANSION
In the study titled the Contraction/Expansion Principle I presented results of tests conducted on the WS4 and WS7. These were compared to the NR4 and the NR7 patterns. All were compared to a control group that made no reference to range size. This was revealing and gave some preliminary evidence that contractions promote directional moves while expansions restrict directional moves. 2 DAY PATTERNS AND ORB
In a separate study titled 2 Day ORB all combinations of the previous direction and the opening direction entry were tested with an ORB. This clear deviations from the norm. The established as price continuation in of the move off the open.
Patterns and day's closing of the day of showed some norm has been the direction
COMBINING CONTRACTION/EXPANSION WITH 2 DAY PATTERNS AND ORB
In this study I have integrated Contraction/Expansion with 2 day price patterns ~and ORB. By combining the two studies I hope to provide you with a better understanding of what is taking place in the market day to day. More importantly, I will present you with an application to actual trading. To do this I find it necessary to establish a definition for trend and bias. The integration of the two produces a method that can be used in conjunction with already existing market indicators. Before I can explain this method of application clearly, an explanation of the tests, tables and diagrams is called for. RESULTING COMBINATIONS
To begin with the combination of studies incorporates the following variables: 1).The direction of yesterday's close compared to the day before yesterday's close. 2). The direction of today's open relative to yesterday's close. 3). The size of yesterday's daily range relative to either the previous day (in the case of an NR or WS), the previous 3 days (in the case of NR4 and WS4), or the previous 6 days (NR7 and WS7). 4). An entry is assumed on a move off of todays open by an indicated level, an ORB.
191
r
MARKET --------------------A_N_A_L_IT_I_CS__________________
The above combinations result in 28 possible price patterns. These patterns are approximated in diagram (A). For example take the first pattern in the column marked NR7 in the row marked (--). This pattern shows a lower close and the narrowest day in seven days (NR7) in the second day of the pattern. This is followed by a lower open. In other words (--) with an NR7. An entry is assumed on a predetermined level off the open. DEFINITIONS OF RANGE VARIABLE In Diagram A there are 7 possible price patterns that are referred to. The definitions of each are: NR7 - A decrease in daily range relative to the previous 6 days' daily ranges compared individually. NR4 A decrease in daily range relative to the previous 3 days' ranges compared individually. NR A decrease in daily range relative to yesterday. CONTROL OR NORM No reference to daily range size. WS - An increase in daily range relative to yesterday. WS4 An increase in daily range relative to the previous 3 days' ranges compared individually. WS7 An increase in daily range relative to the previous 6 days' ranges compared individually. /
TABLES AND HISTORICAL RESULTS With the diagrams, detailed tables showing the historical results of each pattern are provided. Each tables title describes the contents. The tables provide the following information: 1). The entry level above or below the open. 2). The Two day pattern. 3). Whether the trade was a buy or sell. 4). The number of trades throughout the test period. 5). Percentage of profitable trades. 6). Average dollar amount of all winning trades and the average dollar amount of all losing trades. 7).The ratio between the average win and average loss. 8). Gross profits, slippage and commission were not included. Each table also indicates the dates of the test period for each market. MARKET PRIMARIES There are three Market Primaries integrated in this study. The first is direction. This is represented by the previous day,s close and todays opening. The second is momentum, represented by yesterday,s daily range (NR7,NR4,NR,WS,WS4,WS7). The third is price action, represented by the move off the open (ORB). These patterns comes closer to capturing the market's identity than any
192
•
.
MAR.KET ANALYTIC8
A
--
NH7
NRLt
Nf