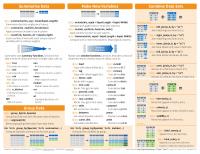
DataCamp ggplot2 cheatsheet
326 84 1MB
English Pages [2] Year 2018
Recommend Papers

- Author / Uploaded
- it-ebooks
File loading please wait...
Citation preview
Geoms
Data Visualization
- Use a geom to represent data points, use the geom’s aesthetic properties to represent variables. Each function returns a layer.
One Variable
with ggplot2
Two Variables
Continuous
Cheat Sheet
Continuous X, Continuous Y f


