Data Analytics in Cognitive Linguistics: Methods and Insights 3110687151, 9783110687156
Contemporary data analytics involves extracting insights from data and translating them into action. With its turn towar
271 72 82MB
English Pages 350 [352] Year 2022
Contents
Data analytics in cognitive linguistics
Mapping the landscape of exploratory and confirmatory data analysis in linguistics
Time series analysis with python
Structural equation modeling in R: A practical introduction for linguists
Visualizing distributional semantics
Lectal variation in Chinese analytic causative constructions: What trees can and cannot tell us
Personification metaphors in Chinese video ads: Insights from data analytics
The interaction between metaphor use and psychological states: A mix-method analysis of trauma talk in the Chinese context
Prospecting for metaphors in a large text corpus: Combining unsupervised and supervised machine learning approaches
Cognitive linguistics meets computational linguistics: Construction grammar, dialectology, and linguistic diversity
What Cognitive Linguistics can learn from dialectology (and vice versa)
Index
Recommend Papers
![Big Data Analytics Methods: Analytics Techniques in Data Mining, Deep Learning and Natural Language Processing [2 ed.]
9781547401567, 9781547417957](https://ebin.pub/img/200x200/big-data-analytics-methods-analytics-techniques-in-data-mining-deep-learning-and-natural-language-processing-2nbsped-9781547401567-9781547417957.jpg)

![Big Data Analytics Methods: Analytics Techniques in Data Mining, Deep Learning and Natural Language Processing [2 ed.]
9781547401567, 9781547417957](https://ebin.pub/img/200x200/big-data-analytics-methods-analytics-techniques-in-data-mining-deep-learning-and-natural-language-processing-2nbsped-9781547401567-9781547417957-p-4909664.jpg)


![Big data analytics methods [2 ed.]
9781547417957, 9781547401567](https://ebin.pub/img/200x200/big-data-analytics-methods-2nbsped-9781547417957-9781547401567.jpg)


File loading please wait...
Citation preview
Data Analytics in Cognitive Linguistics
Applications of Cognitive Linguistics
Editors Gitte Kristiansen Francisco J. Ruiz de Mendoza Ibáñez Honorary editor René Dirven
Volume 41
Data Analytics in Cognitive Linguistics Methods and Insights Edited by Dennis Tay Molly Xie Pan
ISBN 978-3-11-068715-6 e-ISBN (PDF) 978-3-11-068727-9 e-ISBN (EPUB) 978-3-11-068734-7 ISSN 1861-4078 Library of Congress Control Number: 2022935004 Bibliographic information published by the Deutsche Nationalbibliothek The Deutsche Nationalbibliothek lists this publication in the Deutsche Nationalbibliografie; detailed bibliographic data are available on the Internet at http://dnb.dnb.de. Chapter “Lectal variation in Chinese analytic causative constructions: What trees can and cannot tell us” © Xiaoyu Tian, Weiwei Zhang and Dirk Speelman © 2022 Walter de Gruyter GmbH, Berlin/Boston Typesetting: Integra Software Services Pvt. Ltd. Printing and binding: CPI books GmbH, Leck www.degruyter.com
Contents Dennis Tay, Molly Xie Pan Data analytics in cognitive linguistics
1
Bodo Winter Mapping the landscape of exploratory and confirmatory data analysis in linguistics 13 Dennis Tay Time series analysis with python
49
Matteo Fuoli Structural equation modeling in R: A practical introduction for linguists 75 Mariana Montes, Kris Heylen Visualizing distributional semantics
103
Xiaoyu Tian, Weiwei Zhang, Dirk Speelman Lectal variation in Chinese analytic causative constructions: What trees can and cannot tell us 137 Molly Xie Pan Personification metaphors in Chinese video ads: Insights from data analytics 169 Han Qiu, Dennis Tay The interaction between metaphor use and psychological states: A mix-method analysis of trauma talk in the Chinese context 197 Jane Dilkes Prospecting for metaphors in a large text corpus: Combining unsupervised and supervised machine learning approaches
229
Jonathan Dunn Cognitive linguistics meets computational linguistics: Construction grammar, dialectology, and linguistic diversity 273
VI
Contents
Karlien Franco What Cognitive Linguistics can learn from dialectology (and vice versa) 309 Index
345
Dennis Tay, Molly Xie Pan
Data analytics in cognitive linguistics 1 Is data analytics just another name for statistical analysis? Data analytics is commonly defined as the “processing and analysis of data to extract information for enhancing knowledge and decision-making”, with minor differences among definitions. Although large amounts of data are collected nonstop around the clock, people still describe today’s world with the old phrase “data rich but information poor” (Peters and Waterman 1982). The process of turning data into useful information is like finding “a small set of precious nuggets from a great deal of raw material” (Han et al. 2000: 5–6), and would indeed seem like a daunting task to the unacquainted. On the other hand, those who have received some training in general data analysis, including many linguists, might see data analytics as little more than an attempt to refashion applied statistics and quantitative methods in a more marketable way. The gist of it still appears to be making sense of data in numerical rather than verbal or qualitative forms, and popular techniques like clustering and regression still bear the same name as when they were taught in traditional statistics courses. There is some merit to this cynicism given that we live in a world where it seems to be important to put a new spin on old things all the time. However, we would be remiss to overlook some nuanced but important differences between the two. The first difference is that while most data analytic techniques are indeed based on quantitative and statistical methods, there is a strong emphasis on the importance of substantive expertise (Conway 2010) or domain knowledge in order to maximize their potential for insight. This follows from the fact that just about any type of data from historical archives to complex multimodal artifacts can be viewed from the lenses of data analytic techniques as long as there are good theoretical or practical reasons for doing so. It also means that general statistical methods like classification and regression are continuously adopted to meet the specific needs
Acknowledgement: The editorial work involved in this volume was partly supported by the HKSAR Research Grants Council (Project number: 15601019). Dennis Tay, Department of English and Communication, The Hong Kong Polytechnic University, e-mail: [email protected] Molly Xie Pan, College of Foreign Languages and Literatures, Fudan University, e-mail: [email protected] https://doi.org/10.1515/9783110687279-001
2
Dennis Tay, Molly Xie Pan
of different domains like business (Chen et al. 2012) and healthcare (Raghupathi and Raghupathi 2014), with ever expanding functions, applications, and specialized interpretations of models and results. The second difference pertains to a perceived difference in scope between the two. There is a tendency among many novice and experienced researchers alike to view statistical analysis as a set of standard ‘tests’ that are applied to measurements collected under some strictly controlled guidelines in order to determine whether some hypothesis is ‘correct’ or otherwise. This seems to be especially true in the field of applied linguistics where testing, assessment, and other forms of measurement are commonplace. The typical question which test should I use? is often answered by convenient heuristical tools like flow charts, abundantly available on the internet, that attempt to link stock scenarios like ‘comparing the means of two groups’ or ‘comparing the means of three or more groups’ to the t-test, one-way ANOVA, and so on. While this approach of ‘choosing the correct test to use’ might be convenient and helpful for learners, it reinforces the narrow view that statistical analysis is all about trying to prove or disprove a hypothesis at a specific stage of the research process. This in turn makes it easy to see statistical analysis as an independent set of procedures that apply to all types of, and are hence divorced from, specific subject matter knowledge. Data analytics, on the other hand, is more in line with the broader notion of statistical thinking that has been gaining traction in modern statistics education. There are many different definitions of statistical thinking but they all focus on cultivating a “more global view” (Chance 2002) in learners right from the start. For researchers, this means learning to see data analysis as holistic and contextual, rather than linear and procedural. Some concrete steps to do so include exploring and visualizing data in new and creative ways, understanding why a certain analytical procedure is used rather than what or how to use it, reflecting constantly on alternative approaches to think about the data and situation at hand, appreciating how subject matter and contextual knowledge can potentially shape analytic decisions, and learning how to interpret conclusions in non-statistical terms. Compared to the traditional conception of statistical analysis described above, we can therefore describe data analytics as encompassing a more exploratory spirit, being ‘messier’ in a positive sense, and even as a means to inspire emergent research questions rather than a resolution of existing ones. At the same time, data analytics can also be described as being very context-specific and purpose driven, and thus potentially more engaging for focused learners than what the traditional ‘decontextualized’ view of statistics presents. Tools for the actual implementation of data analytic techniques on increasingly large volumes of data have also become more available today. Powerful open-source programming languages like R and Python are continuously developed and freely available to personal users, which can be a
Data analytics in cognitive linguistics
3
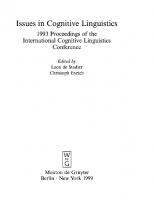
great relief for many learners relying on expensive commercial statistical software packages like SPSS, Stata, MATLAB etc. Data analytics can be classified as four subtypes(Evans and Lindner 2012) in order of increasing complexity and value-addedness (Figure 1). Originally conceived for business contexts where complexity and value are measured in relatively concrete financial terms, these notions also have meaningful interpretations for researchers. We may understand the four subtypes as representing progressive phases of inquiry into a certain dataset. Descriptive analytics is roughly synonymous with the classic notion of descriptive statistics. It involves summarizing and depicting data in intuitive and accessible ways, often to prepare for later phases of analysis. A simple example is to depict the central tendency and distribution of a dataset with box plots or histograms. With an increasing premium placed on visual aesthetics and user engagement, however, data visualization has become a growing field in itself, with increasingly sophisticated and interactive forms of visualization driving the development of contemporary descriptive analytics. The next subtype or phase known as diagnostic analytics involves discovering relationships in the data using various statistical techniques. It is deemed more complex and valuable than descriptive analytics because the connections between different aspects of our data help us infer potential causes underlying observed effects, addressing the why behind the what. In an applied linguistics context, for example, the descriptive step of uncovering significant differences in the mean scores of student groups might motivate a broader correlational study of scores and demographics to diagnose potential sociocultural factors that explain this difference. Following that, if we see diagnostic analytics as revealing why something might have happened in the past, the next phase known as predictive analytics is aimed at telling us what might happen in the future. This involves predicting the values of future data points using present and historical data points, supported by core techniques like regression, classification, and time series analysis. It should be clear why predictive analytics represents a quantum leap in value for businesses that are inherently forward looking. To a lesser extent perhaps, the same applies for linguistics research that aims to predictively categorize new texts, speakers, and varieties, or forecast language assessment scores, based on existing data. As ever-increasing volumes of data become available, both diagnostic and predictive analytics are turning towards machine learning – the use of artificial intelligence to quickly identify patterns, build models, and make decisions with little or no human intervention. Applications in computational linguistics and natural language processing (NLP) best reflect these advances in the field of linguistics research. Lastly, prescriptive analytics fill the gap between knowing and doing by translating the above insights
4
Dennis Tay, Molly Xie Pan
into concrete courses of action. It goes beyond knowing what is likely to happen based on predictive analytics, which may or may not be ideal, to suggest what needs to be done to optimize outcomes. Examples that require split-second decisions to everchanging information and conditions include the optimization of airline prices, staffing in large organizations, and the modern self-driving car. While linguistics is not likely to involve this level of challenge, prescriptive analytics still interfaces with the ubiquitous notion of applied or appliable research, which ultimately boils down to the growing need to demonstrate how our findings positively inform personal and social action.
Figure 1: Four subtypes of data analytics.
2 Data analytics in cognitive linguistics Cognitive linguistics has undergone remarkable development since its inception. Luminaries of the field like George Lakoff, Leonard Talmy, Ronald Langacker, Charles Fillmore, and Gilles Fauconnier established some of the most influential theories about the interfaces between linguistic meaning, structure, and cognition, basing much of their introspective analyses on made-up examples. This mode of inquiry has however come to be criticized on both philosophical and methodological grounds over the years. Philosophically, reliance on introspection reduces “cognition” to psychological reality and neglects its neurobiological underpinnings (Lamb 1999). This is often reflected in the common use of the terminology “mind/brain” to conflate the two for analytic convenience.
Data analytics in cognitive linguistics
5
The use of introspective examples has also been susceptible to charges of argumentative circularity, like in the case of conceptual metaphor theory where invented utterances are taken as both evidence and product of conceptual mappings (Kertész and Rákosi 2009). More generally, there are obvious limitations to our ability as humans to accurately introspect upon many of our cognitive processes (Gibbs 2006). The concern motivating the present volume is more methodological in nature. The past decades have witnessed steady growth in the (combined) use of empirical methods like corpora, surveys, and experimentation in humanities research in general and cognitive linguistics in particular (Gibbs 2007, 2010; Kertész et al. 2012). A key argument for empirical over introspective methods in cognitive linguistics is their compatibility with the basic tenet that linguistic structure and meaning emerge from multiple usage contexts. These are inherently beyond the introspective ambit of individuals, and we therefore need transparent methods that can deal with measures and their variability on larger scales. This ‘empirical turn’ has at the same time dovetailed with the call for cognitive linguistics to demonstrate its applications in real world activities, including but not limited to the traditional areas of language acquisition and education. Many examples in the Applications of Cognitive Linguistics book series have powerfully illustrated this point. The above conditions imply that cognitive linguistics – as a specialized knowledge domain aspiring to be truly “applied” – presents a fertile but underexplored ground for data analytics. While not all empirical methods are quantitative in nature, the majority used by cognitive linguists including corpora, surveys, and experiments do involve different extents of quantification and statistical analysis. There is certainly no lack of advocacy, pedagogy, and application of quantitative and statistical methods by cognitive linguists interested in different topics ranging from metaphor and metonymy to constructions and lexical semantics (Glynn and Robinson 2014; Gonzalez-Marquez et al. 2007; Janda 2013; Tay 2017; Winter 2019; Zhang 2016). A cursory review of articles in specialized journals like Cognitive Linguistics, Review of Cognitive Linguistics and Cognitive Linguistic Studies quickly shows that there is an increasing use of quantitative methods in theoretical and empirical work alike. We are fortunate to already have many examples of textbooks, introductory overviews, step-by-step guides, as well as more advanced applications of a wide variety of statistical methods to analyze linguistic data. However, with respect to the distinct features of data analytics outlined above, two aspects remain critically underexplored in the cognitive linguistics literature. Firstly, existing work has made ample use of descriptive analytics to account for data, diagnostic analytics to investigate hypotheses, and predictive analytics to make inferences about patterns of language use. It nevertheless stops short at prescriptive analytics; i.e. suggesting concrete courses of action, which is crucial if
6
Dennis Tay, Molly Xie Pan
cognitive linguistics wishes to be truly “applied”. This goes beyond the traditional ambit of language acquisition and pedagogy (Achard and Niemeier 2008; Littlemore 2009) to other contexts like advertising (Littlemore et al. 2018), design (Hurtienne et al. 2015), and aspects of healthcare where language plays a key role (Demjén et al. 2019; Tay 2013). As mentioned earlier, while linguistic research is not likely (yet) to require the most sophisticated prescriptive analytics, it is time to consider how the “practical implications” of our work could be more intimately informed by prior analytical steps and articulated as such. The second underexplored aspect is the aforementioned holistic guiding role of data analytics throughout the research trajectory – from data description to hypothesis setting, testing, and the eventual interpretation and application of findings. This contrasts in important ways with the widely held belief that statistical and quantitative methods only apply to “top-down” investigation of experimental hypotheses determined in advance. It is in fact the case that many “bottom-up” designs across different cognitive linguistic topics – ranging from corpus-driven studies to (conceptual) metaphors in discourse – can be critically informed by various data analytic techniques. A dedicated space is required to demonstrate the different possibilities with reference to diverse areas in current cognitive linguistics research. From a pedagogical point of view, researchers new to data analytics could be made more aware that even a working familiarity with basic skills, including programming languages like R and Python, can go a long way towards the formulation and refinement of different research objectives.
3 This volume as a first step This volume is a modest first step towards the aforementioned goals. It features ten contributions from established and up-and-coming researchers working on different aspects of cognitive linguistics. As far as practicable, the contributions vary in terms of their aims, featured languages and linguistic phenomena, the social domains in which these phenomena are embedded, the types of data analytic techniques used, and the tools with which they are implemented. Some chapters are conceptual discussions on the relationships between cognitive linguistic research and data analytics, some take a more pedagogical approach to demonstrate the application of established as well as underexplored data analytic techniques, while others elaborate these applications in with full independent case studies. Examples from multiple languages and their varieties like English, Mandarin Chinese, Dutch, French, and German will be discussed. Phenomena and constructs to
Data analytics in cognitive linguistics
7
be analyzed include verbal and visual metaphors, constructions, language variation, polysemy, psychological states, and prototypicality. The case studies address relevant issues in different social domains like business, advertising, politics, and mental healthcare, further underlining the applied dimensions of cognitive linguistics. The featured data analytic techniques span across descriptive, to the threshold of prescriptive analytics as described above. These include innovative ways of data visualization, machine learning and computational techniques like topic modeling, vector space models, and regression, underexplored applications in (cognitive) linguistics like time series analysis and structural equation modeling, and initial forays into prescriptive analytics in the mentioned social domains. The contributions also showcase a diverse range of implementation tools from traditional statistical software packages like SPSS to programming languages like Javascript, R, and Python, with code and datasets made available either in print, via external links, or upon request by contributors. The volume starts with Chapter 1 where Bodo Winter provides an excellent overview of the landscape of statistical analysis in cognitive as well as general linguistics research. Framing data analysis as a process of modeling the data with respect to domain and contextual knowledge rather than the ritualistic application of statistical tests, he communicates the central message of this volume and discusses how a modeling approach could address perceived issues of replicability and reproducibility in cognitive linguistics research. This overview is followed by two tutorial-style chapters aimed at introducing useful data analytic techniques that are likely to be less familiar to cognitive linguists. In Chapter 2, Dennis Tay discusses the underexplored relevance of time series data – consecutive observations of a random variable in orderly chronological sequence – in cognitive linguistics research. Key steps of the widely used BoxJenkins method, which applies a family of mathematical models called ARIMA models to express values at the present time period in terms of past periods, are explained with reference to a guiding example of metaphors across psychotherapy sessions. Sample code from the Python programming language is provided to encourage readers to attempt and implement the method to their own datasets. Matteo Fuoli’s Chapter 3 follows closely with an introduction of structural equation modelling. This is a technique for testing complex causal models among multiple related variables, and has much underexplored potential in cognitive linguistics work. Experimental data on the psychological effects of stance verbs (e.g. know, want, believe) in persuasive business discourse comprise the guiding example, this time using the R programming language for implementation. Learners might also find in these two chapters an opportunity to compare Python and R code for themselves.
8
Dennis Tay, Molly Xie Pan
The volume then transits into a series of four case studies that, as mentioned above, feature a diverse range of phenomena, settings, and data analytic techniques. In Chapter 4, Mariana Montes and Kris Heylen highlight the importance and increasing sophistication of data visualization techniques, and how they interface with processes of statistical data analysis. They argue that the process of visualization helps researchers recognize, interpret, and reason about otherwise abstract statistical patterns in more intuitive ways. The crucial role played by interactive visual analytics is then demonstrated by a corpusbased case study of Dutch, where distributional semantic models are used to analyze structural properties of word meaning like polysemy and prototypicality as they emerge from contextual usage patterns. Chapter 5 by Xiaoyu Tian, Weiwei Zhang, and Dirk Speelman is a case study of lectal variation in analytic causative constructions across three varieties of Chinese used in Mainland China, Taiwan, and Singapore. The authors are interested in how features of the cause and the effected predicate might influence the choice of near-synonymous causative markers shi, ling, and rang in these varieties. They demonstrate how a combination of data analytic techniques – conditional random forests and inference trees, complemented by logistic regression models, can enhance the explanatory power and insight offered by tree-based methods alone. We remain in the Chinesespeaking context in Chapter 6 by Molly Xie Pan, turning our attention to the use of personification metaphors in Chinese video advertisements. Besides showing how these metaphors are constructed and distributed across product types, with prescriptive implications for advertisers, another important objective of this chapter is to underline how data analytic techniques like log-linear and multiple correspondence analysis can guide researchers to explore larger datasets with multiple categorical variables, as a starting point to inspire subsequent research questions. Chapter 7 moves from the social domain of advertising to mental health and politics. Working with interview and psychometric data from affected individuals in the recent social unrest in Hong Kong where protestors occupied a university and disrupted its operation, Han Qiu and Dennis Tay apply multiple linear regression to analyze the interaction between metaphor usage profiles and measures of psychological trauma, interpreting the results and implications in a contextually specific way. As a step towards predictive analytics, they show how aspects of metaphor use (e.g. targets, sources, conventionality, emotional valence) at the level of individuals could reasonably predict performance in the Stanford Acute Stress Reaction Questionnaire, which in turn suggests concrete courses of actions by healthcare professionals. The final three chapters showcase innovations in the application of data analytics, both in terms of refining methodology in established research areas as well as tilling new grounds for collaborative cross-disciplinary work. In
Data analytics in cognitive linguistics
9
Chapter 8, Jane Dilkes discusses metaphor identification, a foundational step in metaphor research that is well known for its (over)reliance on manual human judgement. She shows how a combination of supervised and unsupervised machine learning techniques in natural language processing can be harnessed to prospect for “community metaphor themes” in an extensive online English cancer-related forum. This in turn paves the way for investigating associations between metaphor use and other measures of language style. Chapters 9 and 10 by Jonathan Dunn and Karlien Franco respectively argue for closer collaboration between cognitive linguistics and the neighboring fields of computational linguistics and dialectology. In Chapter 9, the growing area of computational cognitive linguistics is showcased as a truly usage-based approach operating on a large enough scale to capture meaningful generalizations about actual usage. Computational methods are used to model language learning and variation from respective theoretical perspectives of construction grammar and dialectology, featuring a vast dataset that covers seven languages (English, French, German, Spanish, Portuguese, Russian, Arabic) and their 79 distinct national dialects. In Chapter 10, potential synergies between cognitive linguistics and dialectology are further explored with three case studies that offer a cognitive linguistic take on sociolinguistic principles like transmission, diffusion, and communicative need. To operationalize this cross-fertilization of theoretical ideas, generalized additive models, as extensions of generalized linear models that flexibly accommodate parametric and non-parametric relationships between (in)dependent variables, are combined with other correlational analyses to investigate dialectal lexical variation in Dutch. In this way, the volume is divided into three natural and overlapping sections. Chapters 1 to 3 are more conceptually and pedagogically oriented by presenting a broad overview followed by tutorial-style contributions aimed at learners. Chapters 4 to 7 feature specific case studies with a range of data analytic techniques, phenomena, and social contexts, and Chapters 8 to 10 conclude the volume by offering glimpses of promising future directions for data analytics in cognitive linguistics. While the target audience are cognitive linguists, the techniques underpinning the theoretical issues and examples are readily applicable to other areas of social and linguistic research with appropriate reconceptualization of the design and variables. We believe that the volume will be most beneficial to researchers who have some foundational knowledge in statistics and data analytics, and want to further understand how a range of underexplored as well as established techniques could operate in actual research contexts.
10
Dennis Tay, Molly Xie Pan
References Achard, Michel & Susanne Niemeier. 2008. Cognitive linguistics, second language acquisition, and foreign language teaching. Berlin: Walter de Gruyter. Chance, Beth L. 2002. Components of statistical thinking and implications for instruction and assessment. Journal of Statistics Education 10(3). Chen, Hsinchun, Roger HL Chiang & Veda C Storey. 2012. Business intelligence and analytics: From big data to big impact. MIS quarterly. 1165–1188. Conway, Drew. 2010. The Data Science Venn Diagram. blog.revolutionanalytics.com. Demjén, Zsófia, Agnes Marszalek, Elena Semino & Filippo Varese. 2019. Metaphor framing and distress in lived-experience accounts of voice-hearing. Psychosis 11(1). 16–27. Evans, James R & Carl H Lindner. 2012. Business analytics: The next frontier for decision sciences. Decision Line 43(2). 4–6. Gibbs, Raymond W. 2006. Introspection and cognitive linguistics. Annual Review of Cognitive Linguistics 4. 131–151. Gibbs, Raymond W. 2007. Why cognitive linguists should care more about empirical methods. In Monica Gonzale-Marquez, Irene Mittelberg, Seana Coulson & J. Michael Spivey (eds.), Methods in cognitive linguistics, 2–18. Amsterdam: John Benjamins. Gibbs, Raymond W. 2010. The wonderful, chaotic, creative, heroic, challenging world of researching and applying metaphor. In Graham Low, Zazie Todd, Alice Deignan & Lynne Cameron (eds.), Researching and applying metaphor in the real world, 1–18. Amsterdam: John Benjamins. Glynn, Dylan & Justyna Robinson (eds.). 2014. Corpus methods for semantics: Quantitative studies in polysemy and synonymy. Amsterdam: John Benjamins. Gonzalez-Marquez, Monica, Irene Mittelberg, Seana Coulson & J. Michael Spivey (eds.). 2007. Methods in cognitive linguistics. Amsterdam: John Benjamins. Han, Jiawei, Micheline Kamber & Jian Pei. 2000. Data mining concepts and techniques 3rd edn. San Francisco, CA: Morgan Kaufmann. Hurtienne, Jörn, Kerstin Klöckner, Sarah Diefenbach, Claudia Nass & Andreas Maier. 2015. Designing with image schemas: Resolving the tension between innovation, inclusion and intuitive use. Interacting with Computers 27(3). 235–255. Janda, Laura A. 2013. Cognitive linguistics: The quantitative turn. Berlin & New York: Walter de Gruyter. Kertész, András & Csilla Rákosi. 2009. Cyclic vs. circular argumentation in the Conceptual Metaphor Theory. Cognitive Linguistics 20(4). 703–732. Kertész, András, Csilla Rákosi & Péter Csatár. 2012. Data, problems, heuristics and results in cognitive metaphor research. Language Sciences 34(6). 715–727. Lamb, Sydney M. 1999. Pathways of the brain: The neurocognitive basis of language. Amsterdam: John Benjamins Publishing. Littlemore, Jeannette. 2009. Applying cognitive linguistics to second language learning and teaching. Basingstoke/New York: Palgrave Macmillan. Littlemore, Jeannette, Paula Pérez Sobrino, David Houghton, Jinfang Shi & Bodo Winter. 2018. What makes a good metaphor? A cross-cultural study of computer-generated metaphor appreciation. Metaphor and Symbol 33(2). 101–122. Peters, Thomas J & Robert H Waterman. 1982. In search of excellence: Lessons from America’s best-run companies. New York: Harper Collins Business.
Data analytics in cognitive linguistics
Raghupathi, Wullianallur & Viju Raghupathi. 2014. Big data analytics in healthcare: Promise and potential. Health information science and systems 2(1). 1–10. Tay, Dennis. 2013. Metaphor in psychotherapy: A descriptive and prescriptive analysis. John Benjamins Publishing. Tay, Dennis. 2017. Time series analysis of discourse: A case study of metaphor in psychotherapy sessions. Discourse Studies 19(6). 694–710. Winter, Bodo. 2019. Statistics for linguists: An introduction using R. New York: Routledge. Zhang, Weiwei. 2016. Variation in metonymy: Cross-linguistic, historical and lectal perspectives. Berlin, Germany: Walter de Gruyter.
11
Bodo Winter
Mapping the landscape of exploratory and confirmatory data analysis in linguistics 1 The data gold rush Linguistics has and still is undergoing a quantitative revolution (Kortmann 2021; Levshina 2015; Sampson 2005; Winter 2019a). Over the last few decades in particular, methodological change has arguably taken up speed. For example, many researchers have criticized the over-reliance on introspective data in generative linguistics (Gibson and Fedorenko 2010; Pullum 2007; Schütze 1996) and cognitive linguistics (Dąbrowska 2016a; Dąbrowska 2016b; Gibbs 2007). This critique of introspection was one of the driving forces spurring an increased adoption of quantitative methods. Other factors that have spurred the quantitative revolution in our field include the ever-increasing ease with which data can be extracted from corpora, or crowdsourced via platforms such as Amazon Mechanical Turk and Prolific (Bohannon 2011; Paolacci, Chandler and Ipeirotis 2010; Peer, Vosgerau and Acquisti 2014; Sprouse 2011). In addition, it is becoming increasingly easy to access freely available web data, such as the results of large-scale word rating studies (Winter 2021). In the cognitive sciences, Griffiths (2015) speaks of the ‘big data’ computational revolution. Buyalskaya and colleagues (2021) speak of ‘the golden age of social science.’ This new era, in which we are inundated by a large amount of freely available or easily obtainable datasets, means that data analytics is increasingly becoming an essential part of linguistic training. However, even though some linguistics departments offer excellent statistical education, many others still struggle with incorporating this into their curricula. Many linguistics students (and sometimes their supervisors!) feel overwhelmed by the sheer number of different approaches available to them, as well as the many different choices they have to make for any one approach.
Acknowledgement: Bodo Winter was supported by the UKRI Future Leaders Fellowship MR/ T040505/1. Bodo Winter, Dept. of English Language and Linguistics, University of Birmingham, e-mail: [email protected] https://doi.org/10.1515/9783110687279-002
14
Bodo Winter
To readers who are new to the field, the landscape of statistical methodology may look very cluttered. To begin one’s journey through this landscape, there is no way around reading at least one book-length introductory text on statistical methods, of which there are by now many for linguists (e.g., Baayen, 2008; Larson-Hall, 2015), cognitive linguists (e.g., Levshina, 2015; Winter, 2019b), and corpus linguists (Desagulier 2017; Gries 2009). We simply cannot expect to learn all relevant aspects of data analysis from a short paper, online tutorial, or workshop. Statistical education needs more attention than that, and reading booklength statistical introductions should be a mandatory part of contemporary linguistic training. The available books are often focused on teaching the details of particular statistical procedures and their implementation in the R statistical programming language. These books generally cover a lot of ground – many different approaches are introduced – but they are often less focused on giving a big picture overview. This chapter complements these introductions by taking a different approach: without going into the details of any one particular method, I will try to map out a path through the landscape of statistics. My goal is not to give the reader a set of instructions that they can blindly follow. Instead, I will focus on giving a bird’s eye overview of the landscape of statistics, hoping to reduce the clutter. This chapter is written decidedly with the intention of being accessible to novice analysts. However, the chapter should also be useful for more experienced researchers, as well as supervisors and statistics educators who are in need for high-level introductions. Even expert analysts may find the way I frame data analytics useful for their own thinking and practice. Moreover, I want to chart the map of statistics in light of the modern debate surrounding the replication crisis and reproducible research methods (§2), using this chapter as an opportunity to further positive change in our field. Our journey through the landscape of statistics starts with a characterization of data analysis as a cognitive activity, a process of sensemaking (§3). There are two main sub-activities via which we can make sense of data, corresponding to exploratory and confirmatory data analysis. Some have (rightfully) criticized the distinction between exploration and confirmation in statistics (Gelman 2004; Hullman and Gelman 2021), as it often breaks down in practice. Regardless of these critiques, the exploration-confirmation divide will serve as useful goal posts for framing this introduction, as a means for us to split the landscape of statistics into two halves, each with their own set of approaches that are particularly suited for either confirmation or exploration. And it is fitting for this volume, which includes chapters that are relatively more focused on confirmatory statistics (e.g., Tay; Fuoli, this volume), as well as chapters that are relatively more focused on exploratory statistics (e.g., Dilkes; Tian and Zhang; Pan, this volume).
Mapping the landscape of exploratory and confirmatory data analysis
15
Within the confirmatory part of the statistical landscape, a critique of the significance testing framework (§4) motivates a discussion of linear models (§5–6) and their extensions (§7), including logistic regression, Poisson regression, mixed models, and structural equation models, among others. My goal in these sections is to focus on the data analysis process from the perspective of the following guiding question: How can we express our theories in the form of statistical models? Following this, I will briefly sketch a path through the landscape of exploratory statistics by looking at Principal Components Analysis, Exploratory Factor Analysis, and cluster analysis to showcase how exploration differs from confirmation (§8.1). Section §8.2 briefly mentions other techniques that could be seen as exploratory, such as classification and regression trees (CART), random forests, and NLP-based techniques such as topic modeling.
2 The replication crisis and reproducible research We start our journey by considering how statistical considerations are intrinsically connected to the open science movement and the ‘replication crisis’ that has been unfolding over the last decade. No introduction to statistics is complete without considering the important topic of open and reproducible research. Any statistical analysis is pointless if it is not reproducible, and we cannot, and should not, trust results that do not meet modern standards of open science. Given how essential reproducibility and transparency are for the success of linguistics as a science, not including discussions of open science and reproducibility into the statistics curriculum is doing our field a disservice. Large-scale efforts in psychology have shown that the replicability of study results is much lower than people hoped for, with one study obtaining only 36 successful replications out of 100 studies from three major psychological journals (Open Science Collaboration, 2015; see also Camerer et al., 2018). Linguistics is not safe from this “replication crisis,” as evidenced by the fact that some high-profile findings relating to language have failed to replicate, such as the idea that bilingualism translates into advantages in cognitive processing (e.g., de Bruin et al., 2015; Paap and Greenberg, 2013). Cognitive linguists in particular should be particularly wary of the replication crisis, as a number of the results that have failed to replicate relate to one of the core tenets of cognitive linguistics, the idea that the mind is embodied (see Evans, 2012; Gibbs, 2013; Lakoff and Johnson, 1999). Embodied cognition results that have failed to replicate include, among others, the finding that
16
Bodo Winter
reading age-related words makes people walk more slowly (Doyen et al. 2012), that experiencing warm physical temperatures promotes social warmth (Chabris et al. 2018), that reading immoral stories makes people more likely to clean their hands (Gámez, Díaz and Marrero 2011), and that reading action-related sentences facilitates congruent movements (Papesh 2015). In fact, embodied cognition research may be one of the most non-replicable areas of cognitive psychology (see discussion in Lakens, 2014). Thus, linguists, and especially cognitive linguists, need to take the replication crisis very seriously. A recent special issue in the journal Linguistics (de Gruyter) includes several papers focused on discussing the relevance of the replication crisis for linguistics (Grieve 2021; Roettger 2021; Sönning and Werner 2021; Winter and Grice 2021). The reasons for failures to replicate are manifold and cannot be pinned down to just one cause. This also means that a variegated set of solutions is required (e.g., Asendorpf et al., 2013; Finkel et al., 2017), including replicating existing studies, performing meta-analyses of existing studies, preregistering one’s planned methodology ahead of time, increasing the sample size of studies where possible, placing more emphasis on effect sizes in one’s analysis, being more rigorous about the application of statistical methodology, as well as making all materials, data, and analysis code publicly available. The latter factor – open data and open code – is particularly relevant for us here. In linguistics, including cognitive linguistics, it is still not required for publications to make everything that can be shared available, although this situation is changing rapidly (see, e.g., Berez-Kroeker et al., 2018; Roettger et al., 2019). Two of the flagship cognitive linguistics journals (Cognitive Linguistics, de Gruyter; Language and Cognition, Cambridge University Press) now require data to be shared on publicly available repositories. In Winter (2019b), I explicitly discussed the issue of replicability in the context of cognitive linguistic research, focusing on “reproducibility” rather than replication. Reproducibility is defined as the ability of another analyst to take the existing data of a study and reproduce each and every published value (see e.g., Gentleman and Temple Lang, 2007; Munafò et al., 2017; Peng, 2011; Weissgerber et al., 2016). In many ways, reproducibility is an even more basic requirement than replicability. Replication involves the repetition of a study with a new dataset; reproducibility includes that even for the very same data, another person should be able to trace each and every step, ultimately being able to re-create all figures and statistical results on one’s own machine. Lakoff (1990) proposed that the subfield of cognitive linguistics can be characterized by three “commitments”: the cognitive reality commitment, the convergent evidence commitment, and the generalization and comprehensiveness commitment. The details of each of these commitments is irrelevant for
Mapping the landscape of exploratory and confirmatory data analysis
17
our purposes, but taken together, they ground cognitive linguistics in the empirical sciences (see also Gibbs, 2007), including the incorporation of research from the wider cognitive sciences. However, if the cognitive science results that cognitive linguists use to ground their theories in empirical research turn out to be non-reproducible, all commitment to empirical work is vacuous. Therefore, in analogy to Lakoff’s foundational commitments, I have argued that cognitive linguists should add the “reproducibility commitment” to their canon of commitments, repeated here as follows: The Reproducibility Commitment: “An adequate theory of linguistics needs to be supported by evidence that can be reproduced by other linguists who did not conduct the original study.” (Winter 2019b: 126)
When focused on data analysis, this commitment, at a bare minimum, compels us to make all data and code available.1 From this reproducibility commitment, we can get an easy question out of the way that some beginning data analysts may have: What statistical software package should be used? On what software should a novice analyst focus their efforts on? The Reproducibility Commitment rules out any statistical software that is proprietary, i.e., that costs money and is not open source (SPSS, SAS, STATA, Matlab, Mplus etc.). Instead, efforts have to be directed to freely available open-source software (such as R and Python). Reproducibility commits us to use software that can be accessed and understood by everyone in the community without the need to acquire expensive licenses. Clearly, software does not make one a statistician, and many software packages other than R and Python are very powerful, but if we want to follow open science principles, we should not be using software that restricts access to certain members of the linguistic community. Especially the R programming environment (R Core Team 2019) is by now the de facto standard in linguistics, one could even say the ‘lingua franca’ of our field (Mizumoto and Plonsky 2016). A common objection against R (and other programming languages such as Python) is the belief that they may be harder to learn than software with graphical user interfaces such as SPSS. However, there simply is no empirical evidence to support this claim, and the few studies that have actually looked at students’ reactions to different software packages suggest claims about R being substantially harder may be overstated (Rode and Ringel 2019). But even if R were harder than software such as SPSS, teaching the latter is simply put unethical given how incompatible the use of proprietary software is with the core principles of open and reproducible research.
1 For a response to common objections to data and code sharing, see Winter (2019b, Ch. 2).
18
Bodo Winter
With the fundamental topics of reproducibility and the question as to what software we should use out of the way, we can now begin charting a map of the landscape of statistics.
3 Data analysis as a cognitive process: Confirmatory and exploratory sensemaking Data analysis is fruitfully seen as a cognitive process, one that involves making sense of data. As stated by Grolemund and Wickham (2014: 189): “Data analysis is a sensemaking task. It has the same goals as sensemaking: to create reliable ideas of reality from observed data. It is performed by the same agents: human beings equipped with the cognitive mechanisms of the human mind. It uses the same methods.”
Any sensemaking process is an interaction between the external world and the sensemaker’s preexisting beliefs. The same way, data analysis is shaped not only by what’s in the data, but also by the state of the cognizer. Psychologists distinguish between bottom-up perception (the input, that what directly comes from the world around us) and top-down perception (influence from our preexisting beliefs). Visual perception is both bottom-up and top-down, and so is data analysis. However, in contrast to visual perception, which is generally automatic, the researcher performing a data analysis has a choice to make about how much they want to be bottom-up or top-down. A data analyst should think about whether they are primarily looking into the data to discover new patterns – with relatively fewer existing beliefs intervening – or whether they are looking to the data to either confirm or disconfirm their existing beliefs. If we are in a maximally confirmatory mode, all hypotheses are specified a priori; in exploratory statistics, much fewer hypotheses are specified a priori, and the data itself is allowed to suggest new patterns, including some that the researcher may not have thought of. Very informally, we can think of exploratory statistics as answering the question: What does my data have to offer? In turn, confirmatory statistics can be thought of as answering the question: Is my theory consistent with the data? Ultimately, there is a continuum between confirmation and exploration because every method will always take something from the data, and every method will always come with some set of assumptions. The distinction between confirmatory and exploratory statistics is therefore one that comes in degrees, depending on how much a given statistical methodology requires specifying structures in
Mapping the landscape of exploratory and confirmatory data analysis
19
advance. And of course, the distinction between confirmatory and exploratory statistics pertains to the difference in the purpose of an analysis. Generally speaking, the same method can be used for both confirmation and exploration, depending on the analyst’s goals. That said, within the field of linguistics, some methods are more aligned with exploratory versus confirmatory purposes. Because of this, the following sections will proceed from confirmatory statistics (§4-6) to exploratory statistics (§7) to frame this introduction. Moreover, even though the exploration-confirmation distinction may break down in practice, it is important not to frame the results of exploratory analysis in terms of confirmatory analysis, as if they had been predicted in advance (Roettger, Winter and Baayen 2019). The majority of the remainder of this chapter is devoted to confirmatory statistics as opposed to exploratory statistics not because the latter is less important, but because confirmatory statistics has recently undergone massive changes in our field, away from significance tests towards statistical models and parameter estimation. Because this approach is still new in some subfields and new textbooks do not necessarily teach the full scope of this framework, the emphasis will be on confirmatory statistical models.
4 Why cognitive linguistics needs to move away from significance tests We start the journey of confirmatory statistics with what is still the status quo in many subfields of linguistics. To this day, the notion of ‘statistics’ is synonymous with ‘null hypothesis significance testing’ (NHST) to many researchers. Undergraduate statistics courses still emphasize the use of such NHST procedures as t-tests, ANOVAs, Chi-Square tests etc. This includes many existing introductions in cognitive and corpus linguistics (Brezina 2018; Gries 2009; Levshina 2015; Núñez 2007; Wallis 2021). All significance tests have a primary goal, which is to yield a p-value. Informally, this statistic measures the incompatibility of a given dataset with the null hypothesis. If a p-value reaches a certain threshold, the ritual of NHST involves that the null hypothesis is rejected, and the researcher claims to have obtained a “significant” result. The true meaning of the p-value, however, is so counter-intuitive that even most statistics textbooks (Cassidy et al. 2019) and statistics teachers fail to discuss it accurately (Gigerenzer 2004; Haller and Krauss 2002; Lecoutre, Poitevineau and Lecoutre 2003; Vidgen and Yasseri 2016). By itself, the p-value alone does not tell us very much (Spence and Stanley 2018), and is only a very weak indicator of whether a study will replicate, or is strong, or “reliable.”
20
Bodo Winter
The over-reliance on significance tests in the behavioral and cognitive sciences, including linguistics, has been widely criticized in the statistical and psychological literature for now nearly a century (Kline 2004). In fact, many now believe that the ‘statistical rituals’ (Gigerenzer 2004) encouraged by the use of significance tests may be one of the key factors that have contributed to the replication crisis in the first place. But data analysis is so much more than subjecting the data to a prefab hypothesis testing procedure, which is why the field of linguistics has undergone a dedicated shift away from these methods towards the more theory-guided process of statistical modeling and parameter estimation (Baayen, Davidson and Bates 2008; Jaeger 2008; Jaeger et al. 2011; Tagliamonte and Baayen 2012; Wieling et al. 2014). This change from statistical testing to statistical modeling is also happening in cognitive linguistics (e.g., Gries, 2015a; Levshina, 2016, 2018; Winter, 2019b). To be clear: significance testing can also be done with statistical models, but a key difference is that the emphasis shifts from subjecting the data to an off-the-shelf procedure such as a t-test or a Chi-square test, towards considering the estimation of parameters in the form of multifactorial statistical models (Gries 2015b; Gries 2018). The latter approach is less limiting and allows for a more theory-guided approach to statistical analysis. Most importantly for our purposes, significance tests make for a very bad way of decluttering the landscape of statistics. Each significance test is a highly specific tool that can be applied only in extremely limited circumstances. Recommendations about statistical methodology then often take the form of decision trees and statements like “if you have this hypothesis and this data, use test X, otherwise use test Y”. However, rather than worrying about picking the right test, we should channel our energy into theory-driven reasoning about data. In contrast to significance testing as a conceptual framework, statistical modeling encourages thinking about how our preexisting beliefs (= linguistic domain knowledge / theories / hypotheses / assumptions) relate to a dataset at hand in a more principled fashion. This is ultimately much more intellectually engaging than picking a test from a decision tree of different pre-classified options, and it encourages thinking more deeply about how one’s theory relates to the data at hand. Luckily, the world of statistical modeling also turns out to be much easier to navigate than the world of significance testing. In fact, there is just one tool that will cover most of the use cases that commonly arise in linguistics. This tool is the linear model, an approach that can be flexibly extended to deal with all sorts of different theoretical proposals and data structures. The linear model framework makes it possible to represent the same data structures that significance tests are used for, which renders it unnecessary to teach significance tests in this day and age.
Mapping the landscape of exploratory and confirmatory data analysis
21
5 Using linear models to express beliefs in the form of statistical models The statistical models we will discuss here are all versions of what is called the ‘linear model,’ or sometimes ‘general linear model,’ also discussed under the banner of ‘(multiple) regression analysis.’ It is potentially confusing to novices that the different models bear different names that may sound like they are entirely different approaches. For example, consider this long list of terms: generalized linear models, linear mixed effects models, multilevel models, generalized additive models, structural equation models, path analysis, mediation analysis, moderation analysis, Poisson regression, logistic regression, hierarchical regression, growth curve analysis, . . .
This array of terms may seem daunting at first, but we should take comfort in the fact all of it is built on the same foundations. In fact, they are all versions or extensions of a particular approach that, in its essence, is easy to grasp. This is one of the key conceptual advantages of the linear model framework, which is that it leads to a very unified and coherent picture of the landscape of statistics, regardless of the apparent diversity of terms suggested by the list above. Any of the linear models or regression models we will consider here have the same structure: One singular response or ‘outcome’ variable is described as varying by a set of predictor variables. An alternative terminology is to say that the dependent variable is modeled as a function of one or more independent variables. Thus, this form of statistical model is focused on describing how one singular quantity of interest (such as ratings, response times, accuracies, performance scores, word frequencies etc.) is influenced by one or more predictors. The analyst then focuses on thinking about which predictors they think would influence the response, thereby implementing their assumptions about the relations in the data into a statistical model. To give a concrete example of a linear model, consider the observation that in English, many words related to taste are positive (such as sweet, delicious, juicy, tasty, peachy), whereas on average, words related to smell are relatively more negative (such as rancid, pungent, stinky, odorous) (Winter 2016; Winter 2019b). To test this generalization, we can use existing perceptual ratings for words (Lynott and Connell 2009) in combination with ‘emotional valence’ ratings, which describe the degree to which a word is good or bad (Warriner, Kuperman and Brysbaert 2013). Figure 1.1a visualizes the correlation between these two quantities (taste-relatedness and emotional valence). As can be seen, words that are relatively more strongly related to taste are on average more
22
Bodo Winter
positive than words that are less strongly related to taste, although this is obviously a very weak relationship given the large scatter seen in Figure 1.1 a. The superimposed line shows the corresponding linear or ‘regression’ model. This model describes the average emotional valence (whether a word is good or bad, on the y-axis) as a function of how much a word relates to taste (on the xaxis). The beauty of the linear model framework is that the underlying mathematics of lines can easily be extended to incorporate predictors that are categorical, such as seen in Figure 1.1b. This works by pretending that the corresponding categories (in this case, the binary distinction between ‘taste words’ and ‘smell words’) are positioned on a coordinate system (Winter, 2019b, Ch. 7). The two models corresponding to Figure 1.1a and Figure 1.1b can be expressed in R as follows, with the first line (dark grey) representing the user input command, and the following lines (light grey) showing the output. The reader interested in the details of the implementation within R should consult Winter (2019a), a book-length introduction to the basics of linear models. Here, only a brief overview of the overall logic of the approach is presented. lm(valence ~ taste_relatedness) Coefficients: (Intercept) taste 3.2476 0.4514
lm(valence ~ taste_vs_smell) Coefficients: (Intercept) taste_vs_smellSmell 5.3538 -0.9902
The R function lm() is named this way because it fits linear models. The tilde in the formula specifies that the term on the left-hand side (in this case, emotional valence) is ‘described by’, ‘predicted by’, ‘conditioned on’, or ‘modeled as a function of’ the term on the right-hand side. All input to linear models takes this general form, with the response on the left, and the predictor(s) on the right: ‘response ~ predictors’. Each of the terms in the model, such as in this case valence, taste_relatedness, and taste_vs_smell, corresponds to a column in the spreadsheet that is loaded into R. To understand the above output and interpret the model, we need to remind ourselves that a line can be described by two numbers: an intercept, and a slope. The intercept is the point where the line crosses the y-axis (which is
23
Mapping the landscape of exploratory and confirmatory data analysis
(a) Continuous predictor
(b) Categorical predictor
9
9
fragrant
7
sweet delicious juicy
perfumed peachy mild
6 5
salty
4
bland sweaty putrid
3 smelly
2
bitter alcoholic
rancid
8
Emotional valence
Emotional valence
8
fatty
7 6 5 4 3 2
1
1 0
1
2
3
4
5
Taste =0
Smell =1
Taste−relatedness
Figure 1.1: a) Emotional valence as a function of how much a word relates to smell; b) emotional valence as a function of the categorical taste versus smell difference.
conventionally positioned at x = 0). Informally, we can think of the intercept as corresponding to the ‘height’ of the regression line (higher intercepts mean that the line is overall shifted upwards). The slope describes the degree to which y depends on x, with Figure 1.1a giving an example of a positive slope and Figure 1.1b giving an example of a negative slope. Taken together, the intercept and slope are called ‘coefficients.’2 In any actual data analysis, a considerable amount of time should be spent on interpreting the coefficients to understand what exactly it is that a model predicts. For the continuous model above, the output value of the intercept, 3.2476, corresponds to the white square in Figure 1.1a, where the line crosses the y-axis. This is the predicted value for a word with zero taste rating. The intercept is often not particularly interesting, but it is necessary to ‘fix’ the line along the y-axis. Oftentimes we are more interested in the slopes, as each slope expresses the relationship between the response and a given predictor. In the output above, the slope value of 0.4514 has the following interpretation: increasing the taste-relatedness by one rating unit leads to a positive increment in emotional valence ratings by this value. Our model of this data, then, corresponds to the equation of a line: y = 3.25 + 0.45 * taste (rounded). We can use this equation to make predictions: For example, we can plug in a taste rating of ‘3’ to assess what emotional valence rating this model predicts for this specific taste rating: 3.25 + 0.45 * 3 = 4.6 (rounded).
2 Some textbooks use the term ‘coefficient’ only for the slope.
24
Bodo Winter
This basic picture does not look markedly different for the case of a categorical predictor, except that the corresponding slope has to be interpreted as a categorical difference between two groups. In the output above, the number −0.9902 represents the difference in emotional valence between taste and smell words. Thinking in terms of lines, this difference can be conceptualized as moving from the taste words at x = 0 (the intercept) down to the smell words at x = 1. It is this mathematical trick – positioning categories within a coordinate system – that allows linear models to easily incorporate continuous predictors (Figure 1.1a) as well as categorical predictors (Figure 1.1b). The basic idea of expressing the relation between y and x in terms of coefficients can be extended to the case of ‘multiple regression,’ which involves adding more predictors to the model, each one associated with its own coefficient that describes how that particular predictor is related to the response variable. This is exemplified in the following schematic R function call: lm(response ~ predictor1 + predictor2 + predictor3) Coefficients: (Intercept) predictor1 predictor2 predictor3 ? ? ? ?
The function call (dark grey) can be thought of as a more technical way of expressing our hypotheses in the form of an equation. This particular formula notation can be paraphrased as “I want to assess whether the response is influenced jointly by predictor1, predictor2, and predictor3.” The linear model will then estimate the corresponding coefficients – one slope for each predictor. Each slope expresses the relationship between the response and that specific predictor while holding all the other predictors constant. For example, the slope of predictor1 corresponds to how much predictor1 is statistically associated with the response while controlling for the influence of the other predictors. If the slope is positive, increases in predictor1 result in an increase of the response. If the slope is negative, increases in predictor1 result in a decrease of the response. We can think of the coefficients as placeholders specified by the user, which the linear model in turn will ‘fill’ with estimates based on the data. In the schematic function call above, this placeholder nature is represented by the question marks. This highlights how fitting a linear model essentially corresponds to a set of questions (what is the slope of each of these terms?) that the model will try to answer. Given a model specification and given a particular dataset, the model actually fills the question marks with the best-fitting coefficient estimates, those values that ensure that the predictions are closest to all data
Mapping the landscape of exploratory and confirmatory data analysis
25
points. However, the linear model only performs optimally with respect to the set of instructions that the data analyst has specified. If the user has missed important predictors, the model cannot know this. It can only answer the questions it has been asked to answer, which is why researchers should spend a lot of time thinking about the linear model equation – ideally prior to collecting the data. If one uses linear models in a confirmatory fashion, the inclusion of each predictor into the model should be theoretically motivated. It is therefore good practice to specify a linear model in advance – before loading the data into any statistical software. Or, even more in line with a fully confirmatory approach, a researcher can pre-register one’s analysis in a publicly accessible repository prior to collecting the data (Roettger 2021). The two cognitive linguistics-oriented journals Language and Cognition and Cognitive Linguistics have a special article category called ‘Registered Reports’ that requires pre-specifying an analysis plan prior to collecting the data. In my experience teaching statistics, novice analysts generally make their life harder by jumping into a statistical software package too quickly. Everything becomes much easier if considerable time is spent on determining which predictors should or should not be included in advance, based on theory, literature, and domain knowledge. There are procedures for changing the model in response to the data (e.g., “model selection” techniques such as LASSO) that will not be discussed here. Moreover, in Bayesian statistics, several researchers recommend expanding models based on how well they can generate novel data in line with existing data (Gelman and Shalizi 2013; Kruschke 2013). However, despite the existence of such approaches, it is still useful and recommended to think as much as possible about a model in advance of performing an analysis or collecting the data. The next section discusses how linear models can be expanded to assess more complex theoretical ideas involving interactions.
6 Linear models with interactions Linear models can be expanded to include interaction terms. These are best explained by example. Here, I will draw from Winter and Duffy (2020), an experimental study on gesture and time metaphors in which interactions were of key theoretical interest. This experiment follows up on the famous “Next Wednesday” question that has been used extensively to probe people’s metaphorical conceptualization of time (Boroditsky and Ramscar 2002; McGlone and Harding 1998). When asked the following question . . .
26
Bodo Winter
“Next Wednesday’s meeting has been moved forward two days – what day is the meeting on now?”
. . . about half of all English speakers respond ‘Friday,’ and half respond ‘Monday’ (Stickles and Lewis 2018). This is because there are two ways of conceptualizing time in English, one with an agent moving forward through time (reflected in such expressions as We are approaching Christmas), another one with the agent being stationary and time moving towards the agent (reflected in such expressions as Christmas is coming). Jamalian and Tversky (2012) and subsequently Lewis and Stickles (2017) showed that certain gestures can change whether people respond Monday or Friday. If the question asker moves the gesturing hands forwards (away from their torso), an ego-moving perspective is primed, which implies a shift from Wednesday towards Friday. If the question asker moves the gesturing hand backwards (from an extended position towards their torso), a time-moving perspective is primed, thus implying a shift from Wednesday to Monday. In our follow-up study to these experiments, we wanted to know to what extent gesture interacts with the concomitant language. That is, how much do language and gesture co-depend on each other in determining time concepts? For example, can forwards/backwards movement in gesture alone push people forwards/backwards along the mental time line, even if the corresponding language does not use any spatial language at all? Or is spatial language needed in order to make people pay attention to the direction of the gesture? In one of our experiments (Winter and Duffy, 2020, Experiment 4), we manipulated two factors, each one of which is a categorical predictor in the corresponding linear model: The first factor is gestural movement, whether the hands move forwards or backwards. The second factor is whether the language was spatial (moved by two days) or not (changed by two days). The corresponding model that we used had the following basic structure: glm(response ~ gesture * language,. . .) Coefficients: (Intercept) gesture language ? ? ?
gesture:language ?
The use of glm() as opposed to lm() is irrelevant for the present discussion and will be explained in the next section (§7). What matters here is the fact that the above function call combines predictors with the multiplication symbol ‘*’ rather than using the plus symbol ‘+’, as in the last section. This difference in notation instructs the statistical model to not only estimate the effects of gesture
Mapping the landscape of exploratory and confirmatory data analysis
27
and language, but also the effects of unique combinations of both predictors. Another way of thinking about this interaction is to say that one predictor has a different effect for specific values of the other predictor. For example, the forwards/ backwards effect could be nullified if the language is non-spatial, which is indeed what we found (Winter and Duffy 2020). In the output, the interaction appears as a third term in the model, gesture:language. The size of this coefficient corresponds to the strength of the interaction. The larger this coefficient is (both positive or negative), the more do the gesture and language predictors co-depend on each other in changing the response. In linguistics, many statistical models include such interactions. One issue that arises, however, is that once two predictors are ‘interlocked’ by virtue of participating in an interaction, each predictor’s influence has to be interpreted with respect to the specific values of the other predictor. In the presence of an interaction, what influence a predictor has on the response variable will depend on the specific level of the other predictor, and so there is no easy-to-interpret ‘across the board’ effect for the individual predictors anymore. As a result, interactions generally make models harder to interpret. Thus, while interactions are often theoretically interesting and need to be included if a hypothesis actually specifies that one predictor’s influence on the response depends on another predictor, including interaction terms also comes at the epistemological cost of making models harder to interpret. The question whether an interaction should or should not be included depends on theory. In the case of Winter and Duffy (2020), the interaction was the primary effect of theoretical interest and therefore had to be included into the model. As it is easy to misinterpret the output of statistical models that contain interactions, the reader is advised to consult a statistics textbook on this material. Winter (2019a) has a full chapter focused on the interpretation of interactions.
7 Becoming a more flexible data analyst via extensions of linear models 7.1 Generalized linear models In the first regression example we discussed above (§5), the response was continuous. Each word was represented by an average rating where words are more or less good, in a scalar manner (Warriner, Kuperman and Brysbaert 2013). The Monday/Friday response in the second example (§6) was discrete. As discussed above, predictors in linear models can be continuous or categorical. However, to incorporate discrete responses, a more substantive change to the
28
Bodo Winter
model is required. Generalized linear models (GLMs) are an extension of linear models that allow incorporating different assumptions about the nature of the response variable. The generalized linear model framework subsumes the linear models we discussed so far. That is, the multiple regression models we discussed above (§5-6) are specific cases of the generalized linear model. Table 1.1 gives an overview of the three ‘canonical’ generalized linear models that cover a lot of common use cases in linguistics. Table 1.1: Three of the most common types of response variables and the most canonical generalized linear models that correspond to them. Response variable
Generalized linear model
continuous
multiple regression
discrete: binary (fixed N)
logistic regression
discrete: count (no fixed N)
Poisson regression
In linguistics, logistic regression is generally used when the response variable is binary, such as was the case with the Monday/Friday responses in the example above. Other response variables that are binary include things such as the English dative alternation (Bresnan et al. 2007), the usage of was versus were (Tagliamonte and Baayen 2012), or the presence/absence of a metaphor (Winter 2019b). Any case where the response involves only two categories is amenable to logistic regression, and in the form of multinomial logistic regression, the approach can be extended to include response variables with more than two categories. Poisson regression is another type of generalized linear model that is incredibly useful for linguistics because it is the canonical model type to deal with count variables that have no known or fixed upper limit. Example applications include showing that visual words are more frequent than non-visual words (Winter, Perlman and Majid 2018), or modeling the rate of particular fillers and discourse markers as a function of whether a speaker speaks politely or informally (Winter and Grawunder 2012). Given that linguists frequently count the frequency of discrete events, Poisson regression should be a natural part of the linguistic toolkit (Winter and Bürkner 2021). Conceptually, the core ideas discussed in relation to multiple regression (§4) carry over to the case of generalized linear models. Just as before, fitting a generalized linear model to a dataset yields estimates of slopes, with each slope representing how much a binary variable (logistic regression) or unbounded count variable
Mapping the landscape of exploratory and confirmatory data analysis
29
(Poisson regression) depends on the predictor(s) of interest. However, a key difference to the more basic case of multiple regression is that the slopes will appear in a different metric. In the case of Poisson regression for unbounded count data, the coefficients will appear as logged values; in the case of logistic regression for binary data, the coefficients will appear as log odds. The reader is advised to read an introductory text on generalized linear models to aid the interpretation of the exact numerical values of the coefficients (Winter 2019a; Winter and Bürkner 2021).
7.2 Mixed models / multilevel models All generalized linear models, including standard multiple regression, assume that data points are independent. For linguistics, this means that an ‘individual’ can only contribute one data point to the whole data set. What counts as ‘individual’ in linguistics depends on the type of study and how it is designed (Winter and Grice 2021): In many contexts, the ‘individual’ is an actual person. This is often the case in such subfields as psycholinguistics, phonetics, sociolinguistics, or experimental syntax where repeated measures designs are common, which leads to experiments that include multiple data points from each person. However, the term ‘individual’ as used here has a broader meaning, essentially incorporating any grouping factor. For example, if a corpus analysis included multiple data points from the same text, then ‘text’ could be an individual unit of observation. If the same corpus analysis included multiple data points from the same author, ‘author’ would be another grouping factor. Ignoring the fact that data contains multiple data points from the same individual or group has dire consequences for the outcomes of a statistical analysis. These problems are discussed under the banner of the “independence assumption” of statistical tests, and they are also discussed under the banner of ‘pseudoreplication’, which is a term used in certain fields, such as ecology, to refer to erroneously treating statistically dependent observations as independent. For a classic introduction to the notion of “pseudoreplication”, see Hurlbert (1984). For a more general discussion of the independence assumption in statistical modeling and consequences for different subfields of linguistics, including corpus linguistics, see Winter and Grice (2021). It is now standard in many different subfields of linguistics to include individual or grouping factors into the modeling process to statistically account for the fact that data points from the same individual or group are dependent (see e.g., Baayen et al., 2008; Tagliamonte and Baayen, 2012; Winter, 2019b, Ch. 13). In fact, the ability to account for multiple grouping data structures in a principled manner is one of the major reasons why the field has moved away from significance tests (Winter
30
Bodo Winter
and Grice 2021), which make it hard and sometimes impossible to account for multiple nested or crossed dependencies in the data. The way to deal with non-independent clusters of observations within a generalized linear model framework is to incorporate random effects into the model. The mixing of the regular predictors we have dealt with in the last few sections (now called ‘fixed effects’ in this framework) and what are called ‘random effect’ predictors is what gives mixed models their name. Mixed models are also called multilevel models, linear mixed effects models, or multilevel regression, and specific instances of these models are also discussed under the banner of hierarchical linear regressions. Gries (2015a) calls mixed models “the most under-used statistical method in corpus linguistics.” McElreath (2020: 400) states that such “multilevel regression deserves to be the default approach.” Clearly, there is no point in using mixed models if a particular application does not call for it. However, because data sets in linguistics will almost always include repeated data points from the same ‘individual’ (person, word, language family, text etc.), mixed models are almost always needed (Winter and Grice 2021). A random effect can be any categorical variable that identifies subgroups in the data, clusters of observations that are associated with each other by virtue of coming from the same individual. The word ‘random’ throws some novices off because differences between grouping factors are clearly not ‘random’, i.e., a specific participant may systematically respond differently from another participant in a study. It therefore helps to think of ‘randomness’ in terms of ‘ignorance’: by fitting a specific grouping variable as a random effect, we are effectively saying that prior to the study, we are ignorant about the unique contribution of each individual. Random effects then estimate the variation across individuals. It is entirely possible (and indeed, often required) to have random effects for participants in the same model in which there are also fixed effects that are tied to the same individuals. For example, we may hypothesize that gender and age systematically affect our response variable, and we want our mixed model to include these two variables as fixed effects. In addition, the same model can, and indeed probably should, also contain a random effect for participant. Whereas the fixed effects capture the systematic variation that an individual is responsible for (e.g., for an increase in x years of age, the response changes by y); the random effects capture the idiosyncratic contribution of that individual. Thus, including fixed effects tied to specific individuals does not preclude the inclusion of additional individual-specific random effects. Importantly, the incorporation of random effects into the modeling process is key to avoiding violations of the independence assumption. Ignoring important random effects can lead to grossly misleading results, as has been extensively
Mapping the landscape of exploratory and confirmatory data analysis
31
discussed in linguistics and elsewhere (Barr 2013; Barr et al. 2013; Matuschek et al. 2017; Schielzeth and Forstmeier 2008; Winter 2019a; Winter and Grice 2021). The reason for this is that fixed effects, such as condition effects, have to be evaluated against random effect variation. If the random effect variation is not actively estimated in the modeling process, fixed effects estimates can be severely overconfident, leading to a much higher rate of spuriously significant results. Because of this, it is of utmost importance that the researcher spends a lot of time thinking about whether there are non-independent clusters in their data set that need to be accounted for. The perspective so far has focused on the perspective of including random effects to make sure that the fixed effects in the same model are estimated accurately. However, it is important to emphasize that random effect variation itself may actually be the primary thing that is of theoretical interest in some studies (for examples, see Baumann and Winter, 2018; Drager and Hay, 2012; Idemaru et al., 2019; Mirman et al., 2008). Some analyses may also require models that have more random effects than fixed effects (e.g., Ćwiek et al., 2021). It is important to think about random effect variation as theoretically interesting in its own right, and to interpret the random effect output of one’s models. For a basic introduction to mixed models, see Winter (2019a).
7.3 Example models within cognitive linguistics The trajectory of this chapter so far has been an expansion of the statistical modeling repertoire. This is not, like in the case of significance tests, adding new, fundamentally distinct tools to our toolkit. Instead, we take the very same tool (focused on the relation of a response and a predictor in terms of lines) and expand this tool to binary and count data (generalized linear models: logistic regression and Poisson regression), as well as to cases where there are multiple data points for the same grouping factor (mixed models). Table 1.2 shows some different types of models applied to test cognitive linguistic theories. Plain text descriptions of the corresponding R formula notation should help the reader get a better grasp of the extent of the linear model framework, and how this translates into actual data analyses conducted in cognitive linguistics. While the models have different names (“multiple regression”, “logistic regression” etc.), it has to be borne in mind that they are built on the same foundations.
32
Bodo Winter
Table 1.2: Examples of linear model formulas in cognitive linguistic work. Littlemore et al. (2018) lm(metaphor_goodness ~ frequency + concreteness + emotional_valence) Multiple regression: This model describes the extent to which a continuous measure of metaphor goodness depends on the frequency, concreteness, and emotional valence of a metaphor. Winter (2019a, Ch. 17) lm(metaphoricity ~ iconicity + valence) Multiple regression: This study operationalized metaphoricity in a continuous fashion using a corpus-based measure; the research question was whether iconicity (e.g., the words bang and beep are iconic) and the emotional quality of words determine the likelihood with which the words are used as source domains in metaphor. Winter, Perlman, and Majid () glm(word_frequency ~ sensory_modality, family = poisson) Poisson regression: The token frequency of words in a corpus (a categorical count variable) was conditioned on which sensory modality (touch, taste, smell, sight, sound) the word belongs to; of interest here is whether visual words are more frequent than non-visual words. Hassemer and Winter (2016) glm(height_versus_shape ~ pinkie finger curl * index curve, family = binomial) Logistic regression: In this experimental study, participants had to indicate whether a gesture depicted the height or the shape of an object; the above model formula expresses the belief that this binary categorical response depends on two predictors that we experimentally manipulated: either the index finger was more or less curved, or the pinkie finger was more or less curled in. Additionally, we were interested in the interaction of these two hand configuration predictors (it is plausible that specific combinations of pinkie curl and index curve values have a unique effect on the choice variable). Winter, Duffy and Littlemore (2020), simplified lmer(RT ~ participant_gender * profession_term_gender * verticality) (additional random effects for participant and item not shown) Linear mixed effects regression: In this reaction time experiment, we were interested in replicating the finding that people automatically think of power in terms of vertical space because of the conceptual metaphor POWER IS UP. The basic idea is that seeing a word pair such as “doctor ~ nurse” with the word “doctor” shown on top of a screen and the word “nurse” shown at the bottom of the screen will be faster than the reverse mapping (with the less powerful position on top). In addition, we manipulated the gender of the profession terms (e.g., “male doctor” or “female doctor”) and we also wanted to assess whether responses differed as a function of the participant’s gender. Our results provided evidence for a three-way interaction between the participant’s gender, the gender of the profession term, and whether the vertical arrangement was in line with POWER IS UP or not: male participants responded much more quickly when the vertical alignment was consistent with the metaphor and the male profession term was shown on top.
Mapping the landscape of exploratory and confirmatory data analysis
33
7.4 Further extensions of the framework Further extensions of the linear model framework are possible, and specific data sets and theoretical assumptions may require a move towards more complex model types. One set of extensions is in the direction of structural equation models (SEM), which involve extending the linear model framework either by adding what are called ‘latent variables’ (variables that cannot be directly observed), or by adding complex causal paths between predictors, such as when one predictor influences the responses indirectly, mediated by another predictor. Fuoli, this volume, discusses these concepts in more detail. An additional extension of linear models are generalized additive models, or GAMs. These models are increasingly gaining traction within linguistics (Wieling et al. 2014; Winter and Wieling 2016), especially psycholinguistics (Baayen et al. 2017) and phonetics (Wieling 2018). GAMs are (generalized) linear models that involve the addition of ‘smooth terms,’ which are predictors that are broken up into a number of smaller functions. This allows the inclusion of nonlinearities into one’s modelling process. Such nonlinearities are useful when dealing with spatial data, such as in dialectology, sociolinguistics, or typology, but they are also useful for dealing with temporal data, such as in time series analysis (compare Tay, this volume). This means that GAMs could be used, for example, for modeling such diverse aspects of linguistic data as pitch trajectories, mouse movements in a mouse-tracking study, gesture movements on a continuous scale, or language evolution over time. Both SEMs and GAMs can also incorporate random effects, in which case they would be mixed SEMs or mixed GAMs. Moreover, since all of these are extensions of the same generalized linear model framework, each one of these approaches can also be logistic regression models (binary data) or Poisson regression models (unbounded count data), just with additional paths or latent variables (SEM) or with additional smooth terms (GAM). In fact, all of these different extensions of linear models are mutually compatible. For example, a GAM can also include random effects or latent variables. Figure 1.2 gives one overview of how the different classes of models can be conceptualized. At this stage in this overview, the reader may get the impression that we are back to some sort of decision tree where we have to choose the right model, just what I have argued is a conceptual disadvantage of the significance testing framework. However, the picture painted here is fundamentally different to the case of significance tests. In the case of the linear model framework, the analysis process involves reasoning about one’s model and building all the things that are hypothesized to matter into a singular model. For example, if there are multiple observations from the same individual in a dataset, random effects need to
34
Bodo Winter
Figure 1.2: Snapshot of a portion of the generalized linear model framework and some common extensions.
be added. If there are also hypothesized nonlinear effects, smooth terms need to be added, and so on. What type of model is needed, then, follows from theoretical considerations and one’s domain knowledge about the dataset at hand. The reader should not put the question “What model should I choose?” first, but instead focus on the guiding question: “What are my assumptions about this data?” Or, more informally, “What do I know about this data that my model needs to know?” There simply is no default way of answering these questions, as this depends on the knowledge, assumptions, and theoretical leaning of the data analyst. Therefore, different researchers come up with different statistical analyses for the same research questions (Botvinik-Nezer et al. 2020; Silberzahn et al. 2018), and this subjectivity of statistical modeling should be endorsed, rather than eschewed (McElreath 2020). We should stay away from any default recipes and instead focus on the thinking part in statistical modeling, arguably that what makes data analysis fun and inspiring.
8 Exploratory statistics: A very brief overview of some select approaches 8.1 General overview As mentioned above, exploratory data analysis is one of the two key ways that we engage with data, it is one of the two ‘sensemaking modes’ of data analysis. Within statistics, one of the names that is most commonly associated with exploratory data analysis is John Tukey, who characterizes the process of exploratory data analysis as “detective work” (Tukey 1977: 1). It is arguably the case that exploratory data analysis has historically been more important for linguists (Grieve 2021), given that the field is founded on detailed and genuinely exploratory “detective work”, such as the early historical linguistics in the 19th century, the rich tradition of descriptive and field linguistics throughout
Mapping the landscape of exploratory and confirmatory data analysis
35
the 20th century, and the rich tradition of observational research conducted under the banner of corpus linguistics since the middle of the 20th century. It is important that exploratory statistics are not viewed as theory-neutral or inferior to confirmatory statistics (Roettger, Winter and Baayen 2019). One form of exploratory data analysis is data visualization, and indeed, this was a primary focus of Tukey’s work on this topic. In fact, all descriptive statistics (summarizing data) and visualization can be conducted in a genuinely exploratory fashion, looking to see what the data has to offer. For an excellent practical introduction to data visualization with R, see Healy (2019). However, here I want to focus on two approaches that are not only particularly useful for cognitive linguists, but that have also been widely used within the language sciences, especially in corpus linguistics. These approaches can be split up into two broad categories, shown in Table 1.3. Other approaches, with different goals, will be discussed below. Table 1.3: Two common goals in exploratory data analysis and corresponding approaches. Goal
Example techniques
grouping variables
Exploratory Factor Analysis, (Multiple) Correspondence Analysis, . . .
grouping data points
k-means, hierarchical cluster analysis, Gaussian mixture models, . . .
Each row in this table corresponds to a specific analysis goal: Is the target of one’s investigation to look at relationships between lots of variables, grouping them together into a smaller set of underlying factors? Or is the target of one’s investigation to find subgroups of data points (‘clusters’)? The approaches that are used to answer these two questions differ from the above-mentioned linear model framework in a fundamental fashion in that they are genuinely multivariate. This means that in contrast to regression modeling, there is no one primary response variable. Instead, these approaches deal with multiple outcome variables at the same time. For the approaches listed in Table 1.3, there is no asymmetry between ‘predictor’ and ‘response’. All variables are on equal terms.
8.2 Grouping variables with exploratory factor analysis To exemplify both approaches, we can follow an analysis presented in Winter (2019b), which uses the perceptual ratings for adjectives from Lynott and Connell (2009). The input data has the following structure, with each column
36
Bodo Winter
corresponding to ratings on one sensory modality, and each row corresponding to a particular adjective. The word abrasive, for example, has a relatively high touch rating and much lower taste and smell ratings. In contrast, the word acidic is much more strongly related to taste and smell.
abrasive absorbent aching acidic
sight 2.894737 4.142857 2.047619 2.190476
touch 3.684211 3.142857 3.666667 1.142857
sound 1.6842105 0.7142857 0.6666667 0.4761905
taste 0.57894737 0.47619048 0.04761905 4.19047619
smell 0.57894737 0.47619048 0.09523809 2.90476190
With Exploratory Factor Analysis (EFA), we focus on relationships between the columns. The entire correlation structure between all variables is investigated in a simultaneous fashion, looking to see whether particular variables can be re-expressed in terms of being part of a single underlying factor. Running an EFA on this ‘word by modality’ matrix suggests that there may be two underlying factors in this set of variables. The following summary of ‘loadings’ allows looking at how the original variables relate to the new set of factors. A loading expresses how strongly an individual variable latches onto a factor, with the sign of the loading expressing whether there is a positive association or negative association, which can be thought of as being analogous to a positive correlation (more of X gives more of Y) or a negative correlation (more of X gives less of Y). Two loadings for factor 2 are missing in the output below because they do not exceed the threshold taken to be a strong-enough loading by the base R function factanal() used to compute these results. Loadings: Factor1 Factor2 sight -0.228 0.674 touch -0.177 0.496 sound -0.445 -0.654 taste 0.824 smell 0.945 A crucial part of doing an Exploratory Factor Analysis is interpreting what the new factors mean. It is not guaranteed that an EFA will yield a theoretically interpretable solution. In this case, however, clear patterns emerge: The positive values for taste and smell, as opposed to the negative values for all other modalities, suggest that the first factor represents how much a word is related to
Mapping the landscape of exploratory and confirmatory data analysis
37
taste and smell. The fact that these two variables load heavily onto the same factor is theoretically interesting given that prior psychological research suggests that taste and smell are perceptually and neurally highly coupled (e.g., Auvray and Spence, 2008; De Araujo et al., 2003). Sight and touch load heavily onto the second factor, with a strong negative loading for sound, suggesting that this factor represents how much things can be touched and seen as opposed to heard. Theoretically, this factor solution can be thought of as an alternative, more parsimonious, way of representing the perceptual structure of the sensory lexicon of English. There are two underlying factors that allow capturing most of the ways words differ from each other in terms of their sensory characteristics. In this case, these two factors together account for 60% of the variance in the overall ratings. The insight here is that a larger set of variables can be compressed into a much smaller set of factors without losing too much information. This general principle is called dimensionality reduction and can be likened to looking at the night sky, which is a two-dimensional projection of three-dimensional space. Other dimensionality reduction techniques include Principal Components Analysis and (Multiple) Correspondence Analysis. Multidimensional Scaling is a conceptually similar approach that is aimed at finding the underlying structure of similarity or dissimilarity data.
8.3 Grouping data points with cluster analysis The above Exploratory Factor Analysis answers the question: Are there any groups of variables? We can use the same data to answer the question: Are there any groups of data points? For this, we use the same ‘word by rating’ matrix, but our focus will be on grouping the words (rows) rather than the columns (variables). ‘Cluster analysis’ – itself a vast field of statistics – is the approach that allows answering this question. There are many different specific algorithms that realize this goal, with k-means and various forms of hierarchical cluster analysis being common in corpus linguistics. For a conceptual introduction to cluster analysis in cognitive linguistics, see Divjak and Fieller (2014). In the case of the sensory modality data, I opted to use the specific clustering technique of Gaussian mixture models (Winter 2019b). In contrast to such approaches as k-means and hierarchical cluster analysis, Gaussian mixture modeling is a clustering technique that has the key theoretical advantage of allowing for fuzzy overlap between clusters, with some words being more and others being less certain members of each cluster. Moreover, Gaussian mixture models actually yield a genuine model of clusters (with parameter estimates),
38
Bodo Winter
rather than merely a heuristic partitioning of the data. Either way, applying this method to the sensory modality rating dataset yielded 12 clusters (various model fit criteria can be used to find the best cluster solution). The same way that there is no guarantee that Exploratory Factor Analysis produces interpretable factors, there is no guarantee that any cluster analysis method produces interpretable clusters. To interpret whether the cluster solution produces sensible results that can be meaningfully related to existing linguistic proposals, we can look at the most certain words for each cluster, shown in Table 1.4. Table 1.4: Two common goals in exploratory data analysis and corresponding approaches. Clusters Proposed name
Adjectives ordered in terms of certainty
pure sight
gray, red, brunette, brown, blonde, reddish, yellow, . . .
shape and extent
triangular, conical, circular, curved, little, bent, . . .
gross surface properties
crinkled, bristly, prickly, big, sharp, bumpy, wiry, . . .
motion, touch, and gravity craggy, ticklish, low, swinging, branching, scratchy, . . .
skin and temperature
tingly, lukewarm, tepid, cool, warm, clammy, chilly, . . .
chemical sense
acrid, bitter, tangy, sour, salty, antiseptic, tasteless, . . .
taste
cheesy, chocolatey, bland, unpalatable, alcoholic, . . .
smell
odorous, whiffy, perfumed, reeking, smelly, stinky, . . .
sound
noisy, deafening, bleeping, silent, whistling, . . .
sound
sonorous, squeaking, melodious, muffled, creaking, . . .
impression-related
stormy, cute, crowded, crackling, clear, lilting, . . .
multisensory
beautiful, burning, gorgeous, sweaty, clean, strange, . . .
In Winter (2019b), I discussed these different clusters and their relation to the existing literature on sensory words in detail. The words in some clusters form clearly semantically coherent groups, such as the ‘purse sight’ cluster, which contains color words. Other clusters, however, are less semantically coherent, such as the ‘multisensory’ and ‘impression-related’ categories. Just like EFA, cluster analysis is a purely statistical procedure, and it is up to the analyst to use this procedure within their sensemaking process.
Mapping the landscape of exploratory and confirmatory data analysis
39
8.4 Other statistical techniques commonly used for exploratory data analysis The examples discussed so far should clarify how EFA and cluster analysis are very different from the linear models discussed in the previous sections. In contrast to linear models, the exploratory approaches discussed so far consider all variables together without an asymmetric relation between response and predictor. There are, however, approaches that allow dealing with this asymmetric relationship in a genuinely exploratory fashion, such as classification and regression trees (CART, for a conceptual introduction for linguists, see Gries, 2019). Such trees use a method called binary recursive partitioning to split the data into a representation that essentially looks like a decision tree, with discrete split points for different variables in an analysis (see Strobl et al., 2009 for an introduction). For example, a split point for the data shown in Figure 1.1a above could be a taste rating of