Climate Change and Terrestrial Carbon Sequestration in Central Asia [1 ed.] 9780415422352, 0415422353
This book brings together current knowledge of terrestrial C sequestration in Central Asia. The themes treated include:
338 9 9MB
English Pages 512 Year 2007
Book Cover......Page 1
Title......Page 4
Copyright......Page 5
Table of Contents......Page 6
Foreword......Page 10
Preface......Page 12
Contributors......Page 16
Biophysical Environment......Page 20
CHAPTER 1 Principal biomes of Central Asia......Page 22
CHAPTER 2 Forests in Central Asia: Current status and constraints......Page 44
CHAPTER 3 C3/C4 plants in the vegetation of Central Asia, geographical distribution and environmental adaptation in relation to climate......Page 52
Water Resources of Central Asia......Page 84
CHAPTER 4 Water resources of the Central Asia under conditions of climate change......Page 86
CHAPTER 5 Climate change and water resource alteration in Central Asia: The case of Uzbekistan......Page 94
CHAPTER 6 Problems and management of the efficient use of soil-water resources in Central Asia with specific reference to Uzbekistan......Page 102
CHAPTER 7 Underground and surface water resources of Central Asia, and impact of irrigation on their balance and quality......Page 116
Agricultural and Soil and Environmental Degradation......Page 126
CHAPTER 8 Addressing the challenges for sustainable agriculture in Central Asia......Page 128
CHAPTER 9 Soil and environmental degradation in Central Asia......Page 146
CHAPTER 10 Land degradation by agricultural activities in Central Asia......Page 156
CHAPTER 11 Salinity effects on irrigated soil chemical and biological properties in the Aral Sea basin of Uzbekistan......Page 166
Soil Management and Carbon Dynamics......Page 182
CHAPTER 13 Dynamics of soil carbon and recommendations on effective sequestration of carbon in the steppe zone of Kazakhstan......Page 196
CHAPTER 14 Carbon dynamics in Saskatchewan soils: Implications for the global carbon cycle......Page 208
CHAPTER 15 Conservation agriculture: Environmental benefits of reduced tillage and soil carbon management in water-limited areas of Central Asia......Page 218
CHAPTER 16 Conservation agriculture for irrigated agriculture in Asia......Page 230
CHAPTER 17 Syria’s long-term rotation and tillage trials: Potential relevance to carbon sequestration in Central Asia......Page 242
CHAPTER 18 Potential for carbon sequestration in the soils of Afghanistan and Pakistan......Page 254
CHAPTER 19 Improvement of soil physical and chemical conditions to promote sustainable crop production in agricultural areas of Kazakhstan......Page 270
CHAPTER 20 Technological options to enhance humus content and conserve water in soils of the Zarafshan valley, Uzbekistan......Page 276
CHAPTER 21 Eliminating summer fallow on black soils of Northern Kazakhstan......Page 286
CHAPTER 22 Dynamics of water and soil organic matter under grain farming in Northern Kazakhstan – Toward sustainable land use both from the agronomic and environmental viewpoints......Page 298
CHAPTER 23 Conservation agriculture in the steppes of Northern Kazakhstan: The potential for adoption and carbon sequestration......Page 352
CHAPTER 24 Cover crops impacts on irrigated soil quality and potato production in Uzbekistan......Page 368
Forest Management and Carbon Dynamics......Page 380
CHAPTER 25 Forest carbon sequestration and storage of the Kargasoksky Leshoz of the Tomsk Oblast, Russia – Current status and the investment potential......Page 382
CHAPTER 26 Soil and vegetation management strategies for improved carbon sequestration in Pamir mountain ecosystems......Page 390
Economic Analysis......Page 400
CHAPTER 27 An economic comparison of conventional tillage and conservation tillage for spring wheat production in Northern Kazakhstan......Page 402
Methodological and Technological Challenges......Page 418
CHAPTER 28 An assessment of the potential use of SRTM DEMs in terrain analysis for the efficient mapping of soils in the drylands region of Kazakhstan......Page 420
CHAPTER 29 Potential for soil carbon sequestration in Central Kazakhstan......Page 432
CHAPTER 30 Application of GIS technology for water quality control in the Zarafshan river basin......Page 438
CHAPTER 31 Remote sensing application for mapping terrestrial carbon sequestration in Kazakhstan......Page 448
CHAPTER 32 Possible changes in the carbon budget of arid and semi-arid Central Asia inferred from landuse/landcover analyses during 1981 to 2001......Page 460
CHAPTER 33 Western Siberian peatlands: Indicators of climate change and their role in global carbon balance......Page 472
Research and Development Priorities......Page 492
CHAPTER 34 Researchable priorities in terrestrial carbon sequestration in Central Asia......Page 494
Subject index......Page 504
Author index......Page 512
Recommend Papers


![Climate Change and Terrestrial Carbon Sequestration in Central Asia [1 ed.]
9780415422352, 0415422353](https://ebin.pub/img/200x200/climate-change-and-terrestrial-carbon-sequestration-in-central-asia-1nbsped-9780415422352-0415422353.jpg)
- Author / Uploaded
- Rattan Lal
- M. Suleimenov
- B.A. Stewart
- D.O. Hansen
- Paul Doraiswamy
- Similar Topics
- Geography
- Meteorology, Climatology
- Commentary
- 20193
File loading please wait...
Citation preview
CLIMATE CHANGE AND TERRESTRIAL CARBON SEQUESTRATION IN CENTRAL ASIA
BALKEMA – Proceedings and Monographs in Engineering, Water and Earth Sciences
Climate Change and Terrestrial Carbon Sequestration in Central Asia Editors
R. Lal The Ohio State University, Carbon Management and Sequestration Center, Columbus, Ohio, USA
M. Suleimenov International Center for Agriculture Research in Dryland Areas-Central Asia Caucasus, Tashkent, Uzbekistan
B.A. Stewart Department of Agricultural Sciences, West Texas A&M University, Canyon, Texas, USA
D.O. Hansen The Ohio State University, International Programs in Agriculture, Columbus, Ohio, USA
P. Doraiswamy USDA-ARS Hydrology and Remote Sensing Laboratory, Beltsville, Maryland, USA
LONDON / LEIDEN / NEW YORK / PHILADELPHIA / SINGAPORE
This edition published in the Taylor & Francis e-Library, 2007. “To purchase your own copy of this or any of Taylor & Francis or Routledge’s collection of thousands of eBooks please go to www.eBookstore.tandf.co.uk.”
Taylor & Francis is an imprint of the Taylor & Francis Group, an informa business © 2007 Taylor & Francis Group, London, UK All rights reserved. No part of this publication or the information contained herein may be reproduced, stored in a retrieval system, or transmitted in any form or by any means, electronic, mechanical, by photocopying, recording or otherwise, without written prior permission from the publishers. Although all care is taken to ensure integrity and the quality of this publication and the information herein, no responsibility is assumed by the publishers nor the author for any damage to the property or persons as a result of operation or use of this publication and/or the information contained herein. Published by:
Taylor & Francis/Balkema P.O. Box 447, 2300 AK Leiden, The Netherlands e-mail: [email protected] www.balkema.nl, www.taylorandfrancis.co.uk, www.crcpress.com
British Library Cataloguing in Publication Data A catalogue record for this book is available from the British Library Library of Congress Cataloging-in-Publication Data Climate change and terrestrial carbon sequestration in Central Asia/R. Lal ... [et al.], editors. p. cm. Includes bibliographical references and index. ISBN 978-0-415-42235-2 (hardcover : alk. paper) 1. Carbon sequestration—Asia, Central. 2. Climatic changes—Asia, Central. I. Lal, R. SD387.C37C58 2007 368.700958—dc22 2007009819 ISBN 0-203-93269-2 Master e-book ISBN
ISBN13 978-0-415-42235-2 (hbk)
Table of Contents
Foreword Preface Contributors
Biophysical Environment 1. Principal biomes of Central Asia E. De Pauw 2. Forests in Central Asia: Current status and constraints M. Turdieva, E. Aleksandrovskiy, A. Kayimov, S. Djumabaeva, B. Mukanov, A. Saparmyradov & K. Akmadov 3. C3/C4 plants in the vegetation of Central Asia, geographical distribution and environmental adaptation in relation to climate K. Toderich, C.C. Black, E. Juylova, O. Kozan, T. Mukimov & N. Matsuo Water Resources of Central Asia 4. Water resources of the Central Asia under conditions of climate change V.E. Chub
IX XI XV
1 3 25
33
65 67
5. Climate change and water resource alteration in Central Asia: The case of Uzbekistan N. Hakimov, A. Lines, P. Elmuratov & R. Hakimov
75
6. Problems and management of the efficient use of soil-water resources in Central Asia with specific reference to Uzbekistan R. Khusanov & M. Kosimov
83
7. Underground and surface water resources of Central Asia, and impact of irrigation on their balance and quality R.K. Ikramov
97
Agricultural and Soil and Enviromental Degradation
107
8. Addressing the challenges for sustainable agriculture in Central Asia R. Paroda
109
9. Soil and environmental degradation in Central Asia R. Lal
127
10. Land degradation by agricultural activities in Central Asia B. Qushimov, I.M. Ganiev, I. Rustamova, B. Haitov & K.R. Islam 11. Salinity effects on irrigated soil chemical and biological properties in the Aral Sea basin of Uzbekistan D. Egamberdiyeva, I. Garfurova & K.R. Islam
137
147
VI
Table of Contents
Soil Management and Carbon Dynamics
163
12. Central Asia: Ecosystems and carbon sequestration challenges M. Suleimenov & R.J. Thomas
165
13. Dynamics of soil carbon and recommendations on effective sequestration of carbon in the steppe zone of Kazakhstan A. Saparov, K. Pachikin, O. Erokhina & R. Nasyrov 14. Carbon dynamics in Saskatchewan soils: Implications for the global carbon cycle A. Landi & A.R. Memut 15. Conservation agriculture: Environmental benefits of reduced tillage and soil carbon management in water-limited areas of Central Asia D.C. Reicosky 16. Conservation agriculture for irrigated agriculture in Asia K. Sayre 17. Syria’s long-term rotation and tillage trials: Potential relevance to carbon sequestration in Central Asia J. Ryan & M. Pala 18. Potential for carbon sequestration in the soils of Afghanistan and Pakistan A.U.H. Khan & R. Lal
177 189
199 211
223 235
19. Improvement of soil physical and chemical conditions to promote sustainable crop production in agricultural areas of Kazakhstan W. Busscher, J. Novak, F. Kozybaeva, T. Jalankuzov & B. Suleymenov
251
20. Technological options to enhance humus content and conserve water in soils of the Zarafshan valley, Uzbekistan Sh. T. Holikulov & T.K. Ortikov
257
21. Eliminating summer fallow on black soils of Northern Kazakhstan M. Suleimenov & K. Akshalov
267
22. Dynamics of water and soil organic matter under grain farming in Northern Kazakhstan – Toward sustainable land use both from the agronomic and environmental viewpoints S. Funakawa, J. Yanai, Y. Takata, E. Karbozova-Saljnikov, K. Akshalov & T. Kosaki
279
23. Conservation agriculture in the steppes of Northern Kazakhstan: The potential for adoption and carbon sequestration P.C. Wall, N. Yushenko, M. Karabayev, A. Morgounov & A. Akramhanov
333
24. Cover crops impacts on irrigated soil quality and potato production in Uzbekistan A.X. Hamzaev, T.E. Astanakulov, I.M. Ganiev, G.A. Ibragimov, M.A. Oripov & K.R. Islam
349
Forest Management and Carbon Dynamics
361
25. Forest carbon sequestration and storage of the Kargasoksy Leshoz of the Tomsk Oblast, Russia – Current status and the investment potential R.A. Williams & S.E. Schafer
363
Table of Contents
VII
26. Soil and vegetation management strategies for improved carbon sequestration in Pamir mountain ecosystems S. Sanginov & U. Akramov
371
Economic Analysis
381
27. An economic comparison of conventional tillage and conservation tillage for spring wheat production in Northern Kazakhstan P.E. Patterson & L.D. Makus
383
Methodological and Technological Challenges
399
28. An assessment of the potential use of SRTM DEMs in terrain analysis for the efficient mapping of soils in the drylands region of Kazakhstan E.R. Venteris, K.M. Pachikin, G.W. McCarty & P.C. Doraiswamy
401
29. Potential for soil carbon sequestration in Central Kazakhstan G. McCarty, P. Doraiswamy, B. Akhmedou & K. Pachikin
413
30. Application of GIS technology for water quality control in the Zarafshan river basin T.M. Khujanazarov & T. Tsukatani
419
31. Remote sensing application for mapping terrestrial carbon sequestration in Kazakhstan U. Sultangazin, N. Muratova & A. Terekhov
429
32. Possible changes in the carbon budget of arid and semi-arid Central Asia inferred from landuse/landcover analyses during 1981 to 2001 E. Lioubimtseva
441
33. Western-Siberian peatlands: Indicators of climate change and their role in global carbon balance S.N. Kirpotin, A.V. Naumov, S.N. Vorobiov, N.P. Mironycheva-Tokareva, N.P. Kosych, E.D. Lapshina, J. Marquand, S.P. Kulizhski & W. Bleuten
453
Research and Development Priorities
473
34. Researchable priorities in terrestrial carbon sequestration in Central Asia R. Lal
475
Subject index
485
Author index
493
Foreword
The countries of Central Asia and the Caucasus (CAC), which were a part of the former Soviet Union, represent a vast area of some 416 million hectares. This area has great potential for carbon sequestration through better land management. Since the CAC countries are now “economies in transition,” they offer an opportunity to examine the role of land use change in both reducing poverty and in ensuring long-term sustainability of natural resources. Agriculture in CAC occupies around 70% of the land area and is characterized by relatively low productivity and increasing land degradation. After independence, all CAC countries dismantled the former large state-run farms and are now facing the challenge of addressing the problems of smaller leased or privately owned land. During this period of transition, crop and livestock production has declined markedly as inputs have become scarcer and unaffordable. Recovery has been slow, putting enormous pressure on rural populations as they struggle to come to terms with these profound changes. Some areas have been abandoned because of land degradation, lack of resources and low returns. Management of the production systems and of the natural resource base that they depend on remains less than satisfactory in many areas. A Collaborative Research Program for Sustainable Agricultural Production in Central Asia and the Caucasus was established in 1998, involving nine CGIAR Centers and eight CAC NARS, with ICARDA as the lead Center. The Consortium has helped the region to halt the erosion of its genetic resources, organize joint research on improved crop and livestock production, and on efficient control of pests and diseases. Many conservation agriculture technologies including zero tillage, crop diversification and reduction of summer fallow area, as well as improved rangeland management practices, are contributing to improved soil organic carbon maintenance. The Central Asian Countries Initiative on Land Management (CACILM), in which ICARDA has been playing the lead role in a Research Component on Sustainable Land Management, will address carbon sequestration as one of priority issues. Since much still remains to be done, it was only timely that Ohio State University, jointly with the USDA-ARS, ICARDA and CIMMYT, organized a workshop on Carbon Sequestration in Central Asia on 1–5 November, 2005. The prospects for carbon trading were discussed at the workshop. The trading schemes that emerged could offer the rural poor in CAC the opportunity to generate income and conserve the natural resource base. The challenge will be to stimulate a widespread adoption of the promising resource-conserving practices that were identified at the workshop and to link them to carbon trading possibilities. We are delighted that the proceedings of this workshop are now available to a wider audience through this publication. We look forward to participating in, and catalyzing further interactions between the national agricultural research systems of the region and international research organizations and other partners globally. Mahmoud Solh Director General, ICARDA.
Preface
Climate change and desertification are major global issues of the 21st century. The earth’s mean global temperature rose by 0.6 ± 0.2◦ C during the second half of the 20th century, at a rate of 0.17◦ C/decade. If the present trend continues, a drastic increase in global temperature is projected by the end of the 21st century and consequences will be a rise in sea level and accelerated meltdown of polar ice sheets. Scientists recently observed that a shelf of floating ice, which was larger than 100-km2 , and which jutted into the Arctic Ocean for 3,000 years from Canada’s northernmost shore, broke away in the summer of 2005 because of sharply warming temperatures. Increasing concentrations of CO2 along with CH4 and N2 0 are several of the causes of the accelerated greenhouse effect. The problem is exacerbated by a rising global demand for energy and a corresponding increase in fossil fuel combustion. The world used 420 Q of energy in 2003. This amount is projected to increase to 470 Q in 2010 and 620 Q in 2025. Thus, growing and strong interest in renewable energy sources is rightfully justified. For all their potential, however, wind does not always blow nor does the sun always shine when they are most needed. For this reason a reduction of carbon emissions will remain an essential component of any strategy to address global warming. The U. N. declared 2006 the “Year of Deserts and Desertification”. Despite the severity of the problem and the good intentions of all parties concerned, no concrete action was undertaken during 2006 to combat it nor has a sharply focused action plan been designed for the future. It is in this context that the topic of terrestrial carbon sequestration in Central Asia is extremely relevant and timely. Serious problems of soil and environmental degradation in general, and that in Central Asia in particular, have been exacerbated by the collapse of Soviet Union which helped to coordinate regional use of soil and water resources. Land use change from natural steppe vegetation to agricultural ecosystems also resulted in severe problems of wind and water erosion and desertification in the region. The total desert area in the region is estimated to be about 150 Mha or 37% of the total land area. Most agricultural and range land soils lost 30 to 50% of their soil organic carbon pool, and soils have experienced a corresponding decline in quality. Inappropriate land use, soil mismanagement, and excessive irrigation with high evaporation have caused severe and unprecedented problems of degradation of soil, water, vegetation and other elements of the environment of the region with long-term adverse impacts on agricultural sustainability, environmental quality and economic well being of the region’s inhabitants. A workshop was held at The Ohio State University campus in fall, 2005. It addressed soil and other environmental problems in the Central Asia region. The rationale for organizing the workshop included the following considerations: Soil degradation: Large areas of arable land in Central Asia are being lost to production as a consequence of inappropriate cropping systems and inappropriate irrigation schemes. Some of it is being transformed into semi-desert conditions with an attendant loss in soil biodiversity, soil organic carbon pool, plant nutrient reserves, and plant available water capacity. Declines in soil quality have severe adverse impacts on net primary productivity (NPP), agronomic sustainability, and water quality. Loss of Aral Sea and Water Resources: Land us change and expansion of irrigation have had a major negative impact on the hydraulic balance of the region. Two major rivers (Amu-Darya and Syr-Darya) feed the Aral Sea. Overuse of their flowage for irrigation purposes has drastically shrunk the Aral Sea and adversely affected its water quality. This has resulted in a major reduction in the availability of water to sustain human and animal populations in the region and major adverse changes in the surrounding ecoregions.
XII
Preface
Water Pollution and Contamination: Excessive water use and indiscriminate use of agricultural chemicals have led to considerable salinization and water logging of soils. Pollution and contamination of water resources are serious problems throughout the region. Unsustainable Agriculture and Food Insecurity: The severe problems of soil degradation and depletion of water resources in the region threaten the production of food for inhabitants of the region. The problem is exacerbated by the projected climate change which may accentuate the frequency and intensity of extreme events. Global Climate Change: Depletion of the soil organic carbon pool exacerbates emission of CO2 into the atmosphere. Soil degradation decreases CH4 uptake by agricultural soils. Indiscriminate use of nitrogenous fertilizers and water logging also accentuate N2 O emissions from croplands. The projected climate change may be a positive feedback which increases the risk of soil degradation and the rate of decomposition of soil organic matter. Eminent scholars, who are familiar with these problems in Central Asia, were invited to contribute chapters to this book. Topics and authors were specifically chosen to achieve the following 5 objectives: (a) identify land use and soil/vegetation management strategies that restore degraded soils and ecosystems, enhance soil quality, improve water use efficiency, and sequester carbon in soil biomass; (b) develop strategies to facilitate dialogue among scientists and policy makers so that soil and ecosystem recovery is an integral component of any governmental program to mitigate climate change; (c) encourage dialogue on scientific and technological exchange; (d) create multi-disciplinary teams to facilitate carbon trading in national and international markets; and (e) identify social, economic, and bio-physical factors and processes that restore degraded soils and ecosystems, thus making agriculture a contributor to the solution of the environmental degradation problems in Central Asia. The 34-chapter volume is a state-of-the-knowledge compendium on terrestrial C sequestration in Central Asia. It is sub-divided into 8 thematic sections. Section A deals with the biophysical environments of the region and consists of 3 chapters: one describing the principal biomes and the other two reviewing the predominant vegetative cover of the region. Section B deals with the water resources of Central Asia. It consists of 4 chapters that address the current water regime, possible impacts on it of climate change, problems caused by water mismanagement, contamination of surface and ground waters by non-point source pollution, and increasing salinization. Section C also consists of 4 chapters in which existing challenges to sustainable agriculture, problems of soil degradation, and the effects of irrigation schemes on secondary salninzation are discussed. Section D consists of 12 chapters that address the principal theme of the book, namely, “soil management and its relationship to carbon dynamics”. Several chapters focus on the impact of tillage methods, soil fertility management, and summer fallowing on soil carbon dynamics, water conservation and agronomic productivity. Section E, contains two chapters that describe the important relationship between forest management and carbon dynamics. Section F also contains two chapters in which economic analyses of land use practices are presented. Materials found in Section G deal with important methodological issues regarding the use of GIS, remote sensing, carbon budgeting and scaling. Section H consists of only one chapter in which knowledge gaps on carbon and climate change are identified and related researchable priorities are recommended. Organization of the workshop and publication of this volume were possible because of the cooperation and support of sponsoring organizations. The workshop was jointly sponsored by The Ohio State University, the International Center for Agricultural Research in Dry Areas (ICARDA), the United States Department of Agriculture – Agricultural Research Service (USDA-ARS), and the International Maize and Wheat Improvement Center (CIMMYT). Dr. Mekhlis Suleimenov, Assistant Regional Coordinator, of ICARDA-CAC Office in Tashkent, Uzbekistan played an important role in identifying and contacting scientists from the region. All authors are to be thanked for their outstanding efforts to document and present current research information and summary analyses of the current status of accumulated knowledge on these topics. The authors’ contributions help increase general understanding of opportunities and challenges encountered when attempting to enhance terrestrial carbon sequestration in Central Asia, and the potential sink capacity of different biomes through adoption of recommended land use and management practices. Research
Preface
XIII
reported in this volume has advanced the frontiers of soil and environmental science with regards to terrestrial C sequestration, enhancing biomass-productivity, improving soil quality, advancing sustainability and mitigating climate change. Special thanks are also due to Dr. Bobby A. Stewart. He undertook the most difficult and tedious task of formatting each of the 34 chapters and getting them camera ready. It is a pleasure and honor to work with him. He is a role model regarding dedication, hardwork, sincerity and commitment to excellence. Thanks are also due to Dr. Jerry Ladman of OSU for his support through the CIRITClimate Change initiative. Help received from staff of the Carbon Management and Sequestration Center and Ms. Lynn Everett in relation to organizing the workshop is also much appreciated. Preparation of this volume also depended on assistance from many staff of the publisher Taylor & Francis, Leiden, The Netherlands. 15 January 2007 Columbus, OH 43210 R. Lal Chair, Organizing and Editorial Committee
Contributors
Bakhyt Akhmedou, Science Systems and Applications, Inc., Lanham, MD, USA. Khukmatullo Akmadov, Academy of Agricultural Sciences of the Republic of Tajikistan, Dushanbe, Tajikistan. A. Akramhanov, International Maize and Wheat Improvement Center (CIMMYT), Astana, Kazakhstan. U. Akramov, Soil Science Institute of Tajikistan, Dushanbe, Tajikistan. Kanat Akshalov, Barayev Kazakh Research and Production Center of Grain Farming, Shortandy, Kazakhstan. Evsey Aleksandrovskiy, Research and Production Centre of Ornamental Gardening and Forestry, Tashkent, Uzbekistan. T.E. Astanakulov, Samarkand Agricultural Institute, Samarkand, Uzbekistan. Clanton C. Black, Biochemistry and Molecular Biology, University of Georgia, Athens, Georgia, USA. W. Bleuten, University of Utrecht, Utrecht, The Netherlands. Warren Busscher, Coastal Plains Soil, Water and Plant Research Center, USDA-ARS, Florence, SC, USA. V.E. Chub, Uzhydromet, Tashkent, Uzbekistan. Eddy De Pauw, International Center for Agricultural Research in the Dry Areas (ICARDA), Aleppo, Syria. Salamat Djumabaeva, Research Institute of Forest and Nut Industry, Bishkek, Kyrgyzstan. Paul C. Doraiswamy, USDA-ARS Hydrology and Remote Sensing Laboratory, Beltsville, MD, USA. D. Egamberdiyeva, Tashkent State University of Agriculture, Tashkent, Uzbekistan. Pirnazar Elmuratov, Tashkent State University of Economics, Tashkent, Uzbekistan. O. Erokhina, Soil Research Institute, Academgorodok, Almaty, Kazakhstan. Shinya Funakawa, Graduate School of Agriculture, Kyoto University, Kyoto, Japan. I.M. Ganiev, Samarkand Agricultural Institute, Samarkand, Uzbekistan. I. Garfurova, Tashkent State University of Agriculture, Tashkent, Uzbekistan. B. Haitov, Tashkent State Agrarian University, Tashkent, Uzbekistan. Nazar Hakimov, Tashkent State University of Economics, Tashkent, Uzbekistan. Rashid Hakimov, Tashkent State University of Economics, Tashkent, Uzbekistan. A.X Hamzaev, Samarkand Agricultural Institute, Samarkand, Uzbekistan. D.O. Hansen, International Programs in Agriculture, The Ohio State University, Columbus, OH, USA.
XVI Contributors Sh. T. Holikulov, Samarkland Agricultural Institute, Samarkland, Uzbekistan. G.A. Ibragimov, Samarkand Agricultural Institute, Samarkand, Uzbekistan. R.K. Ikramov, Central Asian Research Institute of Irrigation, Tashkent, Uzbekistan. K.R. Islam, Crops, Soil and Water Resources, Ohio State University South Centers, Piketon, OH, USA. Temirbulat Jalankuzov, Akademgorodok, Institute of Soil Science, Almaty, Kazakhstan. Ekaterina Juylova, Department of Desert Ecology and Water Resources Research, Samarkland, Uzbekistan. M. Karabayev, International Maize and Wheat Improvement Center (CIMMYT), Astana, Kazakhstan. Elmira Karbozova-Saljnikov, Institute of Soil Science, Belgrade, Serbia and Montenegro. Abdukhalil Kayimov, Department of Forestry, Tashkent State Agrarian University, Tashkent, Uzbekistan. Anwar U.H. Khan, University of Agriculture, Faisalabad, Pakistan. T.M. Khujanazarov, Department of Desert Ecology and Water Resources Research, Samarkland, Uzbekistan. Rasulmant Khusanov, Research Institute of Market Reforms, Tashkent, Uzbekistan. S.N. Kirpotin, Tomsk State University, Tomsk, Russia. Takashi Kosaki, Graduate School of Global Environmental Studies, Kyoto University, Kyoto, Japan. Muhammad Kosimov, Research Institute of Market Reforms, Tashkent, Uzbekistan. N.P. Kosych, Institute of Soil Science and Agrochemistry, Novosibirsk, Russia. Osamu Kozan, University of Yamanashi, Kofu-city Yamanashi, Japan. Flarida Kozybaeva, Akademgorodok, Institute of Soil Science, Almaty, Kazakhstan. S.P. Kulizhski, Tomsk State University, Tomsk, Russia. R. Lal, Carbon Management and Sequestration Center, SENR/OARDC, The Ohio State University, Columbus, OH, USA. A. Landi, University of Ahwaz, Faculty of Agriculture, Department of Soil Science, Ahwaz, Iran. E.D. Lapshina, Yugorskiy State University, Khanty-Mansiysk, Russia. Allan Lines, Department of Agricultural, Environmental, and Development Economics, The Ohio State University, Columbus, OH USA. Elena Lioubimtseva, Department of Geography and Planning, Grand Valley State University, Allendale, MI, USA. Larry D. Makus, Professor of Agricultural Economics, University of Idaho, ID, USA J. Marquand, University of Oxford, Oxford, UK. Naoko Matsuo, Graduate School of Agriculture, Kyoto University, Kyoto, Japan. Greg W. McCarty, USDA-ARS Hydrology and Remote Sensing Laboratory, Beltsville, MD, USA.
Contributors
XVII
A.R. Memut, University of Saskatchewan, Department of Soil Science, Saskatoon, Saskatchewan, Canada. N.P. Mironycheva-Tokareva, Institute of Soil Science and Agrochemistry, Novosibirsk, Russia. A. Morgounov, International Maize and Wheat Improvement Center (CIMMYT), Ankara, Turkey. B. Mukanov, Research and Production Centre of Forestry, Shuchinsk, Kazakhstan. Tolib Mukimov, Department of Desert Ecology and Water Resources Research, Samarkland, Uzbekistan. N. Muratova, Kazakh Space Research Institute, Almaty City, Kazakhstan. R. Nasyrov, Soil Research Institute, Academgorodok, Almaty, Kazakhstan. A.V. Naumov, Institute of Soil Science and Agrochemistry, Novosibirsk, Russia. Jeff Novak, Coastal Plains Soil, Water and Plant Research Center, USDA-ARS, Florence, SC, USA. M.A. Oripov, Bukhara State University, Bukhara, Uzbekistan. T.K. Ortikov, Samarkland Agricultural Institute, Samarkland, Uzbekistan. Konstantine M. Pachikin, Department of Soils, Institute of Kazakhstan Ministry of Education and Science, Almaty, Kazakhstan. Mustafa Pala, International Center for Agricultural Research in the Dry Areas, Aleppo, Syria. Raj Paroda, Program for Central Asia and Caucasus, International Center for Agricultural Research in Dryland Areas, Tashkent, Uzbekistan. Paul E. Patterson, Extension Professor of Agricultural Economics, University of Idaho, ID, USA. B. Qushimov, Tashkent State University of Economics, Tashkent Uzbekistan. D.C. Reicosky, North Central Soil Conservation Research Laboratory, USDA Agricultural Research Service, MN, USA. I. Rustamova, Tashkent State Agrarian University, Tashkent, Uzbekistan. John Ryan, International Center for Agricultural Research in the Dry Areas, Aleppo, Syria. S. Sanginov, Soil Science Institute of Tajikistan, Dushanbe, Tajikistan. Ashyrmuhammed Saparmyradov, Department of Science and Technologies of the Ministry of Agriculture, Ashgabat, Turkmenistan. A. Saparov, Soil Science Institute, Academgorodok, Almaty, Kazakhstan. Ken Sayre, International Maize and Wheat Improvement Center (CIMMYT), El Batan, Texcoco, Mexico. Sarah E. Schafer, International Programs, The Ohio State University, Columbus, OH, USA. B.A. Stewart, Department of Agricultural Sciences, West Texas A & M University, Canyon, TX, USA. Mekhlis Suleimenov, International Center for Agriculture Research in Dryland Areas-Central Asia Caucasus, Tashkent, Uzbekistan. Beibut Suleymenov, Akademgorodok, Institute of Soil Science, Almaty, Kazakhstan. U. Sultangazin, Kazakh Space Research Institute, Almaty, Kazakhstan. Yusuke Takata, Graduate School of Agriculture, Kyoto University, Kyoto, Japan.
XVIII
Contributors
A. Terekhov, Kazakh Space Research Institute, Almaty City, Kazakhstan. Richard J. Thomas, International Center for Agriculture Research in Dryland Areas, Aleppo, Syria. Kristina Toderich, Department of Desert Ecology and Water Resources Research, Samarkland, Uzbekistan. Tsuneo Tsukatani, Institute of Economic Research, Kyoto University, Japan. Muhabbat Turdieva, CWANA Subregional Office for Central Asia, Tashkent, Uzbekistan. Erik R. Venteris, Ohio Division of Geological Survey, Columbus, OH, USA. S.N. Vorobiov, Tomsk Regional Environmental Administrative Unit, Tomsk, Russia. P.C. Wall, International Maize and Wheat Improvement Center (CIMMYT), Harare, Zimbabwe. Roger A. Williams, School of Environment and Natural Resources, The Ohio State University, Columbus, OH, USA. Junta Yanai, Graduate School of Agriculture, Kyoto Prefectural University, Kyoto, Japan. N. Yushenko, Central Kazakh Agricultural Research Institute, Karaganda, Kazakhstan.
Biophysical Environment
CHAPTER 1 Principal biomes of Central Asia
Eddy De Pauw International Center for Agricultural Research in the Dry Areas (ICARDA), Aleppo, Syria
1
INTRODUCTION
If we wanted to describe Central Asia in a few lines, the following would do: a huge barren or sparsely vegetated plain, bordered by snow-covered mountains in the south, and broken by large irrigated areas fed by rivers with their headwaters in the mountains. Correct as this may be as seen from space, the reality on the ground is much more complex. Central Asia is a unique region among the world’s agroecosystems. The particular mix of climatic conditions, terrain, soils, vegetation and land use patterns, as well as the major socioeconomic shifts taking place, particularly with respect to land and water use, are not found elsewhere. Despite the apparent (and misleading) monotony of the landscapes in most of the region, there is a surprising diversity in agroecologies. Moreover, it is a region that has witnessed some major environmental catastrophes and degradation of its land and water resources in its recent past, and is particularly vulnerable to the threat of climate change. Several studies and projects have been undertaken to assess the potential of Central Asia’s vast land resources to act as a sink for the greenhouse gas CO2 and thus to help mitigate the impact of global warming. At the same time, there is concern that poor management of the natural resource base, compounded by ongoing warming trends, may negatively affect the region’s capacity to absorb atmospheric carbon. In dealing with the issue to what extent Central Asia ultimately has the capacity to act as a carbon sink, and particularly on how to manage this carbon store, perhaps insufficient attention has been paid to the diversity of its environments. The sequestration potential is determined by climatic conditions, the kinds of vegetation and land use, the soil types, the land management systems and their interactions. An understanding of the characteristics and dynamics of these factors is essential for guiding carbon sequestration research and management. It is not as if there is a shortage of information. During the Soviet era there was a major investment in resource monitoring, characterization and mapping summarized in National Atlases, which exist for each country of Central Asia. These maintain rich collections of thematic maps, most of which remain relevant to the present day. However, the use of these paper databases in the post-Soviet era is largely limited to educational purposes, mostly in view of limitations of scale, particularly for large countries, and the difficulty in combining this information with other datasets (De Pauw et al., 2004). What is needed is a new approach, based on the use of geographical information systems (GIS) to consolidate this thematic information into a more integrated spatial database, available to C-sequestration researchers, and update it. 2
METHODS
This paper essentially offers a synthesis of Central Asia’s agricultural environments on the basis of secondary sources and new information in the form of maps, some of which were developed 3
4
Climate Change and Terrestrial Carbon Sequestration in Central Asia
using methodologies reported elsewhere. The production of the climatic maps is based on a twostage approach, in which at first basic climatic variables, obtained from meteorological station data, were interpolated to create ‘basic climate surfaces’. These GIS layers were then converted into new layers, ‘derived climate surfaces’, through either elementary grid calculations in GIS software, or through pre-programmed and more complex models. The specific transformation rules for generating the maps in Figures 4, 6, 7, 10–15 can be found in De Pauw (2001) or De Pauw et al. (2004). The methods used for the production of the Agroecological Zones are reported further on in the paper.
3
GENERAL SETTING
Central Asia occupies an area of 3,994,400 km2 , or about half the area of the United States (Encyclopedia Britannica, 1994). Based on information from the Internet statistical database Geohive, its total population in 2000 was approximately 58 million, the majority of which (about 70%) lives in rural areas or in small towns. Rural population density varies widely, from a high of 200–500 persons km−2 in the densely populated Fergana Valley, Uzbekistan, to only 0–2 people km−2 in most of ‘empty’ Kazakhstan (Figure 1). Level of aridity and presence of water resources (see further) were key, but not the only, factors in the initial establishment of settlements and subsequent population growth. The physical geography of Central Asia (Figure 2) mainly consists of a huge plain, with vast steppe lands in the north in Kazakhstan, and the drainage basin of the Aral Sea in the south. This plain is bordered in the east and south by mountain ranges, which include some of the highest peaks in the world. Central among the plain features of Central Asia is the fairly monotonous Turanian Plain, which extends northward from the sandy Karakum desert and links up to the West Siberian Plain in Russia through a narrow corridor, the Turgay ‘Valley’, which is in fact more of a longitudinal depression within the plain rather than a true valley. The Turanian Plain borders the Aral Sea to the west and is located at an absolute elevation of 0–100 m. Further west is the higher-lying (100–200 m) Ustyurt plateau, a plain with low ridges, salt marshes, sinkholes and other karstic features, bordering with dissected edges the Aral Sea, and is formed on gypseous deposits (Gintzburger et al., 2003). The Ustyurt Plateau separates the Turanian Plain from the Caspian Depression, a featureless lowland
Figure 1.
Population density in 2000, people km−2 (CIESIN and CIAT, 2005).
Principal biomes of Central Asia
5
descending imperceptibly from 0 m to −30 m at the edge of the Caspian Sea. At its maximum extent, north of the Caspian Sea, this lowland area extends up to 300 km inland. In the north east of the region, in central Kazakhstan, the landscape rises to a central ridge with west-east orientation and an elevation range of 500–1000 m. The Kazakh Uplands in the middle of this central ridge consist of more hilly landscapes and are in mountainous places. Breaking further the relative uniformity of the Central Asian plain landscapes are rivers, deserts, several large lakes, and mountains (Figure 2). The main river systems of the Amu-Darya and SyrDarya with their extended irrigation systems originate in and drain the southern mountain waters into the Aral Sea basin. The huge 840 km-long Karakum Canal, constructed in the early 50s–60s, diverts water from the Amu-Darya river to the agricultural areas west of Ashkhabad and is navigable for about 450 km. Water losses and abstractions for agriculture along this artificial waterway are one of the principal factors for the drying out of the Aral Sea. The deserts, while plain-like and at fairly low elevations (0–500 m), have their own characteristics. The Karakum (‘Black Sand’ in Turkic) desert occupies 70% of Turkmenistan and is, with 350,000 km2 one of the world’s largest sand deserts. The Kyzylkum (‘Red Sand’) desert, with an area of about 300,000 km2 in both Uzbekistan and Kazakhstan, is also plain-like with isolated bare hills rising up to 900 m. The Muyunkum desert, another sandy desert in southern Kazakhstan, north of the Karatau Range, is about half the size of the Kyzylkum or Karakum deserts. The Betpak-Dala desert (or ‘Severnaya Golodnaya Steppe’) occupies about 75,000 km2 east of the Turanian Plain and has many shallow, mostly saline lakes. The western part is clayey, the east is more stony desert. Lake Balkhash, with a length of 600 km and an extent varying between 15,000–19,000 km2 , depending on precipitation levels in the lake’s huge catchment area, is, after the Aral Sea, the second largest water body in Central Asia. It is fairly shallow (10–30 m) and partially saline. The salty Lake Issykul, with a length of 182 km and a width of up to 60 km is the third largest water body, and with a depth of up to 700 m the deepest. It is located at an elevation of 1,600 m. Central Asia’s southeastern and eastern rim consists entirely of mountains, foothills and a few plain depressions. The Tien Shan is major dividing line in Asia, with the highest peaks reaching 7,500 m, from which ‘satellite’ mountain ranges extend deep into the lowlands. Some of these Tien Shan ‘branches’ are shown in Figure 1. The topography is one of very steep slopes with narrow intervening valleys, generally trending from east to west. Characteristic for the Tien Shan is a high area under glaciers (about 10,000 km2 ) of which 80% in Kyrgyzstan and Kazakhstan. The Karatau Range is the most westward extension of the Tien Shan, reaching 450 km into the Kazakhstan
Figure 2.
Main physiographical features of Central Asia (Compiled from Encyclopedia Britannica, 1994).
6
Climate Change and Terrestrial Carbon Sequestration in Central Asia
lowlands and rising on average about 1,000–1,500 m above the plain. The Dzungarian Alatau Range, the most northerly westward ‘branch’ of the Tien Shan in Kazakhstan, rises up to 4,500 m. Another central knot in the mountain systems of Central Asia are the Pamirs. With their core in the highlands of Tajikistan, they are at the hub of a system of intersecting east-west and northsouth ranges. They easily reach 5,000–6,000 m in elevation, with the highest peaks up to 7,500 m. Glaciation in the Pamirs is dominated by the massive Fedchenko Glacier, also the ultimate source of the Amu-Darya river. In all mountain regions of Central Asia there is a great complexity and diversity of climatic conditions, terrain, vegetation and land use systems, which is best understood in the context of prevailing wind directions, rain exposure or shadow effects, elevation zones and northern or southern slope exposure to radiation.
4
BIOMES OF CENTRAL ASIA
‘Biomes’, also known as ‘major life zones’ (Encyclopedia Britannica, 1994) are usually defined as major communities of plants and animals with similar life forms and environmental conditions. With this kind of ‘flexible’ definition it is obvious that there can be no single system of classification. A well-known system is Bailey’s Eco-regions classification (Bailey and Hogg, 1986; Bailey, 1989), which maps for Central Asia 15 Ecoregion Provinces, of which the following three cover 75% of the region: • Dry steppes of continental climates • Semi-deserts of continental climates • Deserts of continental climates. In addition to its coarse resolution, a disadvantage of this system is that no documentation appears to exist for areas outside the continental USA, hence the exact meaning of the terminology used, although obviously related to climate and vegetation, is not clear. A more up-to-date, well documented and carefully mapped system is the classification of Terrestrial Ecosystems of the World Wildlife Fund (Olson et al., 2001). This system, designed as a basis to serve conservation of flora, fauna and their habitats, differentiated 867 ecoregions worldwide, of which 20 are in Central Asia (Table 1). Figure 3 shows their location. Whereas the WWF Ecoregions offers a useful framework for targeting biodiversity and wildlife conservation projects, it is less suitable for carbon sequestration research given its focus on macroenvironments that themselves may be fairly heterogeneous. For agricultural management and planning a more detailed framework is required. Hence, on the basis of available global, regional and national datasets, this paper will provide a general overview of the various environmental
Table 1.
Terrestrial ecosystems in Central Asia (compiled from Olson et al., 2001).
System
Name
System
Name
A502 A801 A806 A814 A1001 A1014 A1306 A1310 A1312 A1318
Altai montane forest and forest steppe Alai-Western Tien Shan steppe Emin Valley steppe Pontic steppe Altai alpine meadow and tundra Pamir alpine desert and tundra Badghyz and Karabil semi-desert Central Asian northern desert Central Asian southern desert Kazakh semi-desert
PA521 PA802 PA811 PA818 PA1008 PA1019 PA1308 PA1311 PA1317 PA1319
Tien Shan montane conifer forests Altai steppe and semi-desert Kazakh upland Tien Shan foothill arid steppe Kopet Dag woodlands and forest steppe Tien Shan montane steppe and meadow Caspian lowland desert Central Asian riparian woodlands Junggar Basin semi-desert Kopet Dag semi-desert
Principal biomes of Central Asia
7
factors that influence C-sequestration and integrate these in a new GIS-based biophysical framework (‘Agroecological Zones’) to identify the region’s principal agricultural environments, without either oversimplification or unnecessary detail.
5
CLIMATE
The key features of Central Asia’s climate are a pronounced degree of aridity, untypical in comparison to the rest of the Eurasian landmass, and large temperature fluctuations, unmitigated by any oceanic influence. The main arid regions of the world are normally found between 15◦ and 35◦ in both northern and southern hemisphere in the subsidence branch of the Hadley global circulation belt. The presence of arid regions between elevations 30◦ N and 50◦ N, as is the case in Central Asia, is caused by a massive rain-shadow effect due to the high mountains in the southeast and east. These mountains also act as an effective barrier between cold northern Eurasian and warm southern airflows primarily from the Indian Ocean. Warm air can not reach northern Central Asia and Siberia, resulting in strong temperature fluctuations typical of a continental climate (Buslov et al. 2006). Within this overall setting there is a lot of variability in space and time. The main features and spatial and temporal patterns of Central Asia’s different climates are explained in the following sections. 5.1 Agroclimatic zones Using UNESCO’s classification system (UNESCO, 1979) and the spatial interpolation methods explained earlier, 21 major agroclimatic zones were identified in Central Asia. Figure 4 shows their distribution and Table 2 presents the characteristics of each zone. Six zones occupy 90% of the region, and two of these occupy two thirds. Hence, although climatically diverse, most of the region has only a few climates, and its climatic diversity finds expression only in relatively small ‘niches’. Climate diagrams for stations that represent the most important agroclimatic zones are illustrated in Figure 5. The location of these stations is indicated by the blue dots in Figure 4. These diagrams show that climatic conditions across Central Asia can vary a lot, but that, with the exception of
Figure 3.
Terrestrial ecoregions of Central Asia (compiled from Olson et al., 2001).
8
Climate Change and Terrestrial Carbon Sequestration in Central Asia
Figure 4.
Table 2.
Agroclimatic zones of Central Asia.
Agroclimatic zones.
Agroclimatic Zone
Description
Aridity index1
Temp. range coldest month
Temp. range warmest month
% of total
SA-K-W A-K-W SA-K-M SH-K-M A-C-W A-C-VW PH-K-C H-K-M SA-C-W SH-K-W A-K-VW PH-K-M SH-K-C SA-K-C H-K-C H-K-W SH-C-W A-K-M PH-K-K PH-K-W A-K-C
Semi-arid, cold winter, warm summer Arid, cold winter, warm summer Semi-arid, cold winter, Sub-humid, cold winter, Arid, cool winter, warm summer Arid, cool winter, very warm summer Per-humid, cold winter, cool summer Humid, cold winter, mild summer Semi-arid, cool winter, warm summer Sub-humid, cold winter, warm summer Arid, cold winter, very warm summer Per-humid, cold winter, Sub-humid, cold winter, cool summer Semi-arid, cold winter, cool summer Humid, cold winter, cool summer Humid, cold winter, warm summer Sub-humid, cold winter, warm summer Arid, cold winter, mild summer Per-humid, cold winter, cold summer Per-humid, cold winter, warm summer Arid, cold winter, cool summer
0.2–0.5 0.03–0.2 0.2–0.5 0.5–0.75 0.03–0.2 0.03–0.2 >1 0.75–1 0.2–0.5 0.5–0.75 0.03–0.2 >1 0.5–0.75 0.2–0.5 0.75–1 0.75–1 0.5–0.75 0.03–0.2 >1 >1 0.03–0.2
≤ 0◦ C ≤ 0◦ C ≤ 0◦ C ≤ 0◦ C 0◦ –10◦ C 0◦ –10◦ C ≤ 0◦ C ≤ 0◦ C 0◦ –10◦ C ≤ 0◦ C ≤ 0◦ C ≤ 0◦ C ≤ 0◦ C ≤ 0◦ C ≤ 0◦ C ≤ 0◦ C 0◦ –10◦ C ≤ 0◦ C ≤ 0◦ C ≤ 0◦ C ≤ 0◦ C
20◦ –30◦ C 20◦ –30◦ C 10◦ –20◦ C 10◦ –20◦ C 20◦ –30◦ C >30◦ C 0◦ –10◦ C 10◦ –20◦ C 20◦ –30◦ C 20◦ –30◦ C >30◦ C 10◦ –20◦ C 0◦ –10◦ C 0◦ –10◦ C 0◦ –10◦ C 20◦ –30◦ C 20◦ –30◦ C 10◦ –20◦ C ≤ 0◦ C 20◦ –30◦ C 0◦ –10◦ C
37.9 30.8 6.6 5.9 4.9 2.9 2.0 1.6 1.5 1.4 1.2 1.2 0.5 0.5 0.5 0.2 0.1 0.1 0.1 0.0 0.0
1 The
ratio of the mean annual precipitation divided by the mean annual potential evapotranspiration.
mountain peaks with high snowfall (see the diagram for the Fedchenko Glacier station), most of the region has low precipitation. The precipitation patterns tend to shift from a dominance of winter precipitation in the south of the region, to a higher share of summer precipitation in the north. Temperature conditions are characterized by a high range between summer and winter, reflecting the continental climates, but also by a high diurnal range, particularly in desert and steppe areas.
9
Principal biomes of Central Asia 200
40.0
Berlik, Kazakhstan (SA-K-W)
200
40.0
Bukhara, Uzbekistan (A-C-W)
180
30.0
180
30.0 160
160 20.0
140 120
10.0
20.0
140 120
10.0
100
100 0.0
80 60
−10.0
0.0
80 60
−10.0
40
40 −20.0
−30.0
20 0 JUL
AUG
SEP
OCT
NOV
DEC
JAN
FEB
MAR
APR
MAY
JUN
200
40.0
Dzhapt'k, Kyrgyzstan (H-K-M)
−20.0
−30.0
40.0
180
30.0
30.0
20 0 JUL
AUG
SEP
OCT
NOV
DEC
JAN
FEB
MAR
APR
MAY
JUN
200
Fedchenko Glaciet, Tajikistan (PH-K-C)
180
160 20.0
140 120
10.0
160 20.0
140 120
10.0
100 0.0
80 60
−10.0
100 0.0
80 60
−10.0
40 −20.0
−30.0
20 0 JUL
AUG
SEP
40.0
OCT
NOV
DEC
JAN
FEB
MAR
APR
MAY
JUN 200
Karakaralinsk, Kazakhstan (SA-K-M)
40 −20.0
−30.0
20 0 JUL
AUG
SEP
OCT
DEC
JAN
FEB
MAR
APR
MAY
JUN 200
40.0
Khiva, Uzbekistan (A-K-W)
180 30.0
NOV
180
30.0 160
20.0
140 120
10.0
160 20.0
140 120
10.0
100 0.0
80 60
−10.0
100 0.0
80 60
−10.0
40 −20.0
−30.0
20 0 JUL
AUG
SEP
40.0
OCT
NOV
DEC
JAN
FEB
MAR
APR
MAY
JUN 200
Petropavlovsk, Kazakhstan (SH-K-M)
40 −20.0
−30.0
20 0 JUL
AUG
SEP
OCT
DEC
JAN
FEB
MAR
APR
MAY
JUN 200
40.0
Tedzhen, Turkmenistan (A-C-VW)
180 30.0
NOV
180
30.0 160
20.0
140 120
10.0
160 20.0
140 120
10.0
100 0.0
80 60
−10.0
100 0.0
80 60
−10.0
40 −20.0
−30.0
20 0 JUL
AUG
SEP
OCT
NOV
DEC
JAN
FEB
MAR
APR
MAY
JUN
40 −20.0
−30.0
20 0 JUL
AUG
SEP
OCT
NOV
DEC
JAN
FEB
MAR
APR
MAY
JUN
Figure 5. Climatic diagrams for representative stations in Central Asia (left axis and lines: mean, maximum and minimum temperature, ◦ C right axis and shaded blocks: monthly precipitation, mm).
5.2
Precipitation
The distribution of precipitation is shown in Figure 6 and summarized in Table 3. Both confirm the high level of aridity, with nearly 90% of the region receiving 400 mm or less and 70% in the 100– 300 mm range. Precipitation decreases towards the center, south of Aral Sea, and increases towards the north, east, and southern edges of the region. Rain shadows can be particularly pronounced in valleys that are entirely surrounded by high mountains (e.g., Fergana, Issykul). The seasonal distribution of precipitation is shown in Figure 7 as the percentage of annual precipitation that falls in each of the four seasons. Winter or spring precipitation is the dominant
10 Climate Change and Terrestrial Carbon Sequestration in Central Asia
Figure 6. Table 3.
Mean annual temperature. Summary of precipitation levels in Central Asia.
Precipitation class (mm)
% of Asia
Mean (mm)
Standard deviation (mm)
0–100 100–200 200–300 300–400 400–500 500–600 600–800 800–1000 1000–1500 1500–2000
1.19 38.28 31.08 18.73 3.93 2.60 2.62 0.89 0.53 0.14
266
160
Figure 7.
Seasonal distribution of precipitation as a percentage of the annual total.
11
Millimeters (mm)
Principal biomes of Central Asia
Year
Figure 8. Variability and trends of annual precipitation for Tashkent, Samarkand and Aralskoe More (Williams and Konovalov, 2004).
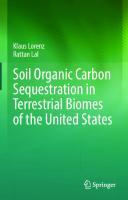
source of moisture in the south of the region, whereas summer precipitation prevails in the north and the eastern mountains. The overall share of autumn precipitation appears less prominent. As is typical for arid regions, the temporal variability of precipitation is very high and the vulnerability to drought severe. Figure 8 shows typical examples of inter-annual precipitation variations for three stations with long records and different precipitation levels. Absolute variations, as expressed by the standard deviation, increase with increasing precipitation. Figure 8 also shows the trend lines of precipitation over the observation periods. They are positive for Tashkent, less so for Samarkand and neutral for Aralskoe More. Figure 9 shows the probability distributions of annual precipitation for the same stations, as approximated by log-normal transforms. With a 42% probability to exceed the mean precipitation, they display the typical negative skewness of precipitation patterns in arid regions, and the associated greater likelihood of precipitation below than above average. 5.3
Temperature
Central Asia is generally a cold region. As Table 2 indicates, 90% of Central Asia has cold winters, whereas less than 5% has very warm summers. The inter-annual variation of the mean temperature is quite pronounced, as shown in the climate diagrams of Figure 5 and the maps of Figure 10. Temperature can be represented as a pool of energy for plant growth and biomass production through the concept of accumulated heat units or growing degree days, which sum the daily temperature above a threshold (e.g., 0◦ C) for a specified period (e.g., one year). The map of mean annual heat units accumulated above 0◦ C (Figure 11) shows that two thirds of the region accumulate less than 4,000 degree-days. This is very low in comparison to tropical regions, which easily reach more than double this amount. Given the general cold character of the region, it is no surprise that virtually all of Central Asia is affected by frost to some extent (Figure 9). About 50% of the region has 150–210 frost days. Very high frost occurrences (270–365 days) are confined to highest mountain ranges, particularly the Pamir and Tien Shan (Figure 12).
12 Climate Change and Terrestrial Carbon Sequestration in Central Asia
Figure 9. Probability distributions of annual precipitation for Tashkent, Samarkand and Aralskoe More (Williams and Konovalov, 2004).
Figure 10.
Mean temperature of the coldest (left) and warmest month (right).
Figure 11.
Mean annual heat units (AHU) accumulated above 0◦ C.
Principal biomes of Central Asia
Figure 12.
13
Mean number of frost days. Table 4. Summary of potential evapotranspiration (PET) levels in Central Asia.
5.4
Range
% of Central Asia
400–500 500–600 600–800 800–1000 1000–1500 1500–2000
1.59 2.30 17.18 41.89 31.24 5.80
Potential evapotranspiration
Potential evapotranspiration (PET), a measure of the water demand of live vegetation, is determined principally by air temperature. Other important factors are radiation, humidity and wind speed. As Table 4 indicates, PET is relatively low in Central Asia, with a mean of 993 mm and standard deviation of 265 mm, and this is parallel with the low levels of heating units (see earlier section). The pattern is determined by latitude, with a notable decrease when going north, but the lowest PET levels are in the mountains in the southeast and east of the region (Figure 13). Considering the balance between precipitation and PET, 97% of Central Asia has a water deficit (i.e., can not meet the full water demand of live vegetation). In about 50% of the region the deficit is in the range 500–1000 mm, which is high. Only 3% has a surplus (mountain tops). 5.5
Growing periods
The growing period, as a climatic concept, is the time of the year when neither temperature nor moisture limit biomass production. As explained in earlier sections, both temperature and moisture can be major limiting factors for biological activity in Central Asia. It therefore makes sense to assess them separately as either a temperature-limited or a moisture-limited growing period, and then to combine both into a temperature- and moisture-limited growing period. The mean temperature-limited growing period (TGP) in Central Asia is 206 days, with a standard deviation of 51 days. About 94% of the region has a TGP of more than 150 days, hence with the
14 Climate Change and Terrestrial Carbon Sequestration in Central Asia
Figure 13.
Mean annual potential evapotranspiration (based on Pennman-Monteith method).
Figure 14.
Distribution of the temperature-limited (left) and moisture limited (right) growing period.
exception of high mountains there is no major temperature limitation for crop production. The spatial distribution of the TGP (Figure 14, left) is primarily determined by a latitudinal gradient of increasing growing period duration from north to south, and secondly by a declining growing period with increasing elevation in the high mountains. The mean moisture-limited growing period (MGP) in Central Asia is 178 days with a standard deviation of 69 days. About 67% of the region has a MGP above 150 days, hence in most of the region there is sufficient moisture for growing crops. The spatial distribution of MGP (Figure 14, right) is foremost characterized by a trend of decreasing duration along a north-south latitudinal gradient, deflected to the west by the presence of the southern and eastern mountain ranges. The lowest values occur in the deserts and steppes south of the Aral Sea, and in intra-montane depressions and linear valleys. The periods in which TGP and MGP overlap constitute the temperature- and moisture-limited growing period (TMGP). The mean TMGP in Central Asia is only 30 days with a standard deviation of 36 days, and 90% of the region has a TMGP not exceeding 90 days (Figure 15). These figures point to a severe mismatch between the period in which moisture is available and the period in which temperature is adequate. In much of Central Asia it is too cold at the time that soil moisture is adequate for biomass production. It is one of the reasons why most of Central Asia is rangeland, and not cropland. It also explains why rainfed agriculture occurs only in the north of the region, where there is a larger share of precipitation during the warmer part of the year
Principal biomes of Central Asia
Figure 15.
15
Duration of the growing period, limited by both temperature and moisture.
(Figure 7), and in areas bordering the southern mountains (where both temperature and moisture are adequate during a longer overlapping period). Where irrigation water is available, areas with very low MGP but high TGP can become highly productive, as is the case in e.g. the Fergana intramontane basin.
6
SOILS
Central Asia has a great diversity in soil types. Eighteen of the 26 Soil Orders according to the 1974 FAO soil classification (FAO-UNESCO, 1974) are represented in Central Asia, distributed over 244 soil associations. Of the Soil Orders, eight occupy 82% of the region (Table 5). In addition, a large proportion of the region (12.6%) is covered by mobile sand and sand sheets, particularly in the sandy deserts of Karakum, Kyzylkum and Myunkum, and south of Lake Balkhash. The distribution of the main soil types is shown in Figure 16. From north to south the soil patterns follow climatic gradients of decreasing precipitation and increasing temperature. Above 52◦ N Chernozems are dominant. These soils are deep, have high porosity, high moisture storage capacity, dark and thick topsoils, and high organic matter content, ranging from 4 to 16% (Deckers et al., 1998), and have more fine, clayey textures. They contain free calcium carbonate, but usually not above 2 m depth. Between 48◦ N and 52◦ N the main soils are Kastanozems (also called Chestnut Soils in Russia), which differ from the Chernozems by a lower organic matter content (2–4%) and more shallow topsoils, lighter colors, and generally more loamy textures. They usually contain free carbonates within 1 m depth. Below 48◦ N the trend towards declining organic matter content, lighter color and rising carbonates continues as the land becomes drier and warmer, at first with the Xerosols, and in the driest parts of the region with the Yermosols. Whereas the Xerosols are usually strongly enriched in lime in some soil horizons above 1 m depth, the Yermosols may also contain substantial quantities of gypsum. Both types of soils are alternatively known in Central Asia as Sierozems (Plyusnin, 1960) or ‘grey-brown soils’ (Lobova, 1960), which cover a wide range of soils with different morphology and physical characteristics. A particular feature of the soil patterns in Central Asia is a comparatively high proportion of sodic soils (a.k.a. Solonetz and solonetzic soils) and saline soils (Solonchaks). Solonetz are characterized
16 Climate Change and Terrestrial Carbon Sequestration in Central Asia Table 5.
Most common soil types of Central Asia.
Soil classification system FAO, 1974
FAO, 1988 WRB, 19982
Soil Taxonomy, 1994
Central concept and extent1
Xerosols, Yermosols
Calcisols (Gypsisols)
Calcids (Gypsids)
Soils with high lime concentrations in the subsoil. Gypisols have high subsoil gypsum concentrations (20.8%)
Kastanozems
Kastanozems
Ustolls
Lighter colored soils with fertile, wellstructured, organic topsoil, enriched in lime or gypsum (18.4%)
Solonetz
Solonetz
Soils with natric horizon
Sodic soils (11.3%)
Lithosols + rock outcrops
Leptosols
Lithic subgroups of different soil orders
Shallow soils and rock outcrops (9.3%)
Solonchaks + salt flats
Solonchaks
Salids
Saline soils (9.3%)
Chernozems
Chernozems
Ustolls
Dark soils, rich in lime with a fertile, wellstructured, topsoil rich in organic matter (5.8%)
Gleysols
Gleysols
Soils with aquic conditions
Poorly drained soils (4.7%)
Fluvisols
Fluvisols
Fluvents
Soils formed on recent alluvium (2.8%)
1 Percentages 2 World
in parentheses refer to the relative amount of land area in each soil type. Reference Base for Soil Resources (Deckers et al., 1998).
Chernozems: dark, well-structured, fertile, calcareous soils Dunes and shifting sands Inland water Kastanozems: lighter colored soils with good fertility and structure Cambisols: moderately developed soils Histosols: peal soils
200
0
Figure 16.
200
Xerosols: poorly developed soils of (semi-)deserts Gleysols: poorly drained soils Regosols: rock debris or desert detritus Solonchaks: saline soils Arenosols: sandy soils
400 Kilometers
Dominant soils of Central Asia (compiled from FAO, 1995).
Solonetz: sodic soils Fluvisols: soils formed on recent alluvium Yermosols: very poorly developed soils of (semi-)deserts Lithosols: very shallow soils GLACIERS
Principal biomes of Central Asia
Figure 17.
17
Relative coverage (%) by sodic (left) and saline soils (right) (compiled from FAO, 1995).
by a natric horizon, a dense, strongly structured clay horizon with a high proportion of adsorbed sodium and/or magnesium ions (Driessen et al., 2000). They are particularly well represented in the Ustyurt Plateau and in a latitudinal belt north of 45◦ N, where they are associated with Chernozems, Kastanozems, Xerosols and Solonchaks, and where, according to Plyusnin (1960), they represent a ‘zonal’, rather than a site-specific, feature. The unusual importance of these soils in Central Asia is linked to a particular combination of climatic and micro-topographic conditions in the region. Solubility of common sodium and magnesium compounds in the soil increases sharply as temperature rises from 0◦ C to 30◦ C. The dissolution and accumulation of Na/Mg-compounds during the warmer part of the year is followed by much slower leaching during the wet but cold winter season (Driessen et al., 1998).This process of Solonetz formation is promoted by the level, slightly undulating relief, typical for the steppe plains, in with concave parts capture surface water, especially after snowmelt, soils get more humid and often leached, whereas convex parts are much drier (Plyusnin, 1960). The process starts already in the Chernozem zone, reaches its maximum importance in the south of the Kastanozem zone, weakens in the zone of dry steppes and is virtually absent in the deserts (Figure 17, left). In Central Asia saline soils are in most cases associated to sodic soils and occur under similar climatic and micro-topographic conditions (Figure 17, left and right). In addition, they are widespread in alluvial plains, where their presence is mostly related to secondary salinization under prolonged irrigation and waterlogging. To complete the picture, Lithosols are the dominant soils in the mountain ranges where they are associated with rock outcrops, whereas in the main alluvial plains and their tributaries Fluvisols are prevalent. Gleysols (soils with poor drainage) can also be important in depressions of alluvial plains or could result from improper irrigation without drainage. As much as by the soils that do occur, the region is characterized by the soils that are absent. The FAO Soil Map of the World does not report for Central Asia the following soils, which are widespread in other parts of Eurasia or the Mediterranean region: • • • • • • •
Andosols: soils formed on volcanic ash Acrisols: acid soils with clay-enriched subsoil and good nutrient retention capacity Phaeozems: strongly colored soils with fertile, well-structured, organic topsoil Luvisols: non-acid soils with clay-enriched subsoil and good nutrient retention capacity Nitosols: well drained fine-textured soils with constant clay content in subsoil Podzols: soils with a subsoil enriched in mobilized iron and organic matter Vertisols: darker colored cracking clays with (somewhat) deficient drainage
Whereas the absence of Andosols is indicative of a lack of volcanic activity in Central Asia, the lack of the other soil types is mainly related to the absence of the climatic conditions needed for the formation of these soils. The organic matter content of the soils of Central Asia is variable. On the basis of the soil classification units and their relative proportions in the associations of the Soil Map of the World, the Food and Agriculture Organization of the United Nations developed global maps of the distribution of organic carbon (FAO, 1995). Figure 18 is based on these maps and shows the distribution of
18 Climate Change and Terrestrial Carbon Sequestration in Central Asia
Figure 18. Distribution of soils with low organic matter content (left) and medium-high organic matter content (right) (compiled from FAO, 1995).
soils with very low to low OC-content in the topsoil (less than 0.6% OC) on the left, and medium to high OC-content (more than 1.2% OC) on the right. In Figure 18 it is easy to recognize the patterns of Chernozems, Kastanozems, Xerosols and Yermosols, with the associated southward trend of declining organic matter. 7
VEGETATION
Within the overall context of aridity, general coldness and soil patterns of Central Asia, the vegetation shows great diversity. In Uzbekistan alone, Gintzburger et al. (2003) mention the existence of 3750 species of vascular and other plants. The best way to describe the distribution of the main plant communities is through a phytogeographical framework linked to the main ecological zones. The Vegetation Map of Uzbekistan, (Geography Department of the Academy of Sciences of the Uzbek SSR, 1982), differentiates the following broad ecosystems: • Riparian vegetation and river banks (‘tugai’): communities dominated by either reeds, riparian forest species, halophytes, Tamarix, or mixtures • Vegetation of plains (desert-‘chol’): communities dominated by various Haloxylon, Calligonum, Astragalus, Ammodendron, Artemisia, Anabasis, Carex, Salsola and other species • Vegetation of foothills (‘adyr’): communities dominated by various Artemisia, Pistacia, Hordeum, Elytrigia and other species • Mountain vegetation (‘tau’): communities dominated by various fruit trees forests and bushes, Acer and Juniperus species • Vegetation of high mountains (‘alau’): communities dominated by various Prangos, Festuca, Polygonum and other species. In other countries of Central Asia the same zoning system for regrouping the plant communities is followed. Despite the high aridity, the ‘Chol’ vegetation, shows surprising diversity in response to local micro-climatic and soil conditions. Gintzburger et al. (2003) describe in Uzbekistan different plant communities on either sandy desert, ‘gypseous’ desert, Solonchak desert and clay desert. For a more extensive treatment of vegetation in Central Asia is referred to the relevant literature. Gintzburger et al. (2003), although mostly focused on Uzbekistan, offer a very comprehensive monograph and literature list, whereas the WWF Ecoregion descriptions (Olson et al, 2001) contain excellent introductions to vegetation communities and their associated fauna. 8
LAND USE
The map in Figure 19, derived from interpretation of 1-km resolution satellite imagery for the base year 1993 (Celis et al., 2006a), shows the distribution of the main land use/cover categories.
Principal biomes of Central Asia
Figure 19.
19
Major land use/land cover types in Central Asia, base year 1993 (Celis et al., 2006a). Table 6.
Summary of land use/land cover in Central Asia.
Land use/land cover
% of region
Irrigated cropland Rainfed cropland Grasslands and shrubs Forests and woodlands Sparse vegetation Other (water, urban)
6.4 8.2 48.4 1.1 33.8 2.1
Agriculture is practiced in about 15% of the region. Unsurprisingly, rainfed agriculture is confined to the north of the country and the foothill areas along the southeastern mountains, where both temperature and precipitation allow sufficiently long growing periods (Figure 15). Irrigation occurs along main river courses, the Karakum canal and natural basins, such as the Fergana valley. Most of the region (Table 6) is covered by either a good cover of grasslands and shrubs, or by sparse vegetation, for a total of more than 80%. Forests or woodland barely cover 1% of the region. This picture of land use patterns is not static. A regional analysis of low-resolution satellite imagery (Celis et al., 2006b) evidenced during the observation period 1982–1999 significant and consistent (i.e. not related to climatic variability) changes in land use/land cover. These changes could be summarized into 4 major trends (Figure 20): • ‘intensification of agriculture’: a consistent upward trend in land use with higher biomass productivity • ‘intensification of natural vegetation’: a similar upward trend for the natural vegetation • ‘retrenchment of agriculture’: a consistent downward trend in land use tending to lower biomass productivity • ‘retrenchment of natural vegetation’: a similar downward trend for the naural vegetation Comparing Figure 20 with Figure 19, it is clear that the hotspots of change are mainly located at the interface between the grassland-shrub areas and the sparsely vegetated rangelands on the one hand, and between the grassland-shrubs and the rainfed agriculture systems. Within each system individually there is not much change. Quantifying these changes, it appears that intensification of agriculture occurred on 147,520 km2 , mostly in the form of a change from grasslands/open shrublands into rainfed cultivation. The inverse
20 Climate Change and Terrestrial Carbon Sequestration in Central Asia
Figure 20.
Land use/land cover change trends in Central Asia over the period 1982–1999 (Celis et al., 2006b).
trend, a change from rainfed cultivation to grasslands/open shrublands, occurred on 80,960 km2 and is the major component of the retrenchment of agriculture (125,248 km2 ). Intensification of natural vegetation occurred on 111,040 km2 , almost all as a result of change from barren/sparsely vegetated areas to grasslands/open shrublands. This intensification trend is very noticeable in Southwest Kazakhstan near the Caspian Sea. There is no clear explanation for this trend in the literature. It is possible that the trend is related to the decline of livestock herds and corresponding decrease in grazing intensity after the collapse of the Soviet Union in the early 1990s, a cause proposed for the NDVI patterns in other parts of Kazakhstan (de Beurs and Henebry, 2004). The inverse trend, a change from grasslands/open shrublands into barren/sparsely vegetated areas, occurred on 46,272 km2 , and is particularly clear in Central Kazakhstan. 9
AGROECOLOGICAL ZONES
In the previous sections it was evidenced that the key environmental drivers that influence carbon sequestration, climate, terrain, soils and land use systems, are subject to considerable spatial and often temporal variability. Hence it is obvious that the interaction of these factors may lead at local level to a wide range of different domains for the management of the natural resource base. To capture the major differences in these factors and link them in a way that management recommendations can be more easily formulated in a spatially explicit manner, a more holistic spatial framework is needed. In this context the term agroecological zones is used to demarcate integrated and more or less homogeneous spatial units, in which available water resources, climate, terrain, and soil conditions are combined to create unique environments, associated with distinct farming systems and recommendation domains for land use management. Whereas in the past the manual integration of spatial data from different disciplines was problematic, GIS technology makes this now perfectly practicable. 9.1
Methodology
The agroecological zones (AEZ) for Central Asia were generated at 1-km resolution by an overlay procedure in GIS that involves climatic, terrain, soils, land use/land cover themes and the following steps: • Generating raster surfaces of basic climatic variables through spatial interpolation from station data;
Principal biomes of Central Asia Table 7.
21
Soil management groups of Central Asia.
Soil types by symbols (FAO, 1974)
Soil Management Groups and their extent (%)
B, Bc, Bd, Be, Bh, C, Ch, Ck, Cl, H, K, Kh, Kl, Mo
Agricultural soils (26.6%)
G, Gc, Ge, Gm, J, Jc, Je, Oe
Soils of wetlands, poorly drained areas and floodplains (7.9%)
Qc + DS
Sandy soils, sand sheets and mobile sands (12.9%)
S, Sg, Sm, So, Ws, Z, Zg, Zo, Zt, Zm, St
Sodic and saline soils (21.4%)
I, RK, U
Rock outcrops and shallow soils (9.7%)
X, Xh, Xk, Xl, Xy
Semi-desert soils (12.2%)
Y, Yh, Yk, Yt, Yy
Desert soils (8.6%)
Gx, Rc, Rd
Non-agricultural soils (.3%)
Dd
Soils with high acidity and/or low nutrient status (0.1%)
• Generating a spatial framework of agroclimatic zones (ACZ) by combining the basic climatic surfaces into more integrated variables that provide a better, although simplified, synthesis of climate conditions; • Simplifying the relevant biophysical themes (agroclimatic zones, land use/land cover, landforms and soils); • Integrating the simplified frameworks for agroclimatic zones, land use/land cover, landforms and soils by overlaying in GIS; • Removal of redundancies, inconsistencies, and spurious mapping units; • Characterization of the spatial units in terms of other relevant themes. The generation of raster surfaces of basic and derived climatic variables was described in earlier sections. As input theme for climate the 1-km layer of Agroclimatic Zones (Figure 4) was used. The land use/land cover layer developed by Celis et al. (2006a) was used as second overlay theme. The input theme used to represent landforms was a layer consisting of 7 elevation-‘relief intensity’ classes, based on the classification of the 1-km resolution GTOPO30 digital elevation model (Gesch and Larson, 1996). For the soil theme the 1:5,000,000 scale Digital Soil Map of the World (FAO, 1995) was used, with attribute table to represent the entire soil association. These themes were then simplified in order to avoid (i) a replication of the single-theme maps, and (ii) unnecessary complexity for the purpose of the AEZ map. Thus the theme ‘agroclimatic zones’ was condensed from 21 to 9 classes, the land use/land cover theme from 12 to 3 classes, the landform theme from 7 to 3 classes, and the soils theme from 55 FAO Soil Groups and 140 soil associations to 9 ‘soil management groups’ (Table 7). The creation of new units in GIS through overlaying propagates errors that were already present in the component datasets. Simplification of the input data layers was one way to reduce the errors resulting from overlaying. In addition, special rules were established to remove redundancy or inconsistencies as well as GIS-based automatic procedures to remove ‘spurious’ mapping units, created by the overlaying process. A final step was the characterization of the AEZ in terms of additional themes relevant to planning or management. This could be biophysical themes, such as frost occurrence, growing periods, soil management groups, but also socio-economic themes, such as farming systems, and is presented as a summary table. An example is given in Table 8 for the theme ‘Number of frost days’. 9.2 Results Following the above methodology 185 AEZ were identified in Central Asia.
22 Climate Change and Terrestrial Carbon Sequestration in Central Asia Table 8.
Percentages of frost day classes within a specific agroecological zone (AEZ).
AEZ
0–1 days
1–30 days
30–60 days
60–90 days
90–120 days
120–150 days
150–180 days
>180 days
160 251 351 206 120 306 456
0 0 0 0 0 0 0
100 6 0 14 100 0 0
0 11 0 36 0 0 0
0 53 0 40 0 0 0
0 31 76 11 0 56 0
0 0 23 0 0 43 37
0 0 0 0 0 2 60
0 0 0 0 0 0 3
Table 9.
Five largest agroecological regions (AEZ) in Central Asia.
AEZ
Description
33100
Arid climates with cool or cold winters and warm or very warm summers; winter coldness is an ecological constraint; non-agricultural land use; plains and plateaux; undifferentiated soils
53110
Wemi-arid climates with cool or cold winters and mostly warm summers; winter coldness is an ecological constraint; non-agricultural land use; plains and plateaux; predominantly agricultural soils
53100
As above, but with undifferentiated soils
33170
Arid climates with cool or cold winters and warm or very warm summers; winter coldness is an ecological constraint; non-agricultural land use; plains and plateaux; predominantly desert soils
33140
As above but with predominantly sodic and saline soils
Figure 21.
Distribution of the five largest agroecological zones (AEZ) in Central Asia.
Of these, the five largest (Table 9) cover nearly 48% of Central Asia (Figure 21), whereas the 20 largest cover 80% of the region. On the other hand, 50% of all AEZ in Central Asia cover a total of only 1%, evidencing that virtually all of them constitute ‘niche’ agroecologies, the vast majority located in mountain areas.
Principal biomes of Central Asia
23
10 CONCLUSION Keeping the soils of Central Asia as a net sink for atmospheric carbon becomes a new goal for agricultural planning, on top of the need to create productive and economic land use systems, improve rural livelihoods and maintain environmental sustainability. In this respect it becomes another optimization challenge in balancing often conflicting interests. Although it is certainly possible to make generalized management recommendations for the agricultural environments of Central Asia, this paper make it clear that the environmental drivers of land use management are far from uniform across the region. Climatic drivers, particularly those determining moisture supply and temperature stress, vary considerably, not only in space but also in time. Micro-climatic conditions can be very important, particularly, but not exclusively, in mountain areas, and the large number of AEZ with rather small spatial extent points to the existence of ‘niche’ agroecologies in much of the region. In order to reduce the great complexity of agricultural environments without oversimplification, this paper proposes an approach for defining agroecological zones using GIS procedures. It is based on the integration of thematic layers related to climatic, landform, land use/land cover, and soil data, and the characterization of the resulting spatial units. The method is useful to define areas that can be considered homogeneous in their biophysical characteristics at a relatively fine resolution (1−5 km2 ) and can thus serve as a first basis for area-specific agricultural (research) planning. It is also sufficiently flexible to allow, again using GIS procedures, aggregation into larger spatial units for higher-level planning. The delineation of the zones, while based on objective criteria, is not static and their updating, as could be required due to changes in the more dynamic components, such as land use or even climate change, is perfectly feasible.
REFERENCES Bailey, R.G. and H.C. Hogg, 1986. A world ecoregions map for resource reporting. Environmental Conservation 13: 195–202. Bailey, R.G. 1989. Explanatory supplement to Ecoregions Map of the Continents. Environmental Conservation 16: 307–309. Celis, D., E. De Pauw, and R. Geerken. 2006a. Assessment of land cover/land use in the CWANA region using AVHRR imagery and agroclimatic data. Part 1. Land cover/land use – Base Year 1993. Technical report. ICARDA, Aleppo, Syria, 50 pp. Celis, D., E. De Pauw, and R. Geerken. 2006b. Assessment of land cover/land use in the CWANA region using AVHRR imagery and agroclimatic data. Part 2. Hot spots of land cover change and drought vulnerability. Technical report. ICARDA, Aleppo, Syria, 58 pp. Center for International Earth Science Information Network (CIESIN), Columbia University; and Centro Internacional de Agricultura Tropical (CIAT). 2005. Gridded Population of the World Version 3 (GPWv3): Population Density Grids. Palisades, NY: Socioeconomic Data and Applications Center (SEDAC), Columbia University. Available at http://sedac.ciesin.columbia.edu/gpw. (2006/11/11) Deckers J.A., F.O. Nachtergaele, and O.C. Spaargaren (eds.). 1998. World Reference Base for Soil Resources. Introduction. Acco Leuven, 165 pp. de Beurs, K.M. and G.M. Henebry. 2004. Land surface phenology, climatic variation, and institutional change: analyzing agricultural land cover change in Kazakhstan. Remote Sensing of Environment 89: 497–509. De Pauw, E. 2002. An agroecological exploration of the Arabian Peninsula. ICARDA, Aleppo, Syria, 77 pp. ISBN 92-9127-119-5. De Pauw, E., F. Pertziger, and L. Lebed. 2004. Agroclimatic mapping as a tool for crop diversification in Central Asia and the Caucasus. p. 21–43. In: J. Ryan, P. Vlek, and R. Paroda (eds.). Agriculture in Central Asia: Research for Development. ICARDA, Aleppo, Syria. Driessen,P., J. Deckers, O. Spaargaren, and F. Nachtergaele. 2001. Lecture Notes on the Major Soils of the World. World Soil Resources Report 94, FAO, Rome. 334 pp. Encyclopedia Britannica. 1994. The New Encyclopedia Britannica. Chicago. FAO. 1974. FAO-UNESCO Soil Map of the World. Vol.I: Legend. UNESCO, Paris
24 Climate Change and Terrestrial Carbon Sequestration in Central Asia FAO. 1988. FAO-UNESCO Soil map of the world: Revised legend. World Soil Resources Report No. 60. Food and Agriculture Organization of the United Nations, Rome, Italy. FAO-UNESCO. 1995. The Digital Soil Map of the World and Derived Soil Properties. Land and Water Digital Media Series 1. FAO, Rome. CD-ROM. Geohive. 2006. Geohive Global Statistics. Available at http://www.xist.org/default1.aspx (2006/12/04) Gesch, D.B., and K.S. Larson. 1996. Techniques for development of global 1-kilometer digital elevation models. (on-line document, URL http://edc.usgs.gov/products/elevation/gtopo30/papers/geschtxt.html) (2007/01/14) Gintzburger, G., K.N. Toderich, B.K. Mardonov, and M.M. Mahmudov. 2003. Rangelands of the Arid and Semi-Arid Zones in Uzbekistan. CIRAD-ICARDA. ISBN 2-87614-555-3, 426 pp. Lobova, E.V. 1960. Génèse et classification des sols gris-bruns des déserts de l’URSS. Bulletin AFES, May 269–282. Olson, D.M., E. Dinerstein, E.D. Wikramanaya, N.E. Neil, D. Burgess, G.V.N. Powell, E.C. Underwood, J.A. D’Amico, I. Itoua, H.E. Strand, J.C. Morrison, C.J. Loucks, T.F. Allnutt, T.H. Ricketts, Y. Kura, J.F. Lamoreux, W.W. Wettengel, P. Hedao, and K.R. Kassem. 2001. Terrestrial Ecoregions of the World: A New Map of Life on Earth. BioScience 51: 933–938 Terrestrial Ecoregion GIS Database available at: http://www.worldwildlife.org/science/data/terreco.cfm (2006/12/04) Plyusnin, I.I. 1960. Reclamative Soil Science. Foreign Language Publishing House, Moscow. 398 pp. Soil Survey Staff. 1994. Keys to Soil Taxonomy. United States Department of Agriculture, Soil Conservation Service. Sixth Edition, Washington, DC., USA. UNESCO, 1979. Map of the world distribution of arid regions. Map at scale 1: 25,000,000 with explanatory note. United Nations Educational, Scientific and Cultural Organization, Paris, 54 pp. ISBN 92-3-101484-6 Williams, M.W. and V.G. Konovalov. 2004. GHCN: Regional Data Base on Climate of Central Asia, Volume 1.0. Available at: snobear.colorado.edu/Markw/Geodata/BD_INFOR_E.doc (12/5/2006)
CHAPTER 2 Forests in Central Asia: Current status and constraints
Muhabbat Turdieva CWANA Subregional Office for Central Asia, Tashkent, Uzbekistan
Evsey Aleksandrovskiy Research and Production Centre of Ornamental Gardening and Forestry, Tashkent, Uzbekistan
Abdukhalil Kayimov Department of Forestry,Tashkent State Agrarian University, Tashkent, Uzbekistan
Salamat Djumabaeva Research Institute of Forest and Nut Industry, Bishkek, Kyrgyzstan
B. Mukanov Research and Production Centre of Forestry, Shuchinsk, Kazakhstan
Ashyrmuhammed Saparmyradov Department of Science and Technologies of the Ministry of Agriculture, Ashgabat, Turkmenistan
Khukmatullo Akmadov Academy of Agricultural Sciences of the Republis of Tajikistan, Dushanbe, Tajikistan
1
INTRODUCTION
Humans have used forest genetic resources for a long time, but without understanding the necessity and methods of their conservation. Thus, over-exploitation and insufficient forest protection, misuse of forest lands, uncontrolled cattle grazing which continues until present, felling trees for firewood, over-harvesting of wild fruits and nuts, forest fires and other factors have adversely impacted forest resources. Consequently, the forest vegetation in Central Asian countries does not form large contiguous areas, and is represented with relatively fragmented forest lands, located far from human settlements, and often, in poorly accessible locations. Forest ecosystems are degraded and many plant and animal species are endangered to a great extent. The ecosystem services of forests are being compromised, many species are losing their natural habitat, and their gene pool is progressively impoverished under the influence of human activities. An important role in conservation of forest biodiversity can be played by a national system of creating protected areas, which include nature reserves (“zapovednik”), national parks, nature refuges (“zakaznik”), and nature monuments. However, the ratio of specially protected areas is on average about 5% in the region and this situation is a major concern for the future of forest resources in Central Asia. Forests in Central Asia are not only a source of timber but also provide ecosystem services including moderating climate, protecting soils, storing water, etc., which ensure sustainability of forest and agricultural production. Forests in the region are an important source of non-wood forest products for rural communities and forest dwellers living there. The demand of construction industry for timber is mainly met by importation from Russia. Area under forests in Central Asia has been reduced on average by a factor of 4–5 times since the beginning of the 20th century. Desert and floodplain native forests were especially affected 25
26 Climate Change and Terrestrial Carbon Sequestration in Central Asia drastically by anthropogenic pressure due to their use for agricultural production (Regional Report “Environment Status in the Aral Sea Basin”, 2000). This chapter outlines the need for undertaking urgent activities on conservation of genetic resources of main forests and associated forest tree species. 2
CENTRAL STATUS OF FORESTS IN CENTRAL ASIA
The Region of Central Asia occupies a large territory – about 3.996 million km2 with a population of 54.6 million. The Region of Central Asia includes Kazakhstan, Kyrgyzstan, Tajikistan, Turkmenistan and Uzbekistan and belongs to the area categorized as sparsely covered with forests. On average, the portion of area covered with forest barely exceeds 5% in the entire region. State forest farms are the main entities in the region, whose main objective is protection and management of forest land in Central Asian countries. 2.1
Kazakhstan
Total area of all forest types in Kazakhstan is more than 26.5 million hectares (M ha), including forest covered area of 11.4 M ha. The ratio of forest-covered area in Kazakhstan is very low, about 4.2%. Ratio of plain area is 42.5% of the total area of the country, and is characterized with the least forest-covered area (1.63%). Forests in Kazakhstan occur almost in all climatic zones, but are unevenly distributed throughout the country. Eastern and south-eastern parts of the country are the areas most covered with forests. Diversity of forest tree species in Kazakhstan is quite rich and includes 622 species. Coniferous forests in the country are represented by pine (Pinus silvestris, P.sibirica) woods in north, with fir (Abies sibirica), larch (Larix sibirica), spruce, and cedar forests in east and south-east. Total area of coniferous forests is 1.69 M ha. Hard-wood forest area is 5.4 M ha and is comprised mainly of oak (Quercus robur) and elm (Ulmus laevis). Soft-wood forests occupy 1.3 M ha. Betula sp. is the main forest forming species in soft-wood forests. Saxaul forest is widely spread in southern part of the country. Haloxylon sp. grows in about 5.3 M ha. Brushwood forest area (Artemisia sp, Colligonum sp.) has formed recently through transfer of areas under bush and degraded pastures in southern part of the country to the forest fund, and has area of 2.52 M ha. An area under wild fruit species is 0.19 M ha in the southern part of the country and mainly comprises Malus sieversii, Armeniaca vulgaris, Crataegus and Berberis spp. Forests in Kazakhstan are of great importance to ecosystem services and 96% of them belong to groups I and II of the forest protection system. There are nine nature reserves with total area of 0.87 M ha, five National Parks with area of 1.28 M ha, and 57 natural refuges in Kazakhstan. The total area of specially protected areas is 5.4% of the whole territory of Kazakhstan, where 0.14% of national plant gene pool is conserved (Krever et al., 1998). 2.2 Kyrgyzstan Total area of state forest land is 3.16 M ha in Kyrgyzstan and forest covered area is 0.85 M ha, which comprises 4.25% of the total area of the country (Kolov et al., 2001). All forests in Kyrgyzstan are of particular value. Under the Forest Code of Kyrgyz Republic, these are classified as environment protecting forests and according to composition of dominant species and habitat conditions they are divided into four groups: (a) Spruce, (b) Juniper, (c) Nut-Fruit, and (d) Flood-lands forests. Total area of spruce forests is 0.124 M ha, including Picea Shrenkiana F. et. M. (0.114 M ha), Abies Semenovii Fed. (3,600 ha), Pinus silvestris L. (2,300 ha), Larix sp. (1,600 ha) and Betula pendula (5,400 ha). Ratio of total area covered with spruce forests is 2.3% of the total forest area in Kyrgyzstan (Figure 1). Juniper forests, formed with three juniper species grow in the south of the country in Osh Province in mountainsides of the Altay ridge, at the altitude of 900–3,700 m above sea level (m.a.s.l.). Lower belt of these forests is formed with Juniperus seravschanica Kom. at the altitude
Forests in Central Asia: Current status and constraints
Figure 1.
27
Spruce forest in Kyrgyzstan (photo of s. Djumabaeva).
of 900–1,300 m.a.s.l., medium belt of Juniperus semiglobosa Rgl. at the altitude of 1,400 to 3,100 m a.s.l., and higher belt of Juniperus turkestanica at the altitude of 2,500 to 3,300 m a.s.l. Total area of juniper forests in Kyrgyzstan is 250,300 ha, including cedar forests with area of 90,510 ha. Despite the fact that conservation of juniper forests is of great importance, their status is gradually becoming worse. Since 1980, the area of juniper forests is reduced to 18% and the area of hessians has increased to 31%. Intensive tree felling in the past, forest fires and excessive cattle grazing have led to this situation. Severe soil erosion is observed on 0.115 M ha in Kyrgyzstan, which was covered with juniper forests in recent past. Natural regeneration of juniper forests is practically stopped due to bad seed germination and cattle grazing. Degradative processes are rapidly accelerating. Desertification of areas covered with juniper forests, replacement of forest plants with desert and semi-desert species, strong mud streams and soil washing are widespread (Kolov et al., 2002). Natural nut and fruit tree forests, a unique world heritage, are located in Jalalabad and Osh Provinces in Kyrgyzstan, in the mountainsides of Fergana and Tien Shan ridges. As many as 183 tree and shrub species grow in nut and fruit forests there. Nut and fruit tree forest is of special interest and has area of 0.63 M ha, including 0.28 M ha covered with forest. Juglans regia L. (35,100 ha), Pistacia vera L. (32,600 ha), Malus domestica (16,500 ha), Prunus divaricata Ldb. (600 ha), Acer sp. (27,600 ha), Picea tienshanika and P. shrenkiana F. et. M. (64,000 ha), Abies Semenovii Fed. (1,400 ha), Juniperus sp. (47,200 ha), Crataegus sp. (3,000 ha) are the main species comprising nut and fruit tree forests. About 2,500 t of walnut, 8,000 t of apples, 1,000 tons of cherry-plum and other wild nuts and fruits are annually harvested in natural forest stands in Kyrgyzstan (Figures 2 and 3). Other forest tree species grow on 113,300 ha (Kolov, 2003). A national system of specially protected areas in Kyrgyzstan includes six nature reserves with total area of 0.22 M ha and forested area of 20,262 ha, six national parks with total area of 0.22 M ha, 52 nature refuges and 18 nature monuments. The total special protected area is 0.86 M ha, or 4.4% of total area of Kyrgyzstan. 2.3 Tajikistan All forests in Tajikistan are mountainous and belong to the first category of the forest protection system. The total area of forest reserve is 1.8 M ha, of which 0.41 M ha is covered with forest. The ratio of forest covered area is about 3% in Tajikistan.
28 Climate Change and Terrestrial Carbon Sequestration in Central Asia
Figure 2.
Walnut natural stands in Southern Kyrgyzstan (photo of S. Djumabaeva).
Figure 3.
Pistachio (Pistacia vera L.) natural stands in Tajikistan (photo of L. Nikolyai).
Juniper sp. is the main forest species in Tajikistan and grows at the altitude of 1,500–3,200 m.a.s.l. Area of juniper forests, represented by Juniper sibirica, J. turestanica, J. seravschanica, J. semiglobosa and J. schugnanica is 0.15 M ha. Pistachio (Pistacia vera) sparse forests grow mainly in the southern part of Tajikistan at the altitude of 600–1,400 m.a.s.l. (Figure 3). Area of pistachio forest in Tajikistan is 78,000 ha. Walnut (Juglans regia) stands occupies area of 8,000 ha and grows in central part of Tajikistan at the altitude of 1,000–2,000 m.a.s.l. (Figure 2), sometimes in mixture with Malus sieversii, Acer Regelii, Prunus darsvasica. Betula, Populus, Hippophae rhamnoides, Fraxinus growing along riversides at the altitude of 1,500 m.a.s.l. and occupying an area of 15,000 ha (Novikov, Safarov, 2002). Populus, Elaeagnus, Tamarix contribute floodplain forests (tugay) in Tajikistan. In the beginning of 19th century, the area of tugay forest was about 1 M ha, whereas now its area is only 120,000 ha or one-eighth of the original area (Akhmadov and Kasirov, 1999). There are four nature reserves with area of 0.17 M ha, 13 nature refuges with area of 0.31 M ha, two national parks (2.6 M ha), and 26 nature monuments in Tajikistan.
Forests in Central Asia: Current status and constraints
Figure 4.
2.4
29
Juniper forests in Turkmenistan (photo of M. Turdieva).
Turkmenistan
Arid Turkmenistan is one of the forest deficient regions in Central Asia. All forests in Turkmenistan belong to State Forest Fund (forests of state importance and forests in reserved land) and its area is 9.996 M ha. Forest covered area is about 4.13 M ha. Forests in Turkmenistan are distinguished into three types: (a) Desert forests, (b) Mountainous forests, and (c) Native floodplain (tugay) forests. Mountain forests (mainly juniper and pistachio tree stands) grow on 0.524 M ha in Turkmenistan with forest covered area of 0.15 M ha (Figure 4). Juniper forests comprise of Juniperus turcomanica and J. zeravschanica. These are fragmented forests and barely form big all-over covered forest areas. Total area of juniper forests is 66,200 ha. Juniper tree stands provide water saving and nature-preserving service to mountain ecosystem of Kopetdag and Kugitang. Wild populations of Pistacia vera L. and Punica granatum L. grow in hills in the south of Turkmenistan. Main natural stands of Pistacia vera L. grow in Badkhiz, in the border of Turkmenistan, Iran and Afghanistan. Total area of pistachio stands in Turkmenistan is over 0.1 M ha with forest covered area of 36,400 ha. Today, pistachio stands are fragmented and do not form large natural stands, though a dense belt of semi-savannah pistachio groves ranges along the northern mountainside from east-end to central part of Kopetdag ridge in the past. Total area of desert forests is 9.35 M ha, of which the forest cover occupies 3.96 M ha. Haloxylon persicum is the main forest species and covers a large area of 3.66 M ha. Haloxylon aphyllum grows on an area of 0.73 M ha. The area covered with Calligonum sp. is 41,000 ha of which Salsola sp. occupies 4,000 ha (Allamuradov et al., 2005). Native floodplain forests (tugay) grow in valleys of Amu-Darya, Tejen and Murgab rivers, and mountain rivers of Central and especially South-Western subtropical Kopetdag. Total area of tugay forests is 44,500 ha, of which the forest cover is 26,000 ha. The main forest species of tugay forests in flood-plains of Amudarya river are ‘turanga’ (Populus diversifolia) (4,800 ha) and Russian olive (Elaeagnus angustifolia) (1,500 ha). Glycyrrhiza glabra is of particular value in tugay forests (Kamakhina, 2005). There are eight nature reserves with a total area of 0.785 M ha, 14 nature refuges with an area of 1.16 M ha, and 17 nature monuments. Total area of specially protected lands is 1.98 M ha or
30 Climate Change and Terrestrial Carbon Sequestration in Central Asia
Figure 5.
Saxaul forest in Uzbekistan.
4.02% of the total area of the country. About 62.6% or 72 species of plants are conserved in these protected areas. 2.5
Uzbekistan
Total area of forest land in Uzbekistan is 8.78 M ha, or 19% of the total area (data of 1.01.2006). Uzbekistan is a low-forested country, and the forest covered area is only 2.3 M ha or about 5.1% of the total area of Uzbekistan (Kayimov, 2006). The principal owner of forest lands is Main Forestry Office of Ministry of Agriculture and Water Management of Uzbekistan. The total area of forest fund belonging to these Offices is 8.05 M ha (91.8%) of which 2.37 M ha is covered with forest. Forest fund of the Main Forestry Office is classified into different ecological zones as: (a) Mountainous, (b) Desert, (c) Tugay (native floodplain forests), and (d) Valley zone. The main part of forests (88%) is located in deserts (total area of 7.02 M ha with forest covered area of 1.95 M ha). Desert forests are formed mainly by Haloxylon persicum (1.12 M ha) and H. aphyllum (0.27 M ha). Salsola Paletzkiana, S. Richteri, Calligonum sp. and Tamarix sp. are also widely spread in desert forests (Figure 5). Ratio of mountains forests is 9% with total area of 0.76 M ha and forest covered area of 0.25 M ha. Juniperus sp. (0.2 M ha) and such nut-bearing species as Juglans regia L., Pistacia vera L. and Amugdalus sp. (46,400 ha) are the main forest species in mountainous area. Malus siversi L., local species of Crataegus sp., Acer sp., Prunus armeniaca, shrub species of Berberis sp., Rosa sp., Hippophae rhamnoides and others also grow in forests there. Area of tugay forests is 75,500 ha with forest covered area of 17,800 ha. The area of valley zone forests is 38,000 ha with forest covered area of 8,800 ha. The main forest species in tugay forests are Populus pruinosa and P. diversifolia, which usually grow together with Elaeagnus sp. and Salix sp. In contrast, Poplar, elm, sycamore and other fast-growing trees and shrubs are forest spp. in valley zone forests (online data of Main Forestry Office of Ministry of Agriculture and Water Resources of the Republic of Uzbekistan; 2006). In comparison with 1996, forest area in Uzbekistan was reduced by more than 1 M ha by logging, converting forest lands to arable lands, and increasing effects of soil erosion. Area of tugay forests was reduced to less than one-tenth of the original area. Cutting saxaul, juniper and other forest trees for firewood has led to desertification of 6.5 M ha of land previously covered with vegetation in Uzbekistan.
Forests in Central Asia: Current status and constraints Table 1.
31
Wood stock of main forest forming species groups in Central Asian countries. Wood stock (million m3 )
Species
Kazakhstan
Kyrgyzstan
Turkmenistan
Uzbekistan
Coniferous tree species Soft-wood tree species Saxaul sp. Hard-wood tree species
231.0 121.9 10.2 2.9
15.95 2.42 – –
1.5 – 9.3 –
4.135 0.845 12.745 –
National system of specially protected areas in Uzbekistan includes nine nature reserves with total area of 0.22 M ha, two national parks with area of 0.61 M ha, and nine nature refuges with area of 1.22 M ha (National Strategy and Action Plan on Conservation and Sustainable Use of Biodiversity of the Republic of Uzbekistan, 1998).
3
FOREST PRODUCTIVITY
It is very difficult to estimate forest productivity in the countries of the region for a number of reasons. Information is lacking or outdated to make analysis of wood stock by species and age structure. Average forest yield in Central Asia is 82.04 million m3 , of which 60.2% is wood stock of coniferous species, 7.2% is hard-wood, 28.2% is soft-wood and 4.4% comprises other tree species. On average, the per capita forest area is 0.4 ha and per capita wood stock is about 7.0 m3 in Central Asian region, which are very low. Distribution of forested area is uneven throughout the region. Main part of forested area and consequently wood stock is in Kazakhstan (366.1 M m3 ) (Table 1). Tajikistan is the country with the lowest wood stock (5.0–5.2 M m3 ) in the region (Regional report, Environment status of the Aral Sea Basin). Forests in Central Asian countries mainly (89%) belong to 1st group of Forest Functions Classification and provide ecological, sanitational, recreational and protective functions. Therefore, commercial timber logging in these forests is prohibited. There are forests of 2nd and 3rd groups where timber logging is allowed, but only in Kazakhstan. Forests in the region are considerably affected by such negative factors such as pest outbreaks, forest fires, cutting trees for firewood due to lack of alternative energy sources, overgrazing, climate change, transforming forest lands into arable.
4
MAIN CONSTRAINTS IN FOREST MANAGEMENT
The principal constraints in sustainable management of forests in Central Asian region are: • Low capacity of the current national forest protection and management systems in the region to ensure effective conservation of forest genetic resources due to lack of resources both financial and physical; • Lack of awareness on value and importance of forest conservation and sustainable use for national development at national and regional levels. This should be recognized by all groups of stakeholders, including policymakers, planning agencies and local communities; • Lack of definite prospects for forest enterprises functioning in new economic situations during the phase of economy transition in the region; • Lack of qualified staff at forest enterprises trained to manage forests in effective way under market driven economy.
32 Climate Change and Terrestrial Carbon Sequestration in Central Asia For low areas covered with forest, a high level of land reclamation and continuous anthropogenic pressure on forests are required to manage the forests in a sustainable way to ensure their availability for future generations in Central Asia. REFERENCES Akhmadov Kh.M. and K.Kh. Kasirov. 1999. Tigrovaya balka nature reserve. Wildlife Conservation [in Russian] 1(12): 20–21. Allamuradov A., A. Abdurakhimov and A. Kuliev. 2005. Turkmenistan: Policies affecting forest land use and forest products markets – Forest resources assessment for sustainable forest management. Country statement. UNECE/FAO/LCR Workshop: Capacity building in sharing forest and market Information, October 24–28, 2005, Prague and Kristny, Czech Republic [online]. Available from: http://www.fao.org/regiona/seur/events/krstiny Forestry of Uzbekistan [online]. Available from: http://www.msvx.uz/rus/forest Kamahina G.L. 2005. Flora of Central Kopetdag: In past, nowadays and in future [in Russian]. Ashgabat, Turkmenistan. p. 245 Kayimov A.K. 2006. Conservation of forets genetic resources biodiversity and their rational use in Uzbekistan. Journal Jalal-Abad State University 1:82–85 Kolov O.V., T.S. Musuraliev, Sh.B. Bikirov, V.D. Zamoshnikov, and T.M. Koblitshkaya. 2001. Forest and forest use. p. 103–120. In: Mountains of Kyrgyzstan [in Russian]. Technologiya Press, Bishkek, Kyrgyzstan. Kolov O.V., Sh.B. Bikirov, N.S. Bikirova, and A.Sh. Bikirova. 2002. Conservation and rational use of forest biodiversity and forest genetic resources of Kyrgyz Republic. pp. 161–166. In: E.D. Shukurov (ed.). Biodiversity of Western Tien-Shan: Status and prospects [in Russian]. Bishkek, Kyrgyzstan. Kolov O.V. 2003. Current status of nut and fruit forests biodiversity in Southern Kyrgyzstan. p. 157–161. In: I.S. Sodombekov (ed.). Conservation and sustainable use of plant resources. [in Russian]. Bishkek. Kyrgyzstan. pp. 157–161 Krever V., O. Pereladova, M. Williams, and H. Jungius (eds.). 1998. WWF. Biodiversity Conservation in Central Asia: An Analysis of Biodiversity and Current Threats and Initial Investment Portfolio. TEXT Publishers, Moscow, Russia. National Biodiversity Conservation Strategy and Action Plan of the Republic of Uzbekistan. 1998 [in Russian]. Tashkent, Uzbekistan Novikov V. and N. Safarov. 2002. Tajikistan:. Environment status. Ecological report. [online]. Available from: http://enrin.grida.no/htmls/tadjik Regional report: Environment status of the Aral Sea Basin. [online]. Available from: http://enrin.grida.no/ aral/aralsea
CHAPTER 3 C3/C4 plants in the vegetation of Central Asia, geographical distribution and environmental adaptation in relation to climate
Kristina Toderich Department of Desert Ecology and Water Resources Research, Samarkland, Uzbekistan
Clanton C. Black Biochemistry and Molecular Biology, University of Georgia, Athens, Georgia, USA
Ekaterina Juylova Department of Desert Ecology and Water Resources Research, Samarkland, Uzbekistan
Osamu Kozan University of Yamanashi, Kofu-city Yamanashi, Japan
Tolib Mukimov Department of Desert Ecology and Water Resources Research, Samarkland, Uzbekistan
Naoko Matsuo Graduate School of Agriculture, Kyoto University, Kyoto, Japan
1
INTRODUCTION
An unparalleled floral diversity is found in the continental deserts of Central Asia that stretch for thousands of miles from Iran and Afghanistan across Uzbekistan, Turkmenistan into Western China and Mongolia. Two major pressures subject Central Asian deserts to powerful forces that lead to desertification, namely, their extremely dynamic environments plus a host of human driven activities. Great natural contrasts exist in these continental environments, e.g., with mostly autumn-winter rains and almost absence of rainfall in summer along with quite high and low annual temperature fluctuations, and complicated desert, mountain, steppe and plain relief. Human activities demand lands, waters, plants, and other natural resources for activities such as domestic livestock grazing, fuels, cropping agriculture, irrigation, dams, reservoirs and canals, mining, drilling, roads, dwellings, and other human infrastructures. Such extreme natural environmental changes coupled with human activities often induce dynamic detrimental environments for the growth and seed reproduction of plants; indeed difficult environments for all biological life forms. The present paper includes our field and laboratory work describing the natural floral diversity of arid/semiarid zones plus the unusual physiology, biochemistry, and reproductive biology, which allows these plants to grow, reproduce, adapt, and survive, even with the environmental degradation found in Central Asian deserts. However data about the relationships between the occurrence of plants and their spatial distribution with different pathways of photosynthesis and climate; as well as mapping of plant species according the new divisions and detailed climatic data are absent. The Central Asian desert flora of from this point of view is insufficient studied yet. The objectives of this study were to obtain a complete list of plants with C4 photosynthesis from different desert zones of Central Asia based on results of experimental field studies and on 33
34 Climate Change and Terrestrial Carbon Sequestration in Central Asia previously published data and to analyze the geographical distribution patterns of C4 Poaceae and Chenopodiaceae species as a function of climatic variables. We also studied climatic and ecological distribution of C4 grasses and chenopods with different photosynthesis biochemistry, mesophyll structures, seed reproduction systems and life forms. Here we demonstrate that C4 grasses and chenopods differ in their relationship to climatic variables and that morphologicalanatomical and seed reproduction features are important for surviving in different habitats. This work allows us to suggest ways to identify plant functional types (PFTs) for Asian arid territories. Knowledge about photosynthetic pathways and PFTs can be useful in the evaluation and prediction of vegetation changes during global climatic changes; in the conservation and restoration of natural ecosystems; and in improving pastures in the domestic livestock grazing based society of Central Asian Desert areas. Several recent biological discoveries also are presented regarding plants living in specific environments that can give us better insights into the unique environmental traits found in desert plants. These new findings will be combined with our understandings of how plants interact with their soil and air environments to adapt and cope with the enormous concentration ranges in nutrients, ions, gases, and toxicants which occur naturally or as pollutants. Plants must take up their essential growth minerals, but simultaneously they often take up non-essential ions and pollutants that can be toxic to plants, toxic to animals, and to other organisms that feed on plants. Thus, as sessile organisms, plants have very strong adaptive interactions with their environments which must be known to present sound and balanced desert restoration and management activities. Ultimately we wish to propose reliable scientific and social reasons for remediating, restoring, and balancing the management of deserts as stable productive economic ecosystems for Central Asian citizens. 2
METHODS AND MATERIAL
Photosynthetic types of plants were determined during studies on the basis of Kranz-anatomy microscopy, δ13 C fractionation, and primary 14 CO2 photosynthetic products and turnover. Many experiments were conducted from 1997 till 2003 during series of field expeditions, mainly in steppe, semidesert, and desert areas of Uzbekistan, Turkmenistan and Mongolia. The assignment of photosynthetic types and biochemical groups of plants was carried out on the basis of the data obtained from these studies and from available published works. The photosynthetic types of some species, that were not available from experimental studies, were identified on the basis of closely related species and plant taxonomy for grasses (Hatteresley and Watson, 1992) and chenopods (Akhani et al., 1997; Pyankov et al., 1992, 1997). Plant samples (leaves, flowers and fruits) were collected from natural desert environments for isotope studies. Different floral organs of all examined species were immersed in 3% glutaraldehyde in sodium cacodylate phosphate buffer (pH = 7.2) for 3 hours prior to mounting on stubs. Then the material was placed in an Edward freezedryer for 24 h-55◦ C. Two methods of sample preparation were used for SEM, i.e., chemical fixation and freeze-drying. For chemical fixation, material was fixed, post-fixed and dehydrated as described for TEM, critical point dried, putter-coated with gold and observed with the JEOL JSM-T330 scanning electron microscope (Bozolla and Russell, 2002). Experiments were conducted at the laboratory of plant cells structure at the Kyoto University (Japan), Department of Botany of Poznan University (Poland) and Laboratory of Electron Microscopy at the University of Georgia (USA). Morphology of fruits and seeds were investigated according to the N.N. Kaden et al. (1971) and N.M. Dudik (1971). Anatomical sections of bracts, perianth segments, anthers, embryo and fruits were selective stained with safranin in combination with fast green, haematoxylin or toluidine blue. Samples for anatomical studies of fruit covers were fixed in alcohol:glycerin:water (1:1:1). Sections were stained with methylene blue. We have used aridity index defined as de Martonne (Encyclopedia of Climatology, 1987), I = P/T+10, where P is average annual precipitation, T is average annual temperature. The minimum absolute values of this index correspond to the maximum aridity of climate. Pearson’s correlation coefficients were calculated for the relationships between climatic variables and occurrence of percentage of Chenopodiaceae and Poaceae species with different photosynthesis types.
C3/C4 plants in the vegetation of Central Asia 3
35
CENTRAL ASIAN DESERT CLIMATE AND PLANT DIVERSITY DISTRIBUTION
Biogeografic studies habitually address Central Asian deserts as the territory covering Mongolia (Jigjidsuren and Johson, 2003), the desert in Chinese Inner Mongolia (Petrov, 1973) that is continuously stretching throughout Kyzylkum (Uzbekistan), Karakum (Turkmenistan) towards Shirmohi (Afghanistan ) and northern African as a unique link of sandy deserts (Figure 1). The climate in almost all of mentioned region is characterized by a dry continental with hot, sunny summer and cold or very cold winter with most of annual precipitation (67%) occurring as snow and rain in spring (March–April), and only 23% during September–December (Figure 2). This winter-spring precipitation feature is most characteristics for Middle Asia (Gintzburger et al., 2005), in contrast with Central Asia covering Northwestern China and Mongolia receiving monomodal summer precipitation. The best example is Uzbekistan that is also subject to the cold influence of the Arctic and Siberian fronts that may reach the southern border near Afghanistan. This characterizes the Middle Asian deserts rangelands climate as predominantly continental and subdesertic with an average 42◦ C continentally Index (M-m) as is a case for Uzbekistan (Gintzburger et al., 2003). The mean annual precipitation (MAP) received as snow and rain on the lowland is between 80–110 mm in the Kyzylkum sandy desert and north of the Karakum desert (Turkmenistan) and the Amudarya River around the Aral Sea. It increases to 200–300 mm between the Kyzylkum desert and west of a line Karshi-Navoi-Nuratau in Uzbekistan. Temperature ranges from 5–10◦ C or extreme minima −40◦ C in January as is a case in Mongolia, Karakalpakistan and Usturt Plateau between the Aral and Caspian seas. Average relative air humidity during April to September ranges from 38–63%. Transpiration during this period is about 914–1216 mm. From a bioclimatic point of view, the Irano-Turanian provinces have much colder winters preventing winter plant growth even when soil water is available. Despite of this the Irano-Turanian provinces possesses slightly over 2,680 species, 670 of which are endemic (Le Houuerou, 2005).
Figure 1.
Map of unique link of Deserts from Mongolia, Kyzylkum-Karakum to Northern Africa.
36 Climate Change and Terrestrial Carbon Sequestration in Central Asia Ombrothermal diagrams for Mashkuduk meteostation in Kanimekh (1999-2004). Precipitation
50 40 30 20 10 0 -10 -20
35 30 25 20 15 10 5 0
Precipitation (mm)
Min air temperature
Ja
n Fe uar br y ua r M y ar ch A pr il M ay Ju ne Ju A ly Se ug pt us em t b O er ct o N ov be em r D ec be em r be r
Temperature (˚C)
Max air temperature
Figure 2.
Ombrothermal diagrams for Central Kyzylkums (Uzbekistan).
Asian ecosystems, particularly the continental desert ecosystems, have not been studied in detail in relation to the occurrence of C4 species and their climatic distribution. The desert territories of Central Asia differ markedly from the arid ecosystems of North America, Australia and Europe in their taxonomic groups of C4 species. According our results Chenopodiaceae is the leading family in abundance of C4 species in Asia, and Kranz-grasses have a reduced importance, particularly in arid territories (Pyankov et al., 1986, 1992b; Pyankov and Mokronosov, 1993; Toderich et al., 2001). Several studies have identified many C4 Chenopodiaceae plants from the Near East and Central Asia (Shomer-Ilan et al., 1981; Winter, 1981; Ziegler et al., 1981; Zalenskii and Glagoleva, 1981; Voznesenskaja and Gamaley, 1986; Gamaley et al., 1988; Pyankov et al., 1992a, 1997; Pyankov and Vakhrusheva, 1989; Akhani et al., 1997). The C4 syndrome occurs in about 250 to 300 chenopods that mainly belong to subfamilies Salsoloideae (tribes Sauedeae and Salsoleae) and Chenopodioideae (tribes Camphorosmeae and Atripliceae); but many species are not yet classified. The occurrence of C4 species has been studied in some Asian desert regions, e.g., the Central Karakum desert (Pyankov et al., 1984; Pyankov and Vakhrusheva, 1988), in some parts of Mongolia (Gamaley, 1985; Gamaley and Shirevdamba, 1988), in South Tadjikistan (Pyankov and Molotkovskii, 1993), in some territories of the former Soviet Union (Pyankov and Mokronosov, 1993), the Pamirs mountains (Pyankov and Mokronosov, 1993; Pyankov, 1993), and in Northeast China (Redman et al., 1995) and Central Kyzylkum (Toderich et al., 2006). One of the plant features uncovered in Central Asia deserts was that globally this is the most Northern and coldest edge of native C4 plant growth. In a global comparison, the desert vegetations of Central Asia have a unique taxonomic composition along with the presence of quite diverse and unusual biochemical, physiological, and structural features. One unusual finding (Pyankov et al., 1986, 2000; Botschantzev, 1969; Gamaley et al., 1988) is the large taxonomic biodiversity and tendency for perennial members of the Chenopodiaceae family to dominate Asian desert vegetation. In Figure 3, we have presented a global taxonomic comparison based on C4 photosynthesis plants. As is shown marked taxa domination of plants by Chenopodiaceae is found in the deserts of Central Asia. In contrast, grass species (Poaceae) dominate in North America, Australia and Europe. Indeed grasses are a minor taxa in Central Asia deserts, i.e., in the Kyzylkum Desert it is remarkable how few native grasses are present as pastoral plants compared to the strongly grass-supported herbivory found in the America’s, Africa, Europe, and Australia (Smith et al., 1977; Jones, 1985). As it’s shown in Figure 3, C4 members of Polygonaceae are present only in Central Asian deserts (Winter, 1981). Also absent from the deserts of Central Asia, but present in other world deserts, is a large
C3/C4 plants in the vegetation of Central Asia
37
Figure 3. A global comparison of C4 photosynthesis taxonomic diversity versus C4 plant diversity in Central Asian deserts.
group of plants with a powerful water conserving type of physiology and biochemistry called Crassulacean Acid Metabolism (CAM). This is a readily visual difference in plant taxa because the deserts of the America, Africa and Australia contain large numbers of huge, even tree-like, CAM plants such as cactus, Agave, Aloe, and Euphorb’s (Black et al., 2003). In fact, for a decade we have searched in Central Asia for CAM plants and CAM is almost absent. However, recently we discovered CAM in one native Asian genus, Orostachys (Oyungerel et al., 2000).
4
TAXONOMIC OCCURRENCE OF C3/C4 SPECIES
According our preliminarily analysis there are 16 families of vascular plants in which C4 photosynthesis occurs. Among them two belongs to subclasses of Monocotyledoneae (Poaceae, Cyperaceae) and 14 are subclasses of Dicotyledoneae (Acanthaceae, Aizoaceae, Amaranthaceae, Asteraceae, Boraginaceae, Caryophyllaceae, Chenopodiaceae, Euphorbiaceae, Nyctaginaceae, Molluginaceae, Polygonaceae, Portulacaceae, Scrophyllariaceae, Zygophyllaceae). According to the latest taxonomic data (Gubanov, 1996) flora of Mongolia consists of 2823 vascular species belonging to 128 families; while the vegetation desert flora of Uzbekistan is estimated as 3100 vascular plants. From our studied more than 96 species with C4 photosynthesis occurs in 8 families: Amaranthaceae, Chenopodiaceae, Euphorbiaceae, Molluginaceae, Polygonaceae, Portulacaceae, Zygophyllaceae and Poaceae.
38 Climate Change and Terrestrial Carbon Sequestration in Central Asia 4.1
Chenopodiaceae
C4 photosynthesis species in Chenopodiaceae were found in the subfamily Salsoloideae, tribes Salsoleae and Suaedeae, and in tribes Atripliceae and Camphorosmeae of the subfamily Chenopodioideae (Carolin et al., 1975; Osmond et al., 1980; Winter, 1981; Gamaley, 1985; Pyankov and Vakhrusheva, 1989; Gamaley et al., 1988; Pyankov et al., 1992a, 1997; Akhani et al., 1997). The total chenopod that exhibit C4 photosynthesis comprises about 45% of the total. The largest number of species with the Kranz-syndrome is in the Salsoleae tribe, where 34 of 45 are C4 photosynthesis species (Table 1). Sixteen species have a direct confirmation of C4 photosynthesis based on leaves/bracts/fruits/flowers/anatomy and biochemical tests. Some experimentally unidentified species belonging to Anabasis, Climacoptera, Nanophyton and Petrosimonia are C4, because these genera are derivatives of Salsola (Botchatnzev, 1969) in which all experimentally studied species demonstrated typical features of C4 photosynthesis (see reference in Table 2). Among 11 Salsola species in the Mongolian flora, and 9 from them were identified as C4 species. Salsola mostly contains C4 plants, but a few are C3 species, mainly shrubby forms (Pyankov et al., 1993, 1997; Akhani et al., 1997). The Kranz-syndrome was found in seven species experimentally (Table 2). Two annual species Salsosa were not identified in regards to photosynthetic type (S. ikonnikovii and S. rosaceae) that belong to the most young and progressive Salsola section of genus Salsola (Botchantzev, 1969) in which all studied species have C4 photosynthesis (Pyankov et al., 1997; Akhani et al., 1997). There are two shrubby Salsola species, S. abrotanoides and S. laricifolia, that are not included in the list with Kranz-syndrome. S. laricifolia and S. montana according our measurement have a C3-like δ13 C value of −23.1‰, while S. arbusculiformis keep a tendency to C3-C4 internmediate type of photosynthesis. S. abrobtanoides and S. pachyphylla were not studied, but can be included as a C3 plant based on it taxonomy. According to Botchantzev (1976), S. abrobtanoides belong to section Coccosalsola, subsection Genistoides together with another two S. webbi and S. genistoides. C3 photosynthesis in S. webbi and S. genistoides is well documented (Carolin et al., 1975; Winter, 1981; Akhani et al., 1997; Pyankov et al., 1997). Hence it seems likely that S.abrobtanoides has a C3 carbon metabolism. C3 photosynthesis in Sympegma regelii is well documented. This species has a C3-like centric non-Kranz type named Sympegmoid by Carolin et al. (1975). The vasculature in Sympegma regelii is close to Kranz Salsoloid-type, therefore Carolin et al. (1975) suggested the possible origination of Sympegmoid type from Salsloid with a reversion of C4 to C3 photosynthesis. We found a high percentage incorporation of 14 C to C3 primary photosynthetic products as in C3 species, but incorporation of label to primary C4 acids varied from 6 to 24% during 10-sec of 14 CO2 assimilation; somewhat more in comparison with typical C3 species (Black, 1973). Some genera of Chenopodiaceae that grow in the Central Asian deserts, are known to have both C3 and C4 photosynthesis types, such as Suaeda, Salsola, Kochia, Atriplex, and Bassia. There are ten species of Suaeda amongst the Mongolian flora (Gubanov, 1996). Suaeda has species with different photosynthetic types (Carolin et al., 1975; Winter, 1981; Pyankov et al., 1992a; Akhani et al., 1997; Fisher et al., 1997). We included two species in our list of C4 species, S. arcuata and S. heterophylla, based on previous results of yearly photosynthesis products and measurement of enzyme activities (Pyankov and Vakhrusheva, 1989; Pyankov et al., 1992a). S. arcuata has C3-like values of 13 C/12 C fractionation (Winter, 1981; Akhani et al., 1997) which confirmed the recent review of photosynthesis types in Suaeda (Fisher et al., 1997). It seems likely that eight other species, S. corniculata, S. foliosa, S. glauca, S. kossinskyi, S. linifolia, S. prostrata, S. prezhewalskii and S. salsa are C3. Some of them, S. corniculata, S. glauca, S. linifolia and S. salsa show C3like carbon fractionation values (Winter, 1981; Akhanii et al., 1997). In addition, taxonomic analysis of photosynthesis amongst Suaeda species show C3 CO2 fixation for species belonging to the most primitive sections Chenopodina (syn. Heteriospermae) (S. corniculata, S. kossinskyi, S. prostrata, S. salsa), and Schanginia (S. glauca, S. linifolia). Some disagreement in identification of photosynthetic types exists, for instance, Gamaley (1985) included S. corniculata as a C4 plant, but this may be incorrect species identification. Experimental data are completely absent regarding S. foliosa and S. przhevalskii, so we have not included them in our list of C4 species.
C3/C4 plants in the vegetation of Central Asia
39
Table 1. Occurrence, ecological distribution and structural-biochemical features of C4 plants of Central Asian Deserts. Family, tribe and No. species1
Life form2
Habitat3
Kranzanatomy4
Biochem. type
13 C/12 C value
Chemopodiaceae Atripliceae 1 Atriplex cana C. A. Mey. 2 A. laevis C. A. Mey. 3 A.sibirica L. 4 A. tatarica L.
semishrub annual annual annual
6 6 5, 6 1, 6
ATR ATR ATR ATR
NAD-ME NAD-ME NAD-ME NAD-ME
−13.9 (+) M −13.0 (W) A A, M −13.6 (W) A, E
annual
6
KOCH
NAD-ME
−13.4 (+)
A, M, F
semishrub 5, 6
KOCH
NAD-ME
−13.1 (+)
A, E, F
annual
5, 6
KOCH
NAD-ME
no data
A
annual annual annual semishrub annual annual
6 3, 5 6 5, 6 1, 2 5, 6
KOCH KOCH KOCH KOCH KOCH KOCH
NAD-ME NAD-ME NAD-ME NAD-ME NAD-ME NAD-ME
−13.9 (W) no data no data −14.0 (+) −13.4 (A) no data
A, M * A A, M, E, F A, F, E A
annual
6
ATR
NAD-ME
−12.8 (W) A, F, M
annual
6
SUA
NAD-ME
no data
semishrub 4–6 semishrub 4–6 semishrub 5, 6
SALS SALS SALS
NADP-ME −14.5 (W) A, F NADP-ME −12.9 (+) A, M, F NADP-ME −13.5 (W) F
semishrub 5
SALS
NADP-ME −13.0 (A)
A, M, F
semishrub 5 semishrub 4–6
SALS SALS
NADP-ME no data NADP-ME −13.2 (+)
* F, E
semishrub 4–6
SALS
NADP-ME no data
*
annual
3, 6
SALS
NAD-ME
a*, F*, M
annual
3, 6
SALS
NAD-ME
annual
3, 6
shrub
Camphorosmeae 5 Bassia hyssopifolia (Pal.) O. Kuntze 6 Camphorosma lessingii Litv. 7 Kochia densiflora Tursz. ex Moq. 8 K. iranica Litv. 9 K. krylovii Litv. 10 K. melanoptera Bunge 11 K. prostrata (L.) Shrad. 12 K. scoparia (L.) Schrad 13 Londesia eriantha Fish. et Mey. Suaedeae 14 Suaeda acuminate (C.A. Mey.) Moq. 15 S. heterophylla (Kar. Et Kir.) Bunge Salsoleae 16 Anabasis aphylla L. 17 A. brevifolia C.A. Mey. 18 A. elatior C.A. Mey. Schisnhk. 19 A. eripoda (Shrenk) Benth. Ex Volkens 20 A. pelliotti Danguy 21 A. salsa (C.A. Mey.) Benth. Ex Volkens 22 A. truncate (Shrenk) Bunge 23 Cimacoptera affinis (C.A. Mey.) Botsch. 24 C. subcrassa (M. Pop.) Botsch 25 Halogeton glomeratus (Bieb.) C.A. Mey. 26 Haloxylon ammodendron (C.A. Mey.) Bunge 27 Iljinia regelii (Bunge) Korov. 28 Micropeplis arachnoideae (Moq._ Bunge
no data
Criteria5
A, E
*
SALS
−13.07 −13.1 (+) NADP-ME −12.8 (+)
3, 6
SALS
NADP-ME −13.2 (+)
A, F, M
shrub
3–6
SALS
NADP-ME −11.9 (+)
A, M, F
annual
3–6
SALS
NADP-ME −12.6 (+)
A, M,
A, E, M
(Continued)
40 Climate Change and Terrestrial Carbon Sequestration in Central Asia Table 1.
Continued
Family, tribe and No. species1
Life form2
KranzBiochem. Habitat3 anatomy4 type
13 C/12 C value
Criteria5
29 Nanophyton grubovii Pratov 30 N. Monogolicum Pratov 31 Petrosimonia litwinovii 32 P. sibirica (Pall.) Bunge 33 S. arbuscula Pall. 34 S. arbusculiformis Drob.
semishrub
3–6
SALS
NAD-ME
no data
A*, M*, F*
semishrub annual annual shrub shrub
3–6 3, 6 3, 6 3, 5 4, 5
SALS SALS SALS SALS no data
no data no data no data −12.9 (+) −26.30 (in leaves)
* A*, F*, M* * A, F, M, E *
35 S. drobovii
shrub
3, 4
SALS
NAD-ME NAD-ME NAD-ME NADP-ME C3-C4 intermediate photosynthesis NAD-ME
36 S. Richteri Kar. Et Litv
3,4
SALS
NAD-ME
3,4
SALS
NAD-ME
38 S. montana Litv
woody tree-like woody tree-like shrub
3,4
no data
no data
39 Salsola dendroides Pall
shrubs
3, 4, 6
SALS
NADP-ME
40 S. incanescens C.A. Mey
perennial
3, 4
SALS
no data
41 42 43 44
S. foliosa (L) Schrad. S. carinata S. orientalis S, G. Gmel. S. gemmascens
annual annual semishrub semishrublet
3, 4 1, 3, 6 4, 6 3, 4
SALS SALS SALS SALS
NAD-ME NADP-ME NAD-ME NADP-ME
45 46 47 48 49 50 51 52 53 54
S. monoptera Bunge S. passeria Bunge S. paulsnii Litv. S. rosaceae L. S. tragus L. S. pachyphylla Botsch. S. pestifer A. Nelson S. aperta Pauls. S. tamariscina S. tomentosa
annual semishru annual annual annual annual annual annual annual annual
3, 5 4–6 3, 6 3, 5 1, 3, 6 1, 3, 4 1, 3, 4, 5 1, 3, 4, 5 1, 3, 4, 5 1, 3, 4, 5
SALS SALS SALS SALS SALS SALS SALS SALS SALS SALS
NADP-ME NAD-ME NAD-ME NADP-ME NAD-ME – NAD-ME NAD-ME NAD-ME NAD-ME
annual annual
1, 3, 4, 5 SALS 1, 3, 4, 5 SALS
perennial
2, 5
annual
37 S. paletzkiana Litv.
55 S. aucheri (Mog.) Bge 56 S. sclerantha C.A. Mey Poaceae Andropogonae 57 Spodiopogon sibiricus Trin. 58 Echinochloa crus-galli (L.) Beauv. 59 Panicum miliaceum L. 60 Pennisetum centralasiaticum Tzvel. 61 Setaria glauca (L.) Beauv.
−25.79 (in * fruits cover) −12.28 (in * fruits) −13.24 * −26.40 (in flower’s perianth); −20.88 (in leaves) −12.63 (flowers) −13.67 (fruits) −11.9 − 12.0 −13.1 (+) −13.5 (+) −12.9– 12.98 (+) −12.7 (+) −13.0 (+) −12.8 (+)
*
NAD-ME NAD-ME
* * A, M, F, E * −13.0 (+) A, E −20.8 − 20.9 A, E −13.42 * 12.78 * −11.93 * −12.91 * (fruits) −13.25 * −13.4 *
PANIC
NADP-ME
−12.3 ®
F, A*
1, 2
PANIC
no data
−16.2 (S)
A, E
annual perennial
1, 2 1, 5
PANIC PANIC
NAD-ME NADP-ME
no data no data
A A*, F*
annual
1
PANIC
NADP-ME
no data
A, F, E
* * A, M, E, F A, M, E, F *
(Continued)
C3/C4 plants in the vegetation of Central Asia Table 1. No. 62 63
41
Continued
Family, tribe and species1
Life form2
Habitat3
Kranzanatomy4
Biochem. type
13 C/12 C value
Criteria5
S. pumila (Poiret) Roem. et Schult S. virdis (L.) Beauv.
annual
1, 2
PANIC
NADP-ME
no data
*
annual
1, 2
PANIC
NADP-ME
−13.2 (+)
A, E, F
annual
3, 5
ARIST
NADP-ME
−14.6 (+)
A, F, M
perennial
1–2, 5
PANIC
NADP-ME
no data
A
perennial
6
CHLOR
NAD-ME
no data
A, E, F
annual perennial
1, 4–5 5
CHLOR CHLOR
PEP-CK no data
−14.6 (S) no data
A, F *
perennial perennial perennial
5 2, 5 2, 5
CHLOR CHLOR CHLOR
no data no data no data
no data no data −14.7 (+)
* * A
perennial annual annual annual
1, 5 6 6 2, 5
CHLOR CHLOR CHLOR CHLOR
−16.4 ® no data no data −14.7 (+)
A, F F F A, F
annual
1,3
CHLOR
no data no data no data NAD-ME or PEP-CK NAD-ME
−15.4 (S)
A, F
annual annual annual
1–3, 5 1, 3, 5 3, 5
CHLOR CHLOR CHLOR
NAD-ME NAD-ME
−13.7 (+) −15.0 (S) no data
A A A*, F*
annual
5
CHLOR
no data
no data
*
annual
5
CHLOR
no data
no data
*
shrub
3
SALS
NAD-ME
no data
A*, F*, M
shrub
3
SALS
NAD-ME
no data
*
Aristideae 64 Aristida heymannii Regel Arundinella 65 Arundinella anomala Steud. 66 Aeluropus micranterus Tzvel. 67 Chloris virgata Sw. 68 Cleistogenes caespitosa Keng. 69 C. kitagawae Honda 70 C. foliosa Keng 71 C. songorica (Roshev.) Ohwi 72 C. squarrosa (Trin) Keng 73 Crypis aculeate (L.) Ait. 74 C. schoenoides (L.) Lam. 75 Enneapogon borealis (Griseb.) Honda 76 Eragrostis cilianensis (All.) Vign.-Lut. 77 E. minor Host 78 E. pilosa (L.) Beauv. 79 Tragus mongolorum Ohwi 80 Tripogon chinensis (Franch.) Hack 81 T. purpurascens Duthie Polygonaceae 82 Calligonum chi-nurum Ivanova ex Soskov 83 C. gobicum Bunge ex Meissn 84 junceum (Fish. Et Mey.) Litv. 85 C. litvinovii Drob. 86 C. mongolicum Turcz 87 C. pumilum Losinsk.
shrub
3
SALS
NAD-ME
−12.7 (W)
F
shrub shrub shrub
3 3 3
SALS SALS SALS
NAD-ME NAD-ME NAD-ME
−12.9 (+)
* A A
Amaranthaceae 88 Amaranthus albus L. 89 A. cruentus L. 90 A. blitoides S. Wats. 91 A. retroflexsus L.
annual annual annual annual
1 1 1 1
ATR ATR ATR ATR
NAD-ME NAD-ME NAD-ME NAD-ME
no data no data no data −12.6 (+)
A A A A, F
annual
3
ATR
NAD-ME
no data
A
annual
1
ATR
NAD-ME
no data
A
Molluginaceae 92 Mollugo cerviana (L.) Ser. 93 Portulaca oleaceae L.
(Continued)
42 Climate Change and Terrestrial Carbon Sequestration in Central Asia Table 1.
Continued
Family, tribe and species1
Life form2
Habitat3
Kranzanatomy4
Biochem. type
13 C/12 C
value
Criteria5
Euporbiaceae 94 Euphorbia mongolicum Prokh.
annual
3
ATR
NAD-ME
−13.8 (+)
94
Zygophyllaceae 95 Tribulus terrestris L.
annual
3, 4
ATR
NADP-ME
no data
A, F
Tamaricaceae 96 Tamarix hispida
shrubs
no data
no data
no data
+27.3
no data
No.
1 List of species, names of species and families by Gubanov (1996), division of Chenopodiaceae by Iljin (1936)
and Botchantzev (1969); division of Poaceae by Tszvelev (1987). 2 Life forms according Grubov (1982). 3 Habitat: (1), moist, meadow or banks of rivers and lakes, oasises; (2), dry and non-saline, dry medow and steppe; (3), sandy and semisandy deserts; (4), takyrs, week saline clay deserts; (5), rocky surfaces; (6), saltmarshes. 4 Kranz-anatomy types after Carolin et al. (1973, 1975). ATR – atriplecoid, KOCH – kochioid, SUE – suaedoid, SALS – salsoloid, PANIC – panicoid, ARIST – aristidoid, CHLOR – chloridoid. 5 Criteria: A, Kranz-anatomy; M, protosynthesis carbon metabolism; E, enzyme activity of C4 cycle; F, carbon isotope fractionation. Asterisk (∗) indicated C4 traits for another species of the same genus.
In the Camphorosmeae tribe, C4 species exist in Camphorosma, Bassia, Kochia and Londesia. Camphorosma lessingi, Londesia eriantha and almost all Kochia species have direct evidences of C4 photosynthesis. K. krylovii has no experimental studies, but was included as a C4 plant. All Asian species of Kochia species, like K. prostrata, K. scoparia, K. iranica demonstrate C4 photosynthesis (Pyankov and Mokronosov, 1993, Toderich et al., unpublished data); and we agree with Carolin et al. (1975) that Eurasian Kochia species commonly have the Kranz-syndrome. Four of five Atriplex species were classified in the Kranz-anatomy group based on experimental evidence. Mesophyll structure and photosynthesis enzyme activities were studied in A. tatarica and A. sibirica (syn. A. centralasiatica) (Pyankov et al., 1992a,b). A. cana is included on the basis leaf anatomy, δ13 C value and primary photosynthetic products (Table 1). There are data showing Kranz-anatomy (Gamaley, Shirevadamba, 1988) and a C4-like δ13 C value (Winter, 1981) in A. laevis; but Akhani et al. (1997) found a C3-like δ13 C value and it is a C3 species according Carolin et al. (1975). A. fera was not included in our C4 list, because data about its type of carbon metabolism are absent. Akhani et al. (1997) reported a C4-like δ13 C value in Axyris amarantoides, which habitats in Mongolia (Gubanov, 1996). However it seems likely, that this species is C3. Carolin et al. (1975) did not find Kranz-anatomy in A. amaranthoides and Axyris is very close to Krashennikovia systematically, all representatives of which are typical xerophytes with a C3 isopalisade leaf structure (Gamaley and Sirevdamba, 1988). The relationships between systematic groups of C4 Chenopodiaceae and their Kranz-anatomy and biochemical types seem clear now (Carolin et al., 1975; Voznesenskaja and Gamaley, 1986; Pyankov and Vakhrusheva, 1989; Pyankov et al., 1992a, 1997). All species from Atriplex and Suaeda are NAD-ME. The species of Camphorosmeae (Camphorosma, Kochia, Bassia) are NADPME. But there are different biochemical pathways of CO2 metabolism among representatives of Salsoloideae. Annual plants belonging to section Salsola and derivative (Halogeton, Micropeplis), Anabasis and shrubs from section Coccosalsola (S. arbuscula) and its derivative (Haloxylon, Ijinia) have NADP-ME biochemical type. Salsola species of Malpigipila section (S. gemmascens, S. passerina), derivative species of sections Belantera (Climacoptera), Caroxylon (Nanophyton) and species of Petrosimonia genus likely are all NAD-ME photosynthesis types.
C3/C4 plants in the vegetation of Central Asia
43
Table 2. Coefficients of correlations between occurrence of C4 species and climatic variables. Correlations >0.50 are significant at P < 0.05.
Plant group1 POA+CH, total species %C4 POA+CH, of total POA+CH species POA, C3+C4 species POA, C3 species POA, all C4 species %all C4 POA of POA total POA, C4 native number %C4 native POA of POA number POA, NAD-ME + PEP-CK species %NAD-ME + PEP-CK species of POA total POA, NADP-ME species %NADP-ME species number of POA total CH, C3+C4 species CH, C3 species CH, C3 succulent species CH, %C3 succulent species of CH total CH, C4 species %C4 of CH total CH, C4+C3 succulent species %C4+C3 succulents of CH total CH, C4 shrubby NADP-ME Salsoloid type species %C4 shrubby NADPME Salsoloid type of CH total CH, C4 annual NADPME Salsoloid type species %of C4 annual NADPME Salsoloid type of CH total CH, C4 shrubby NADPME Kochioid type spec. %, NADP-ME shrubby Kochiod type CH total 1 POA
Annual Annual July Sum of precipi- average average Aridity temperature tation temperature temperature index2 >10◦ C (mm) (◦ C) (◦ C)
July mean minimum temperature (◦ C)
0.21 −0.63
0.26 −0.57
−0.57
−0.53
−0.54
−0.8 0.92 0.52 −0.82 0.56 −0.86 −0.45 0.47 −0.60 0.90
−0.72 0.92 0.53 0.78 0.54 −0.83 −0.14 0.55 −0.50 0.90
0.88 −0.77 −0.81 0.53 0.83
0.9 −0.75 −0.80 0.54 0.84
0.84 −0.73 −0.78 0.60 0.86
−0.42 −0.59
0.44 0.87
−0.14 0.48
0.52 0.89
0.48 0.8
0.49 0.8
0.57 0.84
−0.49
0.51
−0.24
0.6
0.56
0.58
0.62
−0.62
0.89
−0.53
0.91
0.83
0.84
0.84
−0.03
0.04
0.26
0.01
0.10
0.07
0.15
−0.44
0.72
−0.31
0.69
0.65
0.63
0.69
−0.70 −0.60 −0.80
0.40 0.35 0.70
−0.62 −0.47 −0.70
0.47 0.44 0.79
0.43 0.40 0.68
0.48 0.44 0.69
0.40 0.42 0.70
−0.68
0.72
−0.63
0.76
0.65
0.64
0.69
−0.71 −0.74 −0.81
0.39 0.49 0.54
−0.68 −0.64 −0.74
0.44 0.46 0.60
0.41 0.48 0.55
0.46 0.51 0.59
0.33 −0.38 0.50
−0.97
0.80
−0.82
0.80
0.77
0.78
0.73
−0.63
0.50
−0.62
0.53
0.49
0.55
0.34
−0.69
0.69
−0.75
0.72
0.64
0.67
0.54
−0.5
0.27
−0.31
0.28
0.34
0.36
0.34
−0.16
0.15
0.11
0.07
0.22
0.19
0.23
−0.65
0.18
−0.64
0.24
0.16
0.21
0.14
−0.57
0.17
−0.47
0.15
0.15
0.15
0.13
– Poaceae, CH – Chenopodiaceae; index de Martonne, I = P/T + 10. P – annual pct., T – avg. annual.
2 Aridity
July mean minimum temperature (◦ C)
44 Climate Change and Terrestrial Carbon Sequestration in Central Asia The composition of chenopods with different types of CO2 fixation and structural and biochemical subtypes of C4 also changed along the warming and aridity gradient. The relative abundance of non-succulent C3 chenopod species decreased from cool moist to warm desert regions. In general, the percentage of C4 species from Chenopodiaceae positively correlated with increasing of aridity (or negative with aridity index) in each district (Table 2), r = −0.74, P < 0.05. Temperature parameters, i.e., the sum of effective temperatures or average year or July temperatures correlated positively, but not significantly, with the relative abundance of C4 Chenopodiaceae. The chenopods with C4 CO2 fixation have different in types of Kranz-anatomy, biochemical subtypes, and life forms. As is noted in Table 1, there are 4 types of Kranz anatomy: Atriplecoid, Suaedoid, Kochioid and Salsoloid, and two biochemical subtypes, NAD-ME and NADP-ME. Plants with Salsoloid Kranz-anatomy presented both biochemical variants plus two contrasting groups with different life forms – shrubs and annuals. We hypothesized that various groups of C4 Chenopodiaceae responded differently to environmental variables. It would be clear to test this hypotesis by analyzing each group of Chenopodiaceae versus climatic variables. However the number of C4 Atriplex and Suaeda species was not enough for analysis. Therefore we studied the climatic patterns in Camphorosmeae and the main groups of Salsoleae that contain the most number of chenopods with the Kranz-syndrome. We found a different composition of groups along the aridity gradient (Table 2; Figure 4 a, b). Large shrubs with a Salsoloid type of assimilation organs and NADP-ME biochemical subtypes, such as Haloxylon, Iljinia, Salsola arbuscula, and semishrubs of genus Anabasis, appeared only in dry and hot districts with aridity index near 10 or less, and habitat mainly in Middle Asian and Gobian deserts. Their relative abundance positively and significantly correlated with aridity (r = 0.69), the average year temperature (r = 0.69), and negatively with annual precipitation (r = −0.75). The annuals, Salsolas NADP-ME species, C4-herbaceous halophytes known as solyanki are common in all of investigated by us regions. These mostly succulent drought/salt tolerant species form a dominant group in the flora and vegetation of saline/arid environments. The highest coefficient between climate aridity and C4 percentage were found for a group, combined of C4 NADP-ME shrubs with Salsoloid anatomy and C3 succulents, that consist of Halocnemum, Kalidium, Salicornia, Salsola, Suaeda, Sympegma. The relative abundance for this group of combined C3 and C4 succulents correlated with aridity at the highest value (r = 0.97) The correlation with temperature also was high (r = 0.80), but less than aridity. Thus chenopods with C4 photosynthesis types and C3 succulents are favored in areas with hot and dry climate. Recently it was a surprise to discover that the green leaves of some C4 species express C4 genes while their green cotyledons expressed C3 genes. Clearly some, yet unknown, types of control for gene silencing and expression exists in leaves versus cotyledons of the same plant related to Kranz or non-Kranz cell anatomy and the expression of C4 or C3 photosynthesis genes.
4.2
Polygonaceae
Calligonum, mostly tree-like and woody shrubs life forms, is a single genus in Polygonaceae, that contains all C4 species (Winter et al., 1981; Voznesenskaja and Gamaley, 1986). Species of genus Calligonum are mostly distributed on the sandy areas of Central Asian deserts. Only C. mongolicum has a broader geographical distribution in Mongolia. All species have a centric type of Kranz-anatomy that is similar in appearance with Salsoloid type (Voznesenskaja and Gamaley, 1986). Other dicots. C4 species were identified in another five dicotyledonous families (Table 2). There are mainly well-known naturalized species Amaranthus (Amaranthaceae), Portulaca olearceae (Portulacaceae), and cosmopolitian species Mollugo cerviana (Molluginaceae) and Tribulus terrestris (Zygophyllaceae). We found a C4-like δ13 C value in Euphorbia mongolicum (Euphorbiaceae), which is included as a C4 species. Voznesenskja, Gameley (1986) reported the C4 syndrome in the Mongolian species E. humifusa; but our δ13 C determination of −26.3 is a C3-like value.
C3/C4 plants in the vegetation of Central Asia
45
Figure 4. a (top), b (bottom). Ratio of C3/C4 types of photosynthesis occurrence in different taxonomic groups and aridity index.
4.3
Poaceae
Poaceae family is in the third place in abundance amongst species in the Mongolian flora (Gubanov, 1996) and Kyzylkum (Tsvelev, 1987). Identification of C4 grass species was on the basis of experimental studies of Kranz-anatomy and δ13 C values plus published data (Table 2). Beside these, there are strong relationship between taxonomic position and photosynthesis types, Kranzanatomy and biochemical types (Hatteresley and Watson, 1992). Based on these characters we identified 25 grasses with the Kranz-syndrome, i.e., 10% of Poaceae. We found species with the C4 syndrome in five tribes Andropogoneae, Paniceae, Aristideae, Arundinelleae and Cynodonteae. A majority of C4 grasses, 16 species, belong to Cynodonteae and have NAD-ME or PEP-CK types. Species with NADP-ME are comparatively few, and tribes Andropogoneae, Aristideae, and Arundinelleae consist of only a single species. The representatives of Paniceae (Ehinochloa, Panicum and Setraria) are naturalized species and habitat mainly in annually disturbed territories
46 Climate Change and Terrestrial Carbon Sequestration in Central Asia and oasises. Other C4 annuals with aspartate-forming type of metabolism, NAD-ME or PEP-CK, i.e., Chloris virgata, Enneapogon and Eragrostis species are cosmopolites, and their appearance in the natural ecosystems very strongly depends on precipitation. Thus, only a few C4 grasses, such as species from Cleistogenes, Aristida, Aeluropus, Tragus and Eragrostis can play outstanding roles in natural ecosystems. 4.4 Cyperaceae We could not identify C4 photosynthesis amongst representatives of the Cyperaceae family, which is the second in the world flora abundance for C4 photosynthesis. In the Mongolian flora, the Cypreaceae family includes 127 species belonging to 27 genera (Gubanov, 1996). Among these only two genera, Cyperus and Eleocharis contain species with Kranz-anatomy (Ueno and Takeda, 1992; Li, 1993). Cyperus fuscus, the single species in Cyperus has a C3 type of CO2 fixation (Li, 1993). Seven species are in Eleocharis genus, and C3 photosynthesis type was previously demonstrated in five species: E. acicularis, E. mamillata, E. mitrocarpa, E. palustris, and E. unglumsis (Ueno et al., 1989; Ueno and Takeda, 1992). The photosynthesis type is not known for E. klingei and E. meridionalis; but the occurrence of C4 species among Eleocharis is rare (Ueno and Takeda, 1992); therefore, the presence of C3 photosynthesis in all Eleocharis species is very likely. 5
SEXUAL REPRODUCTION, PHOTOSYNTHETIC PATHWAYS AND BIOCHEMICAL LINKAGE
This insight came from extensive studies regarding their biochemistry, physiology, and cellular structural diversity (Pyankov et al., 1986, 1997, 1999; Butnik et al., 2001; Toderich et al., 2001; Zalenskii and Glagoleva, 1981). Space limits us to a brief summary here of findings about this surprising floral diversity in photosynthetic biochemistry, cellular anatomy, and gene expression. Some key findings include studies on their CO2 biochemistry, with 14 C and δ13 C, which show many C4 plants in addition to numerous C3 plants. Their Kranz-type C4 leaf cell anatomy diversity is unusual with several distinctive structural modifications (Zalenskii and Glagoleva, 1981; Pyankov et al., 1999, 2000). Within C4 leaf biochemistry we know that a specific plant expresses dominance by only one of three known C4-acid decarboxylases (Burris and Black, 1976; Buchanan et al., 2000). In naturallyoccurring Central Asian plants, PEP carboxykinase decarboxylating plants apparently are absent; while one decarboxylase, either NAD-malic enzyme or NADP-malic enzyme, is dominant in specific C4 plants (Pyankov et al., 1986). We have noted that there is a strong tendency for NADmalic enzyme plants to dominate the vegetation growing in saline soils and for NADP-malic enzyme plants to dominate in non-saline soils. Diversity in anatomy of assimilation organs and their photosynthetic pathway has been marked within representatives of genus Salsola. Two anatomical types, Salsoloid and Sympegmoid (Carolin et al., 1975; Butnik, 1979; Toderich et al., 2002; Freitag et al., 2002) occur in leaves and bracts of species of Salsola. It was also determined that some species with Salsaloid anatomy have NAD-ME C4 photosynthesis, whereas others have NADP-ME C4 subtype (Pyankov et al., 1997). Plants with Sympegmoid anatomy have C3-like C13 /C12 carbon discrimination values (Akhani et al., 1997; Pyankov et al., 1997). Variations also occur in structural and biochemical features in cotyledons (Pyankov et al., 1999). Two non-Kranz anatomy, Atriplicoid and Salsoloid, are found in Salsola cotyledons (Butnik, 1979). Finally, Kranz-type cotyledons and leaves may or may not contain a hypodermis. The result is a number of unique combinations of structural and biochemical photosynthetic types in leaves and cotyledons in species of Salsoleae. So, multiple origins of C4 photosynthesis as was described for the families of Poaceae, Cyperaceae, Asteraceae and Zygophylaceae appear likely within Chenopodiaceae and the diversity of photosynthetic types and anatomical structures in Salsoleae suggests a dynamic pattern of photosynthetic evolution within this single tribe.
C3/C4 plants in the vegetation of Central Asia
(a)
47
(b)
(c)
(d)
Figure 5. (a) The first stage of differentiation of sclerenchyma of S. praecox. (b) Salsaloid bracts anatomy and indefinite Kranz bundle sheath cells of S. praecox during budding stage. (c) Cross section through bracts of S. praecox during flowering process; Kranz bundle sheath cells is visible. (d) Cross section through bract of S. praecox during fruit maturation. Photosynthetic activity of reproductive organs of Salsola praecox.
From our phenological observations and experimental results, it seems very likely that structural polymorphism of floral organs and sexual reproduction system in some Asiatic Salsola species are coupled with the diversity of photosynthetic pathways and anatomy of the CO2 assimilative organs. Great floral micromorphology and anatomical diversity of assimilative and floral like organs (bracts, bracteoles) were described for some annual Salsolas, contrasting by their growing habitats. It was found that S. pestifer, S. praecox and S. paulsenii are similar in photosynthesis types: C4-Sals (-H) both in leaves, cotyledons and bracts. Differences were revealed in the anatomy of bracts. All Asiatic annual Salsola species of Section Salsola (Kali) have so-called Salsoloid (Carolin et al., 1975) or crown centric (Voznesenskaya and Gamaley, 1986) Kranz leaf and bracts anatomy. The anatomy of bracts in the different Asiatic species of Salsola we studied in relation to their photosynthetic activity (Figure 5 a, b, c, d). The first features of differentiation of bracts and bracteoles chlorenchyma cells are marked at the early stage of pollen sacs development, reaching a maximum during blooming stage. Cross sections of fruits perianth of many annual Salsola species during its maturity also show an insignificant development of chlorenchyma tissue. The similar situation was described for the species of Section Belanthera. In bracts or fruiting body of this type, chlorenchyma is represented by two layers of
48 Climate Change and Terrestrial Carbon Sequestration in Central Asia green cells positioned around the periphery of the organs: the outer layer is composed of palisade mezophyl cells and the inner layer is composed of palisade mezophyll cells and inner layer of bundle sheath cells. The main vascular bundle with greatly thick-walled in the centre, surrounded by the water-storage tissue, and only small peripheral bundles have contact with chlorenchyma. It is known that all species with Salsaloid Kranz anatomy in photosynthetic organs (irrespective of whether these are leaves, stems, cotyledons or bracts) have C4 type photosynthesis (Pyankov and Vakhrusheva, 1989; Pyankov et al., 1999, 2000). However, chlorenchyma of S. ruthenica, consisting of palisade and Kranz cells, is interrupted by longitudinal colenchymatic ridges. S. arbusculiformis manifest a Sympegmoid leaf and bracts anatomy and non-Kranz bundle sheath cells (Voznesenskaya et al., 2001; Toderich, unpubl. data). Other species of Section Coccasalsola forming a unique plant functional group can be united by Salsoloid (with hypodermis both in leaves and reproductive organs) or a Crownary – centrical Kranz type of photosynthetic cell arrangement (Voznesenskaya and Gamaley, 1986). The Salsoloid type of Kranz assimilation tissues anatomy is always associated with the C4 syndrome (Carolin et al., 1975) that is well supported by, as represented in Table 1, C4-like 13 C/12 C carbon discrimination values in leaves, flowers and fruits with a range of −12.0−14.08. Such similarity of anatomical and biochemical features is well coordinated with developmental stability of reproductive system noted by us for S. arbuscula, S. richteri and S. paletzkiana. However, plants of S. arbusculiformis from their natural habitats with Sympegmoid leaf and bracts anatomy maintained their C313 C/12 C carbon fractionation values in the range from −23.6−26.31 throughout their ontogeny, although significant variation was found within plant organs with 2.69‰ in flowers. In addition S. arbusculiformis is characterized by a set of primitive embryological features such as ana-campylotropous, crassinucellate, bitegmic ovule, autogamy (self pollination/fertilization system), narrow specialization of sexual reproductive system that may be an evidence of lower reproductive plant functional activities leads to the lower level of seed set, seed viability and their seed germination energy. It is also known that C3 is the primary type of photosynthesis in relation to C4. Apparently there is a strong connection between structural floral and fruits traits and their physiological and biochemical activity throughout their ontogeny. We have found that photosynthetic activity of reproductive organs was insignificantly in budding stage with some increasing during flowering processes and gradually decreasing during fruit maturation. From our experimental results, it seems very likely that structural polymorphism of floral organs and sexual reproduction system in Asiatic shrubby Salsola species are coupled with the diversity of photosynthetic pathways and anatomy of the CO2 assimilative organs. We have also found out that S. arbusculiformis manifest a Sympegmoid leaf and bracts anatomy with all structural features for C3-like species. Almost the same tendency was revealed in the flowers and fruits of two other taxonomically close related species of section Arbuscula as S. montana and S. drobovii. It was found also a positive correlation between structure and biochemistry of S. arbusculiformis that shows the bundle sheath cells were found to be Krantz-like with rather numerous chloroplasts, and the walls of these cells were thicker than those of the mezophyll cells. Since S. arbusculiformis has two-to-three layers of mezophyll cells, but a much more distinctive chlorenchymatous sheath than found in Sympegmoid species like S. oreophilia it was suggested it might be a C3-C4 intermediate photosynthesis (Pyankov et al., 1997; Voznesenskaya, 2001). However in comparing with structure of assimilation tissues and biochemistry of other C3-C4 intermediates there is a little evidence of C4 in S. arbusculiformis. The 13 C/12 C carbon discrimination values of S. arbusculiformis are less negative than in S. oreophilia, indicating that a C4 cycle may make a small contribution to photosynthesis under certain conditions in this species. S. arbusculiformis might be an intermediate in the path of evolution from C3 to C4 type of photosynthesis. S. arbuscula, S. Richteri and S. paletzkiana with some very similar morphological, palynological and embryological features can be united by Salsoloid (with hypodermis both in leaves and reproductive organs) or a Crownarycentrical Kranz type of photosynthetic cell arrangement into unique plant structural functional group. The Salsoloid type of Kranz assimilation tissues anatomy is always associated with the C4 syndrome (Carolin et al., 1975) that is well support by C4 like 13 C/12 C carbon discrimination values in leaves, flowers and fruits with a range of −12.00−14.08. Such similarity of anatomical
C3/C4 plants in the vegetation of Central Asia
49
and biochemical features is well coordinated with developmental stability of reproductive system noted by us for taxonomically close S. arbuscula, S. richteri and S. paletzkiana, S. montana and S. drobovii species of section Arbuscula. However, plants of S. arbusculiformis from their natural habitats with Sympegmoid leaf and bracts anatomy maintained their C313 C/12 C carbon fractionation values in the range of −23.6−26.31 throughout their ontogeny, although significant variation was found within plant organs with 2.09‰ in flowers and fruits. It is also known that C3 is the primary type of photosynthesis in relation to C4. Primitive type of phtosynthesis and biochemistry in S. arbusculiformis are well correlated with the lower reproductive functional activity due to the presence of primitive embryological features, such as ana-campylotropous, crassinucellate, bitegmic ovule, autogamy (self pollination/fertilization system) and narrow specialization of sexual reproductive organs. Such structural-functional mechanisms of vegetative- reproductive systems in geographically restricted in distribution and reproductively isolated S. arbusculiformis might estimate reduction of seed set, seed biomass, as well as weight of seeds, seed viability and rate of their germination. Apparently there is a strong connection between structural floral and fruits traits and their physiological and biochemical activity throughout their ontogeny. We suggested that the C4-syndrom evolved in the leaves and only later extended to the cotyledons and floral organs. Sex expression of flower’ organs have been most marked for S. ruthenica (European species) that may be related with the habitats, where this species was recently introduced and naturalized. This is a good evidence of origin and diversification of Salsola from Asia to Europe. Analysis of karyotype revealed that these two species have the same number of chromosome 2n = 18 (Wojnicka-Poltorak et al., 2002). Annual C4-Asiatic Salsolas, known in pasture economy of Uzbekistan as solyanki, differ from European ones by saltglands/trichomes morphology (shape of their head): mainly clavate or capitate and its density. Abundant papillae prickle hairs and secreted salts secretion between ridges on bracts/bracteoles surfaces of annual Asiatic Salsola are described. Frequently salt glands are globose or club-shaped and readily distinguishable from unicellular papillae and sharp-pointed prickles. These parameters could be used as discriminating characters between different ecological halophytes Salsolas groups. Variation in the indumentum density is believed to be mainly the effect of stress/desert environmental factors and/or even herbivores pressure. Floral structure diversity (hypoginous disk, stigma, ovule, anthers), pollen grain morphology and fruit anatomy are clearly defined, suggesting their potential value as diagnostic characters concerning taxonomic and evolutionary linkages within Chenopodiaceae, particularly genus Salsola. Remarkable examples of intraspecific variation in pollen grain traits have been described for C/D ratio, thickness of exine, size and numbers of pores. These parameters being more conservative than other flowers and fruits traits were discovered to be highly specialized and support the evident cladistic grouping of some critical species within genus Salsola. Diversity in the anatomy of fruits reflects ways and character of adaptive coevolution of woody Salsola taxons and plays a more significant role in the species identification than other elements of floral organs. For instance at S. richteri and S. paletzkiana the direction of adaptive specialization to the xeric-arid conditions going towards the intensification of sclerification of fruiting perianth and increasing of size and number of cells layers of pericarp and even embryo tissues. The presence of pigments in the fruits covers, singular hydrocytic cells, partial myxospermy and development of membranous layer in the spermoderma intense the defending function against sun radiation. A fully development of embryo organs and differentiation of their tissues indicate the completely readiness of embryo of Salsola species to the germination. Seed dispersal is manifested by the development of large and wide wings; all elements of fruiting cover and embryo organs of studied species has adaptive value pigmentation, partial myxospermy, thickenings of external walls; membranous and aleironic layers in the spermoderma, intensification of succulence features as a results of well development of aerial parenchyma, abundant of reserve store nutritional substances, which stimulate the good defending of embryo from extreme deserts environments. We found out that Asiatic Salsola species of section Arbuscula Coccosalsola section with both C4 and C3 photosynthesis types represents a unique example of the evolutionary
50 Climate Change and Terrestrial Carbon Sequestration in Central Asia convergence of ecological, structural, physiological and biochemical traits. The great range of variation, far more marked in ploidity of genome and fruit structures than in floral and pollen morphology explains the high phenotypic plasticity and good adaptation of S. richteri and S. arbuscula to various geographical and ecological desert habitats. Controversy, S. paletzkiana and S. arbusculiformis are characterized by narrow structural specialization of reproductive organs, partly seeds to germinate only on the sandy or stony gypsumferous soils that perhaps explained the strict local distribution of this species in the Central Asian Flora (Toderich et al., 2006b). The embryological data of perennial Asiatic woody Salsola species from their natural habitats presented briefly in this paper lead us to the conclusion that S. arbusculiformis by reproductive biology is evidently not allied close to S. arbuscula, S. richteri and S. paletzkiana, despite these species form a taxonomic separate monotypic subsection Arbuscula in Coccosalsola section (Botschantzev, 1969). This supports a view that many arid plants being morphological and taxonomic closely related develop a specific plant reproductive functional system that ensures them to reproduce and survive in extreme desert conditions. Our anatomical, biochemical and physiological data in regard to the C3 and C4 pathways of photosynthesis in limits of Coccosalsola complex both in leaves and reproductive organs confirm that this delimitation is well founded. Based on morphological features, Akhani (1997) recently mentioned that section Coccosalsola could be most primitive group of Salsola. However high specialized centric type anatomy of mesophyll of cotyledons of S. arbuscula, S. richteri and S. paletzkiana indicate on their relatively younger phylogenical group. S. arbusculiformis manifest a unique combination of structural and biochemical phosynthetic types in leaves and cotyledons within genus Salsola (Pyankov et al., 1997; Voznesenskaya et al., 2001). In addition several aspects of the species’ ecology indicate on reproductive assurance in this taxon as an adaptive explanation of selfing control for surviving under extreme desert condition. First, S. arbusculiformis typically occurs in small patchy geographical isolated populations or singular individuals, where the availability of outcross mates might be limited. Floral biology of S. arbusculiformis supports the hypothesis that mating between close relatives is expected to reduce the number or vigor plants. Second, embryological data showed that S. arbusculiformis produces simultaneously selfed, outcrossed and apomictic seeds in the absence of pollinators. This feature perhaps is a main reason of lower viability and germinability of seeds both under field and laboratory condition. Based on whole plant morphological features, sexual reproduction and functional systems, as well as ecological habitats and geographical distribution of Asiatic Coccosalsola complex, we propose that S. arbusculiformis was primitive and primary with an origin in Central Asia. We supposed that diversities in sexual reproduction mechanisms and CO2 fixation pathways, e.g., in tree-like Salsola species, also are important factors regarding reproduction and survival under changing desert environments. Structural polymorphism of floral organs is coupled with a diversity of biochemical pathways and anatomy of CO2 assimilative organs as illustrated with two woody perennial species C4 species with NADP-ME photosynthesis, S. arbuscula, and Salsoloid type of Kranz-anatomy both in leaves and reproductive organs form a unique “functional reproductive plant group” that is very resistant to the severe stresses in these arid habitats. Other species, e.g., S. arbusculiformis, have both sexual and apomixis systems of reproductive linked with a Sympegmoid-type cell structure and C3-like δ13 C values both in leaves and reproductive organs; which likely relate to their ancient origin from which Salsola species with the C4-syndrome were derived recently. The coexistence of two reproduction fitness components (sexual and apomictic) in S. arbusculiformis are structural organ adaptations which may enable this plant to survive and reproduce fruits in rocky niches in the extreme isolation of these continental deserts. However, these highly specialized reproductive systems result in a low seed set plus poor germination and viability. Likely these traits result in S. arbusculiformis currently being a very rare plant in the stressed deserts of Central Asia. Based on whole plant morphological features, sexual reproduction and functional systems, as well as ecological habitats and geographical distribution of Asiatic Coccosalsola complex we suppose that S. arbusculiformis was primitive and primary with an origin in Central Asia.
C3/C4 plants in the vegetation of Central Asia 6
51
REDUNDANCY IN ENVIRONMENTAL ADAPTATIONS BY PLANTS
When we consider global vegetation it is clear that green canopies of forests, grassland, and often crops cover much of our lands and act as continuous active green biological interfaces between the atmosphere and other terrestrial life. However the desert land-atmosphere biological interface contains only scattered vegetation, plus unstable sands, rocks, soils, and surface microbes that makes spatial and niche management practices regarding biodiversity-space-harvesting-production relationships in desert ecosystems especially difficult. Also natural and human driven activities such as hooved grazing animals, firewood collection, shifting sands, salinization, industrial actions, pollutants, etc. greatly modify the interface of this difficult green desert lands-atmosphere mosaic. Plants as autotrophic sessile organisms face a continually changing environments. Even internally higher plants have micro-environmental problems to solve within numerous organs and cell types which continually face changing supplies of, e.g., nutrient ions, sugars, amino acids, gases, light and water. Some major external environmental problems that plants must solve are: (I) their biophysical soil and air environments are continually changing, far beyond normal daily environmental changes; (II) their biological environments of microbes, herbivores, and other creatures change constantly; and (III) humans particularly move and destroy plants and add both beneficial materials and toxic pollutants to plant environments. For example in the Kyzylkum Desert some plants, which we characterize as metallohalophytes (Toderich et al., 2004, 2005a,b, 2006a), are found growing well in either natural or contaminated soils containing salt and metals. But the Kyzylkum vegetation contains only a restricted number of species, mainly from Salsola (both annuals and perennial), tamarix, graminous, which have metal/salts removal abilities and also can survive and reproduce under these contaminated environments. Under such condition some successful species produce large quantities of small, easily dispersed seeds, hence facilitating colonization. From a host of biochemical and physiological studies, it has become clear that plants have multiple often redundant pathways and mechanisms that accomplish the same function or goal. These genetically built-in mechanisms for redundancy in numerous plant functions act as fail-safe mechanisms. Redundancy apparently gives sessile plants two major capabilities: (I) their normal developmental ability to form diverse functions in different types of organs, tissues and cells; and (II) a very powerful means to adapt the functions of these structures to cope with whatever happens in their biophysical and biological environments. The following are some well known plant examples of fail-safe redundancy-type activities acting as strongly functional adaptations to various environmental stresses. As external environmental CO2 levels vary, the internal CO2 levels in green photosynthetic tissues can be modified to provide this essential nutrient. Currently we know that specific plants and green organs can express one of 9 or 10 separate CO2 fixation pathways. Figure 6 represents an example of two plant responses to atmospheric CO2 changes, showing that C4 tissues are well adapted to air CO2 levels; while air CO2 is rate limiting for C3 photosynthesis. Within the interior of green tissues C4 plants can increase their micro-CO2 levels in bundle sheath cells 50 to 60 times the level of CO2 in equilibrium with air (Figure 6); or green CAM plants can raise their CO2 levels during the day to 2 to 4% CO2 , in contrast to air at 0.035% CO2 . A host of redundancy network type examples of plants continually coping with environmental changes now are well known in plants including: the simultaneous presence of several pigment networks for harvesting light across the entire visible electromagnetic spectrum during photosynthesis; huge numbers of either large or small diameter cells acting as conduits for transporting H2 O; plant roots commonly have both short-lived root hairs plus long-lived mutualistic mycorrhizal fungi for nutrient and water uptake in soils; metabolically, multiple enzymes are present in cells at various steps in glycolysis forming a carbon metabolism network that, e.g., with an immediate environmental stress, a plant can direct large quantities of carbon into defense responses; a number, perhaps a dozen, light sensing phytochromes and phototropins, even chimaera’s of these, that trigger different plant responses as light changes; large numbers of plastids and mitochondria in a cell to insure energy capture and supply; extensive gene duplications; a variety of post-transcriptional RNA modifications for either silencing or synthesizing various proteins; and extensive protein post-translational modifications for the utilization, activation or inactivation of specific proteins.
52 Climate Change and Terrestrial Carbon Sequestration in Central Asia
Figure 6. in air.
Separate responses of C3 and C4 photosynthesis plants to changing the nutritional levels of CO2
A most critical, indeed a universal trait of plants is the ability to begin meristematic development anew, hence to change completely the primary function of a cell or group of cells; even for a plant to regrow completely, reproduce, and survive. Indeed the constant ability to initiate new meristematic activity is an essential and central functional adaptation in plants when environmental stresses occur and/or decline. Each of these redundancies have strong plant biology roles in Central Asia because of widespread environmental problems such as off-seasonal wet and dry soils, salinization, overgrazing herbivory, and pollutants (Toderich et al., 2003). In addition, our last years of investigation revealed that native desert plants tend to accumulate the highest ion concentrations (primarily sodium, chlorates and oxalates) in the epidermal and subepidermal tissues, including various glandular structures on leaves, bracts/bracteoles and perianth segments. Tamarix hispida as a C3 salt exluder hyperhalophyte has a remarkably high Fe and Co levels in the aerial dry matter biomass that it deserves being described as a hyperaccumulator plant. A significant ability for heavy-metal removal has been noted for Artemisia diffusa, A. turanica, Alhagi pseudoalhagi, Peganum harmala, Haloxylon aphyllum, as well as annual and perennial species of the genus Salsola and some grasses (Toderich et al., 2002, 2005a, 2006a,b). It was also noted that the occurrence of calcium oxalate crystals was almost absent in root and stems. An abundance of these crystals was described in the tissue of the seed coats of many xeroand gemi-halophytes (Figure 7 a, b). Sclerenchyma, vascular and pigmental layers, as is shown in Figure 5 a, c for annual species of section Salsola, consisting of small-sized cubic cells, that partially filled with inclusions of unknown origin. Epidermis can be rather thin-walled (internal walls), but, as a rule, at S. dendroides, S. incanescens (section Caroxylon) and S. iberica (section Salsola) outer walls are thickened are selected by uniform thickening of all walls epidermis. The evolution of parenchyma goes from radially elongated large thin-walled cells to small sized cells thick-walled izo-diametric shape cells. In the same direction the cells of sclerenchyma from very large radial elongated to small sized izodiametric form are changed. Two directions of adaptation are detected for species of genus Salsola. The large cells parenchyma and sclerenchyma are positively correlated with the development of strong pubescence, whereas at almost not pubescent species (exception short papillae for a few species) the small sized with thickened walls of parenchyma is observed. Increasing of sclerification, availability of pigments and tracheids like cells holding moisture, abundance of crystals in the perianth tissues also promote the protection of embryo from unfavorable conditions. In addition some naturally highly adapted metallohalophytes develop a cellular mechanism to partition toxic salts into vacuoles or to exclude salt at the root zone so it does not impact on cell metabolism and division, i.e., a high concentration of various ions can accumulate in the vacuoles of bladder-trichomes terminal cells that are frequently developed on the adaxial surface of epidermal cells of leaves or bract/bracteoles (Figure 7 a, b). The prominent levels of sclerification of perianth segments combined with thickening of pericarp and spermoderma epidermis bearing papillae-shaped proturbences (as in the case indicated in
C3/C4 plants in the vegetation of Central Asia
(a)
53
(b)
Figure 7. Scanning micrographs: exclusion effect of contaminants through salt active trichomes/glands that are abundantly developed at the adaxial epidermis of annual Salsola species, growing under contaminated conditions of Kyzylkum sandy desert.
Figure 8 for Salsola paulsenii) are related to the defending of embryo against entrance of toxic elements. Diversities in sexual reproduction mechanisms and CO2 fixation pathways, as were described in this paper for tree-like Salsola species, also are important factors regarding reproduction and survival under saline and technogenic contaminated desert environments. Most essential plant nutrients come from soil-plant interactions via root and microbial contacts; simultaneously essential nutrient uptake must cope with the presence of any toxicants and nonessential elements in soils. The roles of fungi, bacteria, and other organisms as they interact with plants are crucial but, also due to space limits and the limited information about desert plant/soil organism’s interactions, these are not detailed here. Biological lipid bilayer membranes are essentially impermeable to ions, sugars, and polar molecules; hence channels, pumps, diffusion, solution, and mass flow are used to cross biological membranes. For example, the uptake of mineral ions from soils by plant roots occurs through protein-built channels in a biphasic fashion, first with a strong high affinity active carrier mechanism, followed by a slower diffusion uptake. Such active transport channels and pumps are powered, usually by ATP, and may involve an active co-transport with other ions or an exchange with other ions. Figure 9 illustrates processes and ion competition plus their partial independence. Normally the uptake of K, versus K concentration, is biphasic similar to the Rb curve. Rb is a pollutant non-essential element; K competes with the active uptake process but does not influence diffusion uptake. The same biphasic type uptake occurs with other essential plant mineral nutrients, 2− such as NO− 3 , SO4 and Fe; indeed biphasic nutrient uptake also occurs inside of plants with the apoplastic uptake of sugars, ions, and amino acids by cells. Diffusion is a mass action driven process that likely is especially important in metal and salt polluted soils in Central Asian deserts. To remediate desertification the unique plant soil interactions in Central Asian deserts must be known to present reliable restoration management procedures. 7
SOIL ORGANIC CARBON AND SOIL NUTRIENT FLUXES OF CENTRAL ASIA ECOSYSTEMS
The higher grazing pressure of desert/semidesert rangelands and the intensive cultivation of marginal and virgin lands in Central Asia (as were a case with grassland Mirzachul steppe in Uzbekistan and large areas of Kazakhstan steppe) resulted in a substantial declining in soil organic matter (Nasyrov et al., 2004). During the more than 50 years of cotton monoculture leads to decreasing of in the amount of organic carbon. The same trend, though less pronounced, was observed in the case of cotton in
54 Climate Change and Terrestrial Carbon Sequestration in Central Asia
(a)
(b)
Figure 8. Fruit morphology and anatomy of tepals of S. paulsenii; oxalate crystals are observed in the sub-epidermal cells; special layer of tracheids like holding moisture cells is also developed.
Figure 9. The biphasic uptake of a non-essential element, Rb, and the competition by an essential plant element, K, during the active uptake phase in barley roots. Note the uptake rate of Rb by diffusion is little influenced by K levels; but K very effectively competes with Rb at the active uptake channel.
monoculture with fertilizers. Even crop rotation (3 years of alfalfa and 7 years of cotton) could not maintain soil organic carbon at the initial level (Figure 10). Desert plant communities with predominance of perennial fodder species in arid zones of Central Asia are effective and singular key for maintaining or increasing soil organic matter at a satisfactory level. The shrubs vegetation in the sandy desert in Karakum (Turkmenistan) and Kyzylkum (Uzbekisan) had the longest growing season at 173 days, followed by 140 days for the arid grassland steppes of Mirzachuli (Kazakhstan) and Kazakhstan, while the Karnabchuli Artemisia ephemeroid semidesert has the shortest vegetation cycle with 111–126 days.
C3/C4 plants in the vegetation of Central Asia
55
Treatment
Figure 10.
1930 1986 Cotton Yield
Crop rotation +fertilizers
Cotton + manure
Cotton + fertilizers
3,5 3 2,5 2 1,5 1 0,5 0
cotton yield ( t ha 1)
1,2 1 0,8 0,6 0,4 0,2 0 Cotton + no fertilizers
Organic carbon (%)
Long-term dynamic of soil organic carbon and cotton monoculture
Cotton yield and dynamic soil organic carbon under different cropping system.
Plant biomass incorporated into different types of soils 5
35
4,5
t ha -1
3,5
25
3
20
2,5 2
15
1,5
10
1
Above ground Below-ground
5
0,5 0
0 Sandy desert
Figure 11.
root t ha -1
30
4
Sierosem light
Sierosem dark
Dynamic of above ground and below ground plant biomass under different types of soils.
As it’s shown in Figure 11, the magnitude of biomass both above-ground and below ground at the peak of plant growing seasons was highest on the sierosem dark soils in the grassland steppe and foothills areas, intermediate on light sierosem and gray brown as is the case of Karnabchuli Artemisia ephemeroid semidesert and lowest on the sandy desert soils with predominance of psammophytic woody shrubs type of vegetation of Karakum and Kyzylkum deserts. A strong correlation between plant growing season, biomass accumulation (both above ground and below ground) and time course of daily net ecosystem CO2 exchange (NEE, g CO2 m−2 d−1 ). Total flux of CO2 for the period of 1998–2000 varied from 659 ± 67 g CO2 m−2 for grassland steppe; 347 ± 178 g CO2 m−2 for Artemisia ephemeroid pastures to 151 ± 121 g CO2 m−2 under condition of shrubby sandy desert (Saliendra et al., 2004). This phenomenon indicates that huge open spaces of rangelands of Central Asia are potential sinks for atmospheric CO2 . Long-term precipitation data from nearby meteorological stations showed that mean annual precipitation was in the limits of 324 at Kazakhstan steppe >237, at Artemisia ephemeroid pasture >113 mm yr−1 . The decreasing trend of temperature and annual precipitation mentioned by Saliendra et al. (2004)
56 Climate Change and Terrestrial Carbon Sequestration in Central Asia
Figure 12. Digital Elevation Map of Kyzylkesek area (N39-42, E63-70) at the Central Kyzylkum – that we have chosen as a target area; this areas represents a basin-shaped valley or saline depression.
Figure 13. Long term trend of Tamdy station data for 55 years (1936–1990); triangles shows annual mean air temperature and circles shows annual precipitation. Tamdy is the main meteorological station in the Central Kyzylkum of Uzbekistan.
and noted by our preliminarily data for Tamdy (Figures 12 and 13) (shrubby sandy desert vegetation of Central Kyzylkum) correlated well with the decreasing pattern of total NEE for the growing season for all three typical types of rangelands in Central Asian dryland terrestrial ecosystems. Air temperature and precipitation, as it’s shown in Figure 13, have increasing trend. Air temperature increasing rate per 1 year is 0.0188 degree in Celsius (1.034 degree for 55 years). Precipitation increasing rate per year is 0.74 mm (40.82 mm for 55 years).
C3/C4 plants in the vegetation of Central Asia
57
However the above-mentioned data were obtained for the relatively pristine (virgin) deserts ecosystems. At present time, however, continuously degradation of rangelands as result of overgrazing, up-rooting of trees and shrubs for fuel, extension of irrigated agriculture on pastures of best quality leads to the decreasing of their capacity for fixation of atmospheric CO2 during the plant growing season, as well as sequestration of carbon in soils. Increasing soil organic matter content represents a key component for more productive rangelands and sustainable agricultural ecosystems development. 8
NEW DISCOVERIES RELATIVE TO DESERT PLANTS
Recently several new biological features of desert plants have been reported that help give us better insights into plant growth and potential management possibilities. First, the roots of desert plants can be populated by previously unrecognized large groups of fungi that I.) are adapted to symbiosis with desert plants and II.) are tolerant of high temperatures. Recently a great fungal diversity was found on a single grass species, with about 49 fungal phylotypes (Vandenkoornhuyse et al., 2002). A further development regarding symbiotic fungi was the detection of a thermal tolerant ≤40◦ C, fungus (Redman et al., 2002). Importantly, the fungus conferred heat resistance to the plant host and both the plant and the fungus were required for high temperature growth (as found in deserts). Unfortunately the fungal diversity on Central Asian desert plants is unknown along with desert microbial and plant thermal tolerances. Secondly, new pathways of photosynthetic CO2 assimilation have been described in desert plants and in saline-living diatoms. Two Asian plants, Borszczowia aralocaspica and Bienertia cycloptera in Chenopodiaceae, have been described as conducting a new type of C4 photosynthesis within a single green cell (Freitag et al., 2000; Voznesenskaya et al., 2001; Freitag et al., 2002); i.e., without the well known two green cell types needed by most C4 photosynthesis plants. The physiological and environmental adaptations or advantages in deserts of these new types of plant biochemistry are unknown. Another new discovery is for single cell saline-growing diatoms to first fix bicarbonate into C4 acids, and then to decarboxylate them to release high levels of CO2 for increasing Rubisco activity and C3 photosynthesis (Reinfelder et al., 2000). This pathway would facilitate photosynthesis in low CO2 environments such as Asian desert salt marshes and saline lakes. An unusual night fixation of CO2 , via CAM has been detected in some desert plants that allow them to survive in cold, higher altitude, rocky desert environments. We found that CAM occurred in Orostachys spinosa in Mongolia where it is used as a pastoral and herbal medicine plant. Subsequently we learned that Orostachys species are widely adapted for survival and growth in Asian deserts and grow naturally in Russia, Tibet, and much of Central Asia. Orostachys seems to be the coldest adapted CAM plant known, but its special environmental adaptation mechanisms remain to be elucidated. 9
CONCLUSIONS AND DISCUSSIONS
The Central Asian desert vegetation has a unique composition apparently as an evolutionary result of their extremely harsh and dynamic environments and, in recent times, from strongly human driven pressures. These combined pressures have resulted in very difficult biological growth environments. The Chenopodiaceae family dominates their quite diverse flora, specifically by perennials. Surprisingly essentially absent in Central Asian deserts is a large worldwide group of desert plants, called Crassulacean acid metabolism (CAM) plants. Only one small genus Orostachys has been found with CAM. Also this is the Northern most edge of growth for C4 photosynthesis plants that dominate the desert flora. Several new aspects of desert photosynthesis, symbiosis and reproduction have been detected recently, which give clues about the unusual biology needed by plants to successfully grow and produce seeds under harsh desert environments. Some of adaptive features are well presented on seed production, photosynthesis and soil nutrient uptake mechanisms.
58 Climate Change and Terrestrial Carbon Sequestration in Central Asia The Central Asian Flora, mostly from Uzbekistan and Mongolia was studied for C4 photosynthesis species, their natural geographical occurrence plus their carbon assimilation, structural, and biochemical diversity in relation to climatic characteristics. Mainly families’ spectrum of desert flora of mentioned areas was screened for C3/C4 plants by using 13 C/12 C isotope fractionation, determining the early products of 14 CO2 fixation, microscopy of leaf mesophyll cell anatomy, floral structure and from reported literature data. C4 species being dominated in the cover vegetation of Central Asian Deserts were found among 8 families: Amaranthaceae, Chenopodiaceae, Euphorbiaceae, Molluginaceae, Poaceae, Polygonaceae, Portulacaceae and Zygophyllaceae. Most of the C4 species are in 3 families: Chenopodiceae, Poaceae and Polygonaceae (mostly species of genus Calligonum). C4 Chenopodiaceae species comprise 45% of the total chenopods and are very important ecologically in saline areas and in cold arid deserts likes whole Irano-Turanian lowlands and northern Mongoilian desert ecosystems. C4 grasses include about 10% of the total Poaceae species and these species naturally concentrate in foothills and steppe zones. Naturalized Kranz-grasses of genera Setaria, Aeluropus, Bromus,Eremopyrum, Agropyron, Echinochloa, Eragrostis, Panicum, Pennisetum and Chlori, which occurs in almost all of Irano-Turanian and Mongolias botanical-geographical regions were commonly grown in disturbed areas and in desert oasises. The relationships between the occurrence of C4 plants and their major climatic influences for the main botanical-geographical regions of Central Asian desert showed that the occurrence of C4 species increases with the decreasing of geographical latitude and along the warming North to South gradient; however grasses and chenopods differ in their responses to climate. The abundance of Chenopodiaceae species was closely correlated with aridity index; but the distribution of the C4 grasses was more dependent of temperature. Also, we found a unique distribution of different C4 Chenopodiaceae structural and biochemical subtypes along the aridity gradient. NADP-ME tree-like species with a Salsoloid type of Kranz-anatomy, such as Haloxylon ammodendron, H. aphyllum, Iljinia regelii, Halothamnus subaphyllus plus shrubby perennial species of Salsola, (except Salsola arbusculiformis) and Anabasis species were the most resistant plants to ecological stress and habitat in extra arid conditions with less than 100–120 mm of annual precipitation. Most of the annual C4 chenopods are halophytes, succulent, and grow well in saline and arid environments in steppe and sandy desert areas. The relative abundance of C3 succulent desert species also increased along the aridity gradient. This was the case of C3 Tamarix species from Tamaricaceae that showed strong ranges of variability of 13 C/12 C value (23.0–27.6). Native C4 grasses were mainly annual and perennial species from the Cynodonteae tribe with NAD-ME and PEP-CK photosynthesis types. Their habitats occurs across of Gobi (Mongolia), Karakum (Turkmenia) & Kyzylkum (Uzbekistan) Deserts, although are most common in steppe zones where they can play a dominant role in grazing ecosystems. A concept of plant functional reproduction system (PFRS) based on common structural floral, fruits and functional (photosynthetic pathways and biochemistry) features of perennial shrubby and annual species of different taxonomic groups of plants in their desert natural habitats is developed. Our analysis of C4 plant composition in different botanical-geographical regions of Central Asian deserts showed that species with a similar type life forms, reproductive biology, mesophyll anatomy, CO2 biochemistry are usually characterized by a similar habitation and belong to a similar taxonomical unit. Such similar structural-functional plant groups amongst C4 chenopods have the largest spatial distribution in different areas of Turanian deserts with a much smaller number of species for Mongolia. Shrubs with salsoloid Kranz-anatomy from Chenopodiaceae (Haloxylon, Ilinia, Halothamnus, Salsola arbuscula, S. montana, S. drobovii, S. paletzkiana, S. richteri) and Polygonaceae (mostly species of genus Calligonum) occurs in the sandy desert, i.e. the most hot hyperarid deserts in the whole Central Asia. Annuals such as Salsola and derivative genera (Micropeplis, Halogeton, Ghamanthus, Haloharis) with NADP-ME biochemistry are coldresistant and are distributed in broadest climatic range, including boreal regions. Some of them are weedy plants and distributed worldwide. At the same time, the species of this group are not abundant in true deserts and do not habitat in saline conditions. Annual chenopods with salsoloid and suaedoid mesophyll structure and NAD-ME biochemical type (Climacoptera, Petrosimonia, Suaeda) commonly habitat is saline environment. Plants with kochioid type of Kranz-anatomy
C3/C4 plants in the vegetation of Central Asia
59
all exhibit NADP-ME biochemistry and can occur in a broad range of climatic conditions; but their relative abundance is highest in steppe and semi-desert conditions. In our mind, we have a mosaic distribution of functional plant groups along the main ecological gradients, i.e. temperature, drought and salinity. The correspondence between ecological and structural-biochemical features of these plants is a result of plant evolution and natural selection. Our studies do indeed illustrate two quite contrasting plant functional groups with both groups involving plants with C4 photosynthesis of various life forms. First, it is the vegetation of the extremely arid, cold and hot Kyzylkum and Karakum Deserts, where the C4 Chenopodiaceae species dominate the vegetation; indeed their shrubby to tree life forms form a forest like woodland. These might be species of Haloxylon, Iljinia, Anabasis, Salsola, Calligonum are either NADP-ME or NAD-ME C4 plants with salsoloid assimilation organ anatomy and have deep rooted tree and shrub life forms combined with succulence of assimilation organs and show strong correlation with aridity. This same plant structural-functional group dominated by C4 Chenopodiaceae is found, with some variations in floral richness, in the desert of Western China, Central Asia, down in Arabian Peninsula, Near East, and North Africa being insignificantly distributed in Europe and American continent. In contrast we also found in Central Asia the well known appearance of C4 annuals in annually disturbed areas in agricultural crop lands, and around oasis as weedy cosmopolitian species (Black et al., 1968). These species of Amaranthus, Halogeton, Chenopodium, Micropeplis, Salsola, Ehinochloa, Setaria, and grasses of the Cynodonteae tribe, usually have distinct types of grass Kranz or salsoloid anatomy, NADP-ME or NAD-ME, and have a quick growing annual life form and show little correlation with climatic factors. This C4 plant functional groups occurs world wide on regularly distributed lands up to 60–67◦ North latitude. By means of SEM analyses it was defined that structure of perianth segments reflects ways and character of adaptive coevolution of these taxons and plays a more significant role in the species identification than other elements of floral organs. The structural polymorphism of floral organs is coupled with the diversity of pathway and anatomy of the CO2 assimilative organs. We suppose that sexual reproduction mechanism and CO2 fixation pathway diversities of tree-like Salsola species, detected in this study, are important factors supported by their successful reproduction under desert harsh environments. Species with similar floral developmental features, C4-MADP-ME photosynthesis and Salsoloid type of Kranz-anatomy both in leaves and reproductive organs forming a unique plant functional reproductive group were widely distributed and most resistant plants to various ecological arid habitats. Ana-campylotropous, crassinucellate and butegmic ovule, autogamy (self pollination/fertilization system), narrow specialization of sexual reproductive structures linked with Sympegmoid – leaf anatomy and C3 – like δ13 C values both in leaves and reproductive organs testify the ancient origin of S. arbusculiformis, from which Salsola species with C4 – syndrome must have derived recently. Evolutionary changes in the mating system of S. arbusculiformis under extreme desert environments through advantages of self-fertilization, reproductive assurance (when pollinators are scarce), geographical restricted distribution (growing preferentially on rocks, crushed stones or other ancient substrates) and reproductive isolation between sympatric species support a strong tendency to inbreeding depression in this taxon. The coexistence of two fitness components (sexual and apomictic) in S. arbusculiformis we estimate as a structural adaptive modifications of reproductive organs enable plants to survive and reproduce fruits under extreme continental desert conditions. Complex ecosystems populations, as in the deserts of Central Asia, can be restored over time by utilizing existing species and by adding new uniquely adapted or transformed species. The stable recovery of ecosystem functions can be considered best from the viewpoint of development over time. Note that includes human activity interventions; even recognizing that the first priorities of local citizens living in deserts are concerns about producing food, animals, and useful home-type products for themselves. Naturally, they are not too concerned with topics such as biodiversity, plant adaptations, or science and technology. For example, at numerous Central Asian desert sites the soils are polluted with metals or toxic organics that plants can cope with, indeed some plants can remove these toxicants to assist in land restoration! Phytoremediation technology is considered a
60 Climate Change and Terrestrial Carbon Sequestration in Central Asia potentially valuable technique for dealing with heavy metals, which are typically the most difficult pollutants to remove from soils. The use of metallohalophytes from the Central Asian flora to reclaim soils could represent both a practical and economically viable strategy. Today there is much hope that plants can be transformed to remove specific pollutants for land cleaning and a host of other plant improvements. Even though the scientific technology for molecularly transforming plants is very well established, unfortunately plants that are well adapted to desert environments have not yet been transformed. Plant transformation knowledge needs to be applied immediately to the special needs of desert-adapted plants in Central Asia. Since these deserts have been exploited, polluted, and are regularly overgrazed, many plants well adapted to natural Central Asian deserts have nearly disappeared and are being very difficult to locate. This shortage of high quality plants greatly hinders work to mass propagate, to restore, and maintain desert plant ecosystems. By combining our accumulated knowledge of biodiversity, reproductive biology, biochemistry, physiology, and environmental adaptations, recommendations should be developed for more effectively and sustainable managing the deserts of Central Asia; even in the presence of strong anthropogenic pressures. The elaboration of new strategies of proper management and re-vegetation of degraded rangelands and salt-affected contaminated desert pastures should be a prime priority for all Central Asian countries. REFERENCES Akhani, H., P. Trimborn, and H. Ziegler. 1997. Photosynthetic pathways in Chenopodiaceae from Africa, Asia and Europe with their ecological, phytogeographical and taxonomical importance. Plant Systematics and Evolution 206:187–221. Bender, M.M., I. Rouhani, H.M. Vines, and C.C. Black, Jr. 1973. 13 C/12 C ratio changes in Crassulaceae acid metabolism. Plant Physiology 52:427–430. Berry, J.A. 1993. Global distribution of C4 plants. Carnegie Institution Year Book 92:66–69. Black, C.C. 1973. Photosynthetic carbon fixation in relation to net CO2 uptake. Annual Review Plant Physiology 24:253–286. Black, C.C., T.M. Chen, and R.H. Brown. 1968. A biochemical basis for plant competition. Weed Sci. 17:338–344. Black, C.C. and C.B. Osmond. 2003. Crassulacean Acid Metabolism Photosynthesis: Working the night shift. Photosynthesis Research 76:329–341. Botschantzev, V.P. 1969. The genus Salsola: a concise history of its development and dispersal. Botanicheskii Zhurnal 54:989–1001. (in Russian). Bozolla, J.J. and L.D. Russell. 2002. Electron Microscopy: principles and techniques for biologists, Second edition, Boston, USA. 644 p. Butnik, A.A., O.A. Ashurmetov, R.N. Nygmanova, and S.A. Paizieva. 2001. Ecological anatomy of desert plants of Middle Asia. Vol. 2. Subshrubs, subshrublets, Tashkent: Fan AS Ruz. 132 p. Burris, R.H. and C.C. Black. 1976. CO2 Metabolism and Plant Productivity. Univ. Park Press, Baltimore, MD. 431 p. Buchanan, B.B., W. Gruissem and R.L. Jones. 2000. Biochemistry and Molecular Biology of Plants. Amer. Soc. of Plant Physiol., Rockville, MD. 1367 p. Carolin, R.C., S.W.L. Jacobs, and M. Vesk. 1975. Leaf structure in Chenopodiaceae. Botanishe Jahrblcher fur Systematishe Pflanzengeschichte und Pflanzengeographie 95:226–255. Carolin, R.C., S.W.L. Jacobs, and M. Vesk. 1978. Kranz cells and mesophyll in Chenopodiaceae. Australian Journal Plant Physiology 26:683–698. Dudik, N.M. 1971. To the methodology of compiling of glossary based on fruits and seeds. p. 20–21. Biological Basis of Improvement of Seed Production and Seed Quality of Introduced Plants. Kiev, Naukova Dumka. Fisher, D.D., H.J. Schenk, J.A. Thorson, and W.R. Ferren, Jr. 1997. Leaf anatomy and subgeneric affiliations of C3 and C4 species of Suaeda (Chenopodiaceae) in North America. American Journal of Botany 84: 1198–1210. Freitag, H. and W. Stichler. 2000. A remarkable new leaf type with unusual photosynthetic tissue in a Central Asiatic genus of Chenopodiaceae. Plant Biol. 2:154–160. Freitag, H. and W. Stichler. 2002. Bienertia cycloptera Bunge ex Boiss., Chenopodiaceae, another C4 plant without Kranz tissues. Plant Biol. 4:121–132.
C3/C4 plants in the vegetation of Central Asia
61
Gamaley, Y.V. 1985. The variations of the Kranz-anatomy in Goby and Karakum deserts plant. Botanicheskii Zhurnal 70:1302–1314. (in Russian). Gameley, Y.V. and T. Shirevdamba. 1988. The structure of plants of Trans-Altai Gobi. p. 44–106. In: Y.V. Gamalei, P.D. Gunin, R.V. Kamelin and N.N. Slemnev (eds.), Deserts of Trans-Altai Gobi: Characteristic of Dominant Plants. Nauka, Leningrad. Grubov, V.I. 1982. Key to the vascular plants of Mongolia. Nauka, Leningrad. In Russian. Gubanov, I.A. 1996. Conspectus of flora of Outer Mongolia (vascular plants). Valang, Moscow. In Russian. Gintzburger, G., K.N. Toderich, B.K. Mardonov, and M.M. Makhmudov. 2003. Rangelands of of the arid and semi-arid zones in Uzbekistan. Centre de Cooperation Internationale en Resherche Agronomique pour le Development (CIRAD) , Monpellier, France. 498 p. Gintzburger, G, S. Saidi and V. Soti. 2004b. Ravnina Rangeland current vegetation conditions and utilization. Final DARCA Report INCO-COPERNICUS. Centre de Cooperation Internationale en Resherche Agronomique pour le Development (CIRAD), Monpellier, France. 202 p. Gintzburger, G., H.N. Le Houeoru, and K.N. Toderich. 2005a. The steppes of Middle Asia: Post-1991 Agricultural and Rangeland Adjustment. J. Arid Land Research and Management 19:215–239. Gunin, P.D., E.A. Vostokova, N.I. Dorofeyuk, P.E. Tarasov, and C.C. Black. 1999. Vegetation Dynamics of Mongolia. Kluwer Academic Publishers. 233 p. Hatteresley, H.A. and L. Watson. 1992. Diversification of photosynthesis. p. 38–116. In G.P.Chapman (ed.), Grass Evolution and Domestication. Cambridge University Press, Cambridge. Iljin, M.M. 1936. Chenopodiaceae Less. p. 4–272. In: V.L. Komarov and B.K. Shishkin (eds.) Flora of the USSR. Vol.VI, Centrospermae (English translation, 1970, by N.Landau). Israel Program for Scientific Translation, Jerusalem. Jigiidsuren, S. and D.A. Johnson. 2003. Forage plants in Mongolia. RIAH., Ulanbaator, Mongolia. Jones, C.A. 1985. C4 Grasses and Cereals. John Wiley & Sons, NY. 419 p. Kaden, N.N. and S.A. Smirnova. 1971. To the methodology of karpological description. In: Biological Basis of Increasing of Productivity and Quality of Seeds of Introduced Plants. Kiev., Maukova Dumka. 24 p. Le Houuerou, H.N. 2005. Bioclimatology, phytogeography and diversity of the isoclimatic Mediterranean biome. Copymania Publication, Montpellier, France. Li, M. 1993. Distribution of C3 and C4 species of Cyperus in Europe. Photosynthetica 28:119–126. Nasyrov, M., N. Ibragimov, B. Halikov, and J. Ryan. 2004. Soil organic carbon of Central Asia’s Agroecosystems. p. 126–139. In: J.Ryan, P. Vlek, and R. Paroda (eds.), Agriculture in Central Asia: Research for Development. ICARDA, Aleppo, Syria. Oliver, J.E. and R.W. Fairbridge (eds.). 1987. The Encyclopedia of Climatology. Vol. XI. New York, NY. Osmond, C.B., O. Bjorkman and J. Andersen. 1980. Physiological processes in plant ecology: toward a synthesis with Atriplex.Ecological Studies 36. Oyungerel, O., T. Tsendeekhuu, and C.C. Black. 2000. Studies of photosynthesis by succulent plants in Mongolia. Ph.D. Thesis (in preparation). Petrov, M.P. 1973. The deserts of the Globe. Nauka Publishing House, Leningrad, USSR. 414 p. (in Russian). Pyankov, V.I. 1984. Relationship between primary CO2 fixation pathways in C4 plants of arid zones as affected by various temperature. Soviet Plant Physiology 31:644–649. Pyankov, V.I. 1993. C4-species of high mountain desert of Eastern Pamirs. Russian Journal of Ecology 24:156–160. Pyankov, V.I. and A.T. Mokronosov. 1993. General trends in changes of the Earth’s vegetation related to global warming. Russian Journal of Plant Physiology 40:443–458. Pyankov, V.I. and Y.I. Molotkovskii. 1993. C4-flora of Tiger Valley reserve, South Tadjikistan. Proceedings Acad. Sci. Tadjikistan 35:38–43. (in Russian). Pyankov, V.I. and D.V. Vakhrusheva. 1989. The pathways of primary CO2 fixation in Chenopodiaceae C4-plants of Central Asian arid zone. Soviet Plant Physiology 36:178–187. Pyankov, V.I., D.V. Vakhrusheva, and O.L. Burundukova. 1986. The photosynthetic pathway types in the hot desert of Central Karakum and its ecological importance. Problems of Desert Development N2:45–54. (in Russian). Pyankov, V.I., D.V. Vakhrusheva, and M. Durikov. 1988. Structural-functional especialities of ecotypes of Kochia prostrata (L.) Shrad. in agrocenosis of Central Kara-Kum and Kopetdag. Problems of Desert Development N1:67–73. (in Russian). Pyankov, V.I., A.N. Kuzmin, E.D. Demidov, and A.I. Maslov. 1992a. Diversity of biochemical pathways of CO2 fixation in plants of the families Poaceae and Chenopodiaceae from arid zone of Central Asia. Soviet Plant Physiology 39:411–420.
62 Climate Change and Terrestrial Carbon Sequestration in Central Asia Pyankov, V.I., E.V. Voznesenskaja, A.N. Kuzmin, E.D. Demidov, A.A. Vasiljev, and O.A. Dzubenko. 1992b. C4-photosynthesis in alpine species of the Pamirs. Soviet Plant Physiology 39:421–430. Pyankov, V.I., E.V. Voznesenskaja, A.V. Kondratschuk, and C.C. Black. 1997. A comparative anatomical and biochemical analysis in Salsola (Chenopodiaceae) species with and without a Kranz type leaf anatomy: a possible reversion of C3 to C4 photosynthesis. American Journal of Botany 84: 597–606. Pyankov V.I., C.C. Black, E.G. Artyusheva, E.G. Voznesenskaya, M.S.B. Ku, and G.E. Edwards. 1999. Features of photosynthesis in Haloxylon species of Chenopodiaceae that are dominant plants in Central Asian deserts. Plant Cell Physiol. 40:125–134. Pyankov, V.I., P.D. Gunin, S. Tsoog, and C.C. Black. 2000. C4 plants in the vegetation of Mongolia: their natural occurrence and geographical distribution in relation to climate. Oecologia 123:15–31. Pyankov V.I., E.V. Voznesenskaya, A.N. Kuzmin, M.S.B. Ku, E. Ganko, V.R. Franceschi, C.C. Black, and G.E. Edwards. 2000. Occurrence of C3 and C4 photosynthesis in cotyledons and leaves of Salsola species (Chenopodiaceae). Photosynthesis Research 63:69–84. Redman, R.E., L. Yin, and P. Wang. 1995. Photosynthetic pathway types in grassland plant species from Northern China. Photosynthetica 31:251–255. Redman, R.S., K.B. Sheehan, R.G. Stout, R.J. Rodriguez, and J.M. Henson. 2002. Thermotolerance generated by plant/fungal symbiosis. Science 298:1581p. Reinfelder, J.R., A.M.L. Kraepiel, and F.M.M. Morel. 2000. Unicellular C4 photosynthesis in a marine diatom. Nature 407:996–999. Saliendra N.Z., D. Johnson, M. Nasyrov, K. Akshalov, M. Durikov, B. Mardonov, T. Mukimov, T. Gilmanov, and E. Laca. 2004. Daily and growing season fluxes of carbon dioxide in rangelands in Central Asia. p. 140–153. In: J. Ryan, P. Vlek, and R. Paroda (eds.), Agriculture in Central Asia: Research for Development. ICARDA, Aleppo, Syria. Schulze, E.D., R. Ellis, W. Schulze, and P. Trimborn. 1996. Diversity, metabolic types and δ13 C carbon isotope ratios in the grass flora of Namibia in relation to growth form, precipitation and habitat conditions. Oecologia 106:352–369. Shomer-Ilan, A.S., A. Nissenbaum, and Y. Waisel. 1981. Photosynthetic pathways and the ecological distribution of the Chenopodiaceae in Israel. Oecologia 48:244–248. Smith, S.D., R.K. Monson, and J.E. Anderson. 1997. Physiological Ecology of North American Desert Plants. Springer, Berlin. Toderich, K.N., R.I. Goldshtein, V.B. Aparin, K. Idzikowska, and G.S. Rashidova. 2001. Environmental state and an analysis of phytogenetic resources of halophitic plants for rehabilitation and livestock feeding in arid and sandy deserts of Uzbekistan. 154 p. In: Sustainable Land Use in Deserts. Berlin. Toderich, K.N., T. Tsukatani, C.C. Black, K. Takabe, and Y. Katayama. 2002. Adaptations of plants to metal/salt contained environments: glandlar structure and salt excretion, KIER Discussion paper, No 552, Kyoto University, Kyoto, Japan. 18 p. Toderich, K.N., V.B. Aparin, T. Tsukatanu, and A.B. Konkin. 2003. A strategy for land rehabilitation by salt and heavy metal removal using the integration of Asiatic desert plant diversity. Chinese Journal of Arid Land Geography 26:10:150–159. Toderich, K.N., T. Tsukatani, O.F. Petukhov, V.A. Gruthinov, T. Khujanazarov, and E.A. Juylova. 2004. Risk assessment of Environmental contaminants of Asiatic Deserts Ecosystems in relation to plant distribution and structure. Journal Arid Land Studies 14S:33–36. Toderich, K.N., T. Tsukatani, E.V. Shuyskaya, T. Khujanazarov, and A.A. Azizov. 2005a. Water quality and livestock waste management in the arid and semiarid zones of Uzbekistan. p. 574–583. In: Proceedings of the University of Obihiro, Japan. Toderich, K.N., V.V. Li, C.C. Blak, T.R. Yunusov, E.V. Shuiskaya, G. Mardanova, and L.G. Gismatulina. 2005b. Linkage studies of structure, isoenzymatic diversity and some biotechnological procedures for Salsola species under desert saline environments. p. 73–82. In: Biosaline Agriculture and Salinity Tolerance in Plants. Birkhouser Verlop AG Basel – Boston – Berlin. Toderich, K.N., C.C. Black, A.A. Ashurmetov, U. Japakova, L.G. Gismatulina, and T. Yunusov. 2006a. Salsola spp. as a model for understanding plants reproductive system. p. 204–206. In: Biochemistry and Environmental Physiology in Desert Ecosystems. Baytenovskie Chteniya. Almata. Toderich, K.N., P.N. Yensen, Y. Katayama, Y. Kawabata, V.A. Grutsinov, G.K. Mardonova, and L.G. Gismatullina. 2006b. Phytoremediation Technologies: using plants to clean up the metal/salts contaminated desert environments. Journal Arid Land Studies 15S:183–186. Tsvelev, N.N. 1987. The system of grasses (Poaceae) and their evolution. 37th Komarov Lecture, Nauka, Leningrad. (in Russian).
C3/C4 plants in the vegetation of Central Asia
63
Ueno, O., M. Samejima, and T. Koyama. 1989. Distribution and evolution of C4 syndrome in Eleocharis, a sedge group inhabiting wet and aquatic environment, based on calm anatomy and carbon isotope ratios. Annals of Botany 64:425–438. Ueno, O. and T. Takeda. 1992. Photosynthetic pathways, ecological characteristics, and the geographical distribution of the Cyperaceae in Japan. Oecologia 89:195–203. Vandenkoornhuyse P., S.L. Baldauf, C. Leyval, J. Straczek, and J.P.W. Young. 2002. Extensive fungal diversity in plant roots. Science 295:2051. Voznesenskaja, E.V. and Y.V. Gamaley. 1986. The ultrastuctural characteristics of leaf types with Kranz anatomy. Botanicheskii Zhurnal 71:1291–1307. (in Russian) Voznesenskaya, E.V., V.R. Franceschi, O. Kiirats, H. Freitag, and G.E. Edwards. 2001. Kranz anatomy is not essential for terrestrial C4 plant photosynthesis. Nature 414:543–546. Winter, K. 1981. C4 plants of high biomass in arid regions of Asia: occurrence of C4 photosynthesis in Chenopodiaceae and Polygonaceae from the Middle East and USSR. Oecologia 48:100–106. Wojnicka-Poltorak, A., E. Chudzinska, E. Shuiskaya, H. Barczak, K. Toderich, and W. Prus-Glowacki. 2002. Isoenzymatic and cytological studies of some Asiatic species of genus Salsola. Acta Societatis Botanicorum Poloniae. 71, No 2:115–120. Zalenskii, O.V. and T.A. Glagoleva. 1981. Pathway of carbon metabolism in halophytic desert species from Chenopodiaceae. Photosynthetica 15:244–255. Ziegler, H., K.H. Batanouny, N. Sankhla, O.P. Vyas, and W. Stichler. 1981. The photosynthetic pathway types of some desert plants from India, Saudi Arabia, Egypt, and Iraq. Oecologia 48:93–99.
Water Resources of Central Asia
CHAPTER 4 Water resources of the Central Asia under conditions of climate change
V.E. Chub Uzhydromet, Tashkent, Uzbekistan
1
INTRODUCTION
Most of the Central Asian region is located in areas that feed into the Aral Sea, Balkhash, Issyk-Kul and Karakul lakes basins. The region is part of the Eurasian continent and is located near the northern border of the subtropical zone. It is characterized by a continental climate, uneven distribution of atmospheric precipitation and a peculiar hydrological cycle which is greatly affected by wind movement fluctuations. Most water resources originate in mountainous regions and are concentrated in transboundary rivers whose waters are jointly used by the Central Asian states. The upper catchments of the watersheds of these rivers are characterized by highly variable hydrometeorological features that are greatly affected by climate fluctuations and changes. These features should be analyzed because they will increase in importance as climate changes that are caused by increases in greenhouse gas concentrations in the atmosphere. In the past, the climate of the region was quite different from what it experiences today. During the time of the Lyavlyakon pluvial (7–4 thousand years B.C.) current desert areas were characterized by a plains-type climate. Water flows from the Amudarya and Zeravshan rivers were greater than 2.5 times the current flows (Mamedov and Trofimov, 1996). Desertification and its impact on the landscape greatly increased during the end of the third – beginning of the second millennia B.C. According to archeological, geomorphological and much historical data, humidity levels actually increased during the early Middle Ages and during the seventeenth to twentieth centuries.
2
CHARACTERISTICS OF THE HYDROLOGICAL CYCLE
Unidirectional trends are being recorded for a number of important characteristics of the hydrological cycle. They are very evident in changes in regional glaciation data. For example, only in 3–4 cases, based on data associated with 30 years of instrumental observations about the Abramov glacier, show a positive mass balance. Analyses of aerial photos and satellite images made in different years indicate a reduction in the glaciation found in mountainous regions. The glaciation area of Hissar-Alai region was reduced 15.6% during the period 1957–1980, while in Pamir it was reduced by 10.5%. A 7.6% to 10.6% increase in the moraine area covered by glaciers was recorded in Pamir-Alai and a similar increase of from 4.8% to 11% was recorded in Pamir (Tsarev, 1996). Most of the river flow to the Aral Sea basin is being formed by atmospheric precipitation during cold seasons. Its distribution over the area of the flow formation is determined by the peculiarities of synoptic processes, especially regional atmospheric events such as wind movements. Regularities in the hydrological cycle of the mountainous regions are evident through analyses of changes in specific hydrological elements that depend on the altitude and nature of slopes (Getker, 1981; Kupriyanova, 1969; Chub, 2000; Shetinnikov, 1993). Range ridges have a major impact on wind movements. They cause increases in precipitation layers at similar altitudes as they approach 67
68 Climate Change and Terrestrial Carbon Sequestration in Central Asia
Snow Reserve (103 m3/yr)
the windward ranges. They cause the opposite effect when moving from these range barriers into the interior of the mountain system. Mean long-term gradient values increase to 20 mm km−1 near the ranges of the barriers and decrease to 1–5 mm km−1 when moving away from them. Different types of relationships are formed between precipitation and local altitude depending on the orientation of ranges and their relationship to the main moisture bearing masses. For the windward slopes the relationship is represented by convex shaped, constantly increasing correlations, the steepness of which increases for the favorably oriented ranges. For the leeward slopes and inner mountain screened basins, the correlation relationships take the form of a concave curve (Getker, 1981). It is possible for prevailing types of synoptic processes to vary such that the same slopes can experience both windward and leeward conditions, thus resulting in high temporal and spatial distributions of precipitation. Indeed, rather significant climate fluctuations were recorded during past meteorological observation periods in Central Asia. The 1930–1960 period was characterized by a predominance of latitudinal wind circulation while the 1961–1985 period was characterized by a predominance of meridional wind circulation. Many stations recorded high variability and mixed characteristics in the distribution of precipitation were common during the periods of meridional wind circulation. On the other hand, precipitation deficits were common during the prevalence of periods of latitudinal wind circulation. Muminov (1995) has noted the distinguishable “dry” decade from 1941–1950, the moderately dry decades from 1961–1980, and the humid decades from 1951–1960 and from 1981–1990. He also noted the initiation of a marked increase in latitudinal wind circulation trend during the 90’s. Seasonal snow cover in the Central Asian mountains is rather dynamic and has a major impact on flora and fauna of the region as well as on economic activities. Estimations of a linear trend based on observation results from the Chirchik-Akhangaran basin suggest that snow reserves decreased during the period 1935–1990. The decrease was 610 thousand m3 yr−1 for the Pskem river basin in the inner mountain region. For the Akhangaran valley approaching from the west, the decrease is estimated to have been 1.6 million m3 yr−1 ; and for the wide Chatkal valley the decrease was estimated to be 5.63 million m3 yr−1 which is about 1.0–1.5% of the natural snow reserves standard (Ivanov Yu et al., 1987) (See Figure 1).
Figure 1. Intrannual and linear trends of the integral snow reserves accumulated by the end of March in the basins of Chatkal (1), and Pskem (2) and Akhangaran rivers.
Water resources of the Central Asia under conditions of climate change 3
69
HYDROLOGICAL NETWORK
The hydrological network was most highly developed during the 1970’s and 1980’s. It is virtually impossible to identify exact relationships between the flow of rivers in the Central Asia mountains and key meteorological factors because of lack of adequate data. This explains why the mean flow calculation for mountain rivers is most frequently estimated by using relationships between the median of the mean long-term flow (Ì) and the mean weighted height (Z) and why hydrometeorological data are used to make these calculations. There are 89,000 rivers and almost 6,000 lakes in the region (Table 1). The formula most often used to estimate the mean long-term flow in mountains is M = f(H) which is based on the zoning of the land in question. Central Asia can be divided into two major regions that are distinguished from one another by major hydrographic and geomorphologic features. One is a plains region where almost no river flowage which occupies almost 70% of the area. The other is the mountainous region where all rivers of the region are being formed. It occupies about 30% of the total area. The mountainous region contains the large Amudarya and Syrdarya river basins. Other major river basins are found in the southern and south-eastern parts of Turkmenia. Also among the larger water flowage systems are the Talas, Chu and Aksu river basins and the Issyk-Kul lake basin. These large hydrological units are subsequently subdivided into smaller basins or regions. For example, the Amudarya river basin is divided into the Pyandj, Vakhsh, Kafirnigan, Surkhandarja river basins. The Sherabad, Kashkadarja and Zeravshan rivers are also found in the hydrological region. The Syrdarya river basin is divided into the Naryn, Karadarya, Angren, and Chirchik river basins. It also contains the Keles and Arys rivers, the Southern-Fergana and Northern-Fergana regions, the northern slopes of the Nuratau range and the southwestern slopes of the Karatau range. Turkmenia contains the northeastern slopes of the Kopetdag range and the Badhyz region. The Issyk-Kul lake region is in part defined by rivers on its northern and southern banks. Almost all of these regions are subdivided into subregions which are used to estimate the relationship between river flowage rates and altitude. The water resources of the Central Asia have been estimated several times by different scientists. All have based their studies on observational data provided by the network of hydrometric measurement stations of the regional hydrometeorological system. River flowage values were taken at points representing where rivers entered plains regions from their mountain sources. During most years, it is impossible to gauge the rates of water flowage in rivers in the plains regions, since the flowage is practically non-existent. Flowage data calculated by NIGMI of Uzhidromet are presented in Table 2. Omitted from this table are flowage rates for left bank tributaries of Amudarya River which originate in Afghanistan. They are estimated to be 17 km3 yr−1 (Table 3). Little difference in the estimates of water resources presented by the different authors exists for basins with high density hydrometric networks, principally because the results of reference stations are not distorted by economic activities. Table 1.
The distribution of rivers and lakes on the main regions of Central Asia. Rivers
Lakes
River basin, region
Number
Length, km
Number
Area, km2
Amudarya Syrdarya Talas Chu Chinese Aksu Issyk-Kul lake Turkmenistan Total number
40,999 29,790 3,632 5,244 4,495 1,976 2,972 89,018
1,787 1,907 276 491 214 134 167 4,978
2,619 1,405 467 506 260 183 211 5,961
129 65 23 38 4 20 42 321
70 Climate Change and Terrestrial Carbon Sequestration in Central Asia Table 2.
Water resources (km3 yr−1 ) of the rivers of Amudarya river basin. Volume of the annual flow, km3 yr−1 Mean annual long-term discharge, m3 s−1
River basins Amudarya basin Pyandj Vakhsh Kafirnigan Surkhandarja with Sherabad Kashkadarja Zeravshan Total Syrdarya basin Naryn Rivers of Fergana valley Rivers of the northern slope of range to the west of Turkistan range to the west from Fergana valley Akhangaran Chirchik Keles Arys Rivers of the south-western slope of Karatau range Total Krygyzstan Talas Chu Issyk-Kul lake Chinese Aksu Total Turkmenistan Atrek Tedjen Murgab Rivers of the northern slopes of Kopetdag range Total Overall for Aral Sea basin Table 3.
Mean
Maximum
Minimum
1,140 661 187 127 49 169 2,334
35.9 20.8 5.9 4.0 1.6 5.3 73.5
– 27.6 9.8
– 16.2 4.1
2.7 6.9 –
0.9 3.8 –
448 401 10
13.8 12.8 0.3
2.3
0.8
0.4
0.2
38 248 7 64 21
1.2 7.8 0.2 2.0 0.7
3.0 14.1 0.5 – –
0.6 4.5 0.1 – –
1,237
38.8
–
–
68 137 118 225 548
2.1 4.3 3.7 7.1 17.2
– – – – –
– – – – –
10 27 53 11
0.3 0.8 1.7 0.3
– 0.5 2.6 –
– 0.1 0.4 –
101 4219
3.1 132.6
– –
– –
Water resources of the left bank tributaries of Amudarya River.
River
Mean annual long-term discharge value, m3 s−1
Volume of the annual flow, km3 yr−1
Kokcha Kunduz Khulm Balkhab Sarypul Shirintagao Murgab Gerirud Total
211 165 2.7 49.8 8.0 4.1 61.1 48.5 550.0
6.6 5.2 0.1 1.6 0.2 0.1 1.8 1.4 17.0
Water resources of the Central Asia under conditions of climate change Table 4.
71
Estimates of levels of water flowage for the different river basins of Central Asia.
River basin
Schults, 1965
Golshakov, 1974
Amudarya Srdarya Naryn Chu and Talas Issyk-Kul lake
79.0 37.8 13.5 5.98 3.62
38.3 13.8 6.47 3.72
IWP*, 1985
SHI*, 1987
NIGMI*, 1997
72.8 36.7
69.5 37.0 13.8
73.6 38.8
*IWP-Institue of Water Problem, Academy of Science of Russia; SHI-Science Hydrological Institute of Russia Hydrometservices; NIGMI-Hydrometeorological Research Institute of Uzhydromet. Table 5.
Estimates of water flowage in rivers of Central Asia (km3 yr−1 ). Flow which is formed within the states
State Turkmenistan Uzbekistan Tajikistan Kyrgyzstan Total
Area ‘000 km2
SHI*, 1967
488.0 447.4 143.0 198.5
1.0 11.1 51.2 52.8
1,765.9
126.1
Kupriyanova, 1969
IWP*, 1985
SH*, 1967
IWP*, 1985
– 10.6 53.4 49.7
1.1 9.5 47.4 48.7
– – 20.0
2.9 20.7
–
106.7
–
23.6
*IWP-Institute of Water Problem, Academy of Science of Russia; SHI-Science Hydrological Institute of Russia Hydrometservices.
Data in Table 4 indicate that discrepancies in the water resources of the rivers of the Fergana valley, as represented by the Chirchik-Akhangaran irrigation area and the Amudarya river basin, are rather high. Different authors have estimated the water resources of the Amudarya River. Some have taken into account the flow which was formed in Afghanistan territories in doing so, while some have not. The resulting discrepancies can be dealt with by assessing flow commonalities. Data presented suggest that calculations of total and regional water resources are quite inaccurate and may seriously underestimate total water flowage. National hydrometeorological systems should strive to preserve and further develop observational networks in order to improve measurement processes and the quality of resulting data. Greater effort will need to be devoted to estimation of water resources in the Central Asian states. The relatively low level of reliability of data estimates is illustrated by data found in three published documents that are presented in Table 5. Discrepancies exceed expected error parameters for these data. Error variance in estimations can be accounted for in part by differences in interpretation of size of particular regions and area elevation. Variation in the calculation of river flowages primarily results from cyclical fluctuations in water availability, flow variability and errors made in adjusting results of measurements at specific measurement sites on the rivers. General trends in variability of water flowage and changes in the availability of water resources can be gauged by analyzing time series data over long observation periods. Based on available data it can be concluded that the temporal variability of river flowages in Central Asia over the past fifty to seventy years is less than in Kazakhstan, Siberia and the European part of Russia. This is due to the fact that most major rivers flow represents water that results from the melting of permafrost snow and glaciers. This process is more intensive during years that experience high summer temperatures and less intensive during years that experience
72 Climate Change and Terrestrial Carbon Sequestration in Central Asia
Annual River Flow
lower summer temperatures. The latter can guarantee that remaining of snow and ice reserves will persist from year to year. Unlike in these regions, air temperature fluctuations in Central Asia are negligible from year to year. Basins for most large rivers sprawl out for long distances. Thus fluctuations in water availability are very low and many times are less than for the distant tributaries. Table 2 shows that the flow for the Vakhsh basin during high water years is only 1.7 times more than the flow during low water years. Water flowage is 1.8 times less for the Zeravshan basin during low water years. Differences in flowage rates for the Pyandj river basin for high and low water years are probably less than 1.6 times. Until now it has been impossible to estimate river flows during the dry years because of very short periods of observation that resulted from the lack of water flowage. Variations in the volume of temporal flows were not obtained for other river basins, such as the Surkhandarja river, the Fergana river valley, the Arys river, the rivers of the south-western slope of Karatau range, the Chu and Talas rivers, the Issyk-Kul lake region, the Kopetdag river and the Atrek river for similar reasons. Reliable detailed estimates of flow variability are difficult to estimate because of the short duration of observation series and because of variations in the timing of measurement observations at the monitoring stations. Despite that fact that flow formation zones for the different rivers of the region represent a rather limited geographic area, a high level of fluctuation in flowage rates is apparent. This is determined in part by variations in synoptic processes and to a great extent by wind movements in different regions. It is common to record high water levels for rivers with watersheds located at high mean elevations, especially during years characterized by high air temperatures. On the other hand, high water levels are recorded at lower elevations during years characterized by high levels of precipitation. Variations in water flowage are reduced in large river basins, in part by the size of the region affected. On average, expected variations are observed in annual flow fluctuations in the Amudarya and Syrdarya river basins. These are illustrated by differential integral curves that were calculated using the restored data series in from Kerki and Bekabad flow monitoring stations and taking into account the additional flow from the Chirchik-Akhangaran basin (Figure 2). The Bekabad flow monitoring station, which is located in Syrdarya river basin, is found at the point where the river exits the Fergana valley. This location accounts for 68% of the basin flow. Flow from the Chirchik and Akhangaran rivers to this basin represents another 21% of the total flowage. Together they account for about 89% of the entire flow of Syrdarya river basin.
Figure 2. Integral differential curves of the river flow for Amudarya-Kerki town monitoring station (1,), Sydara town – total flow up to Chardara water storage (2,3).
Water resources of the Central Asia under conditions of climate change
73
The differential integral flow curves found in Figure 2 show that only one long period of flow increase was recorded during 1891–1960 in the Amudarya basin. Flowage rates tended to decrease from that period to 1991. However, increases after 1991 may represent the onset of a prolonged period of flow increase against a background short periods of decrease. Similar trends were observed, for example, in 1914, 1920, 1934–1940. Evidently, the flow increase in Syrdarya river basin began about 1891 and continued up to 1973 after which it began to decrease. Periods of the flow decrease against a background of its increase up to 1973 were characterized by somewhat different features. Similar occurrences took place in the Amudarya river basin during the period 1914–1920 and during the period 1924–1944. The flow decrease since 1973 in the Syrdarya river basin has been continuous while periods of increase were observed in the Amudarya river basin after the trend in flow decreases began in 1961. The common water flowage feature for these two basins is a period of extremely reduced flowage followed by a number of high water years. Water flowage was high in both river basins in 1969. The decrease in flowage in the Amudarya river basin lasted for 17 years from 1969 to 1986. The decrease in flowage in the Syrdarya river basin lasted for 15 years from 1969 to 1982. 4
CONCLUSION
Even the availability of a limited measurement observations over a long period of time and of measurements related to the restoration of the conventionally-natural river regimes makes it possible to use statistical analysis methods and to simulate data series as well as to calculate data for the purposes of forecasting. REFERENCES Bolshakov, M. Water resources of the rivers of the Soviet Tien-Shan and methods of their calculation – Frunze, ILIM, 1974. 308 p. Getker, M. Method of the maximum snow reserves calculation in the mountain and glacial regions for the purpose of creation of maps in the Atlas of the World Snow and Ice Resources Materials of Glaciological Studies. Chronicle. Discussions. Moscow, Akademkniga, 1981. No. 40. p. 133–142. Chub, V. 2000. Climate change and its impact on the natural resources potential of the Republic of Uzbekistan. Tashkent, Glavgidromet. 252 p. Climate variability in Central Asia (F. Muminov, ed.), Tashkent, Glavgidromet of Uzbekistan. 1995. 216 p. Denisov Yu., A. Sergeev, and G. Ibragimova. New approach to the elaboration of the method of the long-term forecasting of mountain rivers flow//Proceedings of SANIGMI (Denisov, Ed.). Tashkent, Glavgidromet of Uzbekistan. 1977. Vol. 153(234). p. 3–10. Kim I., and T. Spectorman. 1991. Climate change effect on the water availability in rivers and on precipitation regime in the mountain regions of the Central Asia. p. 54–67 In: Ushakov (ed.). Reports presented at XV International Conference on the Meteorology of the Carpathian region. Kiev Academy of Science, Kupriyanova E., I.Tsigelnaya, M. Ljvovich, and N. Dreyer. 1969. Peculiar features of the water balance in the mountain regions. p. 90–124 In: V. Beltman (ed.). Water balance of USSR and its transformation. Moscow: Nauka. Mamedov, E. and G. Trofimov. 1996. On the matter of the long-period flow fluctuations of the Central Asian rivers. p. 12–16. In: A. Babaev (ed.). Problem of the desert areas development. Ashgabat, Yilim. Resources of the surface water of USSR. 1987. Amudarya River. Ivanov Yu (ed.). Vol. 14, No. 3. Leningrad, Gidrometeoizdat. 576 p. Schults, V. 1965. Rivers of the Central Asia. Leningrad, Gidrometeoizdat. 692 p. Shetinnikov, A. 1993. Change of the water resources in the glaciers of Pamir-Alai mountains during 1957–1980. Materials of glaciological observations. Chronicle. Discussions. Moscow, Akademkniga 76:83–89. Tsarev B. 1986. Monitoring of snow cover in mountain territories. Tashkent, Glavgidromet. 76 p. Water resources of USSR and their use. Leningrad, Gidrometeoizdat, 1987. 302 p. Water resources and water balance of the territory of USSR. Leningrad, Gidrometeoizdat, 1967. 200 p. Voropaev, G. and D. Ratkovich. 1985. Problem of the territorial re-distribution of the water resources – Moscow. Publishing House of USSR Ac. Sci. 504 p.
CHAPTER 5 Climate change and water resource alteration in Central Asia: The case of Uzbekistan
Nazar Hakimov Tashkent State University of Economics, Tashkent, Uzbekistan
Allan Lines The Ohio State University, Columbus, USA
Pirnazar Elmuratov & Rashid Hakimov Tashkent State University of Economics, Tashkent, Uzbekistan
1
INTRODUCTION
Uzbekistan is a landlocked country in Central Asia with a total area of 447,400 km2 . It is bordered on the north by Kazakhstan, on the east by the Kyrgyz Republic and Tajikistan, and on the south by Afghanistan and Turkmenistan. Geopolitically, the country is divided into 12 provinces (viloyats) and the autonomous republic of Karakalpakstan, which is located in the far west of the country near the Aral Sea. The country is divided into three distinct agro-ecological zones: • the desert (Kyzylkum), steppe and semi-arid region – covering 60% of the country and located mainly in the central and western parts of the country; • the fertile valleys that skirt the Amu Darya and Syr Darya rivers, including the Ferghana valley; and • the mountainous areas in the east with peaks at about 4,500 m above sea level (Tien Shan and Gissaro-Alay mountain ranges). 2
CLIMATIC CONDITIONS
The climate of Uzbekistan is very continental and arid. It is noted for an abundance of solar radiation, sparse cloud cover, and limited atmospheric precipitation. All of Uzbekistan is characterized by a cold, unstable winter and a dry, hot summer. Winter climate is governed by dry, cold Arctic and Siberian air masses from the north and tropical air masses from the south. In the summer the territory is influenced by local tropical air. The mountains also have an important effect on climatic conditions. In flat areas of the country, total solar radiation averages from 130 to 160 cal cm−2 annually. The actual duration of solar light is between 2,800 and 3,130 hours depending on the latitude and topography of a given region. In the mountains, the duration of solar light is substantially determined by the proximity of the horizon, slope exposition and cloud cover. The average temperature in the plains region increases from the north to the south: in January from −8◦ C to +3◦ C. Low temperatures can reach −30◦ C in the north and −25◦ C in the south during severe winters. In July, which is the hottest month, the average monthly temperature reaches +32◦ C with an absolute maximum of +50◦ C in the Surkhandarya region. Mean annual precipitation in the plains ranges from 100–150 mm in the desert to 200–400 mm in the foothills. Approximately 60–70% of annual precipitation occurs during the winter and spring 75
76 Climate Change and Terrestrial Carbon Sequestration in Central Asia months. Autumn precipitation is much less and summer precipitation is essentially insignificant. Droughts in desert areas last 6–7 months and typically occur from May until November. In the foothill areas the drought period is reduced to 4–5 months. For regions in close proximity to foothills, precipitation levels increase to more than 800–900 mm. Distribution of precipitation in the mountains depends on the altitude, relief forms, and slope exposure. Moisture deficits in the southern part of Uzbekistan are greatest from April to September. The largest oasis area of this region has an ancient irrigated agricultural system and is characterized by a special microclimate. Available water resources in Uzbekistan are formed from renewed surface and underground water of natural origin and from return water of anthropogenic origin. 3
WATER RESOURCES
Uzbekistan is the major water consumer in the Aral Sea Basin. In accordance with interstate agreements, on average 43–52 km3 of water per year is allotted for use by Uzbekistan from its boundary rivers.About 90% of river flow is formed beyond Uzbekistan’s boundaries (UNFCCC, 1999). Water resources are subdivided into two categories: national and trans-boundary. National water resources include flows of the local rivers and underground and return water formed within a given country. Trans-boundary water resources include rivers, aquifers, and return water that is common to the territory of two or more countries. It also includes water deposits that are connected hydraulically with trans-boundary rivers, or with artificial, anthropogenic, or reservoir resources. The natural mean annual flow of the rivers for periods during which it has been gauged is 123 m3 yr−1 . This flow is for territories that include 81.5 km3 in the Amu-Darya basin for the period 1932 to 2003, and 41.6 km3 in the Syr-Darya basin for the period 1926 to 2003. At present, Uzbekistan uses about 42 km3 of trans-boundary river flow, 34 km3 of which is from the Amu Darya and Syr-Darya basins. Surface flow formed in Uzbekistan makes up 11.5 km3 . The flow of the rivers is characterized by considerable annual and long-term irregularity. In low water years which occur about 90% of the time, the flow decreases by an average of 23 km3 , compared to an average water year. Groups of high water years reoccur at every 6- to 10 year intervals and their duration lasts from 2 to 3 years. Low water periods occur at 4- to 7 year intervals and can last up to 6 years. The primary concern of the water resource management strategy is to ensure the availability of water resources. It takes into account not only natural water flows, but also their regulation through reservoirs as well as the use of return flow and underground water. Available water resources in the Aral Sea Basin include the actual long-term regulated flow of Syr-Darya water and the seasonal flow of Amu-Darya water. Total amount available is about 121.69 km3 yr−1 , and has a 90% probability of availability. The Rogun reservoir on the Vakhsh River was constructed to facilitate the long-term regulation of the flow of Amu-Darya and to make other technical interventions possible in order to obtain up to 133.6 km3 of available water resources in The Amu-Darya basin. A similar magnitude of availability of water can occur for the Syr-Darya basin. Of this total resource, the share of Uzbekistan’s is 72.4 km3 . It includes 61.1 km3 for irrigation purposes and 11.3 km3 for non-irrigation uses including communal, industrial, agricultural water supply and other non-irrigation uses. These water resources also feed the Aral Seaside region and the Aral Sea. According to figures that are part of the water schemes, the Aral Seaside should receive 3.25 km3 yr−1 from the Syr-Darya River and 3.2 km3 yr−1 from The Amu-Darya River. These rivers should also provide 3.2 km3 yr−1 of water for sanitary drawdown; 1 km3 of water for fishery drawdown and 1 km3 of water for delta flooding. Thus, the planned supply of water from these two rivers to the Aral Seaside area should be 8.4 km3 . During the low water years, these parameters are reduced by up to 54.2 km3 . The volume of prescribed flow established by the schemes is also decreased by that much. This deficiency is to be corrected by projected future water management conditions.
Climate change and water resource alteration in Central Asia
77
Under the current regime of long-term flow regulation of the Syr-Darya River and seasonal flow regulation of the Amu-Darya River, these sources represent up to 11.5 km3 yr−1 (18.4%) of the total water consumption and 457 m3 of yearly per capita consumption in Uzbekistan. River surface flows are undergoing significant changes due to anthropogenic impacts. Increases in water intake from the rivers into irrigation canals and subsequent water losses in canals cause a quantitative flow reduction. Further, discharge of collector drainage water worsens its natural mode and quality. Total reserves of underground waters in Uzbekistan sum to 18.9 km3 , including 7.6 km3 of mineralized water with less than 1 gl−1 , and 7.9 km3 of water with 1–3 gl−1 of salinity. Overall, the water needs of consumers in Uzbekistan are completely met during years of average and increased water probability. Crisis situations arise in low water years, especially for middle and downstream regions of the Syr-Darya and the Amu-Darya water basins. The creation of the Toktogul hydro system for electrical power generation and the regulated use of the Syr-Darya flow for this purpose have aggravated the shortage of water supply for the Syr-Darya and Djizzak Oblasts during the growing season. Irrigation development has resulted in the formation of artificial lakes in Uzbekistan. They serve as sinks to collect drainage water. The Sinchankul, Dengozkul and Solyenoe Lakes were formed mid-stream in the Kashkadarya and Bukhara Oblasts of the Amu-Darya river basin. Downstream at the Amu-Darya delta, there is a whole system of lakes that was previously fed by Amu-Darya flow. Some of these lakes have subsequently begun to be used as sinks to collect drainage flow. Among these is Lake Sudochye which is well known for the large and diversified bird population that it helps to sustain. In the Syr-Darya river basin, the Arnasayi system of lakes acts as a sink to collect drainage water from irrigated areas. It was formed in the Syr-Darya and Djizzak Oblasts. Catastrophic winter draw downs from the Chardarya reservoir and its adjoining lake system located in Kazakhstan in previous years resulted in water flow volumes of 35 km3 where, the water surface is about 2,200 km2 . The Arnasai system of lakes has turned into a profound natural and economic entity that influences four Oblasts of Uzbekistan, namely, Tashkent, Syr-Darya, Djizak and Navoi. Change in use of water during the last decade not only created the downstream summer water shortages, but also winter water excesses. These winter excesses, however, do not help to solve the Aral Sea problem. In order to prevent downstream flooding the excess water was diverted into an isolated Arnaysay depression, in which several independent lakes were created. These lakes cover a total of 2000 km2 area and are responsible for raising groundwater tables. As a result, newly formed wide-spread swamps now exist, covering over 20,000 km2 in area. Uzbekistan presently has 52 reservoirs with total volume of more than 19.3 km3 . Twenty-one of these reservoirs in the Syr-Darya basin have a total volume of 5 km3 and 31 reservoirs in the Amu-Darya basin have a total volume of more than 14.3 km3 . There are two large reservoirs in the Syr-Darya river basin, namely the Charvak and Andijan reservoirs. The Charvak reservoir is located on the river Chirchik near Tashkent and holds a total volume about 1.99 km3 . The Andijan reservoir is located on the river Karadarya in Andijan and has a capacity of 1.9 km3 . Oblasts use these reservoirs for many purposes, including irrigation, flood control and electric power generation. The Tuyamuyun downstream section of the Amu-Darya river basin has the largest multipurpose reservoir which contains 7.8 km3 of water. This reservoir consists of four separate parts located in Turkmenistan and Uzbekistan. However, the parts located in Uzbekistan are responsible for management of the entire reservoir. The Amu-Darya downstream area, especially in the northern Aral seaside of the Republic of Karakalpakstan, has numerous serious problems with its communal and potable water supply. These problems initially resulted from the drying of the Aral Sea and have subsequently been aggravated by substantial increases in grounded water salinity. The maximum potential of hydroelectric power generation on the rivers of Uzbekistan is estimated between 85,000 and 90,000 GWt yr−1 . Of this amount, 15,000 GWt yr−1 is economically suitable for development. Actual capacity, based on existing infrastructure, can produce 1,739.0 GWt yr−1 . In 2000, the production of electricity by hydroelectric power stations was 4.9 billion KWt hr−1 , which was less than 20% of the average annual production for previous
78 Climate Change and Terrestrial Carbon Sequestration in Central Asia years. This reduced production can be explained in part by the critical low waters in the Aral Sea Basin during 2004. Total water intake in 2000 was 54.2 km3 , of which 47.8 km3 of water intake was from surface water and 6.4 km3 of underground water return flow. Irrigation intake from surface water and underground water amounted to 44.1 km3 and 3.3 km3 , respectively. Uzbekistan utilizes over 90% of its available water resources for irrigation purposes. Water resources of the river basin of the Aral Sea belong to Uzbekistan and other nations in the region. They are fully regulated and distributed among water consumer countries, of which Uzbekistan is a primary benefactor. However, Uzbekistan is currently experiencing a large deficit in water resources, the most crucial problem being the Aral Sea crisis. The level of anthropogenic load on water resources is very high in all parts of Uzbekistan and threatens the production of irrigated crops. There is a widespread problem of inappropriate drainage practices associated with poor irrigation. The degradation of cultivated land is primarily a consequence of increased salinization and susceptibility to all types of soil erosion. Natural pastures are being reduced in size and are progressively being degraded. Biological diversity in crops is also being reduced and the entire ecosystems in the Amu-Darya delta are either being destroyed or are disappearing. Approximately 50% of the country’s agricultural land area is prone to degradation of one type or another. 4
CLIMATE CHANGE
Extremes of weather conditions are typical of Uzbekistan’s climate, and adversely impact crop yields. Frosts in late spring and early fall, high temperatures and frequent and enduring droughts in summer are of common occurrence. Additionally, increase in population growth results in increased demand for food production. All of these conditions increase the vulnerability of Uzbekistan to climate change. These changes necessitate development and implementation of adaptive measures to address climate change, especially in less favored ecological regions. These measures can substantially reduce the negative consequences of droughts and exert positive socio-economic influences throughout the entire nation. Examples of such measures include current attempts to address the consequences of the Aral Sea crisis (Coop. Prog. on Water and Climate, 2004). In the late 1950s, the Aral Sea was the Earth’s fourth-largest inland body of water with respect to its surface area. In 1960, the mean level of the Aral Sea was 53.4 m, its surface area was 66,000 km2 , and its volume at about 1,090 km3 . There was a flourishing sea fishery industry, based on the exploitation of a variety of commercially valuable species. During the last three decades of the 20th century, the Aral Sea region became a major world-class ecological and socio-economic problem, and became the sixth-largest inland water body (UNU, 1998; Chub et al., 1999). The problem with focus on assessments of the consequences of climate change is that it is very difficult to distinguish the impact among nations. This requires the investigator to choose among scenarios of greenhouse gas emissions, to determine the time intervals between evaluations, to create regional climatic scenarios, and to choose among distinct models and methods in order to assess actual conditions and temporal changes. According to the majority of climatic scenarios, Uzbekistan is likely to have as much access to water in the future as it has during the first decade of the 21st century. However, under extremely adverse scenarios, there may be a considerable decline in water drainage which would undoubtedly have a further negative impact on the private sector agriculture in Uzbekistan. In the foreseeable future, the price of water will continue to increase. Water shortages will probably become more frequent; thus events such as the failure of the Amu-Darya to flow to the Aral Sea in 2000 and 2001 are likely to occur with increasing frequency (Chub et al., 1999). Even if water supplies should remain the same, excessive use of water flow from the major rivers is likely to continue to occur since the number of people who currently reside in the Amu-Darya and Syr-Darya river basins will increase from 40 million in 2006 to a projected 55–60 million in the coming decades.
Climate change and water resource alteration in Central Asia 5
79
UZBEKISTAN AGRICULTURE
The development strategy for the agricultural sector is designed to ensure food and environmental security, while increasing the efficiency and export potential of domestic production (Djalalov and Chandra, 2006). According to the macroeconomic forecast, the agrarian sector will maintain its leading role in the economy. To meet the strategic goals by 2010, annual growth in agricultural output must be at least 5–6% (UNFCCC, 1999). As shown in Graph 1, agriculture represented 26.8% of the GDP of Uzbekistan in 2004. Over the last few years, this sector of the economy has experienced continued growth largely due to a conservative approach to use of water resource. Over the same period animal production has also experienced a growth tendency. The total amount of land used for all types of agricultural production in 2004 was 7,242,000 hectares which represented a slight decrease from 2003. This land use pattern included an increase of 62,700 hectares to produce cotton the previous year and an increase of 69,000 hectares to produce other industrial crops (See Table 1). Land used to produce cereals decreased by 125,000 hectares and that used to produce other grains also decreased by 37,000 hectares. Land used to produce rice decreased by almost half from 119,000 hectares to 65,000 hectares. Land under feed crop production decreased by 35,000 hectares. Production of food crops remained stable or decreased slightly during that period. The decline in proportion of total area under collective farm production and the increase in the proportion under modern farm production and “peasant” (“dekhkan”) farm production continued in 2004. Land under collective farm production in 2004 was 2,970,000 hectares. This signified a decline of 23% from tht under collective farm production in 2003. In contrast, land under modern farm production increased to 3,400,000 hectares, or an increase of 23% over that under modern farm production in 2003. Land area under modern farm cultivation was 36.3% of the total cultivated area. The land area under cultivation on peasant farms increased slightly from 850,000 hectares to 868,000 hectares from 2003 to 2004 (Mumunov and Abdulleav, 1997; Ryan et al., 2004). These major shifts were mainly due to favorable weather conditions and to a number of other factors including intensified restructuring of unprofitable collective farms into modern farms, the
Share of Gross Production in GDP Growth Rates of Agricultural Production Growth Rates of Crop Production 40
Growth Rates of Livestock Farming Share of Investments into Agriculture in Total Volume of Investments 30.4
30.6
30
28.6
Percent
26.8
20 13.2 11.3
10.1 5.7 3.2
3.13.0
6.5 4.6
4.5 1.9
7.3
6.1
10.1 6.8
5.8 3.4
4.3
3.4
2.0
0 2000
2001
2002
2003
2004
Year
Figure 1. Main macroeconomic indicators of development of agriculture (Source: State Statistics Committee of Uzbekistan, 2004).
80 Climate Change and Terrestrial Carbon Sequestration in Central Asia Table 1.
Structural changes of areas under crop by form of management for 2003–2004. 2003
2004
Commodity
AFC1
CF2
Cereals Grain Rice Maize for seed Industrial crops Cotton Potatoes, melons and gourds Potatoes Vegetables Melons Fruits and berries Grapes Feed crops Total area under production
thousand hectares 1790 912 1506 766 119 67 33 7 1444 847 1393 820 236 47 48 3 145 34 40 8 200 108 117 76 315 160 7386 3855
MF3
PF4
AFC1
CF2
MF3
PF4
680 581 47 7 590 573 36 2 17 17 27 10 94 2681
198 159 5 19 7 – 153 43 94 15 65 31 61 850
1665 1469 65 33 1515 1454 226 51 137 34 198 115 280 7242
661 593 22 5 690 662 31 3 21 5 97 67 113 2970
805 715 40 8 815 792 37 3 19 14 37 16 103 3404
199 161 3 20 10 – 158 45 97 15 64 32 64 868
AFC1 : All Farm Categories; CF2 : Collective Farms; MF3 : Modern Farms; PF4 : Peasant Farms. Source: State Statistics Committee of Uzbekistan, 2004. Table 2.
Gross harvests of agricultural products in farms of all categories. 2003
2004
Commodity
AFC1
CF2
Cotton Grain Wheat Rice Potatoes Vegetables Melons Fruits and berries Grapes
thousand tons 2802 1741 6318 3075 5624 2805 349 162 833 49 3300 626 585 77 764 231 400 160
MF3
PF4
AFC1
CF2
MF3
PF4
1061 2264 2030 145 33 353 177 56 22
– 979 789 42 751 2321 331 477 218
3535 6016 5501 186 891 3314 571 844 576
1707 2211 2085 54 45 335 46 215 264
1828 2781 2584 105 43 384 174 109 56
– 1024 832 27 803 2575 351 520 256
AFC1 : All Farm Categories; CF2 : Collective Farms; MF3 : Modern Farms; PF4 : Peasant Farms. Source: Estimates of State Statistics Committee of Uzbekistan., 2004.
implementation of new credit mechanisms for farmers, timely inputs of technology, an adequate supply of mineral fertilizers, improvement of contractual relationships and increased modernization of water resource utilization. The relationship between crop and animal production was substantially the same in 2003 and 2004. Crop production amounted to 53.7% of total production in 2004 as compared to 51.6% in 2003, while that of livestock farming amounted to 46.3% of total production in 2003 compared to 48.4% in 2004. As shown in Table 2, cotton harvest in 2004 was more than 3.5 million tons due to the increase in area under cultivation, timely agro-technical inputs, repairs of critical irrigation systems, an increase in raw cotton production output on farms and favorable weather conditions. In contrast, there was a decline in the production of grains, rice, melons and gourds in 2004. In comparison with 2003, wheat production declined by 123,000 t in 2004 and rice production declined by 163,000 t over the same time period. Melon production also declined by 14,000 t over
Climate change and water resource alteration in Central Asia Table 3.
81
Livestock and poultry population in all categories of farms. 2003
2004
Commodity
AFC1
CF2
Cattle Sheep and goats Pigs Poultry
thousand heads 5878 284 9927 2460 88 31 17,674 5630
MF3
PF4
AFC1
CF2
MF3
PF4
291 309 12 770
5303 7158 45 11,274
6231 10,558 82 18,725
228 2449 20 5139
309 419 14 766
5694 7690 48 12,820
AFC1 : All Farm Categories; CF2 : Collective Farms; MF3 : Modern Farms; PF4 : Peasant Farms. Source: Estimates of State Statistics Committee of Uzbekistan, 2004.
the same period. These production declines were due to the decrease in areas under cultivation of these crops in 2004 as is evidenced by data in Table 1. In contrast to grain crops, livestock production increased from 2003 to 2004. The number of head of cattle, sheep and goats, and poultry continued to grow. Water-supply for livestock farms and peasant farms also improved. Consequently, there was 6.8% growth rate in livestock production in all types of farms. As is indicated in Table 3 comparatively high growth rates were observed for sheep and goats (6.4%) and poultry (5.9%).
6
CHANGES IN TYPES OF FARMS
Implemented institutional and structural reforms helped farms that were progressively managed to succeed, and led to a decrease in the number of collective farms over this period. Over time 326 collective farms have been reorganized, thus allowing for the establishment of 15,118 modern farms which occupy 769.1 thousand hectares. Among the newly established farms, 10,667 of them, representing 469.9 thousand hectares under cultivation, are specializing in the production of cotton and grains. The restructuring of unprofitable collective farms into modern farms continued during 2004. The share of collective farms in the total agricultural production decreased from 22.2% in 2003 to 19.9% in 2004. The number of peasant farms in agricultural production remained stable and their cumulative output also remained stable. However, their share in the total gross production decreased, which was primarily due to the increase in the number of farms. Economic reforms in agriculture also caused a number of problems. For example, the need for further improvement of the mechanisms for establishing farms became more evident, as was the need for contract discipline, reform of banking-finance institutes, and the creation of service related infrastructure for agricultural producers in the rural areas. Economic reforms in the agrarian sector intensified further in 2005. The accelerated development of modern farms remains a priority task. The anticipated liquidation of collective farms will progressively lead to the establishment of about 20 thousand new modern farms.
7
SUMMARY AND CONCLUSIONS
A comprehensive review of salient water and climate issues in Central Asia, focusing on Uzbekistan, is found in this chapter. The discussion included consideration of Uzbekistan’s agricultural sector since it directly influences water and climate issues in neighboring countries in Central Asia as well as Uzbekistan. Central Asia has a land area of around 3.9 million square kilometers and a population
82 Climate Change and Terrestrial Carbon Sequestration in Central Asia of around 54 million. About 690,000 square kilometers belong to the so called Aral Sea Basin. About 80% of the population of Central Asia depends on the water from the Amu Darya and Syr Darya rivers. Sufficient water exists in Central Asia to meet the needs of the population. However, water resources are used inefficiently because of rapid deterioration of irrigation and sanitation infrastructure and poor administrative allocation systems that do not allocate water equitably and efficiently. Furthermore, people perceive water as a free good; hence the increasing scarcity for an increasing number of people. Indiscriminate use of water for non agricultural purposes, inefficient irrigation practices, excessive use of chemicals for growing cotton and rice crops and lack of adequate drainage have caused extensive water logging, increased salinity and polluted the ground water and drainage inflow to the rivers and the Aral Sea. Water pollution from urban and industrial wastes has further aggravated pollution problems and climate changes. Data presented in this chapter lead to a single principal conclusion, namely, that all critical issues concerned with water and climate in Central Asia, have the same cause. These problems are related to inappropriate use of water resources and the inability of government organizations to rectify the situation. The Aral Sea crisis, which is one of the most significant ecological disasters in the world, was the result of inappropriate agricultural policy during the Soviet era in Central Asia and it has been exacerbated by the breakdown of the Soviet Union. About 35 million people, including a considerable part of the Uzbekistan’s population, is now impacted. Major efforts have been made by Central Asian governments and international organizations to develop instruments and ways to improve the water use in the region. Despite these efforts, adverse agricultural policies and wasteful irrigation and drainage management practices in some of the counties in Central Asia are at the principal cause of the region’s water problems and continue to result in substantial losses in agricultural productivity (Central Asia Human Development Report, 2005). If all countries in the region were to pursue better national water management policies in a coordinated and mutually reinforcing manner, it would lead to major economic and ecological benefits. A more efficient use of water resources would help reduce regional tensions about how to share limited natural resources. Ultimately, the countries in the region will need to develop a regional framework for management of these resources. REFERENCES Central Asia Human Development Report. 2005. Bringing down barriers: Regional cooperation for human development and human security. Chub, V.E. and T.A. Ososkova. 1999. Climatic changes and surface water resources of the Aral Sea Basin. Bulletin #3, Information on fulfillment of commitments to the UNFCCC by Uzbekistan., Tashkent, Glavgidromet RUz. Co-operative program on water and climate, 2004. Coping with climate change: the Syr Darya basin in Central Asia. Working paper. Govt. of Uzbekistan, TashkentCo-operative program on water and climate. Djalalov, S. and B.S. Chandra. 2006. Policy Reforms and Agriculture Development in Central Asia. Muminov F.A. and H.M. Abdullaev. 1997. Agricultural-and-climatic resources of the Republic of Uzbekistan. Tashkent: Glavgidromet RUz. Ryan, J., P. Vlek. P., and R. Paroda. 2004. Agriculture in Central Asia: Research for Development. State Statistics Committee of Uzbekistan 2004. Govt. of Uzbekistan, Tasshkent, Uzbekistan. UNFCCC. 1999. Initial Communication under the UNFCCC is approved by the National Commission of the Republic of Uzbekistan on Climate Change. Main Administration of Hydrometeorology at the Cabinet of Ministers of the Republic of Uzbekistan. UNU. 1998. Central Eurasian water crisis: Caspian, Aral, and Dead Seas. I. Kobori and M.H. Glantz (eds.), The United Nations University.
CHAPTER 6 Problems and management of the efficient use of soil-water resources in Central Asia with specific reference to Uzbekistan
Rasulmant Khusanov & Muhammad Kosimov Research Institute of Market Reforms, Tashkent, Uzbekistan
1
INTRODUCTION
Cultivated land in Central Asia is concentrated in the region of the Aral Sea. Extensive plains and the adjacent foothills are the regions suitable for agricultural production. Moreover, the majority of the land is suitable for the production of a wide range of valuable agricultural crops, including corn, cotton, rice, maize, soybean, vegetables, lucerne, fruits and others. A limited amount of annual precipitation and the severe drought during the warmest period (approximately 2 months in the north corn belt region, and 3–4 months in the southern regions) make irrigation essential to crop production. Because of the limited precipitation, cultivated agricultural land in Central Asia is mainly located along the flood plains of large and small rivers, in foothills, and in mountainous and intermountain valleys (i.e., in regions with sufficient water supply for irrigation). However, the area of irrigated lands is increasing due to broadening of river flows and the construction of artificial water reservoirs and canals. In the limited parts of the mountainous regions, including marginal rainfed areas with annual precipitation of 280 to 350 mm (450–750 mm at sea level) and regions with annual precipitation of 350 to 400 mm or more (above 600 m at sea level), the land is suitable for the cultivation of corn (Zea mays). The corn crop has time to utilize winter-spring moisture during its development stages and can be harvested during the dry season. The absence of the precipitation during the warmest period of the year excludes the possibility of continuous cropping because of severe drought. Therefore, irrigation is the basis of a successful agriculture. Irrigated land in Uzbekistan occupies approximately 9% of its total land area, yet produces more than 95% of the total production. Agricultural lands comprise 26.7 million hectares (Mha), most of which is pastures located in the semi-desert and desert zones and characterized by a low productivity. Therefore, an efficient management of soil-water resource is crucial to the development of agriculture. Meanwhile, decreasing productivity of the irrigated lands and decline in quality of irrigation water are major threats to agricultural sustainability. 2 2.1
FACTORS CONTRIBUTING TO DECLINE IN FERTILITY Salinization
The irrigated cropland area in Uzbekistan was 3.83 Mha in 1991 and 3.73 Mha in 2001. The reduction in irrigated cultivated land area is due to new constructions, specifically for infra-structure such as roads, electric/power lines etc., in accord with increase in the population. Thus, each ha of irrigated cultivated land must produce more food, raw materials for industry and other products. Research data show that the productivity of irrigated cultivated land is progressively declining. Over the 10 years between 1991 and 2001, soil grade (ball-classification) in Uzbekistan decreased 83
84 Climate Change and Terrestrial Carbon Sequestration in Central Asia by 3 points due to increase in soil salinity. The land area affected by salinity increased to 16.3% of the total area comprising slightly salinized area of 8.4%, moderately salinized area of 2.1%, and severely salinized area of 5.8%. The soil area effected in 2002 by salinization or salt affected soils included 35.4% of slightly salinized, 17.9% of moderately salinized, and 11.2% of severely salinized soils. Salinization (in the Republic of Karakalpakstan) is more severe in the vicinity of Aral Sea than in other regions of Uzbekistan. Between 1997 and 2002, the salinized area in the Republic of Karakalpakstan increased to 6.0% for the moderate category, 3.3% for the severe category and 17.4% for the slight category. The situation in the Republic of Karakalpakstan is the same as that in Uzbekistan with the additional problem of decline in the quality of irrigation water. Since shirkats, farmers, and dehkans reside in the higher part of Amudarya River and discharge the brackish collector waste water into the rivers, salinity of the river water has increased to 1.2–1.5 mg/l in vicinity of the Aral Sea. The decline in investments in restorative projects is partly attributed to increase in land area prone to salnization in Uzbekistan. Individual farmers rarely invest in improving the irrigation system. Nonetheless, 30–35% of the collector drainage network must be cleaned on an annual basis. 2.2
Inappropriate irrigation technology
One of the problems of the present irrigation technology is the excessive water use, and the difficulty of regulating the water supply which depends on the crop water requirement and on the maintenance of an optimum level of soil moisture in the root zone. Research data shows that for the last 40 years water consumption of 13,700 m3 ha−1 or 1.37 m ha−1 . More specifically, the problem of excessive water use is in the Horezm region and in the Republic of Karakalpakstan, where water consumption ranges from 20,000–24,000 m3 ha−1 (2.0–2.4 m/crop). Consumptive water use for 1 centner (1 quintal or 100 kg) of raw cotton ranges from 350 to 900 m3 . This level of water use amounts to 8,000–9,000 m3 , for 25–27 centners ha−1 . With a furrow irrigation system, 1 centner of raw cotton requires about 150–450 m3 of water. Thus, the consumptive water use is 2 to 3 times the actual need. It is the excessive irrigation which leads to over-consumption. The average volume of water used ranges 54 to 58 km3 per annum, overflow_in the sources of the irrigation is about 1 km3 , use other than in irrigated lands amounts to 7 km3 , and total overflow amounts to 18 km3 per annum. Consequently, actual use for irrigation does not exceed 40 km3 . Consequently, the water table is rising, and is causing poor drainage and anaerobiosis. Excessive use of water also leads to leaching or runoff of plant nutrients, reduction in soil organic matter content, and depletion of soil fertility. The research conducted at the Uzbek Institute of Cotton show that 50 to 60 t ha−1 of soil is washed off during a single growing season due to furrow irrigation. The eroded soil contains as much as 1 t of N, 140 to 150 kg of P, 150–160 kg of K ha−1 . In addition, there is also a severe loss of micronutrients which are not being replenished. In severely eroded soils, agricultural production is 30–80% lower than in uneroded soil, even with the application of chemical fertilizers. Therefore, introduction of intensive plant-production technology without soil protection is not sustainable. Without adoption of conservation – effective measures, intensive agricultural, technologies involving in discriminate use of chemicals, are serious threat to environmental pollution. Such adverse consequences of intensive technology in agriculture are connected not only to accelerated soil erosion but also to an inappropriate technical infrastructure. In other words, intensive technologies are adopted without the provision of necessary supporting technical facilities. Therefore, inappropriate irrigation technologies lead to a reduction in soil productivity and to an inefficient consumption of irrigation water. It also increases financial and labor resource costs for the delivery of irrigation water. It is thus necessary to construct multiple water reservoirs along with improving water delivery system during the vegetative periods to enhance soil fertility and to improve soil organic matter (SOM) content. The snowmelt runoff originating from mountains erodes a range of microelements and also preferentially transports SOM. However, most of the sediments are deposited in water reservoirs and do not reach the agricultural fields. Therefore,
Problems and management of the efficient use of soil-water resources in Central Asia
85
Table 1. The contents of humus, phosphorus, nitrogen and potassium in soil of a cooperative farm “Dustlik” in the Tashkent region (the springtime before sowing of the cotton in 2002) (Annual Scientific Report, 2002). Availabe nutrients (mg kg−1 ) Soil and zone of the selection R.3 Irrigated meadow soil R.4 Irrigated meadow soil
Depth (cm)
Humus (%)
NO3 –N
P2 O 5
K2 O
0–25 26–54 54–100 0–30 30–50 50–79 79–100
1.71 1.22 0.89 1.89 1.28 0.73 0.62
76.5 67.7 60.0 63.3 72.4 70.5 –
25.73 6.79 16.40 34.79 23.36 21.60 –
175 100 100 200 170 100 –
carbon in SOM is settled in the water reservoirs rather than in the fields. Thus, SOM and carbon pool in agricultural fields is progressively declining. Such a process repeated annually and systematically causes a drastic reduction in soil productivity.
2.3
Negative balance of nutrients and enriching soil with nourishing elements
Soil management research has been conducted under USDA funded project “Problems of effective use of land and water resources in conditions of market economy (coordinator of the Project was Dr. R. Khusanov from 2001–2003)” on the cooperative farm “Dustlik” located in the Tashkent region. The soil of the cooperative farm is meadow, and humus contents in the upper horizon during the springtime before sowing ranges from 1.71 to 1.89% with a gradual decrease in the sub-soil horizons (Table 1). Plant available concentrations of nitrogen, phosphorus, potassium are evenly distributed in the soil profile (Table 1), with the exclusion of P2 O5 , which declines to 6.79 mg kg−1 in the 26–54 cm depth in the R3 soil. This decline in P2 O5 concentration is attributed to an uneven application of phosphatic fertilizers with the autumn plowing. Research data shows that soil is depleted of its nitrate and phosphate contents, but the concentration of soluble potassium ranges from 100 to 210 mg/kg. The concentration of NO3 –N is somewhat higher in spring than in autumn (Table 2), probably because of strong uptake of nitrogen by cotton in the early phase (initial growth and bearing stages) of development. The data in Table 2 also shows a drastic reduction in the concentration of available forms of NPK at the end of the vegetative period, particularly that of NO3 –N, which is drastically reduced. Nutrient concentration of the cultivated soil is compared with that of the irrigated meadow soil. The humus contents in upper horizon range from 1.50 to 1.89%, with reduction to 1.32% at the end of the vegetative period. There is a progressive decline in the concentration of the nitrogen, phosphorus and potassium in the soil during the crop cycle (Figure 1). The analyses of available nutrients show that uptake of nutrients by crop exceeded the rate of application of NPK fertilizers for the last three years. Additionally, the rate of application of potassium fertilizer declined over the last two years (Table 3). Decline in humus and nutrient concentration in soil is attributed to the lack of adoption of recommended agricultural practices (RAPs). Continuous and longterm cultivation of cotton, as well as cotton-grain crop rotation, leads to depletion of soil fertility, reduction in humus pools, and decline in physical properties (e.g., increase in soil compaction). Lack of manure application, and of RAPs also lead to reduction in the humus contents. Thus, a strong imbalance between nutrient uptake and input leads to decline in soil fertility. Consequently, there has been a strong decline in production of raw cotton, and the supply of cotton has severely lagged behind the demand. In conclusion, continuous cultivation and the rate of input of fertilizers have not kept pace with the
86 Climate Change and Terrestrial Carbon Sequestration in Central Asia Table 2. The contents of humus, phosphorus, nitrogen and potassium in soil of a cooperative farm “Dustlik” in the Tashkent region during the vegetation period of 2002 (Annual Scientific Report, 2002). Availabe nutrients (mg kg−1 ) Soil and zone of the selection
Depth (cm)
Humus (%)
NO3 –N
P 2 O5
K2 O
0–25 26–54 54–100 0–30 30–50 50–79 70–100
1.71 1.22 0.89 1.89 1.28 0.73 0.62
76.5 67.7 60.0 63.3 72.4 70.5 –
25.73 6.79 16.40 34.79 23.36 21.60 –
175 100 100 200 170 100 –
0–25 26–54 54–100 0–30 30–50 50–79 79–100
1.50 1.32 0.72 1.61 1.30 0.70 0.60
45.1 38.5 32.0 31.5 13.0 17.1 –
12.1 11.7 8.9 10.7 13.0 7.8 –
170 100 120 210 151 100 –
At the end of the vegetative period P.3. Irrigated meadow soil 0–25 26–54 54–100 P.4. Irrigated meadow soil 0–30 30–50 50–79 79–100
1.32 1.08 0.79 1.45 1.19 0.77 0.71
0.085 0.068 0.061 Trace
22.7 17.3 7.4 22.9 18.1 9.5 7.3
150 100 100 210 150 100 –
Before sowing of cotton P.3. Irrigated meadow soil P.4. Irrigated meadow soil
The flowering stage P.3. Irrigated meadow soil P.4. Irrigated meadow soil
Figure 1.
Temporal changes in nutrient concentrations.
nutrient uptake by cotton-based rotations. The imbalance has caused a decline in soil fertility and a reduction in the cotton production (Figure 2). A similar experiment was conducted in the cooperative farm “Pakhtakor” in the Sirdarya region. The objective of this study was to assess the effects of different periods and rates of the application
Problems and management of the efficient use of soil-water resources in Central Asia
87
Table 3. Indicators of the actual application and uptake of NPK per hectare of cotton production in cooperative farm “Dustlik” Annual Scientific Report, 2002. 2000 Indicators Actual application (kg) Actual uptake (kg) Uptake as % of application Productivity (centares haha−1 )
N
2001 P
K
N
2002 P
K
N
P
K
46.4
20.5
43.2
120.0
50.1
–
104.4
46.0
–
62.8
20.7
49.6
130.0
53.0
–
117.0
55.0
–
135.3
100.9
114.8
108.0
105.8
–
112.0
119.5
–
15.7
26.2
23.4
Figure 2. Factors of the actual application and uptake of NPK for cotton cultion in cooperative farm “Pakhtakor.” (Annual Scientific Report, 2002).
of the mineral fertilizers on irrigated meadow soil under cotton production. The data show that the highest concentration of nutrient elements existed in spring before sowing and prior to bearing and flowering growth stages. Even during these phases, concentration of NO3 , P2 O5 and K2 O in the upper (0–25 cm.) soil layer were not very high (Table 4). Furthermore, nutrient concentrations declined strongly during the vegetative and flowering phases due to rapid uptake of nutrients by plants. The data show that concentration of available (soluble) nutrients drastically declined at the end of the growing period. The apparent increase in potassium concentration in the upper soil horizon is attributed to the local application of potassium fertilizers. Comparing the specific elemental concentration during the spring with that after the vegetative period shows that concentrations of humus and total nitrogen changed towards the end of the vegetative growth. Such changes in the concentrations of the available/soluble forms of these elements may be attributed to the application of mineral fertilizer during the vegetation period of the cotton (Figure 3). Observations on uptake and application of nutrient elements were made over three years. The data on uptake of nutrient elements show that crop removal of NPK for the last three years systematically exceeded the amount applied as mineral fertilizers. Only in 2002 was the rate of application of phosphatic fertilizers equal to the uptake (Table 5).
88 Climate Change and Terrestrial Carbon Sequestration in Central Asia Table 4. The contents of humus, nitrogen, phosphorus, and potassium in the soil of cooperative farm “Pakhtakor” in 2002 (Annual Scientific Report, 2002). Amount (%)
Before sowing cotton P.1. Irrigated meadow soil (K-39)
P.2. Irrigated meadow soil (K-12)
At flowering stage P.1. (K-39) P.2. (K-12)
Depth (cm)
Humus (%)
N
0–25 25–45 45–75 75–115
1.72 1.58 0.97 0.75
0–26 26–45 45–78 78–110
2.01 1.65 1.01 0.51
0–25 25–45 45–80 0–26 26–45 45–75
1.55 1.22 0.87 1.72 1.49 0.75
At the end of vegetative period 110 P.1. (K-39) 0–25 1.41 25–45 1.24 45–75 0.53 P.2. (K-12)
0–26 26–45 45–75
1.47 1.26 0.57
P
Available nutrients (mg kg−1 ) K
NO3 –N
P 2 O5
K2 O
0.126 0.112 0.088 0.061
89.1 70.9 55.9 –
9.47 18.93 5.33 6.10
200 150 75 50
0.130 0.101 0.097 0.048
81.9 71.3 59.2 –
16.27 12.13 4.00 6.80
175 125 50 100
57.5 49.0 45.7 56.4 48.7 44.5
10.6 10.9 6.0 12.2 7.4 6.0
150 160 70 140 150 100
0.105 0.093 0.039
Trace
12.2 7.4 6.0
175 110 75
0.096 0.078 0.042
Trace
11.4 6.0 3.0
160 100 55
Figure 3. Temporal changes in nutrient concentrations of cooperative farm “Pakhtakor” (Section 1, contour 39, depth 0–25 cm) (Annual Scientific Report, 2002).
Therefore, the data showed that irrigated meadow soil is depleted of its humus pool, with humus concentrations ranging between 1.41 and 2.01%. Further, gross nitrogen concentration at the end of vegetation decreased throughout the soil profile. A slight increase in phosphate concentration in cultivated field may be due to immobilization of applied fertilizer and the reduced uptake
Problems and management of the efficient use of soil-water resources in Central Asia
89
Table 5. Factors of the actual application and uptake of NPK for production of raw cotton in cooperative farm “Pakhtakor” (Annual Scientific Report, 2002). 2000
2001
2002
Indicators
N
P
K
N
P
K
N
Actual application (kg ha−1 ) Actual uptake (kg ha−1 ) Uptake (% of application) Productivity (c ha−1 )*
43.4 54.6 125.8
19.5 19.1 102.1 12.4
43.2 49.5 114.6
46.8 52.9 113.0
18.2 18.4 101.0 11.6
44.2 49.6 112.2
43.6 54.6 125.2
P 19.8 19.1 96.5 12.9
K 44.2 47.5 107.5
*10 c = 1 metric ton.
by cotton. Overall, however, cultivation of cotton caused depletion of N, P, K and soil humus concentration. The data in Table 5 show that excess of uptake over the application of nutrients is the principal cause of decline in soil fertility under cotton production. Moreover, the application of the mineral fertilizers alone (without manure or biosolids) reduces the use efficiency of fertilizers applied. It is important to note that with lack of adoption of RAPs, humus pool and nutrient concentrations are progressively diminished leading to an overall decline in soil fertility. 2.4
Decline in soil fertility in the Aral Sea Basin (Republic of Karakalpakstan)
Land mass of the Republic of Karakalpakstan is located downstream of the Amudarya River. Important factors which influence soil quality of the region include the following: Construction of water reserviors in the Amudarya River limit deposition of carbon in the fields, because it is settled in the reservoirs: 1. Increase in salt contribution from the dried out Aral Sea bed; 2. Leaching of plant nutrients into the sub-soil horizons due to improper technology and excessive irrigation (24–25 thousand m3 ha−1 ); 3. Nutrient imbalance caused by more crop uptake than input through application of chemical fertilizers; 4. Continuous cultivation of nutrient depleting crops (e.g., cotton, wheat, and rice) leading to decline in soil fertility and degradation of soil structure; and 5. Reduction in implmentation of soil restorative measures leading to rise in water table and increase in soil salinization. The problem of soil degradation is exacerbated by the frequent passes of heavy machinery which also adversely affects soil structure and fertility. These processes have led to decline in soil fertility in the Republic of Karakalpakstan to grade 3 and to reduction in rating by 41 points during the last 10 years. (Table 6.). In contrast, soil fertility in Nukus and Chimbay districts is not declining, and instead is improving, because of two factors. One, the farmers of these districts specialize in growing vegetables, follow crop rotations, and manage soil fertility by growing leguminous and oil seed crops. Two, these farmers have a high personal interest in their lands. They look after soil quality, maintain the proper NPK balance, and apply oranic matter and manures whenever necessary. However, a sharp decrease in the rate of soil grade in the Muynak district is attributed to the drying of the Aral Sea and the subsequent movement (blowing) of salt and sands throughout region. Based on the data of the State Nature Protection Committee of the Republic of Karakalpakstan, the humus concentration, which is the main indicator of soil fertility, decreased by 30–50% over the 15–20 year period. The data on soil classification/grade show that there is a reduction in highly productive soils in the region (Table 7). In 1990 the soil of group 2, class III comprised of only 0.7% of the total area. In 1999, for comparison, the area under this class increased up to 5.4%, and area under soil in Class VIII, on
90 Climate Change and Terrestrial Carbon Sequestration in Central Asia Table 6. Dynamic change of soil classification/grade in districts of Karakapakstan Republic for 1990–2002 (Annual Reports of the Land Resources Committee of Uzbekistan, 1990–2002). Number
District
1990
2000
Change
1 2 3 4 5 6 7 8 9 10 11 12 13 14 15
Amudarya Beruniy Bozatau Karauzyak Kegeyli Kumgrad Kanlikul Muynak Nukus Hujayli Shumanay Chimbay Tahtakupir Turkul Ellikkala Total
51 50 43 42 43 40 40 40 40 43 45 41 44 51 49 44
46 43 41 41 39 37 38 27 43 42 39 42 40 50 42 41
−5 −7 −2 −1 −4 −3 −2 −13 +3 −1 −6 +1 −4 −1 −7 3
Table 7. Change in soil class/grade dynamics and estimation of irrigated land area in the Republic of Karakalpakstan (Annual Reports of the Land Resources Committee of Uzbekistan, 1990–2002). Irrigation areas (103 ha) Groups
Classes
1
I 0–10 II 11–20 III 21–30 IV 31–40 V 41–50 VI 51–60 VII 61–70 VIII 71–80 IX 81–90 X 91–100 Not estimated lands Total Average classification rate
2 3 4 5 6
Rates
1990
(%)
– – 3.1 239.9 136.9 41.3 16.8 16.1 0.45 – 17.5 472.3
0.7 50.8 29.0 8.8 3,5 3,4 0.1
1999
(%)
– 1.9 25.1 242.2 70.7 48.0 24.5 6.8 –
0.4 5.4 52.3 15.2 10.4 5.4 1.4
3.7 100 44
9.5 100 41
the other hand, decreased from 3.4% to 1.4% over the same period. Area under classes IV and V comprised 31–50% in 1999 and 67.5% in 1999 (Table 7). Considering the fact that the soil of Karakalpakstan is sub-divided into northern and southern zones, it is also possible to assess soil fertility in these two distinct regions. In the northern zone, the majority of the soil (61%) is designated as Class-4, 40% of which is in the category of average to good soil. In southern zone, the good soil comprises 61% of the area, and average soil covers 39% of the total area. In other words, soil quality is improved in the southern regions of the Karakalpakstan Republic. The ground water level changed considerably over the 6 years between 1996 and 2002,which has greatly influenced the overall quality of the land (Table 8). In comparison with 1996, the land area with ground water level of 0–1 m decreased by 31.1% in 2002. All of these changes are linked
Problems and management of the efficient use of soil-water resources in Central Asia
91
Table 8. Temporal change in the ground water level in the Republic of Karaklpakstan between 1996 and 2002 (Annual Reports of the Land Resources Committee of Uzbekistan, 1990–2002). Land area (103 ha) Depth (m)
1996
1998
1999
2000
2001
2002
Area 2002 as % 1996
0–1.0 1.0–1.5 1.5–2.0 2.0–3.0 3.0–5.0 >5.0 m
23.05 75.31 332.12 58.56 6.67 –
24.39 109.24 163.53 89.05 13.19 –
19.17 148.91 237.63 78.60 13.96 0.22
0.77 17.23 101.80 185.20 193.26 1.59
0.91 14.10 61.17 111.11 221.12 90.14
15.9 66.06 169.19 96.39 100.60 50.45
68.9 87.7 50.9 164.6 1508.2 –
Table 9. Dynamic of change in salinity of irrigated lands in The Republic of Karakalpakstan from 1997 to 2002 (Annual Reports of the Land Resources Committee of Uzbekistan, 1990–2002). Salinization of soils
Years 1997 1998 1999 2000 2001 2002 2002 area as %1997
Irrigated land 103 ha 500.9 500.0 500.8 500.1 500.2 500.2 99.8
Unsalinized
Weakly salinized
Moderately salinized
Extremely and strongly salinized
103 ha
%
103 ha
%
103 ha
%
103 ha
%
33.3 28.4 50.3 47.6 50.0 73.8
6.7 5.7 10.0 9.5 9.9 14.8 –
257.2 254.0 255.4 246.1 215.8 169.7 65.9
51.3 50.8 51.0 49.2 43.1 33.9 –
162.3 168.7 152.4 158.3 172.0 192.2 118.4
32.4 33.7 30.4 31.7 34.4 38.4 –
48.1 48.9 42.7 48.1 62.3 64.5 134.1
9.6 9.8 8.6 9.6 12.6 12.9 –
with recurring low water levels during the previous years. Thus, in 2001, the aggregated water supply was only 40.9% of the annual average supply. In low water years, the area sown to cotton, wheat and rice sharply declined. As has been mentioned before, there is a sharp decline in the number of land ameliorative projects, which has raised the ground water level and increased secondary soil salinity. Reversing these trends would necessitate increasing the number of ameliorative projects as well as improvements in crop production technology. In The Republic of Karakalpakstan, about 90% of the irrigated land is subject to some degree of salinization. Analysis of the data shows that the area under severely salinized soil is increasing (Table 9). Land area affected by moderate soil salinity increased from 32.4% in 1996 to 38.4% in 2002, and that affected by severe salinization doubled over the same period. With severely salinized soils, it is impossible to achieve the production targets. As the Republic of Karakalpakstan is situated in the northern zone of the cotton belt, late harvest does not permit adoption of RAPs. Continuing some farming operations in late fall and early winter is not recommended. Further, leaching caused by excessive irrigation (3.5–4.0 thousand m3 ha−1 ) can transport soluble plant nutrients into the sub-soil horizon. Drastic change in ground water levels also leads to destabilization of agriculture, and adversely impacts agricultural economy. Of the 500.8 thousand ha of irrigated lands in 2000, only 389.2 thousand ha were irrigable. Further, the amount of water available during 2001 was only 40.9% of that available in 2000. The irrigable land area decreased from 503 thousand ha in 1990 to 460.3 thousand ha in 2002, a reduction of 8.5% over the 12 year period (Table 9).
92 Climate Change and Terrestrial Carbon Sequestration in Central Asia Adoption of inappropriate soil management technology also negatively influences soil fertility. The repeated passes of heavy equipment during soil preparation for sowing and during the growing cycle strongly compacts the soil and degrades its structure. Finally, these processes reduce productivity of irrigated land and lead to decline in revenue. Specific curative measures are routinely taken to minimize the adverse effects of these practices. Yet, adoption of routine practices does not produce the desired results. In the meanwhile, problems of soil degradation and productivity decline are being exacerbated.
3 3.1
MEASURES TO INCREASE THE USE EFFICIENCY OF WATER AND SOIL RESOURCES Periodic water shortages downstream of Amudarya
Water shortage has occurred repeatedly for decades in Uzbekistan which, according to hydrologists, may reoccur in the future every 5–6 years. During years of water stress, water supply levels for agricultural land are merely 30–40% of the crop requirements. In these situations, a large area of irrigated land either remains unsown or crops fail. Soil fertility in agro-ecoregions declines as does the microbial activity, which adversely affects productivity. This is a serious problem in downstream regions of Amudarya (the Republic of Karakalpakstan and Khorezm region), as well as in regions with predominately steep terrains. Research data show that decline in fertility of irrigated soil is caused by salinization, drought stress, depletion in humus content, nutrient/elemental imbalance, and soil contamination by industrial pollutants. Thus, there is a strong need for development of a research project to identify sustainable agricultural practices in the region. Under the conditions of a recurring water shortage, several research projects were conducted in Uzbekistan to assess agronomic productivity and quality of the produce. However, research aimed at assessing the productivity of different crop species (native and introduced) grown at a range of water supply (40%, 50%, 60% and 70% of optimum) is urgently needed.
3.2
Measures to enhance soil microbiological activities
Decline in humus concentration in soil is also accompanied by reduction in agronomic and agrophysical quality of soil. There is also a decline in nutrient concentration, both macro (NPK) and micro (Cu, Mn, Zn), in irrigated soils. Deficit or an absence of any one of these elements can adversely impact the metabolic processes and retard the growth and development of plants, reduction in crop yield and, deterioration in the quality of agricultural produce. Therefore, research is being conducted on the influence of electrical conductance of soil on the agricultural, chemical characteristics of soil, transport of chemical elements, and microbiological activity of soil in the soil-plant system under a range of water supply. These experiments have been conducted in three-phases involving cultivation of cotton, soybean, corn, sunflower, and millet. These experiments have been conducted in principal soil types of the region. Soils of the experimental site, which is a meadow, is generally of loamy texture, with moderate salinity, and with a mean ground water depth of 1.5 to 2.5 m at the end of the growing season. With regards to the mineral nutrition of crops, importance of N, which is mostly concentrated in the humus fraction, cannot be overemphasized. Soils of the experimental site contain low humus concentration of less than 1%. Some cultivated soils may contain as much as 1.4% of humus concentration. Thus, soil fertility of one region differs from that of another because of differences in humus concentration. Depending on textural composition of the plow layer, humus concentration ranges from 0.5–0.8%, and as high as 1.1–1.5%. Humus concentration decreases with depth to as low as 0.2 to 0.9%. In irrigated meadow soils, humus content can increase to 50–60 cm depth. Soils of the
Problems and management of the efficient use of soil-water resources in Central Asia
93
Amudarya delta are of low inherent fertility, because of low humus concentration and the attendant low concentration of essential plant nutrients. Adverse hydrologic and management conditions of the region are attributed to the ground water flow. These adverse conditions are caused by a gentle slope gradient of the delta, coarse (sandy) texture of soils, and construction of large embankments with complete absence of impermeable layers. Predominately high summer temperatures, low relative humidity of the air, and high wind velocity exacerbate soil evaporation which mostly exceeds the precipitation. Furthermore, high soil salinity increases plant water requirements. Soil analyses of the experimental plots show moderate to average chlorides and sulphate concentration in these soils. Thus, predominant type of soil salinity is chloride-sulphate with some areas affected by sulphate-chloride salts. Experiments have been conducted on the effect of macronutrients and micronutrients in relation to the dynamics of soil microflora under different crops as influenced by electroprocessing under varying levels of water supply (40%, 50%, 60% and 70% of the optimal level). The data show that during moisture deficiency, electroprocessing has a positive influence on agronomic productivity, along with improvements in chemical and microbiological properties of soils. Soil analysis has shown that concentration of soluble forms of nitrogen, phosphorus and potassium with 70% of the water supply in plow layers of cultivated soils planted to cotton is more under RAPs than under control. For example, at the beginning of summer and with 70% of the water supply, concentrations of NO3 –N in the plow layer ranged from 71.4 to 95.2 mg/kg in control compared with 108.0 to 148.0 mg kg−1 with electroprocessing. Concentrations of P2 O5 under cotton also increased under electroprocessing, and ranged from 40.0 to 60.0 mg kg−1 soil under control compared with 50.0 to 70.0 mg kg−1 with electroprocessing. In the beginning of autumn, phosphorus concentration decreased to 27.0 mg kg−1 with electroprocessing compared with an increase to 31.8 mg kg−1 in control. The best results of electroprocessing in cotton are obtained for the soluble potassium concentration for all levels of water supply. Concentration of mobile form of K2 O may ranges from 219.0 to 398.8 mg kg−1 in the humus-rich layer, and 94.0 to 350.8 mg kg−1 soil in the sub-soil horizon. It is only during the mid-spring when the amount of potassium becomes less with the electroprocessing treatment (232.0 mg kg−1 of soil) than without electroprocessing (398.0 mg kg−1 soil). Therefore, under conditions of water shortage, high yield of raw cotton can be obtained in salt-affected soils of the Aral Sea with 60 and 70% of water supply but with electroprocessing of seeds and vegetative components of the cotton at all phases of vegetative growth. Some experiments have also been conducted with regard to the nutrient uptake by sunflower under the impact of electroprocessing. The data shows an increase in the uptake of NO3 –N and K2 O by electroprocessing, regardless of the water supply, which is also in contrast with the control. The quantity of mobile forms of N under the impact of electroprocessings increased from 119.0 to 166.0 mg kg−1 , compared with 38.1 to123.8 mg kg−1 without electroprocessing with water supply level of 60%. Higher concentrations of mobile potassium were formed under 60% of moisture availability with electorprocessing (from 150 to 220 mg kg−1 ) than without electroprocessing (from 125 to 200 mg kg−1 ). However, concentration of P2 O5 was an exception, because increase in its concentration was less at 40% of the moisture availability with electroprocessing (from 25.0 to 33.8 mg kg−1 ) compared with only 11.4 to 25.0 mg kg−1 in the control. Micronutrients in the soil reserve pool can be used to enhance soil fertility. The dynamics of micro-nutrients in soils of the Aral Sea Basin have not been studied in Uzbekistan. The concentrations of the mobile forms of copper, zinc, and manganese in meadow-alluvial soil formed on alluvial deposits have been studied to some extent. Distribution of these micronutrients in the soil profile is influenced by chemical and mechanical processes, including the degree of salinity and influence of anthropogenic factors. Research experiments show that meadow soil in the desert zone differs in concentrations of mobile micronutrients from those in meadow soils of sierozem oasis. Soil analyses show that concentrations do not vary significantly from that of the control even under the influence of electroprocessing. Concentrations of Cu in soils of the experimental plots range from 0.30 to 0.50 mg kg−1 , but sometimes can be as high as 0.70 to 1.27 mg kg−1 . There may be some increase in control and with electroprocessing under cotton in 3 and 4 stages of vegetative growth. The concentrations of
94 Climate Change and Terrestrial Carbon Sequestration in Central Asia copper in the experimental soils were lower on the whole compared with those in the hyohomorphic soils containing hydrogen sulfide in the Tashkent region. In these soils concentration of available copper in the humus-rich horizon may range from 0.9 to 0.22 mg kg−1 . This low concentration of copper in the upper horizon reduces any additional impact of salinization on its concentration. The amount of Cu in these soils exists in form unavailable to plants. Experimental data on zinc show high concentrations in the upper humus-rich horizon with a gradual decrease with increase in soil depth. However, concentration of micronutrients was studied only in the plow layer of arable lands. The concentration of available zinc in all experimental treatments ranged from 3.30 to 5.30 mg kg−1 . Such concentrations in meadow soil of the desert zone are similar to those in meadow – alluvial soils of the hydrogen sulfide oasis. The normal cotton growth is affected when zinc concentrations are in the 1.5–2.5 mg kg−1 range. Manganese concentrations in experimental soils were insufficient in the upper horizon in all treatments in the first phase and ranged from 29.0 to 31.0 mg kg−1 . In the second phase, (the butonization stage) concentrations of manganese ranged between 24.4 mg kg−1 and 31.3 mg kg−1 . Analytical data showed that in the reproductive phase, concentrations of manganese decreased significantly both in the control treatment and with electroprocessing, and ranged from 17.4 to 32.2 mg kg−1 . These trends suggest that the experimental soil contains only trace amounts of manganese. Thus, using manganese as microfertilizers is recommended. Soils derived from alluvial material differ substantially with regard to the concentrations of mobile Zn, Mn, Cu from those of the meadow soil formed from hydrogen sulfide oasis depending on climate, humus content, level of micronutrient composition, and the nature of their distribution within the soil profile under the influence of electroprocessing. Increase in availability of micronutrients to crops may be due to the applied fertilizers, but also due to increase in microbial activity. Soluble forms of micronutrients available for plant growth are strongly influenced by activity of specific micro-organisms in the rhizoshere. Several experiments were conducted to assess the impact of electroprocessing on soil, seed and the microorganisms within the rhyzosphere of different crops under a range of water availability (40, 50, 60 and 70%). The principal groups of microorganisms which affect the cycling of nitrogen, carbon and phosphorus during the growth cycle of cotton, corn, sunflower, millet and sesame, were identified. In addition, ammonicator, oligonitrophyl bacterias, micromicet (the fungus) and actinomyctes in the rhyzosphere of different crops, as well as dynamics of development of soil microflora with and without electroprocessing in cotton were also identified. The microbial count in each physiological group was assessed taking into account as much as is possible because microbial community is actively decomposing the biomass and soil humus. The data obtained supports the conclusion that soil moisture in the rhyzosphere of plants grown in saline soils greatly influences the nutrient concentration and microbial biomass. Even with moisture deficit, electroprocessing increases the concentration of beneficial microorganisms in soil and reduces the amount of harmful microorganisms. It also improves phytosanitary conditions of soil by reducing splash fungus and increasing the amount of actinomyces. The data from these studies show that at crop maturity the impact of electroprocessing successfully alters the dynamics of gross microorganisms under various levels of water availability. For example, during a vegetative period of cotton with 40%) was accumulated within the soil profile (0–120 cm depth) followed by Ca-sulfate (∼ 29%), NaCl (18%), and MgCl (10%). A total amount of 328 Mg ha−1 of salts was accumulated in the soil. Out of that total amount, 70% of the salts (Mg and Na sulfates and chlorides) were highly toxic to plant growth. In this region, the groundwater is saline and contains 5–24 gL−1 of salts. As a result, salt accumulation in irrigated soil differs seasonally. In spring, the salt accumulation at 0–100 cm depth is 180 Mg ha−1 followed by 140 Mg ha−1 at 1–2 m depth. In autumn, the salt content increased up to 200 Mg ha−1 in 0–1 m depth and 160 Mg ha−1 in 1–2 m depth. In arid or semiarid climates of Uzbekistan, salinity is usually combined with high soil pH, because of Na, Ca, and Mg associated carbonate, chloride and sulfate salts accumulation in the uppermost soil horizons. 3.5
Soil biological properties
Soil biological activities were influenced greatly by salinity and seasonal variations (Figures 2–5). Average across soil depth and season, base respiration (BR) (CO2 evolution) rate was 5 mg kg−1 d−1
Salinity effects on irrigated soil chemical and biological properties
153
Table 5. Toxic and non-toxic salt species in irrigated soil (typical sierozems) in the Sayhunobod district of Syr Darya province of Uzbekistan, 2004. Soil depth (cm)
Ca(HCO3 )2
CaSO4
MgSO4
MgCl2
Na2 SO4
NaCl
Total
Non-toxic
Toxic
g kg−1
0–28 28–49 49–96 96–120
0.32 0.24 0.28 0.24
12.99 5.74 3 1.16
Total (Mg ha−1 )
4.4
92.6
5.86 0.95 1.03 1.04 36.9
0.19 0.18 0.17 0.18 3.07
7.6 8.77 7.24 7.91 133
6.52 2.70 2.93 1.08 57.6
33.48 18.58 14.65 11.61 327.6
13.31 5.98 3.28 1.40 97
20.17 12.60 11.37 10.21 230.6
Ca(HCO3 )2 = Calcium Na2 SO4 bicarbonate; CaSO4 = Calcium sulfate; MgSO4 = Magnesium sulfate; MgCl2 = Magnesium chloride; Na2 SO4 = Sodium sulfate; and NaCl = Sodium chloride.
in moderately saline irrigated soil compared to 3.91 mg kg−1 d−1 in weakly saline irrigated soil (Figure 2). In other words, about 22% increase in BR rate was measured in response to increasing soil salinity. However, the BR rates differ among over seasons. The highest BR rate (12.5 and 9.55 mg kg−1 d−1 ) was recorded in spring (April), intermediate (5.2 and 4.5 mg kg−1 d−1 ) in summer (July), and lowest (2 and 1.97 mg kg−1 d−1 ) in autumn (September) in both moderately and weakly saline irrigated soils. Higher BR rate was recorded in surface layer (0–28 cm) of both soils. Similarly, the catalase activity was affected by soil salinity, and also different among seasons (Figure 3). The average catalase activity was higher in moderately saline irrigated soil (1.46 mL O2 kg−1 min−1 ) compared to weakly saline irrigated soil (1.24 mL O2 kg−1 min−1 ). On average, there was a 15% increase in catalase activity from weakly to moderately saline of soil. Averaged across soil depth, catalase activity was recorded highest (1.97 and 1.68 mL O2 kg−1 min−1 ) in spring, intermediate (1.63 and 1.47 mL O2 kg−1 min−1 ) in summer, and lowest (0.78 and 0.56 mL O2 kg−1 min−1 ) in autumn for both moderately and weakly saline soils. The decrease in catalase activity was more pronounced in autumn which is about 50% less than that in spring. In both soils, the catalase activity decreased with increase in soil depth in all seasons. Averaged across seasons and soil depths, the invertase activity was higher (1.31 mg glucose kg−1 d−1 ) in moderately saline soil than in weakly saline (0.9l mg glucose kg−1 d−1 ) irrigated soil (Figure 4). On average, the moderately saline soil had ∼30% more invertase activity than weakly saline soil. Highest invertase activity was recorded at surface depth of both weakly and moderately saline soils. The activity was more for all depths in moderately saline soil than weakly saline irrigated soil. The invertase activity was higher (1.56 and 1.06 mg glucose kg−1 d−1 ) in summer, intermediate (1.36 and 0.9 mg glucose kg−1 d−1 ) in autumn, and lower (1 and 0.77 mg glucose kg−1 d−1 ) in spring. Likewise, the urease activity was higher (0.85 mg NH4 kg−1 d−1 ) in moderately saline soil than in weakly (0.59 mg NH4 kg−1 d−1 ) saline soil (Figure 5). In other words, more than 30% increase in urease activity occurred due to increase in soil salinity. Averaged across soil depth, urease activity was higher in summer (0.96 and 0.68 mg NH4 kg−1 d−1 ) followed by that in autumn (0.83 and 0.56 mg NH4 kg−1 d−1 ), and spring (0.77 and 0.54 mg NH4 kg−1 d−1 ). Greater urease activity was measured in surface depth of both soils. Biological activities are potential indicators of the extent to which soil disturbance by a given activity may affect the immediate environment (Figures 6–8). Adverse effects of soil salinity on soil biological properties have long been recognized. Higher BR rates and enzyme activities in moderately saline irrigated soil during summer and autumn than in weakly saline irrigated soil in spring may be attributed to several factors. During hot summer months (with air and soil temperature ranging from 35 to 45◦ C) under continental climate, salt moves to the surface by upward capillary from saline ground water in response to high evaporation, and results in greater accumulation of salts in summer and autumn than in spring.
154
Climate Change and Terrestrial Carbon Sequestration in Central Asia
Figure 2.
Base respiration rates of varying saline soils.
Salinity effects on irrigated soil chemical and biological properties
Figure 3.
Catalase activity rates of varying saline soils.
155
156
Climate Change and Terrestrial Carbon Sequestration in Central Asia
Figure 4.
Invertase activity rates of varying salinity soils.
Salinity effects on irrigated soil chemical and biological properties
Figure 5.
Urease activity rates of varying saline soils.
157
158
Climate Change and Terrestrial Carbon Sequestration in Central Asia
Figure 6.
Basal respiration rates for toxic and total salts in varying saline soils.
Salinity effects on irrigated soil chemical and biological properties
Figure 7.
Catalase activity rates for toxic and total salts in varying salinity soils.
159
160
Climate Change and Terrestrial Carbon Sequestration in Central Asia
Figure 8.
Invertase activity rates for increasing organic carbon contents in varying salinity soils.
Salinity effects on irrigated soil chemical and biological properties
161
Since salt content of soil is considered to be the limiting factor for the survival of microorganisms, higher BR rates suggest that moderately saline soil environment is unfavorable for microorganisms due to the osmotic effects (Figure 6). In high stress environments (e.g., moderately saline soil); microbial cells may be forced to maximize their catabolism for survival than anabolism (growth) in response to increasing salt content (Figures 6 and 7). The catabolic effect is more pronounced in response to toxic contents of salt (e.g., MaSO4 , MgCl2 , Na2 SO4 and NaCl) than total salt contents. A significant relationship between biological activities and salt contents (total and toxic) supports the conclusion that increasing salt content increases microbial catabolism for survival under saline environment (Figures 6 and 7). Significant relationships between BR rates and invertase activity with increasing C substrate availability suggest a greater microbial catabolism to use organic matter for sustaining biological activity in saline soil (Figure 8). Greater invertase and urease activities during the summer are most probably related to greater transformations of organic matter by microorganisms for their increasing energy and nutrients demand for survival than assimilation in response to high temperature and salinity stresses. 4
CONCLUSIONS
Irrigation is essential to high agricultural production in the Aral Sea basin. About 44% of the land is concentrated in the Syr Darya and 56% in the Amu Darya river basin. In response to large scale withdrawal of water for irrigated agriculture especially for cotton production, the river water flows to the Aral Sea severely decreased over the years. As a result, the Aral Sea, once the fourth largest inland body of water in the deserts of Central Asia, has lost much of its volume (82%) and area (∼66%) and quadrupled in salinity. Indiscriminate flood irrigation with poor quality of water and inefficient drainage systems accelerated secondary salinization of irrigated soils with severe degradation of ecosystems. Aral Sea degradation has caused varying degrees of salinity of irrigated soil in the Amu Darya and Syr Darya basins. Increase in soil salinity (16%) spread to Andijan, Djizak, Namangan, Samarkand, Surkhan Darya, Syr Darya, Tashkent, Fergana, and Kashka Dariya regions between 1990 and 2000. In Syr Darya region alone, about 47% of the irrigated lands are weakly saline followed by 35% moderately saline, and 18% strongly saline. Among the salts, Ca, Mg, and Na associated sulfates, chlorides, and bicarbonates are dominant in the soil profile. Highest amount of Na-sulfate (>40%) followed by Ca-sulfate (∼29%), NaCl (18%), and MgCl (10%) have accumulated within 0–100 cm depth of typical sierozems soils. More than 70% of the salts are highly toxic to plant growth and soil biological activities. As a result, the BR and enzyme activities are influenced strongly by soil salinity in different seasons. There were 22, 15, and 30% increase in BR rates, catalase, invertase, and urease activities in moderately saline soils compared to weakly saline irrigated soils. The BR rates and catalase activities were higher in spring than in summer in both weakly and moderately saline irrigated soils. However, the invertase and urease activities are higher in summer than in spring. Abnormally high biological activities in moderate saline irrigated soil during summer and autumn than in weakly saline irrigated soil during spring may be due to osmotic effects on microorganisms. Under high salinity stress, microbial cells use more energy and nutrients (catabolism) for survival than growth (assimilation). The catabolic effects on microbial cells were more pronounced in moderately saline soil and in response to toxic salt concentration (MaSO4 , MgCl2 , Na2 SO4 and NaCl) than total salt concentration in both weakly and moderately saline soils. REFERENCES Anonymous. 1994. Annual reports on land reclamation and water use. 1975 to 1994. Ministry of Water Resources of the Republic of Uzbekistan. Tashkent. Uzbekistan. 220 p. (in Uzbek). Anonymous. 1995. Environment conditions and natural resources use in Uzbekistan. National Report. Tashkent, 80 p. (in Russian).
162
Climate Change and Terrestrial Carbon Sequestration in Central Asia
Anonymous. 1996. Suggestions for a national water management strategy of the Republic of Uzbekistan. Design Institute ‘Vodproekt’ of the Ministry of Water Resources of Uzbekistan Report. Tashkent, 233 p. (in Russian). Dadenko, E.V. 2006. Some Aspects of Soil Enzyme Activity Application. Rostov State University, B. Sadovaya str., 105, Rostov-on-Don, 344006, Russia. 18th World Soil Science Congress, Philadelphia, PA. FAO. 2006. National Soil Degradation. http://www.fao.org/landandwater/agll/glasod/glasodmaps.jsp. FAO. 2006. Terrastat – land resource potential and constraints statistics at country and regional level. Land and Water Development Division. http://www.fao.org/ag/agl/agll/terrastat/wsr.asp Green, D.M. and M. Oleksyzyn. 2002. Enzyme activities and carbon dioxide flux in a Sonoran Urban Ecosystem. Soil Sci. Soc. Am J. 66: 2002–2008. Killham, K. 1985. Assessment of stress to microbial biomass. In: A.P. Rowland (ed.), Chemical Analysis of Environmental Research. ITE symposium no. 18, pp. 79-83. Marlewood Research Station, Grange-overSands, Cambria, UK. Micklin, P.P. 1994. The Aral Sea problem. Proc. Paper 10154. Instn. Civ. Engrs. Civ. Engng. 114: 114–121. Minshina, N.G. 1996. Soil environmental changes and soil reclamation problems in the Aral Sea basin. Eurasian Soil Sci. 28: 184–195. Mirzaev S.Sh., R.M. Razakov, and V.G. Nasonov. 2000. The future of the Aral Sea basin in flourishing oasis or fruitless desert, Collection of scientific articles: Water resources, the Aral problem and environment. Tashkent University, Tashkent, Uzbekistan. Muminov, F.A. and I.I. Inagatova. 1995. The changeability of the Central Asian climate. SANIGMI, Tashkent, Uzbekistan. Razakov, R.M. 1991. Use and protection of water resources in Central Asia. Tashkent, p. 203. Rietz, D.N and R.J. Haynes. 2003. Effects of irrigation-induced salinity and sodicity on soil microbial activity. Soil Biology and Biochem. 35: 845–854. Ryan, J., P. Vlek, and R. Paroda. 2004. Agriculture in Central Asia: Research for Development. International Center for Agricultural Research in the Dry Areas (ICARDA), Aleppo, Syria. Sokolov, V.I. 2000. Definition of boundaries of water collection basins of trans-bordering, local and mixed types of surface water resources in the basin of the Aral Sea and quantitative assessment. Collection Scientific Works of SRC ICWC, Tashkent, Issue 2. p. 35–53. Tabatabai, M.A. 1994. Soil Enzymes. p. 778-834. In: J.M. Bigham (ed.), Methods of Soil Analysis; Part 2: Microbiological and Biochemical Properties. Soil Science Society of America, Madison, WI. Tripathi, S., S. Kumari, A. Chakraborti, A. Gupta, K, Chakraborti, B. Kumar, and A. Gupta. 2006. Microbial biomass and its activities in salt-affected coastal soils. Biol. Fert. Soils. 42: 273–277. Umramov, M. 1989. Soils of Uzbekistan. Tashkent, Uzbekistan. UNDP. 1995. The Aral crisis. Tashkent, Publishing house of UNDP. UNEP. 2005. Water resources. State of Environment of the Aral Sea Basin. http://enrin.grida.no/aral/aralsea/ english/water/water.htm Uzbekistan Academy of Sciences. 1979–1981. Irrigation of Uzbekistan. Tashkent. Vol.1: 382 p., 1979; Vol.2: 368 p., 1979; Vol. 3: 359 p., 1979; Vol. 4: 448 p., 1981. (in Russian). World Bank. 1997. Aral Sea Basin. Project 3.1.B. Agricultural water quality improvement. EC IFAS., World Bank, Tashkent, p. 51.
Soil Management and Carbon Dynamics
CHAPTER 12 Central Asia: Ecosystems and carbon sequestration challenges
Mekhlis Suleimenov International Center for Agriculture Research in Dryland Areas, Tashkent, Uzbekistan
Richard J. Thomas International Center for Agriculture Research in Dryland Areas, Aleppo, Syria
1
INTRODUCTION
Countries of the Former Soviet Union (FSU) including Russia, the republics of Central Asia and the Caucasus represent vast areas that can have a substantial role in carbon sequestration. Agriculture in the FSU was developed somewhat independently from the rest of the world, was production oriented but was characterized by relatively low crop and livestock productivity. Moreover it was remarkably inefficient as compared to many developing and industrial countries. During the transition to market oriented economies, agricultural production in all countries of the FSU was subject to enormous pressure associated with the disintegration of the Soviet Union and the transformation of government controlled farm sectors into more liberal based private and individual farming businesses. During this transition crop and livestock production declined because of lower input use and less support from the governments. Some areas have been abandoned because of lack of resources and low returns. Poor management of both crop and livestock sub-sectors resulted not only in lower productivity but also in further land degradation reflected in more severe soil erosion and soil salinization leading to large losses of soil carbon on both cropland and rangeland. In this paper, the issues of land management for better carbon sequestration and challenges in addressing these issues are discussed. 1.1
Eco-systems
The regions and eco-systems considered here include Central Asia, the Caucausus and adjacent areas of Russia. They can be subdivided as follows: 1. The steppe belt in northern Kazakhstan (NK) and adjacent areas of Russia including southern part of western Siberia (WS); 2. Southern Ural (SU) and the Volga area (VA), located between 52–56◦ NL; 3. The dry steppe belt in central Kazakhstan and in southeast of Russia including the south Volga area just above the Caspian Sea located between 48–52◦ NL; 4. The northern Deserts of Betpakdala, Moyinkum and other deserts in Kazakhtan located be desert between 44–48◦ NL; 5. The Kyzylkum desert, mostly in Uzbekistan located mainly between 40–44◦ NL; 6. The Southern Garagum desert, mostly in Turkmenistan, located between 36–40◦ NL; 7. The mountains of Central Asia and the Caucasus. 1. The NK is a territory between 50◦ and 54◦ N latitude and between 60◦ and 78◦ E longitude. It covers an area of 57 M (million) ha, and is comprised of 4 provinces: Akmola, Kostanay, Pavlodar and North-Kazakhstan. Soils are fertile, but there are many solonetzic soils and almost all soils are subjected to erosion. The northern area consisting of semiarid southern forest-steppe is situated on gray forest soils and leached black soils occupying 8% of cropland; semiarid steppe on ordinary black soils occupies 22% of cropland. These are the most fertile soils of the region, medium and 165
166
Climate Change and Terrestrial Carbon Sequestration in Central Asia
heavy textured, with soil organic matter (SOM) content of 5–7%. The semiarid steppe zone on southern calcareous chernozem is located in the south and occupies 28% of the cropland. This soil has SOM content of 3–4%, with soil texture of heavy clay loam. The southern part of WS area is located adjacent to and north of the NK. The dryland area is located between 50–55◦ N latitudes and 62–86◦ E longitudes. There are 9 M ha of cropland; 70% of these are on chernozem soils (Khramtsov et al., 2000). The area produces over 10% of Russia’s grain. In the steppe zone, cropland occupies 80% of the area. The major crop is spring wheat produced in the semiarid steppe and southern forest-steppe with average grain yields of 1.0–1.5 t ha−1 . 2. The Steppe belt of the SU is located west of WS and northwest of NK between 51–55◦ latitudes and 52–62◦ longitudes. Orenburg is the largest province in SU with an average area planted to grains of around 4 M ha with average grain yields of 1 t ha−1 . The western part of the area has a climate similar to the Volga area while the eastern part is similar to NK and WS. Cropland is located on black and dark chestnut soils. The Volga area (VA) is located west of the SU. The dryland agriculture belt is located between 48–52◦ N latitudes and 44–52◦ longitudes. The total agricultural land of the area comprises about 30 M ha in the Soviet era, including 20 M ha of cropland. The area produced 16% of grain, and 24% of sunflower of Russian production. The share of irrigated cropland was about 3%. 3. The Dry Steppe belt has chestnut heavy textured soils occupying 40% of the cropland in Kazakhstan. It extends into the lower VA (Volgograd region). The soils have SOM content of 2–3.5%. The main crop is spring wheat producing rather low grain yields but of high baking quality (protein content 14% up) that is widely used for blending with low protein wheat. Significant areas of these lands are marginal and have been abandoned during the transition period. The southern part of Dry Steppe belt is semi-desert represented by rangelands in central Kazakhstan and above the Caspian Sea, the so called Black lands in Kalmykiya. The semi-desert, light chestnut soils cover 2% of the cropland; these soils have less than 2% SOM in the arable layer, with sandy loam and loamy sand textures. The Black lands have been severely degraded because of intensive overgrazing and use of some of these marginal lands for grain production. 4–6. The deserts of Central Asia extend from the Kopetdag and Paromiza mountains in the south up to 48◦ N and from the Caspian Sea in the west to the foothills of Jungar Alatau mountains in the southeast and the deserts of China in the east. There are many deserts types in this vast area; sandy deserts of Garagum (360,000 km2 ), Kzylkum, Moyunkum, Saryyesik-Atyrau, Near Aral Garagum, Great and Small Barsuk, Naryn sands in Volga-Ural area; and smaller size deserts, stony Betpakdala, stone chippings Usturt, clayey Golodnaya steppe; saline desserts Kelkor, Mertviy Kultuk. There is also a new desert, Aralkum, emerging as a result of the drying of the Aral Sea. If the Sea disappears then the Garagum and Kyzylkum deserts will merge. The area covered with desert occupies 79% of the total area of Turkmenistan while in Uzbekistan, Krgyzstan, Kazakhstan and Tajikistan deserts occupy 56%, 35%, 28% and 17% respectively (Bbayev, 1995). 7. The Central Asian region is divided orographically into two parts; an eastern part occupied by the mighty mountain ranges of Tien Shan and Pamir-Alay, while the western part is occupied by lowland plains. The Caucasus stretches for about 1000 km from the Black Sea to the Caspian Sea, separating Europe from Asia. North of the main Caucasus ridge there are mountain ridges that extend to the Russian steppes. The fragile highlands of Central Asia and the Caucasus are threatened by overgrazing, cultivation of steep slopes, non-sustainable fuel wood and timber harvesting that result in severe soil erosion. 1.2
Climate
Moving from the east of NK-WS westwards and further into middle VA the amount of rainfall gradually increases from 320 mm in Omsk to 400 mm in Saratov. The pattern of precipitation distribution is also gradually changing from more pronounced rainfall in July in the east to more even rainfall distribution in the VA region. The amount of rainfall and its distribution in the Volga area is similar to the Canadian prairies of Saskatchewan. Rainfall in July amounts to 12% of the
Central Asia: Ecosystems and carbon sequestration challenges
167
total annual rain in Orenburg, 19% in Chelyabinsk and 21% in Omsk. This explains why spring wheat in Siberia and Kazakhstan is sown much later than in the VA. The annual precipitation in NK and WS decreases southwards; in the northern semiarid steppe zone, precipitation is between 320 and 350 mm, whereas in the southern semiarid steppe zone it is between 280 and 320 mm. In the dry steppe, annual precipitation varies between 220 and 280 mm, the water deficit during summer averages about 250 mm. The distribution of precipitation throughout the year in all regions is similar. About 30% of precipitation falls evenly as snow during November–March. In VA annual precipitation decreases from about 350–400 mm in semiarid steppes (Saratov) to 220–300 mm in the more southerly dry steppes (Volgograd). Below the dry steppe belt, stretches a semi-desert belt with 150–220 mm annual precipitation with gradual transition into desert with annual precipitation below 150 mm. Deserts of Central Asia are characterized by a continental climate of dry and hot summers across the deserts, cool winter in the south and cold winter in the north (average monthly temperature in January is −15◦ ). Rainfall amounts are small (100–150 mm a year) and are evenly distributed throughout the year in the north, with prevailing rainfall in winter in the south. Evaporation is high, from 1300 mm in the north up to 2850 mm in the south. Sandy deserts comprise 60% of all the arid territory of Central Asia (Babayev, 1995). Grey and brown-grey soils with various degree of salinity are widespread in Central Asia. Temperatures gradually increase moving from the NK and WS areas westwards to the SU and WA. The NK and WS areas are characterized by a continental climate with hot summers and very cold winters. The average annual air temperature is 1.6◦ C (at Astana). Winter begins in November; the coldest months are December, January and February with average monthly temperatures of 16–18◦ C below zero. In May, the average is 12.6◦ C but by the end of June, average temperatures go up to 20◦ C. July is the hottest time of the year and the only month with no frost. The average temperature is about 20–21◦ C, while daily temperatures exceed 30◦ C. In August, temperature falls to an average to 16–18◦ C with a high probability of night frost that can damage grain at the end of the month. WS has the same temperature regime as the Northern Kazakhstan. Omsk, situated in the forest-steppe zone and 600 km north of Astana, has an average annual temperature of 0.4◦ C, due to slightly lower temperatures throughout the year compared to Astana. In the SU and VA the average annual temperature is higher than in Siberia. Temperatures in the semi-desert and northern desert belt in winter are just as cold as in the dry steppe but summers are drier and hotter. Winters are milder only in the southeast with average annual temperatures of around 6–8◦ C (Almaty, Bishkek) and are much warmer in southern Kazakhstan and in Uzbekistan (14◦ C in Tashkent and Dushanbe), going up to 18◦ C in southern deserts (Ashgabat, Turkmenistan). 2
AGRICULTURAL POLICIES AND PRODUCTION IN CENTRAL ASIA
The development of agriculture in the FSU differs a great deal from country to country. Essentially, the FSU countries may be subdivided in two groups; (1), those that followed a relatively radical approach to reforms (Russia, Kazakhstan, Kyrgyzstan, Armenia, Azerbaijan and Georgia), and (2), those that followed a relatively gradual approach to reforms, maintaining governmental control of agricultural production (Tajikistan, Turkmenistan and Uzbekistan). Different policies strongly affect not only agricultural production but also the sustainability of agriculture and the viability of livelihoods. In the semi-arid steppes of NK and WS with black and dark chestnut soils almost all the agricultural land was plowed up for grain production about fifty years ago. This is predominantly a spring wheat zone grown continuously for four-five years with summer fallow occupying from 15– 20% of cropland. In SU and VA, agriculture has a longer history with spring wheat predominating although winter wheat has been grown on summer fallow. All other crops occupy small areas. Recent developments associated with the liberalization of production, markets and prices have resulted in major changes in production systems. In both regions, especially in NK, bankruptcy of the restructured collective farms in the mid-nineties resulted in the transfer of these enterprises
168
Climate Change and Terrestrial Carbon Sequestration in Central Asia
to large grain trading companies that decided to invest in agricultural production. Nowadays these companies own grain processing and storage facilities and control the agricultural production on at least 100,000 ha. Individual farmers with farm sizes of several hundred hectares do not play an important role in the overall production scenario although some of them are involved in integrating grain production with processing and marketing. In the dry steppe across Kazakhstan and the Volga area, rangelands occupy large areas while cropland is less suitable for grain production. Nevertheless, during the Soviet era, most of the drylands including marginal lands were used for grain production. Since independence and market oriented developments, large areas of marginal lands especially in Kazakhstan (over 10 M ha) were abandoned and left as weedy fallow in the mid-nineties. One of the reasons for abandoning marginal lands was the poor financial status of farms. Some of these earlier abandoned lands (10–15%) have been brought back to production after agricultural business in Kazakhstan became profitable over the last three-four years and investments in agriculture increased. In semi-desert and desert areas agricultural lands are being used for livestock grazing except for pockets of irrigated agriculture and limited areas of rainfed agriculture. A general trend in livestock production is more reliance on rangeland grazing rather than integration with forage production. In all countries under radical and gradual reforms, forage production almost came to a standstill because large and small farms decided to get rid of livestock and concentrate on grain production. Finally, in all FSU countries livestock was mainly restricted to households that owned cow and calf operations and small flocks of sheep and goats. Radical reforms resulted in dramatic cutbacks of livestock populations first of all in small ruminants. The distribution of large flocks of animals to small household operations resulted in an enormous concentration of livestock around villages leaving remote large rangelands unused especially in Kazakhstan and Kyrgyzstan. In the past some neighboring countries shared rangelands, for example Georgia used winter rangelands on the territory of Azerbaijan. This practice was discontinued. In countries with gradual reforms in agriculture, livestock numbers were not cutback so dramatically and in Turkmenistan population numbers increased remarkably. FAO statistics indicate a stable figure of some 6 M heads of small ruminants during the last five years whereas Turkmenistan national statistics indicate a small ruminant number of 15 M heads (Turkmen Mallary, 2005). Even if the national statistics are rather optimistic the livestock population in this country increased substantially and their influence on range status and finally on carbon sequestration can not be overemphasized. Irrigated agriculture in southern (Garagum) and the Kyzylkum desert areas have changed a great deal during the transition. First, dryland rainfed agriculture decreased more markedly in countries with liberal economies as it became unprofitable. In irrigated agriculture, dramatic changes occurred in all countries driven by different forces. In countries with liberal economies the market has been a major factor effecting cropping structure. In Kazakhstan, cotton-alfalfa rotations have been replaced by continuous cotton as the most profitable cash crop. In Azerbaijan, on the contrary, policy liberalization caused dramatic cutback of cotton growing areas because small farmers couldn’t take advantage of good world market prices for cotton and cotton was replaced by wheat. In Kyrgyzstan, the area dedicated to forages was reduced and was replaced by wheat. In addition, sugar beet areas increased driven by good local prices for this product. Some new crops such as common bean were introduced as a result of a favorable market. In all countries with government controlled agriculture the priority crop for expansion was wheat that replaced alfalfa and other forage crops. All these changes in countries with different policies invariably resulted in severe cutbacks of the areas under forage crops including perennial forages like alfalfa. This change has negatively affected soil fertility in general and SOM content in particular. 3 3.1
CROPLAND AND RANGELAND MANAGEMENT FOR CARBON SEQUESTRATION Cropland management
It is well known that major losses of SOM are associated with soil erosion. In the steppe belt of the FSU conservation tillage was introduced in the 1960s in the NK. Later it spread to WS and across
Central Asia: Ecosystems and carbon sequestration challenges
169
this region conservation tillage became a generally adopted practice because it not only protected soil from wind erosion but also increased crop yields thanks to better soil moisture accumulation. In SU and VA conservation tillage did not improve crop yields significantly and its adoption was not widespread. However even with conservation tillage, if it is done several times during the summer fallow period, no residue is left on the soil surface to protect soil and soil erosion occurs by wind and water. In spite of this finding the rotation of small grains with summer fallow became a practice for moisture conservation and weed control across the steppe belt regions even though the practice appears to be unsustainable. In the middle of the VA, SOM content amounts to 200–600 t ha−1 in natural grasslands versus 150–200 t ha−1 in croplands (Medvedev et al., 2003). On average, annual losses of SOM from cropland on black soils amount to 1–1.5 t ha−1 resulting mainly from soil erosion. The cropland area of black soils affected by varying extents by water erosion is about 55% with summer fallow contributing greatly to soil erosion. Global climate change, increases in areas under summer fallow, the introduction of row crops, reduced application of fertilizers and removal of crop residues combined with soil erosion by water, have all contributed to increased land degradation on black soils. Retrospective analysis of soil quality monitoring data indicated that during agricultural use black soils lost 40–50% of SOM. In the process, deep fertile chernozems with SOM contents of 12–14% have been transferred into medium humus common cherenozems with SOM contents of 6–8%. In turn, common chernozems have been transformed into dark chestnut soils. The active fraction of the SOM of cherenozem soils has been reduced from 60–65% to 35–45%. Alongside soil erosion, SOM losses have been caused by the decomposition of organic matter especially in fields left to summer fallow (Medvedev et al., 2003). Annually, on black soils depending on soil texture, between 1.5–2.5 t ha−1 of SOM has been decomposed during the summer fallow period. As a result of periodic leaching, a significant amount of nutrients accumulated during summer fallow is leached beyond the crop root zone in spring during snow thawing into ground waters. In eroded soils the availability of easily available nitrogen was reduced by 38.8%, moderately available nitrogen by 15.9% and stable nitrogen by 9.8% when compared with non-eroded soils. The annual loss of SOM from intensively used cropland in rotations of grains with row crops and fallow in VA was 1.1 t ha−1 with no fertilizer application while the loss of SOM was reduced to 0.52–0.64 t ha−1 when fertilizers were applied at a rate of 60 kg N, 60 kg P and 40 kg K/ha. The application of 40 t ha−1 of manure once in six years reduced the SOM losses to 0.40–0.32 t ha−1 . In rotations of grains with perennial forages there was an accumulation of SOM even with no fertilizer applied (Medevedev et al., 2003). The authors however failed to point out that cropping systems including clean summer fallow are not sustainable because of the loss of SOM. In the Omsk region, WS the original SOM contents in black soils in southern forest-steppe and steppe zones were 6.78% and 5.48% respectively (Khramtsov and Kholmov, 2003). During 16 years of cultivation, losses of SOM in 0–20 cm layer were 1.51 t ha−1 in a rotation of wheat with fallow (once in 3 years), 0.98 t ha−1 in rotations with 25% under summer fallow and 0.76 t ha−1 with fallow on 16% of cropland. Interestingly, in a four year rotation when summer fallow was replaced by annual forage crop there was almost no loss of SOM. In spite of these findings crop rotations with 20–25% summer fallow are recommended. In the Kulunda steppe of Altay, WS, theadoption of soil conservation practices on sandy loams has helped to control wind erosion but crop rotations including summer fallow have been causing increased losses of SOM (Gnatovskiy, 2003). Over 15 years, the annual loss of SOM in the 0–20 cm soil layer was 0.68 t ha−1 compared with no significant losses under continuous wheat or perennial grasses. Although recognizing that summer fallow results in the loss of SOM and is not particularly efficient in conserving moisture, the author indicates that summer fallow is a means to control weeds. There is a general belief that in any steppe region summer fallowing is essential. In Kostanay, one of the largest grain growing regions of NK with grain sown on 3 M ha, there is about 800,000 ha of summer fallow which is planned to increase up to 1 M ha in order to control weeds, insect pests
170
Climate Change and Terrestrial Carbon Sequestration in Central Asia
and plant diseases (Tuleubayev, 2003). There is evidence however that soil erosion on bare summer fallow fields is 6 times higher than on fallow with oats as a cover crop (Gilevich, 2003). Some authors advocating summer fallowing agree that it should not be bare but covered. Shramko (2003) came to conclusion that on dark chestnut soils, the black fallow should be replaced with fallow with application of manure or green manure. Loss of SOM during soil erosion should be considered as a loss of crop yields (Zhunusov, 2003). On sloping lands with weakly washed out soils crop yields have been decreased by 15– 25%, on medium washed soils where SOM has decreased by 25–45%, crop yields have been reduced by 35–45%, on strongly washed out soils with SOM losses of 50%, crop yields decreased by 45–75%. The data obtained in a long-term study in Shortandy (Suleimenov and Akshalov, 2004) provides evidence to test the efficiency of cropping systems based on summer fallow practice. The summer fallow is believed to be very important in soil moisture conservation providing greater water storage in soil before planting spring wheat in mid-May. The long-term observations show that water storage in 1 m soil layer before planting of spring wheat depends on inputs applied for different snow management technologies and amounted to the following; on fallow – from 60 to 170 mm, on stubble land – from 40 to 150 mm. This indicates that using similar approaches to management practices on fallow and on stubble one can expect only 20 mm of additional available water under summer fallow. This does not justify keeping land without a crop for one year. Weed control is the most frequently emphasized factor to advocate summer fallow. However there is no evidence that weeds could not be controlled without summer fallow. Moreover research on weed control by tillage and chemicals conducted in Shortandy has concluded that the frequency of herbicides application needed to control weeds was the same with summer fallow occupying in crop rotations from 16 to 33% of cropland (Shashkov, 2003). Summer fallow is reported to improve the nutrient regime of soils for growing grains. In terms of nitrogen, nitrate availability is significantly higher under summer fallow compared with stubble land. But one has to recognize that it is at the expense of SOM and in the long run frequent summer fallow will lead to greater losses of organic matter. Rennie et al. (1976) estimated that the SOM content of soils of Saskatchewan, Canada had declined to 35–44% of their original values. They estimated that crop removal could account for only 30–33% of the N lost from SOM, and that the missing N was equivalent to approximately 36 M Mg to 1974. They further estimated that about 10 M Mg of this lost N (600 kg N/ha) was leached below rooting depth, mainly during fallow periods. The most important integral element of the assessment of cropping practices is crop yield. On average for sixteen years (1988–2003) the advantage of wheat sown first year after summer fallow was 15% higher than on stubble land. The advantage of summer fallow in increasing wheat yield was the highest under low input technologies in dry years. However it is more important to calculate grain production from the total cropland area including fallow which does not produce a crop. In our experiment, the control was the rotation of “fallow-wheat-wheat-barley-wheat”. In continuous grain rotation fallow was replaced by oat for grain. Comparative data for 13 years demonstrated that grain production from the total area always was higher when fallow fields were replaced by oats. Under low, medium and high input technologies yields increased by 6, 18 and 28%, respectively. The first clear and well publicized call to Saskatchewan farmers to re-examine their summer fallowing frequency was issued by Dean D.A. Rennie to a University of Saskatchewan Farm and Home Week audience in 1973 (Austenson, 1998). In the FSU, after the first publication on the possibility of no-fallow farming practices (Suleimenov, 1988), it was thought that there was insufficient evidence to draw firm conclusions. Since then further data is available that incorporates more weather data. This data indicates that the yield advantage of wheat sown after fallow as compared to continuous wheat increased with increased drought. On average, there was no yield decline in continuous wheat on stubble after twenty years provided adequate cultural practices were applied. This new finding contrasts with the belief that grain yield declines gradually with continuous wheat cropping in northern Kazakhstan (Shiyaty, 1986). In spite of these findings many
Central Asia: Ecosystems and carbon sequestration challenges
171
agricultural specialists recommend an increase summer fallow area which may result in increased soil erosion, loss of SOM and serious land degradation. Thus, over fifteen years there was no publication that questions the efficiency of the cropping system based on summer fallow, moreover some scientists and specialists are keen to increase the share of summer fallow in cropland up to 33%. However, a publication in Russia (Shnider, 2004) relates the findings of a very successful innovative large farmer in Western Siberia on an area adjacent to north Kazakhstan. The farm is well equipped with modern tractors, combines and equipment including no-till planters. Strikingly, he states that he has never used summer fallowing on some 28,000 ha over a ten year period although it was recommendation that farmers should keep on average about 15% of cropland under fallow. During an eight year period he was growing spring wheat continuously and harvesting on average 2.11 t ha−1 against 1.59 t ha−1 in the neighbouring district. During recent years he has diversified his crops, planting 3,000 ha of dry pea, 4,200 ha of sunflower and 1,200 ha of maize in 2004. Based on economical efficiency of crop diversification in 2005 he planted 9,000 ha of sunflower, 2,500 ha of both maize for grain and canola. In 2004–2005, two traveling workshops were organized by ICARDA to NKWS to see soil tillage and crop diversification practices on research stations and farms. On the research farms crop rotation was practiced with one third of the cropland under summer fallow while on commercial farms the share of summer fallow was around fifteen percent. Mr. Vadim Shnider was the only farmer out of tens of thousands in the whole region of NKWS who did not use summer fallow. Certainly his farming practices can be considered as very intensive technologies as he has been practicing application of recommended full rates of fertilizers and controlling weeds successfully by applying up-to-date chemicals with modern sprayers. Thus, the farmer Shnider proved on a large scale that under adequate grain growing technologies there is no need to fallow up to 33% of cropland every year (Suleimenov, 2004). Of course continuous grain cropping is not the best alternative. Actually, rotation of small grains with fallow one year out of every 3–5 is a form of monoculture. Recently experiments have been laid out testing crop rotations with no fallow. Alternative crops which could possibly replace summer fallow are food legumes such as field pea, chickpea, lentil (Paroda et al., 2004). In western Kazakhstan chickpea was found to be one of the best preceding crops for grains. When planted after winter wheat chickpea is the most drought resistant high yielding crop among spring crops (Vyurkov, 2003). Long-term data indicated that annual losses of SOM amounted to 1.4 t ha−1 : in typical fertile black soils of northeastern region of Kazakhstan, 1.2 t ha−1 in common black soils, and 0.9 t ha−1 on southern black soils, and 0.5–0.8 t ha−1 on rainfed sierozems and light chestnut soils in the south (Kenenbayev et al., 2004). To maintain soil fertility on rainfed sierozem soils in rotations of grains with fallow once in four years it is recommended to leave all residues of grain crops during harvest and to apply manure (20–40 t ha−1 ) or green manure (4–5 t ha−1 ). Certainly, leaving crop residues during grain harvest is a feasible practice in Kazakhstan but applications of manure or green manure are unlikely to be adopted. SOM can be maintained using well known agronomic practices. On rainfed sieroziems the SOM content decreased from 1.2% to 1.09% after five years under the generally adopted practice of straw removal. Where straw was spread over the soil surface, SOM increased up to 1.4% while the application of 30 t ha−1 of manure once in five years resulted in an increase of SOM up to 1.6% (Omarov, Kozhakhmetiov, 2003). In irrigated light chestnut soils in southern Kazakhstan, rotation of grains with sugar beet with no fertilization decreased SOM content by 0.2–0.3% but it did not change with the application of adequate fertilizer rates. In crop rotations of grains with alfalfa there was no reduction of SOM with or without fertilizers. On sloping croplands, annual soil losses by runoff amounted to 47 M t with a reduction in grain yield of 16–80%. Alfalfa should take an important share in crop rotations (30–35%) for soil fertility management in irrigated agriculture (Kenenbayev et al., 2004). In southeastern Kazakhstan, during 40 years of irrigated agriculture SOM content in 0–20 cm and 20–40 cm layers reduced from 2.60–2.50% to 2.23–2.16% respectively in crop rotations including
172
Climate Change and Terrestrial Carbon Sequestration in Central Asia
wheat, alfalfa and sugar beet and with no fertilization (Ramazanova et al., 2004). With commercial fertilization rates SOM decreased slightly to 2.50–2.35%. For complete soil fertility management with no losses of SOM it was necessary to apply both commercial fertilizers and manure at a rate of 40 t ha−1 once in an eight year rotation. Soil erosion is a major factor for SOM management in the dry sub-tropics of Uzbekistan. Soil losses from water erosion may reach up to 500 t ha−1 on slopes with a gradient of 5◦ or more in a year including annual losses of SOM of 500–800 kg ha−1 , 100–120 kg of N ha−1 , 75–100 kg of P ha−1 (Gafurova et al., 2004). On areas subject to soil erosion by water, losses of nitrogen are equivalent to 70% of that applied with fertilizers and losses of phosphorus exceed the rates of fertilizer applied. SOM may be lost by widespread practices of burning stubble. On typical sierozem soils a loss of biomass in terms of above ground and root residue as a result of burning of crop residue amounted to 35–38% while on dark sierozems the loss of biomass amounted to 57–59% (Riskiyeva et al., 2004). With the grain crop residue burnt, losses of nutrients amounted to 100–160 kg of N ha−1 , 900–1400 kg of C ha−1 . The main causes of land degradation in mountain areas are soil erosion by wind and water, soil salinization and water-logging (Shokirov, 2001). Intensive development of soil erosion with gulley formation has been observed in all natural zones of Tajikistan. The main reason for soil salinization is unsatisfactory maintenance of collector and drainage systems with as much as 30% of horizontal and vertical drains non-functional. The area covered with forest decreased from 392,100 ha in 1988 to 171,500 ha in 2000 (Shokirov, 2001) as a result of uncontrolled wood cutting. This status is a characteristic feature of all mountain countries in Central Asia and the Caucasus. Poor ecological status of soil cover is a result of inadequate soil management by farmers who have only short-term outputs in mind and who use monocultures (Jumabekov, 2001). Thus 70% of soil area is subjected to erosion including 80% of the cropland in Kyrgyzstan. Intensive use of rainfed foothill grey-brown soils in Azerbaijan over 50–100 years under 400–500 mm annual rainfall reduced SOM contents in the 0-25 cm layer from 2.5–3.8% to 1.5–2.0% (Gasanov et al., 2001). Land management using sowings of perennial forages is an efficient practice to maintain soil OM. Studies on sloping lands in Tajikistan with alfalfa in row spacings between almond rows and irrigated by sprinklers, indicated an increase of SOM in 0–50 cm layer from 0.27–1.62% (Kabilov and Sanginov, 2001). Also, annual mulching with straw increased SOM significantly. Studies in Tajikistan demonstrated that application of green manure for maize (mixture of clover with rapeseed) resulted in a reduction of nitrogen application rates by 50 kg ha−1 (Rashidov et al., 2001). There is a varying attitude to the role of shelter belts in dryland agriculture in the different areas of the steppe belt. In the NK, the shelter belts were not recommended because they were believed to contribute to uneven snow distribution in between windbreaks (Barayev, 1960). In WS, some scientists favored shelter belts but it was not a widely adopted practice (Kashtanov, 2003). In VA, shelter belts have been recognized as important part of farming systems in dryland agriculture (Arkhangelskaya, 2005).
3.2 Range management Although arid and semi-arid ecosystems are known to have substantially lower productivity than forests, we hypothesize that the vast landscapes of Central Asia, dominated by rangeland ecosystems, could be an important contributor to the “missing carbon sink”. Thus we studied the daily magnitudes and growing season dynamics of net ecosystem CO2 exchange (NEE) in representative rangelands. The magnitude of daily NEE at the peak of growing season was highest in the steppe site at Shortandy as compared to semi-desert and desert sites. Results from 1998–2000 measurements of daily and growing season NEE indicated that rangelands of Central Asia are potential sinks for atmospheric CO2 . Among the three study sites, differences in magnitude of 20-min and daily NEE
Central Asia: Ecosystems and carbon sequestration challenges
173
at peak season were consistent with variations in CO2 sink capacity for the whole growing season. Long-term precipitation data from nearby weather stations indicated that mean annual precipitation at Shortandy was much higher than in arid steppe in Uzbekistan and desert in Turkmenistan where parallel studies were conducted. This trend of annual precipitation agreed with the pattern of total NEE for the growing season. This suggests that annual precipitation is a key environmental factor influencing the capacity of Central Asian rangelands to act as sinks for atmospheric CO2 (Saliendra et al., 2004). Kazakhstan has a huge rangeland area of 180 M hha, which could be a carbon sink of global importance under proper management. During the transition period from centrally commanded to market oriented economical policies, livestock and rangeland management were greatly affected. During the first period of reforms from 1992–1998 small ruminant numbers were reduced dramatically from 34 to 10 M heads as a result of fragmentation of large farms and distributing livestock to small holders. Small ruminant populations during 1928–1934 decreased from 19.2 M to 2.3 M (Asanov et al., 2003). In six years dedicated to collectivization, Kazakhstan lost about 17 M heads of sheep and goats, while during six years of de-collectivization the country lost 24 M heads of sheep and goats. The striking problem of new production systems emerging after the break up of centrally organized farming system was the failure to adequately and timely use the rangelands – the cheapest feed source although reduced livestock herds were left on the vast rangeland area. Large flocks of small ruminants used to be managed by different seasonal and rotational grazing strategies, some involving the movement of flocks through several thousand of km in the year to graze seasonal ranges allocated by government for each large state farm. Nowadays the expansive movement of flocks by small producers is virtually impossible, as this is not economical. As a consequence animals roam nearby ranges around the villages causing intense degradation of rangelands nearby villages and leaving remote rangelands ungrazed. The consequence of overgrazing is the decreased productivity around villages even in spring when fodder availability is greatest. Fodder availability is 1.5 times greater at 6 to 12 km away from homesteads and 2.5 times in remote ranges (Iniguez et al., 2004). Such conditions apply to all countries, even those where the reforms were not applied extensively, and are particularly critical during fall and winter. The consequence of this is direct land degradation and the rise of conflicts near farms due to increased competition for resources. To benefit from adequate feed resources access to the remote ranges should be considered urgently. Community action is required in order to overcome the financial limitations for individual farmers. This can be achieved by the promotion of associations for collective range grazing and consolidation of flocks. The other area which may play important role in carbon sequestration is marginal lands used during the Soviet period for grain production and nowadays abandoned. During 1992–1998 over 10 M ha were left as weedy fallows. The major reason for this strategy was the low productivity of these lands. But the other reason was low resource capacity of agricultural producers who were not able to cultivate these lands. Over the last five-six years the grain industry is recovering and is becoming a profitable business. Hence, some profitable companies would like to put back these marginal lands to grain production when grain prices will be favorable. Therefore, it is a great challenge to introduce government policies to prevent the use of the abandoned marginal lands for grain production. Overstocking of mountain rangelands and intensive haymaking reduced plant cover by 36–48% and reduced rangeland productivity by 30%, followed by reduced percentage of edible plants and increased share of poisonous and non-edible plants. The process has been exacerbated in recent years as a result of increased use of shrubs for fuel (Aknazarov, 2001). In the rainfed area of the Gissar valley, 93% of rangelands were found to be affected by erosion, including 45% severely eroded and 38% moderately eroded (Sanginov and Aliyev, 2001). In southern Tajikistan, a survey conducted in 1969–1990 indicated that 60% of rangeland soils were subjected to erosion, including 12.7% very severely eroded with very poor productivity (Boboyev, 2001).
174 4
Climate Change and Terrestrial Carbon Sequestration in Central Asia CHALLENGES
In different ecosystems the potentials for carbon sequestration and the challenges can be summarized as follows: • In semiarid steppe belt: a reduction of summer fallow and its elimination in the future, reducing tillage to minimum with the final goal of zero tillage, introduction of shelter belts in accordance with recommendations of forestry science. • In dry steppe belt: reducing summer fallow, replacing clean summer fallow with chemical, covered and partly occupied types of fallow, reducing tillage to minimum with the final goal of zero tillage, introduction of shelter belts in accordance with recommendations of forestry science. • In semi-desert and desert rangeland areas: introducing better grazing management including limiting stock numbers to prevent rangeland degradation, establishing shelter belts in accordance with recommendations of forestry science, introducing policies preventing using of shrubs and trees for fuel as well as using marginal lands for crop production. • In irrigated agriculture: addressing issues of soil salinization through better management of irrigation and drainage systems, increasing crop diversification by adopting more food and forage legumes into crop rotations, introducing conservation agriculture practices preventing soil erosion and maintaining soil fertility. • In mountainous areas: introducing policies preventing intensive forest cutting for timber and for fuel, introducing integrated feed and livestock production to prevent overgrazing of rangelands, introducing conservation agriculture approaches including no-tillage, strip cropping, mulching and terracing to prevent soil erosion.
REFERENCES Arkhangelskaya, G.P. and O.I. Zhukova. 2005. Ecological potential of forestations of the Volgograd province. p. 48–54. In: Issues of the Volgograd State University. Proc. of the Round Table, (Rus). Aknazarov O. 2001. Desertification of anthropogenic landscapes of Pamir and measures to soften its negative consequences. p. 143–145. In: Proceedings of Soil Science Congress of Tajikistan, , Dushanbe, Tajikistan (Rus). Asanov, K., B. Shakh, I. Alimayev, and S. Prianishnikov. 2003. Pasture Farming in Kazakhstan (Textbook). Gylym publishers, Almaty, Kazakhstan translated into English. Austenson, H.M. 1988. A continuing reexamination of summerfallowing in Saskatchewan. p. 814–816. In: Challenges in dryland agriculture. A global perspective. Proc. of Intl. Conf. on Dryland Farming, Amarillo, Bushland, Texas. Babayev, A. 1995. Problems of desert development. Ylym Publishers, Ashgabat, Turkmenistan (Rus). Barayev, A. 1960. Cropping structure and crop rotations in grain farming of northern Kazakhstan. J. Zemledeliye, #7 (Rus). Boboyev, R. 2001. Ecological aspects of soil status of rangeland territory of Southern Tajikistan. P. 288–290. In: Proc. of Soil Science Congress of Tajikistan. Dushanbe, Tajikistan (Rus). Gafurova L., K. Mirzazhanov, K. Makhsudiv, and O. Khakberdiyev. 2004. Influence of mineral fertilizers on winter wheat on eroded sierozem soils. p. 183–187. In: Proc. of First National Conference on Wheat Improvement and Agronomy Technologies in Uzbekistan. Tashkent State University, Uzbekistan (Rus). Gasanov, B., N. Novruzova, R. Aslanova, and C. Galandarov. 2001. Low-productive rainfed soils of foothills of Azerbaijan and restoration of their fertility. p. 14–150. In: Proc. of Soil Science Congress of Tajikistan. Dushanbe, Tajikistan (Rus). Gnatovskiy V. 2003. Some peculiarities of adaptive landscape farming systems in Kulunda zone of Altay area. p. 86–93. In: Proc. of Intl. Conf. on Development of soil conservation practices in new socioeconomic conditions. Shortandy, Kazakhstan (Rus). Gilevich S. 2003. Crop diversification in crop rotations of Northern Kazakhstan. p. 239–250. In: Proc. Intl. Conf. on Development of soil conservation practices in new socioeconomic conditions. Shortandy, Kazakhstan. (Rus).
Central Asia: Ecosystems and carbon sequestration challenges
175
Iniguez, L., M. Suleimenov, S. Yusupov, A. Ajibekov, M. Kineyev, S. Kherremov, A. Abdusattarov, and D. Thomas. 2004. Livestock production in Central Asia: Constraints and Research Opportunities. p. 278– 302. In: J. Ryan and J. Vlek, and R. Paroda (eds.). Proc. of a Symposium on Agriculture in Central Asia: Research for development. ASA Annual Meeting, Indianapolis, Indiana. ICARDA, Aleppo, Syria. Kabiliov, R., and S. Sanginov. 2001. Changes in organic matter and nitrogen content in sloping lands under long-term cropping irrigated with sprinklers. p. 312–313. In: Proc. of Soil Science Congress of Tajikistan. Dushanbe, Tajikistan (Rus). Kashtanov, A.N. 2003. A.I. Barayev and modern agriculture. p. 3–7. In: Proc. of Intl. Conf. on Development of soil conservation practices in new socioeconomic conditions. Shortandy, Kzakhstan (Rus). Khramtsov, I., and V. Kholmov (eds.), 2003. Farming practices on lowland landscapes and agro-technologies in Western Siberia. Novosibirsk, Russia, 412 p. (Rus). Kenenbayev, S., A. Iordanskiy, and K. Balgabekov. 2004. Main outcomes of research on soil fertility management. p. 66–80. In: Proc. of Conf. “70 years to Scientific Production Center of Soil and Crop Management.” Nurly Alem Publishers, Almaty, Kazakhstan (Rus). Medvedev, I., N. Levitskaya, and I. Ryabova. 2003. Resources availability and agroecological sustainability of various agro-landscapes in black soil zone of Volga area. p. 104–116. In: Proc. Intl. Conf. on Development of soil conservation practices in new socioeconomic conditions. Shortandy, Kazakhstan (Rus). Omarov, B., and M. Kozhakhmetov. 2003. Soil biologization – to conservation agriculture. p. 297–305. In: Proc. Intl Conf. on Development of soil conservation practices in new socioeconomic conditions. Shortandy, Kazakhstan (Rus). Paroda, R., M. Suleimenov, H. Yusupov, A. Kireyev, R. Medeubayev, and L. Martynova. 2004. Crop diversification for dryland agriculture in Central Asia. p. 139–151. In: S. Rao and J. Ryan (eds.). Challenges and strategies of dryland agriculture. CSSA Special Publication 32, Madison, WI. Ramazanova, S., G. Baymaganova, E. Suleimenov. 2004. Agrochemistry research in Kazakh Research Institute of Soil Management. p. 80–89. In: Proceedings of Conference “70 years to Scientific Production Center of Soil and Crop Management.” Nurly Alem Publishers, Almaty. (Rus). Rashidov, Kh., D. Gaziyev and S. Gaforov. 2001. Influence of green manure on soil fertility and grain yields of maize on stony soils of northern Tajikistan. p. 328–330. In: Proc. of Soil Science Congress of Tajikistan. Dushanbe, Tajikistan (Rus). Rennie, D.A., G.J. Racz, and D.K. Mcbeath. 1976. Nitrogen losses. p. 325–353. In: Proc. of the western Canada nitrogen symposium. Alberta Agriculture, Edmonton, Alberta, Canada. Riskiyeva, Kh., A. Bairov, R. Riskiyev, and M. Mirsadykov. 2004. Change of fertility and ecologic status of soil as affected by stubble burning. p. 325–353. In: Proc. of First National Conf. on Wheat Improvement and Agronomy Technologies in Uzbekistan. Tashkent State University, Uzbekistan (Rus). Saliendra, N.Z., D.A. Johnson, M. Nasyrov, K. Akshalov, M. Durikov, B. Mardonov, T. Mukimov, T. Gilmanov, and E. Laka. 2004. Daily and growing season fluxes of carbon dioxide in rangelands of Central Asia. p. 140–154. In: J. Ryan, P. Vlek, and R. Paroda (eds.). Proc. of a Symposium on Agriculture in Central Asia: Research for Development. ASA Annual Meeting, Indianapolis, IN, 2002. ICARDA, Aleppo, Syria. Sanginov, S. and I. Aliyev. 2001. Ecologic and soil quality conditions and factors of desertification in Gissar valley. p. 152–160. In: Proceedings of Soil Science Congress of Tajikistan. Dushanbe, Tajikistan (Rus). Shashkov, V. 2003. Integrated weed management in grain crops. p. 274–279. In: Proc. of Intl. Conf. on Development of ideas of conservation agriculture in new socioeconomic conditions. Shortandy, Kazakhstan, (Rus). Shnider, V. 2004. Large Grain Farm in Siberia. D. Vermel (ed.). Moscow. 27 p. Shramko, N. 2003. Role of crop rotations in addressing issues of biologization and ecologization of conservation agriculture. p. 145–153. In: Proc. of Intl. Conf. on Development of soil conservation practices in new socioeconomic conditions. Shortandy, Kazakhstan. (Rus). Shokirov, U. 2001. Status of land resources of republic Tajikistan, its conservation and rational use. p. 22–26. In: Proc. of Soil Science Congress of Tajikistan. Dushanbe, Tajikistan (Rus). Shiyaty, E. 1996. Three years grains-fallow rotations in steppe of Kazakhstan. J. Zemledeliye, Number 6 (Rus). Suleimenov, M.K. 1988. About theory and practice of crop rotations in Northern Kazakhstan. J. Zemledeliye, Number 9 (Rus). Suleimenov, M. 2004. Farmer’s folly. In newspaper “Kazakhstanskaya Pravda.” 3 September, 2004, Astana, Kazakhstan (Rus). Suleimenov, M. and K. Akshalov. 2004. Issues of transition from grains-fallow rotations to no-fallow crop rotations. p. 33–39. In: V. Loshakov (ed.). Proc. Intl. Conf. on Crop rotation in modern farming practices. Moscow Agricultural Academy, Moscow. (Rus).
176
Climate Change and Terrestrial Carbon Sequestration in Central Asia
Tuleubayev, T. 2003. Main factors of sustainable development of agriculture in Kostanay region in new socioeconomic conditions. p. 127–140. In: Proc. Intl. Conf. on Development of soil conservation practices in new socioeconomic conditions. Shortandy, Kazakhstan (Rus). Viurkov, V. 2003. Crop rotations of conservation agriculture of Ural area. p. 116–127. In: Proc. of Intl. Conf. on Development of soil conservation practices in new socioeconomic conditions. Shortandy. (Rus). Zhunusov, K. 2003. Influence of slope exposition on runoff and soil losses. p. 83–86. In: Proc. Intl. Conf. on Development of soil conservation practices in new socioeconomic conditions. Shortandy. (Rus). Zhumabekov, E. 2001. Soil fertility management in Kyrgyzstan. p. 43–44. In: Proc. Soil Science Congress of Tajikistan. Dushanbe, Tajikistan (Rus).
CHAPTER 13 Dynamics of soil carbon and recommendations on effective sequestration of carbon in the steppe zone of Kazakhstan
A. Saparov Soil Science Institute, Academgorodok, Almaty, Kazakhstan
K. Pachikin, O. Erokhina & R. Nasyrov Soil Research Institute, Academgorodok, Almaty, Kazakhstan
1
INTRODUCTION
Maintenance of the carbon (C) balance in the atmosphere is one of the most urgent global ecological problems of the 21st century. Increasing concentrations of carbonic acid in the lower layers of the atmosphere are caused not only by industrial emissions but also by the irrational use of natural resources. This leads to the destruction of natural biogeochemical cycles of ecosystems, with the destructive processes of biomass transformation by mineralization occurring more frequently than the productive processes of photosynthesis and humification. Uncontrolled economic activity causes soil alienated through degradation from the biological cycle, and inefficient agricultural systems deplete the soil fertility, which is determined by humus content and soil C levels, among other variables. The steppe zone is one of the regions in The Republic of Kazakhstan (RK), where the problem of soil degradation is especially serious. Factors responsible for intensive development of agriculture in the region include favorable natural-climatic conditions and sufficient availability of water resources. During the first half of the 20th century, the local population had traditionally used these regions as highly productive pastures. However, these ecosystems were converted to arable lands following either natural ecosystems or pastoral land use. The area of arable lands in the steppe zone of the RK comprised 29.3 million ha (Mha) or 75% of the total arable land of the RK by the early 1990s. Despite the lack of profitable grain production, these lands intensively farmed until the disintegration of the former Soviet Union. The long-term exploitation of lands under minimal field management and the intensive application of mineral fertilizers and herbicides caused a drastic decline in soil C levels, and acceleration of erosion and deflation processes. Consequently, the plowed layers of cultivated soils in the steppe zone of RK lost up to 30% of their antecedent C pool in comparison with the antecedent level in 1954. The area under arable land sharply declined in the 1990s, primarily due to the economic difficulties during the transition period, and because of a considerable decline in soil fertility caused by soil degradation. Large land areas used for pastures are now set aside as lay lands overgrown to varying degrees by natural fallow vegetation. Although these lands are covered by weeds and unpalatable species not suitable or grazing, they are still categorized as arable lands. Biological diversity of the unique steppe landscapes has strongly declined. The specific structure of vegetation has changed because of the overgrazing of pastures. Rich virgin steppes have been transformed into secondary weed communities, which have lead to an appreciable decline in soil C pool. 177
178
Climate Change and Terrestrial Carbon Sequestration in Central Asia
The problems of land resources management for a steady development of the regions, control of soil cover under diverse ecological conditions, conservation and enhancement of soil fertility, and prognosis of soil anthropogenic transformations are of special importance at the dawn of the 21st century. There is a pressing need to develop scientifically proven recommendations on the stabilization and increase of soil C content, as a parameter, defining soil bio-productivity, and finally, social and economic well-being of a society. Therefore, the objective of this chapter is to describe the impact of land use conversion on soil C pool, and identify soil management options to restore degraded ecosystems and enhance soil C pool in different ecoregions of RK. 2
PRINCIPAL ECOREGIONS AND FACTORS DETERMINING THE DYNAMICS OF C POOL IN SOILS OF THE STEPPE ZONE
The steppe zone covers the northern and central part of RK and occupies an area of 126.2 Mha or 42.6% of the total land area. The large land area encompasses a variety of landscapes and diverse soils. The northern part of the steppe zone, located in the West-Siberian lowland, is characterized by the lowest absolute heights and flat terrain. Oval uplands and plains (Obshy Syrt, Poduralskoye plateau, Zauralskoye plateau, Turgai tableland) prevail in the western part of the zone. These are alternated by denudation plains or plateaus (Kazakh hummocky topography) with the massifs of insular low mountains (Ulutau, Kokchetau, Bayan-Aul, Karkaralinsk and other) in the central and eastern regions. Zonal sequence of soils, namely progression of dry conditions from the north to the south, is the principal factor that determines the heterogeneity of soil cover in the steppe zone of RK and, the resultant C pool in different soils. Furthermore, provincial peculiarities, connected with lythology-geomorphologic conditions of soil cover formation influence the spatial position of zonal boundaries. The vertical zonality is limited, and is primarily located on the insula mountains of the Kazakh hummocky topography and mountainous Mugodzhary. From the soil-geographic point of view, the steppe zone of RK comprises five distinct sub-zones: regular chernozems of moderately arid steppes, southern chernozems of arid steppes, dark-chestnut soils of moderately-dry steppes, chestnut soils of dry steppes and light-chestnut soils of desert steppes (Figure 1). The climatic conditions of soil cover formation, the mean value of principal parameters shown in Table 1, appreciably differ within the specified sub-zones, but have several common features. Average annual air temperature is positive for the whole steppe zone with natural increase to the south with the corresponding decrease in annual precipitation. Average annual amplitudes of temperature vary widely. The warmest month is July (20–22◦ C), and the coldest is January (−17–20◦ C). The depth of soil freezing in winter is the greatest in the central part of the zone (up to 2 m); it is connected with a small amount of autumn precipitation, the lowest snow cover and increased heat conductivity of the soils. Average parameter for the zone is 120–150 cm. Precipitation is more frequent during the warm period of the year, and up to 70–80% of the annual amount is received during the summer. Thus, it leads to a significant loss of water by evaporation. Snow cover in winter is low throughout the region, and a rapid increase of temperatures in the period of snow melt after a significant freezing of soils in winter is accompanied by a redistribution and drainage of thawed snow into the low lying valleys of the landscape. These climatic peculiarities create diverse soil covers and structures along with a wide range of soil combinations (complexes, combinations, mottles), connected with a different meso- and microrelief soil occurrence, increasing with the increase in climatic aridity. The moderately arid and arid steppe zone of chernozems is characterized by a flat terrain, and it occupies about 25.3 Mha of land area. The vegetation cover is represented by grass-Stipa vegetation (decreasing in species and percentage ratio further south), and birch-aspen kolki are observed in the northern part of the zone in closed depressions of the relief. Regular and southern chernozems
Dynamics of soil carbon and recommendations on effective sequestration of carbon
Figure 1. Table 1.
Sub-zones
179
The five sub-zones of the steppe zone of the Republic of Kazakhstan (RK). Mean climate indices of soil sub-zones in the steppe region of Kazakhstan.
Avg. T(◦ C)
Average Frost free annual Sum of period amplitude T > 10◦ C (days) of T (◦ C)
Regular 0.6–0.8 2070 chernozems of moderately arid steppe Southern 1–1.5 2160 chernozems of arid steppe Dark-chestnut 1.5–2 2310 soils of moderate dry steppes Chestnut soils of 2–4 2380 dry steppes Light-chestnut 4–7 2490 soils of desert steppes
Depth snow Annual cover Pct. (cm) (mm)
Pct. when T > 10◦ C (mm)
Hydrothermic coefficient for yearly warm period
114–118
37
23–26 320–350 220–230
0.9–1.0
107–119
38
21–26 300–330 160–180
0.8–0.9
128–131
39
20–23 270–300 150–170
0.7–0.8
131–147
40
18–23 220–270 130–150
0.6–0.7
131–158
40
16–21 180–210 90–100
0.4–0.5
(normal, calcareous and alkaline) are the dominating soil subtypes. These soils cover 60–65% of the whole territory, 20–22% are comprised of complexes of zonal soils with steppe alkali, and about 10% are hydromorphic and semihydromorphic soils (meadow-cherno-zemic, meadow, meadowboggy). Alkaline soils (steppe, meadow-steppe and meadow) and solonchaks occupy only a small area of about 3–4%.
180
Climate Change and Terrestrial Carbon Sequestration in Central Asia
Moderately-dry, dry and desert-steppe zone of chestnut soils, located further south, occupy more than 90 Mha and are characterized by more complex surface structure. Xerophytic turf-like cereals (Stipa, Festuca) with small presence of grasses (Linosyris, Potentila, Piretrum) and different spices of Artemisia prevail in vegetation cover of zonal soils in the northern part of the zone. Presence of Artemisia L. in the vegetation cover increases further south with decline in vegetation cover from 60–80% to 40–50%. The proportional reduction in area of nonsaline zonal soils from 40–50% to 10–20% further south is typical for the zone soil cover structure. The areas of complexes of zonal soils with alkali characteristics increase from 30% in the sub-zone of dark-chestnut soils to 45 to 50% in the subzone of light chestnut soils. Slightly developed soils (up to 7–15% in the structure of soil cover) are widely distributed within Kazakh hummocky topography. The area under solonchaks is about 3%. The soils of hydromorphic and semihydromorphic moisture regimes are not widely distributed in this zone. The soil C pool changes according to the heterogeneity of soil cover structure, as the balance of organic matter characterizes each taxonomic soil unit down to the soil series level, as is determined by the complex soil-forming factors. The soil C pool is a parameter which reflects an equilibrium condition, and is and the result of the interactive effect of two diverse yet interconnected processes: humification and mineralization of plant residues. The research data show that the ratio of annual average temperatures and the sum of precipitation, appropriate to moderately arid steppe sub zone of the regular chernozems, is the best for accumulation of carbon in soil. The soil C pool decreases because of low humidity and high temperatures especially when the hydrothermal coefficient is less than 1. Vegetation cover is one of the most important factors that determine the amount and composition of organic residues input into a soil. These residues are the main source of C accumulation in soil. The above ground and root residues serve as a source of biomass for the humification and these may be considered as one of the parameters affecting potential soil fertility. Reduction in the general stocks of vegetative biomass and corresponding C level in soil is observed with the changes in climate from moderately arid steppes to desert steppes. The research data show that the maximum amount of biomass (above ground and below ground) among the natural biomes of the steppe zone in RK accumulates under the grass-Stipa, Festuca-Stipa vegetation (580–600 c ha−1 ), followed by that under Stipa-Festuca (470–490 c ha−1 ), Artemisia-Festuca (350– 360 c ha−1 ) associations, and progressively declines with decrease in precipitation (Gromyko et al., 1964). The data on deccomposition show that only about 10% of the vegetation residues returned to the soil is humified and the remaining 90% of organic matter is mineralized into CO2 (Titlyanova et al., 1998). The root biomass is the principal factor determining C accumulation in soil. The principal component of vegetation biomass is represented by roots in the plant associations of the steppe zone. Due to the increase in climatic aridity, the ratio of above-ground to below-ground biomass is 10.3 for regular chernozems, 13.4 for southern chernozems, 16.0 for dark-chestnut soils, and 19.22 for light chestnut soils (Kolkhodzhayev, 1974). The highest amount of C is stored in the upper horizons of the soil. Soil C stock in 0–20 cm layer contributes 40–42% of the total C stock to 1-m depth, and that in the 0–50 cm layer contributes 75% of the total C stock to 1-m depth (Vishnevskaya, 1974). Soil C stock is not constant during a year, and varies among seasons. It decreases at the beginning of summer because conditions are favorable for mineralization of organic matter. The maximum intensity of decomposition is observed at soil moisture content of about 60–80% of the total moisture capacity, and temperature reaches about 30◦ C (Vishnevskaya, 1974). The loss of C in the upper root layer of 0–20 cm at those conditions can be as much as 15–18 t ha−1 , taking into account an intensive biomass increase in vegetation which uses nutrients or mineral nutrition for the vegetation growth (Ponomaryova et al., 1980). The level of C in soil is stabilized at the end of summer, when the plant growth practically stops and the microbiological activity of soils decreases. At this time, new humic substances are not involved in the biological processes but they are bound with the mineral fraction of soil,
Dynamics of soil carbon and recommendations on effective sequestration of carbon
181
forming strong organo-mineral compounds. Both root and the above-ground biomass debris and root secretions (organic acids, amino acids, lactose, ferments), the proportion of which makes up more than 10% of the vegetation biomass, are the sources of the increase in soil C stock by the end of summer (Ponomaryova et al., 1980). The amplitude of seasonal fluctuations of soil C stock decreases with the increase in soil depth, and no change is observed below 50 cm depth. Together with common bioclimatic conditions, lythology-geomorphologic conditions of soil occurrence and the moisture regime strongly influence the soil C stock. C stock in zonal soils of one sub zone differs naturally among soils of different texture. It is high in soils of heavy texture (clayey, heavy loam) and low in those of light texture. Decrease of C stock in light-textured soils is caused by an intensive decomposition of organic matter and weak fixation of newly formed substances by the mineral component of the soil. The variability in the C stock is caused by soil characteristics as influenced by the forms of topography in conditions of a dissected terrain. It is natural that the C stock is lower on the slopes due to the accelerated erosion, and the soils that occur on the concave slope accumulate more organic matter transferred from the adjacent upslope soils. The average values of the C stock in principal soils of the steppe zone of RK are given in the Table 2. The data in Table 2 show that the C stock in the layer 0–50 cm in soils of the steppe zone in RK ranges within considerable limits, decreasing from the value of 136–170 t ha−1 for zonal soils of moderately arid steppe subzone up to 49–52 t ha−1 in the desert-steppe subzone soils according to the zonal changes of bioclimatic conditions of soil cover formation. Alkaline soils have the lowest level of inherent fertility and C stock among the zonal soils. It is due to poor hydrological and physical properties, and unfavorable conditions for vegetation growth and development. Calcareous soils don’t appreciably differ from the normal zonal soils in the humus content, but the C stock is somewhat higher either in the 0–50 cm layer or in the 0–20 cm layer. This trend in C stock is attributed to the heavy texture of calcareous soils. The lowest C stock values of 25–35% less than in old soils are typical for undeveloped soils which have a shallow humus horizon, scarce vegetation cover, and consist of a large skeletal fraction. More favorable conditions for vegetation development exist where there is additional ground cover and surface wetness. These conditions promote the accumulation of organic matter in soils. As a result, the hydromorphic and semihydromorphic soils are rich in humus content and C stock in comparison with the automorphic zonal soils. The difference in C stock is higher under arid than humid conditions. Salinization and extremely unfavorable hydrological-physical properties are the limiting factors to the development of vegetation in alkaline soils. Thus, C stock in these soils is low, and is in the range of 30–75 t ha−1 , which is 40–50% less than that of the normal zonal soils.
3
DYNAMICS OF C STOCK IN SOILS UNDER AGRICULTURAL USE
The main factor which changes the soil C balance is the conversion of steppe zone soils to agriculture. The most cardinal changes are brought about by the agricultural land use and related activities. The steppe zone of chernozems is characterized as non-irrigated agricultural zone for grain crop production. The subzone of regular chernozems is relatively stable, but the subzone of southern chernozems is not stable. The frequency of droughts in the last subzone is 25%, or one in four years. Regular and southern chernozems are the best arable lands among the zonal soils of the steppe zone in RK, and they are almost entirely cultivated for grain crop production. The subzones of dark-chestnut and chestnut soils, or the so-called zone of “risky agriculture”, are characterized by climatic instability. Frequency of droughts ranges from 35 to 50% or once in two or three years. Thus, agronomic yield decreases by 3–4 times in case of the extended period of droughts. Sometimes, there is a total crop failure. A wide spread problem of alkalization in those soil covers is a limiting factor to agricultural development.
182
Climate Change and Terrestrial Carbon Sequestration in Central Asia
Table 2.
Carbon stock in soils of the Kazakhstan steppe zone. Carbon stock 0–50 cm layer
0–20 cm layer
Type of land
(t ha−1 )
Virgin Arable
165 149
Regular calcareous chernozems
Virgin
170
Regular alkaline chernozems
Virgin Arable
136 120
Regular slightly developed chernozems
Virgin
107
Southern normal chernozems
Virgin Arable
115 103
90
75 63
83
Virgin Arable
132 113
86
56 48
85
Virgin Arable
101 90
89
60 52
86
Southern slightly developed chernozems
Virgin
93
51
Meadow-chernozemic typical
Virgin
192
134
Dark-chestnut normal
Virgin Arable
102 91
Dark-chestnut calcareous
Virgin Arable
117 98
Dark-chestnut alkali
Virgin Arable
93 86
Dark-chestnut slightly developed
Virgin
95
Chestnut normal
Virgin Arable
75 68
Chestnut calcareous
Virgin Arable
73 62
Chestnut alkaline
Virgin
62
33
Chestnut slightly developed
Virgin
51
33
Light-chestnut normal
Virgin Arable
53 49
Virgin Arable
5245
Soils Regular normal chernozems
Southern calcareous chernozems Southern alkali chernozems
Light-chestnut calcareous
% of virgin soil 90
(t ha−1 ) 98 83
85
85 88
78 68
87
73
89
52 43
82
85
60 50
83
92
47 43
90
54 90
40 32
80
85
36 30
83
92
28 22
78
86
30 24
80
Light-chestnut alkaline
Virgin
49
25
Light-chestnut slightly developed
Virgin
46
31
Meadow-chestnut typical
Virgin Arable
131 114
Virgin
257
Meadow typical
% of virgin soil
87
75 70 145
Alkali steppe
Virgin
74
46
Alkali desert-steppe
Virgin
34
21
93
Dynamics of soil carbon and recommendations on effective sequestration of carbon Table 3.
183
Distribution of arable lands in the sub-zones (Adapted from Dyusenbekov, 1998). Area (Mha)
Sub-zones Regular cheronozems of moderately arid steppe Southern chernozems of arid steppe Dark-chestnut soils of moderately dry steppes Chestnut soils of dry steppes Light-chestnut soils of the desert steppes
Of the whole sub-zone
Arable land (% of total area) Arable lands in 1977
Of sub-zones
Of all arable Kazakhstan land
11.7
7.3
59.8
24.3
13.6
7.2
52/9
24.0
27.7
10.0
36.1
30.3
24.3 38.4
3.6 1.5
14.8 3.9
12.0 5.0
The lands of the desert-steppe zone are mainly used as pastures due to extreme aridity of the climate. Frequency of droughts is up to 75%, or in 3 out of 4 years. Normal zonal soils (without alkalinity and salinization) are not widely distributed and are attributed to the parent material of light textured mechanical composition. The areas of arable lands in the steppe zone of RK, percent of total area and distribution in the subzones, are given in Table 3. The anthropogenic changes in cultivated soils are mainly related to the decrease in humus content, caused by mixing of the surface horizons, erosion and deflation of humus with the fine earth, humus mineralization and removal of nutrient elements by harvested crops. It is also caused by mechanical disturbance of surface horizon (A and partially B1) structure and strengthening or compaction of subsurface horizon. The research data show that losses of C occur in arable non-irrigated soils and in the sub-soil layer, up to 1-m depth. These losses essentially vary depending on the soil morphological properties, relief, crop rotation, tillage system, application of fertilizers and can be as much as 30% in the plow layer (Rubinstein and Tazabekov, 1985). On average, chernozems have lost 19–22% and chestnut soils 28–30% of humus over 50 years of cultivation. Average annual loss of C is about 4.6–5.8 t ha−1 (Akhanov et al., 1998). Soil C stock in natural ecosystems, amount of organic matter formed by biomass and release of C into the atmosphere by mineralization of plant residues, is at a steady state, and the processes of organic matter accumulation are unremitting as natural biomes consist of plants of different phenological rhythms. The ecological regime of soils sharply changes under arable land use. The rhythm of agroecosystem production process is set artificially, and the interaction of plants with soil is limited in time. A considerable part of organic matter of agroecosystems is removed irreversibly, and the biochemical equilibrium is disturbed, leading to the depletion of soil C stock. Up to 50–60% of organic matter is removed with harvests and economically useful production in agroecosystems (Titlyanova et al., 1998). An accelerated decomposition of organic matter occurs in arable lands. It is caused by the change in water, air and temperature regimes, strengthening of microbiological activity, and weakening or breakdown of soil aggregates. The major part of plant residues of the former virgin or climax vegetation is decomposed in 8 years of cultivation (Gromyko et al., 1964). This process occurs more intensively on fallow fields. Inactive or recalcitrant humus fraction is involved in the biological cycle; nutrient elements are transformed into an available form, absorbed by plants, and removed with crop harvests. The research data shows that the roots of the crops in the 0–50 cm layer of cultivated soils decompose 1.4–1.6 times faster than roots of vegetation in virgin soils (Vishnevskaya, 1974). The labile component of C stock increases, because the biomass input of the cultivated vegetation
184
Climate Change and Terrestrial Carbon Sequestration in Central Asia
(120–140 c/ha) is lower than that of the virgin soil (350–360 c/ha for the dark-chestnut soils). The vegetation biomass of a fallow field, represented only by the roots of the pervious crop, is about 70–90 c/ha (Gromyko et al., 1964), and the losses of C in this system are especially high and may be as much as 20–25% (Titlynova et al., 1988; Aderikhin, 1964; Akhanov, 1996). For example, it was observed that the upper 20-cm layer of regular chernozem lost 30.2 t ha−1 of C after 12 year of fallowing in comparison with the virgin soil (Ponomarkova, 1980). The sharp fluctuations of hydrothermal conditions (alterations between dry hot and warm humid periods) accelerate the mineralization processes. It’s typical for the climate of the steppe zone. The rate of loss of C in agroecosystems eventually decreases and it is related to the decrease in humus level. At the same time, the humus, left after the long-term cultivation, changes by its group and fractional composition and is characterized by a high proportion of recalcitrant fraction. The recalcitrant form of humus is attributed to strong chemical bonding with the mineral fraction of soil. The new steady state equilibrium level is attained in about 25 years (Ponomrayova et al., 1980). The data in Table 2 on the C stock in virgin soils permit estimation of the C losses caused by cultivation in the soils of the steppe zone in RK in the 0–50 cm and 0–20 cm layers. The losses of C in the 0–50 cm layer for normal zonal soils under cultivation are small and consist about 9–10% of the total stock, but increase in alkali (11–12%) and calcareous (14–15%) soils. The loss of C in the surface plow layer (0–20 cm) more strongly reflects its interrelation with inherent properties of soils, caused by type and genera differences. The losses of C in normal arable soils are likely to accelerate with increase in climatic aridity – from 15% for regular chernozems up to 23% for light-chestnut soils. Slightly lower values of C losses (15–20%) in the calcareous compared with the normal soils are caused by decrease in humus solubility in calcareous soils. Further, a sharp decrease of humus with depth is not so typical of alkaline soils as is the case for normal and calcareous soils because of a high-absorbing capacity of the alkaline horizons. It slightly decreases the negative effects of mixing in the 0–20 cm layer caused by tillage operations. The loss of C in the 0–20 cm layer in this type of soil exceeds the losses in the 0–50 cm layer, and can be as much a 10–13% of the total C stock. A high loss of C in the 0–50 cm layer (up to 23–25%) and in the 0–20 layer cm (about 5%) is typical for intrazonal arable soils of semihydromorphic and hydromorphic types. It is related to the trasport of the soluble humus components down the profile. The climatic factors of the steppe zone (e.g., shallow depth of snow cover and deep freezing of soils in winter, large fluctuations of seasonal and diurnal air temperatures, frequent occurrence of soil and atmospheric drought, high wind velocity, and low relative humidity) exacerbate soil’s susceptibility to wind erosion. Ancient alluvial plains (Priirtysh plain, North-turgai, Podural plateau) and sand massifs are the areas of soil deflation by wind erosion in the steppe zone of RK. The decrease of C stock in cultivated soils of the steppe zone is caused by deflation of fine particles (less than 0.01 mm in diameter) enriched in organic matter. Thus, cultivated surface horizon becomes progressively sandy because these soils are not resistant to erosion. The C concentration decreases sharply, and often as much as 15–30% (Akhanaov et al., 1998). In general, soils prone to severe erosion contain more than 50–60% of the fine fraction (6 degrees. Establishing forest shelter belts is one of the most important measures for conservation and restoration of fertility of cultivated soils in arid climate and high wind velocity in the steppes zone. Shelter belts can reduce the wind speed at 3 meters above the surface by 44–65%. Shelter belts also capture snow drifts which can be 30–70 cm deep along the tree line. Increase of snow cover thickness considerably reduces soil freezing in winter. Most soils in the open field are generally frozen to 120 cm depth. In contrast, the soil freezing occurs to 60–90 cm depth at the distance of 100 m from the forest belts and up to 15–24 cm depth in close proximity of the belts. The soil moisture reserve increases in the top 1 m by 114 mm after snow melt in the open steppe, and by 175, 225 and 252 mm at the distance of 100, 50 and 25 m from the forest belts, respectively. Deposition of fine soil, blown by wind and enriched in organic matter, increases the thickness of the humus horizon. Crop yields increase by 20–40% within the belt zone of 250–300 m. There are also notable changes in soils within the belts where the C stock in the 0–40 cm depth is increased by 20–25% and may appreciably exceed the analogous parameters for zonal virgin soils after 8–10 year of planting trees and shrubs (Dzhanpesov et al., 1978; Rubinshtein et al., 1985; Sobolev et al., 1964). A large development of irrigated agriculture is needed in the southern part of the sub-zone where the probability of droughts is very high. The high expenses for installation of the irrigation network and wells in the regions prone to water deficit are fully justified by the increase in agricultural production. Development of irrigation would raise the production efficiency of each hectare of arable land by 3 to 5 times in the dry steppe zone on dark-chestnut soils. Local supplemental irrigation enhances, through indirectly, the ecosystem C stock in the steppe ecosystems because it reduces the total cultivated land area and converts the surplus land to natural vegetation cover. The strategy of restoring lay land, taken out of cultivation, is very important to enhancing the humus content. Self-restoration of technologically-disturbed soils is a slow process because of the low soil moisture reserve. Weed communities represent the dominant vegetation of the lay lands whose NPP is less than those of natural ecosystems during a long period of up to 10 or more years depending on the subzonal type. The root systems of weedy vegetation do not form a dense turf, and thus do not protect against the processes of water erosion. Planting of the lay lands to perennial grasses is an effective method of enhancing the C stock. Application of organic matter or biosolids is also desirable. The residues, harvested from the virgin sites after the seeds mature, applied to the lay lands are very effective in the restoration of natural ecosystems. In this case, the seeds serve as a propagating material and the above ground parts of the plants serve as an organic amendment. The pastures of the steppe zone also require radical improvement because these are also severely degraded. Grazing management is the first step, and overgrazing must be avoided. Pastures must be subdivided to facilitate rotational grazing in different seasons. Lowland steppes, sub-mountainous and piedmont regions must be grazed during summer. In contrast, sandy soils and the flood plains of large rivers must be grazed during winter. Rotational grazing and outlet restoration wedge must be used to minimize erosion, deflation and decline of ecosystem bioproductivity (Akhanov et al.,
Dynamics of soil carbon and recommendations on effective sequestration of carbon
187
1998). Grasses must be established on severely degraded pastures, and appropriate measures of soil deflation and erosion control must be implemented on the eroded pastures.
5
CONCLUSION
The steppe zone of RK covers a large area and comprises diverse bioclimatic conditions and complex of the surface structure which result in heterogeneous soil cover and a wide range of soil genetic properties. These diverse ecoregions lead to a wide range of soil C stock because the organic matter balance depends on soil type, and differs among down to the soil series level. Total soil C stock decreases progressively from north to south. Changes in the C stock within the limits of subzones are caused by heterogeneity of soil cover as determined by lythologygeomorphological conditions and the soil moisture regime. Dynamics of soil C stock is mainly determined by anthropogenic factors, in conjunction with the agricultural land use. Extensive system of agriculture and inappropriate expansion of arable lands, indiscrininate agrotechnical methods of soil tillage, high doses of chemical fertilizers and low rates of application of organic amendments, have degraded soil fertility and depleted C stock. The steppe zones are a special type of natural environment. Specific processes of soil organic matter dynamics increase vulnerability of soil cover to anthropogenic perturbations. The risk of continuing C losses in soils is especially high because the self-restoration of the disturbed ecosystems in the arid climate of the steppe zone is extremely slow. A revolutionary reorganization of the land resources management in the steppe zone of RK is necessary based on the principle of landscape-ecological agriculture and adoption of the principles which enhance the soil organic matter budget. It is necessary to consider the soil genetic properties while choosing an optimum system of agriculture. It is equally important to adopt soil protective technologies of vegetative cover, and to implement moisture conservation and erosion control measures.
REFERENCES Aderikhin, P.G. 1964. Researches of chernozems fertility in the Central chernozemic zone under cultivation. Fertility and amelioration of soils in the USSR. Doklady for VIII International Congress of Soil Science. Nauka. p. 31–38. Akhanov, Z.U., R.E. Yeleshev, T. Dzhalankuzov, M.I. Rubinshtein, and A.I. Iorgansky. 1998. Problems of soil fertility restoration RK. Condition and rational use of soils in the Republic Kazakhstan. Almaty. Tethys. p. 8–14. Akhanov, Z.U., K.M. Pachikin, and A.A. Sokolov. 1998. Modern condition of soils and soil cover of Kazakhstan, their rational use, protection and objects of further study. Condition and rational use of soils in the Republic Kazakhstan. Almaty, Tethys. p. 4–8. Akhanov, Z.U. 1996. Theoretical bases of soil fertility restoration in Kazakhstan/Izvestiya MS-AS RK. Ser. Biological. No. 3. p. 13–24. Barayev A.I. 1964. Protection of soils from wind erosion. Fertility and amelioration of soils in the USSR. Doklady for VIII International Congress of Soil Science. Nauka. p. 223–230. Dyusenbekov, Z.D. 1998. Land resources of RK, problems of their rational use and protection in the conditions of market economy. Condition and rational use of soils in the Republic Kazakhstan. Almaty, Tethys. p. 18–25. Dzhanpeisov, R.D., A.K. Alimbayev, and K.B. Balgabekov. 1978. Development of soil deflation and erosion, scientific bases and practice in soil protection amelioration in Kazakhstan. Almaty. Nauka. p. 80–97. Gromyko I.D., E.V. Kulakov, A.P. Mershin, and N.P. Panov. Biological cycle and fertility of chernozems and chestnut soils of Tseliny krai. Fertility and amelioration of soils of the USSR. Doklady for VIII International Congress of Soil Science. Nauka. p. 38–47. Kolkhodzhayev M.K. 1974. Soils of Kalby and adjacent territories. Alma-Ata. Nauka. 254 p.
188
Climate Change and Terrestrial Carbon Sequestration in Central Asia
Matyshyuk I.V., 1964. Problems of cultivated soils formation in arid agriculture of Kazakhstan // Soil researches in Kazakhstan. Alma-Ata: AS Kaz SSR. p. 118–143. Mukhametkarimov, K.M. and K. Smailov. 2001. Change of physoco-chemical properties of soils under different regimes of grazing on natural pastures // Scientific bases of fertility restoration, protection and rational use of soils in Kazakhstan. Almaty. p. 228–231. Ponomaryova, V.V. and T.A. Plotnikova. 1980. Humus and soil formation. L.: Nauka. 1980. 221 p. Rubinshtein, M.I. and T.T. Tazabekov. 1985. Anthropogenic changes of humus in arable soils of Kazakhstan / Archievements of Dokuchayev’s soil science in Kazakhstan. Alma-Ata, p. 33–43. Rubinshtein, M.I., B.K. Borangaziyev, and A. Bektemirov. 1985. Influence of forests field protective zones on the fertility of dark-chestnut soils in the west Kazakhstan // Fertility of soils in Kazakhstan. Issue 1. Alma-Ata: Nauka. p. 5–12. Sobolev, S.S., I.D. Braude, and A.M. Byaly. 1964. Zonal systems of erosion control measures in the USSR in conditions of agriculture intensification. Fertility and amelioration of soils in the USSR. Doklady for the VIII International Congress of soil Science. M.: Nauka. p. 206–215. Titlyanova, A.A., N.A. Tikhomirova, and N.G. Shatokhina. 1988. Productional process in agrocoenoses. Novosibirsk: Nauka. 185 p. Uteshev, A. S. 1959. Climate of Kazakhstan L.: Gydrometeoizdat. 367 p. Vishnevskaya, B.Y. 1974. Content and composition of organic matter. Southern chernozems of the north Kazakhstan. Alma-Ata: Nauka. p. 148–190.
CHAPTER 14 Carbon dynamics in Saskatchewan soils: Implications for the global carbon cycle
A. Landi University of Ahwaz, Faculty of Agriculture, Department of Soil Science, Ahwaz, Iran
A.R. Memut University of Saskatchewan, Department of Soil Science, Saskatoon, Saskatchewan, Canada
1
INTRODUCTION
The pedosphere has a significant influence on the gaseous composition of the atmosphere. Soil organic C (SOC) and inorganic C (SIC) are the two major pools in the pedosphere. The total amount of global SOC has been estimated at 1500 Pg, which is three times more than the biotic pool (living plants), and two times more than the atmospheric pool. Estimation on the total amount of SIC varies between 700–1700 Pg. This is at least partly due to the difficulty of separation between pedogenic and lithogenic carbonates (Lal et al., 1998). The lack of reliable information about the size and dynamics of the SIC pool is emphasized in the recent literature. Lal et al. (2000a; b) expressed the importance of knowledge on the SIC pool, its cycling, and relationship to SOC within the global C cycle. The SIC sequestration occurs over tens to hundreds of thousands of years and plays a very significant role in the global C cycle (Mermut et al., 2000). Answers to the questions are quite important for complete understanding of the C cycle. Carbon sequestration can be highly cost effective and environmentally friendly mitigation technique (Mermut and Eswaran, 2001). The soils of Saskatchewan, with a well-documented deglaciation history and a regular zonal ecological gradient, provide an ideal opportunity to estimate the amount of C flux in soils of the dry, cool boreal region. The arid climate of the region is similar to that of the Central Asian region. Thus, the objective of this chapter is to determine the amount and accumulation rate of pedogenic carbonates and SOC using stable isotope geochemistry (13 C:12 C ratio of SOC and SIC in a series of zonal boreal soils of Saskatchewan, Canada.
2
MATERIALS AND METHODS
A southwest to northeast transect of about 500 km in length across five different soil-climatic zones (Dry Brown, Brown, Dark Brown, Black, and Gray) in Saskatchewan, between 49◦ 13′ and 53◦ 63′ latitude and 104◦ 92′ and 107◦ 66′ W longitude was selected for the study and total of 18 sites, with three replicates, representative of the major soil association on glacial till, and three from highly calcareous Rego Black Chernozem soils were used in this study (Figure 1). At each site, one soil profile was excavated to >120 cm depth, and described according to the Canadian System for Soil Classification (Soil Classification Working Group, 1998). In the vicinity of each profile two more pedons were sampled by auger and the data for soil chemical properties represent the mean of three measurements. A Global Positioning System (GPS) was used to record the elevation, longitude, and latitude of each profile. Soils were sampled 189
190
Climate Change and Terrestrial Carbon Sequestration in Central Asia
Figure 1. Ice margin positions during the deglaciaion of Saskatchewan, the study region and soil sampling sites (produced from the map of the Saskatchewan Land Resource Center (1999) and deglaciation maps (Christiansen, 1978)).
on well-drained, level to slightly undulating upper slopes with a moderate and dominantly vertical downward flow of soil moisture, in order to minimize the influence of landscape. All the soils were developed on glacial till parent materials, and were never cultivated.
2.1
Physical and chemical properties
Air-dried soil samples, passed through 2 mm sieve and saturated with deionized water, were used to prepare a saturated paste, and an extract from this paste was used to determine pH, electrical conductivity (EC), and concentration of soluble ions. Two to four core samples were taken from each horizon for bulk density measurement. Total initial and oven-dried (105–110◦ C) weights were recorded. Bulk density was calculated by dividing the dry weight by the sample volume, and the mean bulk density for each horizon was calculated. Particle size analysis of the samples