Cellular Programming and Reprogramming: Methods and Protocols [1 ed.] 1607616904, 9781607616900
Before the therapeutic potential of cell replacement therapy or the development of therapeutic drugs for stimulating the
293 43 8MB
English Pages 334 [335] Year 2010
Front Matter....Pages i-xi
Back Matter....Pages 1-24
....Pages 25-44
Recommend Papers


![Nuclear Reprogramming: Methods and Protocols [1st ed.]
9781071610831, 9781071610848](https://ebin.pub/img/200x200/nuclear-reprogramming-methods-and-protocols-1st-ed-9781071610831-9781071610848.jpg)
![Nuclear Reprogramming: Methods and Protocols [2 ed.]
1493915932, 9781493915934](https://ebin.pub/img/200x200/nuclear-reprogramming-methods-and-protocols-2nbsped-1493915932-9781493915934.jpg)


![Epigenetic Reprogramming During Mouse Embryogenesis: Methods and Protocols [1st ed.]
9781071609576, 9781071609583](https://ebin.pub/img/200x200/epigenetic-reprogramming-during-mouse-embryogenesis-methods-and-protocols-1st-ed-9781071609576-9781071609583.jpg)
![Cellular Programming and Reprogramming: Methods and Protocols [1 ed.]
1607616904, 9781607616900](https://ebin.pub/img/200x200/cellular-programming-and-reprogramming-methods-and-protocols-1nbsped-1607616904-9781607616900.jpg)
- Author / Uploaded
- Ge Lin
- Kristen Martins-Taylor
- Ren-He Xu (auth.)
- Sheng Ding (eds.)
File loading please wait...
Citation preview
METHODS
IN
MOLECULAR BIOLOGY™
Series Editor John M. Walker School of Life Sciences University of Hertfordshire Hatfield, Hertfordshire, AL10 9AB, UK
For other titles published in this series, go to www.springer.com/series/7651
Cellular Programming and Reprogramming Methods and Protocols
Edited by
Sheng Ding Ph.D. Department of Chemistry, The Scripps Research Institute, La Jolla, CA, USA
Editor Sheng Ding, Ph.D. Department of Chemistry The Scripps Research Institute La Jolla, CA USA [email protected]
ISSN 1064-3745 e-ISSN 1940-6029 ISBN 978-1-60761-690-0 e-ISBN 978-1-60761-691-7 DOI 10.1007/978-1-60761-691-7 Springer New York Dordrecht Heidelberg London Library of Congress Control Number: 2010922991 © Springer Science+Business Media, LLC 2010 All rights reserved. This work may not be translated or copied in whole or in part without the written permission of the publisher (Humana Press, c/o Springer Science+Business Media, LLC, 233 Spring Street, New York, NY 10013, USA), except for brief excerpts in connection with reviews or scholarly analysis. Use in connection with any form of information storage and retrieval, electronic adaptation, computer software, or by similar or dissimilar methodology now known or hereafter developed is forbidden. The use in this publication of trade names, trademarks, service marks, and similar terms, even if they are not identified as such, is not to be taken as an expression of opinion as to whether or not they are subject to proprietary rights. While the advice and information in this book are believed to be true and accurate at the date of going to press, neither the authors nor the editors nor the publisher can accept any legal responsibility for any errors or omissions that may be made. The publisher makes no warranty, express or implied, with respect to the material contained herein. Printed on acid-free paper Humana Press is a part of Springer Science+Business Media (www.springer.com)
Preface Advances in stem cell biology are making possible new approaches to treat devastating human diseases, including cardiovascular disease, neurodegenerative disease, musculoskeletal disease, diabetes, and cancer. Such approaches may involve cell replacement therapy as well as the development of therapeutic drugs for stimulating the body’s own regenerative ability to repair cells damaged by disease and injury. However, obstacles such as control of stem cell fate, immunorejection, and limited cell sources must be overcome before their therapeutic potentials can be realized. Recent studies have suggested that tissuespecific cells may overcome their intrinsic lineage-restriction to dedifferentiate or transdifferentiate upon exposure to a specific set of signals in vitro and in vivo. The ability to dedifferentiate or reverse lineage-committed cells to pluripotent/multipotent cells might overcome many of the obstacles (e.g., cell sources, immunocompatibility, and bioethical concerns) associated with using ES and adult stem cells in clinical applications. With an efficient dedifferentiation process, it is conceivable that healthy, abundant, and easily accessible somatic cells could be reprogrammed to become multipotent or pluripotent stem/progenitor cells, which can then be programmed to generate different types of functional cells for the repair of damaged tissues and organs. This series will cover the most recent technologies and their mechanistic understanding in cellular reprogramming and programming. La Jolla, CA
Sheng Ding
v
Contents Preface. . . . . . . . . . . . . . . . . . . . . . . . . . . . . . . . . . . . . . . . . . . . . . . . . . . . . . . . . . . . . Contributors. . . . . . . . . . . . . . . . . . . . . . . . . . . . . . . . . . . . . . . . . . . . . . . . . . . . . . . . . 1 Human Embryonic Stem Cell Derivation, Maintenance, and Differentiation to Trophoblast . . . . . . . . . . . . . . . . . . . . . . . . . . . . . . . . . . . . Ge Lin, Kristen Martins-Taylor, and Ren-He Xu 2 Isolation and Maintenance of Mouse Epiblast Stem Cells . . . . . . . . . . . . . . . . . . . Josh G. Chenoweth and Paul J. Tesar 3 Functional Assays for Hematopoietic Stem Cell Self-Renewal . . . . . . . . . . . . . . . . John M. Perry and Linheng Li 4 Isolation Procedure and Characterization of Multipotent Adult Progenitor Cells from Rat Bone Marrow. . . . . . . . . . . . . . . . . . . . . . . . . . . . . . . . Kartik Subramanian, Martine Geraerts, Karen A. Pauwelyn, Yonsil Park, D. Jason Owens, Manja Muijtjens, Fernando Ulloa-Montoya, Yeuhua Jiang, Catherine M. Verfaillie, and Wei-Shou Hu 5 Generation of Functional Insulin-Producing Cells from Human Embryonic Stem Cells In Vitro. . . . . . . . . . . . . . . . . . . . . . . . . . . . . . . . . . . . . . . Yan Shi 6 Mesoderm Cell Development from ES Cells . . . . . . . . . . . . . . . . . . . . . . . . . . . . . Takumi Era 7 Directed Differentiation of Red Blood Cells from Human Embryonic Stem Cells . . . . . . . . . . . . . . . . . . . . . . . . . . . . . . . . . . . . . . . . . . . . . Shi-Jiang Lu, Qiang Feng, Jennifer S. Park, and Robert Lanza 8 Directed Differentiation of Neural-stem cells and Subtype-Specific Neurons from hESCs . . . . . . . . . . . . . . . . . . . . . . . . . . . . . . . . . . . . . . . . . . . . . . Bao-Yang Hu and Su-Chun Zhang 9 Directing Human Embryonic Stem Cells to a Retinal Fate . . . . . . . . . . . . . . . . . . Thomas A. Reh, Deepak Lamba, and Juliane Gust 10 Bovine Somatic Cell Nuclear Transfer . . . . . . . . . . . . . . . . . . . . . . . . . . . . . . . . . . Pablo J. Ross and Jose B. Cibelli 11 Cell Fusion-Induced Reprogramming . . . . . . . . . . . . . . . . . . . . . . . . . . . . . . . . . . Jeong Tae Do and Hans R. Schöler 12 An Improved Method for Generating and Identifying Human Induced Pluripotent Stem Cells . . . . . . . . . . . . . . . . . . . . . . . . . . . . . . . . . . . . . . Prashant Mali, Zhaohui Ye, Bin-Kuan Chou, Jonathan Yen, and Linzhao Cheng 13 Using Small Molecules to Improve Generation of Induced Pluripotent Stem Cells from Somatic Cells . . . . . . . . . . . . . . . . . . . . . . . . . . . . . . Caroline Desponts and Sheng Ding
vii
v ix 1 25 45
55
79 87
105
123 139 155 179
191
207
viii
Contents
14 Reprogramming of Committed Lymphoid Cells by Enforced Transcription Factor Expression . . . . . . . . . . . . . . . . . . . . . . . . . . . . . . . . . . . . . . Huafeng Xie, Catherine V. Laiosa, and Thomas Graf 15 Reprogramming of B Cells . . . . . . . . . . . . . . . . . . . . . . . . . . . . . . . . . . . . . . . . . . César Cobaleda 16 Adult Cell Fate Reprogramming: Converting Liver to Pancreas. . . . . . . . . . . . . . . Irit Meivar-Levy and Sarah Ferber 17 In Vitro Reprogramming of Pancreatic Cells to Hepatocytes. . . . . . . . . . . . . . . . . Daniel Eberhard, Kathy O’Neill, Zoë D. Burke, and David Tosh 18 Generation of Novel Rat and Human Pluripotent Stem Cells by Reprogramming and Chemical Approaches . . . . . . . . . . . . . . . . . . . . . . . . . . . Wenlin Li and Sheng Ding 19 Small Molecule Screen in Zebrafish and HSC Expansion. . . . . . . . . . . . . . . . . . . . Eirini Trompouki and Leonard I. Zon 20 Zebrafish Small Molecule Screen in Reprogramming/Cell Fate Modulation. . . . . . . . . . . . . . . . . . . . . . . . . . . . . . . . . . . . . . . . . . . . . . . . . . Jing-Ruey J. Yeh and Kathleen M. Munson Index . . . . . . . . . . . . . . . . . . . . . . . . . . . . . . . . . . . . . . . . . . . . . . . . . . . . . . . . . . . . . .
219 233 251 285
293 301
317 329
Contributors ZOË D. BURKE • Department of Biology & Biochemistry, Centre for Regenerative Medicine, University of Bath, Bath, UK LINZHAO CHENG • Institute for Cell Engineering, Johns Hopkins University School of Medicine, Baltimore, MD, USA JOSH G. CHENOWETH • Laboratory of Molecular Biology, National Institute of Neurological Disorders and Stroke, National Institutes of Health, Bethesda, MD, USA BIN-KUAN CHOU • Institute for Cell Engineering, Johns Hopkins University School of Medicine, Baltimore, MD, USA JOSE B. CIBELLI • Department of Animal Science, Michigan State University, East Lansing, MI, USA CÉSAR COBALEDA • Departamento de Fisiología y Farmacología, Universidad de Salamanca, Salamanca, Spain CAROLINE DESPONTS • Department of Chemistry, The Scripps Research Institute, La Jolla, CA, USA SHENG DING • Department of Chemistry, The Scripps Research Institute, La Jolla, CA, USA JEONG TAE DO • CHA Stem Cell Institute & CHA Biotech, Pochon CHA University, Seoul, Korea DANIEL EBERHARD • Department of Biology & Biochemistry, Centre for Regenerative Medicine, University of Bath, Bath, UK TAKUMI ERA • Division of Molecular Neurobiology, Institute of Molecular Embryology and Genetics, Kumamoto University, Kumamoto, Japan QIANG FENG • Advanced Cell Technology, Worcester, MA, USA SARAH FERBER • Endocrine Institute, Sheba Medical Center, Tel-Hashomer, Israel; Department of Human Genetics and Molecular Medicine, Sackler School of Medicine, Tel-Aviv University, Tel-Aviv, Israel MARTINE GERAERTS • Stem Cell Institute Leuven, Catholic University of Leuven, Leuven, Belgium THOMAS GRAF • Center for Genomic Regulation and ICREA, Barcelona, Spain JULIANE GUST • Department of Biological Structure, University of Washington, Seattle, WA, USA BAO-YANG HU • Department of Anatomy and Department of Neurology, Waisman Center, School of Medicine and Public Health, the WiCell Institute, University of Wisconsin-Madison, Madison, WI, USA WEI-SHOU HU • Stem Cell Institute and Department of Chemical Engineering and Materials Science, University of Minnesota, Minneapolis, MN, USA YEUHUA JIANG • Stem Cell Institute Leuven, Catholic University of Leuven, Leuven, Belgium
ix
x
Contributors
CATHERINE V. LAIOSA • Mount Sinai Hospital, New York, NY, USA DEEPAK LAMBA • Department of Biological Structure, University of Washington, Seattle, WA, USA ROBERT LANZA • Advanced Cell Technology, Worcester, MA, USA LINHENG LI • Stowers Institute for Medical Research, Kansas City, MO, USA; Department of Pathology and Laboratory Medicine, Kansas University Medical Center, Kansas City, KS, USA WENLIN LI • Department of Chemistry, The Scripps Research Institute, La Jolla, CA, USA GE LIN • Stem Cell Institute and Department of Genetics and Developmental Biology, University of Connecticut Health Center, Farmington, CT, USA SHI-JIANG LU • Advanced Cell Technology, Worcester, MA, USA; Stem Cell and Regenerative Medicine International, Worcester, MA, USA PRASHANT MALI • Institute for Cell Engineering, Johns Hopkins University School of Medicine, Baltimore, MD, USA KRISTEN MARTINS-TAYLOR • Stem Cell Institute and Department of Genetics and Developmental Biology, University of Connecticut Health Center, Farmington, CT, USA IRIT MEIVAR-LEVY • Sheba Medical Center, Endocrine Institute, Tel-Hashomer, Israel; Department of Human Genetics and Molecular Medicine, Sackler School of Medicine, Tel-Aviv University, Tel-Aviv, Israel MANJA MUIJTJENS • Stem Cell Institute Leuven, Catholic University of Leuven, Leuven, Belgium KATHLEEN M. MUNSON • Developmental Biology Laboratory, Cardiovascular Research Center, Massachusetts General Hospital, Charlestown, MA, USA; Department of Medicine, Harvard Medical School, Boston, MA, USA KATHY O’NEILL • Department of Biology & Biochemistry, Centre for Regenerative Medicine, University of Bath, Bath, UK D. JASON OWENS • Stem Cell Institute and Department of Chemical Engineering and Materials Science, University of Minnesota, Minneapolis, MN, USA JENNIFER S. PARK • Advanced Cell Technology, Worcester, MA, USA YONSIL PARK • Department of Chemical Engineering and Materials Science and Department of Biomedical Engineering, University of Minnesota, Minneapolis, MN, USA KAREN A. PAUWELYN • Stem Cell Institute Leuven, Catholic University of Leuven, Leuven, Belgium JOHN M. PERRY • Stowers Institute for Medical Research, Kansas City, MO, USA THOMAS A. REH • Department of Biological Structure, University of Washington, Seattle, WA, USA PABLO J. ROSS • Department of Animal Science, Michigan State University, East Lansing, MI, USA HANS R. SCHÖLER • Department of Cell and Developmental Biology, Max Planck Institute for Molecular Biomedicine, Münster, Germany YAN SHI • Laboratory of Chemical Genomics, Shenzhen Graduate School of Peking University, Shenzhen, Guangdong, China
Contributors
xi
KARTIK SUBRAMANIAN • Stem Cell Institute and Department of Chemical Engineering and Materials Science, University of Minnesota, Minneapolis, MN, USA PAUL J. TESAR • Department of Genetics, Case Western Reserve University, Cleveland, OH, USA DAVID TOSH • Department of Biology & Biochemistry, Centre for Regenerative Medicine, University of Bath, Bath, UK EIRINI TROMPOUKI • Stem Cell Program and Hematology/Oncology, Children’s Hospital, Harvard Medical School, Howard Hughes Medical Institute, Harvard Stem Cell Institute, Boston, MA, USA FERNANDO ULLOA-MONTOYA • Stem Cell Institute Leuven, Catholic University of Leuven, Leuven, Belgium; Stem Cell Institute and Department of Chemical Engineering and Materials Science, University of Minnesota, Minneapolis, MN, USA CATHERINE M. VERFAILLIE • Stem Cell Institute Leuven, Catholic University of Leuven, Leuven, Belgium HUAFENG XIE • Dana Farber Cancer Institute, Boston, MA, USA REN-HE XU • Stem Cell Institute and Department of Genetics and Developmental Biology, University of Connecticut Health Center, Farmington, CT, USA ZHAOHUI YE • Institute for Cell Engineering, Johns Hopkins University School of Medicine, Baltimore, MD, USA JING-RUEY J. YEH • Developmental Biology Laboratory, Cardiovascular Research Center, Massachusetts General Hospital, Charlestown, MA, USA; Department of Medicine, Harvard Medical School, Boston, MA, USA JONATHAN YEN • Institute for Cell Engineering, Johns Hopkins University School of Medicine, Baltimore, MD, USA SU-CHUN ZHANG • Department of Anatomy and Department of Neurology, School of Medicine and Public Health, Waisman Center, the WiCell Institute, University of Wisconsin-Madison, Madison, WI, USA LEONARD I. ZON • Stem Cell Program and Hematology/Oncology, Children’s Hospital, Harvard Medical School, Howard Hughes Medical Institute, Harvard Stem Cell Institute, Boston, MA, USA
Chapter 1 Human Embryonic Stem Cell Derivation, Maintenance, and Differentiation to Trophoblast Ge Lin, Kristen Martins-Taylor, and Ren-He Xu Abstract Since the first report of derivation of human embryonic stem cell (hESC) lines in 1998, many progresses have been achieved to reliably and efficiently derive, maintain, and differentiate this therapeutically promising cell type. This chapter introduces some basic and widely recognized methods that we use in our hESC core laboratory. Specifically, it includes methods for (1) deriving hESC lines without using enzyme and antibody to isolate the inner cell mass; (2) sustaining hESC self-renewal under feederdependent, feeder-conditioned, and defined conditions as well as pluripotency validation and quality control assays; and (3) inducing hESC differentiation to trophoblast with BMP4. Key words: hESCs, Derivation, Pluripotency, Differentiation, Trophoblast, BMP4, bFGF, TGFb
1. Introduction Human embryonic stem cells (hESCs) were originally derived and cultured on mouse embryonic fibroblast (MEF) cells as feeder cells in 80% DMEM medium (Invitrogen) and 20% fetal bovine serum (Hyclone) (1, 2). Alternatively, 80% DMEM medium and 20% KnockOut SR, a serum replacer optimized for mouse ES cells (Invitrogen), supplemented with 4 ng/mL bFGF can also support clonal as well as colonial growth of hESCs on MEF cells (3). Later, a feeder-independent system was reported, in which the SR-containing DMEM is conditioned by MEF, and then the conditioned medium (CM) is harvested and supplemented with 4 ng/mL bFGF to culture hESCs plated on Matrigel, a gelatinous protein mixture secreted by mouse tumor cells (BD Biosciences) (4). We found that BMP4 induces hESC differentiation to the extraembryonic lineage trophoblast (5). We further demonstrated that S. Ding (ed.), Cellular Programming and Reprogramming: Methods and Protocols, Methods in Molecular Biology, vol. 636, DOI 10.1007/978-1-60761-691-7_1, © Springer Science+Business Media, LLC 2010
1
2
Lin, Martins-Taylor, and Xu
the SR contains BMP-like activity; MEF cells secret BMP inhibitors such as Noggin and Gremlin, and high-dose bFGF also represses BMP signaling in hESCs (6). Noggin and bFGF synergize to maintain hESC culture (6). When the bFGF concentration is increased to 100 ng/mL, Noggin is no longer necessary (7). We further demonstrated that TGFb and FGF work concertedly to inhibit BMP signaling, and TGFb-activated SMAD2/3 directly bind to the key pluripotency gene NANOG to regulate its expression (8). Others also reported that bFGF alone or together with ligands for TGFb and WNT signaling supplemented in the SR-containing medium (9) or chemically defined media (10, 11) can support hESC culture on Matrigel or other matrices. This chapter will introduce the above basic and widely recognized methods that we use in our hESC core laboratory for hESC derivation, maintenance, and differentiation to trophoblast.
2. Materials 2.1. Reagents
1. Dulbecco’s PBS, Without Ca++ and Mg++. 2. Dulbecco’s PBS with Ca++ and Mg++. 3. 0.05% Trypsin in 0.53 mM EDTA. 4. Gelatin Solution (0.1%, 500 mL). Mix 0.5 g gelatin with 500 mL embryo-quality water (type 1, reagent grade), autoclave the solution for 30 min, store at room temperature, and keep sterile. 5. MEF Culture Medium (500 mL). Mix 445 mL DMEM, 50 mL FBS, and 5 mL Non-Essential Amino Acids (NEAA, 100×). Filter with 0.22 mm PES membrane. Store at 4°C, and use within 1 month. 6. MEF Cryopreservation Medium (2×, 50 mL). Mix 20 mL MEF Medium, 20 mL FBS, and 10 mL Dimethyl Sulfoxide (DMSO). Filter with 0.22 mm PVDF membrane. Use the same day, or store aliquots at −80°C. 7. Quinn’s Advantage Thaw Kit (SAGE In Vitro Fertilization). 8. Quinn’s Advantage Protein Plus Blastocyst Medium (SAGE In Vitro Fertilization). 9. OVOIL (Vitrolife). 10. hESC Medium (250 mL). Mix 200 mL DMEM/F-12, 50 mL Knockout Serum Replacer (KOSR), 2.5 mL NEAA 100×, 1.25 mL 200 mM l-glutamine solution, 1.75 mL betamercapto-ethanol, and 500 mL of 2 mg/mL bFGF solution. Filter with 0.22 mm PES. Store at 4°C and use within 2 weeks.
Human Embryonic Stem Cell Derivation
3
11. bFGF Solution (2 mg/mL, 5 mL). Dissolve 10 mg bFGF (Invitrogen) in 5 mL 0.1% Bovine Serum Albumin (BSA) in PBS. Mix with pipette. Aliquot into microfuge tubes. Store at −80°C. 12. 0.1% BSA Solution (150 mL). Mix 150 mL Dulbecco’s PBS without Ca++ and Mg++ and 2 mL 7.5% BSA, Fraction V (Invitrogen). Filter with 0.22 mm PES membrane. Store at 4°C. 13. 1 mg/mL Collagenase solution (30 mL). Dissolve 30 mg collagenase in 30 mL DMEM/F12 (Invitrogen). Filter with 0.22 mm PES membrane. Store at 4°C for up to 1 month. 14. 0.5 mg/mL Dispase Solution (30 mL). Dissolve 15 mg Dispase in 30 mL DMEM/F12. Filter with 0.22 mm PES membrane. Store at 4°C for up to 1 month. 15. Matrigel (Becton Dickinson Labware). 16. hESC Cryopreservation Medium (2×, 50 mL). Mix 10 mL hESC medium, 30 mL FBS (Hyclone, Defined), and 10 mL Dimethyl Sulfoxide (DMSO). Filter with 0.22 mm PVDF membrane. Use it the same day, or store aliquots at −80°C. 17. Conditioned Medium (CM) plus 4 ng/mL bFGF (100 mL). Seed irradiated MEF cells at ~55,000 cells/cm2 in MEF Culture Medium in T75 flask, incubate them at least 4 h or overnight to allow MEF attachment. Aspirate the MEF medium, add hESC Medium at 0.5 mL/cm2, culture overnight for conditioning, and collect the CM. Mix 100 mL CM with 200 mL of 2 mg/mL bFGF Solution. Filter with 0.22 mm PES membrane. Store at 4°C and use within 7–10 days, or freeze at −80°C and use within a month. 18. mTeSR1 medium (Stem Cell Technologies). 19. BMP4 (R&D Systems). 20. Brefeldin A, Hoechst 33342 Solution, and mouse IgG (Sigma). 21. Primary Antibodies: Mouse anti-SSEA3 (Developmental Studies Hybridoma Bank), and mouse anti-SSEA4 (Developmental Studies Hybridoma Bank) antibodies. Mouse anti-TRA1-60 (Santa Cruz Biotechnology Inc), mouse anti-TRA1-81 (Santa Cruz Biotechnology Inc.), mouse anti-Oct-3/4 (C-10) antibody (Santa Cruz Biotechnology Inc.), and rabbit anti-NANOG antibody (Abcam Inc.). Mouse anti-human CGb antibody (Abcam Inc.). 22. Secondary Antibodies: Alexa Fluor® goat anti-mouse IgG, goat anti-mouse IgM, and goat anti-rabbit IgG antibodies (Molecular Probes, Inc.). 23. Quantitative Alkaline Phosphatase ES Characterization Kit (Millipore).
4
Lin, Martins-Taylor, and Xu
24. Permeablization Buffer: Add 5% normal goat serum (Invitrogen, 10000C), 1% BSA, and 0.1% Triton X-100 in PBS. 25. Blocking Buffer: Add 5% normal goat serum and 1% BSA in PBS. 26. PBS-T: Add 0.4% Triton X-100 in PBS. 27. Fluorescence-activated cell sorting (FACS) Buffer: Add 2% fetal bovine serum (FBS), 0.1% Triton X-100, and 0.1% sodium azide to calcium- and magnesium-free PBS. 28. AxSYM Total hCGb kit (Abbott, Lake Forest, IL). 29. PBS-T20: Add 0.2% Tween-20 in PBS. 2.2. Supplies
1. Watchmakers’ Forceps (Fine Science Tools Inc.). 2. Iris Scissors (Fine Science Tools Inc.). 3. STEMPRO® EZPassage (Invitrogen) or Disposable Cell Scraper (Fisher Scientific). 4. Nalgene Freezing Box (Nalge Nunc International). 5. One mL U-100 Insulin Syringe 28G1/2 (Becton Dickson). 6. Four-well and six-well Culture Plates, 50, 75, and 90 mm Filter Units (Nalge Nunc International). 7. 0.22 mM Filter Unit (Millipore). 8. 40 mM Mesh (BD Labware). 9. Falcon (35/2054) 5 mL Polystyrene Round Bottom Tube (BD Labware). 10. TaqMan® Low Density Array Human Stem Cell Differentiation Panel (Applied Biosystems Inc.). 11. Glass Coverslips (Fisher Scientific).
3. Methods 3.1. hESC Derivation
hESC lines are traditionally derived from the inner cell mass (ICM) of early stage human embryos (days 5–6 after insemination) donated by patients of in vitro fertilization clinics. After zona pellucida digestion by pronase, the ICM is isolated by immunosurgery using anti-human serum antibody followed by exposure to guinea pig complement, and placed onto an irradiated MEFcoated plate for expansion (1, 2). hESC lines can also be derived by placing the ICM onto human fibroblasts (12–14), Matrigel or defined matrices (15, 16), or by isolating single blastomeres from cleavage-stage embryos and placing each of them onto a fluorescent hESC colony as a feeder (17). A surgical method that does not require the enzyme and antibody to isolate the ICM has been reported recently (18, 19). By using this method, we
Human Embryonic Stem Cell Derivation
5
have derived four hESC lines, CT1-4. Below are the detailed procedures for the derivations (see Note 1). 3.1.1. Thawing and Culture of Human Embryos
1. One day prior to embryo thawing, prepare blastocyst culture dishes for thawed embryos as follows. Under a dissecting microscope that is installed within a UV-sterilized hood, make droplets of 50 mL Blastocyst Culture Medium onto a 60 mm culture dish, and cover the droplets with 6 mL paraffin oil. Note: Usually make two droplets on top for washing the embryo and make appropriate droplets on the bottom for embryo culture. Each culture droplet should not contain more than 3 embryos. Make appropriate number of droplets according to the number of embryos to be thawed. The embryos from one donor may not be mixed with those from another in the same plate unless ethical compliance requires so. 2. Equilibrate the dish in incubator at 37°C, 5% CO2 and 95% humidity overnight or for at least 4–6 h. 3. On the day of embryo thawing, prepare four-well plates as follows 30 min prior to thawing. Add 1 mL 0.5 M Sucrose Solution from the Quinn’s Advantage Thaw Kit into the top left well of the plates, 1 mL 0.2 M Sucrose Solution into the top right well, and 1 mL/well of Cryo Solvent into the bottom two wells. 4. Let the plates set at room temperature in a laminar flow cabinet for 30 min. Prepare one plate per thawed vial or straw. 5. In the meanwhile, prepare a flame-pulled open Pasteur pipette as follows. Pull a sterile Pasteur pipette over a flame with one hand holding the cotton end and forceps holding the open end. Bend the narrow part to break the tip to produce an open end approximately 150–250 mm in diameter, which is slightly larger than the diameter of a human embryo (110– 120 mM). Check the cutting edge under the dissecting microscope to determine whether the diameter is appropriate. Keep the pulled Pasteur pipette sterile in the hood. 6. Using a pair of forceps, take a cryopreserved vial containing human embryo(s) out of liquid nitrogen. Place the lower part of the vial in a 30°C water bath, gently swirling the vial until ice crystals disappears. Be careful not to let the water emerge the cap of the vial during swirling and not to leave the vial in the water bath once the ice crystals have disappeared. Wipe off the water with paper towel. Spray the vial with 75% ethanol for sterilization, and let the vial air dry in the hood. 7. Based on ethical requirements, de-identify the information on the vial by assigning the thawed embryos with random codes.
6
Lin, Martins-Taylor, and Xu
8. Quickly remove the content from the vial with a sterile Pasteur pipette, put it onto a 60 mm culture dish, and check the embryos (often more than one embryos is stored per vial) under the dissecting microscope. Note: A healthy embryo often contains bright, similarly sized, and integral blastomeres. In contrast, an unhealthy embryo often contains gray, unevenly sized or fragmented blastomeres. Continue thawing the healthy embryos. 9. Using the pulled Pasteur pipette, transfer the embryos into the prepared four-well thawing plate for serial dilution of embryos in the cryopreservants. Place the embryos into the first well, which contains the 0.5 M sucrose solution, and incubate for 10 min at room temperature (RT). Move the embryos into the second well, which contains the 0.2 M sucrose solution, and incubate for 10 min at RT. Move the embryos into the third well, which contains the Cryo solvent, and incubate for 5 min at RT. Finally, move the embryos into the second well of Cryo solvent (well #4) and incubate for 10 min at 37°C (in a incubator). Note: During the dilution process, embryos are very fragile and easy to be damaged. Be cautious to manipulate them very gently. Do not repeatedly pipette the embryos up and down. If more than one vial is thawed, repeat the thawing process for each new vial. 10. After the final incubation step in the fourth well, use the pulled Pasteur pipette to transfer the embryos from the Cryo Solvent in the thawing plate to washing droplet #1 in the prepared blastocyst culture dish. Wash the embryos by moving them clockwise in the droplet and pipetting them up and down gently. 11. Transfer the embryos into washing droplet #2 and wash them as in droplet #1. Finally, move the embryos to the culture droplet containing Blastocyst Medium. Note: When moving the embryos from one droplet to another, try to carry as little medium as possible from the last droplet to the next. 12. Place the blastocyst culture dish into the incubator to culture the embryos, allowing them to develop to the blastocyst stage. After culturing for 48 h, transfer the embryos into freshly prepared Blastocyst Medium and continue culturing them for an additional 48 h. Note: The fresh media can only maintain the vigorous development of human embryos for a maximum of 48 h. 3.1.2. Preparation of MEF-Coated Plate
1. Harvest exponentially proliferating MEF cells (less than 3 passages in culture after thawing), irradiate them with gamma ray at 40 Gy, dilute them to 0.75 × 10⁴ cell/mL in the MEF Culture Medium, and seed them at 1 mL/well into a gelatincoated twelve-well plate (see Note 2).
Human Embryonic Stem Cell Derivation
7
2. Return the plate to the incubator to let the cells attach overnight. When placing the plate in the incubator, gently and straightly move it back and forth and left to right three times (do not swirl the plate) for even spreading. After plating, the MEF-coated plate should be used within 7 days. 3.1.3. Isolation of the Inner Cell Mass from Human Blastocysts
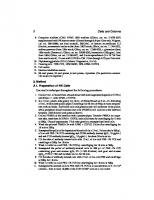
Usually, a human embryo will develop to the blastocyst stage on day 5 or 6 postfertilization. If there is no blastocyst formation on day 7, the embryo is considered to have arrested in development, which is often unlikely for hESC derivation. 1. Wait for the embryos to develop to the expanded blastocyst stage for easy evaluation of the inner cell mass. 2. Under an inverted microscope observe the number of blastocysts formed and record the quality of the blastocysts as described (20). Blastocysts with good quality often contains a clearly formed inner cell mass (ICM) with bright, similarly sized, and nonfragmented cells. Although the healthy blastocysts are more likely to become cell line, we still recommend continuing the derivation with any blastocysts that you may have. 3. Prepare dissection dishes by adding 5 mL prewarmed hESC Medium to a 60 mm culture dish, using one dish per blastocyst. 4. Aspirate the MEF Medium in the twelve well MEF-coated plate, add 1 mL PBS to each well to remove any traces of serum, aspirate the PBS, and add 1 mL hESC Culture Medium per well. 5. Transfer one blastocyst at a time from the blastocyst culture dish to the 60 mm dissection dish by using a 10 mL sterile pipette tip. 6. Locate the blastocyst in the dish under the dissecting microscope and use a 1 mL U-100 Insulin Syringe needle (28½ G) to make two slight, close, and paralleling scratches aside the blastocyst. 7. As shown in Fig. 1, use the needle to carefully push the blastocyst between the two scratches, orientating the embryo such that its ICM is to one side. The scratches will hold the blastocyst via its sticky outer zona pellucida in the right position for the following steps. Using the needle, cut open the blastocyst, which will also break the zona pellucida, and separate the ICM part from the zona pellucida. 8. Using a 10 mL sterile pipette tip, transfer the ICM to one well of the twelve-well MEF-coated plate. Return the twelvewell plate to the incubator. Repeat the above procedures for each blastocyst.
8
Lin, Martins-Taylor, and Xu
Fig. 1. Diagram for surgical isolation of the inner cell mass from human blastocyst by using a 28G1/2 needle linked to a 1-mL syringe
9. Leave the twelve-well plate undisturbed in the incubator for 48 h to allow the ICM to attach to the MEF layer (to facilitate the attachment, add 10 mM of the ROCK inhibitor Y27632). 10. Carefully refresh the medium every other day until the first passage. 3.1.4. Primary Culture of the ICM
In the primary culture, there are usually trophoblast surrounding the ICM, which may restrict the outgrowth and spread of the ICM cells, especially when the ICM is located in the center of the primary colony. In this case, the ICM may still proliferate but will form a ball- or cylinder-like structure and tend to differentiate. Thus, it is important to separate the entire ICM colony from the surrounding trophoblast prior to its differentiation and replate it as described as follows onto a new MEF-coated well for continued flat outgrowth. 1. Locate the primary ICM colony under dissecting microscope. 2. Use a 1 mL syringe needle to carefully cut and lift the entire ICM colony off from the primary culture dish, and be cautious not to damage the ICM colony. 3. Using a 10 mL sterile pipette tip transfer the ICM colony into a new MEF-coated well containing hESC Medium, and put the plate back into incubator for continued culture. 4. Refresh the medium every other day until a typical hESC colony appears.
3.1.5. Continuing Propagation of the hESC Cells
1. For the first passage, use a 1 mL syringe needle to cut the hESC colony into 2–4 clumps, gently lift the cell clumps, and transfer them into a new MEF-coated well.
Human Embryonic Stem Cell Derivation
9
2. For the next 2–3 passages, repeat the cutting/transferring steps into a MEF-coated six-well plate. 3. After the hESCs are scaled up to a full six-well plate, use routine hESC culture methods for continuous expansion, maintenance, and cryopreservation (see below). 3.2. hESC Culture
3.2.1. Culture in hESC Medium on MEF (1–3)
hESCs can be cultured in three kinds of conditions: feeder-dependent (1, 2), feeder-independent (4), and defined cultures (10, 11, 16, 21) (see Note 3). A typical hESC colony is often highly compacted with clear borders, and contains tightly contacted, tiny cells with unclear cell borders. Under high magnification, they have a high nucleus/cytoplasm ratio and clear nucleoli. On the other hand, a colony of differentiated hESCs often has diffused borders, containing loosely contacted and flattened cells with decreased nucleus/cytoplasm ratio. Spontaneous differentiation can occur in hESC culture. In this case, “weeding out” the differentiated cells or “picking up” the undifferentiated cells is often necessary to keep and expand the undifferentiated cells. 1. Determine when to split hESCs. In general, cells must be split when the MEF layer is 2-weeks old or when the hESC colonies are too dense or too large, whichever comes the first. These criteria often lead to a splitting frequency of about once a week. 2. Remove the six-well hESC culture plate from the incubator, aspirate the spent media, add 1 mL of 1 mg/mL Dispase Solution to each well of the plate, and incubate for 5–20 min or until the edges of the colonies begin to curl up. 3. Using a glass 5 mL pipette, blow the cell colonies off the surface of the plate. Transfer the cell suspension into a 15-mL conical tube. Gently pipette the cells up and down a few times to further break up the cell clumps. Be careful not to break up the clumps into a single cell suspension and not to cause foaming. Since the enzymatic splitting can promote cytogenetic instability of the cells (22), hESCs may be split mechanically by cutting and pasting or with a disposable stem cell passaging tool called STEMPRO® EZPassage, instead of enzymatically, to directly remove the cell colonies from the plates. 4. Pellet the cell clumps by centrifuging at 200 × g for 5 min. Aspirate the supernatant, and wash the cell pellet with 2–3 mL KnockOut DMEM/F12 medium in the 15-mL conical tube via centrifugation of the suspension and aspiration of the supernatants. 5. While the hESCs are centrifuging, aspirate MEF medium from fresh feeder plates, and add about 1 mL PBS to each well of the six-well feeder plate to remove any traces of
10
Lin, Martins-Taylor, and Xu
the serum. Note: Do not leave PBS on fibroblasts for more than 5 min. 6. Aspirate the supernatant from the hESC pellet, resuspend the pellet in 2–3 mL hESC Medium, and add a sufficient volume of hESC Medium to the 15-mL tube to ensure a total of 2.5 mL medium per well or 15 mL medium per six-well plate. Mix well by gently pipetting. 7. Aspirate the PBS from the wells of the feeder plate, add the cell suspension to each well of the plate as follows: (1) mix the suspension by gently pipetting up and down, (2) take only a portion of it to evenly add it drop-wise into each of the six wells, and (3) do not disperse the last several drops, instead, return them to the tube. Repeat the three steps until each well has 2.5 mL of the cell suspension. If the total volume is less than 2.5 mL/well, add fresh hESC Medium to fill the difference. 8. After plating hESCs, return the plate to the incubator. Move the plate in several quick, short, back-and-forth and side-to-side motions to disperse the cells across the surface of the wells. Note: Open and close incubator door carefully while cells are attaching. This will prevent disturbing the even distribution of cells to the surface of well. 9. Incubate the cells overnight to allow the cell clumps to attach. If cell attachment is a concern, 10 mM Y27632 may be added to the culture for the first night postsplit. 10. Refresh the medium daily until next split when the cell density is about 75% confluent, which usually takes about a week. 3.2.2. Culture in MEF-Conditioned hESC Medium on Matrigel (4)
1. Coat six-well culture plates by incubating with Matrigel (diluted 0.5 mg per six-well plate in cold KnockOut DMEM/ F12 at 1 mL/well) and incubate at room temperature for 1 h. Plates may be stored and sealed at 4°C until use. 2. Add 1 mL of 1 mg/mL Dispase Solution to each well of hESCs that are at about 75% confluent in a MEF- or Matrigelcoated six-well plate, and incubate the plate at 37°C for 5–20 min or until the edges of the colonies start to curl up. 3. Using a glass 5 mL pipette, blow the cell colonies off the surface of the plate. Transfer the cell suspension into a 15-mL conical tube, gently pipette the cells up and down a few times to further break up the cell clumps. Be careful not to break up the clumps into a single cell suspension and not to cause foaming. As described above, hESCs may also be split mechanically, instead of enzymatically, with stem cell passaging tool to directly remove the cell colonies from the plates.
Human Embryonic Stem Cell Derivation
11
4. Wash each well with 1 mL KnockOut DMEM/F12 medium, transfer the cell wash to the 15-mL conical tube, and gently pipette to mix. 5. Pellet the cell clumps by centrifuging at 200 × g for 5 min. Aspirate the supernatant, and wash the cell pellet with 2–3 mL KnockOut DMEM/F12 medium in the 15-mL conical tube via centrifugation of the suspension and aspiration of the supernatants. 6. Aspirate the supernatant from the hESC pellet, resuspend the pellet in 2–3 mL CM supplemented with 4 ng/mL bFGF, and add a sufficient volume of the CM plus bFGF to the 15-mL tube to ensure a total of 2.5 mL medium per well or 15 mL medium per six-well plate. Mix gently by pipetting. 7. Aspirate excess Matrigel solution from the Matrigel-coated plates, and add the cell suspension to each well of the plate as described and place the plate in incubate as described in “Culture in hESC medium on MEF.” 8. Incubate the cells overnight to allow the cell clumps to attach. If the cell attachment is a concern, 10 mM Y27632 may be added to the culture for the first night postsplit. 9. Refresh the CM plus bFGF daily until next split when the cell density is about 75% confluent, which usually takes about a week. 3.2.3. Culture in mTeSR1 Medium on Matrigel (16, 21)
1. To transit hESCs from other culture media to mTeSR1, replace the previous medium with prewarmed mTeSR1 at 2 mL/well about 3 days before passage. Refresh the medium daily. 2. When hESCs reach about 75% confluence – usually 5–7 days postsplit, aspirate the spent medium and incubate cells with prewarmed 1 mg/mL Dispase at 1 mL/well for 5–10 min at 37°C or until the edges of the cell colonies start to curl up. 3. Aspirate excess Matrigel solution and pipette 2 mL/well prewarmed mTeSR1 medium into the Matrigel-coated plate. 4. When the cell incubation with Dispase is complete, aspirate the Dispase solution and gently rinse the cells on the plate with 1 mL of warmed DMEM/F12 medium/well at least three times, instead of washing the cells by centrifugation. Note: Residual Dispase will reduce the cell attachment after split. 5. After the last rinse, add 2 mL of mTeSR1 medium to the well and gently scrape the cells from the plate, while slowly expelling the medium from a pipette. Plate cells into prepared Matrigel plates at a split ratio of 1:3 or 1:6 or from one original well to 3–6 fresh wells, distribute the cells evenly, and place the plate
12
Lin, Martins-Taylor, and Xu
into the incubator as described above in “Culture in hESC medium on MEF.” 6. Incubate the cells overnight to allow the cell clumps to attach. If the cell attachment is a concern, 10 mM Y27632 may be added to the culture for the first night postsplit. 3.3. Validation and Quality Control of hESCs
Validation and quality control assays are necessary to establish a hESC line and should be started as soon as possible once a primary hESC culture is expanded. These assays typically include pluripotency tests, telomerase activity, DNA fingerprinting, karyotyping, HLA typing, and tests for viral pathogens and mycoplasma. We will mainly introduce pluripotency assays here, but also provide brief information for the other assays. Pluripotency assays often include detection of hESC markers, and both in vitro (e.g., embryoid body formation) and in vivo (e.g., teratoma formation) differentiation ability. For hESC marker detection, alkaline phosphatase (AP) can be tested as a quick marker for pluripotent cells. Expression of stage-specific embryonic antigen (SSEA) 3 (SSEA-3), SSEA-4, and tumor recognition antigens (TRAs) 1-60 (TRA1-60) and TRA1-81 are widely used as cell surface markers for hESCs. These markers are often detected by immunocytochemistry for visualization and flow cytometry for quantification. The transcription factors OCT4 and NANOG are tested as nuclear markers for hESCs by immunocytochemistry, flow cytometry, and RT-PCR.
3.3.1. Alkaline Phosphatase Detection
hESCs are characterized by the high expression of alkaline phosphatase. Although there are several commercial kits available for the detection of alkaline phosphatase, we have found that the Quantitative Alkaline Phosphatase ES Characterization Kit works the best in our laboratory. Alkaline phosphatase detection is done per the manufacturer’s recommendations. Alkaline phosphatase may also be detected by immunocytochemistry (See below).
3.3.2. Immunocytochemistry Detection for Cell Surface Markers in hESCs (Fig. 2)
1. Split hESCs on Matrigel-coated glass coverslips (Fisher Scientific, 12-545-80) that fit into four-well plates, ideally plating 2–5 colonies/well. 2. At 2–3 days post-cell split, aspirate the medium and cover the coverslips with 4% paraformaldehyde (freshly prepared or thawed from frozen aliquots). Fix the cells for 10 min at room temperature. Remove the fixitive, and wash with PBS. 3. Prepare the Permeablization Buffer containing 5% normal goat serum, 1% BSA, and 0.1% Triton X-100 in PBS. Note: Spin down the Permeabilizing Buffer for 10–15 min before use to remove insoluble aggregates to reduce background. 4. Cover the coverslips with the Permeabilization Buffer and incubate for 45 min at room temperature. Remove the
Human Embryonic Stem Cell Derivation
13
Fig. 2. Immunostaining for pluripotency markers in hESCs
Permeabilization Buffer, and wash each well with PBS three times. 5. Add Blocking Buffer containing 5% normal goat serum and 1% BSA in PBS, and incubate for 30 min at 37°C. Note: Spin down the Blocking Buffer for 10–15 min before use to reduce background. 6. Remove the Blocking Buffer, cover the coverslips with primary antibodies diluted in Blocking Buffer, and incubate at 37°C for 1 h or 4°C overnight, remove the antibodies, and wash with PBS containing 0.4% Triton X-100 (PBS-T) for three times. The primary antibodies include anti-SSEA3 (diluted 1:25), anti-SSEA4 (1:100), anti-TRA1-60 (1:100), anti-TRA1-81 (1:100), and anti-TRA-2-54/2 J (alkaline phosphatases, 1:10). Note: Spin down the antibody-containing Block Buffer for 10–15 min before use. 7. Remove the primary antibodies, and wash with PBS three times. Cover the coverslips with secondary antibodies diluted in Blocking Buffer, incubate them in the dark covered with aluminum foil at 37°C for 1 h, and wash with PBS three times. If using Alexa Fluor® secondary antibodies (Molecular
14
Lin, Martins-Taylor, and Xu
Probes), dilute the antibodies at 1:200 and spin down for 10–15 min before use. 8. Mount the cells with DAPI to counterstain the nuclei, seal the samples with clear nail polish, and observe under fluorescent microscope for phase and fluorescent images. Samples may be wrapped with aluminum foil and stored at 4°C for up to 1 week. 3.3.3. Immunocytochemistry Detection for Nuclear Markers in hESCs (Fig. 2)
1. Split hESCs on Matrigel-coated glass coverslips that fit into four-well plates, ideally plating 2–5 colonies/well. 2. At 2–3 days postcell split, aspirate the medium and cover the coverslips with 4% paraformaldehyde (freshly prepared or thawed from frozen aliquots). Fix the cells for 10 min at room temperature. Remove the fixitive, and wash with PBS. 3. Prepare PBS-T for cell permeablization. 4. Cover the coverslips with PBS-T and incubate for 10 min at room temperature. Remove the PBS-T, and wash each well with PBS three times. 5. Add Blocking Buffer (5% normal goat serum, 0.2% Tween20, 0.2% fish skin gelatin) and incubate for 30 min at 37°C. Note: Spin down the Blocking Buffer for 10–15 min before use to reduce background. 6. Remove the Blocking Buffer, cover the coverslips with primary antibodies diluted in Blocking Buffer, and incubate at 37°C for 1 h or 4°C overnight, remove the antibodies, and wash with PBS-T20. The primary antibodies include mouse anti-Oct-3/4 (C-10) antibody (diluted 1:100), and rabbit anti-NANOG antibody (diluted 1:100). Note: Spin down the antibody-containing Block Buffer for 10–15 min before use. 7. Remove the primary antibodies, and wash with PBS-T20 three times. Cover the coverslips with secondary antibodies diluted in Blocking Buffer, incubate them in the dark covered with aluminum foil at 37°C for 1 h, and wash with PBS-T20 three times. If using AlexaFluor secondary antibodies (Molecular Probes), dilute the antibodies at 1:200 and spin down for 10–15 min before use. 8. Mount the cells with DAPI to counterstain the nuclei, and observe under fluorescent microscope for phase and fluorescent images. For later view, seal the samples with clean nail polish, wrap with aluminum foil, and store at 4°C.
3.3.4. Embryoid Body Formation (23, 24)
The in vitro pluripotency assay of embryoid body (EB) formation from hESCs is a simple way to test the pluripotency of the cells. Detection of differentiation markers for the three germ layers, as well as the extra-embryonic cell types such as trophoblast, in the EBs is a sign of the pluripotency of these cells. Although there are
Human Embryonic Stem Cell Derivation
15
many versions of EB formation protocols, we have found that the following protocol used by Li and coworkers (23, 24) works the best in our laboratory. 1. Culture hESCs at about 75% confluence, similar to that prior cell passaging. Aspirate spent medium from hESC culture and add 1 mg/mL Dispase at 1 mL/well of a six-well plate. Incubate for 5–10 min and check for the edges of cell colonies to begin to curl off of the plate. Aspirate dispase. 2. Add 3 mL hESC Medium, gently blow off the hESC colonies from one entire six-well plate, and transfer the cell suspension into a 15-mL tube. Gently triturate three to five times to break the cell colonies into smaller clusters. Clusters should be roughly twice the size as clusters for passaging hESCs. 3. Allow the hESC clusters to settle to the bottom of the tube for 5 min. Aspirate the medium with caution so as not to aspirate the cell pellet. 4. Wash the cells once by adding 5 mL fresh hESC Medium and then centrifuge for 2 min at 200 × g. 5. Aspirate the supernatant and resuspend the cells in hESC Medium (for cells from six wells use 60 mL hESC Medium) and transfer them to low attachment T75 flasks. Note: Cell aggregates will initially look unhealthy from shock of separation from feeders. To speed cell recovery, feed for the first time within 12 h and replace most of the medium to remove debris. Switching cells to a new flask is also useful to remove MEF that may have attached during the first 12 h. 6. Continue feeding with hESC Medium every day for 4 days. Note: When feeding, use a 5 mL pipette to gently pull the cell aggregates up and then blow them back into the medium two to three times. This will help clean dead cells off the aggregate surface. Let the clusters settle to the bottom in a standing flask and aspirate off the medium. 7. EBs should be formed within 1 day. Healthy EBs often look bright and are in integral shape, whereas unhealthy EBs often look dark and are in irregular shapes with cell debris. Collect EBs at various times, e.g., 7 or 14 days for early or late differentiation markers or further differentiation purposes. The TaqMan® Human Stem Cell Pluripotency Low Density Arrays contain representative marker genes for pluripotency and various differentiation cell lineages and may be used to test mini-profiles of gene expression via quantitative RT-PCR of hESCs and EB cells differentiated at various times from hESCs (Fig. 3). 3.3.5. Teratoma Formation
The in vivo pluripotency assay of teratoma formation in immunodeficient mice remains the gold standard to test the ultimate
16
Lin, Martins-Taylor, and Xu
Fig. 3. Heat map for gene expression in hESC lines H9 and CT1 tested by the TaqMan® Low Density Array Human Stem Cell Differentiation Panel. The intensity of the colors correlates to normalized ∆Ct values for transcripts of pluripotency and differentiation genes in hESCs. Displayed is the averaged ∆Ct value from two biological replicates for each gene. Note: Ct for a referred gene is reversely related to its RNA level. Green color indicates high transcript levels, and red indicates low.
differentiation potential of both hESCs (1). As described below, immunodeficient (SCID-beige) mice are injected with hESCs (see Note 2). The mice will usually form teratomas 2–3 months
Human Embryonic Stem Cell Derivation
17
postinjection. The resultant teratomas are collected and subject to histological examination to confirm the presence of cells from all the three germ layers and extra-embryonic cell types. 1. Grow hESCs on MEF-coated six-well plates with four wells of hESCs per mouse. 2. When the cells reach about 75% confluence, aspirate the spent medium, wash each well with 2 mL PBS. 3. Add 1 mL of 1 mg/mL Dispase to each well, incubate at 37°C for 15–20 min until entire colonies can be easily dislodged by tapping the plate, add 2 mL hESC Medium into each well, and transfer the cell suspension from each four wells into a 15-mL tube. 4. Centrifuge at 200 × g for 1.5 min, remove the supernatant, add 10 mL fresh hESC Medium into the tube, and pipette up and down of the cell clumps for eight times to break them down into small clumps. 5. Centrifuge at 12 rpm for 2 min, carefully remove the supernatant, add 100 mL of hESC Medium to resuspend the cell clumps, and transfer the cell suspension into a 1.5-mL microcentrifuge tube for injection. Note: 10 mM Y27632 may be added to the cell suspension before injection to increase the cell survival and terotoma formation efficiency. 6. Carry 1-mL U-100 Insulin Syringe 28G1/2, Sterile Alcohol Prep Pads, and the cell suspensions to the animal facility. 7. Tap the bottom of the cell-containing microcentrifuge tube to disperse the cell suspension before loading the cells to the syringe. 8. Suck the entire cell suspension into a 1-mL U-100 Insulin Syringe. Keep the suspension within the needle side and the air on the syringe side. Do not hold the needle side up to tap out the air bubble from the bottom. 9. Use the Alcohol Prep Pad to sterilize the skin of the left thigh of a SCID mouse (male, 4–6-weeks old), inject all of the cell suspension into the muscles of the left thigh until the air bubble reaches the link between the needle and the syringe. 10. Pull out the needle slowly, and make sure no blood or the cell suspension leaks out of the injection site. 11. Return the mouse to the cage and label the cage with detailed information. 12. Observe all the injected mice weekly, and about 5 weeks postinjection start to feel the injection site for tumor formation. 13. When the tumor grows to about 1 cm in diameter, dissect the tumor as follows.
18
Lin, Martins-Taylor, and Xu
14. Use the Alcohol Prep Pad to sterilize the skin above the tumor, use scissors to cut open the skin, use forceps to separate the surrounding tissues and expose the tumor, and use the scissors to cut out the tumor. 15. Place the tumor into a Petri dish containing 5 mL PBS, cut the tumor into two halves, transfer both pieces into a 15-mL tube containing 4% paraformaldehyde, and fix the samples at 4°C overnight. 16. Process the fixed samples for paraffin-embedded sections (5 mm thick) on glass slides, and develop the sections for hematoxylin–eosin staining. 17. Observe under a microscope for representative cell types differentiated from all the three germ layers, and take photographs (Fig. 4).
Fig. 4. Hematoxylin–eosin staining of sections from teratomas formed by CT2 hESCs injected into SCID-beige mice
Human Embryonic Stem Cell Derivation 3.3.6. Information for Other Quality Control Assays
19
1. Test for pathogenic viruses such as HIV, HTLV, HBC, HCV, CMV, EBV, and HSV: GlobelStem Inc. http://www.globlestem.com. 2. Mycoplasma test: MycoAlert Mycoplasma Detection Kit, Cambrex http://www.turnerbiosystems.com/doc/appnotes/ PDF/S-0129.pdf. 3. Karyotyping: Cell Line Genetics http://www.clgenetics.com/. 4. DNA fingerprinting: PowerPlex® 1.2, Promega http://www. promega.com/tbs/tmd009/tmd009.html. 5. HLA typing: serology, PCR, or retrieval from transcriptomic database.
3.4.hESC Differentiation to Trophoblast (5)
3.4.1. Trophoblast Induction
hESCs can form derivatives of all three embryonic germ layers, as well as extra-embryonic tissues such as primitive endoderm and trophoblast. The use of hESCs to derive early human trophoblast is particularly valuable, because it is difficult to obtain these cells from other sources and they are significantly different from mouse trophoblast. Here we describe a method by using BMP4, a member of the TGFb superfamily, to induce the differentiation of hESCs to trophoblast. Immunoassays (as well as DNA microarray and reversetranscription polymerase chain reaction analyses – data not shown) demonstrate that the differentiated cells express a range of trophoblast markers and secrete placental hormones. When plated at low density, the BMP4-treated cells form syncytia that express chorionic gonadotrophin b (CGb). This technique underscores fundamental differences between human and mouse ES cells, which differentiate poorly, if at all, to trophoblast. Thus, hESCs are a novel tool for studying the differentiation and function of early human trophoblast and may provide a new understanding of some of the earliest differentiation events of human postimplantation development. 1. Split hESCs into a six-well plate as described above (see Note 4). 2. When the cells become ~30% confluent (usually on day 2–3 following split), treat the cells with or without 100 ng/mL BMP4. 3. Add fresh media and BMP4 every other day (see Note 5). 4. Observe morphological changes with following features (see Note 6): 1. On day 2 (48 h) of BMP4 treatment, a synchronous wave of differentiation occurs at the edge of the colonies, and is characterized by flattened, enlarged cell types and reduced proliferation (Fig. 5). 2. Gradually the differentiation continues inward to the center of the colonies.
20
Lin, Martins-Taylor, and Xu
Fig. 5. Trophoblast differentiation from BMP4-treated hESCs. (a, b) H1 hESCs cultured in MEF-conditioned medium supplemented with 4 ng/ml bFGF were treated with (a) or without (b) 100 ng/ml BMP4 for 7 days. (c) A syncytial cell formed after 2 weeks of treatment of individualized hESCs by BMP4. (d) Immunofluorescence for CGb (green) and Hoechst 33342 fluorescence for the nuclei (blue). Bars, 25mm.
3. The morphological changes become obvious by day 2 of the treatment for BMP4 at 100 ng/mL, days 3–4 for 10 ng/mL, and days 5–6 for 1 ng/mL. 4. BMP family members such as BMP2 (300 ng/mL), BMP7 (300 ng/mL), and GDF5 (30 ng/mL) induce similar morphological changes to that induced by BMP4 (100 ng/mL). 5. Addition of inhibitors of BMP signaling, such as the soluble BMP receptor IA (500 ng/mL) or the BMPantagonizing protein Noggin (500 ng/mL), can block the morphological changes induced by the BMPs.
Human Embryonic Stem Cell Derivation 3.4.2. Induction of Syncytial Trophoblast
21
1. Aspirate spent medium from a well of hESCs cultured in a six-well plate, add 1 mL Trypsin/EDTA Solution to the well, and incubate at 37°C for at least 5 min, then add 1 mL MEFconditioned medium (CM) to neutralize the Trypsin/EDTA Solution. 2. Scrape the cells from the plate with a glass pipette, transfer the cells to a 15-mL tube, break up the cell colonies by pipetting up and down several times, and add DMEM/F12 medium to a final volume of 10 mL. 3. Pellet the cells by spinning at 200 × g for 5 min, remove the supernatant and resuspend the pellet in CM, which contains mostly single cells. 4. Plate the cells at 105 cells/well, and incubate at 37°C overnight to allow the cells to attach. 5. Treat the cells with or without 100 ng/mL BMP4 next day, and add fresh media and BMP4 every other day. 6. Observe the formation of syncytial cells, which usually occurs within 1–2 weeks of the treatment, featuring giant and irregularly shaped cells containing more than two nuclei (Fig. 5). These differentiated phenotypes remain for a long time without obvious changes.
3.4.3. Characterization of the Induced Trophoblast 3.4.3.1. IImmunocytochemistry
1. Culture hESCs in a four-well plate that contains 0.5 mL CM. 2. Treat the cells with or without 100 ng/mL BMP4 for 7 days as above. 3. On day 7 of the treatment, remove the spent medium from the treated cells, add fresh CM containing Brefeldin A, a Golgi blocker, at 1.25 g/mL, and incubate for 4 h at 37°C. 4. Remove the medium, wash the cells with PBS once, and fix them with 0.5% paraformaldehyde for 10 min at room temperature. 5. Remove the fixative and wash the cells with PBS once. 6. Block and permeabilize the cells by incubating them with PBS-T containing 5% milk powder at room temperature for 30 min. 7. Remove the solution and wash the cells with PBS-T. 8. Add 0.2 mL PBS-T containing mouse anti-human CGb antibody at 1:100 dilution to the test well, and 0.2 mL PBS-T containing equal amount of mouse IgG to the control well. 9. Incubate the cells at 4°C overnight. 10. Remove the solution, and wash the cells with 0.5 mL PBS-T three times (5 min each time). 11. Add 0.2 mL PBS-T containing Alexa Fluor®-labeled goat anti-mouse IgG antibody at 1:200 to each well.
22
Lin, Martins-Taylor, and Xu
12. Incubate the cells at room temperature for 30 min. 13. Remove the solution, and wash the cells with 0.5 mL PBS-T three times (5 min each time). 14. Incubate the cells with the Hoechst 33342 solution for at least 5 min to stain the nuclei. 15. Aspirate the solution (to reduce light reflection) and photograph at 20× magnification to observe both phase and fluorescent images under a microscope (Fig. 5). 3.4.3.2. Placental Hormone Measurement
1. Collect 2 mL spent media daily from cultures of BMP4treated hESCs. 2. Keep the media at −70°C or immediately test them for CGb concentrations using the AxSYM Total hCGb kit (see Note 7), and estradiol and progesterone concentrations by ELISA assays.
4. Notes 1. Before hESC derivation, appropriate ethical compliance documents must be obtained. For example, in the United States many institutions have set up embryonic stem cell research oversight committees. Investigators must obtain approvals from the committees regarding ethical compliances of their hESC research projects. To obtain informed consent from embryo donors, investigators must also apply to their institutional review board for its approval of the consent and authorization to use and disclose protected health information of the donors for research purposes. 2. For hESC culture on MEF or in MEF-conditioned medium, out-bred day-12 pregnant CF-1 strain mice are traditionally used to generate the MEF feeder cells. For in vivo pluripotency assay of hESCs, immunocompromised SCID-beige, or NOD-SCID mice are often used to produce teratomas from hESCs inoculated in the mice. For both purposes, investigators must obtain approval of their animal use protocols from institutional animal care committees. 3. All the three culture conditions, MEF, CM, and TeSR1, introduced above can be used to culture hESCs. In addition to economic and biosafety consideration, we use the MEF system for our stem cell core’s hESC maintenance and training courses, the CM system for individual researcher’s cell maintenance and general research, and the TeSR1 system for specific projects, e.g., study of signaling pathways. 4. For synchronous differentiation of hESCs to trophoblast, hESCs should be passaged as small colonies (about 200 mM
Human Embryonic Stem Cell Derivation
23
in size), and BMP4 added when the cells are ~30% confluent. Big colonies often end up with the cells in the middle of the colonies remaining undifferentiated. 5. We have observed that the potency of BMP4 added to hESC cultures twice on alternative days is equivalent to that of BMP4 added daily for 7 days, as evaluated by morphology and hCG secretion. 6. According to microarray and reverse-transcription polymerase chain reaction assays, the expression levels of pluripotency- and trophoblast-related genes in the hESCs change dynamically during BMP4 treatment (5). From 3 h through 7 days of BMP4 treatment, the expression of the following trophoblast-related genes are elevated: TFAP2A, TFAP2C, MSX2, GATA2, GATA3, SSI3, HEY1, FZD, PlGF, CGB, CGA, LHB, GCM1, INSL4, PAEP, PAPPE, DEPP, MET, and HLA-G1. At day 7, pluripotency marker genes OCT4 and TERT are downregulated. 7. For detection of CGb expression in trophoblast by immunocytochemistry, it is essential to enhance the signal by pretreating the cells with the Golgi blocker Brefeldin A for 4 h, permeabilizing the fixed cells with Triton X-100, and incubating the cells with anti-CGb antibody at 4°C overnight.
Acknowledgments The authors wish to thank the staff of Xu laboratory, former colleagues of Thomson laboratory at University of WisconsinMadison and WiCell Research Institute, and Dr. Xue-Jun Li for contributions to the protocols. This work was supported by Connecticut Stem Cell Research Grants #06SCB14 and 06SCD02 to R.X. The contents in this work are solely the responsibility of the authors and do not necessarily represent the official views of the State of Connecticut. References 1. Thomson, J. A., Itskovitz-Eldor, J., Shapiro, S. S., Waknitz, M. A., Swiergiel, J. J., Marshall, V. S., Jones, J. M. (1998) Embryonic stem cell lines derived from human blastocysts. Science 282(5391), 1145–1147 2. Reubinoff, B. E., Pera, M. F., Fong, C. Y., Trounson, A., Bongso, A. (2000) Embryonic stem cell lines from human blastocysts: somatic differentiation in vitro. Nat Biotechnol 18(4), 399–404
3. Amit, M., Carpenter, M. K., Inokuma, M. S., Chiu, C. P., Harris, C. P., Waknitz, M. A., Itskovitz-Eldor, J., Thomson, J. A. (2000) Clonally derived human embryonic stem cell lines maintain pluripotency and proliferative potential for prolonged periods of culture. Dev Biol 227(2), 271–278 4. Xu, C., Inokuma, M. S., Denham, J., Golds, K., Kundu, P., Gold, J. D., Carpenter, M. K. (2001) Feeder-free growth of undifferentiated
24
5.
6.
7.
8.
9.
10.
11.
12.
13.
14.
Lin, Martins-Taylor, and Xu human embryonic stem cells. Nat Biotechnol 19(10), 971–974 Xu, R. H., Chen, X., Li, D. S., Li, R., Addicks, G. C., Glennon, C., Zwaka, T. P., Thomson, J. A. (2002) BMP4 initiates human embryonic stem cell differentiation to trophoblast. Nat Biotechnol 20(12), 1261–1264 Xu, R. H., Peck, R. M., Li, D. S., Feng, X., Ludwig, T., Thomson, J. A. (2005) Basic FGF and suppression of BMP signaling sustain undifferentiated proliferation of human ES cells. Nat Methods 2(3), 185–190 Levenstein, M. E., Ludwig, T. E., Xu, R. H., Llanas, R. A., Vandenheuvel-Kramer, K., Manning, D., Thomson, J. A. (2006) Basic fibroblast growth factor support of human embryonic stem cell self-renewal. Stem Cells 24(3), 568–574 Xu, R. H., Sampsell-Barron, T. L., Gu, F., Root, S., Peck, R. M., Pan, G., Yu, J., AntosiewiczBourget, J., Tian, S., Stewart, R., Thomson, J. A. (2008) NANOG is a direct target of TGFbeta/activin-mediated SMAD signaling in human ESCs. Cell Stem Cell 3(2), 196–206 Wang, L., Li, L., Menendez, P., Cerdan, C., Bhatia, M. (2005) Human embryonic stem cells maintained in the absence of mouse embryonic fibroblasts or conditioned media are capable of hematopoietic development. Blood 105(12), 4598–4603 Yao, S., Chen, S., Clark, J., Hao, E., Beattie, G. M., Hayek, A., Ding, S. (2006) Long-term self-renewal and directed differentiation of human embryonic stem cells in chemically defined conditions. Proc Natl Acad Sci USA 103(18), 6907–6912 Lu, J., Hou, R., Booth, C. J., Yang, S. H., Snyder, M. (2006) Defined culture conditions of human embryonic stem cells. Proc Natl Acad Sci USA 103(15), 5688–5693 Hovatta, O., Mikkola, M., Gertow, K., Stromberg, A. M., Inzunza, J., Hreinsson, J., Rozell, B., Blennow, E., Andang, M., Ahrlund-Richter, L. (2003) A culture system using human foreskin fibroblasts as feeder cells allows production of human embryonic stem cells. Hum Reprod 18(7), 1404–1409 Richards, M., Fong, C. Y., Chan, W. K., Wong, P. C., Bongso, A. (2002) Human feeders support prolonged undifferentiated growth of human inner cell masses and embryonic stem cells. Nat Biotechnol 20(9), 933–936 Inzunza, J., Gertow, K., Stromberg, M. A., Matilainen, E., Blennow, E., Skottman, H., Wolbank, S., Ahrlund-Richter, L., Hovatta,
15.
16.
17.
18.
19.
20. 21.
22.
23.
24.
O. (2005) Derivation of human embryonic stem cell lines in serum replacement medium using postnatal human fibroblasts as feeder cells. Stem Cells 23(4), 544–549 Klimanskaya, I., Chung, Y., Meisner, L., Johnson, J., West, M. D., Lanza, R. (2005) Human embryonic stem cells derived without feeder cells. Lancet 365(9471), 1636–1641 Ludwig, T. E., Levenstein, M. E., Jones, J. M., Berggren, W. T., Mitchen, E. R., Frane, J. L., Crandall, L. J., Daigh, C. A., Conard, K. R., Piekarczyk, M. S., Llanas, R. A., Thomson, J. A. (2006) Derivation of human embryonic stem cells in defined conditions. Nat Biotechnol 24(2), 185–187 Klimanskaya, I., Chung, Y., Becker, S., Lu, S. J., Lanza, R. (2006) Human embryonic stem cell lines derived from single blastomeres. Nature 444(7118), 481–485 Crook, J. M., Peura, T. T., Kravets, L., Bosman, A. G., Buzzard, J. J., Horne, R., Hentze, H., Dunn, N. R., Zweigerdt, R., Chua, F., Upshall, A., Colman, A. (2007) The generation of six clinical-grade human embryonic stem cell lines. Cell Stem Cell 1(5), 490–494 Zhou, J., Ou-Yang, Q., Li, J., Zhou, X. Y., Lin, G., Lu, G. X. (2008) Human feeder cells support establishment and definitive endoderm differentiation of human embryonic stem cells. Stem Cells Dev 17(4), 737–749 Bongso, A. (2006) Blastocyst culture for deriving human embryonic stem cells. Methods Mol Biol 331, 13–22 Ludwig, T. E., Bergendahl, V., Levenstein, M. E., Yu, J., Probasco, M. D., Thomson, J. A. (2006) Feeder-independent culture of human embryonic stem cells. Nat Methods 3(8), 637–646 Mitalipova, M. M., Rao, R. R., Hoyer, D. M., Johnson, J. A., Meisner, L. F., Jones, K. L., Dalton, S., Stice, S. L. (2005) Preserving the genetic integrity of human embryonic stem cells. Nat Biotechnol 23(1), 19–20 Li, X. J., Du, Z. W., Zarnowska, E. D., Pankratz, M., Hansen, L. O., Pearce, R. A., Zhang, S. C. (2005) Specification of motoneurons from human embryonic stem cells. Nat Biotechnol 23(2), 215–221 Li, X. J., Hu, B. Y., Jones, S. A., Zhang, Y. S., Lavaute, T., Du, Z. W., Zhang, S. C. (2008) Directed differentiation of ventral spinal progenitors and motor neurons from human embryonic stem cells by small molecules. Stem Cells 26(4), 886–893
Chapter 2 Isolation and Maintenance of Mouse Epiblast Stem Cells Josh G. Chenoweth and Paul J. Tesar Abstract Epiblast stem cells (EpiSCs) are isolated from the postimplantation mouse embryo just after implantation but prior to gastrulation. EpiSCs are pluripotent and provide a tractable, in vitro system to study the processes that function during gastrulation to transition pluripotent cells to their differentiated derivatives. This chapter describes the methods for the isolation and maintenance of mouse EpiSCs. We also describe basic assays used to characterize new EpiSC lines. Key words: Epiblast stem cells, Postimplantation epiblast, Egg cylinder, Pluripotency, Pou5f1 (Oct3/4)
1. Introduction Prior to gastrulation, the mouse embryo must maintain a pluripotent population of cells while developing the extraembryonic tissues required for connection to the mother as well as support of the embryo proper. At 3.5 days postcoitus (dpc) the first overt differentiation event of the mouse embryo occurs where the trophectoderm and inner cell mass (ICM) become spatially distinct. The trophectoderm is an extraembryonic structure required for implantation in the female reproductive tract and will form most of the fetal portion of the placenta. The ICM is a small cluster of pluripotent cells that further segregates at 4.5 dpc into two cell types; the preimplantation epiblast and the primitive endoderm. The preimplantation epiblast is pluripotent and is the tissue source for mouse embryonic stem (ES) cell lines (1). After implantation the preimplantation epiblast undergoes morphological and molecular changes to form a radially symmetric, cup-shaped, pseudo-stratified epithelium called the postimplantation epiblast
S. Ding (ed.), Cellular Programming and Reprogramming: Methods and Protocols, Methods in Molecular Biology, vol. 636, DOI 10.1007/978-1-60761-691-7_2, © Springer Science+Business Media, LLC 2010
25
26
Chenoweth and Tesar
Fig. 1. 5.5 dpc mouse embryo. Tissues are labeled and indicated with white arrows. The location of the embryonic/extraembryonic boundary is shown (black dashed line). The postimplantation epiblast is outlined with white dashes
(also commonly referred to as the primitive ectoderm; see Fig. 1). Around 6.25 dpc the mouse embryo commences the process of gastrulation whereby the postimplantation epiblast differentiates into each of the three classical germ layers, ectoderm, mesoderm, and endoderm, as well as the primordial germ cells, the precursors to the gametes (2–4). The postimplantation epiblast, therefore, is the most proximal, pluripotent precursor to all the cell types of the embryo proper and is the ideal tissue in which to study the transition from pluripotency to the differentiated state. The molecular mechanisms regulating the postimplantation epiblast are currently not well defined. This is due to the difficulty accessing this early postimplantation stage of development and the lack of a robust in vitro model system. Research on the biology of mammals has been transformed by the in vitro utilization of stem cell lines directly from the mouse embryo. These cell lines provide access to events that normally take place in vivo within the developing embryo and are not amenable to direct investigation. In addition, the early embryo contains very few cells and these derivative stem cell lines can provide the large source of cells necessary for biochemical and molecular analyses. The recent derivation of stable cell lines from the postimplantation epiblast, EpiSCs, has provided a unique system to interrogate the processes that function during gastrulation to generate all three germ layers as well as primordial germ cells (5, 6).
Isolation and Maintenance of Mouse Epiblast Stem Cells
27
EpiSCs are isolated by direct culture of the postimplantation epiblast. These cells can be indefinitely propagated in vitro and maintained in an undifferentiated state. EpiSCs differ significantly from the more generally studied preimplantation-derived mouse ES cells (1, 7–9). These two pluripotent cell types have divergent global, transcriptional profiles illustrated by the restricted expression of Fgf5 in EpiSCs and Zfp42 (Rex1) in mouse ES cells. Both cell types express the pluripotency transcription factor Pou5f1, yet this is achieved through the use of distinct upstream enhancer elements. Related to this, mouse ES cells and EpiSCs are dependent upon different signal transduction pathways to maintain the pluripotent state. EpiSCs recapitulate the molecular mechanisms functioning in the postimplantation epiblast, the most immediate precursors to the differentiated derivatives in the gastrulating mouse embryo. This trait makes them uniquely capable of serving as a robust model system to study the direct transition from pluripotency to differentiated derivatives. This chapter will detail the methods required to derive EpiSC lines as well as basic assays required for their characterization.
2. Materials 2.1. Mouse Embryonic Fibroblasts
1. Timed pregnant (see Note 1) CF1 strain mouse (Charles River) at 13.5 dpc. 2. Dissection tools: forceps (see Note 2) and scissors. 3. PBS: Phosphate-Buffered Saline without calcium and magnesium. PBS is stored at room temperature. 4. Dissection Medium (see Note 3): FHM Hepes-buffered medium. Dissection Medium is stored in aliquots at −20°C for up to 6 months. Once thawed, Dissection Medium can be used for up to 2 weeks. 5. Coating Solution: 0.1% gelatin Type A from porcine skin (w/v) in tissue culture grade water, dissolved and sterilized by autoclaving. Coating Solution is stored at room temperature and used within 3 months. 6. Mouse Embryonic Fibroblast (MEF) Culture Medium: Dulbecco’s Modified Eagle Medium (DMEM) supplemented with 10% Fetal Bovine Serum (FBS; see Note 4), 2 mM L-glutamine, and 0.1 mM 2-mercaptoethanol. Antibiotics can also be added at final concentrations of 50 units/ml penicillin and 50 mg/ml streptomycin (see Note 5). MEF Culture Medium is filter sterilized using a 0.22 mm polyethersulfone Stericup-GP filtration unit (Millipore), stored at 4°C, and used for up to 2 weeks.
28
Chenoweth and Tesar
7. 2× Freezing Medium: 60% Knockout DMEM, 20% DMSO, and 20% FBS. The solution is filter sterilized with a 0.22 mm syringe filter. Excess 2× Freezing Medium can be stored at 4°C and used for up to 1 week. 8. Cryotubes: 1.8 ml. 9. Cryo-freezing Container: Nalgene “Mr. Frosty” (Nalgene). Container must be filled with isopropanol prior to use. Isopropanol should be changed after four uses. Between uses, store container with isopropanol at room temperature. 10. MEF Passaging Medium: 0.25% trypsin and 0.38 g/L EDTA4Na in Hank’s Balanced Salt Solution without CaCl2 and MgCl2. Trypsin/EDTA is thawed, aliquoted, and refrozen at −20°C for up to 1 year. Thawed aliquots can be used for up to 2 weeks when stored at 4°C. 11. Counting Chamber: (Marienfeld).
Neubauer-improved,
bright-lined
12. Tissue Culture Incubator: humidified and maintained at 37°C and 5% CO2 in air. 13. Irradiator (see Note 6): cesium source or cabinet X-ray device (Faxitron). 14. Stereomicroscope: Leica MZ9.5 with transmitted light base. 2.2. Epiblast Isolation
1. Timed pregnant female mouse at 5.5 dpc (see Note 7). 2. Mouth pipette apparatus (see Note 8): tube assembly, 0.22mm syringe filter, and latex tubing to adapt the end of the tube assembly to a Pasteur pipette. 3. Glass pipettes (see Note 9): siliconized Pasteur pipettes (Bilbate). 4. Glass scalpels (see Note 10): glass capillaries with an outer diameter of 1.00 mm and an inner diameter of 0.75 mm (World Precision Instruments). The central portion of each capillary is fused over a flame and a tapered cutting surface is created using an electrode puller (Sutter Instruments). 5. Dissociation Medium: 0.5% trypsin (w/v) and 2.5% pancreatin (w/v). Powders are stored at −20°C indefinitely. Combine 0.025 g of trypsin and 0.125 g of pancreatin in a 15-ml conical tube. Add 5 ml of PBS, lay the tube on its side and secure to a benchtop shaker with tape, and agitate at high speed for 1–2 h to dissolve the powders (see Note 11). Filter the solution through a 0.22-mm syringe filter and store at 4°C until use. Dissociation Medium can be stored for up to 3 days at 4°C or for 3 months at −20°C. 6. EpiSC Culture Medium: Knockout DMEM supplemented with 20% Knockout Serum Replacement (KSR), 5 ng/ml
Isolation and Maintenance of Mouse Epiblast Stem Cells
29
recombinant human FGF2 (R&D Systems), 2 mM L-glutamine, 0.1 mM 2-mercaptoethanol, and 1× nonessential amino acids. Bottles of KSR are thawed upon arrival, aliquoted, and refrozen at −20°C for up to 6 months. FGF2 is dissolved in 0.1% Bovine Serum Albumin Fraction V (w/v) in PBS to a concentration of 10 ng/ml. FGF2 aliquots are stored at −80°C and used within 6 months. Once thawed, FGF2 aliquots are stored at 4°C and used within 2 weeks. 2.3. EpiSC Culture
1. EpiSC Passaging Medium: 1.5 mg/ml collagenase type IV dissolved in EpiSC Culture Medium (without FGF2) and filter sterilized. EpiSC Passaging Medium is stored at 4°C and can be used for up to 2 weeks. 2. Nunc culture plates and flasks with the Nunclon D-treated surface are used for the culture of EpiSCs and MEFs (sixwell; 24-well; T175 flask).
2.4. EpiSC Characterization 2.4.1. RNA Extraction
1. TRIzol Reagent. Store at 4°C and use in a chemical safety fume hood. TRIzol contains phenol so treat waste as hazardous material. 2. Phase Lock Gel (PLG) Tubes. Store at 15–25°C and do not freeze. 3. Chloroform. Use in a chemical safety fume hood. 4. Isopropanol. Store in a flammable liquids cabinet below 37°C. 5. Diethyl pyrocarbonate (DEPC) water. 6. RNA Precipitation Salt Solution: 0.8 M Sodium Citrate, 1.2 M NaCl in DEPC Water. Store at room temperature in RNase-free tubes. 7. 75% Ethanol in DEPC Water (v/v). 8. DNA-free (Ambion). 9. NanoDrop Scientific).
ND-1000
Spectrophotometer
(Thermo
10. DNase-free\RNase-free\Sterile 1.6-ml microcentrifuge tubes and RNase-free filtered micropipette tips. 2.4.2. Semiquantitative Reverse Transcription Polymerase Chain Reaction
1. Superscript III Reverse Transcriptase 200 U/ml. This product also includes 0.1 M DTT and 5× First-strand Buffer: 250 mM Tris–HCL (pH 8.3), 375 mM KCL, 15 mM MgCL2. Store the Reverse Transcriptase in a manual defrost freezer at −20°C. 2. Random Primers 3 mg/ml. Store at −20°C. 3. Taq DNA Polymerase 5 U/ml. This product also includes a 10× Polymerase Chain Reaction (PCR) Buffer. Store at −20°C in a manual defrost freezer.
30
Chenoweth and Tesar
4. PCR Nucleotide Mix 10 mM. Store at −20°C in a manual defrost freezer. Limit freeze/thaw cycles and aliquot the nucleotide mix if it will be used repeatedly. 5. PCR grade water. 6. Forward and reverse PCR Primers for mouse Fgf5, Pou5f1 (Oct3/4), Zfp42 (Rex1) and Actin genes. Prepare 10 mM working stocks in PCR grade water and store at −20°C. Primer sequences are as follows (5, 10): Pou5f1, forward 5¢CGT TCT CTT TGG AAA GGT GTT C-3¢, reverse 5¢-GAA CCA TAC TCG AAC CAC ATC C-3¢; Zfp42, forward 5¢TGA AAG TGA GAT TAG CCC CGA G-3¢, reverse 5¢-GTC CCA TCC CCT TCA ATA GCA C-3¢; Fgf5, forward 5¢-CTG TAC TGC AGA GTG GGC ATC GG-3¢, reverse 5¢-GAC TTC TGC GAG GCT GCG ACA GG-3¢; Actin, forward 5¢-CTA GAC TTC GAGCAG GAG ATG GC-3¢, reverse 5¢TCT GCA TCC TGT CAG CAA TGC C-3¢. 7. RNase-free\DNase-free\Sterile 1.6-ml microcentrifuge tubes and 0.2-ml PCR tubes. 8. Thermal Cycler. 2.4.3. Oct3/4 Luciferase Reporter Assay
1. Plasmids: Oct3/4 DE-SV40-Luc and Oct3/4 PE-SV40-Luc (5), pGL3-Promoter (Promega), and pRL-TK (Promega). 2. Tris–EDTA (TE) pH 8.0: Tris base 1.21 g/L (10 mM); disodium EDTA 2H2O 0.37 g/L (1 mM). 3. Mouse Embryonic Stem Cell Nucleofector Kit (Amaxa). 4. Nucleofector (Amaxa). 5. Dual-Glo Luciferase Assay System (Promega). 6. 96-well white Microlite microplates (Thermo Scientific). 7. Plate reader capable of quantitatively detecting luminescence such as the Wallac Victor3 Plate Reader (Perkin Elmer). 8. RNase-free\DNase-free\Sterile 1.6 ml microcentrifuge tubes.
3. Methods 3.1. MEFs 3.1.1. MEF Isolation
1. Prewarm MEF Culture Medium at 37°C. You will need ~5 ml of medium per embryo. 2. Euthanize female mouse at 13.5 dpc according to local animal care requirements. 3. Cut open abdominal cavity, transfer the uterus to a 100 mm petri dish filled with PBS, and cut away excess fat and connective tissue from the uterus.
Isolation and Maintenance of Mouse Epiblast Stem Cells
31
4. Transfer the uterus to a 100-mm petri dish filled with Dissection Medium and, using a stereomicroscope, carefully dissect out the embryos by tearing open the uterine muscle layers and extraembryonic membranes with forceps. Ensure embryos are at the correct developmental stage by consulting the Atlas of Mouse Development (7). 5. Transfer embryos to a clean dish of Dissection Medium. Pinch off the heads and remove spinal cords and all internal organ primordia. 6. Transfer the bodies to a clean dish of PBS and move to a sterile hood. 7. Transfer bodies to a 60-mm petri dish containing 5 ml of 0.125% trypsin/EDTA (0.25% trypsin/EDTA diluted 1:1 with PBS) and using a pair of sterile forceps and a sterile razor blade, mince the bodies thoroughly (see Note 12). 8. Use a 5-ml pipette to transfer minced tissue suspension to a 50 ml conical tube and triturate vigorously for 15–20 s. 9. Rinse the dish with an additional 5 ml of 0.125% trypsin/ EDTA and add to the tube. 10. Incubate suspension at 37°C in a water bath for 8–10 min. 11. Triturate vigorously with a 5-ml pipette. Large clumps should be broken up leaving a mostly single-cell suspension. 12. Add an equivalent volume of MEF Culture Medium to the cell suspension to inactivate the trypsin. Do not try to pellet the cells at this point. The trypsin is sufficiently inactivated by the serum in the MEF Culture Medium. 13. Add 25 ml of prewarmed MEF Culture Medium to each T175 flask required (one flask for every five embryos). 14. Divide the cell suspension equally among the flasks and incubate in a Tissue Culture Incubator. This is the primary plating and is denoted as passage 0. 15. Change the medium the next morning to remove excess debris. 3.1.2. MEF Passaging, Freezing, and Thawing
1. Passage 0 MEFs require passaging when they are nearly confluent. This is initially 1–3 days after the primary plating and depends on the initial plating density and survival (see Note 13). Cells are passaged 1:4 (each passage 0 flask is split into 4). To passage, remove medium from each T175 flask, rinse with 5 ml PBS, add 3 ml MEF Passaging Medium, and incubate for 5 min at 37°C. Add 7 ml MEF Culture Medium to each flask and pipette to a single-cell suspension. Spin cells down at 200 × g for 5 min, resuspend the cell pellet in MEF Culture Medium, and distribute evenly among flasks containing 25 ml of prewarmed MEF Culture Medium.
32
Chenoweth and Tesar
2. When passage 1 cells are confluent, trypsinize cells as in Step 1 of Subheading 3.1.2, count using a Counting Chamber, pellet cells at 200 × g for 5 min, and resuspend in MEF Culture Medium at 14 × 106 cells/ml. Add an equal volume of 2× Freezing Medium, mix gently by inverting the tube three times, and distribute 1 ml of cell suspension into individual cryotubes (final concentration 7 × 10⁶ cells/ml). Place tubes in cryo-freezing container and store at −80°C. The following day, transfer vials to a liquid nitrogen freezer for permanent storage. 3. Test thaw one vial from the batch of MEFs to determine survival percentage and to take samples for mycoplasma testing (see Notes 14–15). Usually 1 vial thawed into a T175 flask will be confluent (~25 × 106 cells) in 2–3 days. To thaw, remove vial from liquid nitrogen storage and thaw in 37°C water bath until almost completely melted. Gently add cell suspension to 8 ml of room temperature MEF Culture Medium. Rinse vial with 1 ml of MEF Culture Medium and combine with cell suspension (total of 10 ml). Spin down at 200 × g for 5 min, remove supernatant, and resuspend pellet in 5 ml MEF Culture Medium. Add cell suspension to a T175 flask containing 25 ml of prewarmed MEF Culture Medium. Place flask in a Tissue Culture Incubator. 3.1.3. Mitotic Inactivation of MEFs
1. Add enough Coating Solution to cover the bottom of each culture flask/plate that is required for your experiment. Incubate flasks/plates with Coating Solution at 37°C for 1–2 h (see Note 16). 2. Remove medium from a nearly confluent T175 flask of MEFs, rinse flask with 5 ml of PBS, add 3 ml of MEF Passaging Medium, and incubate at 37°C for 5 min. 3. Add 7 ml of MEF Culture Medium to inactivate the trypsin, triturate to a single-cell suspension, and spin down at 200 × g for 5 min. 4. Remove supernatant and resuspend pellet in 12 ml of MEF Culture Medium. 5. Transport the tube of cells to the irradiator and provide 30–60 Gy of radiation to mitotically inactivate the cells. 6. Resuspend suspension in case any settling has occurred during irradiation and count cells using a Counting Chamber. 7. Remove coating solution from plates/flasks and plate irradiated MEFs at 4 × 10⁴ cells/cm2 (see Note 17). We routinely plate primary epiblast explants onto irradiated MEFs in individual wells of a 24-well plate and culture our established EpiSC lines on irradiated MEFs in six-well plates.
Isolation and Maintenance of Mouse Epiblast Stem Cells
3.2. Isolation and Culture of the Postimplantation Epiblast 3.2.1. Isolation of 5.5 dpc Postimplantation Mouse Embryos
33
1. Euthanize female mouse at 5.5 dpc according to local animal care requirements. 2. Cut open abdominal cavity and transfer the uterus to a 100mm petri dish filled with PBS. Cut away excess fat and connective tissue from the uterus. 3. Transfer the uterus to a 60-mm petri dish filled with Dissection Medium and, under a stereomicroscope, carefully free each deciduum from the uterine muscle layers using properly sharpened forceps. 4. Carefully tease apart each deciduum to reveal each egg cylinder stage embryo (see Note 18). A representative 5.5 dpc embryo can be seen in Fig. 1. 5. Transfer each embryo to the center of a 60-mm petri dish filled with Dissection Medium.
3.2.2. Separation of Tissues from 5.5 dpc Mouse Embryos
1. Using properly sharpened forceps carefully reflect Reichert’s membrane without damaging the embryo. 2. Using a glass scalpel, cut the embryo at the embryonic/extraembryonic boundary as shown in Fig. 1. Discard the extraembryonic fragment. 3. Transfer embryonic fragment (epiblast with overlying visceral endoderm) to a drop of cold Dissociation Medium and incubate for 5–8 min at 4°C. 4. Return embryonic fragment to Dissection Medium and allow it to rest for 5 min. 5. Hand-pull a glass pipette whose inner diameter is slightly smaller than the width of the embryonic fragment. Using a mouth pipette apparatus for fine control, carefully draw the embryonic fragment into the pipette (cut end first). The epiblast should enter the pipette and the visceral endoderm should peel away (see Note 19).
3.2.3. Plating and Culture of Primary Epiblast Tissue
1. Transfer each epiblast fragment to an individual well of a 24-well plate containing irradiated MEFs prepared the previous day (see Note 20). Primary epiblast fragments are grown in EpiSC Culture Medium (see Note 21). 2. Incubate overnight in a Tissue Culture Incubator and examine attachment and morphology of each colony the following day (see Note 22). Do not change medium on day 1. 3. Change medium on day 2. A representative image of a day 2 epiblast colony is shown in Fig. 2a.
3.3. EpiSC Culture 3.3.1. Passage of Primary Epiblast Outgrowth
1. After 2–3 days of growth, the epiblast outgrowth is ready for passage (see Fig. 2b). Under a stereomicroscope in a sterile hood, use a glass pipette or 30-gage needle to cut the colony into 4–6 equally sized pieces.
34
Chenoweth and Tesar
Fig. 2. Culture of primary postimplantation epiblast fragments. (a) Morphology of a primary, postimplantation epiblast colony after 2 days of culture on a layer of irradiated MEFs. Notice the flat, epithelial morphology and sharp, defined colony borders showing no evidence of differentiation. (b) Morphology of epiblast colony shown in (a) after 1 additional day of culture (3 days total). (c–d) Representative examples of cultured postimplantation epiblast explants where extraembryonic tissues were not completely removed from the epiblast fragment prior to plating. White arrows denote areas of extraembryonic cell growth. It is much more difficult to derive EpiSC lines from epiblast explants that are not isolated cleanly as these colonies tend to differentiate rapidly
2. Transfer pieces to a fresh well of irradiated MEFs and culture in EpiSC Culture Medium for 2–3 days. Change medium daily. 3. Under optimal conditions, you can expect each primary epiblast explant to yield an EpiSC line. There is not a derivation process per se. 3.3.2. Routine Passaging of EpiSCs
1. After the first passage, EpiSCs can be passaged enzymatically. We culture our EpiSC lines in six-well plates. To passage, remove EpiSC Culture Medium from each well, add 1 ml of EpiSC Passaging Medium, and incubate at 37°C for 8–12 min (see Note 23). 2. Add 1 ml of EpiSC Culture Medium to each well and dislodge colonies away from irradiated MEFs by gentle pipetting with a 5-ml pipette. Combine colony suspensions from each plate into a 15-ml conical tube.
Isolation and Maintenance of Mouse Epiblast Stem Cells
35
3. Separate colonies away from any remaining MEFs by centrifugation at 200 × g for 15 s. The colonies will loosely pellet at the bottom of the tube while the individual MEFs will remain in the supernatant. 4. Aspirate the supernatant and discard. Gently resuspend the colony pellet in 5 ml EpiSC Culture Medium and perform another 15 s spin. Repeat rinse/spin cycle one more time for a total of three. FGF2 is omitted from EpiSC Culture Medium when used for rinsing. 5. Resuspend colonies in 100 ml of EpiSC Culture Medium and transfer to an individual well of a 96-well round bottom plate. 6. Triturate colonies with a P100 pipette set at 80 ml until only small clusters remain (see Note 24). 7. Add triturated suspension to prewarmed EpiSC Medium and plate 2.5 ml per well. EpiSCs are typically split 1:4–1:6 every 2–3 days. The density at which each EpiSC line is grown is very important and must be determined empirically. 8. EpiSC Culture Medium is changed daily. 3.3.3. Cryopreservation of EpiSCs
1. Isolate colonies free of MEFs as described in Subheading 3.3.2. 2. Triturate into small clusters just slightly larger than for passaging and spin down at 200 × g for 5 min. 3. Resuspend pellet in MEF Culture Medium at a concentration of 0.5 ml for every 35 mm well being frozen (see Note 25). Add an equal volume of 2× Freezing Medium, mix gently by inverting the tube, and distribute 0.5 ml of cell suspension into individual cryotubes (final volume is 0.5 well/vial). Place tubes in cryo-freezing container and store at −80°C. The following day, transfer vials to a liquid nitrogen freezer for permanent storage.
3.3.4. Thawing of EpiSCs
1. Remove vial from liquid nitrogen storage and thaw in 37°C water bath until almost completely melted. Gently add cell suspension to 8.5 ml of room temperature MEF Culture Medium. Rinse vial with 1 ml of MEF Culture Medium and combine with cell suspension (total of 10 ml). Spin down at 200 × g for 5 min, remove supernatant and gently resuspend pellet in 5 ml of prewarmed EpiSC Culture Medium. Remove MEF Culture Medium from MEFs irradiated the prior day, rinse with PBS, and aliquot suspension equally into 2, 35 mm wells. Place in a Tissue Culture Incubator. 2. If recovery is adequate, colonies should be ready to passage in 2–3 days.
36
Chenoweth and Tesar
3.4. Basic Characterization of EpiSCs 3.4.1. Total RNA Extraction from EpiSCs
1. Harvest colonies away from MEFs as described in Subheading 3.3.2. Transfer approximately 1 × 10⁶ cells to a 1.6 ml RNase-free microcentrifuge tube and spin for 2 min at 1,000 × g to collect the cells. Remove the supernatant and resuspend the cells in 0.5 ml of TRIzol (see Note 26). These samples can be stored in the TRIzol at −80°C for later processing, or you can continue with the RNA isolation immediately (see Note 27). 2. Prepare one PLG tube for each sample by spinning each for 3 min at 13,000 × g in a microcentrifuge. The gel will collect at the bottom of the tube. Add 0.5 ml of sample-containing TRIzol to a prepared PLG tube followed by 0.1 ml of chloroform. Vortex the samples vigorously for 15 s and spin for 3 min at 13,000 × g in a microcentrifuge. 3. Transfer the aqueous phase to a new RNase-free microcentrifuge tube (see Note 28). Add 125 ml of isopropanol and 125 ml of the RNA Precipitation Solution. Mix by inversion and spin for 20 min at 22,000 × g in a microcentrifuge at 4°C. Thoroughly remove the supernatant from the resulting pellet with a micropipette (see Note 29). The pellet will be clear and may not stick well to the tube so avoid vacuum aspiration and take great care when removing the supernatant. Save the supernatants so the RNA can be recovered in case the pellet is accidentally transferred. 4. Add 500 ml of ice-cold 75% ethanol in DEPC water to the pellets and wash by inversion of the tube 4–6 times. Collect the pellet by spinning for 1 min at 22,000 × g in a microcentrifuge at 4°C. Remove the supernatant and repeat the wash once more. After removing the supernatant, allow the isolated RNA pellet in the microcentrifuge tube to air-dry for 5 min followed by resuspension in DEPC water. A yield of approximately 10–15 mg of RNA is expected from 1 × 10⁶ EpiSCs depending upon cell line and extraction. A resuspension volume of 25–50 ml should result in a suitable working concentration (approximately 400 ng/ml). 5. DNase treat the RNA samples with the DNA-free reagent according to the manufacturer’s protocol (see Note 30) and quantify the samples with a NanoDrop spectrophotometer (see Note 31). RNA can be stored at −80°C. Prepare aliquots to avoid the introduction of RNase contamination by repeated use of any one individual sample of RNA.
3.4.2. Reverse Transcription Using Total RNA
1. 200 ng–1 mg of total RNA is generally used for a 20 ml RT reaction to make cDNA. Dilute isolated RNA in DEPC water to a normalized working concentration of 100 ng/ml so RT master mixes can be prepared for the samples to be compared (see Note 32).
Isolation and Maintenance of Mouse Epiblast Stem Cells
37
2. The RT reaction can be divided into two steps. The first step is target denaturation. The second step is cDNA generation. Master mixes should be made for each step. 3. For the first step, to a 0.2-ml PCR tube add 200 ng of RNA, 250 ng of random primers, 1 ml of the 10 mM dNTP mix, and an appropriate volume of DEPC water to bring the total volume to 13 ml. A master mix that contains the random primers, dNTPs, and water can be prepared if multiple samples are to be analyzed. Always prepare enough master mix for at least one additional sample. 4. Heat the samples in a thermal cycler for 5 min at 65°C. Immediately following the incubation, place the PCR tubes on ice for 1 min. 5. Spin the tubes briefly in a PCR tube centrifuge to collect the samples in the bottom of the tubes. For the second step, to each tube, add 4 ml of 5× First-Strand Buffer, 1 ml of 0.1 M DTT, 1 ml RNaseOUT and 1 ml Superscript III RT. A master mix of these components for multiple samples can be prepared while step one is incubating on ice. If including minus RT controls, prepare a second master mix where the Superscript III RT is substituted with DEPC water (see Note 33). Mix by pipetting and incubate at room temperature for 5 min. Transfer the tubes to a thermal cycler and incubate for 50 min at 50°C followed by reaction inactivation by heating at 70°C for 15 min. 6. Proceed to PCR-based target detection or store cDNA at −20°C for future use. 3.4.3. PCR Detection of Target cDNA
1. All PCR reactions should be prepared on ice in DNase-free 0.2-ml PCR tubes. 2. Two microliter of cDNA is used for each PCR reaction (see Note 34). Prepare a master mix for each primer set used for target detection. Each reaction consists of 5 ml of 10× PCR Reaction buffer containing 15 mM MgCl2, 1 ml 10 mM dNTP mix, 1 ml of the 10 mM forward primer, 1 ml of the 10 mM reverse primer, 0.4 ml Taq polymerase and 39.6 ml PCR grade water. Add 2 ml of cDNA to the PCR tube followed by 48 ml of the reaction master mix. Mix by pipetting and spin briefly in a PCR tube centrifuge. 3. Program the thermal cycler with the following generic program: 1 initial cycle of – 95°C for 5 min (denaturation) 30 cycles of – 95°C for 30 s (denaturation)
38
Chenoweth and Tesar
60°C for 30 s (annealing) 72°C for 45 s (extension) 1 final cycle of – 72°C for 7 min (extension) Hold at 4°C This program is designed for the Fgf5 primer set described in the materials section. Make the following modifications to the generic program for the indicated primer sets. Pou5f1, lower the annealing temperature to 54°C. Actin, lower the annealing temperature to 59°C. Zfp42, lower the annealing temperature to 56°C and increase the cycling extension time to 90 s. 4. Analyze 10 ml of each PCR reaction using agarose gel electrophoresis. 5. EpiSCs show a 320-bp band for Oct3/4, a 487 bp doublet for Fgf5, a 378 bp band for Actin, and no band for Zfp42 (see Note 35). 3.4.4. Oct3/4 Luciferase Reporter Assay
1. For each of the reporter constructs, Oct3/4 DE-SV40-Luc, Oct3/4 PE-SV40-Luc, and pGL3-Promoter, ~2.5 × 10⁶ cells are used for nucleofection. Equimolar amounts of each construct will be cotransferred with the Renilla luciferase expression plasmid pRL-TK to normalize for nucleofection efficiency (see Note 36). 2. The approximate molecular weights of Oct3/4 DE-SV40-Luc, Oct3/4 PE-SV40-Luc, and pGL3-Promoter are 4.45 × 10⁶ g/ mol, 3.93 × 10⁶ g/mol, and 3.30 × 10⁶ g/mol, respectively. The optimal mass of plasmid DNA for the nucleofection is suggested to be from 2–20 mg. For EpiSCs, 4.5 mg of the largest reporter, Oct3/4 DE-SV40-Luc, is a good starting point. Using the molecular weights and the concentrations of your reporter plasmid preparations, calculate the volume of each needed so that equal numbers of molecules are used for each reporter. Pipette equimolar amounts of each reporter construct into separate 1.6 ml microcentrifuge tubes. 3. Transfer an appropriate amount of the pRL-TK plasmid to each of the tubes so that a tenth of the number of molecules as compared to each reporter is cotransferred. The approximate molecular weight of pRL-TK is 2.67 × 10⁶ g/mol. Bring the total volume of each tube up to 10 ml with TE. 4. Collect the EpiSCs colonies and isolate them from the MEFs as described in Subheading 3.3.2. Triturate into small clusters and resuspend ~2.5 × 10⁶ cells in sterile 1.6 ml microcentrifuge tubes. Pellet cells at 1,000 × g for
Isolation and Maintenance of Mouse Epiblast Stem Cells
39
2 min, rinse with PBS, pellet cells again, and resuspend in 90 ml of Mouse ES cell Nucleofector Solution. Add the 10 µl DNA solution to the cell suspension and mix by gently pipetting three times. Transfer the colony suspension to an Amaxa certified cuvette and proceed with the nucleofection per manufacturer’s protocol using program A-23 (see Note 37). 5. Following the nucleofection, add the 100 ml cell suspension to 3 ml of prewarmed EpiSC Culture Medium and plate 1 ml/ well into three wells of a 24-well plate prepared with irradiated MEFs. Incubate for 48 h under standard EpiSC growth conditions and change the medium daily. This procedure produces three technical replicates for each sample as each of the three wells can be assayed individually. We recommend a minimum of three biological replicates (individual transfections) for each construct. 6. After 48 h the cells are ready to be harvested for analysis. Remove the EpiSC Culture Medium, rinse with PBS, add 250 ml of MEF Passaging Medium (0.25%trypsin/EDTA), incubate for 5 min at 37°C, add 250 ml of MEF Culture Medium, triturate with a P1000 pipette to a single-cell suspension, and transfer each sample to a 1.6-ml microfuge tube. Pellet the cells at 1,000 × g for 2 min, thoroughly aspirate off the supernatant, and resuspend each pellet in 75 ml of PBS. Add 75 ml of Dual-Glo Luciferase Reagent and mix by pipetting three times. Transfer all 150 ml of each sample to separate wells of a 96-well white microplate. Protect the plate from light and incubate at room temperature for 10 min. Measure the firefly luminescence using a luminometer to measure total luminescence for each sample for 1 s (see Note 38). This first measurement detects the firefly luciferase expressed from the Oct3/4 plasmids. After the firefly luminescence is recorded, to each well add 75 ml of the Dual-Glo Stop & Glo reagent that has been prepared according to the manufacturer’s protocol. Protect the plate from light and incubate at room temperature for 10 min. Measure the luminescence using the luminometer to measure total luminescence for each sample for 1 s. This second measurement detects the Renilla luciferase expressed from the pRL-TK control plasmid. 7. Normalize the firefly luciferase activity for each sample to its corresponding Renilla luciferase activity. 8. In EpiSCs you should expect an approximate fivefold greater activity from the Oct3/4 PE-SV40-Luc reporter versus the Oct3/4 DE-SV40-Luc reporter (see Note 39).
40
Chenoweth and Tesar
4. Notes 1. Timed pregnant mice can be ordered from commercial suppliers (Charles River, Taconic, etc) or timed matings can be setup in house. 2. Forceps (Dumont #5) and scissors can be purchased from Fine Science Tools. Although often neglected, forceps should be diligently maintained (11). Properly sharpened forceps simplify the dissection of postimplantation embryos and result in less damage to the embryo. 3. Dissection medium can also be prepared in house (11). It is critical that the Dissection Medium is buffered for room air using a non-CO2-based system and contains protein (BSA or FBS) to prevent sticking. 4. Different lots of FBS have distinct effects on the growth of MEFs. Since we also work extensively with mouse ES cells, we use the same lot of FBS for both MEFs and mouse ES cells. We screen 6–8 lots of FBS each year for mouse ES cell plating efficiency, mouse ES cell colony morphology, and maintenance of Oct3/4 expression. Serum is stored at −20°C or −80°C for up to 1 year. 5. We do not routinely use antibiotics for any of our cultures. Antibiotics are only added to primary cultures for the first 3 days after the initial plating. 6. If access to an irradiator is not feasible, chemical means such as mitomycin-c can be used to mitotically inactivate the MEFs. 7. Unlike mouse ES cells, the derivation of EpiSCs does not seem to be restricted to specific mouse strains. 8. Extreme care must be used when using a mouth aspirator. If you are uncomfortable with this technique or local safety regulations do not permit its use, alternatives such as the Stripper Pipette system (Mid-Atlantic Diagnostics) are available. 9. Pasteur pipettes can also be purchased and acid cleaned and siliconized in house. 10. A more detailed protocol for the production of glass scalpels can be found elsewhere (11). 11. Even after 1–2 h of shaking, not all the trypsin/pancreatin powder will have dissolved. Prior to filtering, the undissolved powder should be settled by gravity or a quick spin in a benchtop centrifuge. The cleared supernatant can be decanted prior to filtration to prevent clogging of the filter. 12. It is best to mince the bodies into small, uniform pieces. Spend no more than 1–3 min on this step to minimize the amount of cell death.
Isolation and Maintenance of Mouse Epiblast Stem Cells
41
13. If the cells take longer than 3–4 days to reach confluence then your initial plating density was too low or proliferation rate is too slow. It is important not to plate the cells too sparse because then it takes them extra population doublings to reach confluence (so passage 1 cells would actually be more equivalent to passage 2 or 3 due to the excess number of population doublings). 14. All primary cells and cell lines should be mycoplasma tested immediately upon entry into the lab and on a regular basis thereafter. It is preferable to keep cells in a separate incubator until their mycoplasma status is known. We routinely use the MycoAlert Mycoplasma Detection Kit (Lonza). 15. Different batches of MEFs have distinct effects on the growth of EpiSCs (as well as ES cells). It is important to screen each batch of MEFs for the ability to support your EpiSCs. For EpiSCs, we only use MEFs up to Passage 3. In our experience, higher passage MEFs do not efficiently support the undifferentiated state of EpiSCs. 16. Pre-coating culture surfaces with gelatin prior to plating irradiated MEFs is important for EpiSCs. The MEFs tend to adhere to gelatin-coated surfaces more strongly and do not lift off the plate when treated with collagenase. This is vital when isolating EpiSCs away from the MEFs for passaging or analysis. 17. The density of the feeder layer is important to maintaining the undifferentiated state of EpiSCs. We recommend counting your MEFs just prior to plating (not before irradiation). 18. Isolation of early postimplantation mouse embryos is extremely difficult and requires practice and perseverance. Additional diagrams of this procedure can be found elsewhere (12). 19. Additional diagrams of this technique can be found elsewhere (13). 20. Although it is a laborious task, we only culture primary epiblast fragments and established EpiSC lines onto MEFs that were irradiated and plated the prior day. 21. Supplementation of Activin A (R&D Systems) at 10 ng/ml can be beneficial to primary epiblast fragments and established EpiSC lines. This is not typically required since the irradiated MEFs provide adequate stimulation of this signaling pathway. Supplementation with Activin A at 10 ng/ml is required if you decrease the plating density of your irradiated MEFs. 22. It is important that each epiblast fragment is completely isolated away from the extraembryonic tissues (see Fig. 2.2c, d). Any remaining extraembryonic tissue will induce differentiation of your epiblast colony. 23. A variety of factors can affect the amount of time required for the collagenase to free the EpiSC colonies from the plate.
42
Chenoweth and Tesar
Check the colonies every few minutes. They are ready when the edges begin to retract from the plate. 24. It is important to dissociate the colonies in a well of a 96-well plate so that you can monitor your dissociation. We typically triturate the colonies ten times and then check their size under the microscope. This is repeated until the colonies reach an optimal size. EpiSCs do not survive well as single cells so it is important not to triturate too much. 25. Since EpiSCs are not trypsinized to a single cell suspension, they are not counted for passaging or freezing. The passaging density and freezing density need to be determined empirically. 26. We find 0.5 ml of TRIzol works well to isolate total RNA from 1 × 10⁶ EpiSCs. Too many or too few cells might lead to an inefficient extraction in 0.5 ml of TRIzol. 27. When working with RNA, take care to use RNase-free consumables and reagents and change gloves often. RNA is highly susceptible to degradation. 28. Avoid transferring any of the gel from the PLG tubes with the aqueous phase. Use a micropipette to transfer the RNA containing aqueous phase to a new microcentrifuge tube. 29. Depending on the efficiency of the extraction, the RNA pellet may be very small and loosely attached to the side of the microcentrifuge tube following centrifugation. Position the tubes in a common orientation in the microcentrifuge prior to spinning so you have an idea where the RNA pellet will be. Use a micropipette to carefully take off the supernatant. You might want to do a second quick spin to recollect any supernatant that may have attached to the sides of the tube and remove it prior to proceeding to the washing steps. 30. The DNA-free kit removes contaminating genomic DNA and divalent cations from the RNA preparation. Contaminating DNA could interfere with subsequent analysis and divalent cations promote nuclease activity. The kit includes recombinant DNase1, a 10× DNase1 buffer, and a DNase inactivation reagent. Following a 37°C incubation of your RNA samples in 1× DNase1 buffer and 2 Units of DNase1, the DNase1 inactivation reagent is added. The proprietary inactivation reagent removes the DNase without phenol\chloroform extraction or precipitation which helps avoid sample loss or degradation. 31. An OD260\OD280 ratio of approximately 1.9–2.1 for total RNA is expected. A simple way to assess RNA quality is to run and analyze your sample on an ethidium bromide-stained 1% agarose gel. You should see two sharp high molecular
Isolation and Maintenance of Mouse Epiblast Stem Cells
43
weight bands that are the 28S and 18S ribosomal RNA bands. Degraded RNA will look like a smear and will lack these sharp ribosomal RNA bands. 32. It is important to normalize RNA from different samples at the beginning of the protocol if they are to be compared using RT-PCR. This allows you to make master mixes of reagents that reduce experimental variability. 33. To control for DNA contamination, it is best to include a minus RT reaction for each sample to be analyzed by semiquantitative RT-PCR. To do this, prepare duplicate RT reactions for each sample in step one of the RT reaction. In step two, only one of these will receive the reverse transcriptase enzyme, while the second will get just water and be termed the minus RT sample. Because the minus RT sample cannot be made into cDNA by definition, then it should not yield any PCR product in the PCR detection step. If it does, then you most likely have genomic DNA contamination of your RNA preparation. 34. We generally use 10% of the cDNA reaction, in this case 2 ml, for the template in the PCR reaction. This is sufficient to detect the desired targets from a starting amount of 200 ng of total EpiSC RNA. You may increase the amount of cDNA used in the PCR reaction to optimize the detection of additional targets. The Superscript III enzyme used in the reverse transcription (RT) reaction has been developed to prevent interference with the PCR reaction. 35. Consider a cDNA sample from blastocyst-derived mouse ES cells to serve as a positive control for the Zfp42 primer set since EpiSCs do not express this gene and will give a negative result. 36. It is best to use equimolar amounts of each reporter and not just the same mass of each. The reporters are different sizes and later interpretation of the data will be facilitated by doing this. 37. Also prepare a control nucleofection sample of EpiSCs using the empty pGL-3 vector and analyze it in the same manner as the experimentals. This will give you an idea of background luminescence and the significance of your signal. 38. Consult your plate reader’s manual to determine the proper operation to record luminescence. 39. You should perform the assay in a blastocyst-derived mouse ES cell line where you can expect the opposite result as compared to the EpiSCs. In the blastocyst-derived line, the Oct3/4 DE-SV40-Luc reporter should have an approximate eightfold greater expression level.
44
Chenoweth and Tesar
References 1. Brook, F. A., and Gardner, R. L. (1997) The origin and efficient derivation of embryonic stem cells in the mouse; PNAS 94, 5709–12. 2. Diwan, S. B., and Stevens, L. C. (1976) Development of teratomas from the ectoderm of mouse egg cylinders. J Natl Cancer Inst 57, 937–42. 3. Lawson, K. A., Meneses, J. J., and Pedersen, R. A. (1991) Clonal analysis of epiblast fate during germ layer formation in the mouse embryo. Development 113, 891–911. 4. Tam, P. P. L., and Zhou, S. X. (1996) The allocation of epiblast cells to ectodermal and germline lineages is influenced by the position of the cells in the gastrulating mouse embryo. Developmental Biology 178, 124–32. 5. Tesar, P. J., Chenoweth, J. G., Brook, F. A., Davies, T. J., Evans, E. P., Mack, D. L., Gardner, R. L., and McKay, R. D. (2007) New cell lines from mouse epiblast share defining features with human embryonic stem cells. Nature 448, 196–9. 6. Brons, I. G., Smithers, L. E., Trotter, M. W., Rugg-Gunn, P., Sun, B., Chuva de Sousa Lopes, S. M., Howlett, S. K., Clarkson, A., Ahrlund-Richter, L., Pedersen, R. A., and Vallier, L. (2007) Derivation of pluripotent epiblast stem cells from mammalian embryos. Nature 448, 191–5.
7. Kaufman, M. H. (1992) The Atlas of Mouse Development, Elsevier Academic Press, London. 8. Martin, G. R. (1981) Isolation of a pluripotent cell line from early mouse embryos cultured in medium conditioned by teratocarcinoma stem cells. Proc Natl Acad Sci U S A 78, 7634–8. 9. Tesar, P. J. (2005) Derivation of germ-linecompetent embryonic stem cell lines from preblastocyst mouse embryos. Proc Natl Acad Sci U S A 102, 8239–44. 10. Hirst, C. E., Ng, E. S., Azzola, L., Voss, A. K., Thomas, T., Stanley, E. G., and Elefanty, A. G. (2006) Transcriptional profiling of mouse and human ES cells identifies SLAIN1, a novel stem cell gene. Dev Biol 293, 90–103. 11. Downs, K. M. (2006) In vitro methods for studying vascularization of the murine allantois and allantoic union with the chorion. Methods Mol Med 121, 241–72. 12. Nagy, A. (2003) Manipulating the mouse embryo: a laboratory manual, Cold Spring Harbor Laboratory Press, Cold Spring Harbor, N.Y. 13. Beddington, R. S. (1987) Isolation, culture and manipulation of postimplantation mouse embryos, IRL Press, Oxford.
Chapter 3 Functional Assays for Hematopoietic Stem Cell Self-Renewal John M. Perry and Linheng Li Abstract Stem cells are defined by the ability to self-renew. Specific functional assays have been developed for the rigorous identification and quantification of hematopoietic stem cells (HSCs), making these cells the benchmark in studies of self-renewal. Here, we review the theory behind these functional stem cell tests and discuss important considerations in choosing and designing these assays. Finally, we provide a basic protocol for the serial-dilution assay, a quantitative assay for HSCs, from which individual researchers can construct their own customized protocols utilizing the guidelines discussed. Key words: Hematopoietic stem cell, Self-renewal, Transplantation, Reconstitution, Repopulation, Competitive repopulation assay, Serial-dilution assay, CRU
1. Introduction Stem cells possess a combination of two key properties. First, they are multipotent, having the capacity to differentiate into multiple, distinct cell types. Secondly, they can undergo self-renewal, a process which regenerates stem cells (1). The hematopoietic system is maintained throughout an organism’s life span by HSCs. Hematopoiesis is a particularly dynamic system containing stem cells, which have the remarkable ability to home from the peripheral circulation to their specific microenvironment or niche and there produce a vast hierarchy of progenitors and precursor cells which ultimately give rise to at least ten distinct lineages of cells (2, 3). Decades of study have produced an immense array of antibodies allowing for identification or enrichment of various hematopoietic cells including HSCs (4). In addition, the ability to isolate very specific populations using fluorescence-activated S. Ding (ed.), Cellular Programming and Reprogramming: Methods and Protocols, Methods in Molecular Biology, vol. 636, DOI 10.1007/978-1-60761-691-7_3, © Springer Science+Business Media, LLC 2010
45
46
Perry and Li
cell sorting (FACS), transplant HSCs intravenously, and collect blood samples identifying donor and host cells periodically without sacrificing test animals has made HSCs the most intensively studied and best understood adult stem cell system. Due to these and other advantages, specific assays have been developed for the functional quantification of HSCs, making this system a gold standard in studies of self-renewal. 1.1. Phenotypic Identification of Putative HSCs
HSCs were first identified as being highly enriched in a relatively rare population of lineage marker negative (Lin−), Sca-1+ and Thy1.1Low cells (5). This population proved to be of limited utility because commonly used strains of mice, such as C57BL/6, lack Thy1.1 expression, and the Thy1.2 allele in these strains is not expressed on HSCs. Later, the receptor for stem cell factor, c-Kit, was found to enrich for HSCs, thus identifying Lin−, Sca-1+, c-Kit+, or LSK cells as putative HSCs (6, 7). Further enrichments and hierarchical classifications have since been developed. Some important ones include the use of Flk2 for further purification and separation of long-term reconstituting HSCs (LT-HSC) in the Flk2− fraction and short-term reconstituting HSCs (ST-HSC) in the Flk2+ fraction (8). More recently, the use of CD34 has yielded further refinements with LT-HSCs classified as an even rarer population of LSK Flk2− CD34− cells (9). Many researchers now designate LSK Flk2− CD34+ cells as ST-HSC while their derivatives, LSK Flk2+ CD34+ cells, are termed multipotent progenitors (MPPs) (10). It is important to note that these designations are age-dependent as CD34+ cells contain LT-HSCs in mice younger than 10 weeks, for instance, and many researchers typically utilize 6–8-week-old mice (11). In general, ST-HSCs more rapidly reconstitute hematopoiesis biased toward myeloid differentiation. This is important for short-term survival (up to about 4 weeks), but ST-HSCs are incapable of longer-term reconstitution. Similarly, MPPs reconstitute only transiently but are biased toward lymphopoiesis (12). In addition, initial survival of animals conditioned for transplantation, typically by lethal-dose irradiation, require radioprotective cells. These cells have rapid and high proliferative capacity but no long-term potential. In contrast, while LT-HSCs are the only population with long-term potential, they are incapable of maintaining survival in the short-term. Consequently, both populations are necessary in transplantation assays involving severe myeloablative conditioning. Numerous other schemes have been utilized for HSC identification. For example, various vital dyes such as rhodamine 123 or Hoescht can enrich for HSCs (13, 14). Efflux of Hoescht is utilized to identify “side-population” or SP cells, which are highly enriched in HSCs. More recently, CD201 (EPCR) and members of the SLAM family have been shown to aid in HSC enrichment, particularly CD150+, CD48− cells (15, 16). Complicated schemes
Functional Assays for Hematopoietic Stem Cell Self-Renewal
47
utilizing multiple combinations of the above markers have yielded extremely high purity of functional HSCs from single cells with reports of greater than 50% of single cells yielding long-term, multilineage reconstitution. Regardless of this impressive progress, “HSCs” identified by FACS analysis can, at best, only be considered phenotypic or putative HSCs. Identification of bona fide HSCs requires functional testing in order to prove both multipotential and self-renewal capacity. In addition, while the variously identified phenotypic HSCs may meet the functional definition of HSC to different degrees, alternate populations may have previously unidentified variations in properties, such as lineage biases and differences in proliferative capacity, which require future functional investigations (17, 18). 1.2. Functional Assays for HSCs
In vitro functional assays have been developed for HSCs including the cobblestone area-forming cell (CAFC) assay and the longterm culture-initiating cell (LTC-IC) assay (19). In particular, the LTC-IC assay, originally developed for human HSC studies due to the previous lack of an adequate xenotransplantation model, can be quantitative and does not require radioprotective or competitor cells. However, the use of these assays remains controversial. They clearly identify relatively immature cells, but it is unclear whether or not they identify true HSCs. Thus, more rigorous standards involve an in vivo functional assay. The first functional, in vivo assay for presumptive HSCs involved the colony forming unit-spleen or CFU-S (20). These cells give rise to large hematopoietic colonies which can be observed on the spleen between 1–3 weeks after irradiation. While the CFU-S was long thought to be a stem cell, these cells only have very short-term potential and are progenitors, not HSCs (21, 22). To test for self-renewal and thus stem cell capacity, longterm assays are required and have since been developed.
1.3. Long-Term Repopulation Assay
The long-term repopulation assay involves transplantation of test cells into irradiated or otherwise compromised hosts. Donors and hosts are chosen ideally so that each can be distinguished by different alleles of the hematopoietic cell marker CD45, with host cells expressing the CD45.1 allele and donor cells expressing the CD45.2 allele, for instance. Blood samples are collected at various intervals, and donor vs. host cells are analyzed by FACS for their potential presence and contribution to major hematopoietic lineages, typically including myeloid as well as B and T lymphoid lineages. A test population is considered to contain LT-HSC(s) when a recipient contains donorderived cells of all these lineages even after at least 16 weeks following transplantation. Modifications of this basic scheme include the use of competitor cells.
48
Perry and Li
1.4. Competitive Repopulation Assay
In this assay, a standard source of HSCs, typically a specific number of whole bone marrow cells derived from mice congenic with the host, are included with the test cells. This allows for the quality of the test cells to be assessed relative to the standard (23, 24). However, it does not allow for rigorous quantification of HSC frequency and number in the test population. For this, a further modification is required.
1.5. Limiting-Dilution Assay
The limiting-dilution assay utilizes a titration of varying doses of test cells (23, 25, 26). The percentage of hosts which fail to engraft donor cells is determined for each dose. With a minimum of three different doses in which both positive and negative recipients are present, a best-fit line is generated by Poisson statistics. This is utilized to calculate the frequency of competitive repopulating units (CRUs) and thus the number of HSCs.
1.6. Serial Transplantation Assay
The most stringent test for stemness is the serial transplantation assay (27). It can utilize any of the above assays. Here, test cells are transplanted into primary recipients as above but then harvested from these primary recipients and transplanted into secondary recipients and further from secondary into tertiary hosts. Only the most primitive HSC can yield long-term, multilineage repopulation in this assay. There are a number of important considerations when designing the above assays (10). The first major consideration involves the test cells and competitor cells. The number of cells utilized is critical. Typically, 1–2 × 10⁵ whole bone marrow competitor cells are utilized. It is estimated that 1 × 10⁵ whole bone marrow cells contain about 3–5 long-term multilineage repopulating HSCs. When the number of test cells is very low, a high number of competitors could result in false negatives (19). However, when competitors are also required as rescue cells for myeloablated hosts, there must be an adequate number of these cells for survival of recipients. In this case, the use of compromised competitor cells may be preferred. Originally, bone marrow which had undergone two rounds of serial transplantation was utilized in the competitive repopulation assay in order to reduce the number of CRUs without reducing the radioprotective effect (28). This or similar schemes, such as transplantation of sorted radioprotective cells (without HSCs), can substantially improve engraftment of the test population. Of course, this also compromises the quality readout; however, it can be useful if the purpose is to demonstrate that a rare population possesses the capacity of a true HSC even if it does not compete well with a known standard. A second major consideration involves the choice and treatment of recipients. Histocompatible mice should be utilized whenever possible; otherwise, immunocompromised recipients are necessary. Numerous stains of immunocompromised mice are
Functional Assays for Hematopoietic Stem Cell Self-Renewal
49
available; the more severely compromised ones naturally tend to yield the best engraftment. In addition, myeloablative therapy such as lethal-dose irradiation is necessary in order to empty the HSC niche and thus allow for donor cell engraftment (29, 30). This myeloablative therapy necessitates the use of rescue/competitor cells. However, mutant mouse models exist which allow for engraftment without this preconditioning. Mice with mutations in c-Kit, W/WV for instance, allow for engraftment of donor cells without irradiation (31, 32). Alternatively, administration of ACK2, an antibody that blocks c-Kit function, can transiently remove endogenous HSCs from their niches allowing for engraftment without myeloablative therapy (30). Generally, there are both advantages and disadvantages to both competitive and noncompetitive assays which should be considered according to the purposes of the experiment. Uncompetitive assays are actually the most clinically relevant; however, they lack quantification relative to a known standard. In contrast, competitive assays allow for rigorous quantification but may yield false negatives, particularly if limited test cell numbers are utilized (19). Theoretically, an HSC could be out-competed in this assay in spite of its capacity as an HSC under normal physiological circumstances in the original donor animal. The third major consideration involves the time following transplantation at which donor engraftment should be measured. If engraftment is analyzed too early, the assay may be measuring progenitors rather than primitive HSCs. Theoretically, an HSC should be able to repopulate the host throughout its life span; however, this is impractical since hosts can live for several years. In practice, engraftment rates tend to stabilize by about 16 weeks posttransplantation (17). Current standards consider long-term engraftment to be achieved by 16 weeks at minimum (10). The fourth important consideration involves the threshold for defining positive and negative engraftment. This is particularly important for the limiting-dilution assay where mice are considered either positive or negative and level of engraftment is not considered in calculating CRU frequency. With very low engraftment, it can be difficult to distinguish true engraftment from nonspecific staining. Some researchers somewhat arbitrarily set the threshold for engraftment at 1%. Others have considered true engraftment at 0.1%. Arbitrary thresholds should not be utilized; all thresholds should be empirically based on each experiment. In particular, a control group should be treated as similarly as possible to the experimental group but without injection of any donor-derived cells. Blood from the control group should be collected and processed alongside the experimental group. The average “engraftment” from this control group should be subtracted from the engraftment of the experimental group.
50
Perry and Li
Here, we provide a basic structure for designing and carrying out a limiting-dilution assay for HSCs. Certain details and modifications should be considered by each individual investigator depending on the goals of the particular study. The considerations discussed above as well as in the following Notes section should aid in this process.
2. Materials 2.1. Recipient Mice/ Competitor Cell Donors
1. B6.SJL (CD45.1) mice, 4–8-weeks old.
2.2. Donor Mice for Test Cells
1. C57BL/6 (CD45.2) mice, 6–12-weeks old.
2.3. Reagents/ Equipment
1. Cell counter. 2. 15-ml sample tubes. 3. 5-ml flow tubes. 4. DMEM without phenol red for resuspension of test/competitor cells. 5. 29-gage and 22-gage needles with syringe. 6. Phosphate-buffered saline (PBS) +2% fetal bovine serum (FBS) for staining medium. 7. Ethylenediaminetetraacetic acid (EDTA)-coated blood collection tubes. 8. Red blood cell (RBC) lysis buffer (150 mM NH4Cl, 10 mM KHCO3, 10 mM EDTA). 9. 40 mM cell strainers/nylon mesh. 10. Anti-mouse antibodies: FITC CD45.2. PE-Cy5 CD45.1. APC CD3. PE B220. APC-Cy7 Gr1. PE-Cy7 conjugated Mac-1. IgG Isotype controls. 11. FACS analyzer. 12. L-Calc software™ (StemCell Technologies, Vancouver). 13. Irradiator. 14. Heat lamp.
Functional Assays for Hematopoietic Stem Cell Self-Renewal
51
3. Methods 3.1. Preparation of Recipient Mice
1. Place recipient mice on acidified or antibiotic-containing water 3 days prior to irradiation and continue for 2 weeks. Be sure to have enough mice for at least three doses typically separated by three to fivefold dilutions. Each dilution should have at least eight mice. Be sure to include a group which is treated as equivalently as possible but is not transplanted with any test cells. This group will be utilized as the base-line for establishing true engraftment (see discussion in the Introduction). Pilot experiments may be needed to gage the optimal doses. Note that each of the 3+ doses will need to contain at least one animal which is negative for use in the CRU calculation. 2. Identify mice by institutionally approved protocols. 3. Irradiate recipient mice with 10 Grays the morning before transplant.
3.2. Preparation of Test and Competitor Cells
1. Harvest bone marrow from mice by flushing marrow from tibias and femurs using a 22-gage needle with syringe and gently draw the solution through the needle to produce a single-cell suspension (see Note 1). 2. Obtain highly accurate cell counts. 3. Add test cells to competitor cells such that the concentration of competitor cells is 2 × 10⁵ + desired number of test cells per 100 ml in DMEM for each recipient (see Note 2).
3.3. Transplantation
1. Place recipient mice under heat lamp for about 2 min. Do not overheat. 2. Place mouse in restraint with tail exposed. Carefully inject cells into the lateral tail vein (see Note 3).
3.4. Evaluation of Engraftment
1. Collect about 50–100 ml of peripheral blood by institutionally approved methods into EDTA-coated tubes (see Note 4). 2. Add cold RBC lysis buffer to blood collection tube and pipette out diluted sample. Add to 15-ml tube containing 5 ml of RBC lysis buffer (see Note 5). Mix gently and place on ice. Continue with additional samples to a maximum of 10–15 samples per group, depending on speed of work. It is important that lysis is relatively consistent, and that samples are not overlysed. To aid in this, all materials should be set up and arranged prior to beginning lysis procedure. 3. Place samples in 37°C water bath for 7 min. Remove and centrifuge at 400 × g for 5 min at 4°C. Immediately aspirate
52
Perry and Li
lysis buffer without disturbing cell pellet. Wash with 5 ml PBS + 2% FBS and resuspend in 100 ml of PBS + 2% FBS. Any remaining blood clots should be removed or filtered out. 4. Transfer samples to 5-ml flow tubes. Add repopulation antibody cocktail to each tube (cocktail should contain 0.25 mg FITC CD45.2; 0.05 mg PE-Cy5 CD45.1, PE B220, and PE-Cy7 Mac-1; 0.25 mg APC CD3 and APC-Cy7 Gr1) (see Note 6). Place on ice for 25–30 min. 5. Wash with 4–5 ml of PBS + 2% FBS. 6. Aspirate leaving approximately 100 ml above cell pellet and resuspend by quickly vortexing. 7. Analyze on FACS cytometer (see Note 7). 8. Calculate CRU frequency using L-Calc™ software (available from StemCell Technologies).
4. Notes 1. Due to normal differences in HSC frequency of individual mice, bone marrow pooled from at least three mice as the source of competitor cells may reduce variation between different experimental groups. 2. Fewer or compromised competitor cells can be added, especially when very limited numbers of test cells are utilized (see further discussion in the Introduction). It may be necessary to first ensure that at least 90% of mice receiving only competitor cells survive. Also, while larger volumes can be injected into adult mice, 100 ml allows for relatively rapid injection whereas lower volumes may compromise accuracy and precision of volume delivered. 3. This is a critical and challenging step and should only be performed by trained personnel. A small amount of blood can be drawn from the vein to ensure that the needle is actually within the vein immediately prior to injection. The fluid should enter smoothly without being forced. 4. Puncture of the submandibular plexus is the preferred method of blood collection. Mixing the blood within the tube by immediately vortexing for a few seconds helps reduce clotting which otherwise requires time-consuming filtration steps and loss of usable material. 5. If blood clots are present, they can often be removed by simply pipetting them out. If numerous small clots are present, entire sample can be filtered through 40-mm nylon mesh or cell strainer.
Functional Assays for Hematopoietic Stem Cell Self-Renewal
53
6. This staining scheme allows for host/competitor and donor myeloid as well as B and T lymphoid cells to be analyzed in a single sample but requires six-color analysis. Four-color analysis can be utilized by splitting each sample into two aliquots and staining host/competitor and donor myeloid cells in one tube, and host/competitor and donor lymphoid cells in the second tube. An alternative scheme is to utilize one color for myeloid cells, a different color for T cells, and both these colors for B cells. This allows four-color, single tube staining as well (B cells are the double positive population) (33). 7. Be sure to collect enough events to allow proper statistical analysis of potential low engraftment accounting for the fact that certain lineages may further represent a low percentage of the donor population.
Acknowledgments We would like to thank Jeff Haug and the Flow Cytometry facility staff at Stowers Institute for help in designing the repopulation assay. References 1. Weissman, I. L., Anderson, D. J., and Gage, F. (2001) Stem and progenitor cells: origins, phenotypes, lineage commitments, and transdifferentiations. Annu Rev Cell Dev Biol 17, 387–403. 2. Orkin, S. H., and Zon, L. I. (2008) Hematopoiesis: an evolving paradigm for stem cell biology. Cell 132: 631–44. 3. Watt, F. M., and Hogan, B. L. M. (2000) Out of Eden: stem cells and their niches. Science 287, 1427–30. 4. Weissman, I. L., and Shizuru, J. A. (2008) The origins of the identification and isolation of hematopoietic stem cells, and their capability to induce donor-specific transplantation tolerance and treat autoimmune diseases. Blood 112, 3543–53. 5. Spangrude, G. J., Heimfeld, S., and Weissman, I. L. (1988) Purification and characterization of mouse hematopoietic stem cells. Science 241, 58–62. 6. Ikuta, K., and Weissman, I. L. (1992) Evidence that hematopoietic stem cells express mouse c-kit but do not depend on steel factor for their generation. Proc Natl Acad Sci U S A 89, 1502–6.
7. Okada, S., Nakauchi, H., Nagayoshi, K., Nishikawa, S., Miura, Y., and Suda, T. (1992) In vivo and in vitro stem cell function of c-kitand Sca-1-positive murine hematopoietic cells. Blood 80, 3044–50. 8. Christensen, J. L., and Weissman, I. L. (2001) Flk-2 is a marker in hematopoietic stem cell differentiation: a simple method to isolate long-term stem cells. Proc Natl Acad Sci U S A 98, 14541–6. 9. Osawa, M., Hanada, K., Hamada, H., and Nakauchi, H. (1996) Long-term lymphohematopoietic reconstitution by a single CD34low/negative hematopoietic stem cell. Science 273, 242–5. 10. Purton, L. E., and Scadden, D. T. (2007) Limiting factors in murine hematopoietic stem cell assays. Cell Stem Cell 1(3), 263–70. 11. Matsuoka, S., Ebihara, Y., Xu, M., Ishii, T., Sugiyama, D., Yoshino, H., Ueda, T., Manabe, A., Tanaka, R., Ikeda, Y., Nakahata, T., and Tsuji, K. (2001) CD34 expression on long-term repopulating hematopoietic stem cells changes during developmental stages. Blood 97, 419–25. 12. Yang, L., Bryder, D., Adolfsson, J., Nygren, J., Mansson, R., Sigvardsson, M., and
54
13.
14.
15.
16.
17.
18.
19.
20.
21.
22.
Perry and Li Jacobsen, S. E. (2005) Identification of Lin(-)Sca1(+)kit(+)CD34(+)Flt3- short-term hematopoietic stem cells capable of rapidly reconstituting and rescuing myeloablated transplant recipients. Blood 105, 2717–23. Goodell, M. A., McKinney-Freeman, S., and Camargo, F. D. (2005) Isolation and characterization of side population cells. Methods Mol Biol 290, 343–52. Li, C. L., and Johnson, G. R. (1992) Rhodamine123 reveals heterogeneity within murine Lin-, Sca-1+ hemopoietic stem cells. J Exp Med 175, 1443–7. Balazs, A. B., Fabian, A. J., Esmon, C. T., and Mulligan, R. C. (2006) Endothelial protein C receptor (CD201) explicitly identifies hematopoietic stem cells in murine bone marrow. Blood 107, 2317–21. Kiel, M. J., Yilmaz, O. H., Iwashita, T., Terhorst, C., and Morrison, S. J. (2005) SLAM family receptors distinguish hematopoietic stem and progenitor cells and reveal endothelial niches for stem cells. Cell 121, 1109–21. Dykstra, B., Kent, D., Bowie, M., McCaffrey, L., Hamilton, M., Lyons, K., Lee, S. J., Brinkman, R., and Eaves, C. (2007) Longterm propagation of distinct hematopoietic differentiation programs in vivo. Cell Stem Cell 1, 218–29. McKenzie, J. L., Gan, O. I., Doedens, M., Wang, J. C., and Dick, J. E. (2006) Individual stem cells with highly variable proliferation and self-renewal properties comprise the human hematopoietic stem cell compartment. Nat Immunol 7, 1225–33. van Os, R., Kamminga, L. M., and de Haan, G. (2004) Stem cell assays: something old, something new, something borrowed. Stem Cells 22, 1181–90. Till, J. E., and McCulloch, E. A. (1961) A direct measurement of the radiation sensitivity of normal mouse bone marrow cells. Radiat Res 14, 213. Jones, R. J., Wagner, J. E., Celano, P., Zicha, M. S., and Sharkis, S. J. (1990) Separation of pluripotent haematopoietic stem cells from spleen colony-forming cells. Nature 347, 188–9. Ploemacher, R. E., and Brons, R. H. (1989) Separation of CFU-S from primitive cells responsible for reconstitution of the bone marrow hemopoietic stem cell compartment following irradiation: evidence for a pre-CFUS cell. Exp Hematol 17, 263–6.
23. Szilvassy, S. J., Humphries, R. K., Lansdorp, P. M., Eaves, A. C., and Eaves, C. J. (1990) Quantitative assay for totipotent reconstituting hematopoietic stem cells by a competitive repopulation strategy. Proc Natl Acad Sci U S A 87, 8736–40. 24. Harrison, D. E., Jordan, C. T., Zhong, R. K., and Astle, C. M. (1993) Primitive hemopoietic stem cells: direct assay of most productive populations by competitive repopulation with simple binomial, correlation and covariance calculations. Exp Hematol 21, 206–19. 25. Taswell, C. (1981) Limiting dilution assays for the determination of immunocompetent cell frequencies. I. Data analysis. J Immunol 126, 1614–9. 26. Szilvassy, S. J., Lansdorp, P. M., Humphries, R. K., Eaves, A. C., and Eaves, C. J. (1989) Isolation in a single step of a highly enriched murine hematopoietic stem cell population with competitive long-term repopulating ability. Blood 74, 930–9. 27. Lemischka, I. R., Raulet, D. H., and Mulligan, R. C. (1986) Developmental potential and dynamic behavior of hematopoietic stem cells. Cell 45, 917–27. 28. Harrison, D. E., and Astle, C. M. (1982) Loss of stem cell repopulating ability upon transplantation. Effects of donor age, cell number, and transplantation procedure. J Exp Med 156, 1767–79. 29. Micklem, H. S., Clarke, C. M., Evans, E. P., and Ford, C. E. (1968) Fate of chromosomemarked mouse bone marrow cells tranfused into normal syngeneic recipients. Transplantation 6, 299–302. 30. Czechowicz, A., Kraft, D., Weissman, I. L., and Bhattacharya, D. (2007) Efficient transplantation via antibody-based clearance of hematopoietic stem cell niches. Science 318, 1296–9. 31. Waskow, C., Madan, V., Bartels, S., Costa, C., Blasig, R., and Rodewald, H. R. (2009) Hematopoietic stem cell transplantation without irradiation. Nat Methods 6, 267–9. 32. Boggs, D. R., Boggs, S. S., Saxe, D. F., Gress, L. A., and Canfield, D. R. (1982) Hematopoietic stem cells with high proliferative potential. Assay of their concentration in marrow by the frequency and duration of cure of W/Wv mice. J Clin Invest 70, 242–53. 33. Challen, G. A., and Goodell, M. A. (2008) Promiscuous expression of H2B-GFP transgene in hematopoietic stem cells. PLoS ONE 3, e2357.
Chapter 4 Isolation Procedure and Characterization of Multipotent Adult Progenitor Cells from Rat Bone Marrow Kartik Subramanian, Martine Geraerts, Karen A. Pauwelyn, Yonsil Park, D. Jason Owens, Manja Muijtjens, Fernando Ulloa-Montoya, Yeuhua Jiang, Catherine M. Verfaillie, and Wei-Shou Hu Abstract Multipotent adult progenitor cells (MAPCs) are adult stem cells derived from the bone marrow of mouse and rat and were described for the first time in 2002 (Jiang et al., Nature 418:41-49, 2002), and subsequently (Breyer et al., Exp Hematol 34:1596-1601, 2006; Jiang et al., Exp Hematol 30:896-904, 2002; Ulloa-Montoya et al., Genome Biol 8:R163, 2007). The capacity of rodent MAPC to differentiate at the single-cell level into some of the cell types of endoderm, mesoderm, and neuroectoderm germ layer lineages makes them promising candidates for the study of developmental processes. MAPC are isolated using adherent cell cultures and are selected based on morphology after a period of about 8–18 weeks. Here, we describe a step-by-step reproducible method to isolate rat MAPC from fetal and adult bone marrow. We elaborate on several aspects of the isolation protocol including, cell density and medium components, and methods for selecting and obtaining potential MAPC clones and their characterization. Key words: Adult stem cells, Bone marrow, Pluripotency, Differentiation
1. Introduction Multipotent adult progenitor cells (MAPCs), derived from rodent bone marrow, were described for the first time in 2002 (1). In addition to bone marrow, murine MAPC have also been isolated from muscle and brain (2). MAPC can undergo extensive proliferation without the loss of potential to differentiate into several cell types, such as, endothelial cells and blood (3–5). Since the isolation of MAPC a number of other groups reported the isolation of
S. Ding (ed.), Cellular Programming and Reprogramming: Methods and Protocols, Methods in Molecular Biology, vol. 636, DOI 10.1007/978-1-60761-691-7_4, © Springer Science+Business Media, LLC 2010
55
56
Subramanian et al.
cells with broader differentiation capacity than classical adult stem cells from somatic tissues such as (a) bone marrow, including human bone marrow-derived stem cells (hBMSCs) (6), marrowisolated adult multilineage inducible cells (MIAMI cells) (7), pre-mesenchymal stem cells (pre-MSCs) (8), (b) umbilical cord, including unrestricted somatic stem cells (USSCs) (9), and very small embryonic-like cells (VSELs) (10, 11), (c) amniotic fluid, amniotic fluid stem cells (AFSs) (12), and from (d) liver, heart, and bone marrow, multipotent adult stem cells (MASCs) (13). The relationship between these different “more pluripotent” populations of stem cells and whether they exist in vivo or are created in vitro is yet to be determined conclusively. Regardless of their origin, the isolation of cells with pluripotent capacity from postnatal somatic tissues yields another source of cells to study and compare self-renewal and differentiation mechanisms in stem cells, and for potential applications, such as cell therapy and in vitro drug toxicity screening. All isolations should be performed following approval from an ethical commission. Rat MAPC are isolated from bones from the entire hind limbs in fetal (E18–E19) and newborn rats and from the tibia and femur of 4–6 weeks old rats. Six to ten million cells per well are plated on six-well tissue culture plates (9.6 cm2 of surface/well) in medium optimized for the process of MAPC isolation and growth (see Subheading 2.1, item 7). The plates are incubated in a humidified incubator at 37°C with 5% oxygen and 5–6% CO2 gas. After 4 weeks of culture, cells are depleted of hematopoeitic cells using magnetic microbeads and the remaining cells are seeded into 96-well plates at 5–10 cells/well. Morphology of cells in the different wells of 96-well plates is very heterogeneous and only wells with mainly small cells are subsequently expanded. After 3–14 weeks, cells with the typical spindle-shaped MAPC morphology appear in some of the selected wells (cells are 10–15 mm size, Fig. 1). To demonstrate that these clones are indeed MAPC, the level of Oct4 mRNA is determined using quantitative RT-PCR and the presence of
Fig. 1. Cell morphology of rat MAPC lines. Cell morphology of (a) selected clones from 96-well plates, (b) rat MAPC cells in heterogeneous cultures, and (c) rat MAPC line after subcloning
Isolation Procedure and Characterization of Multipotent Adult Progenitor Cells
57
Cell Growth curve 1E+36 1E+34 1E+32 1E+30 1E+28 1E+26 1E+24 1E+22 1E+20 1E+18 1E+16 1E+14 1E+12 1E+10 1E+08 1E+06 10000 100 1
rMAPC-1 rMAPC-2
0
5
10
15
20
25 days
30
35
40
45
50
Fig. 2. Cell expansion curve for rat MAPC lines. Cell growth curve of two rat MAPC lines, the doubling time is about 12 h
CD31, typical for rat MAPC is analyzed by fluorescence-activated cell sorting (FACS) (14). Once a cell line with MAPC phenotype (Oct4 mRNA at ∆Ct of 4–6, and CD31 positive) is derived, a large frozen stock of master and working banks is prepared. The characteristics of the putative MAPC are then evaluated (endothelial, hepatocyte, and neural precursor-like differentiation; and further transcriptome phenotype) as described by Ulloa-Montoya et al. (14) (Figs. 3–5), and cytogenetic analysis is done as well. During subsequent cell expansion/maintenance of an established line, quality control studies are performed on a weekly to monthly basis. Routine quality control includes (a) determination of the phenotype by FACS, (b) evaluation of the expression level of the pluripotency transcription factor Oct-4, at the mRNA level, (c) monitoring of karyotype by chromosome counting weekly and intermittent G-banding, (d) exclusion of mycoplasma contamination, and (e) proof of multilineage differentiation potential. Importantly, and different from what we initially described in Nature 2002, undifferentiated MAPC are derived and grown in low oxygen conditions (5%). The process of isolating MAPC from the heterogeneous mixture of cells of the BM is a lengthy procedure (8–18 weeks). The exact frequency of wells that will yield MAPC is still unknown. This chapter aims to provide a detailed description of the isolation protocol of rat MAPC that has enabled multiple investigators in different laboratories to obtain rat MAPC lines with very similar phenotype and differentiation capabilities.
58
Subramanian et al.
Fig. 3. Characterization of rat MAPC by flow cytometry and immunocytochemistry. Upon generation of new rat MAPC lines, typical MAPC markers are checked by (a) FACS analysis for Oct4, CD31, and CD44 and (b) Oct4 immunocytochemistry
Ct gene x- Ct housekeeping gene
Gene expression profile of rat MAPC lines 7,00 6,00 5,00 rMAPC1
4,00
rMAPC2 3,00
rMAPC3
2,00 1,00 0,00 Oct4
Sall4
Epas1
Gata6
Gata4
FoxA2
SOX7
SOX17
Fig. 4. Typical gene expression profile of undifferentiated rat MAPC lines. The gene expression profile of typical rat MAPC genes as evaluated by qRT-PCR shows high levels of expression of pluripotency genes Oct4 and Sall4 and primitive endodermal genes Gata4, Gata6, Sox7, and Sox17
Neuroectoderm differentiation 15
Log2(fold expression on day 20 over day 0)
Log2(fold expression on day 14 over day 0)
Isolation Procedure and Characterization of Multipotent Adult Progenitor Cells
59
Endothelial differentiation
10
10 rMAPC 1 rMAPC 2 5
0 Sox2
Pax6
rMAPC 1 rMAPC 2
5
0 Flk-1
Ve-Cadherin
vWF
Fig. 5. Directed differentiation of rat MAPC lines to hepatocytes, endothelial, and early neuroectoderm-like cell lineages. Directed differentiation of the rat MAPC lines to hepatocyte, endothelial, and neuroectoderm-like progenitors, respectively. Upregulation of genes expressed in cells of hepatic endoderm (will be published separately), endothelial mesoderm (Flk-1, Ve-Cadherin, vWF), and in neuroectoderm-like cells (Sox2, Pax6) are observed demonstrating the multilineage differentiation capability of the rat MAPC lines in cell culture
2. Materials 2.1. Isolation of Rat MAPC from Bone Marrow and Cell Culture
1. PBS (w/o Calcium/Magnesium) with 0.2% Collagenase D and 0.02% DNAse. 2. PBS with 2% fetal bovine serum (FBS). 3. 23-G needle, a 10-ml Luer-Lok syringe, 40-mm nylon cell mesh strainer. 4. MCDB-201: Dilute 1 vial (17.7 g) of MCDB-201 in 1,000 ml of MilliQ distilled water by stirring with magnetic stirrer at room temperature. Adjust the pH to 7.2 and then filter using a 0.22-mm filter. Store at 4°C for a maximum of 1 month before use. 5. Recombinant human platelet-derived growth factor (PDGF-BB): Prepare 4 mM HCl with 0.1% bovine serum albumin (BSA) by adding 0.1 ml HCl to 300 ml water, and subsequently 0.1 g BSA in 100 ml of this 4 mM HCl solution. Filter the solution with a 0.22-µm filter. For vials containing 0.5 mg of PDGF-BB, dissolve the contents in 50 ml of 4 mM HCl + 0.1% BSA and mix well. Aliquot 500 ml/vial and store in −80°C. The stock concentration is 10 mg/ml (use 1 vial for 500 ml of MAPC medium for a final concentration of 10 ng/ml). 6. Mouse epidermal growth factor (EGF): Prepare 0.3% BSA– PBS solution by adding 0.3 g of BSA to 100 ml of PBS. Add 100 ml of this 0.3% BSA–PBS solution to 1 mg of EGF. Mix and aliquot 500 ml/vial and store in −80°C freezer. The stock concentration is 10 mg/ml (use 1 vial for 500 ml of MAPC medium for a final concentration of 10 ng/ml).
60
Subramanian et al.
7. MAPC medium: Mix 60% Dulbecco’s Modified Eagle medium (DMEM) low (1 g/l) glucose, 40% MCDB-201 solution at pH 7.2, 1× Insulin–transferrin–selenium (ITS), 1× Linoleic acid–Bovine serum albumin (LA-BSA), 100 IU/ml Penicillin and 100 µg/ml Streptomycin, 10−4 M l-Ascorbic acid (add 256 mg of l-Ascorbic acid to 100 ml PBS), 2% qualified (see Note 2) FBS, 10 ng/ml human PDGF-BB, 10 ng/ ml mouse EGF, 0.05 µM dexamethasone, 103 units/ml mouse leukemia inhibitory factor (LIF), 55 µM 2-mercaptoethanol (to be added freshly) . Sterilize the medium using a 0.22-mm filter and use within a month. 8. 6-well cell culture plates, 24-well cell culture plates, 96-well cell culture plates, 10-cm cell culture dishes. 9. Fibronectin coating solution: Prepare 0.5 mg/ml stock solution of rat fibronectin by adding 4 ml of PBS to 2 mg fibronectin. Do not shake or pipet solution. Put in incubator for 30 min, then aliquot, and store at −80°C. Dilute rat fibronectin to working solution (100 ng/ml) by adding 100 µl of stock solution to 500 ml of PBS. Filter sterilize through a 0.22-µm filter and store at 4°C. 10. Trypsin–EDTA 0.05%. 11. MACS separation CS columns, PE anti-rat CD45 antibody, anti-PE microbeads. 12. Cell freezing: Prepare freezing medium A: 80% (v/v) MAPC medium and 20% (v/v) FBS (qualified for MAPC) and freezing medium B: 60% (v/v) MAPC medium, 20% (v/v) FBS, and 20% (v/v) DMSO. Cryovials, Nalgene Cryo 1°C freezing container, must change isopropanol at least once every 4–5 times of use. 2.2. Characterization of MAPC and Quality Control
1. RNA mini/micro kit.
2.2.1. mRNA Expression of Pluripotency Markers and Lineage-Specific Genes
3. Nuclease-free microcentrifuge tubes (1.5 ml) with flat cap to collect cell lysates.
2. Cell lysis buffer from RNA mini/micro kit: Mix 990 ml RLT buffer with 10 ml b-mercaptoethanol.
4. Ethanol, Depc-treated water: Prepare 70% and 80% (v/v) Ethanol in Depc-treated water. 5. DNAse turbo kit. 6. Superscript III first-strand synthesis system for RT-PCR. 7. PCR microtubes and RT-PCR grade water. 8. Platinum SYBR green qPCR Supermix-UDG, primer stocks at 5 mM (see sequence Table 1), Thermo-fast 96 Detection plate (Thermo Scientific), Ultra-Clear Cap Strips (Thermo Scientific).
Isolation Procedure and Characterization of Multipotent Adult Progenitor Cells
61
Table 1 Forward and reverse primer sequences for pluripotency and differentiation markers Tissue/lineage Gene
Forward primer
Reverse primer
Housekeeping Gapdh
AAGGGCTCATGACCACAGTC
GGATGCAGGCATGATGTTCT
Pluripotency
Oct4
CTGTAACCGGCGCCAGAA
TGCATGGGAGAGCCCAGA
Sall4
AGAACTTCTCGTCTGCCAGTG
CTCTATGGCCAGCTTCCTTC
Epas1
CAGTCCTCCAGGAGCTCA
CTCCCCTGCAGGAGTGTAGA
Gata6
GTCTGGATGGAGCCACAGTT
ATCATCACCACCCGACCTAC
Gata4
CTGTGCCAACTGCCAGACTA
AGATTCTTGGGCTTCCGTTT
Foxa2
GCAGAACTCCATCCGTCATT
TCGAACATGTTGCCAGAGTC
Sox7
CAAGGATGAGAGGAAACGTC
CTCTGCCTCATCCACATAGG
Sox17
GCCAAAGACGAACGCAAGCGG TCATGCGCTTCACCTGCTTG
AFP
ACCTGACAGGGAAGATGGTG
GCAGTGGTTGATACCGGAGT
Albumin
TCTGCACACTCCCAGACAAG
AGTCACCCATCACCGTCTTC
AAT
CAAACAAGGTCAGCCATTCTC CAGCATCATTGTTGAAGACCC
Flk-1
CCAAGCTCAGCACACAAAAA
CCAACCACTCTGGGAACTGT
Ve-Cadherin GGCCAACGAATTGGATTCTA
GTTTACTGGCACCACGTCCT
vWF
CCCACCGGATGGCTAGGTATT
GAGGCGGATCTGTTTGAGGTT
Neuroectoderm Sox2
GGCCAACGAATTGGATTCTA
GTTTACTGGCACCACGTCCT
Pax6
GTCCATCTTTGCTTGGGAAA
TAGCCAGGTTGCGAAGAACT
Primitive endoderm
Hepatic endoderm
Endothelium
2.2.2. Flow Cytometry
1. Antibodies: mouse anti-rat CD31-PE (TLD-3A12, BD Pharmingen), mouse anti-rat CD44-FITC (OX-49, BD Pharmingen), goat Oct3/4 (Santa Cruz). 2. Isotype controls: Mouse IgG1-PE (BD Pharmingen), Mouse IgG2a-FITC (BD Pharmingen), Goat IgG (Jackson), and Donkey anti-goat-Cy3 (Jackson) as secondary antibody for Oct4 staining. 3. FACS round bottom tubes with cell strainer cap. 4. Prepare formaldehyde fixation solution by diluting 400 ml of 10% Ultrapure Formaldehyde (Polysciences) in 600 ml PBS. 5. SAP buffer – 0.1% (w/v) saponin, 0.05% (w/v) sodium azide in PBS, SAP serum buffer – SAP buffer with 10% donkey serum (Jackson).
62
Subramanian et al.
2.2.3. Immunocytochemistry
1. Fish skin gelatin (in water). 2. 0.3% (v/v) Hydrogen peroxide solution (30% w/w) in methanol, prepare just before use. 3. 0.2% Triton X-100 solution for permeabilization: add 100 ml Triton X-100 to 500 ml of PBS. 4. Antibodies: Goat Oct3/4 (Santa Cruz) and Biotin-labeled donkey anti-goat secondary antibody (Jackson) in Dako Real Antibody diluent (Dako). 5. Vectastain ABC kit (Vector Laboratories). 6. Dako Liquid DAB+ substrate chromogen system containing Substrate Buffer and DAB+ Chromogen (Dako).
2.2.4. Hepatocyte Differentiation (Endoderm)
The precise current protocol will be published shortly in a separate manuscript; hence, readers are referred to that manuscript for the detailed protocol.
2.2.5. Endothelial Differentiation (Mesoderm)
1. Basal differentiation medium: 60% Dulbecco’s Modified Eagle Medium, low glucose , 40% MCDB-201, 1× ITS, 1× LA-BSA, 100 IU/ml Penicillin, and 100 mg/ml Streptomycin (Cellgro), 10−4 M L-Ascorbic acid, 1 mM Dexamethasone, 55 mM b-mercaptoethanol (Gibco) (to be added freshly). Combine and filter through a 0.22-mm steriflip (Millipore) and store at 4°C no longer than 4 weeks. 2. Recombinant Human VEGF165 (R&D): Dissolve 50 mg of lyopholized cytokine in 10 ml of PBS + 0.3% BSA and aliquot in 100 ml vials and store at −80°C. 3. Endothelial differentiation medium step 1: To prepare 50 ml of medium, add 47.5 ml of basal differentiation medium, 0.1 ml of rh-VEGF165 5 mg/ml, 2.5 ml of qualified FBS. Combine and filterize through 0.22 mm 50 ml steriflip and store at 4°C no longer than 2 weeks. 4. Endothelial differentiation medium step 2: To prepare 50 ml of medium, add 48.75 ml of basal differentiation medium, 0.1 ml of rh-VEGF165 5 mg/ml, 1.25 ml of qualified FBS. Combine and filterize through 0.22 mm 50 ml steriflip and store at 4°C no longer than 2 weeks.
2.2.6. Neuroectoderm Differentiation
1. N2B27 medium: 50% Neurobasal-A medium, 50% DMEM/ F12, 0.5× B27, 0.5× N2 plus (R&D Systems), 0.05 mM b-mercaptoethanol, 2 mM Glutamine. 2. NSE medium: Euromed-N medium (Annovum/Euroclone), 2 mM L-Glutamine, 10 ng/ml bFGF, 10 ng/ml EGF, 1× N2 plus supplement, 2 µg/ml heparin, 0.05 mM 2-mercaptoethanol. 3. 0.1% gelatine solution (Chemicon).
Isolation Procedure and Characterization of Multipotent Adult Progenitor Cells
2.3. Cytogenetics by G-Banding
63
1. Colcemid 10 µg/ml (Irvine Scientific). 2. Hanks’ Balanced Salt Solution. 3. Trypsin–EDTA 1× solution (0.25%). 4. Hypotonic solution: 0.075 KCl (pH 6.0–6.7) (Mallinckrodt): Dissolve 11.2 g KCl in 2 L MilliQ water, stir for 2–3 h and store at 4°C until needed. No expiration date for this solution. 5. Methanol/Acetic Acid Fixative: Mix 1 part glacial acetic acid with three parts absolute methanol immediately before use. Store at room temperature. 6. Pancreatin: Mix 2.5 ml trypsin–EDTA 10× (Biochrom) and 50 ml of 1× Hanks balanced salt solution. 7. Wright’s stain: In a 6-L flask, dissolve 12.5 g of Wright’s stain (Richard-Allan Scientific) into 5 L of methanol and then add 0.225 g of Giesma stain (Fisher). Cover the flask with foil to protect from light and mix on a stirrer for at least 30 min (preferably overnight). Filter the solution into 1-L brown glass bottles. For best results, let the stain age for at least 1 month by storing in dark at room temperature. 8. Phosphate Buffer (pH 6.8): Prepare solutions A (0.06M KH2PO4 – dissolve 16.32 g KH2PO4 in 2 L distilled water) and solution B (0.06 M Na2HPO4 – dissolve 17.04 g Na2HPO4 in 2 L distilled water) in separate flasks. Pour solution A into a large clean plastic container and then add most of solution B to solution A and mix well. Check pH and adjust to 6.8 with the remainder of solution B.
3. Methods 3.1. Isolations of Rat MAPC from Bone Marrow
1. Sacrifice one timed-pregnant rat (E18-E19) or 3–4-weeksold Fischer or Sprague-Dawley rats by CO2 inhalation (see Note 1).
3.1.1. Bone Marrow Aspiration from E18 and 3/4-Week-Old Rats
2. Take out the whole litter of embryos and dissect the skin and muscle from the tibiae and femur, under sterile conditions. Collect all material in 10-cm dishes in PBS 2% FBS. 3. Cut of the ends of the bones to be able to insert the needle. It is important to flush the end of the bones as well. Flush the bones thoroughly with 15–20 ml of PBS containing 2% FCS using a 23-G needle, until the bones are more or less transparent. Collect the flushed fluid in sterile 10-cm cell culture dishes. 4. Triturate cells by passing the cell suspension 5–10 times through a 23-G needle attached to a 10-ml syringe to obtain a single-cell suspension.
64
Subramanian et al.
5. After flushing of fetal bones, the bone is crushed and incubated for 20–30 min with PBS containing 0.2% collagenase and 0.02% DNAse at 37°C. After incubation, cells are pooled with the flushed cells. 6. Filter the total cell suspension through a 40-µm nylon cell mesh strainer. 7. Centrifuge cells at 600 × g for 6 min. 8. Wash the cells three times with regular MAPC expansion medium by centrifugation at 600 × g for 6 min. 9. Count the cells. 10. Plate cells in the fibronectin-coated wells (at 6–10 × 106 cells/ well in 2 ml of MAPC medium). 3.1.2. High-Density Culture of Cells for 1 Month
1. Three days after plating of the cells, add 1-ml prewarmed medium to each well. 2. For the rest of the first week only add 1 ml of prewarmed medium every other day. Since many of the cells will not yet be attached to the plate, do not remove any medium. 3. From the second week (days 7–14), change half of the medium (2 ml/well) every other day. Add the medium slowly from the side wall of each well to minimize the chances of detachment of cells from the bottom of the plate. 4. On day 14 (beginning of the third week), trypsinize and replate at 80% confluence (about 2 × 10⁴ cells/cm2), which can be achieved by doing a 1–1.5 split. 5. For the next 2 weeks (days 14–28), trypsinize cells 1–2 times/ week when the plate is 100% confluent and replate again at 80% confluence (1–1.5 split).
3.1.3. Column Depletion of CD45+ Population
Column depletion is a negative selection strategy whereby the unwanted cells are magnetically labeled and eliminated from the cell mixture (see Note 3). 1. Column preparation: Attach the three-way stopcock to the column, with a 20-G needle attached below and a 10-ml syringe on the side. Attach column with three-way stopcock to MACS triangle. Wash the CS column by pushing 30 ml of MACS buffer through the 10-ml syringe from bottom to top of the column and let the fluid evacuate through the 20-G needle. Never let the column dry out! 2. Cell preparation: Trypsinize the cells, centrifuge them and count. Use about 3–5 million cells for each run through the column. Wash and centrifuge the cells again in MACS buffer. Remove supernatant and resuspend in 80 µl of MACS buffer. Add anti-rat CD45-PE antibody. Incubate solution
Isolation Procedure and Characterization of Multipotent Adult Progenitor Cells
65
for 20 min at 4°C with intermittent shaking. Wash the cells twice in 10 ml of MACS buffer. Incubate in a second step with anti-PE microbeads for 20 min at 4°C with intermittent shaking. Wash cells again and following the second wash, resuspend the cells in 500 µl of MACS buffer. 3. Cell depletion: Attach a 23- to 25-G needle to the three-way stopcock. Apply the cell suspension to the MACS column. The cells positive for CD45 will be attached against the magnetic column and the negative cells will migrate through the column. Let cells flow through the column at a slow pace (1 drop every 4–5 s). Collect in 15-ml tubes. Wash the column with an additional 30 ml of MACS buffer. Spin down the cells in different fractions with each fraction consisting of 10 ml of eluted buffer. Collect 3–4 fractions (see Note 3). Count the cells and plate them at 5–10 cells/well of 96-well fibronectin-coated plates for expansion. To obtain several cell lines with high levels of Oct4 expression, plate five 96-well plates per fraction. 3.1.4. Subcloning, Culture, and Screening of Potential MAPC Clones
1. Change half of the medium every other day. Inspect the plate under the microscope daily from the second week after plating to identify wells with clones consisting of small, triangular to round cells (see Note 4). 2. Once the colony consists of 30–50 cells, trypsinize the cells (50 ml of 0.05% trypsin/well of 96-well plate) and replate in progressively larger fibronectin-coated plates; a well of a 24-well plate for about 3–4 days, followed by 6-well plates for another 7–14 days and eventually a 10-cm dish. From then, trypsinize and maintain cells in 10-cm dishes passaging every 2–3 days at ratios between 1:3 and 1:6 depending on cell density. Make sure to keep the cells at low density, without forming cell–cell contacts. 3. Continue with maintenance of cells till small clusters of cells begin to appear and/or the large cells begin to disappear from the culture. Once a homogeneous population of small, spindle/triangular cells with MAPC morphology appear, passage every 2 days and seed each 10-cm dish at 300 cells/cm2 (see Note 4). Within the first week of obtaining MAPC-like cells by morphology, expand cells to obtain a frozen stock (master bank of early passages) and for characterization of cells for MAPC phenotype. After some initial characterization and confirmation of new MAPC lines using quantitative real-time polymerase chain reaction (qRT-PCR) and immunohistochemistry for Oct4, create another frozen stock (working bank) within the following week. Complete all the characterizations before using or distributing the MAPC lines for experiments.
66
Subramanian et al.
3.2. Expansion or Maintenance Culture of MAPC Lines (see Note 5) 3.2.1. Coating of Wells and Dishes
3.2.2.Procedure for Thawing MAPC
1. Cell Culture dishes (Nunc) or wells (Corning) are coated with 100 ng/ml rat fibronectin (3 ml/10 cm dish). 2. Dishes or wells are precoated for 2 h at room temperature, 1 h at 37°C or overnight at 4°C. Upon plating of the cells, fibronectin is removed and the rat or mouse growth medium containing the cells is added. Typically 20,000 cells are seeded per 10-cm dish (300 cells/cm2). 1. Remove the vial from the liquid nitrogen tank and place on dry ice. 2. Partially thaw in a 37°C water bath. 3. When about half of the liquid in the vial is thawed, collect the medium and cells and add to 10 ml of fresh MAPC expansion medium. 4. Spin down at 300 × g for 8 min (freshly thawed cells are more fragile, hence g-force should be lower). 5. Count and plate the cells as described on fibronectin-coated dishes. 6. Change full medium the next day and passage the following day.
3.2.3. Passaging of MAPC Lines
1. Precoat 10-cm dishes with fibronectin. 2. Prepare fresh rat MAPC medium. 3. Aspirate the expansion medium. Collect the removed medium in 50-ml tubes. 4. Rinse the dishes with PBS without calcium and magnesium (3 ml/dish) by rigorous swirling and aspirate the PBS. 5. To deattach the cells, add ~20 µl/cm2 trypsin; 0.05% for rat MAPC. Cover the surface of the plate by swirling. Incubate for 1–2 min at room temperature. Dislodge the cells by tapping the plates gently. Check microscopically if all cells are deattached. 6. Add the collected expansion medium to neutralize the trypsin. Harvest the cells in a 15-ml or 50-ml centrifuge tube. 7. Centrifuge at 600 × g for 6 min. 8. Aspirate the supernatant and resuspend the pellet in fresh growth medium. 9. Count the cells with a hemocytometer. 10. Remove fibronectin solution from the new 10-cm dishes. Plate rat cells at 300 cells/cm2 (about 20,000 cells/10 cm dish) use 6 ml of rat MAPC medium.
3.2.4. Procedure for Freezing MAPC
1. Place freezing vials on ice. 2. Trypsinize and count cells. Freeze about 0.5 × 10⁶ cells/vial.
Isolation Procedure and Characterization of Multipotent Adult Progenitor Cells
67
3. Centrifuge at 600 × g for 6 min and then discard the supernatant. 4. Resuspend 0.5 × 10⁶ cells in 500 µl freezing medium A for each vial. Gently add 500 µl freezing medium B for each vial. Add drop by drop and tap or shake tube. Do not repeatedly pipet solution. 5. Immediately place the vial in Nalgene freezing box (containing 100% isopropanol) and store at −80°C for a minimum of 6 h or overnight. 6. Move the vials to the liquid nitrogen freezer (−180°C) for long-term storage. 3.3. mRNA Expression of Pluripotency Markers
Rat MAPC lines express some pluripotency genes as Oct4 and Rex1 but do not express Nanog and Sox2 as described by UlloaMontoya et al. (14). Upon isolation of new lines with characteristic MAPC morphology (Fig. 1), the cells are expanded (Fig. 2) and the levels of Oct4 and primitive endodermal genes are evaluated by qRT-PCR (Fig. 4). Generally rat MAPC lines express Oct4 at a ∆Ct between 2 and 6, with GAPDH as housekeeping gene. Only lines with these levels of Oct4 are further characterized for MAPC phenotype and function (Figs. 3–5).
3.3.1. Preparation of Cell Lysates
1. After 2 days of culture, trypsinize cells in 10-cm cell culture dishes as described before, centrifuge 6 min 600 × g. 2. Remove medium and add 350 µl (for 40 days at high density or in 3D aggregates in complete MAPC medium does not induce loss of Oct4 or loss of differentiation ability. However, if cultured at high density in the absence of EGF, PDGF, and LIF, spontaneous differentiation is seen, with acquisition of early endodermal and mesodermal markers (papers being submitted). 8. In our protocol, Sybr Green is used for real-time detection of PCR products. Sybr Green is less specific compared to systems with gene-specific fluorescently labeled probes. Since Sybr Green also can bind nonspecific to dsDNA, it can give more aspecific readings (i.e., primer-dimers). Therefore, it is recommended to include a dissociation curve analysis in the end of the PCR reaction. For each set of primers, it is advised that the obtained amplified product is send the first time for sequencing to assure that the primers amplify the correct gene. Some investigators also run the amplified products on a gel to assure that a band of the correct size is obtained with each qRT-PCR reaction, aside from performing dissociation curve analysis. Results of gene expression can be calculated using different methods. We mostly use the ∆Ct method by calculating the Ctgene of − CtGAPDH. The closer the gene of interest is to the interest housekeeping gene, the higher the Ct value of this gene and the lower the ∆Ct value. 9. At the start of a differentiation, always freeze an RNA sample of the cells for determination of pluripotency and differentiation gene expression before induction of differentiation. In general, it is important to handle the cells gently; never let the wells with the cells dry out during rinsing or changing medium. To avoid dislodging of the cells, it is advisable not to add the medium straight on the cells, but instead add the medium slowly from the side of the well, avoiding contact with the cell monolayer, also when removing medium. It is particularly important to count the cells accurately, since the seeding density is one of the critical parameters determining the result of the different differentiations. 10. In contrast to previous published papers with mouse MAPC (15), the neuroectoderm differentiation of rat MAPC with the described mesendodermal phenotype is the most difficult to perform. So far, we only obtain induction of early neuroectodermal genes Sox2 and Pax6. Further optimization of the protocol is being carried out in our lab to obtain functional neurons in cell culture.
Isolation Procedure and Characterization of Multipotent Adult Progenitor Cells
77
Acknowledgments The authors would like to thank Dr Hirsch and LeAnn Oseth of the University of Minnesota cytogenetics core facility for accurate performance and analysis of G-banding experiments. Tine Decuyper, Sarah Mertens, Nathalie Feyaerts, Annelies Deman, April Breyer, Tineke Notelaers, Pieter Berckmans, and Sumitha Jacob are acknowledged for their excellent technical support with cell culture, stainings and qRT-PCR. Vick Vanduppen is acknowledged for his FACS support. This work was supported by grants to CMV: NIH-T15 HL076653, KUL CoE, FWO Odysseus Fund; FP6-STREP: STROKEMAP. KS was funded by Doctoral dissertation fellowship (DDF), Graduate School, University of Minnesota. MG was funded by FWO; DJO was supported by the NIH biotechnology Training Grant (GM08347); KP was funded by the FWO, BAEF, and VVGE. References 1. Jiang, Y., Jahagirdar, B. N., Reinhardt, R. L., Schwartz, R. E., Keene, C. D., OrtizGonzalez, X. R., et al. (2002) Pluripotency of mesenchymal stem cells derived from adult marrow. Nature. 418, 41–49. 2. Jiang, Y., Vaessen, B., Lenvik, T., Blackstad, M., Reyes, M. and Verfaillie, C. M. (2002) Multipotent progenitor cells can be isolated from postnatal murine bone marrow, muscle, and brain. Exp. Hematol. 30, 896–904. 3. Luttun, A., Ross, J. J., Verfaillie, C., Aranguren, X. L. and Prosper, F. (2006) Differentiation of multipotent adult progenitor cells into functional endothelial and smooth muscle cells. Curr. Protoc. Immunol. Chapter 22, Unit 22F 29. 4. Aranguren, X. L., McCue, J. D., Hendrickx, B., Zhu, X. H., Du, F., Chen, E., et al. (2008) Multipotent adult progenitor cells sustain function of ischemic limbs in mice. J. Clin. Invest. 118, 505–514. 5. Serafini, M., Dylla, S. J., Oki, M., Heremans, Y., Tolar, J., Jiang, Y., et al. (2007) Hematopoietic reconstitution by multipotent adult progenitor cells: precursors to long-term hematopoietic stem cells. J. Exp. Med. 204, 129–139. 6. Yoon, Y. S., Wecker, A., Heyd, L., Park, J. S., Tkebuchava, T., Kusano, K., et al. (2005) Clonally expanded novel multipotent stem cells from human bone marrow regenerate myocardium after myocardial infarction. J. Clin. Invest. 115, 326–338.
7. D’Ippolito, G., Diabira, S., Howard, G. A., Menei, P., Roos, B. A. and Schiller, P. C. (2004) Marrow-isolated adult multilineage inducible (MIAMI) cells, a unique population of postnatal young and old human cells with extensive expansion and differentiation potential. J. Cell Sci. 117, 2971–2981. 8. Anjos-Afonso, F. and Bonnet, D. (2007) Nonhematopoietic/endothelial SSEA-1+ cells define the most primitive progenitors in the adult murine bone marrow mesenchymal compartment. Blood. 109, 1298–1306. 9. Kogler, G., Sensken, S., Airey, J. A., Trapp, T., Muschen, M., Feldhahn, N., et al. (2004) A new human somatic stem cell from placental cord blood with intrinsic pluripotent differentiation potential. J. Exp. Med. 200, 123–135. 10. Kucia, M., Halasa, M., Wysoczynski, M., Baskiewicz-Masiuk, M., Moldenhawer, S., Zuba-Surma, E., et al. (2007) Morphological and molecular characterization of novel population of CXCR4+ SSEA-4+ Oct-4+ very small embryonic-like cells purified from human cord blood: preliminary report. Leukemia. 21, 297–303. 11. Kucia, M., Reca, R., Campbell, F. R., ZubaSurma, E., Majka, M., Ratajczak, J., et al. (2006) A population of very small embryoniclike (VSEL) CXCR4(+)SSEA-1(+)Oct-4+ stem cells identified in adult bone marrow. Leukemia. 20, 857–869. 12. De Coppi, P., Bartsch, G., Jr., Siddiqui, M. M., Xu, T., Santos, C. C., Perin, L., et al.
78
Subramanian et al.
(2007) Isolation of amniotic stem cell lines with potential for therapy. Nat. Biotechnol. 25, 100–106. 13. Beltrami, A. P., Cesselli, D., Bergamin, N., Marcon, P., Rigo, S., Puppato, E., et al. (2007) Multipotent cells can be generated in vitro from several adult human organs (heart, liver, and bone marrow). Blood. 110, 3438–3446. 14. Ulloa-Montoya, F., Kidder, B. L., Pauwelyn, K. A., Chase, L. G., Luttun, A., Crabbe, A., et al. (2007) Comparative transcriptome analysis of embryonic and adult stem cells with
extended and limited differentiation capacity. Genome Biol. 8, R163. 15. Jiang, Y., Henderson, D., Blackstad, M., Chen, A., Miller, R. F. and Verfaillie, C. M. (2003) Neuroectodermal differentiation from mouse multipotent adult progenitor cells. Proc Natl Acad Sci U S A. 100 Suppl 1, 11854-11860. 16. Breyer, A., Estharabadi, N., Oki, M., Ulloa, F., Nelson-Holte, M., Lien, L., et al. (2006) Multipotent adult progenitor cell isolation and culture procedures. Exp. Hematol. 34, 1596–1601.
Chapter 5 Generation of Functional Insulin-Producing Cells from Human Embryonic Stem Cells In Vitro Yan Shi Abstract Human pancreatic islet transplantation at present is the preferred therapeutic option for type I diabetes treatment. However, this therapy is not widely utilized because of the severe shortage of donor islets. The capacity for self-renewal and differentiation of human embryonic stem (hES) cells makes them a potential new source for generation of functional pancreatic islet cells for treating type I diabetes mellitus. Here, we report a simple and effective protocol, carried out in a serum-free system, which could induce human ES cells to differentiate into functional insulin-producing cells. Activin A was first used in the initial stage to induce definitive endoderm lineage differentiation from human ES cells. And all-trans Retinoic Acid (RA) was then utilized to promote pancreatic differentiation. After maturation in the final induction stage with bFGF and Nicotinamide, the differentiated cells expressed islet specific markers. The secretion of insulin and C-peptide by these cells corresponded to the variations in glucose levels. Our method provides a promising in vitro differentiation model for studying the mechanisms of human pancreas development and illustrates the potential of using human ES cells for the treatment of type I diabetes mellitus. Key words: Human embryonic stem cells, Differentiation, Activin A, All-trans Retinoic Acid, Pancreas, Insulin-producing cells
1. Introduction Islet transplantation has been suggested to be a promising treatment for type I diabetes. However, this therapy is not widely utilized because of the severe shortage of donor islets (1, 2). Human embryonic stem (ES) cells can be maintained in vitro for extended periods without loss of genetic stability, and are potential sources for generating a variety of specialized human cells needed for clinical applications. They hold the promise of serving as an unlimited source of insulin-producing donor cells for type I diabetes cell therapy (3, 4).
S. Ding (ed.), Cellular Programming and Reprogramming: Methods and Protocols, Methods in Molecular Biology, vol. 636, DOI 10.1007/978-1-60761-691-7_5, © Springer Science+Business Media, LLC 2010
79
80
Shi
Therefore, it is worthwhile to identify effective approaches to induce human ES cells to differentiate into functional insulinproducing cells in vitro. It has been reported that human ES cells can spontaneously differentiate into insulin-producing cells in vitro (5, 6). A fivestage protocol similar to that described by Lumelsky et al. (7) has been used to induce human ES cell differentiation into insulinproducing cells (8). However, further investigation is still needed to confirm that human ES cells are indeed induced to become functional insulin-producing cells by these methods because of a possibility of exogenous insulin uptake (9). Therefore, it is necessary for us to explore more efficient induction approaches, which could mimic the pancreas development process in vivo and obtain the insulin-secreting cells with the characteristics of pancreatic beta cells. Activin A was the key induction factor for this step, which was reported to be indispensable for definitive endoderm differentiation from both mouse ES (10, 11) and human ES cells (12, 13). It was demonstrated that human ES cells were able to be differentiated into up to 80% definitive endoderm cells with Activin A treatment (12, 13). Currently, most human ES cells to pancreatic cell differentiation methods would choose Activin A to induce definitive endoderm specialization for the first step. On the other hand, the quality and efficiency of this cell population would determine the final production of pancreatic islet cells from hES cell differentiation. RA is an important signaling molecule in the development of the early embryonic pancreas besides functions on induction of ectoderm and mesoderm development (14). During zebrafish development, increased RA signaling could induce remarkable anterior expansion of the pancreas and liver endoderm. Conversely, inhibition of RA signaling by BMS493 blocks early pancreas differentiation from embryonic endoderm (15). It was firstly showed that after Activin A and RA treatment in sequence, differentiated mouse ES cells could express pancreatic progenitor markers such as pdx1, hnf3ß, and hnf4a (10). It was also further confirmed the role of RA in pancreatic specialization in nuclear-transfer mouse ES cells (16). Recently, more evidences (12, 17–19) showed that RA could induce pancreatic progenitor cell specification from human ES-derived definitive endoderm cells. Here, we gave the detailed process of an effective approach in serum-free culture medium to induce human ES cells to differentiate into functional insulin-producing cells by combining Activin A, All-trans retinoic acid (RA) in chemically defined medium (CDM), and other maturation factors such as bFGF and Nicotinamide in islet maturation medium (IMM). Depending on this method, which consisted of an incubation with Activin A and RA in CDM followed by maturation in DMEM/F12 serum-free medium supplemented with bFGF and Nicotinamide, the human
Generation of Functional Insulin-Producing Cells from Human Embryonic Stem Cells
81
ES cell-derived cells expressed islet specific genes such as pdx1, insulin, C-peptide, glut2, glucagon, and amylase. The C-peptidepositive cells were TUNEL-negative and the percentage of C-peptide-positive cells achieved was more than 15%. The secretion of insulin by these cells was responsive to variations in glucose levels. After transplantation into diabetic nude mice, 30% of the animals showed an obvious rescue of their hyperglycemia phenotype, and this condition was maintained for more than 6 weeks (12). Therefore, our approach offers a promising in vitro model for studying human pancreas development and also helps fulfill the urgent need of an ample supply of insulin-producing cells for cell transplantation therapy in type I diabetes.
2. Materials 2.1. Human ES Cell Line Expansion
1. The human ES cell lines H1 and H9 derived from WiCell Research Institute. 2. Mouse embryonic fibroblast cells (20). 3. Tissue culture plates from Falcon. 4. Mitomycin C Solution: 1 mg/mL mitomycin C (Roche) stock solution prepared in PBS (1:100 dilute before use). Store in the dark at 4°C, stable for 2 weeks. 5. Dispase Solution: Thaw the Dispase powder in PBS at the concentration at 0.5 mg/mL, store at −20°C, stable for 2–4 weeks. 6. Human ES cell culture medium: DMEM/F12 (Invitrogen) with 20% Knockout Serum Replacement (KSR) (Invitrogen) containing 8 ng/mL of bFGF (Invitrogen), Nonessential amino acids (1:100, Invitrogen), 4 mM l-Glutamine, 0.1 mM 2-Mercaptoethanol (Invitrogen), Penicillin/Streptomycin (1:100, Invitrogen); store at 4°C.
2.2. Human ES Cell Differentiation
1. Matrigel store at −80°C. Before differentiation, dilute Matrigel as 1:100 with 4°C DMEM/F12 medium. Coat tissue culture plates with diluted Matrigel and incubate at 37°C for 30 min to 1 h. Then the Matrigel-coated tissue culture plates are ready for use. 2. Human ES cell differentiation medium: (a) Chemical Defined Medium (CDM): 50% IMDM (Invitrogen) plus 50% F12 Nutrient Mixture (Invitrogen), supplemented with Insulin-Transferrin-Selenium-A (1:100, Invitrogen), 450 mM Monothioglycerol (Sigma), and 5 mg/mL Albumin Fraction V (Sigma).
82
Shi
(b) Islet Maturation Medium (IMM): DMEM/F12, InsulinTransferrin-Selenium-A (1:100) and 2 mg/mL albumin fraction V (Sigma). 3. Factors on human ES cell to insulin-producing cell differentiation: Activin A (R&D System) 50–100 ng/mL (see Note 1), all-trans Retinoic Acid (Sigma) 10−6M, bFGF (Invitrogen) 10 ng/mL, and Nicotinamide (Sigma) 10 mM. 4. Ultra Low Attachment culture dishes (Costar) for Suspension culture. 2.3. Human ES Cell Transplantation
1. 4–6-week-old BALB/c male nude mice or NOD/SCID mice. 2. Streptozotocin (STZ, Sigma). 3. GlucoTREND2 (Roche) for blood glucose test. 4. Mouse antihuman nuclei monoclonal antibody (1:30, CHEMICON) for in vivo human ES-derived cell detection.
3. Methods The sketch of human ES cell to insulin-producing cell differentiation protocol is summarized in Fig. 1. All incubations are performed in a standard, humidified, cell culture incubator, at 37°C in 5% CO2. 3.1. Day 0 Prepare hES Cells for Differentiation
1. hES cell lines are maintained following the typical protocol from WiCell Research Institute (WiCell’s Proven Protocols). 2. Before induction, hES cells are splitted as 1:3 (60% confluent) and replated onto 1% Matrigel-coated tissue culture dishes. hES cells are incubated with hES culture medium overnight for attachment.
Fig. 1. The sketch of human ES cell differentiation protocol. Undifferentiated human ES cells were first cultured in CDM containing Activin A for 4 days. Then, the differentiated cells were further induced with RA in CDM for 4 days and transferred from CDM culture medium into DMEM/F12 islet maturation medium with bFGF added as a pancreatic cell maturation factor for 3 days. Finally, the differentiated cells were switched to DMEM/F12 islet maturation medium containing bFGF and nicotinamide for another 5 days
Generation of Functional Insulin-Producing Cells from Human Embryonic Stem Cells
3.2. Days 1–4 Induce Human ES Cells to Differentiate into Definitive Endoderm Cells
83
1. Next day, aspirate the human ES cell culture medium from the dishes and wash with PBS. 2. Change the medium into CDM or DMEM/F12 medium with 50–100 ng/mL Activin A and replace with fresh medium every day. 3. After 4-day induction with CDM or DMEM/F12 medium plus Activin A, the 70–80% human ES cells would differentiate into definitive endoderm cells, which expressed definitive endoderm specific markers such as Sox17 and Cxcr4.
3.3. Days 5–8 Pancreatic Lineage Specification from Differentiated Human ES Cells
After 4-day differentiation with CDM or DMEM/F12 medium plus 50–100 ng/mL Activin A, human ES cells are further induced with 10−6 M RA in CDM or DMEM/F12 medium for another 4 days. At this stage, some Pdx1-positive cells appear which indicate the early pancreatic cell specification.
3.4. Days 9–20 Insulin-Producing Cell Matured from Differentiated Human ES Cells
1. Following the treatment with Activin A and RA, we transferred the differentiated cells from CDM or DMEM/F12 medium to the IMM containing 10 ng/mL bFGF as a pancreatic cell maturation factor for 3 days.
3.5. Transplantation of the Differentiated Insulin-Producing Cells Derived from hES Cells In Vivo
1. Prior to transplantation, Streptozotocin (STZ) was injected i.p. at 40 mg/kg/day into 4–6-week-old BALB/c male nude mice or NOD/SCID mice for 5 days to induce experimental diabetes. The blood glucose of STZ-induced nude mice should be more than 15 mM.
2. The differentiated cells were switched to IMM containing 10 mM Nicotinamide and 10 ng/mL bFGF for another 3–7 days for insulin-producing cell maturation (see Note 2).
2. When the STZ-treated mice had developed diabetes, about 1 × 10⁶ differentiated cells in the final induction stage were transplanted into the left renal capsule. PBS or cells without Activin A and RA induction were used as control. 3. After more than 1 month, the cell-transplanted kidneys were removed from those mice whose blood glucose was rescued after induced cell transplantation. Blood glucose was measured by GlucoTREND2 from snipped tail. If the diabetes of STZ-treated mice were rescued, the blood glucose of the induced cell-transplanted mice should be maintained at normal levels (20 passages) easily induce ES cells to be transformed and may lose their ability to support the in vitro ES cell differentiation.
Mesoderm Cell Development from ES Cells
101
6. In the case of CCE ES cells, 50–60% of day 4 differentiated ES cells express PDGFRa and VEGFR2 (16). 7. To confirm the ES cell-derived mesoderm cells, the gene expression specific for paraxial and lateral mesoderm cells is examined by quantitative RT-PCR (qPCR). We use Tbx6 and Mesp2, and GATA2 and Tal1 for paraxial and lateral mesoderm markers, respectively (see Table 1 and Fig. 2b) (16). GAPDH is used as a control (see Table 1). 8. The qPCR method is useful for examining the presence of bone and cartilage cells. Several markers such as Bglap 1 and 2, and Col2a1 and Col10a1 are suitable for defining the bone
Table 1 Primers for quantitative RT-PCR Gene GAPDH
Tbx6
Mesp2
GATA2
Tal1
Bglap1
Bglap2
Col2a1
Col10a1
bH1
Sequence Sense
5¢-GGAGCGAGACCCCACTAACA-3¢
Antisense
5¢-GCCTTCTCCATGGTGGTGAA-3¢
Sense
5¢-CCCAACTATGCAGCCAACACT-3¢
Antisense
5¢-CTGTGTGATCCTAGGGTTCTGGTA-3¢
Sense
5¢-CTGAAAACCTTGGGAACAGGAT-3¢
Antisense
5¢-GGCTCTTTCTAGGGACTGGTGTAA-3¢
Sense
5¢-CGGCCTCTTCTTCTGCAGG-3¢
Antisense
5¢-TGGTACTTGACGCCATCCTTG-3¢
Sense
5¢-CCCACCAGACAAGAAACTAAGCA-3¢
Antisense
5¢-GGCCAGGAAATTGATGTACTTCA-3¢
Sense
5¢-GAGGACCATCTTTCTGCTCACTCT-3¢
Antisense
5¢-GACATGAAGGCTTTGTCAGACTCA-3¢
Sense
5¢-GCGCTACCTTGGAGCTTCAG-3¢
Antisense
5¢-CATACTGGTTTGATAGCTCGTCACA-3¢
Sense
5¢-CCTTGGACGCCATGAAAGTT-3¢
Antisense
5¢-CTTGCTGCTCCACCAGTTTTT-3¢
Sense
5’-CCTGGTTCATGGGATGTTTTATG-3’
Antisense
5¢-TGGCGTATGGGATGAAGTATTG-3¢
Sense
5¢-TGTTTACCCATGGACTCAGAGATTC-3¢
Antisense
5¢-CTTTCTTGCCATGGGCTCTAA-3¢
102
Era
and cartilage cell lineages, respectively (see Table 1 and Fig. 2c) (16, 19). 9. Immuno-cytostaining is the easiest method for clarifying the presence of endothelial colonies in the culture. We routinely examine the expression of either VE-cadherin or PCAM1(CD31) as the markers for ECs (16, 18).
Acknowledgements I thank Dr. Nishikawa SI and Dr. Sakurai H for helpful discussion and supporting of these studies. References 1. Tam PP and Beddington RS. (1987) The formation of mesodermal tissues in the mouse embryo during gastrulation and early organogenesis. Development 99, 109–126. 2. Kimelman D. (2006) Mesoderm induction: from caps to chips. Nat Rev Genet 7, 360–372. 3. Kinder SJ, Tsang TE, Wakamiya M, Sasaki H, Behringer RR, Nagy A and Tam PP. (2001) The organizer of the mouse gastrula is composed of a dynamic population of progenitor cells for the axial mesoderm. Development 128, 3623–3634. 4. Lawson KA, Meneses JJ and Pedersen RA. (1991) Clonal analysis of epiblast fate during germ layer formation in the mouse embryo. Development 113, 891–911. 5. Kinder SJ, Tsang TE, Quinlan GA, Hadjantonakis AK, Nagy A and Tam PP (1999) The orderly allocation of mesodermal cells to the extraembryonic structures and the anteroposterior axis during gastrulation of the mouse embryo. Development 126, 4691–4701. 6. Zon LI. (1995) Developmental biology of hematopoiesis. Blood 86, 2876–2891. 7. Keller G. (2005) Embryonic stem cell differentiation: emergence of a new era in biology and medicine. Genes Dev 19, 1129–1155. 8. Tada S, Era T, Furusawa C, Sakurai H, Nishikawa S, Kinoshita M, Nakao K, Chiba T and Nishikawa S–I. (2005) Characterization of mesendoderm: a diverging point of the definitive endoderm and mesoderm in embryonic stem cell differentiation culture. Development 132, 4363–4374. 9. Niwa H. (2007) How is pluripotency determined and maintained? Development 134, 635–646.
10. Kabrun N, Buhring HJ, Choi K, Ullrich A, Risau W and Keller G. (1997) Flk-1 expression defines a population of early embryonic hematopoietic precursors. Development 124, 2039–2048. 11. Nishikawa SI, Nishikawa S, Hirashima M, Matsuyoshi N and Kodama H. (1998) Progressive lineage analysis by cell sorting and culture identifies FLK1+VE-cadherin + cells at a diverging point of endothelial and hemopoietic lineages. Development 125,1747–1757. 12. Yamashita J, Itoh H, Hirashima M, Ogawa M, Nishikawa S, Yurugi T, Naito M, Nakao K and Nishikawa S. (2000) Flk1-positive cells derived from embryonic stem cells serve as vascular progenitors. Nature 408, 92–96. 13. Soriano P. (1997) The PDGF alpha receptor is required for neural crest cell development and for normal patterning of the somites. Development 124, 2691–2700. 14. Kataoka H, Takakura N, Nishikawa S, Tsuchida K, Kodama H, Kunisada T, Risau W, Kita T and Nishikawa SI. (1997) Expressions of PDGF receptor alpha, c-Kit and Flk1 genes clustering in mouse chromosome 5 define distinct subsets of nascent mesodermal cells. Dev Growth Differ 39, 729–740. 15. Takebe A, Era T, Okada M, Jakt LM, Kuroda Y and Nishikawa S-I. (2006) Microarray analysis of PDGFRa + populations in ES cell differentiation culture identifies genes involved in differentiation of mesoderm and mesenchyme including ARID3b that is essential for development of embryonic mesenchymal cells. Dev Biol 293, 25–37. 16. Sakurai H, Era T, Jakt LM, Okada M, Nakai S, Nishikawa S, Nishikawa S-I. (2006) In vitro modeling of paraxial and lateral mesoderm
Mesoderm Cell Development from ES Cells differentiation reveals early reversibility. Stem Cells 24, 575–586. 17. Era T and Witte ON. (2000) Regulated expression of P210 Bcr-Abl during embryonic stem cell differentiation stimulates multipotential progenitor expansion and myeloid cell fate. Proc Natl Acad Sci U S A 97, 1737–1742. 18. Era T, Izumi N, Hayashi M, Tada S, Nishikawa S and Nishikawa S-I. (2008) Multiple mesoderm
103
subsets give rise to endothelial cells, whereas hematopoietic cells are differentiationed only from a restricted subset in embyomic stemm cell differentiation culture. Stem Cells 26, 401–411. 19. Takashima Y, Era T, Nakao K, Kondo S, Kasuga M, Smith AG and Nishikawa S-I. (2007) Neuroepithelial cells supply an initial transient wave of MSC differentiation. Cell 129, 1377–1388.
Chapter 7 Directed Differentiation of Red Blood Cells from Human Embryonic Stem Cells Shi-Jiang Lu, Qiang Feng, Jennifer S. Park, and Robert Lanza Abstract Human embryonic stem cells (hESC) represent a new source of stem cells that can be propagated and expanded in vitro indefinitely, providing a potentially inexhaustible and donorless source of cells for human therapy. The ability to create banks of hESC lines with matched or reduced incompatibility could potentially reduce or eliminate the need for immunosuppressive drugs and/or immunomodulatory protocols altogether, for example, O-type RhD− lines for generation of universal red blood cells (RBC). Hematopoietic differentiation of hESCs has been extensively investigated in vitro, and hematopoietic precursors as well as differentiated progeny representing erythroid, myeloid, macrophage, megakaryocytic, and lymphoid lineages have been identified in differentiating hESC cultures. Previous studies also generated primitive erythroid cells from hESCs by embryoid body (EB) formation and coculturing with stromal cells. However, the efficient and controlled differentiation of hESCs into homogeneous RBC populations with oxygen-carrying capacity has not been previously achieved. In this chapter, we describe a robust system that can efficiently generate large numbers of hemangioblasts from multiple hESC lines using well-defined conditions and produce functional homogeneous RBCs with oxygen-carrying capacity in large scale. The homogeneous erythroid cells can be used for further mechanism studies. Key words: Human embryonic stem cells (hESC), Embryoid body (EB), Hemangioblasts, Erythroid cells, Red blood cells (RBC)
1. Introduction Since their discovery in 1998 (1), human embryonic stem cells (hESC) have been considered a promising source of replacement cells for human therapy. However, successful clinical translation depends on the efficient and controlled differentiation of hESCs toward specific cell lineages and the generation of homogeneous transplantable cell populations. One potentially important application is the use of hESC-derived hematopoietic stem cells to generate S. Ding (ed.), Cellular Programming and Reprogramming: Methods and Protocols, Methods in Molecular Biology, vol. 636, DOI 10.1007/978-1-60761-691-7_7, © Springer Science+Business Media, LLC 2010
105
106
Lu et al.
mature blood cells, such as erythrocytes, for transfusion and the treatment of leukemia and other blood diseases. Differentiation of hESCs into hematopoietic cells has been extensively investigated in vitro, and hematopoietic precursors as well as differentiated progeny representing erythroid, myeloid, macrophage, megakaryocytic, and lymphoid lineages have been identified in differentiating hESC culture systems (2–8). Red blood cells (RBCs) – the oxygen-carrying component of the blood – are required in over half of all anemic patients admitted to intensive care units in the USA (9–11). Unfortunately, the supply of transfusable RBCs, especially “universal” donor type O Rh-negative, is often insufficient, especially in the battlefield environment due to the lack of blood type information and the limited timeline for transfusion. Although alternative sources of progenitors for the generation of transfusable RBCs have been investigated, including cord blood, bone marrow, and peripheral blood (12–14), it is clear that even after expansion and differentiation, these progenitors represent donor-limited sources of RBCs. Moreover, the low prevalence of O(−) type blood in the general population (d9
Mouse anti-ApoB
Chemicon
1/100
>d3
CYP2E1
Cypex, Dundee, UK
1/300
>d3
Sheep anti-UGT
Cypex, Dundee, UK
1/300
>d5
Rb anti-Amylase
Sigma, A8273
1/300
Decrease
Primary antibodies
Secondary antibodies Goat anti-rabbit IgG FITC
Vector labs, FI-1000
1/200
Rb anti-sheep IgG FITC
Vector labs, FI-6000
1/200
Horse anti-mouse IgG FITC
Vector labs, FI-2001
1/200
Rb rabbit, ApoB apolipoprotein B, CYP2E1 Cytochrome P450 2E1, UGT UDP-glucuronosyltransferase, FITC fluorescein isothiocyanate
9. Antisera to pancreatic and hepatic proteins (see Table 1). 10. Triton X-100. 11. Blocking reagent for immunostaining (Roche Applied Science). 12. 4¢,6-diamidino-2-phenylindole (DAPI) nuclear stain. 13. Aqueous-based mounting medium for mounting, e.g. Gelmount or Fluoromount. 14. Cell freezing sulphoxide.
media:
FBS
containing
10%
dimethyl
15. 4% paraformaldehyde (pFA) in PBS. 16. Phosphate-buffered saline, pH 7.4.
3. Methods Transdifferentiation of pancreatic AR42J cells to hepatocytes can be induced by culture with 1 mM dexamethasone (Dex) (16) but lower concentrations (1 nM) have been used to induce the hepatic phenotype (16). Transdifferentiation can be followed under
In Vitro Reprogramming of Pancreatic Cells to Hepatocytes
289
Fig. 1. Time course of B13 cells during days 0–7 of Dex treatment. Small and round B13 cells change their morphology and gradually convert to hepatocytes (large and flattened cells). Lower row (adapted from (13)), immunostaining of liver markers expressed in Dex-treated B13 cells using antibodies described in Table 1
transmitted light microscopy. Hepatocytes induced from AR42J cells are morphologically distinct and are larger and flatter than their control pancreatic counterparts. Morphological changes are observed between days 3 and 5 after Dex addition (Fig. 1). The proportion of transdifferentiated cells can be increased by coculture with 1 mM and 10 ng/ml OSM. Oncostatin M promotes liver maturation (20). At least 80% of the pancreatic cells can be converted to hepatocytes after 14 days of combined Dex and OSM treatment. The conversion to a liver phenotype can be confirmed by immunostaining for exocrine pancreatic (amylase) and hepatocyte (transferrin and albumin) proteins (Table 1). 1. The AR42J cell line is maintained in DMEM containing 10% FBS, 0.1 mg/ml penicillin-streptomycin, and 2 mM L-Glutamine (see Note 1). The medium is changed every 2–3 days and the cells are subcultured every 4–6 days at a ratio of 1:7. The cells can be passaged from 1:4 to 1:10 once 80% confluent. 2. AR42J-B13 cells are seeded at low density (10–20% confluent) in 35 mm dishes on sterile, noncoated glass coverslips, and cultured in 1.5–2.0 ml of medium (see Note 2).
290
Eberhard et al.
3. On the day after splitting, Dex is added to a final concentration of 1 mM. OSM is added at a concentration of 10 ng/ml to enhance conversion toward hepatocytes (see Note 3). 4. The medium is changed every 2–3 days and Dex and OSM added as appropriate. 5. For fixation, discard the culture medium and rinse the dish with PBS. Fix cells in 4% paraformaldehyde for 20 min at RT. Cells may be fixed on days 3–7 to observe the intermediate stages of transdifferentiation or after 7–14 days to analyze the fully transdifferentiated hepatocytes (Fig. 1, Table 1). 6. The cells are immunostained for pancreatic or hepatocyte markers (Table 1) using a standard immunostaining protocol. Briefly, the cells are permeabilized in 0.1% Triton X-100 in PBS for 30 min and then incubated in 2% blocking buffer to block nonspecific binding sites (see Note 4). The primary and secondary antibodies are added sequentially (Table 1). The primary antibody is added overnight at 4°C. The following day, the primary antibody is removed and the cells washed with PBS to remove excess antibody. The wash is repeated a total of three times. The secondary antibody (usually fluorescently conjugated) is added for 3 h at room temperature. The cells are then counterstained with DAPI (500 ng/ml) and mounted on a slide with mounting medium. The fluorescently labeled cells can be viewed by conventional fluorescence microscopy (Fig. 1). 7. Transdifferentiation can be inhibited by addition of RU486 (which inhibits glucocorticoid receptor activity). RU486 can be added at a concentration of 2.5 mM with the treatment commencing 1 h before dexamethasone addition (see Note 5).
4. Notes 1. The ATCC suggests formulated F12-K (30-2004) medium to maintain AR42J cells. We commonly use DMEM. 2. The cell density is critical for efficient transdifferentiation. Cell growth and conversion rates are low in cultures below 20% cell density. AR42J cell cultures also resist efficient conversion to hepatocytes if too confluent. 3. Prepare a stock of 1 mM dexamethasone and add 1 ml/ml of culture medium. Dexamethasone is prepared in 100% ethanol and can be stored at −20°C for several months. Dexamethasone is added to the medium, mixed and then added to the pancreatic cells.
In Vitro Reprogramming of Pancreatic Cells to Hepatocytes
291
4. Due to cross-reactivity, it is not recommended to use a blocking buffer containing bovine serum albumin when staining for albumin. Alternatively, BSA-free blocking reagent (Roche) is very effective. 5. RU-486 binds to the glucocorticoid receptor and inhibits transdifferentiation (16).
Acknowledgments We wish to thank the Medical Research Council and Wellcome Trust for funding. References 1. Tosh, D., and Slack, J. M. (2002) How cells change their phenotype. Nat Rev Mol Cell Biol. 3, 187-94. 2. Deutsch, G., Jung, J., Zheng, M., Lora, J., and Zaret, K. S. (2001) A bipotential precursor population for pancreas and liver within the embryonic endoderm. Development. 128, 871-81. 3. Rao, M. S., Dwivedi, R. S., Subbarao, V., Usman, M. I., Scarpelli, D. G., Nemali, M. R., Yeldandi, A., Thangada, S., Kumar, S., and Reddy, J. K. (1988) Almost total conversion of pancreas to liver in the adult rat: a reliable model to study transdifferentiation. Biochem Biophys Res Commun. 156, 131-6. 4. Rao, M. S., Subbarao, V., and Reddy, J. K. (1986) Induction of hepatocytes in the pancreas of copper-depleted rats following copper repletion. Cell Differ. 18, 109-17. 5. Reddy, J. K., Rao, M. S., Qureshi, S. A., Reddy, M. K., Scarpelli, D. G., and Lalwani, N. D. (1984) Induction and origin of hepatocytes in rat pancreas. J Cell Biol. 98, 2082-90. 6. Scarpelli, D. G., and Rao, M. S. (1981) Differentiation of regenerating pancreatic cells into hepatocyte-like cells. Proc Natl Acad Sci U S A. 78, 2577-81. 7. Krakowski, M. L., Kritzik, M. R., Jones, E. M., Krahl, T., Lee, J., Arnush, M., Gu, D., and Sarvetnick, N. (1999) Pancreatic expression of keratinocyte growth factor leads to differentiation of islet hepatocytes and proliferation of duct cells. Am J Pathol. 154, 683-91. 8. Eguchi, G., and Kodama, R. (1993) Transdifferentiation. Curr Opin Cell Biol. 5, 1023-8.
9. Longnecker, D. S., Lilja, H. S., French, J., Kuhlmann, E., and Noll, W. (1979) Transplantation of azaserine-induced carcinomas of pancreas in rats. Cancer Lett. 7, 197202. 10. Mashima, H., Ohnishi, H., Wakabayashi, K., Mine, T., Miyagawa, J., Hanafusa, T., Seno, M., Yamada, H., and Kojima, I. (1996) Betacellulin and activin A coordinately convert amylase-secreting pancreatic AR42J cells into insulin-secreting cells. J Clin Invest. 97, 1647-54. 11. Zhou, J., Wang, X., Pineyro, M. A., and Egan, J. M. (1999) Glucagon-like peptide 1 and exendin-4 convert pancreatic AR42J cells into glucagon- and insulin-producing cells. Diabetes. 48, 2358-66. 12. Logsdon, C. D., Moessner, J., Williams, J. A., and Goldfine, I. D. (1985) Glucocorticoids increase amylase mRNA levels, secretory organelles, and secretion in pancreatic acinar AR42J cells. J Cell Biol. 100, 1200-8. 13. Burke, Z. D., Shen, C. N., Ralphs, K. L., and Tosh, D. (2006) Characterization of liver function in transdifferentiated hepatocytes. J Cell Physiol. 206, 147-59. 14. Kurash, J. K., Shen, C. N., and Tosh, D. (2004) Induction and regulation of acute phase proteins in transdifferentiated hepatocytes. Exp Cell Res. 292, 342-58. 15. Tosh, D., Shen, C. N., and Slack, J. M. (2002) Differentiated properties of hepatocytes induced from pancreatic cells. Hepatology. 36, 534-43. 16. Shen, C. N., Slack, J. M., and Tosh, D. (2000) Molecular basis of transdifferentiation of pancreas to liver. Nat Cell Biol. 2, 879-87.
292
Eberhard et al.
17. Lardon, J., De Breuck, S., Rooman, I., Van Lommel, L., Kruhoffer, M., Orntoft, T., Schuit, F., and Bouwens, L. (2004) Plasticity in the adult rat pancreas: transdifferentiation of exocrine to hepatocytelike cells in primary culture. Hepatology. 39, 1499-507. 18. Percival, A. C., and Slack, J. M. (1999) Analysis of pancreatic development using a cell lineage label. Exp Cell Res. 247, 123-32.
19. Shen, C. N., Seckl, J. R., Slack, J. M., and Tosh, D. (2003) Glucocorticoids suppress beta-cell development and induce hepatic metaplasia in embryonic pancreas. Biochem J. 375, 41-50. 20. Kamiya, A., Kinoshita, T., Ito, Y., Matsui, T., Morikawa, Y., Senba, E., Nakashima, K., Taga, T., Yoshida, K., Kishimoto, T., and Miyajima, A. (1999) Fetal liver development requires a paracrine action of oncostatin M through the gp130 signal transducer. Embo J. 18, 2127-36.
Chapter 18 Generation of Novel Rat and Human Pluripotent Stem Cells by Reprogramming and Chemical Approaches Wenlin Li and Sheng Ding Abstract Although embryonic stem cells (ESCs) have been established from mice since 1981, attempts to derive its counterparts from various other mammals, including rats, have not succeeded. Recently, induced pluripotent stem cells (iPSCs) have been generated from both mouse and human somatic cells by genetic transduction. We had successfully established novel rat iPSCs (riPSCs), which can be homogenously maintained by LIF and a cocktail of ALK5 inhibitor, GSK3 inhibitor and MEK inhibitor. riPSCs share conventional mouse ESC characteristics and most importantly can contribute extensively to chimeras. We also generated novel human iPSCs (hiPSCs) with “mouse ESC-like” characteristics, which can be surprisingly maintained in culture in the presence of MEK inhibitor and ALK5 inhibitor. Key words: Embryonic stem cells, Pluripotent stem cells, iPS cells, Inhibitors
1. Introduction Recently, pluripotent stem cells were derived from the postimplantation egg cylinder stage epiblasts of mouse and rat (1, 2). These novel stem cells were named epiblast stem cells (EpiSCs). EpiSCs seem to correspond very closely to human embryonic stem cells (hESCs) in the colony morphology and culture/signaling requirements for maintaining pluripotency, but exhibit a range of significant phenotypic and signaling response differences from the conventional mouse ES cells (mESCs). Leukemia inhibitory factor (LIF) is essential for maintaining the pluripotency of mESCs in the presence of serum through JAK-STAT3 pathway (3). However, in serum-free medium, BMP4 is also required, together with LIF, to sustain mESC self-renewal by inducing inhibitor of differentiation (Id) protein expression (4) and inhibiting ERK activation (5). S. Ding (ed.), Cellular Programming and Reprogramming: Methods and Protocols, Methods in Molecular Biology, vol. 636, DOI 10.1007/978-1-60761-691-7_18, © Springer Science+Business Media, LLC 2010
293
294
Li and Ding
In contrast to mESCs, LIF cannot support EpiSCs/hESCs, which typically require basic fibroblast growth factor (bFGF) and Activin A for long-term self-renewal. Undifferentiated hESCs display high-level basal activity of ERK through bFGF signaling (6). BMP4 doesn’t support EpiSC/hESC self-renewal either, but instead induces EpiSC/hESC to differentiate into trophoblasts or primitive endoderm (1, 2, 7). In addition to bFGF, Activin A/ Nodal signaling has been shown to support the undifferentiated state of hESCs/EpiSCs (1, 2, 8), while it is dispensable for mESCs. These results strongly support the notion that EpiSCs and hESCs are intrinsically similar and raise an attractive hypothesis that mESCs and EpiSCs/hESCs represent two distinct pluripotent states: the mESC-like state representing the preimplantation inner cell mass (ICM) and EpiSC-like state representing later epiblast cells, respectively. mESCs can be usually derived from certain mouse strains using feeder layer-based cell culture conditions (9). However, it has been proven difficult to derive authentic ES cells from rats under similar conditions (10–13). Similarly, although (in vitro) pluripotent rat EpiSCs had been derived, both rat and mouse EpiSCs show little or no ability to be reincorporated into the preimplantation embryo and contribute to chimeras (1, 2). Recently, induced pluripotent stem cells (iPSCs) generated from both mouse and human somatic cells by defined genetic transduction have attracted enormous interests (14–19). Based on the cell-signaling differences for sustaining the pluripotency of mESC or EpiSC/hESC, the novel “mESC-like” rat and human pluripotent cells could be captured and maintained by combining genetic reprogramming and cell-signaling-based selection using small molecules.
2. Materials
2.1. Cell Culture
1. Diploid rat WB-F344 cells (Grisham et al., 1993), a kind gift from Prof. William B. Coleman at University of North Carolina. Human fibroblasts IMR90 were from ATCC. Viral package cell lines: Plat-E and 293T. 2. Rat iPS cell growth medium: Knockout™ Dulbecco’s Modified Eagle’s Medium (DMEM), 20% Knockout serum replacement, 1% Glutamax, 1% Nonessential amino acids, 1% penicillin/streptomycin, 0.1 mM b-mercaptoethanol, and 103 U/ml mLIF (Millipore). Human iPS cell growth medium: Knockout™ DMEM, 20% Knockout serum replacement, 1% Glutamax, 1% Nonessential amino acids, 1% penicillin/streptomycin, 0.1 mM b-mercaptoethanol, and 10 mg/ml hLiF. Viral pack-
Generation of Novel Rat and Human Pluripotent Stem Cells by Reprogramming
295
age cell line medium: DMEM with 10% fetal bovine serum. All cell culture products were from Invitrogen/Gibco BRL except where mentioned. 2.2. Viral Package and Cell Transduction
1. Plasmids: pMXs-based retroviruses for mouse Oct4, Klf4, and Sox2 (Addgene); pSin-EF2-Puro-based lentiviruses for human Oct4, Sox2, Nanog, and Lin28; (Addgene) and lentiviral package plasmids pMD 2G and psPAX2 were prepared using Qiagene Hi-Speed kit. 2. Polybrene (10 mg/ml) (Millipore) was used as 4 mg/ml during viral transduction.
2.3. Cytochemistry and Immunofluorescence Assay
1. Alkaline Phosphatase staining was performed using the Alkaline Phosphatase Detection Kit (Millipore). 2. Fixation buffer for immunofluorescence: 4% paraformaldehyde in PBS. 3. Washing buffer: PBS containing 0.1% Triton X-100. 4. Blocking buffer: 0.1% Triton X-100 and 10% normal donkey serum (Jackson ImmunoResearch Laboratories Inc) in PBS. 5. The primary antibodies: Mouse anti-Oct4 antibody (1:250) (Santa Cruz), rabbit anti-Sox2 antibody (1:2,000) (Chemicon), mouse anti-SSEA1 antibody (1:250) (Santa Cruz), rabbit anti-Nanog antibody (1:500) (Abcam), rat anti-SSEA3 antibody (1:1,000) (Chemicon), mouse antiSSEA4 antibody (1:1,000) (Chemicon), mouse antiTRA-1-81 antibody (1:1000) (Chemicon), rabbit anti-Pdx1 (1:1,500), a gift from Dr. C. Wright (Vanderbilt University, TN), mouse anti-bIII-Tubulin (Tuj1) antibody (1:1,000) (Covance Research Products), rabbit anti-albumin antibody (1:1,000) (DAKO), rabbit anti-Brachyury antibody (1:200) (Santa Cruz). 6. Secondary antibodies: Alexa Fluor 486/555 donkey antimouse, anti-rat, anti-goat, or anti-rabbit IgG (1:500) (Invitrogen). 7. DAPI (Sigma) is dissolved in tissue-culture water at 1 mg/ ml, stored in aliquots at −20°C, and used at 1 mg/ml. 8. Nikon Eclipse TE2000-U microscope.
2.4. Teratoma Assay
Mice: 4–6 week-old male SCID-Beige mice from Charles River Breeding Laboratories.
296
Li and Ding
3. Methods 3.1. Generation of Rat Induced Pluriopotent Stem Cells (riPSCs) 3.1.1. Retroviral Package and Target Cell Transduction
1. Thaw a vial of frozen Plat-E cells from the liquid nitrogen, transfer the cell suspension to a tube with 10 ml DMEM medium containing 10% FBS and seed the cells in Poly-lysinecoated 100-mm dish. Four hours later, replace the medium with fresh DMEM medium containing 10% FBS and incubate the cells in a 37°C, 5% CO2 incubator. The Plat-E cells are passaged when approaching 70–80% confluence with trypsin/EDTA, and then replate them to new 100-ml dishes at 1:6 dilution. 2. Before transduction, dissociate the Plat-E cells by trypsin/ EDTA, suspend the cells in appropriate amount of DMEM medium with 10% FBS by gently pipetting. Count the cell number and adjust the concentration to 7 × 10⁵ cells per ml with fresh medium. Seed cells at 100-mm Poly-lysine coated culture dishes (12 ml per dish), and incubate overnight at 37°C, 5% CO2. Replace the medium with antibiotics free DMEM, 10% FBS (7 ml/dish). The Plat-E cells are ready to be transduced. 3. Transfer 0.45 ml of OPTI-MEM into a 1.5-ml tube. Add 9 mg of pMXs plasmid DNA (encoding Oct3/4, Sox2, Klf4, and c-Myc), mix gently by finger tapping. Add 30 ml of Fugene HD transfection reagent into each of the above tubes, mix gently by finger tapping, and then incubate for 15 min at room temperature. Add the DNA/Fugene HD complex dropwise into the Plat-E dish, and incubate overnight at 37°C, 5% CO2. Replace the transfection reagent-containing medium with 7 ml of fresh DMEM, 10% FBS medium, and incubate the cells for another 24 h. Collect the medium from the transduced Plat-E dishes and filter it through a 0.45 mm pore size cellulose acetate filter. 4. After adding polybrene into the filtrated virus-containing medium at 4 mg/ml final concentration, the medium containing Oct-3/4, Sox2, Klf4 retroviruses was mixed equally and used to transduce 20–30% confluence diploid rat WB-F344 cells at passage 7 for overnight.
3.1.2. The Establishment and Culture of riPSCs
1. Twenty-four hours later after retroviral transduction, 1 × 10⁵ transduced WB-F344 cells were seeded on the X-rayinactivated CF1 MEFs in 100-mm dish and incubated with mESC growth medium: Knockout™ DMEM, 20% Knockout serum replacement, 1% Glutamax, 1% Nonessential amino acids, 1% penicillin/streptomycin, 0.1 mM b-mercaptoethanol, and 103 U/ml mLIF. The medium was changed every another day.
Generation of Novel Rat and Human Pluripotent Stem Cells by Reprogramming
297
2. After 10 days, the riPSC colonies were visualized and picked up under a microscope using a Pipetman. The individual colonies were trypsinized and seed on MEF feeder cells in 24-well plates for expansion in mESC growth medium with MEK inhibitor PD0325901 (0.5 mM), ALK5 inhibitor A-8301 (0.5 mM), and GSK3b inhibitor CHIR99021 (3 mM). When the cells reach 80–90% confluency, they were passaged into six-well plates and subcultured regularly with the presence of above small molecules (see Note 1). 3.1.3. The Pluripotency of riPSCs
1. To analyze the expression of pluripotent markers by riPSCs, cells were fixed in 4% paraformaldehyde for 10 min and washed with PBS containing 0.1% Triton X-100. The fixed cells were then incubated in blocking buffer, 0.1% Triton X-100 and 10% normal donkey serum in PBS, for 30 min at room temperature. The cells were then incubated with primary antibody overnight at 4°C in blocking buffer. The day after, cells were washed with PBS three times, 5 min per time and incubated with secondary antibody in PBS containing 0.1% Triton X-100 for 1 h at room temperature. Nuclei were stained by 1 mg/ml DAPI for 30 s. Then the cells were washed three times, 5 min per time with PBS. Images were captured using a Nikon Eclipse TE2000-U microscope. riPSCs should be positive to typical mESC markers, such as Oct4, Sox2, SSEA-1, Nanog, but are negative to the hESC markers, such as SSEA3, SSEA4, and TRA-1-81. 2. For Alkaline Phosphatase detection, riPSCs were fixed by 4% Paraformaldehyde in PBS for 1–2 min. Aspirate fixative and rinse with PBS. Stain the cells by mixing Fast Red Violet (FRV) with Naphthol AS-BI phosphate solution and water in a 2:1:1 ratio (FRV:Naphthol:water) in dark at room temperature for 15 min. Aspirate staining solution and rinse with PBS. Red colonies are riPSCs (see Note 2). 3. For in vitro differentiation of riPSCs, the cells were dissociated by 0.05% Trypsin-EDTA and cultured in ultra-low attachment 100-mm dish in DMEM medium supplemented with 10% FBS to form embryoid bodies (EBs). The medium was changed every another day. One week later, the EBs were harvested and transferred into Matrigel-coated six-well plate in DMEM medium with 10% FBS. Three to seven days later, the cells were fixed for immunocytochemistry analysis as described above. Mesoderm marker Brachyury should be detected at 3 days after transferring EBs on Matrigel-coated plate. Endoderm and ectoderm markers, such as Albumin, Pdx-1, and bIII-Tubulin, should be detected 7 days later. 4. For teratoma formation, 106 riPSCs were resuspended in PBS and injected into subrenal capsule of immune-compromised
298
Li and Ding
SCID mice. Xenografted masses formed within 4–6 weeks, and paraffin sections were stained with hematoxylin and eosin for all histological determinations. 3.2. Generation of Mouse ES Cell-Like Human Induced Pluripotent Stem Cells 3.2.1. Lentiviral Package and Target Cell Transduction
1. Thaw a vial of frozen 293T cells from the liquid nitrogen, culture and split the cells exactly following the protocol of culturing Plat-E cells. 2. One day before transduction, dissociate the 293T cells by trypsin/EDTA, seed cells at 100-mm Poly-lysine-coated culture dishes (12 ml per dish), and incubate overnight at 37°C, 5% CO2. Replace the medium with antibiotics-free DMEM, 10% FBS (7ml/dish). The 293T cells are ready to be transduced. 3. Transfer 0.45 ml of OPTI-MEM into a 1.5-ml tube. Add 4 mg of pSin-EF2-Puro-based lentiviral plasmid DNA (encoding human Oct4, Sox2, Nanog, and Lin28), 3.5 mg psPAX2, and 0.5 mg pMD2.G, mix gently by finger tapping. Add 30 ml of Fugene HD transfection reagent into each of the above tubes, mix gently by finger tapping, and then incubate for 15 min at room temperature. Add the DNA/Fugene HD complex dropwise into the 293T dishes, and incubate overnight at 37°C, 5% CO2. Replace the transfection reagentcontaining medium with 7 ml of fresh DMEM, 10% FBS medium, and incubate the cells for another 24 h. Collect the medium from the transduced 293T dishes and filter it through a 0.45 mm pore size cellulose acetate filter. 4. After adding polybrene into the filtrated virus-containing medium at 2 mg/ml final concentration, the medium containing human Oct4, Sox2, Nanog, and Lin28 lentiviruses was mixed equally and used to transduce 40–50% confluence diploid human fibroblast IMR-90 cells for 4 h. After incubated with fresh medium over night, IMR-90 cells were transduced again for 4 h by the lentiviruses.
3.2.2. The Establishment and Culture of Mouse ES Cell-Like Human Induced Pluripotent Stem Cells
1. Twenty-four hours later, 1 × 10⁵ transduced IMR90 cells were seeded on the X-ray-inactivated CF1 MEFs in 100-mm dish and incubated with human ES cell growth medium: Knockout DMEM, 20% Knockout serum replacement, 1% Glutamax, 1% Nonessential amino acids, 1% penicillin/streptomycin, 0.1 mM b-mercaptoethanol, and 10 mg/ml hLiF. The medium was changed every another day. 2. After 3 weeks, the mouse ES cell-like colonies were visualized. The colonies were picked up under a microscope using a Pipetman. The individual colonies were dissociated by Accutase and seed on MEF feeder cells in 24-well plates for expansion in human ES cell growth medium with MEK
Generation of Novel Rat and Human Pluripotent Stem Cells by Reprogramming
299
inhibitor PD0325901 (0.5 mM), ALK5 inhibitor A-83-01 (0.25 mM), and GSK3b inhibitor CHIR99021 (3 mM). When the cells reach ~50% confluency, they were passaged into six-well plates by Accutase and subcultured regularly (see Note 3). 3.2.3. The Pluripotency of Mouse ES Cell-Like Human Induced Pluripotent Stem Cells
1. To analyze the expression of pluripotent markers by Human Induced Pluripotent Stem Cells (hiPSCs), immunostaining was carried out as described above to detect the expression of pluripotent markers by riPSCs. These hiPSCs should homogenously express typical pluripotency markers, such as Oct4, Sox2, Nanog, TRA-1-81, SSEA3, and SSEA-4. hiPSCs should also express Alkaline Phosphatase by cytochemistry assay. 2. For in vitro differentiation of mouse ES cell-like hiPSCs, the cells were dissociated by Accutase and cultured in ultra-low attachment 100-mm dish in DMEM medium supplemented with 10% FBS to form embryoid bodies (EBs). The medium was changed every another day. One week later, the EBs were harvested and transferred into Matrigel-coated six-well plate in DMEM medium with 10% FBS. Three to seven days later, the cells were fixed for immunocytochemistry analysis as described above. Mesoderm marker Brachyury should be detected at 3 days after transferring EBs on Matrigel-coated plate. Endoderm and ectoderm markers, such as Albumin, Pdx-1, and bIII-Tubulin, should be detected 7 days later. 3. For teratoma formation, 106 hiPSCs were resuspended in PBS and injected into subrenal capsule of immune-compromised SCID mice. Xenografted masses formed within 4–6 weeks, and paraffin sections were stained with hematoxylin and eosin for all histological determinations.
4. Notes 1. riPSCs were very easy to detach from feeders. So, always passage the cells before riPSC colonies become too big and always dissociate riPSC colonies into single cells by trypsin. 2. Do not overfix cells. Fixing cells longer than 2 min will result in inactivation of alkaline phosphatase. 3. It would be helpful to include 5 mg/ml Rock inhibitor (Y-27632) in the medium, then seed the picked-up colonies dissociated by Accutase.
300
Li and Ding
References 1. Tesar, P. J., Chenoweth, J. G., Brook, F. A., Davies, T. J., Evans, E. P., Mack, D. L., et al. (2007) New cell lines from mouse epiblast share defining features with human embryonic stem cells. Nature. 448, 196–199. 2. Brons, I. G., Smithers, L. E., Trotter, M. W., Rugg-Gunn, P., Sun, B., Chuva de Sousa Lopes, S. M., et al. (2007) Derivation of pluripotent epiblast stem cells from mammalian embryos. Nature. 448, 191–195. 3. Niwa, H., Burdon, T., Chambers, I., and Smith, A. (1998) Self-renewal of pluripotent embryonic stem cells is mediated via activation of STAT3. Genes Dev. 12, 2048–2060. 4. Ying, Q. L., Nichols, J., Chambers, I., and Smith, A. (2003) BMP induction of Id proteins suppresses differentiation and sustains embryonic stem cell self-renewal in collaboration with STAT3. Cell. 115, 281–292. 5. Qi, X., Li, T. G., Hao, J., Hu, J., Wang, J., Simmons, H., et al. (2004) BMP4 supports self-renewal of embryonic stem cells by inhibiting mitogen-activated protein kinase pathways. Proc Natl Acad Sci USA. 101, 6027–6032. 6. Dvorak, P., Dvorakova, D., Koskova, S., Vodinska, M., Najvirtova, M., Krekac, D., et al. (2005) Expression and potential role of fibroblast growth factor 2 and its receptors in human embryonic stem cells. Stem Cells. 23, 1200–1211. 7. Xu, R. H., Chen, X., Li, D. S., Li, R., Addicks, G. C., Glennon, C., et al. (2002) BMP4 initiates human embryonic stem cell differentiation to trophoblast. Nat Biotechnol. 20, 1261–1264. 8. Sato, N., Sanjuan, I. M., Heke, M., Uchida, M., Naef, F., and Brivanlou, A. H. (2003) Molecular signature of human embryonic stem cells and its comparison with the mouse. Dev Biol. 260, 404–413. 9. Martin, G. R. (1981) Isolation of a pluripotent cell line from early mouse embryos cultured in medium conditioned by teratocarcinoma stem cells. Proc Natl Acad Sci USA. 78, 7634–7638. 10. Ueda, S., Kawamata, M., Teratani, T., Shimizu, T., Tamai, Y., Ogawa, H., et al.
11.
12.
13.
14.
15.
16.
17.
18.
19.
(2008) Establishment of rat embryonic stem cells and making of chimera rats. PLoS ONE. 3, e2800. Demers, S. P., Yoo, J. G., Lian, L., Therrien, J., and Smith, L. C. (2007) Rat embryonic stem-like (ES-like) cells can contribute to extraembryonic tissues in vivo. Cloning Stem Cells. 9, 512–522. Schulze, M., Ungefroren, H., Bader, M., and Fandrich, F. (2006) Derivation, maintenance, and characterization of rat embryonic stem cells in vitro. Methods Mol Biol. 329, 45–58. Ruhnke, M., Ungefroren, H., Zehle, G., Bader, M., Kremer, B., and Fandrich, F. (2003) Long-term culture and differentiation of rat embryonic stem cell-like cells into neuronal, glial, endothelial, and hepatic lineages. Stem Cells. 21, 428–436. Takahashi, K., Tanabe, K., Ohnuki, M., Narita, M., Ichisaka, T., Tomoda, K., et al. (2007) Induction of pluripotent stem cells from adult human fibroblasts by defined factors. Cell. 131, 861–872. Yu, J., Vodyanik, M. A., Smuga-Otto, K., Antosiewicz-Bourget, J., Frane, J. L., Tian, S., et al. (2007) Induced pluripotent stem cell lines derived from human somatic cells. Science. 318, 1917–1920. Takahashi, K., and Yamanaka, S. (2006) Induction of pluripotent stem cells from mouse embryonic and adult fibroblast cultures by defined factors. Cell. 126, 663–676. Dimos, J. T., Rodolfa, K. T., Niakan, K. K., Weisenthal, L. M., Mitsumoto, H., Chung, W., et al. (2008) Induced pluripotent stem cells generated from patients with ALS can be differentiated into motor neurons. Science. 321, 1218–1221. Han, J., and Sidhu, K. S. (2008) Current concepts in reprogramming somatic cells to pluripotent state. Curr Stem Cell Res Ther. 3, 66–74. Park, I. H., Zhao, R., West, J. A., Yabuuchi, A., Huo, H., Ince, T. A., et al. (2008) Reprogramming of human somatic cells to pluripotency with defined factors. Nature. 451, 141–146.
Chapter 19 Small Molecule Screen in Zebrafish and HSC Expansion Eirini Trompouki and Leonard I. Zon Abstract The zebrafish (Danio rerio) has emerged as a valuable model organism that is amenable for large-scale chemical and genetic screens. The ability of zebrafish to produce large quantities of synchronized, externally fertilized, transparent embryos makes them ideal for screens, which often are not possible in mammalian models. Signaling pathways important for hematopoiesis are well conserved between zebrafish and mammals, making many targets identified in zebrafish screens applicable to mammals. Hematopoiesis in zebrafish occurs in two waves: the primitive or embryonic wave and the definitive or adult wave. Definitive hematopoietic stem cells arise in the aorta-gonad-mesonephros region (AGM) and express conserved markers such as runx1 and c-myb that allow for the detection of stem cells by whole-mount in situ hybridization (WISH). In this protocol, we will discuss a chemical screen in zebrafish embryos to detect compounds that expand or deplete hematopoietic stem cells (HSCs) in vivo. This type of screen represents a powerful tool to study HSCs in zebrafish. Key words: Zebrafish hematopoiesis, HSCs: hematopoietic stem cells, Chemical screen, Chemical compound library, Chemoinformatics
1. Introduction Zebrafish is an attractive model to study vertebrate hematopoiesis (1, 2) and has been used extensively for the study of many human hematological disorders (3). It shares characteristics of invertebrate models such as generation of large numbers of progeny, short generation time, and relatively small size that make it ideal for large-scale studies. In addition, hematopoiesis is well conserved between zebrafish and mammals (4). Zebrafish embryos are transparent and therefore ideal for fluorescent microscopy studies. Screens in whole organisms offer many advantages in comparison to tissue culture screens since the cells are in their physiological environment where it is easy to monitor in vivo in the context of adjacent tissues (5, 6). S. Ding (ed.), Cellular Programming and Reprogramming: Methods and Protocols, Methods in Molecular Biology, vol. 636, DOI 10.1007/978-1-60761-691-7_19, © Springer Science+Business Media, LLC 2010
301
302
Trompouki and Zon
As in all vertebrates zebrafish hematopoiesis occurs in two waves, the primitive or embryonic hematopoietic wave and the definitive or adult wave. In zebrafish the primitive wave occurs in the intermediate cell mass (ICM), which gives rise to primitive erythroblasts, and the rostral blood island (RBI), which predominantly generates macrophages. The primitive erythrocytes are morphologically distinct from the adult erythrocytes and they enter the circulation around 24 h postfertilization (hpf). Several transcription factors, which are homologous to mammalian transcription factors, are expressed during the primitive wave of hematopoiesis and allow for the study of this event including scl, fli1, gata2, lmo2, and tif1g. Definitive hematopoiesis gives rise to long-term HSCs, which maintain all mature hematopoietic lineages for the lifetime of the animal. This initially takes place in the aorta-gonad-mesonephros (AGM) region that in zebrafish is found in the ventral wall of the dorsal aorta around 36–40 hpf. Markers of the definitive HSCs include c-myb and runx1. These runx1+ HSCs then translocate to the kidney that becomes the major source of hematopoiesis during the lifetime of the zebrafish (7–9). Large-scale screens are a major tool in zebrafish biology. Since HSCs are well defined in zebrafish it is expected that screens have been performed in order to find chemical factors and signaling pathways that can expand the HSC pool. In this chapter, we will describe a chemical screen in zebrafish that has been performed successfully and led to the discovery of chemical compounds that affect HSCs (10). Zebrafish embryos, as already mentioned, are ideal for small molecule screens (11,12). Chemical screens in zebrafish can lead to the discovery of molecules that affect certain pathways or developmental procedures, providing information that can finally lead to drug discovery. Zebrafish is also being used successfully to study potential safety liabilities of novel drugs (13).Chemical screens can provide information about toxicity of specific chemicals as well as tissue specificity since the screen is performed in whole organisms. A live organism may metabolize the chemical that is being tested, leading to activation of a pro-drug or an inactive metabolite. These effects cannot be studied in vitro and are studied much more accurately in vivo in a whole organism. Chemical screens can be used also for the discovery of modifiers in zebrafish mutants. If the mutation is embryonic lethal, these screens can be more labor intensive as heterozygous adults must be mated to generate mutant embryos. Since only 25% of the clutch will be mutants, fewer chemicals can be screened each week (14). Although small molecule screening in zebrafish is beneficial some potential problems have been identified. First, since the chemicals are added to the water, there is a question as to whether a given chemical can penetrate the chorion and permeate the
Small Molecule Screen in Zebrafish and HSC Expansion
303
embryo. Warfarin and dexamethasone are two examples of chemicals that have been shown to permeate into the embryo (15, 16). Colorful chemicals can provide direct evidence for the reagent permeability, for example, geimsa stain in a chemical library turns the embryos blue, while beta-carotene turns them yellow. Another major concern is the possibility that small molecules discovered by zebrafish screens will not be active in a mammalian system although some important drug-metabolizing enzymes studied in zebrafish seem to be conserved across species (17). A small molecule screen to evaluate the effect of chemicals on HSCs has been performed successfully in zebrafish (10). The general design of this screen, described in detail below, is to collect thousands of zebrafish embryos, treat them with chemicals over the course of HSC development and perform whole-mount in situ hybridization for two HSC markers, runx1 and c-myb. Chemicals that augment or decrease HSCs in the AGM can be recognized, confirmed, and further tested in a mammalian system (Fig. 1). Different screening procedures can be adapted depending on the desired result. For HSC screening in zebrafish, whole-mount in situ hybridization (see Note 1) (18) has been successfully employed as a screening modality. As mentioned earlier, two markers for the definitive stem cells of zebrafish are runx1 and c-myb.(see Note 2)
2. Materials 2.1. Embryo Preparation
1. E3 embryo medium: 5 mM NaCl, 0.17 mM KCl, 0.33 mM CaCl2, 0.33 mM MgSO4, and 10−5 methylene blue (see Note 3).
Fig. 1. Runx1/c-myb staining of zebrafish embryos at 36 hpf. The first picture represents the staining in a wild-type embryo. The second is a picture of an embryo treated with a chemical that increases HSC population whereas the third picture represents an embryo that has been treated with a chemical that decreases HSC population in the AGM. (The pictures in this figure are kindly provided by Trista E. North)
304
Trompouki and Zon
2. 1,000× stock methylene blue. 3. Plastic pipettes and glass pasteur pipettes. 4. Tissue culture dishes. 5. Watchmaker’s forceps (Dumont). 6. Incubator 28°C. 7. Cages with dividers for timed embryo production. 2.2. Chemical Libraries and Chemical Screen
E3 E3+: E3 with 1% DMSO and 1% Pen/Strep There are numerous chemical libraries commercially available. Chemicals are usually stored in 96- or 384-well plates at −20°C, −80°C, or at room temperature under 100% nitrogen. The libraries differ in the number and complexity of compounds as well as the purity of them. High purity of the compounds is essential since impurities can give false-positive or false-negative results on a screen. In the best available libraries the quality control of the compounds is performed by NMR. Chemical libraries can contain known or unknown chemical substances or they may be compiled from naturally occurring chemical compounds. Some examples of the available chemical libraries are given below ●
Libraries that contain biologically active compounds with defined biological activity. These libraries are the best solution for dissecting a biological pathway, most importantly, they offer good coverage over several biologically important pathways and the chemicals are usually provided in high purity. The disadvantage of some of these libraries is that usually they include only one or two chemicals per pathway. An example of this kind of library is the “ICCB known bioactive library” by Biomol.
●
Natural product libraries. These libraries are the best choice when the screen is seeking a novel clinical or pharmaceutical product. Their major disadvantage is that they usually contain chemicals with low purity 50–80%. That means that a possible active biochemical needs to be biochemically purified and retested in order to be verified, and to ensure that the impurities don’t interfere with the action of the chemical. Many companies offer natural product libraries.
●
Functional libraries. These libraries contain a collection of chemicals against a very specific target or with a specific action. Examples include a neurotransmitter library, or kinase inhibitor library.
Small Molecule Screen in Zebrafish and HSC Expansion ●
305
Commercial libraries. These libraries are in general huge and contain tens of thousands of compounds. The advantage is maximal chemical diversity, while the disadvantage is that most compounds will not have any biological activity. These libraries are most useful when the screen is very high throughput.
Many companies offer the ability to create a custom chemical library (Chembridge http://www.chembridge.com/collected-screeninglibraries.html). The National Institute of Health offers a vast array of chemicals available for screens free of charge. Sigma Aldrich also offers a variety of chemical libraries, including the LOPAC1280 collection of pharmaceutically active compounds. The libraries offered can be broad in order to cover a great extent of the available chemical compounds, or can be more biased according to the chemical identities of the compounds, the molecular weight of the compounds, the medicinal use, or other. 1. 96- or 48-well plates. 2. TECAN liquid handling robot to easily transfer chemicals from 96 to 48-well plates if desired (Tecan, Durham, NC) (see Note 4) 2.3. Embryo Fixation, Dechorionation, Bleaching, Rehydration, and Proteinase K Treatment
1. Phosphate buffer saline (PBS): 0.14 M NaCl, 0.003 M KCl, 0.002 M KH2PO4, 0.01 M Na2HPO4, pH 7.2. 2. 4%PFA in PBS (see Note 5). 3. Pronase: 50 mg/ml in E3, aliquot, and store at −20°C (see Note 6). 4. Bleach solution: 0.8% KOH, 0.9% H2O2, 0.1%Tween in deionized water. Should be prepared fresh just before use (see Note 7). 5. PBST: PBS, 0.1%Tween-20. 6. Proteinase K: 10 mg/ml in PBST, aliquot and store at −20°C (see Note 8). 7. Watchmaker’s forceps (Dumont). 8. 48-well mesh plates.
2.4. Hybridization
1. Deionized formamide: formamide should be aliquoted and stored at −20°C. Formamide is toxic and must be handled with care. (see Note 9). 2. Saline sodium citrate (SSC): 20×: 3M NaCl, 300 mM trisodium citrate, pH 6.0. 3. Hybridization solution (hybe solution): 50% formamide, 5×SSC, 0.1%Tween-20. Can be prepared and stored at −20°C. 4. PBST: PBS, 0.1%Tween-20.
306
Trompouki and Zon
5. Probe: dilute 100 ng of probe in 100 ml of Hybe solution. 6. 70°C oven. 7. Blocking solution: 2% heat-inactivated lamb serum 0.2%BSA in PBST. 8. Anti-digoxigenin alkaline phosphatase (AP) Fab fragments (Roche) (see Note 10). 9. Antibody solution: 1 ml of antibody in 5 ml of blocking solution. 2.5. DIG Staining (see Note 11)
1. PBST: PBS, 0.1%Tween-20. 2. Staining buffer: 100 mM Tris-base, pH 9.5, 50 mM MgCl2, 100 mM NaCl, 0.1% Tween-20. Add Tween-20 before use. The rest of the solution can be kept at 4°C. 3. 4-Nitroblue tetrazolium (NBT) (50 mg/ml) in 70% dimethylformamide. 4. 5-Bromo-4-chloro-3-indolyl-phosphate (BCIP) (50 mg/ml) in 100% dimethylformamide. 5. Staining solution: dilute 35 ml of 50 mg/ml BCIP and 45 ml of 50 mg/ml NBT in 10 ml of staining buffer.
2.6. Probe Preparation
1. Template DNA in appropriate vector. 2. Enzyme suitable for vector linearization. 3. DIG-labeling kit (Roche): DIG-11-UTP NTP mix, 5× Transcription buffer, SP6, T3 or T7 polymerase, RNAse inhibitor, RNAse-free DNAse, and RNAse-free ddH2O. 4. RNeasy Mini kit or some other kit for purification of RNA.
2.7. Observation and Photography
1. Coverslips and microscope slides. 2. PBST. 3. Glycerol. 4. Microscope (we use Nikon Eclipse E600). 5. Camera (we use CoolPix 4500 4.0 Mega Pixel).
3. Methods 3.1. Embryo Preparation
1. Set up the desired adult pairs overnight (male and female separated by divider) in mass mating cages 2–3 females and 2–3 males per cage, or as single pairs. 2. Pull out the dividers to combine fish around 8–9 a.m. to best synchronize fertilization timing.
Small Molecule Screen in Zebrafish and HSC Expansion
307
3. Collect different clutches into individual petri dishes using E3 water and methylene blue and stage the embryos to verify that they are synchronized. 4. At about 5 hpf clean out dead embryos and debris. 5. When the embryos have reached the desired stage check them again to confirm that they are synchronized and pool all the embryos together (synchronized staging of the embryos is really crucial!). 6. For a screen in HSCs the treatment with the chemical can start as early as 5 somites stage or as late as 24 hpf depending on the specificity of the target desired. For different kind of screens it may be necessary to choose an earlier or a later stage. (see Note 12) 3.2. Chemical Libraries
1. Preparation of chemical plates. 2. Get the desired chemical library, for example, the ICCB. 3. Add 150 ml E3+ into each well of the desired number of 96-well plates and add 1 ml of chemical in each well. (see Note 13) 4. Transfer chemicals to 48-well plates using Tecan robot or manually. Final volume is 300 ml per well (drugs are used at an approximate concentration of ~20 mM). 5. Pool synchronized embryos together to avoid clutch bias and remove as much of the E3 as possible. Scoop desired number of embryos with a small spatula and flick briskly to place embryos into each well. Embryo number can be adjusted according to the demands of each screen. For screens of wildtype embryos 5–10 embryos per well is an acceptable number. (see Note 14) 6. Incubate embryos in the chemicals at 28.5°C. The time can be adjusted according to the demands of each screen. For an HSC screen embryos can be incubated from 5 somites stage till 36 h postfertilization. (see Note 15) 7. It is crucial that untreated, negative and positive controls (if available) are placed in every single plate of the chemical screen. The positive control can be used to verify the stopping point for the in situ hybridization staining and can validate the success of the whole procedure for each plate.
3.3. In Situ Hybridization ( see Note 16) 3.3.1. Embryo Dechorionation, Fixation, Bleaching and Rehydration, and Proteinase K Treatment
1. Dechorionate the embryos. Dechorionation of embryos younger than 20 somites should be done manually with two fine watchmaker’s forceps. The user can grab the chorion with the forceps and gently pull in opposite directions. The procedure should be performed under a dissecting microscope. After the dissection the yolk will appear dark but this will not affect the outcome of in situ hybridization. For an HSC screen the embryos will be collected at 36 hpf. In this
308
Trompouki and Zon
case, the dechorionation can be performed with the addition of pronase. Add 10 ml of 50 mg/ml pronase per well and leave for 5 min. The chorion should be very easily detachable. Prolonged incubation with the pronase may result in embryo dissociation. 2. After dechorionation with pronase the embryos should be washed four times in E3 to remove pronase and the chemical. 3. Fix the embryos overnight in 4% PFA. 4. After fixation, embryos that are 36 hpf or older need bleaching, otherwise, the optical clarity of the embryos, a great advantage of zebrafish, will be severely diminished. To bleach the embryos remove PFA and wash twice with PBST twice. Put 300 ml of bleaching solution in each well and incubate 10 min at RT for embryos 36 hpf to 2 dpf, 30 min for 3 dpf embryos and 45 min for older embryos. Embryos after bleach are generally fragile so they must be handled with care. 5. Remove bleach and wash twice for 5 min with PBST. 6. Fix again in 4% PFA for at least 2 h at RT or overnight at 4°C (PFA should be fresh or recently defrozen because embryos are fragile after bleaching). 7. Wash in MeOH three times for 5 min and fix in MeOH o/n at 4°C or −20°C for at least 2 h. Embryos can be stored at −20°C for up to 2 weeks. 8. Rehydrate the embryos. From this step onward you can transfer embryos to 48-well mesh screen trays, which facilitate the procedure or for use with the BioLane machine if available. 9. For each of the solutions mentioned use 500 ml per well unless otherwise indicated. If you use the mesh 48-well plates, use 50 ml of solution per plate. 10. Wash once in MeOH:PBST 2:1 for 5 min RT. 11. Wash once in MeOH:PBST 1:2 for 5 min RT. 12. Wash four times in PBST for 5 min each RT. 13. Dilute pK in PBST to a final dilution of 10 mg/ml and add 200 ml per well. This treatment can be hard for the embryos, so timing is really crucial. Another important point is that every batch of pK may differ slightly, as it is also possible for older versus newer stocks. 14. Suggesting timing for pK treatment ●
Embryos younger that “bud”: treat them for 30 s at RT.
●
Early somitogenesis embryos: treat them for 1 min at RT.
●
Late somitogenesis: treat them for 2 min at RT.
●
Embryos 24 hpf: treat them for 5 min at RT.
Small Molecule Screen in Zebrafish and HSC Expansion ●
Embryos 36/48 hpf: treat them for 10 min at RT.
●
Zebrafish 5–6 dpf: treat them for 20 min at RT.
309
15. Wash once quickly with PBST. Washing should start immediately to prevent prolonged treatment with pK. In mesh-48well plates the solution can be changed quickly. In the case of regular plates it is advisable to dilute the pK solution with PBST before trying to remove it, so that the time of exposure to pK is not prolonged. 16. Fix in 4% PFA for 20 min at RT. 17. Wash four times in PBST for 5 min each at RT. 3.3.2. Hybridization
1. Prehybridize the embryos in hybe solution at 70°C for 30 min up to 3 h. 2. Dilute the probe in hybe solution at a final concentration of 1 ng/ml and prewarm it at 70°C. 3. Replace hybe solution with hybe solution+probe (250 ml) and incubate o/n at 70°C. 4. Next day prepare the wash solutions and preheat the appropriate ones at 70°C. Use at least 500 ml of washing solution for each well or 50 ml if you are using the mesh plates. 5. Hybe/2×SSC 3:1 for 15 min at 70°C. 6. Hybe/2×SSC 1:1 for 15 min at 70°C. 7. Hybe/2×SSC 1:3 for 15 min at 70°C. 8. 2×SSC for 15 min at 70°C. 9. 0.2×SSC for 30 min at 70°C. 10. 0.2×SSC for 30 min at 70°C. 11. 0.2×SSC/PBST 3:1for 10 min at RT. 12. 0.2×SSC/PBST 1:1 for10 min at RT. 13. 0.2×SSC/PBST 1:3 for 10 min at RT. 14. PBST for 10 min at RT. 15. Block the embryos in blocking solution 500 ml per well for at least 30 min at RT. 16. Dilute the antibody (0.15 U/ml, 1 ml of antibody per 5 ml of blocking solution) and incubate o/n at 4°C (see Note 17).
3.3.3. DIG Staining
1. Wash once quickly with PBST to remove the antibody solution. 2. Wash five times with PBST for 15 min RT on a rocker at 40 rpm. 3. Prepare staining solution and vortex. In 10 ml of staining buffer add 35 ml of BCIP stock (50 mg/ml) and 45 ml of NBT stock (50 mg/ml).
310
Trompouki and Zon
4. Wash once with staining buffer and then add 500 ml of staining solution and 500 ml of staining buffer. This reaction is light sensitive so the plates must be kept in the dark. Monitor the reaction every 30–60 min to prevent high background staining. If runx1 and c-myb are used as probes for staining of the AGM staining should be stopped after several hours or it can be left o/n. 5. When the staining has reached the desired level remove the staining solution and wash multiple times with PBST. Stop the reaction by adding PFA 4%, and store at 4°C. Observe the embryos under a microscope for changes in the staining. In a screen, it is crucial that the same person evaluates all the plates of the screen so that there is consistency. The best solution is for two independent observers to judge the results and compare. 3.3.4. Probe Preparation
Probes for in situ hybridization can be made from a variety of vectors that contain a T3, T7, or SP6 polymerase site and can be linearized opposite that site with a restriction enzyme. In general, any in vitro transcription kit that adds digoxigenin-labeled UTP into antisense RNA can be used. The probe is crucial for the outcome of the screen so it is better to use a probe that gives a strict pattern and that is easily recognizable. The probes should be around 1 kb in length but longer or shorter probes or partial probes can work equally well. 1. Digest 10 mg of DNA with the appropriate enzyme. Digestion should be complete so longer than usual incubation times or even o/n incubation may be needed. 2. Purify the DNA and measure the OD with nanodrop. Run a small sample on an agarose gel to check whether the digestion is complete. Dilute the DNA to a final concentration of 1 mg/ml. 3. For the transcription reaction use ●
1 mg of linearized DNA
●
Transcription buffer (T3, T7 or SP6 polymerase) 2 ml
●
NTP-DIG-RNA 2 ml
●
RNAse inhibitor (35 units/ml) 1 ml
●
T3/T7/SP6 polymerase (20 units/ml) 1 ml
●
ddH2O to 20 ml total volume
4. Incubate for 1 h at 37°C. 5. Digest the DNA template by adding 1 ml RNAse-free DNAse for 30 min at 37°C. 6. Purify the RNA with RNeasy MINI kit from Qiagen or some other purification method.
Small Molecule Screen in Zebrafish and HSC Expansion
311
7. Measure the optical density of the RNA and run a gel to check for the integrity and the size of the RNA fragment. Aliquot probe and store at −80°C. 3.3.5. Observation and Photography
Observe the screen plates under the microscope for possible “hits.” In case you have a “hit,” the embryos should be photographed. Embryos that are 36 hpf are more easily photographed using a depression or a bridge slide to keep the embryos properly oriented. Coverslip slides by Nomarsky are also appropriate for taking pictures of the embryos. To make a bridge slide, stack and glue 3–4 coverslips on each side of a normal slide. The embryo can be put in the middle in a drop of glycerol, positioned as desired, then covered with another coverslip that bridges the two stacks. The embryos should be transferred from PFA 4% to PBST and finally to glycerol so that they can be photographed (Fig. 1).
3.4. Chemoinformatics ( 19, 20)
Performing a chemical screen can lead to the identification of many chemicals that produce a desired effect. It is possible that these chemicals have no known biological activity. In this case, there are tools to help the researcher to identify the potential activity of the unknown chemical by comparison to known chemicals. It is also possible to identify a known and FDA-approved drug that may exhibit the same activity as the unknown compound. The computational tool that gives the researcher these possibilities is chemoinformatics. Chemoinformatics is the use of information technology to manage chemical information and solve chemical problems. Usually the chemicals that are included in a certain library, even though they may not have a known biological activity, are represented as molecules in different formats. The researcher can use these formats to compare to chemicals with known biochemical activity. Many types of formats exist. One of the most commonly used is the Simplified Molecular Input Line Entry Specification (SMILES) format (useful information about SMILES can be found in the following link http://www.daylight.com/dayhtml/ doc/theory/theory.smiles.html). Smiles is a very powerful format because it is simple and can be read rapidly by a computer. SMILES represent only the fundamental property of the molecule so they provide information that is not arbitrary. Another standard format is the Chemical Markup Language (CML) and the GROMACS file format family which is used in combination with the molecular simulation software GROMACS. Other formats are the CHARMM format, the Chemical File Format, the SYBYL Line Notation. It is also possible to convert between different formats. Two open source tools that can be used to convert between formats are the OpenBabel and JOELib. The researcher can use these formats to search available chemical databases, using algorithms somewhat analogous to a
312
Trompouki and Zon
BLAST search. Examples of such databases includePubChem, Wombat, MDL Drug Data Report (MDDR), Thor, CrossFire Beilstein, ChemBank, and many more. These repositories contain unique features but most of them enable the user to identify analog chemical substance to the one that they are interested in and they provide a link to 3D models and Safety Data Sheets as well as information about the purity of each chemical or the availability. MDL ACD provides also a number of suppliers for different chemicals. MDL ACD can be reached online via Discovery Gate where the researcher can execute structural or text-based searches. Most of the databases provide also links to literature and patents. The methods to query each database vary, but include the commonly used Tanimoto similarity score, which allows the researcher to determine how similar a given compound is to others in the literature with n dimensions by finding the angle between them. Alternatives include the SEA algorithm (http://shoichetlab. compbio.ucsf.edu/~keiser/sea/) or Tversky similarity (http:// chembank.broad.harvard.edu/welcome.htm) These tools, although not always successful, may sometimes point toward a class of similar compounds that can be tested for their ability to phenocopy the “hit” from a given screen.
4. Notes 1. In situ hybridization is an established readout for a screen in zebrafish. Another powerful readout is imaging of fluorescent fish, and the particular screen that we describe in this protocol could be performed using fish that express c-myb GFP(AGM staining), or c-myb GFP and lmo2-dsRED(AGM and vessel staining). The techniques for such a screen are still evolving. There are three main issues to contend with: (1) Sibling fish tend to exhibit significant variability in the strength of fluorescence. For that case, one should perform a prescreen and isolate some zebrafish pairs that produce embryos with similar fluorescent levels. (2) High-throughput fluorescent imaging needs to be rapid so that the embryos in the first well are at a similar stage to those in the last well screened on a given day. (3) Fluorescent visualization in typical 48-well plates tends to be of low quality, but this can be improved with the use of optical prism plates that allow for much improved image quality. 2. In situ hybridization on a large scale can be carried out using a robot. We use the Biolane HTI robot. This robot consists of two individual trays that can be each run independently with separate in situ protocols. The whole machine can be
Small Molecule Screen in Zebrafish and HSC Expansion
313
programmed to perform all the steps of the in situ hybridization. We usually use the robot from the rehydration step of the protocol until the washes, whereas the staining is performed manually. For the robot we use mesh plates provided by the same company (Hölle & Hüttner AG). 3. E3 can be made and kept at room temperature as a 50× stock. Working stock is 1× and can be kept up to 2 weeks at RT. Methylene blue is usually added to 1× E3 as a fungicide. 4. Chemicals can be transferred to the wells manually, but an automated system ensures a much faster and more accurate system avoiding pipetting errors. 5. Dilute PFA in PBS and heat the solution to 65°C to dissolve. If the powder is not completely dissolved add some drops of 1 N NaOH to the solution till it is clear (pH ~7.5). PFA should be used fresh but it can be stored in aliquots and kept at −20°C. Do not freeze and thaw PFA. 6. Pronase is a mixture of a broad spectrum of proteases. Its activity is extended to both denatured and native proteins which can be digested into individual aminoacids. The mixture contains various types of endopeptidases (serine and metalloproteases) and exopeptidases (carboxypeptidases and aminopeptidases) as well as neutral and alkaline phosphatases. It is used here for the dechorionation of zebrafish embryos. It is obvious that prolonged exposure of embryos to pronase will affect their integrity so if the embryos appear fragile reduce the time of exposure to pronase. 7. Another common way to produce unpigmented embryos is the use of Phenylthiouria (PTU). PTU should be used to treat embryos younger than 24 hpf but it has shown to cause delayed hatching, retardation, and embryo malformation in some cases although these effects are very mild at the working dose of 0.003% in fish water. PTU has also been shown to block thyroid hormone expression (21). For older embryos, bleaching is recommended. 8. Proteinase K is a broad spectrum serine protease. The predominant site of cleavage is the peptide bond adjacent to the carboxyl group of aliphatic, aromatic, or hydrophobic amino acids. Prolonged exposure to proteinase K may damage the embryos. The bleached embryos are especially fragile so a shorter treatment with proteinase K is recommended for bleached embryos. 9. Formamide lowers the melting point of nucleic acids and as a result the strands can be separated more easily. Formamide is highly corrosive in contact with skin or eyes and may be deadly if ingested. Formamide should never be handled without proper safety attire including gloves and goggles.
314
Trompouki and Zon
10. Instead of digoxigenin other molecules can be also used in in situ hybridization probes, for example, fluoroscein or its derivatives such as fluoroscein isothyocyanate (FITC). 11. These solutions are toxic and light sensitive. The user should wear gloves while handling these solutions. BCIP and NBT are chemical compounds used for the sensitive detection of alkaline phosphatase (AP). BCIP is the alkaline phosphatase substrate and NBT acts as the oxidant. These two compounds together naturally form a purple precipitate but alkaline phosphatase act as a catalyst in this reaction and accelerates it approximately 1,000 fold. BCIP binds to the alkaline phosphatase active site but upon interaction with NBT, BCIP is released from the enzyme and the colorful precipitate is formed. In case the reaction is very slow, the addition of polyvinyl alcohol (PVA) accelerates the reaction by 20-fold. In that case, the user should add PVA 10% w/v to the staining buffer that contains no Tween-20, boil the solution, let it cool down, and finally add Tween-20 (0.1%) and use the solution. The use of PVA is recommended for less robust chromogenic substrates such as Fast Red. Levamisole can be used to block high endogenous alkaline phosphatase activity, and should be diluted in the staining buffer at a final concentration of 1 mM. 12. If a positive control for the screen is available, a time course with the known chemical should be performed in order to check the optimal initiation time for the screen (primary screen). Embryos should be treated at different stages and for different time points and a check should be made for the best possible readout. Earlier stages, for example, the start of gastrulation (50% epiboly stage) may cause greater toxicity than choosing a stage after completion of gastrulation. The positive control is also essential to verify that the chemicals are able to penetrate the chorion since the treatment is performed before dechorionation. Important evidence regarding the penetrance of the chemicals is the fact that some chemicals are colored so they can be easily visualized to color the embryo. A negative control can also provide the time window, dose and different types or levels of nonspecific effects, but the positive control will also provide a picture of a potential positive regulator. 13. In a chemical screen it is generally too labor intensive to use different concentrations of the chemicals. This can result in toxicity from chemicals that should have been used in lower concentrations. It is also possible to miss a “hit” because a chemical needed to be more concentrated in order to have an effect. So, if the user has identified some chemicals that affect a certain pathway but missed others in the same pathway, we
Small Molecule Screen in Zebrafish and HSC Expansion
315
recommend retesting these chemicals and performing a dose– response curve to find out the optimal dilution for each chemical. 14. The number of embryos depends on the kind of the screen. If the screen is performed on wild-type embryos, five embryos per well are generally enough to detect the desired result. When screens are performed on homozygous mutants that are embryonic lethal, the embryos must be generated by incrossing heterozygous adults so that only 25% of the total embryo population will be homozygous mutants. In this case, at least 20 embryos per well should be used to ensure enough numbers of the mutant embryos are tested with each chemical. 15. Pooling of chemicals is another suggestion in case large chemical libraries are screened. This is recommended for natural product libraries or commercial libraries that contain thousands of chemicals most of which will have no biological activity. Depending on the format of the library and the screening plate, the number of compounds per well can vary. The advantage of this method is that it reduces greatly the number of embryos requested for the screen. If the pooling strategy allows for each chemical to be represented twice in a plate, individual hits can be identified. The major drawback for the pooling strategy is the increased toxicity that can be very high, especially in libraries with known bioactive compounds. Another issue is the incubation temperature. The suggested temperature can be modified according to the needs of the screen. Lower temperatures, for example, 25°C or 21°C will delay the development of the embryos if it is necessary. 16. As a general instruction for the whole in situ protocol, use large volumes of liquid for the washes. Smaller volumes are required for the Proteinase K treatment, bleaching, and the hybridization with the probe. 17. The antibodies can be absorbed against whole zebrafish embryos or zebrafish powder but we don’t find this step necessary if we use dilution of the antibody at 1:5,000.
Acknowledgments We would like to thank Trista E North for providing Fig. 1. We would also like to thank Trista E North, Jill L.O. de Jong, Xuining Le, and Richard M. White for providing their expertise in chemical screening and in particular Richard M.White for the
316
Trompouki and Zon
chemoinformatics part of the protocol. Finally, we would like to thank Trista E North, Jill L.O. de Jong, and Richard M. White for careful review of the manuscript. Eirini Trompouki is supported by Jane Coffin Childs Memorial Fund. References 1. Amatruda, J. F., and Zon, L. I. (1999) Dissecting hematopoiesis and disease using the zebrafish. Dev Biol 216, 1–15. 2. Dooley, K., and Zon, L. I. (2000) Zebrafish: a model system for the study of human disease. Curr Opin Genet Dev 10, 252–6. 3. Shafizadeh, E., and Paw, B. H. (2004) Zebrafish as a model of human hematologic disorders. Curr Opin Hematol 11, 255–61. 4. Galloway, J. L., and Zon, L. I. (2003) Ontogeny of hematopoiesis: examining the emergence of hematopoietic cells in the vertebrate embryo. Curr Top Dev Biol 53, 139–58. 5. Kari, G., Rodeck, U., and Dicker, A. P. (2007) Zebrafish: an emerging model system for human disease and drug discovery. Clin Pharmacol Ther 82, 70–80. 6. Lally, B. E., Geiger, G. A., Kridel, S., ArcuryQuandt, A. E., Robbins, M. E., Kock, N. D., Wheeler, K., Peddi, P., Georgakilas, A., Kao, G. D., and Koumenis, C. (2007) Identification and biological evaluation of a novel and potent small molecule radiation sensitizer via an unbiased screen of a chemical library. Cancer Res 67, 8791–9. 7. Davidson, A. J., and Zon, L. I. (2004) The ‘definitive’ (and ‘primitive’) guide to zebrafish hematopoiesis. Oncogene 23, 7233–46. 8. de Jong, J. L., and Zon, L. I. (2005) Use of the zebrafish system to study primitive and definitive hematopoiesis. Annu Rev Genet 39, 481–501. 9. Hsia, N., and Zon, L. I. (2005) Transcriptional regulation of hematopoietic stem cell development in zebrafish. Exp Hematol 33, 1007–14. 10. North, T. E., Goessling, W., Walkley, C. R., Lengerke, C., Kopani, K. R., Lord, A. M., Weber, G. J., Bowman, T. V., Jang, I. H., Grosser, T., Fitzgerald, G. A., Daley, G. Q., Orkin, S. H., and Zon, L. I. (2007) Prostaglandin E2 regulates vertebrate haematopoietic stem cell homeostasis. Nature 447, 1007–11. 11. Murphey, R. D., and Zon, L. I. (2006) Small molecule screening in the zebrafish. Methods 39, 255–61.
12. Mandrekar, N., and Thakur, N. L. (2008) Significance of the zebrafish model in the discovery of bioactive molecules from nature. Biotechnol Lett. 13. Barros, T. P., Alderton, W. K., Reynolds, H. M., Roach, A. G., and Berghmans, S. (2008) Zebrafish: an emerging technology for in vivo pharmacological assessment to identify potential safety liabilities in early drug discovery. Br J Pharmacol 154, 1400–13. 14. Murphey, R. D., Stern, H. M., Straub, C. T., and Zon, L. I. (2006) A chemical genetic screen for cell cycle inhibitors in zebrafish embryos. Chem Biol Drug Des 68, 213–9. 15. Jagadeeswaran, P., and Sheehan, J. P. (1999) Analysis of blood coagulation in the zebrafish. Blood Cells Mol Dis 25, 239–49. 16. Langenau, D. M., Ferrando, A. A., Traver, D., Kutok, J. L., Hezel, J. P., Kanki, J. P., Zon, L. I., Look, A. T., and Trede, N. S. (2004) In vivo tracking of T cell development, ablation, and engraftment in transgenic zebrafish. Proc Natl Acad Sci U S A 101, 7369–74. 17. Tseng, H. P., Hseu, T. H., Buhler, D. R., Wang, W. D., and Hu, C. H. (2005) Constitutive and xenobiotics-induced expression of a novel CYP3A gene from zebrafish larva. Toxicol Appl Pharmacol 205, 247–58. 18. Thisse, B., Heyer, V., Lux, A., Alunni, V., Degrave, A., Seiliez, I., Kirchner, J., Parkhill, J. P., and Thisse, C. (2004) Spatial and temporal expression of the zebrafish genome by large-scale in situ hybridization screening. Methods Cell Biol 77, 505–19. 19. Parker, C. N., and Schreyer, S. K. (2004) Application of chemoinformatics to highthroughput screening: practical considerations. Methods Mol Biol 275, 85–110. 20. Brown, F. (2005) Editorial opinion: chemoinformatics - a ten year update. Curr Opin Drug Discov Devel 8, 298–302. 21. Elsalini, O. A., and Rohr, K. B. (2003) Phenylthiourea disrupts thyroid function in developing zebrafish. Dev Genes Evol 212, 593–8.
Chapter 20 Zebrafish Small Molecule Screen in Reprogramming/Cell Fate Modulation Jing-Ruey J. Yeh and Kathleen M. Munson Abstract Embryonic zebrafish have long been used for lineage-tracing studies. In zebrafish embryos, the cell fate identities can be determined by whole-mount in situ hybridization, or by visualization of live embryos if using fluorescent reporter lines. We use embryonic zebrafish to study the effects of a leukemic oncogene AML1-ETO on modulating hematopoietic cell fate. Induced expression of AML1-ETO is able to efficiently reprogram hematopoietic progenitor cells from erythroid to myeloid cell fate. Using the zebrafish model of AML1-ETO, we performed a chemical screen to identify small molecules that suppress the cell fate switch in the presence of AML1-ETO. The methods discussed herein may be broadly applicable for identifying small molecules that modulate other cell fate decisions. Key words: Chemical screen, Zebrafish, Hematopoiesis, AML, Leukemia, Reprogramming, Cell fate, In vivo, Erythroid, Myeloid
1. Introduction Many leukemic oncogenes, including AML1-ETO, contribute to leukemogenesis by modulating hematopoietic stem/progenitor cell differentiation. Embryonic zebrafish is a powerful model to study hematopoietic cell fate. Within the first day postfertilization, zebrafish embryos develop two localized pools of hematopoietic progenitor cells (HPCs). The anterior blood island expresses pu.1, and will give rise to the myeloid cells (1). On the other hand, the posterior blood island expresses gata1, and will differentiate into the erythroid cells (1). These synchronized pools of HPCs are useful for studying the signaling pathways that underlie or affect hematopoietic cell fate determination. We have shown that expressing AML1-ETO, an oncogene frequently associated with acute myelogenous leukemia, leads to S. Ding (ed.), Cellular Programming and Reprogramming: Methods and Protocols, Methods in Molecular Biology, vol. 636, DOI 10.1007/978-1-60761-691-7_20, © Springer Science+Business Media, LLC 2010
317
318
Yeh and Munson
hsp 70 AML1-ETO
hsp 70 AML1-ETO
15-s omite
20-s omite
2 dpf
Fig. 1. Expression of AML1-ETO in embryonic zebrafish reprograms hematopietic cell fate. At 15-somite stage, erythroid cell markers such as gata1 are strongly expressed in the intermediate cell mass (ICM) of zebrafish embryos (indicated as a red stripe in the ventral side of the trunk). In the absence of AML1-ETO (top scheme), the hematopoietic progenitor cells in the ICM will continue to express erythroid cell markers and will eventually become red blood cells. Only a small number of cells in the ICM express myeloid cell markers (indicated as green dots). However, induced expression of AML1-ETO (bottom scheme) leads to rapid downregulation of gata1 in the ICM and eventually the accumulation of myeloid cells at 2 days postfertilization (dpf). Red stripes and red dots, cells expressing erythroid cell markers; green stripe and green dots, cells expressing myeloid cell markers
a rapid and efficient cell fate switch in the posterior blood island of zebrafish embryos (Fig. 1). This fate switch is characterized by downregulation of gata1, suggesting suppression of erythropoiesis, and upregulation of mpo, indicating conversion into the granuocytic cell fate (2). Furthermore, to identify candidate small molecules that can reverse AML1-ETO’s effects and the mechanisms by which AML1-ETO reprograms hematopoietic cell fate, we conducted a chemical suppressor screen using zebrafish embryos. From this screen we have identified several classes of compounds that restored gata1 expression in the presence of AML1-ETO (3). The chemical suppressors of AML1-ETO identified from the in vivo zebrafish screen may provide not only new insights into AML1-ETO-mediated hematopoietic differentiation but also new means to block AML1-ETO’s effects in the clinical settings. For the chemical suppressor screen of AML1-ETO we used a transgenic zebrafish line, Tg (hsp:AML1-ETO), in which AML1ETO expression is controlled by a zebrafish heat-shock hsp70 promoter. Thus, AML1-ETO expression can be induced by incubating zebrafish embryos at 37–42°C as compared to the regular embryo culture temperature at 24–28.5°C. Tg(hsp:AML1-ETO) embryos were arrayed into 96-well screening plates. Compounds from the chemical library were also added to the screening plates, and the plates were subjected to the heat treatment to induce AML1-ETO expression. Subsequently, the embryos were fixed and processed for whole-mount in situ hybridization of gata1 through both manual and automated procedures.
Zebrafish Small Molecule Screen in Reprogramming/Cell Fate Modulation
319
Conceivably, the present method could also be adapted for investigation of other cell fate decisions by using other zebrafish lines and cell markers. The combination of facile detection of cell fates and high-throughput in vivo small molecule screening surely will make the embryonic zebrafish a unique model system to study reprogramming/cell fate modulation.
2. Materials 2.1. Zebrafish
1. Adult wild-type and transgenic Tg (hsp:AML1-ETO) zebrafish, males and females (see Note 1). 2. Mating cages for the zebrafish that have divider slots in the middle. 3. E3 buffer: 5 mM NaCl, 0.17 mM KCl, 0.33 mM CaCl2, 0.33 mM MgSO4. 4. Petri dishes. 5. Egg strainers for collecting zebrafish embryos. 6. Incubators at 24°C and 28.5°C.
2.2. Chemical Screening in Zebrafish Embryos
1. A dissecting microscope. 2. A desiccator. 3. Pronase, which is a mixture of proteinases available from various commercial sources. 4. Pipette Pump™, 10 ml (#378980000, Scienceware®). 5. Glass Pasteur pipettes with a large bore size. 6. MultiScreen-Mesh Filter plates with 96-well receiver plates (MANMN6010, Millipore). Each set of the plates includes a cover, a 96-well nylon mesh (60 mm) plate, a 96-well receiver plate, and a single-well reservoir tray. 7. A multichannel pipette. 8. Chemical libraries – Any small molecule libraries may be used. The compounds in the chemical libraries are generally dissolved in dimethyl sulfoxide (DMSO) and stored in a 96- or 384-well format. 9. Dimethyl sulfoxide (DMSO). 10. Foil plate seals.
2.3. Incubation and Fixation of Compound-Treated Zebrafish Embryos
1. A water bath at 39°C for heat-shock treatment. 2. 4% paraformaldehyde in 1× phosphate-buffered saline (PBS), (4% PFA/PBS): 4 g PFA in 100 mL 1× PBS. Dissolve
320
Yeh and Munson
at 65°C. Alternatively, dilute 37% formaldehyde solution to 4% with 1× PBS. Store in foil-wrapped Falcon tubes at 4°C. 2.4. Digoxigenin Probe Labeling
1. Plasmid DNA pBS-ZG1 (4). 2. XbaI restriction enzyme. 3. QIAquick PCR Purification kit (#28104, Qiagen). 4. T7 RNA polymerase (#P2075, Promega). 5. 0.1 M dithiothreitol (DTT). 6. RNasin® Ribonuclease Inhibitor (#N2115, Promega). 7. DIG RNA Labeling Mix (#11277073910, Roche). 8. RNase-free DNase (#M6101, Promega). 9. Mini Quick Spin RNA Columns (#11814427001, Roche). 10. A 37°C incubator.
2.5. Whole-Mount In Situ Hybridization
1. 10× PBS: 800 mL RNase-free water, 80 g NaCl, 2 g KCl, 14.4 g Na2HPO4, 2.4 g KH2PO4, adjust pH to 7.4 with HCl and add RNase-free water to 1 L. Store at room temperature. 2. 1× PBS: Dilute 1 part of 10× PBS with 9 parts of RNase-free water. 3. PBST: 1× PBS with 0.1% Tween-20. Store at room temperature. 4. 20× SSC: 175.3 g NaCl, 88.2 g sodium citrate, adjust pH to 7.0, and add RNase-free water to 1 L. Store at room temperature. 5. Hyb(−) solution: 50% formamide, 5× SSC, 0.1% Tween-20. Use RNase-free water. Add 1 ml of 1 M citric acid per 100 ml of hyb(−) solution. Store at −20°C. 6. Hyb(+) Solution: Hyb(−) solution with 500 mg/mL Torula Yeast RNA and 50 mg/mL heparin. Store at −20°C. 7. Maleic acid buffer: 0.1 M maleic acid, pH 7.5, 0.15 M NaCl. 8. Blocking solution: Maleic acid buffer with 10% calf serum. 9. Antibody solution: Diluted anti-digoxigenin-AP antibody (#11093274910, Roche) 1:5,000 in the blocking solution. 10. NTMT: 0.1 M Tris–HCl, pH 9.5, 0.1 M NaCl, 50 mM MgCl2, 0.1% Tween-20. 11. NBT: 4-nitro blue tetrazolium chloride solution (100 mg/ml). 12. BCIP: 5-bromo-4-chloro-3-indolyl-phosphate 4-toluidine salt (50 mg/ml). 13. BioLane™ HTI (Holle & Huttner AG), which is an automated liquid handling platform that can be programmed for various applications. 14. A 68°C incubator. 15. A dissecting microscope.
Zebrafish Small Molecule Screen in Reprogramming/Cell Fate Modulation
321
3. Methods 3.1. Collection of Zebrafish Embryos
1. Day 1: Set up matings of wild-type and transgenic fish pairs using the mating cages with dividers in the middle to separate males and females. 2. Day 2: Pull the dividers in the morning. Two hours later, collect embryos using the egg strainers and place each clutch of the embryos in a 10-cm Petri dish with E3 buffer. Incubate dishes with the embryos at 28.5°C for 5 h and then at 24°C overnight (see Note 2).
3.2. Arraying the Embryos and Administering the Chemicals
1. Day 3: Set water bath temperature at 39°C. 2. Thaw compound plates from –80°C in a desiccator (see Note 3). 3. Discard dead embryos and stage embryos under a dissecting microscope, pooling clutches of similarly staged embryos. Embryos should be younger than 14-somite stage. 4. Reduce the E3 volume in the Petri dish just to the point at which the embryos can move freely in the dish when swirled. Add 0.5 mg of pronase to each ml of E3 buffer. Swirl Petri dishes to mix. Monitor the embryos, swirling often to promote the dechorionation of the embryos. Once all of the embryos come out of the chorions, rinse at least five times in E3 to remove chorion debris and any remaining pronase (see Note 4). 5. Assemble the screening plate with one 96-well mesh plate, one 96-well receiver plate, and one single-well reservoir tray. Add 250 ml of E3 to each well of the screening plate using a multichannel pipette. Make sure that the solution flows through the mesh (see Note 5). 6. Using a Pipette Pump with a glass Pasteur pipette, transfer five dechorionated embryos to each well of the screening plate (see Note 6): (a) In many chemical libraries, Columns 1 and 12 of the compound plates are empty. Thus, these wells can be used for positive and negative controls. (b) Add wild-type embryos to wells in Column 1 to serve as positive controls. These embryos should stain positive with gata1 probe. (c) Add transgenic embryos to the remaining wells including Column 12. (d) Add 0.5 ml DMSO to wells in Column 12. These wells should stain negative with gata1 probe and will serve as negative controls for the assay.
322
Yeh and Munson
7. Add 0.5 ml of each individual compound from the compound plate to the corresponding wells in Column 2–11 of the screening plate. Use the pipette tip to gently mix the solution while adding the compound (see Note 7). 8. Reseal the compound plate with foil seal when finished. Store the chemical libraries at –80°C. 3.3. Heat-Shock Treatment and Fixing the Embryos
1. Put the lid back on the screening plate and let stand at 25–28.5°C for at least 1 h before heat shock. The embryos should not exceed 18-somite stage before heat shock. 2. Remove the single-well reservoir tray from the rest of the screening plate and float the screening plate (including the lid, 96-well mesh plate and 96-well receiver plate) in a 39°C water bath for 1 h to heat-shock the embryos. 3. Remove the screening plate from the water bath, replace the reservoir tray to the bottom of the screening plate and incubate embryos at 28.5°C for 90 min. 4. Remove the reservoir tray and pour 30 ml of 4% PFA/PBS solution into it. Lift the mesh plate, let drain of the solution and place the mesh plate directly into the reservoir tray containing the fixative. Make sure all of the embryos are covered in the solution. Store the screening plate overnight at 4°C. 5. Clean the 96-well receiver plate for future use (Subheading 3.5, step 7).
3.4. Digoxigenin Labeling of Antisense RNA Probe
1. Digest 10 mg of pBS-ZG1 with XbaI. This will yield linearized plasmid DNA. Run one hundredth of the sample on an agarose gel to confirm that the digestion is complete. 2. Purify the linearized DNA with Qiagen PCR Purification kit. Alternatively, the DNA may be purified by phenol/chloroform 1:1 extraction followed by ethanol precipitation. 3. Mix the following components in an RNase-free microcentrifuge tube: 1 mg linearized DNA 8 ml 5× transcription buffer 4 ml 0.1 M DTT 4 ml DIG RNA-Labeling Mix 1 ml RNase inhibitor (40 U/ml) 2 ml T7 RNA polymerase Add RNase-free water to 40 ml and incubate in a 37°C water bath for 2 h to overnight.
Zebrafish Small Molecule Screen in Reprogramming/Cell Fate Modulation
323
4. Following the reaction, add 2 ml of RNase-free DNase I to the reaction mix and incubate for additional 30 min in the 37°C water bath. 5. Use Mini Quick Spin RNA Columns from Roche to purify the probe. Follow the manufacturer’s protocol (see Note 8). 6. Dilute the purified probe from one 40-ml reaction into 16 ml of hyb(+) solution. This is enough for one 96-well screening plate. Store the probe/hyb(+) solution at −20°C. 3.5. Whole-Mount In Situ Hybridization
1. (Continued from Subheading 3.3) Day 4: Lift the mesh plate with the embryos, let drain of the solution, and pour 4% PFA/PBS from the reservoir tray to a waste container. Replace with 30 ml of 1× PBS, put the mesh plate back into the reservoir tray and incubate for 5 min at room temperature. 2. Lift the mesh plate, let the solution drain, and pour out the PBS in the reservoir tray. Replace with 30 ml of methanol, put the mesh plate back into the reservoir tray and incubate for 5 min. 3. Repeat methanol washes three times for 5 min each, leaving final wash. Store embryos for a minimum of 2 h in methanol at –20°C. Alternatively, the plates may be stored long-term at –20°C. 4. Day 5: Wash plate as described above for 5 min each of 3:1, 1:1, 1:3 methanol:PBST solutions to rehydrate the embryos at room temperature. Use 30 ml of solution per plate for all washes (see Note 9). 5. Wash plates two times quickly in PBST, followed by four more washes of PBST for 15 min at room temperature. During these washes, heat hyb(−) solution and probe/hyb(+) solution in a 68°C incubator. 6. Replace final PBST wash with warm hyb(–) buffer and incubate at 68°C for 30 min to 2 h. 7. At the end of step 6, add 160 ml of probe/hyb(+) solution to each well of the 96-well receiver plate. 8. After hyb(−) incubation, lift the mesh plate from the reservoir tray and let the solution drain. Place the mesh plate into the 96-well receiver plate. Make sure that all of the embryos are covered with probe/hyb(+) solution. Place the screening plate including the lid, the mesh plate and the receiver plate in a humidified chamber and incubate at 68°C overnight. Clean the reservoir tray for later use (step 10).
324
Yeh and Munson
9. Keep hyb(−) solution at 68°C. Prepare 3:1, 1:1, 1:3 hyb(−):2× SSC solutions, 80 ml per plate, 2× SSC, 80 ml per plate, and 0.2× SSC, 160 ml per plate. Store at 68°C for Day 6. 10. Day 6: Pour 30 ml of hyb(−) solution into the reservoir tray. Transfer the mesh plate from the 96-well receiver plate to the reservoir tray and incubate at 68°C for 5 min. 11. Collect the probe/hyb(+) solution from the 96-well receiver plate into a 50-ml Falcon tube. Solution can be used once again. Bring up to 16 ml with hyb(+) and store at –20°C. 12. Pour warm 3:1 hyb(−):2× SSC solution into the tray of the BioLane™ HTI machine. Transfer the mesh plate from the reservoir tray to BioLane™ HTI. Up to four plates may be processed at once using BioLane™ HTI (see Note 10). Clean the reservoir tray for later use (step 16). 13. Set up the program in BioLane™ HTI according to Table 1. Connect the solutions to the corresponding ports of the machine. The volume required per wash per plate is 80 ml. Start the program. 14. Day 7: Prepare NTMT solution. Reserve 25 ml NTMT per plate and connect remaining NTMT to the correct port on BioLane™ HTI. 15. Add 56.25 ml of NBT (100 mg/ml) and 87.5 ml of BCIP (50 mg/ml) substrates per 25 ml of reserved NTMT solution. 16. At the end of the final NTMT wash, pour NTMT with substrates into the reservoir tray and remove the mesh plate from the machine into the reservoir tray. Cover the screening plate with the lid, wrap in aluminum foil, and incubate at room temperature. 17. Check staining periodically using a dissecting microscope. Check the staining of the positive and negative control embryos (Fig. 2). The development is complete when the positive control embryos show strong purple staining in the posterior blood island, or the intermediate cell mass (ICM). Stop the reaction if the negative control embryos start to show any staining in the ICM or when the background staining becomes obvious. 18. To stop the reaction, lift the mesh plate and change the solution in the reservoir tray into PBST. Replace the mesh plate and incubate for 5 min at room temperature. Repeat PBST wash once more. 19. Inspect the staining of each embryo under a dissecting microscope and log the results into 8 × 12-grid Excel spread sheets.
Zebrafish Small Molecule Screen in Reprogramming/Cell Fate Modulation
325
Table 1 Program for whole-mount in situ hybridization using BioLane™ HTI Step
Solution
Time
Temperature
1
3:1 hyb(−):2× SSC
15 min
68°C
2
1:1 hyb(−):2× SSC
10 min
68°C
3
1:3 hyb(−):2× SSC
10 min
68°C
4
2× SSC
10 min
68°C
5
0.2× SSC
30 min
68°C
6
0.2× SSC
30 min
68°C
7
3:1 0.2× SSC:PBST
5 min
22°C
8
1:1 0.2× SSC:PBST
5 min
22°C
9
1:3 0.2× SSC:PBST
5 min
22°C
10
Blocking solution
2h
22°C
11
Antibody solution
2h
22°C
12
PBST
10 min
22°C
13
PBST
10 min
22°C
14
PBST
4h
4°C
15
PBST
4h
4°C
16
PBST
4h
4°C
17
PBST
4h
4°C
18
PBST
10 min
22°C
19
PBST
10 min
22°C
20
PBST
4h
22°C
21
NTMT
10 min
22°C
22
NTMT
10 min
22°C
23
NTMT
10 min
22°C
Embryos can remain in PBST to be photographed using a light microscope and camera either as separate wells of the mesh plate (Fig. 2) or as individual embryos on the lid of petri dish. The embryos can be stored within the plate in PBST at 4°C for several weeks, although the color of the staining will fade over time.
326
Yeh and Munson
Fig. 2. The gata1 staining in the positive and negative control embryos. Strong staining of gata1 probe appears in the ICM region of the heat-treated wild-type embryos (a) but not the heat-treated Tg (hsp:AML1-ETO) embryos (b). Five embryos were arrayed into each well of the screening plate. The gata1 staining was performed as described in the Methods
4. Notes 1. In this experiment, we use Tg(hsp:AML1-ETO) zebrafish to identify chemical modifiers of AML1-ETO function. Other lines of zebrafish may be used for different experimental designs. 2. The use of dividers ensures the synchrony of embryo stages, which is crucial to this experiment. Transferring embryos from 28.5 and 24°C slows down the embryonic development, so that they will be at the desired stage on the next day. 3. The chemical libraries should be aliquoted into several copies to prevent frequent freeze–thaw cycles. 4. In general, it takes about 15–30 min to dechorionate embryos with pronase. Prolonged incubation with pronase or insufficient rinsing after pronase incubation will cause destruction of the embryo, as evidenced by disintegration of the embryo during later steps of the in situ hybridization protocol. Once dechorionated, embryos are fragile and have a tendency to stick to dry plastic surface. Handle with care. 5. If the solution does not flow through the mesh right away, suck the solution back up with the multichannel pipette and expel the solution again. Once the mesh is wet, the solution should flow through easily. 6. To transfer embryos without increasing the volume of the solution in each well, simply hold the dial on the pump (to prevent expelling the solution) and gently tap the tip of the glass pipette in the solution of each well. The embryos will naturally come out of the glass pipette and sink into the well.
Zebrafish Small Molecule Screen in Reprogramming/Cell Fate Modulation
327
7. The volume of the chemical libraries to use is determined by the concentrations of the compound stocks and the desired effective dose range. We performed this screen at 20 mM concentration. Compounds may be added using a multichannel pipette or a 96-pin transfer device. If using a pin transfer device, the device should be cleaned between different compound plates. This is done by dipping the pins into a DMSO bath and an ethanol bath, and by briefly flaming the device to remove any residual solution. 8. The quality of the RNA probe synthesized may be monitored on a denaturing agarose gel. The yield of the RNA probe may be quantified using a spectrophotometer. We typically obtain around 10–20 mg per 40-ml reaction. 9. The steps from rehydration to hybridization may also be done using BioLane™ HTI. However, the volumes of the solutions required for each step will need to scale up to 80 ml per plate. In addition, all solutions containing Tween-20 should not be stored for long-term use. Stocks may be stored for long term without Tween-20. 10. All of the following steps may also be done manually by changing the solutions in the reservoir tray.
Acknowledgments The authors would like to thank Dr. Randall T. Peterson for his advice and support during the development of this project. J.-R. J. Yeh is supported by a Career Development Award (AG031300) from the National Institute of Aging. This work was supported by RO1 CA118498 and the Claflin Distinguished Scholar Award. References 1. Davison, A. J. and Zon, L. I. (2004) The ‘definitive’ (and ‘primitive’) guide to zebrafish hematopoiesis. Oncogene 23, 7233–7246. 2. Yeh, J.-R. J., Munson, K. M., Chao, Y. L., Peterson, Q. P., MacRae, C. A., Peterson, R. T. (2008) AML1-ETO reprograms hematopoietic cell fate by downregulating scl expression. Development 135, 401–410. 3. Yeh, J.-R. J., Munson, K. M., Elabgib, K. E., Goldfarb, A. N., Sweetser, D. A., Peterson,
R. T. (2009) Discovering chemical modifiers of oncogene-regulated hematopoietic differentiation. Nat. Chem. Biol. 5, 236 –243. 4. Detrich, H. W., Kieran, M. W., Chan, F. Y., Barone, L. M., Yee, K., Rundstadler, J. A., Pratt, S., Ransom, D., Zon, L. I. (1995) Intraembryonic hematopoietic cell migration during vertebrate development. PNAS 92, 10713–10717.
INDEX
A Adult cell reprogramming adenovirus propagation Ad-Easy ..................................................... 265–266 first generation recombinant ...................... 264–265 helper-dependent adenoviral vectors ................. 264 materials .............................................255, 257–258 viral particle titration, TCID50 methods ............................................... 266–267 C-peptide materials .................................................... 260–261 methods ............................................................. 278 secretion ..................................................... 278–279 DNase treatment materials ............................................................ 258 methods ............................................................. 272 glucose regulated secretion............................... 260–261 immunofluorescence analyses materials ............................................................ 260 methods ..................................................... 276–277 insulin materials .................................................... 260–261 methods ..................................................... 277–278 secretion ..................................................... 278–279 liver cells isolation ..................................................... 252–253 primary cultures ......................................... 253–255 RNA isolation, TRI reagent .............................. 258 luciferase assay ......................................................... 258 pancreatic differentiation factor ....................... 251–252 pancreatic lineage activation, in vitro ectopic insulin promoter ............................ 269–271 efficiency .................................................... 267–269 implantation kidney capsule .............................. 280 molecular analyses, quantitative TR-PCR.............................................. 271–274 transplantation ................................................... 279 quantitative RT-PCR analysis SYBR® Green .............................258–259, 273–274 TaqMan® probes ........................................ 259, 274 reverse transcriptase reaction ................................... 258 RIA analyses ............................................................ 278 SCID–NOD mice diabetes induction ...................................... 279–280 hyperglycemia amelioration ............................... 261
Western blot analysis materials .................................................... 259–260 methods ..................................................... 275–278 AML1-ETO expression, zebrafish chemical suppressor screen ...................................... 318 gata1 expression ............................................... 317–318 hematopoietic cell fate modulation (see Zebrafish)
B B cell reprogramming ................................................... 220. See also Committed lymphoid cells anti-IL7Ra antibody ....................................... 241, 242 dedifferentiation experiment.................................... 242 efficiency.................................................................. 245 FACS... .................................................................... 243 iPS cells ................................................................... 234 lineage ectopic expression .............................................. 234 transcription factor loss .............................. 234–235 lymph node suspensions .......................................... 245 macrophage differentiation ...................................... 244 materials .......................................................... 240–241 nuclear transfer ........................................................ 234 PBS cells .................................................................. 246 plasticity normal development .................................. 235–237 Pax5-dependent ......................................... 239–240 tumoral ...................................................... 237–238 T cell contamination................................................ 245 V(D)J recombination analysis .......................... 246–247
C Cell fusion-induced reprogramming cell culture ES cell................................................................ 183 materials .................................................... 181–182 MEFs preparation ..................................... 184–185 NSCs preparation ...................................... 183–184 cell fusion materials ............................................................ 182 schematic illustration ................................. 180, 185 freezing materials ............................................................ 183 methods ............................................................. 188
329
CELLULAR PROGRAMMING AND REPROGRAMMING 330 Index Cell fusion-induced reprogramming (Continued) fusion hybrid cells drug selection ..................................................... 186 materials ............................................................ 182 Oct4-GFP-positive cells, FACS sorting ....................................... 186–188 thawing materials ............................................................ 183 methods ............................................................. 188 Chemoinformatics ................................................. 311–312 Committed lymphoid cells cell isolation, bone marrow/thymus B cell ...........................................221–222, 224–225 lineage tracer mice ..................................... 221, 224 T-cell ..................................................222, 225–226 cell line transfection, retrovirus vector ecotropic retroviral supernatant production............................................ 223–224 materials .................................................... 220–221 infected cell analysis antibody labeling................................................ 228 data analysis ............................................... 228, 230 fluorescence microscopy......................223, 227–230 multicolor flow cytometry...................223, 227–230 primary cell infection coculture, stromal cells ............................... 223, 227 retroviruses..........................................222, 226–227 synergistic and antagonistic transcription factor interactions .................................................. 230 Competitive repopulation assay ....................................... 48
D Developmental redirection. See Adult cell reprogramming
E Embryonic stem (ES) cells cell culture cell freezing .......................................................... 95 flat culture ............................................................ 88 gelatin coating ..................................................... 94 mesoderm cells differentiation ....................... 88–89 passage ........................................................... 94–95 thawing ................................................................ 94 cell fusion-induced reprogramming ..........181–182, 183 cell lines ..................................................................... 89 cell maintenance .................................................. 89–91 ES cell-derived mesoderm cell bone cell differentiation ....................................... 92 cartilage cell differentiation ................................. 93 endothelial cell differentiation ............................. 93 hematopoietic cell differentiation ........................ 93 mesoderm cells Alcian blue staining ............................................. 99 Alizarin red staining ............................................ 98
bone cell induction............................................... 98 cartilage cells induction.................................. 98–99 embryo ........................................................... 87–88 hematopoietic cells induction ...................... 99–100 purification .................................................... 91–92 OP9 stromal cell maintenance......................................................... 91 passage ........................................................... 95–96 storing .................................................................. 96 thawing ................................................................ 95 in vitro ES cell differentiation mesoderm cells induction .............................. 96–97 mesoderm cells purification ........................... 97–98 OP9 stromal cell .................................................. 91 Epiblast stem cells (EpiSCs) characterization DNA contamination ............................................ 43 Oct3/4 luciferase reporter assay ............... 30, 38–39 RNA extraction ............................................. 29, 36 semiquantitative RT-PCR ..................29–30, 36–37 target cDNA detection .................................. 37–38 culture antibiotics ............................................................ 40 cryopreservation ................................................... 35 materials .............................................................. 29 primary epiblast outgrowth passage ............... 33–34 routine passaging ........................................... 34–35 thawing ................................................................ 35 epiblast isolation 5.5 dpc postimplantation mouse embryos............ 33 materials ........................................................ 28–29 plating and culture ............................................... 33 tissue separation ................................................... 33 mouse embryonic fibroblasts feezing ................................................................. 32 isolation ......................................................... 30–31 materials ........................................................ 27–28 mtotic iactivation ................................................. 32 passaging.............................................................. 31 tawing .................................................................. 32 Eye field induction eye field transcription factors (EFTFs) ................... 141 retinal progenitor cell generation, hES cell (see Retinal progenitor cell generation) schematics........................................................ 140–141 Wnt signal inhibition .............................................. 141
F Fluorescence-activated cell sorting (FACS) B cell reprogramming .............................................. 243 cell fusion-induced reprogramming ................. 186–188 hematopoietic stem cells (HSCs) self renewal .................................................... 47 MAPC........................................................... 57–58, 70
CELLULAR PROGRAMMING AND REPROGRAMMING 331 Index multipotent adult progenitor cells.................. 57–58, 70 T cell reprogramming .............................................. 229 TRA-1-60 expression analysis ................................. 199
H Hematopoietic stem cells (HSCs) screening, zebrafish bleaching ......................................................... 305, 308 chemical libraries and screen BCIP and NBT ................................................. 314 biologically active compounds ........................... 304 chemical concentration .............................. 314–315 commercial libraries ........................................... 305 functional libraries ............................................. 304 method .............................................................. 307 natural product libraries ..................................... 304 pooling strategy ................................................. 315 positive and negative control.............................. 314 dechorionation ..........................................305, 307–308 DIG staining materials ............................................................ 306 embryo fixation materials ............................................................ 305 method .............................................................. 308 embryo preparation materials .................................................... 303–304 method ...................................................... 306–307 observation and photography........................... 306, 311 probe preparation......................................306, 310–311 pronase..................................................................... 313 proteinase K treatment .....................305, 308–309, 313 rehydration ...................................................... 305, 308 in situ hybridization Biolane HTI robot..................................... 312–313 materials .................................................... 305–306 Hematopoietic stem cells (HSCs) self renewal competitive repopulation assay .................................. 48 engraftment evaluation ........................................ 51–52 functional assays ........................................................ 47 limiting-dilution assay ............................................... 48 long-term repopulation assay ..................................... 47 phenotypic identification enrichment........................................................... 46 FACS analysis ...................................................... 47 long-term reconstituting HSCs (LT-HSC) ......... 46 short-term reconstituting HSCs (ST-HSC)........ 46 reagents/equipment ................................................... 50 recipient mice materials .............................................................. 50 preparation........................................................... 51 serial transplantation assay positive and negative engraftment threshold ....... 49 recipients choice and treatment ..................... 48–49 test and competitor cells ...................................... 48 transplantation time ............................................. 49
test cells donor mice ........................................................... 50 preparation........................................................... 51 transplantation ........................................................... 51 Human embryonic stem cells (hESCs). See also Embryonic stem (ES) cells culture.. ...................................................................... 12 MEF-conditioned hESC medium ................ 10–11 MEF medium .................................................. 9–10 mTeSR1 medium........................................... 11–12 derivation blastocyst culture.................................................... 6 embryo thawing ................................................. 5–6 hESC cell propagation....................................... 8–9 inner cell mass isolation ..................................... 7–8 MEF-coated plate preparation .......................... 6–7 primary culture, ICM ............................................ 8 erythrocyte generation ............................................. 106 erythropoiesis........................................................... 107 globin chain, immunostaining ................................. 107 hemangioblast generation ................................ 107–108 iPS Cells .................................................................. 193 materials reagents .............................................................. 2–4 supplies .................................................................. 5 pluripotency markers, immunostaining ..................... 13 red blood cell differentiation blast cell growth and expansion ................. 109–110 embryoid body (EB) formation ......................... 109 erythroid enucleation ......................................... 110 hESC culture ............................................. 108–109 hESC quality ..................................................... 119 PMEF feeder ..................................................... 110 red blood cells (RBCs)............................................. 106 retinal cell generation (see Retinal progenitor cell generation) spinal cord motoneuron differentiation antibodies........................................................... 127 culture substrate preparation ...................... 127–128 media ................................................................. 127 NE cells generation ........................................... 125 neural induction phase ............................... 124–125 neuroepithelial cell induction..................... 129–131 Olig2-expressing progenitor induction ......124, 125, 131–132 scheme ....................................................... 124–125 stock solutions ........................................... 125–127 trophoblast differentiation BMP4-treated hESCs ......................................... 20 induced trophoblast characterization ............. 21–22 syncytial trophoblast induction ............................ 21 trophoblast induction..................................... 19–20 validation and quality control .................................... 19 alkaline phosphatase detection............................. 12
CELLULAR PROGRAMMING AND REPROGRAMMING 332 Index Human embryonic stem cells (hESCs) (Continued) cell surface marker detection .......................... 12–14 embryoid body formation ........................ 14–15, 16 nuclear marker detection ..................................... 14 teratoma formation ........................................ 15–18 Human induced pluripotent stem cells (hiPSCS) cell culture ....................................................... 294–295 cell transduction....................................................... 295 cytochemistry .......................................................... 295 immunofluorescence ................................................ 295 lentiviral package ..................................................... 298 mouse ES cell like hiPSCS culture ........................................................ 298–299 pluripotency ....................................................... 299 target cell transduction ............................................ 298 teratoma assay .......................................................... 295 viral package ............................................................ 295
I Induced pluripotent stem cells (iPSCS) basic reprogramming procedure cell derivation protocol ...................................... 196 MEF feeder cells........................................ 197, 198 OSK................................................................... 198 OSKM ....................................................... 197–198 TRA-1-60 expression analysis ........................... 199 B cells reprogramming ............................................. 234 cell culture media preparation .................................. 193 clone expansion and characterization .............. 201–203 colony identification and picking..................... 200–201 human induced pluripotent stem cell generation (see Human induced pluripotent stem cells (hiPSCS)) rat induced pluripotent stem cell generation (see Rat induced pluripotent stem cells (riPSCs) generation) retrovirus production ..........................................193, 194–195 usage .................................................................. 195 somatic cells alkaline phosphatase detection kit ..................... 211 blocking buffer composition .............................. 211 cell culture.................................................. 209–210 compounds ........................................................ 210 2× freezing media............................................... 210 MEF derivation ..................................209, 211–212 mES cell media .................................................. 210 observation ................................................ 214–215 Plat-E cell media ............................................... 210 pluripotency status ..................................... 215–217 primary antibodies ............................................. 211 retroviruses production .......................210, 213–214 secondary antibodies .......................................... 211 transduction ....................................................... 214 tissue culture .................................................... 192–193
K Karyotype analysis ......................................................... 202
L Leukemia inhibitory factor (LIF) .......................... 293–294 Long-term reconstituting HSCs (LT-HSC) ................... 46 Long-term repopulation assay ......................................... 47 Lymphoid cell reprogramming. See Committed lymphoid cells
M Mesoderm cell development embryo ................................................................. 87–88 ES cell-derived mesoderm cells bone cell differentiation ....................................... 92 cartilage cell differentiation ................................. 93 endothelial cell differentiation ............................. 93 hematopoietic cell differentiation ........................ 93 in vitro ES cell culture cell lines ............................................................... 89 cell maintenance ............................................ 89–91 cell passage..................................................... 94–95 cell purification ...................................91–92, 97–98 flat culture ............................................................ 88 freezing ................................................................ 95 gelatin coating ..................................................... 94 mesoderm cell induction, OP9 cells............... 96–97 mesoderm differentiation............................... 88–89 OP9 stromal cell maintenance ................. 91, 95–96 thawing ................................................................ 94 Mouse embryonic fibroblasts (MEFs) cell fusion-induced reprogramming .....................181–182, 184–185 human embryonic stem cells (hESCs) derivation ........................................................... 6–7 MEF-conditioned hESC medium ................ 10–11 MEF medium .................................................. 9–10 red blood cell differentiation .............................. 110 induced pluripotent stem cells derivation ............................................209, 211–212 feeder cells ..........................................193, 197, 198 transduction ....................................................... 214 neural epithelial cell differentiation ................. 129–130 red blood cell differentiation, hESC ................ 110, 118 Multipotent adult progenitor cells (MAPCs) differentiation capacity ........................................ 55–56 flow cytometry ..................................................... 61, 70 G-banding materials .............................................................. 63 method .......................................................... 73–74 immunocytochemistry materials .............................................................. 62 method ................................................................ 71
CELLULAR PROGRAMMING AND REPROGRAMMING 333 Index maintenance culture freezing .......................................................... 66–67 MAPC lines passaging ........................................ 66 MAPC thawing ................................................... 66 wells and dishes coating ....................................... 66 multilineage differentiation capacity endothelial differentiation.............................. 62, 72 hepatocyte differentiation .............................. 62, 72 neuroectoderm differentiation ................. 62, 72–73 mycoplasma contamination screening ....................... 74 pluripotent markers, mRNA expression cDNA preparation ......................................... 68–69 cell lysate preparation .......................................... 67 DNAse treatment ................................................ 68 materials .............................................................. 60 total RNA isolation, Mini kit ........................ 67–68 rat MAPC isolation bone marrow aspiration ......................59–60, 63–64 column depletion, CD45+ population ........... 64–65 high-density culture ................................. 59–60, 64 potential MAPC clone screening ........................ 65 subcloning...................................................... 65, 75 rat MAPC lines cell expansion curve ............................................. 57 cell morphology ................................................... 56 characterization ................................................... 58 directed differentiation ........................................ 59 gene expression profile ......................................... 58 isolation ......................................................... 56–59
N Neural epithelial cell differentiation antibodies ................................................................ 127 culture substrate preparation ............................ 127–128 media... .................................................................... 127 NE cell induction aggregate formation ........................................... 130 hESC colony lifting, MEF feeder cells ...... 129–130 primitive cell differentiation ...................... 130–131 neuroepithelial sphere passaging polished pasteur pipette ............................. 133–134 splitting, ACCUTASE ...................................... 134 Olig2-expressing motoneuron progenitors ...... 131–132 spinal motor neurons generation .......................................................... 132 maturation ......................................................... 133 stock solutions ................................................. 125–127
P Pancreatic cells pancreatic lineage activation, liver (see Adult cell reprogramming) transdifferentiation antibodies........................................................... 288
AR42J-B13 cells ........................................ 287, 289 ATCC................................................................ 290 culture medium .................................................. 287 Dex treatment .................................................... 289 RU-486.............................................................. 291 transdifferentiation .................................... 286, 288
R Rat induced pluripotent stem cells (riPSCs) generation cell culture materials .................................................... 294–295 method ...................................................... 296–297 cytochemistry .......................................................... 295 immunofluorescence ................................................ 295 pluripotency ..................................................... 297–298 teratoma assay .......................................................... 295 viral package ............................................................ 295 viral package and cell transduction materials ............................................................ 295 method .............................................................. 296 Recombinant human platelet-derived growth factor (PDGF-BB) .................................................. 59 Red blood cell differentiation, hESC blast cell growth and expansion materials .................................................... 109–110 method ...................................................... 111–114 embryoid body (EB) formation ............................... 109 erythroid cell differentiation ............................................ 114–115 enucleation..........................................110, 116–117 maturation ................................................. 115–116 hESC culture materials .................................................... 108–109 methylcellulose .................................................. 119 splitting .............................................................. 111 thawing ...................................................... 110–111 trypsin/EDTA passaging ................................... 118 primary mouse embryo fibroblasts (PMEF) feeder mitomycin C ...................................................... 118 preparation......................................................... 110 Retinal progenitor cell generation adherent cell coating materials ............................................................ 142 method .............................................................. 144 hES cell-derived retinal cells, notch pathway materials ............................................................ 143 method .............................................................. 150 quantitative PCR materials ............................................................ 143 method ...................................................... 146–148 primers ............................................................... 148 retinal determination analysis fluorescent immunocytochemistry ............. 143, 149 quantitative RT-PCR .........................143, 146–148
CELLULAR PROGRAMMING AND REPROGRAMMING 334 Index Retinal progenitor cell generation (Continued) subretinal transplantation, retinal cells materials ............................................................ 143 method ...................................................... 151–152 undifferentiated hESC culture materials .................................................... 141–142 method .............................................................. 144 retinal cell generation......................................... 142
S Serial transplantation assay positive and negative engraftment threshold ............. 49 recipients choice and treatment ........................... 48–49 test and competitor cells ............................................ 48 transplantation time................................................... 49 Short-term reconstituting HSCs (ST-HSC)................... 46 Simplified Molecular Input Line Entry Specification (SMILES) format ........................................ 311 Somatic cell nuclear transfer (SCNT) embryo culture ................................................. 173–174 equipment electrofusion generator....................................... 158 inverted fluorescent microscope ......................... 157 microdispensers ................................................. 158 micro forge and grinder ..................................... 158 microinjectors .................................................... 158 micromanipulation setup ........................... 157–158 micropipette preparation enucleation pipettes ................................... 163–165 materials ............................................................ 159 pipette holding........................................... 162–163 transfer pipettes ......................................... 165–166 nuclear transfer cell transfer ................................................ 171, 172 culture dishes preparation .................................. 166 fusion chamber .................................................. 174 manipulation chamber and tool setup ........ 167–168 materials ............................................................ 159 oocyte activation ................................................ 173 oocyte-cell fusion ....................................... 171–173 oocyte enucleation ..................................... 168–170 recipient oocyte preparation....................... 166–167 oocyte collection and maturation aspiration assembly ............................................ 161 materials .................................................... 158–159
method ...................................................... 159–161 oocyte location, HH medium ............................ 174 sperm-induced oocyte activation ............................. 175 Sybr Green dye ................................................................ 76
T Teratoma formation, iPS cells ............................... 202–203 T lymphocyte reprogramming ...................................... 220. See also Committed lymphoid cells Trophoblast differentiation. See also Human embryonic stem cells (hESCs) BMP4-treated hESCs ............................................... 20 trophoblast induction characterization ............................................. 21–22 method .......................................................... 19–20 syncytial trophoblast ............................................ 21
Z Zebrafish chemical screens .............................................. 302–303 chemoinformatics ............................................ 311–312 definitive/adult wave hematopoiesis ........................ 302 hematopoiesis .................................................. 301–302 hematopoietic cell fate modulation, AML1-ETO antisense RNA probe, digoxigenin labeling 322–323 chemical administeration ........................... 321–322 embryo arraying ......................................... 321–322 embryo fixation .................................................. 322 heat-shock treatment ......................................... 322 materials .................................................... 319–320 whole-mount in situ hybridization ............ 323–326 zebrafish embryo collection ............................... 321 HSC screening, chemical effect bleaching.................................................... 305, 308 chemical libraries and screen...............304–305, 307 dechorionation ....................................305, 307–308 DIG staining ......................................306, 309–310 embryo fixation .......................................... 305, 308 embryo preparation .....................303–304, 306–307 hybridization.......................................305–306, 307 observation and photography..................... 306, 311 probe preparation ................................306, 310–311 proteinase K treatment .......................305, 308–309 rehydration................................................. 305, 308 primitive/embryonic hematopoiesis ......................... 302