Cell Cycle Oscillators: Methods and Protocols 1493929569, 9781493929566
This volume brings together a unique collection of protocols that cover standard, novel, and specialized techniques. C
299 50 8MB
English Pages xii+352 Year 2015
Front Matter....Pages i-xii
Front Matter....Pages 1-1
Front Matter....Pages 3-19
Front Matter....Pages 21-57
Back Matter....Pages 59-70
....Pages 71-88
Recommend Papers


![Stem Cell Renewal and Cell-Cell Communication: Methods and Protocols (Methods in Molecular Biology, 2346) [2nd ed. 2021]
1071615696, 9781071615690](https://ebin.pub/img/200x200/stem-cell-renewal-and-cell-cell-communication-methods-and-protocols-methods-in-molecular-biology-2346-2nd-ed-2021-1071615696-9781071615690.jpg)


- Author / Uploaded
- Amanda S. Coutts
- Louise Weston
File loading please wait...
Citation preview
Methods in Molecular Biology 1342
Amanda S. Coutts Louise Weston Editors
Cell Cycle Oscillators Methods and Protocols
METHODS
IN
MOLECULAR BIOLOGY
Series Editor John M. Walker School of Life and Medical Sciences University of Hertfordshire Hatfield, Hertfordshire, AL10 9AB, UK
For further volumes: http://www.springer.com/series/7651
Cell Cycle Oscillators Methods and Protocols
Edited by
Amanda S. Coutts Department of Oncology, University of Oxford, Oxford, UK
Louise Weston Scientific writer, London, UK
Editors Amanda S. Coutts Department of Oncology University of Oxford Oxford, UK
Louise Weston Scientific writer London, UK
ISSN 1064-3745 ISSN 1940-6029 (electronic) Methods in Molecular Biology ISBN 978-1-4939-2956-6 ISBN 978-1-4939-2957-3 (eBook) DOI 10.1007/978-1-4939-2957-3 Library of Congress Control Number: 2015945586 Springer New York Heidelberg Dordrecht London © Springer Science+Business Media New York 2016 This work is subject to copyright. All rights are reserved by the Publisher, whether the whole or part of the material is concerned, specifically the rights of translation, reprinting, reuse of illustrations, recitation, broadcasting, reproduction on microfilms or in any other physical way, and transmission or information storage and retrieval, electronic adaptation, computer software, or by similar or dissimilar methodology now known or hereafter developed. The use of general descriptive names, registered names, trademarks, service marks, etc. in this publication does not imply, even in the absence of a specific statement, that such names are exempt from the relevant protective laws and regulations and therefore free for general use. The publisher, the authors and the editors are safe to assume that the advice and information in this book are believed to be true and accurate at the date of publication. Neither the publisher nor the authors or the editors give a warranty, express or implied, with respect to the material contained herein or for any errors or omissions that may have been made. Printed on acid-free paper Humana Press is a brand of Springer Springer Science+Business Media LLC New York is part of Springer Science+Business Media (www.springer.com)
Preface In order to multiply, all cells must go through a series of highly regulated and ordered events in order to complete a cell division cycle, or cell cycle. Understanding the dynamic interaction of small molecules, genes, and proteins that facilitate such a sophisticated biological process remains a challenging scientific problem. Oscillatory networks underlie the cycle of cell division, a process that in addition to driving both reproduction and the development of living systems also facilitates proliferative diseases and cancer. In Cell Cycle Oscillators, expert researchers discuss recent progress in the field from both holistic and reductionist perspectives. Moreover, they provide the latest developments in molecular biology techniques, biochemistry, and computational analysis used for studying oscillatory networks. Written in the highly successful Methods in Molecular Biology series format, chapters include introductions to their respective topics, lists of the necessary materials and reagents, step-by-step, readily reproducible laboratory protocols, and key tips on troubleshooting and avoiding known pitfalls. We hope you will agree that this book brings together a unique collection of protocols that cover standard, as well as novel and more specialized, techniques. Because of this range, the protocols will be useful for those new to the field as well as the more experienced scientist. Importantly, we hope these techniques will be used to gain further insight into the complex and incompletely understood processes that are involved in the cell cycle and its regulation by oscillatory networks. Lastly, we would also like to thank all the authors for their excellent contributions, John Walker for his expert advice and assistance, and Springer Press for all their efforts. Oxford, UK London, UK
Amanda S. Coutts Louise Weston
v
Contents Preface. . . . . . . . . . . . . . . . . . . . . . . . . . . . . . . . . . . . . . . . . . . . . . . . . . . . . . . . . . Contributors . . . . . . . . . . . . . . . . . . . . . . . . . . . . . . . . . . . . . . . . . . . . . . . . . . . . . . . . . .
PART I
REVIEWS
1 Cell Cycle Control: A System of Interlinking Oscillators . . . . . . . . . . . . . . . . . Randy Y.C. Poon 2 Model Organisms for Studying the Cell Cycle . . . . . . . . . . . . . . . . . . . . . . . . . Zhaohua Tang 3 Role of Computational Modeling in Understanding Cell Cycle Oscillators . . . Attila Csikász-Nagy and Ivan Mura 4 E2F Transcription Factors Control the Roller Coaster Ride of Cell Cycle Gene Expression. . . . . . . . . . . . . . . . . . . . . . . . . . . . . . . . . . . . . Ingrid Thurlings and Alain de Bruin
PART II
v ix
3 21 59
71
METHODS
5 Cell Synchronization of Mouse Embryonic Fibroblasts . . . . . . . . . . . . . . . . . . Michael J. Thwaites, Courtney H. Coschi, Christian E. Isaac, and Frederick A. Dick 6 Cell Cycle Synchronization in Xenopus Egg Extracts . . . . . . . . . . . . . . . . . . . . Peter J. Gillespie, Julia Neusiedler, Kevin Creavin, Gaganmeet Singh Chadha, and J. Julian Blow 7 Elutriation for Cell Cycle Synchronization in Fission Yeast. . . . . . . . . . . . . . . . Kazunori Kume 8 Spatiotemporal Investigation of Phosphorylation Events During Cell Cycle Progression . . . . . . . . . . . . . . . . . . . . . . . . . . . . . . . . . . . . Lilia Gheghiani and Olivier Gavet 9 Cell Cycle Dynamics of Proteins and Post-translational Modifications Using Quantitative Immunofluorescence. . . . . . . . . . . . . . . . . . . . . . . . . . . . . Karen Akopyan, Arne Lindqvist, and Erik Müllers 10 Building a Synthetic Transcriptional Oscillator . . . . . . . . . . . . . . . . . . . . . . . . Matthaeus Schwarz-Schilling, Jongmin Kim, Christian Cuba, Maximilian Weitz, Elisa Franco, and Friedrich C. Simmel 11 The Use of SNAP Labeling to Study Cell Cycle Oscillatory Proteins . . . . . . . . Christine Greil, Marie Follo, Monika Engelhardt, and Ralph Wäsch 12 A Computational Method for Identifying Yeast Cell Cycle Transcription Factors . . . . . . . . . . . . . . . . . . . . . . . . . . . . . . . . . . . . . . . . . . . Wei-Sheng Wu
vii
91
101
149
157
173 185
201
209
viii
Contents
13 Measuring Activity and Specificity of Protein Phosphatases . . . . . . . . . . . . . . . Brendan L. Powers, Michael Melesse, Christie L. Eissler, Harry Charbonneau, and Mark C. Hall 14 Combining the Optimized Yeast Cytosine Deaminase Protein Fragment Complementation Assay and an In Vitro Cdk1 Targeting Assay to Study the Regulation of the γ-Tubulin Complex . . . . . . . . . . . . . . . . Po Hien Ear, Jacqueline Kowarzyk, Michael J. Booth, Diala Abd-Rabbo, Kristian Shulist, Conrad Hall, Jackie Vogel, and Stephen W. Michnick 15 Cell Cycle Synchronization Using a Microfluidic Synchronizer for Fission Yeast Cells . . . . . . . . . . . . . . . . . . . . . . . . . . . . . . . . . . . . . . . . . . . Shujing Wang and Chunxiong Luo 16 Detection of Protein–Protein Interactions in Tobacco BY-2 Cells Using Bimolecular Fluorescence Complementation . . . . . . . . . . . . . . . . . . . . . Gemma S. Puts and Natasha Spadafora 17 Tracking the Cyclin B1-GFP Sensor to Profile the Pattern of Mitosis Versus Mitotic Bypass . . . . . . . . . . . . . . . . . . . . . . . . . . . . . . . . . . . Victoria Griesdoorn, M. Rowan Brown, Marie Wiltshire, Paul J. Smith, and Rachel J. Errington 18 Measuring APC/C-Dependent Ubiquitylation In Vitro . . . . . . . . . . . . . . . . . Marc A. Jarvis, Nicholas G. Brown, Edmond R. Watson, Ryan VanderLinden, Brenda A. Schulman, and Jan-Michael Peters 19 Using the Fly-FUCCI System for the Live Analysis of Cell Cycle Dynamics in Cultured Drosophila Cells . . . . . . . . . . . . . . . . . . . . . . . . . . . . . . N. Zielke, M. van Straaten, J. Bohlen, and B.A. Edgar 20 Imaging Cell Cycle Phases and Transitions of Living Cells from Yeast to Woman . . . . . . . . . . . . . . . . . . . . . . . . . . . . . . . . . . . . . . . . . . . Hadas Segev, Drora Zenvirth, Kobi J. Simpson-Lavy, Naomi Melamed-Book, and Michael Brandeis 21 Measurement of Cdk1/Cyclin B Kinase Activity by Specific Antibodies and Western Blotting . . . . . . . . . . . . . . . . . . . . . . . . . . . . . . . . . . . . . . . . . . . Cody W. Lewis, Ryan G. Taylor, and Roy M. Golsteyn
221
Index . . . . . . . . . . . . . . . . . . . . . . . . . . . . . . . . . . . . . . . . . . . . . . . . . . . . . . . . . . . . . . .
349
237
259
269
279
287
305
321
337
Contributors DIALA ABD-RABBO • Département de Biochimie, Université de Montréal, Succursale Centre-Ville, Montréal, QC, Canada; Centre Robert-Cedergren, Bio-Informatique et Génomique, Université de Montréal, Succursale Centre-Ville, Montréal, QC, Canada KAREN AKOPYAN • Department of Cell and Molecular Biology, Karolinska Institutet, Stockholm, Sweden J. JULIAN BLOW • Centre for Gene Regulation & Expression, University of Dundee, Dundee, UK J. BOHLEN • German Cancer Research Center (Deutsches Krebsforschungszentrum; DKFZ), Heidelberg, Germany; Center for Molecular Biology of Heidelberg University (Zentrum für Molekulare Biologie der Universität Heidelberg; ZMBH), Heidelberg, Germany MICHAEL J. BOOTH • Département de Biochimie, Université de Montréal, Succursale Centre-Ville, Montréal, QC, Canada; Merton College, University of Oxford, Oxford, UK MICHAEL BRANDEIS • The Department of Genetics and The Bio-Imaging Unit, The Hebrew University of Jerusalem, Jerusalem, Israel NICHOLAS G. BROWN • Department of Structural Biology, St Jude Children’s Research Hospital, Memphis, TN, USA M. ROWAN BROWN • College of Engineering, Swansea University, Swansea, UK ALAIN DE BRUIN • Department of Pathobiology, Faculty of Veterinary Medicine, Utrecht University, Utrecht, The Netherlands; Division of Molecular Genetics, Department of Pediatrics, University Medical Center Groningen, Groningen, The Netherlands GAGANMEET SINGH CHADHA • Centre for Gene Regulation & Expression, University of Dundee, Dundee, UK HARRY CHARBONNEAU • Department of Biochemistry and Center for Cancer Research, Purdue University, West Lafayette, IN, USA COURTNEY H. COSCHI • Department of Biochemistry, London Regional Cancer Program, Children’s Health Research Institute, Western University, London, ON, Canada KEVIN CREAVIN • Centre for Gene Regulation & Expression, University of Dundee, Dundee, UK ATTILA CSIKÁSZ-NAGY • Randall Division of Cell and Molecular Biophysics, King’s College London, Strand, London, UK; Institute for Mathematical and Molecular Biomedicine, King’s College London, London, UK; Department of Computational Biology, Research and Innovation Centre, Fondazione Edmund Mach, San Michele all’Adige, Italy CHRISTIAN CUBA • Department of Mechanical Engineering, University of California, Riverside, Riverside, CA, USA FREDERICK A. DICK • Department of Biochemistry, London Regional Cancer Program, Children’s Health Research Institute, Western University, London, ON, Canada; Cancer Research Labs, London, ON, Canada PO HIEN EAR • Département de Biochimie, Université de Montréal, Succursale Centre-Ville, Montréal, QC, Canada; Department of Genetics, Harvard Medical School, Boston, MA, USA
ix
x
Contributors
B.A. EDGAR • German Cancer Research Center (Deutsches Krebsforschungszentrum; DKFZ), Heidelberg, Germany; Center for Molecular Biology of Heidelberg University (Zentrum für Molekulare Biologie der Universität Heidelberg; ZMBH), Heidelberg, Germany CHRISTIE L. EISSLER • Department of Biochemistry and Center for Cancer Research, Purdue University, West Lafayette, IN, USA MONIKA ENGELHARDT • Department of Hematology, Oncology and Stem Cell Transplantation, University Medical Center, Freiburg, Germany RACHEL J. ERRINGTON • Institute of Cancer and Genetics, School of Medicine, Cardiff University, Cardiff, UK MARIE FOLLO • Core Facility, Department of Hematology, Oncology and Stem Cell Transplantation, University Medical Center, Freiburg, Germany ELISA FRANCO • Department of Mechanical Engineering, University of California, Riverside, Riverside, CA, USA OLIVIER GAVET • Institut Gustave Roussy, UMR 8200 CNRS, Villejuif Cedex, France LILIA GHEGHIANI • Sorbonne Universités, UPMC Paris VI, Paris, France PETER J. GILLESPIE • Centre for Gene Regulation & Expression, University of Dundee, Dundee, UK ROY M. GOLSTEYN • Cancer Cell Laboratory, Department of Biological Sciences, University of Lethbridge, Lethbridge, AB, Canada CHRISTINE GREIL • Department of Hematology, Oncology and Stem Cell Transplantation, University Medical Center, Freiburg, Germany VICTORIA GRIESDOORN • Institute of Cancer and Genetics, School of Medicine, Cardiff University, Cardiff, UK MARK C. HALL • Department of Biochemistry and Center for Cancer Research, Purdue University, West Lafayette, IN, USA CONRAD HALL • Department of Biology, McGill University, Montreal, QC, Canada CHRISTIAN E. ISAAC • Department of Biochemistry, London Regional Cancer Program, Children’s Health Research Institute, Western University, London, ON, Canada MARC A. JARVIS • Research Institute of Molecular Pathology (IMP), Vienna Biocenter (VBC), Vienna, Austria JONGMIN KIM • Wyss Institute for Biologically Inspired Engineering, Harvard University, Boston, MA, USA JACQUELINE KOWARZYK • Département de Biochimie, Université de Montréal, Succursale Centre-Ville, Montréal, QC, Canada KAZUNORI KUME • Department of Molecular Biotechnology, Graduate School of Advanced Sciences of Matter, Hiroshima University, Higashi-Hiroshima, Japan CODY W. LEWIS • Cancer Cell Laboratory, Department of Biological Sciences, University of Lethbridge, Lethbridge, AB, Canada; Department of Oncology, Cross Cancer Institute, University of Alberta, Edmonton, AB, Canada ARNE LINDQVIST • Department of Cell and Molecular Biology, Karolinska Institutet, Stockholm, Sweden CHUNXIONG LUO • The State Key Laboratory for Artificial Microstructures and Mesoscopic Physics, School of Physics, Peking University, Beijing, China; Center for Quantitative Biology, Academy for Advanced Interdisciplinary Studies, Peking University, Beijing, China
Contributors
xi
NAOMI MELAMED-BOOK • The Department of Genetics and The Bio-Imaging Unit, The Hebrew University of Jerusalem, Jerusalem, Israel MICHAEL MELESSE • Department of Biochemistry and Center for Cancer Research, Purdue University, West Lafayette, IN, USA STEPHEN W. MICHNICK • Département de Biochimie, Université de Montréal, Succursale Centre-Ville, Montréal, QC, Canada; Centre Robert-Cedergren, Bio-Informatique et Génomique, Université de Montréal, Succursale Centre-Ville, Montréal, QC, Canada ERIK MÜLLERS • Department of Cell and Molecular Biology, Karolinska Institutet, Stockholm, Sweden IVAN MURA • Faculty of Engineering, EAN University, Bogotá, Colombia JULIA NEUSIEDLER • Centre for Gene Regulation & Expression, University of Dundee, Dundee, UK JAN-MICHAEL PETERS • Research Institute of Molecular Pathology (IMP), Vienna, Austria RANDY Y.C. POON • Division of Life Science, Center for Cancer Research, Hong Kong University of Science and Technology, Clear Water Bay, Hong Kong; State Key Laboratory of Molecular Neuroscience, Hong Kong University of Science and Technology, Clear Water Bay, Hong Kong BRENDAN L. POWERS • Department of Biochemistry and Center for Cancer Research, Purdue University, West Lafayette, IN, USA GEMMA S. PUTS • Department of Biochemistry & Molecular Biology, University of Maryland School of Medicine, Baltimore, MD, USA BRENDA A. SCHULMAN • Department of Structural Biology and Howard Hughes Medical Institute, St Jude Children’s Research Hospital, Memphis, TN, USA MATTHAEUS SCHWARZ-SCHILLING • Systems Biophysics and Bionanotechnology, Physik Department and WSI/ZNN, Technische Universität München, Garching, Germany HADAS SEGEV • The Department of Genetics and The Bio-Imaging Unit, The Hebrew University of Jerusalem, Jerusalem, Israel KRISTIAN SHULIST • Department of Biology, McGill University, Montreal, QC, Canada FRIEDRICH C. SIMMEL • Systems Biophysics and Bionanotechnology, Physik Department and WSI/ZNN, Technische Universität München, Garching, Germany KOBI J. SIMPSON-LAVY • The Department of Genetics and The Bio-Imaging Unit, The Hebrew University of Jerusalem, Jerusalem, Israel PAUL J. SMITH • Institute of Cancer and Genetics, School of Medicine, Cardiff University, Cardiff, UK NATASHA SPADAFORA • School of Biosciences, Cardiff University, Cardiff, UK M. VAN STRAATEN • German Cancer Research Center (Deutsches Krebsforschungszentrum; DKFZ), Heidelberg, Germany; Center for Molecular Biology of Heidelberg University (Zentrum für Molekulare Biologie der Universität Heidelberg; ZMBH), Heidelberg, Germany ZHAOHUA TANG • W.M. Keck Science Center, The Claremont Colleges, Claremont, CA, USA RYAN G. TAYLOR • Cancer Cell Laboratory, Department of Biological Sciences, University of Lethbridge, Lethbridge, AB, Canada INGRID THURLINGS • Department of Pathobiology, Faculty of Veterinary Medicine, Utrecht University, Utrecht, The Netherlands MICHAEL J. THWAITES • Department of Biochemistry, London Regional Cancer Program, Children’s Health Research Institute,Western University, London, ON, Canada
xii
Contributors
RYAN VANDERLINDEN • Department of Structural Biology and Howard Hughes Medical Institute, St Jude Children’s Research Hospital, Memphis, TN, USA JACKIE VOGEL • Department of Biology, McGill University, Montreal, QC, Canada SHUJING WANG • The State Key Laboratory for Artificial Microstructures and Mesoscopic Physics, School of Physics, Peking University, Beijing, China; Center for Quantitative Biology, Academy for Advanced Interdisciplinary Studies, Peking University, Beijing, China RALPH WÄSCH • Department of Hematology, Oncology and Stem Cell Transplantation, University Medical Center, Freiburg, Germany EDMOND R. WATSON • Department of Structural Biology, St Jude Children’s Research Hospital, Memphis, TN, USA MAXIMILIAN WEITZ • Systems Biophysics and Bionanotechnology, Physik Department and WSI/ZNN, Technische Universität München, Garching, Germany MARIE WILTSHIRE • Institute of Cancer and Genetics, School of Medicine,, Cardiff University, Cardiff, UK WEI-SHENG WU • Department of Electrical Engineering, National Cheng Kung University, Tainan City, Taiwan DRORA ZENVIRTH • The Department of Genetics and The Bio-Imaging Unit, The Hebrew University of Jerusalem, Jerusalem, Israel TONGLI ZHANG • Biochemistry Department, University of Oxford, Oxford, UK N. ZIELKE • German Cancer Research Center (Deutsches Krebsforschungszentrum; DKFZ), Heidelberg, Germany; Center for Molecular Biology of Heidelberg University (Zentrum für Molekulare Biologie der Universität Heidelberg; ZMBH), Heidelberg, Germany
Part I Reviews
Chapter 1 Cell Cycle Control: A System of Interlinking Oscillators Randy Y.C. Poon Abstract The cell cycle is the sequence of events through which a cell duplicates its genome, grows, and divides. Key cell cycle transitions are driven by oscillators comprising cyclin-dependent kinases and other kinases. Different cell cycle oscillators are inextricably linked to ensure orderly activation of oscillators. A recurring theme in their regulation is the abundance of auto-amplifying loops that ensure switch-like and unidirectional cell cycle transitions. The periodicity of many cell cycle oscillators is choreographed by inherent mechanisms that promote automatic inactivation, often involving dephosphorylation and ubiquitinmediated protein degradation. These inhibitory signals are subsequently suppressed to enable the next cell cycle to occur. Although the activation and inactivation of cell cycle oscillators are in essence autonomous during the unperturbed cell cycle, a number of checkpoint mechanisms are able to halt the cell cycle until defects are addressed. Together, these mechanisms orchestrate orderly progression of the cell cycle to produce more cells and to safeguard genome integrity. Key words APC/C, Cell division, Cell growth, Checkpoints, Cyclin-dependent kinases, Cyclin, DNA replication, Mitosis, Phosphorylation, pRb, Proteolysis, Ubiquitin-mediated degradation
1
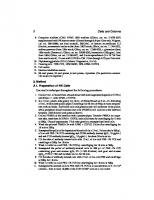
Introduction The cell cycle is the sequence of events through which a cell duplicates its genome, grows, and divides into two daughter cells. It encompasses one of the most fundamental properties of life. The cell cycle is divided into four phases (Fig. 1). After cell division, daughter cells undergo a period of growth (G1) when cellular macromolecules including proteins, RNA, and membranes are synthesized. G1 is followed by a period of DNA synthesis (S). After another period of growth (G2), cells undergo mitosis (M), during which the DNA is divided equally into two daughter cells, cumulating in cytokinesis. Most nondividing cells exit the cell cycle at G1 into quiescence (G0). Progress in the past several decades has revealed that the eukaryotic cell cycle is driven by an evolutionarily conserved engine composed of a family of protein kinases called cyclin-dependent kinases (CDKs). Although the orderly progression of the cell cycle depends
Amanda S. Coutts and Louise Weston (eds.), Cell Cycle Oscillators: Methods and Protocols, Methods in Molecular Biology, vol. 1342, DOI 10.1007/978-1-4939-2957-3_1, © Springer Science+Business Media New York 2016
3
4
Randy Y.C. Poon
CDK1 Cyclin B CDK1
M
Cyclin A
G0
G2
CDK4/6 Cyclin D
G1 R
S
CDK2 Cyclin E CDK2 Cyclin A
Fig. 1 The cell cycle and cyclin–CDK complexes. The cell cycle is divided into four phases: Gap 1 (G1), DNA synthesis (S), Gap 2 (G2), and mitosis (M). Most nondividing mammalian cells exit the cell cycle at G1 into a quiescent state (G0). After passing the restriction point (R), a cell is committed to another round of cell cycle and becomes independent of proliferation stimulants. The cyclin–CDK complexes involved in different periods of the cell cycle are shown
on a number of factors, the sequential switching on and off of different CDKs to promote different stages of the cell cycle remains a good approximation (Fig. 1). Accordingly, the activities of CDKs are stringently regulated by mechanisms including protein–protein interaction, phosphorylation, and ubiquitin-mediated proteolysis. This review summarizes the fundamental concepts of cell cycle oscillators. Although the basic mechanisms of cell cycle control are conserved in all eukaryotic cells, details such as the complexity of protein families involved and checkpoint regulation do vary between organisms and between embryonic and somatic cells. Here the emphasis is placed on the somatic cell cycle of mammalian cells. 1.1 Anatomy of a Cell Cycle Oscillator
The cell cycle is steered by successive waves of cell cycle oscillators. Myriad mechanisms are developed to ensure that cell cycle regulators are turned on and off a timely fashion and in proper order. These oscillators are characterized by several features, including (a) an activating mechanism; (b) an auto-amplifying loop to ensure switchlike cell cycle transitions; an additional kick-starting mechanism may also be involved; (c) an auto-inactivating mechanism that automatically turns off the oscillator; (d) a mechanism to prevent the
Cell Cycle Oscillators Auto-amplifying loop
Activator
Next cell cycle Inhibitor
Activity
Kick-starter
5
Time
Fig. 2 Cell cycle oscillators. Due to the periodic nature of the cell cycle, activating mechanism of a cell cycle oscillator is followed by an inactivating one. The latter then has to be suppressed to enable a subsequent cell cycle. Several features are frequently found in cell cycle oscillators, including (a) an activating mechanism; (b) an auto-amplifying and a kick-starting mechanism; (c) an auto-inactivating mechanism; (d) a mechanism to prevent the reactivation of the oscillator during the same cell cycle; and a way to remove this inhibitory signal during the next cell cycle; as well as (e) a stimulator of the next oscillator in the cell cycle (blue)
reactivation of the oscillator during the same cell cycle; and a way to remove this inhibitory signal during the next cell cycle; and (e) a stimulator of the next oscillator in the cell cycle (Fig. 2). Not all of these features are present in every cell cycle oscillator. Emphasis is placed in the subsequent sections to identify these components in each cell cycle oscillator. 1.2 Checkpoints: Putting a Break on Cell Cycle Oscillators
2
Once passed the restriction point, the cell cycle can be viewed as a succession of autonomous oscillators (see Subheading 2). However, the free running of the cell cycle engine is restrained by surveillance mechanisms termed checkpoints. By temporarily halting the cell cycle, checkpoints ensure that each stage of the cell cycle is completed before the next stage is initiated. In general, checkpoints include a sensor that monitors cell cycle defects, a transducer that transmits and amplifies the signal, and an effector that stop the cell cycle. Several major checkpoints, including those that monitor proper spindle assembly, completion of DNA replication, and DNA damage are discussed here.
Entering the Cell Cycle and G1–S Whether a cell stays in the cell cycle depends on the integration of extracellular signals from cell surface receptors responding to mitogenic growth factors and growth inhibitory factors. This decision
6
Randy Y.C. Poon
Mitogenic cues
G0
M
pRb E2F
G2
CDK4/6 Cyclin D
G1
CDK2
p27
Cyclin E
S
CDK2
R
Cyclin A P
E2F
pRb PP
Fig. 3 Regulation of G1–S. Both the transcription and stability of cyclin D increase when quiescent cells are stimulated to enter the cell cycle by extracellular growth signals. Hyperphosphorylation of pRb by cyclin D– CDK4/6 releases pRb from E2F, allowing E2F to activate transcription. Increased E2F-dependent transcription enables cells to pass through the restriction point (R). Among other genes, E2F increases the expression of cyclin E and cyclin A, which activates CDK2 and further boosts the phosphorylation of pRb in a positive feedback loop. Sequestering of p21CIP1/WAF1 and p27KIP1 by cyclin D–CDK4/6 further increases the activity of cyclin E–CDK2. Cyclin E–CDK2 also reduces p27KIP1 by targeting it to SCFSKP2-dependent degradation. Resetting pRb to a hypophosphorylated state is carried out by PP1 at the end of mitosis
is made at a transition toward the end of G1 called the restriction point (R). Cells exit the cell cycle into G0 if insufficient mitogenic signals are present to overcome the restriction point. After passing the restriction point, a cell is committed to another round of cell cycle and becomes independent of external stimuli. Mechanistically, the restriction point involves phosphorylation of the retinoblastoma gene product pRb by G1 cyclin–CDK complexes (Fig. 3). After DNA damage, the G1–S cell cycle engine is suppressed by the G1 DNA damage checkpoint. 2.1 Cyclin D as a Mitogenic Sensor for the Cell Cycle
Transcription of D-type cyclins (D1, D2, and D3) increases when quiescent cells are stimulated with growth factors. The strong dependence of cyclin D expression on extracellular mitogenic cues, coupling to the relatively short half-live of the protein (~30 min), enables cyclin D to act as an effective mitogenic sensor that conveys extracellular signals to the cell cycle. The promoters of D-type cyclins are under the control of multiple cell surface receptors and signaling pathways [1]. For example, activation of RAS–RAF–MEK–ERK signaling cascade, either
Cell Cycle Oscillators
7
in response to soluble growth factors binding to cell surface tyrosine kinase receptors or extracellular matrix (ECM) binding to integrins, activates the transcription of cyclin D1. This is mediated by the downstream transcription factors AP-1 (including members of the FOS, JUN, and ATF families) of the RAS signaling pathway. In addition, RAS also activates AKT/PKB through phosphoinositide 3-kinase (PI3K). AKT/PKB then phosphorylates and inactivates GSK-3β, thereby preventing β-catenin from degradation; the accumulated β-catenin then recruits the TCF/LEF family of transcription factors to activate cyclin D1 transcription. In this connection, activation of β-catenin by the canonical Wnt signaling pathway also increases the transcription of cyclin D1. As degradation of cyclin D1 involves phosphorylation by GSK-3β (at residue threonine (Thr) 286, generating a phosphodegron that is recognized by the ubiquitin ligase SCFFBX4), inhibition of GSK-3β by AKT/PKB also has an additional effect of stabilizing cyclin D1 protein [2]. 2.2 Phosphorylation of pRb Underlies the Restriction Point
Once cyclin D is synthesized, it binds and activates two cyclindependent kinases, CDK4 and CDK6. The cyclin D–CDK4/6 complexes then phosphorylate the retinoblastoma gene product pRb (and the related p107 and p130) [3]. One of the key functions of pRb (and related proteins) before it is phosphorylated by cyclin D–CDK4/6 (hypophosphorylated) is to sequester E2F. Several members of the E2F family (E2F1-3) bind DP proteins (DP1 or DP2), forming transcription factors critical for transcribing genes important for entry into S phase [4]. Hypophosphorylated pRb inhibits E2F by both blocking the transactivating domain as well as recruiting other proteins to repress E2F-mediated transcription. One mechanism involves the association of pRb with chromatin remodeling enzymes including histone deacetylase (HDAC), thereby indirectly targeting HDAC to the promoters bound by E2F–DP [3]. This represses the transactivation of the promoter through chromatin remodeling. Phosphorylation of pRb by cyclin D–CDK4/6 releases pRb from E2F (removing HDAC at the same time), liberating E2F–DP complexes to activate transcription. Hyperphosphorylation of pRb is initiated by cyclin D–CDK4/6, but is then maintained by cyclin E–CDK2 and cyclin A–CDK2. Unlike that of cyclin D, the expression of cyclin E and cyclin A is independent of extracellular signals. A large number of genes, many yet to be characterized, are transcriptionally activated by E2F–DP complexes. Among these are cyclin E and cyclin A, which activate CDK2 and further increase the phosphorylation of pRb. The pRb–E2F pathway therefore functions as a switch to convert graded growth factor stimulations into an all-or-none E2F response. Several members of the E2F family including E2F4 and E2F5 are transcriptional repressors. During G0, E2F4 and E2F5 repress E2Fresponsive genes that promote entry into G1. Following mitogenic
8
Randy Y.C. Poon
stimulation, phosphorylation of pRb by cyclin–CDK complexes results in the release of E2F repressors and the accumulation of newly synthesized E2F activators (E2F1-3) [4]. Negative regulators of the G1 cyclin–CDK complexes including CDK inhibitors can modulate the threshold of the restriction point. Binding of cell surface receptors by TGF-β stimulates a signaling pathway involving Smad proteins, eventually leading to the synthesis of p15INK4B [5]. As a cyclin D-specific inhibitor, p15INK4B inhibits cyclin D–CDK4/6 by blocking the formation of the complexes. It also has an additional effect of displacing the p21CIP1/WAF1/p27KIP1 that normally associates with cyclin D– CDK4/6 to redistribute to other cyclin–CDK complexes. The protein p27KIP1 is further stabilized by TGF-β signaling through destruction of SKP2 [6]. The levels of some of the CDK inhibitors are modulated during the cell cycle. For example, p27KIP1 is degraded by the ubiquitin ligase SCFSKP2 complex. SKP2 itself is destroyed by APC/CCDH1 during G1 [7, 8]. The accumulation of p27KIP1 conferred by APC/CCDH1 therefore contributes to the inhibition of CDK2 activity during G1. When cyclin D accumulates during G1, it drags p21CIP1/WAF1 and p27KIP1 away from cyclin E–CDK2 complexes, thereby liberating cyclin E–CDK2 from the CDK inhibitors. For cyclin D–CDK4/6 complexes, the kinase activity towards pRb is actually unaffected by p21CIP1/WAF1 and p27KIP1 (in fact, these proteins stimulate the formation of cyclin D– CDK4/6 complexes). After cyclin E–CDK2 is turned on, it phosphorylates p27KIP1 and stimulates SCFSKP2-dependent degradation of p27KIP1. This in turn allows more cyclin E–CDK2 to be activated to promote G1– S. As described above, signaling by RAS activates AKT/PKB. AKT/ PKB also phosphorylates p21CIP1/WAF1 and p27KIP1 and blocks their nuclear accumulation, thereby preventing these CDK inhibitors from acting on the G1 cyclin–CDK complexes. Phosphorylation of pRb is reset to the hypophosphorylated state by the phosphatase PP1 at the end of mitosis, at a time when the levels of cyclin D, cyclin E, and cyclin A are at their lowest during the cell cycle [9]. The overcoming of the restriction point becomes once again dependent on extracellular cues and the accumulation of cyclin D. 2.3 The G1 DNA Damage Checkpoint
DNA damage occurring during G1 phase activates a checkpoint that pauses the cell cycle to allow time for DNA repair. The molecular mechanism underlying this checkpoint is comprised of a p53-dependent mechanism that feeds into the pRb pathway [10]. In the absence of DNA damage, p53 is suppressed by one of its own transcriptional targets called MDM2 in a negative feedback loop. MDM2 binds to the amino (N)-terminal transactivation
Cell Cycle Oscillators
9
domain of p53 and inhibits p53-mediated transcription, shuttles p53 out of the nucleus, and promotes ubiquitin-dependent degradation of p53. The last effect is due to the fact that MDM2 is itself an ubiquitin ligase. DNA damage activates sensors that facilitate the activation of the PI3K-related protein kinases ATM and ATR. They in turn activate the checkpoint kinases CHK1 and CHK2. ATM/ATR, CHK1/CHK2, and other DNA damage-activated protein kinases phosphorylate the N-terminal region of p53. Phosphorylation of these sites abolishes the MDM2–p53 interaction, leading to a rise in p53 level and transcriptional activity. One of the transcriptional targets of p53 is the CDK inhibitor p21CIP1/WAF1. The accumulated p21CIP1/WAF1 then binds and inhibits cyclin A/E–CDK2. This diminishes the phosphorylation of pRb, thereby stopping the cell cycle in G1 phase (see Subheading 2.2). Another important control of the p53 pathway comes from the INK4A gene, which encodes both the CDK inhibitor p16INK4A and a protein called p14ARF. The inhibition of p53 by MDM2 is interrupted by p14ARF because it sequesters MDM2 to the nucleolus. The INK4A gene is generally activated in response to oncogenic stresses. The ensuing increase in p16INK4A and p14ARF reduces cyclin D–CDK4/6 activity and elevates p53 expression, respectively. Both of these events eventually suppress pRb phosphorylation and arrest the cell cycle in G1.
3
Control of S Phase The key issues concerning the regulation of S phase are (1) how DNA replication occurs only in S phase, and (2) how replication is initiated once and once only per cell cycle (Fig. 4). Centrosome duplication also occurs during S phase and is in part coupled with the mechanisms that govern DNA replication. The replication checkpoint is responsible for delaying S phase progression and preventing mitosis in the presence of stalled replication forks.
3.1 Initiation of S Phase
Although it is well established that initiation of DNA replication occurs at chromosomal locations known as origins of replication, S. cerevisiae is the only known eukaryote with a defined initiation sequence. Several proteins, including origin recognition complex (ORC, which is composed of ORC1-6), CDC6, and CDT1 are assembled at the origins of replication during G1. This facilitates the loading of double hexamers of the MCM2-7 core helicase, forming the so-called pre-replication complex (pre-RC). The formation of pre-RC on origins is called origin licensing [11]. During G1–S transition, the origins are activated by CDK2 and another kinase called CDC7. CDK2 is activated by cyclin A and
Randy Y.C. Poon
10
P
P
MCM2-7 GINS
(Geminin) CDC45
M
G0
Prereplicative complex
CDT1 Geminin
ORC
(CDC6)
MCM2-7
G2
CDT1 CDC6 ORC
G1 S
P
P
R
CDK2
CDC7
Cyclin A/E
DBF4 P
P
GINS MCM2-7 CDC45
MCM2-7
CDT1 CDC6
CDT1 CDC6
ORC
ORC
Fig. 4 Regulation of S phase. Initiation of DNA replication occurs at origins of replication. During G1 phase, the origins are licensed by binding to the pre-replication complex. During G1–S transition, cyclin A, cyclin E, and DBF4 are transcriptionally activated by E2F. Pre-replication complex components including MCM2-7 are phosphorylated by cyclin A/E–CDK2 and DBF4–CDC7, thereby stimulating the recruitment of CDC45 and GINS. This activates the MCM2-7 helicase to unwind the origin. Finally, the unwound DNA allows the recruitment of DNA polymerases and other components of the DNA synthesis machinery to initiate DNA synthesis. After DNA replication, several mechanisms including degradation of CDC6 and binding of CDT1 to newly synthesized geminin prevent re-replication. These mechanisms are reset later in G1 (including the removal of geminin by APC/C shown in the figure)
cyclin E and CDC7 is activated by a protein called DBF4 (ASK in humans) [12]. Higher eukaryotes contain a second DBF4-like protein called DRF1 or ASKL1. Similar to cyclin–CDK pairs, while the level of CDC7 remains relatively constant during the cell cycle, the level of DBF4/ASK oscillates during the cell cycle, being absent during G1 and accumulating during S and G2. Similar to cyclin A and cyclin E, transcription of DBF4/ASK1 is activated during late G1 and S phase by E2F. CDK2 and CDC7 phosphorylate components of the pre-RC including the MCM2-7 complex, thereby triggering the recruitment of two helicase co-activators, CDC45 and GINS. The MCM2-7 helicase is then activated and unwinds the origin. The single-stranded DNA is subsequently stabilized by binding to replication protein A (RPA). Finally, the unwound DNA facilitates the recruitment of DNA polymerases and other components of the DNA synthesis machinery to initiate DNA synthesis.
Cell Cycle Oscillators
11
Cyclin A/E–CDK2 also coordinates the initiation of DNA replication with the centrosome cycle [13]. The centrosome is located near the nucleus and contains the microtubule organizing center, playing important roles in the establishment of the interphase cytoplasmic microtubule network and bipolar mitotic spindles. Since each daughter cell receives just one centrosome after cell division, the centrosome has to duplicate once before the next mitosis. Centrosome duplication occurs during S phase and is coupled to the cell cycle, at least in part, by the activity of cyclin A/E–CDK2. 3.2 Prevention of Re-replication
Once the genome has been replicated, formation of the pre-RC is inhibited by multiple mechanisms until the next cell cycle. Cyclin E is degraded by the ubiquitin ligase SCFFBW7 after S phase, thereby turning off the cyclin E-CDK2 kinase activity. The phosphodegron recognized by SCFFBW7 is created by CDK2-dependent autophosphorylation as well as by GSK-3β. On the other hand, DBF4/ ASK1 is degraded by APC/C only after mitosis. The accumulation of CDK activity during late G1, S, and G2 prevents the reassembly of the pre-RC through several mechanisms. Although cyclin E is degraded during S phase, the expression of cyclin A persists till mitosis. CDK-dependent phosphorylation excludes MCM2-7 from the nucleus, targets CDT1 and CDC6 for degradation, and dissociates ORC from the chromatin. Furthermore, accumulation of geminin during S and G2 results in the formation of a tight geminin–CDT1 complex, thereby preventing CDT1 from loading onto the pre-RC. Cyclin A–CDK2 also phosphorylates E2F1 and E2F3, decreasing their DNA binding capability and terminating the transcription of genes involve in S phase control [14, 15]. SCFSKP2-dependent degradation of E2F1 during S and G2 further limits the activity of E2F after S phase [16]. Several members of the E2F family including E2F7 and E2F8 are transcriptional repressors. After G1–S, these transcriptional repressor E2Fs attenuate the transcription of genes activated earlier by E2F1-3. They also directly repress the expression of transcriptional activator E2Fs such as E2F1 [4]. Together, these mechanisms prevent the expression of E2Factivating genes after G1–S. Assembly of the pre-RC can occur again in early G1 because destruction of cyclin A and cyclin B during mitosis provides an environment of low CDK activity. Proteolysis of geminin by APC/C during mitosis also unleashes CDT1 to form the preRC. Hence, APC/C resets the mechanisms that safeguard rereplication during the previous cell cycle.
3.3 Replication Checkpoint
Stalled replication forks activate a checkpoint involving ATR [17]. Replication fork progression is disrupted by either an insufficient supply of nucleotides or lesions and obstacles on the DNA. Several proteins including ATRIP, Claspin, and TopBP1 are involved in
12
Randy Y.C. Poon
recruiting ATR to single-stranded DNA present at the stalled replication forks. Specifically, ATR is activated by binding to the single-strand binding protein RPA-coated single-stranded DNA. The activated ATR then phosphorylates and activates CHK1. CHK1 subsequently activates WEE1 and inactivates CDC25 (see Subheading 4.2). Consequently, this alters the inhibitory phosphorylation status of CDKs, tipping the balance towards inhibition of the cyclin–CDK complexes involved in both replication (see Subheading 3.1) and mitotic entry (see Subheading 4). Hence, the replication checkpoint regulates origin firing, replication forks progression, as well as preventing untimely mitosis. These mechanisms provide the cell with time to restart or repair the stalled replication forks. Significantly, the checkpoint is essential during unperturbed S phase even in the absence of exogenous stresses.
4
G2–Mitosis Several dramatic events occur during mitosis, including chromosome condensation, nuclear envelope breakdown, formation of mitotic spindles, attachment of chromosomes to the mitotic spindles, and separation of sister chromatids. In essence, mitosis is driven by the activation of CDK1 (Fig. 5). Working in concert with a number of kinases and phosphatases, the activation of CDK1 is characterized by feedback mechanisms that ensure CDK1 is activated rapidly.
4.1 Cyclin B–CDK1 as the Engine of Mitosis
The key event for mitotic entry is the activation of CDK1. Although CDK1 is present at constant levels throughout the cell cycle, it is active only during mitosis due to regulation by several mechanisms including binding to cyclins and phosphorylation. The mitotic cyclins (cyclin A and cyclin B) are synthesized and destroyed around the time of mitosis (cyclin A also functions in S phase) [18]. Mammalian cells contain two A-type cyclins (A1 and A2) and three B-type cyclins (B1, B2, and B3). While cyclin A2 is present in all proliferating somatic cells, cyclin A1 is critical only during spermatogenesis. Cyclin B1 is the major mitotic cyclin partner of CDK1. Cyclin B2 is co-expressed with cyclin B1 in the majority of dividing cells but is less abundant. The expression of cyclin B3 is restricted to developing germ cells and in the adult testis. A salient characteristic of the mitotic cyclins is their periodicity. Cyclin A starts to accumulate during late G1, continues through S phase and G2, before being rapidly destroyed during mitosis. Cyclin B is synthesized and destroyed slightly later than cyclin A. The cell cycle expression of cyclin A and cyclin B is regulated at the levels of transcription and proteolysis [18]. For example, several transcription factors, including B-MYB, E2F, FOXM1, and NF-Y, regulate the mRNAs of cyclin B1 so that they accumulate during G2 and diminish after mitosis. The sharp decrease of the mitotic cyclins at
Cell Cycle Oscillators
Separase
MAD2
Aurora A
13
Bora PLK1
APC/C
CDC25
CDK1
WEE1
Cyclin B
CDC20
Separase
CDK1
Securin
M
G0
G2
G1 S
R
Fig. 5 Regulation of mitotic entry and exit. After cyclin B is synthesized and bound to CDK1, the complex is kept in an inactive state by WEE1/MYT1-dependent phosphorylation of CDK1. Dephosphorylation of CDK1 by members of the CDC25 phosphatase family during G2–M transition activates cyclin B–CDK1. Cyclin B–CDK1 activation is autocatalytic because CDK1 activates CDC25 and inactivates WEE1/MYT1. Initial activation of CDC25 may be carried out by PLK1, which in turn is activated by Aurora A and Bora. During early mitosis, APC/CCDC20 is turned on by cyclin B–CDK1 and other mitotic kinases. However, its activity is suppressed by MAD2 from the spindleassembly checkpoint. Once all kinetochores are properly attached, the spindleassembly checkpoint is silenced to allow APC/CCDC20 activation. APC/C then targets several proteins including cyclin B, PLK1, Aurora A, and securin to ubiquitin-mediated degradation. Proteolysis of securin releases separase, which in turn cleaves cohesin to allow sister chromatid separation. Reactivation of CDK1 during G1 is safeguarded by another APC/C complex involving CDH1. APC/C also resets conditions required for forming of the pre-replication complex for the next S phase (not shown)
the end of mitosis, however, is caused mainly by proteolysis involving APC/C-dependent mechanisms (see Subheading 5). 4.2 Feedback Control Ensures Biphasic Activation of CDK1
The defining characteristic of CDK1 activation is a system of feedback loops that converts the slow accumulation of cyclin B into an abrupt activation of CDK1. Monomeric CDK1 is inactive and unphosphorylated. On binding to cyclin B, the kinase activity of
14
Randy Y.C. Poon
CDK1 is initially suppressed by inhibitory phosphorylation of CDK1Thr14/Tyr15 by MYT1 and WEE1 [19]. WEE1 is a dualspecificity kinase that phosphorylates tyrosine (Tyr) 15 (but not Thr14). MYT1, a kinase that is normally bound to the endoplasmic reticulum and Golgi complex, can phosphorylate both Thr14 and Tyr15, but has a stronger preference for Thr14. At the end of G2, the stockpile of inactive cyclin B–CDK1 complexes is rapidly activated by members of the CDC25 phosphatase family (A, B, and C) [20]. CDC25B is believed to be the initial activator of cyclin B–CDK1 at the centrosomes. This is followed by the complete activation of cyclin B–CDK1 by CDC25A and CDC25C in the nucleus. Significantly, active CDK1 activates more CDC25 and inactivates WEE1 by directly phosphorylating these proteins. Hence, a small amount of active cyclin B–CDK1 can lead to a rapid and complete activation of all the complexes by this autocatalytic loop. Phosphorylation of WEE1 by CDK1 (as well as by PLK1) also creates a phosphodegron for SCFβTrCPdependent degradation. Thus cyclin B–CDK1 is essentially a biphasic switch system that becomes autocatalytic once a critical portion is activated. 4.3 Kick-Starting the CDK1 Activating Loops
Given that the activation of cyclin B–CDK1 is autocatalytic, how the initial batch of cyclin B–CDK1 is activated becomes a salient issue. The available data indicate that the multifunctional protein kinase PLK1 may initiate the system by activating CDC25 and inactivating WEE1/MYT1 [21]. In addition, PLK1 also promotes the translocation of cyclin B into the nucleus during prophase [22]. During G2, binding of the export mediator CRM1 to the nuclear export sequence (NES) of cyclin B1 promotes cytoplasmic localization of cyclin B1. Phosphorylation of residues in the NES by kinases including CDK1 and PLK1 is important for the nuclear translocation of cyclin B1, presumably by disrupting the CRM1–cyclin B1 interaction. This mechanism enables the localization of cyclin B1–CDK1 to the nucleus (involving binding of cyclin B1 to importin-β) when the complexes are active. The activation of PLK1 involves phosphorylation by Aurora A, an event that is assisted by a protein called Bora [23]. Binding of Bora to PLK1 is stimulated by cyclin B–CDK1, thereby creating another positive feedback loop in the activation of cyclin B–CDK1. PLK1 then phosphorylates Bora and generates a phosphodegron motif that is recognized by the ubiquitin ligase SCFβTrCP, targeting Bora for degradation [24]. Degradation of Bora allows the redistribution of Aurora A from a cytoplasmic Bora-containing complex to a TPX2-containing complex at the mitotic spindle. Activation of Aurora A during mitosis involves binding to cofactors such as TPX2 and autophosphorylation of a residue in the T-loop. Both Aurora A and PLK1 are also important for various centrosome functions, including centrosome separation, maturation,
Cell Cycle Oscillators
15
and mitotic spindle formation. Separation of duplicated and matured centrosomes in late G2 is crucial for the formation of bipolar mitotic spindles. At the end of mitosis, both Aurora A and PLK1 are degraded by APC/CCDH1-mediated ubiquitination. 4.4 Greatwall (MASTL) Helps Maintain the Mitotic State
Phosphorylation events during mitosis are reversible. To ensure that mitotic cells do not reverse to G2, it is important both to maintain the activities of the mitotic kinases as well as to suppress the phosphatases that counteract the kinases’ actions. Greatwall (MASTL in humans) is a kinase that phosphorylates ARPP19 and α-endosulfine (ENSA), promoting their inhibition of the phosphatase PP2A–B55. As PP2A–B55 is a major phosphatase that dephosphorylates cyclin B–CDK1 substrates, Greatwall activity is important for maintaining the phosphorylation of CDK1 substrates during mitosis [25]. Greatwall also regulates the activation of CDK1 by maintaining the phosphorylation of CDC25, thereby keeping CDK1 in a Thr14/Tyr15-dephosphorylated state. Greatwall itself appears to be activated during mitosis by CDK1 in a feedback loop. At the end of mitosis, Greatwall is reset to an inactive state by PP2A–B55dependent dephosphorylation of an essential CDK phosphorylation site (Thr194). Dephosphorylation of ENSA/ARPP19 is mediated by the phosphatase FCP1 [26].
4.5 The G2 DNA Damage Checkpoint
The G2 DNA damage checkpoint involves the activation of the protein kinases ATM/ATR followed by CHK1/CHK2 similarly to the G1 DNA damage checkpoint. CHK1/CHK2 then activates WEE1 and inactivates all three isoforms of the CDC25 family (CDC25A, CDC25B, and CDC25C). Together, these mechanisms promote CDK1Thr14/Tyr15 phosphorylation, leading to the inactivation of CDK1 and cell cycle arrest in G2 [27]. CDC25C is inactivated by CHK1/CHK2-dependent phosphorylation both directly and indirectly through the creation of a 14-3-3 binding site. Binding of 14-3-3 to CDC25C masks a proximal nuclear localization sequence, thereby anchoring CDC25C in the cytoplasm and preventing efficient access to cyclin B–CDK1. The centrosomal CDC25B is also phosphorylated by CHK1, creating a docking site for 14-3-3 that disrupts access to CDK1. In contrast to other CDC25 isoforms, CDC25A is targeted for rapid degradation by CHK1/CHK2. CDC25A stability is usually controlled by APC/CCDH1 complexes during early G1 and by SCFβTrCP complexes during interphase. Importantly, the SCFβTrCP-mediated degradation of CDC25A is enhanced after DNA damage through phosphorylation by CHK1. In addition to acting on CDC25, CHK1/CHK2 also appears to phosphorylate and activate WEE1 by promoting 14-3-3 binding.
16
5
Randy Y.C. Poon
Mitosis–G1 The key event in mitotic exit is the onset of anaphase, which is driven by APC/C-dependent ubiquitination. Degradation of APC/C substrates including cyclin B and securin promotes several events during mitotic exit, including sister chromatid separation, spindle disassembly, chromosome decondensation, cytokinesis, and reformation of the nuclear envelope. How to keep APC/C inactivate before all the chromosomes are attached to the spindle correctly is the major feedback that orchestrates mitotic exit (Fig. 5).
5.1 APC/C Drives Mitotic Exit
Bipolar spindle formation and proper attachment of chromosomes are highly regulated to ensure that chromosomes are segregated equally to the daughter cells. Several kinases that are targeted to unattached kinetochores, including CDK1, PLK1, and NEK2, phosphorylate key kinetochore proteins such as HEC1 and contribute to the stabilization of microtubule–kinetochore interactions [19]. The chromosomal passenger complex (CPC, composed of Aurora B, Borealin, INCENP, and Survivin) plays a major role in spindle assembly and cytokinesis. CPC localizes to the kinetochores and chromosomes during early mitosis and functions in microtubule–kinetochore interactions, sister chromatid cohesion, and the spindle-assembly checkpoint. CPC corrects misattachments of chromosomes until they are bioriented and under tension. CPC is relocated to the central spindle at anaphase and subsequently to the midbody to promote cytokinesis [28]. Once all kinetochores are properly attached, the ubiquitin ligase APC/C is activated to degrade the mitotic cyclins and other proteins [29]. Both A- and B-type cyclins contain a short sequence at the N-terminal region known as the destruction box (D-box). The D-box targets the mitotic cyclins to the multi-subunit ubiquitin ligase APC/C. Two targeting subunits called CDC20 and CDH1 are involved in facilitating the ubiquitination of cyclins by APC/C. While CDC20 is present only during mitosis, CDH1 remains constant during the cell cycle, but only associates with APC/C during G1. The ubiquitinated cyclins are then rapidly degraded by a constitutively active proteasome complex. Importantly, activated cyclin B–CDK1 stimulates the activity of APC/CCDC20 through phosphorylation of several subunits of APC/C and CDC20. APC/C is also phosphorylated and activated by PLK1. Hence, cyclin B primes its own destruction and ensures that APC/CCDC20 is activated only after mitotic entry. However, the activity of APC/CCDC20 is suppressed by the spindleassembly checkpoint until all the all kinetochores are properly attached (see Subheading 5.2). In addition to cyclin B, APC/CCDC20 also degrades several substrates including securin and geminin [30]. Degradation of
Cell Cycle Oscillators
17
securin is important for sister chromatid separation during anaphase. After DNA is replicated, sister chromatids are tethered together by cohesin, a ring-shaped complex consisting of four SMC subunits. This involves a cohesin-interacting protein called sororin, which protects the removal of cohesin by PDS5 and WAPL. Cohesin is removed from chromosomes in a two-step manner during mitosis: while cohesin at the chromosome arms is removed during early mitosis, the centromeric cohesin is protected until anaphase. During prophase, CDK1, PLK1, and Aurora B collaborate to phosphorylate cohesin and sororin, inducing WAPL-dependent removal of cohesin from chromosome arms. However, a pool of cohesin at centromeres is protected by Shugoshin (SGO1). The primary signal for localizing SGO1 to centromeres is BUB1 (a component of the spindle-assembly checkpoint)-dependent phosphorylation of histone H2ASer121. SGO1 interacts with the phosphatase PP2A, thereby keeping cohesin and sororin in a hypophosphorylated state and maintaining centromeric cohesion. During metaphase-anaphase transition, proper kinetochore–microtubule attachment creates tension across sister kinetochores and triggers the removal of SGO1. Kinetochore tension also silences the spindle-assembly checkpoint. This allows the APC/CCDC20 to degrade securin, leading to activation of the protease separase. Separase then cleaves centromeric cohesin to facilitate sister-chromatid separation. Another substrate of APC/CCDC20 is geminin. Degradation of geminin by APC/CCDC20 releases CDT1, a subunit required for the initiation of DNA replication (see Subheading 3). Hence, by simultaneously destroying the mitotic cyclins, securin, and geminin, APC/CCDC20 coordinates several important processes during the mitosis–G1 transition and prepares the cell for the next S phase. In addition to CDC20, APC/C can also associate with a targeting subunit called CDH1 [30]. In contrast to APC/CCDC20, APC/CCDH1 is turned off during mitosis because phosphorylation by cyclin B–CDK1 alters the conformation of CDH1 and prevents its interaction with APC/C. Destruction of cyclin B at anaphase therefore relieves the inhibition of APC/CCDH1, enabling it to degrade CDC20 and take over the task of degrading any remaining or newly synthesized cyclin B during G1. Finally, APC/CCDH1 is also responsible for destroying several important mitotic regulators including PLK1, CDC25A, Aurora A, and SGO1. During late G1, E2F is released from pRb and activates the transcription of cyclin A (see Subheading 2). Cyclin A–CDK complexes then phosphorylates CDH1 and inhibits its association with APC/C. APC/CCDH1 and APC/CCDC20 are also turned off by binding to EMI1, which begins to accumulate at late G1 (also transcriptionally activated by E2F). EMI1 has to be removed subsequently to allow APC/C to function in mitotic exit. This is achieved by PLK1-dependent phosphorylation, targeting EMI to ubiquitinmediated degradation by SCFβTrCP.
18
Randy Y.C. Poon
5.2 The SpindleAssembly Checkpoint
The spindle-assembly checkpoint is activated by either the presence of unattached kinetochores or the absence of tension between paired kinetochores [31]. Consequently the spindle-assembly checkpoint ensures that chromosomes have achieved correct bipolar attachment to the mitotic spindles before cyclin B and other proteins are degraded by APC/C (Fig. 5). Unattached kinetochores attract several components of the checkpoint sensors (including BUB1, BUBR1, BUB3, CENP-E, MAD1, MAD2, and MPS1), catalyzing the formation of diffusible complex called mitotic checkpoint complexes (MCC, components include MAD2, BUBR1, and BUB3). These checkpoint components act as signal transducers, resulting in the inhibition APC/ CCDC20 through the sequestration of CDC20 by MAD2. Binding to CDC20 requires a conformational change of MAD2 from a less stable open conformation (known as O-MAD2) to the more stable close conformation (C-MAD2). Although the mechanism remains incompletely understood, several lines of evidence suggest that C-MAD2 can convert more C-MAD2 from O-MAD2 in an autocatalytic manner [32]. Once all kinetochores are properly attached, the spindleassembly checkpoint is silenced to allow APC/CCDC20 activation. Several mechanisms have been implicated in switching off the checkpoint, including those that involve PP1 [33] and a MAD2-binding protein called p31comet [31]. However, the precise mechanism of how p31comet inactivates MAD2 remains incompletely understood.
Acknowledgements Related works in my laboratory are supported in part by the Research Grants Council of Hong Kong. References 1. Wang C, Li Z, Fu M, Bouras T, Pestell RG (2004) Signal transduction mediated by cyclin D1: from mitogens to cell proliferation: a molecular target with therapeutic potential. Cancer Treat Res 119:217–237 2. Lin DI, Barbash O, Kumar KG, Weber JD, Harper JW, Klein-Szanto AJ, Rustgi A, Fuchs SY, Diehl JA (2006) Phosphorylationdependent ubiquitination of cyclin D1 by the SCF(FBX4-alphaB crystallin) complex. Mol Cell 24:355–366 3. Henley SA, Dick FA (2012) The retinoblastoma family of proteins and their regulatory functions in the mammalian cell division cycle. Cell Div 7:10
4. Chen HZ, Tsai SY, Leone G (2009) Emerging roles of E2Fs in cancer: an exit from cell cycle control. Nat Rev Cancer 9:785–797 5. Massague J (2008) TGFbeta in Cancer. Cell 134:215–230 6. Liu W, Wu G, Li W, Lobur D, Wan Y (2007) Cdh1-anaphase-promoting complex targets Skp2 for destruction in transforming growth factor beta-induced growth inhibition. Mol Cell Biol 27:2967–2979 7. Bashir T, Dorrello NV, Amador V, Guardavaccaro D, Pagano M (2004) Control of the SCF(Skp2-Cks1) ubiquitin ligase by the APC/C(Cdh1) ubiquitin ligase. Nature 428:190–193
Cell Cycle Oscillators 8. Wei W, Ayad NG, Wan Y, Zhang GJ, Kirschner MW, Kaelin WGJ (2004) Degradation of the SCF component Skp2 in cell-cycle phase G1 by the anaphase-promoting complex. Nature 428:194–198 9. Nelson DA, Krucher NA, Ludlow JW (1997) High molecular weight protein phosphatase type 1 dephosphorylates the retinoblastoma protein. J Biol Chem 272:4528–4535 10. Sherr CJ, McCormick F (2002) The RB and p53 pathways in cancer. Cancer Cell 2:103–112 11. Masai H, Matsumoto S, You Z, YoshizawaSugata N, Oda M (2010) Eukaryotic chromosome DNA replication: where, when, and how? Annu Rev Biochem 79:89–130 12. Matthews LA, Guarne A (2013) Dbf4: the whole is greater than the sum of its parts. Cell Cycle 12:1180–1188 13. Hinchcliffe EH, Sluder G (2001) “It takes two to tango”: understanding how centrosome duplication is regulated throughout the cell cycle. Genes Dev 15:1167–1181 14. Dynlacht BD, Moberg K, Lees JA, Harlow E, Zhu L (1997) Specific regulation of E2F family members by cyclin-dependent kinases. Mol Cell Biol 17:3867–3875 15. Krek W, Xu G, Livingston DM (1995) Cyclin A-kinase regulation of E2F-1 DNA binding function underlies suppression of an S phase checkpoint. Cell 83:1149–1158 16. Marti A, Wirbelauer C, Scheffner M, Krek W (1999) Interaction between ubiquitin-protein ligase SCFSKP2 and E2F-1 underlies the regulation of E2F-1 degradation. Nat Cell Biol 1:14–19 17. Friedel AM, Pike BL, Gasser SM (2009) ATR/ Mec1: coordinating fork stability and repair. Curr Opin Cell Biol 21:237–244 18. Fung TK, Poon RY (2005) A roller coaster ride with the mitotic cyclins. Semin Cell Dev Biol 16:335–342 19. Ma HT, Poon RY (2011) How protein kinases co-ordinate mitosis in animal cells. Biochem J 435:17–31 20. Lindqvist A, Rodriguez-Bravo V, Medema RH (2009) The decision to enter mitosis: feedback and redundancy in the mitotic entry network. J Cell Biol 185:193–202
19
21. van Vugt MA, Medema RH (2005) Getting in and out of mitosis with Polo-like kinase-1. Oncogene 24:2844–2859 22. Porter LA, Donoghue DJ (2003) Cyclin B1 and CDK1: nuclear localization and upstream regulators. Prog Cell Cycle Res 5:335–347 23. Lens SM, Voest EE, Medema RH (2010) Shared and separate functions of polo-like kinases and aurora kinases in cancer. Nat Rev Cancer 10:825–841 24. Macurek L, Lindqvist A, Medema RH (2009) Aurora-A and hBora join the game of Polo. Cancer Res 69:4555–4558 25. Hunt T (2013) On the regulation of protein phosphatase 2A and its role in controlling entry into and exit from mitosis. Adv Biol Regul 53:173–178 26. Hegarat N, Vesely C, Vinod PK, Ocasio C, Peter N, Gannon J, Oliver AW, Novak B, Hochegger H (2014) PP2A/B55 and Fcp1 regulate Greatwall and Ensa dephosphorylation during mitotic exit. PLoS Genet 10:e1004004 27. Chen Y, Poon RY (2008) The multiple checkpoint functions of CHK1 and CHK2 in maintenance of genome stability. Front Biosci 13:5016–5029 28. Carmena M, Wheelock M, Funabiki H, Earnshaw WC (2012) The chromosomal passenger complex (CPC): from easy rider to the godfather of mitosis. Nat Rev Mol Cell Biol 13:789–803 29. Teixeira LK, Reed SI (2013) Ubiquitin ligases and cell cycle control. Annu Rev Biochem 82:387–414 30. Manchado E, Eguren M, Malumbres M (2010) The anaphase-promoting complex/cyclosome (APC/C): cell-cycle-dependent and -independent functions. Biochem Soc Trans 38:65–71 31. Musacchio A, Salmon ED (2007) The spindleassembly checkpoint in space and time. Nat Rev Mol Cell Biol 8:379–393 32. Mapelli M, Massimiliano L, Santaguida S, Musacchio A (2007) The Mad2 conformational dimer: structure and implications for the spindle assembly checkpoint. Cell 131:730–743 33. Lesage B, Qian J, Bollen M (2011) Spindle checkpoint silencing: PP1 tips the balance. Curr Biol 21:R898–R903
Chapter 2 Model Organisms for Studying the Cell Cycle Zhaohua Tang Abstract Regulation of the cell-division cycle is fundamental for the growth, development, and reproduction of all species of life. In the past several decades, a conserved theme of cell cycle regulation has emerged from research in diverse model organisms. A comparison of distinct features of several diverse model organisms commonly used in cell cycle studies highlights their suitability for various experimental approaches, and recaptures their contributions to our current understanding of the eukaryotic cell cycle. A historic perspective presents a recollection of the breakthrough upon unfolding the universal principles of cell cycle control by scientists working with diverse model organisms, thereby appreciating the discovery pathways in this field. A comprehensive understanding is necessary to address current challenging questions about cell cycle control. Advances in genomics, proteomics, quantitative methodologies, and approaches of systems biology are redefining the traditional concept of what constitutes a model organism and have established a new era for development of novel, and refinement of the established model organisms. Researchers working in the field are no longer separated by their favorite model organisms; they have become more integrated into a larger community for gaining greater insights into how a cell divides and cycles. The new technologies provide a broad evolutionary spectrum of the cell-division cycle and allow informative comparisons among different species at a level that has never been possible, exerting unimaginable impact on our comprehensive understanding of cell cycle regulation. Key words Cell-division cycle (cdc) phenotype, Checkpoints, Yeast genetics, Maturation-promoting factor (MPF), Cyclin-dependent kinases (Cdks), Protein kinases, Phosphorylation, Domino model, Clock model
1
Introduction: Why Is Cell Cycle Regulation Important? The development of model organisms has been driven by the fundamental questions that stimulate biologists and the amenability of species for experimental investigation in laboratories. Historically, cell function has been mainly elucidated from studies using a few unicellular organisms—primarily Escherichia coli and yeasts; what we have learned about animal development has been largely based on the genetics of the fruit fly and worm, as well as exploration of the frog and mouse; our understanding of the molecular and developmental biology of plants came from examining Arabidopsis.
Amanda S. Coutts and Louise Weston (eds.), Cell Cycle Oscillators: Methods and Protocols, Methods in Molecular Biology, vol. 1342, DOI 10.1007/978-1-4939-2957-3_2, © Springer Science+Business Media New York 2016
21
22
Zhaohua Tang
The cast of conventional model organisms is considerably small compared with the biodiversity that exists on Earth, but they have been serving as the representatives of individual groups in research to address a variety of biological questions, constituting the core of biological knowledge [1]. This chapter provides a review of several diverse model organisms commonly used in cell cycle analyses, including yeasts, frogs, fruit flies, and mammalian cells. A traditional meaning of the term model organism is: a life-form that has been established as an experimental system with common tools and reagents accessible to the community members, who focus on the model to seek answers to questions about biology [2]. Model organisms are crucial for a comprehensive understanding of a biological process at any scale. However, since every organism may be limited by its suitability for only specific types of approaches, each system may harbor imperfections, and a single route to discovery may bear biases in research, such as in cell cycle studies. Comparing the mechanisms of cell cycle regulation among different organisms deciphers whether conclusions being reached independently can be generalized across species. Research in eukaryotes as divergent as yeasts, frogs, fruit flies, and mammalian cells has revealed the conservation of the fundamental principles in cell cycle regulation. At the same time, the unique features of cell cycle control in various organisms studied have helped, and will continue to help, illuminate how fidelity of the cell cycle can be achieved in different ways (for review, see refs. 3–6). Historically, cell cycle research communities based in different model systems, often in isolation from one another, have gained insight into the general principles that underlie the cell cycle control in all eukaryotic cells. Changes in technologies with the availability of complete genome sequences from many species, are reframing our concept of what consists of a model organism [1, 2]. These advances have greatly facilitated informative comparisons between different species and have increased interactions among organism-based cell cycle research communities, thereby enabling fresh and exciting opportunities in this field. 1.1 The Cell as a Structural Unit of Life
A great variety of organisms have evolved on Earth with diverse shapes, sizes, and lifestyles that nonetheless all work under a common framework of cellular mechanics. In 1838, botanist Matthias Schleiden and zoologist Theodor Schwann proposed “all organisms are composed of essentially like parts, namely cells”—the cell theory [5]. The cell theory states that: 1. All life forms are made from one or more cells. 2. Cells are the smallest form of life. 3. Cells only arise from preexisting cells. It took 20 years for Rudolf Virchow, a German pathologist to add the third tenet of the cell theory about cell reproduction. He
Cell Cycle Control and Model Organisms
23
discovered that cancer is an uncontrolled growth of cells—hyperplasia in its extreme form, as he put it: ominis cellula e cellula [7]. That constitutes the above third tenet of the cell theory. After the birth of the cell theory, the cell biology field was forever changed. While life on Earth consists of immensely diverse forms, the cell theory provides us with an operational definition of life: the cell as a common basic unit for all organisms, the appearance of which can be drastically diverse. Amazingly, the principles of cell cycle regulation in all eukaryotes are fundamentally the same. Eukaryotic organisms can grow quite large and develop many different tissues types. For example, adult humans are composed of about 1013 (ten trillion) cells that all arise from a single fertilized egg via subsequent cell divisions. Furthermore, the cell-division cycle is still indispensible after reaching the adult stage, as cellular renewal is crucial for functional physiology of multicellular organisms. A human body loses 109 cells each day and reforms its entire skin every 7 days. Without this regeneration ability, we would lose the lining of our intestines in 2 days; our skin would fall apart in 3 weeks; and our blood cells including red blood cells would run out in 4 months. Afterwards, we would only have some organs left. This necessary regeneration is accomplished via the cell-division cycle of precursor cells of various types. During a human life-span, the cells in the body undergo about 1016 (ten thousand trillion) divisions [8]. 1.2 The Cell as a Functional Unit of Life
“Cells do it all: heredity, development, disease, and death.” [4]. There are more than 200 types of different cells in a human body and not every cell can divide forever. Two classes of stem cells, embryonic stem (ES) cells and adult stem cells, are responsible for replenishing old, dying cells [9]. The distinctions between them are their growth and developmental potentials. Embryonic stem cells are pluripotent cells that can divide indefinitely and generate all types of cells in the body. Adult stem cells are multipotent cells that possess limited ability to proliferate and are more restricted in what they can become. Both embryonic and adult stem cells are capable of responding to particular differential factors in the environment and developing into the corresponding precursor cells. Blood precursor cells will become mature blood cells and skin precursor cells will become mature skin cells, and so on. Therefore, the fate of these cells in a normal environment from then on is more or less determined, not to say it cannot be reversed based on recent studies on induced pluripotent stem (iPS) cells [10]. In addition to the essential cell-division cycle for organism development and renewal, programed cell death, known as apoptosis, is required for normal development. Interestingly, about a hundred thousand cells are produced every second in a human by mitosis, and a similar number of cells die by apoptosis through a physiological suicide process [11]. On the other hand, cells that do not kill themselves can go awry in many ways. Errors in cell
24
Zhaohua Tang
division routinely occur and mutations can accumulate to activate oncogenes, which promote cell growth and division, and/or inactivate tumor-suppressor genes, which restrain cell growth and division, leading to cancer in complex organisms such as mice and humans. In a sense, every time a cell divides, it is at risk of producing errors that may contribute to cancer development in humans. The risk for individuals increases with age due to the genetic mutations accumulated as one’s life span extends. 1.3 Natural Selection Is Not Natural Perfection
Remarkably complex adaptations have evolved in living organisms; however, humans are still very vulnerable to a wide range of diseases. Cancer perhaps is among the most enigmatic and tragic of illnesses, because it is derived from the cells of our own body that have escaped the normal controls of the cell cycle. Furthermore, cancer is not rare. In the US, the cancer incidence is one in every three people and the mortality rate is one in every four people. Three people are diagnosed and one person dies of cancer every minute. Globally, cancer causes eight million deaths per annum. It is anticipated that a woman in the US has a 39 % chance, while a man has a 45 % chance of being diagnosed with some type of cancer in their lifetime [7]. The startling fact is that tumors afflicting us are not foreign parasites that have acquired sophisticated strategies for attacking our bodies; tumors are made of our own cells turned against us. Cancer cells arise as variants from normal cells in that they have lost their usual controls for growth and division [7]. Yet cancer is complex, since it comprises numerous ways to flee from cell cycle controls, gain growth advantages, and become cancerous. In this sense, cancer is not one disease but many types of diseases. Natural selection has only a limited ability to prevent cancer. It has provided some defenses for the survival of species involved, but these measures tend to delay the diseases until late in life rather than eliminating it entirely. Since most cancer occurs in the postreproductive period, it is unlikely to be selected against, as the criterion of a species’ fitness is its reproducibility. Moreover, as some scientists argue, the selective pressure may even have resulted in tools that help tumors grow [12]. Evolutionary forces have apparently favored some genes that promote proliferation and migration during organism growth and development. These genes may get hijacked by cancer cells and be turned on when they would normally be silent after the developmental stages. The ability of some gene products to stimulate new blood vessel formation and aggressive growth serves a tumor just as it does a placenta. Therefore, natural selection is not natural perfection. It lacks the power to erase cancer from humans, partly due to its focus on reproduction rather than on longevity of species [12]. In principle, at a cellular level, aging starts with a reduced ability in cell growth and division, finally reaching the senescence state without reentry into the cell cycle, whereas cancer development
Cell Cycle Control and Model Organisms
25
begins with unrestrained proliferation and genomic instability during growth and division. Without understanding the normal balances and checks that ensure the orderly cell-division cycle, we cannot design effective strategies for cancer prevention and treatment.
2
Basic Properties of the Cell-Division Cycle What is the cell-division cycle? The cell cycle is the universal process by which cells reproduce, and it underlies the growth and development of all living species. There are four successive phases of a standard eukaryotic cell cycle: G1 (growth phase 1), S (synthesis phase), G2 (growth phase 2), and M phase (Fig. 1). During interphase (G1, S, and G2) a cell grows continuously and in M phase it divides. DNA replication is confined to a part of interphase known as S phase.
Fig. 1 Four successive phases of a standard mitotic cell cycle of eukaryotes. G1 (growth phase 1 or gap 1), S (synthesis phase), G2 (growth phase 2 or gap 2), and M phases. M phase consists of mitosis (nuclear division) and cytokinesis (cell separation). A cell grows continuously during interphase (G1, S, and G2) and divides in M phase. DNA replication is confined to a part of interphase known as S phase
26
Zhaohua Tang
The M phase consists of nuclear division/mitosis and cell separation/cytokinesis, the changes during which are visible under a microscope. Although a typical M phase only occupies a small fraction of the cell cycle, it is the stage that has dramatic morphological changes. The other much longer part of the cell cycle is known as interphase with relatively less discernible morphological changes (Fig. 1). At metaphase-anaphase transition, the chromosome pairs first line up to form the mitotic spindle plate and then quickly break apart from each other and race to the spindle poles (Fig. 2). The precision and concerted manner of the process is very striking. There is no doubt that a decisive switch is at work to ensure the event occurs rapidly, accurately, and completely. The central issue of cancer prevention is the fidelity of the cell cycle, that is, all eukaryotic cells must replicate their DNA during S phase, only replicate once per cell cycle, and distribute the resulting identical copies of genetic information to daughter cells at mitosis (Fig. 3). It is important to understand not only how the cell-division cycle is accomplished, but also how its precision is achieved. The high fidelity of mitotic chromosome transmission is necessary in order to ensure the genome stability. Usually errors occur once in 105–106 divisions. There are three major restriction
Fig. 2 A cell in anaphase. Lengthening microtubules push the two sets of chromosomes apart. Blue: chromosomes, green: mitotic spindle. (Image captured by Roy van Heesbeen posted on http://upload.wikimedia.org/wikipedia/commons/9/91/Anaphase_IF.jpg)
Cell Cycle Control and Model Organisms
27
Fig. 3 Two critical steps of the cell-division cycle: DNA replication and nuclear division. To produce healthy cells, eukaryotes must accurately replicate their DNA during S phase and precisely distribute the resulting copies of genetic information to daughter cells at mitosis
points or important transitions in the cell cycle: the start or a restriction point before the G1–S transition to initiate DNA replication, the G2–M transition to enter mitosis, and the metaphase– anaphase transition to exit from the mitosis (Fig. 4). These phase transitions are discrete points of cell cycle control. What is a phase transition of the cell-division cycle? It is a unidirectional change in the state of the cell cycle. The fidelity of the cell cycle requires that each phase transition occurs at the right time in the right order, which is stringently monitored. Two types of processes must be coordinated for a cell to divide. First, the initiation of a transition is dependent upon the completion of a previous transition. For example, the initiation of mitosis must be coupled to the completion of DNA replication, in order to exert the checkpoint control on the precise phase transitions. All eukaryotic cells synthesize their DNA during S phase, replicate DNA only once per cell cycle, and distribute the resulting identical copies of genetic information to daughter cells at mitosis. When mammalian cells such as baby hamster cells in S phase are treated with an inhibitor of DNA synthesis, for example, aphidocolin or hydroxyurea, the cells halt in S phase and will not progress into mitosis until the inhibitor is removed and DNA replication has been completed. However, in the presence of 2 mM caffeine, cells enter mitosis without finishing DNA replication, increasing the genomic instability of the cells [13]. These experiments indicate that incompletely replicated DNA blocks the onset of mitosis, while caffeine disconnects the coupling between DNA replication and mitosis. Second, the cell size must be coordinated with the progression of the cell-division cycle. Eukaryotic cells can complete cell cycle
28
Zhaohua Tang
Fig. 4 Phase transitions and restriction points of cell cycle control. Phase transitions are unidirectional changes in the state of the cell cycle. The three major transitions in the cell cycle are the start or a restriction point before G1–S transition to initiate DNA replication, G2–M transition to enter mitosis, and the metaphase–anaphase transition to exit from the mitosis
events such as DNA replication during S phase and chromosome segregation at mitosis in less time than it takes to double in size. If cells keep dividing without attaining a standard size, they would become smaller with each generation. Figure 5 shows the relationship between cell growth, cell size, and cell division in a free-living organism such as a yeast cell. If cell division continued at an unchanged rate when cells are starved, the daughter cells produced at each division would become progressively smaller and eventually be too small to be viable—mitotic catastrophe. Yeast cells have evolved the ability to respond to poor nutritional conditions by slowing the rate of cell division in the population — a cell size control. A cell cannot proceed past a specific point in the division cycle until it has attained a standard size; thus the rate of cell division slows down and cell size remains more or less unchanged.
Cell Cycle Control and Model Organisms
29
Fig. 5 The coordination of cell size and cell division in free-living yeast cells. Yeast cells have evolved the ability to respond to poor nutritional conditions by slowing the rate of cell division in the population—a cell size control. If cells keep dividing at an unchanged rate when cells are starved, the daughter cells generated at each division would become progressively smaller and eventually unviable, reaching catastrophe
3
Exploring Mechanisms of Cell Cycle Control in Different Model Organisms Although the fundamental mechanisms of the cell cycle have been conserved for a billion years, from yeasts to humans through evolution, various organisms possess different features in cell cycle regulation. The studies on the cell-division cycle have been conducted in diverse eukaryotic systems, but the significance of an analysis relies on the suitability of the model organism chosen for addressing the questions of interest in cell cycle. Importantly, cell cycle studies in different experimental systems allow us to assess the conservation and variation in the mechanisms of cell cycle regulation, gaining a comprehensive understanding of the cellular process fundamental for all eukaryotes. The most commonly used model organisms are unicellular yeasts, the early embryos of frogs and fruit flies, and mammalian cells in cell culture. What are the features of the cell cycle in these different organisms? What are advantages and disadvantages of each system used as a model organism to examine the regulation of the cell cycle? A comprehensive review of these model organisms with respect to cell cycle analyses is valuable for us to appreciate how our knowledge of cell cycle control has expanded, how the completion of genome sequences has empowered the established model organisms, as well as how systems biology and quantitative approaches influence the research of the cell cycle. Exciting possibilities are emerging and renewed emphasis on cell cycle analyses are created by the new technologies developed in the post-genomic era and research advances using these model organisms in the past decades.
30
3.1
Zhaohua Tang
Yeasts
3.1.1 An Overview
Yeasts belong to unicellular Ascomycota fungi, a branch of eukaryotes. More than 80,000 living fungi species have been described [1]. These include the models of great importance for genetics, Saccharomyces cerevisiae, Schizosaccharomyces pombe, Neurospora crassa, and Aspergillus nidulans, as well as animal and plant pathogens. The budding yeast Saccharomyces cerevisiae and the fission yeast Schizosaccharomyces pombe are unicellular and considered to be among the best genetically tractable organisms for a comprehensive understanding of biology. Budding yeast was the eukaryote whose genome was sequenced first in 1996 [14], followed by the genome sequence of fission yeast, which was completed in 2002 [15]. 5885 and 4914 protein-coding genes have been predicted in S. cerevisiae and S. pombe, respectively [14, 16]. Research employing these yeasts has made tremendous impacts on the elucidation of the biological principles of complex organisms. Moreover, comparative genome analysis suggests that S. cerevisiae and S. pombe diverged about 1 billion years ago [1]. Their genomes share no obvious synteny and are quite distinct in their biology (Fig. 6). S. cerevisiae was established as an experimental system earlier than S. pombe. It was the first eukaryotic organism to be transformed by plasmids, to have precise gene knockouts, and to have its genome sequenced. S. cerevisiae has also been the model eukaryote for pioneering research in chemical genomics [17–20].
Fig. 6 Morphology of fission yeast S. pombe and budding yeast S. cerevisiae under fluorescence microscopy. The images were acquired at room temperature with cells grown in rich medium. Red, DAPI (4′,6′-diamidino2-phenylindole) staining has been used to visualize DNA. (a) Schizosaccharomyces pombe cells. Blue, calcofluor has been used for detecting septa; green, a GFP (green fluorescent protein)-tagged RNA processing factor. (b) Saccharomyces cerevisiae cells. The image was captured by Dr. Gretchen Edwalds-Gilbert’s laboratory
Cell Cycle Control and Model Organisms
31
Although started later, research using S. pombe has been particularly influential in studies of cell cycle regulation, DNA damage/ repair mechanisms, and chromosome dynamics, including RNA interference (RNAi) [21]. Furthermore, the fission yeast S. pombe harbors less genome duplication compared with other eukaryotes so far sequenced and holds the smallest sequenced eukaryotic genome, which led to its rising popularity as a eukaryotic model in the last decade. Based on current information, out of 4914 protein coding genes in S. pombe, 3385 fission yeast proteins have one or more orthologues in humans (http://listserver.ebi.ac.uk/pipermail/pombelist/2013/003783.html). Therefore, investigators studying mammalian cell biology are increasingly using S. pombe to test their gene of interest, as it may be present in only one copy, bestowing fission yeast the nickname “micro-mammal” [22]. The equivalent logic can be applied to budding yeast S. cerevisiae, building the concept of surrogate genetics: testing a gene from one organism such as a human gene in the context of another model system such as yeasts to provide an assessment of the potential function of the gene [2]. A milestone case for a proof of principle is the substitution of a fission yeast cell-division cycle (cdc) gene, cdc2, coding for a master protein kinase in cell cycle regulation, by a human orthologous gene, CDC2 in a cross-species complementary assay [23]. (See later part of Subheading 3.1.) In fact, many methods now used for complex organisms were first developed and optimized in the yeast model organisms. Studying human protein homologs in yeasts allows researchers to extrapolate information about human proteins and gain insight into genetic networks that are more difficult to uncover in humans (reviewed in [24]). 3.1.2 The Haploid and Diploid State of Yeast Life Cycle
Both budding yeast S. cerevisiae and fission yeast S. pombe are able to exist in either a diploid or a haploid state. Although most strains of yeasts used in the laboratory are haploid strains, in the wilderness, budding yeast tends to live as a diploid, whereas fission yeast prefers to be in a haploid form. The proportion of the life cycle they spend in the diploid or haploid state varies, depending on the environment. When nutrients are plentiful, budding yeast proliferate as diploid cells [13]. If starved, they undergo meiosis to form haploid spores. The spores germinate to become haploid cells when conditions improve. These haploid cells can then either proliferate or conjugate in G1 phase to reform diploid cells. In contrast, fission yeast typically proliferate as haploid cells. They fuse in response to starvation to form diploid cells, and the diploid cells promptly undergo meiosis and sporulation. The spores hatch to regenerate the haploid cells when nutrients become available again [25]. Thus, the diploid and haploid states are two alternative ways for yeast cells to divide.
32
Zhaohua Tang
3.1.3 Advantages of Using Yeast Systems as Experimental Models
S. cerevisiae and S. pombe are especially suitable for biological research for a number of reasons. The two yeasts are non-pathogenic and thus safe to handle. Their reproduction cycles are fast and easy to monitor, with doubling times from 90 min for wild-type cells in rich medium to a few hours for mutant cells. Both yeasts lend themselves to diverse experimental approaches, from genetics to systems biology, cytological and biochemical, making them useful for comprehensive investigations of biological processes. Moreover, the available online resources for the yeast models (yeastgenome.org and pombase.org) and supporting research communities facilitate data analysis by researchers and students. Although the two yeasts differ from one another in a range of features, they share the fact that they have well-established and fast-evolving genetic tools. S. cerevisiae and S. pombe are genetically tractable and readily amenable to both classical and molecular genetic analyses. They have been used for decades in forward genetics, to identify genes important for a process of interest, including cell cycle regulation [26, 27]. They are also the only eukaryotes with collections of genome-wide gene deletions available [16], allowing systematic reverse genetic analyses for genotype–phenotype relationships. The functional analyses in budding and fission yeasts have been further facilitated by the availability of accurate and well-annotated genome sequences, since they entered the post-genomic era more than a decade ago [15, 28, 29]. A primary goal of any genetic screen or selection is to identify the players in a process of interest or a role of a gene product in such a process. The haploid phase of the yeast life cycle expedites the isolation of genes involved in a cellular process [30]. The haploid life cycle of the yeasts is particularly useful in determining the normal function of a gene, as it reveals a phenotype rendered by a recessive, loss-of-function mutation that is normally masked by the presence of the other allele in a diploid cell. Another advantage of yeast genetics is the availability of nutritional and drug markers. Inserting a marker, for example a marker that complements a specific nutritional requirement, in the gene locus of interest disrupts the gene and the subsequent expression of the marker can be conveniently selected for generating the null mutant. If successful, an auxotroph (supply-dependent) for a particular nutrient would be conferred a prototroph (self-sufficient) for that nutrient, confirming that the gene has been knocked out [31]. The isolation of cdc mutants in yeasts allowed scientists to identify important protein regulators in cell cycle. Since S. cerevisiae and S. pombe diverged from the common ancestor more than a billion years ago, they are not closer relatives to each other than to humans with respect to the evolutionary distance between them as to each to humans. The divergence between the two yeasts actually serves as a useful criterion when we explore the conservation of a cellular process. For example, if a relevant
Cell Cycle Control and Model Organisms
33
orthologue is identified in both yeasts, the corresponding gene or gene product is likely to be conserved in humans as well. S. cerevisiae and S. pombe differ from each other in a number of aspects, including cell cycle organization, heterochromatin, complexity of centrosomes and DNA replication origins, and the prevalence of introns [16]. The long evolutionary distance between the two yeasts makes their comparison beneficial for defining genes and processes common to all eukaryotes. On the other hand, the variation between the two yeasts in cellular processes, such as the regulation of the cell cycle, is valuable for us to inquire whether conserved or alternative mechanisms have been evolved to solve identical biological problems that all eukaryotes, including humans, face throughout evolution. 3.1.4 Distinct Features of the Cell Cycles in S. cerevisiae and S. pombe
Both S. cerevisiae and S. pombe undergo closed mitosis, during which the nuclear envelope does not break down. In contrast, most multicellular animal cells usually undergo open mitosis: the nuclear envelope breaks down (Fig. 7) [5]. Although both are yeasts, the cell cycles of S. cerevisiae and S. pombe have distinct features. Fission yeast cells go through a typical eukaryotic cell cycle with consecutive G1, S, G2, and M phases (Fig. 8). Conversely, the budding yeast cell cycle appears to consist of only clear G1 and S phases; the G2/M boundary is fuzzy, as spindle assembly starts to occur in S phase (Fig. 9) [13]. Therefore, the control at the G2–M transition is more visible in fission yeast S. pombe, while the G1–S transition—Start, is the major control of the cell-division cycle in budding yeast S. cerevisiae.
Fig. 7 Different morphologies of mitosis between yeasts and animal cells. Both S. cerevisiae and S. pombe undergo closed mitosis, at which the nuclear envelope does not break down; while most multicellular animal cells usually undergo open mitosis: the nuclear envelope breaks down
34
Zhaohua Tang
3.1.5 Fission Yeast (Schizosaccharomyces pombe) Cell Cycle
Two properties of fission yeast S. pombe make it especially suitable for analyzing the relationship between cell size and cell cycle. First, unlike budding yeast, fission yeast cells divide symmetrically by forming a septum in the middle of the cell, thus the cell size at a particular position of the cell cycle is well defined for a cell. Second, fission yeast cells grow only in length, not in diameter; measuring individual cell lengths provides a convenient and precise way of following cell growth during the cell cycle. Therefore, fission yeast as a study system permits detailed analysis of cell size as a parameter to follow cell cycle progression. Among the four phases of the cell cycle, G2 is the longest while G1 may be the shortest or least visible in fission yeast. Normally, after completing cytokinesis, two daughter cells are born passing G1 (Fig. 8). Consequently, G1/S control is not visible unless the cell entry into S phase is blocked. It is not surprising that most of cell-division cycle (cdc) mutants originally isolated from fission yeast arrest in G2. The G2–M transition in fission yeast therefore acts as a major control in the mitotic cell cycle. Because of its distinct cell cycle features, fission yeast has historically been used as a model organism for genetic studies of G2–M transition. The research in fission yeast S. pombe has contributed greatly to our understanding of the mechanisms of mitotic cell cycle control, especially for identifying key regulators such as Cdc2 protein kinase, Cdc25 tyrosine phosphatase, and Wee1 tyrosine kinase [5, 26, 32, 33].
Fig. 8 Features of the S. pombe cell cycle. Fission yeast cells have a typical eukaryotic cell cycle with consecutive G1, S, G2, and M phases. The major restriction point is at the G2–M transition
Cell Cycle Control and Model Organisms
35
Fig. 9 Features of the S. cerevisiae cell cycle. The budding yeast cell cycle appears to consist of only clear G1 and S phases; the G2–M boundary is blurry. The G1–S transition—Start, is the major control of the cell-division cycle 3.1.6 Budding Yeast (Saccharomyces cerevisiae) Cell Cycle
Since budding yeast S. cerevisiae divides asymmetrically by budding before entering S phase, it is convenient to follow the progress of the cell cycle in living cells by observing the size of the bud. A small bud forms early in the cell cycle of budding yeast. The bud enlarges continually and ultimately separates from the mother cell. Moreover, the ratio between the size of the mother and the bud gives a rough estimate of a cell’s position in the cell cycle. Since the bud appears after the Start, it provides a morphological marker for the event of G1–S transition. We can look at the cells under a microscope and examine the presence or absence of a bud and measure the bud size to assess the cell cycle progression, or a possible cell cycle arrest at the major control of cell cycle in budding yeast—G1–S transition [34].
3.1.7 Identifying Key Players in Cell Cycle Control Using Yeast Conditional Mutants
Our present understanding of the cell cycle regulation comes partly from a systematic search for mutations in genes encoding components of cell cycle machinery in yeasts [35, 36]. Geneticists analyze mutants to identify the genetic information responsible for specific traits. These approaches can be broadly grouped into two categories: forward genetics and reverse genetics. Forward genetic analyses begin by obtaining mutants that display a specific phenotype, followed by identifying the particular gene alteration(s) responsible for the observed trait. Reverse genetic analyses involve targeted
36
Zhaohua Tang
gene mutation(s) and observation of the resultant phenotype to determine the function of a specific gene. The logic of reverse genetics relies on a “reverse destructive” strategy—targeting a gene of interest for a loss of function mutation or deletion and observing the resulting phenotype. The possible role of the gene in the corresponding process can then be proposed. In this paradigm, each gene is analogous to a worker in an automobile assembly line. Removing a worker will have a car produced with some missing part [37]. These genetic methods allow researchers to identify and assemble a cast of players in phase transitions of the cell cycle. Once the gene(s) responsible for a trait has been identified, genetic studies can branch off in various directions to investigate the mechanisms of the gene function, including biochemical analysis of encoded proteins and determination of spatial and/or temporal expression patterns. One of the strengths of the yeasts as model organisms to study the cell cycle is the wealth of defined wild-type strains against which other isolated mutants can be compared [2]. Leland Hartwell and Paul Nurse began to search for mutations that affect the cell cycle in budding yeast and fission yeast, respectively in 1970s [35, 36]. They examined collections of temperaturesensitive (ts) mutants that specifically arrest at a discrete stage of the cell-division cycle or that divide at a smaller size at the restrictive temperature. What are ts mutants? Why would it not work to simply create a loss-of-function mutation or deletion of a gene? Since cell division is essential for viability, a haploid mutant that is unable to complete a cell-division cycle cannot be propagated. As result, a mutant would be lethal if it harbors a loss-of-function mutation or a null deletion in a gene that is required for completing the cell cycle. To circumvent this problem, conditional mutants are developed for identifying the genes involved in the cell cycle. Conditional mutants are the cells in which a gene product is inactive under one condition but not another. The most common conditional mutants used in cell cycle studies are temperature-sensitive, cell-division cycle (cdc) mutants. In a ts mutant the gene product can function at a lower temperature, the permissive temperature, but not at a higher, restrictive (or non-permissive) temperature. For yeasts, the permissive temperature is usually at room temperature (20–25 °C), and the restrictive temperature is 35–37 °C. Temperature-sensitive cdc mutants can be selected, isolated, and maintained only as conditional mutations. What are the distinct features of cdc mutants? Cells in a cdc mutant population growing at a permissive temperature are in various stages of the cell cycle and thus are asynchronous. After arresting at the same stage of the cell cycle at a restrictive temperature, they become synchronous (Fig. 10) and are ready to progress through the cell cycle synchronously upon being released from the block by shifting down from the restrictive to a permissive temperature. The affected genes in these mutants are called cdc genes, which may function in a particular phase transition of the cell cycle.
Cell Cycle Control and Model Organisms
37
Fig. 10 cdc mutants arrest at a specific stage of the cell cycle. Cells in a cdc mutant population growing at a permissive temperature are asynchronous in the cell cycle. at a restrictive temperature, they are blocked at a specific stage of the cell cycle and become synchronous. cdc2ts mutant cells are all arrest at G2–M transition at 36 °C, since cdc2+ gene is required for the cell entry into mitosis but it is not functioning at the restrictive temperature
In contrast, non-cdc mutants may be deficient in continuous processes such as ATP production, necessary for biosynthesis and growth throughout all phases; thus, it may halt at any stage of the cell cycle as soon as the ATP reservoir runs out. To identify genes that are directly involved in the control of the cell cycle, the search was focused on two mutant phenotypes. In the first type, all of the cells in the same mutant population arrest at the same point in the cell cycle—cdc phenotype at restrictive temperature. Cells blocked at the specific phase of the cell cycle in a particular cdc mutant population display similar phenotypes. For example, the mutations in CDC28 gene in budding yeast or cdc2 gene in fission yeast result in arrest at the restrictive temperature at G1–S or G2–M transition, respectively. The second type of mutations display the so-called wee (derived from a Scottish word for small) phenotype in fission yeast, as the mutants divides at a smaller size than normal cells [36]. The wee mutants are defective in gene products that normally inhibit passage through the G2–M transition without attaining a standard cell size [38]. It has been known that Wee1 protein mediates the control of cell size in response to the availability of nutrients in the external environment and internal synthesis cues, such as DNA replication.
38
Zhaohua Tang
Several dozens of cdc genes were originally identified in fission yeast and budding yeast by using forward genetics [34–36]. We now know probably more than hundreds of genes are cell cycle regulated by genome-wide analyses [39, 40]. In human HeLa cells, more than 500 genes are implicated in mitosis [41]. However, not all of these genes identified by the forward genetics approach are directly involved in regulating the cell cycle. In fact, among the genes originally identified as cdc genes, substantial numbers of those encode proteins that contribute to the mechanics of a cell cycle event, such as those that comprise the DNA replication machinery for completing S phase. They may not have a role in the regulation of cell cycle progression, such as DNA polymerases or enzymes that synthesize the precursors for DNA replication, for example. On the other hand, forward genetics has not exhausted the search for cell cycle regulators yet. Negative regulators of the cell cycle, extrinsic to cell cycle progression, including those that regulate checkpoints, would be overlooked, as the loss-of-function of those genes does not exhibit cdc phenotypes. Nonetheless, investigation of yeast cell cycle mutants revealed the cdc2+/CDC28+ gene product as a pivotal, decisive component for driving the cell into mitosis: when cdc2 is defective, mitosis fails to occur in fission yeast, leading to cell elongation (Fig. 11, upper part); while when CDC28 is not functional, cells arrest before the Start without a bud in budding yeast (Fig. 11, lower part). Conversely, if this master gene is released from the normal control, mitosis or S phase takes place prematurely in fission yeast or budding yeast, respectively. Most cdc mutants of fission yeast exhibit an altered cell length at a restrictive temperature. The majority of the cdc mutants are recessive, temperature sensitive and blocked at the G2–M transition before entry into mitosis at the restrictive temperature. Using this forward genetics approach, scientists discovered a cast of important players in cell cycle control, including Cdc2/Cdc28 and Wee1 protein kinases, as well as Cdc25 tyrosine phosphatase [38, 42]. The early studies of these mutants, defective in cell cycle progression, also revealed the order of the cell cycle events. If a cdc mutant is blocked in S phase without completing DNA synthesis, it cannot initiate a later phase such as mitosis. This sequential order of the cell cycle events underlines the concept of checkpoint pathways, which are a series of cell signaling events to ensure the proper order of phase transition in the cell cycle. The results of these genetic studies provide the evidence for the interdependence of the cell cycle events—the central idea of checkpoint control in celldivision cycle [43]. 3.1.8 The Cloning of the cdc Genes
Although the genetic studies of the cdc mutants, including tetrad analysis and genetic mapping, defined the discrete genes involved [35, 36], the molecular nature of the genes and the corresponding proteins encoded by these genes were not known. In-species complementation assays were used to clone several cdc genes crucial for
Cell Cycle Control and Model Organisms
39
Fig. 11 Schematic presentations of yeast mutants with cell cycle phenotypes. The upper part shows wild-type cells of fission yeast S. pombe at different stages of the cell cycle; cdc2ts and cdc25ts mutants are blocked at the G2–M transition at 36 °C, giving rise to cell elongation; wee1ts mutants dividing prematurely, resulting in small cell size [44]. The lower part illustrates asynchronous wild-type cells of S. cerevisiae budding yeast; CDC28 ts mutants arrest before the Start at the G1–M transition at 36 °C without budding [31]
the cell cycle regulation in yeasts [44]. For example, cloning the cdc2+ gene allowed the amino acid sequence of the Cdc2 protein to be deducted from the nucleotide sequence of the gene, providing valuable clues about its homology to protein kinases [45]. This clue was exciting to researchers in the field, because the pattern of protein phosphorylation had been known to change when cells enter mitosis, and it had long been suspected that maturationpromoting factor (MPF), identified in the frog embryos was a protein kinase. Generally, all the cdc genes can be cloned by using the complementation assay. We can clone a gene by isolating a DNA fragment that would complement a ts mutation phenotype. This logic should work for all systems in which tools of genetic manipulation are available for complementing the phenotype caused by mutations. One advantage of the approach is that the selection depends on functional rescuing rather than structural similarity. To clone the fission yeast cdc2+ gene, a library of plasmids containing fission yeast DNA fragments was introduced into cdc2ts cells, and the cells were then shifted from 25 °C to 35 °C [44]. Individual recipient cells could intake different plasmids from the library. The vast majority of cells received a plasmid that did not contain the cdc2+ gene and failed to divide and grow into colonies at 35 °C. But a small fraction of cells that received a plasmid containing the cdc2+ gene were capable of restoring the mitotic entry, thereby giving
40
Zhaohua Tang
rise to colonies. The plasmids were then recovered, amplified in bacteria, and used to determine the sequence of the gene. Other genes genetically interacting with cdc2+ may also be isolated by this method, such as the suppressor of cdc2+ gene, which may function in the same pathway as cdc2+ [46]. 3.1.9 Cloning of Orthologous Genes in Cell Cycle Regulation
The same logic of the in-species complementation assay can be applied to isolating orthologous genes in other organisms, the crossspecies complementation assay. In this assay, the source of the DNA containing a potential orthologous gene, is from an organism of interest. The gene selection is based on the ability of the gene to complement the phenotype of interest in yeasts. The first proof-ofprinciple work was the milestone work by Lee and Nurse, in which they successfully cloned the human cdc2+ gene, encoding the protein counterpart of Cdc2/Cdc28 protein [23]. The result demonstrates that human Cdc2 and fission yeast Cdc2 protein are true orthologues of each other, based not only on their sequence relationship, but also on their functional substitution. It provides convincing evidence for the conservation of the fundamental principles of cell cycle regulation for a billion years through evolution. Moreover, it also offers a new methodology to identify orthologues in diverse organisms. The strength of the method is the functional selection of orthologous genes, which surpasses the sequence-based selections.
3.2 Early Embryo of Frog (Xenopus laevis)
Many biological processes are best studied in cells that are specialized for particular tasks. For example, historically, studies on nerve cells have been a principal route to understanding the electrical properties of cells, and research in muscle have provided the foundation of our knowledge about how chemical energy is converted to movement. Eggs of the frog Xenopus laevis are a special type of cell very useful for cell cycle studies. The eggs of amphibians, marine invertebrates and insects are large cells and they divide very rapidly following fertilization in early embryo development. An oocyte of a frog Xenopus grows for many months in the ovary of the mother frog, without dividing, and finally matures into an egg. Upon fertilization, the egg cleaves very rapidly, initially at a rate of one cycle every 30 min, forming a multicellular tadpole within a day or two. The cells get progressively smaller as no growth can occur until the tadpole begins feeding. What is the distinguishing feature of early embryonic cell cycle in frog? In the early embryonic cycle, no cell growth occurs and each daughter cell produced from a cell division is half the size of the parent cell. Therefore, compared with the standard cell division, the duration of the frog egg cycle is extraordinarily short, only consisting of alternating S phase and M phase without intervening G1 or G2 phase (Fig. 12) [5, 13]. The first cell-division cycle of a frog embryo lasts 75 min and is followed by 11 synchronous cell cycles each 30 min long. The rapid cleavage pattern of the early frog embryo determines their unique features of cell division cycle.
Cell Cycle Control and Model Organisms
41
Fig. 12 Comparison of the early embryonic cell cycle with the somatic cell cycle. The somatic cell cycle consists of four phases while the early embryonic cell cycle alternates between S and M phases without intervening G1 and G2 phases
Because of the specialized rapid cell division of the frog embryo, they are very useful for studying the mechanisms of interphase–M phase transition. The early development of the frog X. laevis embryo provides a particularly powerful system to analyze the factors that drive cells into mitosis. A female frog is able to produce several thousands of eggs, which can be fertilized in vitro to produce a large population of embryos proceeding synchronously through several cell-division cycles. A frog egg is a large structure of about 1 mm in diameter. It has 100,000 times more cytoplasm than an average somatic cell and is a vast store of macromolecules, thus serving as a good resource for biochemically isolating protein factors of specific cell cycle stages. Since the 1970s a lot of what we know about the control mechanisms of the mitotic cell cycle has been learned from the studies on the interphase–M phase transition in the frog egg system [3]. 3.2.1 Identifying and Purifying MaturationPromoting Factor (MPF) in Frog Xenopus laevis Eggs
An inspiring way to illustrate the strength of the frog embryonic system is to revisit several experiments crucial for establishing the existence of a cytoplasm-based control activity and the molecular nature of the activity that operates in all dividing cells to initiate phase transitions in the cell cycle.
3.2.2 Xenopus Oocyte Injection Assay
A fully grown oocyte arrests in G2, when triggered by hormone, the oocyte matures into an egg and arrests in metaphase of the meiosis II. Fertilization releases the metaphase arrest, so that the egg completes its second meiotic division and enters the interphase of the first embryonic cell cycle. Since an immature oocyte arrests in meiotic G2, whereas a mature egg arrests in meiotic M phase, the
42
Zhaohua Tang
Fig. 13 Oocyte injection experiment. Injection of the cytoplasm from a mature egg in M phase into an immature oocyte in interphase induces the oocyte to become mature and enter M phase
abundant source of the cytoplasm can be extracted from these embryonic cells at defined stages of the cell cycle. Moreover, because of their big size, they are amenable for injecting materials such as a molecule of interest or protein lysates into them, or for extracting out of the cytoplasm. When M-phase cytoplasm from a mature egg is injected into a G2-phase immature oocyte, the oocyte is driven into M phase and completes its maturation (Fig. 13) [47]. The cytoplasmic activity identified in the assay was initially called maturation-promoting factor (MPF) because it induces the maturation of an immature oocyte into a mature egg. 3.2.3 Cell Fusion Experiment
Mammalian cells are generally not as large as frog oocytes; therefore, it is not as easy to use them for cytoplasmic injections. However, we can perform a logically equivalent test by fusing a mitotic cell with an interphase cell, so that the nucleus of the interphase cell is exposed to any active components present in the cytoplasm of the mitotic cell. In such experiments the interphase cell is directly driven into mitosis, no matter whether it is in G1, S, or G2, and whether it has replicated its DNA or not [48]. This cytoplasmic activity is also named MPF—M-phase-promoting factor. It became clear several years later that MPF plays a general role in mitotic induction in somatic cells of all eukaryotic cells from yeasts to humans [49–53].
3.2.4 Egg Splitting and Bouncing Egg Experiments
An activated frog egg can be constricted by a loop of fine human baby hair before it has completed the first division, so that it is split into two separate parts: one containing the nucleus, the other not. As expected, the nucleated part continues the normal program of rapid cleavages. Remarkably, the non-nucleated part also undergoes a series of oscillations, seen as repeated cycles of contractions with almost perfect synchrony with the cleavages of the nucleated part. Similar patterns were observed in the famous “bouncing frog egg” experiment presented at a cell cycle symposium in 1980 by
Cell Cycle Control and Model Organisms
43
Kirschner [3]. Frog eggs need fertilization to start rapid cleavages in nature. Alternatively, we can artificially “activate” frog eggs in various ways to initiate the mitotic cell cycle. In Kirschner’s experiments, he removed the nuclei from Xenopus oocytes and observed striking contractions of the enucleated egg, expanding as mitosis began and then contracting during interphase. The cycles of contractions seen in both egg-splitting and bouncing egg experiments are due to the activity of the MPF in the cytoplasm. The peak of the MPF activity overlaps with the onset of mitosis. These results provide evidence for MPF as a cytoplasmic oscillator in the cleaving Xenopus embryo. This oscillator operates even in the absence of a nucleus [3]. 3.2.5 Discovering Cyclins
Although the division cycles in the cleaving embryo can occur in the absence of DNA, they cannot occur in the absence of protein synthesis: blocking protein synthesis in early interphase prevents both the activation of MPF and the next mitosis. Protein synthesis was examined in sea urchin eggs by Tim Hunt. The fertilized eggs were incubated with water containing the radioactive amino acid, 35 S-methionine. Samples were removed at allocated time points and analyzed by SDS-PAGE (polyacrylamide gel electrophoresis). The experiment revealed a novel class of proteins, appearing in a periodic fashion, although most proteins in sea urchin eggs accumulate continuously after fertilization. The family of oscillating proteins increases steadily during interphase until the metaphase–anaphase transition, at which they are suddenly abolished. The proteins are thus given the name of cyclin because of their characteristic cycling pattern during the cell cycle [54]. The result suggests the possible model that one or more cyclins need to build up to a threshold concentration to activate MPF, and the destruction of cyclin is coupled to the inactivation of MPF and the cell exit from mitosis.
3.2.6 Reconstituting Cell Cycle Events in Cell-Free Extracts of Frog Xenopus laevis Eggs
The reconstitution of a biological process in a cell-free system is an ultimate goal of biochemical research to study the mechanism of a biological process at a molecular level. The frog egg has several unequaled advantages for such an approach. It is essentially pure cytoplasm, containing stockpiles of cellular components. It arrests as a single state of the cell cycle, either in G2 phase as an immature oocyte or in M-phase as a mature egg, and it can be made to go from one state to the other state of the cell cycle by adding purified molecules. Cell-free extracts were developed in 1980s to reproduce cell cycle events in vitro. Activated frog eggs are broken open by centrifugation. The undiluted cytoplasm is then collected. Sperm nuclei are added together with ATP to monitor the alternating M phase and interphase in the “cycling” extracts [55]. How is the alternating M phase and interphase monitored in the Xenopus egg extracts? The sperm nuclei undergo decondensation in interphase and condensation at the onset of the
44
Zhaohua Tang
Fig. 14 Reproducing mitotic cell cycle in a cell-free system of frog egg extracts. The sperm nuclei undergo de-condensation in interphase and condensation at the onset of the mitosis, in parallel with nuclear envelope disassembly and reassembly, respectively, serving as an indicator to distinguish interphase and M phase. These morphological changes can be observed under a fluorescence microscope to follow the cell cycle events occurring in the cell-free system
mitosis, in parallel with nuclear envelope disassembly and reassembly, respectively, serving as an indicator to distinguish interphase and M phase. The extracts reproduce the events of conversion between the two phases. We can observe these morphological changes under a fluorescence microscope to follow the cell cycle events occurring in the cell-free system (Fig. 14). This system makes it possible to characterize functionally the role of a protein in the interphase–M phase transition. An inhibitor slows down the transition, while an activator speeds up the transition. The long arduous work to purify MPF from the M-phase extracts was accomplished utilizing this “biochemically tractable” system, as the MPF-enriched fractions of the extracts induce the conversion from interphase to mitosis in the extracts [56]. One culminating work was using the frog egg extracts, depleted of endogenous transcripts and adding cyclin mRNA back to the extracts, to elegantly demonstrate that cyclin alone fulfilled the entire protein synthesis requirement of the interphase–M phase transition. Therefore, cyclin is the only protein needed, rather than total protein synthesis, for the onset of the mitosis [57]. Furthermore, the linkage of MPF to Cdc2 and ultimately to cyclin was also established in this biochemical assay system [58]. The studies using the system provide insights into the molecular nature of the MPF and the control mechanisms of the mitotic transition. 3.3 The Fruit Fly Drosophila melanogaster
Fruit Fly Drosophila melanogaster is a valuable model organism for cell cycle studies. The components of the cell cycle control system in Drosophila are structurally and functionally similar to humans. Particularly, both fruit flies and humans share common developmental and physiological constrains that are unique for multicellular organisms [59]. The generation time of Drosophila is 2 weeks and it is relatively easy to grow and maintain them in a laboratory.
Cell Cycle Control and Model Organisms
45
Drosophila has a genome size of about 14,000 genes, which is 2–3 times of yeasts and about half the number in humans. Efficient genetic tools are established and available in Drosophila to identify and analyze the genes involved in regulation and progression of the cell-division cycle [60], although the diploid chromosome content makes the subsequent characterization of these genes more complex than the haploid yeasts. An early Drosophila embryo undergoes rapid and synchronous nuclear divisions after the fusion of egg and sperm nuclei to give rise to a zygote nucleus. These divisions each last less than 10 min and proceed without gap phases, resulting in a syncytium, in which many nuclei share the same cytoplasm. The nuclei subsequently move to the surface of the embryo after nine divisions and start cytokinesis to form about 6000 cells at the end of the 13th division. The synchronous progression of the nuclear division in early Drosophila embryos provides a good resource to isolate important regulators of the cell cycle. However, the analysis of a mutant phenotype in such system is complicated by the presence of maternal gene products, required for completing the first 13 divisions. Consequently, mutations in a zygotic gene may not generate a visible phenotype until the stock of the maternal gene products is depleted. 3.4
Mammalian Cells
Although the fundamental principles of cell cycle control are studied efficiently in simpler systems including yeasts and Drosophila, it cannot supersede the research in the mammalian cell cycle. Only in mammalian cells can we ultimately decipher the complex circuits regulating the cell cycle. However, in complex multicellular organisms such as humans, various cells divide at very different rates. The cells that line our intestine live only 3 days and must be constantly replaced by the division of precursor cells. On the other hand, the life span of liver cells is more than a year, thus cell division in this organ is rare. The cell cycle in mammalian cells varies greatly. The variability in the length of the cell cycle of different cells occurs mainly in G1 and G2. It reflects the ability of cells to exit from the cell cycle during either G1 or G2 phase (Fig. 15). Many cells can withdraw from the cell cycle, entering G0 or a stable G2 arrest. Cells in G0 have left the cycle after division but before the restriction point at the G1–S transition. These cells account for most of the non-growing, non-proliferating cells in the human body. Some cells such as epidermal cells leave the cycle during G2 and arrest without growth or proliferation [5]. It is difficult to study cell proliferation in intact multicellular animals; therefore, most studies of cell cycle control are performed on cells proliferating in culture. The tissue culture studies on the cell cycle contribute to our understanding of cancer development at a cellular level. Insights into the regulation of cell growth and proliferation in mammals have been provided by studies of cell lines and transformed cancer cells in cell culture. No matter how different
46
Zhaohua Tang
Fig. 15 Features of the cell cycle of human cells. The human cell cycle varies in length. The variability reflects the ability of cells to exit from the cell cycle during either phase of G1 or G2
individual paths of cancer development are from each other and how diverse the origins that cancer derives from, all cancer cells abandon normal growth regulation and continuously cycle. Cancer cells proliferate excessively and give rise to malignant tumors. In essence, cancer is a cellular disease in multicellular organisms and uncontrolled cell proliferation is the hallmark of cancer. Usually, multiple genetic changes are necessary to affect properties of cell growth and proliferation that eventually lead to cancer. Several properties are used as parameters to judge the normality of cells in culture: ●
●
●
●
●
Limited generation time and death at crisis—a point at which most of the cells die. Anchorage dependence—cells need a firm surface to attach to. Serum dependence or growth factor dependence—serum that contains growth factors is essential for cell proliferation. Density-dependent inhibition—cell growth is inhibited via cell–cell contact. Cell shape—cells are usually flat and extended on the growth surface due to the cytoskeletal organization.
Growth of normal cells result in a monolayer in culture because of these properties. Primary cells, immortal cell lines and transformed cell lines have been used to study cell cycle control in tissue culture environment.
Cell Cycle Control and Model Organisms
47
3.4.1 Primary Cells Reach Replicative Senescence in Culture
Ideally, cells freshly removed from animals—primary cells are used. Primary cells are the immediate descendants of cells taken directly from an animal organism. We can culture them in plastic dishes with medium containing nutrients and growth factors. Although primary cells faithfully mimic the in vivo properties, they can only survive for a relatively short period in culture. Human primary cells usually divide 25–50 times in culture before reaching replicative senescence or a crisis. The proliferative life span of mouse cells is even shorter—about 15 generations of cell divisions [61]. The replicative senescence probably caused by telomere degeneration and the culture condition that drastically differs from the normal environment of the animal body [62]. The limitation of the life span of most primary cells makes it necessary to also explore options of employing non-transformed cells—immortal but not transformed cell lines, even if it is not perfect.
3.4.2 Cultured Cell Lines
To examine the pathways and aberrant events that enable cells to bypass normal cell cycle controls and develop tumors, we need to recognize the differences in proliferation properties among primary cells, immortal and transformed cell lines in culture. During cell adaptation to culture environment, cells may first convert to immortal cell lines, continue to evolve and finally become transformed, in which the aforementioned characteristics of primary cells are completely lost. Cells in an established cell line can divide indefinitely. Cell lines are evolved through a step of immortalization. When the growth of primary cells from a vertebrate animal ceases in culture, reaching replicative senescence—a crisis, the majority of the cells die. However, among them a few cells survive the crisis, keep proliferating, and eventually form a line of endless dividing cells. Although changed to become immortalized, the cells in such a cell line still remain non-tumorigenic and display the other features similar to those of primary cells. As these cell lines can perpetuate endlessly, they may continue to change while adapting to the culture environment. They may lose anchorage dependence for growth on solid surfaces, gain the ability to grow without serum supply, and become insensitive to contact inhibition and form multiple layers of cells—tumor foci in culture. The last stage of transformation is metastasis, at which point, cells become mobile and are capable of migrating to new sites, establishing new colonies in culture [5]. Fully transformed cells capture the malignancy of cancer—the ability to invade normal tissue. The combined changes of cell immortalization and transformation in culture provide a paradigm for cancer development at the cellular level. An assay that is commonly used to identify transformation agents is called the transfection assay. The assay is based on the ability of a molecule to convert a “normal” cell line into a transformed cell line. Many oncogenes/proto-oncogenes harbored in retrovirus and tumor DNA have been identified and isolated by using the transfection assay [63]. In contrast, it is difficult to
48
Zhaohua Tang
identify tumor-suppressor genes using the transfection assay, due to the recessive nature of the mutations, unless both alleles in the cell are altered. Certain steps converting normal cells into transformed cells may provide models for the process of cancer development. Although studies using normal and transformed cell lines in culture contribute to our understanding of cell cycle controls and cancer development at a cellular level, we must keep in mind that these cell lines have changed to form distinct identities from primary cells. Even normal cell lines can only serve as an approximate mimic of in vivo controls. All cell lines, normal or transformed, are consequences of genetic changes that affect cell cycle control. 3.4.3 New GeneManipulation Tools in Mammalian Cells
4
The large size of mammalian cells makes them excellent for cytological and biochemical analyses of the cell cycle. Traditionally, the main drawback of the mammalian cell system is the lack of efficient means for genetic manipulations. Development of two methodologies has opened immense potential for genetic analyses in mammalian cells: systematic gene deletions using small-interfering RNAs (siRNAs) and gene editing, regulating and targeting employing the clustered, regularly interspaced, short palindromic repeat (CRISPR) technology [64, 65]. There has been success in using the siRNAs approach in cell cycle studies, including an exceptionally large-scale project by Neumann et al. [41]. In this work, Neumann et al. reduced protein expression with siRNA from 21,000 genes, used time-lapse microscopy to measure defects in mitosis, and identified more than 500 genes implicated in mitosis. Although the siRNA method is versatile, it may suffer from partial knockdown and off-target effects [66]. These problems render this method less straightforward for assigning gene functions compared with complete gene ablation in yeasts. CRISPR-Cas systems are RNA-guided nucleases, such as Cas9, derived from adaptable immune mechanisms used by many bacteria to protect themselves from foreign nucleic acids including viruses and plasmid DNAs. The guide RNA assembles into complexes with Cas9 and target the nuclease to a specific DNA sequence by base pairing. The programmable feature of the DNA-targeting system enables researchers to efficiently modify endogenous genes in many cell types and organisms including mammalian cells, which are traditionally challenging for genetic manipulations [65].
Diverse Biological Systems, Conserved Mechanisms: A Historic Perspective Before the genomics era of the 1990s, cell division was mainly studied using genetic manipulations in yeasts and biochemical analyses of early embryonic cell divisions in frog eggs. Isolating yeast mutants with perturbed cell cycle control helped identify genes involved in the sequential execution of cell cycle phase
Cell Cycle Control and Model Organisms
49
transitions. In early development, the rapid cleavage of frog eggs and the cell-free extracts proved useful in biochemically characterizing a key cell cycle regulator: MPF, whose activity oscillated in synchrony with the mitotic cycle. These different approaches led to two seemingly distinct models: the domino model in yeasts and the clock model in frog eggs. The domino model emphasizes the interdependence of the cell cycle events or phase transitions, whereas the clock model envisions a cytoplasmic timer controlling the onset of mitosis, which is independent to other events in the cell cycle. The divergent models were originally proposed based on research in yeasts and early embryonic frog cells, respectively. The identification of the proteins with crucial functions in both models allowed scientists to reconcile the divergent models, and highlights fundamental principles of cell cycle regulation that are exquisitely conserved through evolution in all eukaryotic organisms. 4.1 Lessons from Yeasts: The Domino Model
In the 1970s, Paul Nurse and Leland Hartwell pioneered the search for mutations that affect the cell cycle in fission yeast and budding yeast, respectively [35, 36]. They identified mutants based on either the aforementioned phase-specific arrest, so-called cdc phenotype, or on the abnormally small cell size phenotype, known as the wee mutants. The mutants identified in both yeasts are temperature-sensitive (ts). Using this genetic approach, researchers identified a cast of vital players in cell cycle control, including the genes encoding Cdc2, Wee1 protein kinases, as well as Cdc25 tyrosine phosphatase. The discoveries also provide the basis for the concept of checkpoint control of cell division [34, 43]. If mutant cells lose a functional gene necessary for completing an early phase, they cannot proceed to the later phases. The interdependence of cell cycle events ensures that each phase transition of the cell cycle occurs at a specific time and in a defined order. Thus, the initiation of a later cell cycle phase is dependent on the proper completion of a prior phase, known as the domino model of cell cycle regulation. This sequential order of the cell cycle events is achieved through a series of cell signaling events; checkpoint pathways for the faithful phase transitions of the cell cycle.
4.2 Lessons from Frog Eggs: The Clock Model
The rapid cleavage of early Xenopus laevis eggs and the frog egg extracts provide a valuable system to functionally analyze and purify the factors that drive a cell into mitosis. It is this model organism that enables researchers to biochemically purify MPF and functionally identify the key regulators of the cell cycle including, Cdc2, later named as cyclin-dependent kinase1 (Cdk1), Cdc25 tyrosine phosphatase, and Wee1 tyrosine kinase. The tight timing of the onset of mitosis in early frog embryos indicates a fast biochemical switch responsible for speedy and accurate phase transition. Remarkably, in the egg-splitting and bouncingegg experiments, the eggs underwent a series of oscillations, seen as
50
Zhaohua Tang
repeated cycles of contractions with almost perfect synchrony as to the onset of mitosis. Since the driving force for cell entry into mitosis had then been identified as MPF and MPF peak activity overlaps with the onset of mitosis, scientists soon established that the surge or fluctuation of the MPF activity, occurring every 30 min in the cleaving frog Xenopus embryo, acts as a cytoplasmic oscillator or a cytoplasmic timer/clock. In fact, this clock continues ticking even in the absence of a nucleus [3]. The results from biochemical studies in early frog embryos apparently suggest a very different mechanism of cell cycle regulation—what is known as the clock model. In this model, the timing for the onset of mitosis is controlled by the MPF activity that resides in the cytoplasm and is turned on every 30 min, independent of other cell cycle events. 4.3 Reconciliation of the Two Divergent Views
Are the governing principles of the cell cycle conserved in different organisms through evolution? Is there any generality in cell cycle regulation? The genetic isolation and analysis of cdc mutants in yeasts revealed a fundamental nature of cell cycle control—the execution of late events depends on the prior completion of early events. This concept has become the theme for the domino model. In contrast, the rapid contractions of an enucleated Xenopus egg illustrated a cytoplasmic clock that sets the timing of mitotic entry, representing the idea known as the clock model. The domino model suggests that the cell cycle events are interdependent, whereas the clock model implies that the timing for cell entry into mitosis is not influenced by other events. Back in the 1980s, researchers conducting cell cycle analyses in yeast and frog eggs using different experimental systems, mainly genetic and biochemical, were mutually impressed by each other’s accomplishments, depth of thinking and cleverness of approaches at conferences, yet walked away disappointingly seeing little commonality in the cell cycle among different organisms [3, 34]. The clues about the functional links of the genetic and biochemical approaches came from the molecular identifications of the key players in cell cycle regulation. Genetic studies in yeasts identified a central gene in the network of cell cycle control: cdc2+ in fission yeast and CDC28+ in budding yeast. Budding yeast CDC28+ gene transformed into fission yeast cdc2 ts mutant could rescue its elongation phenotype and restore the normal cell cycle, establishing that Cdc2 and Cdc28 proteins are functionally equivalent in the yeasts. Cdc2/Cd28d is thus crowned as the master regulator of the cell cycle in yeasts, just like the royal status of MPF in frog eggs. A giant leap came in 1987. Using the same cross-species complementation assay, Melanie Lee and Paul Nurse discovered the human counterpart of fission yeast cdc2+, based on the ability of human CDC2+ to entirely replace the function of cdc2+ in fission yeast. All three homologous genes, cdc2+ in fission yeast, CDC28+ in budding yeast and CDC2+ in humans, appeared to be
Cell Cycle Control and Model Organisms
51
closely related protein kinases. “One small step for yeast…one giant leap for mankind,” reflects the significance of the result and the promising potential of utilizing yeasts as model organisms for rapid understanding of cell cycle control in humans (www.nature. com/celldivision/milestones/full/milestone11.html). Since Cdc2 is evolutionarily conserved from yeast to humans, the next logical question is: how are Cdc2/Cdc28 proteins in yeasts related to MPF in animal cells? Scientists in the field suspected that MPF in frog eggs and mammalian cells might also be a master protein kinase in charge of protein phosphorylation cascades. As long predicted, MPF isolated from the frog extracts was finally confirmed as a specific protein kinase. In fact, it was further defined as a two-subunit protein complex, the catalytic subunit being a protein kinase with a size of 34 kDa. Using clever heterologous strategy, scientists introduced the fission yeast Cdc2 protein into frog egg extracts, and found that the 34 kDa component of frog MPF was actually the same kinase as the Cdc2 protein in fission yeast [58]! The frog eggs and yeast cells, which originally appeared dramatically different, are fundamentally the same in the master regulator of the cell cycle. It has been one of the most unifying discoveries in cell biology—the fission yeast Cdc2 protein, budding yeast Cdc28 protein, and MPF in Xenopus are all related serine-threonine protein kinases. The master kinase that triggers downstream events for mitotic transition consists of two proteins: cyclin-dependent kinase1 (Cdk1/Cdc2) and a regulatory subunit, cyclin. To form an activated MPF at the G2–M transition, Cdc2 (the 34 kDa protein subunit of MPF) is associated with cyclin B (the 48 kDa protein subunit of MPF). The two views of cell cycle regulation were finally unified at the identification of the molecular identity of MPF: the same protein kinase is required for cell entry into mitosis in both yeasts and animals. Furthermore, different Cdks control the onset of S phase and M phase, acting as a “cell cycle engine” [5]. This conclusion is both satisfying and surprising for two reasons. Firstly, there is a wide evolutionary distance between yeasts and vertebrates. Secondly, the morphological events of mitosis are significantly distinct between yeast and animal cells. In yeasts, “closed” mitosis takes place without disassembly of the nuclear envelope, while in animal cells, “open” mitosis occurs with breakdown of nuclear membrane in despite of the drastic differences from singlecellular to multicellular eukaryotes including humans, the function of the master kinase is conserved. Therefore, in many diverse biological systems, the main components of the cell cycle machinery for phase transitions are fundamentally the same [3, 26]. The domino model and clock model reflect the mechanisms in specialized cell types, proliferating cells and early embryos, respectively. The specific mechanisms governing the functions of these regulators, as well as the complexity of the signaling pathways may vary with
52
Zhaohua Tang
phase transitions, developmental stages, organisms, and environment. These distinct aspects of cell cycle regulation constitute fascinating areas for further research.
5
Gaining a Comprehensive Understanding of Cell-Division Cycle The fundamental theme controlling the cell-division cycle underlies the growth, development, and reproduction of all eukaryotes. A comprehensive understanding of the molecular regulatory mechanisms is one of the most important goals of modern cell biology. In the past decades, we have seen remarkable advances in our understanding of cell cycle control. These advances are built mainly on the knowledge gained from studying the cell cycle in different model organisms using various experimental approaches. Given the conservation of the cell-division cycle through evolution, the findings in these simpler model organisms are relevant to the control mechanisms in humans. Researchers also explored the cell cycle regulation in the context of development, tumorigenesis, and human diseases, proving the value of model organism research for meeting the critical translational challenges of the current age. One singe model organism alone with one specialized experimental approach, genetic, cytological, or biochemical would not have led us to what we know now about cell cycle regulation. One particular model would be imperfect for addressing all questions about cell cycle control. Informative comparisons of cell cycle regulators in different organisms allow the identification of gene products that are implicated more universally in a cell cycle event or phenomenon [67]. These comparisons also provide a logical route to reduce system biases inherent in individual organisms. Successful examples include, the converging of the diverging domino and clock models, as well as the level changes of certain RNAs at the transitions of cell cycle stages in a conserved manner in multiple organisms [40]. The cell-division cycle as a vital process of life is complex and dynamic. Many interacting components involved are prone to unexpected outcomes, reflecting emergent properties characteristic of life. Lots of challenging questions about the cell cycle still await us to answer them. Even certain control circuits of the cell cycle have emerged from the research in the past decades, to reveal that the linkages in the network are not always hard-wired. How and when they may break, reform, or connect to new components, remain elusive. In addition, often, cell cycle regulators such as protein kinases, have pleiotropic roles. Also, little is known about the unique benefit provided by the redundancy of gene functions in cell cycle networks. Uncovering these genetic interactions would have a special impact on cancer treatments, which could result in synthetic lethal interactions [2]. A comprehensive understanding of the celldivision cycle is necessary to further our knowledge about the important processes of biology.
Cell Cycle Control and Model Organisms
53
Yeasts with small genomes of 5000–6000 genes are relatively straightforward organisms for use in systems genomic analyses. The availability of genome-wide gene deletion collections, as well as other methods for forward genetics, allows the identification of as many genes involved in cell cycle control as possible [2, 16]. Discoveries in zinc-finger nucleases (ZFNs), transcription activator-like effector nucleases (TALENs), and more lately clustered regulatory interspaced short palindromic repeats (CRISPRs), make it possible for targeted genome editing in all organisms including human cells. The application of bioinformatics procedures would enable us to link the genes identified with specific biochemical and molecular functions. Employing stable-isotope labeling of amino acids in culture (SILAC) for global analysis of Cdk1 substrate phosphorylation sites sets an elegant example of chemical genomics for signaling pathways in cell cycle regulation [68, 69]. Quantitative methodologies have been developed to manage large database sets, in addition to the development of mathematical modeling as a tool for analyzing cell cycle control networks [70, 71]. The new technologies have empowered cell cycle studies in the model organisms to investigate the regulatory mechanisms at a higher level with respect to cellular phenomena and morphologies, changes in the gene expression program, protein modification and protein degradation at large scales and in a cell cycle-dependent manner. Because of the progress in genome annotation and the conservation of the cell cycle throughout evolution, orthologous genes or proteins from a variety of organisms in a range of situations can be compared extensively at a level that was never possible decades ago. It is no longer a fantasy to test a human gene in yeasts to determine its potential function in the cell cycle—surrogate genetics. Although researchers have enriched their common toolboxes and reagents by working with individual model organisms to fulfill their goals in scientific discovery, they are becoming more integrated into larger communities than before. Changes in technologies and the applicability of new methodologies have renewed interests and opened exciting opportunities in cell cycle studies using different model organisms, allowing the gain of a comprehensive understanding of the fundamental processes of all eukaryotes. Biological research is used to relying on a small number of traditional model organisms. The species chosen are usually based on their amenability for experimental approaches to investigate biological problems ranging from genetics, cell biology, biochemistry, development, and evolution. Advances in genome sequencing and editing, proteomics, quantitative analyses, as well as systems biology approaches are reshaping our concept of a model organism. The introduction of next-generation sequencing technology has changed the landscape of genetics [72]. The capability of processing millions of sequence reads in parallel, in much shorter time periods, with lower costs than conventional sequencing methods, also
54
Zhaohua Tang
influences the cast of potential model organisms. The living species used in biological research have been vastly expanded from relatively small numbers, to a large variety of organisms. New species have been introduced to laboratories as emerging model organisms, including Butterfly (Bicyclus anynana), Cricket (Gryllus bimaculatus), Fruit Bat (Carollia perspicillata), Social Ameba (Dictyostelium discoideum), and Tomato (Solanum lycopersicum) [73]; just name a few. For example, tiger pufferfish is characterized as a vertebrate model with a compact genome [74]. We have entered a new era of model organism development, in which expansion of model organisms, comparison among and refinement of the established model organisms will be driven by both exciting biological questions and fascinating advancements of technologies. The new technologies provide a broad evolutionary perspective of cell-division regulation and allow informative comparisons among different species at a level that has never been possible, exerting unimaginable impact on our comprehensive understanding of cell cycle regulation.
Acknowledgement I thank my colleagues at Keck Science Department, Claremont Colleges, CA, Dr. Gretchen Edwalds-Gilbert for providing an image of budding yeast S. cerevisiae; Dr. Bryan Thines and Dr. Babak Sanii for reading and the feedback on the manuscript. I also thank Dr. Louise Weston for editing and the feedback on the manuscript. References 1. Hedges SB (2002) The origin and evolution of model organisms. Nat Rev Genet 3:838–849 2. Rine J (2014) A future of the model organism model. Mol Biol Cell 25:549–553 3. Kirschner M (1992) The cell cycle then and now. Trends Biochem Sci 17:281–285 4. Nurse P (2000) A long twentieth century of the cell cycle and beyond. Cell 100:71–78 5. Murray A, Hunt T (1993) The cell cycle: an introduction. Oxford University Press, New York, NY 6. Morgan DO (2007) The cell cycle: principles of control. New Science Press Ltd, London 7. Mukherjee S (2011) The emperor of all maladies: a biography of cancer. Scribner, New York, NY 8. Bianconi E, Piovesan A, Facchin F, Beraudi A, Casadei R, Frabetti F, Vitale L, Pelleri MC, Tassani S, Piva F, Perez-Amodio S, Strippoli P,
9.
10.
11. 12. 13.
14.
Canaider S (2013) An estimation of the number of cells in the human body. Ann Hum Biol 40: 463–471 Fischbach GD, Fischbach RL (2004) Stem cells: science, policy, and ethics. J Clin Invest 114:1364–1370 Yamanaka S (2007) Strategies and new developments in the generation of patient-specific pluripotent stem cells. Cell Stem Cell 1:39–49 Vaux DL, Korsmeyer SJ (1999) Cell death in development. Cell 96:245–254 Zimmer C (2007) Evolved for cancer? Sci Am 296:68–74, 75A Alberts B, Johnson A, Lewis J, Raff M, Roberts K, Walter P (2007) Molecular biology of the cell. Garland Science, New York, NY Goffeau A, Barrell BG, Bussey H, Davis RW, Dujon B, Feldmann H, Galibert F, Hoheisel JD, Jacq C, Johnston M, Louis EJ, Mewes
Cell Cycle Control and Model Organisms
15.
16.
17.
18.
19.
HW, Murakami Y, Philippsen P, Tettelin H, Oliver SG (1996) Life with 6000 genes. Science 274(546):563–567 Wood V, Gwilliam R, Rajandream MA, Lyne M, Lyne R, Stewart A, Sgouros J, Peat N, Hayles J, Baker S, Basham D, Bowman S, Brooks K, Brown D, Brown S, Chillingworth T, Churcher C, Collins M, Connor R, Cronin A, Davis P, Feltwell T, Fraser A, Gentles S, Goble A, Hamlin N, Harris D, Hidalgo J, Hodgson G, Holroyd S, Hornsby T, Howarth S, Huckle EJ, Hunt S, Jagels K, James K, Jones L, Jones M, Leather S, McDonald S, McLean J, Mooney P, Moule S, Mungall K, Murphy L, Niblett D, Odell C, Oliver K, O’Neil S, Pearson D, Quail MA, Rabbinowitsch E, Rutherford K, Rutter S, Saunders D, Seeger K, Sharp S, Skelton J, Simmonds M, Squares R, Squares S, Stevens K, Taylor K, Taylor RG, Tivey A, Walsh S, Warren T, Whitehead S, Woodward J, Volckaert G, Aert R, Robben J, Grymonprez B, Weltjens I, Vanstreels E, Rieger M, Schafer M, Muller-Auer S, Gabel C, Fuchs M, Fritzc C, Holzer E, Moestl D, Hilbert H, Borzym K, Langer I, Beck A, Lehrach H, Reinhardt R, Pohl TM, Eger P, Zimmermann W, Wedler H, Wambutt R, Purnelle B, Goffeau A, Cadieu E, Dreano S, Gloux S, Lelaure V et al (2002) The genome sequence of Schizosaccharomyces pombe. Nature 415:871–880 Kim DU, Hayles J, Kim D, Wood V, Park HO, Won M, Yoo HS, Duhig T, Nam M, Palmer G, Han S, Jeffery L, Baek ST, Lee H, Shim YS, Lee M, Kim L, Heo KS, Noh EJ, Lee AR, Jang YJ, Chung KS, Choi SJ, Park JY, Park Y, Kim HM, Park SK, Park HJ, Kang EJ, Kim HB, Kang HS, Park HM, Kim K, Song K, Song KB, Nurse P, Hoe KL (2010) Analysis of a genomewide set of gene deletions in the fission yeast Schizosaccharomyces pombe. Nat Biotechnol 28:617–623 Parsons AB, Lopez A, Givoni IE, Williams DE, Gray CA, Porter J, Chua G, Sopko R, Brost RL, Ho CH, Wang J, Ketela T, Brenner C, Brill JA, Fernandez GE, Lorenz TC, Payne GS, Ishihara S, Ohya Y, Andrews B, Hughes TR, Frey BJ, Graham TR, Andersen RJ, Boone C (2006) Exploring the mode-of-action of bioactive compounds by chemical-genetic profiling in yeast. Cell 126:611–625 Hillenmeyer ME, Fung E, Wildenhain J, Pierce SE, Hoon S, Lee W, Proctor M, St Onge RP, Tyers M, Koller D, Altman RB, Davis RW, Nislow C, Giaever G (2008) The chemical genomic portrait of yeast: uncovering a phenotype for all genes. Science 320:362–365 Hoon S, St Onge RP, Giaever G, Nislow C (2008) Yeast chemical genomics and drug
20.
21.
22. 23.
24.
25.
26.
27.
28.
29.
30.
31.
32.
55
discovery: an update. Trends Pharmacol Sci 29:499–504 Costanzo M, Baryshnikova A, Bellay J, Kim Y, Spear ED, Sevier CS, Ding H, Koh JL, Toufighi K, Mostafavi S, Prinz J, St Onge RP, VanderSluis B, Makhnevych T, Vizeacoumar FJ, Alizadeh S, Bahr S, Brost RL, Chen Y, Cokol M, Deshpande R, Li Z, Lin ZY, Liang W, Marback M, Paw J, San Luis BJ, Shuteriqi E, Tong AH, van Dyk N, Wallace IM, Whitney JA, Weirauch MT, Zhong G, Zhu H, Houry WA, Brudno M, Ragibizadeh S, Papp B, Pal C, Roth FP, Giaever G, Nislow C, Troyanskaya OG, Bussey H, Bader GD, Gingras AC, Morris QD, Kim PM, Kaiser CA, Myers CL, Andrews BJ, Boone C (2010) The genetic landscape of a cell. Science 327:425–431 White SA, Allshire RC (2008) RNAi-mediated chromatin silencing in fission yeast. Curr Top Microbiol Immunol 320:157–183 Forsburg SL, Rhind N (2006) Basic methods for fission yeast. Yeast 23:173–183 Lee MG, Nurse P (1987) Complementation used to clone a human homologue of the fission yeast cell cycle control gene cdc2. Nature 327:31–35 Botstein D, Fink GR (2011) Yeast: an experimental organism for 21st century biology. Genetics 189:695–704 MacNeill SA, Nurse P (1997) The molecular and cellular biology of the yeast saccharomyces. Cold Spring Harbor Laboratory Press, New York, NY Nurse P (1990) Universal control mechanism regulating onset of M-phase. Nature 344:503–508 Botstein D, Chervitz SA, Cherry JM (1997) Yeast as a model organism. Science 277:1259–1260 Melese T, Hieter P (2002) From genetics and genomics to drug discovery: yeast rises to the challenge. Trends Pharmacol Sci 23:544–547 Roguev A, Wiren M, Weissman JS, Krogan NJ, Roguev A, Krogan NJ (2007) Highthroughput genetic interaction mapping in the fission yeast Schizosaccharomyces pombe SINfully silent: HDAC complexes in fission yeast. Nat Methods 4:861–866, Epub 2007 Sep 23 Alfa C, Fantes P, Hyams J, McLeod M, Warbrick E (1993) Experiments with fission yeast, a laboratory course manual. Cold Spring Harbor Laboratory Press, New York, NY Forsburg SL (2001) The art and design of genetic screens: yeast. Nat Rev Genet 2:659–668 Lee MG, Nurse P (1987) Cell cycle genes of the fission yeast. Sci Prog 71:1–14
56
Zhaohua Tang
33. Morgan DO (1995) Principles of CDK regulation. Nature 374:131–134 34. Hartwell LH, Culotti J, Pringle JR, Reid BJ (1974) Genetic control of the cell division cycle in yeast. Science 183:46–51 35. Hartwell LH, Mortimer RK, Culotti J, Culotti M (1973) Genetic control of the cell division cycle in yeast: v. genetic analysis of cdc mutants. Genetics 74:267–286 36. Nurse P, Thuriaux P, Nasmyth K (1976) Genetic control of the cell division cycle in the fission yeast Schizosaccharomyces pombe. Mol Gen Genet 146:167–178 37. Sullivan W (1993) The salvation of doug. Generations (Genet Soc Am) 1:3 38. Russell P, Nurse P (1987) Negative regulation of mitosis by wee1+, a gene encoding a protein kinase homolog. Cell 49:559–567 39. Spellman PT, Sherlock G, Zhang MQ, Iyer VR, Anders K, Eisen MB, Brown PO, Botstein D, Futcher B (1998) Comprehensive identification of cell cycle-regulated genes of the yeast Saccharomyces cerevisiae by microarray hybridization. Mol Biol Cell 9:3273–3297 40. Rustici G, Mata J, Kivinen K, Lio P, Penkett CJ, Burns G, Hayles J, Brazma A, Nurse P, Bahler J (2004) Periodic gene expression program of the fission yeast cell cycle. Nat Genet 36:809–817 41. Neumann B, Walter T, Heriche JK, Bulkescher J, Erfle H, Conrad C, Rogers P, Poser I, Held M, Liebel U, Cetin C, Sieckmann F, Pau G, Kabbe R, Wunsche A, Satagopam V, Schmitz MH, Chapuis C, Gerlich DW, Schneider R, Eils R, Huber W, Peters JM, Hyman AA, Durbin R, Pepperkok R, Ellenberg J (2010) Phenotypic profiling of the human genome by time-lapse microscopy reveals cell division genes. Nature 464:721–727 42. Russell P, Nurse P (1986) cdc25+ functions as an inducer in the mitotic control of fission yeast. Cell 45:145–153 43. Hartwell LH, Weinert TA (1989) Checkpoints: controls that ensure the order of cell cycle events. Science 246:629–634 44. Beach D, Durkacz B, Nurse P (1982) Functionally homologous cell cycle control genes in budding and fission yeast. Nature 300:706–709 45. Simanis V, Nurse P (1986) The cell cycle control gene cdc2+ of fission yeast encodes a protein kinase potentially regulated by phosphorylation. Cell 45:261–268 46. Draetta G, Brizuela L, Potashkin J, Beach D (1987) Identification of p34 and p13, human homologs of the cell cycle regulators of fission
47.
48.
49.
50.
51.
52.
53.
54.
55.
56.
57.
58.
59.
60.
yeast encoded by cdc2+ and suc1+. Cell 50:319–325 Masui Y, Markert CL (1971) Cytoplasmic control of nuclear behavior during meiotic maturation of frog oocytes. J Exp Zool 177:129–145 Johnson RT, Rao PN, Hughes HD (1970) Mammalian cell fusion. 3. A HeLa cell inducer of premature chromosome condensation active in cells from a variety of animal species. J Cell Physiol 76:151–157 Gerhart J, Wu M, Kirschner M (1984) Cell cycle dynamics of an M-phase-specific cytoplasmic factor in Xenopus laevis oocytes and eggs. J Cell Biol 98:1247–1255 Newport JW, Kirschner MW (1984) Regulation of the cell cycle during early Xenopus development. Cell 37:731–742 Sunkara PS, Wright DA, Rao PN (1979) Mitotic factors from mammalian cells: a preliminary characterization. J Supramol Struct 11:189–195 Kishimoto T, Kuriyama R, Kondo H, Kanatani H (1982) Generality of the action of various maturation-promoting factors. Exp Cell Res 137:121–126 Tachibana K, Yanagishima N, Kishimoto T (1987) Preliminary characterization of maturation-promoting factor from yeast Saccharomyces cerevisiae. J Cell Sci 88(Pt 3):273–281 Evans T, Rosenthal ET, Youngblom J, Distel D, Hunt T (1983) Cyclin: a protein specified by maternal mRNA in sea urchin eggs that is destroyed at each cleavage division. Cell 33:389–396 Lohka MJ, Masui Y (1983) Formation in vitro of sperm pronuclei and mitotic chromosomes induced by amphibian ooplasmic components. Science 220:719–721 Lohka MJ, Hayes MK, Maller JL (1988) Purification of maturation-promoting factor, an intracellular regulator of early mitotic events. Proc Natl Acad Sci U S A 85:3009–3013 Murray AW, Kirschner MW (1989) Cyclin synthesis drives the early embryonic cell cycle. Nature 339:275–280 Dunphy WG, Brizuela L, Beach D, Newport J (1988) The Xenopus cdc2 protein is a component of MPF, a cytoplasmic regulator of mitosis. Cell 54:423–431 Edgar BA, Lehner CF (1996) Developmental control of cell cycle regulators: a fly’s perspective. Science 274:1646–1652 Lee LA, O-W TL (2003) Regulation of cell cycles in Drosophila development: intrinsic and extrinsic cues. Annu Rev Genet 37:545–578
Cell Cycle Control and Model Organisms 61. Todaro GJ, Green H (1963) Quantitative studies of the growth of mouse embryo cells in culture and their development into established lines. J Cell Biol 17:299–313 62. Ramirez RD, Morales CP, Herbert BS, Rohde JM, Passons C, Shay JW, Wright WE (2001) Putative telomere-independent mechanisms of replicative aging reflect inadequate growth conditions. Genes Dev 15:398–403 63. Land H, Parada LF, Weinberg RA (1983) Cellular oncogenes and multistep carcinogenesis. Science 222:771–778 64. Novina CD, Sharp PA (2004) The RNAi revolution. Nature 430:161–164 65. Sander JD, Joung JK (2014) CRISPR-Cas systems for editing, regulating and targeting genomes. Nat Biotechnol 32:347–355 66. Sioud M (2011) Promises and challenges in developing RNAi as a research tool and therapy. Methods Mol Biol 703:173–187 67. Nurse P, Hayles J (2011) The cell in an era of systems biology. Cell 144:850–854 68. Holt LJ, Tuch BB, Villen J, Johnson AD, Gygi SP, Morgan DO (2009) Global analysis of Cdk1 substrate phosphorylation sites provides
69.
70.
71.
72.
73.
74.
57
insights into evolution. Science 325:1682–1686 Koivomagi M, Valk E, Venta R, Iofik A, Lepiku M, Morgan DO, Loog M (2011) Dynamics of Cdk1 substrate specificity during the cell cycle. Mol Cell 42:610–623 Allen NA, Chen KC, Shaffer CA, Tyson JJ, Watson LT (2006) Computer evaluation of network dynamics models with application to cell cycle control in budding yeast. Syst Biol 153:13–21 Brazhnik P, Tyson JJ (2006) Cell cycle control in bacteria and yeast: a case of convergent evolution? Cell Cycle 5:522–529 Mardis ER (2008) The impact of nextgeneration sequencing technology on genetics. Trends Genet 24:133–141 Hudson A et al (2009) Emerging model organisms: a laboratory manual. Cold Spring Harbor Laboratory Press, New York, NY Brenner S, Elgar G, Sandford R, Macrae A, Venkatesh B, Aparicio S (1993) Characterization of the pufferfish (Fugu) genome as a compact model vertebrate genome. Nature 366:265–268
Chapter 3 Role of Computational Modeling in Understanding Cell Cycle Oscillators Attila Csikász-Nagy and Ivan Mura Abstract The periodic oscillations in the activity of the cell cycle regulatory program, drives the timely activation of key cell cycle events. Interesting dynamical systems, such as oscillators, have been investigated by various theoretical and computational modeling methods. Thanks to the insights achieved by these modeling efforts we have gained considerable insights about the underlying molecular regulatory networks that can drive cell cycle oscillations. Here we review the basic features and characteristics of biological oscillators, discussing from a computational modeling point of view their specific architectures and the current knowledge about the dynamics that the life evolution selected to drive cell cycle oscillations. Key words Cell cycle oscillators, Mathematical models, Nonlinearity, Predictive simulation, Regulation, Cross-talk
1
Introduction to Biological Oscillators The ordered and regulated execution of the cell reproduction process relies on a complex set of interactions that are able to sense and integrate multiple signals from the cell environment into a fundamental network, with a molecular oscillator as the core engine driving the events of the cell cycle. Oscillatory behaviors are interesting and complex. Their dynamical equilibria are able to maintain information about time progression and the state of variables, enabling native patterns of behavior to be coupled with external stimuli that modulate the final resulting responses. Similarly, the cell cycle oscillator is controlled by several environmental inputs, which set the frequency of the oscillation and stop it if the environment does not support cell division. So effective are oscillators in flexibly governing the many regulated phenomena inside living systems, that we find more and more evidence of their existence in many key cellular processes, for instance the p53 response to DNA damage [1, 2], or the dynamics of key transcription factors such as NF-kB [3, 4].
Amanda S. Coutts and Louise Weston (eds.), Cell Cycle Oscillators: Methods and Protocols, Methods in Molecular Biology, vol. 1342, DOI 10.1007/978-1-4939-2957-3_3, © Springer Science+Business Media New York 2016
59
60
Attila Csikász-Nagy and Ivan Mura
Cell reproduction cycles, circadian rhythms and seasonal clocks in plants are all examples of combined time and signal dependent modulation of cellular function regulation, which result in the concerted activation or repression of genes responsible for periodical phenotypical expression. Oscillatory behaviors are complex to understand. One of the very first and simplest oscillators, the Lotka self-catalytic module, which was originally discovered and analyzed in 1920 [5], couples two chemical reactions involving just two species, yet it gives rise to a type of dynamical behavior that could hardly be predicted by other means than via simulation of a model. By their very time-dependent essence, oscillators escape classical equilibrium analysis, as they never rest in a steady state, and reveal sensitivities that can account for distinct types of system responses. Both frequency and amplitude of oscillating effectors may be crucial in exerting regulation upon a biological phenomenon as information can be coded in either or both frequency and amplitude of a biological oscillation. The reasons for such rich behaviors of oscillators are rooted in the existence of nonlinear relationships among variables. Nonlinearity is a general concept in systems theory, which essentially provides for generating response outputs that are not proportional to the input variables. In the absence of nonlinear relations among variables, a system can only provide outputs that satisfy the superposition principle; changes in the input would be mapped into proportional variations of the output, which implies that oscillations could only be relayed but not be generated. When the relations among variables involve nonlinearities, the analysis of the possible system behaviors soon becomes complex. Mathematical models of nonlinear systems are comparatively much easier to build than to solve. They are hardly tractable from an analytical viewpoint, and call for the deployment of approximated numerical and/or simulation techniques. The rest of this review paper is organized as follows. In Subheading 2 we focus on cell cycle computational model based research, with a short historical perspective that accounts for the evolution of the field, and then discuss the main modeling approaches that have been deployed. In Subheading 3 we review the most influential models of the cell cycle, which in a sense are distilling the knowledge gained by decades of computational modeling in the field. As it always happens in biology, every subsystem connects to the whole systems in a number of ways, the machinery regulating cell cycle oscillations does not escape the rule. In this same section we review some of the many interactions that cell cycle oscillator components have with other periodically regulated cellular functions. Conclusions and perspectives for future research are provided in Subheading 4.
Models of cell cycle oscillators
2
61
Cell Cycle Modeling Cell cycle oscillating phenomena are not an exception to the abovementioned complexity, and their study has largely benefited from computational approaches based on the definition and simulation of mathematical models. In the decades from the 1960s to the 1980s, yet before the molecular interactions that sustain the cyclic behavior were explored, models were developed [6–14] that attempted to explain, at a phenomenological level, the experimentally observed correlation between cell cycle and cell size. Later on, extensive experimental work on model organisms began to unveil the details of the intracellular network generating the oscillating behavior of cyclins and cyclin-dependent kinases. This information fostered new modeling efforts aimed at understanding a growing set of intertwined molecular interactions that, through positive and negative feedback, generate bistability, hysteretic switches, and cyclic behaviors. A number of computational models were developed, in particular for the cell cycle of budding fission yeast yeast Saccharomyces cerevisiae [15–18], Schizosaccharomyces pombe [19–26], and Xenopus frog embryos [27–29]. Models for the cell cycle of embryonic cells of the fruit fly Drosophila melanogaster [30] and of the sea urchin [31] were also built. The modeling of the mammalian cell cycle is a complex task, due to the many regulatory mechanisms that control cell reproduction in complex organisms. Nevertheless, many different aspects of the cell cycle in mammals have been the subject of computational modeling studies; see for instance [32–45]. Various approaches to the mathematical modeling of the interactions among the molecular components of the cell cycle network have been used, each one using a different abstraction level. We succinctly explain in Fig. 1 the main concepts of the three main modeling methods, namely Boolean, Continuous-Deterministic, and Discrete-Stochastic, and the outputs provided by their computationally implemented versions. A common requirement for all the modeling methods is that they must be able to provide a prediction of the dynamics of the system over time. A quick look at the mathematical approaches applied for the computational modeling of the cell cycle reveals that continuousdeterministic techniques have been the first choice tools. Quite obviously, when dealing with nonlinearity, limit cycles and switches, the mathematics of differential equations comes in straightforwardly, with its rich set of simulation and analysis techniques. In the continuous-deterministic setting, the variables of interest are the concentrations of species (see Fig. 1b), and their time evolution is modeled through the effect that the interactions among species have on the derivatives of the concentrations [49, 50].
62
Attila Csikász-Nagy and Ivan Mura
Fig. 1 Computational and mathematical methods used for cell cycle oscillator modeling. (a) Boolean models consider how various proteins activate (solid) or inhibit (dashed) each other (adapted from ref. [46]). Each molecule can be in either active (1) or inactive (0) forms and transitions between these driven by regulators. Simulations (bottom) show how each molecule switches between the two states. (b), Ordinary Differential Equation models (adapted from ref. [47]) consider the continuous transitions between states (solid arrows) driven by regulator molecules (dashed) in a deterministic form, capturing the average cell behavior by simulating changes in the concentration of each form. (c) Various stochastic methods can be used to follow the changes in molecule numbers and the noise observed in individual cells. The notation of the wiring corresponds to the Petri-Net formalism (adapted from ref. [48])
When constructing a model of a system’s dynamics, a continuous-deterministic model is just one of the possible interpretations, mostly used to capture the average behavior of cells. In those cases when the molecular noise plays a role in determining the emerging behavior of the oscillatory system, discrete-stochastic modeling methods can provide additional information, which is not necessarily captured by continuous-deterministic abstractions built upon the same knowledge base. In a discrete-stochastic interpretation, variables are integer molecular counts (see Fig. 1c), and interactions among species are rendered as reactions with integer stoichiometry, which occur at random times. Thanks to the many available implementations of the stochastic simulation algorithm of Gillespie [51], many models-based studies of the cell-cycle regulatory networks have been conducted [48, 52–57]. Stochasticity has been considered as well in the continuous setting to model molecular noise by Langevin equations, whereby random terms are directly added to the differential equations [53, 58].
Models of cell cycle oscillators
63
On the other hand, when the focus of the research is on understanding the properties of the dynamics that are determined by the structure (topology) of the interaction network rather than by the kinetics of the reactions, other interpretations based on Boolean modeling techniques become of interest [46, 59, 60]. In a Boolean model, time progression is abstracted as stepwise increments, and the state of a molecule is abstractly represented by a binary variable, whose two possible values can be used to model two distinct behaviors, for instance when the molecule is phosphorylated and active, or unphosphorylated and inactive (see Fig. 1a). The transition between states is determined by the values taken by Boolean functions, which depend on the states of interacting molecules and are evaluated at the discrete time steps. No matter which angle was taken at the time of implementing the model, the process of identifying the involved entities and their interactions always resulted in a refinement and systematization of the biological knowledge. Because they must be executable on a computing system, by their very nature computational models are not ambiguous, and require a complete specification of the biochemical transformations in mathematical or logical terms. This means that each phenomenon, such as a repression or activation, which has a clear semantic for biologists, needs to be detailed in terms of molecular interactions. Consequently, model definition is an inter-disciplinary activity that sets the ground for gaining new insights into the design of biological systems and requires the interaction of mathematicians, computer scientists, and physicists with the experimental biologists [61]. The objective of building a computational model is twofold: from one side the model provides a precise encoding of the available knowledge about a phenomenon, and on the other one, at least for the class of dynamical models we are considering in this context, it allows generating predictions about system evolution over time. When these predictions can reproduce experimentally observed behaviors, the model is valid, and its predictions can be extended to scenarios that have not been explored before. Hence, a valid model allows rapidly conducting in-silico experiments, analyzing what-if scenarios, simulating conditions that could hardly be run or that would be very costly in the wet-lab. Moreover, the obtained insights about system behavior can drive additional experimental work, to verify specific aspects or to dig into areas that require refining biological knowledge. Furthermore, models that cannot be validated, i.e., cannot reproduce parts of the experimentally observed behaviors, are also conductive to additional experimental work, in that they are usually pointing out limitations of the available knowledge. These all reflect to the famous quote by George EP Box “all models are wrong, but some are useful”, which underlines that models just represent the summary of our current knowledge and when they fail then the problem is with our current knowledge, not with the model itself.
64
Attila Csikász-Nagy and Ivan Mura
Computational modeling studies of the cell cycle have been instrumental in providing many insights about the intricacies of oscillatory behavior and the regulatory effects exerted by external environmental and cellular processes. Especially, significant advances have been obtained in those circumstances when computational modeling progressed hand-in-hand with experimental research in the lab. For instance, the group of Béla Novák and John J. Tyson, which has been working for the last 30 years on cell cycle modeling with the support of the team of experimentalists led by Fred Cross, was able to propose many hypotheses about the design principles of the cell cycle oscillator, which were lately proved by experiments. For instance, the bistability features of the Cdk control system [16, 29], the existence of a dedicated switch point controlling the entry into the DNA synthesis phase of the cycle in Saccharomyces cerevisiae [15], and interactions with yet unobserved species [18], were all predicted through the definition and analysis of computational models of the cell cycle. The group of James Ferrell also contributed to our knowledge on cell cycle regulation by combining theory and modeling [28, 62, 63]. Recent results from other interactions between theorists and experimentalists have led to further new results that help us to understand the dynamical features of cell cycle oscillations.
3
Models of Cell Cycle Oscillators Oscillations can be generated in various ways. The simplest, and in engineering the most used version, is the ring oscillator, whereby processes activate or inhibit each other in a cyclical manner (Fig. 2). Indeed the transcriptional waves of the cell cycle were associated with such a system [64]. Activation of genes that regulate a specific cell cycle stage or transition is induced by specific transcription factors. The yeast cell cycle regulatory transcription factors are connected in a way that one transcription factor induces the next one in the cycle, which induces the following one, until they close the loop of the cell cycle [65]. These oscillations are autonomous; they can run even in a cell cycle block, when the core Cdk control system is halted, whereas in normal circumstances the period of the transcriptional oscillations is controlled by the Cdk regulatory module [66]. These transcriptional waves were also subjects of modeling approaches [67, 68]. Similarly, a loop of transcriptional repressors can induce oscillations as it has been showed by synthetic construction of a three transcription factor loop called repressilator [69] (Fig. 2). Combination of positive and negative effects in a loop can also induce oscillation, the necessary criteria is that the loop should have an odd number of negative signs and cause enough delay to allow the active forms to reach a critical level (Fig. 2). Indeed one of the
Models of cell cycle oscillators
65
Fig. 2 Regulatory networks that can create oscillations. In ring oscillators each component activates the next component closing on a loop where activatory waves follow each other. Negative feedback loops also contain a ring, but the signs of the interactions could be both negative and positive, the crucial point is that an odd number of negative interactions and a long enough loop are needed for oscillations. The repressilator is a special type of negative feedback loop that inherited concepts of a ring oscillator from engineering. Oscillations are also possible with positive feedback and substrate depletion, where a substrate (Y) is totally used up by an autocatalytic reaction and the active (X) form is unstable. Positive and negative feedbacks can be combined, leading to the most robust oscillators
earliest models of cell cycle regulation is based on a three component negative feedback loop where Cdk is activated by a cyclin, which is destroyed by a protease that was activated by Cdk [70]. Positive feedback can also lead to oscillations, in the case where the autocatalytic reactions lead to the depletion of the substrate of the autocatalytic reaction (Fig. 2). An alternative model of the Cdkcyclin oscillations was proposed by Tyson [71], where the fast, autocatalytic transition from inactive to active Cdk leads to the depletion of the inactive form and at the same time induces the degradation of the active form. Thus, in the 1990s, the core Cdk oscillations were explained by both positive and negative feedback oscillations. By now we have learned that the combination of positive and negative feedback loops can lead to the most robust cell cycle oscillations [62] and indeed these might stand in the core of most cell cycle oscillators [50, 72]. It is still a controversial question whether normal cell cycles run as a limit cycle or the system moves between steady states as it passes through cell cycle transitions. In the case of embryonic cell cycles the system might be indeed
66
Attila Csikász-Nagy and Ivan Mura
free-running, without checkpoints being activated, although the importance of positive feedbacks and hysteresis have been first predicted [27], and later experimentally shown in Xenopus embryonic cycles [28]. Similarly, the importance of positive feedback in the stabilization of cell cycle stages and the irreversibility in the transitions between them, have been proposed following theoretical considerations [73] and later proved experimentally [74]. Probably the most influential cell cycle model (known in the community as ‘Chen model’) is the result of the computational modeling work on the Start (G1 to S) and Finish (M to G1) transitions of the budding yeast cell cycle. The very first model, focusing on the Start transition, was published in 2000 [15]. Predictions from this work were experimentally tested and the model adjusted to fit new data in 2002 [16]. Finally, this Start model was extended with the molecular regulatory network controlling mitotic exit in 2004 [17]. The final version of Chen’s model is able to account for several physiological observations on wild type and on 132 mutant strains at various growth conditions [17]. The relevance of this result is backed up by the rigorous process used in model definition: the values assigned to a basic parameter set were solely determined to fit wild type behavior; simulating the behavior of mutants only requires changing the parameters of the reactions that get perturbed in the corresponding mutation. Based on this model and on models of fission yeast [23] and mammalian [34] cell cycles, a generic model of eukaryotic cell cycle regulation was created [50]. This model could capture the similarities and differences between the cell cycle control of the key eukaryotic test organisms. This model was later used as a starting point for investigations of cell cycle coupling to other processes [1, 58]. We have already discussed that the transcriptional oscillations and the core Cdk oscillations can be uncoupled and both can run autonomously [66]. There are other periodic processes connected to the cell cycle that could oscillate even when uncoupled from the core cell cycle machinery [75]. The transcriptional and centrosome duplication cycles can be uncoupled from the Cdk activity cycles, similarly to the recently discovered oscillations in the localization of a major cell cycle regulator phosphatase Cdc14 [76, 77]. In normal conditions all of these oscillators are tightly coupled to the oscillations in Cdk activity, but can also feed back and slow down or halt the Cdk cycles in case there is a failure in these loops. Similar coupling connects the cell cycle oscillator to other periodic processes such as the circadian clock and metabolic oscillations [78, 79]. Various modeling approaches were established to investigate the importance and selective advantage of such coupling between the core and auxiliary cell cycle and related oscillators [75, 80], but there is still a long way ahead until we will understand and will be able to control the complex oscillatory network that controls the cell division cycle.
Models of cell cycle oscillators
4
67
Conclusions and Future Perspectives We know more and more about the molecular regulatory networks that control the cell division cycle. A detailed map of the cell cycle regulatory network of yeast is available [72] and cell cycle controlling pathways in mammals are also characterized in fine detail [81, 82]. However, this increasing knowledge is also setting new challenges for the computational biology community. First of all, there is the necessity to develop tools that can deal with such large amount of data. The promise of computational and systems biology is the ability to integrate data coming from the different omics into coherent representations of biological processes. Moreover, we know that the cell cycle behavior emerges from the interaction of many biological processes and is influenced by the availability of nutrients and by the presence of physical factors, such as light radiation. Therefore, we also need to be able to combine various existing models of the core systems to reach a global model that can capture and successfully predict all the dynamical details of cell cycle oscillators. Such an integration calls for the development of hybrid modeling techniques, whereby continuous representations of parts of the system can be effectively included into more detailed models of molecular interactions built at a discrete-stochastic level. Another key area of research has to do with the availability of reliable data that can be used to quantitatively characterize cellular phenomena. Molecular counts, volumes, and reaction kinetics are all input data to predictive models. Their quality determines the predictive ability of models. Historically, experimental biology has been more a qualitative than a qualitative science. This is somehow changing, thanks to the appearance of single cell measurement techniques, which allow measuring concentrations and even molecular counts avoiding the averaging effects of traditional techniques. There is a long way to go in developing a complete predictive model of the cell cycle, which could account for the many factors that influence cell reproduction. The availability of such a predictive model would have profound impact on health research. In the mammalian system, it would aid cancer research as, at the single cell level, defects of the cell cycle control system lie at the core of cancerous proliferation [83].
References 1. Toettcher JE, Loewer A, Ostheimer GJ, Yaffe MB, Tidor B, Lahav G (2009) Distinct mechanisms act in concert to mediate cell cycle arrest. Proc Natl Acad Sci U S A 106(3):785–790. doi:10.1073/pnas.0806196106 2. Liu B, Bhatt D, Oltvai ZN, Greenberger JS, Bahar I (2014) Significance of p53 dynamics in regulating apoptosis in response to ionizing
radiation, and polypharmacological strategies, Sci Rep 4, Article number: 6245 doi:10.1038/ srep06245 3. Ihekwaba AE, Broomhead DS, Grimley R, Benson N, White MR, Kell DB (2005) Synergistic control of oscillations in the NF-kappaB signalling pathway. Syst Biol (Stevenage) 152(3):153–160
68
Attila Csikász-Nagy and Ivan Mura
4. Mengel B, Hunziker A, Pedersen L, Trusina A, Jensen MH, Krishna S (2010) Modeling oscillatory control in NF-κB, p53 and Wnt signaling. Curr Opin Genet Dev 20(6):656–664. doi:10.1016/j.gde.2010.08.008 5. Lotka AJ (1920) Undamped oscillations derived from the law of mass action. J Am Chem Soc 42:1595–1599 6. Prescott DM (1956) Relation between growth rate and cell division. III. Changes in nuclear volume and growth rate and prevention of cell division in Amoeba proteus resulting from cytoplasmic amputations. Exp Cell Res 11:94–98 7. Brooks RF, Bennett DC, Smith JA (1980) Mammalian cell cycles need two random transitions. Cell 19:493–504 8. Castor LN (1980) A G1 rate model accounts for cell-cycle kinetics attributed to ‘transition probability’. Nature 287:857–859 9. Koch AL, Schaechter M (1962) A model for statistics of the cell division process. J Gen Microbiol 29:435–454 10. Koch AL (1980) Does the variability of the cell cycle result from one or many chance events? Nature 286:80–82 11. Shields R (1977) Transition probability and the origin of variation in the cell cycle. Nature 267:704–707 12. Smith JA, Martin L (1973) Do cells cycle? Proc Natl Acad Sci U S A 70:1263–1267 13. Tyson JJ (1983) Unstable activator models for size control of the cell cycle. J Theor Biol 104:617–631 14. Tyson JJ, Hannsgen KB (1986) Cell growth and division: a deterministic/probabilistic model of the cell cycle. J Math Biol 23:231–246 15. Chen KC, Csikasz-Nagy A, Gyorffy B et al (2000) Kinetic analysis of a molecular model of the budding yeast cell cycle. Mol Biol Cell 11:369–391 16. Cross FR, Archambault V, Miller M et al (2002) Testing a mathematical model for the yeast cell cycle. Mol Biol Cell 13:52–70 17. Chen KC, Calzone L, Csikasz-Nagy A et al (2004) Integrative analysis of cell cycle control in budding yeast. Mol Biol Cell 15:3841–3862 18. Queralt E, Lehane C, Novak B et al (2006) Downregulation of PP2A(Cdc55) phosphatase by separase initiates mitotic exit in budding yeast. Cell 125:719–732 19. Csikasz-Nagy A, Kapuy O, Gyorffy B et al (2007) Modeling the septation initiation network (SIN) in fission yeast cells. Curr Genet 51:245–255 20. Lygeros J, Koutroumpas K, Dimopoulos S et al (2008) Stochastic hybrid modeling of
21.
22.
23.
24.
25.
26.
27.
28.
29.
30.
31.
32.
33.
34.
35.
DNA replication across a complete genome. Proc Natl Acad Sci U S A 105:12295–12300 Novak B, Tyson JJ (1995) Quantitative analysis of a molecular model of mitotic control in fission yeast. J Theor Biol 173:283–305 Novak B, Tyson JJ (1997) Modeling the control of DNA replication in fission yeast. Proc Natl Acad Sci U S A 94:9147–9152 Novak B, Csikasz-Nagy A, Gyorffy B et al (1998) Mathematical model of the fission yeast cell cycle with checkpoint controls at the G1/S, G2/M and metaphase/anaphase transitions. Biophys Chem 72:185–200 Novak B, Pataki Z, Ciliberto A et al (2001) Mathematical model of the cell division cycle of fission yeast. Chaos 11:277–286 Sveiczer A, Csikasz-Nagy A, Gyorffy B et al (2000) Modeling the fission yeast cell cycle: quantized cycle times in wee1-cdc25Delta mutant cells. Proc Natl Acad Sci U S A 97:7865–7870 Vasireddy R, Biswas S (2004) Modeling gene regulatory network in fission yeast cell cycle using hybrid petri nets. In: Neural information processing. Springer, Berlin, pp 1310–1315 Novak B, Tyson JJ (1993) Numerical analysis of a comprehensive model of M-phase control in Xenopus oocyte extracts and intact embryos. J Cell Sci 106(Pt 4):1153–1168 Pomerening JR, Sontag ED, Ferrell JE (2003) Building a cell cycle oscillator: hysteresis and bistability in the activation of Cdc2. Nat Cell Biol 5:346–351. doi:10.1038/ncb954 Sha W, Moore J, Chen K et al (2003) Hysteresis drives cell-cycle transitions in Xenopus laevis egg extracts. Proc Natl Acad Sci U S A 100:975–980 Calzone L, Thieffry D, Tyson JJ et al (2007) Dynamical modeling of syncytial mitotic cycles in Drosophila embryos. Mol Syst Biol 3:131 Ciliberto A, Tyson JJ (2000) Mathematical model for early development of the sea urchin embryo. Bull Math Biol 62:37–59 Hatzimanikatis V, Lee KH, Bailey JE (1999) A mathematical description of regulation of the G1-S transition of the mammalian cell cycle. Biotechnol Bioeng 65:631–637 Kohn KW (1998) Functional capabilities of molecular network components controlling the mammalian G1/S cell cycle phase transition. Oncogene 16:1065–1075 Novak B, Tyson JJ (2004) A model for restriction point control of the mammalian cell cycle. J Theor Biol 230:563–579 Pfeuty B, David-Pfeuty T, Kaneko K (2008) Underlying principles of cell fate determination during G1 phase of the mammalian cell cycle. Cell Cycle 7:3246–3257
Models of cell cycle oscillators 36. Qu Z, Weiss JN, MacLellan WR (2003) Regulation of the mammalian cell cycle: a model of the G1-to-S transition. Am J Physiol Cell Physiol 284:C349–C364 37. Swat M, Kel A, Herzel H (2004) Bifurcation analysis of the regulatory modules of the mammalian G1/S transition. Bioinformatics 20:1506–1511 38. Singhania R, Sramkoski RM, Jacobberger JW, Tyson JJ (2011) A hybrid model of mammalian cell cycle regulation. PLoS Comput Biol 7(2):e1001077 39. Alfieri R, Barberis M, Chiaradonna F, Gaglio D, Milanesi L, Vanoni M, Klipp E, Alberghina L (2009) Towards a systems biology approach to mammalian cell cycle: modeling the entrance into S phase of quiescent fibroblasts after serum stimulation. BMC Bioinform 10(Suppl 12):S16. doi:10.1186/1471-2105-10-S12-S16 40. Conradie R, Bruggeman FJ, Ciliberto A, Csikász-Nagy A, Novák B, Westerhoff HV, Snoep JL (2010) Restriction point control of the mammalian cell cycle via the cyclin E/ Cdk2:p27 complex. FEBS J 277(2):357–367. doi:10.1111/j.1742-4658.2009.07473.x 41. Kapuy O, He E, Uhlmann F, Novák B (2009) Mitotic exit in mammalian cells. Mol Syst Biol 5:324. doi:10.1038/msb.2009.86 42. Haberichter T, Mädge B, Christopher RA, Yoshioka N, Dhiman A, Miller R, Gendelman R, Aksenov SV, Khalil IG, Dowdy SF (2007) A systems biology dynamical model of mammalian G1 cell cycle progression. Mol Syst Biol 3:84. doi:10.1038/msb4100126 43. Gérard C, Goldbeter A (2009) Temporal selforganization of the cyclin/Cdk network driving the mammalian cell cycle. Proc Natl Acad Sci U S A 106(51):21643–21648. doi:10.1073/pnas.0903827106 44. Pfeuty B (2012) Strategic cell-cycle regulatory features that provide mammalian cells with tunable G1 length and reversible G1 arrest. PLoS One 7(4):e35291. doi:10.1371/journal. pone.0035291 45. Iwamoto K, Hamada H, Eguchi Y, Okamoto M (2011) Mathematical modeling of cell cycle regulation in response to DNA damage: exploring mechanisms of cell-fate determination. Biosystems 103(3):384–391. doi:10.1016/j. biosystems.2010.11.011 46. Davidich MI, Bornholdt S (2008) Boolean network model predicts cell cycle sequence of fission yeast. PLoS One 3(2):e1672. doi:10.1371/journal.pone.0001672 47. Tyson JJ, Chen KC, Novák B (2001) Network dynamics and cell physiology. Nat Rev Mol Cell Biol 2:908–916. doi:10.1038/35103078
69
48. Kar S, Baumann WT, Paul MR, Tyson JJ (2009) Exploring the roles of noise in the eukaryotic cell cycle. Proc Natl Acad Sci U S A 106:6471 49. Tyson JJ, Chen KC, Novak B (2003) Sniffers, buzzers, toggles and blinkers: dynamics of regulatory and signaling pathways in the cell. Curr Opin Cell Biol 15(2):221–231. doi:10.1016/ S0955-0674(03)00017-6 50. Csikász-Nagy A, Battogtokh D, Chen KC, Novák B, Tyson JJ (2006) Analysis of a generic model of eukaryotic cell-cycle regulation. Biophys J 90(12):4361–4379. doi:10.1529/ biophysj.106.081240 51. Gillespie DT (1977) Exact stochastic simulation of coupled chemical reactions. J Phys Chem 81(25):2340–2361. doi:10.1021/j100540a008 52. Sveiczer A, Tyson JJ, Novak B (2001) A stochastic, molecular model of the fission yeast cell cycle: role of the nucleocytoplasmic ratio in cycle time regulation. Biophys Chem 92:1–15. doi:10.1016/S0301-4622(01)00183-1 53. Steuer R (2004) Effects of stochasticity in models of the cell cycle: from quantized cycle times to noise-induced oscillations. J Theor Biol 228:293–301. doi:10.1016/j.jtbi.2004.01.012 54. Mura I, Csikász-Nagy A (2008) Stochastic Petri Net extension of a yeast cell cycle model. J Theor Biol 254:859–860. doi:10.1016/j. jtbi.2008.07.019 55. Palmisano A, Mura I, Priami C (2009) From ODEs to language-based, executable models of biological systems. In: Proceedings of the Pacific Symposium on Biocomputing 14, Kohala Coast, Hawaii, USA, pp 239–250. 56. Ballarini P, Mazza T, Palmisano A, CsikászNagy A (2009) Studying irreversible transitions in a model of cell cycle regulation. Electron Notes Theor Comput Sci 232:39–53. doi:10.1016/j.entcs.2009.02.049 57. Csikász-Nagy A, Mura I (2010) Role of mRNA gestation and senescence in noise reduction during the cell cycle. In Silico Biol 10(1):81– 88. doi:10.3233/ISB-2010-0416 58. Zámborszky J, Hong CI, Csikász-Nagy A (2007) Computational analysis of mammalian cell division gated by a circadian clock: quantized cell cycles and cell size control. J Biol Rhythms 22:542–553 59. Fauré A, Naldi A, Chaouiya C, Thieffry D (2006) Dynamical analysis of a generic Boolean model for the control of the mammalian cell cycle. Bioinformatics 22(14):e124–e131. doi:10.1093/bioinformatics/btl210 60. Li F, Long T, Lu Y, Ouyang Q, Tang C (2004) The yeast cell-cycle network is robustly designed. Proc Natl Acad Sci U S A 101(14):4781–4786. doi:10.1073/pnas.0305937101
70
Attila Csikász-Nagy and Ivan Mura
61. Kitano H (2002) Computational systems biology. Nature 420(6912):206–210. doi:10.1038/nature01254 62. Tsai TYC, Choi YS, Ma W, Pomerening JR, Tang C, Ferrell JR (2008) Robust, tunable biological oscillations from interlinked positive and negative feedback loops. Science 321(5885):126–129. doi:10.1126/ science.1156951 63. Santos SDM, Ferrell JE (2008) Systems biology: on the cell cycle and its switches. Nature 454:288–289. doi:10.1038/454288 64. Simmons Kovacs LA, Orlando DA, Haase SB (2008) Transcription network and cyclin/ CDKs: the yin and yang of cell cycle oscillators. Cell Cycle 7(17):2626–2629. doi:10.4161/ cc.7.17.6515 65. Orlando DA, Lin YC, Bernard A, Wang JY, Socolar JES, Iversen ES, Hartemink AJ, Haase SB (2008) Global control of cell-cycle transcription by coupled CDK and network oscillators. Nature 453:944–947. doi:10.1038/ nature06955 66. Simmons LA, Kovacs LA, Mayhew MB, Orlando DA, Jin Y, Li Q, Huang C, Reed SI, Mukherjee S, Haase SB (2012) Cyclindependent kinases are regulators and effectors of oscillations driven by a transcription factor network. Mol Cell 45(5):669–679. doi:10.1016/j.molcel.2011.12.033 67. Sevim V, Gong X, Socolar JES (2010) Reliability of transcriptional cycles and the yeast cell-cycle oscillator. PLoS Comput Biol 6(7):e1000842. doi:10.1371/journal.pcbi.1000842 68. Sriram K, Bernot G, Képès F (2007) A minimal mathematical model combining several regulatory cycles from the budding yeast cell cycle. IET Syst Biol 1(6):326–341. doi:10.1049/ iet-syb:20070018 69. Elowitz MB, Leibler S (2000) A synthetic oscillatory network of transcriptional regulators. Nature 403:335–338. doi:10.1038/35002125 70. Goldbeter A (1991) A minimal cascade model for the mitotic oscillator involving cyclin and cdc2 kinase. Proc Natl Acad Sci U S A 88(20):9107–9111. doi:10.1073/pnas.88. 20.9107 71. Tyson JJ (1991) Modeling the cell division cycle: cdc2 and cyclin interactions. Proc Natl Acad Sci U S A 88(16):7328–7332. doi:10.1073/pnas.88.16.7328
72. Kazunari K, Samik G, Yukiko M, Hisao M, Yuki S-Y, Hiroaki K (2010) A comprehensive molecular interaction map of the budding yeast cell cycle. Mol Syst Biol 6:1. doi:10.1038/ msb.2010.73 73. Novak B, Tyson JJ, Gyorffy B, Csikasz-Nagy A (2007) Irreversible cell-cycle transitions are due to systems-level feedback. Nat Cell Biol 9:724–728. doi:10.1038/ncb0707-724 74. López-Avilés S, Kapuy O, Novák B, Uhlmann F (2009) Irreversibility of mitotic exit is the consequence of systems-level feedback. Nature 459:592–595. doi:10.1038/nature07984 75. Oikonomou C, Cross FR (2010) Frequency control of cell cycle oscillators. Curr Opin Genet Dev 20(6):605–612. doi:10.1016/j. gde.2010.08.006 76. Lu Y, Cross FR (2010) Periodic cyclin-Cdk activity entrains an autonomous Cdc14 release oscillator. Cell 141(2):268–279. doi:10.1016/j.cell.2010.03.021 77. Manzoni R, Montani F, Visintin C, Caudron F, Ciliberto A, Visintin R (2010) Oscillations in Cdc14 release and sequestration reveal a circuit underlying mitotic exit. J Cell Biol 190(2):209– 222. doi:10.1083/jcb.201002026 78. Matsuo T, Yamaguchi S, Mitsui S, Emi A, Shimoda F, Okamura H (2003) Control mechanism of the circadian clock for timing of cell division in vivo. Science 302(5643):255–259. doi:10.1126/science.1086271 79. Klevecz RR, Bolen J, Forrest G, Murray DB (2003) A genomewide oscillation in transcription gates DNA replication and cell cycle. Proc Natl Acad Sci U S A 101(5):1200–1205. doi:10.1073/pnas.0306490101 80. Mirollo RE, Strogatz SH (1990) Synchronization of pulse-coupled biological oscillators. SIAM J Appl Math 50(6):1645– 1662. doi:10.1137/0150098 81. Kanae O, Yukiko M, Akira F, Hiroaki K (2005) A comprehensive pathway map of epidermal growth factor receptor signaling. Mol Syst Biol 1:1. doi:10.1038/msb4100014 82. Laurence C, Amélie G, Andrei Z, François R, Emmanuel B (2008) A comprehensive modular map of molecular interactions in RB/E2F pathway. Mol Syst Biol 4:1. doi:10.1038/ msb.2008.7 83. Malumbres M, Barbacid M (2009) Cell cycle, CDKs and cancer: a changing paradigm. Nat Rev Cancer 9:153–166. doi:10.1038/nrc2602
Chapter 4 E2F Transcription Factors Control the Roller Coaster Ride of Cell Cycle Gene Expression Ingrid Thurlings and Alain de Bruin Abstract Initially, the E2F transcription factor was discovered as a factor able to bind the adenovirus E2 promoter and activate viral genes. Afterwards it was shown that E2F also binds to promoters of nonviral genes such as C-MYC and DHFR, which were already known at that time to be important for cell growth and DNA metabolism, respectively. These findings provided the first clues that the E2F transcription factor might be an important regulator of the cell cycle. Since this initial discovery in 1987, several additional E2F family members have been identified, and more than 100 targets genes have been shown to be directly regulated by E2Fs, the majority of these are important for controlling the cell cycle. The progression of a cell through the cell cycle is accompanied with the increased expression of a specific set of genes during one phase of the cell cycle and the decrease of the same set of genes during a later phase of the cell cycle. This roller coaster ride, or oscillation, of gene expression is essential for the proper progression through the cell cycle to allow accurate DNA replication and cell division. The E2F transcription factors have been shown to be critical for the temporal expression of the oscillating cell cycle genes. This review will focus on how the oscillation of E2Fs and their targets is regulated by transcriptional, post-transcriptional and post-translational mechanism in mammals, yeast, flies, and worms. Furthermore, we will discuss the functional impact of E2Fs on the cell cycle progression and outline the consequences when E2F expression is disturbed. Key words E2F transcription factors, Cell cycle, Oscillation, Gene expression, RB/E2F pathway
1
Introduction Quiescent cells are able to enter the cell cycle in G1-phase upon proper mitogenic stimulation (Fig. 1). Growth factors activate the RB/E2F-pathway, an important pathway for cell cycle progression, by stimulating G1-Cyclins and Cyclin-dependent kinases (CDKs) to form complexes. Activated Cyclin-CDK complexes will phosphorylate Rb-family members (RB, p107, p130), which are bound to E2Fs. Hyperphosphorylation of Rb-family members is the point of no return in the cell cycle, committing the cell to a full cycle of DNA replication and cell division. It leads to a conformational change of RB, releasing E2Fs from the complex.
Amanda S. Coutts and Louise Weston (eds.), Cell Cycle Oscillators: Methods and Protocols, Methods in Molecular Biology, vol. 1342, DOI 10.1007/978-1-4939-2957-3_4, © Springer Science+Business Media New York 2016
71
Rb G0 E2F
P G1
Rb
E2F
P
P
P
P
P
P
P
P P
Rb P
P
P
P
P
P
P
E2F S
E2F
E2F
E2F
E2F
E2F
G2
Ub Ub Ub Ub
Ub Ub Ub Ub
M
G1
Rb
E2F
Fig. 1 The pRb/E2F pathway is activated by growth signals when a cell enters a new round of the cell cycle. Cyclin D-CDK4/6-complexes phosphorylate Rb-family members, leading to release of activator E2Fs and progression into S-phase. Activated repressor E2Fs bring down the levels of activator E2Fs, guiding the cells to G2-phase and mitosis, when the transcription factors are degraded
E2F and Control of Gene Expression
73
The accumulation of free activating E2Fs leads to increased expression of their target genes. Activating E2Fs mainly bind to promoters of genes that are important for S-phase progression leading to the initiation of DNA replication [1–4]. This critical upswing of S-phase gene expression is followed by a downswing and is induced by the action of atypical E2Fs, the newest members of the mammalian family of E2F transcription factors, which are induced by activator E2Fs [5–11]. This mechanism of transcriptional repression to shut down S-phase gene expression during late S- and G2-phase is most likely required for the timely progression through G2–M; however, experimental evidence is still lacking. In addition to downregulating S-phase gene expression, atypical E2Fs repress classical E2F activators during G2, creating a direct negative feedback-loop to control the oscillating expression pattern of E2F target genes. Interestingly, atypical E2Fs also repress their own transcriptional activity [10, 11], providing a second negative feedback-loop, most likely to guarantee the repressive activity has been shut down before a cell starts the next cell cycle. A posttranslational mechanism has been identified on top of the transcriptional mechanism to induce degradation of S-phase proteins during G2–M, for example through the SCF-SKP2 complex in G2-phase, or anaphase-promoting complex or cyclosome (APC/C) mediated degradation from anaphase onwards [12–14]. Together these findings demonstrate that a complex mechanism exists to control the roller coast ride of E2F target gene expression during the cell cycle.
2
Regulation of Oscillating E2F Target Gene Expression in Mammals Proper oscillating E2F target gene expression is vital for cell cycle progression. Their altered expression can have detrimental consequences for the cell, such as speeding up or slowing down the cell cycle. In some occasions, it can even result in a cell cycle arrest or apoptosis, for example when the expression of specific members of the E2F family is altered. The mammalian E2F family consists of eight members, which are divided into activators (E2F1–3) and repressors (E2F4–8). E2F1–6 are classical E2Fs, with one DNA-binding domain, and are required to heterodimerize with DP1/DP2 proteins before they can bind target gene promoters and activate or repress their expression. E2F7 and E2F8 are considered as atypical E2Fs. They have two DNA-binding domains, and they can repress target genes independent of DP heterodimerization. Instead, they can form homodimers and heterodimers with each other [10, 15, 16]. The protein expression of the activator E2F1–3 increases in G1, peaks during S, and decreases in G2-phase [17]. RB blocks the
Ingrid Thurlings and Alain de Bruin
74
b mammals
G0
G1
rel. expression
rel. expression
a
S
G2
G0
M
G1
S
G2
M
S
G2
M
d
c Drosophila
G0
G1
rel. expression
rel. expression
yeast
S
activator E2F
G2
M
repressor E2F
C. elegans
G0
G1
non-oscillating E2F
E2F target
Fig. 2 E2F expression patterns. (a) The mammalian E2F family consists of activator, repressor, and nonoscillating E2Fs. (b) Yeast contains one oscillating, activator E2F. (c) The Drosophila E2F family consists of an activator and a repressor E2F, both E2Fs are oscillating. (d) The C. elegans E2F family consists of three members, all of which are non-oscillating
transcriptional activity of the activator E2Fs in G1 through the occupation of their transactivation domain. The RB-E2F complex dissociates upon RB hyperphosphorylation, and activation of E2F target gene expression starts, followed by entry into S-phase (Fig. 2a) [2, 18, 19]. The individual loss of E2F1, E2F2, or E2F3 has minor effects on the target gene expression and the cell cycle progression. Cells have a lengthened S-phase, but keep proliferating (see Table 1) [20–26]. However, the combined loss of E2F1–3 abolishes the possibility for mouse embryonic fibroblasts to enter S-phase and proliferate (see Table 1). This loss triggers a p53-p21Cip1 response and leads to a G1-phase arrest. However, as long as there is still one functional allele of one of the three activators, cells are able to continue through the cell cycle. These findings demonstrate a clear redundancy between the activating E2Fs [27, 28]. Remarkably, the requirement of E2F1–3 for cell cycle progression appears to be cell type specific, as deletion of the activator E2Fs has no effect on cell cycle progression in epithelial stem cells and lens progenitor cells. Nevertheless, the lens progenitor cells deficient for E2F1–3 display increased expression of cell cycle regulated genes, high levels of DNA damage and an activated p53-pathway, leading to massive apoptosis later in development, suggesting that E2F1–3 function as transcriptional repressors in stem cells most likely via
E2F and Control of Gene Expression
75
Table 1 Impact of altering E2F expression: deletion
Oscillation
Level
E2F1
No effect
No effect
E2F2
Earlier upswing
E2F3
Cell cycle progression
Cell fate
Reference
Lengthened S-phase
No effect
[20–22]
Increased
Enhanced S-phase
Hyper-proliferation
[23–25]
Delayed upswing
Decreased
Lengthened S-phase
Apoptosis
[21, 26]
E2F1–3
No upswing
Decreased
G1-phase arrest
Apoptosis, hyperploidy
[27, 28, 66]
E2F6
No effect
No effect
No effect
No effect
[37]
E2F7
No effect
No effect
No effect
No effect
[10]
E2F8
No effect
No effect
No effect
No effect
[10]
E2F7–8
No downswing
Increased
No effect
Apoptosis
[10]
SBF
Unknown
Decreased
G1-phase arrest
Apoptosis
[39, 41, 43–45]
MBF
Unknown
Decreased
G1-phase arrest
No effect
[39, 41, 45]
dE2F1
No upswing
Decreased
G1-phase arrest
Unknown
[19, 53]
dE2F2
Unknown
Increased
No effect
No effect
[19, 56]
EFL-1
Unknown
Increased
Enhanced S phase
Reduced apoptosis, endoduplication
[58, 59, 61]
their interaction with Rb [18]. The ectopic expression of activator E2Fs is sufficient to bypass upstream signals and drive cells into S-phase (see Table 2). When the activator E2F levels remain high after S-phase entry, cells will undergo apoptosis [2, 7, 29]. High levels of activator E2Fs lead to the induction of apoptotic target genes, such as APAF1 and p73, especially in response to DNA damage [2, 30]. E2F4 and E2F5 play important roles in keeping cells in quiescence, the resting phase of the cell cycle (G0). During this time, E2F4 and E2F5 form repressing complexes with the Rb-family members p107 and p130. Their binding to promoters of E2F target genes leads to inhibition of their expression and results in blockage of cell cycle progression. E2F4 and E2F5 are constitutively expressed throughout the cell cycle (Fig. 2a), but their subcellular localization changes during cell cycle progression to regulate their repressing transcriptional activity [31, 32]. In G0 and early G1, E2F4/5 are present in the nucleus to inhibit E2F target gene expression, but upon p107/p130 hyperphosphorylation through enhanced CDK activity during G1, E2F4/5 can be relocated to
76
Ingrid Thurlings and Alain de Bruin
Table 2 Impact of altering E2F expression: overexpression Oscillation
Level
Cell cycle progression
Cell fate
Reference
E2F1
Unknown
Increased
Enhanced G1-phase
Apoptosis
[2, 7, 29]
E2F2
Unknown
Increased
Induced S-phase entry
No effect
[2, 95]
E2F3
Earlier upswing
Increased
Induced S-phase entry
Hyper-proliferation [2, 96]
E2F6
Earlier downswing Decreased S-phase arrest
E2F7
Earlier downswing Decreased During G1: S-phase arrest Apoptosis
[5, 6, 11]
E2F8
Unknown
Decreased S-phase arrest
Unknown
[8, 9, 98]
SBF
Unknown
Increased
Enhanced G1/S
Toxic
[46]
MBF
Unknown
No effect
No effect
Toxic
[46]
dE2F1 Unknown
Increased
During G1: induction S phase During S: G1-arrest
Apoptosis
[54]
dE2F2 Unknown
Decreased No effect
No effect
[19]
EFL-1
Unknown Unknown
Sterility
[61, 99]
Unknown
Unknown
[37, 97]
the cytoplasm [33]. Experiments in synchronized cell populations have shown that E2F4 is able to repress and activate target genes during the cell cycle, suggesting a more versatile role for this transcription factor than its known function during quiescence [34]. E2F6–8 are transcriptional repressors, and are important for inhibiting the expression of target genes in S/G2-phase, most likely to ensure proper cell cycle progression. Like E2F1–3, the expression of E2F6–8 oscillates during the cell cycle. Since E2F1–3 induce the expression of E2F6–8, the upswing of E2F6–8 expression occurs a couple of hours later compared to the upswing of E2F1–3 expression. E2F6–8 expression peaks at S-G2 and declines during G2–M (Fig. 2a). They appear to function independent of Rb-family members, because they lack the classical pocket protein binding domain [6, 8, 11, 33, 35–37]. The exact role of E2F6 in cell cycle regulation and the effects of the loss or gain of this transcription factor are still unclear (Tables 1 and 2). It has been shown that E2F6 binds to promoters of target genes that are important for G1/S-phase progression during G2/M phase, repressing their expression so the cells can continue the cell cycle [37]. A loss of E2F6 can be compensated by E2F4, since this transcription factor is also able to bind to the same target gene promoters, and co-deletion of both E2F4 and E2F6 leads to a derepression of their target genes during S-phase [35, 37].
E2F and Control of Gene Expression
77
Cells lacking both E2F7 and E2F8 continue cycling as well, even though the RNA levels of the E2F target genes are strongly derepressed during S/G2-phase (Table 1). One possible explanation for the continuation of the cell cycle is that other E2F repressors, such as E2F4 or E2F6, can compensate for the loss of E2F7/8 to partially repress E2F target genes [10]. In addition, enhanced production of E2F target protein in response to loss of E2F7/8 will be most likely compensated through enhanced degradation mechanisms during G2/M. Remarkably, the effects on cell cycle progression of ectopic expression of E2F7 depend on the phase of the cell cycle (Table 2). The induction of E2F7 during G1-phase leads to a strong repression of its target genes involved in DNA replication, metabolism and repair, and to an early S-phase arrest. However, when E2F7 is induced later, during S-G2, cell cycle progression is not disturbed. Prolonged ectopic expression of E2F7 results in DNA damage and apoptosis [11]. Overexpression of E2F8 has been shown to reduce the proliferation rate [9]. However, overexpression studies where E2F8 is induced at different phases of the cell cycle are still missing. 2.1 Regulation of Oscillating E2F Target Gene Expression in Yeast, Flies, and Worms
E2Fs are highly conserved through evolution. This strong conservation of the E2Fs throughout different species allows us to use less complex systems to learn more about the general mechanisms that regulate the oscillating E2F target gene expression pattern.
2.1.1 E2Fs in Yeast
There is a robust functional similarity between the mammalian and yeast E2F proteins, but there is no detectable sequence homology throughout the protein [38]. The budding yeast E2F family consists of two activating proteins, SBF and MBF, which overlap in function. As in mammals, SBF and MBF are present in G1-phase, but they are bound to Whi5, the yeast protein functionally comparable to RB. SBF and MBF are released from its binding partner Whi5 by CDK-dependent hyperphosphorylation of Whi5, and become active in late G1-phase to promote target gene expression and subsequent cell cycle progression into S-phase (Fig. 2b) [38, 39]. SBF and MBF are inactivated in S-G2/M by B-type cyclins. SBF and MBF promote expression of B-type cyclins in late G1, which in turn inhibit the expression of SBF and MBF by phosphorylation [38, 40]. This phosphorylation leads to nuclear export of SBF and MBF [41]. A second level of regulation of MBF target genes is via Nrm1, a G1-target of MBF. This factor can bind MBF and together they form an inhibitory complex, repressing MBF target gene expression [42]. Deletion of SBF or MBF leads to a G1-phase arrest accompanied with a decreased expression of the target genes (Table 1), which can lead to apoptosis [39, 41, 43–45]. Overexpression of SBF or MBF leads to an enhanced G1–S-phase transition and is toxic to the cells (Table 2) [46].
78
Ingrid Thurlings and Alain de Bruin
2.1.2 E2Fs in Flies
Compared to mammals, Drosophila melanogaster has E2F family members that are both functionally and sequentially more conserved than in yeast. Drosophila has two E2F proteins, an activator E2F (dE2F1), with over 65 % sequence homology to human E2F1 in the DNA binding domain and 50 % homology in the RB-interacting domain [47], and a repressor E2F (dE2F2), with a similar level of homology as dE2F1 [48]. The Rb homologue RBF1 is a strong regulator of dE2F1, and is important to limit dE2F1-regulated activation of target genes in G1-phase, similar to its function in mammals [49–51]. dE2F1 accumulates in G1-phase, when RBF1 is phosphorylated and dissociates from the transcription factor. Once the cells progress into S-phase, dE2F1 is rapidly degraded by the Cul4Cdt2 E3 ubiquitin ligase, via a PCNA-interacting-protein motif (Fig. 2c) [52]. The loss of dE2F1 leads to a G1-phase arrest, as there is no upswing of the activator target genes to push the cells forward into S-phase (Table 1) [19, 53]. Ectopic expression of dE2F1 in S-phase has effects on the cell in the following cell cycle (Table 2). Cells are unable to enter the next S-phase with continued expression of dE2F1. However, if the ectopic expression is limited to G1, there will be a strong induction of S-phase due to high levels of target genes. A subset of these genes regulates apoptosis, leading cells with high dE2F1 levels to their fate [54]. An important function of dE2F2 is to antagonize the function of dE2F1 through repression of their common E2F target genes. This competition between the activator and repressor E2F is important for cell cycle progression, as the cell cycle progression phenotypes caused by deletion of dE2F1 can be rescued by deletion of dE2F2 [19, 54, 55]. The deletion or overexpression of dE2F2 has no clear effects on the cell cycle (Tables 1 and 2). There is an increase in its target genes when dE2F2 is absent, but without any resulting phenotypes. Ectopic expression of dE2F2 leads to a decrease in target gene expression, but surprisingly also without any effect on cell cycle progression or cell fate [19, 56].
2.1.3 E2Fs in Worms
C. elegans has three E2F transcription factors, namely EFL-1, EFL2, and the recently identified EFL-3. None of their expression levels appear to be cell cycle regulated (Fig. 2d). E2F proteins in C. elegans are important during development, regulating tightly controlled cell divisions redundantly with several regulatory pathways, including the RAS/MAP kinase cascade [57]. EFL-1 shares its structure with mammalian E2F4 and E2F5, its DNA binding domain is highly conserved and the dimerization domains have 38 % homology [58]. This transcription factor acts as a transcriptional repressor and thereby inhibits S-phase entry [59]. It forms a repressor complex with LIN-35 (most homologous to p107 and p130, overall 19 % and 20 % amino acid homology, respectively) in
E2F and Control of Gene Expression
79
G1, repressing G1/S genes [57, 58]. In G1-phase, the Cyclin D1 (CYD1)/CDK-4 complex phosphorylates the LIN-35/EFL-1 complex, relieving the inhibitory effect on target genes like Cyclin E (CYE1), pushing the cells into S-phase [57, 60]. The loss of EFL-1 in C. elegans leads to enhanced S-phase entry and hyperplasia, as the negative regulation is gone and target genes are derepressed, similar to the loss of LIN-35 (Table 1). There is not much known about the effects of ectopic expression of EFL-1 on the cell cycle, only that C. elegans overexpression mutants are sterile (Table 2) [61]. EFL-2 is most similar to mammalian E2F3 and E2F6 (the dimerization domain homology is 37 %) and is proposed to act as an E2F activator during the cell cycle. However, current data only supports a transcriptional activator role during apoptosis [58, 61]. EFL-3 is a novel homologue of the mammalian E2F7 and E2F8, and it does not appear to be essential for regulating cell cycle progression. However, it has been shown that EFL-3 acts as a repressor in cooperation with Hox to regulate apoptosis [62, 63]. The function of the activator E2Fs to stimulate target gene expression and moving the cell into S-phase is highly conserved from yeast to mammals. Furthermore, the inhibitory effect of RB interaction with E2F activators is strongly conserved as well. In contrast, the evolution of E2F repressors in different species is quite diverse. In line with this observation, different mechanisms have evolved in mammals, yeast, flies, and worms to regulate the downswing of E2F target gene expression. The relevance of downregulation of E2F target genes for cell cycle progression remains obscure, since inactivation of E2F repressors has no major impact on cell cycle progression and cells continue to proliferate even in the absence of E2F repressors. Recent studies provide evidence that loss of E2F repressors such as E2F7/8 can lead to hyperproliferation or inhibition of abortive cell cycles [64, 65]. Future studies are necessary to determine what the long-term effects are of deleting E2F repressors to understand functional impact on tissue homeostasis, aging, and tumorigenesis.
3
Mechanisms That Regulate the Oscillation of the E2F Transcription Factors There are several mechanisms that tightly regulate the oscillating E2F expression during the cell cycle to prevent aberrant cell cycle progression. These mechanisms are on transcriptional, posttranscriptional, and post-translational levels. Transcriptionally, the most common regulation of E2Fs in proliferating cells is via a feedback-loop by E2Fs themselves [1, 66]. Activator E2Fs promote the expression of repressor E2Fs by binding to their promoter sites. Repressor E2Fs can bind to the promoters of activator E2Fs and inhibit their transcription, creating a negative feedback within the system [1].
80
Ingrid Thurlings and Alain de Bruin
E2Fs are also strongly regulated by c-Myc [67, 68]. c-Myc binds to the promoter of activator E2Fs after cells are triggered to start proliferating, leading to increasing levels of E2F mRNA and consequently E2F protein, and activation of E2F target genes [69]. It has also been shown that c-Myc is essential for the loading of E2F1 on activator E2F promoters. Immunoprecipitation experiments for c-Myc and E2F1 on endogenous E2F2 promoters after serum stimulation show that c-Myc binds from 4 h after stimulation onwards, while E2F1 does not bind until 16 h after serum stimulation. Importantly, mutations in E box elements in the promoter abolishes both c-Myc and E2F1 binding to the promoter [69]. In recent years, it has been shown that E2Fs are also under post-transcriptional regulation by microRNAs (miRNAs); short noncoding RNAs that are involved in many biological processes such as cell proliferation, differentiation, and oncogenesis. For instance, c-Myc activates a cluster of six miRNAs. Two of these miRNAs can inhibit the expression of E2F1, namely miR-17-5p and miR-20a. The inhibition of E2F1 by these miRNAs seems to be a mechanism to control E2F activation by c-Myc via a negative feedback loop in G1-phase, preventing uncontrolled activation of E2F1 [70]. Another example of miRNA regulation is the repression of E2F7 via miR-26a in acute myeloid leukemia (AML) cells. The E2F7 3′-UTR contains two putative binding sites for miR-26a, and E2F7 levels are increased after knockdown of this miRNA [71]. E2Fs are also regulated through post-translational regulation. Chk1 is an important kinase for the regulation of cell cycle progression after replication stress and DNA damage. During replication stress, E2F6 replaces the activator E2Fs on the target gene promoters, repressing their expression. Once the DNA damage caused by replication stress is repaired and the DNA replication checkpoint is satisfied, Chk1 phosphorylates E2F6. This leads to the dissociation of E2F6 from the promoters, and freeing them for activator E2Fs to bind again and promote cell cycle progression [35]. Transcriptional repression of transcription factors is an important step in limiting target gene expression, but this no longer has any effect on the already synthesized pool of proteins. Cyclin-CDK complexes are vital in E2F regulation. These complexes phosphorylate and inactivate Rb and E2Fs during different phases of the cell cycle [3, 72]. The regulation of protein turnover is another way to control the activity of E2Fs. The decrease of E2F1–3 in late S-G2 phase is caused via the SKP2-CUL1 complex, which targets the proteins for degradation [12]. A second degradation mechanism acts primarily in mitosis, namely via APC/CCdh1. The levels of E2F3 are slowly decreased upon cell cycle exit through APC/CCDh1. E2F3 interacts with both Cdh1 and Cdc20 in vitro, but it seems to be a predominant target of Cdh1 in vivo [73]. Another substrate for APC/C is E2F1. E2F1 interacts with Cdh1 and Cdc20 in vitro,
E2F and Control of Gene Expression
81
similar to E2F3, but is mainly degraded by Cdc20 in vivo [13]. There are currently no reports on APC/C-mediated degradation of repressor E2Fs, but their oscillating expression pattern during the cell cycle suggests that these transcription factors are degraded as well [6, 8].
4
Mechanism of Controlling Target Gene Transcription by E2Fs Activator and repressor E2Fs work together to control the oscillating expression pattern of E2F target genes. It is known that activator and repressor E2Fs can bind to a common set of promoters to balance target gene expression in vivo, for instance in the liver and placenta [64–66]. Loss of activator E2F1–3 in the mouse liver results in downregulation of target genes, while loss of repressor E2F7/8 leads to upregulation of the same target genes [65, 66]. However, it is still unknown how different E2Fs regulate the expression of target genes at the promoter levels. All E2Fs can bind to the E2F consensus sequence TTTSSCGC, but the different E2F factors can also bind to non-consensus motifs [11, 34, 74]. One possible mechanism is that activating and repressing E2Fs compete for the same E2F binding sites, and the E2F factor with the highest DNA-binding affinity or the highest expression levels has a stronger effect on the transcriptional outcome (Fig. 3) [11, 75]. Another possibility is that binding to certain promoters or low-affinity sites is stabilized in cooperation with other transcription factors, for instance the binding of E2F7/8 to hypoxia-induced factor (HIF) during hypoxia, as HIF is essential for inhibiting cell cycle proliferation under this condition [76–78]. Since many promoters contain multiple consensus and nonconsensus E2F binding sites, an alternative mechanism would be that different E2Fs bind to different sites on the same promoter binding-site competition
activation
dominance of repression
E2F
E2F
TSS
TSS
repression
E2F
E2F TSS
E2F TSS
Fig. 3 There are two main models of E2F target gene regulation. The first shows competition between activator and repressor E2Fs for the same binding site, the second shows simultaneous binding and a dominant effect of repressor binding
82
Ingrid Thurlings and Alain de Bruin
and the combinatorial activating and repressing transcriptional activity of each individual E2F factor determines the transcriptional outcome. Previous studies provide evidence for the presence of positive- and negative-acting E2F promoter elements, for example in the CDK1 and CCNB1 promoter, whereby E2F1–3 bind to the positive acting site and E2F4 to negative acting sites [74, 79]. The expression patterns of E2F1–3 and E2F6–8 show a strong overlap especially during S-phase, so it is likely that they have overlapping binding sites as well. Currently it is unclear whether the competitor model or the activator/repressor specificsite model is critical to determine the transcriptional outcome of E2F target genes during S-phase. Recently, it has been shown that E2F1 and E2F7 can bind to the same binding sites in the E2F1 promoter utilizing the gel shift assay [80]. Interestingly, it was also demonstrated that E2F1 and E2F7 can form a complex, and that the binding of E2F1-E2F7 heterodimer towards the promoter required the presence of two adjacent E2F binding sites [80]. Together, these findings show that activator and repressor E2Fs can bind to the same binding site, but also to different E2F sites in the same promoter, providing support for both models outlined above. However, it still unclear how the different binding options for activator and repressor E2Fs regulate the transcriptional activity of the target gene. For example, does induced expression of repressor E2F lead to disappearance of activator E2Fs from the promoter and vice versa? Does the number of consensus and non-consensus E2F sites in a promoter influence the transcriptional activity of a promoter? Do activator and repressor E2Fs bind to the same promoter in vivo during S-phase? Does the distance between E2F binding sites and the transcriptional start site influence the transcription rate? Future studies will be necessary to unravel the mechanism of how activator and repressor E2Fs regulate the expression of target genes at the promoter level. 4.1 Altered Regulation of E2F Target Gene Expression
The majority of human cancers show enhanced expression of E2Fs and E2F target genes (reviewed in [81]), providing evidence that proper control of E2F target expression is critical to avoid uncontrolled proliferation. Altered expression of E2F target genes is often caused by specific mutations in upstream regulators of the RB/E2F pathway, such as Cyclin D amplification [82], or by mutations of the RB/E2F pathway itself (reviewed in [81]). Transgenic mouse models for E2F activators demonstrated that enhanced expression of E2F1–3 leads to enhanced E2F target gene expression and spontaneous tumor formation (reviewed in [81]). Moreover, deletion of activator E2Fs in mouse models of cancer can reduce tumorigenesis, such as inactivation of E2F3 in a mouse model of mammary cancer [83]. Importantly, E2F activators have oncogenic potential, but can also function as tumor suppressors in specific tissues. E2F1 plays an important role in repressing skin
E2F and Control of Gene Expression
83
carcinogenesis by inducing DNA repair and apoptosis in response to DNA damage [84, 85]. The role of repressor E2Fs (E2F6–8) in controlling tumorigenesis is still undetermined, and it is unclear whether the timely downswing of oscillating E2F target gene expression is critical to suppress tumorigenesis. Preliminary data from our group show that inactivation of atypical E2Fs leads to spontaneous tumor formation in mice (unpublished data), providing strong evidence that enhanced expression of E2F target genes can lead to uncontrolled proliferation and cancer. Further support that repressor E2Fs can function as tumor suppressors is provided by studies showing that E2F7 is involved in cellular senescence and DNA damage. During oncogene-induced senescence or DNA damage, E2F7 is a direct transcriptional target of p53 and represses target genes that are involved in cell cycle progression to promote a strong cell cycle arrest [86–89]. Tight control of E2F target expression is not only important to prevent tumorigenesis but also for development. Inactivation of E2Fs in mice and zebrafish and the subsequent deregulation of E2F target gene expression results in many developmental defects of the placenta [64, 66] and the embryo [10, 78, 81]. Studies performed in the mammalian placenta and liver, as well as in flies and plants, revealed that E2Fs are not only important for regulating the normal cell cycle, but are also critical for the control of abortive cell cycles (reviewed in [90]). Abortion of the cell cycle can occur before entering mitosis (endocycle), during mitosis (endomitosis) or during cytokinesis (incomplete cytokinesis) and leads to the formation of polyploid cells, cells with increased numbers of chromosome sets. Remarkably, inactivation of the repressors E2F7/8 prevents the formation of polyploid cells in hepatocytes and giant trophoblast cells, while inactivation of activator E2F1 enhances polyploidization [65, 66]. These findings demonstrate that low levels of E2F target gene expression promote an abortive cell cycle leading to the formation of polyploid cells in the placenta and liver. In contrast, when the levels of E2F target gene expression were increased through inactivation of the repressors E2F7/8, cells completed a normal cell cycle and polyploidization was blocked. This suggests that the levels of E2F target gene expression determine whether a hepatocyte or trophoblast cell enters a normal or an abortive cell cycle.
5
Outstanding Questions There have been great advancements in understanding how E2Fs function since their discovery in the late 1980s [91]. However, there are still many open questions concerning the regulation of the oscillating E2F target expression. Since many cancers are characterized by the deregulation of E2F target expression, it will
84
Ingrid Thurlings and Alain de Bruin
be critical to understand the mechanism that influences E2F target gene expression in more detail. For example, what are the dynamics of expression of E2Fs and its targets in single cells in response to growth signals or DNA damage? What is the expression profile of all E2Fs in different tissue and cell types during cell cycle progression? What is the direct impact of the acute deletion or overexpression of E2Fs on the length of each cell cycle phase? A bottleneck in answering these questions has been the redundancy in the mammalian E2F family members, and the limitations of the techniques by looking at cell populations. Recent developments in single cell analysis techniques have made it possible to take the next step. It is now feasible to analyze the gene expression pattern of a single cell by single cell transcriptomics, which can provide more detailed knowledge about the regulation of E2Fs and their target genes [92, 93]. This will allow one to study whether each cell within a particular tissue has the same expression pattern, or whether there are subsets of cells within a tissue that have distinct expression profiles. Another strong tool to help elucidate questions about E2F functions during the cell cycle is live time lapse microscopy of cells expressing fluorescent cell cycle indicators, such as the ubiquitination-based cell cycle indicator (FUCCI) system [68, 94]. Thus, cell cycle progression of single cells over time can be visualized, and the effects of manipulating the activity of specific E2Fs can be monitored. Combining these two single cell techniques makes it possible to analyze in detail the entire network of E2F target genes during specific phases of the cell cycle. Utilizing these novel single cell analysis technologies will help to provide answers to the burning fundamental questions about the dynamics and mechanism of expression of E2Fs and its targets. Moreover, it will help to design novel strategies to avoid or inhibit altered E2F target gene expression patterns in diseases such as cancer.
Acknowledgements We thank B. Westendorp and W.J. Bakker for critically reviewing the manuscript. References 1. Wong JV, Dong P, Nevins JR et al (2011) Network calisthenics: control of E2F dynamics in cell cycle entry. Cell Cycle 10:3086–3094 2. DeGregori J, Leone G, Miron A et al (1997) Distinct roles for E2F proteins in cell growth control and apoptosis. Proc Natl Acad Sci U S A 94:7245–7250
3. Weinberg R (2013) The biology of cancer, 2nd edn. Garland Science, New York, NY 4. Sun A, Bagella L, Tutton S et al (2007) From G0 to S phase: a view of the roles played by the retinoblastoma (Rb) family members in the Rb-E2F pathway. J Cell Biochem 102:1400– 1404. doi:10.1002/jcb.21609
E2F and Control of Gene Expression 5. Di Stefano L, Jensen MR, Helin K (2003) E2F7, a novel E2F featuring DP-independent repression of a subset of E2F-regulated genes. EMBO J 22:6289–6298. doi:10.1093/emboj/ cdg613 6. de Bruin A, Maiti B, Jakoi L et al (2003) Identification and characterization of E2F7, a novel mammalian E2F family member capable of blocking cellular proliferation. J Biol Chem 278:42041–42049. doi:10.1074/jbc. M308105200 7. Logan N, Delavaine L, Graham A et al (2004) E2F-7: a distinctive E2F family member with an unusual organization of DNA-binding domains. Oncogene 23:5138–5150. doi:10.1038/sj.onc. 1207649 8. Christensen J, Cloos P, Toftegaard U et al (2005) Characterization of E2F8, a novel E2Flike cell-cycle regulated repressor of E2Factivated transcription. Nucleic Acids Res 33:5458–5470. doi:10.1093/nar/gki855 9. Maiti B, Li J, de Bruin A et al (2005) Cloning and characterization of mouse E2F8, a novel mammalian E2F family member capable of blocking cellular proliferation. J Biol Chem 280: 18211–18220. doi:10.1074/jbc.M501410200 10. Li J, Ran C, Li E et al (2008) Synergistic function of E2F7 and E2F8 is essential for cell survival and embryonic development. Dev Cell 14:62–75. doi:10.1016/j.devcel.2007.10.017 11. Westendorp B, Mokry M, Groot Koerkamp MJA et al (2012) E2F7 represses a network of oscillating cell cycle genes to control S-phase progression. Nucleic Acids Res 40:3511–3523. doi:10.1093/nar/gkr1203 12. Nakayama KI, Nakayama K (2006) Ubiquitin ligases: cell-cycle control and cancer. Nat Rev Cancer 6:369–381. doi:10.1038/nrc1881 13. Peart MJ, Poyurovsky MV, Kass EM et al (2010) APC/C(Cdc20) targets E2F1 for degradation in prometaphase. Cell Cycle 9:3956–3964 14. GeleyS,KramerE,GieffersCetal(2001)Anaphasepromoting complex/cyclosome-dependent proteolysis of human cyclin A starts at the beginning of mitosis and is not subject to the spindle assembly checkpoint. J Cell Biol 153:137–148 15. Trimarchi JM, Lees JA (2002) Sibling rivalry in the E2F family. Nat Rev Mol Cell Biol 3:11– 20. doi:10.1038/nrm714 16. Lammens T, Li J, Leone G, De Veylder L (2009) Atypical E2Fs: new players in the E2F transcription factor family. Trends Cell Biol 19:111–118. doi:10.1016/j.tcb.2009.01.002 17. Leone G, DeGregori J, Yan Z et al (1998) E2F3 activity is regulated during the cell cycle and is required for the induction of S phase. Genes Dev 12:2120–2130
85
18. Wenzel PL, Chong J-L, Sáenz-Robles MT et al (2011) Cell proliferation in the absence of E2F1-3. Dev Biol 351:35–45. doi:10.1016/j. ydbio.2010.12.025 19. Frolov MV, Huen DS, Stevaux O et al (2001) Functional antagonism between E2F family members. Genes Dev 15:2146–2160. doi:10.1101/gad.903901 20. Logan TJ, Evans DL, Mercer WE et al (1995) Expression of a deletion mutant of the E2F1 transcription factor in fibroblasts lengthens S phase and increases sensitivity to S phasespecific toxins. Cancer Res 55:2883–2891 21. Humbert PO, Verona R, Trimarchi JM et al (2000) E2f3 is critical for normal cellular proliferation. Genes Dev 14:690–703 22. Dos Reis Vasques L, Pujiz RS, Strauss BE, Krieger JE (2010) Knockdown of E2f1 by RNA interference impairs proliferation of rat cells in vitro. Genet Mol Biol 33:17–22. doi:10.1590/S1415-47572009005000104 23. Degregori J, Johnson DG (2006) Distinct and overlapping roles for E2F family members in transcription, proliferation and apoptosis. Curr Mol Med 6:739–748 24. Zhu JW, Field SJ, Gore L et al (2001) E2F1 and E2F2 determine thresholds for antigeninduced T-cell proliferation and suppress tumorigenesis. Mol Cell Biol 21:8547–8564. doi:10.1128/MCB.21.24.8547-8564.2001 25. Laresgoiti U, Apraiz A, Olea M et al (2013) E2F2 and CREB cooperatively regulate transcriptional activity of cell cycle genes. Nucleic Acids Res 41:10185–10198. doi:10.1093/ nar/gkt821 26. Chong J-L, Tsai S-Y, Sharma N et al (2009) E2f3a and E2f3b contribute to the control of cell proliferation and mouse development. Mol Cell Biol 29:414–424. doi:10.1128/ MCB.01161-08 27. Wu L, Timmers C, Maiti B et al (2001) The E2F1-3 transcription factors are essential for cellular proliferation. Nature 414:457–462. doi:10.1038/35106593 28. Tsai S-Y, Opavsky R, Sharma N et al (2008) Mouse development with a single E2F activator. Nature 454:1137–1141. doi:10.1038/ nature07066 29. Stevens C, Smith L, La Thangue NB (2003) Chk2 activates E2F-1 in response to DNA damage. Nat Cell Biol 5:401–409. doi:10.1038/ ncb974 30. Carnevale J, Palander O, Seifried LA, Dick FA (2012) DNA damage signals through differentially modified E2F1 molecules to induce apoptosis. Mol Cell Biol 32:900–912. doi:10.1128/ MCB.06286-11
86
Ingrid Thurlings and Alain de Bruin
31. Müller H, Moroni MC, Vigo E et al (1997) Induction of S-phase entry by E2F transcription factors depends on their nuclear localization. Mol Cell Biol 17:5508–5520 32. Verona R, Moberg K, Estes S et al (1997) E2F activity is regulated by cell cycle-dependent changes in subcellular localization. Mol Cell Biol 17:7268–7282 33. Attwooll C, Lazzerini Denchi E, Helin K (2004) The E2F family: specific functions and overlapping interests. EMBO J 23:4709–4716. doi:10.1038/sj.emboj.7600481 34. Lee B-K, Bhinge AA, Iyer VR (2011) Wideranging functions of E2F4 in transcriptional activation and repression revealed by genomewide analysis. Nucleic Acids Res 39:3558– 3573. doi:10.1093/nar/gkq1313 35. Bertoli C, Klier S, McGowan C et al (2013) Chk1 inhibits E2F6 repressor function in response to replication stress to maintain cellcycle transcription. Curr Biol 23:1629–1637. doi:10.1016/j.cub.2013.06.063 36. Lyons TE, Salih M, Tuana BS (2006) Activating E2Fs mediate transcriptional regulation of human E2F6 repressor. Am J Physiol Cell Physiol 290:C189–C199. doi:10.1152/ajpcell. 00630.2004 37. Giangrande PH, Zhu W, Schlisio S et al (2004) A role for E2F6 in distinguishing G1/S- and G2/M-specific transcription. Genes Dev 18:2941–2951. doi:10.1101/gad.1239304 38. Cross FR, Buchler NE, Skotheim JM (2011) Evolution of networks and sequences in eukaryotic cell cycle control. Philos Trans R Soc Lond B Biol Sci 366:3532–3544. doi:10.1098/rstb.2011.0078 39. Charvin G, Oikonomou C, Siggia ED, Cross FR (2010) Origin of irreversibility of cell cycle start in budding yeast. PLoS Biol 8, e1000284. doi:10.1371/journal.pbio.1000284 40. Amon A, Tyers M, Futcher B, Nasmyth K (1993) Mechanisms that help the yeast cell cycle clock tick: G2 cyclins transcriptionally activate G2 cyclins and repress G1 cyclins. Cell 74:993–1007 41. Bähler J (2005) Cell-cycle control of gene expression in budding and fission yeast. Annu Rev Genet 39:69–94. doi:10.1146/annurev. genet.39.110304.095808 42. de Bruin RAM, Kalashnikova TI, Chahwan C et al (2006) Constraining G1-specific transcription to late G1 phase: the MBF-associated corepressor Nrm1 acts via negative feedback. Mol Cell 23:483–496. doi:10.1016/j.molcel. 2006.06.025 43. Igual JC, Johnson AL, Johnston LH (1996) Coordinated regulation of gene expression by
44.
45.
46.
47.
48.
49.
50.
51.
52.
53.
54.
55.
56.
the cell cycle transcription factor Swi4 and the protein kinase C MAP kinase pathway for yeast cell integrity. EMBO J 15:5001–5013 Verma R, Smiley J, Andrews B, Campbell JL (1992) Regulation of the yeast DNA replication genes through the Mlu I cell cycle box is dependent on SWI6. Proc Natl Acad Sci U S A 89:9479–9483 Koch C, Moll T, Neuberg M et al (1993) A role for the transcription factors Mbp1 and Swi4 in progression from G1 to S phase. Science 261:1551–1557 Sopko R, Huang D, Preston N et al (2006) Mapping pathways and phenotypes by systematic gene overexpression. Mol Cell 21:319– 330. doi:10.1016/j.molcel.2005.12.011 Ohtani K, Nevins JR (1994) Functional properties of a Drosophila homolog of the E2F1 gene. Mol Cell Biol 14:1603–1612 Sawado T, Yamaguchi M, Nishimoto Y et al (1998) dE2F2, a novel E2F-family transcription factor in Drosophila melanogaster. Biochem Biophys Res Commun 251:409–415. doi:10.1006/bbrc.1998.9407 Dimova DK, Stevaux O, Frolov MV, Dyson NJ (2003) Cell cycle-dependent and cell cycleindependent control of transcription by the Drosophila E2F/RB pathway. Genes Dev 17:2308–2320. doi:10.1101/gad.1116703 Lee H, Ragusano L, Martinez A et al (2012) A dual role for the dREAM/MMB complex in the regulation of differentiation-specific E2F/ RB target genes. Mol Cell Biol 32:2110–2120. doi:10.1128/MCB.06314-11 Ji J-Y, Miles WO, Korenjak M et al (2012) In vivo regulation of E2F1 by Polycomb group genes in Drosophila. G3 (Bethesda) 2:1651– 1660. doi:10.1534/g3.112.004333 Shibutani ST, la Cruz de AFA, Tran V et al (2008) Intrinsic negative cell cycle regulation provided by PIP box- and Cul4Cdt2-mediated destruction of E2f1 during S phase. Dev Cell 15: 890–900. doi:10.1016/j.devcel.2008.10.003 Duronio RJ, O’Farrell PH (1994) Developmental control of a G1-S transcriptional program in Drosophila. Development 120:1503–1515 Asano M, Nevins JR, Wharton RP (1996) Ectopic E2F expression induces S phase and apoptosis in Drosophila imaginal discs. Genes Dev 10:1422–1432 Frolov MV, Moon N-S, Dyson NJ (2005) dDP is needed for normal cell proliferation. Mol Cell Biol 25:3027–3039. doi:10.1128/MCB. 25.8.3027-3039.2005 Ambrus AM, Nicolay BN, Rasheva VI et al (2007) dE2F2-independent rescue of proliferation in
E2F and Control of Gene Expression
57.
58.
59.
60.
61.
62.
63.
64.
65.
66.
67.
68.
69.
cells lacking an activator dE2F1. Mol Cell Biol 27:8561–8570. doi:10.1128/MCB.01068-07 Koreth J, van den Heuvel S (2005) Cell-cycle control in Caenorhabditis elegans: how the worm moves from G1 to S. Oncogene 24:2756–2764. doi:10.1038/sj.onc.1208607 Ceol CJ, Horvitz HR (2001) dpl-1 DP and efl-1 E2F act with lin-35 Rb to antagonize Ras signaling in C. elegans vulval development. Mol Cell 7:461–473 Boxem M, van den Heuvel S (2002) C. elegans class B synthetic multivulva genes act in G(1) regulation. Curr Biol 12:906–911 Roy SH, Tobin DV, Memar N et al (2014) A complex regulatory network coordinating cell cycles during C. elegans development is revealed by a genome-wide RNAi screen. G3 (Bethesda) 4:795–804. doi:10.1534/g3.114. 010546 Schertel C, Conradt B (2007) C. elegans orthologs of components of the RB tumor suppressor complex have distinct pro-apoptotic functions. Development 134:3691–3701. doi:10.1242/dev.004606 van den Heuvel S, Dyson NJ (2008) Conserved functions of the pRB and E2F families. Nat Rev Mol Cell Biol 9:713–724. doi:10.1038/ nrm2469 Winn J, Carter M, Avery L, Cameron S (2011) Hox and a newly identified E2F co-repress cell death in Caenorhabditis elegans. Genetics 188: 897–905. doi:10.1534/genetics.111.128421 Ouseph MM, Li J, Chen H-Z et al (2012) Atypical E2F repressors and activators coordinate placental development. Dev Cell 22:849– 862. doi:10.1016/j.devcel.2012.01.013 Pandit SK, Westendorp B, Nantasanti S et al (2012) E2F8 is essential for polyploidization in mammalian cells. Nat Cell Biol 14:1181–1191. doi:10.1038/ncb2585 Chen H-Z, Ouseph MM, Li J et al (2012) Canonical and atypical E2Fs regulate the mammalian endocycle. Nat Cell Biol 14:1192–1202. doi:10.1038/ncb2595 Hölzel M, Kohlhuber F, Schlosser I et al (2001) Myc/Max/Mad regulate the frequency but not the duration of productive cell cycles. EMBO Rep 2:1125–1132. doi:10.1093/emboreports/kve251 Dong P, Maddali MV, Srimani JK et al (2014) Division of labour between Myc and G1 cyclins in cell cycle commitment and pace control. Nat Commun 5:4750. doi:10.1038/ncomms5750 Leung JY, Ehmann GL, Giangrande PH, Nevins JR (2008) A role for Myc in facilitating transcription activation by E2F1. Oncogene 27:4172–4179. doi:10.1038/onc.2008.55
87
70. O’Donnell KA, Wentzel EA, Zeller KI et al (2005) c-Myc-regulated microRNAs modulate E2F1 expression. Nature 435:839–843. doi:10.1038/nature03677 71. Salvatori B, Iosue I, Mangiavacchi A et al (2012) The microRNA-26a target E2F7 sustains cell proliferation and inhibits monocytic differentiation of acute myeloid leukemia cells. Cell Death Dis 3, e413. doi:10.1038/cddis. 2012.151 72. Fung TK, Poon RYC (2005) A roller coaster ride with the mitotic cyclins. Semin Cell Dev Biol 16:335–342. doi:10.1016/j.semcdb.2005. 02.014 73. Ping Z, Lim R, Bashir T et al (2012) APC/C (Cdh1) controls the proteasome-mediated degradation of E2F3 during cell cycle exit. Cell Cycle 11:1999–2005. doi:10.4161/cc.20402 74. Xu X, Bieda M, Jin VX et al (2007) A comprehensive ChIP-chip analysis of E2F1, E2F4, and E2F6 in normal and tumor cells reveals interchangeable roles of E2F family members. Genome Res 17:1550–1561. doi:10.1101/ gr.6783507 75. Grant GD, Brooks L, Zhang X et al (2013) Identification of cell cycle-regulated genes periodically expressed in U2OS cells and their regulation by FOXM1 and E2F transcription factors. Mol Biol Cell 24:3634–3650. doi:10.1091/mbc.E13-05-0264 76. Goda N, Ryan HE, Khadivi B et al (2003) Hypoxia-inducible factor 1alpha is essential for cell cycle arrest during hypoxia. Mol Cell Biol 23:359–369 77. Ortmann B, Druker J, Rocha S (2014) Cell cycle progression in response to oxygen levels. Cell Mol Life Sci 71:3569–3582. doi:10.1007/ s00018-014-1645-9 78. Weijts BGMW, Bakker WJ, Cornelissen PWA et al (2012) E2F7 and E2F8 promote angiogenesis through transcriptional activation of VEGFA in cooperation with HIF1. EMBO J 31:3871–3884. doi:10.1038/emboj.2012.231 79. Zhu W, Giangrande PH, Nevins JR (2004) E2Fs link the control of G1/S and G2/M transcription. EMBO J 23:4615–4626. doi:10.1038/sj.emboj.7600459 80. Liu B, Shats I, Angus SP et al (2013) Interaction of E2F7 transcription factor with E2F1 and C-terminal-binding protein (CtBP) provides a mechanism for E2F7-dependent transcription repression. J Biol Chem 288:24581–24589. doi:10.1074/jbc.M113.467506 81. Chen H-Z, Tsai S-Y, Leone G (2009) Emerging roles of E2Fs in cancer: an exit from cell cycle control. Nat Rev Cancer 9:785–797. doi:10.1038/nrc2696
88
Ingrid Thurlings and Alain de Bruin
82. Okami K, Reed AL, Cairns P et al (1999) Cyclin D1 amplification is independent of p16 inactivation in head and neck squamous cell carcinoma. Oncogene 18:3541–3545. doi:10.1038/sj.onc.1202837 83. Wu L, de Bruin A, Wang H et al (2015) Selective roles of E2Fs for ErbB2- and Mycmediated mammary tumorigenesis. Oncogene 34:119–128. doi:10.1038/onc.2013.511 84. Russell JL, Weaks RL, Berton TR, Johnson DG (2006) E2F1 suppresses skin carcinogenesis via the ARF-p53 pathway. Oncogene 25:867–876. doi:10.1038/sj.onc.1209120 85. Biswas AK, Mitchell DL, Johnson DG (2014) E2F1 responds to ultraviolet radiation by directly stimulating DNA repair and suppressing carcinogenesis. Cancer Res 74: 3369–3377. doi:10.1158/0008-5472.CAN13-3216 86. Aksoy O, Chicas A, Zeng T et al (2012) The atypical E2F family member E2F7 couples the p53 and RB pathways during cellular senescence. Genes Dev 26:1546–1557. doi:10.1101/gad.196238.112 87. Carvajal LA, Hamard P-J, Tonnessen C, Manfredi JJ (2012) E2F7, a novel target, is upregulated by p53 and mediates DNA damagedependent transcriptional repression. Genes Dev 26:1533–1545. doi:10.1101/ gad.184911.111 88. Zalmas LP, Zhao X, Graham AL et al (2008) DNA-damage response control of E2F7 and E2F8. EMBO Rep 9:252–259. doi:10.1038/ sj.embor.7401158 89. Zalmas L-P, Coutts AS, Helleday T, La Thangue NB (2013) E2F-7 couples DNA damage-dependent transcription with the DNA repair process. Cell Cycle 12:3037–3051. doi:10.4161/cc.26078 90. Pandit SK, Westendorp B, de Bruin A (2013) Physiological significance of polyploidization in mammalian cells. Trends Cell Biol 23:556– 566. doi:10.1016/j.tcb.2013.06.002
91. Reichel R, Kovesdi I, Nevins JR (1987) Developmental control of a promoter-specific factor that is also regulated by the E1A gene product. Cell 48:501–506 92. Avital G, Hashimshony T, Yanai I (2014) Seeing is believing: new methods for in situ single-cell transcriptomics. Genome Biol 15:110. doi:10.1186/gb4169 93. Grindberg RV, Yee-Greenbaum JL, McConnell MJ et al (2013) RNA-sequencing from single nuclei. Proc Natl Acad Sci U S A 110:19802– 19807. doi:10.1073/pnas.1319700110 94. Sakaue-Sawano A, Kurokawa H, Morimura T et al (2008) Visualizing spatiotemporal dynamics of multicellular cell-cycle progression. Cell 132:487–498. doi:10.1016/j.cell.2007.12.033 95. Joyce NC, Harris DL, Mc Alister JC et al (2004) Effect of overexpressing the transcription factor E2F2 on cell cycle progression in rabbit corneal endothelial cells. Invest Ophthalmol Vis Sci 45:1340–1348 96. Rady B, Chen Y, Vaca P et al (2013) Overexpression of E2F3 promotes proliferation of functional human β cells without induction of apoptosis. Cell Cycle 12:2691–2702. doi:10.4161/cc.25834 97. Cartwright P, Müller H, Wagener C et al (1998) E2F-6: a novel member of the E2F family is an inhibitor of E2F-dependent transcription. Oncogene 17:611–623. doi:10.1038/sj.onc.1201975 98. Logan N, Graham A, Zhao X et al (2005) E2F8: an E2F family member with a similar organization of DNA-binding domains to E2F-7. Oncogene 24:5000–5004. doi:10.1038/sj.onc. 1208703 99. Reddien PW, Andersen EC, Huang MC, Horvitz HR (2007) DPL-1 DP, LIN-35 Rb and EFL-1 E2F act with the MCD-1 zincfinger protein to promote programmed cell death in Caenorhabditis elegans. Genetics 175:1719–1733. doi:10.1534/genetics.106. 068148
Part II Methods
Chapter 5 Cell Synchronization of Mouse Embryonic Fibroblasts Michael J. Thwaites, Courtney H. Coschi, Christian E. Isaac, and Frederick A. Dick Abstract A fundamental need in the analysis of the cell cycle is the ability to isolate relatively homogeneous populations of cells in different phases. This is complicated by the variable proliferative properties and responses to synchronizing methods of different cancer-derived cell lines. Paradoxically, cell lines with genetic defects in cell cycle control are sometimes chosen because they are amenable to chemical synchronization. Embryonic fibroblasts from mice present the opportunity to study the effects of defined genetic modifications on a normal cell cycle. However, synchronization of these cells has often been challenging. In this chapter we outline three basic protocols for isolating mouse fibroblasts at the G1-to-S-phase transition, in S phase, and during mitosis. Key words Flow cytometry, DNA replication, Aphidicolin, Serum starvation, Nocodazole
1
Introduction The mammalian cell division cycle is marked by a number of phases through which cells progress prior to division. G1, S, G2, and mitosis are distinct phases of the cell cycle that undertake specific molecular tasks related to division. Fidelity of the biochemical events that define these phases is ensured by checkpoints and other mechanisms that regulate the unidirectional transition between phases. These mechanisms are essential to propagate all living organisms [1]; however mistakes in the cell division cycle can lead to unwanted effects on development and fuel the progression of diseases such as cancer [2]. A long-standing challenge in understanding cell cycle control at a molecular level is the distinction between cause and consequence. A pathway that controls advancement of the cell cycle from one phase to the next could be mistaken for one that participates directly in distinct events during the next phase. Normal mouse embryonic fibroblast cells (MEFs) deficient for cell cycle
Amanda S. Coutts and Louise Weston (eds.), Cell Cycle Oscillators: Methods and Protocols, Methods in Molecular Biology, vol. 1342, DOI 10.1007/978-1-4939-2957-3_5, © Springer Science+Business Media New York 2016
91
92
Michael J. Thwaites et al.
regulators have been invaluable in determining requirements for cell cycle control as well as making distinctions between cause and consequence [3–6]. Serum starvation (G0) and contact inhibition (G1) methods readily allow for isolation of cells from these phases. However, the ability to synchronize MEFs later in the cell cycle for biochemical experiments is more challenging when compared with established cancer cell lines. In this chapter we outline protocols to isolate relatively uniform populations of MEFs for the analysis of events at the G1-toS-phase transition, in early S phase, and mitosis. The first is a serum deprivation and restimulation protocol to obtain cell populations in late G1 or early S phase to investigate the regulation and timing of the transition between these phases. The second is a protocol to isolate uniform populations of early S-phase cells and it can also be used to create enriched populations of mitotic cells. Lastly, we describe a nocodazole shake-off method for isolation of mitotic cells. In this way we have established simple methods for isolating MEFs in commonly studied phases of the cell cycle and we have used these routinely in our studies [7–9]. Investigators that are new to cell synchronization should be cautious in the implementation of these methods. It is critical that methods for assessing the degree of synchronization by flow cytometry be established in parallel. Methods for assessing cell cycle phases using BrdU and propidium iodide staining have been described previously [10], and flow cytometric techniques for detecting histone H3-S10 phosphorylation in mitosis are also available [11]. While we focus on the use of MEFs, we expect that these methods will be amenable for adaptation to other primary cell culture systems that best represent normal cell cycle regulation.
2
Materials
2.1 Generation and Culture of Mouse Embryonic Fibroblasts
1. Pregnant female mice, day 13.5 of gestation. 2. Stereomicroscope for dissection, equipped for top lighting. 3. Sterile phosphate-buffered saline (PBS). 4. Tissue culture-grade disposable plastics including 6 cm tissue culture dishes, T75 tissue culture flasks, 10 and 15 cm tissue culture dishes, and 50 ml conical tubes. 5. Sterile razor blades, watch maker’s forceps, and scissors. 6. Growth media: Dulbecco’s modified Eagle’s medium containing 100 U/ml penicillin, 10 μg/ml streptomycin, 200 mM L-glutamine, and 10 % fetal bovine serum. 7. Trypsin-EDTA: 0.05 % Trypsin, 0.7 mM EDTA in Hanks’ balanced salt solution.
Synchronization of Mouse Fibroblasts
93
8. Basic supplies for mammalian cell culture including incubators, laminar flow hood, tabletop centrifuge, and cell culture pipets. 9. 2 ml cryogenic vials (e.g., Thermo Scientific 5000-0020). 10. Slow cooling cryogenic container (e.g., Mr Frosty Freezing container, Thermo Scientific 5100-0001). 2.2 Cell Synchronization
1. Low-serum media: Dulbecco’s modified Eagle’s medium containing 100 U/ml penicillin, 10 μg/ml streptomycin, 200 mM L-glutamine, and 0.1 % fetal bovine serum. 2. 3 mM aphidicolin: 1 mg/ml in ethanol (250× stock). Store in the dark at −20 °C and remake weekly. 3. 150 μM nocodazole: 0.045 mg/ml in DMSO (1000× stock). Store in the dark at −20 °C.
3
Methods
3.1 Preparation of Mouse Embryonic Fibroblast
The generation of primary mouse embryonic fibroblast cultures (MEFs) is relatively ubiquitous. The basic protocol that we follow is devised to generate cultures from individual embryos. This creates the advantage that crosses designed to produce control and mutant embryos in the same litter will be processed in parallel and can be genotyped in isolation. In addition, cultures derived from individual embryos of the same genotype represent separate biological replicates. The biggest challenge in culturing MEFs is that oxidative DNA damage limits their proliferative capacity [12], and requires judicious protocol planning to ensure that they are used at as early a passage as possible. In addition, culture at low cell density is also detrimental to long-term proliferative capacity. The following protocol describes the generation of MEFs and illustrates how to organize cell cycle analysis experiments at the earliest passage possible. 1. Euthanize pregnant mother at day 13.5 of gestation. Dissect out uterus and submerge in PBS in a 10 cm dish. 2. Isolate individual embryos and transfer to separate 6 cm dishes containing PBS. 3. Under dissecting microscope use forceps to hook, poke, and scratch out organs and remove brain. Save these tissues or the yolk sac for DNA extraction and genotyping if desired. 4. Place carcass in a fresh, dry 6 cm dish and continue dissecting other embryos. 5. Once all embryos in a litter have been dissected, aspirate residual PBS and cover each embryo with 1 ml trypsin-EDTA. Mince tissue finely with a sterile razor blade. 6. Tip dish on edge to allow tissue and trypsin solution to pool, and place in 37 °C humidified incubator for 30 min on edge.
94
Michael J. Thwaites et al.
7. Pipet up and down ten times through a Pasteur pipet. Then add 4 ml of growth media, and pipet to mix. 8. Transfer cell suspension to a T75 flask and add 15 ml of growth media and incubate for 2 days (this is the first passage; see Note 1). 9. Rinse cells in PBS and dissociate with 3 ml trypsin-EDTA. Add 7 ml of growth media and pipet to break up small aggregates of cells. Allow larger aggregates to settle out to remove them from future cultures. Subculture cell suspension into three, 15 cm dishes in 30 ml of media per dish. 10. Culture for approximately two additional days and freeze in log growth phase. Trypsinize cells as above in step 9, resuspend in growth media containing 10 % DMSO at a density of three million cells per ml, and aliquot into cryogenic vials in 1 ml aliquots. These cells are in mid-passage 2 and each embryo should yield approximately 20 vials. Slowly freeze cells in a cryogenic container at −80 °C for 24 h. Following this slow freeze, cryovials are transferred to a −150 °C freezer (or liquid nitrogen vapor) for long-term storage. 11. Thaw a single cryovial per 10 cm dish or equivalent, and culture until it reaches confluence (end of passage 2). Subculture onto five, 10 cm dishes for passage 3. This will yield greater than 20 × 107 cells. Subculture again at the desired density for the start of passage 4 and use in the synchronization methods described below (see Note 2). 3.2 Cell Synchronization in G1 and at the G1-to-SPhase Transition
In this section we describe how to synchronize cells at the G1-Sphase boundary. Using this technique we are able to enrich for cells in the early stages of S phase using a relatively gentle induction of quiescence through serum deprivation. Cells are then stimulated to progress into the cell cycle with growth media containing 10 % serum. We find that this approach leads to adequate synchrony at the G1/S boundary without the use of drugs, which could affect the proliferative capacity of the cells or the integrity of the data. Figure 1 contains data depicting a time course following serum stimulation with growth media. Once a time course has been performed, particular time points can be selected for experiments in G1 phase (10–12 h in our example) and the G1/S boundary (approximately 18 h). In general, cells that do not reach S phase in the first 20 h enter the cell cycle more slowly. For this reason, unsynchronized cells in these cultures are earlier in the cell cycle and generally do not affect analysis of the G1/S boundary in these experiments. 1. Plate passage 4 MEFs at a density of 7 × 10⁵ cells per 10 cm plate or equivalent for each time point in growth media (see Note 3).
% BrdU positive cells
Synchronization of Mouse Fibroblasts
95
15
10
5
0 0h
10h
12h
14h
16h
18h
20h
22h
24h
Serum stimulation (hours)
Fig. 1 Time course of serum stimulation: Wild-type MEFs were stimulated with 10 % serum to reenter the cell cycle. Cells were pulse labeled with BrdU beginning 1 h before the indicated time points. The percentage of BrdU-positive cells at each time point was determined by flow cytometry
2. The following day wash the cells three times with PBS and re-feed with low-serum media. 3. Following 72 h of serum deprivation, standard growth media containing 10 % serum is added to each culture (see Note 4). 4. Harvest cells for cellular analyses, fractionation, RNA, or protein at the desired time point(s). 3.3 Generating Synchronous S-Phase and Mitotic Populations of Cells
The following section outlines our methods for isolating a highly synchronous S-phase population of cells. This method makes use of the DNA polymerase inhibitor aphidicolin to initially block cell cycle advancement in early S phase. In our experience, hydroxyurea and thymidine block techniques are too toxic for MEFs, and the cells cease to proliferate in response to these treatments. Since all of these chemicals unavoidably rely on a replication block that activates a DNA damage response, we do not recommend analyzing cells at the point of arrest. Our protocol removes aphidicolin and allows the cells to resume DNA synthesis before harvesting, thus obtaining a bona fide S-phase population. Cells synchronized in this manner can also be followed into M phase to enrich for mitotic figures. 1. At the end of passage 3, allow the cells to become fully confluent by leaving them for three additional days, for a total of 6 days following subculture. 2. Resume proliferation of cells by subculturing them at your desired cell density, but not less than 7 × 10⁵ cells for a 10 cm dish, to ensure maintenance of robust proliferation (see Note 3). 3. Ten hours following subculture, supplement media with 12 μM aphidicolin and culture for an additional 10 h. 4. Aspirate media, wash cells three times with PBS, and re-feed with fresh growth media.
96
Michael J. Thwaites et al.
5. Culture for an additional 2 h to allow the cells to resume DNA replication (see Note 5). 6. Cells can be cultured further and at 8 h post-aphidicolin removal, the peak of mitotic enrichment occurs (see Note 6). 3.4 Generating Large Quantities of Mitotic Cells
Mitotic shake-off approaches rely on the fact that mitotic cells round up compared to their interphase neighbors. This leads to poor attachment and consequently they are readily isolated by shearing forces associated with tapping the side of the dish or washing with media. Many human cancer cell lines can be arrested in mitosis with microtubule inhibitors for prolonged periods of time, leading to extensive mitotic enrichment. Murine cells are less amenable to accumulation at this cell cycle stage because they adapt to the arrest and decondense their chromosomes [13]. Consequently, shorter drug treatments are necessary and lower yields need to be expected. We have used the following brief protocol and it has allowed us to isolate large quantities of mitotic cells and even to undertake biochemical fractionation experiments (see Fig. 2). 1. Plate passage 4 MEFs at a density of at least 7 × 10⁵ cells per 10 cm plate or equivalent. 2. Two days later supplement the media with 150 nM nocodazole and return the cells to the incubator for 4 h (see Note 7). 3. Harvest weakly adherent cells first by removing 6 ml of culture media from each 10 cm dish and place in a centrifuge tube. This media is removed to prevent splashing. 4. Vigorously tap the cell culture dish on its side to detach cells. Remove this media and add to the first aliquot. 5. Wash cells vigorously with PBS using a strong stream of liquid from a tissue culture pipet to further remove cells. Add this PBS wash to the media already collected. 6. Concentrate cells by centrifugation at 400 × g for 10 min, resuspend in a small volume of PBS, and proceed with use in downstream applications (see Note 8).
4
Notes 1. If genotyping to select particular embryos, complete this step before the next passage. In this way undesired genotypes of cells can be discarded before passaging to conserve cell culture supplies. 2. When cells are thawed into a 10 cm dish virtually all cells should be viable and the plate should become confluent in 1–2 days. Batches of cells that exhibit poor viability upon thawing or that fail to proliferate appropriately in the initial 2 days
Synchronization of Mouse Fibroblasts
97
Chromatin Interphase
Mitosis
Rb1+/+ Rb1∆L/∆L Rb1+/+ Rb1∆L/∆L IB: α-SMC1 (Cohesin) IB: α-CAP-D3 (Condensin II) H3, H2A, H2B H4
Fig. 2 Shake-off isolation of mitotic cells and analysis of chromatin: Mitotic MEF cells of the indicated genotypes were isolated by nocodazole treatment and shake-off. Isolated cells, and remaining adherent interphase cells, were processed to isolate chromatin fractions [14]. Interphase and mitotic chromatin preparations were normalized to histone protein content. Levels of SMC1 (a component of cohesin) and CAP-D3 (a component of condensin II) were determined by western blotting. Coomassie staining of histone proteins serves as a loading control
should be discarded as they will not generate reproducible data. We generally design experiments where control and mutant genotypes are thawed simultaneously and carried through the entire experiment in parallel to ensure that they are as comparable as possible. 3. It is advisable to plate multiple dishes of cells for each desired time point. This will allow a parallel culture to be pulse labeled with BrdU 1 h prior to the desired time point. These cells are then harvested in parallel to experimental cultures and used to monitor cell cycle position by flow cytometry. This is the approach used to generate the data in Fig. 1. 4. Growth media containing 20 % FBS can be used to stimulate more cells to enter the cell cycle at the beginning of this experiment. 5. We typically find that BrdU pulse labeling followed by analysis by flow cytometry at this time point results in 60 % positive cells. In addition, it is advisable to assay for replication stress following aphidicolin washout by western blotting for a marker such as phospho-serine 345 on Chk1. 6. At 8 h post-aphidicolin washout, pulse labeling with BrdU and flow cytometry reveals that cells are typically less than 20 % BrdU positive. Approximately 5–10 % will be in mitosis. This is ideal for analysis of mitotic events by microscopic methods as asynchronous MEF cultures will contain less than 1 % mitotic figures.
98
Michael J. Thwaites et al.
7. The exact cell density is less critical in this method. Cells can be plated at a higher initial density and drug treated sooner. It is important that cells are highly proliferative. Since your yields can be relatively low, using sparse cultures is unproductive. 8. A small quantity of cells should be fixed and used for H3-S10p staining and flow cytometry analysis, or processed for generating mitotic spreads to count mitotic figures. We typically obtain a 15 % yield of mitotic cells from cultures using this experimental approach.
Acknowledgements The authors wish to thank the CIHR strategic training program in cancer research and technology transfer for fellowship support. F.D. is the Wolfe Senior Research Fellow in Tumor Suppressor Genes at Western University. Research in the Dick lab is supported by the Canadian Institutes of Health Research, the Canadian Cancer Society Research Institute, and the Cancer Research Society. References 1. Harashima H, Dissmeyer N, Schnittger A (2013) Cell cycle control across the eukaryotic kingdom. Trends Cell Biol 23(7):345–356 2. Massague J (2004) G1 cell-cycle control and cancer. Nature 432:298–306 3. Kozar K, Ciemerych MA, Rebel VI, Shigematsu H, Zagozdzon A, Sicinska E, Geng Y, Yu Q, Bhattacharya S, Bronson RT, Akashi K, Sicinski P (2004) Mouse development and cell proliferation in the absence of D-cyclins. Cell 118:477–491 4. Geng Y, Yu Q, Sicinska E, Das M, Schneider JE, Bhattacharya S, Rideout WM, Bronson RT, Gardner H, Sicinski P (2003) Cyclin E ablation in the mouse. Cell 114(4):431–443 5. Brugarolas J, Moberg K, Boyd S, Taya Y, Jacks T, Lees J (1999) Inhibition of cyclin-dependent kinase 2 by p21 is necessary for retinoblastoma protein-mediated G1 arrest after gammairradiation. Proc Natl Acad Sci U S A 96:1002–1007 6. Santamaria D, Barriere C, Cerqueira A, Hunt S, Tardy C, Newton K, Caceres JF, Dubus P, Malumbres M, Barbacid M (2007) Cdk1 is sufficient to drive the mammalian cell cycle. Nature 448(7155):811–815
7. Isaac CE, Francis SM, Martens AL, Julian LM, Seifried LA, Erdmann N, Binne UK, Harrington L, Sicinski P, Berube NG, Dyson NJ, Dick FA (2006) The retinoblastoma protein regulates pericentric heterochromatin. Mol Cell Biol 26(9):3659–3671 8. Coschi CH, Martens AL, Ritchie K, Francis SM, Chakrabarti S, Berube NG, Dick FA (2010) Mitotic chromosome condensation mediated by the retinoblastoma protein is tumor-suppressive. Genes Dev 24(13):1351–1363 9. Cecchini MJ, Thwaites M, Talluri S, Macdonald JI, Passos DT, Chong JL, Cantalupo P, Stafford P, Saenz-Robles MT, Francis SM, Pipas JM, Leone G, Welch I, Dick FA (2014) A retinoblastoma allele that is mutated at its common E2F interaction site inhibits cell proliferation in gene targeted mice. Mol Cell Biol 34:2029–2045 10. Cecchini MJ, Amiri M, Dick FA (2012) Analysis of cell cycle position in mammalian cells. J Vis Exp 59:e3491. doi:10.3791/3491 11. Taylor WR (2004) FACS-based detection of phosphorylated histone H3 for the quantitation of mitotic cells. Methods Mol Biol 281:293–299 12. Parrinello S, Samper E, Krtolica A, Goldstein J, Melov S, Campisi J (2003) Oxygen sensitivity
Synchronization of Mouse Fibroblasts severely limits the replicative lifespan of murine fibroblasts. Nat Cell Biol 5(8):741–747 13. Rieder CL, Maiato H (2004) Stuck in division or passing through: what happens when cells cannot satisfy the spindle assembly checkpoint. Dev Cell 7:637–651
99
14. Mendez J, Stillman B (2000) Chromatin association of human origin recognition complex, cdc6, and minichromosome maintenance proteins during the cell cycle: assembly of prereplication complexes in late mitosis. Mol Cell Biol 20(22):8602–8612
Chapter 6 Cell Cycle Synchronization in Xenopus Egg Extracts Peter J. Gillespie, Julia Neusiedler, Kevin Creavin, Gaganmeet Singh Chadha, and J. Julian Blow Abstract Many important discoveries in cell cycle research have been made using cell-free extracts prepared from the eggs of the South African clawed frog Xenopus laevis. These extracts efficiently support the key nuclear functions of the eukaryotic cell cycle in vitro under apparently the same controls that exist in vivo. The Xenopus cell-free system is therefore uniquely suited to the study of the mechanisms, dynamics and integration of cell cycle regulated processes at a biochemical level. Here, we describe methods currently in use in our laboratory for the preparation of Xenopus egg extracts and demembranated sperm nuclei. We detail how these extracts can be used to study the key transitions of the eukaryotic cell cycle and describe conditions under which these transitions can be manipulated by addition of drugs that either retard or advance passage. In addition, we describe in detail essential techniques that provide a practical starting point for investigating the function of proteins involved in the operation of the eukaryotic cell cycle. Key words Xenopus, Egg extract, In vitro, Cell-free system, DNA replication, Cell cycle, Synchronization
1
Introduction For more than 30 years we have used cell-free extracts prepared from the eggs of the South African clawed frog, Xenopus laevis, to study the control of cell cycle progression and DNA replication. Originally conceived to study chromatin remodeling [1], this embryonic model system is used to conduct research in fields as diverse as DNA replication, apoptosis, nucleocytoplasmic transport, kinetochore formation and spindle microtubule dynamics and sister chromatid cohesion and condensation. That these soluble egg extracts recapitulate the key nuclear transitions of the eukaryotic cell cycle in vitro under apparently the same controls that exist in vivo is dependent upon some key properties of early Xenopus embryos [2–4]. The eggs, as in other vertebrates, are arrested in metaphase II of meiosis. Progression into the first mitotic interphase occurs upon fertilization. In only 7 h after
Amanda S. Coutts and Louise Weston (eds.), Cell Cycle Oscillators: Methods and Protocols, Methods in Molecular Biology, vol. 1342, DOI 10.1007/978-1-4939-2957-3_6, © Springer Science+Business Media New York 2016
101
102
Peter J. Gillespie et al.
fertilization the eggs undergo 11 rounds of synchronous cell division. It is only after this stage—at the mid-blastula transition—that zygotic transcription occurs [5, 6]. The eggs therefore contain an abundant stockpile of material to support genome duplication and segregation up to DNA concentrations found at the onset of zygotic transcription: ~13 ng DNA per 0.5 μl egg, pre-S phase, in cell cycle 12, with approximately ~4000 cells per embryo at the transition. The continuing translation of a single protein, cyclin B, can support passage through the whole cell cycle [7]. DNA added to extract prepared from unfertilized, metaphase arrested, eggs is first assembled into chromatin and then condensed into rod-like fibers [3]. Upon activation and release of the extract into interphase the DNA is first decondensed and then assembled into structures corresponding to interphase nuclei [3, 4]. Upon nuclear assembly the added DNA is efficiently replicated, producing interphase nuclei with a 4C DNA content [8, 9]. Advancement of the extracts into mitosis supports first the condensation and resolution of paired sister chromatids and ultimately their separation on the spindle, all in vitro [10]. That these extracts support this wide range of activities in vitro makes this model system uniquely suited to the study of the mechanisms, dynamics and integration of cell cycle regulated processes at a biochemical level. The regulation of cell cycle progression and DNA replication in egg extract occurs under the same controls as occur in vivo. Cytostatic factor (CSF) maintains the block to cell cycle progression in extracts prepared from unfertilized eggs [11]. Activation of these extracts by the addition of calcium, mimicking the Ca2+ wave at fertilization, promotes cyclin B destruction facilitating meiotic exit and entry into the first mitotic cycle [12]. The complete duplication of DNA present in the now interphase extract requires the activation of many thousands of origins of replication. To ensure genetic stability these origins must fire once and only once in each cell cycle. To this end two distinct signals are required to permit origin activation: origin “licensing” and “activation.” The activation of the Anaphase Promoting Complex (APC/C) upon exit from anaphase of meiosis II permits activation of the “replication licensing system” [13, 14]. This allows Mcm2–7 double hexamers to be loaded onto DNA, “licensing” these sites to act as replication origins in the upcoming S phase [15–17]. During S phase replication forks are initiated, only at licensed origins, by the combined action of two protein kinases: S phase cyclin-dependent kinases (CDKs) and Dbf4-dependent kinases (DDKs) [18–22]. It is likely that nuclear assembly and protein import permits the concentration of these two kinases within the nucleus to a critical concentration that promotes the initiation of replication forks. Nuclear protein import also prevents re-replication of DNA by reactivating the licensing inhibitor geminin [14, 23]. The combination of CDK and DDK activity promotes the recruitment of replisome proteins to origins, which activates the helicase
Cell Cycle Synchronization in Xenopus Egg Extracts
103
activity of Mcm2–7 to unwind template DNA at the replication fork [24]. Activated origins revert to an unlicensed state upon initiation as Mcm2–7 moves away with the replication forks. Terminated Mcm2–7 hexamers are removed from the DNA under the control of ubiquitination [25, 26]. The sequential activation of the license and initiation signals ensures the faithful duplication of the genome [15, 27]. Upon completion of genome duplication the translation of cyclin B promotes passage into the first mitotic metaphase in vitro [7, 28]. At the chromatin level, high mitotic CDK activity drives sister chromatid resolution and condensation [7, 29, 30]. These condensed chromosomes form into a cognate metaphase plate with bi-orientated amphitelic sister chromatids. The sisters can then be induced to separate as the extract undergoes the metaphase-toanaphase transition and reenters into interphase. Importantly, by using well-characterized inhibitors of individual proteins that function in these phase transitions we are able to perturb cell cycle progression in vitro. In this article we describe the methods currently in use in our laboratory for the study of cell cycle progression and DNA replication using the Xenopus cell-free system. In addition to a description of the methods used for extract preparation, we detail their application for studying protein function in this system. These recently developed and revised techniques provide a practical starting point for investigation of cell cycle progression and DNA replication using this system.
2
Materials Buffer storage temperatures are indicated in parenthesis and are abbreviated as follows: temperature, as indicated, °C; RT—room temperature; RS— refrigerated stock; FS—frozen stock. All solutions are made up with Milli-Q H2O.
2.1 Preparation of Demembranated Xenopus laevis Sperm Nuclei
1. EB (4 °C, freshly made): 50 mM KCl, 5 mM MgCl2, 2 mM dithiothreitol (DTT) or β-mercaptoethanol, 50 mM HEPES– KOH, pH 7.6. 2. SuNaSp (4 °C, freshly made): 0.25 M sucrose, 75 mM NaCl, 0.5 mM spermidine, 0.15 mM spermine, 15 mM HEPES– KOH, pH 7.6. 3. Lysolecithin (−20 °C FS to 4 °C): 5 mg/ml, in H2O. 4. Hoechst 33258 (−20 °C FS to 4 °C): 10 mg/ml in H2O; prepare 20 μg/ml dilution on the day. 5. MS222 (RT, freshly made, immediately before use): 0.2 % w:v Tricaine mesylate MS222, ~0.5 % w:v NaHCO3, to pH 7.5.
104
Peter J. Gillespie et al.
2.2 Preparation of Metaphase Arrested Xenopus laevis Egg Extract
1. 10× MMR (RT): 1 M NaCl, 20 mM KCl, 10 mM MgCl2, 20 mM CaCl2, 1 mM EDTA, 50 mM HEPES–NaOH, pH 7.8. 2. 20× XB Salts (4 °C RS): 2 M KCl, 40 mM MgCl2, 2 mM CaCl2. 3. XBE2 (4 °C to RT): 1× XB salts, 1.71 % w:v sucrose, 5 mM K-EGTA, 10 mM HEPES–KOH, pH 7.7. 4. LFB 1/50 (−20 °C FS or freshly made, 4 °C): 10 % w:v sucrose, 50 mM KCl, 2 mM MgCl2, 1 mM EGTA, 2 mM DTT, 20 mM K2HPO4/KH2PO4 pH 8.0, 40 mM HEPES–KOH, pH 8.0. 5. Energy Regenerator (−20 °C FS to 4 °C): 1 M phosphocreatine disodium salt, 600 μg/ml creatine phosphokinase in 10 mM HEPES–KOH pH 7.6. 6. Cytochalasin D (−20 °C FS to RT): 10 mg/ml, in DMSO. 7. Protease inhibitors (−20 °C FS to RT): aprotinin, 10 mg/ml in H2O; leupeptin, 10 mg/ml in H2O; pepstatin, 10 mg/ml in dimethylformamide. 8. Dejellying solution (RT, freshly made, immediately before use): 2 % cysteine w:v in H2O, to pH 7.8 with NaOH.
2.3 Preparation of Interphase Xenopus laevis Egg Extract
1. 10× MMR (RT): 1 M NaCl, 20 mM KCl, 10 mM MgCl2, 20 mM CaCl2, 1 mM EDTA, 50 mM HEPES–NaOH, pH 7.8. 2. Barth solution (RT): 88 mM NaCl, 2 mM KCl, 1 mM MgCl2, 15 mM Tris–HCl pH 7.4, 0.5 mM CaCl2. 3. Calcium ionophore A23187 (−20 °C FS to RT): 10 mg/ml in dimethyl sulfoxide (DMSO). 4. Extraction buffer (EB) (4 °C, freshly made): 50 mM KCl, 50 mM HEPES–KOH (pH 7.6), 5 mM MgCl2, 2 mM DTT or β-mercaptoethanol. 5. Extract dilution buffer with sucrose (EDB-S) (−20 °C FS to 4 °C): 50 mM KCl, 50 mM HEPES–KOH (pH 7.6), 10 % (w/v) sucrose, 2 mM DTT, 0.4 mM MgCl2, 0.4 mM EGTA, and pepstatin, leupeptin, and aprotinin (1 μg/ml each).
2.4 Use of Xenopus Egg Extract: General Use and Determination of Extract Integrity and Cell Cycle Status
1. Xenopus egg extract (−80 °C/liquid nitrogen to RT immediately before RT water bath thaw) and demembranated Xenopus sperm nuclei ~400 ng DNA/μl (−80 °C/−20 °C FS to 4 °C). 2. Energy Regenerator (−20 °C FS to 4 °C): 1 M phosphocreatine disodium salt, 600 μg/ml creatine phosphokinase in 10 mM HEPES–KOH pH 7.6. 3. Cycloheximide (−20 °C FS to 4 °C): 10 mg/ml, in H2O. 4. CaCl2 (−20 °C FS to 4 °C): 50 mM, in H2O. 5. Hoechst 33258 (−20 °C FS to 4 °C): 10 mg/ml in H2O; prepare 20 μg/ml dilution on the day.
Cell Cycle Synchronization in Xenopus Egg Extracts
2.5 Use of Metaphase Arrested Egg Extract: In Vitro Release into First Mitotic Interphase and Manipulation by Drug Addition
105
As Subheading 2.4, and the following: 1. Roscovitine (−20 °C FS to RT): 400 mM, in DMSO. 2. 6-DMAP (−20 °C FS to 4 °C): 50 mM, in H2O. 3. Microcystin LR (−20 °C FS to RT): 100 μM, in DMSO. 4. D-box peptide (−20 °C FS to 4 °C): 26 mM, in LFB1/50. 5. MG132 (−20 °C FS to RT): 40 mM, in DMSO. 6. Bortezomib (−20 °C FS to RT): 200 mM, in DMSO.
2.6 Use of Interphase Egg Extract: Manipulation by Drug Addition
As Subheading 2.4, and the following: 1. Wheat germ agglutinin (−20 °C FS to 4 °C): 20 mg/ml, in H2O. 2. GemininDEL (−80 °C/liquid nitrogen FS to 4 °C): used at ~100 nM (~2.6 ng/μl), in LFB 1/50. 3. p27Kipl (−80 °C/liquid nitrogen FS to 4 °C): used at ~100 nM (~5.2 μg/ml), in LFB 1/50. 4. p21Cip1 (−80 °C/liquid nitrogen FS to 4 °C): used at ~0.5 μM (~21.1 μg/ml), in LFB 1/50. 5. Roscovitine (−20 °C FS to RT): 400 mM, in DMSO. 6. PHA-767491 (−20 °C FS to RT): 100 mM, in DMSO and diluted in 40 mM HEPES–KOH pH 7.0 immediately prior to use, mixing well to avoid precipitates. 7. Aphidicolin (−20 °C FS to RT): 18 mM. in DMSO.
2.7 Interphase-toMitosis Extract Conversion
As Subheading 2.4, and the following: Non-destructible mutant mitotic cyclins, e.g., cyclin A1 N∆56 [31, 32] or cyclin BΔ90 [33] (−80 °C/liquid nitrogen FS to 4 °C), or metaphase-arrested egg extract (−80 °C/liquid nitrogen to RT immediately before RT water bath thaw).
2.8 Quantifying DNA Replication
As Subheading 2.4, and the following: 1. Stop-C (RT): 0.5 % w:v SDS, 5 mM EGTA, 20 mM Tris HCl, pH 7.5. 2. Proteinase K (−20 °C): 20 mg/ml proteinase K, 50 % v:v glycerol, 10 mM Tris HCl, pH 7.5. 3. 5 % TCA (4 °C RS): 5 % w:v TCA, 0.5 % w:v Na4P2O7 · 10H2O. 4. 10 % TCA (4 °C RS): 5 % w:v TCA, 2 % w:v Na4P2O7 · 10H2O. 5. α32P-dATP (high activity: typically 10 mCi/ml) (4 °C RS). 6. 25 mm Paper filter disks. 7. 25 mm Glass microfiber filter disks. 8. Vacuum manifold (Millipore). 9. Gel preparation buffer (RT): 50 mM NaCl, 1 mM EDTA.
106
Peter J. Gillespie et al.
10. Gel running buffer (RT): 50 mM NaOH, 1 mM EDTA. 11. StopN (RT): 20 mM Tris HCl pH 8.0, 200 mM NaCl, 5 mM EDTA, 0.5 % SDS. 12. 7 % (w:v) TCA (4 °C RS). 13. Phenol–chloroform–isoamyl alcohol (25:24:1) (e.g., Sigma P-3803) (4 °C RS). 14. 10 mM EDTA (RT). 15. 100 % ethanol (−20 °C). 16. 70 % ethanol (RT). 17. 2× alkaline loading buffer (RT): 100 mM NaOH, 2 mM EDTA, 2.5 % Ficoll, 0.025 % bromocresol green, H2O. 18. Eppendorf Phase Lock gel tube. 19. 6× 3MM paper, 20 cm × 20 cm. 20. 12× paper towel. 21. 2× glass plates, 20 cm × 20 cm. 22. 8× large bulldog clips. 23. Large polythene box 25 cm × 25 cm. 24. End-radiolabeled molecular weight markers—1 kb lambda DNA HindIII digested, see below. 25. 10× End-labeling buffer: 5 mM dCTP, 5 mM dGTP, 5 mM dTTP, 500 mM Tris HCl, pH 8.0, 100 mM MgCl2. 26. Reaction mix (10 μl): 1 μl 10× end-labeling buffer, 1 μl DNA (500 μg/ml) 1 kb lambda-HindIII, 0.5 μl Klenow exo− (10 units/μl), 0.3 μl 32P-dATP (10 mCi/ml), 7.2 μl H2O. 2.9 Immunodepletion and Immunoprecipitation
As Subheading 2.4, and the following: 1. A source of antibody, either crude serum or a purified fraction. 2. Either, agarose beads (rProtein A- or rProtein G-FF; GE Healthcare) or magnetic beads (Dynabeads Protein A or G; Dynal-Life Technologies) (4 °C RS). 3. LFB 1/50 (−20 °C FS or freshly made, 4 °C): 10 % w:v sucrose, 50 mM KCl, 2 mM MgCl2, 1 mM EGTA, 2 mM DTT, 20 mM K2HPO4/KH2PO4 pH 8.0, 40 mM HEPES–KOH, pH 8.0. 4. 100 mM HEPES–KOH, pH 8.0 (−20 °C FS or freshly made, 4 °C). 5. Xenopus egg extract (−80 °C/liquid nitrogen to RT immediately before RT water bath thaw) and demembranated Xenopus sperm nuclei ~400 ng DNA/μl (−80 °C/−20 °C FS to 4 °C). 6. Energy Regenerator (−20 °C FS to 4 °C): 1 M phosphocreatine disodium salt, 600 μg/ml creatine phosphokinase in 10 mM HEPES–KOH pH 7.6.
Cell Cycle Synchronization in Xenopus Egg Extracts
107
7. Cycloheximide (−20 °C FS to 4 °C): 10 mg/ml, H2O. 8. CaCl2 (−20 °C FS to 4 °C): 50 mM in H2O. 9. Magnetic tube stand. 10. PMSF (−20 °C FS to RT): 100 mM, in 100 % ethanol. 11. Gel loading fine pipette tips. 12. 50 ml Falcon tube. 13. 25 μm Nybolt filter. 14. Sepharose wash buffer (4 °C, freshly made): 40 mM HEPES, 20 mM K2HPO4/KH2PO4, pH 8.0, 2 mM MgCl2, 1 mM DTT, 2 mM EGTA, 10 % (w:v) sucrose, 10 μg/ml each of leupeptin, pepstatin, and aprotinin, 100 mM KCl. 15. Dynabead wash buffer (4 °C, freshly made): 20 mM Na2HPO4/ NaH2PO4 pH 8.0, 150 mM NaCl, 0.1 % Tween 20. 2.10 Immunofluorescent Staining of Chromosomes and Nuclei Assembled In Vitro
1. 24-well plates. 2. 13 mm coverslips—optionally coated with poly-lysine. 3. XBE2 plus 30 % sucrose (4 °C, freshly made): 1× XB salts, 5 mM K-EGTA, 10 mM HEPES–KOH pH 7.7, 30 % (w:v) sucrose. 4. 20× XB Salts (4 °C RS): 2 M KCl, 40 mM MgCl2, 2 mM CaCl2. 5. Formaldehyde stock (typically 37 %, freshly prepared immediately before use or high-grade commercial stock, typically 16 %, at 4 °C). 6. PBS plus 0.1 M glycine pH 7.0 (RT)—alternatively 750 mM Tris–HCl pH 7.0. 7. PBS plus 0.1 % (v:v) Tween and 3 % (w:v) BSA (RT). 8. VECTASHIELD (Vector Laboratories) (4 °C RS). 9. PBS plus 0.1 % (v:v) Tween (RT). 10. PBS plus 0.1 % (v:v) Triton (RT). 11. Secondary Antibodies (Alexa Fluor recommended). 12. DAPI: 1 mg/ml, in PBS (−20 °C FS); use at 1/1000, freshly made, immediately before use.
3
Methods
3.1 Preparation of Demembranated Xenopus laevis Sperm Nuclei
Although able to support the replication of a range of DNA templates - single and double stranded plasmids and extracted mammalian nuclei - the physiological substrate for replication in Xenopus laevis egg extracts are Xenopus laevis sperm nuclei. The sperm nuclei, recovered from the testes postmortem, remain stable for extended periods after demembranation.
108
Peter J. Gillespie et al.
Frogs are euthanized by means of a lethal dose of anesthetic and the testes are recovered postmortem. The preparation procedure is composed of two parts: after removing unwanted tissue from around the isolated testes the sperm are released; the released nuclei are then demembranated and prepared for storage. Sperm yield may be increased by hormone injection (see Note 1). 1. Place the frogs in MS222 solution in individual opaque chambers. When their heads drop below water and they stop moving when touched (after approximately 5–10 min), check for life by placing a forefinger deep into the frog’s mouth—if the frog performs a reflex sucking response then it is alive. Keep the frog in MS222, checking every minute or so until the reflex is lost. 2. Remove the frog from the MS222 and place it on its back on a protected work surface. Ensure death by quickly opening up the abdomen using sharp scissors or a scalpel and cutting the main arteries around the heart. Remove the testes as soon as possible, cutting carefully so as not to cut or damage them, and place them in EB solution on ice (see Note 2). 3. Wash the testes in ~20 ml of EB in a 9 cm petri dish and clean them, being careful to avoid bursting them, using two pairs of dissection forceps, to remove any blood vessels and extraneous tissue. 4. Transfer the cleaned testes to a fresh petri dish containing 10 ml EB. Chop the testes with a razor blade as finely as possible; pool all chopped material and store on ice. 5. Filter the homogenate through a 25 μm mesh nylon filter (e.g., Nitex or Nybolt), e.g., mounted over the end of a 50 ml tube (see Note 3). The filtered material will look quite cloudy. 6. Spin the filtered material in a 15 ml tube at 2000 × g in a swinging bucket rotor for 5 min at 4 °C; repeat the spin if the supernatant appears cloudy. If the sperm preparation contains a significant contamination of erythrocytes these will appear as a red fraction at the bottom of the pellet. Separate these cells by careful resuspension and transfer of the sperm to a second tube—the recovered sperm should be respun and the still pelleted bloods cells in the original tube discarded. 7. Resuspend the pellet in a total volume of 0.5 ml SuNaSp per testis at room temperature. Supplement with 25 μl lysolecithin per testis and incubate for 5–10 min at room temperature. Check for demembranation of the sperm after incubation by mixing 1 μl of sample with 1 μl of Hoechst 33258 (20 μg/ml) and view by UV microscopy. Demembranated sperm appear as small fat “squiggles” which stain bright blue with Hoechst; non-demembranated sperm will not stain with Hoechst. If