Beer: Health and Nutrition 9780632064465, 0632064463
Книга Beer: Health and Nutrition Beer: Health and NutritionКниги Кулинария Автор: Charles W. Bamforth Год издания: 2004
341 82 2MB
English Pages 184 [199] Year 2004
Contents......Page 8
Preface......Page 10
Acknowledgements......Page 14
1 Beer as Part of the Diet......Page 16
2 Beer Through History......Page 45
3 The Basics of Malting and Brewing: Product Safety and Wholesomeness......Page 64
4 The Basics of Human Nutrition......Page 101
5 The Composition of Beer in Relation to Nutrition and Health......Page 111
6 The Impact of Alcohol on Health......Page 135
7 Conclusion......Page 170
References......Page 174
Index......Page 194
Recommend Papers


![ΔΙΑΤΡΟΦΗ ΣΤΗΝ ΚΟΙΝΟΤΗΤΑ - COMMUNITY HEALTH AND NUTRITION PROGRAMS [1]](https://ebin.pub/img/200x200/community-health-and-nutrition-programs-1.jpg)


File loading please wait...
Citation preview
Beer Health and Nutrition
C. W. Bamforth
Beer Health and Nutrition
From man’s sweat and God’s love, beer came into the world St Arnoldus
Beer Health and Nutrition
Charles W. Bamforth Professor, Department of Food Science and Technology University of California, Davis
Blackwell Science
© 2004 Blackwell Science Ltd a Blackwell Publishing company Editorial of ces: Blackwell Science Ltd, 9600 Garsington Road, Oxford OX4 2DQ, UK Tel: +44 (0)1865 776868 Blackwell Publishing Professional, 2121 State Avenue, Ames, Iowa 50014-8300, USA Tel: +1 515 292 0140 Blackwell Publishing Asia Pty Ltd, 550 Swanston Street, Carlton, Victoria 3053, Australia Tel: +61 (0)3 8359 1011 The right of the Author to be identi ed as the Author of this Work has been asserted in accordance with the Copyright, Designs and Patents Act 1988. All rights reserved. No part of this publication may be reproduced, stored in a retrieval system, or transmitted, in any form or by any means, electronic, mechanical, photocopying, recording or otherwise, except as permitted by the UK Copyright, Designs and Patents Act 1988, without the prior permission of the publisher. First published 2004 Library of Congress Cataloging-in-Publication Data is available ISBN 0-632-06446-3 A catalogue record for this title is available from the British Library Set in 10/14 pt Times New Roman by Sparks Computer Solutions Ltd, Oxford http://www.sparks.co.uk Printed and bound in India by Gopsons Papers Ltd, New Delhi The publisher’s policy is to use permanent paper from mills that operate a sustainable forestry policy, and which has been manufactured from pulp processed using acid-free and elementary chlorine-free practices. Furthermore, the publisher ensures that the text paper and cover board used have met acceptable environmental accreditation standards. For further information on Blackwell Publishing, visit our website: www.blackwellpublishing.com
Dedicated to my forebears
Contents
Preface Acknowledgements 1
2
3
4
Beer as Part of the Diet
ix xiii 1
Beer: a vice or a staple part of the diet? Getting beer into perspective What is moderation? But what about addiction? Impacts on behaviour
2 13 18 20 25
Beer Through History
30
Brewing travels west Restraining excess Religious origins Maintaining standards Beer: a nutritious dish for the whole family Temperance pressures Towards prohibition
32 33 34 35 37 42 45
The Basics of Malting and Brewing: Product Safety and Wholesomeness 49 Chemical beer? Basic outlines of malting and brewing Styles of beer The chemistry of beer
49 63 69 71
The Basics of Human Nutrition
86
Energy Phytonutrients Carbohydrate, fat and protein
86 91 91
viii
5
6
7
Contents
Vitamins Minerals Fibre Water Balance
92 93 94 95 95
The Composition of Beer in Relation to Nutrition and Health
96
Energy Carbohydrate, fat and protein Water Vitamins Minerals Fibre Comparison of beer with other foodstuffs for nutrient value Potentially deleterious components of beer Beer as a ‘treat’
97 105 106 106 109 112 112 116 117
The Impact of Alcohol on Health
120
The metabolism of ethanol Direct and indirect impacts The heart and the circulatory system The liver and the digestive system The reproductive system Brain and cognitive function Kidney and urinary tract Age Cancer Allergy The common cold
122 123 124 135 139 142 146 147 149 153 154
Conclusion
155
References
159
Index
179
Preface
John Hudson peered at me over his half-moons. A rm frown was on his forehead. His hands were folded rmly on his desk. ‘Say that one more time, lad’, he grunted in his familiar and frequently feared North Yorkshire accent. I gulped and let it go one more time. ‘I don’t think the work I am doing here is worthwhile. I mean, I could be researching cancer – something bene cial for mankind. But I’m working on beer – what puts bubbles on a pint, why lager tastes of sweetcorn, how to choose the best barley. It’s not exactly crucial, is it?’ I’d been worrying about my raison d’être for some while. Surely my expertise as an enzymologist could be put to better use? Hudson, Deputy Director of the Brewing Research Foundation at Nut eld in leafy Surrey, was unexpectedly calm on that dull winter morning in 1980. ‘Do people drink beer, Charlie?’ ‘Well, yes.’ ‘Who drinks beer?’ ‘Lots of people.’ ‘Such as the working class man and woman, for instance? ‘Yeah.’ ‘Does it make them happy?’ ‘Well, sure, as long as they don’t get drunk, and they can afford it, and nobody suffers as a result of them doing it.’ ‘True, but accepting all that, do they like their pint?’ ‘Well, yes.’ ‘So you don’t think that helping brewers make grand beer, that people will enjoy, is worthwhile?’ I just looked at him. At that very moment I matured considerably. I realised that my humble place in society’s tapestry was not insigni cant, that I did have a worthwhile role to play, and that there was no shame associated with the work that I was doing on a topic that, admittedly, I found to be fascinating.
x
Preface
Dr Hudson wasn’t nished. ‘Don’t forget, lad, that beer has long since been important to the diet of some people. It gives them energy, vitamins, minerals. It soothes them. Don’t knock it.’ Hudson was a wise man. Irascible for sure, but a man who loved beer in every respect and would have nobody badmouth it. I, his young protégé, was certainly receptive to the fact that beer could actually be a worthy part of the diet. And, for a number of years prior to the conversation in question, it had formed a prominent part of my social activity, as it did for a great many young folk in late sixties and early seventies England. I had my own clear appreciation of the merits and de-merits of alcohol consumption. As a young biochemistry student at the University of Hull, who worked ludicrously hard during the week, I looked forward eagerly to the weekend when my buddies and I would make for old town Hull and its plethora of outstanding pubs. Sometimes I made a complete fool of myself. My conscience will not allow me to deny the fact that, from time to time, I imbibed to excess. It didn’t take me long to learn the lesson, however, that this was disadvantageous, not least from the unpleasantness of the day after. Before long, though, I had come to understand the pleasure that is to be had from taking one’s beer steadily and in moderation – a pint or two daily. It tasted good. It complemented the food I was taking, whether a sandwich, a curry or just a bag of crisps. It made me mellow and calmed. And, as I usually took the beer in a pub rather than at home, it was a valuable part of a holistic social experience. For the majority of my beer-drinking life (33 years of cially – and still counting loud and strong), I have never contemplated beer in an overtly dietary manner. It has been taken for pleasure and not as part of a carefully considered diet. Few people would treat it as a foodstuff per se. And yet, as you will nd from reading this book, beer is very much a food. It is unreasonable for critics to refer to beer as ‘empty calories’ and, as we shall see in Chapter 5, it is entirely possible to tally the contribution of calories, bre, vitamins, minerals, and so on from beer alongside those of the other items on the dinner table. Proteins and carbohydrates, but (despite the myth) absolutely not fats, are very much a part of beer as they are of bread, meat, vegetables and cereal. Indeed, what is beer if it is not lique ed barley with added value? As consumers become more and more health conscious and aware of the need for a well-balanced diet, it is not suf cient simply to bracket a product such as beer as ‘something for pleasure’, as if it was just water and contributing no nutritive quotient. It does kick plenty, in various ways, and people need to be aware of the extent of this and how it impacts the rest of their intake. It would never be my intention to advocate beer as an inherent substitute for any other component of the diet. It seems entirely logical, though, to include beer amongst the diverse other items on the menu in the ready reckoning exercise and even to fashion a sustaining and, of course, pleasurable meal
Preface
xi
that incorporates a glass of beer. One less slice of bread perhaps? Skipping the stodgy or ludicrously sweet dessert? The supermarket shelves are loaded with diverse choices and all manner of foodstuffs – forti ed with this or that, low calorie variants, ‘organic’, etc., etc. Beer is no different – except that there is no overt forti cation going on, rather the inherent components such as vitamins and minerals that can be in quite useful quantities. What, I wonder though, would people say if I said that beer might as justi ably be located in the medicine cupboard as in the larder? The evidence is mounting that moderate consumption of beer (of the order of one to two pints per day) lowers the risk of mortality and morbidity and has a range of bene cial impacts on the body. When my wife was in the maternity ward with our rst born, the drinks trolley included stout alongside the other beverages on offer. It was accepted wisdom that beer is rich in valuable nutrients, as well as offering a soothing impact after an intense emotional and physical experience. It would be stupid to argue against the fact that drinking alcoholic beverages to excess is dangerous (health-wise and accident-wise) and prone to lead to suffering, both for the imbiber and for those close to them. It is no surprise whatsoever, therefore, that organisations have sprung up with the aim of attacking the alcoholic beverages industry. It is equally unsurprising that those within the industry (and, as a professor whose specialisation is beer, I guess this includes me) should seek to counter such sieges. However, it is important that this is done in a responsible and conscientious manner, and with a rationality that seems to be too frequently lacking from those who decry alcohol. The producers of alcoholic beverages must position their products for what they are: valuable and positive components of the human diet that should be enjoyed responsibly by adults. They should not be (but, too often, regrettably are) marketed with images of wild and irrational behaviour. And, when arguments for their positive contribution are made this should be done in as balanced and critical way as possible. Would that those who oppose alcoholic beverages take the same approach in considering all the evidence. Perhaps then more of them might come to accept that, taken wisely and temperately, beer and other alcoholic beverages are a worthy component of society. The vast majority of people who take a beer are not drunken drivers, wife beaters, football hooligans, panhandlers or, above all, alcoholics. And neither will they go on to become these things. Certainly, excessive alcohol intake can reduce inhibitions that could increase the likelihood that a football yob will wreak havoc. However, it’s not the alcohol, any more or less than the game of soccer itself, that has made the thug what he is. Drinking of alcohol, including as beer, is so often an integral feature of social occasions for adults. As Gus eld (1987) says, a drink is a signal for an important change of pace or venue.
xii
Preface
So, what is someone who has been employed either in the brewing industry or as a professor teaching its science and technology for a quarter of a century doing writing this book? Is it, as some will undoubtedly say, an exercise in self serving, an unashamed piece of biased lobbying to tout one’s favourite beverage? I have very little doubt that the anti-alcohol lobby will come to that conclusion. With just as much vehemence, I would refute the inference. I must stress, too, that I have neither been commissioned to write this book nor am I directly paid by any brewing company. This volume seeks to discuss beer in a warts-and-all context. I have certainly not fought shy of discussing any of the adverse impacts that excessive consumption of alcoholic beverages can have. I was driven to write the book by several forces: (1) To consider dispassionately the role of beer in the human diet now and through history, as an exercise in scholarship. (2) To consider the impact that beer (as part of the spectrum of alcoholic beverages) has on health, in an era when the average person has probably never been more conscious of, and concerned about, the state of their well-being. (3) To redress the balance about the relative worth of beer and wine as bene cial parts of the diet. It seems to me that those writing on the topic from within (or closely associated with) the alcoholic drinks industry tend to cover both the positive and negative aspects of alcohol. By contrast, those writing from the opposing stance seldom do other than consider the consumption of alcoholic beverages as entirely negative. I believe that there is a key need for education, to present facts as we know them (and as they emerge consequent to state-of-the-art research) and not to shy away from any facet of the debate. In a class I teach to students of all ages on the Davis campus of the University of California we endeavour to do just this. I bring in guest speakers from breweries but also expose the students to medical experts able to articulate the perils of taking alcohol to excess. Some of the images can be quite gruesome. We want the students to understand, to nd themselves in this con icting arena. For after all, is not a maxim from the Temple of Apollo at Delphi (Braun 1996), ‘Know thyself and nothing to excess’?
Acknowledgements
Thanks to Lou Grivetti for hepful discussions. I am grateful to David Long for providing valuable statistical data and Jaime Jurado for making available analytical data on beers. As ever, I appreciate my wife Diane for her patience and support.
1
Beer as Part of the Diet
Beer has been drunk for more than 6000 years, from the time that it was rst made by happenstance in the middle age of ancient times (Bamforth 2003). Ever since, it has become a staple part of the diet in many cultures. Furthermore, it has not only comprised a valuable addition to the table, but has served various medicinal roles, including mouthwash, enema, vaginal douche and applicant to wounds (Darby et al. 1977). Beer (and other forms of alcohol) differs in its signi cance, acceptability and importance from culture to culture. At one extreme the prophet Mohammed forbade his followers to drink alcohol, thereby establishing a point of difference from Christianity. The Koran speaks of alcohol as being an ‘abomination and the work of Satan’ (5: 90). Conversely, the Kofyar of northern Nigeria believe that ‘man’s way to god is with beer in hand’ (Netting 1964). In the Aztec nation, religious worshippers were obliged to get drunk for fear of displeasing the gods (Thompson 1940). In India, the various deities demand different approaches to the use of alcohol. Indeed, in some areas of India, alcohol is replaced by infusions of hashish (Carstairs 1957). What better illustration might one use to stress the need for tolerance of others’ customs and beliefs and of what is or is not acceptable? Mandelbaum, in discussing the Tiriki of Kenya, observes: Beer is a constant medium of social interchange for men; beer drinking is a preoccupying activity that few men reject. Drinking beer together induces physical and social mellowness in men. Very little aggressive behaviour is ever shown as a result of drinking, and that little is promptly squelched. Pathological addiction rarely, if ever, occurs. Mandelbaum (1979) This thought-provoking view surely reminds us that we should view the consumption of beer (and other alcoholic beverages) from a holistic standpoint. The historical importance within society of beer (and other alcoholic beverages, such as wine in climates where grapes could be grown) is illustrated by the argument that nomadic tribes gravitated to crop farming and organised communities in order to ensure a constant supply of beverages (Kendell 1987).
2
Chapter One
In many cultures, especially those of Northern Europe, beer was through generations the staple drink for the whole family, young and old. At least in part this was on account of beer being safer to drink than water in days when there were no water puri cation systems. The ale, after all, had been through a boiling stage, whereas the local supply of water had not. The ale tasted better too. Cesar de Saussure, a Swiss writing in 1720 (see de Saussure 1902), found in London that: Though water is to be had in abundance in London, and of fairly good quality, absolutely none is drunk. In this country beer is what everybody drinks when thirsty. The early settlers in Virginia fell sick for want of ale, on account of the local infected water that they were obliged to drink. One of the rst settlers, Richard Ffrethorne, bemoaned the lack of any creature comforts, bitter that back in England folk were healthy on their strong ale whereas here there was only water to drink (Kingsbury 1906–1935). It was only with the development of cleaner water and the advent of tea and coffee drinking in the seventeenth century that beer in countries such as Great Britain progressively shifted away from being the staple beverage at mealtimes for all members of the family unit, and became more of a luxury item. Yet there remain cultures, notably the Czech Republic and Germany, where the consumption of beer to accompany a meal remains a key feature of the diet, which is re ected in the per capita consumption gures (Table 1.1).
Beer: a vice or a staple part of the diet? Were we able to transport ourselves back to the Middle Ages and enquire in England, Flanders, Bavaria or Bohemia about the key features of the popular diet, ale or beer would unquestioningly and unhesitatingly be listed alongside meat, bread, milk and vegetables. The questioner would be regarded as being mightily peculiar if he or she were to question ale’s legitimate place on the table. It was neither a comfort food nor an extravagance. It was an integral part of the food intake in all walks of society. In eighth-century England a monk might consume eight pints of ale a day. Beer in Britain has long been considered to be a key part of the diet, as much so as wine in France. Henry Brougham MP (Brougham 1830) said that ‘To the poor the beer is next to a necessity of life.’ Over 50 years ago the nutritive value of beer was emphasised. An admittedly weakish beer [3% alcohol by volume (ABV) in the austere early post-war years] was claimed to provide 200 calories and a fth of a working man’s requirement for calcium, phosphorus,
Beer as Part of the Diet
Table 1.1 Worldwide consumption of beer, 2000. Country
Consumption (litres per head)
Argentina Australia Austria Belgium* Brazil Bulgaria Canada Chile China Colombia Croatia Cuba Czech Republic Denmark Finland France Germany Greece Hungary Ireland Italy Japan Korea (Republic of) Mexico New Zealand Netherlands Nigeria Norway Peru Philippines Poland Portugal Romania Russia Slovak Republic Slovenia South Africa Spain Sweden Switzerland Ukraine UK USA Venezuela
32.7 90.0 107.0 98.3 48.2 51.0 67.4 27.5 17.3 32.7 86.2 20.3 158.9 98.6 80.2 35.9 123.1 39.0 73.0 125.0 28.9 55.9 35.5 48.3 79.5 80.5 5.6 52.0 22.8 15.9 62.8 61.3 55.4 37.9 87.1 92.0 53.8 72.0 56.4 58.3 21.1 95.4 82.4 76.0
*Includes Luxembourg, because of inaccuracies introduced by cross-border trading. Source: Tighe (2002).
3
4
Chapter One
nicotinic acid and ribo avin (Bunker 1947). The satisfaction of having at least part of one’s dietary intake in a pleasurable form was not sneered at then. Perhaps the rst person to conduct a serious study of the impact of abstinence, moderation and excessive drinking on health was statistician Raymond Pearl. On the basis of interviews with over 2000 workers in Baltimore, he concluded almost 80 years ago that on average moderate drinkers lived longer than abstainers and much longer than those who were heavy drinkers (Pearl 1926). Yet now, at the dawn of the twenty- rst century, beer-drinking is regarded in many societies as a vice. It is surely astonishing that in the United States it is possible to buy cigarettes at the age of 18, but it is not legal to purchase alcohol until the age of 21. It would be a struggle to identify any merit associated with smoking, with the possible exception of its role as an anxiety relaxant. By contrast there is accumulating evidence that alcohol, including beer, in moderation can have a bene cial impact on health and wellbeing. In passing, let us consider the legal age at which, in the US, it is possible to partake of other activities that surely might be considered a genuine risk to health and wellbeing, not only for the partaker but also for those around them. A child may legally drive a car, with relatively few restrictions, at the age of 16. More alarmingly, 35 states in the US have no licensing or registration requirements for guns (www.soros.org/crime/ higlights.htm). Seven states lack a legal minimum age for buying a ri e or shotgun from an unlicensed dealer, while six states have no legal minimum age for a child to possess a handgun. In ve states there is a minimum age – 16 in New York, Georgia, Vermont and Alaska, and just 14 in Montana. But the minimum legal age for drinking alcohol in all 50 states is 21! Opinions about the relative merits and de-merits of smoking, driving, guns and alcohol will of course differ between individuals. Certainly if we consider the respective virtues of smoking, weapon use and alcohol (in restraint), then it seems to this author that there may be a warped set of priorities in one country at least. Nonetheless beer is the second most popular drink in the United States, with annual average per capita consumption at 357 8-ounce servings, after sodas and other soft drinks (861) (Beverage Digest 1998). Worldwide production of beer in 1999 ran at 0.13 billion litres. It seems that we have lost sight of the real bene ts of a foodstuff such as beer (and it is a foodstuff, as we will explore in Chapter 5) for the body and for overall wellbeing. P.G. Wodehouse, in The Inimitable Jeeves, wrote: ‘It was my Uncle George who discovered that alcohol was a food well in advance of modern medical thought.’ In Pearson’s Weekly (a rival to Tit-Bits and founded in 1890 by Sir Arthur Pearson, who went on to create the Daily Express), Bass Ale received the following testimonial: An old friend of mine, Colonel Worsley CB, when in India, had a very dangerous attack of dysentery and was given up by the doctors. When dying as it was thought,
Beer as Part of the Diet
5
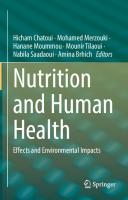
he begged the man in a faint whisper to give him some Bass and as it was thought his case was hopeless he was humoured. He then drank pint after pint and began to get better as soon as his yearning was satis ed much to the astonishment of the doctors and brother of cers. Despite the fact that once upon a time I was research manager with Bass, I can’t believe that there was anything magical about Bass Ale to make it superior in the context quoted as compared to any other beer. I remain open-minded about the veracity of the report, and about the likelihood of a causal link between Worsley’s wellbeing and the consumption of beer. The claims for Bass have been various. Doctors in its town of origin, Burton-onTrent, are said to have recommended it as a laxative. Writing in The Times, Dr Mapother recommended Bass as a cure for gout. It is claimed that Bass cured Edward VII, when Prince of Wales, of typhoid. Perhaps this stimulated the music-hall song that ran I’ve tasted hock and claret too, Madeira and Moselle But not one of those boshy wines revives this languid swell Of all complaints from A to Z the fact is very clear There’s no disease but what’s been cured by Bass’s Bitter Beer. Remarkable testimony! But Bass isn’t the only brand to have been championed in this way. 1928 saw Guinness launch the slogan Guinness is Good for You, and followed it with such as My Goodness, My Guinness and Guinness for Strength (Fig. 1.1). The sweet stout, Mackeson, was marketed in the 1950s on a slogan of: It looks good, it tastes good, And, by golly, it does you good. Nursing mothers were expected to enjoy a daily bottle of stout. Those were the days when some governments were not hesitant to see the virtues that beer had as a social cement and catalyst of contentment. As Queen Victoria had said rather earlier: ‘Give my people plenty of beer, good beer and cheap beer, and you will have no revolution among them.’ The British government in the middle of the last century was totally happy to see the trade association The Brewers Society champion their members’ products with generic messages including For Bodily Health – Beer is Best and To Set A Man up for Winter – Beer is Best and For an A1 People – Beer is Best (Fig. 1.2). Predictably, the temperance lobby countered with Beer is Best Left Alone.
(a) Fig. 1.1 Marketing slogans from Guinness. (a) Poster from 1932. The seven pints represented both the days of the week and the seven beneficial reasons for drinking Guinness: ‘strength, nerves, digestion, exhaustion, sleeplessness, its tonic effects and for the blood’. (b) Poster from 1945. The Ministry of Information’s ‘Dig for Victory’ slogan was adapted and integrated into the ‘Guinness for Strength’ campaign. The GUINNESS
(b)
word, HARP device and ARTHUR GUINNESS signature are trade marks and are reproduced together with the ‘Poster from 1932’ and ‘Poster from 1945’ advertisements with the kind permission of Guinness & Co. Guinness & Co. All Rights Reserved. The ‘GUINNESS IS GOOD FOR YOU’ advertising campaign dates from the 1930s to 1960s and has not featured in subsequent campaigns to advertise GUINNESS beer.
8
Chapter One
(a) Fig. 1.2 (a)–(e) Marketing slogans from the Brewers Society. Reproduced courtesy of the British Beer & Pub Association (formerly The Brewers Society).
Beer as Part of the Diet
(b) Fig. 1.2
(Continued.)
9
10
Chapter One
(c) Fig. 1.2
(Continued.)
Beer as Part of the Diet
(d) Fig. 1.2
(Continued.)
11
12
Chapter One
(e) Fig. 1.2
(Continued.)
Beer as Part of the Diet
13
This type of campaigning by the Brewers Society stressed the social element of beer as much as anything. There was scienti c understanding of the composition of beer and brewers realised that it could make a contribution to dietary intake of various key components, as you would expect from ‘just another’ foodstuff. The Brewer’s Journal in 1939 reported (on the basis of a study by the Royal Society) that a barrel of beer was the equivalent in cumulative nutritive value of 10 pounds of beef ribs, 8 pounds of shoulder mutton, 4 pounds of cheese, 20 pounds of potatoes, 1 pound of rump steak, 3 pounds of rabbit, 3 pounds of plaice, 8 pounds of bread, 3 pounds of butter, 6 pounds of chicken and 19 eggs (Glover 2003). At that time the body of evidence was not available that now indicates that the moderate intake of beer has a clear impact in preventing certain diseases.
Getting beer into perspective As my friend and colleague, Michael Lewis, is wont to say: ‘There is nothing so disgusting as a drunken brewer.’ I would go further, for the state of drunkenness is neither pretty nor conscionable in anybody. It is socially unacceptable, ugly and dangerous. Stuttaford (1997) tells of how medical students memorise the various stages of drunkenness: ‘dry and decent, delighted and devilish, delinquent and disgusting, dizzy and delirious, dazed and dejected, and dead drunk’. Excessive consumption of alcohol can be fatal. At the very least it can lead to an unfortunate lack of inhibitions. Most extensively publicised of course are the incidences of drunken driving. There is no question that consumption of alcohol and driving do not mix. The legally permitted levels of alcohol consumption vary considerably between countries (Table 1.2). The safest option is to avoid alcohol completely when intending to drive. Interestingly, alcohol appears to play a part in 15% of fatal crashes in the UK where the legal drinking age is 18, but more than 30% in the US where the legal drinking age is 21 (Barr 1999). There is ample evidence that drinking any alcoholic beverage to excess is harmful (Table 1.3). However, so too is the overconsumption of any dietary component or the pursuit of many activities to excess. It is a fact that drunkenness has been around for millennia (Roueche 1960). The Chinese Shu Ching from about 650 BC said that: Men will not do without kiu (a beer made from millet or rice). To prohibit it and secure total abstinence from it is beyond the power even of sages. Here, therefore, we have warnings on the abuse of it. The Mongolian chief, Genghis Khan, stated: A soldier must not get drunk oftener than once a week. It would, of course, be better if he did not get drunk at all, but one should not expect the impossible.
14
Chapter One
Table 1.2 Legal limits for blood alcohol content of drivers. Country
Limit (mg/mL)
Country
Limit (mg/mL)
Albania Argentina Armenia Australia Austria Azerbaijan Belarus Belgium Bosnia and Herzegovina Bulgaria Canada Croatia (Republic of) Czech Republic Denmark Estonia Finland France Georgia Germany Greece Hungary Iceland Ireland Israel Italy Kyrgyzstan Latvia
0.1 0.5 0 0.5 0.5 0 0.5 0.5 0.5 0.5 0.8 0.5 0 0.5 0 0.5 0.5 0.3 0.5 0.5 0 0.5 0.8 0.5 0.5 0 0.5
Lithuania Luxembourg Malta Moldova The Netherlands New Zealand Norway Peru Poland Portugal Romania Russia Singapore Slovak Republic Slovenia South Africa South Korea Spain Sweden Switzerland Thailand Turkey Turkmenistan United Kingdom United States Zimbabwe
0.4 0.8 0.8 0.3 0.5 0.8 0.2 0.5 0.5 0.5 0 ‘drunkenness’ 0.8 0 0.5 0.5 0.5 0.5 0.2 0.8 0.5 0.5 0.3 0.8 0.8 0.8
Source: International Center for Alcohol Policies (2002).
Table 1.3 Harmful effects of alcohol. • • • • • •
Traf c accidents, falls, drowning Nervous system: cerebral, cerebellar, brain stem degeneration; optic atrophy; polyneuropathy; pellagra Digestive system: hepatitis; fatty degeneration of liver; cirrhosis; pancreatitis; peptic ulcer Cancers: mouth, pharynx, larynx, oesophagus, liver, colon (?), breast (?) Cardiomyopathy, hypertension Myopathy, porphyria, fetal alcohol syndrome
Source: Bamforth (2002).
Such pragmatic approaches sit uncomfortably with a good many people. However, in a mature and far-sighted society, it is only by confronting these issues that rational and realistic solutions and practices will emerge. It is relevant at this point to consider statistics concerning drunkenness and instances of drink-related driving. Table 1.4 highlights that the current situation in the UK is far healthier in respect of all drunkenness offences than 25 years ago. Furthermore, the number of drivers involved in accidents that register above the legal limit for alcohol
Beer as Part of the Diet
15
Table 1.4 Drunkenness offenders in the United Kingdom. Year
Rate per 10,000 people
1964 1965 1966 1967 1968 1969 1970 1971 1972 1973 1974 1975 1976 1977 1978 1979 1980 1981 1982 1983 1984 1985 1986 1987 1988 1989 1990 1991 1992 1993 1994 1995 1996 1997 1998 1999 2000 (estimate)
15.9 14.9 14.9 15.2 15.9 15.9 16.3 17.0 17.9 19.8 20.2 20.5 21.0 20.7 20.3 21.4 22.1 19.4 19.0 18.9 15.7 14.3 12.6 15.2 17.1 16.7 15.5 13.5 12.2 10.6 10.2 7.5 8.7 9.4 9.2 8.3 7.7
Source: Tighe (2002).
has remained around 2% of the total number involved in accidents since 1990 and is half the level of 25 years ago (Table 1.5). Incidentally, Skynet Webmagazine in May 2002 reported how the use of a mobile telephone (even a hands-free phone) presented a greater risk during driving than the consumption of up to two drinks. This should not be construed as an acceptance of even moderate alcohol consumption before driving – zero intake will always be the best option for those intent on such an activity – but
16
Chapter One
Table 1.5 Results of breath tests on car drivers involved in accidents in the United Kingdom. Year
Percentage of drivers in accidents that were tested positive in a breath test
1969 1970 1971 1972 1973 1974 1975 1976 1977 1978 1979 1980 1981 1982 1983 1984 1985 1986 1987 1988 1989 1990 1991 1992 1993 1994 1995 1996 1997 1998 1999 2000
1.7 2.2 3.0 3.4 4.0 4.8 4.8 3.8 3.6 3.8 4.3 4.1 3.8 4.0 3.9 3.7 3.7 3.4 3.2 2.8 2.6 2.4 2.4 2.2 2.0 2.0 2.1 2.2 2.1 2.0 2.0 2.2
Source: Tighe (2002).
rather highlights that there are other even more potent dangers that do not attract the same focus or emotion. Alcohol, though, raises passions to an extent wholly unlike most other components of the diet. It is anathema to some that a broad kirk within the world of medicine should be alerting society to the bene ts to be had from including alcohol in the diet in moderation. Moderation should surely be the byword for all parts of our menu. Lord D’Abernon, editor of the early twentieth-century study championed by the British Medical Research Council, Alcohol: Its Action on the Human Organism, exclaimed:
Beer as Part of the Diet
17
Alcohol is an ungrateful subject. Most people who are interested in the subject are already partisans on the one side or the other, and no body of impartial opinion exists which is ready to be guided by scienti c inquiry. The majority of those who would give any attention to original work on the subject would do so less to gain knowledge than to nd arms and argument to support their preconceived opinion. Roueche (1960) In Chapter 6, I present the published facts about the negative impact of excessive alcohol consumption on health. However I do the same with the claimed bene ts of alcohol, especially beer. I hope I have been impartial. In a speech to the National Press Club on 10 June 1991, Dr Arthur Klatsky, head of cardiology at the Kaiser Permanente Hospital in Oakland, California, said: Current evidence about lighter drinking and health suggests that: (1) The case is now quite strong that, for persons, at risk of coronary heart disease, there is an optimal amount, not just a safe amount of drinking. (2) This bene t of alcohol operates by reducing the risk of the commonest kind of heart disease – coronary heart disease. (3) We cannot yet de ne precisely the optimal amount of alcohol but that it is below 3 drinks per day. (4) It doesn’t seem to matter what type of alcoholic beverage is taken. Subsequent research from Klatsky’s laboratory and various other researchers have re ned these statements, but their fundamental accuracy is unchanged. Another major player in the eld has been Dr Norman Kaplan from the University of Texas Southwestern Medical Centre, who wrote in the American Heart Journal: I nd nothing wrong or unhealthy about my current practice – a beer or two after a heavy tennis game or a glass or two of wine after dinner… One last argument sometimes used against all alcohol consumption is that, even if moderate alcohol consumption is healthy, physicians cannot condone it because this condones heavier use and may even encourage those who now drink in moderation to become addicted abusers. To this I say ‘baloney’. Kaplan (1991) Dr Kaplan certainly hits the nail on the head, for there are so many who cannot seem to recognise that it is possible, indeed the norm, to consume alcohol in moderation. It is no more reasonable to advocate the elimination of alcohol consumption than it would be to lobby for the elimination of football because some people deliberately set out to
18
Chapter One
critically injure opponents, or the avoidance of prescription medicines because some people overdose. Aspirin in regular small doses is a lifesaver. In excess it can be a killer. The same applies to alcohol. A dear friend of mine takes an aspirin a day to counter the risk of heart disease. He is roundly applauded for his conscientiousness and it is implicit that he would never take more than his prescribed ration. The evidence is increasing that a pint or two of beer per day may be just as ef cacious. Rather fewer people would approve if he swapped his aspirin for the beer, despite the fact that the beer has nutritional value absent in the aspirin. And, whereas everyone will naturally assume that he will know not to get heavy-handed with the aspirin, some will just as automatically assume that he won’t know when to put down the bottle of booze. Preventing reasonable-minded folk from drinking to their customary moderation is just as illogical as banning chocolate because some people pig out on it, or dispensing with kitchen knives because there is an occasional person predisposed to insert them into friends and neighbours.
What is moderation? It is common for those writing on the topic of alcohol and health to refer to ‘moderation’. What is it exactly? In the Second Special Report to Congress on Alcohol and Health from the National Institute on Alcohol and Health in 1974, some de nitions of drinking habits were given:
• • • •
Moderate occasional. People who drink alcohol only in small amounts at any one time, never enough to become intoxicated and less frequently than daily Moderate. Same, except daily Heavy occasional. People who get drunk occasionally, with periods of abstinence or moderation Heavy. People who get drunk regularly and frequently
This is a general classi cation, but it still doesn’t give any precise quanti cation. Most people would consider moderation to equate to one or two glasses of beer or wine per day. Even then, what a German consuming steins of lager or a Frenchman enjoying a bottle of wine daily would consider to be moderate might be considered to be excessive by those of other nationalities. The World Health Organization suggests that 60 grams of alcohol per day should be a maximum. For a beer of 5% alcohol by volume, which equates to approximately 4% alcohol by weight, this means 1.5 litres, or a little over two and a half pints.
Beer as Part of the Diet
19
In his commendably balanced book, Stuttaford makes these perspicacious comments: Approximately 90 per cent of men and 80 per cent of women in this country [United Kingdom] enjoy drinking alcohol from time to time. Only a tiny fraction drink to excess; few would ever fall down any steps … and a couple of pints two or three nights a week will not turn most people into drunken hooligans. Opponents of drinking are selective in their reporting: they seize upon the disasters which overtake the minority who drink too much and draw conclusions from their behaviour and health which are then applied to the population as a whole. This way of generating statistics is unsound, and their misleading of the public is unjusti able. The medical advantages of alcohol have been hidden from the general public for thirty years, and the reason usually advanced for this obfuscation is the patronising one that alcohol, delightful as it is to take and good as it is for the heart, cannot be trusted to the masses lest they drink themselves to death. Stuttaford (1997) If such is the case in the UK, then it is writ ten-fold larger in the US. Recently a colleague ‘confessed’ that he and his wife enjoyed a drink, but never in front of the children, for fear of giving them the wrong impression. The impact of this hypocritical behaviour is to persuade the younger element that drinking is some mysterious and hidden pleasure, a ‘forbidden fruit’. Perhaps it is not to be wondered at that when a student here reaches the legal drinking age of 21 they too frequently succumb to the temptations of the drinking ritual, sometimes with such devastating consequences. Such ceremonies have generally involved the consumption of spirits, perhaps doubles, to match the number of years on the planet. Alas, too often they do not reach their next birthday. To consume that amount of alcohol in the form of beer would be virtually impossible on a volume basis, but that is not my point. Rather it seems to me that beer and other alcoholic beverages should be associated with messages of responsibility for the good that they can deliver when used in moderation – and not swept under the carpet. Professor Pelc, a psychiatry lecturer at a leading Belgian university, was quoted in Le Journal de Brasserie (December 2002, page 17) as saying that banning the consumption of alcoholic beverages by young people actually increases the risk of harmfully excessive alcohol consumption and of criminal or other antisocial behaviour. He is said to have advocated what is surely the practice for many societies worldwide, namely an early introduction to the consumption of moderate quantities of alcohol in the family home as the best way to encourage safe and socially acceptable drinking habits. Y. Boes, writing in the same journal (page 7) suggests that traditional Belgian low-alcohol beer (biere de table) is healthier for children than cola or lemonade. Between 1960 and 1980 there was an annual doubling of the amount of beer and spirits consumed in the US. Perhaps young people were rebelling against laws that restricted consumption of alcohol because of the association of alcohol with vice.
20
Chapter One
Fortunately there are legislatures that have far-sighted and common-sense attitudes. When the UK government freed up legislation to allow children to accompany their parents into public houses, the Home Secretary, Kenneth Clarke, suggested it would ‘enable children to see people drinking sensibly and perhaps stop them becoming lager louts’. Incidentally, Clarke is by no means the only Member of Parliament to be favourably disposed to beer. In 1975 the then Prime Minister, Harold Wilson, having converted from whisky to beer, said: ‘Contrary to all medical opinion, I’ve lost a lot of weight since I began drinking more beer. In fact, I’ve lost a stone in only a year.’ That prosaic Christian chronicler C.S. Lewis had written, rather earlier: ‘The sun looks down on nothing half so good as a household laughing together over a meal, or two friends talking over a pint of beer.’ Wechsler and Isaac in 1989 produced evidence to show that the raising of the legal drinking age in the US from 18 to 21 had led to an increase in episodes of drunkenness from 25% up to 41% for men and from 14% to 37% for women (Wechsler & Isaac 1992). It seemed that the impact was a polarisation of drinking habits, with a disappearance of moderate consumers: students either drank not at all or to excess.
But what about addiction? So many fear addiction. The former First Lady, Betty Ford, said in 1991 that alcohol was the number one addictive drug in the US. Yet the fact is that by far the majority of people who enjoy alcohol don’t feel a compulsion to drink and don’t suffer from withdrawal, which are the markers of an addictive drug. Roueche (1960) quotes a reformed alcoholic, the Reverend Ralph S. Pfau, in differentiating between a drunkard and an alcoholic: ‘The drunkard drinks because he wants to. The alcoholic drinks because he has to.’ This is an important difference. As Harold Lovell, erstwhile clinical professor of neurology at the New York Medical College, said: Alcoholism is a condition characterised by uncontrolled, compulsive drinking. An alcoholic is impelled to drink against his will or judgement, even if will or judgement are functioning. Stanton Peele (1985) says: ‘Addiction may occur with any potent experience.’ Orford (1985) reminds us that compulsive gambling, extremes of sexual behaviour and overeating are all addictions. Might we add to these watching television, shoplifting, sur ng the Internet, shopping (notably by credit card) and work?
Beer as Part of the Diet
21
Alcohol is less addictive than caffeine. It was shown by Strain et al. (1984) that caffeine in coffee, tea and cola induced all of the features of psychoactive dependence, including the continued use of the material despite side effects which include anxiety, sleeplessness and gastrointestinal dif culties, as well as the displaying of withdrawal symptoms. True, it is possible to get caffeine-free versions of this type of drink – but the ‘fully charged’ versions of each hardly attract the same attention as alcohol in the legislature. The words ‘alcohol’ and ‘drug’ are linked in the public consciousness, not so ‘coffee’ or ‘cola’ and ‘drug’. Those over-imbibing sodas or coffee would seldom be considered generally to have a disease. Yet the majority of the public would consider alcoholism to be a disease. The medical profession (Room 1983; Fingarette 1988) no longer holds this view. The concept of alcoholism as a disease was rst propounded in the late 1930s (Mann 1950; Jellinek 1960). The argument is that certain people are vulnerable to alcohol and will develop the disease if they start to drink. Progressively they will consume everincreasing amounts and suffer a range of symptoms, including amnesia and blackouts, and lose control over their ability to say yes or no to another drink. There is no alternative for such a person but to abstain. It seems, however, that there is considerable scepticism about the disease concept (Kissin 1983). As Marlatt (1983) says: ‘There is no adequate empirical substantiation for the basic tenets of the classic disease concept of alcoholism.’ There is a realisation that the tendency for some to abuse alcohol is little different to other forms of compulsive behaviour, such as addictions to drugs, cigarettes, gambling, shopping and caffeine. Peele (1985) embraces all these forms of ‘excessive appetite’ into a ‘unitary theory’. Jellinek (1960) largely de ned the concept of alcoholism as a disease. Fingarette (1988) detailed the various aws in Jellinek’s approach, to the extent of pointing out that Jellinek himself questioned the adequacy of his techniques: In sum, Jellinek’s highly in uential articles were based on questionnaires completed by 98 male members of AA (Alcoholics Anonymous). Of the 158 questionnaires returned, Jellinek had eliminated 60, excluding the data from some AA members who had pooled and averaged their answers on a single questionnaire because they shared their newsletter. Jellinek also excluded all questionnaires lled out by women because their answers differed greatly from the men’s … Even in 1960, Jellinek acknowledges the lack of any demonstrated scienti c foundation for his proposals. Fingarette (1988) There emerged diverse studies to contradict the disease concept, including the observation that those who have undertaken regular bouts of heavy drinking may very
22
Chapter One
well return to a style of moderate consumption (Clark & Cahalan 1976). The reader is referred to the autobiographical confessions of Jack London in John Barleycorn (1913) for a literary example of this. As Schuckit (1984) observes, in any given month half of all alcoholics will be abstinent, with an average of four months being ‘dry’ in a 1- to 2-year period. Keller (1972) points out that virtually all of the alcoholics that he had encountered said that they could frequently take just 1 to 3 drinks for a period of weeks without any episodes of being unable to stop. Keller observed that if there had been an unavoidable slide towards uncontrolled drinking as a result of simply taking one drink, then that would not explain why an alcoholic would lack the self-control simply to avoid taking that rst drink. In other words, the lack of self-control exists before the drink is taken. Several studies have presented powerful evidence that heavy drinkers do possess selfcontrol. Mello and Mendelson (1972) (see also Heather & Robertson 1981) performed an experiment whereby heavy consumers of bourbon were allowed to earn ounces of bourbon in periods of between 5 and 15 minutes in response to their ability and preparedness to partake of simple tasks involving pushing a button according to instructions. Under conditions where they could certainly earn enough bourbon to become intoxicated, none of the subjects attempted to drink to gross excess. In fact they drank to maintain high but approximately constant blood alcohol levels, in spontaneously initiated and terminated sessions over a prolonged period as opposed to continuously. It was also concluded that the amount of alcohol consumed was related to the effort that needed to be exerted to get it – there was a bene t versus cost balance, which ies in the face of the lack of control supposition associated with alcoholism. In another study it was shown that, when given the choice of more liquor or the ability to remain in a pleasant social environment, alcoholics mostly retrained themselves to moderate drinking (Cohen et al. 1971). Pattison et al. (1977), in a review of more than 50 clinical studies, drew the conclusion: Within a hospital or laboratory environment the drinking of chronic alcoholics is explicitly a function of environmental contingencies. This must mean either that there is something about non-controlled environments that impacts on drinking behaviours or that properly controlled experiments and observations made out of a clinical or laboratory setting have not been made. If the former is the case, coupled with the observations made on individuals’ drinking habits in relation to reward, then this argues for the importance of a range of other motivations for heavy drinking that are not chemical based. Indeed, a compelling study by Marlatt et al. (1973) showed that alcoholics consume beverages in response to what they are directed to believe that those drinks comprise. Thus, if given tonic water alone but told that it contained vodka, the subject consumes
Beer as Part of the Diet
23
as much of that drink as they do of one that is genuinely a blend. However, if told that a product is pure tonic then, irrespective of whether the sample actually did contain vodka, the alcoholic would drink less of it and certainly no more of the sample that contained alcohol. This type of study ies directly in the face of arguments for a chemical-based rationale for alcoholism. Fingarette (1988) opines that the retention of the disease concept by some in the medical profession and legislatures is one tactic for securing research funds and ensuring that those who do drink to excess seek help. As Vaillant puts it: Calling alcoholism a disease, rather than a behaviour disorder, is a useful device both to persuade the alcoholic to admit his alcoholism and to provide a ticket for admission into the health care system. I willingly concede, however, that alcohol dependence lies on a continuum and that in scienti c terms behaviour disorder will often be a happier semantic choice than disease. Vaillant (1983) Jellinek (1960) himself said that ‘A disease is what the medical profession recognises as such.’ The National Institute on Drug Abuse (Galizio & Maisto 1985) considered 43 different theories for what drives alcoholism. Fingarette (1988) says that some of them, at least, must be wrong, and that: there is no such single ‘disease’ and therefore there is no cause. The very proliferation of widely diverging unsupported hypotheses is not characteristic of solid scienti c research. It is characteristic of pseudo-science and faddism. There are, however, rm adherents to the belief that there is a gene-based inheritance of alcoholism. Studies of relative tendency towards alcoholism in adoptive children and twins have now led to the view that the risk of alcohol dependence is due to the additive or interactive impact of multiple genes (Goodwin et al. 1973, 1974; Bohman et al. 1981; Hrubec & Omenn 1981; Heath et al. 1997; Kendler et al. 1997). The question is whether children born to an alcoholic parent and put up for adoption soon after birth show a greater tendency towards alcoholism that those adoptees who were born to nonalcoholic parents. In the work of Goodwin, there were 3.6 times more alcoholic adopted children from alcoholic fathers than from non-alcoholic fathers. It is important to stress, however, that 82% of the adoptees that came from an alcoholic biological father did not become alcoholic. This may be because they did not inherit the gene(s) or that there are other impacting factors, including environmental ones. Fingarette (1988) provides a calculation to illustrate that the majority of alcoholics are not born to alcoholic parents. Indeed, in a study analogous to that reported by Goodwin, it was found that daughters
24
Chapter One
of alcoholic parents were not predisposed to becoming alcoholics; indeed, there were more alcoholic women who did not have alcoholic parents (Cahalan et al. 1969). Speci c genes for alcohol dependence have not yet been identi ed; there may be six or so linked to alcohol sensitivity, as well as others determining personality and general predilection towards addiction (Whit eld 2001). It is believed by some that innate resistance to intoxication increases the risk of alcohol dependence, whereas sensitivity to the impact of alcohol decreases the risk (Whit eld 2001). Seemingly 5–10% of British and Germans and twice as many Swiss have forms of the enzyme, alcohol dehydrogenase, that allow up to 30% faster elimination of alcohol (Marshall & Murray 1989). The concern is that individuals who react less intensely to alcohol may lack the inherent feedback control to prevent the negative impact of higher alcohol intake (Finn et al. 1990). Another key factor that limits the extent to which people consume alcohol is its inhibition of the synthesis of glucose in the body (gluconeogenesis). This induces hypoglycaemia (shortage of sugar) and a healthy body should respond by limiting the intake of the inhibitor, i.e. ethanol. Alcoholism, then, is held by many to run in families (Cotton 1979; Dietrich & Spuhler 1984; Goodwin 1985), with four- fths of male and female alcoholics in treatment possessing at least one close biological relative also displaying alcohol-related problems (Hesselbrock et al. 2001). Hesselbrock et al. say that the risk of alcoholism among sons of alcoholic fathers is 3–5 times greater than for the general population. It should be appreciated that, while there may be a genetic basis for this inheritance, there may equally be an environmental in uence. This may run in a counter-indicative way; for example (if I may be permitted a qualitative observation), I know several individuals who adopt an extremely abstemious lifestyle having been raised in households where the father has been troubled by abusing alcohol. Fingarette (1988) amply illustrates how there are undoubtedly diverse causal impacts on individuals’ likelihood to take alcohol to excess. There may be no uniformity between people in this respect. While there may be some genetic contribution to the effect, there are those who believe that there may equally be a signi cant contribution of ‘learning theory’: some people may simply learn to deal with life’s dif culties in this way. Fingarette writes: There is no one cause of alcoholism; alcohol abuse is the outcome of a range of physical, personal and social characteristics that together predispose a person to drink to excess; and episodes of heavy drinking are triggered by immediate events in a person’s life. We are reminded, too, that there may be an economic impact. It is claimed that there is an inverse relationship between cirrhosis and the price of alcohol (Cook 1984). On this basis some rmly advocate higher taxation of alcohol to reduce alcoholism. For
Beer as Part of the Diet
25
this to be a legitimate tool inherently assumes that an individual does indeed have total control over their environment, psychiatry, physiology and genome, and will simply not purchase alcohol if it is highly priced. On the other hand, if it is accepted that there are individuals who, for whatever reason, are predisposed to abuse alcohol, then they will surely nd the wherewithal to acquire drink by whatever means it takes. Meanwhile the vast majority who enjoy and bene t from alcohol (see later) are penalised (Chaloupka et al. 2002). It seems that diverse psychiatric conditions tend to be found in individuals displaying alcohol dependence. Thus it was shown in one study that only one- fth of people receiving treatment for alcohol dependence failed to report other psychiatric disorders. It seems, too, that those predisposed to ‘abusing’ alcohol are also increasingly likely to display anxiety, affective and antisocial disorders and other substance abuse problems (Burns 1994). It is claimed that those people with an increased tendency towards alcohol abuse metabolise alcohol in distinctive ways. Acetaldehyde levels are seemingly higher in such people (Lindros 1978). However, Lindros does not believe that acetaldehyde is directly implicated in triggering a dependence on alcohol. Males have more alcohol-related problems than females (Dawson & Archer 1992), but females tend to accumulate higher levels of alcohol in the blood, metabolising it more slowly (Frezza et al. 1990).
Impacts on behaviour I live in a city that was proud recently to vote in a new ordinance prohibiting the possession of open containers of alcoholic beverages in public places. It was argued that this would preserve some social ideal, denying rabble-rousers and itinerant panhandlers the opportunity to make a nuisance of themselves. Seemingly there was no thought given to the closing off of one avenue of contentment to the greater majority of people, i.e. those who enjoy a drink or two in accompaniment of a pleasurable all-round lifestyle. Those families and friends who enjoyed some conviviality over a bottle of wine or a couple of beers at the Farmers Market in Central Park were suddenly made to feel as if they were somehow socially inadequate. Legislators might ponder the work of Zarkin et al. (1998), which showed that men who consume alcohol enjoy approximately 7% higher wages than those who do not drink. Alcohol, regrettably, is too often associated with antisocial behaviour. Starting with the observation that moderation can be associated with the use of any alcoholic beverage, what evidence is there for differences between drink type in their impact on social behaviour? And let us be careful when addressing matters of cause and effect. Thus football hooligans might be predisposed to beer consumption. That is quite different from saying that drinking beer causes all instances of football hooliganism. In just this
26
Chapter One
same way, a wife beater is predisposed to domestic violence from a aw in his character. The fact that he may enjoy a drink is by no means causally linked. Somebody who will in ict physical harm on a spouse is not made into such a person by consuming alcohol, although we might accept that the alcohol may remove inhibitions to increase the likelihood of it happening. Approximately half of adult males in the US who are heavy drinkers do not display drink-related personal or social problems, while nearly a half of those adult males that do have the very problems generally associated with drinking are not heavy drinkers (Cahalan & Room 1974). Many laboratories have demonstrated the Mellanby effect (Mellanby 1919): the concentration of alcohol in the blood rises more rapidly and to higher levels after the consumption of spirits as opposed to beer (see e.g. Gardiner & Stewart 1968). Takala et al. (1957) showed that these differences were manifest even when the spirits were diluted to the alcoholic strength of beer. The differences were displayed in respect of performance – for example, driving tasks were more impaired for people who had taken brandy rather than beer (Bjerver & Goldberg 1950). Takala et al. (1957) found that brandy drinking led to more argumentative and aggressive behaviour than did beer drinking, even though blood alcohol levels were similar. Boyatzis (1974) made comparable observations. Pihl and colleagues (1981) feel that the different impact of beer and spirits is due to different expectations about their effects, and not the different type of beverage per se. However, we assume that Siamese ghting sh don’t have expectations, and Raynes and Ryback (1970) found that aggression in such creatures was decreased by alcoholic beverages, with beer and wine having a greater impact than spirits. Klein and Pittman (1993) claimed that emotional state impacts on the beverage of choice. Thus beer drinking increases in response to negative emotions, such as loneliness, whereas the intake of wine coolers was increased in association with positive emotional states. Seemingly, married people drink more wine when they are sad and bored. Of course, we must not ignore the fact that there are substantial differences between the drinking public in where and when they will consumer beverages of different types. Also the perception of the different types of beverages varies. Klein and Pittman (1990) surveyed more than 2000 American adults to nd that underage drinking and antisocial behaviour were regarded as being associated more with beer and spirits than with wine. Conversely, Gaines (1985) found that the black population in three cities regarded beer as a soft drink and unlikely to be harmful. Lang et al. (1983) determined that undergraduates believed wine to be the most positively regarded of the alcoholic drinks, while Harford (1979) found that wine was more likely than beer or spirits to be consumed with a meal. It seems that bar customers taking beer will do so with greater rapidity and to a greater extent than will those taking other forms of alcohol (Storm & Cutler 1981; Stockwell et al. 1992). Surveys seem to suggest that wine consumption is less associated with problems than is that of beer or spirits (e.g. Adlaf et al. 1993). However, Evenson (1986) found that
Beer as Part of the Diet
27
among more than 10,000 alcoholics in Missouri, those drinking beer alone had fewer alcohol-related symptoms and problems. Gronbaek et al. (2000) concluded that beer drinkers appeared to have more sensible drinking patterns than did wine drinkers. Once again, I believe it to be important to distinguish cause and effect. The evidence seems to be that beer is perceived to be less healthful than wine even though the evidence (see also Chapter 6) does not support this contention. Beer is also more frequently associated with antisocial behaviour than is wine, though again good arguments can be made to say that either beverage is as good or bad as the other in this context. The simple truth is that ‘high spirits’ are more often associated with young men than with any other sector, and at the same time young men tend to be the fraction most likely to take in most beer (Single & Storm 1985). Without belabouring the point, it’s rather like drawing a correlation between the absence of goatee growth and the predisposition to become a nurse. There are many more female than male nurses and (I assume) the majority of the former gender don’t have goatees, and indeed, for reasons of hygiene, the male nurses won’t either. Thus the population drinking wine generally tend to be older (and wiser?) than those drinking beer. They are less likely to drink and drive for this very reason (Perrine 1970, 1975), and not on account of the beverage they drink. Berger and Snortum (1985) suggest that the problem is the beer drinker’s culture, with the positioning of much beer advertising being one that appeals to gung-ho masculinity. Snortum et al. (1987) discovered that male students declaring a preference for beer regarded themselves as more ‘drunk’ than did those claiming to prefer wine. It was predicted that this self-concept would lead to an actual likelihood of increased drinking. Booth (2003) points out that many effects of alcohol on mood and social behaviour are as much to do with the situation in which the drink is consumed as with the direct impact of ethanol on the neural system. He says: Merriment and perhaps sexual predation are what is expected at parties; personal aggressiveness and vandalism become a norm for soccer fans, and gloom is natural for the lone(ly) drinker. All these effects have been seen in experimental studies, but there tend to be large ‘placebo’ or expectancy effects, too. It seems that ethanol contributes some disinhibition or incapacitation but a participative spirit achieves the rest. Diverse social pressures and norms can play an important role in conditioning individuals’ approach to drinking. Religion is naturally high on the list (Single et al. 1997) and the reinforcement of standards by family and friends may be more effective than legal and regulatory controls (Heath 1990). Grivetti (1985) reminds us that young people invariably start off by disliking the avour of alcoholic beverages, including beer. They pass through subsequent stages
28
Chapter One
of tolerance, acceptance and savouring. Impacting factors are peer impressions and adult mimicry. At rst they stand in bars, saying ‘boy, this stuff sure is great’, when in fact they nd the avour challenging, to say the least. The same pressures lead to the impression that smoking is mature and socially sophisticated. There are two possible reactions to such observations. Some would argue that the response should be to scare young people from the ‘evils’ and educate them so that this mimicry of adults is seen as futile and ill advised. The converse attitude, particularly when armed dispassionately with the facts in support of a very real positive impact of moderate alcohol consumption, is to educate with a more balanced approach. Sure, excessive consumption of alcohol is stupid, detrimental to health and antisocial. Restrained consumption, though, can be a boon. Schools in America teach ‘Driver’s Ed’ to develop good road skills in young people. The person who advocated the banning of the automobile in response to the numerous instances of speeding, accidents (far from all traceable to drunkenness) and atmospheric pollution caused by such machinery would be viewed as eccentric at the very least. Sutherland and Willner (1998) investigated problems of alcohol, cigarette and illicit drug use in English adolescents. They found that instances of drug use and smoking were lowest in those young people who drank beer or wine, was intermediate in those consuming ‘alcopops’ (nowadays the terms ‘malternative’ is in vogue for this type of product) and highest in those who drank spirits. Schweitz (2001) made some very perceptive observations regarding beer drinking in Sweden. He says that many Swedes have been inculcated with a feeling that even very modest consumption of beverages of relatively low alcohol content (e.g. most beers) is morally wrong. He claims that the unjusti ed reaction of shame and guilt in turn leads to feelings of ‘let’s do something to feel guilty about’, with attendant episodes of binge drinking. Such drinking patterns of over-indulgence separated by lengthy periods of abstinence are more prevalent in Sweden than in other countries. Schweitz also says that the proportionately higher taxation rate (on an alcohol basis) on beer as opposed to stronger products (wine, spirits) encourages people to consume the higher-alcohol products. There is a strong appreciation that the most acute health and social consequences are most frequently associated with those who indulge in light drinking but then binge (Poikolainen 1995; Stockwell et al. 1996; Grant & Litvak 1998). Understandably there is great concern from the medical profession in the face of the burgeoning evidence for the bene cial impact on the body of moderate alcohol consumption (which we will address in Chapter 6). To actually recommend that people drink is considered beyond the ethical pale. As W. Castelli, a principal in the famed Framingham Heart Study (see Chapter 6), wrote in 1979, ‘With 17 million alcoholics in this country we perhaps have a message for which this country is not yet ready.’ And
Beer as Part of the Diet
29
Criqui said in 1997: ‘Alcohol is too dangerous to be employed as a pharmacological agent except in highly selected situations.’ How, then, to deal with observations like that of Sesso et al. (2000), who nd that, among men with low alcohol consumption (e.g. one drink per week or less), a subsequent moderate increase in alcohol consumption will lower their risk of cardiovascular disease? Might I suggest that the sensible approach is to accept that a product such as beer can be a safe, pleasurable and even nutritious component of our diet, properly balanced against all other elements of our daily intake? It is not a medicine to be prescribed by doctors but rather a foodstuff that should be approached within social environs that are mature, considerate and reasonable. As was written in the Wall Street Journal on 13 January 1988: Drinking tends to be unproblematic when it is a normal, wholesome, enjoyable aspect of everyday life – not an unwholesome, dangerous and mysterious activity to be done in peculiar contexts that are set apart from friends, family and the normal routine of living. Drinking is much like eating, in the salutary view of Italians and many others, a view that contrasts markedly with the special quest for relaxation, relief of psychic stress, delusions of power or escape that prevail in much of Northern Europe and North America.
2
Beer Through History
It seems that the rst domesticated grain dates from around 8000 BC in the regions of Tell Aswad, Jericho and Nahal Oren. A stamp seal from Tepe Gawra (one of the most important historic sites of ancient North Mesopotamia, now Northern Iraq) of some 6000 years ago is the rst evidence of beer consumption: it depicts two people drinking beer from a single container using straws (Katz & Voigt 1986). Sumerian and Mesopotamian texts and artwork feature beer to a substantial extent, with the oldest known recipe being recorded as the Hymn to Ninkasi (Oriental Institute 2002). The lengthy verse (from which I quote extracts) refers to Ninkasi as the one who handles dough [and] … with a big shovel, Mixing, in a pit, the bappir with sweet aromatics. This refers to the practice at the time of making a bread from sprouted barley, the bread subsequently being lightly baked: You are the one who bakes the bappir in the big oven, We recognise that it was barley because of the retained hull (or husk, see Chapter 3): Puts in order the piles of hulled grain. The ‘malt’ was then mixed with water, allowing the endogenous enzymes to digest the starch in the production of ‘wort’ and for adventitious yeasts to commence the fermentation process: You are the one who waters the malt set on the ground, You are the one who soaks the malt in a jar, You are the one who spreads the cooked mash on large reed mats,
Beer Through History
31
Coolness overcomes … You are the one who holds with both hands the great sweetwort, You place appropriately on [top of] a large collector vat. Ninkasi, the fermenting vat, which makes a pleasant sound, After fermentation there was a clari cation – and, by the sounds of it, there was rather a lot to lter: When you pour out the ltered beer of the collector vat, It is [like] the onrush of the Tigris and the Euphrates. And the poem goes on to indicate that the beer was prized and valued for its merits: The gakkul vat, which makes the liver happy, The lam-sá-re vat, which rejoices the heart, The ugur-bal jar, a tting thing in the house. The sa-gub jar, which is lled with beer, The am-am jar, which carries the beer of the lam-sá-re vat … The beautiful vessels, are ready on [their] pot stands! May the heart of your god be well disposed towards you! Let the eye of the gakkul vat be our heart! What makes your heart feel wonderful, Makes [also] our heart feel wonderful. Our liver is happy, our heart is joyful. While I circle around the abundance of beer, While I feel wonderful, I feel wonderful, Drinking beer, in a blissful mood, Drinking liquor, feeling exhilarated, With joy in the heart [and] a happy liver – While my heart full of joy, As we shall see in Chapter 3, the processes referred to are entirely recognisable in brewing practices to this very day.
32
Chapter Two
In those far-off times, beer featured centrally as a foodstuff rather than as an accompaniment. Hesseltine (1979) indicates that a typical consumption must have been about a litre per day at 2% alcohol. The straw used for drinking was of clay or reed for the general population, but gold or silver for the rich and powerful. Some 40% of the grain in Sumeria was used for beer production. A workman in the temple got 1.75 pints per day, with senior dignitaries getting ve times that level (Singer et al. 1954–58). By the early Egyptian period the contemporary brewing practices were rmly in place (Tannahill 1973). Dough was made from sprouted and dried grains and partially baked. These loaves were then broken up and soaked in water and allowed to ferment for about a day. Then the liquid was strained off and the beer was ready for drinking. As Singer observes, Egyptian brewers were soon making variously spiced and avoured beer breads, allowing for a diversity of beers. There was a superintendent of breweries to ensure that purveyors only made available the best and purest products (Fleming 1975). Of course they had no control over the yeast because they had no notion that it existed, although they would have discovered that older cracked jars, with more hiding places for organisms ‘naturally selected’ for the purpose, would have given better results. It wasn’t until later that Pliny the Elder (AD 23–79) reported that the Gauls and Iberians were skimming beer for the purpose of re-inoculating the next batch. The brewers were women, who sold their beer from home. The Code of Hammurabi (1750 BC) condemned alehouses for their under-strength and over-priced beers and also had a decree regarding those who diluted the beer (Saggs 1965). Those who overcharged for their beer were to be drowned. In Egypt the most common beer was haq (hek) made from the red barley of the Nile (Tannahill 1973). Compared to some other products that we believe reached alcohol contents similar to modern wines (i.e. about 12%), haq seems to have been quite ‘mild’. Bread, beer and onions seemed to form the basic diet of the dynastic Egyptian peasant. Beer was deemed to be essential for general wellbeing. The Ebers papyrus, a sort of pharmacists’ standard text, listed the ingredients for diverse medicines, of which more than 100 of the 700 were made with beer (Fleming 1975).
Brewing travels west The Egyptians passed on their brewing techniques to the Greeks, though wine was the preferred drink for that empire and also for the Romans. Greek tradition says that Dionysus ed from Mesopotamia in disgust owing to its people being addicted to beer (Tannahill 1973). Beer was the mainstay of more northern cultures and the Germanic and Celtic races. In the rst century AD the Britons and Hiberni (Irish) were making kourmi from barley, a crop that had probably been cultivated in England since 3000 BC
Beer Through History
33
(Dunn 1979). One member of St Patrick’s (373–464) household was a brewer, a priest named Mecan (King 1947). One of the earliest references to beer in England is perhaps not as complimentary as one might wish: Kourmi, made from barley and often drunk instead of wine, produces headaches, is a compound of bad juices and does harm to the muscles. However, this was penned by a Greek (Dioscorides ca. 1st century AD), presumably biased in favour of wine! The history of beer has always been entwined with the church. St Brigid brewed ale at Eastertide to supply to all churches in her neighbourhood (King 1947). Later, the monasteries spawned the rst breweries in the British Isles. The word ‘ale’ comes from the Old English ealu, and we suppose that the malted grain was a cheaper option than the honey used in making mead. The Danes and Anglo-Saxons drank ale because their homelands were too cold to cultivate grapes successfully. The Anglo-Saxons used ale for coughs, shortness of breath and curing hiccups (Fleming 1975). They rubbed it on to the knees to ease aches and pains. Beer was a drink for heroes and Norse seafarers were brave in battle believing that, should they perish, it would be to go to drink ale in Valhalla (Savage 1866). The Vikings sang about drinking well before putting out to sea, hence the phrase ‘three sheets to the wind’. The Scandinavian word bjor became beer in the Anglo-Saxon. The foods enjoyed in Northern European countries were (and still are) heavy in carbohydrate and fat, needing to be washed down with large volumes of liquid (Tannahill 1973). Thus beer is highly suitable.
Restraining excess King Edgar (959–975) was convinced by Archbishop Dunstan of Canterbury to close many alehouses because of drunkenness and it was decreed that there should be only one such establishment per hamlet. This early attempt at enforcing moderate consumption had the additional proviso that pins should be hammered inside drinking horns at stated points and ‘whoever should drink beyond these marks at one draught should be obnoxious to a severe punishment’ (King 1947). One might note, however, that medieval drinking vessels had a capacity of about four pints (a ‘pottle’) (Brown & Schwartz 1996). Drinking competitions sprang up to see who could uncover the most pins – in other words to ‘take each other down a peg or two’.
34
Chapter Two
In Norman times ale was used for casting out devils: the trick was to mix some herbs with ‘clean ale’, sing seven masses over the drink, add garlic and holy water and then drink it from an inverted church bell (King 1947). Ale was popular. William of Malmesbury wrote of the English in the early twelfth century (King 1947): Drinking was a universal practice, in which occupation they passed entire nights as well as days. They consumed their whole substance in mean and despicable houses; unlike the Normans and French who in noble and splendid mansions lived with frugality. They were accustomed to … drink till they were sick. These latter qualities they imparted to their conquerors.
Religious origins All monasteries and abbeys featured breweries. The symbols X, XX and XXX were used as a guarantee of sound quality for beers of increasing strength (Savage 1866; King 1947). The monasteries passed on their skills to those brewing in their own homes (notably the women: ‘ale wyfes’) and by the Middle Ages ale had become the drink at all mealtimes. Out of the domestic brewing scene came the development of breweries, each selling their own beer in a room at the front – they would be known today as ‘brew pubs’. They produced two main products: ‘strong beer’ fermented from the rst runnings from the mash and ‘small beer’ from the weaker, later runnings. In the early fourteenth century there was one ‘brew pub’ for every 12 people in England. In Faversham in 1327, 84 out of 252 traders were brewers. All ale was sold locally because of transport limitations and the dif culty of keeping beer for any length of time. Ale was sold in three types of premises: inns, where you also sought food and accommodation; taverns, which also sold wine; and ale-houses (Dunn 1979). And yet 90% of ale was still ‘home-brew’. One of the earlier attempts to regulate standards of quality was in Chester, where the penalty for a woman brewing bad ale was a drenching in the ducking chair (King 1947). The number of ordinances and regulations in the middle years of the second millennium that dealt with beer were nearly as many as dealt with another staple, bread (Drummond & Wilbraham 1958). In the Liber Albus of 1419 compiled by John Carpenter and Richard Whittington (of cat fame) there is mention of the ‘aleconners of the Ward’ whose job was to taste each brew and report on it to the Mayor. In Medieval times ale was associated with festivals and family events – thus there were lamb-ales, bride-ales (bridals) and so on. A bride could sell ale on her wedding day and take the proceeds (King 1947).
Beer Through History
35
Ale was sold to support Parish funds, hence at Sygatem Church in Norfolk we nd the quotation: God speed the plough And give us good ale enow… Be merry and glade With good ale this church was made. We look back to those times for the origins of terms like ‘cheers’ and ‘good health’ and diverse other ‘toasts’ (Fleming 1975). It was the custom to put a piece of toasted bread into the beer, which was passed around the guests in a ‘loving cup’. Perhaps the toast improved the avour. Finally the host received the cup, drank the remains and ate the bread.
Maintaining standards Henry VI appointed surveyors and correctors of beer-brewers (King 1947): Both the malt and hops whereof beer is made must be perfect, sound and sweet, the malt of good sound corn – to wit, of pure barley and wheat – not too dry, nor rotten, nor full of worms, called wi es, and the hops neither rotten nor old. The beer may not leave the brewery for eight days after brewing, when of cials should test it to see that it is suf ciently boiled, contained enough hops and is not sweet. Brewers of the time, though, were less than honest. In a popular play of the period, in which souls are able to escape from Hell, the Devil is allowed to keep the soul of one person as a souvenir. He chooses the brewer. In Oxford, where the University used to have its own brewery, brewers were ordered to assemble in the Church of the Blessed Virgin Mary and made individually to swear only to brew ale ‘as was good and wholesome, so far as his ability and human frailty permitted him’. The whole family drank. For instance, in 1512 the Earl of Northumberland’s household – including the 8- and 10-year-old heirs – consumed 1 quart of ale or beer each mealtime (King 1947). In the poorest of homes, ale was still the drink of the whole family. During the reign of Henry VIII [whose breakfast for three comprised a joint of roast beef, a loaf of bread and a gallon of ale (Katz 1979)] one owner of an ale brewery successfully fetched an action against his brewer for putting in ‘a certain weed called a hop’. It was decreed that neither hops nor brimstone were to be put into ale (Savage 1866). We can be thankful that hops gained ascendancy, for they seem in nitely prefer-
36
Chapter Two
able to materials such as wormwood, gentian, chicory or strychnia that were sometimes employed. Savage (1866) has the date as 1524 when hops rst came into the British Isles, from Flanders where they had been used for centuries. Prior to the arrival of hops, ale had sometimes been preserved with ground ivy. Incidentally, Henry VIII was far from being the only monarch with a passion for ale. Seemingly, Queen Elizabeth I had the local ale sampled for suitability in advance of her travels around the nation. If it failed to pass muster, then her favourite London product was shipped ahead of her in time for her arrival (Katz 1979). Concerning hops, by 1576 Henri Denham wrote: Whereas you cannot make above 8 or 9 gallons of indifferent ale out of one bushell of mault, you may draw 18 or 20 gallons of very good Beere, neither is the Hoppe more pro table to enlarge the quantity of your drinke than necessary to prolong the continuance thereof. For if your ale may endure a fortnight, your Beere through the bene t of the Hoppe shall continue a moneth, and what grace it yieldeth to the teaste, all men may judge that have sense in their mouths – here in our country ale giveth place unto Beere, and most part of our countrymen do abhore and abandon ale as a lothsome drink. Gerard wrote in 1596 that: The manifold virtues in hops do manifestly argue the wholesomeness of beere above ale, for the hops rather make it a physical drink, to keep the body in health, than an ordinary drink for the quenching of our thirste. This was one of the earliest attempts to position beer on a health-positive platform. In the sixteenth century, too, John Taylor penned: It is an Emblem of Justice, for it allowes and yeelds measure; It will put Courage into a Coward and make him swagger and ight; It is a seale to many a good Bargaine. The Physittian will commend it; the lawyer will defend it. It neither hurts, nor kils, any but those that abuse it unmeasurably and beyond bearing. It doth good to as many as take it rightly; It is as good as a paire of Spectacles to cleare the Eyesight of an old parish Clarke; And in Conclusion, it is much a nourisher of Mankinde, that if my mouth were as bigge as Bishopsgate, my Pen as long as a Maypole, and my Inke a owing spring, or a standing shpond, yet I could not with Mouth, Pen, or Inke, spak or write the true worth and worthiness of Ale.
Beer Through History
37
Houses for the sale of beer had rst become licensed in the reign of the boy king, Edward VI, in the mid-sixteenth century (Savage 1866). By an Act of 1604, it was decreed that parish constables should inspect alehouses to ensure that they were operated properly (King 1947). It was emphasised that: the ancient, true and principal use of such places was for the relief of wayfaring men and women and also to ful l the requirements of those people unable to store victuals in large quantities and not for the entertainment of lewd and idle people. No workman was allowed to spend longer than one hour in an inn unless his occupation or residence obliged him so to do. Fines of 10 shillings were collected by churchwardens and given to the poor of the parish. At the time the cost of best ale was xed at a penny a quart (one quart = two pints) and small beer at a halfpenny. Notwithstanding, the government in the middle of the seventeenth century was raising some 40% of its budget by taxing beer (Wilson 1991).
Beer: a nutritious dish for the whole family By the late seventeenth century more than 12 million barrels of beer were drunk each year in Great Britain, when the population was only some 5 million. That’s just about 2 pints per day per person. Even infants, who drank small beer, scarcely ever drank water. Although naturally there was no explanation for why it was the case, it was universally recognised that it was safer to drink beer. The boiling and the hopping were inadvertently water puri cation techniques. In the era of Charles II, a family of seven in London would drink a barrel of small beer per week, this despite a tax of six pence a barrel (two shillings and sixpence for strong beer) (Savage 1866). Tea seems rst to have arrived in Holland and Portugal in about 1610 and in Germany in the 1630s, but the rst public sale of tea in England was not until 1657 (Tannahill 1973). The rst coffeehouse in England was to be found in Oxford in 1650. Soon there were choices available for a wholesome beverage at mealtimes and it no longer needed to be alcoholic. The progressive growth in tea drinking led to brewers brewing weaker beer (small beer was now 2–3% alcohol, compared to the previous 4–5%) and having to keep lower prices (Drummond & Wilbraham 1958). Beer, though, retained a key place in the diet, and at the end of the seventeenth century the beer allowance at Christ’s Hospital school was 30 barrels per week for 407 people (Drummond & Wilbraham 1958). These authors stress the nutritive value of the beer (additional to its safety dimension when compared to water to drink). They estimate that small beer will have
38
Chapter Two
had a calori c value of around 150–200 kilocalories per pint, so 3 pints per day for a small boy will have yielded some 20–25% of his energy needs. And furthermore it will have ‘supplied a modest amount of calcium and appreciable quantities of ribo avin, nicotinic acid, pyridoxine, pantothenic acid and perhaps other vitamins’ (Drummond & Wilbraham 1958). This is not to ignore that the wholemeal bread still favoured in those days will also have supplied vitamins, including thiamine, which tends to be diminished in beer as it is readily consumed by yeast during fermentation. It is certain, however, that home-brewed beer was a good, sound, healthful drink and one which could not possibly do any harm to children when drunk in reasonable amounts. Drummond & Wilbraham (1958) Moderation, however, was not universally displayed. And so the rst laws were already in place to reduce drunkenness, including xed hours when pubs must close at night, no opening on Sundays and a limit on any drinker of one hour at a time (King 1947). In the early eighteenth century gin was developing popularity, and no licence was needed for its production, unlike beer. The duty on gin was merely tuppence per gallon (Drummond & Wilbraham 1958). By 1735 there were 5 million gin distilleries in England (King 1947). By 1750 it seems that every fourth or fth house in the slum areas of London sold gin, or something that passed for gin (Drummond & Wilbraham 1958). There were signs above doors claiming that ‘here a man may get drunk for a penny, and dead drunk for tuppence’ (Fleming 1975). Hogarth’s paintings capture the sentiments: in Beer Street people seemed jolly and healthy, whereas in Gin Street they were debauched (Fig. 2.1). One London clergyman, James Townley, was driven to write: Gin, cursed end, with fury fraught Makes human race a prey; It enters by a deadly draught, And steals our life away. Virtue and Truth, driven to despair, Its rage compels to y; But cherishes, with hellish care, Theft, murder, perjury. Damned cup, that on the vitals preys, That liquid re contains; Which madness to the heart conveys, And rolls it through the veins. Roueche (1960)
Beer Through History
39
(a) Fig. 2.1 Depictions of drinking, by William Hogarth. (a) Beer Street. (b) Gin Lane. Reproduced courtesy of Haley & Steele (www.haleysteele.com).
40
Chapter Two
(b) Fig. 2.1
(Continued.).
Beer Through History
41
There were no such verses about beer. In 1722, 33 million bushels of malt were used for brewing and annual consumption was running at a barrel of beer per head (King 1947). There was, however, great concern regarding the wholesomeness of some of the brews that were being made, leading to a book in 1738, anonymously authored, entitled The London and Country Brewer (Drummond & Wilbraham 1958). The writer claimed that it was to inform a public who had long ‘suffered great prejudices from unwholesome and unpleasant beers and ales, by the badness of malts, underboiling of worts, mixing of injurious ingredients, the unskilfulness of brewers’. Reference was made to the use of the seeds of a poisonous berry (Cocculus indicus) to afford bitterness and a ‘heady’ character. Coriander seeds and capsicum (red pepper) were used variously to give avour or ‘bite’ to thin beers or ones that had ‘turned’. Tobacco and liquorice were not unheard of in the context of beer, despite an Act of Parliament in the reign of George III that prohibited many adulterants. The brewer’s concerns with the beer souring, however, were very real. The London and Country Brewer described the use of ‘balls’ to preserve beer in casks, such balls comprising alabaster or marble, oyster shells, chalk, horse-bean our, red saunders, grains of paradise, Florentine orrice-root, coriander seeds, cloves, hops, isinglass and treacle. According to Drummond and Wilbraham (1958), …the marble, shells and chalk served to neutralise acidity as it developed, the bean- our and isinglass helped to ‘ ne’ the beer, carrying down impurities to form a sludge at the bottom of the cask, while the coriander, orris-root, cloves etc imparted a avour which would help mask the earthy taste caused by the addition of so much lime. The same authors observe, though, that the treatment tended to make beer go at, leading in turn to the addition of ‘headings’ to promote foaming. A popular treatment was iron sulphate, which produced a ‘head like a colly ower’. Twenty- rst-century beer drinkers should be relieved that none of these practices prevails, save for the use in some quarters of the entirely wholesome isinglass nings (see Chapter 3). Towards the end of the eighteenth century, the impact of taxation and increasing imports of tea and coffee saw a change in domestic drinking habits – tea instead of ale for breakfast.
42
Chapter Two
Temperance pressures In the closing years of the eighteenth century less beer was brewed at home, with major brewing companies being spawned to supply beer to the millions employed in the newly developing industries. Only country folk retained their brewing traditions. The development of roads and railways provided distribution systems for the big brewers. By 1810, there were 48,000 alehouses for some 8 million people in Britain (King 1947). Captains of industry were perturbed about wages being ‘wasted’ on excess drinking. This led to a tightening of licensing laws and many counties declared that public houses should be closed at 9 PM in winter and 10 PM in summer. Some were not satis ed even with that and the temperance movement developed. The rst pledge of ‘teetotalism’ was signed in Preston in 1832 (King 1947). [The word teetotal is said to have originated in an English temperance meeting, when a stammering man said ‘We can’t keep ‘em sober unless we have the pledge total. Yes, Mr Chairman, tee-tee-total’ (Fleming 1975).] However, there were those who championed the merits of consuming beer. Savage (1866) wrote in the United States (where beer was very much the drink of moderation as compared to the much more prevalent distilled concoctions) that: The most useful temperance lecturer is he who advocates the temperate use of beverages which custom has sanctioned and which … man will have. A reform may, and we trust will be effected in favour of healthful and comparatively mild drinks; but it is more than doubtful if hard working, energetic and withal social people, such as form the bone and sinew of the Republic, will or can be induced to give up all drink which custom, and the large majority of clergymen and physicians, have sanctioned as refreshing. Savage reminded the reader that in Bavaria at the time the average frugally drinking labourer consumed a gallon per day. With reference to England, Savage championed beer thus: With an impartial catholicity of palate the votary of the amber ale loves to see its ‘beaded bubbles winking at the brim’ and yet is never forgetful of the darker charms possessed by porter or stout. Boating men … cricketers, and the whole of the manly English sporting community, are sensible alike to the charms of the long, thin, narrow glass, the simple and unassuming tumbler, and the thorough going pewter pot. The prudent and industrious mechanic prefers the wholesome brew of native malt and hops to the ery foreign distillations that madden the brain and shatter the nerves. The statistics of beer drinking are simply stupendous. Mr. Gladstone … computed that every adult male in England consumed the astounding quantity
Beer Through History
43
of six hundred quarts per annum. Despite all the arguments and invectives of the agitators who advocate what is paradoxically described as a ‘permissive bill’, on account of its prohibitory character, we adhere to our faith that sound honest malt liquor does far more good than harm; nor should we dream of opposing any system of nancial legislation which would make it cheaper without in icting an extra burden upon the community. And the beer strength in England at the time was formidable (Dunn 1979). In 1843 Burton Ale had original gravities between 1077 (19.25°P) and 1120 (30°P), while Common Ale was 1073 (18.25°P) and Porter 1050 (12.5°P) (see Chapter 3 for de nitions of beer strength). Early nineteenth-century diets, though, retained beer as an integral feature, indeed the recommended ‘family economy’ for ‘moderate persons in a frugal family’ for 1826 comprised (per person, per week): 6 pounds meat (undressed) 4 pounds bread (quartern loaf) 0.5 pounds butter 2 ounces tea 0.5 pound sugar 1 pint per day of beer (Porter) Drummond & Wilbraham (1958) The same authors cite a range of typical diets through the ages, reproduced in Table 2.1, and their estimated nutritive value is given in Table 2.2. Table 2.1 Diets through history in England. Diet 1
Diet 2
Diet 3
Diet 4
Diet 5
15th-century meateating classes (per day)
Sailor’s diet, 1615 (per day)
St Bartholomew’s Hospital, 1687 (per day)
Navy ration, 1745 (per week)
Navy ration, 1811 (per day)
cheese, 12 ounces salt beef, 4 pounds salt pork, 2 pounds butter, 8 ounces biscuit, 7 pounds oatmeal, 2.5 pounds pease, 2 pints beer, 7 gallons
cheese, 1.75 ounces beef, 4.5 ounces pork, 2.25 ounces butter, 0.9 ounce suet, 0.25 ounce sugar, 0.9 ounce bread, 1 pound our, 3 ounces beer, 2 pints
cheese, 4 ounces meat, 1.5 pounds herring, 6 ounces fat, 1 ounce bread, 1 pound wine, 1 pint ale, 2 pints
cheese, 8 ounces bacon, 4 ounces butter, 4 ounces biscuit, 1 pound oatmeal, 3 ounces beer, 8 pints
cheese, 1.5 ounces milk pottage, 1 pint beef or mutton, 4 ounces broth, 1 pint butter, 1 ounce bread, 10 ounces beer, 3 pints
Source: based on Drummond & Wilbraham (1958).
44
Chapter Two
Table 2.2 Estimated nutritive value of the diets listed in Table 2.1 (and the 1826 diet referred to in the text).
Energy (kcal) Protein (g) Fat (g) Calcium (mg) Phosphorus (g) Iron (mg) Vitamin A (i.u.) Thiamine (mg) Ribo avin (mg) Nicotinic acid (mg) Vitamin C (mg)† Vitamin D (i.u.)
Diet 1
Diet 2
Diet 3
Diet 4
Diet 5
1826 diet
Requirement*
4750 200 190 1.3 4.2 39 2800 1.5 3.7 68 ? 950
5800 150 250 2.6 3.7 24 6350 1.9 3.9 84 ? 100
2350 70 80 0.9 1.7 14 3200 1.1 1.7 40 ? 25
5500 160 180 1.9 3.7 36 1750 2.6 4.0 100 ? 26
2900 80 100 0.7 1.9 18 1450 1.6 1.5 46 ? 22
2050 70 120 0.1 1.2 18 1150 0.8 1.3 28 0 19
2550 63 a 800 0.8 10 1 mg 1.5 1.7 19 60 5 µg
*Requirement for adult male, aged 25–50, according to the Food and Nutrition Board, National Academy of Sciences and British Nutrition Foundation. †Uncertain due to dif culty of estimating vegetable consumption and heat-dependent losses in cooking. a For a diet containing alcohol, it is recommended that the total dietary energy should be 47% as carbohydrate, 33% as fat and 15% as protein.
Table 2.3 Expenditure on foodstuffs, 1881. Item
Expenditure per head per day (pence)
Bread Potatoes Vegetables Meat Fish Butter and cheese Milk and eggs Fruit etc Sugar Tea Coffee etc Beer Spirits Wines Total
0.59 0.27 0.14 0.79 0.11 0.28 0.33 0.08 0.21 0.12 0.02 0.59 0.32 0.07 3.92
Source: British Association for the Advancement of Science (1981). Values converted to decimal pence from the old shillings and pence.
In 1881 it was estimated that expenditure on beer in the average household was one of the three major outlays (Table 2.3) (Burnett 1966). The development of teetotalism and the push for prohibition was moving apace in the late nineteenth century, featuring among others the Salvation Army. It was even suggested in 1903 that alcoholic drinks should only be taken with meals. Balance this
Beer Through History
45
with the acceptance in the medical profession even then that alcohol had real merits. Before ether was discovered in 1846, alcohol was used to dull pain (Fleming 1975). In 1900, the distinguished physician Sir William Osler referred to alcohol as ‘our most valuable medicinal agent’. In those days whisky, beer and brandy were stocked on the medicine shelves as ‘stimulants’. Meanwhile over a period of many years there was much debate and development in the area of licensing, primarily on account of concerns about the numbers of public houses. The Licensing Bill introduced in 1908 ruled that there could be one licence for every 400 persons for areas with populations averaging two individuals per acre; one for every 500 when the population was 2–25 per acre; and up to one per 1000 people when the population averaged 200 to the acre. The Great War of 1914–18 led to fresh concerns about excessive drinking and its impact on the war effort. Lloyd George claimed: ‘Drink is doing us more damage in the war than all the German submarines put together.’ However, a bill proposing a doubling of the tax on alcohol was not passed (King 1947). In World War II, also, formidable voices in the UK government urged a ban on alcohol, so as to divert raw materials to food production. Fortunately, rational minds applied logic to the situation (which seems seldom to be the case unfortunately when it comes to matters to do with alcohol): it was calculated that if the beer supply was halved and the barley thus saved diverted to chicken food, the net bene t would have been one egg per month in people’s ration – and huge public discontent (King 1947).
Towards prohibition The most famed instance of prohibition was of course the United States between 1920 and 1933. In the earliest days of that country everyone generally held that the human could not survive without alcohol (Fleming 1975 – from which reference I have sourced much of what follows in this section). As Fleming puts it: Men and women, old and young, rich and poor, regularly started the day with a morning dram. The drink might be anything from cherry brandy to wine mixed with sugar and water, as long as it contained alcohol. A daily glass of ‘bitters’ was considered essential for warding off disease, clearing the head, and keeping the heart in good working order. Shopkeepers had barrels of rum on tap for customers (rather like a bank might have a pot of coffee on the go today). Labourers had a mid-morning break for ‘bitters’. Jugs of rum were in the elds for agricultural workers. Note that the liquids provided were spirits, not the gentle (by comparison) beer.
46
Chapter Two
It was Dr Benjamin Rush, a signatory to the Declaration of Independence, who in 1784 penned An inquiry into the effects of spiritous liquors on the human mind and body, and who argued that ‘ardent spirits’ caused inter alia obstruction of the liver, jaundice, hoarseness, diabetes, jaundice, gout, epilepsy, madness and ‘frequent and disgusting belchings’. There were plenty of people prepared to buy into his argument. And so a group of Connecticut businessmen stopped making rum available to their employees, replacing it with cider and beer. And in New York State in 1808 the Union Temperance Society was founded. Beer was ‘in’, but the 44 members pledged to ‘use no rum, gin, whisky, wine or any distilled spirits … except by the advice of a physician, or in case of actual disease, also excepting wine at public dinners’. A number of other such societies sprang up, arguing for moderation rather than abstinence. President Thomas Jefferson wrote to a friend in 1815 about beer: ‘I wish to see this beverage become common instead of the whiskey which kills one third of our citizens and ruins their families’. As Divine et al. (1987) put it: The temperance movement was directed at a real social evil, more serious in many ways than the drug problems of today. Since the Revolution, whiskey had become the most popular American beverage. Made from corn by individual farmers or, by the 1820s, in commercial distilleries, it was cheaper than milk or beer and safer than water (which was often contaminated). Hard liquor was frequently consumed with food as a table beverage, even at breakfast and children sometimes imbibed along with adults. Per capita annual consumption of distilled spirits in the 1820s was almost triple what it is today, and alcoholism had reached epidemic proportions. A Presbyterian minister, the father of Harriet Beecher Stowe (author of Uncle Tom’s Cabin), became a particularly vocal opponent of alcohol in all its manifestations. The Reverend Lyman Beecher implored his congregation to join his crusade to rid the country of ‘rum-selling, tippling folk, in dels and ruff-scruff’. His sermons were distributed nation-wide, with the impact that employers stopped giving drinks to their workforce and liquor rations ceased in the US Army. Beecher’s American Temperance Union (ATU) sought to persuade every state to ban the production and sale of alcohol. At rst beer was accepted within the ATU, but that too fell foul of the zealots in 1836. The impact was a decline in membership. So many people realised the facts: it was hard spirits that were leading too many astray, not beer. The ght against alcohol became easier in 1833 when the US Supreme Court ruled that state governments could regulate the liquor trade within their boundaries. Furthermore it permitted ‘local option’, in which individual counties and towns could introduce prohibition if they so wished. First off the blocks was Massachusetts in 1838, with the banning of sales of spirits in quantities less than 15 gallons. It didn’t last long
Beer Through History
47
– customers bought 15 gallons plus a gill, drank the latter and then returned the balance. Maine introduced total prohibition in 1851, causing Lyman Beecher to exclaim: ‘The glorious Maine law is a square and grand blow right between the horns of the Devil.’ Soon thirteen more states had joined Maine, but nine soon repealed the laws or declared them unconstitutional. Only Maine, Kansas and North Dakota held rm – and in each there were bootleggers and illicit taverns (‘blind pigs’). By 1872 a political body, the Prohibition Party, had come into being and nominated James Black to run for President. He lost – and so have many other prohibition candidates since. Their best performance in the polls was 271,000 votes in 1892. The Party is still in existence (see http://www.prohibition.org/), and they observe that they are ‘the oldest “third party” in the United States’. We might note their other stated ‘values’ include being anti-commercial gambling, against the homosexual agenda, preservation of US sovereignty and concerns about the United Nations and about international trade agreements. Back to the late nineteenth century. Women soon led the charge against alcohol. One slogan was: We do not think we’ll ever drink Whiskey or gin, brandy or rum Or anything that’ll make drunk come. Not classic verse – but at least no mention of beer. The Women’s Christian Temperance Union had prominent members, including the First Lady, Mrs Rutherford B. Hayes (‘Lemonade Lucy’). And they warmly embraced the redoubtable Carry Nation, who declared ‘hatchetation’ in smashing up illicit taverns in her home state of Kansas and beyond, and set off on an enthusiastically received lecture tour in which hatchets could be bought as souvenirs. They do say that no publicity is bad publicity and soon liquor producers were marketing Carry Nation cocktails and bars were decorated with hatchets and signs that declared ‘All Nations welcome but Carry.’ Carry Nation was probably emotionally disturbed for much of her life (Fleming 1975) and the most successful pro-prohibition lobby, the Anti-Saloon League originating in a Congregational Church in Ohio, ignored her. The tactics of this body were more subtle and low key, progressively persuading towns and counties to embrace prohibition. Soon they were successful at the state level: Georgia, Oklahoma and then half a dozen more fell into line. In 1913, after 20 years of existence, the Anti-Saloon League marched on Washington DC with a slogan ‘A Saloonless Nation in 1920’. Several supporters were elected to Congress. The 65th Congress, convening in March 1917, soon declared war on Germany following the sinking of the Lusitania. This demanded laws that would ensure that the
48
Chapter Two
US was in t state to ght a war, including legislation concerning the production and distribution of food. A clause was inserted that outlawed the production and sale of alcoholic beverages, so that grain could be conserved. There was disagreement from the opponents of prohibition, and there was agreement to let the Senate vote on a separate resolution calling for a prohibition amendment to the Constitution. Astonishing to many, but the Eighteenth Amendment went speedily through Congress and it was rati ed by 36 State legislatures in little more than a year. Only Rhode Island and Connecticut held out on ratifying the amendment. The amendment was of cially adopted on 16 January 1919, with national prohibition being effected one year later. It’s perhaps not altogether strange that to deny people something that the majority enjoy and don’t abuse will inevitably prove unsuccessful. In New York before prohibition there were 15,000 bars. After prohibition there were 32,000 speakeasies. Women and youngsters now decided that drinking was something they perhaps should entertain, having not bothered much before. Booze was coming in illicitly from Canada and Mexico and by ship from Cuba, the West Indies and Europe. And there was the illicitly brewed stuff in the States, much of it dangerous through a lack of regulation. There was plenty of corruption at high level and of course the making of some infamous criminal reputations among the gangsters. Bootleggers collected $2 billion annually, amounting to some 2% of the gross national product (Divine et al. 1987). Bodies quickly sprang up, seeking to repeal the Volstead Act, including the Moderation League. In 1930 the American Bar Association adopted a resolution that called for a repeal of Volstead. They were supported by the Women’s Organization for National Prohibition Reform. Those advocating ‘dryness’ were at risk of being perceived as defending the gangster culture. By the early 1930s the nation was in the midst of the Great Depression. Many argued that it had been brought on by prohibition and that to repeal the Act would be to create jobs and put much needed taxation income into the exchequer. The 1932 presidential campaign was in substantial part fought on the alcohol issue. Herbert Hoover said that prohibition had been an ‘experiment noble in purpose’ and he promised to do what he could to correct whatever shortcomings there were. Franklin Delano Roosevelt went a major step further: ‘I promise you that from this date on the Eighteenth Amendment is doomed.’ Roosevelt was elected and nine days later he asked Congress to amend the Volstead Act so that the alcohol content of beer could be raised from 0.5% to 3.2% by weight. The law was passed. As he sat down to his evening meal on 12 March 1933, Roosevelt is quoted as saying: ‘I think this would be a good time for a beer’ (Barone 1990).
3
The Basics of Malting and Brewing: Product Safety and Wholesomeness
The fundamental shape of the processes by which beer is made has not changed for many generations [see Bamforth (2003) for a general introduction and overview, and a full glossary of brewing terms]. However, the control and predictability of those processes has improved. Beer nowadays is invariably a highly consistent consumable, closely controlled for the ef ciency of its production and its safety. There is little that is hit-and-miss about the making of beer. Despite its reliance on agricultural products (barley, sometimes other cereals, and hops) the understanding of the process means that seasonal and regional vagaries can be overcome such that the taste, appearance and composition of a beer are generally consistent from batch to batch. There is no such thing as a vintage in brewing. Accordingly, the customer should realise as they explore their local supermarket shelves that one of the most consistent and reliable products to be had is the beer. It is also one of the safest, as we shall see.
Chemical beer? The brewing of beer is complicated. The vast majority of beers comprise at least 90% water, with ethanol (it is customary to use ‘alcohol’ synonymously for this one alcohol – although there are other alcohols in beer) and carbon dioxide being quantitatively the next major individual components (Table 3.1). Beers also contain a wide range of chemical species in relatively small quantities that determine the properties of the beer in respect of appearance and avour. Malting and brewing are processes designed to maximise the extraction and digestion of starch and protein from barley, yielding a highly fermentable extract that is known as wort. The processes are also designed to eliminate materials that can have an adverse effect on beer quality, such as the haze-forming polyphenol from barley and hops and the lipids and oxygen that, together, can cause beer to stale. Malting and brewing within all companies, large and small, are very traditional processes. Relatively few chemicals are added to beer (or to the process) as opposed to being derived from its raw materials. In some markets (but by no means all) propylene glycol alginate is used as a foam stabiliser (Bennett 1993) and sulphur dioxide
50
Chapter Three
Table 3.1 Composition of an all-malt Pilsen beer (ca. 12° Plato). Component
Content (in mg/L unless otherwise indicated)†
Original extract Alcohol ‘Real extract’ Water Carbon dioxide Total carbohydrate Glucose Fructose Sucrose Maltose Maltotriose Maltotetraose Maltopentaose Maltohexaose Maltoheptaose Maltooctaose Maltononaose Maltodecaose Maltoundecaose Maltododecaose Maltotridecaose Maltotetradecaose Maltopentadecaose Maltohexadecaose Maltohepatdecaose Maltooctadecaose Higher dextrins Pentosans β-Glucans Proteins Low molecular weight N componds Medium molecular weight N componds High molecular weight N componds Histidine Isoleucine Leucine Lysine Methionine Phenylalanine Threonine Tryptophan Valine Arginine Proline Aspartic acid Serine γ-aminobutyric acid Glutamic acid Glycine Alanine Tyrosine Cysteine
11.8 g/100g 3.93 g/100g 4.15 g/100g 919 g/L 5 g/ L 28 g/L 150 30 5 1430 1930 3360 1330 1150 1090 1220 1590 1750 920 640 760 1020 880 950 800 1130 5490 60 350 5 g/L 185 83 26 36 34 55 16 2 77 5 20 73 72 357 28 19 73 40 31 103 76 12
(Continued.)
The Basics of Malting and Brewing
Table 3.1 (Continued.) Component
Content (in mg/L unless otherwise indicated)†
Cystine Potassium Sodium Calcium Magnesium Phosphorus Copper Iron Manganese Zinc Silicon Sulphate Chloride Nitrate Thiamine Ribo avin Pyridoxin Pantothenic acid Niacin Biotin Vitamin B12 Folic acid Meso-inositol Choline Total polyphenols Anthocyanogens Catechin Epicatechin Rutin Quercetin Chlorogenic acid Caffeic acid Quinic acid p-Coumaric acid Ferulic acid Sinapic acid Kampferol Myricetin Gallic acid p-Hydroxybenzoic acid Isohumulones* Sulphur dioxide Putrescine Tyramine Histamine Purines Pyrimidines
6 493 30 34 107 308 0.07 0.09 0.17 0.06 107 176 179 23 33 µg/L 410 µg/L 650 µg/L 1632 µg/L 7875 µg/L 13 µg/L 0.1 µg/L 82 µg/L 10.1 18.1 172 46 5–55 9–24 1–6 5–125 2–20 2–20 1–5 1–7 2–21 1–20 5–20 1 5–29 5–20 10–40 3.7 130 µg/L 1.69 315 µg/L 134 144
Source: based on Moll (1994). *Diverse closely related molecules are present, many of them being oxidation products. †The balance is made up of organic acids (e.g. citric, acetic, malic, etc.) and various other fermentation secondary products (e.g. glycerol, propanol, ethyl acetate, iso-amyl acetate). These various components are much more signi cant for avour than wholesomeness.
51
52
Chapter Three
or ascorbic acid (vitamin C) might be added to counter staling (Postel 1972). There is close regulation concerning the materials that are permitted. For example, in the US this is through the Food and Drug Administration (http://www.fda.gov/). However, the vast majority of the chemical constituents of beer are derived either directly from the malted barley, adjuncts, water and hops, or are produced through the metabolism of yeast during the alcoholic fermentation. In some markets, notably Germany within the German purity law of 1516 (the Reinheitsgebot), the raw materials for the production of beer are entirely restricted to malted barley, hops, yeast and water. All raw materials of malting and brewing are subject to intense scrutiny by maltsters and brewers. The main raw materials of course are barley, hops and water.
Barley Speci c malting varieties of barley (Fig. 3.1) are employed for beer production, characterised by their high yield of fermentable material that is readily obtainable from the stored starch (Table 3.2). Farmers are obliged to avoid excessive use of fertilisers, for fear of boosting the protein content of the barley – high protein means low starch, which in turn means low levels of fermentable sugar. Farmers are also obliged to be sparing with the use of pesticides and to use only those that are approved. However, in
Fig. 3.1
Barley in the field. The brewer produces beer from the grain.
The Basics of Malting and Brewing
53
Table 3.2 Composition of barley. Component
% of total dry weight
Carbohydrates Starch Sucrose Other sugars Water-soluble polysaccharides Alkali-soluble polysaccharides Cellulose Lipid Protein Albumins and globulins Hordeins Glutelins Nucleic acids Minerals Other
78–83 63–65 1–2 1 1–1.5 8–10 4–5 2–3 10–12 3.5 3–4 3–4 0.2–0.3 2 5–6
Source: data derived from Harris (1962).
common with other crops, barley is susceptible to a range of infections and infestations (Briggs 1978). Aflatoxins originate from some members of the genus Aspergillus, namely Aspergillus avus, A. parasiticus, A. nomius and A. ochraceoreseus (Moss 2003). (It will be noted that these don’t include the strains such as A. oryzae that have a role in the production of alcoholic beverages such as sake or as a source of exogenous enzymes for brewers.) The most commonly a atoxin-contaminated foods are corn (maize) and peanuts, but all cereals may be affected. Infection is most commonly associated with post-harvest spoilage, when storage is under inapproporiate conditions of temperature and moisture. Pesticides have real value in this context. Nonetheless there has been in-depth investigation of alternative ways of treating grain, particularly during storage, such that it does not develop infection. These studies have included the use of anaerobic storage (Baxter & Dawe 1990). Where pesticides are used much will be largely washed off the surface of the grain during steeping (Miyake et al. 2002). It must be emphasised that authorities in most countries have regulations and systems for controlling the nature of pesticides that may be used, and those pesticides have been widely screened for their environmental and health impacts. Any perceived risks of using them are grossly outweighed by the very real problem that can accrue in any cereal from contamination with those micro ora capable of producing mycotoxins and ochratoxins (Petzinger & Weidenbach 2002). One such substance is deoxynivalenol (DON), which is produced by the fungus Fusarium (Wolf-Hall & Schwarz 2002). Brewers (and therefore maltsters) set rigorous standards for the level of DON in barley
54
Chapter Three
and malt, and will not use grain that contains it. Fusarium infection is a bigger risk in wetter climates. Thus it was virtually unheard of in North America until the mid-1990s, when a substantial problem was encountered. The reason was a movement away from the burning of straw stubble after grain had been harvested. This burning, outlawed for supposed environmental damage, had served the valuable function of destroying Fusarium spores. Once burning was banned, it meant that the Fusarium was enriched in the soil and readily available to spoil crops the subsequent year. Woller and Marjerus (1982) and Marjerus and Woller (1983) failed to detect any mycotoxins in a diversity of beers (detection limit 1–2 µg/L). It is not impossible to nd nite levels of mycotoxins – see for example Payen et al. (1983). However, provided all parties adhere to the strictest standards of hygiene from eld to glass, and the grain is maintained under the appropriately low levels of moisture and temperature, then this is not an issue.
Hops The number of brewers employing whole hops (Fig. 3.2) is dwindling, with many using processed forms such as pellets or extracts made with liquid carbon dioxide. In any event, quantitatively the hop affords a minor fraction of the overall composition of beer, albeit a very important one in terms of quality. As we shall see, hops also offer intriguing possibilities from a health perspective.
Fig. 3.2
Hops. Reproduced courtesy of Yakima Chief Inc. (www.yakimachief.com).
The Basics of Malting and Brewing
55
Hops, perhaps even more so than barley, are prone to disease and infestation (Neve 1991). Accordingly they almost invariably demand some form of protection during their cultivation, with the same considerations as given above for barley. The gross composition of hops is shown in Table 3.3. One advantage to the use of extracts of hops is that they have a somewhat lower nitrate content than the parent plant, nitrate presenting a potential cancer risk by comprising a precursor of nitrite. Even so, the contribution of nitrate to the daily human intake coming from any form of hops (or indeed beer) is extremely low in comparison to other sources.
Water As the vast majority of beers are more than 90% water, its composition is of critical concern to the brewer. Any water that will end up in the beer or that will be in contact with tanks, pipes, etc. through which the process stream passes, must be of the highest chemical and microbiological quality. The water must ful l all legal requirements both chemically and microbiologically as well as satisfy the brewer’s standards for clarity and lack of colour, taste and smell. Most, if not all, countries have their regulations concerning the quality of water. In the UK water quality is in the province of the Department for Environment, Food and Rural Affairs (http://www.defra.gov.uk/environment/ water/index.htm). In the US potable water must satisfy the National Primary Drinking Water Regulations established by the Environmental Protection Agency (Table 3.4). Additionally there are National Secondary Drinking Water Regulations (Table 3.5). The latter are non-enforceable guidelines (though states may choose to adopt them as enforceable standards) regulating contaminants that may cause cosmetic effects (such as skin or tooth discolouration) or aesthetic effects (such as taste, odour or colour). The World Health Organization publishes Guidelines for Drinking Water Quality (http: //www.who.int/water_sanitation_health/). Table 3.3 Composition of hops. Component
% of total dry weight
Resins Essential oils Tannins Monosaccharides Pectin Amino acids Proteins Lipids and wax Ash Cellulose, lignin, etc.
17 0.6 4.5 2.5 2.5 < 0.2 17 3.5 1 45
Source: based on Hough et al. (1982).
zero
Viruses (enteric)
Bromate Chlorite Haloacetic acids (HAAs) Total trihalomethanes (TTHMs)
Contaminant
0.010 1.0 0.060
0.10; 0.080
none7; n/a6
MCL or TT1 (mg/L)2
zero 0.8 n/a6
MCLG1 (mg/L)2
Disinfection byproducts
TT3
n/a
TT3
TT3 5.0%4
zero zero
Legionella Total coliforms (including faecal coliforms and E. coli) Turbidity
TT TT3 TT3
3
MCL or TT1 (mg/L)2
zero zero n/a
MCLG1 (mg/L)2
Cryptosporidium Giardia lamblia Heterotrophic plate count
Contaminant
Microorganisms
Liver, kidney or central nervous system problems; increased risk of cancer
Increased risk of cancer Anemia; infants and young children: nervous system effects Increased risk of cancer
Potential health effects from ingestion of water
Turbidity is a measure of the cloudiness of water. It is used to indicate water quality and ltration effectiveness (e.g. whether disease-causing organisms are present). Higher turbidity levels are often associated with higher levels of disease-causing microorganisms such as viruses, parasites and some bacteria. These organisms can cause symptoms such as nausea, cramps, diarrhoea, and associated headaches Gastrointestinal illness (e.g. diarrhoea, vomiting, cramps)
Gastrointestinal illness (e.g. diarrhoea, vomiting, cramps) Gastrointestinal illness (e.g. diarrhoea, vomiting, cramps) HPC has no health effects; it is an analytic method used to measure the variety of bacteria that are common in water. The lower the concentration of bacteria in drinking water, the better maintained the water system is Legionnaire’s disease, a type of pneumonia Not a health threat in itself, it is used to indicate whether other potentially harmful bacteria may be present5
Potential health effects from ingestion of water
Byproduct of drinking water disinfection
Byproduct of drinking water disinfection Byproduct of drinking water disinfection Byproduct of drinking water disinfection
Sources of contaminant in drinking water
Human and animal faecal waste
Soil runoff
Found naturally in water; multiplies in heating systems Coliforms are naturally present in the environment; as well as faeces; faecal coliforms and E. coli only come from human and animal faecal waste.
Human and animal faecal waste Human and animal faecal waste HPC measures a range of bacteria that are naturally present in the environment
Sources of contaminant in drinking water
Table 3.4 National Primary Drinking Water Regulations, United States (as from http://www.epa.gov/safewater/mcl.html#mcls). 56 Chapter Three
1
MRDL=4.0
MRDL1 (mg/L)2
0.010 as of 23 Jan 06 7 MFL
07
7 million bres per litre 2
0.004
0.005
Arsenic
Asbestos ( bre >10 µm)
Beryllium
Cadmium
0.005
0.004
2
0.006
0.006
Antimony
MCL or TT1 (mg/L)2
MCLG1 (mg/L)2
Barium
1
MRDL=4.01 MRDLG=41 MRDLG=0.81 MRDL=0.81
MRDLG=4
MRDL1 (mg/L)2
Contaminant
Inorganic chemicals
Chloramines (as Cl2) Chlorine (as Cl2) Chlorine dioxide (as ClO2)
Contaminant
Disinfectants
Kidney damage
Intestinal lesions
Increase in blood pressure
Skin damage or problems with circulatory systems, and may have increased risk of getting cancer Increased risk of developing benign intestinal polyps
Increase in blood cholesterol; decrease in blood sugar
Potential health effects from ingestion of water
Eye/nose irritation; stomach discomfort Anaemia; infants and young children: nervous system effects
Eye/nose irritation; stomach discomfort, anaemia
Potential health effects from ingestion of water
(Continued.)
Discharge of drilling wastes; discharge from metal re neries; erosion of natural deposits Discharge from metal re neries and coal-burning factories; discharge from electrical, aerospace, and defence industries Corrosion of galvanised pipes; erosion of natural deposits; discharge from metal re neries; runoff from waste batteries and paints
Discharge from petroleum re neries; re retardants; ceramics; electronics; solder Erosion of natural deposits; runoff from orchards, runoff from glass and electronics production wastes Decay of asbestos cement in water mains; erosion of natural deposits
Sources of contaminant in drinking water
Water additive used to control microbes Water additive used to control microbes
Water additive used to control microbes
Sources of contaminant in drinking water
The Basics of Malting and Brewing 57
0.0005
Thallium
10
10
0.05
0.002
0.002
Mercury (inorganic) Nitrate (measured as nitrogen)
Selenium
TT8; action level=0.015
zero
Lead
1
Infants and children: delays in physical or mental development; children could show slight de cits in attention span and learning abilities. Adults: kidney problems; high blood pressure Kidney damage
4.0
4.0
Nitrite (measured as nitrogen)
Bone disease (pain and tenderness of the bones); children may get mottled teeth
0.2
0.2
Cyanide (as free cyanide) Fluoride
0.002
0.05
1
Infants below the age of 6 months who drink water containing nitrate in excess of the MCL could become seriously ill and, if untreated, may die. Symptoms include shortness of breath and blue-baby syndrome Infants below the age of 6 months who drink water containing nitrite in excess of the MCL could become seriously ill and, if untreated, may die. Symptoms include shortness of breath and blue-baby syndrome Hair or ngernail loss; numbness in ngers or toes; circulatory problems Hair loss; changes in blood; kidney, intestine, or liver problems
Short-term exposure: gastrointestinal distress. Long-term exposure: liver or kidney damage. People with Wilson’s disease should consult their personal doctor if the amount of copper in their water exceeds the action level Nerve damage or thyroid problems
TT8; action level=1.3
1.3
Copper
Allergic dermatitis
0.1
0.1
Potential health effects from ingestion of water
Chromium (total)
MCL or TT1 (mg/L)2
MCLG1 (mg/L)2
Contaminant
Inorganic chemicals (continued)
Table 3.4 (Continued.)
Discharge from petroleum re neries; erosion of natural deposits; discharge from mines Leaching from ore-processing sites; discharge from electronics, glass, and drug factories
Runoff from fertiliser use; leaching from septic tanks, sewage; erosion of natural deposits
Erosion of natural deposits; discharge from re neries and factories; runoff from land lls and croplands Runoff from fertiliser use; leaching from septic tanks, sewage; erosion of natural deposits
Discharge from steel/metal factories; discharge from plastic and fertiliser factories Water additive which promotes strong teeth; erosion of natural deposits; discharge from fertiliser and aluminium factories Corrosion of household plumbing systems; erosion of natural deposits
Discharge from steel and pulp mills; erosion of natural deposits Corrosion of household plumbing systems; erosion of natural deposits
Sources of contaminant in drinking water
58 Chapter Three
0.0002
0.04
0.07 0.2 0.0002
0.6 0.075 0.005 0.007
0.07
0.1
0.005 0.005
0.4
zero zero
0.003 zero
zero
0.04
zero
zero 0.1
0.07 0.2 zero
0.6 0.075 zero 0.007
0.07
0.1
zero zero
0.4
Atrazine Benzene
Benzo(a)pyrene (PAHs) Carbofuran
Carbon tetrachloride
Chlordane Chlorobenzene
2,4-D Dalapon 1,2-Dibromo-3chloropropane (DBCP) o-Dichlorobenzene p-Dichlorobenzene 1,2-Dichloroethane 1,1Dichloroethylene cis-1,2Dichloroethylene trans-1,2Dichloroethylene Dichloromethane 1,2Dichloropropane Di(2-ethylhexyl) adipate
0.002 0.1
0.005
0.003 0.005
TT 0.002
9
Acrylamide Alachlor
MCL or TT1 (mg/L)2
MCLG1 (mg/L)2
Contaminant
Organic chemicals
Weight loss, liver problems, or possible reproductive dif culties
Liver problems; increased risk of cancer Increased risk of cancer
Liver problems
Liver problems
Liver, kidney, or circulatory system problems Anaemia; liver, kidney or spleen damage; changes in blood Increased risk of cancer Liver problems
Kidney, liver, or adrenal gland problems Minor kidney changes Reproductive dif culties; increased risk of cancer
Liver or nervous system problems; increased risk of cancer Liver or kidney problems
Problems with blood, nervous system, or reproductive system Liver problems; increased risk of cancer
Nervous system or blood problems; increased risk of cancer Eye, liver, kidney or spleen problems; anaemia; increased risk of cancer Cardiovascular system or reproductive problems Anaemia; decrease in blood platelets; increased risk of cancer Reproductive dif culties; increased risk of cancer
Potential health effects from ingestion of water
Discharge from chemical factories
(Continued.)
Discharge from drug and chemical factories Discharge from industrial chemical factories
Discharge from industrial chemical factories
Discharge from industrial chemical factories
Discharge from industrial chemical factories Discharge from industrial chemical factories Discharge from industrial chemical factories Discharge from industrial chemical factories
Discharge from chemical plants and other industrial activities Residue of banned termiticide Discharge from chemical and agricultural chemical factories Runoff from herbicide used on row crops Runoff from herbicide used on rights of way Runoff/leaching from soil fumigant used on soybeans, cotton, pineapples, and orchards
Runoff from herbicide used on row crops Discharge from factories; leaching from gas storage tanks and land lls Leaching from linings of water storage tanks and distribution lines Leaching of soil fumigant used on rice and alfalfa
Added to water during sewage/wastewater treatment Runoff from herbicide used on row crops
Sources of contaminant in drinking water
The Basics of Malting and Brewing 59
0.007 0.00000003
0.02 0.1 0.002 TT9
0.05
0.0002
0.007 zero
0.02 0.1 0.002 zero
0.7 zero
0.7 zero zero zero
0.05
0.0002
0.04
0.2
zero
zero 0.5 0.004 0.1
Ethylbenzene Ethylene dibromide
Glyphosate Heptachlor Heptachlor epoxide Hexachlorobenzene
Hexachlorocyclopentadiene Lindane
Methoxychlor
Oxamyl (Vydate)
Polychlorinated biphenyls (PCBs)
Pentachlorophenol Picloram Simazine Styrene
0.001 0.5 0.004 0.1
0.0005
0.2
0.04
0.7 0.0004 0.0002 0.001
0.7 0.00005
0.006
MCL or TT1 (mg/L)2
zero
MCLG1 (mg/L)2
Di(2-ethylhexyl) phthlate Dinoseb Dioxin (2,3,7,8TCDD) Diquat Endothall Endrin Epichlorohydrin
Contaminant
Organic chemicals (continued)
Table 3.4 (Continued.)
Skin changes; thymus gland problems; immune de ciencies; reproductive or nervous system dif culties; increased risk of cancer Liver or kidney problems; increased cancer risk Liver problems Problems with blood Liver, kidney, or circulatory system problems
Slight nervous system effects
Reproductive dif culties
Liver or kidney problems
Cataracts Stomach and intestinal problems Liver problems Increased cancer risk, and over a long period of time, stomach problems Liver or kidneys problems Problems with liver, stomach, reproductive system, or kidneys; increased risk of cancer Kidney problems; reproductive dif culties Liver damage; increased risk of cancer Liver damage; increased risk of cancer Liver or kidney problems; reproductive dif culties; increased risk of cancer Kidney or stomach problems
Reproductive dif culties; liver problems; increased risk of cancer Reproductive dif culties Reproductive dif culties; increased risk of cancer
Potential health effects from ingestion of water
Discharge from wood preserving factories Herbicide runoff Herbicide runoff Discharge from rubber and plastic factories; leaching from land lls
Runoff/leaching from insecticide used on cattle, lumber, gardens Runoff/leaching from insecticide used on fruits, vegetables, alfalfa, livestock Runoff/leaching from insecticide used on apples, potatoes and tomatoes Runoff from land lls; discharge of waste chemicals
Runoff from herbicide use Residue of banned termiticide Breakdown of heptachlor Discharge from metal re neries and agricultural chemical factories Discharge from chemical factories
Runoff from herbicide used on soybeans and vegetables Emissions from waste incineration and other combustion; discharge from chemical factories Runoff from herbicide use Runoff from herbicide use Residue of banned insecticide Discharge from industrial chemical factories; an impurity of some water treatment chemicals Discharge from petroleum re neries Discharge from petroleum re neries
Discharge from rubber and chemical factories
Sources of contaminant in drinking water
60 Chapter Three
0.005
0.005
0.003
zero
zero
10
Vinyl chloride
Xylenes (total)
15 picocuries per litre (pCi/L) 4 millirems per year
Radium 226 and Radium 228 (combined) Uranium
5 pCi/L
30 µg/L as of 8 Dec 03
none7; zero
zero
MCL or TT1 (mg/L)2
10
0.002
none ; zero
7
Beta particles and none7; zero photon emitters
Alpha particles
Contaminant
MCLG1 (mg/L)2
0.2
0.20
Radionuclides
0.05 0.07
0.05 0.07
2,4,5-TP (Silvex) 1,2,4Trichlorobenzene 1,1,1Trichloroethane 1,1,2Trichloroethane Trichloroethylene
0.003
zero
Toxaphene
0.005 1
zero 1
Tetrachloroethylene Toluene
Increased risk of cancer, kidney toxicity
Increased risk of cancer
Increased risk of cancer
Increased risk of cancer
Potential health effects from ingestion of water
Nervous system damage
Increased risk of cancer
Liver problems; increased risk of cancer
Liver, kidney, or immune system problems
Liver, nervous system, or circulatory problems
Liver problems Changes in adrenal glands
Kidney, liver, or thyroid problems; increased risk of cancer
Liver problems; increased risk of cancer Nervous system, kidney, or liver problems
Erosion of natural deposits
(Continued.)
Erosion of natural deposits of certain minerals that are radioactive and may emit a form of radiation known as alpha radiation Decay of natural and man-made deposits of certain minerals that are radioactive and may emit forms of radiation known as photons and beta radiation Erosion of natural deposits
Sources of contaminant in drinking water
Discharge from metal degreasing sites and other factories Leaching from PVC pipes; discharge from plastic factories Discharge from petroleum factories; discharge from chemical factories
Discharge from metal degreasing sites and other factories Discharge from industrial chemical factories
Runoff/leaching from insecticide used on cotton and cattle Residue of banned herbicide Discharge from textile nishing factories
Discharge from factories and dry cleaners Discharge from petroleum factories
The Basics of Malting and Brewing 61
Table 3.4 (Continued.)
Notes 1 De nitions Maximum contaminant level (MCL) The highest level of a contaminant that is allowed in drinking water. MCLs are set as close to MCLGs as feasible using the best available treatment technology and taking cost into consideration. MCLs are enforceable standards. Maximum contaminant level goal (MCLG) The level of a contaminant in drinking water below which there is no known or expected risk to health. MCLGs allow for a margin of safety and are non-enforceable public health goals. Maximum residual disinfectant level (MRDL) The highest level of a disinfectant allowed in drinking water. There is convincing evidence that addition of a disinfectant is necessary for control of microbial contaminants. Maximum residual disinfectant level goal (MRDLG) The level of a drinking water disinfectant below which there is no known or expected risk to health. MRDLGs do not re ect the bene ts of the use of disinfectants to control microbial contaminants. Treatment technique (TT) A required process intended to reduce the level of a contaminant in drinking water. 2 Units are in milligrams per litre (mg/L; equivalent to parts per million) unless otherwise noted. 3 EPA’s surface water treatment rules require systems using surface water or ground water under the direct in uence of surface water to (1) disinfect their water, and (2) lter their water or meet criteria for avoiding ltration so that the following contaminants are controlled at the following levels: • Cryptosporidium (as of 1 January 2002 for systems serving > 10,000 and 14 January 2005 for systems serving < 10,000): 99% removal. • Giardia lamblia: 99.9% removal/inactivation. • Viruses: 99.99% removal/inactivation. • Legionella: No limit, but EPA believes that if Giardia and viruses are removed/inactivated, Legionella will also be controlled. • Turbidity: At no time can turbidity (cloudiness of water) go above 5 nephelometric turbidity units (NTU); systems that lter must ensure that the turbidity go no higher than 1 NTU (0.5 NTU for conventional or direct ltration) in at least 95% of the daily samples in any month. As of 1 January 2002, turbidity may never exceed 1 NTU, and must not exceed 0.3 NTU in 95% of daily samples in any month. • HPC: No more than 500 bacterial colonies per millilitre. • Long Term 1 Enhanced Surface Water Treatment (Effective Date: 14 January 2005): Surface water systems or (GWUDI) systems serving fewer than 10,000 people must comply with the applicable Long Term 1 Enhanced Surface Water Treatment Rule provisions (e.g. turbidity standards, individual lter monitoring, Cryptosporidium removal requirements, updated watershed control requirements for un ltered systems). • Filter Backwash Recycling: The Filter Backwash Recycling Rule requires systems that recycle to return speci c recycle ows through all processes of the system’s existing conventional or direct ltration system or at an alternate location approved by the state. 4 More than 5.0% samples total coliform-positive in a month. (For water systems that collect fewer than 40 routine samples per month, no more than one sample can be total coliform-positive per month.) Every sample that has total coliform must be analysed for either faecal coliforms or E. coli if two consecutive TC-positive samples, and one is also positive for E. coli faecal coliforms, system has an acute MCL violation. 5 Faecal coliform and E. coli are bacteria whose presence indicates that the water may be contaminated with human or animal wastes. Disease-causing microbes (pathogens) in these wastes can cause diarrhoea, cramps, nausea, headaches, or other symptoms. These pathogens may pose a special health risk for infants, young children and people with severely compromised immune systems. 6 Although there is no collective MCLG for this contaminant group, there are individual MCLGs for some of the individual contaminants: • Trihalomethanes: bromodichloromethane (zero); bromoform (zero); dibromochloromethane (0.06 mg/L). Chloroform is regulated with this group but has no MCLG. • Haloacetic acids: dichloroacetic acid (zero); trichloroacetic acid (0.3 mg/L). Monochloroacetic acid, bromoacetic acid, and dibromoacetic acid are regulated with this group but have no MCLGs. 7 MCLGs were not established before the 1986 Amendments to the Safe Drinking Water Act. Therefore, there is no MCLG for this contaminant. 8 Lead and copper are regulated by a treatment technique that requires systems to control the corrosiveness of their water. If more than 10% of tap water samples exceed the action level, water systems must take additional steps. The action level is 1.3 mg/L for copper and 0.015 mg/L for lead. 9 Each water system must certify, in writing, to the state (using third-party or manufacturer’s certi cation) that when acrylamide and epichlorohydrin are used in drinking water systems, the combination (or product) of dose and monomer level does not exceed the levels speci ed, as follows: • Acrylamide = 0.05% dosed at 1 mg/L (or equivalent); • Epichlorohydrin = 0.01% dosed at 20 mg/L (or equivalent).
62 Chapter Three
The Basics of Malting and Brewing
63
Table 3.5 National Secondary Drinking Water Regulations, United States (as from http://www.epa.gov/ safewater/mcl.html#mcls). Factor
Permissible level
Aluminium Chloride Colour Copper Corrosivity Fluoride Foaming agents Iron Manganese Odour pH Silver Sulphate Total dissolved solids Zinc
0.05–0.2 mg/L 250 mg/L 15 (colour units) 1.0 mg/L noncorrosive 2.0 mg/L 0.5 mg/L 0.3 mg/L 0.05 mg/L 3 threshold odour number 6.5–8.5 0.10 mg/L 250 mg/L 500 mg/L 5 mg/L
Basic outlines of malting and brewing Beer is the product of the alcoholic fermentation by yeast of extracts of malted barley (see Figs 3.3 and 3.4). The sugars that are converted to alcohol for the most part arise from the starch of barley. It was pure happenstance that the rst beers were brewed from barley 6000–8000 years ago (Bamforth 2003), but barley has been retained ever since because, unlike other cereals, it retains its husk on threshing. This husk has traditionally formed the lter bed through which the liquid extract of sugars is separated in the brewery. The starch in barley is enclosed in cell walls and proteins (Fig. 3.5) and these wrappings are rst stripped away in the malting process (which is essentially a controlled and limited germination of the barley grains), to leave 85–90% of the starch behind, but in a form accessible for hydrolysis to sugars in brewing. The controlled germination softens the grain, rendering it more readily milled. Unpleasant grainy and astringent characters are also removed. Malt has diverse food uses additional to the production of beer (Table 3.6), and it is not only tastier than barley, but the malting process makes its components more nutritionally available.
64
Chapter Three
Fig. 3.3
Outline of malting.
Fig. 3.4
Outline of brewing.
The Basics of Malting and Brewing
Husk
Starchy endosperm
One endosperm cell wall Embryo
One small starch granule
Aleurone One large starch granule protein
Fig. 3.5
The structure of the barley grain. Only two of the thousands of starch granules are depicted.
Table 3.6 Uses for malt. Used in foodstuff
Used for colour
Enzymes
Flavour
Sweetness
Nutrition
Beer Biscuits and crackers Bread Breakfast cereal Cakes Coffee alternative Confectionery Desserts Gravy Ice cream Infant food Malted food drinks Meat products Mincemeat Pickles Preserves Sauces Soft drinks Soups Stock cubes Whisky
✓ ✓
✓ ✓
✓ ✓
✓ ✓
✓ ✓
✓
✓
✓ ✓ ✓ ✓
✓ ✓ ✓
✓ ✓
✓ ✓
✓
✓
✓ ✓ ✓
✓ ✓
✓ ✓
✓ ✓
✓ ✓
✓
✓ ✓ ✓ ✓ ✓ ✓ ✓ ✓ ✓ ✓ ✓ ✓ ✓ ✓ ✓ ✓ ✓
Source: based on Bamforth & Barclay (1993).
✓
65
66
Chapter Three
Malting The rst stage of malting comprises the steeping of barley in water at 14–18°C for up to 48 h, until it reaches a moisture content of 42–46%. Raising the moisture content allows the grain to start to germinate, a process that usually takes less than a week at 16–20°C. In germination, the enzymes break down the cell walls and some of the protein in the starchy endosperm (the grain’s food reserve), rendering the grain friable. The amylases that break down the starch are produced (or released) in germination and these are important for the subsequent mashing process in the brewery, which is where they convert starch to fermentable sugars. Over the years a number of agents have been employed to assist the maltster to ef ciently produce malts that will satisfy the brewer in terms of quality and cost. In a great many markets these materials are banned, even though there is little or no evidence that they are harmful. Thus the natural gibberellin hormones of the barley, which have a key role in stimulating enzyme production, can be supplemented with gibberellic acid (GA), which is produced using industrial fermentation processes (Tudzynski 1999). GA is very closely similar to the native molecules in barley, but nonetheless is outlawed in the Scotch whisky industry and the North American brewing industry. Where it is used, its undesirable impact in excessively stimulating the production of rootlets (which is a waste of potentially fermentable material) has been countered by the use of potassium bromate. A detailed study showed that this latter molecule does not survive in signi cant quantities into beer (Brewing Research International, unpublished). Very few malting operations nowadays use bromate, but it is widely used in the baking industry where it is used to help bread rise. There was a time, long ago, when maltsters experimented with the use of formaldehyde, as an agent to remove tannins from the surface of the grain and render the malt less prone to giving the beer a tendency to cloud (haze) formation (Macey 1970). I know of no maltster (or brewer) that has used this material for many years. One recent development has been the proposal to seed barley with lactic acid bacteria during the malting process (Laitila et al. 2002). These bacteria are widely employed in the production of wholesome foodstuffs, e.g. sauerkraut and cheeses, and indeed natural infection of worts in German breweries has a very long history as an exercise in ‘naturally’ lowering the pH to a more favourable level. The rationale for using lactic acid bacteria in the maltings is that they will consume surface nutrients from the grain, thereby preventing undesirable organisms such as Fusarium from prospering. Germination is arrested by kilning, in which there is a lowering of the moisture content. Regimes with progressively increasing temperatures over the range 50 to perhaps 110°C are used to allow drying to < 5% moisture, while preserving those enzymes that are particularly sensitive to heat. The more intense the kilning process, the darker the malt that is produced and the more roasted, coffee-like and smoky are the avour characteristics developed. Essentially, malts used for making very pale lager-style beers are
The Basics of Malting and Brewing
67
kilned quite gently, whereas those going into the somewhat darker ales are subjected to more heating. The very dark colours in stouts come from the incorporation into the grist of a proportion of malt that is roasted intensely. One of the biggest concerns with the intense heating of grain raised over 20 years ago was the risk of developing nitrosamines (Havery et al. 1981). These molecules have been demonstrated to be carcinogenic in model animal systems, but not so far for man. They are primarily produced when precursors in grain, notably hordenine, react under heat with oxides of nitrogen, which tend to be present in the atmosphere, especially in regions with heavy industry. The malting and brewing industries responded with tremendous alacrity to the ‘scare’ and within a very short period of time nitrosamine levels had been reduced to very low levels (Sen et al. 1996, and see Chapter 5). The key change in practice was the use of indirect kilning such that the nitrogen oxides no longer contacted the malt.
Brewing Brewing (and malting) is nowadays conducted in well-designed and highly hygienic facilities, for the most part fabricated from stainless steel. The equipment is repeatedly cleaned using regimes of acid or caustic, followed by thorough rinsing with clean water and perhaps a sterilant of the type that would nd use in the domestic kitchen. In the brewery, the malted grain must rst be milled to generate relatively ne particles, which are then intimately mixed with hot water in a process called mashing. Mashes typically have a thickness of around three parts water to one part malt and contain a stand in the vicinity of 65°C. At this temperature the granules of starch are converted in a transition called gelatinisation into a ‘melted’ form that is much more susceptible to digestion by amylases. These enzymes are developed during malting, but only start to act once the gelatinisation of the starch has occurred in the mash tun. Some brewers will add starch from other sources, such as unmalted barley, maize or rice, to supplement that from malt. These other sources are called adjuncts. It may be necessary for the brewer to add extra enzymes at this stage, to help deal with some of these adjuncts. Many brewers, though, outlaw the adoption of such ‘exogenous’ enzymes, even though they are fully recognised as safe and are derived from harmless organisms, e.g. Aspergillus and Pencillium, which naturally thrive throughout nature, including on the surface of grain (Flannigan 2003). After a period typically of one hour, the liquid portion of the mash, known as wort, is recovered in a ‘lautering’ or ltration operation and run to the kettle where it is boiled, again typically for an hour. Boiling serves various functions, including sterilisation of wort, precipitation as ‘trub’ of proteins and tannins (which would otherwise come out of solution in the nished beer and cause cloudiness), and the driving away of unpleasant
68
Chapter Three
grainy characters that originate in the cereal. Many brewers add some adjunct sugars at this stage, and most brewers also introduce at least a proportion of their hops. The hops have two principal components: resins and essential oils. The resins (socalled α-acids) are changed (‘isomerised’) during boiling to yield iso-α-acids, which provide the bitterness to beer. This process is rather inef cient. Nowadays, hops are often extracted with lique ed carbon dioxide and the extract is either added to the kettle or is isomerised outside the brewery for addition to the nished beer (thereby avoiding losses due to the tendency of bitter substances to stick on to yeast). The oils in hops are responsible for the ‘hoppy nose’ on beer. After the precipitate produced during boiling has been removed, the hopped wort is cooled and pitched with yeast. There are many strains of brewing yeast (Saccharomyces cerevisiae), and brewers carefully select and maintain their own strains because of their importance in determining brand identity. Yeast needs a little oxygen to trigger off its metabolism, but otherwise the alcoholic fermentation is anaerobic. Ale fermentations are usually complete within a few days at temperatures as high as 20°C, whereas lager fermentations at as low as 6°C can take several weeks. Fermentation is complete when the desired alcohol content has been reached and when an unpleasant butterscotch avour, which develops during all fermentations, has been mopped up by yeast. The yeast is harvested for use in the next fermentation. It may be washed with acid to eliminate contaminating microbes that can produce non-volatile nitrosamines (Simpson et al. 1988). In traditional ale brewing the beer is now mixed with a small quantity of hops (to supplement hoppy avour), some priming sugars and isinglass nings, which settle out the solids in the cask. Isinglass is basically hydrolysed collagen, a protein found in many animal tissues. The collagen used for brewing comes from the swim bladders of certain species of sh that breed in the South China Seas. The swim bladders are dried, and then partially hydrolysed using sulphurous acid to generate a solution that has good capability for reacting with beer proteins to form large aggregates, which precipitate and settle. Under Draft Directive 2000/13/EC of the European Union it will in future be required that process aids or ingredients that are included in one of the major allergen groups be labelled. As sh and sh products are in the list that forms an annex to the Directive, this means that isinglass would need to be declared. Phillips (2003) has argued convincingly why this seems preposterous, for the collagen is vastly modi ed during processing and the levels that survive into beer are minimal. In traditional lager brewing the ‘green beer’ is matured by several weeks of cold storage, prior to ltering. Filtration generally involves the use of lter aids that keep the lter bed loose and prevent it from clogging up. The two main types of lter aid are kieselguhr and perlite. They leave no residue in the beer. Nowadays many beers, both ales and lagers, receive a relatively short conditioning period after fermentation and before ltration. This conditioning is ideally performed
The Basics of Malting and Brewing
69
at –1°C for a minimum of three days, under which conditions more proteins drop out of solution, making the beer less likely to go cloudy in the package or glass. The long-term stability of beer may also be aided by the use of materials downstream that remove haze-forming protein or polyphenol. For the latter, the one choice is polyvinylpolypyrrolidone. Protein may be removed in three ways: by adsorption on silica gels that are made from sand, by precipitation with tannic acid derived from gallnuts, or by hydrolysis with the enzyme papain from the pawpaw. This is the same enzyme that comprises meat tenderiser. The ltered beer is adjusted to the required carbonation before packaging into cans, kegs or glass or plastic bottles. The packaging operations are rigorously designed to ensure that the product is delivered in secure (tamper-proof or at the very least tamperevident) packages that minimise the opportunity for air ingress (oxygen promotes staling). Modern packaging lines incorporate highly ef cient systems to ensure that packages will not contain foreign bodies and furthermore that such items cannot be introduced during the packaging process itself. Countries such as the UK have regulations which stipulate that packaging materials may not react with or alter the organoleptic properties of the food which they contact (Partington 2003). Aluminium or stainless steel cans, casks or kegs, therefore, are lined with epoxy lacquer coatings to prevent metal from leaching into the relatively low pH beer.
Styles of beer One fundamental approach to classifying beers is based on whether they are generated by ‘top fermentation’ or ‘bottom fermentation’, i.e. whether the yeast congregates at the top of the vessel or sinks to the base. In modern fermenters with their high hydrostatic pressures the distinction is blurred. Top fermentation tends to be at relatively warm temperatures (15–25°C) with the yeast producing higher levels of avour volatiles such as esters, affording fruity characteristics. Bottom fermentation beers are produced at much lower temperatures (e.g. 6–15°C) and frequently possess signi cant sulphury notes. The main top fermentation beers are the ales. Alcohol content will generally be in the range 3 to 7.5% by volume (ABV), and more frequently in the bottom half of the range. The major grist material will be well-modi ed malt, kilned to relatively high temperatures to impart a copper colour. ‘Mild’ is a sweeter, darker product, the colour being either due to caramel or in part to a low proportion of heavily kilned malt, though not so much as to impart burnt avours. It tends to have a lower alcohol content (less than 3.5% ABV) and when bottled may be referred to as ‘Brown Ale’. ‘Barley wines’
70
Chapter Three
are fermented at very high gravities and so develop much higher alcohol contents (up to 10% by volume). They are usually sold in smaller volumes, in bottles called ‘nips’. Porters (named after the main customers in eighteenth-century London) are traditionally very dark, due to the use of a proportion of roasted barley in the grist, and not overwhelmingly strong (about 5% ABV). Stouts are close relatives of porter, originating in Ireland, with intense colour and burnt, smoky avours due to the use of roasted barley adjuncts, and high bitterness. These robust avour characters are frequently mellowed by the use of nitrogen gas, which ‘smoothes’ the palate as well as affording the rich, white and creamy foam. Alcohol content may be between 4 and 7%, with up to 10% in Imperial stouts. Sweet stouts are a British variant, of lower alcohol content (up to 4% ABV), with less roast character (often due to the use of caramel and less roast barley as colourant). Trappist beers, from Belgium, are relatively dark, intensely bitter, acidic products of up to 12.5% alcohol by volume. Lambic and gueuze have very complex avours, owing to the use of a more complex micro ora than brewing yeast alone. They are sour (low pH) and usually hazy. Various avourants may be added, including cherries (Kriek) or raspberries (Framboise). The German wheat beers comprise a further class of top fermentation beers. Weizenbier is made from a grist of at least 50% wheat malt. The products are relatively highly carbonated, affording a refreshing nature alongside the fruity and phenolic (clove-like) characters. Often they are cloudy due to yeast, which is employed traditionally to carbonate the bottled product through ‘natural conditioning’. The products are relatively lightly coloured (straw-like) and have alcohol contents of 5–6% by volume. Weissbier (‘white beer’) is much weaker (e.g. 2.8% alcohol by volume), made from a grist of less than 50% wheat malt, with the addition of lactic acid bacteria to generate a low pH of 3.2–3.4. Therefore such beers are quite sour, and may be taken with raspberry or sweet woodruff syrups. The classic style of bottom fermentation beers originated in Pilsen and is known as Pilsner. It is quite malty with typically 4.8–5.1% ABV and a pale gold colour. Particularly important is the ‘late hop character’, which is introduced by retaining a proportion of the hops for addition late in the kettle boil. The term ‘lager’ is used by many, inaccurately, as a synonym for Pilsner. Lager as a term is really an umbrella description for relatively pale beers, fermented and dispensed at low temperatures. Malt liquor is a term used to describe alcoholic products (6–7.5% ABV) which are very pale, very lightly hopped and quite malty and sweet. Light beers comprise the most rapidly growing segment of the beer market. ‘Standard’ beers retain a proportion of carbohydrate that is not fermentable by yeast, whereas a light beer has most or all of this sugar converted into alcohol. These beers therefore have fewer calories, provided that the extra alcohol is diluted to the level found in ‘normal’ beers.
The Basics of Malting and Brewing
71
There are many de nitions worldwide about what constitutes low-alcohol products. Perhaps the most stringent is in UK, where non- and low-alcohol beers (NAB/LABs) contain less than 0.05% or 1.2% ABV, respectively. They are produced either by removing the alcohol from a full-strength brew (by techniques such as vacuum distillation or reverse osmosis), or by restricting the ability of yeast to ferment wort (either by making a wort containing very low levels of fermentable sugars or by ensuring that the contact between yeast and wort is at a very low temperature and for a relatively brief time).
The chemistry of beer Ethanol As we shall see in Chapter 6, there is increasingly good evidence for the bene cial impact of moderate levels of ethanol on the body. There are several other effects of alcohol on the quality of beer. It contributes directly to avour, by impacting characters variously described as warming and sweet as well, of course, as alcoholic. It also moderates the contribution of other components to avour by in uencing their partitioning between the body of the beer and its headspace (‘the nose’). Ethanol also in uences the foaming properties of beer (Brierley et al. 1996). It lowers surface tension, and so aids bubble formation, but it also competes with other surface-active molecules (notably proteins) for places in the bubble wall, thus detracting from stability of the head. Beer strength is usually de ned in terms of alcohol by volume (ABV), i.e. the number of cm3 of ethanol per 100 cm3 of beer. Sometimes alcoholic strength is described in terms of weight per volume. As the speci c gravity of ethanol is 0.79, this means that a beer that contains 5% alcohol by volume has approximately 4% alcohol by weight. One of the most relevant examples to use by way of illustration is the so-called ‘3–2 beer’ in Utah. Most of the beer in that US state is in this category, which refers to the fact that it contains no more than 3.2% by weight. This is of course 4% when quoted on the basis of volume. Another way of describing the strength of a beer is on the basis of its ‘original gravity’ (known as ‘original extract’ in the US). This is variously quoted on the basis of speci c gravity or, increasingly commonly, degrees Plato. It is basically a measure of the strength (approximating to the sugar content) of the wort prior to fermentation. During fermentation, the fermentable sugars are converted into alcohol, leaving behind that proportion of the solubilised starch that is not fermentable. Sugar solutions have a high speci c gravity (weight per unit volume), as compared to water (1 mL of which weighs 1 g – i.e. the speci c gravity is 1.00) and to ethanol (speci c gravity 0.79). Thus there is a fall in speci c gravity during fermentation and the nal speci c gravity of a beer re ects the balance between ethanol and the residual unfermentable ‘dextrins’ (see
72
Chapter Three
later). By measuring the speci c gravity and ethanol content and putting the values into an equation, the brewer can calculate the original extract, that is, the original strength of the wort. One degree Plato basically represents a 1% by weight solution of sugars. Thus a wort that is 10° Plato is the equivalent of a 10% sugar solution. A 12°P wort is a 12% sugar solution. If they contain the same proportion of fermentable sugars, then the latter would go on to give a more alcoholic beer. For most beers the sugars originate from malted barley, but some brewers use adjuncts. Thus, for instance, if the grist comprised 70% malt : 30% corn syrup, then, when compared to one of the same strength in degrees Plato derived from an all-malt grist, the former would contain less of the other components that are derived from malt (protein, vitamins, polyphenols, bre, etc.). Thus, although a knowledge of the original gravity of a beer is useful for ‘normalising’ analytical data on beers, it is important to bear in mind that the exact nature of the grist has a key role to play. Compared to other alcoholic beverages, beer contains relatively low levels of ethanol. In the UK the mean alcohol content of all beers is 4.1% whereas in the US the average alcoholic strength is 4.6% ABV. Table 3.7 illustrates the typical alcohol content of a diversity of other beverages. Naturally, those of higher alcohol content are consumed in smaller servings. However, there is an obviously greater risk with the drinks of higher alcohol content. Thus, if a whisky is poured without the use of an optic, then a ‘heavy hand’ delivering 30 mL rather than the standard unit of 25 mL has a profound effect on the amount of alcohol being given. In the vast majority of instances the amount of alcohol being served in the form of beer is inherently self-regulated. If on draft it is de ned as the volume of the glass (e.g. pint or half-pint) whereas if in small pack it is determined by the size of the container (viz. bottle or can). Of course beers do vary substantially from brand to brand in their alcoholic strength (see Tables 3.8–3.11); however, the vast majority are in the range 3–6%. The average alcohol content of beers on a national basis is given in Table 3.12.
Table 3.7 Alcohol content of a range of beverages. Beverage
Typical alcohol content (% ABV)
Premium beer High-strength beer Wine Whisky Gin Vodka Vermouth
4.5 9.0 12.0 40.0 40.0 45.0 15.0
Source: Bamforth (2003).
The Basics of Malting and Brewing
73
Table 3.8 Alcohol content of a range of ales. Brand
Alcohol (% w/w)
BridgePort India Pale Ale India Ale Greene King IPA Deuchars IPA Indian Pale Ale James Squire IPA Imperial Pale Ale Indica IPA Full Sail IPA Woodstock IPA India Pale Ale Quail Springs IPA Hop Ottin’ IPA Pyramid Indian Pale Ale Wolaver’s India Pale Ale Rogue XS Imperial Ale India Pale Ale Old Nick Old Horizontal/Barleywine Style Ale Hobgoblin Extra Strong Ale Rogue XS Imperial Ale Maredsous Abbey Ale Dobbel 8.1% Ballantine Burton Ale Dominion Millennium Druid Fluid Barley Wine Blue Heron Ale Old Brewery Pale Ale Organically Produced Ale Bass Pale Ale Augustinian Ale Golden Thread Old Speckled Hen Sparkling Ale St. Andrews Ale Young’s Ram Rod Fuller’s ESB Fuller’s 1845 Belhaven Scottish Ale Old Peculiar Speights Pale Ale Maudite Little Creatures Pale Ale Point Pale Ale Sierra Nevada Pale Ale Three Floyds X-Tra Pale Ale Dead Guy Ale Black Oak Pale Ale Liberty Ale Arrogant Bastard Ale Full Sail Pale Paci c Ridge Pale Ale Sunnyside Pale Ale Pale Ale
4.45 3.80 2.74 3.32 2.25 4.04 6.19 5.76 4.99 4.99 4.34 4.75 5.06 5.15 5.09 7.26 4.74 5.45 7.90 4.02 7.26 6.24 6.74 8.00 6.68 3.09 3.88 4.08 3.84 4.11 3.84 3.74 4.33 3.60 3.89 4.63 4.90 2.93 4.46 3.23 5.89 3.99 4.29 4.32 3.85 5.63 3.89 4.87 5.67 3.94 4.23 3.18 4.22 (Continued.)
74
Chapter Three
Table 3.8 (Continued.) Brand
Alcohol (% w/w)
Dog Town Pale Ale Single Track Copper Ale Old Slugger Pale Ale Mirror Pound Pale Ale Saranac Pale Ale Ruedrich’s Red Seal Ale Porch Swing Single Ale Ruth All American Ale Pale Ale Syracuse Pale Ale Hop Jack Pale Ale Union Pale Ale Mobjack Pale Ale Wild Salmon Pale Ale Telemark Ale Shelter Pale Ale Seneca Trail Ale Sam Adams Pale Ale Holyoke Dam Ale Beast Bitter Long Trail Pollenator Ale Yuengling Black & Tan Ballantine Ale Summit Extra Pale Ale Jackman’s American Pale Ale Casta Pale Ale Casta Dark Ale Pete’s Wicked Red Rush Ebenezer Ale Clancy’s Harvest Ale Kilkenny Irish Cream Ale Smithwick’s Irish Ale Leinenkugel Red Lager Original County Ale Irish Red Ale Blue Ridge ESB Red Ale Irish Red Ale Augustiner Lager Grolsch Amber Ale Hammer & Nail Vienna Style Ale McSorley’s Ale Oktoberfest Marzen Amber Avalanche Ommegang Michael Shea’s Irish Amber Iron Range Amber Lager Bob’s 1st Ale Killarney’s Red Lager George Killian’s Irish Red MacTarnahan’s Scottish Style Amber Ale Beamish Irish Cream Stout Guinness Extra Stout
3.79 3.56 3.64 4.04 4.15 4.56 4.30 5.51 3.90 3.78 4.15 5.36 3.73 3.82 3.52 3.83 4.69 4.32 3.92 4.11 3.00 3.53 4.34 4.11 4.06 4.13 4.37 3.78 4.75 3.8 3.31 3.74 3.85 3.92 4.24 3.41 3.85 3.39 4.22 3.43 4.49 4.12 4.31 6.28 3.64 3.81 3.17 3.83 3.88 3.79 3.73 4.27
Sources: Most of the data in this table is reproduced courtesy of Carlos Alvarez & Jaime Jurado (Gambrinus). The data was originally published by Jurado in a series of articles in The Brewer International. Most of the remaining information is from http://brewery.org/brewery/library/AlClbinger.html.
The Basics of Malting and Brewing
Table 3.9 Alcohol content of a range of lagers. Brand
Alcohol (% w/w)
Budweiser Becks Pilsner Urquell Michelob Bud Light Molson Canadian Pete’s Signature Pilsner CD Pils Premium Pils Stone Hammer Pilsner Stoudt’s Pils Summer Pils Harpoon Pilsner Saratoga Pilsner Paper City Pilsner Prima Pils Pils Pilsner Pilsner Zephyrus Pilsner Blue Paddle Pilsner Golden Pilsner Pete’s Wicked Helles Andechser Spezial Hell Lagerbier Hell Kaltenberg Hell Original Bayrisch Mild Urtyp Hell Wurziges Helles Edelstoff Meistersud Spezialbier Lowenbrau Original Lowenbrau Schloss Gold Urtyp Hell Spezial Münchner Hell Export Hell Original München Helles Export Lager 2000 Original Münchner Edel-Helles Brau Hell Münchner Hell Appenzeller Bier Premium Pils Shiner Blonde Black Oak Lager Golden Ale Blonde Ale Vienna Style Lager Ichiban Special Reserve Amstel Lager Black Label
4.82 5.13 3.4 4.9 3.56 5.19 3.79 3.96 3.98 3.37 3.05 4.21 4.12 3.81 3.91 4.45 4.48 4.2 4.66 4.28 3.75 3.83 3.85 4.81 4.17 4.03 4.16 4.02 3.69 4.63 4.43 4.00 3.90 4.17 3.84 4.42 3.84 4.26 4.09 4.35 4.25 3.82 4.04 4.16 3.86 3.78 3.90 3.44 3.84 3.26 4.27 3.44 3.86 3.85 4.13
Sources: Most of the data in this table is reproduced courtesy of Carlos Alvarez & Jaime Jurado (Gambrinus). The data was originally published by Jurado in a series of articles in The Brewer International. Most of the remaining information is from http://brewery.org/brewery/library/AlClbinger.html.
75
76
Chapter Three
Table 3.10
Alcohol content of a range of wheat beers.
Brand
Alcohol (% w/w)
Shiner Winter Ale Shiner Hefeweizen Pete’s Honey Wheat Half Ton Hefeweizen Hefeweizen Eramosa Honey Wheat Celis White Penn Weizen Weizen Bock Ramstien Kristall Wheat Beer Classic Wheat Beer Hefeweizen Hefe-Weizen Hefeweizen Hefe Weizen Wheat Beer Whistlepin Wheat Ale Kristall Weizen Wheat Beer Bert Grant’s Hefeweizen Ramstein Blonde Wheat Beer Hefeweizen Jack Whacker Wheat Ale Honey Weiss Bier Sunshine Wheat Bear Franziskaner Hefe-Weisse Paulaner Hefe-Weizen
4.09 4.12 3.84 4.20 4.28 3.40 3.03 4.38 6.51 3.33 4.53 4.88 4.21 3.78 3.57 3.47 4.11 4.05 3.65 3.64 4.88 3.90 3.79 3.67 3.51 3.95 4.43
Sources: Most of the data in this table is reproduced courtesy of Carlos Alvarez & Jaime Jurado (Gambrinus). The data was originally published by Jurado in a series of articles in The Brewer International. Most of the remaining information is from http://brewery.org/brewery/library/AlClbinger.html.
Carbon dioxide Carbon dioxide is produced molecule for molecule alongside ethanol during the fermentation of glucose by Saccharomyces cerevisiae: yeast C6H12O6 → 2C2H5OH + 2CO2 glucose ethanol carbon dioxide CO2 provides the ‘sparkle’ in beer, affording a pleasurable pain sensation through interaction with the trigeminal nerve. Like ethanol, it plays a substantial role in establishing the quality of beer. Apart from its in uence on mouthfeel, CO2 determines the extent of foamability (foam formation) and naturally in uences the delivery of volatiles into the headspace of beers.
The Basics of Malting and Brewing
77
Table 3.11 Alcohol content of a range of seasonal beers. Brand
Alcohol (% w/w)
Pete’s Wicked Winter Brew Pintail Ale Pete’s Wicked Summer Brew Shiner Summer Stock Koelsch-Style Summer Ale Young’s Summer Beer St. Peter’s Summer Ale Hopback Summer Lightning Curve Ball Kolsch Style Ale Sommerbrau Kolsch Beer Zommerfest Kosch Style Summer Ale Spring Brew Speciality Lager Sam Adams Spring Ale Summerfest Sam Adams Summer Ale Juju Ginger Ale Pete’s Wicked Oktoberfest Oktoberfest Marzen Amber Original Oktoberfest Hacker-Pschorr Ayinger Oktober Fest-Marzen Sam Adams Oktoberfest Frambozen Framboise Lambic Blue Moon Abbey Ale Thomas Kemper Roggen Rye Rogue Honey Cream Ale Apricot Ale Young’s Waggledance Honey Ale Pete’s Wicked Strawberry Blonde Samuel Smith’s Winter Welcome Ale Winterbraun Holiday Ale Christmas Brew Royal X-Mas Brew Jubel Victory Dark Lager
4.00 3.87 3.70 3.85 3.04 3.47 5.16 4.20 3.65 3.96 3.97 4.78 4.13 3.59 4.14 2.05 4.50 4.27 4.39 4.21 4.57 4.60 1.46 4.10 3.75 3.63 3.79 3.85 3.99 4.56 5.63 4.47 4.51 3.98 4.71
Sources: Most of the data in this table is reproduced courtesy of Carlos Alvarez & Jaime Jurado (Gambrinus). The data was originally published by Jurado in a series of articles in The Brewer International. Most of the remaining information is from http://brewery.org/brewery/library/AlClbinger.html.
Most cans or bottles of beer contains between 2.2 and 2.8 volumes of carbon dioxide (that is, between 2.2 and 2.8 cm3 of CO2 is dissolved in every cm3 of beer). At atmospheric pressure and 0°C, a beer will dissolve no more than its own volume of CO2 and so achievement of these high levels of CO2 demands the pressurising of beer. The carbon dioxide that is used to pressurise beer and to bring up the gas content is subject to the same stringent quality control procedures as other raw materials used in the production of beer. The use of gases in this way is not without its risks, and some years ago there was a crisis
78
Chapter Three
Table 3.12
Average alcohol levels of beers in different countries.
Country
Average beer strength (% ABV)
Argentina Australia Austria Belgium* Bulgaria Canada Chile Colombia Croatia Cuba Czech Republic Denmark Finland France Greece Hungary Ireland Italy Japan Korea (Republic of) Mexico New Zealand Netherlands Nigeria Norway Philippines Poland Portugal Romania Slovak Republic Slovenia South Africa Spain Sweden Switzerland UK USA
4.8 4.3 5.1 5.2 4.8 5.0 4.5 4.2 5.0 5.0 4.5 4.6 4.6 5.0 4.9 4.7 4.1 5.1 5.0 4.0 4.0 4.0 5.0 4.5 4.5 4.7 5.2 5.2 4.5 4.5 4.9 5.0 5.2 4.0 4.9 4.1 4.6
*Includes Luxembourg, because of inaccuracies introduced by cross-border trading. Source: Tighe (2002).
in the soft drinks industry with the detection of benzene in the CO2 used for carbonating those drinks (see http://www.scotland.gov.uk/food/hazards/haz980701.htm).
Other gases Two more gases from air can be found in beer. Oxygen, which can enter into beer when it is transferred between tanks and during the packaging process unless precautions are
The Basics of Malting and Brewing
79
taken, is severely detrimental to quality because it oxidises components of beer, leading to staling and the formation of haze (Bamforth et al. 1993). The most oxidisable molecules in beer are the polyphenols (Owades & Jakovac 1966). On the one hand this serves to protect beer against staling, as these substances act as oxygen scavengers (Walters 1997). However, following their oxidation, they polymerise and crosslink with proteins (the tanning reaction) to form insoluble complexes, which afford an unsightly turbidity (McMurrough & Delcour 1994). Generally speaking, the brewer will err on the side of caution and seek to remove polyphenols as much as possible, by adsorbing them on to polyvinylpolypyrrolidone (PVPP) after the lter process. This will take the total polyphenol content down to less than 100 mg/L, which means that this class of compounds is somewhat less in beer than in products such as red wine and cider, where they contribute to astringency. The PVPP does not enter the beer. Nitrogen has been added to beer for many years, mostly in Ireland and the UK, to promote foam stability (Lindsay et al. 1996). As little as 20 mg of N2 per litre is suf cient to enhance beer foam quality, levels which are vastly lower than those of CO2. In small pack beer the nitrogen is usually accompanied by the use of widgets, which promote nucleation. These plastic or metal inserts are perfectly safe, provided they do not display any disintegration in the container. As the atmosphere is some 79% nitrogen it hardly seems that we need worry about the quantities deliberately introduced into beer.
Water As already stated, most beers comprise 90–95% water and so its composition is critical as a determinant of beer quality. Brewing demands much more water (5–20 times) than the amount which ends up in the beer (UNEP 1996). A lot is needed for cleaning and for raising the steam needed for heating vessels. The water must contain no taints or hazardous components and a brewer may treat all water coming into the brewery by procedures such as charcoal ltration and ultraltration (Katayama et al. 1987). The water must also have the correct balance of ions (Taylor 1990). Traditionally ale brewing was established in towns such as Burton-onTrent in England. The level of calcium in the water of the region is relatively high (about 350 mg/L), and it is claimed that this is good for ales, whereas low levels of calcium, such as the less than 10 mg/L in Pilsen, is best for bottom-fermented lagers. In many places in the world the salt composition of the water is adjusted to match that rst used by the monks in Burton in the year 1295, a process known as ‘Burtonisation’. Often the brewer will simply add the appropriate blend of salts to achieve this speci cation. To match a Pilsen-type water it is usually necessary to remove existing dissolved ions by deionisation, perhaps by a ltration technique.
80
Chapter Three
Carbohydrates While most of the sugar found in wort is fermented to ethanol by yeast, some carbohydrates remain in the beer. Furthermore, extra sugars (‘primings’) may be added to sweeten the nal product. The carbohydrates surviving into beer from wort are the non-fermentable dextrins and some polysaccharide material. The dextrins are remnants of starch degradation, whereas the polysaccharides derive from cell walls in barley. Most of the starch in the endosperm of barley survives malting, because it is relatively resistant to enzymatic hydrolysis over anything other than prolonged contact times. However, if starch is gelatinised (which can be likened to melting) by heat treatment, then its constituent molecules, amylose and amylopectin, become much more accessible to enzymes. Thus the start of brewing involves gelatinisation, typically at 65°C, a stage known as ‘conversion’. Other cereals, which may be used as adjuncts, have starches that need higher gelatinisation temperatures, e.g. rice and corn, in which starch gelatinises over the range 70–80°C. As stated above, amylase enzymes in the malt degrade the gelatinised starch to fermentable sugars; however, a proportion (usually around 20–25%) remains in the form of unfermentable dextrins. A range of beers is available, which are termed ‘super-attenuated’ but generally marketed as ‘light’, in which all of the available starch is converted into ethanol. To effect this, an exogenous heat-stable glucoamylase or pullulanase of microbial origin is often added to the mash or to the fermenter (Bamforth 1985a). It is not obligatory to approach the problem in this way. By judicious use of the mashing regime, and also perhaps the addition of an extract of lightly kilned or unkilned malt to the fermenter, the enzymes native to malt are suf cient to deal with all the dextrins. The world’s rst approved, genetically modi ed (GM) brewing yeast was transformed to express a glucoamylase; however, as yet this strain has not been used in any commercial operation (Hammond & Bamforth 1994). Indeed, no GM material is knowingly or deliberately introduced into beer by any brewer. The only commodities that are based overtly on products of gene technology are some of the commercial enzymes. However, most brewers do not use these and, where they are used, they are added to the mash, and are denatured and precipitated in the kettle boil. Even so, it needs to be stressed that GM commercial enzymes are themselves rigorously screened before approval for commercial use. Another major carbohydrate component in brewing systems is in the cell walls of barley, a β-glucan comprising β 1–4 links (as in cellulose) but disrupted by occasional β 1–3 links. This molecule is very similar to the β-glucan that is found in oats and which is well known as the ‘soluble bre’ championed as part of oat-based breakfast cereals (Lasztity 1998). While one of the main purposes of malting is to degrade the cell walls through the action of β-glucanase enzymes during germination, in practice some glucan
The Basics of Malting and Brewing
81
always survives into malt (Bamforth & Barclay 1993). Unless it is properly degraded it renders the wort extremely viscous, with attendant problems in the operations of separating the wort from the spent grains and with downstream beer ltration (Bamforth 1994). Thus some brewers mash-in at low temperatures (say 50°C) to allow the β-glucanase (which is sensitive to heat) to act. Additionally a heat-stable glucanase from bacteria (such as Bacillus subtilis) or fungi (such as Trichoderma reesei or Penicillium funiculosum) may be employed (Bamforth 1985a). Barley has been transformed to express a heat-resistant β-glucanase, but it is not yet cleared for commercial use (Mannonen et al. 1993). All of these efforts to eliminate β-glucan are important if production problems are to be avoided, as well as quality problems, for the glucan can cause hazes and precipitates in beer. The beers that will contain the most residual glucan are those that are produced with a high charge of barley adjunct, for instance some well-known stouts. The products of β-glucan breakdown in malting and mashing are not fermentable by yeast, so they survive into beer. Even those beers in which most of the glucan has been converted to low molecular-weight oligosaccharides may be of some value as sources of bre, as it is now understood that any β-linked sugar, no matter how small, may retain some bene cial properties when they reach the lower gut (Schneeman 1999). β-Glucan is not the only polysaccharide found in the cell walls of barley, the other being arabinoxylan. For reasons that are not entirely understood, this seems to survive malting and brewing more readily than does β-glucan, such that beers tend to contain more arabinoxylan than glucan (Schwarz & Han 1995). It also ranks as soluble bre. In the cell wall the arabinoxylan is covalently linked to ferulic acid (Ahluwalia & Fry 1986). This phenolic acid is released during mashing (McMurrough et al. 1996) and survives into beer (unless the beer is made with yeasts, such as those used in the fermentation of wheat-based beers, which contain an enzyme that can decarboxylate the ferulic acid to 4-vinylguiacol, a substance that gives the classic clove-like character to such products). There is huge interest in ferulic acid as an antioxidant (Kroon & Williamson 1999).
Proteins, polypeptides and amino acids The presence of polypeptide material in beer is important for the contribution it makes to foam (Bamforth 1985b). In the processes of malting and brewing, the native proteins of barley undergo considerable degradation and denaturation, such that those present in the nished beer bear little resemblance to those found in the barley kernel. While polypeptides can be bene cial for foaming, they are detrimental in another respect: they can crosslink with polyphenols to form hazes (McMurrough & Delcour 1994). The amino acids in beer provide no real bene t to the beer. If present in excess, they potentiate infection of a product by acting as nitrogen sources for spoilage microorganisms. This is why brewers seek to optimise the level of amino acids in wort, so that the yeast uses up all that is readily assimilable.
82
Chapter Three
Lipids Barley contains about 3% w/w lipid, most of it congregated in the living tissues (embryo and aleurone) (Anness & Reed 1985). Very little lipid, however, survives into beer, making this beverage essentially a fat-free food. This is just as well, from an aesthetic point of view, because lipids are very bad news for beer foam (Bamforth 1985b). The other adverse in uence of lipids is through their ability to act as precursors of stale avours in beer (Drost et al. 1971). The unsaturated fatty acids, such as linoleic acid, may get a good press for their health-giving properties; however, they can be oxidised, ultimately to yield carbonyl compounds that afford aged character to beer. For this reason many brewers try to ensure that as little lipid as possible survives the brewing process and therefore they are meticulous about eliminating solid material at all stages, because the insoluble lipid associates with solids.
Flavours from hops Hops play several roles in the production of beer, but in particular they are crucial as a source of bitterness (from the hop resins) and aroma (from the essential oils) (Neve 1991). The chemistry of hop resins is somewhat complex, but of most importance are the α-acids, which can account for between 2% and 15% of the dry weight of the hop, depending on variety and environment. The higher the α-acid content, the greater the bitterness potential. When wort is boiled, the α-acids are isomerised to form iso-α-acids. The latter are much more soluble and bitter than the α-acids. Isomerisation in a boil is not very ef cient, with perhaps no more than 50% of the α-acids being converted to isoα-acids and less than 25% of the original bittering potential surviving into the beer. Apart from imparting bitterness to beer, the iso-α-acids also promote foaming by crosslinking the hydrophobic residues on polypeptides with their own hydrophobic side-chains, rendering the foam almost solid-like and able to cling to (‘lace’) the walls of the drinking glass (Hughes & Simpson 1994). Furthermore they have strong antimicrobial properties and are able to suppress the growth of many Gram-positive bacteria (Fernandez & Simpson 1995). Beer is not entirely resistant to spoilage but certainly the bitter acids have a strong antimicrobial in uence. Other key factors that render beer extremely inhospitable to microbes are its very low pH (typically in the range 3.8–4.6), lack of oxygen, minimal levels of residual nutrients such as sugar and amino acids, its content of ethanol and perhaps the presence of some other antimicrobial constituents such as polyphenols. No pathogens will grow in beer, even alcohol-free beer. All too familiar food scares such as those due to Listeria, Escherichia coli O-157 and Clostridium botulinum cannot be caused by beer. Increasingly used nowadays are isomerised resin extracts in which one or more of the side-chains of the iso-α-acids has been reduced, using hydrogen gas in the presence of a
The Basics of Malting and Brewing
83
palladium catalyst (Hughes & Simpson 1993). This is because one of the side-chains is susceptible to cleavage by light, yielding a radical breakdown product that reacts with traces of sulphidic materials in beer to produce 3-methyl-2-butene-1-thiol (MBT), a compound that affords a reprehensible skunky aroma. If the side-chain is reduced, it no longer produces MBT. For this reason, beers that are likely to be exposed to light in package (e.g. by being sold in green or clear glass bottles) often contain these modi ed bitterness preparations, which have the added advantage of possessing increased foamstabilising properties. Once again, these products are fully cleared for safe use. Hops contain between 0.03% and 3% w/w of oil, which comprises a complex mixture of at least 300 compounds contributing to beer aroma (Gardner 1997).
Phenolic materials In just the same way that the chemistry of the essential oil fraction of hops is enormously complex, so too is that of the phenolic materials contributed to beer by both barley and hops (Verzele 1986). We encountered ferulic acid above. Other monomeric phenolic species present in beer include catechin and quercetin. Catechin is rmly accepted as an antioxidant, through its ability both to scavenge oxygen radicals and to inhibit the enzyme lipoxygenase, which promotes the initial breakdown of unsaturated fatty acids to staling carbonyls.
Low molecular-weight contributors to beer aroma Many people misguidedly believe that most of the avour of beer is derived from its taste. In fact they are detecting the avoursome materials by the nose, there being only four true characters detected on the tongue: bitterness, sweetness, sourness and saltiness (Bamforth & Hughes 1998). The confusion about what is detected by tongue and what by nose arises because there is a continuum between the back of the throat and the nasal passages. A beer’s smell is the net effect of a complex contribution of many individual molecules. No beer is that simple as to have its aroma determined by one or even a very few substances. The perceived ‘nose’ is a balance between positive and negative avour notes, each of which may be due to more than a single compound from different chemical classes. Some of these volatile substances come from the malt and hops. A great many, though, are side products of the metabolism of yeast. Tables 3.13–3.18 indicate examples of the classes of compounds that contribute to the aroma of beer and which come from yeast metabolism. They can be classi ed as esters (Table 3.13), alcohols (Table 3.14), organic acids (Table 3.15), vicinal diketones (Table 3.16), sulphur-containing substances (Table 3.17), aldehydes (Table 3.18) and
84
Chapter Three
fatty acids. Additionally we can consider the aroma-contributing compounds arising from the malt and hops (see earlier).
Table 3.13
Some esters in beer.
Ester
Flavour descriptor
Range detectable (mg/L)
Ethyl acetate Butyl acetate Isoamyl acetate Ethyl butyrate Isoamyl propionate Phenylethyl acetate Ethyl caprate Ethyl caprylate Ethyl myristate
Solvent, fruity Banana, sweet Banana, apple Papaya Pineapple, aniseed Roses, honey Goaty Apple Vegetable oil
8–42 0.04–0.4 0.6–4 0.04–0.2 0.015 0.05–0.2 0.01–1 0.1–1.5 0.4
Source: most numbers given in Tables 3.13 to 3.18 are derived from Moll (1991).
Table 3.14
Some alcohols in beer.
Alcohol
Flavour descriptor
Typical range detectable (mg/L)
Ethanol Propan-1-ol Glycerol Isoamyl alcohol Cis-3-hexen-1-ol 2-phenylethanol Phenol Tyrosol 4-vinylguiaicol
Alcoholic, strong Alcoholic Sweetish, viscous Vinous, banana, sweet Fresh cut grass Roses, bitter, perfumed Phenol Bitter Clove-like
< 5,000–100,000 3–16 1,300–2,000 30–70 0.025 8–35 0.01–0.05 3–40 0.05–0.55
Source: most numbers given in Tables 3.13 to 3.18 are derived from Moll (1991).
Table 3.15
Some acids in beer.
Acid
Flavour descriptor
Typical range detectable (mg/L)
Acetic Propionic Butyric Valeric Hexanoic Hexenoic Oxalic Succinic
Vinegar Milky Buttery, cheesy Sweaty Vegetable oil Dry leaves
30–200 1–5 0.5–1.5 0.03–0.1 1–5 0.01 2–20 16–140
Source: most numbers given in Tables 3.13 to 3.18 are derived from Moll (1991).
The Basics of Malting and Brewing
Table 3.16
Some vicinal diketones and their reduced derivatives in beer.
Material
Flavour descriptor
Typical range detectable (mg/L)
Diacetyl 2,3-pentanedione 2,3-hexanedione Acetoin 3-hydroxy-2-pentanone
Butterscotch Honey Strawberry Fruity, mouldy, woody
0.01–0.4 0.1–0.15 < 0.01 1–10 0.05–0.07
Source: most numbers given in Tables 3.13 to 3.18 are derived from Moll (1991).
Table 3.17
Some sulphur-containing compounds in beer.
Sulphur compound
Descriptor
Typical range detectable (mg/L)
Hydrogen sulphide Ethyl mercaptan Dimethyl sulphide
Rotten egg Rotting leek, onion, garlic, egg Cooked vegetable, corn, blackcurrant Garlic, burnt rubber Mushrooms Mashed potato Skunk
0.001–0.02 0.001–0.02 0.01–0.2
Diethyl disulphide Methionyl acetate Methional 3-methyl-2-butene-1-thiol
0.001–0.01 0.013–0.03 < 0.05 0.00001–0.03
Source: most numbers given in Tables 3.13 to 3.18 are derived from Moll (1991).
Table 3.18 Some aldehydes in beer. Aldehyde
Flavour descriptor
Typical range detectable (mg/L)
Acetaldehyde Butyraldehyde 3-Methylbutanal Hexanal trans-2-nonenal
Green apples Melon, varnish Unripe banana Bitter, vinous Papery, cardboard
2–20 0.03–0.2 0.01–0.3 0.003–0.07 0.00001–0.002
Source: most numbers given in Tables 3.13 to 3.18 are derived from Moll (1991).
85
4
The Basics of Human Nutrition
If we are to make reasoned judgements on the interrelationship of beer and human health, then it is important that we rst consider the key elements of nutrition. Essentially our bodies require, in the correct balance, the key nutrients for healthy functioning and development. Additionally the diet should be devoid of materials that are damaging. In this context there may be components of our daily intake that, while not of themselves essential nutrients, may serve to counter negative impacts of adverse food constituents or materials present in the environment. For more detailed considerations of human nutrition the reader is referred to Boyle and Zyla (1996). Our bodies need food to provide energy (calories) and the building blocks of our tissues (notably amino acids), for the most part taken into the body in the form of protein, carbohydrates, lipids, vitamins, minerals and water. Our wellbeing is therefore incontrovertibly related to what we eat and drink, in terms of the content of the essentials, the form in which they are present in the food (e.g. carbohydrate in the form of bre acts bene cially in a way quite distinct from that carbohydrate that will overtly provide energy through digestion) and the presence or absence of molecules in the food that may be bene cial or damaging to the body. If any individual component of the diet is present in excess or is insuf cient in quantity, then the diet is out of balance.
Energy The main sources of energy for the human body are carbohydrates, fats and proteins. However, especially in the context of this book, we must stress that alcohol is a source of energy. Energy in food is quanti ed on the basis of calories, one calorie being de ned as the amount of heat required to raise the temperature of one gram of water by one degree Celsius. It is customary to talk in terms of kilocalories (or Calories with a capital C) which equate to 1000 calories. These days it is more scienti cally correct to talk in terms of kilojoules, for the joule has replaced the calorie as the primary unit of energy under the international system of units (SI). (Incidentally, James Prescott Joule, 1818–89, after whom the unit of energy was named, was a member of a famous Staffordshire brew-
The Basics of Human Nutrition
87
ing family.) One joule is de ned as the amount of energy exerted when a force of one newton is applied over a displacement of one metre. It is the equivalent to one watt of power radiated or dissipated for one second. However, calorie is so widely known and used as a term that I employ it here: the term calorie is proving impossible to shake from popular parlance. The reader should be warned that often calorie (without the capital C) is employed in the literature rather than kilocalorie. The number of calories in a foodstuff can be determined in the laboratory by combustion. However the ‘true’ calori c content of a food as it pertains to the diet depends on the extent to which those calories are available to the body. This applies to all components of the diet. Just because something is present in high quantity in a foodstuff it does not necessarily follow that it will get into the body to exert any effect. Many factors may impact, including the form in which the nutrient is present in a food. A metal such as iron may not be assimilated if it is attached to some other component of the diet that passes straight through the gut. Much of the modern work on antioxidants is awed in this way. For example, only if the speci c antioxidants get into the body will they get to the key site where they are able to act. Returning to carbohydrates, those such as starch and sugar are almost completely digested and oxidised by the body and they are ascribed a calori c value of 3.75 kcal/g. Fats, which are digested up to 95%, afford a higher energy level (9 kcal/g) because they are less oxidised than the carbohydrates. The calori c value of protein is generally held to be similar to that of carbohydrate, at 4 kcal/g. Ethanol is ascribed a calori c value of 7 kcal/g, indicating that, molecule for molecule, it is an extremely rich source of energy, second only to fat. If calories in excess of those needed to maintain the body in equilibrium are taken in, then the surplus will be built up in the form of fat, for the simple reason that, pound for pound, fat is a richer energy store than is starch or protein. The converse applies: enhanced energy demand through exercise will ‘burn up’ fat provided that the extra calorie requirement is not met from fresh food intake. We will address the calorie composition (and other key analytical measures) of a range of foodstuffs, including beer, in the next chapter. In North America groups including the National Academy of Sciences and the Institute of Medicine collaborated on the establishment of dietary reference intakes (DRIs). The precise requirement that a human will have for the various components of the diet will differ, depending on issues such as age, sex, climate, activity and weight. Individuals, too, will differ to varying degrees in their metabolic activity. Pregnant and breast-feeding women will need more of each type of nutrient. The DRIs re ect some of these differences. As this is a book dealing with beer, I will restrict consideration to adults over the age of 18 (see Table 4.1). (The reader must bear in mind that the legal drinking age in some countries, including the US, is higher than 18, at 21.)
25–50 79 176 1800 37 2900 63 1000 5 10 80 60 1.2 1.7 19 2 200 2 800 800 350 10 15 150 >500 >750 >2000 50–200 75–250 1.5–3 2–5 1.5–4 70
19–24 72 177 1780 40 2900 58 1000 10 10 70 60 1.5 1.7 19 2 200 2 1200 1200 350 10 15 150 >500 >750 >2000 50–200 75–250 1.5–3 2–5 1.5–4 70
Men
77 173 1530 30 2300 63 1000 5 10 80 60 1.2 1.4 15 2 200 2 800 800 350 10 15 150 >500 >750 >2000 50–200 75–250 1.5–3 2–5 1.5–4 70
51+ 58 164 1350 38 2200 46 800 10 8 60 60 1.1 1.3 15 1.6 180 2 1200 1200 280 15 12 150 >500 >750 >2000 50–200 75–250 1.5–3 2–5 1.5–4 55
19–24
Women
63 163 1380 36 2200 50 800 5 8 65 60 1.1 1.3 15 1.6 180 2 800 800 280 15 12 150 >500 >750 >2000 50–200 75–250 1.5–3 2–5 1.5–4 55
25–50 65 160 1280 30 1900 50 800 5 8 65 60 1.0 1.2 13 1.6 180 2 800 800 280 10 12 150 >500 >750 >2000 50–200 75–250 1.5–3 2–5 1.5–4 55
51+
*REE represents the energy expended by a person at rest. †Rounded values that take into consideration an estimated degree of daily physical activity. Note: For a diet containing alcohol the recommendation is that the population average should have 15% of total dietary energy in the form of protein, 47% as carbohydrate and 33% as fat. Source: Boyle & Zayla (1996) and, in turn, based on the recommendations of the National Academy of Sciences.
Weight (kg) Height (cm) Resting energy expenditure (kcal/day)* Average energy allowance (kcal/kg)† Average energy allowance (kcal/day)† Protein (g) Vitamin A (retinol equivalents) Vitamin D (µg) Vitamin E (mg) Vitamin K (µg) Vitamin C (mg) Thiamine (mg) Ribo avin (mg) Niacin (mg equiv) Vitamin B6 (mg) Folate (µg) Vitamin B12 (µg) Calcium (mg) Phosphorus (mg) Magnesium (mg) Iron (mg) Zinc (mg) Iodine (µg) Sodium (mg) Chloride (mg) Potassium (mg) Chromium (µg) Molybdenum (µg) Copper (mg) Manganese (mg) Fluoride (mg) Selenium (µg)
Table 4.1 Nutritional recommendations. 88 Chapter Four
The Basics of Human Nutrition
89
The values in Table 4.1 presuppose ‘normal’ conditions of health and activity. The number of calories required will vary depending upon the amount of physical exertion. For a male the range might be 2500 through to 5000 kcal per day for the most physically demanding lifestyles. Clearly a foodstuff rich in lipid, and to an only slightly lesser extent alcohol, allows the consumer to take in the energy in a more concentrated form. This must be balanced with satisfying the other nutritional needs as delineated in Table 4.1. Balance is the key word. There are real concerns, for instance, about the tendency of people to shift to sugar-rich drinks as an alternative to, for example, milk. A consequence might be a de ciency in the intake of calcium. In the US, dietary recommendations are also encapsulated within a food pyramid (Fig. 4.1), which was developed by the US Department of Agriculture. The higher up in the pyramid, the more sparing the intake should be. Its emphasis is a plant-based diet high in bre, rich in vitamins and minerals, and low in fat. Beer as a grain-based foodstuff clearly would feature in the lower part of the pyramid, accepting that considerable processing has taken the added-value product away from the whole grain. Other pyramids exist. Two of relevance are the Mediterranean pyramid (Fig. 4.2) and the California pyramid (Fig. 4.3). The former recognises the so-called French Paradox (see Chapter 6), which describes the lower than expected incidence of heart disease and some cancers in Mediterranean countries. This has been ascribed by some to antioxidants but by others to alcohol. In particular much has been written about the merits of red wine
Fig. 4.1 The food pyramid. Reproduced courtesy of US Department of Agriculture and US Department of Health and Nutrition Services.
90
Chapter Four
Fig. 4.2
The Mediterranean food pyramid. Reproduced courtesy of Chef Depot (www.chefdepot.com).
Fig. 4.3 The California food pyramid. Reproduced courtesy of David Heber, MD, PhD, The Resolution Diet, Avery Publishing Group, 1999.
The Basics of Human Nutrition
91
in this context. Notwithstanding, the Mediterranean pyramid refers to ‘wine in moderation’. It also reinforces messages about exercise underpinning the correct diet.
Phytonutrients The importance of antioxidants is highlighted in the California pyramid, with the baseline here occupied by foodstuffs, notably fruits and vegetables, which are rich in these and other ‘phytonutrients’ (i.e. plant-derived nutrients). People living on plant-rich diets generally appear to have lower incidence of disease. This has prompted a search for the active ingredients, of which some are undoubtedly antioxidants. Others may regulate enzyme action and in uence the production or elimination of relevant components. Thus there has developed a large market for herbal supplements. It is in this context that attention has been paid to the hop (see Chapter 6). Phytochemicals are de ned by the US Food Administration as substances of plant origin that may be ingested by humans daily in gram quantities and which exhibit the potential for modulating metabolism such as to be favourable for cancer prevention and cardiovascular protection (Rincon-Leon 2003). The word ‘nutraceutical’ has crept into common parlance. For those preferring their phytonutrients in food – as opposed to supplement – form, Gollman and Pierce (1998) offer one useful recipe book. The authors endeavour to present their recipes from an underpinning scienti c perspective. Alas, beer is not featured. Wine is – yet we will discover in Chapter 6 that beer is likely at least the equal of wine from a health perspective.
Carbohydrate, fat and protein Although carbohydrate, fat and protein are interchangeable through pathways of intermediary metabolism in the body, the relative amounts of each are not irrelevant. Carbohydrates, then, can ‘spare’ protein if they are present in adequate quantities. If they are not, then the body will use protein, which is a key component of muscles and other body tissues. Health experts suggest that about 60% of calorie intake should be as carbohydrate. Even within a category, there can be signi cant differences. More complex forms of carbohydrate, e.g. starch, will linger in the body longer than will simpler sugars, allowing the growth of microbes to take place and the attendant enrichment of vitamins in the uxing food. The converse can apply. Some individuals are lactose-intolerant, with this sugar being poorly absorbed and leading to attendant diarrhoea. For proteins, a key feature of their value in the diet is their relative content of the various amino acids. The best proteins are those containing all of the essential amino
92
Chapter Four
acids (which the human body cannot synthesise) presupposing that those proteins are indeed taken up by the body. Meat, sh, milk and egg proteins are generally good. Barley protein is relatively de cient in two amino acids, lysine and (to a lesser extent) threonine, though high lysine variants have been developed (Kasha et al. 1993). Of course most diets don’t usually contain just a solitary source of protein, and generally there is an appropriate mix of animal and vegetable proteins. The fats provide the essential fatty acid, linoleic acid, which the human body cannot synthesise. Unsaturated fatty acids of this type are associated with a lower incidence of coronary heart disease: they lower cholesterol levels. Beer is essentially fat free.
Vitamins Vitamins are organic substances that the human body cannot synthesise itself and which must be provided in the diet (Finglas 2003). They have various functions in the body and are customarily divided into the water-soluble vitamins and the fat-soluble vitamins; they are summarised in Table 4.2. For the most part they are not required in very large quantities, but it must be borne in mind that the composition of the food matrix in which they are present can impact on their availability. One example is the higher requirement Table 4.2 Vitamins and their significance. Vitamin Fat soluble A (retinol)
D
E K Water soluble C B1
B2 Niacin B6 Pantothenic acid B12 Folic acid Biotin
Notes Not present in plants, but precursor β-carotene is, and this can be converted by human to retinol. Shortage leads to blindness, bone/teeth failures of development; diseases of cells in throat, nose and eyes leading to infection risk. Excess toxic Actually can be formed in skin by contact with light. Needed for ef cient use of calcium and phosphate. De ciency causes rickets. Can be formed by irradiation of ergosterol from yeast α-Tocopherol. Antioxidant, protecting e.g. unsaturated fatty acids and vitamin A Needed for normal blood clotting
Ascorbic acid. De ciency causes scurvy. An antioxidant, e.g. for beer Thiamine. De ciency causes beri-beri. Sensitive to sulphur dioxide that is sometimes used for preserving beer. Like all the B vitamins a very good source is yeast and cereal germ and bran, e.g. from barley and wheat Ribo avin. Very sensitive to light De ciency causes pellagra Pyridoxine. Reduces risk of cardiovascular disease and osteoporosis. No recognised de ciency disease Symptoms in case of shortage include depression Shortage causes pernicious anaemia Prevents certain anaemias Important for healthy nails
The Basics of Human Nutrition
93
for thiamine if alcohol is present at high levels. It is equally important to stress that excessive intake of vitamins may have adverse effects. For the most part this pertains to two of the fat-soluble vitamins, A and D, though B6 at levels above 50 mg per day or nicotinic acid in excess of 2–6 g per day are of concern for neurological damage and liver damage respectively (Finglas 2003).
Minerals Table 4.3 lists the requirements of the human for minerals and their various impacts. Minerals comprise only 4–6% of the body (Freeland-Graves & Trotter 2003) and some of them are needed only in vanishing quantities. Calcium, chloride, magnesium, phosphorus, potassium and sodium are the major minerals. Chromium, copper, uoride, iodide, iron, manganese, silicon and zinc are needed in trace quantities. Arsenic, boron, molybdenum, nickel, selenium and vanadium are ‘ultra trace’ minerals.
Table 4.3 Minerals and their significance. Mineral
Notes
Calcium
Needed for teeth and bones (e.g. lack causing osteoporosis in older women) and blood clotting. By interaction with phosphate these two minerals mutually antagonise one another’s uptake. Also binding with other components will limit uptake, e.g. oxalate Needed for teeth and bones and energy metabolism Needed for nerve and muscle function Component of haemoglobin and myoglobin. Uptake may be limited by complex formation, e.g. with phytate and phosphate Component of key oxidative enzymes Part of vitamin B12 Needed by several enzymes; implicated in reproduction, growth, skin integrity and wound healing Maintenance of osmotic equilibrium and body uid volume Maintenance of osmotic equilibrium and body uid volume. Also needed in manufacture of stomach hydrochloric acid Helps sodium in regulating ionic balance across membranes Part of thyroid hormone, de ciency causing goitre Needed for sound teeth and bones Glucose metabolism, insulin sensitivity Cartilage and bone equity, lipid and carbohydrate metabolism Bone calci cation and cartilage formation Taurine and polyamine metabolism Antioxidant, thyroid hormone metabolism Energy utilisation, bone development Sulphur and nucleic acid metabolism Production of hormones Iodine metabolism
Phosphorus Magnesium Iron Copper Cobalt Zinc Sodium Chloride Potassium Iodine Fluoride Chromium Manganese Silicon Arsenic Selenium Boron Molybdenum Nickel Vanadium
94
Chapter Four
Fibre The term is unfortunate, for not all of the components generally considered under this heading are actually brous. Perhaps ‘roughage’ after all is no worse a term (Kritchevsky & Bon eld 1995). The majority of materials considered to be dietary bre are plant cell wall components including celluloses, hemicelluloses (such as are found in the cell walls of barley) and pectins. There can be a further division into soluble and insoluble fractions, though it must be remembered that this refers to what is solubilised in standard laboratory analytical procedures and not necessarily what happens in the gastrointestinal tract. Insoluble components may serve to delay the digestion of other components via physical blocking. The soluble components, on the other hand, will afford increased viscosity if they are of high molecular weight, thereby lengthening transit time in the gut and also the rate at which digestion products (e.g. glucose) are taken through the gut wall. This may also explain the impact of dietary bre in reducing the absorption of cholesterol. These materials hold water, lead to a softening of stools and accelerate the passage of the stool through the large intestine. Research in recent years has demonstrated the merits of bre in lowering plasma cholesterol levels, reducing cancer incidence, lessening the need for diabetics to take insulin, and so on. The understanding of the precise structural features in bre which lead to best effect is less than clear (see Johnson 2003). The beer carbohydrates comprising soluble bre (which will include the degradation products of barley cell wall polysaccharides and also the dextrins produced during starch degradation; see Chapter 3) escape absorption in the small intestine, thus becoming nutrients for bacteria located in the large bowel. The importance of these organisms to gut function and health has become well recognised in recent years and has led to the concept of probiotics and prebiotics. Probiotics are organisms, notably lactobacilli and bi dobacteria, which are added to diet to boost the ora in the large intestine. For example they are added to yoghurt (Young 1998). Prebiotics are nutrients that boost the growth of these organisms. These may include oligosaccharides that may promote the growth of the appropriate organisms (Gibson 1999; Roberfroid 2001). Microbes in the large intestine produce methane and other gases as a result of their metabolism, and the atulence experienced after drinking beer may relate to this activity (but see Chapter 6). It also needs to be borne in mind that materials capable of binding to the bre passing straight through the digestive system will also be less available to the body. This might include certain minerals and vitamins (Prosky 2003).
The Basics of Human Nutrition
95
Water The human body is almost two-thirds water. Loss of 5–10% of the body weight as water leads to symptoms of dehydration. Evidently the greater the risk of water loss, the greater the need for rehydration. Clearly if the water is also carrying away with it other nutrients, e.g. minerals, then these will need to be replaced in quantities that restore the status quo.
Balance To reiterate: the diet needs to be in balance. And this includes ‘trendy’ food ingredients – the so-called functional food ingredients. Excessive bre can lead to problems with intestinal gas, perhaps intestinal obstruction, and a reduced absorption of essential minerals such as zinc, iron and calcium. Uptake of minerals can also be restricted by chelating agents such as phytate and oxalate. Polyphenolics can bind metals such as iron and so reduce uptake. Phosphates reduce the uptake of zinc while calcium interferes with assimilation of manganese. Another example is that high levels of antioxidants such as vitamin C can switch over and become pro-oxidants. As is said more than once in this book, beer should be taken in moderation as part of a balanced diet. The same goes for all other foodstuffs.
5
The Composition of Beer in Relation to Nutrition and Health
In Chapter 2 we encountered the changing opinions on the importance of beer as part of the diet. Seemingly on Captain Cook’s ships beer contributed as many calories to the sailors’ diets as biscuits (bread) and meat combined (Feeney 1997). Of course this a priori signi cance of beer is tilted rather differently nowadays; however, beer can still offer signi cant contributions to the diet, quite apart from its role as a thirst quencher and substantial contribution to the holistic dining experience. Norris (1946) and Stringer (1946) contributed some of the earliest and most authoritative assessments of the worth of beer to the adult diet. These papers were based on presentations to a joint meeting of the Institute of Brewing and the Nutrition Panel of the Society of Chemical Industry in December 1945. World War II had just concluded and Norris observed that: … there has been great activity on the nutrition front, largely as a result of the stress of war, and it is not unpro table to examine the position in regard to beer in the light of recently acquired knowledge of dietary requirements … Norris (1946) In the discussion recorded after that meeting, which was held at the historic Horse Shoe Hotel on Tottenham Court Road, Dr S.K. Kon was moved to offer his opinions, recorded as follows: The two papers had underlined the nutritional importance of fermented beverages for a civilian community in war. He believed it was an open secret that when Dr Sydenstricker came here from the United States, in 1941, when nutritional problems were very dif cult, he found much less de ciency disease than was expected, and there seemed little doubt that the explanation, or part explanation, was the riboavin and nicotinic acid intake from beer, and possibly from tea. In that way this country seemed to have solved one or two nutritional problems more satisfactorily than the otherwise more fortunate USA. But the importance of beer becomes even greater when the nutrition is considered of the more primitive natives such as those of Africa. From the studies carried out there recently it would really seem that the local fermented native beer may be at times almost the sheet anchor of nutrition.
The Composition of Beer in Relation to Nutrition and Health
97
Energy Too often in nutritional texts all beers are lumped together with one generalised compositional listing. It must be borne in mind, though, that beers can differ enormously in their composition, depending on their strength and how they were made, including the grist materials employed (see Chapter 3). Thus the alcohol content may range from in excess of 10% (v/v) in beers produced in Trappist monasteries to < 0.05% in the alcohol-free products. Most beers worldwide have an alcohol content in the range 3–6% (v/v). Note that ethanol has an energy contribution of 7 kcal per g (c.f. protein 4 kcal/g and carbohydrate 3.75 kcal/g). Additionally, conventionally fermented beers may retain some 25% of the starch in a partially degraded, non-fermentable form which will also contribute to the calorie count. By contrast, so-called light beers generally contain minimal levels of carbohydrate. Some two-thirds of the energy value in a regular beer originates in the alcohol. Brewers use the following formula (ASBC 1992) to calculate the calori c value of a beer: kcal in 100 g beer = 6.9(A) + 4(B – C) where A = alcohol (% by weight), B = real extract (% by weight) and C = ash (% by weight) The ‘real extract’ is a measure of the total dissolved solids in the beer. The major components of this are residual unfermented carbohydrates, some protein and ash (inorganics). The myriad of avour components contributes relatively little and can be ignored in this context. The ash has no calori c value and is therefore subtracted from the residual extract number. Martin (1982) suggested a more exact formula, which takes into consideration more precisely the individual contributions of the major beer components: Calori c value (kcal/100 mL) = [ethanol (g/100 mL) × 7] + [total carbohydrates (as glucose g/100 mL) × 3.75] + [proteins (g/100 mL) × 4] Tables 5.1 to 5.4 compare the calori c values of a diversity of beer brands, respectively ales, lagers, wheat beers and seasonal beers. Ethanol is just as assimilable as other sources of energy (Hawkins & Kalant 1972; Wei et al. 1972). Forsander (1998) has amply shown why he claims that, as a source of energy, ‘ethanol should be an excellent nutrient’. It is used by the body as ef ciently as other energy sources, it requires no digestion by the body before it enters the bloodstream by diffusion, and it is transferred to all cells without the need for an energy-demanding transport system.
98
Chapter Five
Table 5.1 Calorific value of a range of ales (per 355 mL). Brand
kcal
BridgePort India Pale Ale India Ale Greene King IPA Deuchars IPA Indian Pale Ale James Squire IPA Imperial Pale Ale Indica IPA Full Sail IPA Woodstock IPA India Pale Ale Quail Springs IPA Hop Ottin’ IPA Pyramid Indian Pale Ale Wolaver’s India Pale Ale Rogue XS Imperial Ale India Pale Ale Old Nick Old Horizontal/Barleywine Style Ale Hobgoblin Extra Strong Ale Rogue XS Imperial Ale Maredsous Abbey Ale Dobbel 8.1% Ballantine Burton Ale Dominion Millennium Druid Fluid Barley Wine Blue Heron Ale Old Brewery Pale Ale Organically Produced Ale Bass Co’s Pale Ale Augustinian Ale Golden Thread Old Speckled Hen Sparkling Ale St. Andrews Ale Young’s Ram Rod Fuller’s ESB Fuller’s 1845 Belhaven Scottish Ale Old Peculiar Speights Pale Ale Maudite Little Creatures Pale Ale Point Pale Ale Sierra Nevada Pale Ale Three Floyds X-Tra Pale Ale Dead Guy Ale Black Oak Pale Ale Liberty Ale Arrogant Bastard Ale Full Sail Pale Paci c Ridge Pale Ale
180.6 161.7 124.2 139.3 101.6 177.5 229.9 211.8 199.7 199.7 184.6 191.9 207.6 220.8 202.2 278.5 174.0 259.8 346.6 165.0 278.5 222.0 232.0 320.2 279.0 145.3 152.7 160.0 150.1 155.4 152.6 163.2 151.3 139.6 159.4 183.4 202.6 128.2 177.6 127.8 222.7 163.5 177.0 170.2 145.8 207.0 151.0 189.7 238.5 179.8 198.0
(Continued.)
The Composition of Beer in Relation to Nutrition and Health
Brand
kcal
Sunnyside Pale Ale Pale Ale Dog Town Pale Ale Single Track Copper Ale Old Slugger Pale Ale Mirror Pound Pale Ale Saranac Pale Ale Ruedrich’s Red Seal Ale Porch Swing Single Ale Ruth All American Ale Pale Ale Syracuse Pale Ale Hop Jack Pale Ale Union Pale Ale Mobjack Pale Ale Wild Salmon Pale Ale Telemark Ale Shelter Pale Ale Seneca Trail Ale Sam Adams Pale Ale Holyoke Dam Ale Beast Bitter Long Trail Pollenator Ale Yuengling Black & Tan Ballantine Ale Summit Extra Pale Ale Jackman’s American Pale Ale Casta Pale Ale Casta Dark Ale Beamish Irish Cream Stout Guinness Extra Stout
150.9 160.3 165.6 154.5 164.3 169.2 177.2 173.6 172.0 183.5 169.3 159.2 169.8 186.3 159.0 156.2 151.1 143.6 166.3 163.7 156.1 160.0 151.2 151.0 175.2 156.0 172.4 179.0 190.0 131.4 152.7
99
Sources: Most of the data in this table is reproduced courtesy of Carlos Alvarez & Jaime Jurado (Gambrinus). The data was originally published by Jurado in a series of articles in The Brewer International. Most of the remaining information is from http://brewery.org/brewery/library/AlClbinger.html.
Although for many people the focus on alcoholic beverages is the potential negative impacts when consumed in excess, the question of their contribution to obesity is perhaps the major concern, as obesity is associated with many other health problems, including hypertension, cancer, cardiovascular disease and type II diabetes. In the US 39% of men and 36% of women are overweight (National Research Council 1989). The research of Peeters et al. (2003) suggests that obesity is at least as dangerous as smoking as a causal agent of death. The US Surgeon-General recently expressed the concern that obesity will soon overtake cigarette smoking as the leading cause of preventable disease and death (see http://www.surgeongeneral.gov/topics/obesity/default.htm). Most drinkers add alcohol to their normal diet (Prentice 1995) rather than substitute it. Thus total calorie intake is increased and, if not metabolically utilised by exercise,
100
Chapter Five
Table 5.2 Calorific value of a range of lagers (per 355 mL). Brand
kcal
Budweiser Bud Light Michelob Pilsner Urquell Pete’s Signature Pilsner CD Pils Premium Pils Stone Hammer Pilsner Stoudt’s Pils Summer Pils Harpoon Pilsner Saratoga Pilsner Paper City Pilsner Prima Pils Pils Pilsner Pilsner Zephyrus Pilsner Blue Paddle Pilsner Golden Pilsner Pete’s Wicked Helles Andechser Spezial Hell Lagerbier Hell Kaltenberg Hell Original Bayrisch Mild Urtyp Hell Wurziges Helles Edelstoff Meistersud Spezialbier Lowenbrau Original Lowenbrau Schloss Gold Urtyp Hell Spezial Münchner Hell Export Hell Original München Helles Export Lager 2000 Original Münchner Edel-Helles Brau Hell Münchner Hell Appenzeller Bier Premium Pils Shiner Blonde Black Oak Lager Golden Ale Blonde Ale Vienna Style Lager Ichiban Special Reserve Amstel Lager Black Label Michelob Ultra
142 107 156.2 157.5 161.5 151.9 149.4 143.6 145.5 168 160.1 159.4 145.5 166.4 170.6 158.1 172 159.6 155.7 161.6 163.5 178.2 148.6 148.9 154.3 156.3 152.2 165.6 173.7 152.7 148.4 159.8 149.2 170.3 146.3 162.1 145.5 159.0 150.6 149.3 164.6 156.4 151.6 141.5 146.3 141.8 144.0 128.9 166.1 154.2 145.5 146.6 137.7 96
Sources: Most of the data in this table is reproduced courtesy of Carlos Alvarez & Jaime Jurado (Gambrinus). The data was originally published by Jurado in a series of articles in The Brewer International. Most of the remaining information is from http://brewery.org/brewery/library/AlClbinger.html.
The Composition of Beer in Relation to Nutrition and Health
101
Table 5.3 Calorific value of a range of wheat beers (per 355 mL). Brand
kcal
Shiner Winter Ale Shiner Hefeweizen Pete’s Honey Wheat Half Ton Hefeweizen Hefeweizen Eramosa Honey Wheat Celis White Penn Weizen Weizen Bock Ramstien Kristall Wheat Beer Classic Wheat Beer Hefeweizen Hefe-Weizen Hefeweizen Hefe Weizen Wheat Beer Whistlepin Wheat Ale Kristall Weizen Wheat Beer Bert Grant’s Hefeweizen Ramstein Blonde Wheat Beer Hefeweizen Jack Whacker Wheat Ale Honey Weiss Bier Sunshine Wheat Bear Franziskaner Hefe-Weisse Paulaner Hefe-Weizen
189.2 168.0 154.6 172.9 173.7 130.2 182.9 170.5 264.8 154.1 189.0 179.7 157.6 147.5 148.8 148.9 156.4 157.8 145.8 153.4 180.5 155.5 133.3 143.5 139.8 151.9 169.0
Sources: Most of the data in this table is reproduced courtesy of Carlos Alvarez & Jaime Jurado (Gambrinus). The data was originally published by Jurado in a series of articles in The Brewer International. Most of the remaining information is from http://brewery.org/brewery/library/AlClbinger.html.
weight gain will result. If a person consumes 1.6 MJ (roughly the level of calories in a couple of pints of beer) more than is needed as an energy supply to maintain bodily functions then this may result in approximately 1 kg per month gain in weight. However 250 calories is ‘knocked off’ by cycling briskly for 25 minutes, jogging for a similar period, swimming for 30 minutes, gardening for 50 minutes or walking for 60 minutes. (In the days when malting and brewing processes demanded hefty manual labour, such as turning the malt by fork or shovelling out spent grains, the operatives had a generous daily beer allowance. They didn’t get fat: the beer rehydrated them and replenished the calories they were burning off.) Of course it would be totally incorrect to label beer as being a prime factor in causing obesity in moderate drinkers. Any foodstuff loaded with calories will impact and, certainly in a consumer society such as the US with its fast food and generously sized portions, it is likely that for most people alcohol is not the prime source of their excess
102
Chapter Five
Table 5.4 Calorific value of a range of seasonal beers (per 355 mL). Brand
kcal
Pete’s Wicked Winter Brew Pintail Ale Pete’s Wicked Summer Brew Shiner Summer Stock Koelsch-Style Summer Ale Young’s Summer Beer St. Peter’s Summer Ale Hopback Summer Lightning Curve Ball Kolsch Style Ale Sommerbrau Kolsch Beer Zommerfest Kosch Style Summer Ale Spring Brew Speciality Lager Sam Adams Spring Ale Summerfest Sam Adams Summer Ale Juju Ginger Ale Pete’s Wicked Oktoberfest Oktoberfest Marzen Amber Original Oktoberfest Hacker-Pschorr Ayinger Oktober Fest-Marzen Sam Adams Oktoberfest Frambozen Framboise Lambic Blue Moon Abbey Ale Thomas Kemper Roggen Rye Rogue Honey Cream Ale Apricot Ale Young’s Waggledance Honey Ale Pete’s Wicked Strawberry Blonde Samuel Smith’s Winter Welcome Ale Winterbraun Holiday Ale Christmas Brew Royal X-Mas Brew Jubel Victory Dark Lager
170 160 163 150 123.9 136.0 206.7 140.9 143 145 151 186 172.9 150 163.2 106 189 178.0 178.8 171.1 192 192 173 183 167 148 162 147 160 183.9 230.5 165.0 166.3 170 169.2
Sources: Most of the data in this table is reproduced courtesy of Carlos Alvarez & Jaime Jurado (Gambrinus). The data was originally published by Jurado in a series of articles in The Brewer International. Most of the remaining information is from http://brewery.org/brewery/library/AlClbinger.html.
calories. Table 5.5 compares the calorie count in a pint of regular beer with that of other components of the diet. Nonetheless there is considerable interest in so-called Light beers, with their reduced calorie content (Table 5.5). Such brands represent the big growth segment of the brewing sector in the US. According to MacDonald et al. (1993), some 4–6% of the energy intake of the western diet is in the form of alcohol. They highlight that separate studies have led to different
The Composition of Beer in Relation to Nutrition and Health
103
Table 5.5 A comparison of beer with other foodstuffs – energy, protein, fat, carbohydrate and fibre. Food
Size of serving (weight or volume)
Energy (kcal)
Beer* Light beer Cola Milk Tea (black) Coffee (black) Wine, white Wine, red Whisky (80 Proof) Apple Banana Cabbage, cooked Carrot, cooked Lettuce, Iceberg Tomato Potato, baked Bread, white Corn akes Spaghetti, cooked Sirloin steak, broiled Pork sausage, cooked Chicken breast, roasted Egg, raw Cod, cooked (dry) Cheese. Cheddar Chocolate, milk
UK pint (568 mL) UK pint (568 mL) 12 uid ounces (355 mL) 1 cup 6 uid ounces (178 mL) 6 uid ounces (178 mL) 5 uid ounces (148 mL) 5 uid ounces (148 mL) 1.5 uid ounces (44 mL) 1 medium 1 medium 0.5 cup 0.5 cup 1 cup 1 medium 1 1 slice 1 cup 0.5 cup 3 ounces (85 g) 3 ounces 3 ounces 1 large 3 ounces 1.5 ounces 1 bar (1.5 ounces)
250 158 152 150 2 4 100 106 97 81 109 17 35 7 26 220 67 102 99 229 314 141 75 89 171 226
Protein (g) 2.8 0 8 0 0
0 1 1 1 1 1 5 2 2 3 23 17 27 6 19 11 3
Fat (g)
Carbohydrate (g)
Fibre (g)
0 0 0 8 0 0 0 0 0 0 1 0 0 0 0 0 1 0 0 14 27 3 5 1 14 14
16 9 38 11 1 1 1 2 0 21 28 3 8 1 6 51 12 24 20 0 1 0 1 0 1 26
ca. 1 0 0 0 0 0 0 0 4 3 2 3 1 1 5 1 1 1
0
* For a beer of 12° Plato produced from an all-malt grist. 1° Plato is approximately equal to a 1% solution of carbohydrate in the wort prior to fermentation. The higher this value, the higher will be the concentration of alcohol produced during fermentation (see also Tables 5.1 to 5.4). The amount of carbohydrate left in the beer will be much lower than in the wort; however, that which is not fermented will remain, together with any that is added to the nished beer as a sweetener to balance bitterness. Source: Encyclopedia of Foods: A Guide to Healthy Nutrition (2002).
conclusions concerning the impact of alcohol on body mass index (BMI): those which say there is a positive correlation, those saying that there is a negative correlation, and those claiming no correlation whatsoever. It seems that in many of the studies confounding factors have not been taken into consideration, including physical activity, tobacco use and other lifestyle attributes. Jacobsen and Thelle (1987) refute the notion of the ‘beer belly’ with their demonstration of a negative correlation between BMI and beer intake. Incidentally BMI is de ned as weight in kg/(height in metres)2 or [weight in pounds/(height in inches)2] × 703. Overweight is de ned as a BMI of 25–29.9, and obesity is a BMI of > 30. For those with a BMI > 30 the all-causes risk of mortality is 50–100% higher than for those with a BMI between 20 and 25. Alcohol consumption bears an inverse relationship to sugar use (Kubler 1990). In fact most studies suggest that at moderate levels alcohol is itself ef ciently used as a
104
Chapter Five
fuel by the liver (Mitchell & Herlong 1986). Gibney et al. (1989) suggest that there is an inverse relationship between energy derived from alcohol and that from dietary fat. On the other hand, Le Marchand et al. (1989) claim that abstainers consume more vitamins, calcium, fruit and raw vegetables, while drinkers took in more fat (especially polyunsaturates), meat, pickled vegetables and dried sh. It appears as if alcohol is causing a higher metabolic rate (Klesges et al. 1994; Orozco & de Castro 1994) perhaps with an increased burning up of fats (Suter et al. 1992). Rumpler (1994) from the USDA Human Nutrition Research Center claimed that consuming moderate amounts of alcohol did not cause weight gain or an excess of body fat. He suggested that alcohol may help the body to regulate appetite. People who consume alcohol but who are not alcoholics appear to add the energy from alcohol to their normal energy intake rather than replace food with alcohol (Jones et al. 1982). That this increased energy intake does not necessarily translate into body mass may be because alcohol stimulates the basic metabolic rate (MacDonald et al. 1993). So it does not appear that additional calories from alcohol are compensated for by a reduction in calorie intake from other foods (Westerterp-Plantenga & Verwegen 1999). In contrast, pre-dinner drinks in which carbohydrate, protein or fat was the prime energy source led to a reduction in the amount of food eaten during the meal. Richter (1926) and Eriksson (1969), however, presented evidence to suggest that voluntary alcohol intake depresses food consumption in proportion to its energy content. Forsander (1988) showed that ethanol suppresses the consumption of carbohydrate but not fat or protein. There have been various reports that a high carbohydrate/low protein food depresses voluntary alcohol intake, while a low carbohydrate/high protein diet increase it (Hauser & Iber 1989). Candy is recommended to those with a predilection to consume alcohol to excess (Biery et al. 1991). Istvan et al. (1995) says that those who drink regularly, but each time in relatively small amounts, have lower body weights than those who drink a lot at once or don’t drink at all. Direct studies in which alcohol was ‘control fed’ to humans showed that, under normal living conditions, moderate alcohol consumption (e.g. 60–75 g alcohol per day, which is equivalent to approximately 2 litres of average strength beer daily) had no measurable impact on energy balance and body weight over a period of approximately one month (MacDonald et al. 1993). Another index of body mass (perhaps of most interest to women) is waist : hip ratio (WHR). Just as for BMI, it has variously been concluded that alcohol lowers (Kaye et al. 1990), raises (Lapidus et al. 1989) or has no effect (Haffner et al. 1986) on WHR. In a recent investigation, Buemann et al. (2002) measured the amount of food consumed by subjects given beer, wine or a carbonated soft drink with the meal. When people were given a designated quantity of each drink there was no signi cant difference between any of the beverages in respect of impact on the amount of food consumed. However, when they were given less of the drink and allowed to consume the whole
The Composition of Beer in Relation to Nutrition and Health
105
serving or a lesser amount at their will, then the total energy intake (food plus drink) was rather higher for those taking wine as opposed to beer or the soft drink.
Carbohydrate, fat and protein Beer is essentially fat free. Fats are highly water-insoluble molecules which, when present in foodstuffs, are either in the form of emulsions or within a solid matrix. Beer, of course, is largely water, and most beers contain very few insoluble solids. A range of carbohydrates can be found in beers. For most beers, the majority of these are the partial degradation products of starch, which generally amount to 20–25% of the original starch. These dextrins (see Chapter 3) will afford calories if the body uses them, but will contribute to the soluble bre component if they survive to the large gut where they may form part of the feedstock for the micro ora. The polysaccharides that originate in the barley cell walls, and their breakdown products, also contribute to the soluble bre complement. Some sugars may survive fermentation, but if there are sugars in beer it is usually because brewers have added them in small quantities to balance sourness and bitterness. Although beer does contain some protein, indeed rather more than in other alcoholic beverages, the levels are somewhat lower than in many other foodstuffs. Beer contains the essential amino acids, at levels of the order of 5–10 mg per 100 g (Table 5.6). Table 5.6 Amino acid composition of beers. after Hough et al. (1982) Amino acid (mg/L)
after Darby (1979)
after Hardwick (1995)
Histidine Isoleucine Leucine Lysine Methionine Phenylalanine Threonine Tryptophan Valine Arginine Proline Aspartic Serine Glutamic acid Glycine Alanine Tyrosine Cysteine Cystine
5.9–20.4 2.1–6.6 2.0–10.9 0.2–4.4 1.4–2.7 3.1–32.4 3.7–4.6 8.6 2.9–17.8 2.0–9.4 151–169 4.5–20.6 5.3 1.2–6.6 8.1–11.5 14.5–21.6 14.7–28.4 Trace
9–50 5–40 3–60 5–60 0–10 5–99 0–10 1–12 5–80 9–110 ± 400 6–45 2–12 9–50 9–45 10–130 9–80 0–11 0–6
India Pale Ale (10.75 P)
2.6
11.1
177
1.3
Draught Bitter (10.2 P) 0.06 0.19 3.1 1.5 3.1 4.1 12.9 0.19 1.1 178 1 0.9 0.9 0.5 2.7 2.2
Stout (11.25 P)
2.5 2.5 1.25
1.25 3.1
238 1.25 1.25
106
Chapter Five
Water The recommended daily intake of water for an adult male in temperate climates is 2.5 litres, to be increased in relation to local temperature and/or physical exertion. Nutritionists recommend the consumption of at least eight 8-ounce glasses of water daily. Beer, being at least 90% water, can clearly be a signi cant contributor to water intake. In regions of heavy industry, beer has long been championed. We cannot ignore the fact that alcohol exerts a diuretic effect (see chapter 6). Clearly, though, as beer is a drink customarily of lower alcohol content than other alcoholic beverages it is the more useful as a source of water. The lower alcohol beers have been promoted as sports drinks, as an opportunity for replenishing water, minerals and energy to the body (Piendl 1990).
Vitamins The observation that alcohol suppresses the desire to take up calories from other foodstuffs (see above) raises concerns about unbalanced diets, in particular that those who depend on alcohol as a source of calories run the risk of vitamin shortage. In this context beer, with its nite vitamin content, would be a wiser beverage than other alcoholic drinks (though, of course, it is wisest to use it in moderation as part of a properly balanced diet). Table 5.7 shows the vitamin content of beers and Table 5.8 that of beer in relation to a range of other foods. Beer can be a valuable source of many of the water-soluble vitamins, notably folate, ribo avin, pantothenic acid, pyridoxine and niacin. As much as 10% of the daily intake of folate might come from beer in some countries. The fatsoluble vitamins do not survive into beer and are lost with insoluble components in processing (grains, trub and yeast). Some beers will contain vitamin C, because this material is added to protect the beer from oxidation.
Table 5.7 Vitamin content of beers. Derived from Hough et al. (1982) Vitamin (µg/L)
Lagers
Ales
Derived from Moll (1994)
Biotin Nicotinic acid Pantothenic acid Pyridoxine Ribo avin Thiamine Folic acid B12
7–18 4494–8607 1093–1535 329–709 219–420 15–58
11–12 7500–7753 1375–1808 341–546 331–575 59–181
2–15 3000–8000 40–2000 70–1700 20–800 3–80 40–600 3–30
UK pint (568 mL) 12 uid ounces (355 mL) 1 cup 6 uid ounces (178 mL) 6 uid ounces (178 mL) 5 uid ounces (148 mL) 5 uid ounces (148 mL) 1.5 uid ounces (44 mL) 1 medium 1 medium 0.5 cup 0.5 cup 1 cup 1 medium 1 1 slice 1 cup 0.5 cup 3 ounces 3 ounces 3 ounces 1 large 3 ounces 1.5 ounces 1 bar (1.5 ounces)
Beer* Cola Milk Tea (black) Coffee (black) Wine, white Wine, red Whisky (80 proof) Apple Banana Cabbage, cooked Carrot, cooked Lettuce, Iceberg Tomato Potato, baked Bread, white Corn akes Spaghetti, cooked Sirloin steak, broiled Pork sausage, cooked Chicken breast, roasted Egg, raw Cod, cooked (dry) Cheese. Cheddar Chocolate, milk 0.003–0.08 0 0.1 0 0 0 0 0 0 0.1 0 0 0 0.1 0.2 0.1 0.4 0.1 0.1 0.6 0 0 0.1 0 0
Thiamine (mg)
*Range reported across beers. Source: Encyclopedia of Foods: A Guide to Healthy Nutrition (San Diego: Academic Press).
Size of serving (weight or volume)
Food
Table 5.8 Vitamin content of beers in comparison with other foodstuffs.
0.02–0.8 0 0.4 0 0 0 0 0 0 0.1 0 0 0 0.1 0.1 0.1 0.4 0.1 0.2 0.2 0.1 0.3 0.1 0.2 0.1
Ribo avin (mg) 3–8 0 0 0 0 0 0 0 0 1 0 0 0 1 3 1 5 1 3 4 12 0 2 0 0
Niacin (mg) 0.07–1.7 0 0.1 0 0 0 0 0 0.1 0.7 0.1 0.2 0 0.1 0.7 0 0.5 0 0.3 0.3 0.5 0.1 0.2 0 0
B6 (mg) 40–600 0 12 9 0 0 3 0 4 23 15 11 31 18 22 24 99 49 8 2 3 24 7 8 4
Folate (µg)
3–30 0 0.9 0 0 0 0 0 0 0 0 0 0 0 0 0 0 0 2.3 1.5 0.3 0.5 0.9 0.4 0.2
B12 (µg)
The Composition of Beer in Relation to Nutrition and Health 107
108
Chapter Five
Stringer (1946) noted that the levels of vitamins in beer are proportional to original gravity (see Chapter 3). Of course, this will depend on the nature of the grist materials employed. If the beer is all malt, or is produced with the employment of cereal-based adjuncts, then the vitamin level would be higher than one produced from a grist including a high proportion of sugar. Earlier I mentioned the meeting at the Horse Shoe Hotel. It is intriguing to quote another contributor to the discussion, Colonel C.J. Newbold: [I have] a strong belief that, speaking quite generally, the human body knows what it wants. In that connection [I want] to say something about gravity. [I believe that] England and New Zealand are the only two countries in the world that tax beer on its strength. [I am] not arguing that this system is not a good one from a revenue and perhaps other points of view, but there is another system adopted by all other beer-drinking countries and that is to tax it on volume irrespective of strength. In the latter system the average gravity in that country will probably settle down at the gravity that the people want. His point was that beer gravity (and presumably selection of grist materials) are heavily impacted by tax considerations in countries where the levy is on the basis of strength as opposed to volume, and that this will have implications for the content of ‘useful’ materials in the beer. In the UK duty is no longer levied on the wort upstream, but since the late 1980s has been on the basis of alcohol content of the end product. There remains, therefore, a prevalence of products that are comparatively low in alcohol as compared to those in other countries (e.g. the US) where, for the most part, all beers attract the same rate of taxation, irrespective of strength. Beers tend to contain very low levels of thiamine, owing to the fact that it is taken up by yeast (Stringer 1946). Agranoff (2000) hypothesises that it wasn’t ever thus. The high levels of residual yeast present in eighteenth-century beer will have provided vitamins to the diet and might have been part of the reason why beer was portrayed by William Hogarth as leading to a healthier lifestyle (e.g. less beri beri and other neurological diseases) than gin. There is no modern evidence for the relative vitamin ‘charge’ in ltered beers and their counterparts that still contain yeast (i.e. naturally conditioned beers), though the latter would be expected to make a greater contribution providing the yeast is consumed. (A former colleague of mine was devoted to his Worthington White Shield, with its goodly charge of yeast in the bottom of the bottle. He would pour out the beer with extreme caution, such that the glass only contained bright beer. Then, with gusto, he would drain the sediment directly from bottle to throat, declaring with satisfaction that he was ‘getting his vitamins’.) However, in attempts to fortify beer with thiamine, it was found that when the vitamin was added to beer it was soon eliminated by unknown
The Composition of Beer in Relation to Nutrition and Health
109
reactions with other components of the product (Thompson et al. 1990). Furthermore, ethanol inhibits the absorption of thiamine by the body (Hoyumpa 1980). Thiamine de ciency stimulates alcohol consumption (Pekkanen 1979): thiamine shortages interfere with glucose metabolism, so perhaps the same causal inverse link referred to earlier between intake of alcohol and carbohydrate is at play. The body does not need thiamine to deal with ethanol and there are better substrates than fats, so thiamine de ciency may be expected to promote the tendency toward alcohol consumption (Segovia-Riquelme et al. 1971; Yki-Jarvinen 1988). Levels of ribo avin increase through malting and brewing, whereas nicotinic acid levels increase in malting and decline during brewing. Mayer et al. (2001) have demonstrated the worth of beer as a source of folic acid, leading to a decreased homocysteine content in blood (hyperhomocysteinemia is a signi cant risk factor for vascular diseases – see Chapter 6). Chronic alcoholism leads to the obverse effect, although beer drinkers had signi cantly lower serum concentrations of homocysteine than did those consuming wine or spirits (Cravo et al. 1996). Cereals are rich in folate and so it is no surprise that beer is a richer source of this material than are other alcoholic beverages (Savage et al. 1995). Walker et al. (2001b) report folate levels of between 47 and 125 µg/L in a range of lagers, ales and a weissbier, which displayed the highest concentration. The extractable level of folate increased during germination of barley, which the authors ascribe to its synthesis in the embryo, though it may be a result of increased availability for extraction. Typically about 4 mg/kg folate is present in ale and lager malts, with less in barley and other adjuncts, so beers produced from a malt-rich grist might give more folate. Substantial loss of folate occurs during mashing and this is thought to be due to oxidation and heat inactivation. Losses, though, are low in wort boiling and wort clari cation. There is no net effect of fermentation on folate – yeast makes folate to balance that which is lost presumably through adsorption effects. There is some loss of folate (up to 50%) in the nal package due to ill-de ned changes occurring during packaging and storage. Vitamin C is found in barley and green malt, but is destroyed on kilning (Harden & Zilva 1918). Some brewers add it to beer as an antioxidant.
Minerals The mineral content of beer is illustrated in Table 5.9, while that of beer in relation to other foods is shown in Table 5.10. Beer is rich in magnesium and potassium, but
110
Chapter Five
Table 5.9 Mineral content of beers. Inorganic component (mg/L)
British beers*
German beers*
Lager-style beers*
Unspeci ed†
Potassium Sodium Magnesium Calcium Iron Copper Zinc Manganese Lead Arsenic Chloride Sulphate Phosphate Phosphorus Nitrate Nitrite Fluoride Cobalt Silica Aluminium
330–1100 40–230 60–200 40–140 0.1–0.5 0.3–0.8
396–562 (476) 9–120 (35) 75–250 (114) 3.8–102 (32.7) 0.02–0.84 (0.02) 0.04–0.8 (0.19) 0.1–1.48 (0.1) 0.04–0.51 (0.2)
253–680 (362) 15–170 (58) 34–162 (82) 10–135 (46) 0.04–0.44 (0.12) 0.01–0.41 (0.11) 0.01–0.46 (0.06)
200–500 20–110 60–140 20–160 0.01–0.3 0.02–0.4 0.02–4.5 0.03–0.2