Applications of Nanowires in Electronics 1774690772, 9781774690772
One-dimensional semiconducting materials are expected to produce highly-efficient electronic components due to their ext
252 95 29MB
English Pages 258 [260] Year 2022
Cover
Title Page
Copyright
ABOUT THE AUTHOR
TABLE OF CONTENTS
List of Figures
List of Tables
List of Abbreviations
Preface
Chapter 1 Fundamentals of Semiconductor Nanowires
1.1. Introduction
1.2. Nanowire Growth Mechanisms
1.3. SAG (Selective Area Growth)
1.4. Doping of Nanowires
1.5. Strain Relaxation, Nanowire Heterostructures, and Quantum Confined Systems
1.6. Electrical Transport in the Nanowires
References
Chapter 2 Semiconducting Nanowire Solar Cells
2.1. Introduction
2.2. Key Concepts
2.3. Nanowire Fabrication
2.4. Overview of Nanowire Solar Cell Studies
2.5. Enhanced Optical Absorption in Nanowire Arrays
2.6. Optoelectronic Properties of Radial Nanowire Diodes
2.7. Solar Cell Performance: Combined Optical and Electrical Properties
References
Chapter 3 Applications of Nanowires in Biosensors
3.1. Introduction
3.2. Working Principle and Fabrication Process
3.3. Detection of Various Biological Agents
3.4. Recent Advances in Nanowire Biosensors
3.5. Summary and Perspective
References
Chapter 4 Applications of Hierarchical Nanowires in Energy Storage Systems
4.1. Introduction
4.2. Advantages of Assembling Hierarchical Nanowires
4.3. Exteriorly Designed Hierarchical Nanowires
4.4. Interiorly Designed Hierarchical Nanowires
4.5. Aligned Nanowires
References
Chapter 5 Introduction to Nanowire Lasers
5.1. Introduction
5.2. Lasing Mechanisms in Nanowires
5.3. Advanced Nanowire Laser Design
References
Chapter 6 Applications of Nanowires in Light Emitting Diodes
6.1. Introduction
6.2. LED Growth Mechanisms
6.3. Pambe Growth of GAN Nanowires
6.4. Structural Characterization
6.5. Photoluminescence (PL)
References
Chapter 7 Applications of Nanowires in Piezoelectric Energy Harvesting
7.1. Introduction
7.2. Vertical-Aligned Nanowire Arrays
7.3. Lateral-Aligned Nanowire Networks
References
Chapter 8 Applications of Silicon Nanowires in Wearable Sensors
8.1. Introduction
8.2. Growth of SINW Fabrics
8.3. The Structure and Morphology of SINW Fabrics
8.4. The Electrical Properties of SINW Fabrics
8.5. Characterization of the SINW Fabric’s Sensing Properties
References
Index
Back Cover
Recommend Papers


![Nanoelectronics: Nanowires, Molecular Electronics, and Nanodevices [1 ed.]
0071664483, 9780071664486, 9780071664493](https://ebin.pub/img/200x200/nanoelectronics-nanowires-molecular-electronics-and-nanodevices-1nbsped-0071664483-9780071664486-9780071664493.jpg)


File loading please wait...
Citation preview
Applications of Nanowires in Electronics
APPLICATIONS OF NANOWIRES IN ELECTRONICS
Ravi Prakash
ARCLER
P
r
e
s
s
www.arclerpress.com
Applications of Nanowires in Electronics Ravi Prakash
Arcler Press 224 Shoreacres Road Burlington, ON L7L 2H2 Canada www.arclerpress.com Email: [email protected]
e-book Edition 2023 ISBN: 978-1-77469-558-6 (e-book)
This book contains information obtained from highly regarded resources. Reprinted material sources are indicated and copyright remains with the original owners. Copyright for images and other graphics remains with the original owners as indicated. A Wide variety of references are listed. Reasonable efforts have been made to publish reliable data. Authors or Editors or Publishers are not responsible for the accuracy of the information in the published chapters or consequences of their use. The publisher assumes no responsibility for any damage or grievance to the persons or property arising out of the use of any materials, instructions, methods or thoughts in the book. The authors or editors and the publisher have attempted to trace the copyright holders of all material reproduced in this publication and apologize to copyright holders if permission has not been obtained. If any copyright holder has not been acknowledged, please write to us so we may rectify.
Notice: Registered trademark of products or corporate names are used only for explanation and identification without intent of infringement.
© 2023 Arcler Press ISBN: 978-1-77469-077-2 (Hardcover)
Arcler Press publishes wide variety of books and eBooks. For more information about Arcler Press and its products, visit our website at www.arclerpress.com
ABOUT THE AUTHOR
Prof. Ravi Prakash is working as an assisastant Professor in Electronics and Communication Engineering Uma Nath Singh Institute of Engineering and Technology Veer Bahadur Singh Purvanchal University Jaunpur, Uttar Pradesh, India. He was born on January 19, 1975, in Jaunpur, U.P., India. He received the B. Tech. degree in Electronics and Telecommunication Engineering from University of Allahabad, Allahabad, U.P., India in 1997, and M. Tech. degree in Electronics Engineering (Communication Technology) from University of Allahabad, Allahabad, U. P., 2001. He is gold medalist at his graduation level and rank holder in board examination. He has almost 21 years teaching experience at B. Tech., M. Tech. and Ph.D. level in engineering. He had worked as head of department of Electronics Engineering at Veer Bahadur Singh Purvanchal University Jaunpur for almost ten years. He received the Ph.D. degree in Electronics and Communication Engineering from University of Allahabad, U.P., India. His current research interests include Communication Technology. He has published several research articles in reputed international journals related to wireless, optical and digital communication. He has worked as several research and reviewer committee member, and he has excellent work in the field of digital communication, wireless and mobile communication. He had worked as Nodal officer, academic in the Technical Education Quality Improvement Program (TEQIP) supported by World Bank at university level.
TABLE OF CONTENTS
List of Figures.................................................................................................xi
List of Tables................................................................................................. xix
List of Abbreviations..................................................................................... xxi
Preface.................................................................................................... ....xxv Chapter 1
Fundamentals of Semiconductor Nanowires.............................................. 1 1.1. Introduction......................................................................................... 2 1.2. Nanowire Growth Mechanisms........................................................... 4 1.3. SAG (Selective Area Growth)............................................................... 7 1.4. Doping of Nanowires.......................................................................... 9 1.5. Strain Relaxation, Nanowire Heterostructures, and Quantum Confined Systems..................................................... 12 1.6. Electrical Transport in the Nanowires................................................. 21 References................................................................................................ 32
Chapter 2
Semiconducting Nanowire Solar Cells..................................................... 43 2.1. Introduction....................................................................................... 44 2.2. Key Concepts..................................................................................... 47 2.3. Nanowire Fabrication........................................................................ 50 2.4. Overview of Nanowire Solar Cell Studies.......................................... 52 2.5. Enhanced Optical Absorption in Nanowire Arrays............................. 54 2.6. Optoelectronic Properties of Radial Nanowire Diodes....................... 62 2.7. Solar Cell Performance: Combined Optical and Electrical Properties.68 References................................................................................................ 75
Chapter 3
Applications of Nanowires in Biosensors................................................. 85 3.1. Introduction....................................................................................... 86 3.2. Working Principle and Fabrication Process........................................ 87 3.3. Detection of Various Biological Agents.............................................. 94
3.4. Recent Advances in Nanowire Biosensors.......................................... 98 3.5. Summary and Perspective................................................................ 104 References.............................................................................................. 106 Chapter 4
Applications of Hierarchical Nanowires in Energy Storage Systems....... 115 4.1. Introduction..................................................................................... 116 4.2. Advantages of Assembling Hierarchical Nanowires.......................... 119 4.3. Exteriorly Designed Hierarchical Nanowires.................................... 122 4.4. Interiorly Designed Hierarchical Nanowires.................................... 132 4.5. Aligned Nanowires.......................................................................... 138 References.............................................................................................. 142
Chapter 5
Introduction to Nanowire Lasers............................................................ 149 5.1. Introduction..................................................................................... 150 5.2. Lasing Mechanisms in Nanowires.................................................... 150 5.3. Advanced Nanowire Laser Design................................................... 162 References.............................................................................................. 170
Chapter 6
Applications of Nanowires in Light Emitting Diodes.............................. 177 6.1. Introduction..................................................................................... 178 6.2. LED Growth Mechanisms................................................................ 179 6.3. Pambe Growth of GAN Nanowires.................................................. 187 6.4. Structural Characterization.............................................................. 188 6.5. Photoluminescence (PL)................................................................... 188 References.............................................................................................. 189
Chapter 7
Applications of Nanowires in Piezoelectric Energy Harvesting.............. 193 7.1. Introduction..................................................................................... 194 7.2. Vertical-Aligned Nanowire Arrays.................................................... 194 7.3. Lateral-Aligned Nanowire Networks................................................ 202 References.............................................................................................. 206
Chapter 8
Applications of Silicon Nanowires in Wearable Sensors........................ 211 8.1. Introduction..................................................................................... 212 8.2. Growth of SINW Fabrics.................................................................. 213 8.3. The Structure and Morphology of SINW Fabrics............................... 215 8.4. The Electrical Properties of SINW Fabrics......................................... 216 viii
8.5. Characterization of the SINW Fabric’s Sensing Properties................. 217 References.............................................................................................. 223 Index...................................................................................................... 227
ix
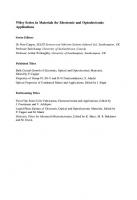
LIST OF FIGURES Figure 1.1. Scanning electron microscopy (SEM) and transmission electron microscopy (TEM) images of the nanowires synthesized from diverse III–V materials Figure 1.2. VLS growth of the nanowires Figure 1.3. Selective-area growth (SAG) of gallium arsenide (111) nanowires on the gallium arsenide (111) substrate Figure 1.4. Schematic demonstration of p-n junctions and the nanowires doping profiles Figure 1.5. Diagrams of diverse nanowire heterostructures Figure 1.6. (a) Geometry of the misfitting cylinder grown coherently on top of the nanowire; (b) calculation of the hc of a misfitting cylinder as the function of the radius of a nanowire; (c) geometry of the misfitting shell grown nearby cylindrical core; (d) calculation of tc performed in the system comprising of the GaN core and the external InxGa1-xN shell Figure 1.7. (a) Pattern of the quantum disc of a phase A introduced in the nanowire of phase A; (b) transmission electron microscopy image of the GaN nanowire comprising the gallium nitride/aluminum nitride multi-quantum disc system; (c) pattern of the nanowire radial structure comprising the core-shell quantum well of a phase A inside two barriers of phase B; (d, e) transmission electron microscopy cross-sectional pictures of (d) an indium gallium nitride/gallium nitride; (e) a zinc oxide/ZnMgO Figure 1.8. Schematic representation of the deterministic inclusion of the single indium arsenide phosphorus quantum dot inside the InP nanowire Figure 1.9. Schematic representation of the nanoscale transistor having quantum dots Figure 1.10. Band diagrams and current-voltage characteristic of the structure of resonant tunneling under an increasing applied bias Figure 1.11. Schematic representation of the STEM image and current-voltage characteristics of aluminum nitride/gallium nitride Figure 1.12. (a) Current-voltage curves stating dark and ultra-violet conductivity in gallium nitride nanowires of diverse diameter; (b) dependency of depletion section, the shape of the conduction band and the valence band edges, and a recombination barrier (ΦB) on the diameter d of a nanowire; (c) photocurrent as the function of the diameter of nanowire for two diverse doping levels Figure 2.1. (a) The above part of the figure is the illustration of a p-n junction representing depletion region (W) with ionized charges; the below part is the correspondent energyband diagram. An electron-hole pair is created by incident light which is field swept to
the charge-neutral regions. (b) Conventional photodiode I–V properties under dark and illumination conditions Figure 2.2. (a) Diagram of a traditional Si solar cell with surface texturing and antireflection coating. Usual L 200 m cell thickness is utilized to absorb the light; carrier collection is principally from the diffusion region (Ld) where Ld >> W, i.e., the junction drift region. (b) An array of 5 m long Si NWs (green line), the relative absorption for a 5 m thick Si slab (red dashed line), and solar intensity spectrum (black curve) Figure 2.3. Comparison of the levelized cost of energy model values of 2009 photovoltaic modules for different commercial Si crystalline cells (Sharp 165U1 multicrystalline, and Sanyo HIP190DA1 monocrystalline and SunPower SPR-220 back contact) together with CdTe, amorphous Si (Unisolar US64), and CIGS thin-film cells to a predicted potential value for Si NW cells Figure 2.4. (a) Diffuse scattering of photons from Si NWs extremely minimizes vertical distance for light absorption; (b) radial p-i-n NW junction for carrier collection and separation by top and substrate transparent contact Figure 2.5. (a) Lithographically patterned 400 m VLS-grown Si NW array along with diffused P shell on Si(111) substrate. Inset displays enlargement of 2:6 m diameter NWs; scale bar: 20 m [13]; (b) TEM representation of Si NW with diffused shell; scale bar: 20 nm Figure 2.6. (a) SEM tilted image of a large area top-down fabricated array of 10 m tall Si NWs (n) over 40 m thick Si substrate(s); inset illustrates a close-up of Bosch-etched 500 nm diameter Si nanopillars; (b) TEM view of a single-crystalline epitaxial radial shell on a Si NW created by vapor-solid growth of P-doped Si; inset displays HRTEM lattice view of the pC core to nC shell region and matching diffraction pattern Figure 2.7. Absorption depth as a function of wavelength for GaAs, CdTe, and crystalline Si. Vertical lines indicate the energy gaps of each material Figure 2.8. Evaluated reflection as a function of wavelength for bulk GaAs, CdTe, and crystalline Si Figure 2.9. The computed refractive index for a thin film of columnar structures as a function of the volume fraction of columns for electric fields perpendicular and parallel to the column axis (as shown in the left vertical axis). Computed reflection for electric fields perpendicular to the columns (as shown in the right vertical axis) Figure 2.10. Evaluated reflection (R), transmission (T), and absorption. 1-R-T/as a function of wavelength for an NW array (red), a nanocone array (blue), and a reference thin c-Si film (black) Figure 2.11. (a) Illustrated cross-section of a radial NW p-n junction; and (b) depletion width distribution in the shell (magenta), core (green), total depletion (blue) for a 50 nm diameter NW, in contrast with the bulk (black), all computed for a doping density of 1018 cm3 Figure 2.12. Photocurrent and dark for a single NW solar cell with NA D ND D 1018 cm3 for b D 100 nm; a D 50 nm; and GL D 1021 cm3 xii
Figure 2.13. Quantum efficiency as a function of minority carrier diffusion lengths for NA D ND D 1018 cm3 for S D 103 cm/s, and a D 50 nm; b D 100 nm; and GL D 1021 cm3 Figure 2.14. Quantum efficiency as a function of intrinsic layer density with various minority carrier diffusion lengths for an overall NW diameter of 500 nm; S D 103 cm/s, and a D 50 nm, NA D ND D 1018 cm3, GL D 1021 cm3 Figure 2.15. Si NW growth on S.S. foil substrates. (a) Illustration of the substrate structure; (b) SEM representation of Si NWs grown on a poly-Si thin film on top of S.S.; (c) SEM demonstration of silicide nanoworm formation using direct synthesis on S.S.; (d) diagrammatic of Si NW-based solar cell on S.S. foil; (e) SEM view of Si NWs grown on Ta2N layer on S.S. foil; (f) light and dark current-voltage properties of a Si NW solar cell viewed in (d). Panels (d)–(f) [20] Figure 2.16. Transport of vertical array of Si microwires within free-standing polymer films. (a) Diagrammatic representation of the process to remove and imbed microwire array; (b) SEM representation of vertical Si microwire array that is suspended in a PDMS film; (c) a flexible free-standing PDMS film along with a suspended vertical array of Si microwires. Panels (a)–(c) [68] Figure 3.1. A conceptual overview of field-effect transistors (FET) Figure 3.2. Top-down fabrication process and results using single-crystalline silicon (SCS) wafer. (A) (100)-silicon; (B) (111)-silicon Figure 3.3. Generalized strategy for ultrasensitive detection of protein and DNA using nanowires Figure 3.4. Design nanowires for in vivo sensing. (A) Improving long-term stability by Al2O3 shell coating. (B–D) Cytotoxic effects of SiC nanowires on cell behavior and differentiation. (B) SEM pictures of SiC nanowires. (C) Quantification of adhesion and proliferation of hMSCs on nanowires and nanoparticles. (D) Quantification of differentiation potency of hMSCs on SiC nanowires. Alizarin red S and oil red O stain was utilized to quantify the differentiation toward osteogenic and adipogenic lineage, respectively Figure 3.5. Integrate nanowires with disposable devices. (A) Schematic and photograph of paper-based analytical devices (PADs) with ZnO nanowires. (B) Characterization of ZnO nanowires. From left to right: (1) SEM image of rough carbon surface before the growth nanowire; (2) SEM image of nanostructured carbon surface with deposited ZnO nanowires; (3) TEM image for quantification of nanowires. (C) Calibration of the sensor (output current vs. glucose concentration) in the buffer. (D) Quantification of detected limits and linear range of the PADs in serum Figure 3.6. Signal processing strategy for multivariable nanowire biosensors. (A) Disease diagnostics based on machine learning: multivariable nanowire sensors were utilized to provide input for artificial neural networks. (B) Big data strategy to correlate exhaled molecules detection by nanowire sensors with the specific disease Figure 4.1. Schematic diagram of assembling plans of hierarchical nanowires xiii
Figure 4.2. (a) Schematic illustration of a sole nanowire electrode device model; (b) sole vanadium oxide nanowire transportation features at early state; (c) (shallow discharge for 200 seconds with 100 pA after Li+ ion intercalation); (d) (shallow charge for 200 seconds with 100 pA) after Li+ ion deintercalation; (e) after deep discharge for 400 seconds with 100 pA; (f) after deep charge for 400 seconds with 100 pA; (g) Diagram of SnO2 nanowire electrode; (h–s) time-lapse construction development of a SnO2 nanowire anode at the time of charging at- 3.5 V compared to a LiCoO2 cathode Figure 4.3. Representation of coating layers operations amid lithium-ion diffusion in coaxial nanowires; (b) scanning electron microscopic (SEM) and transmission electron microscopic (TEM) pictures of carbon-coated Fe3O4 nanospindles; (c) coaxial MnO2// carbon nanotube arrays’ SEM photograph; (d) uniform tin-core/carbon-sheath coaxial nano cables’ TEM picture; (e) mesoporous Fe3O4@C nanorods’ TEM representation; (f) double-walled silicon nanotubes’ TEM photograph; (g) coaxial SnO2-In2O3 heterostructured nanowires’ SEM picture Figure 4.4. (a) Schematic figure of the production of SVO/PANI triaxial nanowire; (b) TEM pictures of SVO/PANI triaxial nanowires; (c) AC impedance spectra curve of β-AgVO3 nanowires and SVO/PANI triaxial nanowires [66] Figure 4.5. (a) Schematic diagram of the fabrication of V2O5/PEDOT and MnO2 NWs; (b) energy dispersive spectrometer (EDS) mapping of V, Mn, and S from V2O5/PEDOT and MnO2 NWs; (c) cycling performance of V2O5, V2O5/PEDOT, and V2O5/PEDOT and MnO2 at 100 mA/g Figure 4.6. (a) Schematic diagram of MnO2/PEDOT coaxial nanowires; (b) TEM picture from a single coaxial nanowire and EDS maps of S and Mn belonging to the boxed area; (c) the specific capacitance of MnO2 nanowires (closed blue square), PEDOT nanowires (open purple dots), MnO2 thin film (open green square), and MnO2/PEDOT coaxial nanowires (closed red dots) at distinct charge/discharge current densities Figure 4.7. (a) Schematic diagram of lithium-ion and electron transport in well-defined and branched nanowires; (b) branched nanowires’ typical SEM picture; (c) SEM picture of the carbon-coated Co3O4@MnO2 nanowire array following the second 3D interfacial reaction; (d) SEM picture of hybrid nanowire arrays; (e) MoS2/PANI-III nanowires’ SEM picture; (f) MnO2 heteronanostructure nanowires’ SEM representation; (g) low magnification TEM illustration showing the particulate character of V2O5 coating and the interconnectivity of TiSi2 nanowires; (h) Top-view SEM display of PANI/GECF; (i) typical SEM photograph of nanostructure progression of SnO2 nanowire-planted graphite materials Figure 4.8. (a) The schematic model illustration of formulating hierarchical MnMoO4/CoMoO4 heterostructured nanowires; (b) hierarchical MnMoO4/CoMoO4 heterostructured nanowires’ SEM photographs; (c) specific capacitance and energy density of various electrodes at distinct current densities; (d) charge-discharge cycling of MnMoO4/CoMoO4 (3D) electrodes at the current density of 3 and 20 A/g performance; inset represents the galvanostatic charge-discharge cyclic curves of the first and last five cycles at 3 A/g xiv
Figure 4.9. (a) Typical SEM and TEM photographs of six-fold-symmetry branched nanowires and the respective elemental mapping pictures; (b) Initial charge-discharge profiles at a rate of 1000 mA/g; (c) cycling operation of bare α-Fe2O3 nanorod arrays, pristine SnO2 nanowires, and α-Fe2O3/SnO2 branched nanostructures Figure 4.10. (a) Schematic for the formation of hierarchical MoS2/PANI nanowires via facile polymerization as well as hydrothermal-processing of Mo3O10 (C6H8N)2·H2O precursor; (b) SEM pictures of as-synthesized hierarchical MoS2/PANI nanowires; (c) cycling execution of the MoS2/PANI nanowires and the commercial MoS2 microparticles tested in the range of 0.01–3.0 V vs. Li+/Li at the current density of 100 mA/g; (d) rate performances charge capacity Figure 4.11. (a) Schematic display for mesoporous nanowire design; (b) TEM picture of echinus-like nanostructures of mesoporous CoO nanowire; (c) TEM photographs of hierarchical porous NiCo2O4 nanowires; (d) SEM image of mesoporous vanadium pentoxide nanofibers Figure 4.12. (a) Schematic display for the layout of the ultralong hierarchical vanadium oxide nanowires; (b, c) ultra-long hierarchical vanadium oxide nanowires’ SEM photograph; (d) capacity vs. cycle number of the ultralong hierarchical vanadium oxide nanowires Figure 4.13. (a) The schematic model illustration of the formation of the hierarchical mesoporous LSCO nanowires; (b) TEM and SEM (inset) photographs of the hierarchical mesoporous LSCO nanowires; (c) the discharge curve of Li-air batteries utilizing hierarchical mesoporous LSCO nanowires + acetylene carbon as the air electrode in oxygen (PO2 = 1 atm) Figure 4.14. (a) Diagram of the principle of strain-graded multilayer nanostructures; (b) cross-section SEM picture of CAl-Si nanoscoop forms settled on a Si wafer with the C, Al, and Si regions specified; (c) differentiating at ~51.2 A/g current density of the charge/discharge capacity versus cycle number for the C-Al-Si electrode versus an electrode consisting of only C nanorods. The length, as well as diameter of the C nanorods in the control sample, is similar to those of the C nanorods in the C-Al-Si multilayer structure Figure 4.15. (a) Schematic diagram of aligned nanowires for enhancing lithium-ion diffusion and electron transport; (b) SEM representation of MoO3-x nanowire arrays; (c) SEM picture of aligned mesocrystalline SnO2 nanowire arrays; (d) SEM photographs of two-ply yarn supercapacitors established on carbon nanotubes and polyaniline nanowire arrays; (e) hydrogenated Li4Ti5O12 nanowire arrays’ SEM image; (f) Cu-Si nano cable arrays’ SEM illustration Figure 4.16. (a) Schematic procedure for the development process of one-dimensional β-AgVO3 grown on the upside of the substrate; (b) SEM picture of radial β-AgVO3 grown on the ITO substrate, the real mound lily displayed in the inset; (c) capacity vs. cycle number of β-AgVO3 nanowire array cathode at various current densities Figure 5.1. Semiconductor nanowire lasers of different materials Figure 5.2. Diagram of spontaneous lasing and emission xv
Figure 5.3. (a) Effective index of the TE01 (solid) and HE11 (dashed) propagating modes against diameter in unlimited cylindrical nanowires for diverse semiconducting materials, regarding their emission wavelength; (b) a 4-level system equal to a semiconductor Figure 5.4. Electrically driven nanowire lasers formed of (right) ZnO and (left) CDs Figure 5.5. Nanowire’s photonic structures Figure 6.1. Developing semiconductor nanowires on metal films. SEM (Scanning electron microscopy) images of GaN nanowires developed on (a) Si; (b) Ti; and (c) Mo; (d) room temperature PL (photoluminescence) measurements of GaN nanowires developed on Si (black line), Ti (red line), and Mo (blue line) Figure 6.2. Chemical mapping of the compositional fluctuation in nanowire heterostructures developed on metal Figure 6.3. Green nanowire LEDs developed on metal with InGaN quantum well active areas Figure 6.4. Display of blue to green nanowire LEDs developed on metal. An extensive range of emission wavelengths is witnessed from different areas of a 3-inch wafer covered with Mo because of the temperature sensitivity of In integration in the InGaN active regions Figure 6.5. Ultraviolet nanowire LEDs developed on metal Figure 7.1. The band diagram for knowing the flow processes and charge output in a nanogenerator with lateral bending model. (a) Before bending; (b) nanowire bent through the tip with the tipping point at the pushed surface; (c) tip scans through the nanowire and reaching the central point; (d) tip reaching the flattened surface of the nanowire; (e) energy-band image for the nanogenerator, showing the output voltage and the role done by the piezoelectric potential Figure 7.2. Band image for knowing the flow process and charge output in the nanogenerator with flattened nanowire. (a) Before pressing; (b) nanowire vertically flattened by an exterior force; (c) equilibrium state under strain state; (d) release of pressure; (e) output voltage Figure 7.3. Design and electricity-producing mechanism of the fiber-based nanogenerator driven through a low-frequency, exterior pulling force Figure 7.4. (a) Schematic diagram of the fabrication procedure of the VING; (b) the output voltage of the VING under diverse exterior pressures Figure 7.5. The fabrication procedure of the segmented ZnO nanowire VINGs Figure 7.6. The produced electrical signal and FEM simulation outcomes Figure 7.7. FEM stagnant simulation of the electromechanical transformation behavior of a vertically compressed device. (a) Schematic diagram of the model; (b) the deformation of silicone; (c) the deformation of the nanorod; (d) the piezoelectric potential of the nanorod Figure 8.1. Large-area growth of light-weighted and flexible SiNW fabrics xvi
Figure 8.2. Structure characterizations and morphology of the SiNW fabrics Figure 8.3. The SiNW fabric’s electrical properties. (a) The definition of transverse direction and longitudinal direction; (b) the SiNW fabric’s current-voltage curves measured along the longitudinal direction are shown by a black line while the transverse direction is shown by a red line; (c) a single SiNW’s current-voltage curve. The single SiNW device is shown by the inset SEM image Figure 8.4. Characterization of the SiNW fabric’s multifunctional sensing properties Figure 8.5. SiNW fabrics that can be used for wearable applications
xvii
LIST OF TABLES Table 3.1. Summary of the salient features and the target application of nanowire-based biosensors Table 5.1. Summary of figures of merit in lasing experiments and relevant parameters
LIST OF ABBREVIATIONS 3D
Three-Dimensional
ANN
Artificial Neural Network
APTES
3-Aminopropoyltriethoxysilane
AR
Anti-Reflection
a-Si
Amorphous Si
CdTe
Cadmium Telluride
CMOS
Complementary Metal-Oxide-Semiconductor
CNT
Carbon Nanotube
c-Si
Crystalline Silicon
CTAB
Cetyltrimethyl-Ammonium Bromide
C-V
Capacitance-Voltage
CV
Cyclic Voltammetry
CVD
Chemical Vapor Deposition
DFBL
Distributed Feedback Laser
DWSiNT
Double-Walled Si-SiOx Nanotube
EBC
Exhaled Breath Condensate
E-beam
Electron-Beam
EBIC
Electron Beam Induced Current
EDLCs
Electrochemical Double Layer Capacitors
EDS
Energy Dispersive Spectrometer
EDXS
Energy Dispersive X-Ray Spectroscopy
EE
Extraction Efficiency
EERE
Energy Efficiency and Renewable Energy
EL
Electroluminescence
EQE
External Quantum Efficiency
FDTD
Finite-Difference Time-Domain
FE
Field Emission
FEM
Finite Element Method
FETs
Field-Effect Transistors
FIB
Focused Ion Beam
FP
Fabry-Pérot
FWHM
Full Width at Half Maximum
GaAs
Gallium Arsenide
GC
Gastric Cancer
GF
Gauge Factor
HAADF
High Angle Annular Dark Field
IQE
Internal Quantum Efficiency
La-APT
Laser-Assisted Atom Probe Tomography
LB
Langmuir-Blodgett
LC
Lung Cancer
LCD
Liquid Crystal Display
LCOE
Levelized Cost of Energy
LED
Light-Emission Diode
LIBs
Lithium-Ion Batteries
LiCoO2
Lithium Cobalt Dioxide
LING
Laterally Integrated Nanogenerator
LOD
Limit of Detection
LSCO
La0.5Sr0.5CoO2.91
LTO
Li4Ti5O12
MBE
Molecular Beam Epitaxy
MOCVD
Metalorganic Chemical Vapor Deposition
MOVPE
Metalorganic Vapor Phase Deposition
NDR
Negative Differential Resistance
NFC
Nanofibrillated Cellulose
NREL
National Renewable Energy Laboratory
NWs
Nanowires
PADs
Paper-Based Analytical Devices
PAMBE
Plasma-Assisted Molecular Beam Epitaxy
PBS
Phosphate-Buffered Saline
PDMS
Polydimethylsiloxane
PEDOT
Poly(3,4-ethylene dioxythiophene)
PEG
Poly(ethylene glycol)
PhC
Photonic Crystal
PI Polyimide PL
Photoluminescence
PMMA
Polymethyl Methacrylate
PNA
Peptide Nucleic Acid
PS
Polyester
PTh
Polythiophene
PV
Photovoltaic
PVR
Peak to Valley
R&D
Research and Development
RGO
Reduced Graphene oxide
RIE
Reactive Ion Etching
S.S
Stainless Steel
SA
Stearic Acid
SAED
Selected-Area Electron Diffraction
SAG
Selective Area Growth
SCLC
Space Charge Limited Conduction
SCS
Single-Crystalline Silicon
SEI
Solid-Electrolyte Interface
SEM
Scanning Electron Microscopy
SETP
Solar Energy Technology Program
SiC
Silicon Carbide
SIMS
Secondary Ion Mass Spectrometry
SiNW
Silicon Nanowire
SLS
Solution-Liquid-Solid
SnO2
Tin Dioxide
SOI
Silicon-on-Insulator
SPCM
Scanning Photocurrent Microscopy
SPR
Surface Plasmon Resonance
STEM
Scanning Transmission Electron Microscopy
SVO/PANI
Silver Vanadium Oxides/Polyaniline
TCR
Temperature Coefficient of Resistance
TE
Transverse Electric
TEM
Transmission Electron Microscopy xxiii
TM
Transverse Magnetic
TMAH
Tetramethylammonium Hydroxide
UNSW
University of New South Wales
UV
Ultraviolet
VCSEL
Vertical-Cavity Surface-Emitting Lasers
VING
Vertical Nanowire Array Integrated Nanogenerator
VLS
Vapor-Liquid-Solid
VO2
Vanadium Dioxide
VS
Vapor-Solid
WZ
Wurtzite
XRD
X-Ray Diffraction
ZB
Zincblende
ZnO
Zinc Oxide
xxiv
PREFACE
Currently, semiconductor nanowires (NWs) are gaining immense attention due to their excellent electronic characteristics. The unique properties of nanowires are observed because of their one-dimensional nanostructure. The contemporary application areas of nanowires include high-speed transistors, nanoelectronics, chemical-, and biosensors, and LEDs (light-emitting diodes) with little power consumption. Nanostructured materials (especially nanowires) have emerged as an excellent green solution to combat the issues of conventional electronic materials. The huge need for the development of efficient electronic devices and the limitations of the existing methods based on lithographic procedures to realize a few nanometer-sized constituents require the establishment of novel approaches. Regulation of the manufacturing and surface characteristics of nanowires may unravel new prospects in the field of nanoelectronics. The advancements are underway for the synthesis and use of nanowire components in the manufacturing of nano-biosensors and nano-circuits. This book is divided into eight chapters. Each chapter contains a detailed discussion about a particular topic. Apart from Chapter 1, all of the chapters deal with applications of nanowires in a particular electronic industry. Chapter 1 focuses on the fundamentals of semiconductor nanowires discussing different growth routes and doping of nanowires. The chapter also illustrates the concepts behind the phenomena of strain relaxation and electrical transport in nanowires. Presently, extensive research is being conducted in the area of nanostructured solar cell development. Chapter 2 deals with key concepts involved in the synthesis, characterization, and applications of nanowire solar cells. Nanotechnology has immensely benefited the medical sector due to its wide-ranging applications. Chapter 3 focuses on the applications of nanowires for the development of nano-biosensors. The major challenge of energy storage systems is their efficiency. However, modern materials can combat this challenge by providing energy-efficient structures. Chapter 4 illustrates the developments in the hierarchical nanowires in terms of their synthesis, merits, performance, and classification in energy storage instruments. Chapter 5 illustrates the applicability of nanowires for the synthesis of lasers. In common semiconductor lasers, several gain media (like quantum dots, multiple quantum wells, and nanowires) are usually created through the epitaxial growth of the whole vertical heterostructure to produce an efficient lasing system.
Chapter 6 contains essential information regarding the synthesis and characterization of light-emitting diodes (LEDs) from semiconductor nanowires. Piezoelectric materials are manufactured to perform the conversion of mechanical stress into electrical energy. Chapter 7 offers a detailed discussion of the working mechanism, simulations/ modeling, and the experimental development of piezoelectric nanogenerators as per the structure of the nanogenerators comprising the lateral-aligned nanowire networks, the nanowire-based nanocomposites, and the vertically aligned nanowire arrays. Numerous fabrics are being developed and being used for wearable sensing applications by means of building conducting paths with metal-based or carbon-based nanostructures. Finally, Chapter 8 thoroughly explains the fundamentals of wearable electronics and their synthesis from nanowires. This book is equally beneficial for students, researchers, teachers, and professionals in the fields of electronics and nanotechnology. However, people from multidisciplinary fields can also benefit from this book which contains knowledge about various areas of the electronics industry. —Author
CHAPTER
1
FUNDAMENTALS OF SEMICONDUCTOR NANOWIRES
CONTENTS 1.1. Introduction......................................................................................... 2 1.2. Nanowire Growth Mechanisms........................................................... 4 1.3. SAG (Selective Area Growth)............................................................... 7 1.4. Doping of Nanowires.......................................................................... 9 1.5. Strain Relaxation, Nanowire Heterostructures, and Quantum Confined Systems..................................................... 12 1.6. Electrical Transport in the Nanowires................................................. 21 References................................................................................................ 32
2
Applications of Nanowires in Electronics
1.1. INTRODUCTION A semiconductor nanowire is the cylindrical semiconducting crystal with a diameter (d) of the order of 100 nm or lower and having the aspect ratio of length (l) over diameter (l/d) of at least ten, though if in usual practice, it is probable to comprise in this class of structures having larger diameters, around one µm-also known as (microwires)-and the lower aspect ratios-also known as (nanocolumns) or (nanorods). Semiconductor nanowires have generally been demonstrated for nearly all of the semiconducting material systems, for example, compounds, and elemental semiconductors from the group IV, like Si, SiC, SiGe, Ge, compound III–V semiconductors, like InAlGaN and InAlGaAsPSb, and the compound II-VI semiconductors, like CdZnTe and ZnMgO. Some of the electron microscopy pictures of nanowires are given in Figure 1.1. The semiconductor nanowires offer peculiar properties that aren’t found in their thin or bulk film counterparts (Ingraffea, 1987; Areias and Belytschko, 2005; Grad et al., 2012). Numerous original physical phenomena have been discovered and studied in semiconductor nanowires all over the last two decades. Various properties have been interpreted into the original device applications. A number of these phenomena are associated with a high surface to volume ratio exemplifying these structures (Rabczuk et al., 2007; Xi et al., 2020). Because of strain relaxation at the sidewalls of a free nanowire, for example, it becomes probable to grow nanowires having high crystalline quality on the intensely lattice-mismatched substrates. It becomes probable to develop novel sorts of quantum-confining structures and heterostructures, like quantum discs, radial quantum wells, quantum dots, and quantum wires. In several cases, the heterostructures can be comprehended with large lattice disparities and the large strain states without generating dislocations. The features can be utilized for the comprehension of nanowire-centered LEDs (Zavattieri and Espinosa, 2001; Shiozawa et al., 2006). Light-emitting diodes have higher compositional flexibility and crystal quality as compared to the case of thin-film-centered III-As/P and III-N technologies. They can be used for the creation of ultra-pure single photons for quantum information and quantum cryptography (Wang et al., 1999; Baker et al., 2003). One more effect of a large surface to volume ratio is utmost sensitivity of the nanowire properties to outside perturbations: the electrical and optical properties of the nanowires can therefore vary considerably as the function of external conditions of the environment. This
Fundamentals of Semiconductor Nanowires
3
has significant consequences for sensor device applications. The nanowirebased biological and chemical sensor, for example, depends on the electrical conductivity sensitivity of nanowire to the vicinity of particular chemical species to a nanowire conduction channel (Dowling, 1979; Eberhardt et al., 1998). Furthermore, nanowires are objects with dimensions of the smaller order or same as the visible, UV, or near-infrared light wavelength. This outcome in an explicit and shape-reliant interface of nanowires with the electromagnetic field. The phenomena like light trapping, large polarization anisotropy, or waveguiding can be utilized for boosting the effectiveness of LEDs, solar cells, and for the making of polarization-sensitive photodetectors and single nanowire lasers (Fajdiga and Sraml, 2009; Li and Wong, 2012).
Figure 1.1. Scanning electron microscopy (SEM) and transmission electron microscopy (TEM) images of the nanowires synthesized from diverse III–V materials. Note: (a, b) Scanning electron microscopy images of ordered arrays of the goldcatalyzed gallium arsenide nanowires; (c) the InP nanowire with tapering apex;
4
Applications of Nanowires in Electronics
(d) STEM-HAADF (scanning TEM in high angle annular dark field mode) image of the gold-catalyzed gallium arsenide nanowire containing aluminum gallium arsenide markers for the study of growth; (e, f) scanning TEM-HAADF images of the nanowires comprising the GaP/GaAsP superlattice; (g) scanning TEM image of the InP/InAsP shell/core nanowire heterostructure; (h) scanning TEM-HAADF image of the gallium nitride nanowire surrounded by the shell of AlN; at the top of a nanowire, a gallium nitride quantum disc is injected inside the cap of AlN. Source: https://pubmed.ncbi.nlm.nih.gov/21508494/.
The novelty perspective of nanowires has therefore triggered an interdisciplinary effort targeting the demo of new and effective methods for the comprehension of the nanoscale structures, manipulation of these structures, the study of the structural, chemical, electrical, and optical properties of the structures, and their application in the original device architectures. Keeping this in thought, this chapter gives an introductory review of the semiconductor nanowires from synthesis to the ultimate device application (De Los Rios et al., 1995; Zhu et al., 2007). The semiconductor nanowires can normally be synthesized by numerous methods. The methods can be categorized according to two methodologies: (a) the bottom-up approach, in which a nanowire is created by the arrangement of formerly independent molecules or atoms, and (b) the top-down approach, in which a nanowire is made by some technique from the pre-existing semiconductor crystal. Here in this chapter, the description will be restricted to the review of the bottom-up method, with the survey of growth techniques and mechanisms. The top-down method or approach is given in the references (Kolmakov and Moskovits, 2004; Zhang et al., 2008; Yang et al., 2010).
1.2. NANOWIRE GROWTH MECHANISMS 1.2.1. VLS (Vapor-Liquid-Solid) Mechanism The VLS method of growth for the nanowires is known ever since the revolutionary work by Ellis and Wagner, who comprehended the growth of silicon nanowhiskers on the silicon substrate by the gold-catalyzed epitaxy in 1964 (Wagner and Ellis, 1964). The authors used gold particles
Fundamentals of Semiconductor Nanowires
5
as catalysts to grow the crystalline semiconductor nanowires from SiH4 or SiCl4 vapor. Figure 1.1 schematically shows the principle for silicon whisker growth. On the bare silicon substrate (Figure 1.2(a)), the thin film of gold is deposited (Figure 1.2(b)). On heating, the film of gold first reacts with a substrate and forms nearly hemispherical droplets (Figure 1.2(c)). It must be observed that the temperature of melting of Au-Si alloy at a eutectic point is much lower as compared to that of Si or Au. Si and Au can form the solid solution for all of the silicon content (0 to 100%). If silicon is deposited from the vapor mixture of H2 and SiCl4, the reaction between H2 and SiCl4 happens at a temperature above 800°C without the aid of catalysts. Thus, a tiny deposition of silicon on the substrate occurs if T> W, i.e., the junction drift region. (b) An array of 5 m long Si NWs (green line), the relative absorption for a 5 m thick Si slab (red dashed line), and solar intensity spectrum (black curve). Source: https://link.springer.com/chapter/10.1007%2F978-3-642-22480-5_11.
The potential for cost minimization of NW arrays and enhanced performance over their majority photovoltaic counterparts is chiefly because of (i) short set of lengths of minority carriers that are separated radially and composed normally to the light absorption direction, (ii) raised absorption because of scattering of diffuse light in NW arrays, and (iii) resilience of cell integration on a range of low-cost carrier substrates. A crucial aspect is that the vapor-liquid-solid (VLS) method can grow the single-crystalline NWs, which is a procedure analogous to thin-film growth technology. The slicing and Si ingot growth in the crystalline Si cells explain up to 50% of the entire cost of wafer-Si cells. Whereas the thin-film solar cells are appealing because of their potential for minimized costs. However, they proceed to have minimal cell efficiencies after many years because of the related carrier recombination loss issues and grain boundary. For instance, the maximum reported efficiency for amorphous Si (a-Si) cells is 10% (Mingebach et al., 2011). Both CIGS and CdTe, increased efficiencies have been shown by the CuInGaSe2/ thin-film cells, but materials availability may restrict their large-scale use. It is possible to accomplish thin layers of single crystal NWs transferred to or grown on low-cost substrates using nanostructured 1D materials. Therefore, less high purity Si is used by the NW approach, i.e., 1=10/ together with device fabrication methods and lower cost materials growth.
Semiconducting Nanowire Solar Cells
47
Even though the enhancements in the efficiency are not expected over the traditional c-Si solar cells, accomplishing fairly good efficiencies. The application of solar cells could be impacted dramatically by 15–20% in combination with less-cost thin-film processing. Figure 2.3 demonstrates this side by analyzing the levelized cost of energy (LCOE) with the National Renewable Energy Laboratory (NREL) “solar advisor model” versus efficiency for various thin-film solar cells and commercial crystalline Si in contrast with predicted values that might be expected if a prosperous Si NW solar cell approach were attained (Blair et al., 2008).
Figure 2.3. Comparison of the levelized cost of energy model values of 2009 photovoltaic modules for different commercial Si crystalline cells (Sharp 165U1 multi-crystalline, and Sanyo HIP190DA1 monocrystalline and SunPower SPR220 back contact) together with CdTe, amorphous Si (Unisolar US64), and CIGS thin-film cells to a predicted potential value for Si NW cells. Source: http://www.nrel.gov/analysis/sam/.
2.2. KEY CONCEPTS A key view of the radial p-n junction NW photovoltaic (PV) cell idea is the carrier collection directions and the orthogonalization of the light absorption (see Figure 2.4). This approach has relied on understanding three-dimensional (3D) architectures. The structure of a parallel multijunction PV cell was suggested by a team at the University of New South Wales (UNSW) in 1994, consisting of metalized grooves and multilayered p-n junctions (Green et al., 2001). The UNSW technique was to utilize the 3D structured cell to obtain approximately 100% carrier collection
48
Applications of Nanowires in Electronics
efficiency by breaking down the PV cell into parts. Furthermore, photon recycling could be provided by a 3D structure made up of a lot of etched Si stripes because of raised effective cell thickness (Weber et al., 2004). In every Si stripe, light absorption happens in the vertical direction, whereas the photogenerated carriers are obtained by the sidewalls of the Si stripe. Practically, up to 18.5% efficiency was produced by the 3D structured PV cell based on etched Si stripes with production costs the same to surface textured Si solar cells. However, there has not been a major focus on the 3D structured PV cell in thin-film and bulk PV cell research due to the hazard of concurrent accomplishment of light absorption maximization and carrier loss minimization (Colombo et al., 2009). An ideal structure for immensely efficient p-n junction solar cells is a radial p-n junction in an NW array design. The carrier collection directions and orthogonalization of the light absorption allowed the radial geometry of the p-n junction. Surrounding p-n junctions or the fabrication of radial is not obtained easily in thin-film and bulk PV cells and needs micro-machining processes, which raise production costs (Czaban et al., 2009; Wang et al., 2010).
Figure 2.4. (a) Diffuse scattering of photons from Si NWs extremely minimizes vertical distance for light absorption; (b) radial p-i-n NW junction for carrier collection and separation by top and substrate transparent contact. Source: http://web.eng.ucsd.edu/ece/groups/iebl/Papers/Book1.pdf.
An appropriate material system is provided by the semiconductor NWs for radial p-n junction PV cells on the account of as-grown semiconductor NWs are prepared for radial p-n junctions. Moreover, material compatibility
Semiconducting Nanowire Solar Cells
49
problems risky to thin-film PV cells can be overcome by the semiconductor NWs. For instance, mismatches of lattice constants between the thin films and substrate and thermal expansion coefficients over large areas result in stresses, while single-crystal semiconductor NWs can be formed on different substrates by diverse approaches with less accumulated stress. Minority carrier diffusion lengths Ldiff/, which a significant material property in finding solar cell efficiency, are in the range of 100s of nano-meters to assorted micro-meters in thin films as they are restricted by grain sizes, on the other hand, values of Ldiff in single-crystalline Si NWs have been recorded in the range of 2 to > 20 m (Garnett and Yang, 2008; Jung et al., 2010). An important factor in the NW approach to solar cells is the orthogonalization using 1D nano-structuring where the charge collection constraints and optical absorption are decoupled. A fundamental problem in traditional c-Si solar cells is that there is a weak optical absorption. Consequently, thick Si regions are needed to absorb the incident light and the charge carrier generation happens all over the region (see Figure 2.2(a)). Hence, minority charge carriers must be carried over long distances by diffusion without recombination, requiring the use of typically perfect singlecrystal materials. For instance, a 260 m thick region of high-quality singlecrystal Si wafer is needed for the maximum silicon solar cell efficiencies. Whereas, the light can be absorbed in 10 m by the crystalline Si NW arrays and permit independent control on the charge carrier separation at the same time (see Figure 2.4). The initial main difference is that the light collection takes the help of the diffuse scattering of photons by the NWs because of the dielectric constant difference together with the surrounding medium to permit carrier excitation within a depth of 10 m and whole absorption. The second major difference is that the rapid carrier separation (ns) takes place by drift in the immense electric field region inside the radial p-n junction having distances of 1 m for the carriers to be gathered by the single-crystal NW shell and conducting core. This is comparable to the procedure in the traditional solar cells where slow carrier separation(s) takes place by diffusion where carriers gathered at distances of 100 m, needing the lack of recombination centers (or charge traps) at these long distances. Consequently, the carrier collection times are minimized dramatically in NWs, from s to ps, providing efficient charge collection (Lu and Lal, 2010; Yoon et al., 2010). One to maximum the effective width of the depletion region is allowed by the unique architecture of the NW solar cell which accumulates the carriers absorbed in the p-type and n-type regions. The depletion region is 140 nm, the scattering is most efficient, for c-Si at 1,100 nm. A product of the number of scatterers and the scattering efficiency is the total light scattering; therefore, for a dense array of 100 nm particles, the ideal scattering is attained. Earlier we have studied ensemble NW effects whose only requirement is the individual NWs having diameters comparable to or less than the wavelength of light. There are also resonance effects and waveguiding for this sized NWs, determined by the optical properties and individual NW geometry. The NWs serve as efficient energy guides in consideration of propagation on their axis for wavelengths relative to the NW diameter and the optical modes are considerably restricted to the NW. The NW guided modes are firmed limited for wavelengths:
60
Applications of Nanowires in Electronics
(5) where; D represents the NW diameter (Liu et al., 2010). Light is heavily guided for NW diameters exceeding 300 nm for Si NWs along with ns = 3, 5, 100 nm. Hence, the NWs can serve as waveguides, for NW diameters 300 nm, for every wavelength exceeding the energy gap of Si related to solar cell performance. The individual NWs demonstrate resonance effects as well, for light passing through perpendicular to the NW axis, which can change the electric field strengths within the wire. The framework of leaky mode resonances can evaluate the resonance frequencies (Cao et al., 2009). There can be the resonances of silicon NWs of 300 nm diameter for optical wavelengths of 1000 nm. Both of these, i.e., resonance effects and waveguiding, can raise the electric field in the NW which is greater than that in a thin-film structure, and therefore grow its relative absorption. In contrast with the combination of light scattering and reduced reflection, usually, these effects are minor, however, it may be possible to scheme structures that improve these resonances especially to boost absorption for wavelengths about 10,00 nm where c-Si absorption is much weak (Bao and Ruan, 2010; Picraux et al., 2012). These fundamental optical effects in NW arrays signify that optical absorption will be enhanced remarkably in vertical NW arrays of short diameter (100 nm). The vertical orientation is preferred for reducing reflection and short diameters turn into much efficient light scattering and trapping. All of the particular optical effects have been incorporated into numerical optical modeling of the NW arrays applying transfer matrix or finite difference time domain methods (Li et al., 2009; Lin and Povinelli, 2009). Theoretical computations normally signify that the optical performance of the NW array is correspondingly insensitive to the array periodicity for spacings in the range of 300–10,00 nm for narrow wire volume fractions ℎ𝜐 > 𝐸𝑔
where; Eg shows the energy gap of the semiconductor; and 𝐸𝐹𝑐 −𝐸𝐹𝑣 reveals the difference in energy between the quasi-Fermi levels of the valence band (𝐸𝐹𝑣) and the conduction band (𝐸𝐹𝑐). It has been simply shown that whichever photons that fulfill the mentioned condition, having energy hυ, would be stimulated. The resemblance between this system and the 4-level system is clear, which underlies the atomic transitions-based standard lasers operation. The condition of Bernard-Durrafourg is general and therefore, irrespective of the dimensions of the system, remains valid whether it is for nanowires (1D), quantum wells (2D), thin films (3D), or bulk materials. In a semiconductor, the gain could be assumed as a 4-level system in which the occurrence of stimulated emission is close to the band edge and there is pumping from the valence to conduction bands, ultimately defining the quasi-Fermi level, rapidly relaxing to the band edge (phonon relaxation) before emission of light through the recombination (Feng et al., 2013). It is only viable if in a short time pulsed laser is utilized for creating many carriers, as mentioned before. In this case, there is no specific definition of semiconductor’s Fermi level, it is preferred to be defined as quasi-Fermi levels for valence and conduction bands. When there is no presence of pulsed light or if a continuous-wave laser is being utilized, the quasi-Fermi levels are considered to be equal with equilibrium Fermi energy. Therefore, it’s not adequate for the deviation from equilibrium Fermi energy. That is how the gas lasers are different, where the energy level is inherent to the medium. In the case of semiconductors, these 4-level systems must be created dynamically through the formation of valence and conduction band quasiFermi levels (Friedler et al., 2009). In solids, specifically semiconductors, there is the occurrence of carrier-carrier interaction that is dominant, which leads to stimulated emissions of different types, making it another
158
Applications of Nanowires in Electronics
major difference. There is a need for modifications that are dependent on carrier types involved in the process of stimulated emission, either due to EHP formation (N-band) or the exciton-exciton scattering (P-band). In nanostructures, the process is complex as compared to the standard laser and discussed intensely (Klingshirn, 2007, 2012). However, the scheme for EHP is still valid in Figure 5.3(b), except that instead of bandgap, having as band edge—the renormalization of bandgap causes a shift in bandgap above Mott density for a higher value of carrier density. Due to the charges’ screening effect, there is no longer existence of exciton while only the holes and electrons remain. The reabsorption phenomenon should always be considered during the nanowire lasers’ features examination of the semiconductor. This occurs when the semiconductor emits photons and they have a high probability of re-absorption by the nanostructure. There are two main reasons to be strong in semiconductor wires (Gadallah and El-Nahass, 2013). First, in nanowires, the Urbach tail is mainly broad. When a strong exciton-phonon interface arises the Urbach tail is accessible, and therefore ‘bends’ the bandgap of the material, interpreting it less sharp. The second reason is that these structures are decent waveguides, constrictive the light in the structure for extensive, thus improving the possibility of absorption (Li et al., 2013; Liu et al., 2013). Other parameters useful for the extensive Urbach tail, particularly in 1D nanostructures, are surface states and crystallographic defects (Gargas et al., 2009). Lastly, we should note the significant laser feature of coherence. Vanmaekelbergh’s group studied the effects of interference among light emissions via two ends of a ZnO nanowire about 20 µm long, having a diameter extending from 60 to 400 nm. They visibly displayed energy spacing among sharp lasing modes scaling through the inverse length of the nanowire (Van et al., 2006), demonstrating the coherence of the light (Gradečak et al., 2005).
5.2.3. Gain and Losses Previously, for semiconductors we derivative the intrinsic gain/absorption coefficients, as used to nanowires. Though, this just measured the intrinsic properties of the material and does not explain all the losses. From growth conditions, these losses can outcome raising the surface states, nevertheless can also be circulation losses of the light inside the nanowire, because of
Introduction to Nanowire Lasers
159
low end-facet reflectivities or tapering. Generally, the gain for this kind of a system is given by: Γ.𝛾 = 𝛼𝑊𝐺 +𝛼𝑀
where; Γ is known as the confinement factor (Table 5.1); 𝛼𝑊𝐺 indicates the losses because of the propagation of light, and 𝛼𝑀 indicates the intrinsic losses because of the mirror reflectivities of the nanowire end-facets, as shown in Table 5.1 (Zimmler et al., 2010). For effective nanowire laser devices, the reasons for these losses have been discussed above. The size of the nanowire orifice in the Fabry Perot system is an important factor to be considered to examine various losses in NW that depends upon photonic behavior. To achieve optimum optical feedback and a greater value of Γ, it is proved experimentally and theoretically that both the value of radius and length should be greater than 100 nm and 1 µm. Although various studies related to electromagnetic features of an uncoated nanowire have (Greytak et al., 2005). Although different studies of the relevant electromagnetic characteristics of a bare nanowire have illustrated its capacity to act as a Fabry Perot resonator, it has many limitations to directly apply it as a source of monolithic integration. For the nanowires growth mechanism of these wires causes either to stand vertically or lie horizontally on a substrate. Several optical losses are induced in case of interaction with both, which considerably limit the Coefficient of absolute reflection at the interface of wire or substrate and Q factor. Furthermore, dielectrophoretic is considered as a heavy method of placement on greater commercial wafers for the assembly of nanowires in horizontal geometry, and that method of placement does not necessarily meet industrial requirements. In the case of vertical geometry, the optical feedback could be merged for comparatively nanowires having a larger diameter (Han et al., 2012). For vertical geometry, optical feedback can be reinforced for sufficiently large nanowire diameters with the aspect of the high ordered whispering gallery-like ways, permit stimulated release for an III–V of size Nano pillar on silicon. In the case of an alternative proposed design, it is to insert a thin layer of metal between nanowire and substrate, but it complicates the fabrication process in which high aspect ratio dry etching and wafer bonding are needed to be considered. Although the proposed design has good results, it is not able to achieve a completely flexible process for bottom-up manufacturing to achieve the laser.
160
Applications of Nanowires in Electronics
To reach the laser maximum threshold limit, the relatively low value of Q factor almost less than 100 of the NW cavities is required the material obtain to use as an alternative to fulfill compensate cavity losses. This condition is also suitable for GaN and II-VI semiconductors, where obtain material can reach a high value of 104 cm−1, in type III–V nanowires, the stimulated emission is inhibited by typically larger surface state concentration (Domen et al., 1996). In empty nanowire core (GaAs/GaAsP) only two groups found to be had stimulated emission close to the infrared region. Similarly, it is mentioned that the inherent longitudinal various mode regime of Fabry Pérot resonator, with the combination of both broad linewidth and cavity length at room temperature of wire emission profile, is useful to achieve a beneficial gain in the case of nanowire lasers. One question is here that in these ID systems in the case of laser properties, is there any need that we have to observe an amplified stimulated emission or properly stimulated emission by using laser oscillations? In both of these, if we look at the first case, we have no feedback as amplified stimulated emission occurs only because of the presence of various photons in structure, and in this way, various photogenerated carriers in the nearby region are stimulated (Henneghien et al., 2009). Meanwhile, lasing emission or properly stimulated emission wants a mechanism of feedback provided by a cavity. In nanowires, through the end-facets of the nanowire itself a self-formed cavity happens, due to a strong index mismatch along with the neighboring environment. Zimmer et al. purposed a transition from (Zimmler et al., 2008). As a function of pump power, they investigated the output intensity and detected first a linear behavior because of spontaneous emission in ZnO, before a superlinear behavior because of ASE at the end of the threshold, and lastly, linear dependence again, demonstrating that laser oscillation happens. On a loglog scale, this ‘S’ shape is a pure signature of laser oscillation. For laser oscillation to happen, they also contain a maximum diameter, irrespective of the nanowire length. In previous theoretical work, this was established (Maslov et al., 2003) investigating distinctive laser cavity conditions, presentation that, for nanowires, the end-facets of the mirrors are deprived reflectors. By their boundaries certainly, the end-facets of nanowires are measured, and in refraction indices, the reflection coefficient is just the nanowire-to-air difference.
Introduction to Nanowire Lasers
161
Figure 5.3. (a) Effective index of the TE01 (solid) and HE11 (dashed) propagating modes against diameter in unlimited cylindrical nanowires for diverse semiconducting materials, regarding their emission wavelength; (b) a 4-level system equal to a semiconductor. Note: The prefix “w” indicates the hexagonal wurtzite crystal phases and “c” stands for cubic zincblende: internal index n1, diameter d, length L, medium index n2, and end-facet reflectivities R1 and R2. Index data take out from Adachi (2004). Source: https://link.springer.com/book/10.1007/1-4020-7821-8. Table 5.1. Summary of Figures of Merit in Lasing Experiments and Relevant Parameters Formulae
Meaning Cavity gain (𝑅: end facet reflectivity if 𝑅1 = 𝑅2;𝐿𝑐: cavity length)
Condition of cavity resonance (𝑙,𝑛,𝑝: shows where 𝑝 is the longitudinal index) Quality factor Q of the cavity
162
Applications of Nanowires in Electronics The spacing of longitudinal modes, Free spectral range (𝑛: nanowire index) The transmission function of a Fabry-Pérot cavity Confinement factor (𝑑: nanowire diameter)
Contrast of a Fabry-Pérot cavity
Photon cavity lifetime (𝑇𝑟𝑡: return-trip transmission cavity; 𝑣𝑔: group velocity) Finesse of a Fabry-Pérot cavity
The effective wavelength of light in a medium with index n
Condition of oscillation in a cavity (𝑟1,𝑟2: complex end-facet reflectivities; 𝑘: wavevector; 𝐸0: incident EM field)
5.3. ADVANCED NANOWIRE LASER DESIGN Great potential in photon production is shown by the semiconductor nanowires, yet the challenge remains in designing an efficient system in practice. It is due to the material issues compared to photonic issues under focus. Now, advanced laser designs which are based on semiconductor laser devices can be focused on due to better growth control techniques. In this part, we will see and discuss some of the newer research avenues of the more complex systems which can be made commercially viable. First, we will review the already done work of NW laser in optoelectrical devices. Before the discussion of photonics and how to achieve single-mode lasing in them, we will talk about hybrid systems and heterostructure-based nanolasers. Then, we will discuss the methods to engineer photonic surfaces
Introduction to Nanowire Lasers
163
surrounding a nanowire laser and create an efficient and working device (Heo et al., 2011).
5.3.1. Electrical Pumping Duan et al. (2003) showed that stimulated emission could be achieved in CdS nanowires through electrically injected carriers. Using CdS nanowires grown through laser-assisted catalytic growth, the lowest optically pumped single-nanowire lasing a threshold of 2 kW/cm2 was achieved. Using p/n Silicon-Cadmium junctions, optically, and electrically pumped nanowire lasing of about 509 nm was obtained. It was the first optoelectronic device constructed of nanowire laser (see Figure 5.3(a) and (b)). Since this, not a lot of progress has been made in electrically pumped nanowire lasers. Zhang et al. (2009a, b) using p/n ZnO nano nail array-Si junction displayed electrically driven lasing behavior. Chu et al. showed the most important report of ZnO electrical injection, whereby achieving electrically as well as optically pumped Fabry-Perot lasing in a p/n ZnO thin film-nanowire homojunction (Figure 5.3(c) and (d)) (Chu et al., 2011). Electro-optic modulation of CdS and GaN was demonstrated by Lieber’s group for nanowire laser-based devices. They used microfabricated electrodes which displayed an electro-absorption mechanism (Greytak et al., 2005). This very prominent result was not followed up. A lot of work has been done in photovoltaic and photodetection applications compared to electrical pumping in the lasing application. Even with the mentioned efforts, electrical injection still needs more work, and especially for materials that haven’t been used in optoelectronic devices, like III–V materials in nanolasers, although they seem to be a better natural choice when studying the quantum wells.
5.3.2. Hybrid Systems and Heterostructures Heterostructures and Hybrid systems are noticed while discussing the advanced laser designs. But techniques like electrical injection haven’t been focused a lot on complex structures. Metallic structures of dielectric coatings can be used with semiconductor nanowires for hybrid systems. As discussed before, our focus will be on how optical confinement occurs by using metal. The first theoretical studies of these systems were done in NASA Ames ResearchaCenter by Masloy and Ning, in which they reduced the nanowire diameter and maintained the stimulated emission by Silver or other metal coatings on the nanowire (Maslov et al., 2007). During the hybrid plasmonic
164
Applications of Nanowires in Electronics
waveguides modal properties’ study, it was reconsidered (Zhu et al., 2010). Also, the plasmonic core-shell nanowire resonator’s influence on an III–V semiconductor nanowire Purcell factor (Hofmann et al., 2011). Bian et al. (2013) experimented further on this system while introducing low-threshold lasing. Wu et al. (2011) gave the first observations of plasmonic-aided nanolaser and in achieving a MO semiconductor structure including InGaN/ GaN nanorod bundle which was coupled strongly to a metal plate using a dielectric nano-gap layer by SiO2. Xu et al. (2012a, b) showed the results of gold substrate-induced singlemodeling in GaN nanowires. It showed that one mode can be preferably excited by discriminating lasing modes. Similarly, Wu et al. coupled a silver nanowire with Cd-Se nanowire and developed a hybrid photon-plasmon laser. An ‘X’ shape was formed by the nanowires over a short length interaction. The first longitudinal coupling between the plasmon and photon modes was achieved by coupling of Cd-Se photon modes to Silver NW plasmon modes, and the selection of mode was also achievable (Wu et al., 2013). Finally, there are reports, on hybrid systems, regarding the nano cables of Cd-S and Cd-Se NWs with coated dielectric materials like Silica (Pan et al., 2005; Ye et al., 2011). Amorphous silica was used in the coating which prevented surface-state recombination as well as provided oxidation and degradation protection. Also, the electromagnetic mode is better confined in this coating, like the surface plasmons with metal case (Zhou et al., 2007). Due to the difficulties in growing the heterostructures using semiconductor nanowires, there aren’t as many studies compared to hybrid systems. In 2008, Qian et al. displayed the first nanowire heterostructure which exhibited laser behavior. Using metal-organic chemical vapor deposition (CVD), R-sapphire was used as a substrate to grow a core-shell NW to attain a wide wavelength-tunable laser. In this study, the GaN core used was triangular and the InGaN shell used was multi-quantum-well. A redshift was observed in the laser wavelength due to Indium. This ‘tour de force’ is so far, the existing one in the literature (Hirano et al., 2005).
5.3.3. Single-Mode Selection Optical signal processing with photonic integrated circuits and optical interconnects needs low-power and ultracompact integrated laser which provides stable monochromatic alight emission. And the distributed feedback laser (DFBL) is still the first choice for many applications despite the relatively large footprint and the bad integration capacity with
Introduction to Nanowire Lasers
165
other optical sources on-chip. NW laser outperforms the DFB in ease of integration and emission wavelength range only when the laser architectures provide stable single-mode emission and they are compatible with largerscale microfabrication techniques (Hua et al., 2009). Even though in 2001, lasing was demonstrated in NWs, it was Xiao et al. (2011), who gave single-mode lasing in a semiconductor NW. By the process of folding and curling, a reduced number of modes varying from a single loop to no loop from one end was observed, and two loops from both ends where single-mode lasing occurred. Emission of 0.12 nm linewidth and 34.4 µJ/cm2 was observed at 738 nm. The single-mode laser can be obtained without any additional photonic structures. Li et al. (2012), using a single GaN NW obtained a stable singlemode lasing output, this was done while operating not close to the lasing threshold. A top-down technique exploiting tunable dry etching, along with wet etching (anisotropic) giving precise wire dimensional control, allowed for high material gain NW fabrication. By using an NW dimension that supported a low transverse mode number in the bandwidth, transverse mode selection was achieved. A significant NW reduction and precise control over it, along with higher material gain to account for the reduction in gain length. Based on a multimode laser theory, narrow gain bandwidth, as well as strong competition, is responsible for single-mode lasing (Johnson et al., 2001, 2003). Single-mode lasing was obtained in NW pairs using the Vernier effect. GaN NWs coupled side-by-side were used, and stimulation was done in one end to perform model selection. Yang et al. (2009) followed the same technique except for axial coupling rather than radial (Gao et al., 2013). It used the concept of the cleaved coupled-cavity from conventional ridge laser diodes to NW lasers. The miniaturization of these devices poses a challenge and places strict conditions on the airgap dimension between the two Fabry-Perot cavities as well as on the crystalline quality of the FabryPerot resonator end facets, which then achieves better axial coupling. In both cases, two FP cavities are coupled and just one resonant mode where both the cavities are stimulated (Qin et al., 2009). Comparatively, Yang et al. (2009) first coupled a SiO2 microfiber knot cavity to a ZnO NW along a 0.2 µJ/cm2 laser threshold. Mode selection was achieved due to this coupling and hence achieving a potentially single-mode and a lower threshold lasing. It is a type of coupled-resonator system as well which is comparable to Vernier-effect experiments.
166
Applications of Nanowires in Electronics
5.3.4. External Cavity Engineering In this section, the focus will be on the NW coupling with photonic structures. In maximizing the lasing efficiency, four such structures have been developed: micro-stadium, Bragg-type structure, ring resonator, and photonic crystals (PhCs). Details of the NW lasers combined with Advanced Photonic Structures studied are given in Figure 5.4.
Figure 5.4. Electrically driven nanowire lasers formed of (right) ZnO and (left) CDs. Note: (a, c) Schematics of structures; (b) SEM images of the device (top) without and (bottom) with current injection; (d) side viewfinder optical microscope observation: (top) under illumination and without current injection, (bottom) without illumination and with a current injection (Chu et al., 2011). Source: https://www.nature.com/articles/nnano.2011.97.
Among the various monolithic semiconductor cavities, the Nanowire geometry and the ring resonator seem incompatible. But still, the combination of the mechanical strength and flexibility of the structures allows developing the artificial nanowires ring cavities. Pauzauskie et al. (2006) did detailed optical spectroscopy in a bare GaN nanowire FP cavity with a GaN nanowire ring resonator. Under optical pumping, lasing
Introduction to Nanowire Lasers
167
oscillations were observed in both structures. But the behaviors are different above and below the threshold value. A Q-factor close to 1000 is observed in the NW ring resonator, which is one order of magnitude higher than for the linear nanowire. Also, a shift in emission wavelength is observed in two cavity types as well, longer wavelength modes were observed through gain discrimination in ring resonators. After this, Ma et al. (2009) in the State Key Laboratory showed matching results but included a method to couple it with an artificial ring resonator by using a straight CdS nanowire. The FP fringes were examined once again to properly characterize the systems (Johnson et al., 2001, 2004). To reveal a so-called micro stadium nanowire laser again, Lieber’s group was among the top, where they joined a single GaN nanowire inside a microresonator in a stadium shape composed of Si3N4 (Park et al., 2007). At 372 nm emission happened at a comparatively high threshold power of 1536 kW/cm2, through a quality factor of 3500. As the refractive index of the Si3N4 micro stadium is < that of GaN (2.5), the light was joined into the Si3N4, which acted as a micro stadium resonator.
New nanowire cavities have been projected to more improve the performance of nanowire laser, typically inspired through solid-state optical micro-cavity ideas. Particularly, semiconductor microcavities having small mode volume V and high Q establish a capable photonic platform for onchip cheap nanolasers, or more improved cavities supporting weak or strong coupling regimes (Claudon et al., 2010; Hostein et al., 2010) [Cla10, Hos10]. In a small volume, the design of a massive optical microcavity depends on firmly constraining light employing highly reflective photonic mirrors. New advancement in photonic bandgap materials has assisted the advancement of highly reflective huge mirrors, like distributed Bragg mirrors projected mainly for VCSEL (vertical-cavity surface-emitting lasers). Chen et al. (2006) presented a distributed-Bragg-reflector mirror an optoelectronic model of a GaN nanolaser lengthways a nanowire composed of consecutive AlGaN/GaN layers having diameter 120 nm and lengths 5–10 µm. Particularly, they describe the geometric parameters to attain single-mode operation situations. Though for surface-emitting nanolasers this structure is attractive, the combination of Bragg mirrors throughout nanowire growth remains a problem and executes strict constraints on fabrication. Likewise, in a 1D PhC cavity Zhang et al. projected implanting a horizontal CdS nanowire molded by PMMA gratings. A mode volume as small as 0.2 (λ/n)3 and A Q factor as high as 3×10⁵ can be accomplished. However,
168
Applications of Nanowires in Electronics
the diameter of the nanowire must still mollify the waveguiding situations described earlier, which confines the reduction of the device (Zhang and Loncar, 2008). In 2011, Das et al. projected a novel SiO2 cavity surrounding a GaN nanowire as a gain medium and closed through the top and bottom SiO2/TiO2 distributed-Bragg-reflector mirrors. At room temperature, they described polariton lasing as having a record low edge of 92.5 nJ/cm2, which is as a minimum two orders of magnitude lesser than the earlier described polariton laser, and above three orders of magnitude lesser than the common photon laser. For advanced cavity quantum electrodynamics systems this extraordinary outcome highpoints the potential of nanowires as a gain medium (Khajavikhan et al., 2012; Park and Crozier, 2013). In 2006 Barrelet et al. completed the first study of a photonic device by employing a single nanowire, where they joined a single CdS nanowire towards a racetrack-type microresonator and a PhC. PhC cavities are made by a limited perturbation of a then regular shape of holes in a dielectric structure. Exceptional optical resonators have been shown (Song et al., 2005), including both a very small modal volume (< (λ/n)3) and a high Q factor (> 106). For giving nanowires with improved cavities PhCs have been considered. Advanced nanolasers can be developed by joining the several degrees of freedom to plan the flexibility of bandgap engineering and a highly resonant PhC cavity during nanowire synthesis (Leosson, 2012). For combining NWs and PhCs, another option is the straight vertical growth of a nanowire from a precise location on the 2D PhC membrane (Figure 5.5). In terms of the optimal light-matter link, Larrue et al. (2012) studied whether this geometry is suitable. The decrease of gain at the lasing threshold, or, consistently, the level of pump, is another principle. This shows that an appropriate design for the PhC cavity and nanowire can let a substantial decrease of the lasing threshold of the nanowire and also increase the impulsive emission factor to ~0.3, which is a distinctive number for nanolasers (Pan et al., 2013).
Introduction to Nanowire Lasers
169
Figure 5.5. Nanowire’s photonic structures. Note: The SEM images of: (a) a nanowire; and (b) a ring resonator, with (c) their spectra of emission; (d) vertical nanowire on a photonic cavity; (e) right: SEM image of the nanowire; left: schematic of a nanowire in a DBR microcavity; (f) SEM image (right) of a GaN nanowire standing on a PhC and schematic (left); (g) schematic (top) and SEM image (bottom) of a nanowire placed on a micro stadium structure; inset: focus at the tip of the nanowire; (h) schematic (top) and SEM image (bottom) of a nanowire lying on a microresonator structure (Barrelet et al., 2006). Source: https://pubs.acs.org/doi/abs/10.1021/nl0522983.
170
Applications of Nanowires in Electronics
REFERENCES Adachi, S., (2004). Handbook on Physical Properties of Semiconductors (Vol. 2, pp. 1–33). Springer Science and Business Media. 2. Agarwal, R., Barrelet, C. J., & Lieber, C. M., (2005). Lasing in single cadmium sulfide nanowire optical cavities. Nano Letters, 5(5), 917– 920. 3. Andreani, L. C., Panzarini, G., & Gérard, J. M., (1999). Strongcoupling regime for quantum boxes in pillar microcavities: Theory. Physical Review B, 60(19), 13276. 4. Arnardottir, K. B., Kyriienko, O., Portnoi, M. E., & Shelykh, I. A., (2013). One-dimensional van hove polaritons. Physical Review B, 87(12), 125408. 5. Bergman, D. J., & Stockman, M. I., (2003). Surface plasmon amplification by stimulated emission of radiation: Quantum generation of coherent surface plasmons in nanosystems. Physical Review Letters, 90(2), 027402. 6. Bernard, M. G., & Duraffourg, G., (1961). Laser conditions in semiconductors. Physica Status Solidi (b), 1(7), 699–703. 7. Bian, Y., Zheng, Z., Zhao, X., Liu, L., Liu, J., Zhu, J., & Zhou, T., (2013). Nanowire based hybrid plasmonic structures for low-threshold lasing at the subwavelength scale. Optics Communications, 287, 245– 249. 8. Cao, B. L., Jiang, Y., Wang, C., Wang, W. H., Wang, L. Z., Niu, M., & Lee, S. T., (2007). Synthesis and lasing properties of highly ordered CdS nanowire arrays. Advanced Functional Materials, 17(9), 1501– 1506. 9. Chen, L., & Towe, E., (2006). Nanowire lasers with distributed-Braggreflector mirrors. Applied Physics Letters, 89(5), 053125. 10. Chen, R., Tran, T. T. D., Ng, K. W., Ko, W. S., Chuang, L. C., Sedgwick, F. G., & Chang-Hasnain, C., (2011). Nanolasers grown on silicon. Nature Photonics, 5(3), 170–175. 11. Chin, A. H., Vaddiraju, S., Maslov, A. V., & Ning, C. Z., (2006). Nearinfrared subwavelength-wire lasers. In: Quantum Electronics and Laser Science Conference (Vol. 1, pp. JWB12). Optical Society of America. 1.
Introduction to Nanowire Lasers
171
12. Chu, S., Wang, G., Zhou, W., Lin, Y., Chernyak, L., Zhao, J., & Liu, J., (2011). Electrically pumped waveguide lasing from ZnO nanowires. Nature Nanotechnology, 6(8), 506–510. 13. Claudon, J., Bleuse, J., Malik, N. S., Bazin, M., Jaffrennou, P., Gregersen, N., & Gérard, J. M., (2010). A highly efficient singlephoton source based on a quantum dot in a photonic nanowire. Nature Photonics, 4(3), 174–177. 14. Danang, B. M., Yokoo, A., Taniyama, H., Kuramochi, E., Takiguchi, M., & Notomi, M., (2012). Design for ultrahigh-Q position-controlled nanocavities of single semiconductor nanowires in two-dimensional photonic crystals. Journal of Applied Physics, 112(11), 113106. 15. Das, A., Heo, J., Jankowski, M., Guo, W., Zhang, L., Deng, H., & Bhattacharya, P., (2011). Room temperature ultralow threshold GaN nanowire polariton laser. Physical Review Letters, 107(6), 066405. 16. Ding, J. X., Zapien, J. A., Chen, W. W., Lifshitz, Y., Lee, S. T., & Meng, X. M., (2004). Lasing in ZnS nanowires grown on anodic aluminum oxide templates. Applied Physics Letters, 85(12), 2361–2363. 17. Ding, Y., Yang, Q., Guo, X., Wang, S., Gu, F., Fu, J., & Tong, L., (2009). Nanowires/microfiber hybrid structure multicolor laser. Optics Express, 17(24), 21813–21818. 18. Domen, K., Kondo, K., Kuramata, A., & Tanahashi, T., (1996). Gain analysis for surface emission by optical pumping of wurtzite GaN. Applied Physics Letters, 69(1), 94–96. 19. Duan, X., Huang, Y., Agarwal, R., & Lieber, C. M., (2003). Singlenanowire electrically driven lasers. Nature, 421(6920), 241–245. 20. Fallert, J., Stelzl, F., Zhou, H., Reiser, A., Thonke, K., Sauer, R., & Kalt, H., (2008). Lasing dynamics in single ZnO nanorods. Optics Express, 16(2), 1125–1131. 21. Feng, G., Yang, C., & Zhou, S., (2013). Nanocrystalline Cr2+-doped ZnSe nanowires laser. Nano Letters, 13(1), 272–275. 22. Friedler, I., Sauvan, C., Hugonin, J. P., Lalanne, P., Claudon, J., & Gérard, J. M., (2009). Solid-state single photon sources: The nanowire antenna. Optics Express, 17(4), 2095–2110. 23. Gadallah, A. S., & El-Nahass, M. M., (2013). Structural, optical constants and photoluminescence of ZnO thin films grown by sol-gel spin coating. Advances in Condensed Matter Physics, 2013.
172
Applications of Nanowires in Electronics
24. Gao, H., Fu, A., Andrews, S. C., & Yang, P., (2013). Cleaved-coupled nanowire lasers. Proceedings of the National Academy of Sciences, 110(3), 865–869. 25. Gargas, D. J., Toimil-Molares, M. E., & Yang, P., (2009). Imaging single ZnO vertical nanowire laser cavities using UV-laser scanning confocal microscopy. Journal of the American Chemical Society, 131(6), 2125–2127. 26. Gradečak, S., Qian, F., Li, Y., Park, H. G., & Lieber, C. M., (2005). GaN nanowire lasers with low lasing thresholds. Applied Physics Letters, 87(17), 173111. 27. Greytak, A. B., Barrelet, C. J., Li, Y., & Lieber, C. M., (2005). Semiconductor nanowire laser and nanowire waveguide electro-optic modulators. Applied Physics Letters, 87(15), 151103. 28. Han, N. S., Shim, H. S., Lee, S., Park, S. M., Choi, M. Y., & Song, J. K., (2012). Light-matter interaction and polarization of single ZnO nanowire lasers. Physical Chemistry Chemical Physics, 14(30), 10556–10563. 29. Henneghien, A. L., Gayral, B., Désières, Y., & Gérard, J. M., (2009). Simulation of waveguiding and emitting properties of semiconductor nanowires with hexagonal or circular sections. JOSA B, 26(12), 2396– 2403. 30. Heo, J., Guo, W., & Bhattacharya, P., (2011). Monolithic single GaN nanowire laser with photonic crystal microcavity on silicon. Applied Physics Letters, 98(2), 021110. 31. Hirano, S., Takeuchi, N., Shimada, S., Masuya, K., Ibe, K., Tsunakawa, H., & Kuwabara, M., (2005). Room-temperature nanowire ultraviolet lasers: An aqueous pathway for zinc oxide nanowires with low defect density. Journal of Applied Physics, 98(9), 094305. 32. Hofmann, C. E., García, D. A. F. J., & Atwater, H. A., (2011). Enhancing the radiative rate in III–V semiconductor plasmonic coreshell nanowire resonators. Nano Letters, 11(2), 372–376. 33. Hostein, R., Braive, R., Le Gratiet, L., Talneau, A., Beaudoin, G., Robert-Philip, I., & Beveratos, A., (2010). Demonstration of coherent emission from high-β photonic crystal nanolasers at room temperature. Optics Letters, 35(8), 1154–1156.
Introduction to Nanowire Lasers
173
34. Hua, B., Motohisa, J., Kobayashi, Y., Hara, S., & Fukui, T., (2009). Single GaAs/GaAsP coaxial core-shell nanowire lasers. Nano Letters, 9(1), 112–116. 35. Huang, M. H., Mao, S., Feick, H., Yan, H., Wu, Y., Kind, H., & Yang, P., (2001). Room-temperature ultraviolet nanowire nanolasers. Science, 292(5523), 1897–1899. 36. Johnson, J. C., Choi, H. J., Knutsen, K. P., Schaller, R. D., Yang, P., & Saykally, R. J., (2002). Single gallium nitride nanowire lasers. Nature Materials, 1(2), 106–110. 37. Johnson, J. C., Knutsen, K. P., Yan, H., Law, M., Zhang, Y., Yang, P., & Saykally, R. J., (2004). Ultrafast carrier dynamics in single ZnO nanowire and nanoribbon lasers. Nano Letters, 4(2), 197–204. 38. Johnson, J. C., Yan, H., Schaller, R. D., Haber, L. H., Saykally, R. J., & Yang, P., (2001). Single nanowire lasers. The Journal of Physical Chemistry B, 105(46), 11387–11390. 39. Johnson, J. C., Yan, H., Yang, P., & Saykally, R. J., (2003). Optical cavity effects in ZnO nanowire lasers and waveguides. The Journal of Physical Chemistry B, 107(34), 8816–8828. 40. Kalt, H., & Klingshirn, C. F., (2019). Semiconductor Optics, 1, 1–22. 41. Khajavikhan, M., Simic, A., Katz, M., Lee, J. H., Slutsky, B., Mizrahi, A., & Fainman, Y., (2012). Threshold less nanoscale coaxial lasers. Nature, 482(7384), 204–207. 42. Klingshirn, C., (2007). ZnO: Material, physics, and applications. ChemPhysChem., 8(6), 782–803. 43. Larrue, A., Wilhelm, C., Vest, G., Combrié, S., De Rossi, A., & Soci, C., (2012). Monolithic integration of III–V nanowire with photonic crystal microcavity for vertical light emission. Optics Express, 20(7), 7758–7770. 44. Leosson, K., (2012). Optical amplification of surface plasmon polaritons. Journal of Nanophotonics, 6(1), 061801. 45. Li, J., Meng, C., Liu, Y., Wu, X., Lu, Y., Ye, Y., & Yang, Q., (2013). Wavelength tunable CdSe nanowire lasers based on the absorption‐ emission‐absorption process. Advanced Materials, 25(6), 833–837. 46. Li, Q., Wright, J. B., Chow, W. W., Luk, T. S., Brener, I., Lester, L. F., & Wang, G. T., (2012). Single-mode GaN nanowire lasers. Optics Express, 20(16), 17873–17879.
174
Applications of Nanowires in Electronics
47. Liu, X., Zhang, Q., Xiong, Q., & Sum, T. C., (2013). Tailoring the lasing modes in semiconductor nanowire cavities using intrinsic selfabsorption. Nano Letters, 13(3), 1080–1085. 48. Luan, C. Y., Liu, Y. K., Jiang, Y., Jie, J. S., Bello, I., Lee, S. T., & Zapien, J. A., (2012). Composition tuning of room-temperature nanolasers. Vacuum, 86(6), 737–741. 49. Ma, R. M., Wei, X. L., Dai, L., Liu, S. F., Chen, T., Yue, S., & Qin, G. G., (2009). Light coupling and modulation in coupled nanowire ringFabry-Pérot cavity. Nano Letters, 9(7), 2697–2703. 50. Maslov, A. V., & Ning, C. Z., (2004). Far-field emission of a semiconductor nanowire laser. Optics Letters, 29(6), 572–574. 51. Maslov, A. V., & Ning, C. Z., (2004). Modal properties of semiconductor nanowires for laser applications. In: Physics and Simulation of Optoelectronic Devices XII (Vol. 5349, pp. 24–30). International Society for Optics and Photonics. 52. Maslov, A. V., & Ning, C. Z., (2007). Size reduction of a semiconductor nanowire laser by using metal coating. In: Physics and Simulation of Optoelectronic Devices XV (Vol. 6468, p. 64680I). International Society for Optics and Photonics. 53. Pan, A., Wang, S., Liu, R., Li, C., & Zou, B., (2005). Thermal stability and lasing of CdS nanowires coated by amorphous silica. Small, 1(11), 1058–1062. 54. Pan, C., Dong, L., Zhu, G., Niu, S., Yu, R., Yang, Q., & Wang, Z. L., (2013). High-resolution electroluminescent imaging of pressure distribution using a piezoelectric nanowire LED array. Nature Photonics, 7(9), 752–758. 55. Park, H. G., Barrelet, C. J., Bao, J., Lončar, M., Capasso, F., & Lieber, C. M., (2006). Hybrid single nanowire photonic crystal structure. In: Conference on Lasers and Electro-Optics (pp. CThB5). Optical Society of America. 56. Park, H. G., Qian, F., Barrelet, C. J., & Li, Y., (2007). Microstadium single-nanowire laser. Applied Physics Letters, 91(25), 251115. 57. Park, H., & Crozier, K. B., (2013). Multispectral imaging with vertical silicon nanowires. Scientific Reports, 3(1), 1–6. 58. Pauzauskie, P. J., Sirbuly, D. J., & Yang, P., (2006). Semiconductor nanowire ring resonator laser. Physical Review Letters, 96(14), 143903.
Introduction to Nanowire Lasers
175
59. Qian, F., Li, Y., Gradečak, S., Park, H. G., Dong, Y., Ding, Y., & Lieber, C. M., (2008). Multi-quantum-well nanowire heterostructures for wavelength-controlled lasers. Nature Materials, 7(9), 701–706. 60. Qin, Q., Williams, B. S., Kumar, S., Reno, J. L., & Hu, Q., (2009). Tuning a terahertz wire laser. Nature Photonics, 3(12), 732–737. 61. Scofield, A. C., Kim, S. H., Shapiro, J. N., Lin, A., Liang, B., Scherer, A., & Huffaker, D. L., (2011). Bottom-up photonic crystal lasers. Nano Letters, 11(12), 5387–5390. 62. Seo, M. K., Yang, J. K., Jeong, K. Y., Park, H. G., Qian, F., Ee, H. S., & Lee, Y. H., (2008). Modal characteristics in a single-nanowire cavity with a triangular cross-section. Nano Letters, 8(12), 4534–4538. 63. Song, B. S., Noda, S., Asano, T., & Akahane, Y., (2005). Ultra-high-Q photonic double-heterostructure nanocavity. Nature Materials, 4(3), 207–210. 64. Van, V. L. K., Rühle, S., & Vanmaekelbergh, D., (2006). Phasecorrelated nondirectional laser emission from the end facets of a ZnO nanowire. Nano Letters, 6(12), 2707–2711. 65. Wang, Z., Tian, B., & VanThourhout, D., (2013). Design of a novel micro-laser formed by monolithic integration of a III–V pillar with a silicon photonic crystal cavity. Journal of Lightwave Technology, 31(9), 1475–1481. 66. Wright, J. B., Li, Q., Luk, T. S., Figiel, J. J., Cross, K. C., Brener, I., & Lester, L. F., (2012). Gold Substrate-Induced Single-Mode Lasing of GaN Nanowires (No. SAND2012-8520J). Sandia National Laboratories. 67. Wu, C. Y., Kuo, C. T., Wang, C. Y., He, C. L., Lin, M. H., Ahn, H., & Gwo, S., (2011). Plasmonic green nanolaser based on a metal-oxidesemiconductor structure. Nano Letters, 11(10), 4256–4260. 68. Wu, X., Xiao, Y., Meng, C., Zhang, X., Yu, S., Wang, Y., & Tong, L., (2013). Hybrid photon-plasmon nanowire lasers. Nano Letters, 13(11), 5654–5659. 69. Xiao, Y., Meng, C., Wang, P., Ye, Y., Yu, H., Wang, S., & Tong, L., (2011). Single-nanowire single-mode laser. Nano Letters, 11(3), 1122– 1126. 70. Xu, H., Wright, J. B., Luk, T. S., Figiel, J. J., Cross, K., Lester, L. F., & Li, Q., (2012). Single-mode lasing of GaN nanowire-pairs. Applied Physics Letters, 101(11), 113106.
176
Applications of Nanowires in Electronics
71. Yang, Q., Jiang, X., Guo, X., Chen, Y., & Tong, L., (2009). Hybrid structure laser based on semiconductor nanowires and a silica microfiber knot cavity. Applied Physics Letters, 94(10), 101108. 72. Yang, W., Ma, Y., Wang, Y., Meng, C., Wu, X., Ye, Y., & Yang, Q., (2013). Bending effects on lasing action of semiconductor nanowires. Optics Express, 21(2), 2024–2031. 73. Ye, Y., Ma, Y., Yue, S., Dai, L., Meng, H., Li, Z., & Qin, G., (2011). Lasing of CdSe/SiO2 nanocables synthesized by the facile chemical vapor deposition method. Nanoscale, 3(8), 3072–3075. 74. Zhang, C., Zhang, F., Xia, T., Kumar, N., Hahm, J. I., Liu, J., & Xu, J., (2009). Low-threshold two-photon pumped ZnO nanowire lasers. Optics Express, 17(10), 7893–7900. 75. Zhang, J. Y., Zhang, Q. F., Deng, T. S., & Wu, J. L., (2009). Electrically driven ultraviolet lasing behavior from phosphorus-doped p-ZnO nanonail array/n-Si heterojunction. Applied Physics Letters, 95(21), 211107. 76. Zhang, Y., & Lončar, M., (2008). Ultra-high quality factor optical resonators based on semiconductor nanowires. Optics Express, 16(22), 17400–17409. 77. Zhou, H., Wissinger, M., Fallert, J., Hauschild, R., Stelzl, F., Klingshirn, C., & Kalt, H., (2007). Ordered, uniform-sized ZnO nanolaser arrays. Applied Physics Letters, 91(18), 181112. 78. Zhu, L., (2010). Modal properties of hybrid plasmonic waveguides for nanolaser applications. IEEE Photonics Technology Letters, 22(8), 535–537. 79. Zimmler, M. A., Bao, J., Capasso, F., Müller, S., & Ronning, C., (2008). Laser action in nanowires: Observation of the transition from amplified spontaneous emission to laser oscillation. Applied Physics Letters, 93(5), 051101. 80. Zimmler, M. A., Capasso, F., Müller, S., & Ronning, C., (2010). Optically pumped nanowire lasers: Invited review. Semiconductor Science and Technology, 25(2), 024001.
CHAPTER
6
APPLICATIONS OF NANOWIRES IN LIGHT EMITTING DIODES
CONTENTS 6.1. Introduction..................................................................................... 178 6.2. LED Growth Mechanisms................................................................ 179 6.3. Pambe Growth of GAN Nanowires.................................................. 187 6.4. Structural Characterization.............................................................. 188 6.5. Photoluminescence (Pl)................................................................... 188 References.............................................................................................. 189
178
Applications of Nanowires in Electronics
6.1. INTRODUCTION Bottom-up nanowires are known for making semiconductor devices with high heterostructures due to strain relaxation by the nanowire sidewalls, which permit the combination of highly lattice incompatible materials without forming dislocations. The resulting nanowires are utilized to fabricate LEDs (light-emitting diodes), solar cells, sensors, and lasers. However, costly single crystalline substrates are generally utilized as substrates for nanowire heterostructures also for epitaxial devices, which confines the manufacturability of nanowire devices (Sarwar et al., 2015; Zhao et al., 2015, 2016). Here, we determine nanowire LEDs grown directly and electrically incorporated on metal. Structural and optical measurements expose high-quality, vertically-aligned GaN nanowires on titanium and molybdenum films. Transmission electron microscopy (TEM) endorses the composition disparity in the polarization-graded Al GaN nanowire light-emitting diodes. Blue to green electroluminescence (EL) is perceived from InGaN quantum well active areas, though GaN active regions show ultraviolet (UV) emission. These results determine a pathway for the hugescale fabrication of solid-state lighting and optoelectronics on metal sheets or foils (Tchernycheva et al., 2014). The III-Nitride semiconductor group has an extensive range of technologically significant applications, particularly in visible and UV LEDs (light-emitting diodes) and lasers (Taniyasu et al., 2006; Nakamura et al., 1994). High-class GaN thin films are usually grown on single crystalline sapphire substrates because of a good epitaxial relationship. Since the initial synthesis of GaN on sapphire major technological barriers have been overwhelmed to realize the commercialization of III-Nitride founded LEDs on sapphire like as comprehending p-type doping, mitigating electron overflow utilizing comprehensive bandgap AlGaN electron obstructive layer, and developing high-quality AlGaN and InGaN quantum wells (Maruska and Tietjen, 1969; Nakamura et al., 1992). Lately, several research groups have been keenly working on III-N nanowires, and substantial progress has been stated on the growth mechanisms/method. Some normally used synthesis techniques comprise catalyst-founded nanowires, self-assembled catalyst open nanowires, and nanowires on selective area development or pre-patterned substrates. Materials synthesized utilizing catalysts undergo high concentrations of unwanted contaminations, and specific area growth needs costly and complex processing steps. On the other hand, catalyst, unrestricted GaN nanowires are free of these drawbacks (Gardner et al., 2007; Shatalov et al.,
Applications of Nanowires in Light Emitting Diodes
179
2012). Single crystalline Si substrates are generally utilized to produce selfassembled catalyst unrestricted GaN nanowires; Si also has the benefit of serving as a contact for optoelectronic and electronic devices. Though, one of the major restrictive factors in the realization of huge-scale fabrication is the single-crystal Si substrate. It also confines performance as it engrosses light in optoelectronic devices. Gratefully, GaN nanowires have been revealed to grow on optically translucent amorphous SiOx and glass substrates. These outcomes are proof that GaN nanowires don’t require a universal epitaxial relationship with the substrate and could be grown on largely accessible substrates (Calarco et al., 2007; Ristić et al., 2008).
6.2. LED GROWTH MECHANISMS Here we report the direct development and electrical incorporation of IIINitride nanowire LEDs on metal. Initially, the growth of GaN nanowires on tinny Ti and Mo films on Si wafers is revealed. PL (Photoluminescence) measurements present the same optical quality for the nanowires grown on Si wafers related to those grown on metal. Room temperature band edge PL release at 363 nm with a 10 nm FWHM (full width at half maximum) is perceived; however, below bandgap fault-related PL is missing. Further, nanowire LEDs comprised of polarization graded AlGaN nanowires on tinny Mo films are fabricated with a diversity of GaN and InGaN active regions (McCune et al., 2012; Li et al., 2015). The EL from InGaN nanowire LEDs is diverse from blue to green (450 to 565 nm) with the highest efficiency at 230 A/cm2 and 3% efficiency fall at 500 A/cm2. Modeling of the EQE (external quantum efficiency) utilizing the ABC model discloses a maximum IQE (internal quantum efficiency) of ~47%, which is similar to the stated typical IQE values for visible GaN founded nanowire LEDs on Si. Lastly, nanowire LEDs developed on Mo films comprising GaN active regions release at UV (385 nm) wavelengths. The selection of Mo metal film is overseen by the fact that our nanowire LEDs present a p-down orientation because of the utilization of polarization-induced doping and Mo is predicted to make good electrical interaction with p-type GaN because of its comparatively large work function. Moreover, it is a safe material for MBE (molecular beam epitaxy) environment because of its high low vapor pressure at high temperatures (Zimmler et al., 2009; Kent et al., 2014). Self-assembled catalyst unrestricted GaN nanowires are developed directly on Mo and Ti films utilizing PAMBE (plasma-assisted molecular beam epitaxy). To confirm identical growth situations, one-quarter of
180
Applications of Nanowires in Electronics
the wafer is covered with Mo, another quarter is covered with Ti and the remaining wafer is left as bare Si. The metal-covered Si wafer is moved to the MBE growth section, and native oxide desorption is executed in-situ through heating the substrate to 1000°C for 1 minute with a ramp rate of 50°C/ min underneath a vacuum of ~7×10–11 torr. Figure 6.1(a)–(c) displays the SEM (scanning electron microscopy) images of the nanowires developed on Si, Ti, and Mo, respectively. As predicted, the nanowires on Si show vertical orientation. Statistical examination of the SEM images tells that diameter and density of the nanowires on Si are 34.75±8.56 nm and 209±12 µm–2, respectively (Guo et al., 2010; Rigutti et al., 2010). It is found that nanowires developed on Ti film show comparatively lower density and larger diameter (54.77±7.76 nm) however, nanowires developed on Mo film display the same density and diameter (35.75±5.81 nm) related to the nanowires developed on Si. In both metals, delamination of the film from the Si wafer is perceived, as shown in Figure 6.1 (b) and (c). We speculate that this happens because of the large thermal growth mismatch among Si (2.6–3.3 × 10⁻⁶ K–1) and metal films (Ti: 8.4–8.6 × 10⁻⁶ K–1 and Mo: 4.8–5.1 × 10⁻⁶ K–1). Furthermore, the high temperature (1000°C) in-situ oxide desorption phase could also contribute to the delamination of metal films. Utilizing of small ramp rate and missing the in-situ oxide desorption phase (which is not compulsory if exclusively grown on metal) is found to assist decrease the delamination problem and utilized for later samples (Bertness et al., 2010; Ra et al., 2014).
Figure 6.1. Developing semiconductor nanowires on metal films. SEM (Scanning electron microscopy) images of GaN nanowires developed on (a) Si; (b)
Applications of Nanowires in Light Emitting Diodes
181
Ti; and (c) Mo; (d) room temperature PL (photoluminescence) measurements of GaN nanowires developed on Si (black line), Ti (red line), and Mo (blue line).
Source: https://onlinelibrary.wiley.com/doi/abs/10.1002/smll.201501909. Figure 6.1(d) displays the room temperature PL release spectra from nanowires developed on Ti (red), Mo (blue), and Si (black). Nanowires developed on all three substrates display only a single PL peak release at 363 nm (~3.423 eV) with FWHM of 10 nm, which links to the band to band carrier recombination in GaN. Further, sub-bandgap features are not perceived over the measured spectral extent (300 to 650 nm). PAMBE developed GaN nanowires on Si are stated to be closely dislocation-free and don’t show defect-mediated yellow luminescence, which is very usual in GaN thin films. The lack of yellow luminesce from nanowires developed on Mo or Ti films shows that nanowires developed on metal films have similar quality as nanowires developed on single crystalline Si wafers (Glas, 2006; Wang et al., 2015). After effectively developing high-quality GaN nanowires on the metal films, we grow and describe nanowire LEDs on metal with together visible and near UV emitting active areas. The design of the nanowire LED heterostructure takes benefit of the intrinsic polarization of IIINitride materials. When compositionally classified, the polarization forms 3D distributed bound charge. At this point, we nucleate Mg-doped GaN nanowires on Mo films utilizing PAMBE at 720°C. An earlier study exhibited that catalyst-free PAMBE developed GaN nanowires grow especially in the (0001̅) crystallographic direction (N-face) (Meijers et al., 2006; Consonni et al., 2010). Following nucleation, the configuration of the nanowire is linearly classified using a shutter pulsing technique from GaN to AlN over 50 nm. This forms a 6.5×1018 cm–3 negative bound polarization charge, causing p-type conductivity. A dynamic region is comprised of 3× InGaN/ GaN quantum wells put at 625°C. Further, a 100 nm AlN to GaN linearly graded layer is placed to persuade polarization doped n-type layer. The top (n-type) and bottom (p-type) graded areas are doped with Si and Mg, respectively. Attentive readers are directed to ref. (Golam et al., 2015) for details on polarization-induced doping in the classified AlGaN nanowires and their confines (Park et al., 2005; Songmuang et al., 2007). Figure 6.2(a) and (b) display the cross-section and plan-view SEM pictures of the nanowire LED heterostructure, correspondingly. Closely vertically aligned high-density nanowires are perceived on the Mo film.
182
Applications of Nanowires in Electronics
Figure 6.2(c) displays HAADF (high angle annular dark field) STEM (scanning transmission electron microscopy) image and EDXS (energy dispersive x-ray spectroscopy) chemical composition (Ga, Mo, and Al) maps in the nanowire heterostructure. Chemical composition diagrams show an extreme Ga concentration at the top and base of the nanowire and the highest Al concentration at the center of the nanowire endorsing the back and forth compositional classifying in the vertical direction (Debnath et al., 2007; Tchernycheva et al., 2007). Displayed in Figure 6.2(d), the EDXS line scan alongside the growth direction (i-ii in Figure 6.2(c)) exhibits the desired linear alteration in Al and Ga composition in the p and n-side as designed. The Ga rich portion at the mid of the nanowire (Figure 6.2(c)) links to the active region. We don’t see an obvious In signal from the active area, which is likely because of the overlapping of numerous nanowires in this sample made utilizing FIB. Though, In signal is perceived from a single nanowire that is discrete on a TEM grid. Figure 6.2(e) displays a HAADF STEM image of the active area of a nanowire LED and related chemical composition diagrams (In, Al, and Ga). An EDXS line scan alongside the radial direction (red line in Figure 6.2(e)) by an InGaN quantum well (Figure 6.2(f)) displays a defined InGaN core region covered with an Al-rich AlGaN shell. The impulsive creation of an Al-rich AlGaN shell region is the consequence of the low adatom mobility of Al linked to Ga and In at high temperatures. The Al adatoms intruding on the side walls integrate where they land earlier they could diffuse to the top of the nanowire (Bertness et al., 2010). On the other hand, Ga, and In adatoms have greater mobility (compared to Al) and could diffuse towards the uppermost of the nanowire and integrate there. A line scan alongside the axis of the active area (blue line in Figure 6.2(e)) displays the formation of 3 InGaN quantum wells detached by GaN barriers, revealed in Figure 6.2(g). The In composition and width of the quantum wells are found to enhance in subsequent quantum wells. This kind of variation in composition and width is observed earlier in InGaN/ GaN nanowire heterostructure through Tourbot et al. (2012). The authors accredited this fluctuation to the composition pulling effect. It is worth noticing that the EDXS analysis is executed without a standard, and because of the complicated core-shell geometry of the nanowires, the composition attained in this analysis is not entire.
Applications of Nanowires in Light Emitting Diodes
183
Figure 6.2. Chemical mapping of the compositional fluctuation in nanowire heterostructures developed on metal. Note: (a) Cross-section; and (b) plan vision SEM images of classified AlGaN nanowire LEDs developed on Mo films placed on Si substrate; (c) HAADF (high angle annular dark field) STEM (scanning transmission electron microscopy) image along with EDXS (energy dispersive x-ray spectroscopy) chemical composition maps displaying back and forth composition grouping; (d) EDXS line scan together with the axis (i-ii in Figure 6.2(c)) of the nanowire heterostructure displaying approximately linear difference of Ga and Al composition. Mo signal could be observed from underneath the nanowire. (e) HAADF STEM image of the active area of a single nanowire. Al, In, and Ga composition maps are also shown; (f) EDXS line scan besides the radial direction by the 2nd QW (quantum well) showing InGaN QW enfolded in an Al-rich AlGaN shell; (g) EDXS line scan alongside the axis of the active area showing 3 InGaN QWs with enhancing in composition in the growth direction. Source: https://onlinelibrary.wiley.com/doi/10.1002/smll.201501909.
184
Applications of Nanowires in Electronics
Nanowire LED devices are made up through depositing a 5 nm Ti/10 nm Au semitransparent top contact right onto the uppermost of the nanowires. A 300 nm Au grid is placed on top of the semitransparent contact as a current dispersion layer. In-diffused bottom contact is created on the Si substrate after mechanically eliminating the nanowires (Hsiao et al., 2006). The diagram of the contact creation scheme is displayed in the inset of Figure 6.3(a). A DC current-voltage (I-V) characteristic of a nanowire LED device is displayed in Figure 6.3(a). Diode conduct having a threshold voltage of ~6V is perceived. EL measurements are executed on 300×300 µm2 LED devices under pulsed (~1% duty cycle) current excitation to reduce any junction heating effect. Figure 6.3(b) displays EL spectra from a device below excitation over the range of 100–500 mA in 100 mA steps. The insertion of Figure 6.3(b) displays an optical image of the nanowire LED device functioning under DC excitation. A video of functioning nanowire LED on Mo film could be found in the additional information (Bertness et al., 2006). The highest emission at ~510 nm is witnessed which corresponds to discharge from the numerous InGaN quantum wells. Figure 6.3(c) displays the highest emission wavelength (black squares) and FWHM (red circles) as a purpose of injection current density. The highest emission moves from ~532 nm (at low injection) to ~510 nm (at high injection). We aspect this blue move to a combination of 2 factors. First, this could be due to the quantum restricted Stark effect in individual QWs usually observed in nitride-founded polar quantum wells. Second, this could be the outcome of a slight fluctuation in In composition in QWs. Because of better electron injection related to hole injection, discharge from the third QW (near to n-side graded region) leads to low injection. With the rise in carrier injection, discharge from second and first QW causes the blue move due to reduced In composition (i.e., high bandgap) in these QWs. The FWHM reduces from 77.7 nm at low injection to 70.6 nm at high injection. Figure 6.3(d) displays the highest emission intensity (black squares) and relative EQE (red triangles) as a function of current density. The highest emission intensity rises linearly from low to moderate injection and displays alteration from linearity at high current density. EQE displays a rise with current density and highest at ~230 A/cm2. EQE value falls by 3% at 500 A/cm2 and 12% at 1000 A/cm2, compared to the peak EQE value (Carnevale et al., 2011).
Applications of Nanowires in Light Emitting Diodes
185
Figure 6.3. Green nanowire LEDs developed on metal with InGaN quantum well active areas. Note: (a) Current-voltage characteristic of nanowire LED on the Mo film. Insertion displays the schematic of the contact creation scheme; (b) EL (electroluminescence) spectra under pulsated current excitation of an InGaN QW nanowire LED developed on Mo film releasing near the green band. Inset displays an optical picture of an LED device in operation; (c) highest discharge wavelength (black squares) FWHM (full width at half maximum) as a function of current density; (d) EL highest intensity (black squares) and comparative EQE (red triangles) as a function of injection current density. IQE (blue line) is modeled through fitting relative EQE utilizing the ABC model. Source: https://www.researchgate.net/figure/Characteristics-of-AlGaN-nanowire-LEDs-The-p-metal-size-is-500-m-500-m-a_fig4_307443890.
The IQE of an LED could be modeled utilizing the ABC model.
Here; A is the Shockley-Read-Hall non-radiative recombination coefficient; B is the radiative recombination coefficient; C signifies higherorder carrier loss because of Auger recombination and/or carrier runoff;
186
Applications of Nanowires in Electronics
and n is the carrier concentration in the active area. EQE is the product of EE (extraction efficiency) and IQE. Supposing EE to be free of injection current density, IQE is modeled by fitting the shape of EQE utilizing the ABC model. Using this technique, we found A, B, and C are 2×10⁸ s–1, 2.5 × 10⁻¹⁰ cm3s–1, and 10–28 cm6s–1, correspondingly, for our nanowire devices, very near to the stated values for InGaN nanowire LEDs. The extreme IQE is found to be ~ 47% which lies in the reported value range (40–50%) for obvious nanowire LEDs (Hersee et al., 2006). The nanowires in this study are developed on a 3-inch wafer. Figure 6.4 displays emission spectra of the LED devices measured from diverse locations of the wafer. Right-most (leftmost) signifies an LED device from the center (edge) of the wafer. We noticed an alteration in the emission wavelength from LED devices through the wafer. We aspect this fluctuation to the temperature incline across the three-inch substrate throughout nanowire deposition (Stoica et al., 2008). It is well-identified that InGaN composition is a durable function of temperature which outcomes in higher In incorporation in the QWs at the edge (low temperature) than in the middle (high temperature) region. Moreover, SEM images examine on the nanowire samples shown smaller average diameters (31.6 nm) at the midpoint (high temperature) of the wafer compared to the average diameter (39.9 nm) at the border (low temperature) of the wafer. R. Armitage et al. have shown that In integration in nanowires enhancing with increasing diameter. These two facts describe the blue shift witnessed in the EL spectra in Figure 6.4 from the edge to midpoint region (Figure 6.5) (Duan and Lieber, 2000).
Figure 6.4. Display of blue to green nanowire LEDs developed on metal. An extensive range of emission wavelengths is witnessed from different areas of a 3-inch wafer covered with Mo because of the temperature sensitivity of In integration in the InGaN active regions.
Applications of Nanowires in Light Emitting Diodes
187
Source: https://www.led-professional.com/resources-1/articles/full-color-ingan-algan-nanowire-light-emitting-diodes-for-ssl-and-displays.
Figure 6.5. Ultraviolet nanowire LEDs developed on metal. Note: (a) Current-voltage characteristic of a GaN QW nanowire LED developed on Mo film; (b) EL (electroluminescence) spectra underneath pulsed current excitation of a GaN QW nanowire LED developed on Mo film releasing near-ultraviolet wavelength; (c) EL highest intensity under the constant wave, pulsed (blue circles) and CW (black triangles) current as a purpose of injection current density. Source: https://onlinelibrary.wiley.com/doi/abs/10.1002/smll.201501909.
6.3. PAMBE GROWTH OF GAN NANOWIRES Self-assembled catalyst unrestricted GaN nanowires are developed using Veeco Gen 930 PAMBE system. Ti and Mo thin films (~50 nm) are deposited utilizing electron beam evaporation on a 3 inch Si (111) wafer. Nanowires are grown utilizing the two-step dynamic growth process described in Carnevale et al. (2011). In this technique, nanowires are nucleated at a low temperature until necessary nanowire density is attained, followed by a high-temperature growth in which previously nucleated nanowires carry on to grow; however new nanowire nucleation doesn’t happen. GaN nanowires are nucleated at 720°C for 5 min and developed at 790°C for 2 hours. A nitrogen partial pressure of 2×10⁻⁵ torr is utilized having a plasma power of 350 W (Kuykendall et al., 2014).
188
Applications of Nanowires in Electronics
6.4. STRUCTURAL CHARACTERIZATION SEM images are collected utilizing an FEI/Philips Sirion SEM with a FE (field emission) source and an in-lens secondary electron detector. STEM samples are made with a Helios NanoLab 600 dual-beam FIB (focused ion beam). High-resolution STEM imaging is worked out on an FEI image modified Titan3TM G2 60–300 S/TEM furnished with a quad silicon drift detector at 300 kV (Schuster et al., 2015).
6.5. PHOTOLUMINESCENCE (PL) The nanowires are optically eager utilizing the third harmonic (266 nm) of a mode-locked Ti: sapphire oscillator (Coherent Chameleon Ultra II) functioning at 800 nm and 40 MHz. The samples are brightened with an average power of 0.5 mW and attentive on the sample surface by a 0.5 NA 36× reflective objective which consequences in a beam diameter of ~10 µm. The discharge from the samples is gathered through a 300 nm long-pass filter and agreed to a 0.5 m spectrometer (Princeton Instruments SP2500i) armed with a UV-Vis CCD (Princeton Instruments PIXIS100) and a 1200 g/ mm diffraction grating (Gačević et al., 2015).
Applications of Nanowires in Light Emitting Diodes
189
REFERENCES 1.
Bertness, K. A., Roshko, A., Sanford, N. A., Barker, J. M., & Davydov, A. V., (2006). Spontaneously grown GaN and AlGaN nanowires. Journal of Crystal Growth, 287(2), 522–527. 2. Bertness, K. A., Sanford, N. A., & Davydov, A. V., (2010). GaN nanowires grown by molecular beam epitaxy. IEEE Journal of Selected Topics in Quantum Electronics, 17(4), 847–858. 3. Calarco, R., Meijers, R. J., Debnath, R. K., Stoica, T., Sutter, E., & Lüth, H., (2007). Nucleation and growth of GaN nanowires on Si (111) performed by molecular beam epitaxy. Nano Letters, 7(8), 2248–2251. 4. Carnevale, S. D., Yang, J., Phillips, P. J., Mills, M. J., & Myers, R. C., (2011). Three-dimensional GaN/AlN nanowire heterostructures by separating nucleation and growth processes. Nano Letters, 11(2), 866–871. 5. Consonni, V., Knelangen, M., Geelhaar, L., Trampert, A., & Riechert, H., (2010). Nucleation mechanisms of epitaxial GaN nanowires: Origin of their self-induced formation and initial radius. Physical Review B, 81(8), 085310. 6. De Cremoux, B., (1982). Instability criteria in ternary and quaternary II IV epitaxial solid solutions. Le Journal De Physique Colloques, 43(C5), C5–19. 7. Debnath, R. K., Meijers, R., Richter, T., Stoica, T., Calarco, R., & Lüth, H., (2007). Mechanism of molecular beam epitaxy growth of GaN nanowires on Si (111). Applied Physics Letters, 90(12), 123117. 8. Duan, X., & Lieber, C. M., (2000). Laser-assisted catalytic growth of single-crystal GaN nanowires. Journal of the American Chemical Society, 122(1), 188–189. 9. Gačević, Z., Gomez, S. D., & Calleja, E., (2015). Formation mechanisms of GaN nanowires grown by selective area growth homoepitaxy. Nano Letters, 15(2), 1117–1121. 10. Gardner, N. F., Müller, G. O., Shen, Y. C., Chen, G., Watanabe, S., Götz, W., & Krames, M. R., (2007). Blue-emitting InGaN-GaN doubleheterostructure light-emitting diodes reaching maximum quantum efficiency above 200 A/cm2. Applied Physics Letters, 91(24), 243506. 11. Glas, F., (2006). Critical dimensions for the plastic relaxation of strained axial heterostructures in free-standing nanowires. Physical Review B, 74(12), 121302.
190
Applications of Nanowires in Electronics
12. Golam, S. A. T. M., Carnevale, S. D., Kent, T. F., Yang, F., McComb, D. W., & Myers, R. C., (2015). Tuning the polarization-induced free hole density in nanowires graded from GaN to AlN. Applied Physics Letters, 106(3), 032102. 13. Guo, W., Zhang, M., Banerjee, A., & Bhattacharya, P., (2010). Catalystfree InGaN/GaN nanowire light-emitting diodes grown on (001) silicon by molecular beam epitaxy. Nano Letters, 10(9), 3355–3359. 14. Hersee, S. D., Sun, X., & Wang, X., (2006). The controlled growth of GaN nanowires. Nano Letters, 6(8), 1808–1811. 15. Hsiao, C. L., Tu, L. W., Chi, T. W., Seo, H. W., Chen, Q. Y., & Chu, W. K., (2006). Buffer controlled GaN nanorods growth on Si (111) substrates by plasma-assisted molecular beam epitaxy. Journal of Vacuum Science and Technology B: Microelectronics and Nanometer Structures Processing, Measurement, and Phenomena, 24(2), 845–851. 16. Kent, T. F., Carnevale, S. D., Sarwar, A. T. M., Phillips, P. J., Klie, R. F., & Myers, R. C., (2014). Deep ultraviolet emitting polarization induced nanowire light-emitting diodes with AlxGa1-xN active regions. Nanotechnology, 25(45), 455201. 17. Kuykendall, T. R., Altoe, M. V. P., Ogletree, D. F., & Aloni, S., (2014). Catalyst-directed crystallographic orientation control of GaN nanowire growth. Nano Letters, 14(12), 6767–6773. 18. Li, K. H., Liu, X., Wang, Q., Zhao, S., & Mi, Z., (2015). Ultralowthreshold electrically injected AlGaN nanowire ultraviolet lasers on Si operating at low temperature. Nature Nanotechnology, 10(2), 140. 19. Maruska, H. P., & Tietjen, J. J., (1969). The preparation and properties of vapor‐deposited single-crystalline GaN. Applied Physics Letters, 15(10), 327–329. 20. McCune, M., Zhang, W., & Deng, Y., (2012). High efficiency dyesensitized solar cells based on three-dimensional multilayered ZnO nanowire arrays with “caterpillar-like” structure. Nano Letters, 12(7), 3656–3662. 21. Meijers, R., Richter, T., Calarco, R., Stoica, T., Bochem, H. P., Marso, M., & Lüth, H., (2006). GaN-nanowhiskers: MBE-growth conditions and optical properties. Journal of Crystal Growth, 289(1), 381–386. 22. Nakamura, S., Iwasa, N., Senoh, M., & Mukai, T., (1992). Hole compensation mechanism of p-type GaN films. Japanese Journal of Applied Physics, 31(5R), 1258.
Applications of Nanowires in Light Emitting Diodes
191
23. Nakamura, S., Mukai, T., & Senoh, M., (1994). Candela‐class high‐ brightness InGaN/AlGaN double‐heterostructure blue‐light‐emitting diodes. Applied Physics Letters, 64(13), 1687–1689. 24. Park, Y. S., Lee, S. H., Oh, J. E., Park, C. M., & Kang, T. W., (2005). Self-assembled GaN nano-rods grown directly on (1 1 1) Si substrates: Dependence on growth conditions. Journal of Crystal Growth, 282(3, 4), 313–319. 25. Ra, Y. H., Navamathavan, R., Yoo, H. I., & Lee, C. R., (2014). Single nanowire light-emitting diodes using uniaxial and coaxial InGaN/GaN multiple quantum wells synthesized by metalorganic chemical vapor deposition. Nano Letters, 14(3), 1537–1545. 26. Rigutti, L., Tchernycheva, M., De Luna Bugallo, A., Jacopin, G., Julien, F. H., Zagonel, L. F., & Songmuang, R., (2010). Ultraviolet photodetector based on GaN/AlN quantum disks in a single nanowire. Nano Letters, 10(8), 2939–2943. 27. Ristić, J., Calleja, E., Fernández-Garrido, S., Cerutti, L., Trampert, A., Jahn, U., & Ploog, K. H., (2008). On the mechanisms of spontaneous growth of III-nitride nanocolumns by plasma-assisted molecular beam epitaxy. Journal of Crystal Growth, 310(18), 4035–4045. 28. Sarwar, A. G., Carnevale, S. D., Yang, F., Kent, T. F., Jamison, J. J., McComb, D. W., & Myers, R. C., (2015). Semiconductor nanowire light‐emitting diodes grown on metal: A direction toward large‐scale fabrication of nanowire devices. Small, 11(40), 5402–5408. 29. Schuster, F., Hetzl, M., Weiszer, S., Garrido, J. A., De La Mata, M., Magen, C., & Stutzmann, M., (2015). Position-controlled growth of GaN nanowires and nanotubes on diamond by molecular beam epitaxy. Nano Letters, 15(3), 1773–1779. 30. Shatalov, M., Sun, W., Lunev, A., Hu, X., Dobrinsky, A., Bilenko, Y., & Wraback, M., (2012). AlGaN deep-ultraviolet light-emitting diodes with external quantum efficiency above 10%. Applied Physics Express, 5(8), 082101. 31. Songmuang, R., Landré, O., & Daudin, B., (2007). From nucleation to growth of catalyst-free GaN nanowires on thin AlN buffer layer. Applied Physics Letters, 91(25), 251902. 32. Stoica, T., Sutter, E., Meijers, R. J., Debnath, R. K., Calarco, R., Lüth, H., & Grützmacher, D., (2008). Interface and wetting layer effect on the catalyst‐free nucleation and growth of GaN nanowires. Small, 4(6), 751–754.
192
Applications of Nanowires in Electronics
33. Taniyasu, Y., Kasu, M., & Makimoto, T., (2006). An aluminum nitride light-emitting diode with a wavelength of 210 nanometers. Nature, 441(7091), 325–328. 34. Tchernycheva, M., Lavenus, P., Zhang, H., Babichev, A. V., Jacopin, G., Shahmohammadi, M., & Kryliouk, O., (2014). InGaN/GaN core-shell single nanowire light-emitting diodes with graphene-based p-contact. Nano Letters, 14(5), 2456–2465. 35. Tchernycheva, M., Sartel, C., Cirlin, G., Travers, L., Patriarche, G., Harmand, J. C., & Julien, F., (2007). Growth of GaN free-standing nanowires by plasma-assisted molecular beam epitaxy: Structural and optical characterization. Nanotechnology, 18(38), 385306. 36. Tourbot, G., Bougerol, C., Glas, F., Zagonel, L. F., Mahfoud, Z., Meuret, S., & Daudin, B., (2012). Growth mechanism and properties of InGaN insertions in GaN nanowires. Nanotechnology, 23(13), 135703. 37. Wang, R., Liu, X., Shih, I., & Mi, Z., (2015). High efficiency, full-color AlInGaN quaternary nanowire light-emitting diodes with spontaneous core-shell structures on Si. Applied Physics Letters, 106(26), 261104. 38. Zhao, C., Ng, T. K., ElAfandy, R. T., Prabaswara, A., Consiglio, G. B., Ajia, I. A., & Ooi, B. S., (2016). Droop-free, reliable, and high-power InGaN/GaN nanowire light-emitting diodes for monolithic metaloptoelectronics. Nano Letters, 16(7), 4616–4623. 39. Zhao, S., Connie, A. T., Dastjerdi, M. H. T., Kong, X. H., Wang, Q., Djavid, M., & Mi, Z., (2015). Aluminum nitride nanowire light-emitting diodes: Breaking the fundamental bottleneck of deep ultraviolet light sources. Scientific Reports, 5(1), 1–5. 40. Zimmler, M. A., Voss, T., Ronning, C., & Capasso, F., (2009). Excitonrelated electroluminescence from ZnO nanowire light-emitting diodes. Applied Physics Letters, 94(24), 241120.
CHAPTER
7
APPLICATIONS OF NANOWIRES IN PIEZOELECTRIC ENERGY HARVESTING
CONTENTS 7.1. Introduction..................................................................................... 194 7.2. Vertical-Aligned Nanowire Arrays.................................................... 194 7.3. Lateral-Aligned Nanowire Networks................................................ 202 References.............................................................................................. 206
194
Applications of Nanowires in Electronics
7.1. INTRODUCTION The initial research work regarding the piezoelectric nanogenerators was stated by Song and Wang in 2006. After that, various research works have been performed about the working mechanism, design, and structural modeling, and performance optimization of the piezoelectric nanogenerators. Till now, numerous types of flexible nanogenerators have been developed, which might be utilized for harvesting that differs mechanical energies from the human bodies or environment (Yan et al., 2011; Wang, 2012). The output electrical energy has been enhanced from some millivolts to several 100 volts, which is sufficient for driving a LED (light-emission diode), LCD (liquid crystal display), and wireless data transmitting device. In this chapter, the author concisely reviewed the working mechanism, simulations/modeling, and the experimental development of piezoelectric nanogenerators as per the structure of the nanogenerators comprising the lateral-aligned nanowire networks, the nanowire-based nanocomposites, and the vertically aligned nanowire arrays (Patolsky and Lieber, 2005; Huang and Wan, 2009).
7.2. VERTICAL-ALIGNED NANOWIRE ARRAYS 7.2.1. Working Mechanism and Structural Modeling Two diverse working models could be utilized for describing the working procedure of the nanogenerators founded on vertical-aligned nanowire arrays comprising vertical compression and lateral bending. Because of their different mechanical and electrical configurations, the working mechanism is changed in certain degrees, however, with one constant basis: the pairing of the semiconductor behavior and the piezoelectric feature of the piezoelectric nanowire (Rørvik et al., 2011). Figure 7.1 demonstrated the working mechanism of the nanogenerator founded on a bending nanowire persuaded through an AFM tip. As revealed, a Schottky barrier was made up among the AFM tip and the nanowire because of the difference in electron affinity and working function. The system was in an equilibrium state and no voltage output was produced when the nanowire is not bent through the AFM tip. Once the nanowire was bent through the scanning AFM tip, the irregular piezoelectric potential would be produced because of the compression and stretch of the outer and inner sides of the nanowire. The piezoelectric potential in the nanowire altered the profile of the conduction band (Wang and Song, 2006).
Applications of Nanowires in Piezoelectric Energy Harvesting
195
Figure 7.1. The band diagram for knowing the flow processes and charge output in a nanogenerator with lateral bending model. (a) Before bending; (b) nanowire bent through the tip with the tipping point at the pushed surface; (c) tip scans through the nanowire and reaching the central point; (d) tip reaching the flattened surface of the nanowire; (e) energy-band image for the nanogenerator, showing the output voltage and the role done by the piezoelectric potential. Source: https://onlinelibrary.wiley.com/doi/10.1002/adfm.200800541.
As revealed in Figure 7.1(b), the limited positive piezoelectric potential at the interaction area would lead to a slow movement of electrons from the ground to the tip by the exterior load, which caused the charged gathering in the tip. When the tip was moved to the central part of the nanowire, the local potential fell to zero and caused a backflow of the gathered electrons by the load to the ground (Figure 7.1(c)). Afterward, if the tip was transferred to the compressive portion of the nanowire, a local adverse piezoelectric potential would increase the profile of the conduction band and take to an electron flow from the 𝑛-type ZnO to the tip. Hence, a circular flow of electrons would be produced and showed output current in the measurement devices (Gu et al., 2013). For nanogenerators with vertical compressed nanowire arrays, the piezoelectric nanowires were joined through a pair of electrodes on the upper and bottom end with almost one Schottky contact in the interface. The
196
Applications of Nanowires in Electronics
compressive distortion was induced proportionally alongside the longitude of the nanowires. As a consequence, the piezoelectric potential must be well-distributed alongside the axial direction of the nanowire. Thus, its working mechanism was diverse from the bending models. As displayed in Figure 7.2, the alternate electric output could be ascribed to the back and forth flow of electrons in the exterior circuit driven through the piezoelectric potential (Kwon et al., 2012). Without the exterior stress, the structure was in an equilibrium state, and no voltage output would be produced (Figure 7.2(a)). Once the nanowire was flattened through external force, the piezoelectric potential would be induced alongside the nanowire. Therefore, the Fermi level of the negative-potential side and conduction band edge would be enhanced through the piezoelectric field as shown in Figure 7.2(b). Because of the Schottky obstacle on both sides of the nanorod, the electron couldn’t pass through the interface among the electrodes and nanowire to recompense the energy difference and would flow by the exterior circuit to the electrode on the counter side. Thus an impulsive electric output would be produced. The electrons were then gathered because of the Schottky barrier and extended to an equilibrium state with the piezoelectric field to reach the Fermi energy back to a similar level, which led to no more electrical output in the exterior circuit (Figure 7.2(c)). When the compression was free as displayed in Figure 7.2(d), the piezo potential was disappeared, which would disrupt the equilibrium state. Hence, the energy difference would be persuaded in the opposite direction and take to an impulsive negative electrical output signal (Jung et al., 2011).
Figure 7.2. Band image for knowing the flow process and charge output in the nanogenerator with flattened nanowire. (a) Before pressing; (b) nanowire vertically flattened by an exterior force; (c) equilibrium state under strain state; (d) release of pressure; (e) output voltage. Source: https://www.sciencedirect.com/science/article/abs/pii/ S0927796X1000077X.
Applications of Nanowires in Piezoelectric Energy Harvesting
197
Because of the expensive and complicated fabrication and characterization and integration procedure of piezoelectric nanogenerators, the performance simulation and accurate modeling about the electromechanical transformation behavior of the nanowires were significant earlier to the experimental works. For instance, Falconi have conducted FEM (finite element method) simulation works to approximate the output potential and kept electrostatic energy of a ZnO nanowire under numerous deformation configurations with diverse coauthors positions of the contacts (Wang et al., 2015). To simplify the FEM modeling procedure, uncertain load in the exterior circuit, the non-zero electrical conductivity of piezoelectric materials, the nonlinear behavior of Schottky contact, and parasitic impacts were ignored. The simulation was shortened to qualitatively relate the static piezoelectric potential produced by nanowires with diverse structures. Their simulation consequence proposed that the electrode contact configuration would have a great effect on the piezoelectric potential of a bending nanowire. Since the maximum strain was distributed at the lowest regain of the nanowires, the greatest piezoelectric potential alteration among the electrodes could be attained when the electrodes were set up on both sides at the lowermost of the nanowire (Mantini et al., 2009). However, it is tough to get this type of nanoscaled electrodes in practical tests. They also relate the performance of bending nanowires with the vertically flattened nanowires and noticed that the latter one displayed higher energy transformation efficiency than the bending nanowires with similar electrode configurations. According to their outcomes, the vertical compression model with comparatively greater electrical output and simplified structures is more appropriate for practical applications than the bending models. Though, the impact of free charge in the nanowires on the electromechanical transformation efficiency was not taken in this work, which has been stated to be a key problem for the piezoelectric nanogenerators (Ohigashi, 1976; Hansen et al., 2010). Lately, the polarization screening impacts induced through the free charge carriers have been considered as an important concern for enhancing the electromechanical transformation efficiency of the piezoelectric nanowires. Though, it was very tough to precisely regulate the concentration of dopant in piezoelectric nanowires in the practical tests. Hence, computer
198
Applications of Nanowires in Electronics
analysis through FEM could be utilized to predict this impact. For instance, Gao and Wang have examined the behavior of free charge movers in a bent piezoelectric semiconductive nanowire in thermodynamic equilibrium situations (Yang et al., 2013). They noticed that the positive side of the bent nanowire would be partly screened through the free charge carriers due to the conduction band electrons would be gathered at the positive side in the piezoelectric potential. Thus, the potential on the positive side is much lesser than the negative side. Furthermore, Falconi et al. have examined the screening impact in a vertically compressed nanowire and noticed that the piezoelectric potential would be nearly totally screened through the free charge carriers at a greater level of donor concentrations. They also established that the length of the vertically compressed nanowire didn’t considerably affect the extreme value of the piezoelectric potential, however, the relative dielectric constant neighboring the nanowire would considerably influence the output voltage (Zhao et al., 2014).
7.2.2. Fabrication and Performance of Vertical Integrated Nanogenerators After the discovery that the AFM tip-induced lateral bending of the nanowire (GaN, CdS, InN, ZnS, ZnO) could produce impulsive voltage output, another type of nanogenerator with the same mechanism was carried out. In this method, the AFM tips were substituted by a zigzag top electrode to bend the nanowires (Fu et al., 2014). Qin et al. have also studied a similar nanogenerator with two fibers covered by the ZnO nanowire arrays (Han et al., 2005). As displayed in Figure 7.3, they tangle the fibers and brush the nanowires with every other to make the ZnO nanowires bending. This nanogenerator could produce voltage with around 1 mV in amplitude. Though these early-stage nanogenerators have fascinated a lot of attention, the complex fabrication procedure, as well as the poor stability and low electrical output, makes them not appropriate for practical application (Rajan et al., 2007).
Applications of Nanowires in Piezoelectric Energy Harvesting
199
Figure 7.3. Design and electricity-producing mechanism of the fiber-based nanogenerator driven through a low-frequency, exterior pulling force. Source: https://www.nature.com/articles/nature06601.
According to the modeling conversed earlier, the vertical compress of nanowires might produce higher output voltage than the top-bottom contacted twisting nanowires. Xu et al. have made a VING (vertical nanowire array integrated nanogenerator). As displayed in Figure 7.4, the device was fabricated by packing the vertical-aligned ZnO nanowire array with PMMA (polymethyl methacrylate) and joined the nanowire with topbottom flat electrodes, which could produce numerous tens of millivolts in amplitude under exterior pressures (Fukada, 2000; Wang, 2008). The fabrication procedure of the VING is far simpler than the bending kind of nanogenerators. Furthermore, the packing of PMMA could largely enhance the robustness of the devices. Because of the easy synthesis procedure of ZnO nanowire arrays, ZnO VING has become the most widely held design amongst the reported nanogenerators. Numerous improvements have been made by researchers. For instance, Kim et al. (2011) have revealed a ZnO VING founded on cellulose paper substrates, which might enhance the thermal stability of the VINGs. Choi and coworkers (2010) have stated a ZnO VING founded on flexible and transparent graphene electrodes. The nanogenerator could be entirely rolled for the energy flexibility and harvesting process. The output current of this device is up to 2–3 mA/cm2 under a rolling and non-rolling state. Besides the conventional VINGs, certain new designs on the architecture of VINGs have been validated by
200
Applications of Nanowires in Electronics
researchers. For instance, Hu et al. (2011) have made a ZnO VING which is a free-standing cantilever beam prepared of a 5-layer structure. Through depositing the ZnO Cr/seed layers on the upper and lower surfaces of the PS (polyester) substrate, the thickly packed ZnO nanowire texture films were produced and then enclosed through PMMA as a blocking layer. Lastly, the top electrodes were placed on top of both PMMA layers, and the entire system was packaged through PDMS. The layered VINGs could produce short-circuit current up to 0.6 𝜇A and open-circuit voltage up to 10 V when it was strained to 0.12% at a strain rate of 3.56 percent/second (Qin et al., 2008; Zhu et al., 2010). As stated above, the free charges in 𝑛-type ZnO nanowires would screen the piezoelectric potential. That would reduce the output voltage of the ZnO nanogenerators.
Figure 7.4. (a) Schematic diagram of the fabrication procedure of the VING; (b) the output voltage of the VING under diverse exterior pressures. Source: https://pubs.acs.org/doi/10.1021/nl101973h.
Till now, two major methods have been employed for reducing the screening effect. Firstly, it could be realized through improving the intrinsic
Applications of Nanowires in Piezoelectric Energy Harvesting
201
properties of ZnO through surface passivation and pretreatment, and so forth. For instance, Hu et al. have enhanced the single-layered VINGs’ performance with the highest output current up to 6 𝜇A and output voltage up to 20 V through treating the ZnO nanowires with oxygen plasma or strengthening in the air. Furthermore, the output performance of the ZnO nanorod-founded nanogenerators might also be upgraded by inducing the UV (ultraviolet light) to passivate the surface. The same work was also stated by Lin et al. (2008), where the output of CdS nanowire could be modified through utilizing a white light stimulation. Secondly, the screening effect might also be repressed by altering the structure of the devices. For instance, Zhu and coworkers (2012) have illustrated a new design of ZnO VING. It could produce high electrical output (𝐼SC = 134 𝜇A, 𝑉OC = 58 V) because of the new structures due to the tinny layer of PMMA among the top of the nanowires and the top electrodes, which might provide a potential hurdle of unlimited height. The barrier could avert the persuaded electrons in the electrodes from inner leaking through the interface between semiconductor and metal. The segregation of nanowire arrays also assured that the native free-charge carriers in the nanowires that are not directly flattened would be isolated from the compressed nanowires (Figure 7.5). This portion of the nanowires would not be involved in the screening effect and conserving the piezoelectric potential from additional degradation. Besides the structure design, certain other techniques like the treatment of the piezoelectric nanowire might also reduce the screening effect (Gao and Wang, 2009; Wang et al., 2010).
Figure 7.5. The fabrication procedure of the segmented ZnO nanowire VINGs. Source: https://www.hindawi.com/journals/amse/2015/165631/#:~:text=R ecently%2C%20the%20microscale%20energy%20harvesters,driving%20 some%20low%2Dpower%20microdevices.
As recognized, the piezoelectric constant is crucial for the electromechanical transformation efficiency of the piezoelectric nanowires.
202
Applications of Nanowires in Electronics
The comparatively low piezoelectric constant of ZnO restricts the performance of the nanowire in the VINGs. Perovskite piezoelectric materials like Pb(Ti, Zr,)O3 (PZT) showed a much greater piezoelectric constant than ZnO materials, which might lead to greater energy conversion effectiveness and electric output of the nanogenerators. For instance, the PZT nanowire array could produce higher output voltage than the ZnO nanowires with similar device architectures (Falconi et al., 2009). Though, the hard synthesis procedure of the perovskite nanowire arrays has restricted the R&D (research and development) of such types of nanogenerators. The flexibility was also restricted through the substrate utilized for material growth (e.g., Nb: SrTiO3 single crystals). Gu et al. have given a feasible way to overwhelmed the issue of flexibility, where the ultra-long PZT nanowire arrays were made through stacking the lateral-aligned PZT nanofibers cover by the cover and joined by top-bottom electrodes (Lin et al., 2008). This device generates ultra-high-output voltage up to 209 V joined with the current density of 23.5 𝜇A/cm2, which might promptly power up a commercial LED without any energy storing unit. Furthermore, Kang and coworkers have described a lead-free piezoelectric nanogenerator founded on vertically aligned KNN nanorod arrays. The nanogenerator showed a stable high power density of ∼101 𝜇W/cm3 (Lu et al., 2009).
7.3. LATERAL-ALIGNED NANOWIRE NETWORKS 7.3.1. Working Mechanism and Structural Modeling
In this kind of device, the deformation of the nanowires was constantly persuaded through the laterally bending of the nanowires either through the pressure applied or through the bending of the substrate along the radial direction of the nanowires. Regardless of the local bending of nanowires in the vertical allied nanogenerators, the nanowires were consistently bent in these procedures. Because of the ultra-high feature ratio of the onedimensional nanostructure, the constant lateral bending behavior of the nanowires could be considered as the lateral stretching by ignoring the strain distribution along the radial direction. Thus, the working mechanism of the nanogenerators founded on lateral-aligned nanowires was similar to the compressed nanowires stated in the above section (Huang et al., 2010). In Falconi’s work, they also relate the energy conversion behavior of the laterally extended nanowire with the vertically flattened ones. They have noticed that the laterally bent nanowire could produce higher output voltage
Applications of Nanowires in Piezoelectric Energy Harvesting
203
than the later one. Though, the exterior forces were directly executed on the nanowires. In practical devices, the nanowires were generally packaged through soft polymers like PDMS silicone to shield them from physical harm. The exterior forces need to be executed on the packing layers rather than on the nanowires (Wang et al., 2007; Xu et al., 2010). Hence the dispersal of the applied forces on the nanowires would be altered. As a consequence, the impact induced through the packaging layer should be taken into account throughout the modeling of the nanogenerators. Figures 7.6 and 7.7 display the improved models of nanogenerators with silicone packing layers for lateral and vertical packaged devices, correspondingly. The silicone is 150% in width and 10 𝜇m in thickness associating with the diameter of the nanorod. In a vertically flattened model, the nanorod was standing vertically, fixed at the last, and packaged through the silicone. An exterior force along the axial direction of the nanorod was executed on the upper surface of the silicone. Under the compressing force, the nanorod was compressed vertically and produced a piezoelectric potential of ∼350 mV between the bottom surface and the top surface (Xu et al., 2010; Pham et al., 2013).
Figure 7.6. The produced electrical signal and FEM simulation outcomes. Source: https://pubs.acs.org/doi/10.1021/nl300972f.
204
Applications of Nanowires in Electronics
Figure 7.7. FEM stagnant simulation of the electromechanical transformation behavior of a vertically compressed device. (a) Schematic diagram of the model; (b) the deformation of silicone; (c) the deformation of the nanorod; (d) the piezoelectric potential of the nanorod. Source: https://www.researchgate.net/publication/281701803_Piezoelectric_ Nanowires_in_Energy_Harvesting_Applications.
In the lateral extending model, the nanorod with similar piezoelectric parameters was laterally placed between 2 Au electrodes and packaged through the silicone. The pressure was applied on the upper surface alongside the radial direction of the nanorod. The nanowire was twisted under the radial compressing force. The piezoelectric potential variance could be calculated to be ∼2.74 V by incorporating the electric field alongside the axial direction of the nanorod. These outcomes showed that the lateral assembled nanorods could produce much higher piezoelectric potential than the vertical assembled ones under similar exterior pressure, which might provide insight for the design of piezoelectric nanogenerators (Kim et al., 2011).
7.3.2. Fabrication and Performance of Laterally Integrated Nanogenerators (LINGs) The initial lateral kind of piezoelectric nanogenerator is stated by Wang et al. (2007). This device is founded on the voltage generation of a specific BaTiO3 nanowire under periodic stretchable mechanical load, which is made through placing a BaTiO3 nanowire onto a piezoelectric flexure stage using the nanomanipulation method. The lateral strain was applied through moving the mobile base of the phase by utilizing a piezo stack driving through
Applications of Nanowires in Piezoelectric Energy Harvesting
205
external voltage, setting the other base. The fabrication procedure of the flexure stage is expensive and complex due to the small dimension. On the contrary, lateral nanogenerators founded on elastic polymer substrates like the PI (polyimide) films have shown much simpler fabrication procedures and higher performance (Hu et al., 2012; Zhu et al., 2012). Yang et al. (2013) have described a LING (laterally integrated nanogenerator) founded on laterally wrapped piezoelectric fine wires. The ZnO fine wire placing on the PI substrate was fitted to electrodes at both ends. The bending of the substrate would consequence in an extended behavior of the wire and lead to a fall in the piezoelectric potential along the wire. Thus, an impulsive and alternate output would be produced by the charge flow in the outer circuit. The nanogenerator founded on a single fine wire could produce output short-circuit current of 60–70 mV and open-circuit voltage and 1000–1100 pA in peak to peak amplitude, correspondingly (Choi et al., 2010; Hu et al., 2011).
206
Applications of Nanowires in Electronics
REFERENCES 1.
Choi, D., Choi, M. Y., Choi, W. M., Shin, H. J., Park, H. K., Seo, J. S., & Kim, J. M., (2010). Fully rollable transparent nanogenerators based on graphene electrodes. Advanced Materials, 22(19), 2187–2192. 2. Falconi, C., Mantini, G., D’Amico, A., & Wang, Z. L., (2009). Studying piezoelectric nanowires and nanowalls for energy harvesting. Sensors and Actuators B: Chemical, 139(2), 511–519. 3. Fu, Y., Zang, W., Wang, P., Xing, L., Xue, X., & Zhang, Y., (2014). Portable room-temperature self-powered/active H2 sensor driven by human motion through piezoelectric screening effect. Nano Energy, 8, 34–43. 4. Fukada, E., (2000). History and recent progress in piezoelectric polymers. IEEE Transactions on Ultrasonics, Ferroelectrics, and Frequency Control, 47(6), 1277–1290. 5. Gao, Y., & Wang, Z. L., (2009). Equilibrium potential of free charge carriers in a bent piezoelectric semiconductive nanowire. Nano Letters, 9(3), 1103–1110. 6. Gu, L., Cui, N., Cheng, L., Xu, Q., Bai, S., Yuan, M., & Wang, Z. L., (2013). Flexible fiber nanogenerator with 209 V output voltage directly powers a light-emitting diode. Nano Letters, 13(1), 91–94. 7. Han, P., Yan, W., Tian, J., Huang, X., & Pan, H., (2005). Cut directions for the optimization of piezoelectric coefficients of lead magnesium niobate-lead titanate ferroelectric crystals. Applied Physics Letters, 86(5), 052902. 8. Hansen, B. J., Liu, Y., Yang, R., & Wang, Z. L., (2010). Hybrid nanogenerator for concurrently harvesting biomechanical and biochemical energy. ACS Nano, 4(7), 3647–3652. 9. Hu, Y., Lin, L., Zhang, Y., & Wang, Z. L., (2012). Replacing a battery by a nanogenerator with 20 V output. Advanced Materials, 24(1), 110– 114. 10. Hu, Y., Zhang, Y., Xu, C., Lin, L., Snyder, R. L., & Wang, Z. L., (2011). Self-powered system with wireless data transmission. Nano Letters, 11(6), 2572–2577. 11. Huang, C. T., Song, J., Lee, W. F., Ding, Y., Gao, Z., Hao, Y., & Wang, Z. L., (2010). GaN nanowire arrays for high-output nanogenerators. Journal of the American Chemical Society, 132(13), 4766–4771.
Applications of Nanowires in Piezoelectric Energy Harvesting
207
12. Huang, C. T., Song, J., Tsai, C. M., Lee, W. F., Lien, D. H., Gao, Z., & Wang, Z. L., (2010). Single‐InN‐nanowire nanogenerator with Upto 1 V output voltage. Advanced Materials, 22(36), 4008–4013. 13. Huang, J., & Wan, Q., (2009). Gas sensors based on semiconducting metal oxide one-dimensional nanostructures. Sensors, 9(12), 9903– 9924. 14. Jung, J. H., Lee, M., Hong, J. I., Ding, Y., Chen, C. Y., Chou, L. J., & Wang, Z. L., (2011). Lead-free NaNbO3 nanowires for a high output piezoelectric nanogenerator. ACS Nano, 5(12), 10041–10046. 15. Kim, K. H., Lee, K. Y., Seo, J. S., Kumar, B., & Kim, S. W., (2011). Paper‐based piezoelectric nanogenerators with high thermal stability. Small, 7(18), 2577–2580. 16. Kwon, J., Seung, W., Sharma, B. K., Kim, S. W., & Ahn, J. H., (2012). A high performance PZT ribbon-based nanogenerator using graphene transparent electrodes. Energy and Environmental Science, 5(10), 8970–8975. 17. Lin, Y. F., Song, J., Ding, Y., Lu, S. Y., & Wang, Z. L., (2008). Alternating the output of a CdS nanowire nanogenerator by a white‐ light‐stimulated optoelectronic effect. Advanced Materials, 20(16), 3127–3130. 18. Lin, Y. F., Song, J., Ding, Y., Lu, S. Y., & Wang, Z. L., (2008). Piezoelectric nanogenerator using CdS nanowires. Applied Physics Letters, 92(2), 022105. 19. Lu, M. Y., Song, J., Lu, M. P., Lee, C. Y., Chen, L. J., & Wang, Z. L., (2009). ZnO-ZnS heterojunction and ZnS nanowire arrays for electricity generation. ACS Nano, 3(2), 357–362. 20. Mantini, G., Gao, Y., D’amico, A., Falconi, C., & Wang, Z. L., (2009). Equilibrium piezoelectric potential distribution in a deformed ZnO nanowire. Nano Research, 2(8), 624–629. 21. Ohigashi, H., (1976). Electromechanical properties of polarized polyvinylidene fluoride films as studied by the piezoelectric resonance method. Journal of Applied Physics, 47(3), 949–955. 22. Patolsky, F., & Lieber, C. M., (2005). Nanowire nanosensors. Materials Today, 8(4), 20–28. 23. Pham, T. T., Lee, K. Y., Lee, J. H., Kim, K. H., Shin, K. S., Gupta, M. K., & Kim, S. W., (2013). Reliable operation of a nanogenerator under ultraviolet light via engineering piezoelectric potential. Energy and Environmental Science, 6(3), 841–846.
208
Applications of Nanowires in Electronics
24. Qin, Y., Wang, X., & Wang, Z. L., (2008). Microfiber-nanowire hybrid structure for energy scavenging. Nature, 451(7180), 809–813. 25. Rajan, K. K., Shanthi, M., Chang, W. S., Jin, J., & Lim, L. C., (2007). Dielectric and piezoelectric properties of [0 0 1] and [0 1 1]-poled relaxor ferroelectric PZN-PT and PMN-PT single crystals. Sensors and Actuators A: Physical, 133(1), 110–116. 26. Rørvik, P. M., Grande, T., & Einarsrud, M. A., (2011). One‐dimensional nanostructures of ferroelectric perovskites. Advanced Materials, 23(35), 4007–4034. 27. Wang, X., Song, J., Liu, J., & Wang, Z. L., (2007). Direct-current nanogenerator driven by ultrasonic waves. Science, 316(5821), 102– 105. 28. Wang, Z. L., & Song, J., (2006). Piezoelectric nanogenerators based on zinc oxide nanowire arrays. Science, 312(5771), 242–246. 29. Wang, Z. L., (2008). Towards self‐powered nanosystems: From nanogenerators to nanopiezotronics. Advanced Functional Materials, 18(22), 3553–3567. 30. Wang, Z. L., (2012). From nanogenerators to piezotronics: A decadelong study of ZnO nanostructures. MRS Bulletin, 37(9), 814–827. 31. Wang, Z. L., Yang, R., Zhou, J., Qin, Y., Xu, C., Hu, Y., & Xu, S., (2010). Lateral nanowire/nanobelt based nanogenerators, piezotronics and piezo-phototronics. Materials Science and Engineering: R: Reports, 70(3–6), 320–329. 32. Wang, Z., Hu, Y., Wang, W., Zhou, D., Wang, Y., & Gu, H., (2013). Electromechanical conversion behavior of K0.5Na0.5NbO3 nanorods synthesized by hydrothermal method. Integrated Ferroelectrics, 142(1), 24–30. 33. Wang, Z., Pan, X., He, Y., Hu, Y., Gu, H., & Wang, Y., (2015). Piezoelectric nanowires in energy harvesting applications. Advances in Materials Science and Engineering, 1, 1–44. 34. Xu, S., Hansen, B. J., & Wang, Z. L., (2010). Piezoelectric-nanowireenabled power source for driving wireless microelectronics. Nature Communications, 1(1), 1–5. 35. Xu, S., Qin, Y., Xu, C., Wei, Y., Yang, R., & Wang, Z. L., (2010). Selfpowered nanowire devices. Nature Nanotechnology, 5(5), 366–373.
Applications of Nanowires in Piezoelectric Energy Harvesting
209
36. Yan, H., Choe, H. S., Nam, S., Hu, Y., Das, S., Klemic, J. F., & Lieber, C. M., (2011). Programmable nanowire circuits for nanoprocessors. Nature, 470(7333), 240–244. 37. Yang, Y., Zhang, H., Lin, Z. H., Liu, Y., Chen, J., Lin, Z., & Wang, Z. L., (2013). A hybrid energy cell for self-powered water splitting. Energy and Environmental Science, 6(8), 2429–2434. 38. Zhao, Y., Lai, X., Deng, P., Nie, Y., Zhang, Y., Xing, L., & Xue, X., (2014). Pt/ZnO nanoarray nanogenerator as self-powered active gas sensor with linear ethanol sensing at room temperature. Nanotechnology, 25(11), 115502. 39. Zhu, G., Wang, A. C., Liu, Y., Zhou, Y., & Wang, Z. L., (2012). Functional electrical stimulation by nanogenerator with 58 V output voltage. Nano Letters, 12(6), 3086–3090. 40. Zhu, G., Yang, R., Wang, S., & Wang, Z. L., (2010). Flexible highoutput nanogenerator based on lateral ZnO nanowire array. Nano Letters, 10(8), 3151–3155.
CHAPTER
8
APPLICATIONS OF SILICON NANOWIRES IN WEARABLE SENSORS
CONTENTS 8.1. Introduction..................................................................................... 212 8.2. Growth of Sinw Fabrics.................................................................... 213 8.3. The Structure and Morphology of Sinw Fabrics................................ 215 8.4. The Electrical Properties of Sinw Fabrics.......................................... 216 8.5. Characterization of the Sinw Fabric’s Sensing Properties.................. 217 References.............................................................................................. 223
212
Applications of Nanowires in Electronics
8.1. INTRODUCTION Considerable attention is grabbed by flexible sensing materials as they have potentials in the Internet of Things, portable electronics, robotics, and health care (Choi et al., 2018; Wang et al., 2018). The fabrics that human are using and making from thousands of years is one of the ideal shapes of flexible sensing material that can be utilized for wearable sensors, this is because of their comfortableness to skin, softness, ease of device integration, and low density. Until now, numerous conductive fabrics are being developed and are in use for wearable sensing applications by the means of building conducting paths with metal-based or carbon-based nanostructures (Hu et al., 2018). These fabrics are conductive and are capable of responding to only mechanical loadings. They do this by hindering their practical applications. For instance, the simultaneous detection of optical and thermal signals is important for environment perception and personal health monitoring. Developing fabric materials that can sense different stimuli before using them in wearable devices is nowadays, a topic of growing interest (Zeng et al., 2014; Yetisen et al., 2016). Intuitively, for wearable sensors, the most suitable materials are semiconductors as they are capable of responding to greater types of stimuli. For this purpose, silicon nanowire (SiNW) fabrics, among semiconductors, are of particular interest, as they have the potential of combining the fabric’s features with silicon’s inherent excellent sensing properties. Still, for practical wearable applications, assembling the SiNWs into macroscopic fabrics is a big challenge. Some of the previous studies show the SiNW fabric’s fabrication, through the synthesis of hundreds of micrometers long SiNWs, been dispersed in solvents by ultrasonic, and then dried on a substrate (Liu et al., 2017a, b; Li et al., 2018). Nonetheless, this method (post-processing) is time-consuming, less efficient, and results in products that have very poor quality. For instance, the structures could be destroyed by the ultrasonic process, and it may also result in shortening the lengths of SiNWs. This shortening may deteriorate the mechanical and electrical properties of the fabrics. Usually, it is difficult to disperse the nanowire building blocks, resulting in uneven distribution and a huge variation in properties of fabrics. Therefore, for fabricating high-quality SiNW fabrics, an efficient and simple method is very desirable. In addition to it, for wearable sensors, there is still a need to investigate potential applications and the multi-parameter sensing capabilities of SiNW fabrics (Zhang et al., 2017). For the first time, we are reporting the one-step growth method for the production of high-quality SiNW fabrics. This is achieved by using a
Applications of Silicon Nanowires in Wearable Sensors
213
metal-assisted massive vapor deposition (CVD) method. For composing the fabrics, interwoven millimeter-long SiNWs are used and they are capable of producing over 80 cm2 SiNWs in a single experiment. These produced SiNW fabrics are tailorable, light-weighted, and flexible (Wang et al., 2016; Yang et al., 2018). These SiNW fabrics exhibit excellent mechanical properties. Based on these fabrics, wearable sensors can effectively detect different stimuli such as pressure, strain, light, and temperature. The prototype sensor’s integration onto the body of a robot is also further demonstrated. This will enable its perception of different environmental stimuli, which may include light illumination, handshaking, the touch of hot water, and walking. The ability to prepare Si-based fabric materials of high-quality efficiently and simply will help in stimulating wearable sensors development for applications in robotics, health care, the Internet of Things, and portable electronics (Seyedin et al., 2019; Wang et al., 2019).
8.2. GROWTH OF SINW FABRICS The synthesis of these SiNW fabrics is done by thermal evaporation of SiO power in a tube furnace having three-temperature-zones (as in Figure 8.1. S1, having a length of 120 cm and an inner diameter of 71 mm). In the tube center, an Umina boat that is 8-cm long and contains 5 g SiO (325 mesh, Aldrich, 99.9%) is placed. There are other alumina boats, which are 30-cm long and have a 100-g Sn bar, which are introduced at a distance of 4 cm from the center. The tube in the furnace is sealed and pumped to 100 Pa. The centers of each zone are heated to different temperatures. The temperature zone 1 is heated to 950°C, temperature zone 2 is heated to 1330°C, and temperature zone 3 is heated to 950°C. They are kept in these temperatures for two hours. Before the growth experiment, a movable thermal couple is used to measure temperature distribution (Someya et al., 2005). Once the furnace is cooled back to room temperature, we can peel the SiNW fabrics from the sides of the alumina boats (30 cm-long ones). In a tube furnace having three-temperature-zones, this growth experiment is taken. For growth (large-scale) of millimeter-long SiNWs, an appropriate temperature distribution is adjusted. As the Si source, SiO powders are chosen (Figure 8.1(a)). This is beneficial in growing long SiNWs. In the growth zone, massive Sn is placed, and it serves as the catalyst. Additionally, two alumina boats having a circular cross-section of 3/4 are chosen. These alumina boats are growth substrates and work in maximizing the area of growth because they provide a larger surface area as compared to planar substrates, which are present inside the furnace tube (Hua et al., 2018).
214
Applications of Nanowires in Electronics
In Figure. 8.1(b), the SiNW fabric’s growth process is diagramed. First, Sn is transmitted into a liquid Sn pool as a metal having a low melting point and here, with increasing temperature, it evaporates. During the growing experiment, large numbers of Sn micro-droplets are formed by the Sn vapor. The SiO vapor is absorbed by these Sn micro-droplets, catalyzing the SiNWs growth process. The growing millimeter-long SiNWs naturally interweave with each other and form highly crossed SiNW fabrics. A small piece of brown SiNW fabrics, having an area of more than 20 cm2 is shown in Figure 8.1(c). It is obtained from one of the sidewalls of a boat. In one growth experiment, four such pieces of around 80 cm2 can be produced (Figure 8.1(a)). This fabric is this light in weight that clover does not undergoes bending with SiNW fabrics (Figure 8.1(d)). Moreover, the SiNW fabrics are flexible and tailorable. We can conveniently tailor them into any desired shape such as a circle, a triangle, and a square (Figure 8.1(e)). We can easily roll and knot a piece of SiNW fabrics around an mm-diameter capillary (Figure 8.1(f) and (g)). For comfortable wearable devices, it is noted that the fundamental requirements of active materials are flexible, should be tailorable, and lightweight (Hsu et al., 2015).
Figure 8.1. Large-area growth of light-weighted and flexible SiNW fabrics. Note: (a) The experimental system present inside the furnace tube is schematically illustrated; (b) the SiNW fabric’s growth process is schematically illustrated; (c) photograph of SiNW fabrics (a small piece) having an area more than 20 cm2; (d) photograph of SiNW fabrics (a small piece) on a clover; (e) tailored SiNW fabric’s photograph with three distinct shapes: a circle, a triangle, and a
Applications of Silicon Nanowires in Wearable Sensors
215
square; (f) photograph of SiNW that is rolled around a glass capillary that has a diameter of 2.2 mm; (g) the knotted SiNW fabric’s photograph.
8.3. THE STRUCTURE AND MORPHOLOGY OF SINW FABRICS The SiNW fabric’s (as-obtained) structure and morphology are further investigated (Figure 8.2). As indicated by SEM (Scanning electron microscopy) characterization, this obtained fabrics consist of SiNWs having lengths between 1.0 and 1.2 mm (Figure 8.2(a)). They are randomly crossed and roughly parallel, this orientation forms a network structure (Figure 8.2(b)). The results of energy dispersive spectrometer (EDS) and magnified image indicate that a silicon oxide’s layer is present around the millimeterlong SiNWs. Furthermore, on the end part of a SiNW, the catalyst droplet containing Sn, Si, and O could be observed, indicating the growth to be a VLS progress that is catalyzed by Sn (Liao et al., 2016; Xiao et al., 2018). The catalyst particles and oxide shells can be removed by using an HF solution. After this HF treatment, the fabrics appear to be much denser, this is because of the SiNW’s hydrophobic aggregation and the removal of silicon oxides (Figure 8.2(e)). From 50 SiNWs, the statistical results indicate the range of SiNW’s diameters that falls in between 140 to 650 nm, 420 nm is taken as an average value (Figure 8.2(f)). The thickness of SiNW fabrics treated with HF is measured to be 150 μm approx, as given by the SEM image (Figure 8.2(g)). Moreover, the SiNW fabric’s density before treating with HF is weighed as 0.055 g/cm3, while after treating with HF is weighed as 0.024 g/cm3. It can be observed that in magnitude, it is two orders lower if compared with Si wafers (2.34 g/cm3). From the prepared fabrics, the x-ray diffraction (XRD) (Figure 8.2(h)) patterns exhibit strong diffraction peaks of the phase (JCPDS 77-2107) that indicates the structure of the SiNWs to be a face-centered cubic crystal. Furthermore, Zhang et al. (2019) also observed weak diffraction peaks from Sn (JCPDS 02-0709). In contrast to it, diffraction patterns of the fabrics passed from HF solution (Figure 8.2(i)) only exhibit diffraction peaks from SiNWs (because the Sn catalyst is removed). The transmission electron microscopy (TEM) also characterizes the HF-treated SiNWs. Smooth surfaces of the SiNWs are observed (Figure 8.2(j)). The corresponding patterns from selected-area electron diffraction (SAED) show the pattern to be singular crystalline having a cubic Si phase that is face-centered and
216
Applications of Nanowires in Electronics
is found beside the crystal orientation. The XRD results also show similar results (Figure 8.2(j) inset).
8.4. THE ELECTRICAL PROPERTIES OF SINW FABRICS The four-probe method is used to test the SiNW fabric’s electrical property. In this method, the fabrics are cut in 2.5 mm wide and 10 mm long rectangles for the test purpose. On the surface of SiNW fabrics that are treated with HF, Ag electrodes (four electrodes) are fabricated through thermal evaporation. 2.5 mm is the distance between the inner electrodes. The semiconductor parameter analyzer and probe station (4200-SCS, Keithley) are used to obtain the current-voltage curves. This four-probe method is also used to test the single SiNW’s electrical property (Hosticka et al., 1997; Hull, 1999). First, single SiNWs are transmitted to 300-nm thick SiO2 covered Si substrates. Then, the Ag electrode’s thermal evaporation and lithography are used to fabricate the single SiNW devices. This method is used for studying the electrical properties of SiNW fabrics that are treated with HF (Figure 8.3).
Figure 8.2. Structure characterizations and morphology of the SiNW fabrics. Note: (a) A single millimeter-long SiNW’s integrated SEM images taken from the fabrics; (b) and (c) are the original SiNW fabric’s SEM images; (d) A SiNW’s SEM image of the growth end; (e) and (f) are the SEM images SiNW fabrics that
Applications of Silicon Nanowires in Wearable Sensors
217
are treated with HF; (g) SEM image of the HF-treated SiNW fabric’s crosssection; (h) the XRD patterns of original SiNW fabrics; (i) the XRD patterns of HF-treated SiNW fabrics; (j) TEM image of a SiNW fabric that is treated with HF. The corresponding SAED patterns are shown by the inset. Source: https://www.springerprofessional.de/en/one-step-growth-of-large-area-silicon-nanowire-fabrics-for-high-/17135498.
In the fabrics, roughly considering the parallel orientation of most of the SiNWs, the fabric’s electrical properties should be anisotropic. Hence, we have measured their electrical properties along with directions that are perpendicular to each other. Figure 8.3(a) shows the orientation that is parallel to SiNW’s main axial and is termed as the longitudinal direction, on the other hand, the one perpendicular to SiNW’s main axial is termed as the transverse direction. The SiNW fabric’s typical current-voltage curves along both orientations are shown in Figure 8.3(b). According to the observations made, in contrast to the current along the transverse direction, the one along the longitudinal direction is always larger. According to statistical results, the average resistivity along the transverse direction is 36.3 Ω·cm and along the longitudinal direction is 21.6 Ω·cm (Chockla et al., 2011; Xu et al., 2013). Both directions have a difference in their electrical properties, and it is because of different conducting paths. Along the longitudinal direction, a longer distance is conducted by the charge a longer distance inside SiNWs, on the other hand, along the transverse direction, more contacts between SiNWs would be conducted by them. For comparison, the four-probe method has been used to study the single SiNW’s electrical properties. As Figure 8.3(c) shows, a single SiNW’s current-voltage curve is approximately linear. A single SiNW’s average resistivity is 7.3×10⁻³ Ω·cm. The SiNW’s high doping concentration is implied by the low resistivity. This might come by injecting the catalyst atoms during VLS growth progress [28, 29]. These electrical properties can be altered by improving the contacts among SiNWs or by controlling their controlling (Koziol et al., 2007; Heo et al., 2008).
8.5. CHARACTERIZATION OF THE SINW FABRIC’S SENSING PROPERTIES The two-electrode technique is used with an electrochemical workstation to collect the sensor’s electrical signals (CHI660E, CH Instruments, Inc.). For the photoconductivity measurements, 5 V voltage is applied. The same voltage is used for SiNW fabric’s other sensing properties. For creating a
218
Applications of Nanowires in Electronics
specific temperature, we use a digital heating stage to perform temperature sensing tests. To perform light-sensing tests, as the light source, a xenon lamp having adjustable power is utilized, and for measuring the light power density, a power meter is used. By bending the sensors on the cylinder’s surface with different radii, a strain is applied to perform strain sensing tests. To perform pressure sensing tests, different weights on the sensors are laid, and static pressure is applied, simultaneously pressure is calculated by dividing gravity through the means of the contact area (Wang et al., 2005, 2015). Based on the SiNW fabrics that are treated with the HF, the fabric’s multifunctional sensing properties are investigated and prototype sensors are fabricated. Their preparation is illustrated in Figure 8.4(a).
Figure 8.3. The SiNW fabric’s electrical properties. (a) The definition of transverse direction and longitudinal direction; (b) the SiNW fabric’s current-voltage curves measured along the longitudinal direction are shown by a black line while the transverse direction is shown by a red line; (c) a single SiNW’s current-voltage curve. The single SiNW device is shown by the inset SEM image. Source: https://link.springer.com/article/10.1007/s12274-019-2505-6.
Applications of Silicon Nanowires in Wearable Sensors
219
Figure 8.4. Characterization of the SiNW fabric’s multifunctional sensing properties. Note: (a) The prototype sensor’s fabrication process is schematically illustrated; (b) the relative current change versus the temperature is plotted; (c) the relative current change versus the incident light’s power density is plotted; (d) the relative change observed in the electrical resistance against the strain is plotted; (e) the relative change observed in the electrical resistance against the applied pressure is plotted. Source: https://www.researchgate.net/publication/335593652_One-step_ growth_of_large-area_silicon_nanowire_fabrics_for_high-performance_multifunctional_wearable_sensors.
Firstly, HF-treated SiNW fabrics (a piece of it) are placed on solid polydimethylsiloxane (PDMS) substrate’s surface, and then a drop of ethanol is used to make it wet so that the fabric gets flatten and can show adherence to the substrate. After some time, the ethanol evaporates and then, copper wires and Ag conductive paste are used for leading out both ends
220
Applications of Nanowires in Electronics
of the fabrics. This is done so that the electric connection can be obtained. Finally, PDMS is used to encapsulate the sensor (Zhang et al., 2017). At first, the SiNW fabric’s temperature sensing property is investigated. The relative change in the current denoted as ΔI/I0 = (I – I0)/I0 versus the temperature (T) is shown in Figure 8.4(b), where I0 is the currents at the original temperature (i.e., 20°C) and I is at the measured temperature. As the temperature rises, ΔI/I0 linearly increases. This increase exhibits the temperature coefficient of resistance (TCR) to be negative (Figure 8.4c). The SiNW fabric’s temperature sensing property is similar to the one of bulk Si that is a result of the change of mobility and carrier concentration with temperature [30]. The sensors based on the SiNW fabrics have a temperature sensitivity of 7.71%/°C. It is similar to the wearable temperature sensor that is based on top-down single-crystalline Si nanoribbons (5.15%/°C). For studying the SiNW fabric’s light sensing property, the prototype sensor is illuminated by using a xenon lamp. The relationship between the power density of applied light and the change in the fabric’s current is illustrated in Figure 8.4(c). Under a fixed bias voltage, the increase in the power density of light increases the current. The SiNW’s photoconduction effect can be the reason behind the fabric’s light response. Under the light radiation, lots of non-equilibrium carriers can be produced by lots of nonequilibrium carriers, acting as semiconductor materials, and thus, this increases their conductivity [20]. Compared to these, the property of light response is rarely exhibited by the reported fabrics made from carbon or metal nanostructures (Moutanabbir et al., 2013). The relative resistance change denoted as ΔR/R0 = (R – R0)/R0 versus the strain (ε) is shown in Figure 8.4(d), where R is the electrical resistance at strain state and R0 strain states at a relaxed state. From the slope, the gauge factor (GF) is calculated to be −21.4 and is defined as GF = (ΔR/R0)/ε. The SiNW fabric-based sensor’s strain sensitivity is comparable to the ones that are based on other Si materials, which includes individual SiNWs, silicon nanoribbons, and silicon wafers. The reported strain sensors include the stain sensors to be among their best results. The negative GF value indicates that the fabric’s electrical resistance would decrease if the tensile strain is
Applications of Silicon Nanowires in Wearable Sensors
221
present. As compared to the reported conductive fabric’s performance, this trend is different but is consistent with the single SiNW’s performance. The outcomes show that the SiNW fabric’s strain sensing property mainly originates from the SiNW’s piezoresistance effect. The pressure-sensing property of the SiNW fabrics is also investigated. Figure 8.4(e) displays the plot of the relative resistance change (ΔR/R0 = (R−R0)/R0) versus the pressure. It is observed that the electrical resistance of the fabrics decreases with the increase of the applied pressure and appears to be stable when the applied pressure exceeds 400 KPa. The pressure-sensing property of the SiNW fabrics is similar to other reported fabrics, which comes from the increase of contact area between micro/nanostructures under pressure. For wearable sensors, we can summarize the three advantages of this fabric from the above results. First, sensing capabilities for multiple stimuli are possessed by the SiNW fabrics. They are capable of responding to four different stimuli, which include pressure, light, strain, and strain, and temperature, more than multifunctional nanomaterials and reported fabrics could. Second, the SiNW fabrics have outstanding sensing performance, having all the sensitivities among multifunctional nanomaterials. Third, they combine the outstanding sensing properties of Si materials, possessing good flexibility. These characteristics indicate the potential of silicon materials in manufacturing of wearable devices. These points indicate the potential that the SiNW fabrics have for wearable sensors (Allen et al., 2008). For demonstrating the potential use of SiNW fabrics in wearable devices, the prototype sensors are attached and integrated onto the robot’s body (Figure 8.5(a)). For example, the temperature of the water can be detected by the temperature sensor integrated on the robot’s hand. They can sense the temperature following the rates of peak and increase values of the current (Figure 8.5(b)). Illuminating angles can be identified by the photodetectors present on the robot’s head. This is done by a specific signal set (Figure 8.5(c)). When the robot walks, the step number and motion time can be monitored by the strain sensors that are mounted over the robot’s knee joints (Figure 8.5(d)). Furthermore, the pressure sensor present on the robot’s hand can sense the handshakes (Figure 8.5(e)).
222
Applications of Nanowires in Electronics
Figure 8.5. SiNW fabrics that can be used for wearable applications. Note: (a) The photograph of one temperature sensor, one pressure sensor, two strain sensors, and three photodetectors mounted on the robot body; (b) the temperature of the water detected by the temperature sensor integrated on the robot’s hand at 6°C. Different colors square represents the mark of the time touching with water at temperatures of 70, 60, 50, 40, and 30, 40, 50, 60, and 70°C, (from left to right); (c) the illumination angle’s detection with three different photodetectors mounted on the robot’s head. The experimental setup is shown by the diagram on the left. The relative current change against the illumination angle from all three photodetectors is shown in the plots on the right; (d) the current response in return to the robot’s walk detected from the strain sensors mounted over the robot’s knee joints; (e) the current response to handshakes detected from the pressure sensor. Source: https://inis.iaea.org/search/search.aspx?orig_q=RN:51081875.
Applications of Silicon Nanowires in Wearable Sensors
223
REFERENCES 1.
Allen, J. E., Hemesath, E. R., Perea, D. E., Lensch-Falk, J. L., Li, Z. Y., Yin, F., Gass, M. H., Wang, P., Bleloch, A. L., Palmer, R. E., et al., (2008). High- resolution detection of Au catalyst atoms in Si nanowires. Nat. Nanotechnol., 3, 168–173. 2. Chockla, A. M., Harris, J. T., Akhavan, V. A., Bogart, T. D., Holmberg, V. C., Steinhagen, C., Mullins, C. B., et al., (2011). Silicon nanowire fabric as a lithium-ion battery electrode material. J. Am. Chem. Soc., 133, 20914–20921. 3. Choi, S., Han, S. I., Jung, D., Hwang, H. J., Lim, C., Bae, S., Park, O. K., Tschabrunn, C. M., Lee, M., Bae, S. Y., et al., (2018). Highly conductive, stretchable, and biocompatible Ag-Au core-sheath nanowire composite for wearable and implantable bioelectronics. Nat. Nanotechnol., 13, 1048–1056. 4. Heo, K., Cho, E., Yang, J. E., Kim, M. H., Lee, M., Lee, B. Y., Kwon, S. G., Lee, M. S., Jo, M. H., Choi, H. J., et al., (2008). Large-scale assembly of silicon nanowire network-based devices using conventional microfabrication facilities. Nano Lett., 8, 4523–4527. 5. Hosticka, B. J., Brockherde, W., & Hammerschmidt, D., (1997). Silicon sensor systems. In: Huijsing, J. H., & Meijer, G. C. M., (eds.), Smart Sensor Interfaces (Vol. 1, pp. 99–111). Springer: Boston, MA. 6. Hsu, P. C., Liu, X. G., Liu, C., Xie, X., Lee, H. R., Welch, A. J., Zhao, T., & Cui, Y., (2015). Personal thermal management by metallic nanowire-coated textile. Nano Lett., 15, 365–371. 7. Hu, Y. G., Zhao, T., Zhu, P. L., Zhang, Y., Liang, X. W., Sun, R., & Wong, C. P., (2018). A low-cost, printable, and stretchable strain sensor based on highly conductive elastic composites with tunable sensitivity for human motion monitoring. Nano Res., 11, 1938–1955. 8. Hua, Q. L., Sun, J. L., Liu, H. T., Bao, R. R., Yu, R. M., Zhai, J. Y., Pan, C. F., & Wang, Z. L., (2018). Skin-inspired highly stretchable and conformable matrix networks for multifunctional sensing. Nat. Commun., 9, 244. 9. Hull, R., (1999). Properties of Crystalline Silicon (Vol. 1, pp. 1–55). INSPEC, the Institution of Electrical Engineers: London. 10. Koziol, K., Vilatela, J., Moisala, A., Motta, M., Cunniff, P., Sennett, M., & Windle, A., (2007). High-performance carbon nanotube fiber. Science, 318, 1892–1895.
224
Applications of Nanowires in Electronics
11. Li, X. T., Hu, H. B., Hua, T., Xu, B. G., & Jiang, S. X., (2018). Wearable strain sensing textile based on one-dimensional stretchable and weavable yarn sensors. Nano Res., 11, 5799–5811. 12. Liao, X. Q., Liao, Q. L., Zhang, Z., Yan, X. Q., Liang, Q. J., Wang, Q. Y., Li, M. H., & Zhang, Y., (2016). A highly stretchable ZnO@fiberbased multifunctional nanosensor for strain/temperature/UV detection. Adv. Funct. Mater., 26, 3074–3081. 13. Liu, M. M., Pu, X., Jiang, C. Y., Liu, T., Huang, X., Chen, L. B., Du, C. H., Sun, J. M., Hu, W. G., & Wang, Z. L., (2017b). Large-area alltextile pressure sensors for monitoring human motion and physiological signals. Adv. Mater., 29, 1703700. 14. Liu, X., Tang, C., Du, X. H., Xiong, S., Xi, S. Y., Liu, Y. F., Shen, X., Zheng, Q. B., Wang, Z. Y., Wu, Y., et al., (2017a). A highly sensitive graphene woven fabric strain sensor for wearable wireless musical instruments. Mater. Horiz., 4, 477–486. 15. Moutanabbir, O., Isheim, D., Blumtritt, H., Senz, S., Pippel, E., & Seidman, D. N., (2013). Colossal injection of catalyst atoms into silicon nanowires. Nature, 496, 78–82. 16. Seyedin, S., Zhang, P., Naebe, M., Qin, S., Chen, J., Wang, X. G., & Razal, J. M., (2019). Textile strain sensors: A review of the fabrication technologies, performance evaluation and applications. Mater. Horiz., 6, 219–249. 17. Someya, T., Kato, Y., Sekitani, T., Iba, S., Noguchi, Y., Murase, Y., Kawaguchi, H., & Sakurai, T., (2005). Conformable, flexible, largearea networks of pressure and thermal sensors with organic transistor active matrixes. Proc. Natl. Acad. Sci. USA, 102, 12321–12325. 18. Wang, C. Y., Li, X., Gao, E. L., Jian, M. Q., Xia, K. L., Wang, Q., Xu, Z. P., Ren, T. L., & Zhang, Y. Y., (2016). Carbonized silk fabric for ultrastretchable, highly sensitive, and wearable strain sensors. Adv. Mater., 28, 6640–6648. 19. Wang, C. Y., Xia, K. L., Wang, H. M., Liang, X. P., Yin, Z., & Zhang, Y. Y., (2019). Advanced carbon for flexible and wearable electronics. Adv. Mater., 31, 1801072. 20. Wang, H., Wang, J. T., Cao, Z. X., Zhang, W. J., Lee, C. S., Lee, S. T., & Zhang, X. H., (2015). A surface curvature oscillation model for vapor-liquid-solid growth of periodic one-dimensional nanostructures. Nat. Commun., 6, 6412.
Applications of Silicon Nanowires in Wearable Sensors
225
21. Wang, H., Zhang, X. H., Meng, X. M., Zhou, S. M., Wu, S. K., Shi, W. S., & Lee, S., (2005). Bulk preparation of Si-SiOx hierarchical structures: High-density radially oriented amorphous silica nanowires on a single-crystal silicon nanocore. Angew. Chem., Int. Ed., 44, 6934– 6937. 22. Wang, S. H., Xu, J., Wang, W. C., Wang, G. J. N., Rastak, R., MolinaLopez, F., Chung, J. W., Niu, S. M., Feig, V. R., Lopez, J., et al., (2018). Skin electronics from scalable fabrication of an intrinsically stretchable transistor array. Nature, 555, 83–88. 23. Xiao, P., Mao, J., Ding, K., Luo, W. J., Hu, W. D., Zhang, X. J., Zhang, X. H., & Jie, J. S., (2018). Solution-processed 3D RGO-MoS2/pyramid Si heterojunction for ultrahigh detectivity and ultra-broadband photodetection. Adv. Mater., 30, 1801729. 24. Xu, Z., Sun, H. Y., Zhao, X. L., & Gao, C., (2013). Ultra-strong fibers assembled from giant graphene oxide sheets. Adv. Mater., 25, 188–193. 25. Yang, Z., Pang, Y., Han, X. L., Yang, Y. F., Ling, J., Jian, M. Q., Zhang, Y. Y., Yang, Y., & Ren, T. L., (2018). Graphene textile strain sensor with negative resistance variation for human motion detection. ACS Nano, 12, 9134–9141. 26. Yetisen, A. K., Qu, H., Manbachi, A., Butt, H., Dokmeci, M. R., Hinestroza, J. P., Skorobogatiy, M., et al., (2016). Nanotechnology in textiles. ACS Nano, 10, 3042–3068. 27. Zeng, W., Shu, L., Li, Q., Chen, S., Wang, F., & Tao, X. M., (2014). Fiber-based wearable electronics: A review of materials, fabrication, devices, and applications. Adv. Mater., 26, 5310–5336. 28. Zhang, B. C., Wang, H., He, L., Zheng, C. J., Jie, J. S., Lifshitz, Y., Lee, S. T., & Zhang, X. H., (2017). Centimeter-long single-crystalline Si nanowires. Nano Lett., 17, 7323–7329. 29. Zhang, M. C., Wang, C. Y., Wang, H. M., Jian, M. Q., Hao, X. Y., & Zhang, Y. Y., (2017). Carbonized cotton fabric for high-performance wearable strain sensors. Adv. Funct. Mater., 27, 1604795.
INDEX
A
E
Aminopropoyltriethoxysilane (APTES) 88
EDXS (energy dispersive x-ray spectroscopy) 182, 183 EE (extraction efficiency) 186 electrical conductivity 3, 9 electrochemical double-layer capacitors (EDLCs) 116 electrode materials 118, 121, 122, 145 electroluminescence (EL) 178 electromechanical transformation efficiency 197, 201 electron beam induced current (EBIC) 54 Electrospinning 122 energy dispersive spectrometer (EDS) 215 energy storage 116, 117, 118, 119, 120, 122, 127, 128, 132, 138, 142, 143, 145, 146, 147 energy storage devices 116, 117, 118, 119, 120, 127, 128 equilibrium Fermi energy 157
B biomedical sensors 86, 87 Biosensors 85, 86, 98, 105 Bragg-type structure 166 C cadmium telluride 55 chemical vapor deposition (CVD) 50 CMOS (complementary metal-oxide-semiconductor) 88 coaxial p-n junction nanowires 44 Communications 150 comprising carbon nanotube (CNT) 86 computer analysis 198 D distributed feedback laser (DFBL) 164
228
Applications of Nanowires in Electronics
F
M
fabrics 213, 214, 215, 216, 217, 218, 219, 220, 221, 222 FDTD (finite-difference time-domain) 154 FEM (finite element method) 197 Fermi energy 196 field-effect transistors (FETs) 87 flexible nanogenerators 194 FWHM (full width at half maximum) 179, 185
magnified image 215 materials systems 5, 17, 20 MBE (molecular beam epitaxy) 5 mesoporous materials 44 metal films 180, 181 metrology 150 micro-stadium 166 microwires 44, 73 miniaturized semiconductor laser 150 morphology 116, 118, 132 multi-junction tandem cells 45
G gallium arsenide 55, 77 H HAADF (high angle annular dark field) 182, 183 Heterostructures 163 Hierarchical nanowire assembly 118 hybrid modes 153 Hybrid systems 163 L lasers 178, 190 lateral assembled nanorods 204 LCD (liquid crystal display) 194 LED (light-emission diode) 194 levelized cost of energy (LCOE) 47 limit of detection (LOD) 95 LING (laterally integrated nanogenerator) 205 lithium-air batteries 116, 117 lithium cobalt dioxide 120 lithium-ion batteries (LIBs) 116 Lithium ions 116
N nanobelts 117, 145 nanogenerators 194, 195, 197, 198, 199, 200, 201, 202, 203, 205, 206, 208 nanolasers 150, 152, 162, 163, 167, 168, 172, 173, 174 nanomaterials 86, 87, 99 nanoparticle 86, 96 nanorods 117, 123, 124, 130, 132, 134, 135, 138, 139 Nanoscale materials 117 nanosphere lithography 8 nanotubes 117, 124, 139 nanowire-based biomedical sensors 87 nanowire-based nanocomposites 194 Nanowires 2, 3, 4, 6, 7, 8, 9, 10, 11, 12, 14, 18, 19, 20, 21, 24, 27, 28, 29, 30, 31, 32, 33, 34, 35, 36, 37, 38, 39, 40, 41, 42
Index
nanowires (NWs) 44 nanowire solar cells 44, 75, 76, 77, 78, 79, 81, 82 National Renewable Energy Laboratory (NREL) 47 nominal concentration detection 95 O optoelectronics 178, 192 P peptide nucleic acid (PNA) 88 perovskite nanowire arrays 202 phosphate-buffered saline (PBS) 91 photonic crystals (PhCs) 166 photon production 162 photovoltaic (PV) 47 piezoelectric constant 201 piezoelectric nanogenerators 194, 197, 204, 207 piezoelectric nanowires 195, 197, 201, 206 PI (polyimide) films 205 plasmonic-aided nanolaser 164 PL (Photoluminescence) 179 PMMA (polymethyl methacrylate) 199 polarization-sensitive photodetectors 3 Polydimethylsiloxane (PDMS) 93 poly(ethylene glycol) (PEG) 95 Pseudo-capacitors 116 PS (polyester) substrate 200 pulverization 121 Q quantum cryptography 2 quantum discs 2, 16, 39 quantum dots 2, 13, 19, 20, 25, 32,
229
34, 36 quantum wires 2, 13, 18, 32 quartz-crystal microbalance 96 R radial 44, 47, 48, 49, 50, 51, 52, 53, 54, 62, 63, 64, 65, 76, 78 radial quantum wells 2, 17 reactive ion etching (RIE) 92 reduced graphene oxide (RGO) 123 ring resonator 166, 169, 174 robot 221, 222 S SAG (selective area growth) 8 Scanning photocurrent microscopy (SPCM) 54 semiconducting material systems 2 semiconductor lasers 150, 155 Semiconductor nanowires 2, 35 SEM (scanning electron microscopy) 180 sensing 150 sensors 178, 218, 219, 220, 221, 222, 224, 225 silicon-on-insulator (SOI) 92 single-crystalline silicon (SCS) 92, 94 solar cell materials 55, 56 solar cells 178, 190 solar radiation 54, 64 solar spectrum 44, 45, 55 solid-state lighting 178 static pressure 218 STEM (scanning transmission electron microscopy) 182, 183 Supercapacitors 116 surface plasmon resonance (SPR) 96
230
Applications of Nanowires in Electronics
T
V
temperature coefficient of resistance (TCR) 220 tetramethylammonium hydroxide (TMAH) 92 TE (transverse electric) 153 TM (transverse magnetic) modes 153 Transmission electron microscopy (TEM) 178
vapor-liquid-solid (VLS) 5 vapor-solid (VS) 6, 51 VING (vertical nanowire array integrated nanogenerator) 199 voltage 216, 217, 218, 220
U ultrahigh-energy density 117 ultraviolet (UV) 178 ultraviolet (UV) emission 178
W wavelength 55, 56, 57, 58, 59, 60, 61, 69 wearable devices 214, 221 wearable sensors 221 wireless data transmitting device 194 X x-ray diffraction (XRD) 215