Application of Calorimetry in Life Sciences: Proceedings of the International Conference in Berlin, August 2–3, 1976 9783110860719, 9783110069198
244 63 16MB
English Pages 354 [360] Year 1977
Preface
Contents
List of Participants
1. Physical Calorimetry and Instrumentation
1.1 The Microcalorimetric Study of Catalytic Reactions
1.2 Ballistic Measurements with the Batch Microcalorimeter
1.3 Development and Properties of Caloric Systems for Substrate Determinations with Immobilized Enzymes
1.4 The Application of a Heat Transport Model for the Assessment of Regional Blood Flow and Regional Metabolic Heat Production in Dog Myocardium
2. Biochemical Calorimetry
2.1. Hydration and Thermal Stability of a-Lactalbumin. A Calorimetrie Study
2.2 Comparative Studies of the Formation of Magnesium, Manganese and Cobalt Complexes with ATP Using Potentiometric and Calorimetric Techniques
2.3 Microcalorimetric Experiments on Cell Free-Protein Biosynthesis
2.4 Enthalpy Changes in Reactions of Messenger-RNA Turnover
3. Microbiological Calorimetry
3. Microbiological Calorimetry
3.2 Calorimetric Studies of Yeast Metabolism under Nongrowing Conditions
3.3 Microcalorimetric Measurements of the Heat Production in Partially Synchronous Cultures of Baker's Yeast
3.4 Quantitative Relation between Heat Production and Weight during Growth of Microbial Cultures
3.5 Calorimetric Studies of Lactic Acid Bacteria and the Effect of 2,4-Dinitrophenol on their Catabolic Regulation
4. Calorimetry of Organs
4.1 Calorimetrie Investigations on Animai Suborganisms: Organites, Tissues and Isolateci Organs
4.2 Calorimetrie Studies of Muscle and Muscle Proteins
4.3 Calorimetric Investigations of Metabolic Regulation in Human Skin
4.4 Organperfusion in a Calvet Microcalorimeter: Adaptation of a Process Computer to an Experimental Arrangement Especially Designed for this Purpose
5. Medical Calorimetry
5.1 Applications of Microcalorimetry in the Medical Field
5.2 Microcalorimetric Measurements of Heat Production in Human Erythrocytes with a Batch Calorimeter
5.3 Characterization of the Mode of Action of Tetracyclines Using Microcalorimetry
5.4 Whole Body Calorimetry
6. Ecological Calorimetry
6.1 Thermodynamic Considerations of Invertebrate Anoxibiosis
6.2 Microcalorimetric Investigations of Aquatic Biotopes
6.3 Combustion Heat in Ecological Energetics. What Sort of Information can be Obtained?
6.4 Energy Flow and Efficiency Differences in Plants and Plant Communities
Index
Recommend Papers

![Equadiff 82: Proceedings of the international conference held in Würzburg, FRG, August 23–28, 1982 [1 ed.]
9783540126867, 3540126864](https://ebin.pub/img/200x200/equadiff-82-proceedings-of-the-international-conference-held-in-wrzburg-frg-august-2328-1982-1nbsped-9783540126867-3540126864.jpg)


![Ill-Posed Problems in Natural Sciences: Proceedings of the International Conference Held in Moscow, August 19–25, 1991 [Reprint 2020 ed.]
9783112313930, 9783112302668](https://ebin.pub/img/200x200/ill-posed-problems-in-natural-sciences-proceedings-of-the-international-conference-held-in-moscow-august-1925-1991-reprint-2020nbsped-9783112313930-9783112302668.jpg)


- Author / Uploaded
- I. Lamprecht (editor)
- B. Schaarschmidt (editor)
File loading please wait...
Citation preview
Application of Calorimetry in Life Sciences
Application of Calorimetry in Life Sciences Proceedings of the International Conference in Berlin, August 2-3,1976
Editors I. Lamprecht B. Schaarschmidt
W DE G Walterde Gruyter • Berlin • New York 1977
Editors Dr. Ingolf Lamprecht Dr. Bernd Schaarschmidt Zentralinstitut für B i o c h e m i e u n d Biophysik Freie Universität Berlin Habelschwerdter Allee 3 0 D - 1 0 0 0 Berlin 3 3
w i t h 2 4 3 Figures
CIP-Kurztitelaufnahme
der Deutschen
Bibliothek
Application of calorimetry in life sciences: proceedings of the internat, conference in Berlin, August 2 - 3 , 1976/ed.: J. Lamprecht; B. Schaarschmidt. 1. Aufl. - Berlin, New York: de Gruyter, 1977 ISBN 3-11-006919-9 NE: Lamprecht, Ingolf [Hrsg.]
© Copyright 1977 by Walter de Gruyter & Co., Berlin 30. All rights reserved, including those of translation into foreign languages. No part of this book may be reproduced in any form by photoprint, microfilm, or any other means, nor transmitted nor translated into a machine language without written permission from the publisher. Printing: Karl Gerike, Berlin. Binding: Liideritz & Bauer, Buchgewerbe GmbH, Berlin. Printed in Germany.
Preface All methods of modern physics and chemistry are now applied to biology and will be increasingly valuable for biological research in the near future, but no other field has such ever increasing importance and promise for a deeper understanding of life and its traces as thermodynamics, and especially the theory of irreversible processes. One essential tool of thermodynamics is calorimetry, calorimetry in its application to life. Unlike optical, enzymatic, isotopic or ultrasonic tests, calorimetry does not interfere directly with the object under research, since nearly all chemical and biochemical processes are combined with a production or consumption of heat and therefore with a flow of heat between the system and its surroundings. Modern calorimeters collect these weak flows and transform them into usable signals. It is left to the skill of the research worker to translate, understand and interpret these signals and to enlarge the information about the system. Unfortunately, however, heat is dreadfully unspecific, and one needs the combination with other methods to gain a complete understanding of the processes under study. This book is about the applications of calorimetry in life sciences. Its approach, which is nearly two hundred years old and yet very modern, is applicable to all levels of life, from the pure biochemical reaction to whole organisms or even ecosystems. The book discusses instrumentation as well as results, correlations with other techniques as well as the limits of the calorimetric method. It is intended to give a review of recent biological calorimetry to the research workers in this field and to direct the newcomer to a method which may be helpful in the solution of his own scientific problems. The articles in this book are the content of an international conference on the "Application of calorimetry to life sciences" which took place at the Free University of Berlin in August 1976. It was sponsored by the Zentralinstitut fur Biochemie und Biophysik and financially supported by the President of the Free University and some companies, whose assistance we gratefully acknowledge. But this conference would have been impossible without the steady help and interest of all the colleagues of our institute to whom we are deeply indebted. To facilitate and expedite the appearance of the book, the authors were asked for camera ready manuscripts. Therefore, only small corrections could be made by the editors, a disadvantage that is more than compensated, in our opinion, by the directness and personal style of the papers. We want to express our thanks to all authors for their care in the preparation of the manuscripts and their efforts to meet the deadlines imposed. We do hope that this book will find an interested audience and help to promote our knowledge of life in its abundance of forms. Berlin, January 1977
Ingolf Lamprecht Bernd Schaarschmidt
Contents
1. Physical Calorime try and Instrumentation 1.1. The Microcalorimetric Study of Catalytic Reactions P. Gravelle 1.2. Ballistic Measurements with the Batch Microcalorimeter L. Tumerman, R. Zidovezki 1.3. Development and Properties of Caloric Systems for Substrate Determinations with Immobilized Enzymes G. Krisam, H.-L. Schmidt 1.4. The Application of a Heat Transport Model for the Assessment of Regional Blood Flow and Regional Metabolic Heat Production in Dog Myocardium W. Miiller-Schauenburg, H. Benzing 2. Biochemical Calorimetry 2.1. Hydration and Thermal Stability of a-Lactalbumin. A Calorimetrie Study M. Ruegg, U. Moor, A. Lukesch, B. Blanc 2.2. Comparative Studies of the Formation of Magnesium, Manganese and Cobalt Complexes with ATP Using Potentiometric and Calorimetrie Techniques M. Ragot, J.C. Sari, J. Galea, G. Ferroni, J.P. Belaich 2.3. Microcalorimetric Experiments on Cell Free Protein Biosynthesis L. Berthe-Corti 2.4. Enthalpy Changes in Reactions of Messenger-RNA Turnover L. Tumerman, S. Rie 3. Microbiological Calorimetry 3.1. Microcalorimetric Studies of Micro-Organisms A.E. Beezer
1 3 33
39
49
57 59
75
85 97
107 109
3.2. Calorimetrie Studies of Yeast Metabolism under Nongrowing Conditions T. Fujita, K. Nunomura
119
3.3. Microcalorimetric Measurements of the Heat Production in Partially Synchronous Cultures of Baker's Yeast R. Brettel
129
VIII 3.4 Quantitative Relation between Heat Production and Weight During Growth of Microbial Cultures B. Schaarschmidt, A.I. Zotin, I. Lamprecht
139
3.5. Calorimetric Studies of Lactic Acid Bacteria and the Effect of 2,4-Dinitrophenol on their Catabolic Regulation P. Monk, W. Forrest, I. Wadso
149
4. Calorimetry of Organs 4.1. Calorimetric Investigations on Animal Suborganisms: Organites, Tissues and Isolated Organs P. Boivinet 4.2. Calorimetric Studies of Muscle and Muscle Proteins R.C. Woledge 4.3. Calorimetric Investigations of Metabolic Regulation in Human Skin A. Anders, G. Welge, B. Schaarschmidt, I. Lamprecht, H. Schaefer 4.4. Organperfusior? in a Calvet Microcalorimeter: Adaptation of a Process Computer to an Experimental Arrangement Especially Designed for this Purpose F. Baisch
5. Medical Calorimetry 5.1. Applications of Microcalorimetry in the Medical Field I. Wadso
157 159 183
199
209
223 225
5.2. Microcalorimetric Measurements of Heat Production in Human Erythrocytes with a Batch Calorimeter M. Trumpa, B. Wendt
241
5.3. Characterization of the Mode of Action of Tetracyclines Using Microcalorimetry E. Semenitz, F. Tiefenbrunner
251
5.4. Whole Body Calorimetry E. Jequier
6. Ecological Calorimetry
261
279
6.1. Thermodynamic Considerations of Invertebrate Anoxibiosis E. Gnaiger
281
6.2. Microcalorimetric Investigations of Aquatic Biotopes F. Tiefenbrunner
305
IX 6.3. Combustion Heat in Ecological Energetics. What Sort of Information can be Obtained? W. d'Oleire-Oltmanns
315
6.4. Energy Flow and Efficiency Differences in Plants and Plant Communities H. Lieth Index
325 337
List of Participants Contributors' names are printed in bold face.
Anders, A., Baisch, F.,
Beezer, A., Beiaich, J.P. Benzing, H., Berthe-Corthi, L., Beyersbergen van Henegouwen, H., Blanc, B., Boivinet, P., Brettel, R.,
Bubenger, H.J., Buschmann, H. Crueger, W., Farhangi, Y.,
Fakultät für Physik, Universität Bielefeld, Universitätsstraße 1, D-4800 Bielefeld Zentralinstitut für Biochemie und Biophysik, Freie Universität Berlin, Habelschwerdter Allee 30, D-1000 Berlin 33 Department of Chemistry, Chelsea College, University of London, Manresa Road, London SW3 LX, Great Britain Laboratoire de Clinic Bactérienne, C.N.R.S., F-13247 Marseille Cedex 2 Physiologisches Institut, Universität Tübingen, Gmelinstraße 5, D-7400 Tübingen Fachbereiche Naturwissenschaften, Universität Oldenburg, Ammerländer Heerstraße 6 7 - 9 9 , D-2900 Oldenburg LKB-Produkten BV, Zeekant 35, NL-Den Haag Eidgenössische Forschungsanstalt für Milchwirtschaft, Sektion Physik und Biophysik, CH-3074 Liebefeld-Bern Institut de Physico-Chimie Biologique, Université de Caen, F-14032 Caen Zentralinstitut für Biochemie und Biophysik, Freie Universität Berlin, Habelschwerdter Allee 30, D-1000 Berlin 33 Institut für Diabetesforschung, A u f m Hennekamp 65, D-4000 Düsseldorf Strahlenbiologisches Institut, Universität München, Schülerstraße 42, D-8000 München 2 Abteilung Verfahrensentwicklung Biochemie der Bayer AG, Friedrich-Ebert-Straße 217, D-5000 Wuppertal 1 Chemistry Department, Faculty of Science, University of Azarabadeghan, Tabriz, Iran
Ferroni, G.,
Université de Provence, Centre Saint Charles, F-13274 Marseille
Forrest, W.,
The Australian Wine Research Institute, Private Bag, Glen Osmond, S.A. 5064, Australia Chemical Center, Thermochemistry, Lund University, P.O.B. 740, S-220 07 Lund
Fujita,T.,
XII Galea, J . ,
Université de Provence, Centre Saint Charles,
Gazith, J .
Haut- und Poliklinik der Freien Universität Berlin
F - 1 3 2 7 4 Marseille im Rudolf-Virchow-Krankenhaus, Augustenburger Platz 1, D-l 0 0 0 Berlin 65 Gnaiger, E.,
Institut für Zoophysiologie, Universität Innsbruck, Peter-Mayr-Straße l a , A - 6 0 2 0 Innsbruck
Gravelle, P.C.,
Institut de Recherches sur la Catalyse, CNRS, 3 9 boulevard du 11 novembre 1 9 1 8 , F - 6 9 6 2 6 Villeurbanne
Gruber, K.,
Institut für Zoophysiologie, Universität Innsbruck, Peter-Mayr-Straße 1 a, A - 6 0 2 0 Innsbruck
Gustafsson, L.,
Botanical Institute, Department of Marine Microbiology, Carl Skottsbergsgatan 2 2 , S 4 1 3 1 9 Göteborg
Held, W.,
Lehrstuhl für Biotechnologie, Technische Universität Berlin,
Hellwig, G.,
Institut für Grenzflächen- und Bioverfahrenstechnik,
Seestraße 13, D-l 0 0 0 Berlin 6 5 Eierstraße 4 6 , D - 7 0 0 0 Stuttgart Höpcke, R.,
Institut für Forschung und Entwicklung der Maizena GmbH, Knorrstraße 1, D - 7 1 0 0 Heilbronn a.N.
Jannsen, L.H.M.,
Pharmaceutical Laboratory, School of Pharmacy,
Jarrett, I.G.,
Division of Human Nutrition, C.S.I.R.O., Kintore Avenue, Adelaide, S. A. 5 0 0 0 , Australia
Jéquier, E.,
Départaient de Médicine, Centre Hospitalier Universitaire Vaudois, CH-1011 Lausanne
Joly, R.,
Chemistry Department, I.N.S.A.,
Catharijnesingel 6 0 , NL-Utrecht
2 0 Avenue Albert Einstein, F - 6 9 6 2 1 Villeurbanne Kafka, H.,
L K B Instrument GmbH, Odoerkergasse 2 5 , A-l 160 Wien
Korver, O.,
Department of Spectrometry, Unilever Research, P.O.B. 114, NL-Viaardingen
Körber, F.,
Zentralinstitut für Biochemie und Biophysik, Freie Universiät Berlin, Arnimallee 2 2 , D - l 0 0 0 Berlin 33
Krisam, G.,
Lehrstuhl für Allgemeine Chemie und Biochemie, Technische Universität München, D-8050 Freising-Weihenstephan
Lamprecht, I.,
Zentralinstitut fur Biochemie und Biophysik, Freie Universität Berlin, Habelschwerdter Allee 3 0 , D - l 0 0 0 Berlin 33
XIII Laskowski, W.,
Zentralinstitut für Biochemie und Biophysik, Freie Universität Berlin, Habelschwerdter Allee 30, D-1000 Berlin 33
Leiseifer, H.P.,
Kernforschungsanlage Jülich, Institut für Biophysikalische Chemie, ICH 2 Postfach 1913, D-5170 Jülich Department of Botany, University of North Carolina, Chapel Hill, N.C. 27514, USA Botanical Institute, Department of Marine Microbiology, Carl Skottsbergsgatan 22, S41319 Göteborg Eidgenössische Forschungsanstalt für Milchwirtschaft, Sektion Physik und Biophysik, CH-3074 Liebefeld-Bern Chemical Center, Thermochemistry, Lund University, P.O.B. 740, S-220 07 Lund Eidgenössische Forschungsanstalt für Milchwirtschaft, Sektion Physik und Biophysik, CH-3074 Liebefeld-Bern Institut für Zoophysiologie, Universität Innsbruck, Peter-Mayr-Straße 1 a, A-6020 Innsbruck Nuklearmedizinisches Department im Medizinischen Strahleninstitut, Universität Tübingen, Im Röntgenweg 11, D-7400 Tübingen
Lieth, H., Lindman, B., Lukesch, A., Monk, P., Moor, U., Moser, H., Müller-Schauenburg, W.,
Mukherjee, B., Nunomura, K., d'Oleire-Oltmanns, W., Ortner, B.,
Abteilung Nuklearmedizin im Klinikum Steglitz, Freie Universität Berlin, Hindenburgdamm 30, D-l 000 Berlin 45 The Institute of Applied Microbiology, University of Tokyo II. Zoologisches Institut, Universität Erlangen-Nürnberg, Bismarckstraße 10, D-8520 Erlangen Institut für Zoophysiologie, Universität Innsbruck, Peter-Mayr-Straße la, A-6020 Innsbruck
Oster, 0 . ,
Zentralinstitut für Biochemie und Biophysik, Freie Universität Berlin, Ostpreußendamm 111, D-1000 Berlin 45
Perrin, J.H.,
Pharmaceutical Laboratory, School of Pharmacy, Catharijnesingel 60, NL-Utrecht Landesanstalt fur Umweltschutz Baden Württemberg, Institut fur Seenforschung und Fischereiwesen, Untere Seestraße 81, D-7994 Langenargen Laboratoire Chimie Bacterienne, C.N.R.S., 31 Chemin Joseph-Auguier, F-13274 Marseille Abteilu ng Nuklearmedizin im Klinikum Steglitz, Freie Universität Berlin, Hindenburgdamm 30, D-1000 Berlin 45
Probst, L.,
Ragot, M„ Reddy, A.R.,
XIV Rie, S., Rohdewald, P., Riiegg, M., Samuelsson, E.G., Sari, J.C.,
Chemical Physics Department, Weizmann Institute of Science, Rehovot, Israel Institut für Pharmazeutische Chemie, Universität Münster, Hittorfstraße 5 8 - 6 2 , D 4 4 0 0 Münster Eidgenössische Forschungsanstalt für Milchwirtschaft, Sektion Physik und Biophysik, CH-3097 Liebefeld-Bern Dairy Department, Royal Veterinary and Agriculture University, Kopenhagen, Denmark Laboratoire Chimie Bacterienne, C.N.R.S., 31 Chemin Joseph-Auguier, F-13274 Marseille
Sayyadi, P.,
Zentralinstitut für Biochemie und Biophysik, Freie Universität Berlin, Habelschwerdter Allee 30, D-1000 Berlin 33
Seidel, N.,
Soldiner Straße 37, D-1000 Berlin 65
Semeritz, E.,
Bundesst. Bakt.-Serol.-Untersuchungsanstalt und Institut für Hygiene Universität Innsbruck, A-6010 Innsbruck
Slotboom, A.J.,
Laboratory of Biochemistry, University of Utrecht, Transitorium III, Padualaan 8, NL-Utrecht Chemical Center, Thermochemistry, Lund University, P.O.B. 740, S-220 07 Lund Zentralinstitut für Biochemie und Biophysik, Freie Universität Berlin, Habelschwerdter Allee 30, D-1000 Berlin 33
Suurkuusk, J., Schaarschmidt, B.,
Schachinger, L., Schaefer, H.,
Schildknecht, J., Schmidt, H.-L.
Schnabel, C.,
Abteilung Strahlenoiologie und Biophysik, Institut für Biologie, Ingolstädter Landstraße 1, D-8042 Neuherberg Haut- und Poliklinik der Freien Universität Berlin im Rudolf-Virchow-Krankenhaus, Augustenburger Platz 1, D-1000 Berlin 65 Hoffmann-La Roche und Co. AG, CH-5058 Basel Lehrstuhl für Allgemeine Chemie und Biochemie, Technische Universität München, D-8050 Freising-Weihenstephan LKB Instrument GmbH, Lochhamer Schlag 5, D-8032 Gräfelfing
Stein, W.,
Rheinbabenallee 3, D-1000 Berlin 33
Taylor, R.,
LKB Instruments Ltd., 232 Addington Road, South Croydon, Surrey CR 2 84D, Great Britain
Tiefenbrunner, F.,
Institut für Hygiene und Mikrobiologie, Universität Innsbruck, Fritz-Pregel Straße 3, A-6010 Innsbruck
XV Trumpa, M.,
Zentralinstitut für Biochemie und Biophysik, Freie Universität Berlin, Habelschwerdter Allee 30, D-1000 Berlin 33
Tumerman, L.,
Department of Chemical Physics, The Weizmann Institute of Science, P.O.B. 26, Rehovot, Israel Messgeräte Vertrieb, St.-Martin-Straße 30, D-8061 Kleinberghofen bei München Chemical Center, Thermochemistry, Lund University, P.O.B. 740, S-220 07 Lund Zentralinstitut für Biochemie und Biophysik, Freie Universität Berlin, Habelschwerdter Allee 30, D-1000 Berlin 33
Vonier, M., Wadsö, I., Welge, G.,
Wendt, B.,
Zentralinstitut für Biochemie und Biophysik, Freie Universität Berlin, Habelschwerdter Allee 30, D-1000 Berlin 33
Weßelmann, G.,
Institut für Pharmazeutische Chemie, Universität Münster, Hittorfstraße 5 8 - 6 2 , D 4 4 0 0 Münster Department of Physiology, University College London, Gower Street, London WC 1, Great Britain Zentralinstitut fur Biochemie und Biophysik, Freie Universität Berlin, Habelschwerdter Allee 30, D-100 Berlin 33
Woledge, R.C., Yasui, A.,
Zidovezki, R., Zotin, A.I.,
Chemical Physics Department, Weizmann Institute of Science, Rehovot, Israel Institute of Developmental Biology. Academy of Science of the USSR, 26 Vavilov St., Moscow 11 7334
1. Physical Calorimetry and Instrumentation
1.1 The Microcalorimetric Study of Catalytic Reactions P. Gravelle
When I received Professor LAMERECHT's
i n v i t a t i o n to g i v e the o p e n i n g
ture of this C o n f e r e n c e o n the A p p l i c a t i o n of C a l o r i m e t r y
in L i f e
Sciences,
I felt v e r y m u c h h o n o u r e d a n d , at the same time, s l i g h t l y a n x i o u s pertise in Life Sciences
is l i m i t e d to the p l e a s a n t m e m o r y of
: my
insects
the s u r p r i s i n g
calorimetric curves
T h i s talk w i l l
t h e r e f o r e be l i m i t e d
rimetry
i n the c a l o r i m e t e r s a n d l e t t i n g Pr C A L V E T thus
flies
discover
obtained!
to a r e v i e w of the u s e s of
microcalo-
in the s t u d y of c a t a l y t i c r e a c t i o n s . A l t h o u g h this topic m a y
p e a r v e r y f o r e i g n f r o m the i n t e r e s t s of m a n y p a r t i c i p a n t s
to the
ap-
Conferen-
c e , there is, a t l e a s t , o n e c o m m o n f e a t u r e in the u s e of c a l o r i m e t r y h e t e r o g e n e o u s C a t a l y s i s a n d in some s t u d i e s c a s e s , a f l o w o r d o s e s of a r e a c t a n t of some m a t e r i a l ,
in o r d e r
The reacting system placed
in Life Sciences.
is f o l l o w e d , m u s t b e c o n n e c t e d
to a g a s or f l u i d - h a n d l i n g
its
m e n t is p a r t i c u l a r l y u n c o n v e n i e n t w h e n c a l o r i m e t r y
rimeter
in the r e a c t i n g
to the r e a c t a n t - h a n d l i n g
which perturbs
system where
problems concerning
is u s e d to d e t e c t
the u s e of c a l o r i m e t r y
isoperibol
calorimeters). Moreover
this a n d
in this field. T h e y h a v e (adiabatic,
since catalysis and
chancalo-
leakage,
Catalytic chemists in s o l v i n g
and developed instruments based on different principles thermal,
the
s y s t e m m a y be the s o u r c e of h e a t
t h e i r skill a n d i n g e n u i t y
the
require-
s y s t e m since the line c o n n e c t i n g
the t h e r m o c h e m i c a l m e a s u r e m e n t s .
however demonstrated
study.
evolution
reactants are properly prepared, mixed, analyzed and dosed. This
ges of e n t h a l p y
sample
to p r o d u c e or m a i n t a i n the p r o c e s s u n d e r instrument where
in
In b o t h
(or r e a c t a n t s ) m u s t c o n t a c t a
in a s u i t a b l e
ex-
practical
j o k e s p l a y e d u p o n P r o f e s s o r C a l v e t b y some of h i s s t u d e n t s , p l a c i n g or other small
lec-
have other used iso-
adsorption
4 phenomena are not limited to temperatures close to normal temperature but require excursions down to 77 K or up to 1000 K, they have had to study, with a particular care, the different experimental limitations of their instruments. Calorimetric research in Life Sciences may benefit from their experience. Calorimetric techniques used in Adsorption and Heterogeneous Catalysis will
be therefore briefly presented and the advantages and limi-
tations of some actual calorimeters will be discussed.
Any calorimetric device may be considered as composed of a cell in which the phenomenon under study takes place and of a surrounding medium
(a
block, a shield, or surrounding envelopes). Let assume, as a first approximation, that, during the operation of the
calorimeter, i) the tempera-
ture of the surrounding medium is constant and uniform and ii) that the temperature of the inner cell is uniform. Then, the heat balance when heat dQ
is produced in time dQ dt
=
„ ^
P
y
dt
is simply given by TIAN equation (1)
d9 dt~
where p is the heat transfer coefficient between the cell and the surrounding medium, y is the heat capacity of the calorimeter vessel and of its contents, 0 is the temperature difference between cell and surrounding medium and
d0
is the temperature change caused by the production or ab-
sorption of heat, dQ. It is clear, from TIAN equation, that the total
a-
mount of heat produced or absorbed in the cell may be deduced from the area under the calorimetric curve provided that
p
and y
are constant
during the course of an experiment and during calibration tests and actual experiments. TIAN equation may be written, in a more general form, as : f(t) = p
g
where f(t) is the rate law for the process under study; g(t) is the recorded calorimetric curve and x is the time constant of the instrument. It appears that the recorded calorimetric curve is not generally a correct representation of the rate law. A distorsion occurs which is caused by the thermal lag in the calorimeter.
5 In order to m i n i m i z e heat leakage from the calorimeter cell, it is possible to regulate the temperature of the surrounding envelope so that it remains at any time identical to that of the calorimeter proper. Following the m o d e r n trend, w e shall call "adiabatic c a l o r i m e t e r s " these instruments. the case of a perfectly adiabatic calorimeter, the heat transfer
In
coeffi-
cient equals zero a n d the total heat produced from time 0 to t is simply deduced, as shown from integrated T I A N equation, from the temperature
in-
crease in the calorimeter cell from time zero to t, p is d e t e r m i n e d by c a libration
experiments.
VIQUAQ. 1
Adiabatic caloxlmeteA (MORRISON and LOS, J950) (2) 1 : {JULting tube,; 1, adlabatÀc. ihlitd; 3, vapouA. p>leAiusie theAmometeA bulb; 4, catonlmeleA vzi&zl; 5, platinum KZAÀJ,tance. theAmometeA; dl{{eAenttal theAmocouple junctions oJie Indicated by aAAow.
One of the m o s t sophisticated calorimeters of the adiabatic type, used a d s o r p t i o n studies, has b e e n described by M O R R I S O N and LOS
(2) (figure
in I).
The calorimeter proper, the envelopes and attachment are placed in a liquid n i t r o g e n or liquid h y d r o g e n cryostat. The adsorbent is packed in the aluminum calorimetric vessel b e t w e e n p e r f o r a t e d aluminum disks w h i c h fa-
6 cilitate heat transfer. The temperature of the calorimeter is measured by a platinum-resistance thermometer. An electrical heater wrapped around the thermometer is used for calibration. The adsorbing gas is admitted to the calorimeter via a metal capillary tube. All electrical leads and capillary tube make thermal contact with the cryostat. Heat is applied via electrical heaters on the shield (top, bottom and side), on the capillaries and bundle of electrical leads. The energy supplied to the shield is adjusted so that the differential thermocouples (marked as arrows on figure 1) give, at any instant, readings as close as possible to zero. In the absence of a thermal effect, the temperature of the calorimeter may be held constant within 0.001 K. The precision in the determination of heats of adsorption is better than 0.5 %. In order to be measured with precision, usual values for the temperature increase during the adsorption of a dose lie
"within 0.5 to 2 K. Large do-
ses of adsórbate and, consequently, large samples of adsorbent are needed. Heat and mass transfers within the adsorbent mass may be the source of errors. This difficulty, however, is not specific of adiabatic calorimeters. The accurate determination of the temperature in the calorimeter cell, at any instant during the course of the experiment, is particularly important in adiabatic calorimetry since the amount of heat is deduced from this measurement. Resistance thermometers should apparently be preferred
to
thermocouples for this purpose since they provide more reliable informiions about the average temperature of the cell than small-area thermocouple junctions, with an equal or better precision. Their use, however, is unfrequent because thermometers of this type continuously generate Joule heat which elevates the temperature of the calorimeter cell. This drawback has been satisfactorily minimized in the case of the adiabatic calorimeter with constant heat exchange described by KISELEV and coll. (3). In this calorimeter, the platinum resistance thermometer which is used to measure the cell temperature is wound, together with a calibration heater, around a copper envelope containing the sample in a glass vessel, connected to an external line. A second copper envelope closely surrounds the first one. Around it, another resistance thermometer is coiled, which forms one arm of a Wheatstone bridge. The second arm of the controlling
7 bridge is a similar thermometer placed, together with a heater, on the adiabatic shield. The temperature of the shield is regulated in such a way that a constant thermal head exists, at all times, between the shield and the calorimeter proper and that the resulting heat leakage exactly balances the thermal output of the resistance thermometer. All heat generated by the process under study is however confined to the calorimeter cell and the calorimeter behaves, with respect to the phenomenon under study, as an adiabatic calorimeter of the usual type. When the calorimeter is placed in +
.
. . .
an excellent thermostat, regulated to - 0.02 K,its temperature sensitivi-5 . . . . -3 ty is 2 x 10 K and its thermal sensitivity is close to 2 x 10 cal (4). It has been used at room temperature. A good precision can therefore be achieved with adiabatic calorimeters. However, the use of these instruments is generally a delicate operation which requires skilled experimentators although temperature-control systems of excellent quality are now available. Three advantages of calorimeters of this type must be cited : a) they allow the study of slow processes. The KISELEV's calorimeter, for instance, is suitable for measurements of the heat produced in several tens of minutes; b) the temperature of the adiabatic shield may be varied almost at will above the thermostat temperature; c) t h ^ allow the measurement of heat capacities : heat capacities of adsorbed layers have been, for instance, determined. Some limitations of this technique, however, should not be ignored : a) the measurements are performed in non-isothermal conditions b) the sample must be connected to the volumetric line via a capillary tube, in order to minimize heat leakage. The initial outgassing or pretreatment of the large samples which are used in these experiments is not easily performed and the reproducibility of this operation is doubtful.
Instead of confining to the calorimeter proper, all heat generated during the experiment, it is possible conversely to transfer as rapidly as possible the generated heat so that the calorimeter vessel remains at all times
8 at a constant temperature. This cannot be completely true however, since a thermal head must exist for heat to be transferred but it is possible to minimize it. A phase-change in the surrounding m e d i u m is generally used to absorb the transferred heat and to determine its quantity. Simple phasechange calorimeters have been used in the past for studying adsorption but they appear to be nowadays only of historical
interest.
Figu/iz 1 Phaiz-changz calo/umzteA (VE'MR, 1904] (5). A, itoppzt; C, c.alo'vimztnA.c ¿¿quid [Liquid cuoi); C', tabz {¡on. gas znttiij and glasi bulb containing the. ad&o>ibzn£; V, meAcuKij guaAd; E, itopcock; F, adioibatz-cLLipe.nAj.ng buAzttz; G, buAzttz (¡on mzaswUng thz voiumz vapofUzzd aix.
DEWAR, for instance, used a liquid-gas transformation to study in 1904, adsorptions on charcoal at liquid air temperature (5) (figure 2). The heat evolved in the adsorption process serves to vaporize liquid air, the volume of which is measured. The heat of adsorption is therefore deduced from two volumetric measurements, that of the adsorbing gas and that of vaporized air. Both volumes being similar, they can be measured w i t h the same type of volumetric system. Numerous difficulties due to the irregu-
9 lar vaporization of the liquid or small variations of its temperature limitate however the use of this technique. Solid-liquid phase transformations have also been used for adsorption studies in BUNSEN type calorimeters. The precision of these calorimeters and -2
their sensitivity (2 x 10
cal/mg of mercury) is acceptable but they are
not very convenient to use and they operate necessarily at a limited number of fixed temperatures. A more reliable and precise method for maintaining isothermal conditions
is to regulate
the temperature of the calorimeter vessel in such a way that it remains constant throughout the experiment. KISELEV and coll. have operated one of their adsorption calorimeters according to this principle (6) (figure 3). The inner cylindrical vessel, which
con-
tains the adsorbent, is
con-
tinuously heated by passing pulses of current in a heater in such a way that a constant heat exchange is maintained at any time between the inner vessel and the outer isothermal jacket. When an exothermic reaction occurs in the calorimeter vessel, the number of pul-
TiquAZ 3 liotheAmai caZotUmeXzn {¡on. itu.dyj.ng tht ad&oiption oumeXeA c M ;
B, huatcA;
C, IiotkeAmal ikiM; V, htcutun; E, thojunocouptz batt&u.£4.
ses per unit time decreases; conversely, it is increased when an endothermic phenomenon takes place in the cell. From a record of the number of pul-
10 ses during the experiment, the quantity of heat produced or absorbed by the reaction may be calculated. When the pulse generator is controlled by a quartz crystal frequency stabilizer, the temperature of the inner vessel is constant to w i t h i n 10 ^ K during a period of 6 to 8 hrs. The precision of the measurements may then be up to 0.2 %. In order to extend the temperature range of this calorimeter up to 670 K, a differential
arrangement
has also been utilized. The principle of this isothermal calorimeter is simple and sound, the only source of variable heat leaks being via the gas phase in the tube which connects the sample cell to the gas handling system. In principle,
there
is no need to calibrate the calorimeter since this is continuously done during any experiment. Thermal paths within the calorimeter cell being short, the response of the instrument is rapid. Because of the discontinuous heating of the inner cell, this calorimeter however is not very suitable for following kinetics of thermal processes, but it may be used indifferently to study fast or slow adsorption processes at the surface of good or poor heat-conducting solids. It requires, however, high quality éiecìronics for the temperature controls and the regulation of the power supply.
Most experimentators working in laboratories which do not specialize in Thermodynamics are not, however, prepared to build such elaborate equipments, especially w h e n calorimetrie data are needed but occasionally to confirm or complete results obtained by more conventional techniques in Adsorption or Catalysis. This is probably why most calorimeters which have been used in these fields are not adiabatic nor
isothermal.
Many of these calorimeters consist of an inner vessel which is imperfectly insulated from its surroundings, usually maintained at a constant ture. Such calorimeters are called "isoperibol calorimeters"
tempera-
(constant
surroundings in greek). As soon as reaction takes place, a temperature gradient exists between the inner vessel and the surrounding shield and heat losses occur producing the cooling of the calorimeter vessel. When all heat is evolved instantaneously at the initial time of the experiment, it follows from NEWTON's cooling law, that the semi-logarithmic plot of
11 the calorimeter temperature changes versus time should yield a straight line. The maximum temperature increase in the calorimeter vessel and thence the heat evolved are then obtained by extrapolating the straight line at time zero. This simple method has b e e n used to measure heats of, fast, adsorptions. It is also possible, and more accurate, to construct the a diabatic curve for any given experiment, i.e. to determine the course of the calorimeter temperature if the instrument had b e e n perfectly
adiaba-
tic at all times. Calorimeters of this type have b e e n constructed for very different stu dies in adsorption and Catalysis but the isoperibol calorimeter, first proposed by BEECK in 1945 (7) is one of the most thoroughly studied
ad-
sorption calorimeters of the isoperibol type (8). It is used to determine heats of adsorption at the surface of metal
films.
The cell of a film calorimeter generally consists of a thin-walled tube closed at one end (figure 4). It is mounted in a glass jacket which can be maintained under reduced pressure, in order to reduce thermal leakage by conduction or convection. The jacket is placed in a thermostat. The film of the desired metal is deposited on the inner surface of the calorimeter wall by heating a filament of the metal. The temperature increase which appears as a dose of gas adsorbs o n the film is generally measured, as a function of time, by means of a platinum resistance thermometer wound around the calorimeter cell, in order to average all local tions of
regularly fluctua-
temperature.
The electrical calibration of film calorimeters is achieved by passing a current of known intensity in a heater also wound around the calorimeter cell Qr., what apparently seems preferable, in the metal film itself. Until now, film calorimeters have been exclusively used to study adsorption processes characterized by very low equilibrium pressures. No heat is thus evacuated by the gas phase in the calorimeter and it has been shown that the m a i n source of heat transfer in film calorimeters of this type is through radiation across the evacuated space between the cell and the j acket,
12
Figune
4
liopeAibol calonimeteA (CERNV, PONEC and HLAVEK, 1966)19) 1, thenmomeXnic wine. intenjwound wiXh a calibnation wine.; {¡oiZi to which the platinum theAmometen winu 1, nickel, on catibnation wine* neApectively one ipot-welded; 3, glaiied molybdenum nodi; 4, nickel {¡oith, ipot-weZdzd. on gilone end to molybdenum nodi and on the othen end to ded platinum {¡oiLi to which in tunn the nMpe.ctU.ve el.ectnical cincuitny -Li ioldened; 5, evaponation {¡ilament; 6, thick nickel leadi.
O n e of the d r a w b a c k s of c y l i n d r i c a l gas may that,
adsorb preferentially
thereby,
all e q u i v a l e n t
film calorimeters
is that the
in the u p p e r p a r t of the m e t a l
admitted
film and
the a d s o r b e d s p e c i e s m a y n o t be d i s t r i b u t e d u n i f o r m l y surface
sites
(8). D i f f e r e n t i a l h e a t s of a d s o r p t i o n ,
o b t a i n e d , w o u l d thus be q u e s t i o n a b l e .
Spherical adsorption
on thus
calorimeters
13 have b e e n used to minimize this drawback. A very large number of isoperibol calorimeters have also been constructed to study adsorption on powdered solids (10). In all cases, the purpose of the arrangement is clear : the calorimeter proper is thermally
insulated
from its surroundings in order to minimize heat leakage and thereby to maintain the temperature increase in the cell to a maximum value. A good sensitivity may then be achieved even w h e n simple thermometers are used. But, heat leakage inevitably exists and the heat leaks in these calorimeters may follow unpredicted paths. The heat transfer coefficient for the different paths m a y be moreover difficult to measure and may vary in the course of the experiment. For these reasons, these calorimeters are generally used in quasi-adiabatic conditions and their use is limited therefore to the study of fast processes.
But many sensitive temperature
sensors are nowadays commercially
availa-
ble. It does not seem necessary any longer to refrain heat leakage in order to achieve a good sensitivity. It is possible, conversely, to construct calorimeters in which a path is defined mechanically in the calorimeter arrangement for transferring heat from the calorimeter vessel to the surrounding heat sink. The heat conductor thus placed in the calorimeter facilitates the heat transfer and thence all other sources of heat leaks often contribute in a negligible manner to the total heat transfer. In this way, the heat transfer coefficient m a y be maintained at an almost constant value throughout the experiments and TIAN equation can be used to analyze the data provided by fast or slow processes. Calorimeters of this type are usually called conduction or heat-flow calorimeters. The "calorimeter element" of a typical heat-flow calorimeter, the TIANCALVET microcalorimeter
is presented on the figure 5 (1). It is composed
of a cell, of surrounding batteries of thermocouples and of a heat sink. In order to increase the stability of the thermocouple emf, two such elements are usually placed in the same metal block and connected differentially. The stability of the record base-line is thus extremely good and fast or very slow phenomena can be studied. Many different versions of this calorimeter have been proposed for use at temperatures extending
from
14 77 K to 1200 K and a given calorimeter may frequently be u tilized in a broad
temperature
range. The m a i n disadvantage of heat-flow calorimeters is, however, that their response is frequently slow. This
is
caused by the large heat capacity of the calorimeter proper and temperature detectors. The profile of the thermal curves is therefore distorded by thermal lags in the calorimeter and
quasi-simultaneous
heat phenomena
though kine-
tically separate may be totally blurred on the recorded thermogram.
It is clear from the preceding F-cgote. 5
Hicut-^tow caZofumzteA. : calMMmte/L dimznt o£ TIAN-CALVET type., 1 956(1).
review that
experimentators
working in the fields of adsorption and catalysis have constructed and used very different types of calorimeters. It is possible to determine,
from these numerous studies, the advantages and limitations of the different calorimetric techniques, as we have attempted to do. Most of these conclusions are probably not only valid in the field of Adsorption
and
Catalysis but should also apply to studies in various branches of the Life Sciences. Isothermal calorimeters with power compensation and heat-flow
calorimeters
present a number of advantages for the study of catalytic reactions and few limitations. They should be preferred, whenever it is possible, to calorimeters of other types. In order to more specifically illustrate this
15 point, a description of several applications of heat-flow calorimetry in the study of catalytic reactions is presented hereafter.
The heat produced by a catalyzed reaction, once it has reached a stationary state, is evidently equal, in absolute value, to the change of enthalpy which can be calculated, from Thermodynamics, for the same reaction in the homogeneous phase at the same temperature. Experiences show, however, that in most cases a stationary state is not instantaneously achieved or continuously maintained and that the catalyst is either activated or deactivated by secondary reactions. The heat experimentally recorded then differs from the expected value and its experimental determination yields informations on the catalyst activation or deactivation
(11).
Q (kcal/moICO) 80-1 68
A J
B
C
J
40
10
15
20
25
F-tgone. 6
Experimental heath {¡on. the combuition oj caAbon monoxide, at 303 K on a iample c>{S gaiZium-dop&d nickel oxide, cu, a function 0{5 the cumulated volume of, KeacXed gai mixture (CO + 1/2 02) 11 2).
16 W h e n s m a l l d o s e s of the m i x t u r e CO + 1/2
are successively reacted,
at
303 K, at the s u r f a c e of a f r e s h l y - p r e p a r e d g a l l i u m - d o p e d n i c k e l o x i d e talyst,
ca-
the h e a t s , i n i t i a l l y r e c o r d e d ,
80 k c a l / m o l e )
e x c e e d the
thermo-
d y n a m i c v a l u e for the c o m b u s t i o n of CO
68 k c a l / m o l e )
(figure 6)
(12).
T h e e x p e r i m e n t a l h e a t s h o w e v e r d e c r e a s e as the n u m b e r of d o s e s u n t i l the e x p e c t e d v a l u e is o b t a i n e d . T h e s e r e s u l t s
indicate
increases
that a
secon-
d a r y r e a c t i o n t a k e s p l a c e t r a n s i e n t l y a t the s u r f a c e of the f r e s h
catalyst
and produces
plots
the d e c r e a s e of its a c t i v i t y as s h o w n o n the k i n e t i c
p r e s e n t e d for s e v e r a l d o s e s
(A, B a n d C) o n f i g u r e 7. T h e s e p l o t s o f
p e r c e n t a g e of h e a t r e l e a s e d as a f u n c t i o n of time w e r e d e d u c e d f r o m r e c o r d e d c a l o r i m e t r i c c u r v e s b y a p p l i c a t i o n of T I A N e q u a t i o n . T h e v a t i o n of the c a t a l y s t , rimetric experiments
to the i r r e v e r s i b l e a d s o r p t i o n of p a r t of the the m o s t r e a c t i v e
(12).
Q(%)
100
75
50
25
0
20
the
deacti-
thus d e m o n s t r a t e d , h a s b e e n r e l a t e d b y d i r e c t
tion product, carbon dioxide, which inhibits sites
the
40
60
80
100
Tìquaq. 7
VeAczwtagz o¡J ovotved hmt, ai a function o{, time {¡OK thz inaction doi,u A, 8 and C In {¡ig. 6 [12).
calo-
reac-
surface
17 q kcal/mol«
TiQUAt i
CO
(•da) C O . , . . . ,
CO.,.„.,
II
CO„.
H
„
CO.
• CO
*
Ni
VifäeAentcat heati o£ adsorption or inteAaction measured during the adsorption sequence CO CO at 303 K on the iuki ace a nearly Stoechlometrlc nlckeZ oxlde. Proposed rmc.ka.ru,&ms oi Interaction axe Indicated on the. figure. Shaded areas correspond to the formation surface species which do not eventuaMy yield the reaction product, C0„ [g ], out, demonstrated by thermochemlcal cycle,4 113).
The same conclusion can also be deduced from more detailed calorimetric studies of the reaction mechanism. The principle of these studies is to adsorb the different reactants in successive sequences and to determine, in each case, the differential heats of adsorption or interaction w i t h preadsorbed species as a function of coverage. Figure 8, for instance, reports the calorimetric results of such a study during which carbon m o n o x i de, oxygen and again carbon monoxide were successively adsorbed at the surface of the same sample of nickel oxide at 303 K (13). A 3 - step mecha nism was supposed for the reaction and was compared w i t h the experimental data for different sets of surface sites, by means of thermochemical
cy-
cles. Analysis of the data indicate that the most energetic surface sites are liable to be inhibited either by adsorbed carbon dioxide or by adsorbed carbonates, in agreement w i t h the calorimetric results for the reaction itself, presented in figure 6; moreover, some adsorption sites are not active enough to participate in the reaction and finally, the number
18 of sites w h i c h m a y remain active during the reaction is indeed limited. The general picture is therefore in agreement w i t h generally accepted views on the surface distribution of catalytic activity. The merit of thi: calorimetric method is however to yield some quantitative data about what is generally readily assumed but seldom demonstrated.
Because of the large sensitivity of TIAN-CALVET calorimeters, it m a y be thought that their operation is tedious and time-consuming. This is true in some cases but not necessarily so. New methods have been recently developed to determine thermokinetics w i t h heat-flow calorimeters w h i c h are as rapid and more convenient than more conventional methods in heterogeneous Catalysis
(14).
The small glass reactor, presented on figure 9 may be placed in the calo-
dynamic. KeactoK and caioKj,irntKlc c.M (14}. 1, Kna.QX.oK 2, caZoKAmzt>u.c. celt; 3, ii.n tiAzd glaii cLL&k; 4, acuta Iyit; 5, i^Licon oiJL; 6, IniulcutLng tube.
rimeter cell. Thermal contact between the reactor and the sensing element of the calorimeter is insured by silicon oil. A small amount of catalyst (50 mg) is placed on the sintered glass disk inserted between the tubes which permit the circulation of the reactants in the reactor. The reactor is connected to a classical gas-supply system located outside of the reac tor and analysis of reactants and products is achieved
gas-chromatographi
cally. Calibration of the calorimeter response for different thermal puts and different flow rates can be made by placing a small
out
electrical
heater in the catalyst bed or by using,as a standard, a catalytic reaction at stationary state. Data reported on figure 10 shows that the proportionality of the calorimeter response to the energy produced in the reactor, measured here in number of moles of product formed per second, i indeed excellent.
200 150
100
50
0
20
10
30
Ftgwie 10 Plot the mextiwied amount ofi heat cu a function ofa the quantity o ¡$ product, detected chAomatogiapkLcally 114).
20
Flgcuie 11 CaJLoHAmoJyU.c. cu/iv&i i&coidzd duAlng the. catalytic, combuitxon o^ caJibon monoxide In thz dynamic itacton. [14].
Figure II shows that, in the case of a catalyst presenting a stable activity (curve A), a stationary state for the reaction is detected by the calorimeter approximately
15 minutes after the introduction of the reac -
tants in the carrier gas. Thermogram A presented on figure 11 refers to the combustion of carbon monoxide over a properly aged nickel oxide catalyst at 473 K. First, oxygen diluted in helium was circulated in the reactor. The stable base line then recorded indicates that the catalyst is in equilibrium w i t h flowing oxygen. At time A^, carbon monoxide was
injected
in the carrier gas. The plateau, parallel to the base line, which is then recorded indicates that a stationary regime is attained and the ordinate for the plateau is an accurate measure of the catalyst activity. At time A^, the partial pressure of carbon monoxide in the gas flow was reduced by a factor of 2. The decrease of heat produced, which indicates a decrease of the reaction rate, stops after
~
15 minutes and a new stationary
regime is obtained indicating that the reaction rate varies w i t h the pres-
sure of carbon monoxide in the reaction mixture. In A^, the flow of carbon monoxide in the carrier gas was discontinued and after some 15 minutes, the thermogram returned to the base line, indicating that no secondary reaction such as the desorption of the reaction product is taking place. The changes of heat flux recorded during this experiment as the partial pressure of carbon monoxide was varied indicate that this calorimetric method m a y be utilized to determine rate laws and reaction orders. In the case of the experiment reported on this slide, the experimental
conditions
were maintained constant for about 2 hrs in order to check the stability of the catalyst activity. W h e n this is demonstrated, an accurate measurement of the activity m a y be achieved in a m u c h shorter time. The calorimetric determination of reaction orders can usually be done in one day's work.
TABLE 1 Thermokinetic data for the combustion of carbon monoxide at 473 K
flow rate
(ml/mn) ,
total
Carbon monoxide
,
,
/
V
Oxygen
80
2 6
2 4
1 .7
80
2 5
5 5
1.6
80
2 6
7 0
1 .7
80
2 7
10 5
1.6
36
0 25
3 2
0.37
37
0 76
3 3
0.89
36
0 90
3 3
0.92
38
1 60
3 5
2.06
The results obtained in the case of CO-combustion over nickel oxide at 200°C are reported on Table 1. It is clear that when the partial pressure of oxygen is varied there is no change in the heat flux produced by the
22 reaction and that the partial order w i t h respect to oxygen is zero. The heat flux, however, changes w i t h partial pressure in the case of carbon monoxide and a first order dependence is demonstrated in agreement w i t h previous
results.
The same method is also very effective to detect all secondary processes which m a y take place, even transiently, at the catalyst surface. Figure 11 also reports thermogram B which was recorded w h e n a mixture of carbon monoxide and oxygen was introduced in the flow of carrier gas composed of pure helium. A thermal peak was first recorded and then a plateau indicating a stationary regime for the reaction. When the introduction of the reaction mixture was discontinued, the calorimetric curve returned to the initial base line. The phenomenon, which explains the peak initially recorded, can be attributed to the irreversible adsorption of oxygen, in excess in the gas mixture, on the surface of the initially nearly stoechiometric oxide. The same results were also obtained previously by
introdu-
cing successive doses of reaction mixture onto the catalyst (15). But, it took 3 days to perform the experiment in the case of the dosing
system
whereas 3 hours were sufficient w h e n the flow method was used. It appears therefore that by placing a dynamic reactor in a heat-flow calorimeter, it is possible to obtain rapidly reliable results on catalyst activities and on rate laws. Moreover, data recording being continuous, it is possible to detect and to study all secondary processes which may take place during the reaction : adsorption, as shown on figure 11, but also catalyst activation or deactivation. Finally, the method m a y be extended to the study of many reactions since a gas chromatograph is used to analyze the reactants and the products.
The preceding examples have demonstrated that, w h e n a dynamic reactor is placed in the calorimeter, catalyst activity can be easily deduced from the ordinate of the plateau which is recorded when the reaction attains stationary state. Kinetics of transient thermal phenomena, of non-stationary reactions for instance, may also be derived from the calorimetric curves. TIAN equation however shows that the recorded calorimetric curve yields kinetic informations which are distorted by the thermal lag in the
23 calorimeter. Moreover, the use of TIAN equation must be restricted to semi-quantitative kinetic measurements. The assumptions underlying TIAN e quation are not completely verified, especially in the case of fast phenomena (16). For TIAN equation to be valid, it is necessary that the surrounding m e d i u m remains, at all times, at a constant and uniform temperature. This is not completely true : heat evacuated from the cell
transien-
tly accumulates at the internal surface of the surrounding block and changes its temperature. Moreover, temperature gradients m u s t also exist in the calorimeter proper. For these reasons, TIAN equation is only an approximation and, for a quantitative analysis of the data, more complex datacorrection m u s t be used to remove the distortion due to thermal lags in the calorimeter. We have tested and used 3 deconvolution procedures based on Fourier transform analysis, time-domain matrices and state-function theory
(17).
In all cases, it is assumed that the calorimeter behaves as a linear system w i t h localized constants and w e have shown that this is indeed the case w i t h heat-flow calorimeters of the TIAN-CALVET type (18). The principle of the method is then to solve the general equation of linear systems (G (p) = Hp. Fp)for any particular experiment, once Hp the transfer function has been determined in separate, calibration experiments. Digital recording of the data and use of a computer are, of course, necessary. Without entering into any mathematical details, presented elsewhere
(17),
it may be pointed out that application of state-function theory presents, in our opinion, a number of advantages since, for instance, it allows the on-line correction of the data w i t h a microprocessor. Dirac pulses or H e a viside steps which are needed to calibrate the calorimeter
may be produ-
ced by Joule heatings but pulse-like adsorption phenomena have also b e e n used for this purpose. Since there is necessarily some uncertainty on the exact location of the heat sources in any particular experiment, it is not possible to completely correct the data. However, we have shown that w h e n the calibration heater or the catalyst occupy a small defined volume of the calorimeter cell, deviations between calibration and actual
experi-
ments or for different experiments do not exceed ~ 5 % (19). The sensitivity of the data correction method was also tested and the li-
24
flguxi Vzconvolwtion
12
o¡$ 6-muJLatzd caZo>ujmeX/Uc cukvu
(20)
m i t of its r e s o l u t i o n w a s d e t e r m i n e d d u r i n g s i m u l a t e d e x p e r i m e n t s R e s u l t s r e p o r t e d figure sampling p e r i o d
(20).
12 i n d i c a t e that short h e a t p u l s e s , lasting
(2s) separated b y
11 p e r i o d s
(24s) a r e , after
c l e a r l y s e p a r a t e d , though they are c o m p l e t e l y blurred o n the r e s p o n s e . Some b r o a d e n i n g
correction,
calorimeter
is h o w e v e r a p p a r e n t o n the c o r r e c t e d
In the case of less a b r u p t c h a n g e s of thermal power in the
1
thermogram.
calorimeter
cell, the c o r r e c t i o n gives e v e n b e t t e r r e s u l t s . The 60 s e c - s t e p s o n f i g u re 13 are, for i n s t a n c e , s a t i s f a c t o r i l y r e c o n s t r u c t e d b y the
correction,
though the c a l o r i m e t e r r e s p o n s e does not give any v a l u a b l e k i n e t i c m a t i o n o n the thermal process s i m u l a t e d in the T h i s study has d e m o n s t r a t e d
infor-
calorimeter.
that rapid c h a n g e s in the thermal power
produ-
ced in the c a l o r i m e t e r can be a c c u r a t e l y d e t e r m i n e d b y m e a n s of the d a t a c o r r e c t i o n m e t h o d s and that r e l i a b l e k i n e t i c d a t a c a n be o b t a i n e d from the t h e r m o g r a m s , e v e n in the case of rapid chemical p r o c e s s e s . B e c a u s e of n o i s e in the r e c o r d i n g
line, the sampling p e r i o d w h i c h is u s u a l l y
the
selected
25
F-cguAe 13
Vzc.onvoluJu.on
o0
prob« 5 mm -
1 -
1 mm \ \ \ heating coil \ gold thermistor
W
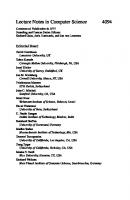
Fig. 1. Left top: The a l t e r n a t e l y h e a t e d p r o b e s implanted into the m y o c a r d i a l wall and the balloon occluder for intermittent c o r o n a r y o c c l u s i o n . Left bottom: A n enlarged scheme of the probe c o n s t r u c t i o n . Right top: D i f f e r e n c e b e t w e e n stationary m e t a b o l i c tissue temp e r a t u r e and aortic t e m p e r a t u r e . Right bottom: T e m p e r a t u r e step response to heating current. Two d i f f e r e n t curves of zero blood flow and non-zero blood flow are s u p e r i m p o s e d , the former being u s e d as a reference i)
Local m y o c a r d i a l
tissue
temperature
ii) A o r t i c blood temperature as input temperature to the coronary
circulation.
Two d i f f e r e n t types of heat are involved in the m e a s u r i n g cess
pro-
(fig. 2) :
First, there is
e n d o g e n o u s heat
p r o d u c e d by
continuously
w o r k i n g heart m u s c l e . The arterial blood enters the m y o c a r d i a l tissue at aortic t e m p e r a t u r e , equilibrates w i t h the tissue temperature by taking up m e t a b o l i c heat c o n t i n u o u s l y transporting
and
it to the central v e n o u s blood pool. This
contin-
uous heat clearance by the blood is s u p p l e m e n t e d by some heat c o n d u c t i o n m a i n l y to the endocardial
surface where the
tissue
51
Fig. 2.. Schematic cut through a computed temperature field in the left ventricular wall of the myocardium. The endocardial surface is kept at constant temperature, the lung surface, in the first approximation, is assumed to act as heat insulator. The temperature is plotted in the third dimension. The metabolic heat produced all over the myocardium yields temperature increment of slightly more than half a degree centigrade above the ventricular blood temperature temperature is kept constant at blood temperature level, i.e., the aortic level. Besides this continuous process of metabolic heat clearance, an artificial heat is produced intermittently in the heating coil of our probe for the determination of blood flow. All types of heat transport within the tissue are analyzed on the basis of the same model
(cf. 6, 3). The model
includes
- heat conduction as a diffusion process and - heat convection, e.g. the transport by blood flow. The description of heat transport by blood is not concerned with the vessel structure or the microscopic structure of blood flow velocity vectors but it looks at the blood simply
52 as a means of supplying and clearing tissue area. This leads phenomenologically to the dimension ml blood ml tissue • min without reference to any direction. For the determination of regional blood flow one can separate heat convection and heat conduction: One does not consider the temperature time course itself but its slope du $ /dt = du Q /dt
• exp (- $ • t/X)
where the temperature difference u Q refers to zero blood The reference curve is first estimated from measurement
flow. in
gelatine and used on-line for computation of blood flow values. If necessary, these are later corrected using post-mortem
ref-
erence curve. Evaluations are done on a desk calculator HP 9810 A. The first step in determination of regional heat production confines to that part which is cleared by blood flow. The approach to this convective part is straigthforward; when entering the tissue the blood is warmed up by u °C. These are converted
into Joules via the specific heat per blood volume
pc,, , (Joule • °C" 1 • ml"1 blood). Thus pc • u are the blood Joules taken up per ml of blood. On multiplication by ml of blood flow per ml of tissue and min one obtains heat in Joules taken'up by 1 ml of tissue in 1 min. This convective part of metabolic heat production has to be corrected
for heat diffusion to the tissue surface
(fig. 3).
This correction depends heavily on blood flow. For a normal blood flow of 0.7 ml blood
• ml"'' tissue
• min"1 the correc-
tion amounts tf> some 15 p.c. With increasing blood flow it becomes less important. For small blood flow the convective part vanishes, and the diffusion process dominates in the direction mainly to the ventricle and less to the lung surface. Geometric assumptions, partially included
in fig. 2, from which cor-
diffusion part
Fig. 3. Correction for diffusion calculated from the model temperature field, described in fig. 2 rection for diffusion is derived are based on approximating the left ventricular wall by a sphere of inner radius 1.5 cm and thickness of 1 cm. The temperature is assumed to be kept constant at the ventricular surface due to good mixing of ventricular blood. At the lung surface thermal isolation is used as a first
approximation.
Fig. 4 shows the results of a single experiment with an anesthetized dog. During systemic stress (hypoxemic hypoxia)
and
at rest the measured values at the three measuring sites differed only accidentally. Starting with intermittent
coronary
occlusion (60 min) the differences were due to regional
tissue
damage. Fig. 4 demonstrates the different reactions to reduced oxygen content in the inspired air. The white columns demonstrate normal reactive increase of blood flow during
hypoxia.
The tissue damaged by the preceding occlusion cannot react in this way. Here mere recording of tissue temperature
difference
is completely misleading: The temperature difference does not
54 dog ( 2 4 kg) myocardium
hypoxemic hypoxia 9.5 7 . 0 2
regional blood flow
hypoxemic hypoxia
I0.5V.02 957.02 I
coronary occlusion (60 min)
mi blood ml tissue min
nil Dim. regional temperature difference
M
JE3
I
r
j
. I
Ti
minj
XI art. blood press. [ m m H g ] 1 5 0 heart rate [beats/min] 150
130 220
(tissue-aorta)
nua
regional heat [ml tissue
N n-u
11». 125 230
to
production
IL
115
120
220
190
rk uo
100
180
210
Fig. 4. From top to bottom: Regional blood flow, temperature difference between tissue and aorta, regional heat production and control parameters. There are three tissue measuring points; white (hatched) columns = outside (inside) the region damaged during the experiment by intermittent coronary occlusion (cf. arrows). Time course without scale from left to right: 1. hypoxemic hypoxia, 2. basic state, 3. coronary occlusion, 4. control after release of occlusion, 5. and 6. hypoxemic hypoxia (10.5 and 9.51 O2), 7. final control differ in normal and damaged tissue; only when regional blood flow and regional heat production are considered, it is possible to estimate the energetic situation of the tissue. The table shows mean values of regional heat production and regional blood flow in different experimental
states of the
tissue. The results are derived from 30 experiments. They have been compared
(11 experiments) with classical energy
turnover
method based upon global O2 uptake. /•regional heat-, production ' ml
Joule tissue-min
, regional . '•blood flow-1 ml
ml blood tissue-min
,-oxygen.. '•uptake ' " ml 02 ml blood
, energy . '-equivalent-' 20
Joule ml 02
55 Thus the complete organ blood flow has been replaced by regional blood flow in the classical
formula.
Table. Regional blood flow, regional heat production and 0?uptake control (x ± s). n: number of measuring points in the myocardium. 1 Joule/s = 1000 mW (= 0.24 cal/s) state
regional blood flow
ml basic state
ml blood tissucmin
0.65 ± 0.30 (n = 96)
hypoxemic hypoxia 10.2±0.5t 02
1 .58 ± 0.77
coronary occlusion
0.31 ± 0.28
(n = 52)
(n = 28)
regional heat production (convect.part)
o 2 control
mW ml tissue
mW ml tissue
27 ± 13
35 ± 12
(n = 96)
(n = 33)
35 ± 15
29 ±
(n = 52)
(n = 22)
6 ±
6
(n = 28)
9
17 ±
5
(n =
5)
The m e a n values of regional blood flow quoted above agree with previous results (7) reflecting the fact that the blood flow does not drop to zero values (8) in dog experiments because of collateral circulation
(9).
The results on heat production
(second and third column of the
table) differ significantly. The mean values become more
simi-
lar if the correction for diffusion is included. This correction is necessary particularly for cases of low blood flow but it is somehow arbitrary depending on the temperature field assumed and on the implantation depth of the probes
(cf. fig. 2
and 3) . The method is suitable for organs where heat diffusion is not dominant, either because of the large distance to the organ surface or due to high blood flow. Since the tissue is damaged
56 by introducing probes it is not possible to carry out routine clinical studies. By means of animal experiments it is possible to test methods for the therapeutic improvement of energetic conditions in localized areas of damaged tissue as in coronary disease.
References 1. GRAYSON, J., COULSON, R.L., WINCHESTER, B. : Internal calorimetry-assessment of myocardial blood flow and heat production. J. appl. Physiol. 30, 251-257 (1971). 2. GRAYSON, J., SCOTT, C.A., MORRISON, C.J.: Oxygen utilization and coronary vascular reserve in the ischemic m y o cardium following acute coronary occlusion in the dog. Microvasc. Res. 1_1_, 1 81 -1 93 (1 976). 3. MOLLER-SCHAUENBURG, W., APFEL, H., BENZING, H., BETZ, E.: Quantitative measurement of local blood flow with heat clearance. Basic Res. Cardiol. 70, 547-567 (1975). 4. BENZING, H., MOLLER-SCHAUENBURG, W. , BETZ, E.: Determination of regional heat production and regional blood flow in dog myocardium. Dtsch. Physiol. Ges. in cooperation with the österr. Physiol. Ges. and the österr. Biophysik. Ges. 45th meeting (autumn meeting) from Sept. 23-26, 1975 in Wien. Pflügers Arch. Suppl. to Vol. 359, R 147 (1975). 5. BENZING, II., MOLLER-SCHAUENBURG, W., BOHLER, M.: Bestimmung von regionaler Wärmebildung und Durchblutung im Myokard narkotisierter Hunde. Biomed. Technik 2_1_, Ergänzungsband, 229-230 (1976). 6. PERL, W.: Heat and matter distribution in body tissues and the determination of tissue blood flow by local heat clearance methods. J. theoret. Biol. 2, 201-235 (1962). 7. BENZING, H., WAHL, S.H., BENDER, H.P., RABE, M.: Quantitative local blood flow changes in the insufficiently supplied dog myocardium, measured by means of the heatclearance method. 7th Europ. Conf. Microcirculation, Aberdeen 1 972, part I, Bibl. anat. JM, 1 39-144 (1973). 8. RIVAS, F., COBB, F.R., BACHE, R.J., GREENFIELD, jr., J.C.: Relationship between blood flow to ischemic regions and extent of myocardial infarction: Serial measurement of blood flow to ischemic regions in dogs. Circulat. Res. 38, 439-447 (1976). 9. SCHAPER, W.: The collateral circulation of the heart. In: Clinical Studies. Vol. 1. North-Holland Publ. Comp. Amsterdam-London. American Elsevier Publ. Co. Inc., New York, 1971.
2. Biochemical Calorimetry
2.1. Hydration and Thermal Stability of a-Lactalbumin. A Calorimetrie Study M. Ruegg, U. Moor, A. Lukesch, B. Blanc
SUMMARY The effect of hydration upon the thermal denaturation of a-lactalbumin has been studied by differential scanning calorimetry. A strong dependence of the denaturation temperature (T^), the enthalpy ( AH^) and entropy changes ( ASp), and the sharpness of the transition peak ( AT^^) w a s observed in the water content range of 0 to about 0.3 g/g (region of primary hydration water). In the water content range of 0.3 to about 0.8 g/g (region of secondary hydration water), smaller changes of the thermodynamic parameters of the thermal denaturation were caused by water uptake. Upon further dilution of the protein in water, AHp remained constant (approx. 59 kcal/ mole), but T Q and aT 1/2 increased from 60.2°C and 7.5°C in 40-20% solutions (wt% protein) to 63.7°C and 10.7 C in 10-3% solutions, respectively. Reversibility of the reaction in these solutions was 60-70%. The thermal transition observed in water does not meet the requirements for a purely two-state process. Different results are obtained in electrolyte solutions. For example, in a solution of phosphate buffer, AH^ and T^ increase. This is explained in terms of the conformation stabilizing effect of phosphate ions. Sucessive measurements of the same sample in phosphate buffer showed that the transition was 80-90% reversible for the particular thermal history involved in the study.
INTRODUCTION Studies on the thermal denaturation of milk proteins are of importance in understanding both the structure and stability of these proteins as well
60 as the changes in the properties of milk and milk products during heat treatments. With the development of highly sensitive thermoanalytical techniques, quantitative measurements of the thermal denaturation of proteins have become feasible with greater experimental ease than with other classical methods. Differential scanning calorymetry (DSC) is one technique which offers the possibility of direct measurement
of the most
important thermodynamic parameters characterizing heat*-induced transitions (1,2). We used this technique for studying the thermal properties of the 8-lactoglobulin-water system and for other proteins-water systans (3,^). In these systems the thermally induced conformational changes of the proteins were irreversible (3) or only partially reversible (4). It was considered useful to extend this research and to study another irrportant whey protein which undergoes reversible thermal denaturation (5), namely a-lactalbumin. As in the case of 6-lactoglobulin the thermal denaturation of dilute alactalbumin solutions has been extensively studied by various techniques such as immunodiffusion (6), spectrophotometry (5), pH-potentiometry (7) and, by measuring the amount of heat^induced centrifugable precipitate (8), but, to our knowledge, there are no reports on the influence of hydration upon the thermal stability of this protein. Also, many published studies on thermal denaturation did not take into account the considerable degree of renaturation of a-lactalbumin after heat treatments. The aim of the present work was to study the influence of hydration on the heat denaturation of a-lactalbumin which is observed in the temperature range of about 50-70°C, and to compare the results with those obtained from similar measurements of other globular proteins.
EXPERIMENTAL
Materials a-lactalbumin was prepared from pooled bovine milk of Simmenthal cows by gel
61 filtration followed by ion exchange chromatography according to the method Of Armstrong et al. (9). A molecular weight of 14,176 was chosen for the calculation of molar concentrations (10). Purity of the preparations was checked by polyacrylamide gel electrophoresis and by analysis of amino acid composition (10). The purified solutions were dialyzed against distilled water and lyophilized. The water content of the samples used for calorimetric measurements was adjusted either by adsorption of water vapor at appropriate vapor pressures or, for the highest water contents, by directly adding distilled water to the dry preparations.
Calorimetry Calorimetric measurements were made using a Perkin Elmer model DSC-2 differential scanning calorimeter. The experimental procedure has been described in detail previously (3). Samples of hydrated a-lactalbumin were packed and sealed in standard volatile sample pans (Perkin Elmer) and scanned at a rate of 5°/min until the denaturation process was complete. The heat capacity of the reference cell was balanced using an appropriate amount of water. Except for dilute solutions the water content of the samples was determined after each experiment by drying the punctured sample pans to constant weight over phosphorus pentoxide. Protein concentration in dilute solutions was determined spectrophotometrically at 280 nm in 0.1 M phosphate buffer of pH 6.9 using E ^
= 20.6 (11).
Water Sorption Data Water sorption by a-lactalbumin in the relative water vapor pressure range (P/PQ) of 0.05 to 0.98 was determined at 25°C using an isopiestic technique. The apparatus and technique have been described in detail elsewhere (12,13). The equilibrium water contents in the p/pQ range of 0.05 to about 0.90 were obtained with an accuracy of _+ 0.5?. At higher p/p values the experimental
62 precision was somewhat lower, because of the steepness of the sorption isotherm in this p/p
region (approx. _+ 1%).
RESULTS AND DISCUSSION Hydration of a-lactalbumin Many experiments have suggested that hydrated globular proteins are surrounded by different shells or layers of water (3,
15 and others). The
water existing near the protein surface has thereby been characterized by different degrees of interaction with the solute. Using the concept of primary and secondary hydration water, as opposed to bulk water (4), we may divide the water sorption isotherm for a-lactalbumin into different segments:
P/Po Fig- 1 Water sorption isotherm for a-lactalbumin at 25°C. P: primary hydration water; S: secondary hydration water; p/p : relative water vapor pressure.
63 1) In the water content range from dryness to about 250 mole/mole (0.31 g/g) primary hydration water (P) is absorbed. This strongly bound water cannot participate in a normal ice lattice without rupture of hydrogen bonds with the protein and thus does not freeze at temperatures as low as -70°C. Various studies have suggested that this strongly modified water has particular physical properties which allow a further subdivision (143 16, 17). For a-lactalbumin primary hydration water corresponds to the amount of water absorbed in the p/p Q range from 0 to about 0.95. It is interesting to note that the amount of strongly bound primary hydration water (0.31 g/g) may be compared with that observed for a number of globular and fibrillar proteins. Albumins (18), g-lactoglobulin (3), caseins (19), collagen (16) and keratin (20) all revealed an amount of non-freezable water around 0,3 g/g. For a-lactalbumin this amount corresponds to about 2 molecules of water per amino acid residue,
2) Above the critical water content' of 250 +_ 16 moles H^O/mole protein, to about 700 mole/mole, thermograms reveal freezable water with temperature and heat of fusion different from ordinary water. A melting thermogram of this secondary hydration water (S) is shown in Fig. 2. As judged from a measurable heat absorption, fusion of this modified water o o started in the vicinity of -30 C and was complete around -1 C. The complex shape of the melting curve indicates the presence of different types of secondary hydration water. 3) At water contents higher than approximately 700 mole/mole water is absorbed which cannot be distinguished by calorimetric methods from the bulk liquid, i.e. heat and temperature of fusion of the water associated with the protein are, within the experimental error, equal to the corresponding values for pure water.
64
Fig. 2 DSC thermogram of secondary hydration water of a-lactalbumin. Sample weight: 11.767 mg; water content: 409 moles t^O/mole protein; sample equilibrated at -25°C during 14 h before DSC scan at 2.5°/min and full scale sensitivity of 1 mcal/sec.
Dependence of Thermostability on Hydration
In the g-lactoglobulin-water and collagen-water systems the changes of the state of water absorbed upon stepwise hydration were apparently accompanyied by changes in the heat stability of the proteins (3,4). In the case of a-lactalbumin the same phenomenon is observed. Fig. 3 shows typical denaturation thermograms for a-lactalbumin obtained at different levels of hydration of the protein. The following thermodynamic data were measured in such DSC thermograms and plotted as a function of water content in Fig. 4: the enthalpy of denaturation AH^ as obtained from the peak area, the temperature of denaturation T^ at maximum heat absorption, and the half width of the endothermal transition AT.^- Also included in Fig. 4 are the entropy changes AS^, which were calculated from T^ and AH^ for
65
-1— 40
50
-r60
70
—r— 80
90
TEMPERATURE [ ° C ]
DSC thermograms of a-lactalbumin in the temperature range 30-100°C. a)-c): a-lactalbumin-water system, water contents (mole/mole) and sample weights (mg) are 44/3.298, 393/11.813 and 1857/10.147, respectively, d): 6.0% a-lactalbumin in 0.1M phosphate buffer solution of pH 6.9. Heating rate is 5°/min.
¿G = 0 at the transition point (ASp ^ H ^ / T ). The predenaturational changes which have been observed by Privalov et al. (21) to occur before the effective thermal transition have not been considered in this study. These predenaturational processes are not accompanied by sharp changes of physical parameters. A linear increase of heat capacity takes place with the rise in temperature only. All of the four functions plotted in Fig, 4 show a marked dependence on the degree of hydration of the protein. In the water content range from dryness to about 700 mole/mole the experimental points for the denaturation temperature, Tp, apparently follow an exponential curve. This indicates that the T n values follow an equation similar to that found by Flory and Garrett for
66
100-
20-
a £! 10-1
Ti f •a
20-
0' a
200-
100'
°0
400
800
1200
1600
2000
2400
2800
WATER CONTENT [mole/mols]
Pig. 4 Dependence on water content of thermodynamic parameters for thermal denaturation of a-iactalbumin. AHL: enthalpy of denaturation; T D ; tenperature of denaturation; AT]_/2: half width of the thermal transition; ASd: entropy of denaturation, calculated form Td and AH D for AG = 0 (ASD = AHo/lb). other proteins (22). This equation establishes a mathematical relation between the volume fraction of solvent in the polymer and the melting temperature of the polymer. In order to apply this type of equation one must know the transition tenperature of the pure polymer. In the case of a-lactalbumin an extrapolation of the denaturation temperatures cannot be regarded as trustworthy because measurements at very low water contents ( AMP+P. i
2. Formation of poly-A from ADP molecules catalyzed by the Polynucleotide Phosphorylase n(ADP)
(CE 2.7.7.8) PNP
' S e > [poly-A] n + n P.
3. Phosphorolysis of poly-A to ADP molecules catalyzed by the same enzyme [poly-A]
+ nP.
> n(ADP)
Hydrolysis of poly-A and RNA to single nucleotide monophosphate units catalyzed by the Ribonuclease A5 from Actinomyces sp. [poly-A] The enzyme was
> n (AMP) isolated and studied by Tatarskaya et a 1. (9).
Reaction media contained as follows: For the reaction
I:
Succinate buffer 0.04M, pH 6.8 + CaCl 2
For reactions 2 and 3:
Tricine buffer 0.1M, pH 8.2 + M g C l 2
0.004M; 0.005M.
_
All reactions were performed at 25 27°C. Heat Measurements The heat effects of the above mentioned reactions were measured with the LKB batch microca1 orimeter.
The readings of this instrument, which belongs
to the type of calorimeters based on the heat conduction principle, are proportional
rate of heat evolution or absorption. absorbed
(or heat
leakage)
to the heat power of the reaction, i.e. to the The amount of heat evolved or
in the course of the reaction was computed from the area under
the registered voltage-time curve using the appropriate calibration of the i nst rument. The substrate solution and appropriate buffer mixture, brought to a total volume of 4ml, were poured
into the greater compartment of both the
99 r e a c t i o n and the r e f e r e n c e cell
of the
instrument.
The smaller
of both c e l l s w e r e f i l l e d w i t h 2ml of b u f f e r s o l u t i o n w i t h o u t Then 20 to 50yl
of e n z y m e s o l u t i o n w e r e p o u r e d
o f the r e a c t i o n cell o n l y . the r e a c t i o n w a s liquids
A f t e r thermal
i n i t i a t e d by r o t a t i n g
in both c e l l s .
into the s m a l l e r
the
heat e f f e c t s d u e
changes
in pH e t c .
were
been
(AH) c h a r a c t e r i s t i c for
i n v e s t i g a t i o n , o n e o n l y has to d i v i d e the m e a s u r e d formed
the
heat
in the
course
reaction.
All m e a s u r e m e n t s w e r e
r e p e a t e d 5 to 10 times and the r e s u l t s w e r e
T h e m e a n q u a d r a t i c e r r o r had been f o u n d to be the m e a s u r e d AH Analytical
10 to 20% o f
Methods
In r e a c t i o n s
phate.
in the range of
averaged.
value.
1 and 2 the n u m b e r N of bonds d i s r u p t e d a n d / o r n e w l y
was established
by m e a s u r i n g
In r e a c t i o n s 3 and k
changes of corresponding Orthophosphate
of Vit. C )0%
the c o n c e n t r a t i o n it w a s e s t a b l i s h e d
nucleotide
H 2 S 0 ^ and a reducing
and the m i x t u r e w a s room t e m p e r a t u r e
by m e a s u r i n g
incubated
NH^ M o s o l u t i o n
reaction
in 1M H ^ O ^
to 1ml o f the
for 30 m i n u t e s at 4 5 ° C .
After cooling
strict proportionality
solutions of
and
to
the
820nm.
known
has been e s t a b l i s h e d b e t w e e n
the
c o n c e n t r a t i o n of the o r t h o p h o s p h a t e and the m e a s u r e d v a l u e s of O t ^ Q least
1 part
reagent,
d e n s i t y of the s o l u t i o n w a s m e a s u r e d at
In c a l i b r a t i o n e x p e r i m e n t s , p e r f o r m e d w i t h I ^ P O ^ concentration,
concentration
T h e r e a g e n t c o n s i s t e d of
10pl of the s p e c i m e n w e r e a d d e d
the optical
formed
orthophos-
by the w a y o f a c o l o u r
agent.
s o l u t i o n , 6 p a r t s of 0.k2%
3.5 p a r t s o f w a t e r .
c h a n g e of f r e e
phosphates.
concentration was measured
with molybdate,
at
to
small.
e f f e c t Q by the n u m b e r N of b o n d s d i s r u p t e d o r n e w l y of the
compartment instrument
the c a l o r i m e t e r and m i x i n g
It s h o u l d be n o t e d that all
the v a l u e o f the e n t h a l p y c h a n g e
reaction under
substrate.
for the e f f e c t of the e n z y m e d i l u t i o n w h i c h had
f o u n d to be n e g l i g i b l y To compute
the
e q u i l i b r a t i o n o f the
the d i l u t i o n o f the s u b s t r a t e s o l u t i o n , to small eliminated except
compartments
up to
0Dg2Q=1,2.
A M P and A D P c o n c e n t r a t i o n s w e r e m e a s u r e d on P E I - c e l l u l o s e
by the t h i n - l a y e r
(Merck 5 6 6 6 , T L C a l u m i n i u m
s p e c i m e n and of a p p r o p r i a t e m a r k e r s
sheets).
5
chromatography
to 10yl o f
(AMP, A D P and ATP s o l u t i o n s o f
the known
100 concentration) were applied to the start-line of the sheet, and chromatograms were developed with 0.2M LiCl for 10 minutes, then with 1.2M LiCl for 20 minutes and finally by 2.0M LiCl.
The nucleotide spots were exami-
ned and identified under a short-wave ultraviolet with 1 m 1 of the mixture:
lamp and then eluted
Tris buffer 1.5M, pH 1.h + 0.75M M g C l 2 .
Optical
density of the eluate was measured at 260nm. Chemi ca1 s Nucleotide phosphates and enzymes were purchased from "Sigma" and used without any further purification, except for the Ribonuclease A5 which was a gift from Dr.. R. Tatarskaya
(Institute of Molecular Biology, Moscow).
Some experiments were also performed with the solution of the Polynucleotide Phosphory1ase (The Weizmann
isolated from E.coli and purified by Dr. M. Shoreq
Institute of Science, Rehovot, Israel).
No essential
dif-
ference in AH-values were found between these two preparations of the enzyme. Results and Discussion The results of our measurements are presented Table 1 - AH-values for the reactions Reaction
in Table 1.
studied
AH (kcal/mol)
ADP Hydrolysis
-11 ,2 .
Poly-A
Synthesis
- 1 .7 ,
Poly-A
Phosphorolysis
+ 3..3
Poly-A (and RNA) Hydrolys i s The value A H = - " 2 kcal/mol
- 9..5 that we have found for the reaction of ADP
hydrolysis to AMP and Pj is close to the value - 12 kcal/mol iously
found prev-
(10) for the ATP hydrolysis to ADP and P..
Thermodynamically
the process of poly-A
(or RNA) formation represents the
coupling of the exothermic reaction of the precursor
(ADP or NTP)
lysis and the endothermic reaction of NMP polymerization. of AH-values for the first two reactions or approximately 85% of the energy
hydro-
The comparison
in the Table shows that 9 kcal/mol
liberated by the breakdown of the macro-
101 ergic
bonds
stored
in the p r e c u r s o r ,
a r e not r e l e a s e d a s heat but r a t h e r
1
in the newly formed 3 , 5 ' - p h o s p h o d ¡ e s t e r
the r e a c t i o n s 3 and 4 show t h a t t h i s a s heat
Our d a t a
s t o r e d e n e r g y can e i t h e r
in the r e a c t i o n o f h y d r o l y s i s ,
n u c l e o t i d e monophosphates
bridges.
are
be
released
or u s e d t o r e - p h o s p h o r y 1 a t e
in the p h o s p h o r o l y t i c
r e a c t i o n , which
model c y c l e o f RNA t u r n o v e r , w h i c h c o n s i s t s o f RNA s y n t h e s i s the r e v e r s e o f t h i s
the r e a c t i o n c y c l e f o r
i s more c o m p l i c a t e d .
The d e g r a d a t i o n p r o d u c t s e n t e r and not v i a
can a c t as p r e c u r s o r s
cription,
and p y r o p h o s p h a t e g r o u p s ,
liberated
in t h i s p r o c e s s ,
l a t e d t o c l o s e the c y c l e . s t e p s , a s shown
from
(P-O-P)-bonds
in F i g .
p r o c e s s o f m-RNA t u r n that
in v i v o t h e
of nucleotide
monophosphates. directly
But s i n c e o n l y the
in t h e n a t u r a l
break-
nucleotide
p r o c e s s o f RNA
i n s t e a d o f the o r t h o p h o s p h a t e ,
r e s e m b l e , from the e n e r g e t i c
in c e l l s
investigated.
three
S i n c e a t Pj
point
of
concentra-
the r e a c t i o n c a t a l y z e d by the P N P 1 s
in the d i r e c t i o n o f RNA p h o s p h o r o l y s i s ,
i t seems n a t u r a l
breakdown o f m-RNA i s the b i o l o g i c a l
to
ass-
function
enzyme.
L. P e l l e r
(11)
phosphates, z a t i o n to
has shown t h a t w i t h o u t
thermodynamics
less
limits
the h y d r o l y s i s o f
liberated
the number a v e r a g e d e g r e e o f
than 100 n u c l e o t i d e s
in s i z e .
To e x p l a i n
RNA t r a n s c r i p t i o n the upper
i s coupled to the pyrophosphates
pyro-
polymeri-
the f o r m a t i o n
much l o n g e r c h a i n s o f RNA t r a n s c r i b e d on a c i s t r o n , one must admit
103.
are
1.
ume t h a t the p h o s p h o r o l y t i c
of
trans-
the n u c l e o t i d e d i p h o s p h a t e s must be p h o s p h o r y -
two s t e p s o f the c y c l e
tions u s u a l l y present
efficiency.
T h i s c y c l e t h e r e f o r e c o n s i s t s of at l e a s t
v i e w , the model c y c l e t h a t we have
of this
level
(6)
the
from ADP and
the n u c l e o t i d e d i p h o s p h a t e pool
the n u c l e o t i d e m o n o p h o s p h a t e s .
tri-phosphates
proceeds
the n a t u r a l
I t has been shown
down o f m-RNA does not p r o c e e d t o the
The f i r s t
is transferred
In
bonds and b a c k . The t r a n s f e r p r o c e e d s w i t h a v e r y h i g h
The p a t t e r n o f over
r e a c t i o n , the e n e r g y
the
represents
the coup 1 i n g o f the RNA h y d r o l y s i s w i t h the AMP p h o s p h o r y l a t i o n .
to ( P - O - P )
for
hydrolysis.
of
that
That
raises
l i m i t o f the a v e r a g e s i z e o f the polymer by a f a c t o r o f the o r d e r
102 RNA
2.- RNA - PHOSFHOROL [NMPl n +(P 1 ) n
- RNA - TRANSCRIPTION
PNP-se
RNA-polymerase
NDP
[(Mp]
+
n
(R
NTT 3. - PHOSPHORILATION n(NTP) + n(P 1 )
n(NDP) + n(P=P)
Figure 1. A "Closed" Reaction Cycle for m-RNA Turnover Since the reaction of RNA transcription catalyzed by the DNA-dependent RNA-polymerase can be reversed by raising essentially the concentration of the pyrophosphates, these have to be hydrolized
(or removed by another way
from the system) to allow the reaction in the cell proceed in the direction of RNA synthesis. The hydrolysis of pyrophosphates could provide the phosphate groups which are required to drive the reaction catalyzed by the PNP !se in the direction of phosphorolysis.
It seems likely to suggest that the reaction of pyro-
phosphate hydrolysis
is also coupled energetically with the 3rd step of
the scheme, the NDP->NTP phosphorylation. The general
idea that pyrophosphate can replace ATP as an energy donor in
some energy requiring biological experimental evidence.
reactions can be supported by solid
M. Ba1tscheffsky et a 1. (12) has shown that both
PP. and ATP may function as donors those causing the changes
in such energy requiring reactions as
in the redox state of endogenous cytochromes
in
chromatophores and in respiring mitochondria, both from lower and higher organisms.
PP. can act also as the energy donor in reactions
for the spectral was further shown
responsible
shift of the carotenoid band in chromatophores
(13).
It
(1*») that the energy requiring reactions of
transhydro-
genase catalyzed reduction of N A D P + by NADH in chromatophores
may also be
driven by the pyrophosphate
instead of ATP.
However, all that evidence bears only on the coupling between the pyro-
103 p h o s p h a t e h y d r o l y s i s and s o m e o x i d o - r e d u c t i o n k n o w , an e n z y m e w h i c h c o u l d c a t a l y z e to the NDP-*NTP p h o s p h o r y l a t i o n
has n e v e r been
s u g g e s t e d as the 3rd s t e p o f the c y c l e in v i t r o .
Therefore,
p y r o p h o s p h a t e m a c r o e r g i c bond e n e r g y
K o r n b e r g et_ aj_. (15)
phosphates
the
A s far a s w e
in Fig.
isolated and the 1 has n e v e r been
have
consider
isolated and p u r i f i e d an e n z y m e from E. col i
reversible
later that
really p r o c e e d
transfer of phosphate groups
>
(Polyphosphate)^
from
poly-
+ ATP
the f o r m a t i o n of A T P f r o m A D P and
in the c e l l s o f C h l o r o b i u m
These data make plausible
the a s s u m p t i o n
in RNA t r a n s c r i p t i o n
immediately
condensed
In the c o n d e n s a t i o n those
required
that
(and p e r h a p s
to p o l y p h o s p h a t e s
in v i v o the
for d r i v i n g
polyphosphate molecule.
(16).
pyrophosphates
in DNA r e p l i c a t i o n
too)
and h e n c e r e m o v e d f r o m the
the p h o s p h o r o l y s i s
bonds between
It w a s
polyphosphates
thiosu1fatorium
r e a c t i o n the o r t h o p h o s p h a t e s , w h i c h a r e
in m a c r o e r g i c
of m - R N A , and
system.
liberated,
are
the e n e r g y
is
the p h o s p h a t e g r o u p s o f the m o r e
T h e e n e r g y can be u t i l i z e d
are
later to c l o s e
stable the
r e a c t i o n c y c l e o f m - R N A t u r n o v e r by the way o f the r e a c t i o n c a t a l y z e d the K o r n b e r g ' s
1.
RNA
the m - R N A
Pyrophosphate
RNA
s c h e m e o f the r e a c t i o n
transcription > [NMP]n +
n(P^P)
condensation
n(P^P) 3.
hypothetical
turnover:
n(NTP) 2.
by
enzyme.
T h u s w e c a m e to the f o l l o w i n g performing
the
to A D P :
demonstrated
stored
observed
is not e x c l u d e d , w e h a v e to
The enzyme was obtained also from Corynebacterium diphteriae.
liberated
reaction
way.
(Polyphosphate)^ + ADP
does
hydrolysis
t h o u g h the p o s s i b i l i t y o f this w a y o f u t i l i z i n g
a more complicated possible
which catalyzes
reactions.
the d i r e c t c o u p l i n g of PP.
( P o l y p h o s p h a t e ) n + n P.
phosphorolysis [ N M P ] n + n P.
> n(NDP)
cycle
104 k.
NDP
phosphorylation n (NDP) + ( P o l y p h o s p h a t e )
The p r o p o s e d "friction", "cheap",
reaction i.e.
cycle
>
n(NTP)
is a c l o s e d one.
w i t h minimal
energy
It
losses.
a s was p r e d i c t e d many y e a r s
can
The
a g o by F.
r o t a t e w i t h a minimal
i n f o r m a t i o n would
be
Crick.
Acknowledgements This
s t u d y was c a r r i e d
as p a r t o f
from the Jewish Agency, helpful
advices
r e s e a r c h program supported
Jerusalem.
and D r s .
We w i s h
Tatarskaya
to t h a n k M r .
and S h o r e q f o r
by a
grant
Z. Voloch
the g i f t s
of
for
enzymes.
Summary Heat e f f e c t s poly-A
computed. reaction
Additional
papers
reactions
phosphorolysis,
hydrolysis,
After
of
cycle
the
f r o m ADP m o l e c u l e s
reactions AH f o r
o f ADP and these
and
poly-A
reactions
a scheme was p r o p o s e d o f
were a
closed
turnover.
Note has
to proceed
been f i n i s h e d
932
(1971).
the mechanism p r o p o s e d reaction
cycle
remains open, cells
and/or
o u r a t t e n t i o n was a t t r a c t e d
o f ATP f r o m ADP and p y r o p h o s p h a t e
in s p i n a c h c h l o r o p l a s t s
Ingrid,
rubrum c h r o m a t o p h o r e s
different
for
t h e m-RNA
in which the s y n t h e s i s
question
as
synthesis
of data obtained
performing
Specht-Jlirgensen
the
as well
On t h e b a s i s
the m a n u s c r i p t
Comm.,
poly-A
were measured and t h e v a l u e s o f
demonstrated
of
of
FEBS L e t t e r s
(Keister,
249
D., Minton,
(Bachofen,
(1968) N.J.,
and
R.,
the 3rd s t e p o f
involving but
it
under d i f f e r e n t
that
had
been
Lutz,
H. ,
Biochem.Biophys.Res.
t h e c y c l e on F i g .
the p o l y p h o s p h a t e s
is p o s s i b l e
in f a v o u r 1 rather
condensation.
b o t h ways a r e u s e d
conditions.
two
i n R h o d o s p i r i 1 lum
T h a t c a n be r e g a r d e d a s an e v i d e n c e for
to
The by
of than
105 References 1. Levinthal,C., Keynan,A., Higa,A.: Messenger RNA turnover and protein synthesis in B.subtilis inhibited by actinomycin D. Proc.N.A.S. 48, 1631-1638 (1962). 2. Levinthal,C., Fan,D.P., Higa,A., Zimmermann,R.A. : The decay and protection of messenger RNA in bacteria. Cold Spring Harbor Symposia on Quantitative Biology 28, 183-190 (1963). 3. Leive,L.: RNA degradation and the assembly of ribosomes in actinomycin-treated Escherichia coli. J.Mol.Biol.13, 862-875 (1965). 4. Mangiarotti, G., Schlessinger, D. : Polyribosome metabolism in Escherichia coli. II. Formation and lifetime of messenger RNA molecules, ribosomal subunit couples and polyribosomes. J.Mol. Biol. 29, 395-418 (1967). 5. Kennell,D.: Titration of the gene sites on DNA by DNA-RNA hybridization. II. The Escherichia coli chromosome. J.Mol.Biol. 34, 85-103 (1968). 6. Salser,W., Janin,J., Levinthal,C.: Measurement of the unstable RNA in exponentially growing cultures of Bacillus subtilis and Escherichia coli. J.Mol.Biol. 237-266 (1968). 7. Norris,T.E., Koch,A.L.: Effect of growth rate on the relative rates of synthesis of messenger, ribosomal and transfer RNA in Escherichia coli. J.Mol.Biol. 64, 633-649 (1972). 8. Georgiev,G.P.: On the structural organization of operon and the regulation of RNA synthesis in animal cells. J.Theor.Biol. 25, 473-490 (1969). 9. Tatarskaya,R.I., Lvova,T.N., Abrossimova-Amelyanchik,N.M., Korenyako,A.I., Bayev,A,A.: 5-P-Forming exonuclease from Actinomyces sp. of coelicolor group, strain nr.5 (exonuclease A5). Purification and some properties. Eur.J.Biochem. 15, 442-449 (1970). 10. George,P., Rutman,R.J.: The "high energy phosphate bond" concept. Progress in Biophysics and Biophysical Chemistry 10, 2-53 (1960). 11. Peller,L.: In vitro RNA synthesis should be coupled to pyrophosphate hydrolysis. Biochem.Biophys.Res.Comm. 63, 912-916 (1975).
106 12. Baltscheffsky,M.: Inorganic pyrophosphate as an energy donor in photosynthetic and respiratory electron transport phosphorylation systems. Biochem.Biophys.Res.Comm. 28, 270-276 (1967). 13. Baltscheffsky,M.: Energy conversion-linked changes of caratenoid absorbance in Rhodospirillum rubrum chromatophores. Arch.Biochem. Biophys. J30, 646-652 (1969). 14. Keister,D.L.: - - - . Discussion following the paper: Baltscheffsky, M., Baltscheffsky,H., Stedingk,L.V.von: Light-induced energy conversion in the inorganic pyrophosphatase reaction in chromatophores from Rhodospirillum rubrum, in: Energy conversion by the photosynthetic apparatus. Brookhaven Symposia in Biology 19, 255-257 (1966). 15. Kornberg,A., Kornberg,S.R., Slimms, E.S. : Metaphosphate synthesis by an enzyme from Escherichia coli. Biochim.Biophys.Acta 20, 215-227 (1956). Kornberg,S.R.: Adenosine triphosphate synthesis from polyphosphate by an enzyme from Escherichia coli. Biochim.Biophys.Acta 26, 294-300 (1957). 16. Cole,J.A., Hughes,D.E.: The metabolism of polyphosphates in Chlorobium thiosulfatophilum. J.gen.Microbiol. 38, 67-72 (1965).
3. Microbiological Calorimetry
3.1 Microcalorimetric Studies of Micro-Organisms A.E. Beezer
It a p p e a r s a p p r o p r i a t e at this t i m e to i n i t i a t e a d i s c u s s i o n on the d i r e c t i o n s in w h i c h m i c r o c a l o r i m e t r i c s t u d i e s of m i c r o b i o l o g i c a l s y s t e m s a r e going. T h i s w i l l r e q u i r e an a s s e s s m e n t of s o m e p u b l i s h e d w o r k and s u g g e s t i o n s c o n c e r n i n g s o m e of the a d v a n t a g e s and p r o b l e m s a s s o c i a t e d w i t h t h i s new m e t h o d o l o g y . D u r i n g the d e v e l o p m e n t of the d i s c u s s i o n s o m e p r a c t i c a l applications will be d e s c r i b e d a s will s o m e , a s yet, unexplored possibilities. C a l o r i m e t r y i s , a s h a s o f t e n b e e n o b s e r v e d , a g e n e r a l and n o n - s p e c i f i c r e a c t i o n p r o p e r t y . T h i s p r o p e r t y h a s b e e n known and e x p l o i t e d f o r m a r y y e a r s b y c h e m i s t s (1) but it i s only s i n c e the i n t r o d u c t i o n of t r u e m i c r o c a l o r i m e t e r s (2) that the p o t e n t i a l of m i c r o c a l o r i m e t r i c s t u d i e s of m i c r o b i o l o g i c a l s y s t e m s h a s s t a r t e d to be e x p l o r e d . T h e g e n e r a l i t y of the m e t h o d h a s l e d to the p r o p o s a l (3) that m i c r o c a l o r i m e t r y could be u s e d to d e t e c t the p r e s e n c e of l i f e on p l a n e t s o t h e r than E a r t h . T h e p r o p o s a l i s b a s e d upon the f a c t that the c o m p l e x s e q u e n c e and c o n j u n c tion of c h e m i c a l e v e n t s that i s m e t a b o l i s m r e s u l t s in h e a t e v o l u t i o n and to the r e c o r d i n g of a c o m p l e x t h e r m o g r a m . T h e proposal w a s t e s t e d by i n c u b a t i n g s a m p l e s of M e x i c a n d e s e r t dust (and s p e c i f i c o r g a n i s m s ) in c o m p l e x o r g a n i c m e d i u m within a c a l o r i m e t e r . T h e s e i n v e s t i g a t i o n s f o r e c a s t a m o r e r e c e n t and g e n e r a l a p p l i c a t i o n of m i c r o c a l o r i m e t r y n a m e l y the i d e n t i f i c a t i o n of m i c r o - o r g a n i s m s (4, 5, 6). T h e r e p o r t s d e s c r i b e o v e r 200 c l i n i c a l l y s i g n i f i c a n t b a c t e r i a w h i c h it i s c l a i m e d m a y be d i f f e r e n t i a t e d on the b a s i s of t h e i r t h e r m o -
110
g r a m s . The instrument used in these studies was a 50 channel batch type device employing sealed plastic ampoules. Typically thermograms show, i n i t i a l l y , an apparent exponential i n c r e a s e in heat output rate followed by peaks and troughs. It is the magnitude and timing of these features which allows differentiation. However the authors have attempted to broaden the utility of the technique by discussion of the feature detail of the thermograms in t e r m s of specific metabolic events. Some r e s e r v a t i o n s must be expressed about this extrapolation. It is possible that during the 7 - 20 hr t i m e s c a l e of the experiments the b a c t e r i a l c e l l s in a s t a t i c , unstirred c a l o r i m e t e r may sediment. T h i s may in turn induce many secondary e f f e c t s . The oxygen tension (which is not controlled) will vary throughout the medium (incidentally obligate a e r o b e s will not yield a thermogram under these conditions) as may all other properties of the system e. g. pH, s u b strate concentrations, osmotic tension e t c . T h e s e purely physical events will/may have r e g i s t r a b l e heat e f f e c t s . Overall therefore it would appear that thermogram detail will not e a s i l y be discussed in metabolic t e r m s if the incubation has been conducted in sealed unstirred f e r m e n t o r s . If though identification is the sole objective of the investigation then the limitations
outlined above will not be important provided that the p r e -
vious history of the c e l l s does not influence the observed thermogram. T h e r e is
preliminary evidence (7) that the source from which the orga-
nism is derived does indeed markedly influence the resultant thermogram. T h i s point h a s , as yet, not been adequately explored. Attempts to improve differentiation (perhaps only in the limited sense described above) have to date been based upon variation of carbon source e . g. changing glucose for l a c t o s e . It is possible, though, to control detail in the thermogram in another way namely by control of the oxygen tension (8) from z e r o to saturation. The magnitude and p r e s e n c e of peaks in the thermogram can be controlled, for example in Kluyvero-
Ill
myces f r a g i l i s , by varying the saturatin gas flow from N^ to a i r to oxygen ( F i g s . 1, 2, 3). T h i s type of experiment has been performed in a flow m i c r o c a l o r i m e t e r the operation of which has been described (9). T o explain the detail in the
Fig. 3
112 thermogram r e q u i r e s the most careful chemical analysis to identify the disappearance of medium constituents and the appearance of metabolites as a function of time. Such experiments have yielded another cautionary observation - a thermogram containing a thermoneutral period which was accompanied by total depletion of all added oxygen. T h i s means a r e a c tion was proceeding but no evidence of its p r o g r e s s could be deduced from the t h e r m o g r a m . The reasons for this a r e not yet c l e a r but the observation s e r v e s to illustrate that "no heat means no p r o c e s s " is not true. On balance it would seem that absolute identification may not be possible but that c h a r a c t e r i s a t i o n may indeed be r e a l i s a b l e . B y this it is meant that in situations where strain maintenance is important e. g. bakery, b r e w e r y , cheese making e t c . then c a l o r i m e t r y may provide a rapid, convenient and unique way of ensuring continuity of s t r a i n . T h i s is because the background of the organisms may be regarded as constant. Moreover such simple, rapid experimentation may allow the investigation of a l t e r native strains of potential industrial utility on the b a s i s of thermogram type. E a r l y evidence (10) suggests that yeasts suitable for differing c o m m e r c i a l purposes show distinctive and p r o c e s s c h a r a c t e r i s t i c thermog r a m s . T h i s hypothesis remains to be thoroughly explored in detail. Again it is apparent that the thermogram detail a r i s e s , in part, from the decline in consumption of one component followed by the onset of metabol i s m of another medium constituent. T h i s sequence of, say, sugar m e t a bolism (see F i g . 4) is a traditional way (11) of speciating y e a s t s . Knowledge of the sequence and the r a t e s of the p r o c e s s e s involved a r e of i m portance in industrial p r o c e s s e s . Enlarging upon this theme of thermogram detail and medium constitution is
should be obvious that the m i c r o c a l o r i m e t r i c approach allows a uniqae
and hopefully sensitive approach to medium design. Many r e c i p e s for media involve up to 40 or so constituents of which many appear to be present for uncertain r e a s o n s . In addition variable components such as yeast e x t r a c t , beef e x t r a c t e t c . appear in many medium designs.
113
lOOrnl CH5%> GLUCOSE 0 - 0 5 % GALACTOSE 0-05 MALTOSE 0-0S°h SUCROSE 0-05 °h LACTOSE CH ml SACC. FRAGILIS
Fig. 4 It h a s b e e n known f o r s e v e r a l y e a r s (12) that e x p o n e n t i a l h e a t output r a t e s h o u l d a c c o m p a n y e x p o n e n t i a l g r o w t h in the i n c u b a t i o n . T h u s by o b s e r v a t i o n of the e f f e c t s on the t h e r m o g r a m of s u p p l y i n g o r w i t h d r a w i n g m e t a b o l i c n u t r i e n t s one m a y i n v e s t i g a t e m e d i u m r e q u i r e m e n t s - p a r t i c u l a r l y i m p o r t a n t in this context a r e the t r a c e c o m p o n e n t s and v i t a m i n s . Such a s e r i e s of e x p e r i m e n t s i s i l l u s t r a t e d in F i g s . 5 - 7 w h e r e the e f f e c t of s u p p l y i n g l i m i t e d v i t a m i n s ( F i g s . 6 and 7) can b e c o m p a r e d with the t h e r m o g r a m o v s e r v e d when y e a s t e x t r a c t i s substituted f o r d e f i n e d v i t a m i n content (13). F u r t h e r p o s s i b i l i t i e s e x i s t in the u s e s of m i c r o c a l o r i m e t r y in m e d i u m i n v e s t i g a t i o n s s u c h a s the r a p i d i n v e s t i g a t i o n of the p o t e n t i a l f a c t o r s r e s u l t i n g in a c o m m e n s a l o r g a n i s m b e c o m i n g p a t h o g e n i c . Since by d e f i n i tion t h i s i n v o l v e s a d i f f e r e n t m e t a b o l i s m then t h i s e f f e c t s h o u l d be o b s e r v e d in the t h e r m o g r a m . E x t e n d i n g the d i s c u s s i o n of m e t a b o l i c m o d i f i e r s f u r t h e r it should be a p p a r e n t that a n t i b i o t i c m o d e of a c t i o n s t u d i e s m a y u s e f u l l y be r e s e a r c h e d . F o r e x a m p l e 5 - f l u o r o c y t o s i n e i s a n a n t i f u n g a l a n t i b i o t i c which
114
Fig. 6
h a s b e e n shown to a c t (14) by i n t e r f e r i n g with RNA s y n t h e s i s in c o n t r a s t to the polyene f u n g a l s which a c t upon the m e m b r a n e . T h i s d i f f e r e n c e m a y be s e e n q u a l i t a t i v e l y (13) by c o m p a r i s o n of the r e l e v a n t t h e r m o g r a m s ( F i g s . 8 and 9). T h e l o n g e r t i m e r e q u i r e d f o r a c t i o n of the 5 F C and i t s q u a s i - f u n g i s t a t i c a p p e a r a n c e f o r s e v e r a l h o u r s i s s t r o n g l y s u g g e s t i v e of a d i f f e r i n g m o d e of a c t i o n f r o m the p o l y e n e s .
115
Addn. of
5FC
Fig. 8
HEAT
TIME (MINS.)
Fig. 9
F r o m the observation of the effect of an antibiotic upon a growing culture of yeast it is but a short step to the investigation of a possible antibiotic a s s a y based upon m i c r o c a l o r i m e t r y . Such a technique has been e s t a blished for the polyene antibiotics (15). T h e general features of the method a r e summarised in F i g . 9. Y e a s t c e l l s stored in liquid nitrogen (9) when inoculated in to buffered glucose yield a zero order kinetic type reaction (illustrated as control in F i g . 9). In the p r e s e n c e of antibiotic the other curves a r e obtained. Measurement of the time for the thermogram to fall to some pre-determined level is the p a r a m e t e r recorded. F e a t u r e s of the technique compared to the c l a s s i c a l agar plate diffusion technique a r e listed in the T a b l e . The m i c r o c a l o r i m e t r i c a s s a y is
116 simple and rapid. It does not as yet have the throughput capacity of the a g a r plate diffusion method.
Reproducibility
%
Lowest determined concentration
unit/ml
Range
unit/ ml
T i m e per a s s a y
h
Micro calorimetrv
A g a r plate diffusion
3
5-10
0.1
20
0.1-100
20-100
1
16
Inspection of F i g . 9 indicates that the thermogram contains information on the rate of the interaction of the antibiotic with the yeast c e l l s . T o date it has not been possible to deduce any simple relationship from these curves however the information is there. Likewise the figures illustrated e a r l i e r of growth p r o c e s s e s in yeast contain kinetic data r e lating to the sequential consumption of medium constituents. Application of the known relationships (16, 17) to these situations has not been s u c c e s s f u l due to the complexity of the s y s t e m s . H'owever it must be one of the objectives of modern microbiological r e s e a r c h to establish the f o r mal relationships between the organism and the medium. Conclusion Inevitably a new methodology appears to find its initial application in the m o r e qualitative and applied aspects of r e s e a r c h . The potential of the m i c r o c a l o r i m e t r i c approach to the study of microbiological subjects in its quantitative aspects is as yet l a r g e l y untouched. The p o s s i b i l i t y of deriving both thermodynamic and kinetic p a r a m e t e r s from one e x p e r i ment on such complex s y s t e m s is appealing. The principal shortcoming at the present moment appears to be lack of p r e c i s e analytical data to allow definition of the p r o c e s s e s studied. Until p r e c i s e thermodynamic
117
e q u a t i o n s c a n b e w r i t t e n t h e n the g o a l s will p r o v e e l u s i v e .
Furthermore
the i n t e r p r e t a t i o n of the k i n e t i c d e t a i l w i l l r e q u i r e a m o r e c o m p l e t e u n d e r s t a n d i n g of a d s o r p t i o n , t r a n s p o r t and r e a c t i o n (as a m i n i m u m ) processes.
References 1. T y r r e l l , H. J . V . , B e e z e r , A . E : T h e r m o m e t r i c T i t r i m e t r y , m a n and H a l l , L o n d o n (1968)
Chap-
2. Monk, P . W a d s ö , I . : A flow m i c r o r e a c t i o n c a l o r i m e t e r , A c t a C h e m . S c a n d . 22, 1842-1852 (1968) 3. B e c h m a n I n s t . I n c . , C o n t r a c t N o . NAS 2 - 3 4 7 7 , F i n a l R e p o r t (1966) 4 . B o l i n g , E . A . , B l a n c h a r d , G. C . , R u s s e l l , W . J . : B a c t e r i a l i d e n t i f i c a t i o n by m i c r o c a l o r i m e t r y , N a t u r e 241, 2 7 2 - 2 7 3 (1973) 5. R u s s e l l , W . J . , F a r l i n g , S. R . , B l a n c h a r d , G. C., B o l i n g , E . A . : I n t e r i m r e v i e w of m i c r o b i a l i d e n t i f i c a t i o n by m i c r o c a l o r i m e t r y , in: M i c r o b i o l o g y - 1975 E d . : S c h l e s s i n g e r , D. , A m . S. M i c r o b i o l . , W a s h i n g t o n (1975) 6. R u s s e l l , W . J . , Z e t t l e r , J . F . , B l a n c h a r d , G. C . , B o l i n g , E . A . : B a c t e r i a l i d e n t i f i c a t i o n by m i c r o c a l o r i m e t r y , in: New A p p r o a c h e s to the I d e n t i f i c a t i o n of M i c r o o r g a n i s m s , E d . H e g e n , C . - G . , I l l e n i , T . , W i t e y , New Y o r k (1975) 7. B e e z e r , A . E . , B e t t e l h e i m , K. A . , Shaw, E . J . , u n p u b l i s h e d o b s e r v a t i o n s (1976) 8. N e w e l l , R . D. : B i o a s s a y of N y s t a t i n , P h . D . H e s i s , L o n d o n U n i v e r s i t y (1975) 9. B e e z e r , A . E . , N e w e l l , R . D. , T y r e l l , H. J . V. : A p p l i c a t i o n of flow m i c r o c a l o r i m e t r y to a n a l y t i c a l p r o b l e m s : T h e p r e p a r a t i o n , s t o r a g e and a s s a y of f r o z e n i n o c u l a of S a c c h a r o m y c e s c e r e v i s i a e , J . A p p l . B a c t e r i o l . 41_, 1 9 7 - 2 0 7 (1976) 10. B e e z e r , A . E . , N e w e l l , R . D. , T y r r e l l , H. J . V . : m a n u s c r i p t in p r e p a r a t i o n (1976) 11. T h e Y e a s t s , E d . L o d d e r , J . , N o r t h H o l l a n d , A m s t e r d a m (1971) 12. F o r r e s t , W . W. : B a c t e r i a l m i c r o c a l o r i m e t r y , in: B i o c h e m i c a l M i c r o c a l o r i m e t r y , E d . B r o w n , H. D. , A c a d e m i c P r e s s , L o n d o n (1969)
118 13. B e e z e r , A . E . , N e w e l l , R . D. , C a w s o n , R . A . : u n p u b l i s h e d o b s e r v a t i o n s (19 76) 14. B e g g s , W. H. , S a r o s i , G. A . , S t e e l l , N . M . : Inhibition of p o t e n t i a l ly p a t h o g e n i c y e a s t l i k e f u n g i by c l o t r i m a z o t e i n c o m b i n a t i o n with 5 - f l u o r o c y t o s i n e o r A m p h o t e r i c i n - B , A n t i m i c r o b i a l A g e n t s and C h e m o t h e r a p y . 2, 8 6 3 - 8 7 1 (1976) 15. B e e z e r , A . E . , N e w e l l , R . D. , T y r e l l , H . J . V. : A p p l i c a t i o n of f l o w m i c r o c a l o r i m e t r y to a n a l y t i c a l p r o b l e m s . T h e b i o a s s a y of n y s t a t i n bulk m a t e r i a l , A n a l y t . C h e m . , in p r e s s (1976) 16. B e e z e r , A . E . , T y r r e l l , H. J . V. : A p p l i c a t i o n of flow m i c r o c a l o r i m e t r y to b i o l o g i c a l p r o b l e m s . P a r t 1. T h e o r e t i c a l A s p e c t s , S c i e n c e T o o l s , lj), 1 3 - 1 6 (1973) 17. B i l t o n e n , R . L . , J o h n s o n , R . E . : D e t e r m i n a t i o n of r e a c t i o n r a t e p a r a m e t e r s by flow m i c r o c a l o r i m e t r y , J . A m . C h e m . Soc. 25, 2 3 4 9 - 2 3 5 5 (1975)
Dr. A. E. Beezer Chemistry Department Chelsea College U n i v e r s i t y of L o n d o n M a n r e s a Road L o n d o n SW 3 6 L X , U . K.
3.2 Calorimetric Studies of Yeast Metabolism under Nongrowing Conditions T. Fujita, K. Nunomura INTRODUCTION Calorimetric studies on growth, and metabolism in yeast have been systematically carried out by several workers
(1,2,3),
however, many of the details of the thermogram still remain unsolved in relation to the individual processes of metabolism. For the purpose of this study, it is often more advantageous to use nongrowing conditions, because metabolic processes then occur without involving complicating factors of growth. The experimental results can be analyzed after several hours. This paper describes a calorimetric study on some metabolic processes in yeast under nongrowing conditions by using specially designed calorimeter for microbiological processes. MATERIALS AND METHODS Calorimeter and experimental procedure The calorimeter and experimental procedure used have been described in details elsewhere (U). The apparatus is a rotation calorimeter of the conduction type, with a maximal sensitivity of 30 mm deflection of recorder pen for a heat flow of 1 cal/hr and the time constant of the response is 8 min. The culture vessel is a short-necked cylindrical flask made of Pyrex glass with a capacity of
ml and is usually charged with 5 ml of
sample in order to assure efficient aeration and agitation. tPresent address: Thermochemistry Laboratory, Chemical Center, Lund University, S-220 07 Lund, Sweden
120 The
inoculum
mixed
with
reaction system
previously
the
in
medium
the
in the
by
active
was
rotated
The
was
aerated
culture air
is
pumped
passing
through
between
the
and
Excess
air
and
tubes.
The
anaerobic
atmosphere
Organism The
of
and
yeast
studied
Dr.
Gunge.t
16
times
metric under
cells
with
phosphate
The
using
an
aeration
of
15 m l / m i n
the
sink
unit, of
culture
gas
are
the
and
aerobic
control the
and
air
via to
in
fills
the
space
and
cotton-wool
flow
through
performed
which
after
calorimeter
allowed were
assembly
under
plugs. outlet
an
cerevisiae)
(pH
strain
maintained
Hinshelwoods by
and
5.6).
Unless
the
on
a
parent
provided
agar
slants
synthetic' m e d i u m
centrifugation,
water
with
was
kindly
suspended
in
otherwise
washed
(5)•
washed
by and After three
potassium noted,
suspension
were
caloricarried
out
conditions.
analyses
Since
is
difficult
without
measurement,
was
harvested
distilled buffer
any
to
used.
and
maintained
The
culture in
remove
thermal
a parallel
was
tMitsubishi
the
vessel
experiments
strain
were
Chemical
vessel
a
measurements
a rate
(Saccaromyces
experiments
it
by
a respiratory-deficient
in K i l k e n n y
hours
with
the
culture
of
grown
and
was
nitrogen.
strain T.
compared
During
exchange
exhaust
rotation
wall
continuously.
heat
enters
a partition
the
was
vessel.
at
a heat
lide
spontaneously
in
by
starting
vessel
reference
calorimeter
moist
separated
a
Chemical
disturbance
culture
was
samples
for
contained
similar
from to
the
the
calorimetric
observation in
culture
and
a calorimeter
way.
Industries
Research
Laboratory
analysis vessel
121
F i g . 1 . Time c o u r s e of e n d o g e n e o u s h e a t p r o d u c t i o n "by washed c e l l s of S . c e r e v i s i a e w i t h v a r i o u s amounts o f c e l l s . , under aerobic c o n d i t i o n s , • • • • , u n d e r a n a e r o b i c c o n d i t i o n . F i g u r e s i n d i c a t e t h e d r y w e i g h t of t h e c e l l s . C e l l s s u s p e n d e d i n p h o s p h a t e b u f f e r ( 0 . 5 ml) were d i l u t e d w i t h p h o s p h a t e b u f f e r (1+.5 m l ) .
Glucose method
was and
Turbidity
determined ethanol
of
Spectronic
the
20
was
Endogeneous
heat
A considerable
when
measured
amount
of
heat
added
to
a
is
energy
different
source.
suspensions
The
heat
showing
the
existence
total
was
amount
by
by
the
Glucostat
chromatography.
at
550
nm w i t h
using
0.1
ml
a
Shimazu
microcuvettes.
production
buffer. The
gas
spectrophotometer
DISCUSSION
exogeneous
using
culture
RESULTS AND
S .cerevisiae
enzymatically determined
was of
is produced
s u s p en d i n g Fig.
1
of
ye a s t
produced
un d e r
of
heat
medium in
shows
the
were
the
absence of
thermograms added to
a
o b t a i n ed
phosphate
anaerobic conditions,
anaerob i c proc esses in c a l c u l at e d
suspension of
whe n a
from
this
microbe
the thermogram
was
122
F i g . 2.
E f f e c t s of temperature on the endogeneous heat production.
F i g . 3. E f f e c t of suspending media on the endogeneous heat production, a, c e l l s suspended in 0.2 M/L NaCl s o l u t i o n , d i l u t e d with d i s t i l l e d water; t>, c e l l s suspended in d i s t i l l e d water (pH ^ - 7 ) , d i l u t e d with water adjusted t o pH 7 by NaOH, r e s u l t i n g pH was 6.1; c , c e l l s suspended in d i s t i l l e d water (pH ^ . 7 ) , d i l u t e d with water adjusted pH 3.1 by HC1, r e s u l t i n g pH was 3 . 3 ; d, c e l l s suspended in b u f f e r , d i l u t e d with b u f f e r . In these experiments the reference v e s s e l contained a s i m i l a r r e a c t i o n , hut without c e l l s , eliminating the e f f e c t of the suspending media.
proportional considered affected tion
the
cell
concentration.
together
with
the
the
depends
to
heat
on t h e
reserve
Although
Forrest
cells
Streptococcus
per
of
unit
in the
(6)
dry weight
no d i f f e r e n c e present
in
fact
production,
than
rate
the
between
experiments.
that
intracellular that
faecalis
lower
produce
higher
relationship,
starvation
indicates
of
reported
that
This
this
energy
of
produc-
sources.
concentrations heat
at
of
a greater
concentrations
samples
markedly heat
different
there cell
rate was
density
123 Pig. 2 shows the time course of the heat production at various temperatures. There is a linear relationship between the total amount of heat and temperature up to
This simple
temperature characteristic supports the view that in this temperature range, heat production may be mainly due to the same processes. It is shown in Fig. 3 that the ionic property of suspending media affects the thermogram. There was no difference in oxygen uptake between these samples, however, the surface of yeast cells have some iogenic groups that have ion-exchange properties, the difference in the heat production therefore may be due to the physico-chemical reaction of yeast cells with suspending media rather than to their physiological response. The results obtained in the present experiments suggest that this heat production may be due to the endogeneous metabolism of the cells adjusting their rate of metabolism in accordance with the change in their environmental condition. It seems to be analogus to the heat of dilution first reported by Forrest (7) and later by Boss (8). As washed cells of S. cereviasiae have a higher level of endogeneous metabolism than that of bacteria, special attention should be paid to this heat production when interpreting the initial part of the thermogram. Heat production of glycolysis
When an exogeneous substrate is added to a washed suspension of yeast cells the heat production subsequently observed may have components due to glycolysis and endogeneous metabolism. Fig.
shows the time course of aerobic glycolysis by yeast in
which turbidity, glucose and ethanol concentrations found in the culture apparatus are compared with a corresponding thermogram obtained with the calorimeter. Glucose was taken up within one hour and ethanol formed by the glucose fermentation was exhausted after about 6 hours. The small increase in turbidity
124 dq/dt
(cal
h-')
ethanol
glucose
(100
ppm)
('/»)
20toots-
10•
50
5-
0J
0
2
0
6
4
d
10
time
i
(h)
0
l
14
F i g , it. Time course of the aerobic g l y c o l y s i s by washed c e l l s of S . c e r e v i s i a e . a , thermogram; b , glucose concentration; c , ethanol concentration; d, t u r b i d i t y . Cells (8 mg dry weight) suspended in b u f f e r were added t o the b u f f e r containing glucose ( 0 . 2 % V/V).
was n o t due t o t h e c e l l m u l t i p l i c a t i o n
b u t t,o t h e i n c r e a s e
c e l l rolurne a s e x a m i n e d by m i c r o s c o p i c
observation.
gram shows t h r e e analyses uptake.
distinct
the f i r s t
phase
The r e s u l t s
second phase i s
phases.
From t h e r e s u l t s
due t o t h e c o n s u m p t i o n o f e t h a n o l ,
f o l l o w e d by t h e t h i r d p h a s e of e n d o g e n e o u s of the f i r s t
thermogram of g l y c o l y s i s , sugars
or g l y c o l y s i s
S.
cannot
ferment
sorbose,
however, sugars
t h a t with g l u c o s e , heat
production.
substantial
(Fig.
5)-
the
which
is
phase observed in
the
were
g l u c o s e was r e p l a c e d by n o n -
metabolizable
of t h e s e
glucose that
metabolism.
the f o l l o w i n g experiments
c a r r i e d o u t i n which e i t h e r cerevisiae
suggest
thermo-
glucose
seems t o be a s s o c i a t e d w i t h
of the e t h a n o l a n a l y s e s
To e l u c i d a t e t h e n a t u r e
The of
in
was i n h i b i t e d by
3-0-methyl g l u c o s e ,
inhibitors.
galactose
h e a t was p r o d u c e d by t h e
The t h e r m o g r a m s
are d i f f e r e n t
showing a s i n g l e b r o a d peak with a
and
addition from smaller
F i g , g . Thermograms f o r t h e u p t a k e of n o n - m e t a b o l i z a b l e s u g a r s , a , 3 - 0 methyl glucose under aerobic c o n d i t i o n ; b , 3-0-methyl glucose under anaerobic condition; c , galactose; d, sorbose. F i g . 6 . E f f e c t s of m e t a b o l i c i n h i b i t o r s on t h e thermogram of g l y c o l y s i s , a , c o n t r o l ; b , w i t h 750 umole KCN; c , u n d e r a n a e r o b i c c o n d i t i o n ; d, w i t h 60 pmole CCCP.
Chemical sugars
analyses
were t a k e n
inhibitors phase but
take
subsequent
results
thermogram uptake
to
of
of
it
considerable
up by y e a s t .
have marked
appears
the
these
show t h a t
effects
As s h o w n on t h e
a similar
heat
seems p r o b a b l e
aerobic
glucose.
glycolysis
The t i m e
is
that is
course
in Fig. in
each
hardly the
6
the
of
these
metabolic The
first
the
curves,
observed.
first
mainly of
of
thermogram.
pattern
production
amounts
phase
associated glycolysis
From
of
the
with
the
suggests
126 that at an early stage, glucose is taken up via a mechanism coupled to the endogeneous metabolism and the second phase depending on the glycolysis may begin at nearly the same time as glucose uptake. The thermograms shown in the present paper have not been reported by other investigators, probably because the two phases overlap and cannot be distinguished separately at a relatively low cell concentration and a high glucose concentration. SUMMARY A considerable amount of heat was produced when a suspension of yeast was added to a suspending medium in the absence of an exogeneous energy source. The amount of heat depended on cell concentration, temperature, and environment of the microbe. Characteristic patterns of heat production were found when suspensions of yeast were added to phosphate buffer containing glucose. Experiments with non-metabolizable sugars and the effects of inhibitors suggested that the early phase of the reaction was mainly associated with the uptake of glucose.
REFERENCES 1.
Battley, E.H.: Enthalpy change accompanying the growth of Sacchromyces cerevisiae. Physiol. Plant. J_3, 62&-6k0
2.
(i960).
Lamprecht, I., Schaarschmidt, B., Stein, W.: Mikrokalorimetrische Untersuchungen zum Stoffwechsel von Hefen. III. Betriebsstoff Wechsel in Glucosepuffer. Biophysik 10, 177-186 (1973).
3.
Murgier, M., Beiaich, J.P.: Microcalorimetric
determination
of the affinity of Saccharomyces cerevisiae for some carbohydrate growth substrates. J. Bacteriol. 105, 573-579 (1971 ) •
127 Fujita, T., Nunomura, K., Kagami, I., Nishikawa, Design and testing
of a c a l o r i m e t e r
u s e s . J. Gen. A p p l . M i c r o b i o l . , 5.
Kilkenny, B.C., Hinshelwood, London, 138,
6.
7.
microbiological
2 2 , it3~50
(1976).
S . C . : P r o c . R o y . S o c . B.
( 1951 ) .
Forrest, W.W.: Bacterial
Calorimetry.
In:
Biochemical
microbiology,
ed. b y B r o w n , H . D . , A c a d e m i c P r e s s ,
York,
(1969) .
165-180
Forrest, W.W., Walker, D.J.: energy
of m a i n t e n a n c e .
13 , 2 1 T - 2 2 2 8.
375
for
X.:
Calorimetric measurements
Biochem. Biophys.
study
of t h r o m b i n
Res.
of
Commun.
(1963) .
Ross, P.D., Fletcher, A.P., Jamieson, metric
Hew
G.A.:
of i s o l a t e d b l o o d p l a t e l e t s and other
aggregating
Biochim. Biophys. Acta 313,
in the
agents.
106-118
Microcalori-
(1973).
presence
3.3 Microcalorimetric Measurements of the Heat Production in Partially Synchronous Cultures of Baker's Yeast R. Brettel
The energy metabolism of microorganisms has often been studied with calorimetric methods. All these studies, however, have the difficulty of relating the measured heat effect to a corresponding event on the level of the cells or the culture. This is due to the non-specifity of calorimetry. Usually we need a variety of additional physical, chemical and biological parameters to make calorimetric results more significant, i.e. to relate them to determined external culture conditions or to average physiological cell conditions. But most of these investigations neglect the individual state of the cells, since growing cultures contain a heterogenous mixture of cells in every age of the cell cycle. The aim of our investigations is to relate the turnover of heat to the events of the cell division cycle. For these experiments we used the budding yeast Saccharotnyces cerevisiae, since the appearance and growing of the bud is a convenient visual marker of the position of the cell in the dividing cycle.
130 The sequence of the most important events in the cell cycle of baker's yeast has been well studied [1,2]. The cycle in budding yeast (Fig.1) starts with a single unbudded cell in the Gi interval.
Fig.1 :
Cell cycle of Saccharomyces cerevisiae (adopted from [2])
The end of this interval is marked by the initiation of DNA synthesis (S) and the emergence of the bud, which grows in size throughout the cycle. Nuclear division (ND) and the migration of a nucleus into the bud take place in the second half of the cycle. After cell wall separation the cycle is completed with the production of two unbudded cells.
Preparation of Synchronous Cultures Most of the methods for analyzing the cell cycle are based on examination of either single cells or synchronous cultures. Calorimetrie work with single cells is nearly impossible, owing to the small heat production of the cell and the too low sensitivity of the instruments. Therefore synchronously dividing cultures are necessary. There are two main ways of making synchronous cultures: selection and induction [2], In selection methods uniform cells are separated physically from a heterogenous culture and grown as a
131 synchronous culture. In induction methods a whole culture is induced to divide synchronously by physical or chemical treatments. We induced partially synchronous growth in a continuous chemostat culture with a method described in [3]. In the chemostat the cell culture is fed with fresh medium at a constant rate and the same amount of culture suspension flows out of the vessel. This way the culture comes to a steady-state during which all important parameters of the culture remain constant. Nevertheless, continuous cultures may show metabolic oscillations which are due to partially synchronous growth. The mechanism of this synchronisation is not well understood at present but it can be induced by starvation or occurs spontaniously
[4], Fig.2 shows the stable oscillations of
heat evolution in a continuous culture which are produced by changes in the metabolic activity due to synchronous growth. The method produces 30 to 50^ synchrony at a rather high cell concentration. However, it should be considered that the cells grow under special physiological conditions, i.e. under a lack of exogenous substrate.
During the appearance of synchrony oscillations we determined by microscopic inspection the percentage of initial budding cells over several cell cycles. Although the definition of initial budding cells may cause some subjective errors, we found this method most successful to determine the cycle position of synchronously dividing cells.
Fig.2: Thermogramme of a partially synchronous chemostat culture of Saccharomyces cerevisiae Fermentor System and Colorimeter In our experiments we used a combination of a fermentor system and a flow-microcalorimeter
[5,6], Fig.3 shows a simplified scheme of this
device. The culture is operated outside the calorimeter and only small parts of the culture volume are pumped continuously through the calorimeter. With this method it is easily possible to control the cultivation conditions and to measure additional parameters during the run of the culture. For the measurements we used a heat conduction microcalorimeter (LKB) with a tubular flow cell. The fermentor system is an aerated and stirred 1 liter laboratory fermentor (BIOTEC) equipped with electrodes and devices to control pH-
133 values and to measure oxygen concentration in the culture.
Fig,3:
Scheme of the arrangement of a chemostat combined with a flow-microcalorimeter
The cell suspension from the fermentor is pumped continuously through a device to measure the turbidity and thereafter through the calorimeter. To avoid sedimentation of the yeast cells and to guarantee sufficient oxygen supply in the calorimeter vessel and in the tubing, the flow stream is mixed half and half with air. This arrangement, however, produces a noise which interferes with the real signal of the calorimeter. Therefore we had to damp the voltage output with a capacitor which limits the device to slow processes. Another peristaltic pump is used to take samples for the determination of dry mass, substrate or metabolite concentration and oxygen consumption with a polarographic method. The equipment for the continuous culture is a conventional chemostat. Fresh medium is
134 supplied to the fermentor vessel at constant rates with a peristaltic pump, and the same volume of the cell suspension leaves the system through an overflow tube.
Results and Discussion Fig.4 gives the results of a synchronously growing culture with glucose as limiting substrate. It shows the part of a thermogramme
Fig.4:
Glucose limited chemostat culture of Saccharomyces cerevisiae. Percentage of initial budding cells NIBC/N, rates of heat generation Q and of oxygen consumption RQJ as functions of cell cycle time. Cell cycle time is given in fractions of a complete cell cycle. For convenience the cycle's start and stop were set at the maximum values of heat evolution.
H5 which represents a complete cell cycle. The time is indicated in fractions of a complete cell cycle. At a sudden point the rate of heat evolution Q increases steeply to a 2.5 fold value. The rate of oxygen consumption RO2 likewise rises, but without the characteristic peak of the thermogramme. Parallel to these values the percentage of initial budding cells N T D _/N shows a strongly XdC marked maximum of about 305&. This means that the activity of the metabolism increases considerably a short time before the bud appears. Accordingly the cell has to achieve a high rate of biosynthesis and of structural changes to prepare for the doubling process and the emergence of a bud within a short time. The required energy is released by the degradation of reserve carbohydrates, which are stored as trehalose and glycogen inside the cell [3,4]. It is proved that the endogenous carbohydrate reserves are mainly catabolized via the same pathways as exogenous substrates [7], The increase in oxygen consumption indicates that a large amount of the intensified metabolism is due to oxidative degradation. During the time of most intense metabolism, however, the degradation increases so much that the capacity of the Krebs cycle is too small. Part of the reserves is then catabolized only fermentatively to ethanol, which is secreted into the medium [3]. This becomes evident when we look on the quotient of heat generation and oxygen consumption (Fig.5). For the oxidative degradation of carbohydrates we have a regular value of about 0.47 j/pMol C>2 [8]. As we find higher values here, this means that part of the evolved heat is not released by oxidative processes.
136
Fig.5:
Ratio of heat generation and oxygen consumption Q/Rq2 0 8 function of cell cycle time, calculated from data in Fig.4. The level at 0,47 j / pMol 02 represents an average value for the oxidative degradation of carbohydrates.
We obtained similar results from synchronous yeast cultures which grow on ethanol as sole and limiting substrate (Fig.6). The degree of synchrony is lower but the relation of initial budding cells and heat production shows essentially the same characteristics. The rate of oxygen consumption remains nearly constant. This suggests that again part of the required energy is released from fermentative degradation of reserve carbohydrates, which were synthesized before via gluconeogenesis. Although there is no fermentable exogenous substrate in ethanol limited cultures, fermentation of endogenous reserves takes place.
137
Fig.6:
Ethanol limited chemostat culture of Saccharomyces cerevisiae. Plotting as in Fig.4.
As a further result of these experiments, we found that the period of increased metabolism has a nearly constant length, which is independent of the specific growth rate and the duration of the complete cell cycle. This observation corresponds with results reported in [9] according to which the time from the emergence of the bud till to the separation of the complete cell remains constant. A prolongation of the cell cycle therefore implies a prolongation of the single cell stage only and not of the cell division process itself.
138 References
1. Hartwell, L.H.: Saccharomyces cerevisiae cell cycle. B a c t e r i d . Rev. 38, 164-198 (1974). 2. Mitchison, J.M., Carter, B.L.A.: Cell Cycle Analysis. In "Methods in Cell Biology" (D.M. Prescott, ed.), Vol. XI, pp. 201-219. Academic Press, New York 1975. 3. KUenzi, M.T., Fiechter, A.: Changes in Carbohydrate Composition and Trehalase-Activity During the Budding Cycle of Saccharomyces cerevisiae. Arch. Mikrobiol. 64, 396-407 (1969). 4. KUenzi, M.: Über den Reservekohlenhydratstoffwechsel von Saccharomyces cerevisiae. Dissertation, ETH, Zürich, 1970. 5. Brettel, R.: Microcalorimetric measurements of the energy utilization in chemostat cultures of Saccharomyces cerevisiae. In: "Proc. Fourth Intern. Symp. on Yeasts" (H. Klaushofer, U.B. Sleytr, eds.), Vol. 1, pp. 87-88. University of Agriculture, Wien 1974. 6. Brettel, R., Corti, L., Lamprecht, I., Schaarschmidt, B.: Combination of a continuous culture with a flow-microcalorimeter. Stud. Biophys. 34, 71-76 (1972). 7. Eaton, R.E. : Endogenous metabolism of reserve deposits in yeast. Ann. N.A. Acad. Sei. 102, 678-687 (1963). 8. Minkevich, I.G., Eroshin, V.K.: Productivity and Heat Generation of Fermentation Under Oxygen Limitation. Folia microbiol. 18, 376-385 (1973). 9. Meyenburg, H.K.v.: Der Sprossungszyklus von Saccharomyces cerevisiae. Path. Microbiol. 31_, 117-127 (1968).
3.4 Quantitative Relation between Heat Production and Weight during Growth of Microbial Cultures B. Schaarschmidt, A.I. Zotin, I. Lamprecht
Summary: The proportionality between heat production and the logarithm of the body weight during growth, found valid for higher organisms [l], is checked experimentally for microorgan i s m s (Saccharomyces cerevisiae, Bacillus stearothermophilus).
On comparing data in the literature we found different constants of proportionality (Transition coefficient r) for different o r ganisms under different growth conditions. The results are discussed in view of different efficiencies of metabolism.
Introduction
The theory of Irreversible Thermodynamics [2] assumes direct proportionality between the dissipation function^(specific rate of entropy production) and the specific rate of heat production
q
= ? J.-X. ) ) )
(1)
140 where J. = thermodynamic flow and X. = thermodynamic force. One of the basic concepts of this theory requires a linear dependance between the flows and the
forces
J. = E L..'X. 1 j i] j (L
= phenomenological
(2)
coefficients).
If the theory of irreversible thermodynamics is a p p l i e d to living matter, eq.(2) must hold for the growth of an organism too. In a first approximation growth may be assumed to be determined by one force only. Then the growth equation can be written as J (j
= L - X gg 9
g
(3)
= -p- = specific flow of weight change,index g = growth).
Assuming a phenomenological law of growth
[1]
¿ • g - k - ( V t )
(4)
(P = dry weight,k = constant, T^ = time when P has reached maximum) which has been found valid for growth of animals and man, we obtain
and
X
g
= (T - t ) . m
^
Under consideration of eqs.(5) and (6) the dissipation
function
(1) can be written as q
g
= r-k.(T - t ) 2 "i
2
which can be finally completed if (T ~t) solution of the law of growth
is inserted from the
(4)
q g = r - 2 -log e -log p ( r = transition coefficient given in mW/g).
(6)
141 In a calorimetric experiment on the heat production organism only the total rate of heat production is generated by the basic metabolism metabolism
q . With 9
q
9
of a growing
is recorded, which
q^ as well as by the growth
from eq. (6) follows
q = «L o + q„ g Pm = q Q + r-2-log e -log and putting
(7)
,
A = q o +2r*log e'log P^ ; B = 2r»log
yields
q = A - B -log P .
(8)
By equation (8) a semilogarithmic dependance between the specific rate of heat production and the body weight in a growing organism is stated, contrary to the generally assumed logarithmic dependance (allometric function) log q = a - b-log P
(9)
as was confirmed between the intensity of respiration and weight[l]. The validity of (8) was verified by calorimetric experiments for growth of fish, frog and fowl [3], but not with unicellular organisms. Since to a certain extent there are some similarities between a single multicellular organism and a culture composed of many separate cells, it was considered desirable to prove eq.(8) with respect to microorganisms.
Material and Methods Organisms: In most experiments the diploid yeast strain 211 of Saccharomyces cerevisiae
was used, but in some other experiments
related polyplonts (haploid to hexaploid [4] ) and the thermo-
142 philic bacterium
Bacillus stearothermophilus
were olso used. The
growth medium contained yeast extract (10 g/l), peptone (5 g/l) and glucose (5 to 20 g/l). Calorimeter: The rate of heat production was measured in two different Calvet-microcalorimeters
(Setaram/Franee) with a sensi-
tivity o f 50 jiV/mW and 100 ml working volume or 60 p.V/mW and 10 ml. respectively. In the calorimeter vessel the cultures were stirred under air. The temperature was kept at 30°C for yeast and at 65°C for
B.stearothermophilus . The heat flux during growth is recorded
continuously as a thermogram. A detailed description of the culturing conditions and the calorimetric method was given previously [5]. Weight determination: Two methods were used for calculating the dry weight. With one method each growth experiment in the calorimeter was stopped at another time, the grown mass sampled and determined by drying and weighing. In the second method the optical density 0D of the culture was measured by light guides in the calorimeter vessel simultaneously with heat flux [6] and converted to a scale of dry weight using the direct proportionality: 1 mg/ml = 0.32 0D units for diploid yeast and 0.59 units for
B.stearothermophilus.
Mathematical calculation: Values for the rate of heat production and for the dry weight were taken from the experimental diagrams with a curve analyzer (Stange u. Voss/Germany). By a regression analysis after Pearson the slope B, the transition factor r and the correlation factor for equation (8) were determined. Results Fig.1 gives typical thermograms for growing cultures of the organisms used. After an initial lag-phase due to adaption of the organism to the medium, the heat production rises according to the
143
Fig.1;(T) Thermogram of a growing culture of Saccharomyces cerevisiae at 30°C, (2) corresponding biomass P.(3) Thermogram of Proteus mirabilis (after [9]), ( ^ c o r r e s ponding biomass. X = calculated from eq.(4). exponential growth of the culture. The heat flux reaches its maximum shortly before the energy source (glucose) is consumed and then drops rapidly. For the calculation of equations (8) and (9) only the exponential growth phase was analyzed as nearly all growth took place during this phase. Figure 2 gives typical results in semilogarithmic and Figure 3 in a double logarithmic plotting. Since it is well known that the volume and the dry weight in a yeast cell increase with the degree of ploidy [7] a series of different polyplonts may be regarded as consecutive growth phases of one (artifically composed) organism. In this case only the maximum heat production and the corresponding weight for each polyploid culture were chosen for calculation. The results of our experiments as well as some other data which were calculated from the literature are listed in the table. For all organisms
p [w• (2-x) lactate + x (acetate + carbonate)
The anaerobic state exists when x = 0.
153 Taking into consideration pKa values and enthalpies of ionization (10), the enthalpy change for reaction (1) was calculated from literature data (11) to be AH(phosphate buffer, pH = 6.2) = -(117 + 509x) kJ/mole glucose. For the anaerobic condition AH will be -117 kJ/mole glucose. As the rate of glucose degradation is not affected by the presence of oxygen and the ratio between the heat effect for aerobic and anaerobic conditions, R, is thus given by •n _ 117 + 509* 117 For the culture studied we observed this value to be R = 2.35 leading to a value for x = 0.31 mole. Experimentally we found that 2 - x = 1.67 or x = 0.33 mole. Cells catabolizing glucose in the absence of DHP are observed to effect a transition from a rapid initial rate to a lower rate. The transition is rapid, and has the characteristics of positive feedback so that regulation of glycolysis in this uncoupled condition appears to consist of the organism glycolyzing at a minimum rate. In the presence of OTP the transition does not occur and the cells retain their initial rapid rate of catabolism; the DHP inactivates the normal feedback regulation. The catabolism of glucose is already completely uncoupled in the washed nongrowing suspension and the observed effect of DHP, normally considered as an uncoupler (5), obviously cannot be explained in terms of uncoupling. In growth the addition of DHP was found to increase the rate of glycolysis similarly to the effect of non-growing suspensions, but the specific growth rate of the organism was not affected. The rate of synthesis of new biomass by each existing unit of biomass is thus unchanged so that the same amount of biologically available energy is coupled to synthesis either in the presence or absence of DHP. The effect of DHP cannot be localised more precisely from the present experiments than to an interaction occurring before the production of endogenous pyruvate in the Embden-Meyerhof pathway, since its addition increases only the rate of glycolysis and lactate production; aerobic
154 oxidation of pyruvate is unaffected by DNP. The maximum effect of DNP is a stimulation of anaerobic glycolysis by a factor of about 1.6. This is closely the same as the increased rate of glycolysis found during transient states in physiologically normal cells (12). The great difference in the effect of DNP is its concentration dependence, with a progressive increase to a maximum as the concentration is raised, compared with discontinuous changes observed in physiologically normal cells. It appears then that DNP is progressively removing the feedback control which reduces the rate of glycolysis to a minimum level, while having no other effect on the products of metabolism. Calorimetrie observations are consistent with the hypothesis that no metabolic changes occur, except for increased lactate production.
A more detailed discussion will be reported elsewhere.
ACKNOWLEDGEMENTS This work has been supported by the Swedish Board for Technical Development and the Australian Research Grants Committee.
REFERENCES 1. 2.
Boivenet, P.: These, Universite-d-'Aix-Marseille (1963). Forrest, W.W., Walker, D.J., Hopgood, M.F.: Enthalpy changes associated with the lactic fermentation of glucose, J. Bact. 82, 6 8 5 - 6 9 0 , (1961).
3.
Manderson, G.J.: Ph.D. Thesis, Univ. Qld., Australia (1973).
U.
Monk, P., Wadso, I.: The use of microcalorimetry for bacterial characterization, J. Appi. Bact. 3 8 , 71-71», (1975).
5.
Lehninger, A.L.: Biochemistry, 2nd edn, p. 520, Worth Publishers, New York.
6.
Monk, P., Wadsò, I.: A flow micro reaction calorimeter, Acta Chem. Scand. 22, 18U2-1852, ( 1 9 6 8 ) .
7.
Forrest, W.W., Walker, D.J.: Calorimetrie measurement of energy of maintenance of Streptococcus faecalis, Biochem. Biophys. Res. Comm.
23, 217-222, (1963).
155 8.
Dolin, M.I.s The DFNH-Oxidizing Enzymes of Streptococcus faecalis, Arch. Biochem. Biophys., 55, M 5-^35, (1955).
9. Demko, G.M., Blanton, S.J.B., Benoit, R.E.: Heterofermentative carbohydrate metabolism of lactose-impaired mutants of Streptococcus lactis, J. Bact. 112, 1335-13^5, (1972). 10. Izatt, R.M., Christensen, J.J.: in Handbook of Biochemistry (Sober, H.A., ed.), pp. J-H8-J-139- The Chemical Rubber Company, Cleveland, (1968). 11. Wilhoit, R.C.: in Biochemical Microcalorimetry (Brown, H.D., ed.), pp. 305-317» Academic Press, Hew York and London, (19^9)• 12. Forrest, W.W., Berger, R.L.: in First European Biophysics Congress IX (Broda, E. ed.), 30^-305, (1971).
4. Calorimetry of Organs
4.1 Calorimetrie Investigations on Animai Suborganisms: Organites, Tissues and Isolateci Organs P. Boivinet
INTRODUCTION If we read the excellent reviews on biocalorimetry by C. Spink and I. Wadsb (1)^ I. Lamprecht (2) or B. Schaarschmidt and I. Lamprecht (3) it is apparent that, although the publications lie in the principal field of interest of the author, the list of references nevertheless gives an indication of the important fields of research: fifty per cent of the works cited are concerned with biochemical reactions, i.e. the molecular level of organisation, and thirty per cent with unicellular systems, microorganisms or blood cells (Wadsb at this meeting) whilst the remainder deal with subcellular systems, tissues, isolated organs and even whole pluricellular organisms. The reason for this uneven distribution may well be that it is possible to obtain well defined states in biochemical systems and, sometimes, to treat them thermodynamically. In the case of naturally isolated cells it is easy to obtain large populations, thus eliminating individual peculiarities. In both cases, homogeneous or almost homogeneous and isotropic systems are obtained, open to a wide variety of experimental techniques. On the other hand, complex and macroheterogeneous subsystems are difficult to investigate
160 and often unpredictable. There is, however, an exception: for over fifty years now, excitable tissues (4 - 5), and particularly skeletal muscle, have been investigated with remarkable results by A.V. Hill, his coworkers and subsequent workers. This is the subject of a special paper at this meeting by Woledge. I can only point out that it was for this work that the only Nobel prize in microcalorimetry was awarded.
SUBCELLULAR SYSTEMS OR ORGANITES Microcalorimetric research on subcellular systems has received rather little attention in the literature. In spite of the progress in differential centrifugation and electron microscopy it is still difficult to get sufficient quantities of homogeneous uncontaminated particles suitable for microcalorimetry. Furthermore these subcellular fractions are delicate and the "ecologic" conditions necessary to ensure a survival time compatible with the "lag phases" of the microcalorimeters are still not known. Recent advances, however, in instrumentation of flow calorimeter (6 - 7) or highly sensitive apparatus with very short time constants, for example the NBS batch microcalorimeter (8 - 9) renew possibilities of progress in this field. Two kinds of subcellular systems have been most frequently studied, membranes and mitochondria. Of the numerous experimental techniques reviewed by Levine (10) in studying the protido-lipidic structures we shall concern ourselves first with differential scanning calorimetry. This method is, indeed, the most straightforward in obtaining information on thermotropic transitions in protein-lipid complexes. These works on biomembrane phase transitions and related models
161 have been reviewed recently by Chapman, Urbina and Keough (11). "Princeps" experiments (12 - 13) were carried out on microorganism cells (Mycoplasma laidlawii). It was possible by comparing living cells, isolated and purified membranes and their lipidic extracts to confirm the hypothesis of bilayer structure. Nowadays, the tendency is to concentrate more on artificial models or liposome dispersions (14 - 15). Suurkuusk et al (16 ) have reported on calorimetric and fluorescent probe studies of the gel-liquid cristalline phase transition in dipalmitoylphosphatidylcholine
vesicles.
Papahadjopoulos et al (17) have studied the fluidizing effects of local anesthetics such as dibucaine on the solid to liquid phase transition in phospholipid liposomes. Cater et al (18) used a lecithin-water model to study the interactions of several drugs structurally related to morphine or similar to desipramine. There are examples where thermal methods promise to contribute to pharmacological interpretations. We are more concerned, however, with animal samples: Jackson et al.(19) using differential heat capacity calorimetry detected a thermal transition for human erythrocyte ghosts. This transformation is completely irreversible, probably because of the thermal denaturation of membrane protein. In agreement with this hypothesis, the ATPase attached to the membrane loses its activity in the same range of temperature. Another type of investigations concerning biomembrane involves surface interactions. Kemp, for example (20), using an LKB batch calorimeter, determined the hydrolysis of exogenous ATP on muscle fibroblasts isolated with trypsin. The inhibition of the enzyme by ouabain, oligomycin, mersalyl and sulfhydryl blocking agents was studied. The fixation on the membrane
162 of rabbit antifibroblast serum was also reported. Similarly Zala et al.(21) have reported on the enthalpy change associated with the binding of glucose to human red blood cell ghosts. The pioneers of mitochondrial microcalorimetry are Poe, Gutfreund and Estabrook (22 - 23). Studies of t h e A H are particularly suitable in determining the energy balance in oxidizing processes. Their initial work was concerned with ETP (electron transport particles) isolated from the heart. Subsequently they studied the energy coupling between catabolism and the absorption of calcium (24) or potassium (25) in the mitochondria of rat liver. An oxygen electrode in the calorimeter enables a comparison to be made between direct and indirect calorimetric methods. The results depend with the type of anions surrounding the mitochondria. The enthalpies of oxidation of the substrate were - 44,1 kcal/atom oxygen with chloride as principal anion, - 35,8 kcal/atom oxygen with acetate and - 34,0 with phosphate. These differences were attributable to the heat of proton neutralization which varies with the anionic environment. The enthalpy of calcium binding, - 25 - 0,85 kcal/at. was determined from the energy balance. Its value indicates that some of the calcium is not in free solution. Tyng-Fang Chien and Burkhard (26) explain the discrepancy observed by Poe et al. when they compared the enthalpy of oxidation of succinate by oxygen with that by ferricyanide as being due to the terminal electron acceptor. The values obtained for oxygen with nonphosphorylating submitochondrial particles or dinitrophenol-uncoupled mitochondria agree with those calculated thermodynamically.
163 On the other hand, the enthalpy of oxidation by ferricyanide measured for ultrasonic dispersed mitochondria agreed with the calculated value, but those for uncoupled mitochondria did not. If the release of the protons is taken into account very good agreement between calculated and experimental results are obtained in every case. As for subcellular particles other than membranes and mitochondria, ribosomes have been investigated by Lamprecht et al.(?7) but only on a cell free protein synthetizing system of Saccharomyces and hence not on an animal system.
TISSUES AND ISOLATED ORGANS Here three kinds of difficulties arise: a) - ensuring sufficient thermal contact between sample and the calorimeter wall. b) - maintaining adequate oxygenation, correct supply of metabolites and efficient removal of waste products with compacted mass of cells. Perifusion is, however, not as efficient as natural perfusion. It is possible to obtain a homogeneous system by isolating the tissue cells with trypsin or collagenase, if this solution is compatible with the physiological behaviour of the sample. c) - defining precisely the base line (experimental zero). Living samples are continuously metabolizing and an initial record of the base line at the beginning of the experiment is not sufficient. Wadsb's drop calorimeter devices minimize this inconvenience, but generally it is necessary to kill the tissues by injecting a suitable toxic material and determine the terminal reference base line. Contamination by microorganisms also causes a shift in the base line.
164 Hence, an a n t i b i o t i c which does not i n t e r f e r e w i t h m e t a b o l i c vity
is
acti-
needed.
A f t e r Woledge's splendid lecture,
it
i s o b v i o u s l y not p o s s i b l e
add a n y t h i n g on the s u b j e c t o f m u s c l e s . H i s t o r i c a l l y , p r i n c i p a l a u t h o r s a r e concerned,
the i n v e s t i g a t i o n s
to
so f a r a s
on heat
the
produc-
t i o n i n nerves were d i r e c t l y comparable w i t h t h o s e on m u s c l e . Helmholtz i n
1848, u s i n g t h e r m o c o u p l e s ,
was the f i r s t t o a t t e m p t
r e c o r d the heat p r o d u c t i o n i n a c t i v a t e d n e r v e s ,
About t h r e e q u a r t e r s o f a c e n t u r y l a t e r , measurement
( 2 8 ) . Abbot e t a l . ( 2 9 )
Hill
but w i t h o u t
success.
succeeded i n making a
have shown t h a t the i n i t i a l
produced i n c r a b l i m b n e r v e s i s d i p h a s i c
heat
i n c h a r a c t e r . An e x o t h e r m i c
phase l a s t i n g a b o u t 60 msec, w i t h a mean v a l u e o f
14. 10 ^ c a l / g
(wet w e i g h t ) c o i n c i d e s w i t h an i n c r e a s e i n the a c t i o n p o t e n t i a l P . ) . An endothermic phase l a s t i n g a b o u t 300 msec f o l l o w s , mean v a l u e o f
12. 10 ^ c a l / g
to
(wet w e i g h t ) ,
(A.
with a
which c o i n c i d e s w i t h
the
d e c r e a s e i n the A . P . The o r i g i n o f the i n i t i a l Peltier effects
heat has been a s c r i b e d t o the J o u l e and
i n the h e t e r o g e n e o u s t i s s u e s and t o i o n i c
inter-
change a c r o s s the membrane. Energy c a p a c i t y s t o r e d i n the membrane was r e l e a s e d d u r i n g the i n c r e a s e o f A . P . and r e s t o r e d d u r i n g decrease of A.P. S t r u c t u r a l
changes,
membrane, may a l s o o c c u r . The i n i t i a l of recovery,
a s i n the
i.e.
the
e n t r o p y changes i n the
heat i s
f o l l o w e d by the
muscle.
The two phase c h a r a c t e r has been o b s e r v e d a s a g e n e r a l f e a t u r e all
forms o f n e r v e s . R i t c h i e
nerve c o n d u c t i o n ,
(30),
in
i n a review on the e n e r g e t i c s
m a i n t a i n s t h a t the g i a n t s q u i d axon was the
for electrophysiology
heat
because o f i t s
l a r g e diameter
(500 pm),
of
best but
165 that the non myelinated fibres of the cervical vagus nerves of the rabbit are better suited for determining heat exchanges. These bres, diameter 0,4 - 1,2 ^im, form 6000 cm
2
weight, compared with 80 cm
2
fi-
of membrane per g wet
for the giant axon, and the heat
pro-
duced is related to the surface-to-volume ratio. Abbot (31), Aubert a n d Keynes
(32-33) studied heat production in the electric organs of
certain species of fishes
(Torpedo, Electrophorus, Malapterus). As
for nerves, an initial two-phase heat production was recorded, the exothermic effects a p p e a r to be due to an artifactual effect in damaged tissues. The cooling
but
Joule
(endothermic) phase is the
more significant event and is followed by a stage of classical
me-
tabolic heat recovery. Thermal inertia of the system prevents any correlation with the phases of the A.P. The Peltier effect heat of ionic mixing and structural changes of the membrane seem to have been discarded as possible
explanations.
The reversibility of the sodium pump appears to be the
principal
source of heat. The last example of heat production in an excitable tissue is by Hoffert et al. (34), who have shown by direct and indirect
calorime-
try that aerobic processes provide 40 - 50 per cent of the total energy in the isolated retina of teleost rainbow trout
(Salmo
neri), the remainder coming from anaerobic sources. These show the obvious disadvantage of exclusive use of
gaird-
results
respirometric
techniques, a n d also the advantages offered by direct
calorimetry.
FAT TISSUES Storage and release of energy and their hormonal regulation are fields of much interest in physiology. Chinet and Girardier
(35),
using a thermal flux differential calorimeter measured the c a l o r i genic response of rat brown fat tissue to norepinephrine. They have
166 shown the unexpected potentiation of the response by inhibitors of hormone binding, i.e. DOPA or vitamin C. Their results suggest that the inhibitors act as competitor for the sites at which the hormone either has an inhibiting effect on calorigenesis or where norepinephrine is destroyed. Chinet et al. (36) have likewise measured the energy flux associated with sodium removal in the brown fat tissue of the rat and compared it with that for rat solear muscle. The blocking effect of ouabain on the sodium pump and the measurement of the sodium flow with isotope 22 of Na have shown a 50 % yield in sodium pumping when using ATP. Insulin greatly increases the glucose absorption rate of several tissues: muscles such as diaphragm, but mainly fat cells
(adipocytes).
Boivinet et al. (37) measured the effect of insulin on rat epididymal fat tissue, using a Calvet calorimeter. Wistar male rats thirty and ninety days old, were quickly killed without anaesthesia. About 100 mg of epididymal fat was removed aseptically and placed in the calorimeter in 1.2 ml of Krebs-Ringer solution, and 4 g/l of glucose and 2 g/l gelatin were added. Gelatin prevented adsorption of insulin on the glass walls
(Fig.l).
The solution was saturated with 95 % oxygen and 5 % CO^ (carbogene). This gas also filled the free space in the cell (ca 12 ml). Penicillin was used to prevent bacterial contamination (3000 U.l/ml). The insulin solution and the metabolic inhibitor (eg. NaF) were successively injected by means of syringes placed in the calorimeter tube, insulin after the heat without insulin had been recorded, NaF at the end of the experime nt (Fig.2). The fraction ( A . - A ) / A obtained from the thermogram l m m
(Fig.2)
gives a relative measure of the insulin activity. In the concentration interval of 25 to 110 jjL) of insulin/ml the fraction is propor-
167
Insulin Solution-
-NaF
g
Epididymal fat* tissue
Fig. 1 :
,Ringer-Krebs Solution
Microcalorimetric determination of insulin activity. About 100 mg of epididymal fat tissue and 1.2 ml of Krebs-Ringer solution are put in the calorimetrie cell. Two syringes make possible the injection of insulin solution and, at the end of the experiment, of NaF solution which determines the final reference baseline.
tional to the quantity of insulin injected. The accuracy obtained is about 15 %. Gulfe and Hellmann (38) studied the heat production of pancreatic IB cells stimulated by glucose in islets of Langerhans obtained from obese hyperglycemic mice. The heat production, measured in the LKB batch microcalorimeter, was compared with microrespirometric or micropolarographic oxygen determinations. Islets were isolated
168 NaF
Fig. 2 :
Thermogram of determination of insulin activity : Metabolic activity without insulin A A^ Metabolic activity in presence of insulin
by a collagenase treatment. Tylosin or gentamycin was used to prevent bacterial growth. The degree of heat production in the absence of glucose was equivalent to about 50 nW/islet or 13 mW/g islet dry weight. After mixing, increasing the glucose concentration to 20 mM, the heat production increased to about 90 nW/islet. The antimycin suppressed all heat production before as well as after the addition of glucose. It is interesting to note that the production of heat increased 80 % with reference to the base level after exposing the islets to 20 mM glucose, whereas oxygen absorption increased by only 50 %. This suggests an increase in the calorific coefficient of oxygen with glucose concentration when the 8 cells use correspondingly more carbohydrate as a source of energy. Schaarschmidt and Schaefer (39) have given details of preliminary microcalorimetric experiments on human cutaneous cells (epidermis) and on guinea-pig liver tissue.
169 The values obtained without substrate in the buffer (endogenous heat production) and with 10 g/l glucose were compared with the heat pro-
2
2
duction of yeast, in air, in N , (2 kp/cm ) and in 0 . (1 kp/cm ). Microcalorimetry would appear to be promising in research into the metabolism of cancerous cells but, as yet, there is only one investigation which can be quoted, i.e. that of Kresheck and Gordon (40) who gave some preliminary results on cell cultures.
ISOLATED ORGANS The heart is a good example of an isolated organ and, at present, the most investigated. A study of the energy balance of the isolated heart requires, firstly, a good knowledge of the mechanical working, and also of the total energy flux produced by aerobic and anaerobic metabolic means. So far there has been only one work reported on a whole isolated mammalian heart, and that is rather old. Neill and Huckabee (41) used two dogs for each experiment. The removed heart was continuously supplied with blood by the other dog (blood donor dog). The isolated heart was kept in a thermally insulated box. The heat production was calculated from the blood flow and from the temperature difference between the blood entering and leaving the heart. The oxygen consumption was measured by manometric technique. An intraventricular ball converted the mechanical work into heat. The results, a mean of seven determinations, showed an anaerobic heat production corresponding to 12,5 % of the total energy requirement. This is rather surprising for a higher animal heart, but calibration and measurement of the temperature and flow, and conversion of work into heat are very difficult. The GraysonS technique (43) of internal calorimetry, using heated thermocouple probes, "in vivo" is better,
170 but still complex. Consequently Ricciuti et al.(42) preferred to revert to more established techniques developed by Fenn for the mechanical work of skeletal striated muscle and by Hill for thermal measurements. They therefore used cardiac trips and papillary muscles which can be assimilated in linear elements and hence studied using Hill thermocouples. In the rabbit capillary muscle the heat production rate varied between 80 and 140 mcal/min under experimental conditions. In the case of lower animals hearts, it is easier to maintain the organ alive and consequently more work has been published. The earliest were by Bohnenkamp et al.(44) and Fisches (45) on poikilotherms (eel, tortoise, frog). Boivinet and Rybak (46) have carried out microcalorimetric studies of the frog heart when completely open and under extension. The technique of the open extended heart, which was developed originally by Rybak (47), improves the interchange with the surroundings. Consequently, mechanical catalysis (48) cardiac contractions may be prolonged over many hours without any perfusion. The frog's heart, weighing about 50 mg, is removed, opened and extended under a known tension in an extensometer(49) and then fixed on a paraffin plate and placed in the calorimeter with 1 M
of Ringer
solution (Fig.3). Two platinum wires embedded in the paraffin enabled the electrocardiogram (E.C.G.) and the number of cardiac cycles to be recorded during the microcalorimetric experiment. Fig.4 shows a typical thermogram. The final reference line was obtained using a blocking solution of KC1 and NaF (0.5 M). Measurements were made in air (heat production rate 0.985 cal/h.dry weight)and in 75% 0^,25% (2.54 ca 1 / h . g dry weight). The heat produced in a single contraction cycle can be calculated
Ng
171 from the electrocardiogram .-4 6.5 • 1 0 ^ cal/cycle
2.88- 10
-4
g
cal/cycle • g
at 27°C in 75 % oxygen, at 27 C in the air.
The results have confirmed that the frog heart was under normal oxygen pressure partially anaerobic. Polarographic determination of the oxygen (47) showed that a partial pressure of oxygen greater than 250 mm was necessary for perfect anaerobiosis. In the preceding experiments, the heart was in a gaseous environment. It is possible in liquid environment , which is more efficient for removal of waste products, to use the catalase activity of the heart for oxygenation (Fig.5). For this 1g/l NaBO^ is added to the Ringer solution. After graphical correction of the thermogram, it is possible to determine
£
•-•Pusher
j^Coaxal cable for E.C.G.
li
^/Syringe (NaF, KC1)
10 m m
•Platinium wires Cactus thorns
Open heart fixed on paraffin plate
Paraffin plate Potential connections for E.C.G.
Fig.3: Device for introduction of frog heart in Calvet microcalorimeter
Fig.4:
Thermogram of open extended heart in air at 27 °C
Fig.5:
Thermogram of open extended heart with catalase oxygenation in liquid environment
173 the initial catalase activity of the myocard. Recently, Herold (50,51) carried out an important and complete study of the energetics of myocard in the isolated ventricle of the snail (Helix pomatia). The ventricle work was first measured with a classical device (Fig.6). The isolated heart , fixed on a Straub cannula, became part of a recording system with constant pressure and its mechanical power P was measured. The ventricular heat production rate or total power Z!(-AH) was determined using a Calvet microcalorimeter. Two ventricles functioning isometrically under known load were stretched on a stainless steel frame .The predetermined load varies from 150 to 650 mg. The frame with attached hearts was placed in the microcalorimeter cell containing hemolymph or another suitable physiologic solution (Fig.7). A gas was bubbled through, a mixture of 0„ and N_ or air, at a rate of 40 ml/h to maintain a constant PQ 9 . -Bubbling catheter
Clark electrode
A\m -Hémo lymphe •Straub cannula Air or gas mixture •Ventricle Wet chamber
« Fig.6:
Record level
Snail heart, mechanical power measurement device
174 Syringes for stopping solution Distributing frame
Gas tank Stainless steel frame
Fig.7:
Snail heart, calorimetrie device with different oxygenation
Three-way cock Scale capillary tube
Cock stopper
Fig.8:
Respirometric chamber
Snail heart, microrespirometric determination of C^-uptake
175 The c o n t r o l
c e l l c o n t a i n e d the same volume o f s o l u t i o n and the same
volume o f g a s was b u b b l e d t h r o u g h . Thus, the p a r a s i t i c e f f e c t due t o b u b b l i n g was e l i m i n a t e d . The base r e f e r e n c e l i n e ,
or
experimental
zero, was determined a t t h e end o f the experiment by i n j e c t i o n f o r m a l i n e s o l u t i o n which e l i m i n a t e d a l l
thermogenesis.
I t was t h u s
p o s s i b l e t o compare v a l u e s o f m e c h a n i c a l power w i t h t o t a l efficiency coefficient =
i s defined a f t e r Gibbs
i c a l power ^m e c h a n— = total
power. The
as: P
power
of
—
Z(-AH)
I t v a r i e s w i t h a p p l i e d t e n s i o n from 0.08 t o 0 . 2 6 f o r an a c t i v e l a t e d h e a r t i n c o n t a c t w i t h the
iso-
hemolymph.
The c o m p a r i s o n between m e c h a n i c a l power P and O g - a b s o r p t i o n was termined manometrically
(Fig.8),
or polarographically
used t o d e f i n e the e n e r g y / o x i d a t i o n p, ' ~
(Fig.9)
_ _P_ ~ O2
(extra absorption = a c t i v e absorption - rest
The e f f i c i e n c y c o e f f i c i e n t
snail's
systems.
It
heart,
snail's
e s s e n t i a l l y anaerobic.
o f 13 i s
shows the v e r y good a d a p t a t i o n
v e n t r i c l e t o v a r i a b l e l o a d and t o v a r y i n g
the f r o g ' s
o f an o r g a n ,
h e a r t , the a m p l i t u d e o f v a r i a t i o n s
than i n v e r t e b r a t e h e a r t s .
conditions.
coefficient
6 g i v e a good i n d i c a t i o n o f the energy c h a r a c t e r i s t i c
Thus i n the s n a i l ' s
absorption)
depending on e x p e r i m e n t a l
a and the e n e r g y / o x i d a t i o n
a l l o w i n g comparisons with other
and
c o e f f i c i e n t IB
m e c h a n i c a l power e x t r a oxygen a b s o r p t i o n
B v a r i e s between 0 . 2 0 and 1.08,
de-
The t h e r m o g e n e s i s
of
oxygenation.
h e a r t under p h y s i o l o g i c a l
conditions,
of v e n t r i c l e
larger
Like is
may reach
1 ca 1/h •g wet w e i g h t o r 40 pW/heart d u r i n g maximum a c t i v i t y . The f a c t o r s
influencing
the e n e r g e t i c b e h a v i o u r were
systematically
Fig.9:
Snail heart, polarographic determination of Og-uptake
studied, principally ionic equilibrium, viscosity of the perfusing liquid, active pharmacological substances, hormones and neurosecretions. The cardiotonic properties of hemolymph protein were demonstrated. The mechanical tension, however, appears to be the principal parameter of energy release.
GENERAL CONCLUSIONS
The strict oxygen dependence for the homeothermic neurones and the numerous experiments carried out on intact higher animals to establish the validity of the first law of thermodynamics in the living world have convinced many physiologists of the universality of indirect calorimetry, i.e. of respirometric techniques. The total molecular balance is often seemingly tedious. However, even in homeotherms some tissues live normally in the hypoxic state using anaero-
Ill bic pathways; in the whole animal, this is concealed by cooperation between the organs. Thus the liver, in Cori's cycle, oxidizes the lactic acid produced by the muscle, and direct and indirect calorimetry will give the same value for total energy production. With isolated tissues such a presumption may not be valid. It is even more obvious in lower heterothermic animals. Direct calorimetry appears to be the most suitable and applicable means of detecting such phenomena and enables a more rigorous approach to be adopted, regarding energy yields and rectification for respirometric or analytic data. Calorimetry is, certainly, unspecific: heat appears, following the law of the entropy, as the universal "excretum". Thus recording heat is an adequate procedure for studying dissipative processes such as life, with the minimum of interference. In the case of tissues or isolated organs the natural, physiological conditions are generally reproduced: heterogeneity, darkness, constant temperature, no need of additional reagents, no agressive intervention such as radiation. It is often advantageous in detecting unsuspected features not to work under highly specific conditions.
REFERENCES
(1) Spink C. and Wadsö I. : Calorimetry as an Analytical Tool in Biochemistry and Biology, in "Methods in Biochemical Analysis" (editor D.Glick),Vtfl.23,pp. 1-159, Wiley-Science,New York
(1976).
(2) Lamprecht I. : Biological Calorimetry and DTA, in "Ecole d'Eté de Calorimétrie", Recueil des conférences, AFCAT, 202-253, Paris (1973).
178 (3) Schaarschmidt B. and Lamprecht I. : H e a t Production in Living Processes, in "Thermodynamic of Biological Processes" (editor A.I. Zotin) Nauka-Press, Moscow (in the press). (4) Abbot B.C. and Howarth J.W. : Heat Studies in Excitable
Tissues.
Physiol. Rev., 53 (1), 120 - 158 (1973). (5) Woledge R.C. : Heat Production and Chemical Change in Muscle, in "Progress in Biophysics and Molecular Biology", vol. 22, 39 - 74, Pergamon Press, N.Y.
(1971).
(6) Monk P. and Wadso I. : Flow Microcalorimetry as an Analytical Tool in Biochemistry and Related Areas. A c t a Chem. Scand., 23^ 29 - 36, (1969) . (7) Picker P., Jolicoeur C. and Desnoyers J.E. : Steady State and Composition Scanning, Differential Flow Microcalorimeters, J. Chem. Thermodyn., Jl_, 469 - 483, (1969). (8) Prosen E.J. : National B u r e a u of Standard Report NBSIR - 73 - 179 Washington, DC
(1973).
(9) Prosen E.J. and Goldberg R.N. - National Bureau of Standard Report NBSIR - 73 - J80
Washington, DC
(1973).
(10)Levine Y.K, : Physical Studies of Membrane Structure in "Progress in Biophysical and Molecular Biology" (Editors : J.A. Butler and D. Noble) 24, 1 - 74., Pergamon Press
(1972).
(11)Chapman D., Urbina J., and Keough K.M. : Biomembrane Phase
Transitions.
J. Biol. Chem., 249., 2512 - 2521, (1974). (12)Hintz H.J, and Sturtevant J.M. : Calorimetric Studies of Dilute Aqueous suspensions of Bilayers formed from synthetic L - ot -Lecithins. J. Biol. Chem., 247, 6071 - 6075
(1972).
(13)Reinert J.C. and Steim J.M. : Calorimetric Detection of a membrane
-
Lipid phase transition in living cells. Science, 168, 1850 - 1852(1970) (14)Ververgaert P.H.J., Verkles A.J., Elbers P.F. and Vandeenen L.L, : Analysis of the cristallization process in lecithin liposomes freech etch study. Blochim.Biophys .Acta,
: a
(3), 320 - 329 (1973)
(15)Klopfenstein W.E., de Kruyff B., Verkleij A.J., Demel R.A. and V a n Deenen L.L.M. : Differential Scanning Calorimetry on Mixtures of L e c i thin, Lysolecithin and cholesterol. Chemistry and Physics of Lipids, 13, 215 - 222 (1974) .
179 (16) J. Suurkuusk, Lentz B.R., Barenholz Y., Biltonen R.L. and Thomson T.E. A calorimetric and fluorescent Probe Study of the Gel-Liquid Crystal.line phase Transition in small single-lamellar Dipalmitoylphosphatidylcholine vesicles. Biochem., _1_5,
1393
"
1401
( 1 0 76).
(17) Papahadjopoulos D., Jacobson K.A., Poste G. and Sepherd G. : Effects of local Anesthetics on Membrane Properties. I. Changes in the fluidity of phospholipids bilayers. Biochem. Biophys. Acta, 394, 504 519, (1975) (18) Cater B.R., Chapman D., Hawes S., and Saville J. : Lipid Phase Transition and Drug Interactions. Biochem. Biophys. Acta, 363, 54 69, (1974). (19) Jackson W.M., Kostlya J., Nordin J. and Brandts : Calorimetric 8tudy of Protein Transitions in Human Erythrocyte Ghosts. Biochem., 12, (19) 3662 - 3667, (1973). (20) Kemp R.B. : Surface-localized Reactions in Tissues Cells : a microcalorimetric Study.
Science Tools, J_9, 3 - 5 (1972).
(21) Zala C.A., Jones M.N. and Levine M. : The Detection of the Enthalpy of binding o£ D. Glucose of Human Red Blood cellmembranes by Microcalorimetry. FEBS LETTERS, 48, (2), 196 - 199, (1974). (22) Poe M., Gutfreund H. and Estabrook R.W. in "Methods in Enzymology" (Estabrook Pullman ed.), Vol. X, 708 - 714, Academic Press N.Y. (1967) (23) Poe M., Gutfreund H. and Estabrook R.W. : Kinetic Studies of temperature changes and oxygen uptake in a differential calorimeter : the Heat of oxidation of NADH and succinate. Archiv. Bioch. Biophys., 122, 204 - 211, (1967) . (24)
Poe M. : Kinetic Studies of Temperatures changes an oxygen uptake in a differential calorimeter : Energy Balance during Calcium Accumulation by Mitochondria, Archiv. Biochem. Biophys., 132, 377 - 387 (1965!)
(25) Poe M. and Estabrook R.W. : Kinetic Studies of temperature changes, oxygen utilisation, pH and potassium concentration changes in a differential calorimeter : The enthalpy of potassium accumulation by Rat liver mitochondria. Arch. Biochem. Biophys., 128, 725 - 733 (1968). (26) Tyng-Fang Chien and Burkhard R.K. : Stoichiometry and calculated Enthalpy change for Mitochondrial Oxidation of succinate by ferricyanide. J. Biol. Chern., 250, (2), 553 - 556 (1975).
180 (27) Lamprecht I., Lochmann E.R., Pietsch I., Uttech K. : Microcalorimetric Experiments on a cell Free Protein Synthetizing System of Saccharomjices, in "Protides of the Biological Fluids" (Editor : H. Peeters) Vol. 20, 551 - 553 - Oxford (1973). (28) Hill A.V. : The Heat Production of Nerve. J. Pharmacol., 29_, 161 165, (1926). (29) Abbot B.C., Hill
A.V. and Howarth J.W. : The positive and negative
Heat Production associated with a Nerve Impulse. Proc. Roy. Soc. (London) Sec B, 148, 149 - 187 (1958). (30) Ritchie J.M. : Energetic aspects of Nerve conduttion : The Relation ships between Heat Production, Electrical Activity and Metabolism in "Progress in Biophysics and Molecular Biology" (Editor : J.A.V. Butler and
D. Noble) Vol. 26_, 147 - 187, Pergamon Press Oxford
(1973) . (31) Abbot B.C.,Aubert K., and Fessard A. : La production de chaleur associée à la décharge du tissu électrique de la Torpille, J. Physiol. (Paris) , 50, 99 - 102 (1958) . (32) Aubert X. and Keynes R.D. : The temperature changes during and after the discharge of the electric organ in Electrophorus electricus. Proc. Roy. Soc. (London) Ser B J_69, 241 - 263, (1968). (33) Keynes R.D. : The temperature changes during and after the discharge of the electric organ in Malapterus electricus. Proc. Roy.Soc (London) Ser B 169, 265 - 274 (1968) (34) Huffert, Russel J. ( Craig E., and Paul 0. : Comparison of direct and indirect calorimetry as a method for determining total energy produced by the isolated retina of rainbow toout (Salmo gairdneri) Exp. Eye. Res., J_9, (4), 359 - 365, (1974). (35) Chinet A. and Girardier L. : Potentiation of Brown Adipose Tissue Calorigenesis by Inhibitors of Hormon Binding. Experientia, 30 (6), 677, (1974). (36) Chinet A., Clausen T. and Girardier L. : Mesure en calorimétrie directe du flux énergétique lié au transport de sodium. J. Physiol. (Paris) , 7_1_, (2), 271, (1975) . (37) Boivinet P., Garrigues J.C. and Grangetto A. : Dosage microcalorimétrique de l'insuline, Compt. Rend. Soc. Biol. France, 162, 1770 - 1774 (1968) .
181 (38) Gylfe E. and Hellamn B. : The Heat Production of Pancreatic
B cells
stimulated by Glucose, A c t a Physiol, scand., £ 3 , 179 - 183, (1975). (39) Schaarschmidt B and Schaefer
: Stoffwechseleuntersuchungen an Hautund
Lebergewebe, in : Lamprecht I. and Schaarschmidt B., Pressedienst Wissenschaft F U Berlin, 4_, 74 - 75, (1974). (40) Kresheck G.C. : The Heat produced in vitro with L 1210 cells, Cancer Biochem. Biophys.,
(1), 39 - 42, (1974).
(41) Neill W.A. and Huckabee W.E. : Anaerobic Heat Production by the Heart J. of Clin. Invest., 45_, 1412 - 1420, (1966). (42) Gibbs C.L., Mommaerts W.F. and Ricchiuti N.V. : Energetics of cardiac contractions, J. Physiol. Lond., 191, 2 5 - 4 6 ,
(1967).
(43) Grayson J., Coulson R. and Winchester B. : Internal calorimetry, assesment of myocardial blood flow and heat production, J. appl. Physiol., 30, (2), 251 - 257, (1971). (44) Bohnenkamp H., Ernst H.W. and Nameto A. : On actual value of energy changes, its independence on mechanical work and its economy, Z. Biol. 88_, 429 - 450, (1929) . (45) Fischer E. : The Heat liberated by the beating heart, Amer. J. Physiol. 96, 78 - 88, (1931) . (46) Boivinet P. and Rybak B. : Etude microcalorimétrique du fonctionnem e n t électromécanique du coeur de grenouille, Life Sciences, 8, (II) 11 - 20, (1969) . (47) Fabel H., Lubbers D.W. and Rybak B. : Mesure polarographique de la consommation d'oxygène du coeur étalé ouvert de grenouille en contractions régulières prolongées "in vitro", Bull. Soc. Chim. Biol., 46, 811 - 817,
(1964).
(48) Rybak B. : Nouvelles perspectives en physiologie cardiaque, Les Conférences du Palais de la Découverte fasc. 226, (1957) (49) Rybak B. : Prolégomènes à 1'extensométrie cardiaque C.R. Acad. Se. Franc., 250, 3391 - 3393,
expérimentale.
(1060).
(50) Herold J..P. : Myocardial Efficiency in the isolated ventricle of the snail Helix pomatia L., Comp. Biochem. Physiol. 52 A, 435 - 440,(197)) (51) Herold J. P. : De l'énergétique du ventricule isolé d'un mollusque, l'escargot, (Helix pomatia L.), Thèse, Besançon (France),
(1975).
4.2 Calorimetrie Studies of Muscle and Muscle Proteins R.C. Woledge
It has been discovered during the past few years that much of the energy which is produced during contraction of skeletal muscle does not come from the splitting of ATP and the reactions which resynthetise it.
It
seems that this energy comes from changes in the proteins in the muscle, quite probably from changes in the contractile proteins.
We would like to
discover the identity of these hypothetical changes and are making two attacks on the problem.
Firstly, in studies of living, excised muscle we
investigate the magnitude of the unexplained part of the energy produced during contraction, and how it varies with different conditions.
Secondly
by studying purified contractile proteins in vitro we try to identify possible exothermic reactions which could be the source of the unexplained energy in the muscle.
The original work reported here has been done in collaboration with Dr Nancy A. Curtin, Dr Takao Kodama, Dr Howard White and Dr Ian Watson. BIOCHEMISTRY OF MUSCLE For the benefit of readers who may have no knowledge of muscle I will briefly summarise a few facts about muscle biochemistry which are needed for understanding this article.
Interested readers who wish for further
information are referred to the books by Carlson and Wilkie (1) and Wilkie (2). Intact muscle contains two very active ATPase systems.
One of these is the
actomyosin system, consisting of the two contractile proteins actin and myosin, which are arranged in separate filaments in living muscle.
ATP is
184 split during the interaction between these filaments which is also responsible for the mechanical events of contraction.
The reaction is
controlled by the proteins troponin and tropomyosin which influence the 2+ 2+ actin in response to changes in intracellular Ca levels. The Ca level is itself controlled by the second ATPase, that of the sarcoplasmic
2+
reticulum, by which ATP splitting is coupled to the accumulation of Ca This calcium is released during stimulation, activates the contractile system, and is then reaccumulated within the sarcoplasmic reticulum. In spite of the activity of these two ATPases, changes in the ATP concentration in muscle do not usually occur during contraction because the ATP is rapidly regenerated by the creatine kinase reaction: ADP + phosphocreatine
» ATP + creatine
If this system is exhausted or if the enzyme is blocked (by DNFB) then the adenylate kinase and adenylate deaminase system resynthesises the ATP: 2ADP
• AMP + ATP
AMP
• inosine monophosphate + NH^
Muscle cells can of course also resynthesiseATP by glycolysis and by oxidative phosphorylation, but these processes are much slower and need not concern us here. Myosin.
The myosin molecule is large (MW = 500,000) and consists of a
tail region carrying two heads.
The tail is insoluble at low ionic
strength and is responsible for the aggregation of myosin into filaments which occurs in vivo and can also be produced in vitro.
The two heads,
which are probably identical, can interact with actin and with ATP.
For
many purposes it is convenient to remove the tail of the myosin molecule (by treatment with a proteolytic enzyme) and to study only the heads, either singly (S ) or in pairs joined by a short part of the tail (HMM). Actin.
This is a fairly small protein (MW = 40,000).
The monomers
(G-actin) have a strong tendency to form linear polymers (F-actin).
It is
185 F-actin which exists in muscle and which is usually used for in-vitro experiments. Actomyosin as an ATPase.
From kinetic studies a mechanism has been pro-
posed for actomyosin ATPase which can be simplified as the following cycle of reactions.
(My represents myosin and Ac actin.
The full arrows show the
probable mechanism)
Myosin alone splits ATP (reactions 1, 2, 3, 4), but only slowly because reactions 3 and 4 are slow.
This situation may be analagous to resting
muscle in which interaction with actin is prevented.
We therefore expect
the myosin in resting muscle to exist largely as MyADP or MyADPP..
When
interaction of actin and myosin is allowed (active muscle, or addition of actin in vitro) an actomyosin complex is formed (reaction 7), and dissociation of the products, ADP and P , proceeds by reactions 3' and 4', thus bypassing the slow reactions 3 and 4.
ATP binds to the actomyosin
complex and then very rapidly dissociates it (reactions l' and 6). splitting occurs by reaction 2, not 2'.
ATP
It is probably during the
reactions of product release from actomyosin, that force is developed in active muscle.
So we expect to find at least some of the myosin in active
muscle in the forms AcMyADP and AcMyADPP^.
We thus expect a change in the
state of the contractile proteins on transition from rest to activity in muscle.
EXPERIMENTS WITH LIVING MUSCLE Figure 1 shows some examples of these experiments.
The measurements of
186 DNFB-TREATED
DURATION of T E T A N U S (MC)
DURATION of TETANUS (sec)
Figure 1. From Curtin & Woledge, 1975. Measurements of energy produced during isometric tetanic contractions of frog (R.temporaria) sartorius muscles at 0°C. The full lines are the calorimetrically observed quantities. The broken lines show the amounts of energy production which can be explained by the changes in metabolite levels.
heat and work produced by the muscle (lines labelled 'observed') are made essentially by the techniques developed by A.V.Hill (3).
To assess the
heat produced by ATP splitting and the reactions which resynthesise it, a parallel series of experiments are done in which muscles are rapidly frozen during contraction and the metabolites extracted.
The extracts are
analysed for creatine, phosphocreatine, inorganic phosphate, ATP, ADP, AMP, inosine monophosphate, and a number of glycolytic intermediates.
From the
changes in concentration of these compounds the amounts of ATP split and the extent of various resynthetic reactions can be calculated.
The heats
of these reactions under in-vivo conditions are known (4, 5) and so the amount of energy they produce in the muscle can be calculated. is shown in the figure by the lines labelled 'explained'.
The result
There is no
doubt that the explained energy is much less than the observed quantity. In other words a large part of the energy comes from reactions other than those considered in calculating the explained heat + work. Some more findings about the production of unexplained energy by muscle
187 will now be summarized briefly. 1.
The phenomenon was first observed in frog muscle at 0°C (6). more marked in Rana temporaria than in R. pipiens (7).
It is
It occurs also
at 20° in frog muscle (8) and in rat muscle (9). 2.
Unexplained energy continues to be produced during relaxation (10). Thus the process which produces this energy is not reversed in relaxation.
We do not know when it is reversed, but studies of glyco-
lytic and oxidative recovery have shown unexpectedly low amounts of rephosphorylation (11).
This would be consistent with the reversal
of the energy yielding process during recovery. 3.
The unexplained energy occurs also in DNFB treated muscle (Fig. 1 and ref. 12) in which creatine kinase is inhibited.
Thus it is not
solely a result of the action of creatine kinase. 4.
The amount of unexplained energy is greater when the muscle shortens rapidly than when contraction is isometric (no shortening) (13).
This
supports the suggestion that the contractile proteins are a source of unexplained energy since they would be expected to be directly influenced by change in the mechanical conditions during contraction. 5.
The unexplained energy occurs also in contractions in which the muscles perform external work (14).
Whether any of the work is derived from
the unidentified process is not known. It is now clear that a large part of the energy for muscle contractions under many conditions comes from reactions other than those usually considered as responsible for the supply of energy.
These extra reactions
could conceivably involve other metabolites for which we have not analysed. Although this possibility seems unlikely it is hard to eliminate it rigorously.
It does seem more likely however that the unexplained energy
comes from the proteins in the muscle.
That this idea is quantitatively
feasible can be seen from the following figures.
The amount of unexplained
energy after 5 sec of stimulation is 50 mj/g of muscle.
One gram of muscle
contains about 0.2 ymol of myosin, that is 0.4 pmol of myosin heads.
Thus
188 if each myosin head were to undergo a change on activation of the muscle which produced 125 kJ/moljthe energy seen in the muscle could be explained. Energy changes of this magnitude are quite possible in protein molecules. EXPERIMENTS ON MUSCLE PROTEINS IN VITRO The work on intact muscle has suggested that hypothesis that the unexplained energy in muscle contraction comes from changes in the contractile proteins. Kinetic studies of these proteins suggest that changes in their state occur on activation.
We have therefore begun to investigate the heat produced
by these changes.
We need to know the heat changes of all 12 of the
reactions shown in the scheme for actomyosin ATPase above.
Because of the
interconnections of these reactions it will be necessary to determine only 7 of the heats of reaction, when the others can be obtained by subtraction using the heat of the overall process.
So far we have information on only
three of these reactions, which I shall now describe. Interaction of Myosin and ADP Since the equilibrium of reaction 4 favours the bound state this reaction is easily studied by adding ADP to myosin, when the reaction occurs in the reverse of its direction during ATP splitting.
We have used a titration
technique for these experiments which has the advantage that the equilibrium constant and stoichiometry of reaction can also be obtained in the same experiment. An LKB batch microcalorimeter was used.
It was modified for titration
calorimetry by fitting a pair of motor driven micrometer syringes to the outside of the calorimeter drum (Figure 2).
The syringes are connected by
means of plasticcapillary tubes to the usual cells.
One cell contains
myosin in buffer solution (about 60 nmol in 4 ml) the other cell contains buffer alone.
After the calorimeter drum has been rotated several times,
to equilibrate the surfaces of the cells with the solutions they contain, the experiment is made by injecting ADP solution (about 15 nmol in 4 yl) into both cells, and then rotating the drum to mix the reactants.
10 or
12 injections are made.interspersed with rotations of the drum without injection.
A typical record of part of such an experiment is shown in
Figure 3, and Table 1 shows the heats observed and their standard errors
189
Figure 2. Diagram of apparatus used for titration calorimetry. The motor driven microsyringes are mounted on the outside of the calorimeter drum, within the thermostated air bath: Injections of titrant are made into both cells. The titrant (TD) in one cell; the other contains buffer solution only.
for two series of such experiments.
The heat observed for one addition of
ADP is about 1 mJ at the start of the titration and then diminishes as the myosin becomes saturated with ADP.
In Figure 4 the total heat produced in
a titration is plotted against the amount of ADP added.
If we assume that the myosin
molecule has n independent and identical
sites at which ADP is bound (with equilibrium constant K and heat of reaction ¿H) we can fit a theoretical curve to the calorimetric data, by means of an iterative least squares procedure using three adjustable parameters, n, K and AH. the data well.
As seen in Figure 4 the calculated curves fit
Table 2 shows the results of a number of series of
experiments with myosin and with HMM.
As expected the results are similar
for both proteins, showing that removing the tail of the myosin molecule has little effect on ADP binding.
The values of K are in reasonable agree-
190
I
1 JiV
|\J\ 1 M
M
M
M + A
M
20min
M> + A
/
M'
h
^observed= ^ M + A
M
+
h
M/
Figure 3. Part of the calorimeter record obtained during a titration of myosin with ADP. The calorimeter drum is rotated, to mix the cell contents, every 15 mins, marked by M. Some rotations are accompanied by an injection of ADP solution, marked by A. The heat attributable to reaction of ADP with myosin is calculated by the formula shown.
MYOSIN/ADP ADP ADDITION
O'c I I ] MEAN S.E.
MEAN
0.M5
0.0(5
1.2(5
0.(50
1.005
.050
1.237
.065
1.015
.029
1.097
.069
0.115
.005
1-127
.0(1
.095
.061
1.016
.0(1
.495
.07»
0.9(0
.0(4
.245
.0(9
.622
.0(0
.125
.070
.309
.040
-0.065
.012
.275
.090
-0.035
.074
.172
.045
0.025
.010
.109
.042
.152
.050
12*C [7] S.E.
Table 1. Heat (in mJ) observed at each addition of ADP myosin with ADP. Average results from 8 experiments at ments at 12°C. 64 nmol of myosin in 4 ml of buffer was experiment. At each ADP addition 17.4 nmol was added. are given in Kodama & Woledge (18',
during titration of 0°C and 7 experiused in each Further details
191
/ y*****
/ / Figure 4. Results of calorimetric titration of myosin with ADP. The points, 0, are mean experimental results, the bars show - 1 S.E. The points x are the result of correcting the 12°C results for a side reaction, ADP splitting. No correction is needed at 0°C. The lines are theoretical curves calculated as described in the text. For further details see Kodama & Woledge (18). PROTEINS
MYOSIN
KCl C O N C .
0.SM
TEMPERATURE
O'C
12'C
-57.1 i 3.2
-71.111.2
log.K
» 42 S 0.11
(.01 * 0.11
n
1.4« ! 0.U
1.74 ± 0.07
nH.
0.1« t «.02
0.20 ! »02
-9.1 i 1.0
-».« • 1.0
AH
(kJmoto'l
n„. A H
Table 2.
b
tKJmol«']
« «
25'C
~
•-««
12'C
-70
-71J • 1.1
-K2
s t»
»5
S « 0 s 0.15
5.44 t 11«
1.75 t OLOi
U ! i «.W
—
192 raent with those obtained by other methods.
However the values of n are
always rather less than the expected value of 2.
This could be the result
of the presence of inactive protein, but an alternative possibility is that the second nucleotide molecule is bound more weakly than the first, so that true saturation is not achieved in our experiments.
Further experi-
ments are needed to examine this possibility. In recent experiments with myosin agregated into filaments, and also preliminary observations with S^, we have been able to observe very similar AH and K values for ADP binding.
Thus under all the conditions we have
investigated, ADP binding is strongly exothermic.
By contrast Goodno and
Swenson (15) have reproted that ADP binding to HMM produces only a small amount of heat.
We cannot at present explain this discrepancy.
Interaction of Myosin with ATP When a stoichiometric amount of ATP is added to myosin, reactions 1 and 2 occur rapidly so that MyADPP^ is formed.
The release of Pi from this com-
plex (reaction 3) then occurs more slowly.
As first shown by Yamada,
Shimizu and Suga (16) these two phases can be distinguished calorimetrically.
We have studied these reactions in a Calvet calorimeter continuously
stirred by vertical oscillations of a perforated teflon disk.
So far we
have made only some preliminary experiments, one of these is shown in Figure 5 (open points).
We find that there is no rapid phase of heat
production but that all the heat is produced with an exponential time course of time constant about 80 sec, which is about the rate expected for reaction 3.
If the starting material is MyADP instead of myosin (filled
points in Figure 5) then there is a rapid initial heat absorption preceding the exponential heat production.
This is due to the ATP 'chasing'
the ADP from the myosin (reactions 4 and 1) is endothermic.
which,
as discussed above,
It thus seems clear that reaction 3 is exothermic and
that reactions 1 and 2 together are almost thermally neutral. estimate of the heat of reaction 3 is -140 kJ/mol.
Our first
This is in reasonable
agreement with the results of Yamada et al.
The separation of the heats of reactions 1 and 2 is a difficult problem. Although reaction 2 is much slower than reaction 1 (at the usual ATP con-
193
Figure S. Result of calorimetric experiment on addition of ATP to myosin (0-0-0) or to myosin-ADP (•-•-#). Measurements were made with a Calvet calorimeter and have been corrected for heat loss and instrument lag by the methods of Hill (3). centrations used) it is too rapid (400 s "S for the heats of the two reactions to be separatedly measured, at least with conventional calorimeters. Possibly the use of ATP analogues, such as ATPYS, for which reaction 2 is much slower may be helpful.
Our expectation is that ATP binding (reaction
1) will turn out to be exothermic, like ADP binding, in which case the actual ATP splitting reaction (reaction 2) must be endothermic.
Interaction of Myosin with Actin The equilibrium of reaction 5, the interaction of actin and myosin strongly favours the actomyosin complex.
The heat of the reaction can be measured
by mixing actin with HMM or S^ in a batch calorimeter.
We have used a
variation of the titration technique used for studying ADP binding. Myosin
(HMM or S^) was placed in the titration syringe and the actin solu-
tion in the calorimeter cell.
Because of the limited concentration of
myosin that could be achieved, rather large volumes (100 to 200yl) had to
194 be injected.
These injections caused artefacts much larger than the
expected heats of reaction.
We therefore deferred mixing of the reactants
until 10 mins after the injections. in Figure 6.
The type of record obtained is shown
Small heat absorptions were observed when the reactants were
mixed; these were only a few tenths of a millijoule and near the limit of resolution of this technique.
Nevertheless we were able to obtain reason-
ably consistent results with both HMM and S^ which are shown in Figure 7. The results for HMM (two headed) and for S^ (one headed) are very similar when plotted per mole of myosin heads.
The similarity suggests that both
heads of the HMM molecule attach to the actin filament, for which evidence was previously lacking. We have attempted to analyse the results of the experiments on the assumption that the binding sites for myosin on the actin filament (n per actin monomer) are identical and independent.
On this assumption we have calcu-
lated the best fit curves shown in Figure 7, using three adjustable parameters:
K ,
Figure 7.
AH, and n.
Well fitting curves were obtained as shown in
The best fit parameters were, for S : n = 0.76
AH = + 22 kj/mol, log K = 6.6
and for HMM:n = 0.60, AH = +38 kJ/mol, log K = 5.9 However these values for n and log K are much lower than expected on the basis of titration experiments using light scattering as an indicator of the extent of actomyosin formation (17).
We therefore feel that the
assumption of independent and identical sites is not correct.
It seems
likely that the attachment of the first myosin heads to the actin filament produces a larger heat absorption than do later attachments. the reaction is an endothermic one is however clear.
The fact that
In the case of HMM
the average heat of reaction is close to +20 kj/mol.
CONCLUSION Our work on the calorimetric study of the ATPase system has only reached about a half way stage.
We hope it will be possible in the next few years
to find the heats of all 12 reactions involved in actomyosin ATPase.
Only
then will it be possible to assess the hypothesis that the origin of part
195
1KV Figure 6. Part of the calorimeter record obtained during a titration of actin with HMM. The calorimeter is rotated every 10 min. Immediately after every 4th rotation (marked I) HMM solution is injected into one cell only but remains separate from the actin solution. This causes a large artefactual heat production. On the next rotation of the calorimeter (marked R) the actin and myosin solutions are mixed. The heat absorbed by the reaction of actin and myosin may be seen by comparison of the heat after this rotation with that after the subsequent rotation M. The amount of heat absorbed is clearly greatest in the first step of the titration and then decreases as the actin becomes saturated with myosin.
Figure 7. Results of calorimetric experiments on binding of myosin to actin. Points are mean results from 7 experiments with S]_, and 3 experiments with HMM. Bars show * S.E. Lines are theoretical binding curves - see text.
196 of the energy appearing during muscle contraction comes from changes in the state of the contractile proteins.
However at this stage it is at
least apparent that some of these changes do produce enough heat to be potentially important sources of energy in muscle contraction. REFERENCES (1)
Carlson, F.D., Wilkie, D.R.:
(2)
Wilkie, D.R.:
(3)
Hill, A.V.:
(4)
Woledge, R.C.:
(5)
Woledge, R.C.:
Muscle Physiology. Prentice Hall Inc.
(1974). Muscle (Second Edition), Institute of Biology, Studies
in Biology No. 11, Edward Arnold (1976). Trails and Trials in Physiology, Edward Arnold (1965). Heat production and chemical change in muscle.
Prog.Biophys.Molec.Biol. , 22_, 37-74 (1971) In vitro calorimetric studies relating to the
interpretation of muscle heat experiments.
Cold Spring Harbor
Symposium 37_, 629-634 (1972) . (6)
Gilbert, C., Kretzscbmar, K.M., Wilkie, D.R., Woledge, R.C.: Chemical change and energy output during muscular contractoin. J.Physiol. 218, 163-193 (1971).
(7)
Homsher, E., Rail, J.A., Wallner, A., Ricchuiti, N.V.:
Energy
liberation and chemical change in frog skeletal muscle during single isometric tetanic contractions. (8)
J.Gen.Physiol. 65, 1-21 (1975).
Canfield, P., Lebacq, J., Marechal, G.:
Energy balance in frog
sartorius muscle after an isometric tetanus at 20°C.
J.Physiol.
232, 467-483 (1973). (9)
Gower, D., Kretzschmar, K.M.:
Heat production and chemical change
during isometric contraction of rat soleus muscle.
J.Physiol. 258,
659-672 (1976). (10)
Curtin, N.A., Woledge, R.C.:
Energetics of relaxation in frog muscle
J.Physiol. 238, 437-446 (1974). (11)
Kushmerick, M.J., Paul, R.J.:
Aerobic recovery metabolism following
a single isometric tetanus in frog sartorius muscle at 0°C. J.Physiol. 254, 693-709 (1976). (12)
Curtin, N.A., Woledge, R.C.: untreated frog muscle.
Energy balance in DNFB-treated and
J.Physiol. 246, 737-752 (1975).
197 (13)
Rail, J.A., Homsher, E., Wallner, A., Mommaerts, W.F.H.M. :
A temp-
oral dissociation of energy liberation and high energy phosphate splitting during shortening in frog skeletal muscles.
J.Gen.Physiol.
68, 13-25 (1976). (14)
Curtin, N.A., Gilbert, C., Kretzschmar, K.M., Wilkie, D.R.:
The
effect of performance of work on the total energy output and metabolism during muscular contraction. (15)
Goodno, C.G., Swenson, C.A.: ADP to heavy meromyosin.
(16)
J.Physiol. 238, 455-472 (1974).
Calorimetrie studies on the binding of
J.Supramol.Struct. 3, 361-367 (1975).
Yamada, T., Shimizu, H., Suga, H.:
A kinetic study of the energy
storing enzyme product complex in the hydrolysis of ATP by heavy meromyosin.
Biochim.biophys.Acta. 305, 642-653 (1973).
(17)
White, H., Taylor, E.:
(18)
Kodama, T., Woledge, R.C.: of myosin with ADP.
Biochemistry (in the Press) (1976). Calorimetrie studies of the interaction
J.Biol.Chem. (in the Press) (1976).
4.3 Calorimetric Investigations of Metabolic Regulation in Human Skin A. Anders, G. Welge, B. Schaarschmidt, I. Lamprecht, H. Schaefer
Introduction
In a series of experiments concerning the adaptation of the photodynamic effect to therapies of dermatologic diseases - especially the Psoriasis - and the application of dye lasers to this purpose (l) it was of some interest to get further information about the metabolism of healthy and diseased epidermis. Up to now experiments on the total metabolism of whole skin or different layers of it and on special steps in the glycolysis were only performed manometrically with the Warburg technique or enzymatically (2,3). Moreover, many of the manometric experiments require prior homogenisation of the samples, so that aj.1 regulative phenomena which take place due to the structural integrity of the cells were cancelled out. As far as we know no calorimetric investigations have ever been performed.
Van Scott has proposed a method by which the intact epidermis is stripped off from the cutis without effecting the horny layer (4). This procedure enables one to investigate in a system of complete cells the metabolic activity as well as the permeability of the membrane for enzymes, substrates, coenzymes and other molecules.
200 Psoriatic cells are well known for a high rate of replication and for a strongly increased metabolic turnover (5-8). The great advantage of a calorimeter is its unspecifity which enables one to detect even unexpected processes due to their enthalpy changes. Therefore, it is extremely suited to determine the differences between healthy and diseased tissues. In this paper we have to distinguish between two different kinds of experiments: (a) The epidermis, streched in a buffer without any additional energy source, renders the endothermic metabolism. (b) From the outside, an appropriate substrate is offered to the cells which is metabolized at a specific rate. This substrate may be glucose as an unspecific energy source or a substance that is utilized in only one specific metabolic step. Fig.1 Flow of the substrate pyruvate and the coenzyme NADH into and outflow of unbound enzyme LDH from a skin specimen suspended in buffer and heat production by the hydrogénation of pyruvate within and outside the specimen.
201 In both cases, a necessary prerequisite is that the substrate can diffuse through the cell walls. At the same time a part of the free, unbound enzyme may leave the cell so that the reaction takes place inside and outside the tissue (Fig.l). When the specimen is later removed from the buffer and new substrate added an evaluation of the enzyme activity in the buffer is possible and a recalculation of the amount of intracellular enzyme. When the substrate is available in high concentrations the steady state metabolism is increased for a prolonged period. The value of the steady state may be influenced by some limiting factor within the cell, e.g. the permeability of the cell membrane for the substrate and coenzyme. Therefore, the rate of metabolism and the calculated enzyme activity do not necessarily correspond with the optimal activity (3).
On the other hand, if we are interested in the metabolic efficiency and the heat released per mole substrate, it would be more appropriate to apply a "ballistic method", i.e. a smaller amount of substrate which is consumed in an interval comparable with the time constant of the calorimeter. Since we are often confronted with first orcbr reactions and the instrumental time constant is large compared with the rate constant a calibration with commercially available enzyme or a mathematical folding is necessary in order to compute the real turnover rate from the maximum heat flow and from the time interval between the start of the reaction and its maximum (9,10). Figure 2 demonstrates that only with LDH activity lower than appr. 7 U is there a linear relation between the activity and the heat production or the t i m e r (see below). With higher activity, both parameters are constant and would not allow the calculation of the real activity.
202
Qmax/mWN
I /min H X .
10-
1.0
\
75-
•075
-1-
-t-
0
1
2
3
5
•H 6
0.5
•025
/—
V/tJl
Fig. 2 Dependence of the maximum heat flow Q and the t i m e t from the addition of coenzyme to the maximum heat flow on the specific enzyme activity A in "ballistic experiments".
Method and Material
Fresh skin was obtained at breast cancer surgery or leg amputations and sometimes from corpses. The latter one is not as suited for metabolic experiments as the fresh skin samples. The epidermis is sheared off from the cutis following the method of van Scott
(4).
Th e samples were stored in a refrigerator at -18 C until used. For the tests, small pieces of 1 to 2 square centimeters (5-10/mg fresh weight) are placed in small frames with synthetic gauze windows so that the tissue stays stretched and offers a maximum surface to the surrounding
buffer.
203 In former experiments the epidermis was compared to small
liver
slices, as these are more easily available. But cutting the slices injures the top layer of cells leading to a break down of
regula-
tive processes, whereas the inner cells do not obtain a sufficient supply of substrate. This fact led to the experiments with an isolated perfused rat liver which are reported by Baisch
(these P r o -
ceedings).
Besides the glucose metabolism of cells in a bicarbonate
buffer
the main interest concerned the enzymatic activity of LDH - lactate dehydrogenase
(EC 1.1.1.27) - which reduces pyruvate to lactate
(11). The buffer contained the substrate pyruvate in excess while the coenzyme NADH was added in exact quantities a n d represented the limiting factor of the
reaction.
The experiments were run in a Calvet microcalorimeter with 15 ml lucite vessels and a recorder sensitivity of 15 |jW/cm. During the thermal equilibration the NADH solution was kept in a syringe
just
above the calorimetric vessel and a t the same temperature. The syringe could be operated from outside the calorimeter. The
tempera-
ture of the instrument was usually adjusted to 25 C, as at higher temperatures the lysis of the tissue is too rapid. An experiment on one specimen with 3 additions of NADH lasted a few hours. In this time there is no significant contamination by bacteria in the vessels.
To obtain the heat of reaction in vitro and to calibrate activities,
metabolic
commercially available LDH (Boehringer/Mannheim)
varying concentrations was used instead of epidermis.
in
204 Results
a ) Pure Enzymatic
Reactions
A t h i g h enzyme c o n c e n t r a t i o n s mogram o f a f i r s t
order reaction,
heat flow Q v e r s u s (Fig.3).
Fig.
line.
i.e.
above
1 u n i t / m l we g e t a
a s may be shown by p l o t t i n g
t h e amount o f h e a t Q p r o d u c e d up t o t h i s
For a f i r s t
ther-
order reaction t h i s
p l o t must be a
the
moment
straight
3 Thermogram o f t h e h y d r o g é n a t i o n o f p y r u v a t e by means o f 6 5 U c o m m e r c i a l l y a v a i l a b l e LDH ( Q = f ( t ) ) and i t s t r a n s f o r m a t i o n to a l i n e a r f i r s t order p l o t ( Q = f ( Q ) )
The d e v i a t i o n
o f the c a l o r i m e t e r .
i n the f i r s t
part i s
due t o t h e t i m e
constant
The h e a t p r o d u c e d p e r mole NADH o r p e r mole
pyruvate hydrogenated to l a c t a t e p o n d i n g t o d a t a from the
i s appr. 35 kJ, a f i g u r e
literature.
corres-
205 b) Epidermis At high concentrations of NADH and pyruvate, the maximum heat production in the steady state is a function of the enzyme activity in the tissue. Figure 4 shows two different ways to determine this figure: in the upper part the epidermis rests in a pyruvate buffer
Fig. 4 Thermogram of the hydrogenation of pyruvate by two epidermis specimens. More details are given in the text.
without NADH. On addition of NADH (arrow) there is a short endothermic heat of dilution and then an exothermic heat flow due to the activity of cellular LDH. The area under the thermogram indicates a heat of hydrogenation of pyruvate which demonstrates that NADH is completely oxidized with the same efficiency as in vitro. The
206 maximum heat flow corresponds to the maximum enzymatic turnover. In the lower part of the picture the buffer contains all necessary substances with the epidermis suspended above it, When it is submersed an equivalent heat flow is observed which stays constant over a prolonged period as the NADH concentration is four times that in the first experiment. This higher concentration of NADH could be used since there is no problem with a heat of dilution. From both experiments a maximum heat flow of appr. 35 (jW/mg wet weight of epidermis is calculated. Under the assumption that the enzyme activity and not a transport factor is the limiting step of this reaction one gets a minimum enzyme activity of appr. 60 mil/ mg, which is in good agreement with data for other organs given in the literature. Similar results are obtained if glucose is added to the system or if the epidermis is submersed in a glucose buffer.
In experiments with consecutive addition of NADH to epidermis in buffer, the heat output in each run is nearly constant and equals that of the enzymatic reaction in vitro. Before the last addition of NADH the epidermis may be pulled out, so that only the LDH which diffused from the tissue into the buffer is able to hydrogenate pyruvate. Since the endogeneous metabolism of the skin probe still continues, it is adviseable to remove the epidermis from the calorimetric vessel and then check the enzyme activity in the buffer. The remaining activity proofed that a large amount of LDH leaves the cells. Schaefer and coworkers (3) have found photometrically that 70 per cent of the enzyme activity leaks which seems to agree with the present data.
207 Conclusion These preliminary experiments show that calorimetrie
investigations
are suited for the evaluation of epidermal metabolism. Further e x periments will be aimed at other steps in glycolysis,
in the citric
acid cycle a n d in the respiration chain. Their results will be published elsewhere
(1?). Moreover, the influence of
photodynami-
cally active dyes - such as thiopyronine and 8-methoxypsoralen - on the metabolism of healthy tissue and of diseased skin or on special metabolic steps is of great interest for the dermatologie
therapy.
We thus hope to find a further approach to the photodynamic
therapy
of dermatosis and a deeper understanding of this effect.
A c k n o w l e d g e m e n t : The calorimeter was placed at our disposal by the Deutsche Forschungsgemeinschaft/Bonn-Bad
Godesberg
References 1
Anders,A., Lamprecht,I., Schaefer,H., Zacharias, H. : The use of dye lasers for spectroscopic investigations and todynamic therapy of human skin Arch.Derm.Res. 255, 211-214 (1976).
pho-
2
Laerum,0.D., Bjerknes,R.: Seasonal and individual metabolic variations of hairless mouse skin J.invest.Derm. 58, 284-290 (1972).
3
Schaefer,H., Zesch,A., Stüttgen,G.: Methodik zur fotometrischen Messung von Enzymaktivitäten in intakten menschlichen Epidermiszellen Arch.klin.exp.Derm. 239, 347-354 (1971).
4
Scott, J.J.van: Mechanical separation of the epidermis from the corium J.invest.Derm. J8, 377-379 (1952).
208 Gans,0., Glasenapp,I. von: Contributi al problema della psoriasi respitazione cutanea e glicolise al livello delle chiazze de psoriasi Dermatologia (Napoli) 2, 1-2 (1951)
6
Herdenstam,C.G. : On the in vitro metabolism of labeled glucose in normal and psoriatic skin slices Acta derm.-venerol. (Stockh.) 42, Suppl.47, 1-49 (1962)
7
Comaish,I.S. : Epidermal aldolase levels in psoriasis and normal skin Brit.J.Derm.Syph. 75, 337-343 (1963) Halprin,K.M., Ohkawara,A.: Lactate production and lactate dehydrogenase in the human epidermis J.invest.Derm. 47, 222-226 (1966)
9
Calvet,E., Camia,F.: Sur l'obtention des courbes de thermogenèse à partir des courbes enregistrées au microcalorimètre de E.Calvet J.Chim.Phys. 55, 818-826 (1958)
10
Zahra,C., Lagarde,L., Romanetti,R. : Etudes thermocinétiques de reactions lentes par microcalorimétrie à conduction Thermochim.Acta 6, 145-163 (1973)
11
Everse,J., Kaplan,N.O.: Lactate dehydrogenases: structure and function. in: Advances in Enzymology (Ed.A.Meister), Vol. 37, 61-133 (1973)
12
A.Anders, B.Schaarschmidt, H.Schaefer, I.Lamprecht Microcalorimetric Investigations of the metabolism of isolated human epidermis J.invest.Dermatol., submitted
4.4 Organperfusion in a Calvet Microcalorimeter: Adaptation of a Process Computer to an Experimental Arrangement Especially Designed for this Purpose F. Baisch Summary A system analysis, including the temperature regulation, the perfusion medium, and the systematic error caused by the friction in the flowline is given. The process computer controls the experiment, correlates different process variables, e.g. flow speed and Og-concentration of the perfusion medium, documents in EDP-usual data size (perforated tapes) and records with dot printer and telegraph. The purpose of the apparatus is to establish reproducible experimental conditions for pharmacological and kinetic research on the metabolism of perfused rat livers.
Introduction The aim of this paper is to give preliminary results on experiments concerning the metabolism of an isolated perfused rat liver. A l though a series of experiments has been performed, it seemed to us more interesting to give a more detailed description of the instrumental setup and the difficulties which must be overcome in this research. Once the method is established, it is quite easy to test the influence of a variety of drugs, pharmaca, antibiotics and metabolites on the metabolism of the liver. Moreover, the re-
210 suits obtained with the intact liver and liver slices may be compared, thus providing a calibration for the data from isolated and sliced tissues
[1,2].
Calorimetric research on tissues and on whole organs is intermediate between that on microbes and on whole organisms and involves special problems. If slices of tissues are cut off or single cells are separated by trypsinogen, they acquire new artificial surfaces and lose part of their regulation mechanisms. Many of the membranebound enzyms are distributed to the surrounding buffer system, the diffusion of internal cell enzymes is far higher and many cells are more like a homogenisate than intact cells. Under these conditions measurements of enzyme activities have little significance. As liver probes had been chosen as comparative systems for calorimetric skin measurements [3] we decided to investigate the fnetabolism of an intact isolated and perfused rat liver. As for as we know, this is the first time that such an experiment has been carried out in a calorimeter, and as there were technical difficulties because of aeration of the liver and heat leakages by the perfusion liquid, we want to emphasize the technical part of these experiments. Methods and techniques All the experiments were done on a CALVET microcalorimeter, type 1203 N° 04 114 (SETARAM/Lyon) with two vessels of 100 ml each and a sensitivity of appr. 55|aV/mW, and all equipments was designed for this instrument. In the first picture, a liver is symbolically indicated by the marked square. In the living organism, it is supplied as follows:
211
The inflow (1) carries arterial blood that comes from the aorta via several branchings. This constitutes a high-pressure supply. The supply (2) represents the blood from the intestinal vessel collected in the portal vein. Since this blood has already flowed through a capillary network, the pressure is much lower. The slightest pressure is found in the outflow (3). It flows through a short vein into the right vestibule. In case of disease (cirrhosis, fatty liver due to alcohol) and, unfortunately, also in our experiments, part of the liquid flowing through the liver drains off through the parenchyma via liver surface. Thus, the pressure in the abdominal space, or as in our experiments, the pressure in the reaction vessel, cannot be neglected. But, otherwise, the classical perfusion technique is applied [4,5,6] . The liver, however, is totally excised for this purpose and placed on a support in the calorimetric vessel. For a short period of time (about 8 hours), the high-pressure supply can be removed without causing severe liver damage, especially when the portal vein blood is oxygenated. Even in vivo, the arterial inflow contains only "\5% of the necessary oxygen. This can be compensated in vitro by a high oxygenation of the perfusion solution. Consequently, for a simplified model the following conditions are necessary in order to guarantee hepatic functioning in the absence of the organism. 1. Physiological pH and oncotic pressure in the perfusion solution are maintained by means of organic buffers, salts and protein. 2. Sufficient oxygen is supplied and 3. Excess CC>2 is eliminated by an oxygenizer perfused with carbogenic gas (95%
5% CO,,).
4. Elimination of metabolic catabolites which are normally excreted
212 by the kidneys, and 5. Nutritive substances and pharmaceuticals to be tested can be exchanged by way of dialysis membranes. 6. Physiological perfusion pressure and 7. Relatively constant temperature and maintained by the instrumental setup described below.
>
BLOOD [¿OUTFLOW
storage Perfused med
pump
i
r
KCN O2 CO2 Pharmakon Fig.1
waste matter Nutrlans
Perfusion flow system. The liver is connected as follows: Inflow : (1) Arterial supply. It is ligatured for the isolated liver. (2) Portal vein Outflow: (3) (Lower large) vena cava inferior (4) Vessel outflow (5) Bile outflow In the inflow line there may be an exchange of gases, metabolites and waste matter via dialysis membranes. Drugs are added to this line by means of syringes.
213 We mention temperature last,since, in the classical perfusion technique, it is subject to the greatest deviation from the value in vivo. The liver is undercooled in order to suppress its activity, the medical term for this being "hibernation. 11 20°C and 30°C are common temperatures for the perfusion solution. Simplified according to van't Hoff, this means a quarter or half of the usual metabolic capacity. When these conditions are met, there is no necessity for erythrocytes as oxygen carriers. For calorimetric investigations, temperature cannot be neglected. With ideal experimental conditions, the perfusion medium must flow isothermally into the reaction vessel of the calorimeter. This can be approximately achieved only by a cascade regulation. In order to balance out the last thousandths of a degree, the technical expense must be driven very high, especially since the medium is flowing, and for the rat liver a control flow of 10-20 cm /min. must be dealt with. For velocities up to 20 cm/s, which we observed in the afferent capillaries, the controlled system must be 20 cm long, in order to compensate within one second for a possible difference in temperature. In the classical perfusion devices, the liver is perfused by means of hydrostatic pressure. Since there is a long way into the calorimeter, this difference in pressure cannot be transferred into the calorimetric vessel by communicating tubes. Experiments in which the liver is perfused with a constant flow by means of peristaltic pump are unphysiological. In many cases, disruption of the tissue is the consequence, and the liver will no longer be able to regulate its perfusion independently. In order to avoid these difficulties, it is necessary to determine the
214 pressure value between liver inflow and outflow, and to regulate the output of the peristaltic pump accordingly. At present, the controlled system is positioned in such a way that the flow decreases to a tenth when the pressure is doubled. Further experiments are needed to indicate whether this linearly controlled system can be maintained. The pressure receiver for the control of the vessel pressure is shown in Fig.2. Moreover, the last cascade of temperature control is recognizable. The difference in temperature between the inflowing medium and the block of the Calvet calorimeter is measured. The bridge tension arising in case of a deviation is reinforced and electric power is delivered accordingly to a resistance heater. At the moment, we perform experiments with a glass spiral which is wound with resistance wire. The perfusion medium flows through the spiral, penetrates the reaction vessel via a passive heat exchanger and perfuses the liver. Then it is led within spirals along the inside of the reaction cylinder and passes into a sort of "backflow heater" for the inflowing medium above the aforementioned heating spiral. This route is a kind of inverse feedback. When the phase relationship between temperature difference and heater current is right, this system is effective. However, phase shifting is flow-dependent, and liquid flow has another effect in itself as can be seen from Fig.3. It shows the inner pressure P along the distance S which must be covered by the perfusion medium via the communicating tubes of the device: from the collecting vessel
through a pump,
dialysis membranes, different heaters into the calorimetric vessel and through the liver, and then back by the same route. From this point, it drops back into the vessel (V.4.2.and
V.4.1.—0.5).
215
0 2 ". CO2" Measurement and
fraction-collector
Liver Pump
Vessel
Fig.2
Control-loop for pressure and temperature
The pressure transducer P^ monitors the difference between inflow and outflow. P^. between outflow and reaction vessel. An electronic filter suppresses unwonted oscillations of the pump control. The temperature of the inflowing medium is measured a few centimeters above the entrance into the reaction vessel and compared with that of the heat sink of the Calvet calorimeter. The probe T is placed in a bulge of the glass tube leading to the liver. Thus it is situated in the flow without disturbing it. The heater is a glass helix wrapped with a resistance wire.
216 But this is only the case if the flow velocity tends towards zero and if there is no pressure loss due to flow friction. Actually, the pump must produce a high pressure in order to cause a pressure difference in the liver, despite the previously mentioned devices the medium flows through. Within the liver, the flow forms branches. Part of the liquid flows off over the liver surface, and in all our experiments, this constituted a non-negligible percentage of the overall flow. In such a total operation, small capsular lesions due to the liver preparation are unavoidable. Besides, the organ would tampon itself if the vessel pressure were not adjusted. Thus, the conduction at the discharge end must be lowered so far that the pressure differences in the liver are maintained when flow velocities of about 20 cm/min are present. With laminar flows (Reynold number smaller than 2320) and constant tube diameter, the pressure gradient depends on the square of the flow velocity (and on geodetical conditions which are independent o f flow) •This pressure loss is converted into heat, which is added to all our metabolic heat measurements as a systematic error. Our studies showed that the flow heat has the same order of magnitude as the heat production by metabolism. This means that the error produced by friction and by the change in friction due to varying flows has to be eliminated. For this purpose, some kind of "line characteristic curve" for the liver must be ascertained. I borrowed this term from the technicians in line systems for heating and air conditioning, and it refers to nothing else but to the curve path: necessary discharge pressure as a function of the amount flow. As the inner surface of our reaction vessel is two-thirds covered by a double coil 1.30 m in length, the heat of friction developed therein must also be considered.
217 However, this method of leading the liquid which drains off from the liver along the inside of the reaction cylinder is needed to insure that all the heat produced in the organ is measured in the calorimeter
[7],
The additional heat of flow in this coil can be calculated. Consequently, the heat due to flow friction is composed of the sum of separate components: firstly, the frictional heat along the two liver paths and secondly, the heat developing along the cylinder coils. Only if this value is deduced point by point from the total heat flow, can a curve path be developed with which the actual metabolic capacity can be assessed. The second coordinate a r r o w ( p ^ ) indicated in the y-direction on Fig.3 is to show that the perfusion circulation as a whole can be set under a higher than atmospheric pressure. This possibility is provided because with higher pressure, more oxygen is dissolved in the perfusion solution and therefore available for the liver. With an overpressure of 1.8 atmospheres, enough oxygen is dissolved so that the erythrocytes of a mammalian organism no longer participate in the gas exchange. In our case, this means that we can abandon the artificial hibernation technique and achieve higher metabolic rates at higher temperatures[8,9],With sufficient oxygen supply, the perfusion flow even decreases, so that we are able to distinguish clearly the metabolic signal from the disturbing frictional heat.
218
Fig.3 The abscissa represents the distance the medium flows, the ordinate the pressure on the inner surface of the tube. From point 0.5 or V.5 the pressure is increased to V.1 by means of a peristaltic pump at a flow rate V. From V.1 the pressure on the inner surface or the tubes decreases to the point V.7. From the liver exit V.3.1 and the reaction vessel V.3.2 the medium flows back to points V.4.1 and V.4.2. From here it drops back into the storage container.
219 However, we intend to minimize the amount of liquid in the perfusion cycle, so that the liver may act with a volume similar to that of the blood and extravasal liquid of the donor animal (appr. 10 to 20 ml). Summarizing the requirements necessary for the perfusion device, the following activities must be presupposed in order to obtain reproducible values. I.
Prior to the test: 1. Preparation of the rat liver. 2. Control of the perfusion solution. 3. Control of the oxygenizer function. 4. Care of the artificial kidney.
II. During the test: 5. Control of the perfusion pressure. 6. Checking of the automatic control systems of temperature for all thermostats and the corresponding water-bearing ducts. 7. Well-timed switching on of the recording. 8. Sampling and control of the C0^ and 0^ recording. 9. After a suitable time, starting of a slow increase of the overall pressure
of the perfusion circulation with all
difficulties of leakage control. 10. Addition of substances to be tested. 11. Recording of the individual terms. 12. Poisoning of the liver at the end of the test to get the experimental zero line. As few of the perfusion line as possible should come into contact with the poison. 13. Conversion of the extremely long registered curves in order to assess wether the experiment is usable at all.
220 14. If this is the cose, the new curve path must be determined point by point. Since this would require too much time or too many coworkers, we plan to assign all the above points except liver preparation to a process calculator. All data from measurement and limiting values are read in cyclically and, accordingly, the previously mentioned devices are connected or disconnected. The dot printer shows the instantly corrected curve path - and that seems to be most important for us. All primary test data are present, corresponding to the computer data. This means that a test procedure may be simulated again at any time, and that the data may be combined according to other points of view. The procedure is fixed for one set of experiments. With only one parameter being changed, the problems, most of which can be solved only empirically, may be more easily eliminated, thus enabling an optimal test setup and procedure. Literature [1 ] De Venanzi, F., Pena, F., Jimenez, V.O., De Alvarado,^H.: Effect of glucagon, epinephrine, cyclic 3', 5'-AMP, N -2'-odibutyryl cyclic 3', 5'-AMP and insulin upon the phosphate exchange of the isolated perfused fed rat liver. Endocrinology 95, 741-746 (1974). [?j Woodside, K.H., Ward, W.F.,Mortimore, G.E.: Effects of glucagon on general protein degradation and synthesis in perfused rat liver. J. Biol. Chem. 249, 5458-5462 (1974). [3] Anders, A. et al.: Calorimetric investigations of metabolic regulation in human skin. This book.
221 [4] Miller, L.L., Bly, C.G., Watson, M.L., Bale, N.E.: The dominant role of the liver in plasma protein synthesis. J. exp. Med. 94, 431-453 (1951). [5] Staib, W., Scholz, R. : Stoffwechsel der isoliert perfundierten Leber. Springer Verlag, Berlin (1968). [6] Höllerer, M., Breuer, H.: Eine optimale Methode zur hämoglobinfreien Perfusion der isolierten Rattenleber. Z. Klin. Chem. 12, 398-402 (1974). [7] Klinger, H.G.: Heat transfer in perfused biological tissue. Bull. Math. Biol. V3C, 403-415 (1974). [8] Harms, H., Kirsch, U. : Hyperbare Oxygenation. In: Praxis der Intensivbehandlung, Ed. P. Lavin, 3. Aufl. Kap. 21, Thieme Verlag, Stuttgart (1975). [9] Reisewitz, H.: Nierenfunktion während des totalen Blutersatzes mit einer Fluor-carbon-Emulsion bei den Ratten. Dissertation Fachbereich Medizin der Universität Hamburg, Hamburg (1974).
5. Medical Calorimetry
5.1 Applications of Microcalorimetry in the Medical Field I. Wadso
INTRODUCTION Practically all processes are accompanied by heat effects. Calorimetry thus forms a general and quantitative analytical tool for simple chemical reactions as well as for an assembly of processes in a cellular system. The fact that calorimetric methods are so general makes them also very unspecific. This is a serious limitation for their practical use in many types of analytical problems. However, in biochemistry and biology the inherent specificity of the reaction systems themselves often allows the use of an unspecific analytical method. One may also note that, in particular for very complex systems, it is sometimes advantageous to use an unspecific method rather than a very specific analytical method since it is then more likely that unknown phenomena will be discovered. For living systems we may further note that life processes, when observed calorimetrically, are self-recording and that it is not necessary to disturb the biological system, e.g. by addition of reagents. Another factor of importance to investigations on bio-systems is that calorimetric methods, in contrast to spectrophotometric methods, do not require optically clear solutions and can be used with tissues or suspensions. When an unspecific analytical method is used on a complex process it is necessary to make sure that the property actually measured is adequately related to that property or phenomenon one has decided to study. As heat effects are evolved at all kinds of processes calorimetry is particularly vulnerable to systematic errors or misinterpretations (1). This is not the least the case in experiments on complex systems which have not been very thoroughly evaluated, e.g. most cellular systems. In modern clinical work chemical analysis plays a key role in the diagnosis of most diseases and for the control of results of medical treatment:
226 determinations of concentrations of metabolites, of enzymes and other proteins and of various cofactors. A large variety of instrumental procedures are utilized: spectrophotometry, electrophoresis, radioactive counting techniques etc. "but calorimetry is as yet of no practical importance in this field. The instrumental methods in current use in clinical chemical analysis have reached a h i g h level of technical development and one can conclude that this is a very competitive
field.
However, there are comparatively few instrumental methods which are useful for the characterization of cellular materials. It is therefore
judged
that calorimetry will prove to be more important for practical analytical work on this level than on the chemical level. Recent microcalorimetric studies on bacteria, blood cells and tissues certainly point in the direction of interesting new analytical determinations. Many research groups rely today upon calorimeters as key instruments for bio-thermodynamic investigations. The impact on the applied areas by such studies cannot easily be assessed, but their importance for the medical field should not be neglected. For instance, studies of the thermodynamics of interaction between biopolymers and low molecular compounds
(including
drugs), of reactions involving immunochemical systems, of unfolding reactions etc., all contribute to a deeper understanding of processes which are of a fundamental importance for medicine. However, the present review will be concerned mainly w i t h the use of microcalorimetry as a general analytical tool. Microcalorimetry and its use in biochemistry and biology as a thermodynamic tool and as an analytical tool have recently been discussed elsewhere (1). Microcalorimetric instrumentation was discussed in some detail (1), cf. also (2), and will therefore not be dealt w i t h in this paper.
WORK ON THE BIOCHEMICAL LEVEL Enzyme Assays Benzinger and Kitzinger seem to have been the first to demonstrate the usefulness of calorimetry for determination of enzyme activity (3). These
227 workers used their batch calorimetric method to follow the purification of a glutaminase preparation which was contaminated by carboxylase. Using glutamic acid as a substrate the decline in the undesired enzyme activity could be followed. Another early study was the one by Brown et al. on ATPase activity in erythrocyte ghosts {h). Using a flow microcalorimetric technique Monk and tfadso (5) reported a method for the assay of a number of clinically important enzymes. Solutions of glucose oxidase, choline esterase, alkaline phosphatase, lactic acid dehydrogenase were investigated as well as a tissue homogenate with ATPase activity. The enzyme preparation was mixed with an excess of substrate to give a zero order reaction system which was pumped through the flow through cell of the calorimeter. The displacement
of the baseline
was directly proportional to the heat effect and thus to the enzyme activity. The possibilities for "chemical amplification" were discussed, cf. (1), and in particular the use of a suitable buffer system was demonstrated. A typical example is provided by hydrolysis of an ester, e.g. acetyl cholin, (1)
(ROAc + H 2 0
-+• ROH + Ac" + H + )aq
The enthalpy change of reaction (1) is close to zero, AH = 1.2 kj mol However, if the proton released is taken up by an amine buffer with a highly exothermic enthalpy of protonation (e.g. tris with AH = _1 prot -^7.5 kj mol , the reaction will become strongly exothermic. If the hydrolysis process is carried out in a phosphate buffer (AH = -1+.7 kJ mol ^ ) the measured reaction will be only weakly exothermic. Several other microcalorimetric studies of enzyme activity measurements have since been reported e.g. (6) ( 7) (8) ( 9 ) s e e also the recent batch calorimetric studies by Rehak et al. (10) involving enzymes in solution as well as immobilized enzymes.
Determination of Substrate Concentration It has been shown that nearly the same flow calorimetric technique as was
228 used for enzyme assays can be adopted for substrate determination, the difference being that the substrate concentration should be rate limiting (5)(7). In principle, however, it is easier to determine substrate quantities in a batch or a stopped flow experiment. The heat quantity evolved in the experiment, after small corrections have been applied, is directly proportional to the quantity of substrate in the sample and the result is thus independent of the activity of the enzyme prepration used. Goldberg et al (11) have applied a batch calorimetric procedure for the determination of glucose in serum using the hexokinase reaction. These workers have also looked into the thermochemistry of this process in some detail. Glothlin and Jordan (12)(13) employed the same reaction for glucose determination in samples of serum, plasma or whole blood. These workers used an injection procedure with a simple Dewar vessel calorimeter. The precision obtained in these calorimetric substrate determinations appears to be similar to that found with conventional techniques. Johansson et al. (1 ) demonstrated the use of immobilized enzymes in flow microcalorimetric determination of substrate quantities. An LKB flow calorimeter was equipped with a modified flow cell holding a column charged with about 0.3 ml of immobilized enzyme. When a solution containing a substrate was pumped through the system the reaction took place and a peak was recorded. The area under the peak is directly proportional to the heat quantity evolved and thus to the. amount of substrate. More recently simple thermistor operated flow instruments for substrate determinations using immobilized enzymes have been designed by Mosbach and coworkers (15,16,17) by Canning and Carr (18) and by Schmidt et al. (19). The method has successfully been used for determination of e.g. glucose, lactase, uric acid, urea, penicillin and cholesterol. The attainable precision varies somewhat with the system investigated but it appears to approach that obtained with a more elaborate calorimetric technique. It is judged that this technique will soon be established in routine substrate analysis.
Plasma Coagulation Plasma coagulation is the result of a very complex series of processes for which thermal observation methods seem to be suitable. Bostic and Carr (20)
229 measured, clotting time with a thermometrie method and. their thermograms also indicated the presence of different reaction steps. Watt et al. (21) used a more developed calorimetric technique and determined clotting time with a good precision (± SD was usually about 3 s). They also found characteristic heat effect patterns before and after the coagulation period. It seems as calorimetric investigations on the plasma coagulation system can yield new information and that the method can develop into a clinically useful technique.
WORK ON CELLULAR SYSTEMS Microorganisms Calorimetric methods have been shown to provide realistic alternatives to existing methods for the detection and enumeration of microorganisms as well as for their identification. Calorimetry can also provide continuous information about aerobic as well as anaerobic microbial growth processes which may be utilized e.g. in rapid antibiotic sensitivity tests. It seems very likely that microcalorimetric methods will be developed into clinically useful methods as well as in corresponding research areas. Microbial activity.
The use of microcalorimetry for detection of micro-
organisms and for their enumeration is presently being explored in several areas (1). A clinical application has been reported by Beezer et al. (22) who investigated the potential use of flow calorimetry for the detection 3 5 of bacteriuria. Samples to be tested contained originally 10 - 10 bacteria.ml \ They were mixed with a nutrient broth and were allowed to grow overnight under standardized conditions before being presented to the calorimeter. Results showed that it is possible to discriminate 3
^
between different levels of initial bacterial concentrations (10 , 10 or 10
bacteria-ml 1). It was concluded that the technique would lend
itself for automatization in addition to the possiblity of extending the calorimetric experiment to the identification of the bacteria and subsequent antibiotic sensitivity tests (cf. below). It seems, however, as if the rapid chemical tests now used for the detection of bacteriuria
230 will be difficult to compete with; probably calorimetry is more promising in connection with bacterial infection in blood, in particular when coupled to identification of the organisms from their growth patterns (23). Regardless of the detection principle used it is necessary in clinical work to grow the microorganisms for some time before they can be enumerated. In studies of the optimization of growth media composition calorimetry appears to be an ideal method. Identification of organisms.
Calorimetrically recorded growth patterns
for bacteria can be used as a method for their identification as demonstrated by Russel and his associates (2U)(25). These workers have examined growth patterns from a large number of different organisms and found that they normally were different enough to serve as a fingerprint identification. The bacteria were grown in brain-heart infusion media and the thermograms were recorded with a multichannel batch calorimeter. Similar results have also been reported by Staples et al. (26). Johansson et al. (27) have developed a computer based identification technique for thermograms of this kind. Ljungholm et al (28) have recently concluded a microcalorimetric study on mycoplasmas. Also for these microorganisms growth patterns showed characteristic differences which may be used for identification purposes. It seems likely that the growth pattern identification method can be developed to a powerful technique in clinical bacteriology. However, bacterial growth patterns are sensitive to variations in experimental conditions, not the least the oxygen potential (29), which thus has to be carefully controlled. It is believed that there is a great need for more thorough research concerning the biochemical and biological basis to the thermogram. Effect of antibiotics. Bindford et al. (30) have described a flow calorimetric screening method for antibiotic sensitivity testing. A culture of growing bacteria was established the increase in heat effect (being related to bacterial growth) was observed. In subsequent experiments
231 solutions of antibiotica were added to new samples of the bacterial suspension. The sensitivities of the culture to the antibiotic tested were recorded in terms of the continued increase in heat effect (indicating resistent organisms), or unchanging or decreasing heat effect (indicating that the bacteria were sensitive to the drug tested). Good agreement was obtained with the disk agar diffusion method, but the calorimetric method provided results 12-2U h before the conventional technique. Mardh et al. (31,32) have recently studied the kinetics of the actions of various antibiotics. A batch calorimetric method as well as a flow method was used. Substantial differences in the kinetics of action were found, e.g. doxycycline and tetracycline, which could not be demonstrated by conventional bacteriological techniques such as the determination of MIC (minimum inhibitory concentration). The results suggested that the techniques used can find a practical value in establishing optimum doses and dose intervals in antibiotic therapy. The same type of experiments with antibiotics have also been conducted recently by Semenitz and Tiefenbrunner (33) (3*+).
Blood cells During the last few years several groups have performed calorimetric investigations on blood cells. The object has usually been to investigate the potential use of calorimetric techniques as a diagnostic tool in clinical hematology. Bandmann et al. (35) have made measurements on whole blood from healthy subjects and made a comparison with results obtained on purified samples of erythrocytes, granulocytes, lymphocytes, thrombocytes and cellfree plasma. The sum of the values for the fractions was found to be in full agreement with the value found for whole blood. Erythrocytes.
Following the first study by Levin and Boyo (36) a
substantial systematic work has now been made on the heat production in erythrocytes from healthy human subjects ( 3 T ~ ) . In the recent studies by Monti and Wadso (U1,1+2) the effect of variation of several experimental parameters was investigated (cell preparation technique, suspension media,
232 pH, temperature, glucose concentration, storage conditions and the calorimetric technique). Using the derived data for the variation in heat effect with experimental conditions actual experimental values could he corrected to a given standard state (pH 7.^0, 3T°C, column separation technique, storage time 1 h at U°C etc.). Such standard values are more suitable for comparison purposes than the directly obtained experimental values, e.g. when comparing data for cells from patients with normal values. In addition to studies on erythrocytes from normal subjects measurements have been performed for erythrocytes from patients with different kinds of anemia. Boyo and Ikomu-Kumm (U3) found highly increased values in sickle cell erythrocytes. Monti and Wadso (37) and Levin (38) have reported significantly increased levels in other anemias. Results of an investigation by Monti and Wadso ( M ) on erythrocytes from patients with hyperthyriodism suggest that calorimetric methods may have a practical value for the control of medical treatment of this disease. The pentose shunt is stimulated in erythrocytes by the presence of methylene blue (Mb) a n d ^
has therefore been thought that heat effect
measurements on erythrocytes during Mb stimulation may in some cases increase the diagnostic value of a calorimetric measurement. Monti and Wadso (1»5) have reported results from a methodological study where they observed an increase in the heat effect by a factor of 10 (phosphate buffer, Mb concentration = 10 ^ M), cf. Levin C*6) and Minakami and de Verdier (U0). Monti (1*7) has recently shown that erythrocytes from patients with chronic uremia have significantly increased heat effect values both in the presence of Mb and under unstimulated conditions. Leucocytes.
Levin has reported results from flow calorimetric measurements
on leucocyte mixtures (i.e. essentially granulocytes and lymphocytes) from normal persons and from patients (^8,1(9,50). The measurements were found to be disturbed by the adhesiveness of the cells (the granulocytes) and Levin attempted to overcome this by introducing air bubbles in the liquid flow (^9). Using a static calorimetric method Bandmann and Wadso (51) have further investigated the problem with adhesiveness of granulocytes, cf. (35). Usually a very large heat effect was observed during the initial
233 phase of the calorimetric measurement, in particular if the cells were suspended in buffer. With plasma suspensions better (although not always satisfactory) steady states were observed. Levin (U9) has reported results from phagocytosis stimulation of leucocytes by latex particles and subsequently Levin and Thomasson (50) utilized a similar technique in an interesting clinical application on leucocytes from patients with systemic lupus erythematosus (SLE). In this case the stimulation was caused by homogenates from the patients own leucocytes. A good discrimination was obtained between samples from normal subjects and from SLE-patients. In their work on whole blood and its main fractions Bandmann et al. (35) reported results from static calorimetric measurements on lymphocytes. Good steady state values were observed but the heat effect values were found to be very dependent on the cell concentration. Krakauer and Krakauer (52) have recently made a systematic study on the heat production by lymphocytes under normal conditions and during stimulation with antigen (DNP-BSA), mitogenic lectin (Con A) and in the presence of various inhibitors. In a more preliminary study Johns et al. have reported results from other immunological experiments with leucocytes (53). Thrombocytes.
Levin (U8) has reported results from flow calorimetric
measurements on thrombocytes and Bandmann et al. (35) obtained very similar results in measurements under static conditions. A more systematic study of heat production in thrombocytes under different experimental conditions has recently been finished (5*0. In the study by Bandmann et al. (35) it was noted that thrombocytes initially showed very large heat effects if the cells had been stored at low temperature for a short time (ca. it°C for 0.5 h). It was concluded that the effect was due to cell aggregation. Thrombocyte aggregation has been studied in some detail by Ross et al. (55) using a batch calorimetric technique. These workers noted very significant heat effects during (mild) agitation and dilution of the thrombocyte suspensions.
234 Other Investigations on Cellular Material Boivinet et al.(56) have demonstrated the potential use of mieroealorimetry for the determination of hormone activity using rat epidydimal fat tissue kept in a nutritional buffer in the calorimetric vessel. When a solution of insulin was added there was a substantial increase in the heat effect. From the quotient between the increased heat effect and the original heat effect from the fat tissue an activity value for the insulin preparation can be calculated. In a study with isolated pancreatic 3~cells Gylfe and Hellman (57) measured the heat effect with and without the presence of glucose. In a search for a viability test for transplant organs Engberg et al. (58) have reported results from an exploratory study on rat kidney biopsies. The results showed a parallel decrease in heat effect and oxygen consumption during storage.
CONCLUSION The recent developments in mieroealorimetry have led to a significant interest for the technique in the medical field. As yet calorimetry has not found any use as a routine analytical tool in clinical work but it has become established on the research level as an analytical tool and for thermodynamic studies. It is felt that with the use of calorimetry a range of new and medically interesting analyses can be developed, perhaps in particular on cellular material. It is clear that the methodological work has only begun. There is a need for extensive studies, on a very basic level, concerning the detailed interpretation of recorded heat effect values and thermograms.
235 REFERENCES 1. Spink, C. and Wadsö, I.: Calorimetry as an analytical tool in biochemistry and biology. In D. Glick (ed.), Methods in biochemical analysis, vol. 23, p. 1-159, Wiley-Science, New York (1976). 2. Wadsö, I.: Microcalorimeters. Quart. Rev. Biophysics,
383-^27
(1970). 3. Benzinger, T.H. and Kitzinger, C.: Microcalorimetry, new methods and objectives. In C.M. Herzfield (ed.) Temperature - its measurment and control in science and industry, Vol. 3. Part 3. Reinholds, New York (1963). Brown, H.D., Evans, W.J. and Altschul, A.M.: Analysis by differential calorimetry of ATPase activity in potato apyrose and red blood cell ghosts. Life Sei. 3, 1U87 (196U). 5. Monk, P. and Wadsö I.: Flow calorimetry as an analytical tool in biochemistry and related areas. Acta Chem. Scand. 23, 29-36 (1969). 6. Konicekova, J. and Wadsö, I.: Use of flow calorimetry for the determination of choline esterase activity and its inhibition by organophosphorous pesticides. Acta Chem. Scand. 25,, 2360-2362 (1971). 7. Beezer, A.E. and Stubb, C.D.: Application of flow microcalorimetry to analytical problems. I. Determination of organophosphorous pesticides by inhibition of choline esterase. Talanta, 20, 27-31 (1973). 8. Beezer, A.E., Steenson, T.I. and Tyrell, H.J.V.: Application of flowmicrocalorimetry to analytical problems. II. Urea-urease system. Talanta 21, k6l-kjh (197*0. 9. Yourtee, D.M., Brown, H.D., Chattopadhyay, S.K., Phillips, D. and Evans, W.J.: Microcalorimetry applied to clinical enzyme measurements. Anal. Lett. 8^, ¡+1-1*9 (1975). 10. Rehah, N.N., Everse, J., Kaplan, N.O. and Berger, R.L.: Determination of the activity and concentration of immobilized and soluble enzymes by microcalorimetry. Anal. Biochem. 70, 381-386 (1976). 11. Goldberg, R.N., Prosen, E.J., Staples, B.R., Boyd, R.N. and Armstrong, G.T.: Heat measurements applied to biochemical analysis: Glucose in human serum. Anal. Biochem.
68-73 (1975).
236 12.
McGlothlin, C.D. and Jordan, J.: Enzymic enthalpimetry, a new approach to clinical analysis: glucose determination by hexokinase catalyzed phosphorylation. Anal. Chem. Vf, 786-790 (1975).
13.
McGlothlin, C.D. and Jordan, J.: Thermochemical determination of glucose in serum plasma and whole blood without prior deproteinization. Clin. Chem. 21_, 7^1-7^5 (1975).
14.
Johansson, A., Lundberg, J., Mattiasson, B. and Mosbach, K.: The application of immobilized enzymes in flow microcalorimetry. Biochem. Biophys. Acta 30^, 217-221
15.
Biochem. Biophys. Acta 36h, 16.
(1973).
Mosbach, K. and Danielsson, B.: An enzyme thermistor. 1Uo—145 (197*0 .
Mosbach, K., Danielsson, B., Borgerud, A. and Scott, M.: Determination of heat changes in the proximity of immobilized enzymes with an enzyme thermistor and its use for the assay of metabolites. Biochem. Biophys. Acta ¡¿03,
17.
256-265
(1975).
Mattiasson, B., Danielsson, B. and Mosbach, K.: Enzyme assay of cholesterol, glucose, lactose and uric acid in standard solutions as well as in biological samples. Anal. Letters, 9,
18.
217-23U (1976).
Canning, L.M., Carr, P.W.: Rapid thermochemical analysis via immobilized enzyme reactors. Anal. Lett. 8, 359-367 (1975).
19-
Schmidt, H.-L., Krisam, G. and Grenner, G.: Microcalorimetric methods for substrate determination in flow systems with immobilized enzymes. Biochim. Biophys. Acta k29,
20.
283-290 (1976).
Bostic, W.D. and Carr, P.W.: A precise, continous recording clot timer based on a thermometric detection system. Amer. J. Clin. Pathol. 60, 330 (1973).
21.
Watt, D., Berger, R.L., Green, D. and Marini, M.A.: Thermal titration: Application of calorimetry to the study of plasma coagulation. Clin. Chem. 20, 1013-1017 (197>0.
22.
Beezer, A.E., Bettelheim, K.A., Newell, R.D. and Stevens, J.: The diagnosis of bacteriuria by flow microcalorimetry. A preliminary investigation. Science Tools, 21_, 13-16 (197*0 •
23.
Kallings, L.O.: Report at Sec. Symp. on Microcalorimetry in Microbiology. Bedford College, London (1975).
237 2k. Boling, E.A., Blanchard, G.C. and. Rüssel, W.J.: Bacterial identification by microcalorimetry. Nature, 2U1, U72-U73 (1973). 25. Rüssel, W.J., Farling, G.C., Blanchard, G.C. and Boling, E.A.: Interim review of microbial identification by microcalorimetry. In D. Schiessinger (ed.), Microbiology-1975, p. 22-31. American Society fo Microbiology, Washington, D.C. (1975). 26. Staples, B.R., Prosen, E.J. and Goldberg, R.N.: Fine structure in thermal growth patterns of bacteria by microcalorimetry. NBS report No 73-181, Washington, D.C., National Bureau of Standards (1973). 27. Johansson, A., Nord, C-E. and Nordström, T.: Computer evaluation of bacterial growth patterns based on microcalorimetric data. Science Tools, 22, 19-21 (1975). 28. Ljungholm, K., Märdh, P.-A., Renström, K. and Wadsö, I.: Microcalorimetric studies of mycoplasmas, acholeplasmas and ureaplasmas. J. Gen. Microbiol. In press (1976). 29. Monk, P. and Wadsö, I.: The use of microcalorimetry for bacterial classification. J. Applied Bact. 38, 71-7^ (1975). 30. Binford, J.S., Binford, L.F. and Adler, P.: A semiautomated microcalorimetric method of antibiotic sensitivity tests. Am. J. Clin. Pathol. 59, 86-9^ (1973). 31. Märdh, P.-A., Ripa, T., Andersson, K.-E. and Wadsö, I.: Microcalorimetry as a tool for evaluation of antibacterial effects of doxycycline and tetracycline. Scand. J. Infect. Dis. In press (1976). 32. Märdh, P.-A., Ripa, T., Andersson, K.-E. and Wadsö, I.: Kinetics of the actions of tetracyclines on E. coli as studied by microcalorimetry. Antimicrob. Ag. and Chemother. In press J_0 (1976). 33. Semenitz, E. and Tiefenbrunner, T.: Mikrocalorimetrische Untersuchungen zur Bestimmung der Antibakteriellen Aktivität von Chemoterapeutika. Arzneimittelforschung. In press (1976). 3^. Semenitz, E. and Tiefenbrunner, F.: Mikrokalorimetrische Untersuchungen zur Characterisierung des Wirkungstyps von Tetracyclinen. Med. Klinik. In press (1976). 35. Bandmann, U., Monti, M. and Wadsö, I.: Microcalorimetric measurements of heat production in whole blood and blood cells of normal persons. Scand. J. clin. Lab. Invest. 35, 121-127 (1975).
238 36.
Levin, K. and Boyo, A.: Heat production from erythrocytes. Scand. J. clin. Lab. Invest. Suppl. J_l8, 55 ( 19T1 ) •
37-
Monti, M. and Wadsö, I.: Microcalorimetric measurements of heat production in human erythrocytes. I. Normal subjects and anemic patients. Scand. J. clin. Lab. Invest. 32, U7-5U (1973).
38.
Levin, K.: Determination of heat production from erythrocytes in normal man and in anemic patients with flow microcalorimetry. Scand. J. clin. Lab. Invest. 32, 55-65 (1973).
39.
Levin, K., Fürst, P., Harris, R. and Hultman, E.: Heat production from human erythrocytes in relation to their metabolism of glucose and amino acids. Scand. J. clin. Lab. Invest. 3]t, 1U1-1U8 (197*0.
Uo.
Minakami, S. and de Verdier, C.-H.: Calorimetrie study on human erythrocyte glycolysis. Heat production in various metabolic conditions. Eur. J. Biochem.
U1.
65, U51-U60
(1976).
Monti, M. and Wadsö, I.: Microcalorimetric measurements of heat production in human erythrocytes. III. Influence of pH, temperature, glucose concentration, and storage conditions. Scand. J. clin. Lab. Invest. In press (1976).
1*2.
Monti, M. and Wadsö, I.: Microcalorimetric measurements of heat production in human erythrocytes. IV. Comparison between different calorimetrie techniques, suspension media and preparation methods. Scand. J. elin. Lab. Invest. In press (1976).
1+3•
Boyo, A.E. and Ikomi-Kumm, J.A.: Increased metabolic heat production by erythrocytes in sickle-cell disease. Lancet 1_, 1215 (1972).
Uit.
Monti, M. and Wadsö, I.: Microcalorimetric measurements of heat production in human erythrocytes. II. Hyperthyroid patients before, during and after treatment. Acta Med. Scand. In press (1976).
1+5-
Monti, M. and Wadsö, I.: Microcalorimetric measurements of heat production in human erythrocytes. Heat effect during methylene blue stimulation. Scand. J. clin. Lab. Invest. In press (1976).
U6.
Levin, K.: Microcalorimetric studies of human blood cells. Scand. J. clin. Lab. Invest. Suppl. 135, 32 (1973).
239 hf. Monti, M.: Microcalorimetric measurements of heat production in erythrocytes of patients with chronic uremia. Scand. J. Haematol. Submitted (1976). U8.
Levin, K.: Heat production by leucocytes and thrombocytes measured with a flow microcalorimeter in normal man and during thyroid dysfunction. Clin. chim. Acta 32, 87-91» (1971).
1*9- Levin, K.: A modified flow calorimeter adapted for the study of human leucocyte phagocytosis. Scand. J. clin. Lab. Invest. 32, 67~73 (1973). 50.
Levin, K. and Thomasson, B.: Leucocyte stimulation by autohomogenate measured with flow microcalorimetry in Systemic Lupus Erythematosus. Acta Med. Scand. 195, 191-200 (197*0-
51. Bandmann, U. and Wadsö, I.: Microcalorimetric measurements on human polymorphonuclear leucocytes. Scand. J. clin. Lab. Invest. Submitted (1976). 52. Krakauer, T. and Krakauer, H.: Antigenic stimulation of lymphocytes I. Calorimetric exploration of metabolic responses. Cell. Immunol. In press (1976). 53.
Johns, P., Jasani, B. and Stanworth, D.R.: Microcalorimetry as a potential tool in the study of antibody antigen reaction systems incorporating a cellular element. J. Immun. Meth.
, 83-116 (197*0*
5*+. Monti, M. and Wadsö, I.: To be published. 55.
Ross, P.D., Fletcher, A.P. and Jamieson, G.A.: Microcalorimetric study of isolated blood platelets in the presence of thrombin and other aggregating agents. Biochim. Biophys. Acta 313, 106-118 (1973).
56. Boivinet, P., Garrigues, J.C. and Grangretto, A,: Dosage microcalorimetrique de l'insuline. C.R. Soc. Biol. 162, 1770 (1968). 57.
Gylfe, E. and Hellman, B.: The heat production of pancreatic ß-cells stimulated by glucose. Acta Physiol. Scand. U8, 779-792 (1971).
58. Engberg, A., Frödin, L., Harvig, B. and Hellerström, C.: Potential use of microcalorimetry as a viability assay in renal preservation. Science Tools 22, 17-18 (1975).
5.2 Microcalorimetric Measurements of Heat Production in Human Erythrocytes with a Batch Calorimeter M. Trumpa, B. Wendt
INTRODUCTION
The metabolism of human red blood cells (RBC) has been intensively studied by manometric (1) and enzymatic methods and more recently by calorimetry as well
(1,2,3,4,6,7,8,9)
(1,10,11,12,13,14,15).
As the heat production by a single erythrocyte is very small -15 (Q = 8 • 10
W) several milliliters of packed cells are
necessary to obtain an appropriate signal. It has been observed that methylene blue (MB) stimulates metabolism and heat production up to six-fold. We want to report experiments on the stimulation of red blood
cells from healthy donors and patients with various forms
of anemia. The main metabolic pathway for glucose in erythrocytes is glycolysis via the Embden-Meyerhof
cycle. Under physiological conditions
about 90 % of the total glucose is metabolized via glycolysis and about 10 % is converted via the pentose pathway into carbondioxid, which are also intermediate products of the glycolysis. The oxygen consumption of erythrocytes is very small, in the range of 0,3 mMol/1 RBC (2,4). Most of the oxygen seems to be used for the oxidation of hemoglobin to methemoglobin
(5,16,17).
242 In the early 1900's BARRON and HARROP discovered that an enormous increase in oxygen consumption can be caused by catalytic quantities of methylene blue (5). Methyl ene blue shifts the equilibrium between glycolysis and the pentose shunt in such a way that glucose is broken down completely by the pentose shunt (6).
METHODS AND MATERIAL
- All calorimetric experiments were performed with a microcalorimeter E. Calvet (SETARAM/LYON) with 4 vessels of 15 ml and a sensitivity of 61 nV/mW. The vessels were made of plexiglas to avoid possible iron poisoning from steel vessels. Usually, a 10 ml erythrocyte suspension, which had been passed through the SEC- Column (see below) were transferred to the vessels. The reaction temperature was 37 C.
- Manometric experiments were run in a Warburg Apparatus (BRAUN / MELSUNGEN) at the same temperature. The difference between respiration and fermentation could be determined by adding 0,2 ml of 20 % KOH to the manometric vessel.
- Red blood cells were prepared by filtration through a sulphoethylcellulose (SEC)* - Sephadex column. This filtration is based on ionic binding of white cells to SEC (18). The advantage of this method is that one does not lose the population of young erythrocytes, as normally occuring during washing procedures. Therefore, this population shows higher metabolic activity than old erythrocytes (13).
*
SEC (SERVA/HEIDELBERG)
243 - All calorimetric and manometric measurements were performed in buffer (pH 7,4,
37 C) containing 0,133 M NaCl,
0,005 M M g C l ^
0,01 M Kh^PO^ and 10 mM glucose. Methylene blue was used at a concentration of 0,1 mM.
RESULTS
a) Healthy donors Figure 1 shows a typical thermogram of a red cell suspension incubated with methylene blue. The heat production of the red blood cells was calculated from the distance P. . between baseline and tot heat flow line after two hours of incubation.
Figure 1:
Thermogram of a red cell suspension with 0,1 mM MB in glucose-phosphatebuffer, 10 ml volume, number of erythrocytes: 3,7 • 10 9 /ml, temperature: 37 C, range f-:00 pV.
244 According to MONTI and WADS'0 (1975), the heat values of unstimulated erythrocytes were corrected to a standard pH of 7,40 with a correction factor of 1,3 % for a pH difference of 0,01 pH units, while the correction factor for stimulated cells was 0,4 % per 0,01 pH unit.
Table 1: Metabolic data from calorimetric measurements without methylene blue:
x
+
S.D.
Heat production
96
+
18
69
to
129
mW/l RBC
Glucose consumption
1,8
+
0,6
1,2
to
2,6
mM/l RBC 'h
Lactate production
2,0
+
0,3
1,7
to
2,5
mM/l RBC*h
n
=
6
Table 2:
n
Range
Dimension
Metabolic data from calorimetric measurements with 0,1 mM methylene blue:
= 3 3
x
+
S.D.
Heat production
571
+
64
367
to
7.'0
mW/l RBC
Glucose consumption
2,9
+
0,9
1,4
to
4,8
mM/l RBC-h
Lactate production
3,1
+
0,5
2,1
to
3,8
mM/l RBC-h
Range
Dimension
MONTI and WAD SO (14) reported a heat value of 10? + 9 mW/'l RBC for unstimulated red cells isolated with SEC and incubated in buffer and a corresponding glucose consumption of 1 , 8 + 0 , 9 mM/l RBC* h.
Recent results of MINAKAMI and DE VERDIER (1) show that 50 % of the heat production of unstimulated erythrocytes stems from the formation
245 of lactate with an enthalpy change of 71 kJ/Mol lactate.
In our experiments the uncorrected heat production was 73 m W/l RBC. If one interprets 50 % of this figure as due to lactate production, one gets a value of 66 kJ/Mol lactate, which is equal with the value of MINAKAMI et al. (1) within the limits of uncertainty.
Some authors (12,15) assumed that the pentose shunt also contributes a significant part to the heat production of erythrocytes. According to RAP0P0RT et al. (7) and LIONETTI (3) who found that 10 % of the total glucose is metabolized via the pentose shunt (0,18 m M/l RBC»h in this investigation, see table 1) one gets an enthalpy changeof 728 kj/Mol glucose consumed via the pentose shunt.
Combining these two figures one should be able to interpret the increased heat production of methylene blue stimulated erythrocytes, when glucose is totally metaboliced via the pentose shunt. One gets a theoretical value of 644 mW/ 1 RBC, which agrees approximately with the value actually found, 571 mW/1 RBC. MINAKAMI
et al. (1)
report a value of 670 kJ/Mol O2 when stimulating with methylene blue, while we find 787 kJ/Mol ©2« Thus, one may conclude that the pentose shunt is responsible for a significant part of the heat production in unstimulated cells.
b)
Anemic donors
Several authors (11,12,15) observed that erythrocytes from anemic patients show an increased heat production, which could be due to increased glycolytic rates. In the present investigation the erythrocytes from one sideropenic anemia and six other anemias
246 from patients with tumors in the bonemarrow were measured calorimetrically under stimulation with methylene blue. From figure 2 it is evident that the heat effects measured on samples from patients with tumors are scattered, but that they are higher on the average than those from the control group. This could be explained by higher metabolic rates via the pentose shunt.
If one assumes that the tumor anemias represent a homogenous group, their heat production is calculated to be 7/8 + 67 mW/l RBC in contrast to 571 + 64 m W/l RBC for the normal group. This difference is highly significant, while the heat production of the stimulated erythrocytes from the patient with sideropenic anemia seems to be normal. §
I S
BOO
6oo
•
.
••
. ..•
400
200
Figure 2:
Heat production of stimulated red cells from normal and anemic patients: Normal red cells: • , sideropenic anemia: • , tumor a n e m i a : « , methylene blue concentration: 0,1 mM.
247 Finally it would be useful to investigate methylene blue stimulation in erythrocytes more thoroughly, to get more information about the activity of the pentose shunt under normal and pathological conditions.
Acknowledgement: The calorimeter was placed at our disposal by the Deutsche Forschungsgemeinschaft/ßonn-Bad Godesberg
REFERENCES
1) Minakami, S., de Verdier, C.H.: Calorimetric study on human erythrocyte glycolysis. Heat production in various metabolic conditions, Eur.J.Biochem. 65, 451-460 (1976) 2) Jacobasch, G., Minakami, S., Rapoport, S.M.: Glycolysis of the erythrocyte, in: Cellular and molecular biology of erythrocytes, Ed.: Yoshikawa, H., Rapoport, S.M., Urban und Schwarzenberg, München, Berlin, 55-92 (1974) 3) Lionetti, F.J.: Pentose phosphate pathway in human erythrocytes, in: Cellular and molecular biology of erythrocytes, Ed.: Yoshikawa, H., Rapoport, S.M., Urban und Schwarzenberg, München, Berlin, 143-166 (1974) 4) Huennekens, F.M., Liu, L., Myers, H.A.P., Gabrio, B.W.: Erythrocyte metabolism, III. Oxidation of glucose, J.Biol.Chem., 224229 (1957) 5) Rapoport, S.M.: Medizinische Biochemie, VEB Verlag Volk und Gesundheit, Berlin (1975) 6) Rapoport, S.M.: Stoffwechselregulation der roten Blutzelle, Folia haematol. 8 3 , 202-216 (1965)
248 7) Rapoport, S.M., Jacobasch, G.: Über die Regulation des Energiestoffwechsels des Erythrozyten. 1. Int.Symposium: "Stoffwechsel und Membranpermeabilität von Erythrozyten und Thrombozyten", Wien 17.-20. Juni 1968, Ed.: Deutsch, E., Gerlach, E., Moser, K., Thieme Verlag Stuttgart, 1-9 (1968) 8) Rapoport, S. M.: The regulation of glycolysis in mammalian erythrocytes in: Essays in biochemistry, Vol. 4, Ed.: Campbell, P. N., Greville, G. D., Academic Press, New York 69-103 (1968)
9) Rapoport, S. M.: Control mechanisms of red cell glycolysis, in: The human red cell in vitro, Ed.: Greenwalt, T. J., Jamieson, G. A., Grune and Stratton, New York, London, 153-178 (1973)
10) Bandmann, U., Monti, M., Wadsö,I. : Microcalorimetric measurements of heat production in whole blood and blood cells of normal persons, Scand. J. clin. Lab. Invest. 35, 1/1-127 (1975)
11) Boyo, A. E., Ikomi-Kumm, J. A.: Metabolic activity of erythrocytes as determined by microcalorimetry, in: Protides of the biological fluids, Vol. TO, Ed.: Peeters, H., Pergamon Press Oxford, 559-56? (1974)
1;') Monti, M., Wadsö, I.: Microcalorimetric measurements of heat production in human erythrocytes, I. Normal subjects and anemic patients, Scand. J. clin. Lab. Invest. 32,
47-54 (1973)
13) Monti, M., Wadsö, I.: Microcalorimetric measurements of heat production in human erythrocytes. Comparison between different
249
calorimetric techniques, suspension media and preparation methods, Scand. J. clin. Lab. Invest., In press 14) Monti, M., Wadsö, I.: Report from a seminar in microcalorimetric investigations on human blood cells, unpublished
(1975)
15) Levin, K.: Determination of heat production from erythrocytes in normal men and in anemic patients with flow-microcalorimetry, Scand. J. clin. Lab. Invest. 32^ 55-65 (1973) 16) Kiese, M.: Die Reduktion des Hämiglobins, ßiochem. Z. 316, 264-294 17) Jaffe,
(1944) E. R. : The formation and reduction of methemoglobin
in human erythrocytes,in: Cellular and molecular biology of erythrocytes, Ed.: Yoshikawa, M., Rapoport S. M., Urban und Schwarzenberg, München, Berlin, 345-376 (1974) 18) Nakao, M., Nakayama, T., Kankura, T.: A new method for separation of human blood components, Nature New Biology 94.
246
(1973)
5.3 Characterization of the Mode of Action of Tetracyclines Using Microcalorimetry E. Semenitz, F. Tiefenbrunner
The development of highly sensitive calorimeters made it possible to document microcalorimetric methods of investigation for the representation of heat production resulting through growth of microorganisms in liquid cultures ( 8, 14 ). In 1973 microcalorimetry was used for the representation of growth-inhibiting action of antibiotics on bacterial growth ( 1 ). In comparison to the above investigations, microcalorimetry was used for the characterization of the types of acticn of chemotherapeutics ( 17 ) and significant differences were found in the thermograms when ampicillin ( a bactericidal antibiotic ) respectively tetracycline ( a bacteriostatic antt biotic ) were added to growing bacteria in liquid culture media. After a characteristic influence of ampicillin and tetracycline on the microcalorimetry curves of E. coli had been demon strated ( 17 ), it was then investigated in the present study how the thermograms of a growing E. coli and Staph.aureus haem. culture are altered when different representatives of a single group of chemotherapeutics ( for example, four tetracyclines: Tetracycline- HC1, Doxycycline, Minocycline and Demethyltetracycline ) are added. In terms of antimicrobic activity these four tetracyclines are practically identical. However, Doxycycline and Minocycline still show a clearly visible growthinhibition of different members of the species Staph.aureus haem. which are resistant to Tetracycline-HCl ( 2, 6, 7, 1o, 12, 13, 16, 18, 19 ). The molecular configurations, weights
and formulae o f t h e s e f o u r t e t r a c y c l i n e s a r e shown i n Table 1. TETRACYCLINE- HCl
C
22
H
24
a3c
N
2 °8-HC1
oh
n(ch3)2
IS^WLCHLORIETEACYCLINE
C
21
H
21
CI w.
N
2
H
.OH
8'C1 N(CH^),
n W r rVrrT
Molecular weight 480 DOXYCYCLIN
MINOCYCLIN
C 0 0 H_. N_ 0 q . H - 0
22 24 ch3
Molecular weight 491
2 8 2
C_ 0 H^t N , O-.HCl
oh
n(ch3)2
n(ch3)2
23 27 3 7
n(ch3)2
n r r r rrrrr Molecular weight 462
Molecular weight 493
N o t a b l y , t h e s e f o u r t e t r a c y c l i n e s can be d i f f e r e n t i a t e d a c c o r d i n g t o t h e i r h y d r o p h i l i c and l i p o p h i l i c p r o p e r t i e s .
APPERATUS AND MODE OP TESTING These i n v e s t i g a t i o n s were c a r r i e d out with a f l o w - m i c r o c a l o r i meter (LKB, Bronima, Type 21o7 ) . A p a r t i c u l a r f e a t u r e of t h i s m i c r o c a l o r i m e t e r i s a 1 ml s t e e l ampule measuring c e l l . The minimal d e t e c t o r s e n s i t i v i t y was o , o 5 p.V / jiW; the minimal
253
measurable continuous heat effect was about 1 jiW. From a culture flask ( 5oo ml ) situated in a water- thermostat (35°C ) next to the microcalorimeter 2o ml/ h
of growing culture were
continuously stirred and pumped into the measuring cell of the calorimeter. For the experiments with E. coli as test organism Purple-Broth was used having 1% dextrose and for those with Staph, aureus haem. Columbia-Broth was used as culture medium. The test bacteria suspended in a physiol. NaCl-solution were added to the liquid culture media in such an amount that concentrations of
cells / ml of media were obtained at the be-
ginning of the experiments.
TEST ORGANISMS a)
E. coli with haemolysis, H 3579, isolated from the urine
of a patient suffering from cystitis. The minimal inhibition concentration (hereafter given as MIC ) as determined by the micro inhibition test was
1.5 pg of each of the four tetra-
cyclines per ml of culture medium. b)
Staph, aureus haem., A 3579. The MIC, similar to that of
E. coli, H 3579, was identical with all four tetracyclines and measured c)
o,7 jig of substance per ml of culture medium.
Staph, aureus haem., A 2953. The MIC of Tetracycline-HCl
was 25o p.g of substance per ml of culture medium, that of Demethyltetracycline
7o p.q and that of Doxycycline and Mino-
cycline identical
15 p.g . Both Staph, species were isolated
directly from puss samples.
RESULTS Figure 1) shows the typical thermogram( =Normthermogramm,first thermogram on top of the figure) of E. coli, H 3 5 79, in Purple-
254
255
ZUGABE 3?9/mt
" "
TETRACYCLIN
TETRACYCLIN
HCl
ZUQAIE JEWEILS
MINOCYCLIN
DEMETHYLCHLORTETRACYCLIN
HCl
DEMETHYLCHLORTETRACYCLIN
30 ug / ' 'ml
NM
DOXYCYCLIN
MINOCYCLIN
256
Fig.0)
ZUGABE ®
.
der ANTIBIOTIKA^'
STAPHYLOCOCCUS A 2953
AUREUS
BBSUA
©
DOXYCYCLIN
MINOCYCLIN
257
Broth. An arrow on the typical thermogram indicates the point at which in successive experiments the tetracyclines were added to the growing culture. This point was approximately 1.5 hours after the beginning of a measurable heat production, situated on the steeply rising section of the thermogram. All four tetracyclines using a concentration of 3 ^ig and 4o jig of substance per ml of culture medium influenced the thermogram of E. coli identically test was 1,5 jig
(the MIC in the micro inhibition
/ml of culture medium) . Figure 2
( top )
shows the typical curve of Staph, aureus haem.,A3579,
(the MIC
was o,7 jig/ml ). The addition of 3pg/ml of each tetracycline caused an immediate inhibition of heat production and the curves were identical. This was even more apparent adding 3o ^g/ml . Figure 3
shows the heat-time-curves of Staph, aureus haem.,
A 2953, i.e. of that Staph, aureus haem. which indicated different minimal inhibition concentrations. With the addition of 3o p.g/ml
of Tetracycline-HCl to the growing Staph, aureus,
A 295 3, culture there is a short stop in heat production followed by a second peak identical in altitude to that of the typical thermogram. The addition of 3o p.q/m.1 of Doxycycline and Minocycline shows, however, practically the same inhibiting influence upon these growing cultures, as demonstrated in figure 2
for the more sensitive Staph, aureus A 3579.
DISCUSSION It was determined that the addition of these four tetracyclines to the growing cultures of test bacteria a)(E. coli, H 3579 ) and b) (Staph, aureus haem.,A 2953 ), respectively those having uniform MIC's of o,7 to 1,5 |ag/ml , caused immediate inhibition of heat production
. The minimal deviations
in the curves as shown in figure 2) (using a 3 jjg/ml concentr.)
258 were no longer detectable with the
3o pg/ml concentration. It
is remarkable that the addition of only 3o pg/ml of Tetracycline-HCl to Staph, aureus haem.,A 2953, showing a MIC of 25o p.g/ml in the micro inhibition test caused a clearly visible Stop in the heat production , even though followed by a further rise of the heat-time curve. Since the thermograms of both the resistante and the sensitive strain of Staph, aureus haem. were identical after addition of Doxycycline and Minocycline , there is
no reason to assume an altered mechanism
of action of these two antibiotics upon a tetracycline sensitive and a tetracycline resistant Staph, aureus haem. strain. It is generally believed that the tetracyclines inhibit protein synthesis in cell-free ribosome fractions. Their antibacterial activity is based on the concentration within the bacterial cell by an active uptake-mechanism
( 5, 15 ). This
has been shown by E. coli as well as Staph, aureus species. In kinetic studies with radioactive labelled tetracyclines it could be shown that E. coli assimilates tetracyclines in the range
o,1 to 4oo
without showing a saturation function. In
the case of Staph, aureus using the same method a completely different uptake function, namely a two-phase function of the uptake system, was determined. Using a fluorescence method an uptake for tetracyclines was found in Staph, aureus which corresponds within a concentration range of
o,2 to 2oo ^ig to the mechanisms of saturation
kinetics ( 3, 4, 5 ). These uptake studies with fluorescence methods are important for this particular investigation because it has been shown that a dependence of characteristic temperature ranges for the uptake of tetracyclines is present, corresponding to a specific configuration of fatty acids in the cell membrane. Differences in the effectiveness of lipophilic and hydrophilic tetracyclines could therefore be dependent upon the rate of penetration of these substances through the layer of fatty acids in the cell membrane ( 4 ) .
259 In summary, it can be said that microcalorimetry can be utilized to demonstrate that Doxycycline and Minocycline have the same mode of action as Tetracycline-HCl. The greater inhibiting effect of these two tetracyclines upon tetracycline- resistant gram positive cocci is not based on an altered uptake mechanism but on the fact that both of these substances are able to penetrate the cell membrane due to their lipohilic properties at a point when Tetracycline-HCl uptake is already blocked.
REFERENCES ( 1 )
Binford, J.E.,Binford, L.F., and Adler,P.: A semiautomated microcalorimetric method of antibiotic sensitivity tests.
( 2 )
Am. J. Clin. Pathol. 59^, 86 - 94 (1973)
Dimmling, Th.: Bakteriologische Untersuchungen über Resorption und Exkretion sowie über das Wirkungsspektrum von Alpha-6-Desoxyoxytetracyclin Med. Klin. 62,
( 3 )
(Doxycyclin).
1269 - 1276 (1967)
Dockter ,M.E.,. and Magnuson, J.A. :Kinetics of Chlorotetracycline uptake in Staphylococcus aureus by a fluorescence technique. Bioch. and Biophys. Res. Comm. 54, 79o - 795 (1973)
( 4 )
Dockter, M.E.,and Magnuson, J.A.: Characterization
of
the active transport of Chlorotetracycline in Staphylococcus aureus by a fluorescence technique. J. Supramol. Struct. 2, 32 - 44 (1974) ( 5 )
Dockter, M.E., and Magnuson, J.A.: Membrane Phase Transitions and the Transport of Chlorotetracycline. Arch. Bioch. and Biophys. ^68, 81 - 88 (1975)
( 6 )
Driessen, J.H.: A Computer Study of Bacterial Resistanae Patterns to Antibiotics. Chemotherapy 21_, (Suppl) 36 46 (1975)
( 7 )
Fedorko, J., Katz, S., and Allnich, H.: In vitro activity of Minocyclin, a new tetracycline.
J. Am. Med.
260 Seien. 255, 252 - 258 (1968) Forrest, W.W.: Microcalorimetry.In:Methods in Microbiology, ed. by Norris,J.R.,and Ribbons,D.W.,Academic Press Vol. 6B, 285 - 316 (1972) 9 ) Isenberg, H.D.: In vitro activity of Doxycycline against bacteria from clinical material. Appl. Microbiol. 15, 1o74 - 1o78 (1967) 1o ) Klastersky, J., and Daneau,D.: Bacteriological Evaluation of Minocycline. Chemotherapy J_7, 51 - 58 (1972) 11 ) M§rdh, P.A.,Ripa,T.,Andersson,K.E.,and Wadsö,I.: Kinetics of the Action of Tetracyclines on Escherichia coli as Studied by Microcalorimetry.(1976) in press. 12 ) Monnier,J.,Bourse,R.,and Onfray,J.: Doxycycline. Activité bactériostatique in vitro et taux sériques chez 1' homme. Antibiotica 4, 268 - 282 (1966) 13 ) Müller,J.: Die antibiotische Wirksamkeit von Doxycyclin, Tetracyclin und Chloramphenicol im Agardiffusionstest. Med. Klinik 65, 1821 - 1825 (197o) 14 ) Prat, H.:Recent Progress in Microcalorimetry.(Ed. Scinner, H.A.),Pergamon Press, London (1963) 15 ) Sazykin,Y.O., Fomina, I.V., Belyavskaya, N.S., Gryaznova, R.M., Petyshenko, R.M.: Studies on some Mechanisms of Resistance to Tetracyclines and their Transport to Bacterial Cell. Progress in Chemotherapy, Proth ceedings of the 8 Int. Congress of Chemotherapy, Athens, 1, 113 - 116 (1973) 16 ) Semenitz, E.: Doxycyclin, Bakteriologische Untersuchungen. Wien. klin. Wochenschrft. _81_, 454 - 457 (1969) 17 ) Semenitz, E., and Tiefenbrunner, F.: Mikrokalorimetrische Untersuchungen zur Bestimmung der antibakteriellen Aktivität von Chemotherapeutika. Arzneimittelforschung, in press. 18 ) Williamson, G.M.: Laboratory Studies on Doxycyclin. In International Symposium : New Resources in Antibiotic Therapy, Buenos Aires, June(1967) (typescript, 21 p.) 19 ) Winkler, E., Weih, H.: Doxycyclin, Ergebnisse von Basisuntersuchungen. Med. Klinik 62, MSI - 1262 (1967)
( 8 )
(
( (
(
(
( (
( (
(
(
5.4 Whole Body Calorimetry E. Jequier
D I R E C T AND
INDIRECT
CALORIMETRY
There are two main m e t h o d s f o r m e a s u r i n g in m a n
: d i r e c t and i n d i r e c t
e q u a t i o n " b e l o w , it can be
that both m e t h o d s do not m e a s u r e the body
the same energy
seen
: indirect
is used to d e t e r m i n e the free energy p r o d u c e d
(M), w h i l e d i r e c t c a l o r i m e t r y m e a s u r e s the r a t e
heat loss by the body (1)
expenditure
calorimetry.
C o n s i d e r i n g the "heat b a l a n c e calorimetry
energy
in of
(R + C + E) :
M = (R + C + E) + S + W
w h e r e M is the free e n e r g y R
is the r a d i a n t
heat
production exchange
C is the c o n v e c t i v e heat E is the e v a p o r a t i v e
heat
S is the s t o r a g e of body
transfer transfer heat
W is the w o r k done a g a i n s t e x t e r n a l Thus direct calorimetry providing
that
forces
can be used to m e a s u r e m e t a b o l i c
rate
two c o n d i t i o n s are met :
- w h 3 n body t h e r m a l e q u i l i b r i u m core and p e r i p h e r a l
is r e a c h e d ,
i.e. w h e n
t e m p e r a t u r e s are c o n s t a n t
- w h e n no e x t e r n a l w o r k is done
(W = 0) .
body
(S = 0],
and,
262 Under these conditions, the heat balance equation is as follows : •
(2)
•
•
•
M = R + C + E
and direct calorimetry becomes a precise method for measuring the energy expenditure of a subject. The principles of direct and indirect calorimetry are described below. Direct human calorimeter The total energy output of a subject is measured by using a human calorimeter or whole body calorimeter. It consists of a sealed insulatsd chamber in which the subject is placed. The modern instruments are heat flow calorimeters in which the rate of heat loss by a subject is measured with a gradient layer. A direct calorimeter of low thermal inertia and rapid response time, large enough to accommodate patients, was built at the Division of Clinical Physiology in Lausanne (8). The principle of direct calorimetry for measuring heat flow by a gradient layer has been described by Benzinger and Kitzinger
(1).
The heat flow through a layer is given by Fourrier's law : (3)
q = A £ (T1 - T 2 )
where Q is the flow through the layer, A is the area of the layer, X is the specific thermal conductivity of the layer, and T^ and J^
are the temperatures of inner and outer surfa-
ces, respectively. 3 The calorimeter is a small chamber with a volume of 1.56 m (Fig. 1). The total inner surface is completely covered with a gradient layer which consists of an expoxy resin 2.4 mm thick with a copper circuit printed on both sides.
263
HUMAN DIRECT
CALORIMETER
Respiratory "condensor"
"Condensor"
Respiratory heater
Heater
Fig. 1
Ventilatory
c i r c u i t of the human d i r e c t
The e l e c t r i c a l r e s i s t a n c e its t e m p e r a t u r e .
of each c i r c u i t
calorimeter.
is d e p e n d e n t
The m e a s u r e m e n t of the heat f l o w i n g
the l a y e r is p e r f o r m e d by a c c u r a t e m e a s u r e m e n t s rence in t e m p e r a t u r e b e t w e e n
upon
through
of the
diffe-
the 2 s u r f a c e s of the layer.
c o p p e r c i r c u i t s of the i n n e r and o u t e r s u r f a c e s of the
The
gra-
d i e n t layer are c o n n e c t e d in a W h e a t s t o n e b r i d g e . The
voltage
m e a s u r e d is p r o p o r t i o n a l
through
to the s e n s i b l e
heat f l o w i n g
the l a y e r (Q). The m e a s u r e m e n t of d e t e c t a b l e plus c o n v e c t i v e ) temperature
heat
(radiative
using a gradient layer requires a
constant
of the o u t e r s u r f a c e of the layer. The w a l l s of
the c h a m b e r are m a i n t a i n e d at a c o n s t a n t t e m p e r a t u r e
within
0 . 0 0 5 ° C of the set t e m p e r a t u r e by c i r c u l a t i n g w a t e r
through
channels
in the w a l l s of the
The e v a p o r a t i v e ventilatory
chamber.
heat loss of a s u b j e c t
circuit
is m e a s u r e d t h r o u g h a
(Fig. 1). O u t s i d e a i r is forced
the v e n t i l a t o r y c i r c u i t at a f l o w r a t e of 1*150
through
1/min. The air
264 is first cooled to a low t e m p e r a t u r e , T^, and c o m p l e t e l y
sa-
t u r a t e d with w a t e r . Before r e a c h i n g the c h a m b e r , it is p a s s e d t h r o u g h a h e a t e r w h e r e it is w a r m e d to the c h a m b e r re
T ^ , a n d r e l a t i v e h u m i d i t y of the a i r d e c r e a s e s
temperatuaccording
to the new t e m p e r a t u r e T^. The w a t e r v a p o r lost by the j e c t i n c r e a s e s the w a t e r c o n t e n t of the air. O u t g o i n g f r o m the c h a m b e r exchanger
m a i n t a i n e d at the low t e m p e r a t u r e ,
The w a t e r v a p o r lost by the s u b j e c t
c o n d e n s e s out a n d
up its latent heat w h i c h is m e a s u r e d by a g r a d i e n t : this c o r r e s p o n d s to the e v a p o r a t i v e
of the s u b j e c t . R e s p i r a t o r y rately through Indirect
air
(at t e m p e r a t u r e T^) p a s s e s t h r o u g h a heat
(condenser)
the c o n d e n s e r
sub-
a respiratory
T^.
gives
l a y e r in heat
heat loss can be m e a s u r e d
loss
sepa-
circuit.
calorimetry
M e t a b o l i c free energy p r o d u c t i o n transformation
(M) r e p r e s e n t s
of c h e m i c a l energy
the rate
into heat and
mechanical
w o r k by a e r o b i c and a n a e r o b i c p r o c e s s e s w i t h i n the In steady state m e t a b o l i c c o n d i t i o n s ,
of
the total
organism.
metabolic
free energy p r o d u c t i o n a r i s e s f r o m o x i d a t i v e m e t a b o l i s m , the m e t a b o l i c rate can be c o m p u t e d f r o m the m e a s u r e m e n t oxygen consumption
after a change gy p r o d u c t i o n
state c o n d i t i o n s ,
quotient.
at the onset of e x e r c i s e ,
in work i n t e n s i t y , the rate of m e t a b o l i c (M) e x c e e d s that i n d i c a t e d by o x y g e n
tion. Part of the total energy p r o d u c t i o n
is due to
p r o c e s s e s w h i c h m a i n l y r e s u l t f r o m the s p l i t t i n g of a m o u n t of a n a e r o b i c energy p r o d u c t i o n
is usually
ener-
aerobic highThe
evaluated
the " o x y g e n d e f i c i t " , w h i c h is o b t a i n e d
the d i f f e r e n c e b e t w e e n the m e a n rate of o x y g e n
or
consump-
energy p h o s p h a t e b o n d s of ATP and c r e a t i n e p h o s p h a t e . by c a l c u l a t i n g
of
(VQ^) using the c a l o r i c e q u i v a l e n t of a
litre of o x y g e n , d e r i v e d f r o m the r e s p i r a t o r y In n o n - s t e a d y
and
from
consumption
265 d u r i n g the steady the
s t a t e , and the VQ^ a c t u a l l y m e a s u r e d
"oxygen d e f i c i t " p e r i o d . A l t h o u g h this m e t h o d of
t i n g the a n a e r o b i c energy p r o d u c t i o n investigators,
it may y i e l d p a r t i a l l y
during
evalua-
has been used by m a n y erroneous results
the m e c h a n i c a l e f f i c i e n c y of the s p l i t t i n g of high
since
energy
p h o s p h a t e b o n d s d u r i n g a n a e r o b i c energy p r o d u c t i o n m a y be f e r e n t f r o m the o v e r a l l e f f i c i e n c y
of a e r o b i c m e t a b o l i c
dif-
pro-
cesses . Heat s t o r a g e and c h a n g e s in mean body T h e rate of heat s t o r a g e study of t h e r m o r e g u l a t i o n
temperature
(S) is an i m p o r t a n t v a l u e for the in m a n . A c c o r d i n g to the heat
ba-
lance e q u a t i o n : (4)
S = M - (R + C + E + W)
M is o b t a i n e d f r o m oxygen c o n s u m p t i o n , R + C + E f r o m
direct
c a l o r i m e t r y and W f r o m m e a s u r e m e n t of the m e a n p o w e r of m u s cular
exercise.
Integration time
of the r a t e of heat s t o r a g e d u r i n g a period
(t-t ) gives the change
The change
in the body heat c o n t e n t
s y s t e m is m a i n l y d e p e n d e n t upon i n f o r m a t i o n
from many thermal the body.
(AS)
in the body heat c o n t e n t is of g r e a t i n t e r e s t
ce r e c e n t w o r k s s t r o n g l y s u g g e s t that the m a m m a l i a n gulatory
of
thermorearising
r e c e p t o r s in the core and the p e r i p h e r y
In o t h e r w o r d s , the m a i n input to the
sin-
of
thermoregula-
t o r y s y s t e m is due to c h a n g e s of the body heat c o n t e n t
(AS).
F r o m the m e a s u r e m e n t of AS we can c a l c u l a t e the c h a n g e in m e a n body temperature
(A T, )
266 (6)
AT
AS
b
m, c, b b
where m^
= weight of the body (kg)
and
= specific heat of the body (3'475 3.kg
c^
Thermophysiologists usually calculate A T^
^)
using Burton's
equation and weighting factors, as follows : (7)
A T , = 0 . 9 AT. , + 0 . 1 b mt
where
AT, sk
is the core temperature of the body, which is mea-
sured in the oesophagus or at the tympanic membrane, and T ^ is the mean skin temperature. The weighting factors 0.9 and 0.1 are those proposed by Stolwijk and Hardy (9), but they cannot be considered as constant since they change with ambient conditions and during exercise. The calorimetric method for measuring AS and AT^ can be used to assess the validity of the weighing factors used by thermophysiologists (4,5). Cutaneous thermal conductance and cutaneous blood flow Cutaneous thermal conductance (K
can
be calculated accor-
ding to Burton (3) and Hardy and DuBois (5) as follows : (8)
K,= sk
(R + C + E . ) SYX. . - T , ) A. sk int sk b
where E ^ is the rate of evaporative heat loss from the skin: (9)
E , = E - E sk ex
E g x represents the rate of respiratory heat loss and is often calculated from the equation of Mitchell et al. (7). (10)
E
ex
= 0.0023 (44-P ) M a
where M, (the energy production), is expressed in Watt and
267 P
a
(the a m b i e n t w a t e r v a p o r pressure)
be m e a s u r e d by d i r e c t c a l o r i m e t r y
in m m Hg. E
can
ex
using a face m a s k to
rate the heat loss by r e s p i r a t i o n f r o m the skin heat (Fig. 1). A^ is the body s u r f a c e Cutaneous thermal
also sepa-
losses
area.
c o n d u c t a n c e d e p e n d s on the t h e r m a l
conduc-
tivity of the t i s s u e s and of the a m o u n t of heat e x c h a n g e to c o n v e c t i v e conductivity
heat t r a n s f e r by the b l o o d . K n o w i n g the of the t i s s u e s , t h e r m a l c o n d u c t a n c e
thermal
measurements
can be u s e d to c a l c u l a t e the skin b l o o d f l o w . C h a n g e s cutaneous thermal conductance
due
are due to v a r i a t i o n s
in
in skin
blood f l o w . The c u t a n e o u s b l o o d f l o w tive f o r h e a t e x c h a n g e s ,
(F , ), w h i c h is e f f e c sk can be e s t i m a t e d by the f o l l o w i n g
equation : (11)
F . = 60 x 1000 SK
— — 3
—
bl
fbl - 1
w h e r e F , is the c u t a n e o u s blood flow in l.min. sk K.. is the tissue c o n d u c t a n c e tis _ be 5.20 W . m . C ) c^
m
- 2
(which is e s t i m a t e d
is the s p e c i f i c heat of b l o o d
(3'978 3 . k g
is the s p e c i f i c mass of b l o o d
M'095.5
The n u m e r i c f a c t o r s
t r a n s f o r m the r e s u l t s
into
to
—1 o —1 . C )
kg. m
-3
)
physiological
units.
M E A S U R E M E N T S OF D I R E C T AND
INDIRECT CALORIMETRY
DURING
EXERCISE S i m u l t a n e o u s m e a s u r e m e n t s of direct + i n d i r e c t
calorimetry,
and of t h e r m o m e t r y
temperature),
(skin t e m p e r a t u r e ,
tympanic
were p e r f o r m e d
in 11 h e a l t h y u n t r a i n e d male s u b j e c t s ,
age was 2 5 + 1
y e a r and w e i g h t
67.5 + 2.5 kg. A l l
whose
subjects
268 p e r f o r m e d m u s c u l a r e x e r c i s e at a m b i e n t t e m p e r a t u r e s and a r e l a t i v e
of
30°C
humidity of 30 %. R e s u l t s on skin blood
flow
are also p r e s e n t e d for e x e r c i s e p e r f o r m e d at 20 and ambient
25°C
temperatures.
The tests c o n s i s t e d
of 4 p e r i o d s :
1) 30 min of r e s t inside the
calorimeter
2) 50 min of e x e r c i s e at 40 W 3) 50 min of e x e r c i s e at 90 W 4) 30 min of r e s t
(recovery
M e t a b o l i c rate and h e a t
period)
losses
The r e s u l t s are s h o w n in F i g . 2. D u r i n g the r e s t p e r i o d , rate of m e t a b o l i c heat p r o d u c t i o n r a t e of total heat losses that the heat s t o r a g e bient
M was s l i g h t l y a b o v e
(H = R + C + E). T h i s
the
the
indicates
(S) was s l i g h t l y p o s i t i v e at 30°C
am-
temperature.
A t the b e g i n n i n g of e x e r c i s e , we o b s e r v e d a w e a k i n c r e a s e dry heat
losses
(R + C) due to m o v e m e n t of the legs.
r a t i v e heat losses respiratory
(E)
(which i n c l u d e d both c u t a n e o u s
heat losses)
and
p r e s e n t e d an e x p o n e n t i a l rise
w a s t r i g g e r e d at the b e g i n n i n g of the 40 W e x e r c i s e The time c o n s t a n t of the e v a p o r a t i v e heat losses
in
Evapowhich
period.
(= time
ne-
cessary to o b t a i n 63.2 % of the r e s p o n s e to a step change heat load) was c a l c u l a t e d Heat
in
to be in the order- of 13.9 + 2.2
min.
storage
Total heat losses d u r i n g e x e r c i s e rate of w o r k
(horizontally
h a t c h e d area)
m e a s u r e d by d i r e c t c a l o r i m e t r y the rate of e n e r g y p r o d u c e d (H + W) r e p r e s e n t s
are o b t a i n e d by a d d i n g to the heat
(H). The d i f f e r e n c e
i n d i c a t e d by the o b l i q u e l y
losses
between
(M) and the rate of energy
the rate of heat s t o r a g e
the
(S), w h i c h
losses is
h a t c h e d area. It is i n t e r e s t i n g
to
269
Fig. 2
Heat losses and metabolic rate during exercise at 30°C. E = evaporative heat losses R + C = radiative + convective heat losses M = metabolic rate Horizontally hatched area = work intensity Obliquely hatched area = heat storage (The anaerobic heat production is not shown on the figure). (From : 3. Appl. Physiol., 40, 384, 1976).
note that during exercise, the rate of heat storage
tends to-
wards zero indicating that a thermal equilibrium is reached, thanks to a precise regulation of evaporative heat losses.
270 At the b e g i n n i n g of the c h a n g e in w o r k i n t e n s i t y , a r a p i d additional increase
i n c r e a s e in E o c c u r s . S i n c e the k i n e t i c s of the
in E is s l o w e r than that of M, a new heat
storage
(S) is c r e a t e d . The time course of r e g u l a t i o n of S is s i m i l a r to that o b s e r v e d in the f i r s t e x e r c i s e p e r i o d
Fig. 3
Thermal conductance for heat t r a n s f e r )
and c u t a n e o u s b l o o d
(40
30°C.
: 3. A p p l . P h y s i o l . , 40, 384,
Cutaneous blood
(effective
at rest and d u r i n g e x e r c i s e
and 90 W) at 20, 25 and (From
(Fig. 2).
1976)
flow
Thermal cutaneous conductance
and c u t a n e o u s b l o o d
m e a s u r e d at 30°C i n c r e a s e d s i g n i f i c a n t l y p e r i o d s . The i n c r e m e n t
d u r i n g the
in c u t a n e o u s b l o o d flow is
flow
exercise
dependent
271 upon the i n t e n s i t y
of the
p e r a t u r e s of 25 and 20°C, flow w a s
less m a r k e d
exe reise
(Fig. 3). At a m b i e n t tern-
the i n c r e m e n t
in c u t a n e o u s
blood
than at 30°C.
T H E R M A L BODY I N S U L A T I O N AND Thermal body insulation
OBESITY
(1^)
is the inverse of t h e r m a l
con-
ductance . (12)
I,
, = —s K . sk
=
(T. T .) A. .lnt. R + C + E , sk
T h e r m a l b o d y i n s u l a t i o n d e p e n d s on the c o m p o s i t i o n
and
t h i c k n e s s of s u b c u t a n e o u s
vasomotor
tissue as w e l l as on the
c o n t r o l of the c u t a n e o u s b l o o d f l o w
(6). The study of
body i n s u l a t i o n in s u b j e c t s of w i d e l y d i f f e r e n t body may give some insight
the thermal
weight
into the m e c h a n i s m of the a p p a r e n t
energy e x p e n d i t u r e o b s e r v e d
in obese s u b j e c t s e x p o s e d
cold or in a n o r e x i c p a t i e n t s exposed to a n e u t r a l
low
to
ambient
temperature. Subjects
: The s u b j e c t s in this study w e r e w o m e n w i t h no
d e n c e of e n d o c r i n e d i s e a s e s . They w e r e a s s i g n e d a c c o r d i n g to t h e i r w e i g h t and Controls ideal Anorexic
(n = 25)
evi-
to 4 groups
anamnesis.
: w o m e n w i t h body w e i g h t w i t h i n + 10 % of
weight. (n = 18)
: w o m e n w i t h body w e i g h t b e t w e e n - 1 0 and
- 3 0 % of ideal w e i g h t and w i t h anorexia
a typical anamnesis
of
nervosa.
Trend to obesity
(n = 29)
: w o m e n m o d e r a t e l y obese
+ 10 to +35 % of ideal weight)
(weight
and w i t h an a n a m n e s i s
easy w e i g h t gain w i t h o u t o b v i o u s c a l o r i c
excess.
of
272 PHYSICAL
CHARACTERISTICS
n>34 z o u $i u. O
(/>
UI V
X LU
80 60 n = 29
40.20
n = 27 J±L
ANOREXIA TREND TO OBESITY OBESITY
CONTROLS •20-
n = 18
0 < 11-s5 H
n «34
in u. IA
% " 1.0 y 2 1 z
S
« H >-, Cfl > -tí
- P Cfl c u
f O u
QJ CO
O • H - P
O
ta H
o
%—
*-
C*r -
o • H
O • H
• H
• H O O
tí tí
cd H (0
C/3
,—-,
y—\
(0
a
f
O
•
^
f -—•
.
OA co" vI N
•
K A
O K A
KA
KA
< r o CM
ü • H
a o
- H
ft o fc ft
,
Ti
1
o •rH
tí
O • H • H O P O) O O 3
(tí
m
,—, a>
y • H t o • H
+-> 0) o (0
< H
tí o «H
ft O k ft
:s7 Legend to Tab.1. Units are in kJ or kcal mole glucose: Temp.25 C; A G values are for unit activity and C 0 2 (aq); A G values are for 0.2 atm 0 2 , 0.05 atm C 0 2 (aq), pH 7 and 0.01 M concentration of other reactants. Values of free energy are calculated from data according to Burton and Krebs "(12)" unless otherwise stated. A H values are calculated from heats of combustion "(5)" unless otherwise stated, and no corrections are made for heats of solution and dissociation of the acids. Thermodynamic efficiency is the percentage of A G retained in phosphorylation reactions (endergonic) per A G of the exergonic reaction. The caloric efficiency is the percentage of maximal ATP turnover in mole per kJ heat produced. =
2 Lactate" + 2 H +
a)
Glc
b)
Glc + 2 N H 4 + ( a q )
=
2 Alanine" + 2 H 2 0 + 4 H +
Alanine production is assumed to proceed by NH, fixation onto pyruvate and therefore with maintenance of redox balance in the overall reaction. Transaminase reactions, however, proceeding without changes of free energy, may also play an important role. A H was calculated from heats of formation. c) Glc + 0.857 HCOj" d)
Glc
=
1.714 Sue 2 " + 1.714 H 2 0 + 2.571 H +
=
1.714 Prp" + 0.857 HC0 3 ~ + 2.571 H +
Production of proprionate (Prp) from succinate (Sue) via the reversal of a reaction sequence known from catabolism of isoleucine and methionine was demonstrated in parasitic helminths "(96, 123)". Therefore the same considerations apply to "propionic" and "succinic" fermentation (see text), but an additional substrate level phosphorylation is probably driven by decarboxylation of succinate. As calculated from data of Wood "(120)". the biotin linked reaction Methylalmonyl-CoA" + H 2 O
=
Propionyl-CoA + HC0,
proceeds with A G = -33 kJ. As the methylmalonylmutase reaction and the transfer of CoA from propionate to succinate are readily reversible "(120)", the same value may be taken for approximating the overall decarboxylation of succinate to yield propionate. e)
f)
Glc + 0.667 HC0 3 ~
Glc
=
=
0.667 Act" + 1.333 Sue 2 " + 1.333 H 2 0
=
0.667 Act" + 1.333 Prp"
+ 2.667 H +
+ 0.667 HC03~ + 2.667 H +
Formation of acetate delivers reducing equivalents for two fumarate reductase reactions. Therefore the NAD/NADH ratio
288
is maintained, if acetate and succinate or propionate are produced in a ratio of 1 : 2. ATP production by acetate kinase is known from micro-organisms, but has not yet been proved in invertebrates.
of glucose, "propionic" fermentation probably 170 % more. In the latter case thermodynamic efficiency would approximate 80
Higher yields of ATP seem thermodynamically unfeasib-
le. Increased efficiencies of phosphorylation in anoxic pathways are due not only to an increased thermodynamic efficiency, but also to larger increments of free energy in the respective reactions
(Tab.1).
PRIMARY AND SECONDARY END PRODUCTS The relative importance of the different anoxic pathways determines the overall efficiency of the anoxic energy metabolism. Due to short experimental acclimation periods (in the range of a few hours) the quantitative importance of lactate, alanine, and of succinate as end products of the anoxic energy metabolism has been largely overestimated. In these studies different sections were taken through a dynamic biochemical transitory process and described as different patterns of anoxic intermediary metabolism. This led to a confusing picture of various traits of metabolic strategies. Abundant evidence now exists that in invertebrates resistant to anoxia, lactate and alanine are initial end products only, accumulating in relatively small amounts during the first 12 to 24 hours of anoxibiosis "(10,27,55,113)". As time of anoxibiosis proceeds "propionic" and/or
"acetic-propionic"
fermentation become increasingly more important (Tab.2), "(30,56,135)", whereby in some cases the two volatile fatty acids are excreted after condensation to methylbutyrate "(21,97)".
Tab.2. Production of organic acids in iimol/g dry weight/h by Tubifex during successive periods of anoxic acclimation. The percentage of total organic acids is given in brackets. Calculated from data of Schottler and Schroff "(101)".
hours
0-14
14-24
24 - 38
38 - 48
lactate
0.58 ( 4 2 )
alanine
1.62 (11.8)
°' 44 (4.8)
succinate
4. 33
(31.5)
3
acetate
1.64
(11.9)
1
propionate
5.57 (40.5)
3,40
glucosyl-3^ equivalents
7. 42
4.78
4.89
5.26
glycogen-*3) consumption
6.29
5.59
4. 77
3. 52
- 3 3 (36.7) - 90 (21.0) (37.5)
0. 0 6
(0.6)
-0.06
2. 48 (26.4)
1. 20 (12.0)
2. 36
(25.1)
2. 30 (23.0)
(47.9)
6. 50 (65.0)
4. 50
a) The rate of consumption of glucosyl-equivalents is calculated from the rate of formation of end products under the assumption that glycogen is the sole source of energy and redox balance is maintained. The difference between this and the sum of organic acid production x 2~' is proportional to the rate of the tricarboxylic acid cycle functioning in its forward direction. b) Measured glycogen consumption in pimol glucosyl-equivalents/g dry weight/h.
The significance of lactate and alanine as primary end products of anoxibiosis is therefore seen in their influence on the activities of regulatory enzymes during the aerobicanoxic transition of intermediary metabolism "(46,47,65,75,
290 74,116,130,131,132,133,134)". Accumulation of these primary end products, the formation of which is less efficient in generating high-energy phosphate bonds, initiates a new state of anoxi-metabolic equilibrium. Essentially, the observed trend can be interpreted as the general tendency to stabilize anoxic pathways with the highest yield of ATP (Fig.2).
APPLICATION OF DIRECT CALORIMETRIC METHODS The confusing variety of species-specific patterns of organic acid production not only during anoxic acclimation, but in different tissues "(1,14,31,64)", developmental stages "(48, 91,113)", different sexes "(9)", and seasons "(121)" makes the biochemical assessment of the level of anoxic energy metabolism a tedious task. The variable ratio of accumulated and excreted end products "(22,72,101)" necessitates the consideration of both. Discontinuous carcass analysis is therefore unavoidable, whereby subtractions of estimated values measured on different individuals will introduce substantial errors due to considerable inhomogeneities, especially when large quantities of analytical substances (e.g.glycogen) are involved "(27,30,101,138,139)". Heat production is an unspecific measure of the enthalpy changes accompanying all metabolic reactions of an organism. In long-term experiments continuous registration of heat production is possible, until a new steady state of anoxic energy metabolism - if ever - is reached. Turnover of ATP comprises the essential parameter of interest, since the scope of energy metabolism is the generation of high energy phosphate bonds as intermediate driving forces for all energy requiring biological processes. Provided that net synthesis is negligible during the experimental period "(49)", the caloric efficiency of ATP production may be calculated from the relative contribution of the different anoxic pathways
291
-
c
7-
I >6(0 o o O or
100% P R O P I O N A T E
/
-o
5
40 5
z
o
h30g DC Q.
^ 3 -
Q. 5
_
O - —
20
-AEROBIC 12
24
ANOXIA (hrs)
36
48
10
Fig.2. Anoxic acclimation of anoxibiotic invertebrates: Tubifex (open circles; calculated from data in Tab.2) and Anodonta (full circles; calculated from data of Gade et al. "(30)". Solid line: Molar efficiency of ATP production in catabolism of glycogen. For every mole of glucose derived from glycogen one mole of ATP is saved, which is added to the maximal ATP production in the different anoxic pathways (Tab. 1). The arrow "100 % propionate" indicates the maximal molar efficiency of ATP production in pure "propionic" fermentation. Dashed line; Caloric efficiency. Values of Tab.1 are used in their proportional contribution to the anoxic metabolism without correcting for glycogen degradation. The calculated mean of total heat production is 85 ^W/g dry weight of Tubifex and 97 nW/g dry weight of Anodonta. The arrow "aerobic" indicates the caloric efficiency level of aerobic metabolism. Potted # line: Percentage of propionate on total organic acid production!
292 to the overall metabolism (Tab.1). The biological interpretation of calorimetric data is difficult especially for the transitory period, but may be approximated by supplementary biochemical investigations (Fig.2). However, various side reactions "(25)", or energy production by "anoxic endogenous oxidation" "(42,54,125,126,127,128)» and net utilization of energy reserves "(109,117,118,129)" may obscure the calculated values. Anoxic metabolism of diving vertebrates "(52,83)" and of whole benthic communities "(79,80)" was studied using direct calorimetric methods, but data of heat production of anoxibiotic invertebrates are not available so far. Inconsistencies of the presented calculations with future experimental investigations may reveal some gaps in our understanding of the biochemical mechanisms promoting anoxic animal life. Incorporating recent refinements of microcalorimetric techniques "(8,13,61,111)", the application of direct calorimetry to the study of ecological energetics will therefore contribute to better insight into the quantitative relationships of invertebrate anoxibiosis.
SUMMARY New insight into the biochemical mechanism of invertebrate anoxibiosis made possible the calculation of the free-energy changes associated with the generation of high-energy bonds in nucleoside triphosphates (ATP, GTP, ITP) under anoxic conditions. The values obtained are compared with thermodynamic data of aerobic and fermentative energy production, and indicate a selection towards increased energetic efficiency of biochemical pathways leading to less toxic and readily excretable end products in anoxibiotic invertebrates. The thermodynamic model is mainly based upon a metabolic scheme elaborated on intertidal bivalves by de Zwaan et al. "(135)",
293
benthic oligochaetes "(101)" and fresh-water bivalves "(30)". It may provide a general hypothesis for the energetic processes which operate in a variety of ecological and taxonomic groups of anoxibiotic animals.
This work was supported by the "Fonds zur Förderung der wissenschaftlichen Forschung in Österreich", project No.2919. I thank Prof.Dr.W.Wieser for discussions and reading the manuscript.
REFERENCES 1 Addink, A.D.F., Veenhof, P.R.: Regulation of mitochondrial matrix enzymes in Mytilus edulis L. Proc. 9th Europ.mar. biol. Symp., Aberdeen Univ.Press, 109-119 (1975). 2 Baginski, R.M., Pierce, S.K. : Anaerobiosis: a possible source of osmotic solute for high-salinity acclimation in marine molluscs. J.exp.Biol. 62, 589-598 (1975). 3 Beadle, L.C. : Adaptations of some aquatic animals to low oxygen levels and to anaerbic conditions. Symp.Soc.Exp. Biol. 15, 120-131 (1961). 4 Beadle, L.C. : Anaerobic life in a tropical crater lake. Nature 200, 1223-1224 (1963). 5 Blaxter, K.L.: The Energy Metabolism of Ruminants. Hutchinson Scientific and Technical, London. 3rd impr., 332 pp (1969). 6 Brand, Th.: Parasitenphysiologie. Gustav Fischer Verlag, Stuttgart, 353 pp (1972). 7 Brand, Th.: The biochemistry of helminths. Zeitschrift f. Parasitenkunde 45, 109-124 (1974). 8 Brown, H.D.: Biochemical Microcalorimetry. Academic Press, New York, 338 pp (1969). 9 Bruce, J.I., Ruff, M.D., Davidson, D.E., Crum, J.W.: Schistosoma mansoni and Schistosoma .iaponicum: Comparison of selected aspects of carbohydrate metabolism. Comp.Biochem.Physiol. 49B, 157-164 (1974). 10 Bryant, C., Morseth, D.J.: The metabolism of radioactive fumaric acid and some other substances by whole adult Echinococcus granulosus (Cestoda). Comp.Biochem.Physiol. ¿ 5 , $41-546 (?%S)7
294
11 Bueding,E., Saz, H.J.: Pyruvate kinase and phosphoenolpyruvate carboxykinase activities of Ascaris muscle, Hymenolepis dimlnuta and Schistosoma mansoni. Comp.Biochem. Physiol. ¿4, 511-515 ("I966). 12 Burton,K., Krebs, H.A.: The free-energy changes associated with the individual steps of the tricarboxylic acid cycle, glycolysis and alcoholic fermentation and with the hydrolysis of the pyrophosphate groups of adenosinetriphosphate. Biochem.J. 54, 94-107 (1953). 13 Calvet, E., Prat, H.: Recent progress in Microcalorimetry. Pergamon Press Oxford, 177 pp (1963) 14 Chaplin, A.E., Loxton, J.: Tissue differences in the response of the mussel Mytilus edulis to experimentally induced anaerobiosis. Biochem.Soc.Transact. 4, 437-441 (1976). 15 Cheah, K.S.: The oxidase systems of Moniezia expansa (Cestoda). Comp.Biochem.Physiol. 23, 27?-302 (1%7). 16 Cheah, K.S.: Properties of Ascaris muscle mitochondria. I. Cytochromes. BBA ¿87, 107-11** (1975). 17 Cheah, K.S., Bryant, C.: Studies on the electron transport system of Moniezia expansa (Cestoda). Comp.Biochem.Physiol. 19, 197-523 U966)7 18 Cheah, K.S., Chance, B.: The oxidase systems of Ascarlsmuscle mitochondria. Biochem.biophys.Acta 223, 55-60 (1970). 19 Chen, C., Awapara, J.: Intracellular distribution of enzymes catalyzing succinate production from glucose in Rangia mantle. Comp.Biochem.Physiol. 30, 727-737 (1969). 20 Coles, G.C.: Modified carbohydrate metabolism in the tropical swamp worm Alma emini. Nature, Lond. 216, 685-686 (1967). 21 Coles, G.C. : Some biochemical adaptations of the swamp worm Alma emini to low oxygen levels in tropical swamps. Comp.Biochem.Physiol. 34, 481-489 (1970). 22 Dietz, T.H.: Body fluid composition and aereal oxygen consumption in the freshwater mussel, Ligumia subrostrata (Say): Effects of dehydration and anoxic stress. Biol.Bull. 147, 560-572 (1974). 23 Falkowski, P.G.: Facultative anaerobiosis in Limulus polyphemus: Phosphoenolpyruvate carboxykinase and heart activities. Comp.Biochem.Phsiol. 49B, 749-759 (1974). 24 Fenchel, T.M., Riedl, R.J.: The sulfide system: a new biotic community underneath the oxidiced layer of marine sand bottoms. Marine Biol. 7, 255-268 (1970). 25 Forrest, W.W., Walker, D.J., Hopgood, M.F.: Enthalpy changes associated with the lactic fermentation of glucose. J. Bacteriol. 82, 685-690 (1961).
295 26 Gäde, G.: Octopine dehydrogenase in the fresh water bivalve, Anodonta cygnea. Comp.Biochem.Physiol. 48B, 513-517 (1574). — 27 Gäde, G. : Anaerobic metabolism of the common cockle, Cardium edule. 1.-The utilization of glycogen and accumulatlon of multiple end products. Arch.Internat.Physiol. Biochem. 83, 879-886 (1975). 28 Gäde, G.: Octopine dehydrogenase in the cockle Cardium edule. Biochem.Soc.Transact., 562nd meeting, Bangor 4, 533^536 (1976). 29 Gäde, G., Grieshaber, M.: Partial purification and properties of octopine dehydrogenase and the formation of octopine in Anodonta cygenea L. J.Comp.Physiol. 102, 149-158 (1975). 30 Gäde, G., Wilps, H., Kluytmans JÜER, Zwaan, A.de: Glycogen degradation and end products of anaerobic metabolism in the fresh water bivalve Anodonta cygnea. J.Comp. Physiol. 104, 79-85 (1975). 31 Gäde, G., Zebe, E.: Uber den Anaerobiosestoffwechsel von Molluskenmuskeln. J.Comp.Physiol. 85, 291-301 (1973). 32 Gilles, R. : Intermediary metabolism and energy production in some invertebrates. Archs.int.Physiol.Biochem. 78, 313-326 (1970). 33 Gilles, R.: Biochemical ecology of mollusca. Chemical Zoology Vol. 7, 467-499 (Florkin,M. and Scheer,B.T. eds.T, Academic Press, New York (1972). 34 Goudsmit, E.M.: Carbohydrates and carbohydrate metabolism in mollusca. Chemical Zoology Vol. 7, 219-243 (Florkin, M. and Scheer.B.T. eds.), Academic Press, New York (1972). 35 Greichus, A. and Greichus, Y.A.: Lipid metabolism in the hog roundworm, Ascaris lumbricoldes suum. Internat.J. Biochem. 6, 1-7 (1975). 36 Grieshaber, M., Gäde, G.: The biological role of octopine in the squid, Loligo vulgaris (Lamarck). J.Comp.Physiol. 108. 225-232 (197b). 37 Hammen, C.S. : Carbon dioxide fixation in marine invertebrates-V. Rate and pathway in the oyster. Comp.Biochem. Physiol. 17, 289-296 (1966). 38 Hammen, C.S. : Metabolism of the oyster, Crassostrea vlrginica. Am.Zool. 9, 309-318 (1969). 39 Hammen, C.S. : Lactate and succinate oxidoreductases in marine invertebrates. Mar.Biol. 4, 233-238 (1969). 40 Hammen, C.S. : Succinate and Lactate oxidoreductases of bivalve molluscs. Comp.Biochem.Physiol. 50B, 407-412 (1975).
296 41 Hammen, C.S., Osborne, P.J.: Carbon dioxide fixation in marine invertebrates: A survey of major phyla. Science 130, 1409-1411 (1959). 42 Harnisch, 0.: Die Eigenart der oxybiotischen Erholung nach Anaerobiose bei Chironomidenlarven. Biol.Zentralbl. 69, 449-463 (1950). 43 Hoberman, J.D., Prosky, L.: The evidence of reduction of fumarate to succinate in perfused rat liver under conditions of reduced 0~ tension. Biochem.Biophys.Acta 148, 392-399 (1967). * 44 Hoberman, H.D., Prosky, L., Arfin, H.W.: Reversal by anaerobiosis of the succinate dehydrogenase system in intact liver. Fedn.Proc. 24, 229 (1965). 45 Hochachka, P.W. , Fields, J., Mustafa, T.: Animal life without oxygen: Basic biochemical mechanisms. Amer. Zool. 13, 543-555 (1973). 46 Hochachka, P.W., Mustafa, T.: Invertebrate facultative anaerobiosis. Science 178, 1056-1060 (1972). 47 Hochachka, P.W., Mustafa, T.: Enzymes in facultative anaerobiosis of molluscs-I. Malic enzyme of oyster adductor muscle. Comp.Biochem.Physiol. 45.B, 625-637 (1973). 48 Holland, D.L., Tantanasiriwong, R., Hannant, P.J.: Biochemical composition and energy reserves in the larvae and adults of four British periwinkles Littorina littorea, L. saxatilis and L. neritoides. Marine Biol. 33, 235-239 (1975). 49 Hoogerheide, J.C. : Studies on the energy metabolism during anaerobic fermentation of glucose by baker's yeast. Radiation environmental Biophys. 21» 295-307 (1975) 50 Hulbert, W.C., Schneider, D.E., Moon, T.W.: Temperature and salinity adaptation in the purple shore crab Hemigrapsus nudus: A n in vitro metabolic flux study with excised gills. Mar.Biol. 36, 223-231 (1976). 51 Isserhoff, H., Tunis, M., Read, C.P.: Changes in amino acids of bile in Fasciola hepatica infections. Comp. Biochem.Physiol. 41B, 157-163 (1972). 52 Jackson, D.C. : Metabolic depression and oxygen depletion in the diving turtle. J. Applied Physiol. 24, 503-509 (1968). 53 Johnston, I.A.: Anaerobic metabolism in the carp (Carassius carassius L.) Comp. Biochem.Physiol. 51B, 235-241 TW75T: ~~ 54 Kerpel-Fronius, S., Zs.-Nagy, I.: Electron microscopic demonstration of energy production in molluscan neurons. Acta biol.Acad.Sei.Hung. 24, 83-90 (1973).
297
55 Kluytmans, J.H. , Veenhof, P.R. , Zwaan, A.de: Anaerobic production of volatile fatty acids in the sea mussel Mytilus edulis L. J.comp.Physiol. 104, 71-78 (1975). 56 Kluytmans, J.H., Zwaan, A.de: Production of volatile fatty acids in bivalved molluscs. Biochem.Soc.Transact. 4, 475-476 (1976). 57 Kmetec, E., Bueding, E.: Succinic and reduced diphosphopyridine nucleotide oxidase systems of Ascaris muscle. J.Biol.Chem. 236, 584-591 (1961). 58 Kornecki-Gerrety, E.H., Penney, D.G.: The effect of phosphoenolpyruvate, fructose-1,6-diphosphate, alanine and valine on pyruvate kinase from turtle liver and heart. Comp.Biochem.Physiol. 48B, 507-512 (1974). 59 Kornecki-Gerrity, E.H., Penney, D.G.: Kinetic properties of pyruvate kinases from turtle liver and heart. Comp. Biochem.Physiol. 49B, 15 (1974). 60 Kurelec, B.: Catabolic path of arginine and NAD regeneration in the parasite Fasciola hepatica. Comp.Biochem. Physiol. 51B, 151-156 (1975). 61 Lamprecht, I.: Biological calorimetry and DTA. Ecol. d'Ete de calorimetrie.in Villeurbanne, Sept. 1973, 1-50 (Assoc Franc.de Calorimetrie etd1 Anal.Thermique) P. Gravelle (ed.) (1973). 62 Lehninger, A.L.: Biochemistry. Worth Publ.,New York, 2nd ed., 1104 pp. (1975). 63 Lindeman, R.L : Experimental simulation of winter anaerobiosis in a senescent lake. Ecology 23, 1-13 (1942). 64 Livingstone, D.R. : Some kinetic and regulatory properties of the cytoplasmatic L-malate dehydrogenases from the posterior adductor muscle and mantle tissues of the common mussel Mytilus edulis. Biochem.Soc.Transact. 4, 447-451 (1976). 65 Livingstone, D.R., Bayne, B.L.: Pyruvate kinase from the mantle tissue of Mytilus edulis L. Comp.Biochem.Physiol. 48B, 481-497 (1973T: 66 Long, C. : Biochemist's handbook. E. & F.N. Spon Ltd., London, 1192 pp. (1968). 67 Maguire, C., Boaden, P.J.S.: Energy and evolution in the thiobios: an extrapolation from the marine gastrotrich Thiodasys sterreri. Cahiers de Biol.Marine 16, 635-646 (1975). ~~ 68 McManus, D.P.: Tricarboxylic acid cycle enzymes in the plerocercoid of Ligula intestinalis (Cestoda: Pseudophyllidea). Zeitschr. Parasitenkunde 45, 319 (1975). 69 McManus, D.P., James, B.L.: Tricarboxylic acid cycle enzymes in the digestive gland of Littorina saxatilis rudis (Maton) and in the daughter sporocysts of Microphallus similis (Jäg.) (Digenea: Microphallidae). Comp.Biochem.Physiol. 50B, 491-495 (1975).
70 McManus, D.P., James, B.L.: Anaerobic glucose metabolism in the digestive gland of Littorina saxatills rudis (Maton) and in the daughter sporocysts of Microphallus similis (Jag.) (Digenea: Microphallidae). Comp.Biochem.Physiol. 51B, 293-297 (1975). 71 McManus, D.P., James, B.L.: Pyruvate kinases and carbon dioxide fixating enzymes in the digestive gland of Littorina saxatills rudis (Maton) and in the daughter sporocysts of M i c r o c e p h a l i a similis (Jäg.) (Digenea: Microphallidae). Comp.Biochem.Physiol. 51B, 299-306 (1975). 72 Mehlman, B., Brand, T.: Further studies on the anaerobic metabolism of some fresh water snails. Biol.Bull. 100, 199-205 (1951). 73 Moore, H.B.: The muds of the Clyde sea area. III. Chemical and physical conditions; rate and nature of sedimentation and fauna. J.mar.biol.Ass.U.K. 2Z» 325-358 (1931). 74 Mustafa, T., Hochachka, P.W.: Enzymes in facultative anaerobiosis of molluscs - II. Basic catalytic properties of phosphoenolpyruvate carboxykinase in oyster adductor muscle. Comp.Biochem.Physiol. 45B, 639-655 (1973). 75 Mustafa, T., Hochachka, P.W. : Enzymes in facultative anaerobiosis of molluscs - III. Phosphoenolpyruvate carboxykinase and its role in aerobic-anaerobic transition. Comp.Biochem.Physiol. 45B, 657-667 (1973). 76 Nopp, H.: Physiologische Aspekte des Trockenschlafes der Landschnecken. Sitzungsber.d.österr.Akad.Wissensch., Mathem.-naturw.Kl.,Abt. 1, 182.Bd., 1-75 (1974). 77 Ott, J.A. : Determination of fauna boundaries of nematodes in an intertidal sand flat. Int.Rev.ges.Hydrobiol. 57, 645-663 (1972). 78 Ott, J., Schiemer, F.: Respiration and anaerobiosis of free living nematodes from marine and limnic sediments. Netherlands J. of Sea Research 7, 233-243 (1973). 79 Pamatmat, M.M.: In situ metabolism of benthic communities. Cahiers de Biol.Marine 16, 613-633 (1975). 80 Pamatmat, M.M., Bhagwat, A.M.: Anaerobic metabolism in lake Washington sediments. Limnol.Oceanogr. 18» 611-627 (1973). 81 Pandian, T.J. : Mechanisms of heterotrophy. Marine ecology, Vol.11, Part 1, 61-258 (0.Kinne (ed.), Wiley-Interscience, New York (1974). 82 Penney, D.G.: Effects of prolonged diving anoxia on the turtle Scripta elegans. Comp.Biochem.Physiol. 47A, 933-941 (1?)?4). ~~ 83 Pickwell, G.V. : Energy metabolism in ducks during submergence asphyxia:assessment by a direct method. Comp. Biochem.Physiol. 27, 455-485 (1968).
299 84 Por, F.D. , Masry, D.: Survival of a nematode and an oligochaete species in the anaerobic benthal of Lake Tiberias. Oikos 1_9, 388-391 (1968). 85 Prichard, R.K., Schofield, P.J.: The glycolytic pathway in adult liver fluke, Fasciola hepatica. Comp.Biochem.Physiol. 24, 697-710 (1968). 86 Prichard, R.K., Schofield, P.J.: The glyoxylate cycle, fructose-1,6-diphosphatase and glyconeogenesis in Fasciola hepatica. Comp.Biochem.Physiol. 29, 581-590 (1969). 87 Regnouf, F., Thoai van, N.: Octopine and lactate dehydrogenases in mollusc muscles. Comp.Biochem.Physiol. 32, 411-416 (1970). 88 Ringler, R.L., Singer, T.P.: Studies on the mitochondrial «-glycerophosphate dehydrogenase. J.Biol.Chem. 234, 8, 2211-2217 (1959). 89 Ruby, E.G., Fox, D.L.: Anaerobic respiration in the polychaete Euzonus (Thoracophelia) mucronata. Marine Biol. 35, 149-153 (1976). 90 Ruttner-Kolisko, A.: The vertical distribution of plankton rotifers in a small alpine lake with a sharp oxygen depletion (Lunzer Obersee). Verh.Internat.Verein.Limnol. 19, 1286-1294 (1975). 91 Salminen, K.: Succinate dehydrogenase and cytochrome oxidase in adult and plerocercoid Dlphyllobothrium latum. Comp.Biochem.Physiol. 49B, 87 (1973T. 92 Sanadi, D.R., Fluharty, A.L.: On the mechanism of oxidative phosphorylation. The energy-requiring reduction of NAD by succinate and the energy-yielding oxidation of NADH by fumarate. Biochemistry 2, 523-528 (1963). 93 Saz, H.J.: pathways (1971). 94 Saz, H.J., of malat 921-933
Facultative anaerobiosis in the invertebrates: and controlsystems. Am.Zoologist 125-135 Hubbard, J.A.: The oxidative decarboxylation by Ascaris lumbricoides. J.Biol.Chem. 225, (19577:
95 Saz, H.J., Lescure, O.L.: The function of phosphoenolpyruvate carboxykinase and malic enzyme in the anaerobic formation of succinate by Ascaris lumbricoides. Comp.Biochem.Physiol. 30, 49-60 (1969). 96 Saz, H.J., Vidrine, A.: The mechanism of formation of succinate and propionate by Ascaris lumbricoides muscle. J.Biol.Chem. 234, 2001-2005 (1959). 97 Saz, H.J., Weil, A.J.: The mechanism of the formation of oc-Methylbutyrate from carbohydrate by Ascaris lumbricoides muscle. J.Biol.Chem. 235, 914-919 (1960"T
300 98 Scheibel, L.W. , Saz, H. J., Bueding, E.: The anaerobic incorporation of 32p into adenosine triphosphate by Hymenolepis diminuta. J.Biol.Chem. 243, 2229-2235 (196S)T~ 99 Schiemer, F., Löffler, H., Dollfuss, H.: The benthic communities of Neusiedlersee (Austria). Verh.int.Verein, theor.angew.Limnol. 17, 201-208 (1969). 100 Schüttler, U.: Uber den Anaerobiosestoffwechsel von Tublfex. Verh.Dtsch.Zool.Ges. 1974, 271-274 (1975). 101 Schüttler, U., Schroff, G.: Untersuchungen zum anaeroben Glykogenabbau bei Tubifex tubifex M. J.Comp.Physiol. B. 108, 243-254 (197b). 102 Seidman, I., Entner, N.: Oxidative enzymes and their role in phosphorylation in sarcosomes of adult Ascarls lumbricoldes. J.Biol.Chem. 236, 915-919 (1961JT 103 Simpson, J.W., Awapara, J.: Phosphoenolpyruvate carboxykinase activity in invertebrates. Comp.Biochem.Physiol. 12, 457-464 (1964). 104 Simpson, J.W., Awapara, J.: The pathway of glucose degradation in some invertebrates. Comp.Biochem.Physiol. 18, 537-548 (1966). 105 Smith, M.H.: Do intestinal parasites require oxygen? Nature, Lond. 223, 1129-1132 (1969). 106 Stokes, T.M., Awapara, J.: Alanine and succinate as end-products of glucose degradation in the clam Rangia cuneata. Comp.Biochem.Physiol. 25, 883-892 (196877""^ 107 Taylor, A.C.: Burrowing behaviour and anaerobiosis in the bivalve Artica papillosa (L.). J.Marine Biol.Assoc. 56, 95-109 (1976). 108 Theede,H., Ponat, A., Hiroki, K., Schlieper, C.: Studies on the resistance of marine bottom invertebrates to oxygen deficiency and hydrogen sulfide. Mar.Biol. 2, 325-337 (1969). 109 Thillard, G. van den, Kesbeke, F., Waarde, A. van: Influence of anoxia on the energy metabolism of goldfish Carassius auratus (L.). Comp.Biochem.Physiol. 55A, 329-336 (1$?6). ~~ 110 Utter, M.F., Kolenbrander, H.M.: Formation of oxalacetate by ¿02 fixation on phosphoenolpyruvate. The Enzymes Vol. 6, 117-168 (Boyer, P.D. (ed.), Academic Press New York, 3rd ed. (1972). 111 Wadsö, I.: Microcalorimeters. Quart.Rev.Biophys. 3, 383-427 (1970). 112 Ward, C.W., Schofield, P.J., Johnstone, I.L.: Carbon dioxide fixation in Haemonchus contortus larvae. Comp. Biochem.Physiol. 26, 537-544 (1968).
301
113 Watts, S.D.M., Fairbairn, D.: Anaerobic excretion of fermentation acids by Hymenolepis diminuta during development in the definitive host. J. Parasitol. 60, 621-625 (1974). 114 Wieser, W. , Kanwisher, J.: Ecological and physiological studies on marine nematodes from a small salt marsh near Woods Hole, Massachusetts. Limnol.Oceanogr. 6, 262-270
(1961).
115 Wieser, W., Ott, J., Schiemer, F., Gnaiger, E.: An ecophysiological study of some meiofauna species inhabiting a sandy beach at Bermuda. Marine Biology 26, 235-248 (1974). 116 Wijsman, T.C.M.: pH fluctuations in Mytilus edulis L. in relation to shell movement under aerobic and anaerobic conditions. Proc.9th Europ.mar.biol.Symp., 139-149, Aberdeen Univ.Press (1975). 117 Wijsman, T.C.M.: Adenosine phosphates and energy charge in different tissues of Mytilus edulis L. under aerobic and anaerobic conditions. J.comp.Physiol. 107, 129-140 (1976). 118 Wijsman, Z.C.M., Zwaan, A.de, Ebberink, R.H.M.: Adenylate energy charge in Mytilus edulis L. during exposure to air. Biochem.Soc.Trans. 4, 442-443 (1976). 119 Wilson, M.A., Cascarano, J.: The energy-yealding oxidation of NADH by fumarate in submitochondrial particles of rat tissue. Biochem.Biophys.Acta 216, 54-62 (1970). 120 Wood, H.G.: Transcarboxylase. The Enzymes, Vol. 6, 83-115 Boyer, P.D. (ed.), Academic Press,New York,3rd ed. (1972). 121 Zebe, E. : In vivo-Untersuchungen liber den Glucose-Abbau bei Arenlcola marina (Annelida, Polychaeta). J.comp. Physiol. füT7 133-145 (1975). 122 Zee, D.S., Zinkham, W.H.: Malate dehydrogenase in Ascaris suum: Characterization, ontogeny, and genetic control. Arch.Biochem.Biophys. 126, 574-584 (1968). 123 Zoeten, L.W. de, Posthuma, D., Tipker, J.: Intermediary metabolism of the liver fluke, Fasciola hepatica. I. Biosynthesis of propionic acid. Hoppe-Seyler's Z. physiol.Chem. 350, 683-690 (1969). 124 Zoeten, L.W. de, Tipker, J.: Intermediary metabolism of the liver fluke Fasciola hepatica II. Hydrogen transport and phosphorylation. Hoppe Seyler's Z.physiol.Chem. 350, 691-695 (1969). 125 Zs.-Nagy, I.: The distribution of cytosomes in the non nervous tissues of Anodonta cygnea L. (Mollusca, Pelecypoda). Annal.Biol.Tihany 40, 121-134 (1973).
302 126 Zs.-Nagy, I.: Adenosine phosphate concentrations and carbohydrate consumption in the tissues of Anodonta cygnea L. (Mollusca, Pelecypoda) under normal and anoxic conditions. Acta Biochim.Biophys.Acad.Sei. Hung. 8, 143-151 (1973). 127 Zs.-Nagy, I.: Some quantitative aspects of oxygen consumption and anaerobic metabolism of molluscan tissues. A review. Comp.Biochem.Physiol. 49A, 399-405 (1974). 128 Zs.-Nagy, I., Ermini, M. : Oxidation of NADHp by the lipochrome pigment of the tissues of the bivalve Mytilus galloprovincialis (Mollusca, Pelecypoda). Comp.Biochem. Physiol. 43B, 39-46 (1972). 129 Zs.-Nagy, I., Ermini, M.: ATP production in the tissue of bivalve Mytilus galloprovincialis (Pelecypoda) under normal and anoxic conditions. Comp.Biochem.Physiol. 43B, 593-600 (1972). 130 Zwaan, A. de: Pyruvate kinase in muscle extracts of the sea mussel Mytilus edulis L. Comp.Biochem.Physiol. 42B, 7-14 (1972). 131 Zwaan, A. de, Bont, A.M.Th. de: Phosphoenolpyruvate carboxykinase from adductor muscle tissue of the sea mussel Mytilus edulis L. J.Comp.Physiol. B 96, 85-94 (1975). 132 Zwaan, A. de, Bont, A.M.Th. de, Kluytmans, J.H.F.M.: Metabolic adaptations on the aerobic-anaerobic transition in the sea mussel, Mytilus edulis L. Proc. 9th Europ.mar.biol.Symp., 121-138, Aberdeen Univ. Press (1975). 133 Zwaan, A. de, Holwerda, D.A.: The effect of phosphoenolpyruvate, fructose-1,6-diphosphate and pH on allosteric pyruvate kinase in muscle tissue of the bivalve Mytilus edulis L. Biochim.biophys.Acta 276, 430-433 (1973)"! 134 Zwaan, A. de, Holwerda, D.A., Addink, A.D.F.: The influence of divalent cations on allosteric behaviour of muscle pyruvate kinase from the sea mussel Mytilus edulis L. Comp.Biochem.Physiol. 52B, 469-472 (1975). 135 Zwaan, A. de, Kluytmans, J.H.F.M., Zandee, D.I.: Facultative anaerobiosis in molluscs. Biochem.Soc.Symp. 41,
133-168 (1976).
136 Zwaan, A. de, Marrewijk, W.J.A.: Anaerobic glucose degradation in the sea mussel Mytilus edulis L. Comp.Biochem. Physiol. 44B, 429-439 (19737! 137 Zwaan, A. de, Wijsman, T.C.M.: Anaerobic metabolism in bivalvia (Mollusca). Characteristics of anaerobic metabolism. Comp.Biochem.Physiol. 54B, 313-324 (1976). 138 Zwaan, A. de, Zandee, D.I.: Body distribution and seasonal changes in the glycogen content of the common sea mussel Mytilus edulis. Comp.Biochem.Physiol. 43A, 53-58 (1972).
303 139 Zwaan, A.de, Zandee, D.I.: The utilization of glycogen and accumulation of some intermediates during anaerobiosis in Mytilus edulis L. Comp.Biochem.Physiol. 43B, 47-54 (19721:
6.2 Microcalorimetric Investigations of Aquatic Biotopes F. Tiefenbrunner
INTRODUCTION The largest fraction of nutrients dissolved in natural waters are organic substances. Dissolved organic carbon (DOC) may be produced within the system by decomposition of organic detritus or by excretion from members of the biotopes. It has been shown ( 1 ), that algae excrete as much as 80% of their photosynthetic products, macrophytes in the litoral zone of a lake may also excrete a large percentage of their photosynthetic products. It has been reported ( 2 ) , that zooplancton is also a significant source of soluble organic carbon. In addition to production within the system (autochthonous)there is introduction from precipitation and run - off water containing plant material and waste products introduced by man. Decomposition, transformation and mineralization of organic material in the aquatic environment is performed by heterotrophic micro - organisms, mainly bacteria, which are the main agents for return of dead organic matter to the soluble state ( 3 ). However bacteria can directly utilize DOC as nutrients returning DOC to the biological system. The specific requirement of measuring heterotrophic activity is only partly possible using direct methods. Besides the measurement of the biochemical oxygen demand (BOD) and enzymkinetic studies of uptake of labelled organic substrates( 4 ), heterotrophic activity is calculated mainly from biomass estimations in combination with chemical parameters ( 5 ). Microcalorimetry is a nonspecific method for the direct measuremert
306 of biological activity, and therefore could offer advantages for examining the heterotrophic activity in natural waters and water treatment plants. Previous experiments comparing calorimetric measurements on biotopes, including BOD, chemical oxygen demand (COD), enzyme kinetic uptake of glucose and manometric methods showed that commercially available calorimeters have a similar sensitivity as manometric measurements. Calorimetry at the present time is restricted to measurement of eutrophic biotopes having plate counts (Agar, 22°C) in the order of 1o cells /ml. However calorimetry is a useful tool for controlling sewage processing, effluent monitoring of puri fied sewage water and following heterotrophic activity during algal blooms. Using an indirect method it is also possible to estimate toxic compounds in water.
EXPERIMENTAL Calorimeters A flow calorimeter (LKB,Bromma, Typ 21o7) was operated at 3o ml/h, using a steel flow cell of 1 ml volume. Three ampule calorimeters ( 6 ), 7 ml volume, were simultaneously used in some experiments, and another (LKB,Bromma,prototype) of 4 ml volume for other experiments. The calorimeters had a heat effect sensitivity better than o,o5 pV / jiW. In operating the ampule calorimeters the time between loading and measurement was 5o minutes.
Investigation Areas Two different types of sewage treatment plants were examined. The first plant ( A ) was about 12o ooo inhabitation equiva lents, with biological treatment by medium loaded trickling
307
filters, chemical treatment with aluminium sulphate followed by passage through three oxidation ponds. The effluent drained into a river flowing at 2oo - 4oo 1/sec. Samples were taken at the outflow from the primary sedimentation basin (" after prim. sed."), at the outflow from the secondary sedimentation basin (" after sec. sedim." ), the third oxidation pond and from the river upstream (" river" ) and downstream from the effluent outlet. The second plant ( B ) was of 34o ooo inhabitation equivalents operated with biological treatment using the activated sludge process. Simultaneous flocculation by adding ferrous sulphate in the grit chambers was used for reduction of the phosphorus content of the sewage. The effluent after passage through a lake system entered the Baltic Sea. Samples were taken at the outflow of the primary and secondary sedimentation basins and from lake water located at about 25 m from the effluent pipe. All samples for examination were stored in plastic bottles for about 2.5 h between sampling and processing. The calori metric experiments were made in several series. A comparison was made between ampule and flow calorimeters using samples from the secondary sedimentation basin (after biological treatment) and the effluent from the oxidation pond to the river in plant ( A ). The effect of glucose addition was examined using. samples from the primary sedimentation basin (after mechanical purification), the secondary sedimentation basin and outlet from the oxidation pond to the river in plant ( A ). Escherichia and Pseudomonas species isolated from the oxidation pond (Nr. 3 ) in plant ( A )were prepared as suspensions in physiological saline and the effect of glucose additions (1mg/ml) were measured in the flow calorimeter. The effect of temperature ( 25°C and 32°C ) on activity to glucose was measured on samples from the primary sedimentation basin and the secondary sedimentation basin in plant ( B ). Similar samples were examined in relation to glucose degration and temperature were sampling time was varied.
308 RESULTS In figure 1), the thermograms are shown from flow- and ampule calorimeters using samples taken from the effluent from
the
rc
secondary sedimentation basin and 3 ^ oxidation pond ( plant A ). The flow thermogram gave a smaller signal in each case due to the smaller volume measured. However, the bacterial density was high enough for measurable heat effects. Samples from the outlet from the oxidation pond did not show a
high
enough heat effect in the flow calorimeter to make any conclu sions during the first six hours of incubation. The results comparing samples with and without added Glucose are shown in figure 2 a). Effluent from the primary sedimentation basin (after mechanical purification) and effluent from the secondary sedimentation basin (after biological purification) from plant ( A ) were used and measured in ampule calorimeters at 25° C . Both samples showed an increase in heat production after the addition of glucose. A sample from the outflow
of
Figure 1) Comparison of thermograms from flow and ampule cal.
309
Mechan, y Second. 1mg/ml Glucose Mechan.Sed. without Glucose Second.Sed. I Oxid.jjondwith G
5 P S E U D O M O N A S sp. 4 , 3 x 1 0 7 K / m l 25°C
I 6
*
Figure 2a) Comparison of samples with and without added glue. Figure 2b) Difference in heat response of two bacteria species
310 the oxidation pond showed a small increase in activity after incubation with glucose for 6 h. The heat production from the different samples could not be directly compared because they were taken on three different days. Figure 2 b) shows the thermograms of Escherichia- and Pseudomonas species isolated from the first oxidation pond (plant A )suspended and stored for 4 h in physiological saline before examination by flow calorimetry. Glucose ( 1mg/ml ) was added as indicated on the figure. The effect of temperature on the thermograms of samples from the primary and secondary sedimentation basins (plant B ) to which glucose had been added are shown in
fi-
gure 3 ). The heat output at 32° C is significantly higher than at 2 5° C , the maximum activity of the sample being obtained within 6 h at 32° C.
AFTER
MECHAN.Sed
Figure 3) The effect of temperature on the thermograms of samples from primary and secondary sedimentation basins.
311
Figure 4) shows activity of biologically treated sewage water from plant ( A ), sampled on Sunday morning and monday afternoon, incubated with glucose at 25° C in an ampule calorimeter
* SECONDARY SEDIMENTATION 1 mg/ml GLUCOSE 25°C
X o
T I M E
PRIMARY SEDIMENTATION 1 mg/ml G L U C O S E 32°C • ^ - +--
i
II H U
T
— I
r k
r
f
/
/
j
(
\f
^
•
1
•
•
•
•
/ M O N D A Y 4 p-m^f \
1
:
:
: :
/
/
/•
a
MONDAY
h
/a dry-night »sh-fre«
1800
* 4272 RilOV. 443%
3200
6400 12600 C »-OOlli
W O O
1000
Fig. 3 Correlation between ash content and cal/ g dry weight f o r the data from fig. 2 Abscissa: calories per gram dry weight Ordinate: ash content
shown in fig. 5. The mean, which is derived from individual measurements, is nearly the same as for phanerogame plants in general. 95 % of the points fall within the + 10 % range. My prediction is that vegeta-
319 tive material from phanerogames will nearly always fall within or near this range. F o r cryptogame aquatic material this is not as probable, but here, too, a random measurement will give as accurate data as necessary.
• •K 4795 xitOV. M.2\
400
n 30© x 5681 : \0\- 64.3
I I •400 12*00
«0
R
C*I/Q
600
1600
cal/g
dry-weight ash-free
n 326 * 4914 *10~ ' 41,4 *_
10t
••8 4080 XtY0*/.80.»\
MO
iJi 6400 t2eoo
dry-weigh! Mh'free
3200
«00
12000 Cal/gdry-wCight
Fig. 4 Living t e r r e s t r i a l phanérogame plant material (See fig. 1)
•-x 4647
3200
0400 12800 c«J/gdry-