An introduction to sustainable development 9781844075201, 1844075206
The most comprehensive textbook ever written on sustainable development, pilot-tested worldwide. Coverage includes: back
403 115 3MB
English Pages 417 Year 2007
Recommend Papers


![an introduction to child development [3 ed.]
2015948966](https://ebin.pub/img/200x200/an-introduction-to-child-development-3nbsped-2015948966.jpg)


![Introduction to Modeling Sustainable Development in Business Processes: Theory and Case Studies [1st ed.]
9783030584214, 9783030584221](https://ebin.pub/img/200x200/introduction-to-modeling-sustainable-development-in-business-processes-theory-and-case-studies-1st-ed-9783030584214-9783030584221.jpg)

File loading please wait...
Citation preview
A N
I N T R O D U C T I O N
T O
SUSTAINABLE DEVELOPMENT
A N
I N T R O D U C T I O N
T O
SUSTAINABLE DEVELOPMENT P e t e r P. R o g e r s • K a z i F. J a l a l • J o h n A . B o y d
P ublis he d by G l e n Ed ucational Found ation, Inc .
EAR T H SCAN
First published by Ear thscan in the UK and USA in 2008 Copyright © Glen Educational Foundation, Inc., 2008 All rights reserved ISBN: 978-1-84407-520-6 978-1-84407-521-4
(hardback) (paperback)
Preliminar y production work by Island Publishing House, Inc., Philippines Editing by Stephen J. Banta, David Sheniak, and Anita Feleo Formatting by Segundo P. dela Cruz Jr., Zenaida S. Antonio, and Dyosa Marie S. Antonio Information technology by Joseph Reyes and Rober to S. Anselmo Design and layout by Felix Mago Miguel Layout Assistant: Susan Lascano-Dungan Final typesetting by JS Typesetting Ltd, Por thcawl, Mid Glamorgan Printed and bound in the UK by Cromwell Press, Trowbridge Cover design by Susanne Harris Materials sourced from the Asian Development Bank are reproduced with its permission. For more information on development in Asia and the Pacific, see www.adb.org. Materials were also sourced from the United Nations System, including the World Bank. Some pictures were provided by Asian Development Bank (Chapters 1, 2, 4, 5, 6, 7, 8, 9, 10, 11, 12. and 15) and Felix Mago Miguel (Chapters 3, 13, and 14). For a full list of publications please contact: Earthscan 8–12 Camden High Street London, NW1 0JH, UK Tel: +44 (0)20 7387 8558 Fax: +44 (0)20 7387 8998 Email: ear thinfo@ear thscan.co.uk Web: www.earthscan.co.uk 22883 Quicksilver Drive, Sterling, VA 20166-2012, USA Ear thscan publishes in association with the International Institute for Environment and Development A catalogue record for this book is available from the British Librar y Librar y of Congress Cataloging-in-Publication Data Rogers, Peter P., 1937An introduction to sustainable development / Peter P. Rogers, Kazi F. Jalal, John A. Boyd. p. cm. Includes bibliographical references and index. ISBN-13: 978-1-84407-521-8 (hbk.) ISBN-13: 978-1-84407-520-1 (pbk.) 1. Sustainable development. 2. Environmental policy. I. Jalal, Kazi F. II. Boyd, John A., 1942- III. Title. HC79.E5R63134 2007 338.9’27—dc22 2007039463 The paper used for this book is FSC-cer tified and totally chlorine-free. FSC (the Forest Stewardship Council) is an international network to promote responsible management of the world’s forests.
CONTENTS Foreword Preface
7 10
Acknowledgments
13
Authors and Contributors
15
Abbreviations and Acronyms
16
Chapter 1 From Malthus to Sustainable Development Some Intellectual Underpinnings (and a Disclaimer)
20
Why Sustainability?
22
Nine Ways to Achieve Sustainability
23
Economics as the Dismal Science
28
Population, Resources, Environment, and Sustainability
29
Sustainability on the Highway Produced by Three Key Sources of Energy
35
A Look Forward
39
Chapter 2 Challenges of Sustainable Development Concept of Sustainability
42
Factors Governing Sustainable Development
47
Linkages Among Sustainable Development, Environment, and Pover ty
50
Determinants of Sustainable Development
65
Case Studies on Sustainable Development
79
Chapter 3 Global Environmental Issues Population, Income, and Urbanization
84
Health Care
87
Food, Fisheries, and Agriculture
87
Materials and Energy Flows
92
Transpor tation: The Automobile Industr y
96
Precautionar y Principle
98
Forestr y
99
Water Resources
99
Valuation of Nature’s Ser vices
101
Coping with Global Problems
103
Chapter 4 Sustainable Development Indicators Need for Indicators
106
Statistical Procedures Emissions, Diffusion, and Impact Model
111 112
Aggregating Indicators
116
Other Weighting Systems
119
Use of Principal Component Analysis
123
Three Environmental Quality Indices
123
Summar y
132
Annex
133
Chapter 5 Environmental Assessment National Environmental Policy Act of 1969
140
Environmental Impact Assessment
143
Project Categories Based on Environmental Impacts
147
Impact Identification Methods
147
Environmental Impact Assessment Process
149
Chapter 6 Environmental Management: Trends and Policies Milestones in Environmental Management
158
Revisiting Complex Issues
162
Sector Policies Concerning the Environment
163
Environmental Impact Assessment (EIA)
171
Institutional Framework for Environmental Management
174
Achievements in Environmental Management
174
People’s Perception of the Environment
174
Why is the Environment Bad?
176
Millenium Development Goals
177
Conclusion
182
Chapter 7 Legislation, International Law, and Multilateral Environmental Agreements Definitions
184
Sources of International Law
186
The Four Questions In the Context of International Law
188
Multilateral Environmental Agreements (MEAs)
201
Some Early Contributions to Environmental Law and Sustainable Development by Lawyers, Scholars, and Judges Conclusion
210 213
Chapter 8 Social Dimensions and Policies Eradication of Pover ty
219
Par ticipator y Development
228
Consensus Building
231
Nongovernment Organizations (NGOs)
233
Gender and Development
235
Involuntar y Resettlement
239
Indigenous Peoples (IPs)
242
Social Exclusion
245
Social Analysis
247
Social Development Indicators (SDIs)
251
Conclusion
257
Chapter 9 The Economics of Sustainability Evolution of Economic Thinking About the Environment and the Role of Different Economic Factors
260
Concepts of Welfare
262
Public Goods, Common Proper ty, and Private Goods
272
Summar y
274
Chapter 10 Sustainability: Externalities, Valuation, and Time Externalities Valuation
277
Approaches to Valuation
282
Economics Assessment of Sustainable Projects
287
Categories of Costs
290
Economic Life of a Project
291
Economic Assessment of Sustainable Plans and Projects
292
Economic Assessment of Investments in Climate Change Mitigation
293
Summar y
297
Chapter 11 Natural Resource Accounting National Income: Definitions and Limitations
300
Genuine Progress Indicator (GPI)
303
Human Development Index (HDI)
307
World Bank’s Wealth of Nations
307
Genuine Savings
310
Summar y of National Sustainability Accounting
312
Chapter 12 The Role of International Financial Institutions Development and Environment at the World Bank
314
Integrating Environment and Pover ty Reduction
318
Environment and Growth
321
Millennium Development Goals and the World Bank
325
Attacking Pover ty Through Sustainable Development
328
World Bank Experience and Goals
330
Corporate Social Responsibility: The Triple Bottom Line
341
Developed Countries and Sustainable Development
343
Chapter 13 International Cooperation Organizations Responsible for Sustainable Development
346
Reform and Revitalization of Global Organizations
348
World Summit on Sustainable Development
353
Role of Non-State Actors in Sustainable Development
358
NGOs and Social Entrepreneurs
362
Financing Sustainable Development
364
Cooperation Between Regions
366
Peoples’ Ear th Char ter
367
Conclusion
368
Chapter 14 Sustainable Development: Crisis, Conflict, and Compromise Crisis
370
Role of Natural Resources and the Environment
371
Conflict
374
Compromise
379
Summar y
381
Epilogue
385
References
389
Index
407
F O R E WO R D
T
he concept of sustainable development has been evolving for more than 30 years. The 1972 United Nations (UN) Conference on the Human Environment in Stockholm, Sweden, contri buted to this evolution by emphasizing that protection of the human environment is a crucial element in the develop ment agenda. As a result of that conference, the United Nations Environment Programme Secretariat was established to promote international environmental cooperation. On the national front, countries through out the world began to set up or improve their respective environmental institutions. Earlier, in 1970, the United States had already established the Environ mental Protection Agency for a cleaner, healthier countr y. In 1987, the World Commission on Environment and Development, chaired by then Prime Minister of Norway Gro Harlem Brundtland, issued a repor t entitled Our Common Future. Also known as the Brundtland Repor t, this landmark document suggests that creating separately exist ing environmental institutions is not enough because environmental issues are an integral par t of all development policies. They are crucial to economic considerations and sector policies and should be integrated as par t of energy decisions, social issues, and other aspects of development work. The next milestone in the evolution of sustainable development occurred at the 1992 UN Confer ence of Environment and Development in Rio de Janeiro, also known as the Ear th Summit. Its major contribution was to give equal impor tance to the environment and develop ment. It endorsed Agenda 21, both a think piece and a program of action governing human activities with an impact on the environment. It also endorsed the Rio Declaration on Environment and Development, and the Statement of Forest Principles. Most impor tantly, the Ear th Summit helped finalize the UN Climate Change Convention and the Biodiversity Convention, both signed by a great number of heads of state. The UN Climate Change Convention and the recently ratified Kyoto Protocol have made significant contributions to the evolution of sustainable development. Ar ticle 4 of the UN Climate Change Convention provides that “the Par ties [to that Convention] have the right to, and should, promote develop ment.” The Kyoto Protocol’s Clean Development Mechanism is designed in par t to assist par tici pa ting developing countries “in achieving sustainable development.” At the 2002 World Summit on Sustainable Development held in Johannesburg, South Africa, heads of state and world leaders committed to implement Agenda 21. They also decided to carr y out a plethora of par tnerships to promote sustainable development. These endeavors in our common cause have made sustainable development a par t of ever ybody’s vocabular y and agenda. Once of concern only to environ mental specialists, sustainable development has become a con cept that concerns ever yone. 9
Since the phrase “sustainable development” gained prominence after the 1987 publication of Our Common Future, it has been defined in many ways, as described in the first chapter of this book. When did the concept of sustainable development reach the academic world? In the 1960s, a broadly con ceived concept of sustainable development was unheard of in the halls of academe. By the 1980s, courses dealing with environmental impacts of industrial activities, especially problems arising from air pollution and toxic waste, were introduced into the curriculum. During the same decade, the idea of conser vation was gathering momentum. People were becoming more aware of the value of wildlife—of birds, of fish and other marine species, of plants and forests. As the impor tance of looking at all aspects of natural life gained wider appre ciation, environmental programs were broadened to include natural resources management. Taking conser vation a step fur ther, while looking at the plants, water, and air, people began to ask what place they themselves have in the environment. Should not people also be a par t of the environ mental picture? People obser ved that many of the poor were becoming poorer. Some of them were suffering from destroyed forests or declining stocks of fish. Still others were becoming poorer as a conse quence of being resettled to facilitate development projects. A great many people were adversely affected by pollution. Should not environmental concerns also encompass social concerns? As a conse quence, not only have studies in environmental and social fields begun to dovetail, but the study of environmental economics has emerged with clearer definition. In like man ner, environmental law, environmental journal ism, and other related disciplines have developed. From my perspective at the Asian Development Bank (ADB), where we deal with invest ments, we have to be realistic. If ADB is to loan more than $6 billion in a year, such loans have to make sense. Otherwise, there will be no takers. It is the same with sustainable development. The concept has to be adapted to the real world so that it makes sense to finance ministers, economists, entrepreneurs, environmentalists, anthropologists, investors, traders, and other development people. In this way ever yone who is con cerned will make investments as well as produce, consume and par ticipate in creating what is needed in a sustainable manner. In the 1980s, ADB established an Office of the Environment. By the 1990s, ADB had an Office of Environment and Social Development headed by Kazi Jalal, and I worked for him as manager of the Environment Division. In 2002, ADB established the Depar tment of Regional and Sustainable Depar t ment, which I headed until last year. My work experience has taught me a few lessons. First, ever y development project and program must be economically and financially viable. This is why economic and financial considerations are integral factors in making sustainable develop ment decisions. Second, ever y development project and program must be environmentally sound. We cannot have projects or programs with unacceptable impacts on our environment, because such impacts can over whelm the benefits of any development. Third, we have to take into account social issues. People and the environment are par t of ever y development program and project. Clearly, people and the environment do not exist apar t 10
from each other. Any significant change introduced into the environment will likely change people’s lives, including those of women, indigenous peoples, and the youth of the world. Also of key impor tance are how to achieve and maintain good governance and sustainable institutions. If a program or project is not governed properly, or if concerned institutions provide insufficient suppor t, any related development program or project will not be sustainable. In sum, sustainable development has many aspects, including economic and financial, environmental and ecological, as well as social. I recommend this book because it deals with all of these aspects. The authors designed it to help the reader to learn the key ideas and tools of sustainable development. Accordingly, they present a holistic concept of sustainable development. This book can help us learn better, more sustainable ways of producing, consuming, invest ing and otherwise par ticipating in projects and programs in both the developing and the developed world. In this way we can contribute to the achievement of the Millennium Develop ment Goals and respond affirm atively to the call in Our Common Future for “a new development path” for “sustained human progress not just in a few places for a few years, but for the entire planet into the distant future.” Bindu N. Lohani Vice President, Finance and Administration Asian Development Bank Metro Manila, Philippines 11 July 2007
11
P R E FAC E
T
his book is based in par t on lectures and materials used in a course on sustainable develop ment at the Har vard Extension School. It is designed to introduce students and others to basic definitions, challenges, and per spec tives arising under the heading of sustainable development. The book, in its draft form, was used as the textbook for the courses in the fall of 2004 and 2005. Sustainable development is a broad, interdisciplinar y concept that could be analyzed at a length great er than many who are seeking a basic introduction might wish. This book does not attempt a comprehen sive review of all contributions to sustainable development, but does deal with all three dimensions—environmental, economic, and social—of sustain able development. Of necessity this introductor y book is selective in dealing with the issues and perspectives presented. The book introduces the concept and practice of sustainable development and presents some of its key challenges including pover ty reduction. It deals with consumption, production, and distribution as the principal determinants of sustainable development. The focus is on a new produc tion revolution (both industrial and agricultural) which aims at minimizing the current problems of unsustainable production systems. Selected issues on the environment that influence sustainable development have been presented. These include environmental management policies and tools; the environmental impacts of infra structures; environmental indicators; and environmental legislation and institutions related to development. An understanding of the economics of sustainability and natural resources accounting are essen tial for promoting sustainable development. Accordingly, the book deals with the evolution of economic thinking on the environment; the issue of policy and market failures with several examples; the concepts of welfare, externalities and valuation, and how they affect development decisions. On the social dimensions of sustainable development, the book presents a strategy to reduce pover ty based on sound economic growth, distributional effectiveness, and population planning. It also deals with selected social issues affecting sustainable development including the par ticipation of all categories of stakeholders in a development project; and the principles and practices of involuntar y resettlement, gender mainstreaming, and social exclusion. The final chapter deals primarily with the coming crisis, conflict, and need for compromise. The Epilogue also recognizes that we all need to work together to achieve sustainable development. This includes nongovernment organizations, social entrepreneurs, and corporations. Clearly, individuals at the grassroots levels and local and regional level organizations will play salient roles in the achievement of sustainable development. 12
We recognize that many of the topics in the book could, in their own right, be the subject of an introductor y book. Even a subtopic in the chapter on Social Dimensions such as the relationship between indigenous peoples and sustainable development would be wor thy of an analysis longer than that offered in an introductor y book. In an effor t not to overwhelm readers seeking an introduction to sustainable development, we have tried to limit the discussion of each such topic or subtopic to basic information, issues, and descriptions. We trust that the reader will forgive us for the lack of completeness in dealing with some of these topics. This book was initially prepared with assistance from Island Publishing House, Inc., in Manila, Philippines. The present version is a revision of that book. We have tried to be clear, concise, and complete. Never theless, we recognize that in numerous areas the book needs fur ther refine ment and that many of the materials may need to be updated and perhaps expanded to take into account recent events. We invite readers to bring to our attention ways in which we can improve the book. Grants from the GLEN Foundation, a not-for-profit Philippine corporation, suppor ted production of this book. GLEN stands for Governance, Law and Environment Network. The GLEN Foundation is contributing to various projects designed to create a more sustainable future. Despite its shor tcomings, we hope that readers will find that this book leads to a better understanding of the concept of sustainable development, the policy choices presented to each of us to achieve sustainable development, and the oppor tunity to achieve human well-being in a way that was not discussed before. Let us keep in mind what Alber t Einstein once stated: “The world we have created today as a result of our thinking thus far has problems that cannot be solved by thinking the way we thought when we created them.” (Nattrass and Altomare, 1999, Chapter 2, p. 2.)
Peter P. Rogers Kazi F. Jalal John A. Boyd Cambridge, Massachusetts 11 July 2007
13
AC K N OW L E D G E M E N T S
T
here are many contributors to the intellectual life of this book; the most impor tant being John A. Dixon, Kristalina Georgieva, and Warren Evans, at the time all senior staff of the World Bank, who gave guest lectures in our course on Sustainable Development on economics, environ mental management, and sustainable development as practiced by their own institution. Dixon was par ticularly helpful when we were drafting Chapters 9, 10, and 11, as were Georgieva and Evans in informing Chapter 12. In addition to these early contributors, the list of contributors to this book has grown to include many others located in Metro Manila, Philippines, where the initial pilot edition was published, as well as elsewhere. In preparing the text, the technical editor, John Boyd, was assisted by: Stephen J. Banta, David Sheniak, and Anita Feleo. Formatting was done by Segundo P. dela Cruz Jr., Zenaida S. Antonio, and Dyosa Marie S. Antonio. Information technology work was handled by Joseph Reyes and Rober to S. Anselmo. Felix Mago Miguel designed the layout of the book with the assistance of Susan Lascano-Dungan, all of The Philippines. Additional thanks are due to Raul Pangalangan, Dean of the School of Law of the University of the Philippines, and Professor Kheng-Lian Koh of the Faculty of Law of the National University of Singapore for their comments on Chapter 7. Thanks as well are extended to Professor John Malcolm Dowling; Piya Abeygunawardena; Anne Sweetser ; Eugenia McGill; Francoise Burhenne Guillman, Senior Counsel of the Center for Environmental Law of the International Union for the Conser vation of Nature; and Amber Pant, Professor of Law, Tribhuvan University for reading and commenting on various chapters. An initial pilot edition by Island Publishing House, Inc., was used as the text in the Extension School in the fall of 2004 and 2005. The present book incorporates feedback from that course and from reviewers. About 300 students from locations spanning the globe have taken the courses over the last six years and we gratefully acknowledge their comments and suggestions; their questions and term papers helped us to sharpen the presentation. The authors greatly appreciate assistance provided by Professor Jack Spengler of the Har vard School of Public Health and Len Evanchick of the Har vard Extension School in encouraging us to write this book. We are also grateful for the assistance and suppor t of Mar y Higgins, Assistant Dean of Continuing Educa tion at the Extension School of Har vard University. Our graduate students and teaching assistants; Molly Kile, Scott Kennedy, Junenette Peters, Amy Zota, Casey Brown, and Linda Liang, were ver y helpful in bringing the book to fruition. Grateful thanks are also extended to assistant librarian Nelia R. Balagapo of the ADB Law Librar y and Larisa Duponte, staff assistant in the Division of Engineering and Applied Sciences at Har vard University.
14
We are especially thankful to Molly Kile and Scott Kennedy for their assistance in teaching the courses and redrafting por tions of the text. Molly Kile completed her doctorate in 2006 and is now a member of the teaching faculty for the course, Scott Kennedy is now an Assistant Pro fessor at the Malaysian University of Technology, and Junenette Peters and Casey Brown now hold academic positions at Har vard School of Public Health and the Ear th Institute at Columbia University, respectively. Finally, a special thanks is due Margaret Owens who seized the moment, made the index, edited the revised texts, checked the references, and made a timely production of this edition possible. Cambridge, Massachusetts 11 July, 2007
15
AU T H O R S A N D C O N T R I B U TO R S Dr. Peter P. Rogers is Gordon McKay Professor of Environmental Engineering and Professor of City Planning, Har vard University. Dr. Kazi F. Jalal is a Lecturer at Har vard’s Extension School, and was the Chief of the Office of Environment and Social Development of the Asian Development Bank and the Director of the Division of Industr y, Human Settlements and Environment of UN/ESCAP. John A. Boyd was a guest lecturer in the 2002, 2004, 2005, and 2006 Har vard Extension School course on sustainable development. Formerly he was a lawyer for the U.S. Depar tment of State and the Asian Development Bank. He also was Principal Sector Specialist (Sustainable Development) for ADB. Dr. John A. Dixon, was a guest lecturer in the 2002 Har vard Extension School course on sustainable development, and formerly an environmental economist at the World Bank. Dr. Kristalina Georgieva was Director of the Environment Depar tment in the Environmentally and Socially Sustainable Development Vice Presidency and Chair of the Environment Sector Board of the World Bank when she was a guest lecturer in the 2002 Har vard Extension School course on sustainable development. J. Warren Evans was the Director of the World Bank’s Depar tment of Environment in 2004 and 2005 when he was a guest lecturer. Previously he was Director of the Environment and Social Safeguard Division within the Regional and Sustainable Development Department of ADB. Dr. Scott Kennedy was a Suppor t Teaching Staff for the 2002 Har vard Extension School course on sustainable development. Dr. Molly Kile is a Research Associate at the Har vard School of Public Health and has been a Suppor t Teaching Staff of the Har vard Extension School course on sustainable development since 2002.
16
A B B R E V I AT I O N S A N D AC RO N Y M S ADB BCA BMI BOD CEQ CFC CO CO 2
COR CPI DDT
DFI DFID DNA EIA
EIRR EIS EPA ESCAP EU FAO
FIRR GDP GE GEF GM GNP GPI HDI HIID IADB IBRD ICJ IEE ILO IMF IP (s) IRRI IUCN Lao PDR MBDOE
Asian Development Bank benefit-cost analysis body mass index biochemical oxygen demand Council on Environmental Quality chlorofluorocarbon carbon monoxide carbon dioxide cost of remediation consumer price index dichlorodiphenyltrichloroethane development finance institution Depar tment for International Development, United Kingdom deoxyribonucleic acid environmental impact assessment economic internal rate of return environmental impact study Environmental Protection Agency, United States United Nations Economic and Social Commission for Asia and the Pacific European Union Food and Agricultural Organization financial internal rate of return gross domestic product genetically engineered (in relation to crops) Global Environmental Facility genetically modified (in relation to crops) gross national product genuine progress indicator human development index Har vard Institute for International Development Inter-American Development Bank International Bank for Reconstruction and Development International Cour t of Justice initial environmental examination International Labour Organization International Monetar y Fund indigenous people(s) International Rice Research Institute World Conser vation Union Lao People’s Democratic Republic million barrels daily oil equivalent
17
MDB MDG MEA MFI MIQR NAAQS NEPA NGO NPK O3 ODA OECD OPEC PCF PPP PRC PSI RSA SDE SDI SDS SEA SO 2
SUV TSP UK UN UNCED UNCHE UNDP UNEP UNFPA US USAID WB WCED WEO WHO WSSD WTO WWF ha kg mg
18
multilateral development bank Millennium Development Goal multilateral environmental agreement multilateral financing institution modified interquar tile range National Ambient Air Quality Standard National Environmental Policy Act nongovernment organization nitrogen, phosphorus, and potassium ozone overseas development assistance Organisation for Economic Co-operation and Development Organization of Petroleum Expor ting Countries Prototype Carbon Fund purchasing power parity People’s Republic of China pollution standard index rapid social assessment social development elasticity social development indicator social design study strategic environmental assessment sulfur dioxide spor ts utility vehicle total suspended par ticulates United Kingdom United Nations United Nations Conference on Environment and Development United Nations Conference on the Human Environment United Nations Development Programme United Nations Environment Programme United Nations Population Fund (Fonds des Nations Unis pour la population) United States United States Agency for International Development World Bank World Commission on Environment and Development World Environment Organization World Health Organization World Summit on Sustainable Development World Trade Organization World Wildlife Fund (for Nature) hectare kilogram milligram
C H A P T E R
1
F RO M M A LT H U S TO S U S TA I N A B L E D E V E L O P M E N T
AN
IN TRO DU C TIO N TO
S U S TA I N A B L E
DEVELO PM EN T
W
hat do we mean by sustainability? First, we will talk about some ideas surrounding the issue ar ticulated by various thinkers. Since a discussion of sustainability can cover a time span between now and kingdom come, we will keep our discussion within a realistic time frame. We will deal with the challenges of sustainable development, including environmental policy management and some social dimensions. And we will utilize some environmental economics, because economics is quite impor tant in understanding some of the potentials and problems when we talk about sustainability and development.
SOME INTELLECTUAL UNDERPINNINGS (AND A DISCLAIMER) In 1798, Thomas Malthus, an economist and a countr y pastor in England, wrote An Essay on the Principle of Population, revised in 1803 as An Essay on the Principle of Population; or, a View of its past and present Effects on Human Happiness; with an Inquir y into our Prospects respecting the Removal or Mitigation of the Evils which it occasions. He believed that population was held in check by “miser y, vice, and moral restraint.” Malthus maintained that “... population, when unchecked, increased in a geometrical ratio, and subsistence for man in an arithmetical ratio.” The debate about Malthusian limits has raged over the centuries, with many critics asking how it became possible to have a six-fold increase in global population (from one to six billion) since 1798 and still be able to more or less feed the population. As recently as 1973 a renewed burst of Malthusianism was published by the Club of Rome in a book entitled Limits to Growth, by Donella Meadows et al. (1972). Most if not all of the Club of Rome’s predictions for the next 30 years, from 1973 to 2003, were not borne out. Another leading Malthusian, Lester Brown, has over the years regaled us with many jeremiads of gloom and doom predicting dire consequences within the next few years, which never seem to be quite fulfilled, but which are plausible based upon projecting trends. An exper t on crop production, Brown set up the prolific World Watch Institute in 1974, which has provided much-appreciated summaries of the global use of natural resources and the environment, usually accompanied by warnings of imminent collapse. Brown’s annual State of the World series and the associated working papers have been impor tant steps in the development of the concepts on sustainability. Despite their tone of immediate collapse, the Malthusians provided a useful reminder to society and governments that continued profligate consumption could sooner or later get us into trouble. In addition to the well-founded evidence that we had, indeed, not run out of resources as the Malthus hypothesis predicted, there arose a school of thought referred to as the cornucopians. The group dismisses Malthus and sees instead an ever-increasing human population enjoying ever more benefits from the planet. In contrast to Malthus, Ester Boserup (1981) believed “necessity is the mother of invention,” and asser ted that the increase in population pressure acts as an incentive to developing new technology and producing more food. Her analysis concluded that population growth naturally
20
FRO M
M A LT H U S TO
S U S TA I N A B L E
DEVELO PM EN T
leads to development, at which point population pressures would decline. Writers such as Julian Simon (1981) and Wilfred Beckerman (2003) also disagreed with Malthus. Simon saw a future limited only by human ingenuity, not by mundane issues such as food and energy consumption; Beckerman sees the future as not resource limited, but limited by humans’ inability to get the economic institutions right. Even as long ago as 1848 Karl Marx saw ever-expanding consumption possibilities, based surprisingly upon the enterprise of the capitalists in promoting globalization. (This was pointed out by the major cornucopian, Herman Khan (1976), in his book, The Next Two Hundred Years.) More recently there has been a series of impor tant books promoting more nuanced views of the Malthus/Cornucopian debate. Bjørn Lomborg’s The Skeptical Environmentalist: Measuring the Real State of the World in 2001 and Jared Diamond’s 2005 Collapse: How Societies Choose to Fail or Succeed both in their own ways look carefully at ecosystems from a historical perspective and draw mixed conclusions with, in some cases, dire consequences for societies that misbehave environmentally and adaptive sur vival strategies in others. Both see social and political adaptability as the major difference between catastrophe and sur vival. Despite more than a generation since the resurgence of Malthusian ideas, we still do not have a consensus as to how seriously impaired the world ecosystems are, or the potential for continued development for the growing population. The United Nations (UN) and its resource agencies, UNDP, UNESCO, UNFPA, WHO, WMO, UNIDO, and the global multinational funding agencies such as the World Bank, the Inter-American Development Bank, the Asian Development Bank, the African Development Bank, and the European Bank for Reconstruction and Development all repor t with reasonable frequency upon the status of the environment and the ecosystems in their areas of interest. The news from the agencies is typically mixed. The good news is that we can feed more than 6.5 billion people with enough food to keep them functioning each day of the year. The bad news is that we appear to be seriously compromising our life suppor t systems to accomplish this. This was borne out in a special series on the “State of the Planet” in November 2003 in Science. The authors looked selectively at air, fresh water, fisheries, food and soil, energy, biodiversity (including human species), and climate change. As the editor of the series, H. Jesse Smith (2003), said: This collection of articles is offered in the spirit of “forewarned is forearmed,” not “the sky is falling.” Whether we find ourselves forearmed or under the fallen sky depends upon what we choose to do about these issues over the next generation. Who then is to be believed and what, if anything, should be done? The irony of the debate is that Malthus wrote his original essay to counteract what he thought to be dangerous ideas about human perfectibility being propounded at that time. Nowadays most Malthusians coat their recommendations and aspirations in terms of human perfectibility. (Gus Speth’s 2004 book, Red Sky at Night, is an example of this hor tator y style.) The debate still swirls around us. What should we attempt to do? Our goal is to avoid the major intellectual perils on both sides of the coin. We must look coldly and soberly on what we know and have experienced and what is predictable in the shor t run and then
21
AN
IN TRO DU C TIO N TO
S U S TA I N A B L E
DEVELO PM EN T
settle on the continuum between the two sides of the issue. Intuition, if nothing else, tells us that Malthus makes sense in the long run: we just cannot keep on expanding and using resources, because something will be exhausted in the end. But in the shor t run, we can rely on human ingenuity to get us through the next 30 or 50 years. After that, all bets are off. Our definition, therefore, of sustainability is time-bound to a couple of human generations. Along with the journal Science, we believe this is the most scientifically suppor table position to take.
W HY S U S T A I N A B I L I T Y ? Sustainability is the term chosen to bridge the gulf between development and environment. Originally it came from forestr y, fisheries, and groundwater, which dealt with quantities such as “maximum sustainable cut,” “maximum sustainable yield,” and “maximum sustainable pumping rate.” How many trees can we cut and still have forest growth? How many fish can we take and still have a fisher y functioning at the end of the time period? How much ground water can we draw and still have a viable aquifer at the end of the pumping period? Even when these “maximums” are obser ved, the ecosystem itself is not necessarily sustainable, as these are just the components of the overall ecosystem. Fur thermore, sustainability can often be achieved in the shor t run, but not necessarily in the long run. The attempt now is to apply the concept of all aspects of development simultaneously. The problem is, we experience difficulties in defining sustainable development precisely or even defining it operationally. The major discussion initiating sustainable development is found in the repor t of the World Commission on Environment and Development (WCED), a body created by the UN General Assembly in 1983. This Commission was headed by Gro Brundtland, then prime minister of Norway and later head of the World Health Organization. The Commission’s 1987 repor t, often referred to as the Brundtland Commission Repor t, defined “sustainable development” as development that “meets the needs of the present without compromising the ability of future generations to meet their own needs.” How is sustainable development to be achieved? This question harkens back to the sustainable fisher y concept. What is a sustainable fisher y? Should we ask what number of whales is sustainable? Many think that having more whales is probably better than having fewer whales. And we do not really need to eat whale meat. We have domesticated animals that we could use for that purpose. Rober t Repetto focuses his discussion of sustainable development on “... increasing long-term wealth and well-being.” In his 1986 book, World Enough and Time, Repetto wrote that “the core idea of sustainability is that current decisions should not impair the prospects for maintaining or improving future living standards. This implies that our economic systems should be managed so that we can live off the dividends of our resources.” By “resources” Repetto includes natural and otherwise, considering both as an endowment fund. As he was connected at the time with the World Bank, it is understandable that Repetto’s definition relies heavily on economic concepts.
22
FRO M
M A LT H U S TO
S U S TA I N A B L E
DEVELO PM EN T
Herman E. Daly, who was also with the World Bank, suggested an ethical concept. In 1987 he talked about requiring an “increase in moral knowledge or ethical capital for mankind.” John C.V. Pezzey, another former World Bank official, listed (Rogers et al. (1997) p. 44) 72 definitions of sustainable development, commencing as long ago as 1972. Mohan Munasinghe (1993) drew the “...distinction between ’sur vivability,’ which requires welfare to be above a threshold in all periods, and ’sustainability,’ which requires welfare to be non-decreasing in all time periods.” Pezzey suggests that sur vivability means that you are always above some threshold at all points in time, whereas sustainability takes a sor t of millennial view that things are getting better all the time in a monotonic way. Our sense of this definition is that sur vivability is what we may have in our future rather than sustainability. In 1993, Mohan Munasinghe discussed (Rogers et al. (1997) p. 44) three approaches to sustainable development: • economic – maximizing income while maintaining a constant or increasing stock of capital; • ecological – maintaining resilience and robustness of biological and physical systems; and • social-cultural – maintaining stability of social and cultural systems. Munasinghe, an economist from the World Bank, offers a somewhat precise definition for his economic approach to sustainable development. However, his discussion of ecological approaches that maintain resilience and robustness of biological and physical systems does not tell us what resilience and robustness mean in biological systems. We have some notions of that, but we do not have good operational definitions. And then in the social-cultural domain, he calls for maintaining stability of social and cultural systems. While this is desirable, he is not clear ; besides, how can one actually calculate such stability? We are left to wonder.
N I N E W AY S
TO
A C H I EVE S U S T A I N A B I L I T Y
In the 1997 book entitled Measuring Environmental Quality in Asia, by Peter P. Rogers, Kazi F. Jalal, et al., indicators for environmental development are discussed. Nine ways to achieve sustainability are described (Box 1-1). Box I-1. Nine Ways to Achieve Sustainability
• • • • • • • • •
Leave everything in the pristine state, or return it to its pristine state. Develop so as to not overwhelm the carrying capacity of the system. Sustainability will take care of itself as economic growth proceeds (Kuznets). Polluter and victim can arrive at an efficient solution by themselves (Coase). Let the markets take care of it. Internalize the externalities. Let the national economic accounting systems reflect defensive expenditures. Reinvest rents for nonrenewable resources (weak and strong sustainability). Leave future generations the options or the capacity to be as well off as we are.
23
AN
IN TRO DU C TIO N TO
S U S TA I N A B L E
DEVELO PM EN T
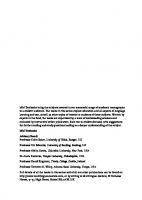
First, leave ever ything in a pristine state, or return it to its pristine state. While that sounds nice, it is not going to happen. Nobody is going to do that, not when people are living, because it would involve a tremendous amount of pain and anguish. Second, develop so as not to overwhelm the carr ying capacity of the system. Again, what is the carr ying capacity of the globe? Does anybody want to hazard a guess in terms of the number of people that might constitute the carr ying capacity of the globe? The current global population is estimated at 6.3 billion. Is the carr ying capacity of the world 6.3 billion people? If the standard of living to be achieved is the equivalent of current United States (US) standards, the carr ying capacity is probably about 1 billion, based on our indicators. A carr ying capacity of 6.3 billion people is possible at some greatly reduced standard of living below the US standard, but cer tainly not at the US standard. Carr ying capacity is a difficult concept to define. And if we decided that we have exceeded our carr ying capacity, what should we do about it? That is another complex question. Third, sustainability will take care of itself as economic growth proceeds. This is sor t of a cornucopian view and it is attributed to the economist Simon Kuznets, (ADB, Emerging Asia (1997), pp. 213-215), though he was already dead when the idea was attributed to him, so he could not complain about it. Basically his followers pointed out that as per capita income rises, people tend to take better care of the environment. When you are very poor, you are concerned about surviving and getting along at any cost. As you obtain more and more income, you can achieve environmental sustainability through the production of superior goods and services because you would then star t to diver t income to such purposes as air quality. Consider the US in the 1960s, when the income per capita rose to about $6,000. Americans star ted to spend a lot of money on reducing the levels of air and water pollution. Despite current repor ts of gloom and doom in the newspapers, the ambient air quality in the US has greatly improved over what it was in the 1960s. That does not mean that it is perfect, but the US peaked on the parabolic cur ve relating environmental damage with per capita income, as Kuznets followers suggested (see Figure 1-1). The figure also suggests some arguments based upon proper ty rights and ecological thresholds as to why and how the Kuznets hypothesis might work. The implication of Kuznets’ thinking is to develop as quickly as possible. We see this hypothesis at work in the People’s Republic of China (PRC): develop quickly, as rapidly as possible, and the environment will take care of itself. However, those who have been to the PRC or India notice that the environment is not doing ver y well right now under this par ticular hypothesis, because the proponents would say, we will just wait a while, when the per capita income gets up to about $6,000, and then things will star t to improve. The current per capita income in the PRC and India is probably about $3,000 to $4,000, so they have got quite a way to go before that would be possible. Meanwhile, we can expect a continuously deteriorating environment. Four th, Ronald Coase suggested that the polluter and the victim can arrive at an efficient solution by themselves. Under the Coase theorem (discussed in more detail in Chapter 10), ever yone should get together and decide on an efficient level of pollution and on an efficient level of degradation of
24
FRO M
M A LT H U S TO
S U S TA I N A B L E
DEVELO PM EN T
Figure 1-1. Causes of Environmental Degradation
ill-deined property rights
Index of environmental degradation
subsidies removed property rights defined externalities internalized better environmental policies
0
10,000+
Source: Modiied from T. Panayotou, ADB, Emerging Asia (1997), p. 213
the environment. Coase won a Nobel Prize in economics mainly for this par ticular theorem, which seems to work fairly well in small-scale situations. However, it is hard to imagine it working with a large number of people, because the transaction costs could be very high. Fifth, let the markets take care of it. This is another economic solution. If one prices pollution and permits trading of pollution rights along with similar market operations, then sustainability can be achieved. Many people believe in this solution. Sixth, internalize the externalities, which would provide an elegant solution. According to the 1997 Asian Development Bank (ADB) Guidelines for the Economic Analysis of Projects (1997), an “externality” is defined in par t as the [e]ffects of an economic activity not included in the project statement from the point of view of the main project participants, and therefore not included in the financial costs and revenues that accrue to them. Externalities represent part of the difference between private costs and benefits, and social costs and benefits. To internalize an externality, the ADB publication continues, “[e]xternalities should be quantified and valued, and included in the project statement for economic analysis.” Of course it is a good
25
AN
IN TRO DU C TIO N TO
S U S TA I N A B L E
DEVELO PM EN T
thing to internalize the externalities, because people will then see in fact the real cost of activities, such as driving automobiles, and realize the damage caused by such activities. When we think of the cost of running an automobile, we think of the cost of gasoline at about $3 a gallon. But if we think about the environmental damage arising from the use of automobiles, it is equivalent to another $3 per gallon. Those of us who drive automobiles are taking a free ride on the environment for the equivalent of about $3 a gallon. We do not internalize these costs. If we were to internalize those externalities, then fewer people would use automobiles, or they would be driving much more fuelefficient types of automobiles. Seventh, perhaps we could have the national economic accounting system reflect defensive expenditures. This suggests that we worr y about making sure that when we do our accounting, we do it correctly from the point of view of resource accounting. Most people probably do not realize that a good way of increasing gross domestic product (GDP) is to have lots of pollution and lots of sewage treatment plants, because GDP measures expenditures for all goods and ser vices. This is why building more prisons with more prisoners is good for GDP; the same holds with building more schools. However, far more money is spent per prisoner than per student. But then more prisons means that GDP increases. Is this a real measure of what we want in terms of sustainability? Since prison expenditures are defensive expenditures, perhaps we should reflect such expenditures in some other way. Eighth, reinvest the rents from nonrenewable resources (sometimes referred to as the Har twick Rule, which is discussed more in Chapter 10.) Under this hypothesis, if we are using petroleum resources, then we should take the revenues resulting from such resources and invest them in some other way of dealing with the environment, for example, improving mobility, if use of gasoline is the issue. Some of the big oil companies are now using the profits from the oil to invest in a renewable resource such as solar technologies. Ninth, leave future generations the options or the capacity to be as well off as we are, which comes from Rober t Solow (1991). We are not quite sure how to do that. We keep on doing more of the same, although it is a truism, cer tainly in the western, industrialized nations, that generally each generation is better off than the last one. We are better off than our parents were, and so on. But whether we can continue with this progression, and how we can actually ensure it, is not obvious. Sir John Hicks, an early twentieth-centur y English economist, defined income as “the maximum value that a person can consume in a period of time and still expect to be as well off at the end of the period as he was at the beginning.” This has been redefined in the context of sustainable development as “sustainable social net product,” which is a measure of a sustainable national income (see Box 1-2). Thus for a nation, sustainable social net product is the net national product (net national product equals GNP minus consumption of fixed capital) minus defensive expenditures to protect the environment minus the depreciation of natural capital. This means that we cannot chop down all the trees in the forest and count them as income, but that we can only use the amount of trees that are going to grow during the time period of such use.
26
FRO M
M A LT H U S TO
S U S TA I N A B L E
DEVELO PM EN T
Box I-2. Sustainable Social Net Product
Sustainable social net product is based on Sir John Richard Hick’s definition of income (i.e., maximum value that a person can consume in a period of time and still expect to be as well off at the end of the period as he was at the beginning) as net national product minus defensive expenditures minus the depreciation of natural capital: SSNP = NNP – DE – DNC Source: Daly (1996)
That is a prudent definition, and one would hope that we would all behave that way. However, it seems that a great deal of current behavior does not conform to this line of thinking. When the net national product is measured without taking into account defensive expenditures and depreciation of natural capital, we tend to overestimate how well we are doing (this is discussed more in Chapter 11). In Measuring Environmental Quality in Asia (Rogers et al., 1997), measures of environmental quality are developed, including a cost of repair approach, which emphasizes measurement of defensive expenditures. This suggests that if we have damaged the environment, we should be concerned with what it would cost to repair it, which means what it would cost to get it back into the condition in which we would like to have it. Savings is the key to sustainability. The formula in Box 1-3 is also a sentence, which in English says, savings, as a percentage of GDP, should be greater or equal to the sum of the depreciation of human knowledge plus the depreciation of human-made capital plus the depreciation of natural capital. Box I-3. Savings: Key to Sustainability
A simple rule for sustainability would be: S y
≥
δH KH y
+
Savings as Percentage of GDP
≥
Depreciation of Human Knowledge
+
δM KM y Depreciation of Human-made Capital
+
δN KN y
+
Depreciation of Natural Capital
Human Capital (H), Man-made Capital (M), and Natural Capital (N). Weak sustainability requires: Sum of all forms of capital constant or increasing over time Strong sustainability requires: Each is constant or increasing over time Source: Modiied from Pearce and Atkinson in Rogers et al. (1997), p. 52
27
AN
IN TRO DU C TIO N TO
S U S TA I N A B L E
DEVELO PM EN T
Weak sustainability requires that the sum of all capital be constant or increasing over time. In other words, it implies the possibility of substitutions among human-made capital, human knowledge, and natural capital. Strong sustainability requires that each of these three types of capital be increasing over time. Most of the literature basically thinks in terms of weak sustainability, meaning that we can substitute between natural capital, human-made capital, and human knowledge, but there are many counter-examples to this assumption. For example, how can we substitute humanmade capital for an extinct species such as the dodo bird?
ECONOMICS
AS THE
DISMAL SCIENCE
Why is economics considered the dismal science? It is because of the relationship of decreasing returns to scale, posited by Malthus and the English economist David Ricardo, among geometric population growth, the arithmetic depletion of resources, and the expansion to everdeclining quality of resources. Both did not paint a ver y pretty picture of what was going to happen to the world, and so economics earned the appellation, “the dismal science,” and they are considered its fathers. Boxes 1-4 and 1-5 are often referred to as the “rule of seventy.” It is a useful trick to help remember the time taken for a number to double when the number is constantly increasing at a cer tain percent. If a number, such as the number of people in a population, is increasing at r percent per year, then after one year the number will equal the original number times one plus r, or (1.0 + r), percent, which is the rate of growth. After two years, the number of people in the population equals the original population times one plus r squared, or (1.0 + r) 2, because we are compounding the increase in the number. After t years, the total population is equal to the original population multiplied by (1.0 + r) to the power of t (1.0 + r) t. The formula also applies to calculating increases in the value of money invested at R percent per annum. Such calculations may be more interesting to most laypersons as they indicate how much money can be made by a par ticular investment over a period of time. If we use exponentials we can do these computations quickly. For instance, the time taken for a number to double is shown in Box 1-4 as 0.6931/r. This means that the doubling time is close to 70/r where R is expressed in percentage terms.
28
FRO M
M A LT H U S TO
S U S TA I N A B L E
DEVELO PM EN T
Box I-4. Geometric Growth: The Foundations of the Dismal Science
If the growth rate of a population is r percent per annum, an initial population of N0 becomes N1 after one year, or N1 = N0 (1+r) and after two years, N 2 = N1 (1+r) = N0 (1+r)2 and after t years, Nt = N0 (1+r) t So for a population of 100 persons growing at a rate of 2% per annum, after 1 year the population will be 102 persons. After 2 years the population will be 104.02. The same holds true for money invested at r percent per annum.
Continuous compounding can be expressed as Nt = N0 er t This is a very useful form to compute. For instance, the time taken for N 0 to double is Nt / N0 = 2 or 2 = er t In 2 = r t t = (ln2)/r = 0.6931/r For r as a percentage the doubling time is close to 70/r. For example, for an interest rate of 10%, the doubling time will be 7 years; 70∕ 10= 7.
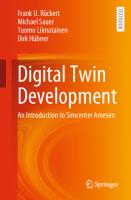
PO P U L A T I O N , R E S O U R C E S , E NV I R O N M E N T , AND SUSTAINABILITY The above calculations can often be done in one’s head. This is a useful trick and a useful tool to calculate rough values for investment returns, world population trends, nor th-south distribution rates, and the like. Table 1-1 shows that it took all of previous histor y until the 1800s before the ear th had a population of one billion. The next billion was reached in 1930, or 130 years later. The next billion
29
AN
IN TRO DU C TIO N TO
S U S TA I N A B L E
DEVELO PM EN T
Table 1-1. World Population Number of Years to Add Each Billion
Year First billion reached Second Third Four th Fifth
Years to Add
1800 1930 1960 1975 1987 Projected 1998 2009 2020 2033 2046 2066 about 2100
Sixth Seventh Eighth Ninth Tenth Eleventh Twelfth
all of human history 130 30 15 12 11 11 11 13 13 20 34
Source: Population Reference Bureau (1991), United Nations and World Bank estimates for the projections
North 6
South 67%
75% 84% 1950 1980 2025
4
2
1820
Source: Modiied from UNDP/HDR (1990), p. 25
30
1920
1996
2020
Billions of People
Figure I-2. World Population Trend and North-South Distribution
FRO M
M A LT H U S TO
S U S TA I N A B L E
DEVELO PM EN T
people was achieved in 1960, after 30 years. And then the four th billion took 13 years; the fifth billion, 12 years; the sixth billion, 11 years. So there has been a huge acceleration in the growth rate of the world population, and this is one reason why we have become concerned about population and resources. Figure 1-2 shows the trend in world population as of 1996, when it was less than 6 billion. It is more than 6.5 billion now, and it is still increasing. Based upon 1990 data, the UN indicated that it would increase to more than 10 billion by 2050, following their median population estimates, and that it might rise as high as 13 billion before stabilizing. Just to show how quickly population forecasts can change, as of 2002 the UN exper ts expected the world population to level off at between 9 to 11 billion. A difference of 2 to 4 billion is rather large, considering that the total world population in 1975 was only 4 billion. Th e E h rl i c h Id e n t i t y To help analyze the interaction of factors causing environmental impact, the American environmentalist Paul Ehrlich suggested the relationship, I=PAT, popularly known as the Ehrlich Identity. The identity relates in a multiplicative way population, P, affluence, A, and technology, T, to environmental impact, I. (This identity fits into a long line of “production” functions in economic analysis. The best known is the Cobb-Douglas production function, where production output, O, is related nonlinearly to capital inputs, K, and labor inputs, L, by the equation O=K aL b, where a and b are the output elasticities of capital and labor, respectively.)
Box 1-5. Ehrlich Identity: I=PAT Environmental Impact (I) = Population (P) times Affluence [consumption per capita (A)] times Technology per capita (T) I = PAT A small change in each, ΔP, ΔA, and ΔT, gives the new impact (I+ΔI) = (P+ΔP) (A+ΔA) (T+ΔT) Dividing through by the identity I = PAT yields (1+ΔI/I) = (1.0+ΔP/P) (1.0+ΔA/A) (1.0+ΔT/T) where ΔI/I etc. is the percentage increase in impact, population affluence, and technology.
Ehrlich has written several books, commencing with The Population Bomb (1971), predicting dire consequences from the rapid growth of human population. For tunately, so far his predictions have not been borne out, but he (like Malthus) might be right in the long run. In any event, I=PAT
31
AN
IN TRO DU C TIO N TO
S U S TA I N A B L E
DEVELO PM EN T
provides a useful way of looking at the impact of population, consumption per capita, and technology per capita. These three factors constitute some of the major influences on the environment. For example, I=PAT can help us understand the relative causes of the impact of lead from automobiles on the environment from 1946 to 1968. During those 22 years, the US population increased by 42%. The measure of affluence in terms of vehicle miles driven per capita rose by 100%, and the measure for technology in terms of lead emitted per vehicle mile rose by 81%. Therefore, the increase in environmental impact can be described as (1+ΔI/I) = (1.0+0.42) (1.0+1.0) (1.0+0.81) (1+ ΔI/I) = 5.14 This amounts to a 414% increase. What caused the increase? Clearly it was not simply a population effect, but the joint effect of affluence and technology working together. For tunately, lead was phased out from gasoline in the US fuel system star ting in 1973. What is the carr ying capacity of the globe? As the Ehrlich Identity suggests, the level of per capita consumption is ver y impor tant in determining the impact on the environment or the carr ying capacity. But then, too, technology changes and income rises, and both these changes are associated with the use of resources. These factors need to be taken into account when population growth in third world countries is compared with such growth in industrialized countries. Third world countries do not consume ver y much. Industrialized countries have low rates of population growth but high rates of consumption of resources like energy. In many instances a person in an industrialized countr y consumes as much energy in six months as an Indian villager consumes in a lifetime. Per capita consumption is thus probably the most impor tant component in such comparisons of technology change. In planning for the future we typically want per capita consumption to increase; hence, to reduce the impact on the environment the multiplicative effects of the other components need to be reduced. Perhaps we need to focus more on the third factor : technology change. Such an emphasis is the basis of much of the cornucopians’ optimism about the future. L ife C y c l e A n a ly s i s a nd S us t a i nability The choice of a simple disposable coffee cup is a trivial example, but it can demonstrate how we could improve sustainability by examining each of our small life style choices—a small achievement, but an impor tant demonstration of the power of life cycle analysis in establishing sustainability. This relates to the environmental impacts of paper cups compared with polyfoam, or Styrofoam cups. The debate over this issue goes back many years. It appears that in many quar ters, paper cups have won this debate. The question is, which is the most environment-friendly of these cups? How can we ascer tain which is more sustainable? Does the paper cup provide the right answer? We will have to do some analysis to find out. Consider Table 1-2 comparing some obvious features of a typical paper cup and a typical polyfoam cup.
32
FRO M
M A LT H U S TO
S U S TA I N A B L E
DEVELO PM EN T
Table I-2. Paper Cup vs. Polyfoam Cup: An Environmental Summary I
Item
Paper Cup
Polyfoam Cup per cup
Raw materials: Wood and bark (g) Petroleum fractions (g) Other chemicals Finished weight (g) Wholesale cost
33 (28 to 37) 4.1 (2.8 to 5.5) 1.8 10.1 2.5 x
0 3.2 0.05 1.5 x
Source: Based on M. Hocking (1991)
When we are examining sustainability, it is impor tant to look at the life cycle of the device in question, including production, use, and ultimate disposal. In Germany, for example, there is an attempt to make automobiles fully recyclable. This has not yet been achieved, but large por tions of German automobiles are now recyclable, and greater por tions will become recyclable in the future. As indicated in the table, the raw materials in the paper cup include wood and bark, since it is made of paper. Paper cup raw materials also include petroleum. Actually, there is more petroleum used in paper cup production than in a polyfoam cup, which is made almost entirely of petroleum products. Some may find that surprising. Also, a lot of chemicals like chlorine are used to bleach the paper in the paper cups to make them look nice. Binders such as glue are used to stick paper cups together. All of these ingredients for paper cups cost about two and a half times as much as cups made of polyfoam. Now consider the environmental impacts during production of the cups, summarized in Table 1-3. The production of the cups requires steam, power (electricity), and cooling water. Water effluent for each cup is measured by volume, suspended solids, biochemical oxygen demand (BOD), organochlorines, and metal salts. Air emissions are measured in terms of chlorine, chlorine dioxide, reduced sulfates, par ticulates, chlorofluorocarbons, pentane, and sulfur dioxide. The table shows that in most cases polyfoam cup production causes much less environmental impact than paper cup production. What about the reuse and recyclable potential and ultimate disposal of paper cups versus polyfoam cups? (Tables I-4 and 1-5.) The ability to reuse paper cups is likely low, since they can disintegrate when reused. Ver y few people reuse paper cups. However, polyfoam cups are easy to wash, and reuse. Paper cups burn well, but produce a hot melt adhesive. If paper cups are not completely burned, these adhesives will linger in the environment.
33
AN
IN TRO DU C TIO N TO
S U S TA I N A B L E
DEVELO PM EN T
Table I-3. Paper Cup vs. Polyfoam Cup: An Environmental Summary II
Item
Paper Cup
Utilities: Steam (kg) Power (kWh) Cooling water (m 3) Water effluent Volume (m 3) Suspended solids (kg) BOD (kg) Organochlorines (kg) Metal salts (kg) Air emissons Chlorine (kg) Chlorine dioxide (kg) Reduced sulfides (kg) Par ticulates (kg) Chlorofluorocarbons (kg) Pentane (kg) Sulfur dioxide (kg)
Polyfoam Cup per metric ton of material
9,000-12,000 980 50
5,000 120-180 154
50-90 35-60 30-50 5-7 1-20
0.5-2.0 Trace 0 0 20
0.5 0.2 2.0 5-15 0 0 10
0 0 0 0.1 0 35-50 10
Source: Based on M. Hocking (1991)
Table I-4. Recyclable Potential of Paper Cups and Polyfoam Cups
Item
Paper Cup
Polyfoam Cup
To primary user
Possible, though washing can destroy
Easy, negligible water uptake
After use
Low, hot melt adhesive or coating difficulties
High, resin reuse in other applications
Recyclable Potential
Source: Based on M. Hocking (1991)
34
FRO M
M A LT H U S TO
S U S TA I N A B L E
DEVELO PM EN T
Table I-5. Ultimate Disposal of Paper Cups and Polyfoam Cups
Item
Paper Cup
Polyfoam Cup Ultimate Disposal
Paper incineration
Clean
Clean
Heat recovery (MJ/kg)
20
40
Mass to landfill (g)
10.1
1.5
Biodegradable
Yes, BOD to leacheate, methane to air
No, essentially inert
Source: Based on M. Hocking (1991)
Potential heat recover y from a polyfoam cup is twice that of a paper cup. The mass to landfill ratio of paper to polyfoam cup is 8 to 1. Are these two types of cups biodegradable? Polyfoam cups do not seem to be biodegradable. Walking the beaches of Massachusetts, one finds lots of old polyfoam that was not disposed of in a correct way. Which is the best cup depends on what we think are bad results. A lot of people seem to think that the litter of polyfoam on the beaches of the world is much worse than all of those other environmental insults produced by paper cups. If polyfoam cups were collected and disposed of properly by incineration, there would be no question about which would be preferred.
S U S T A I N A B I L I T Y O N T H E H I G H W AY P R O D U C E D B Y T H R E E KE Y S O U R C E S O F E N E R G Y Comparing vehicles powered by electricity, gasoline, and diesel is a bit like comparing apples and oranges, and bananas. A comparison of these vehicles is possible only if it is based on their respective performance levels in use and over their entire life cycle. In the following example, based upon typical sized gasoline, diesel, and electric cars in France in the late 1990s before hybrids were available, the cars were assumed to be similar in all performance and travel conditions. In this case, life cycle costs are calculated on the assumption of 45 kilometers a day. First, when all of the private costs from purchase price to energy use, maintenance, batter y replacement, and the like are considered, it turns out in Figure 1-3 that the new gasoline vehicle is the most expensive, the cost of a new diesel is the least expensive, and the cost of an electric vehicle lies in between. This result is based upon ver y low electricity rates in France due to the large amount of nuclear electricity on the base load. In the US the new electric car would have had the highest private costs. Diesel vehicles are a lot cheaper. How would one make a choice? If one is a rational
35
AN
IN TRO DU C TIO N TO
S U S TA I N A B L E
DEVELO PM EN T
Figure I-3. Life Cycle Costs per Kilometer : Private Costs $/km
€/km 0.4
Energy
0.4
Maintenance Battery
0.3
Purchase
0.3 0.2
0.2
0.1
0.1
0.0
0.0 Electric Vehicle 25 km/day
Electric Vehicle 45 km/day
Gasoline new
Diesel new
Gasoline old
Diesel old
Source: Funk and Rabl (1999)
Table I-6. Calculated Damage Costs of Common Air Pollutants Pollutant Greenhouse gases, CO 2 equivalent
Damage Cost (euro/kg)a 0.029
Secondary pollutant, per kg of primary pollutant SO 2 via sulfates
10.0
NO 2 via nitrates
14.5
NO 2 via ozone
1.50
NMVOC via ozone
0.93
Primary pollutants from refineries PM10
15.4
Primary pollutants from cars PM 2.5 Paris PM2.5 highway, Paris-Lyon
a
159
PM2.5 rural France
22
SO2 direct, Paris
28
SO 2 direct, highway, Paris-Lyon
2.2
SO 2 direct, rural France
0.3
CO 2 Paris
0.02
CO 2 highway, Paris-Lyon
0.002
1€ = $1.16
Source: Funk and Rabl (1999)
36
2190
FRO M
M A LT H U S TO
S U S TA I N A B L E
DEVELO PM EN T
Figure I-4. Life Cycle Costs: Including Social Costs €/km 0.4
$/km Damage
0.4
Energy Maintenance
0.3 0.3
Battery Purchase
0.2 0.2 0.1
0.1
0.0
0.0 Electric Vehicle 25 km/day
Electric Vehicle 45 km/day
Gasoline new
Diesel new
Gasoline old
Diesel old
Source: Funk and Rabl (1999)
consumer, focusing on the overall cost of running and owning a car, one would buy a new diesel car or an old diesel car, because either one costs less based on euros spent per kilometer. However, use of these vehicles results in damages caused by the pollution they produce over their life cycle. To calculate these damages, we need to know the damages caused by primar y and secondar y pollutants. Primar y pollutants are emitted from refineries and from fuel use, and secondar y pollutants consist of sulfates, nitrates, and ozone generated in other par ts of the life cycle. The primar y pollutants from cars are provided in terms of driving in a city or driving on a highway, and greenhouse gases (use of all fossil fuels produces greenhouse gases). Table 1-6 repor ts the estimates used to calculate the impacts of the conventional pollutants. Also we need to add in the cost of greenhouse gases estimated at about $20 per ton of carbon dioxide (CO 2). Different vehicular activities have different damage costs based on health damages (mor tality damages were not considered). Figure 1-4 shows what the relative attractiveness of the automobile choice is now when these externalities are factored in. An old diesel vehicle, which is really cheap to buy and use based upon the private costs, has high social costs because it produces a great many par ticulates that are ver y damaging to human health. If all of these costs are added together, the life cycle cost per kilometer, including social costs, is high. Many consumers, however, do not wish to be concerned with social costs; they wish to pay only private costs. However, a policy designed to find a solution that takes into account ever yone in a community, not just those who purchase low-cost vehicles, will encourage the purchase and use of electric vehicles. Indeed, electric vehicles, which can be driven 45 kilometers per day, become competitive with old gasoline vehicles after taking into consideration average values of damages.
37
AN
IN TRO DU C TIO N TO
S U S TA I N A B L E
DEVELO PM EN T
How can we make consumers respond to social costs rather than the private costs? Some would suggest manipulating costs, par ticularly fuel costs, and removing direct and indirect subsidies, in order to make the private cost look more like the real social cost. When attempting full life cycle analysis, social as well as private life cycle costs have to be considered. We must also factor in the damage to the environment. Each of these three points of view may provide entirely different answers, all of which are impor tant to achieve sustainability. By looking behind the numbers and ascer taining the impacts, we could star t modifying motor vehicle technology. For example, spor ts utility vehicles (SUVs) were often considered the worst vehicles from the sustainability point of view because they were big and consumed a great deal of fuel. Ford has now produced a new, small, hybrid SUV powered by gasoline and electricity. As adver tised, the new SUV has improved fuel efficiency by 81% and reduced emissions by 60%, and this SUV is now enjoying brisk sales. Americans often prefer bigger mid-sized vehicles than Japanese consumers. So now American consumers can buy an SUV and feel better about it from the environmental point of view. From the environmental point of view, however, ever yone should be driving small cars or taking public transpor tation, if such is available. On the public transit side there are also potential moves towards sustainability. For example, Seattle recently bought 235 new diesel electric buses, each with a hundred seats. Compared with previous buses, these have a potential improved fuel economy of 60% and reduced par ticulates of 90%. Also note that Seattle has many tunnels where these buses will be used, powered only on electric cycle in the tunnels. The ability to drive significant distances on only electricity has other significant advantages in stop-and-go traffic, because most of the emissions come from low-speed driving. Recall the I=PAT identity and note that we are now rapidly changing the technology we use, which will lead at the same time to reducing consumption. These are major technical improvements with major potential for changing per capita use of petroleum resources. How long does it take to roll over from one type of vehicle in the United States—ten years or 15 years? If these new technologies do indeed catch on, then we can expect that US petroleum demand by 2020 could be substantially lower than currently projected. One impor tant reason to believe that we are due for such an accelerated change of technologies in the direction of more sustainability is the current and growing competition for petroleum-based fossil fuels. In 2004, the PRC impor ted about 90 million tons of petroleum products, while the US impor ted about 400 million tons. By 2020, the PRC will impor t 400 million tons. Also India impor ted about 90 million tons of oil products last year, and India’s demand in 2020 will be significant, though not as high as the PRC’s. The world market for oil may not be able to supply these amounts at reasonable prices. Something has to give. Unless there is a radical shift in the availability of fossil fuels, we are heading for one of those proverbial train wrecks. To avoid such disaster, we are already star ting to see the adoption of alternative-fueled vehicles. This suggests that we will muddle through because we are smar t enough to figure out that we do not want to be wiped out by such a train wreck. The two examples of new technologies for
38
FRO M
M A LT H U S TO
S U S TA I N A B L E
DEVELO PM EN T
hybrid SUVs and Seattle’s purchase of new hybrid buses are quite hopeful. If other par ts of the world such as India, where there are several hundred thousand buses, take similar initiatives, major environmental and social improvements can be achieved. However, without a radical technology shift, we will face significant problems. The good news is, people are actually buying and using new technologies. Life cycle analysis of ever y proposed change is imperative to achieve sustainable development. We often fall shor t, because most of our analyses are based purely on private costs, on manufacturing costs, and on costs to purchase goods and ser vices in the marketplace without sufficient attention to what is impor tant. Why were little plastic bags filled with air designed for packing purposes? Not so long ago Germany required all packaging to be returned to the manufacturer. Before this change, US producers were flying thousands of computers packed with Styrofoam to Germany. With this new requirement the Styrofoam had to be flown back to the US. While flying computers packed in Styrofoam is probably a profitable activity, flying Styrofoam-filled 747s back to the US for disposal clearly is not. Manufacturers had to find a new way of packing the computers. Because bags full of air are a lot cheaper to bring back home than bulky Styrofoam, they were rapidly adopted. These changes in technology for packaging were induced by environmental concerns, new legal requirements, and resulting economic costs, as suggested by the above example of the electric vehicle, which was superior, but only if based on the social costs.
A L O O K FO R W A RD This introductor y chapter has explored many of the key issues to be confronted in achieving sustainable development, including the triple bottom line of environmental, social, and economic considerations in the face of such global environmental issues as population growth, consumption, production, pollution, effects of legal requirements, as well as some of the causes and effects of pover ty. The book will consider other issues, including sustainable development indicators; environmental assessment and management trends; international law, including multilateral environmental agreements; and national environmental accounts. The book concludes with a review of what international financial institutions and others are doing to achieve sustainable development, together with a quick look into the next 50 years. The Epilogue focuses on the challenges posed by terrorism, climate change, the global food system, and globalization. It will be argued that the most serious indicators of losing our path to a sustainable 2050 would be an increase in absolute levels of pover ty in the world, increasing gaps between the rich countries and the poor countries, and increasing gaps between specific countries. Since sustainable development requires social sustainability as well as economic and environmental sustainability, we believe that increased polarization between the rich and the poor could lead to increased terrorist violence, failed states, fur ther deterioration of the environment, and mass migrations for economic sur vival and environmental reasons. To avoid such consequences and provide for a better world, we all need to work toward achieving sustainable development throughout the world.
39
C H A P T E R
2
C H A L L E N G E S O F S U S TA I N A B L E D E V E L O P M E N T
AN
IN TRO DU C TIO N TO
CONCEPT
OF
S U S TA I N A B L E
DEVELO PM EN T
SUSTAINABILITY
T
he concept of sustainability explores the relationship among economic development, environmental quality, and social equity. This concept has been evolving since 1972, when the international community irst explored the connection between quality of life and environmental quality at the United Nations Conference on the Human Environment in Stockholm. However, it was not until 1987 that the term “sustainable development” was deined as “development that can meet the needs of the present generation without compromising the ability of future generations to meet their own needs” (World Commission on Environment and Development, 1987.) This deinition established the need for integrated decision making that is capable of balancing the economic and social needs of the people with the regenerative capacity of the natural environment. Sustainable development is a dynamic process of change in which the exploitation of resources, the direction of investments, the orientation of technological development, and institutional change are made consistent with future as well as present needs. According to the Brundtland Commission, sustainable development, in the inal analysis, must rest on political will of the governments as critical economic, environmental, and social decisions are made. There are many deinitions and concepts of sustainable development as depicted in Table 2-1. Besides, there is a vast literature on sustainable development, which also provides other deinitions, concepts, principles, criteria, indicators, and references (see: http:// www.iisd.org/ie/info/ss9504.htm and http://www.gdre.org/sustdev). Reviewing these and other relevant references constitutes a major task in trying to understand the meaning and signiicance of the term “sustainable development.” Table 2-1. Sustainable Development: Definitions, Principles, Criteria, Conceptual Frameworks, and Indicators S u b je c t
1. 2. 3. 4. 5.
Definitions Principles Criteria Conceptual frameworks Indicators
Number
57 19 12 4 28 sets
(See: )
Th ree C o mpo n e n t s Sustainable development has three dimensions: economic, environmental, and social. These are frequently referred to as the triple bottom line, and are used to gauge the success of a par ticular development program or project. It is critical that each component be given equal attention in order to ensure a sustainable outcome. This balance becomes obvious when each component is examined individually. 42
CH A L L E N G E S
O F
S U S TA I N A B L E
DEVELO PM EN T
1. The economic approach: Maximize income while maintaining constant or increasing stock of capital. [T]he core idea of sustainability is that current decisions should not impair the prospects for maintaining or improving future living standards. This implies that our economic systems should be managed so that we can live off the dividends of our resources. (Rober t Repetto, 1986) By “resources” Repetto includes natural and otherwise, considering them as an endowment fund. The interest rate is the regenerated capacity of the natural environment or of a human-made environment, plus the managed capacity for expansion. As he was connected at the time with the World Bank, it is understandable that Repetto’s definition relies heavily on economic concepts. Sustainable economic growth means that real GNP per capita is increasing over time and the increase is not threatened by “feedback” from either biophysical impacts (pollution, resource degradation) or from social impacts. (David Pearce et al., 1989) Sustainable development argues for : (1) development subject to a set of constraints which set resource har vest rates at levels not higher than managed natural regeneration rate, and (2) use of the environment as a “waste sink” on the basis that waste disposal rates should not exceed rates of managed or natural assimilative capacity of the ecosystem. (D. Pearce, 1988) In this definition, note the phrases “managed natural regeneration rate” and “managed or natural assimilative capacity.” This is a definition that is somewhat quantifiable and can be translated in mathematical terms. For example, with reference to forest management: If: Then:
X 1 = m 3 biomass removed/unit time X 2 = m 3 biomass regenerated naturally and/or reforested/unit time X 1 should be less than X 2 for sustainable forestr y
Similarly, in terms of water quality, if there is, in a given wastewater effluent, Y 1 par ts per million of biochemical oxygen demand (BOD) per day being discharged into a receiving body of water, and Y 2 is the par ts per million of BOD per day that the receiving body of water can satisfy in terms of its dissolved oxygen content, then Y 1 has to be less than or equal to Y 2 in order for the natural body of water to retain its sustainable character. That is: If: Then:
Y 1 = ppm BOD discharged/unit time Y 2 = ppm BOD satisfied/unit time Y 1 should be less than or equal to Y 2
43
AN
IN TRO DU C TIO N TO
S U S TA I N A B L E
DEVELO PM EN T
Sustainable development means basing developmental and environmental policies on a comparison of costs and benefits and on careful economic analysis that will strengthen environmental protection and lead to rising and sustainable levels of welfare. (World Bank, 1992) This definition regards the classification of sustainability as a balance between a desired environmental end and the costs involved in achieving that end. Here, the World Bank tries to balance the three dimensions of sustainability, but “sustainable levels of welfare,” which refers to the social dimension, is not ver y clear. Sustainable development is an approach that will permit continuing improvements in the quality of life with a lower intensity of resource use, thereby leaving behind for future generations an undiminished or even enhanced stock of natural resources and other assets. (Mohan Munasinghe and Ernst Lutz, 1991) This is yet another definition given by the World Bank. It refers to future as well as present generations only in terms of enjoying the stock of resources and assets. The social dimension is par tly ignored, which is the definition’s inherent weakness. 2. The ecological approach: Maintain the resilience and robustness of biological and physical systems. Sustainable development is about maintenance of essential ecological processes and life support systems, the preser vation of genetic diversity, and the sustainable utilization of species and ecosystems. (IUCN, WWF, UNEP, 1987) The term “sustainable development” suggests that the lessons of ecology can, and should be applied to economic processes. It encompasses the ideas in the World Conser vation Strategy, providing an environmental rationale through which the claims of development to improve the quality of (all) life can be challenged and tested. (Michael Redclift, 1987) 3. The socio-cultural approach: Maintain the stability of social and cultural systems. Sustainable economic development is directly concerned with increasing the standard of living of the poor, which can be measured in terms of increased food, real income, education, health care, water supply, sanitation, and only indirectly concerned with economic growth at the aggregate. (Edward Barbier, 1987) Maurice Strong, the first Executive Director of the United Nations Environment Programme (UNEP) and the Secretar y General of the United Nations Conference on Environment and 44
CH A L L E N G E S
O F
S U S TA I N A B L E
DEVELO PM EN T
Development (UNCED) in Rio in 1992, offers this definition, which runs beyond the economic, environmental, and social boundaries. Sustainable development involves a process of deep and profound change in the political, social, economic, institutional, and technological order, including redeinition of relations between developing and more developed countries. (Maurice Strong, 1992) There are many definitions of sustainable development contained in the Brundtland Commission repor t and related references on the subject. O pe ra t i o n a l C ri t e ri a fo r S u s tainable Development Considering many definitions and concepts of sustainable development, there seem to be three operational criteria. These criteria should evaluate each objective of the triple bottom line with the following three caveats:
Box 2-1. Balancing Project Benefits ECONOMIC
Project A
Project C
Project B
Project D
SOCIAL
Project A
Project B Project C Project D
ENVIRONMENTAL
– Large-scale irrigation project with high economic returns: rich farmers beneit, but causes schistosomiasis among local people, who are not direct beneiciaries: poor farmers may become landless laborers – Save the spotted deer or rhinoceros – Subsidized hospital project in a sparsely populated urban area – Rural water supply project, which beneits the poor and women in particular, improves quantity and quality of available water, and at low cost.
Source: D.V. Smith and K. F. Jalal (2000), p. 3
45
AN
IN TRO DU C TIO N TO
S U S TA I N A B L E
DEVELO PM EN T
• Economic objectives should not be maximized without satisfying environmental and social constraints. • Environmental benefits should not necessarily be maximized without satisfying economic and social constraints. • Social benefits should not be maximized without satisfying economic and environmental constraints. Operationally speaking, sustainable development is about maximizing economic, social, and environmental benefits subject to a set of constraints. (See Boxes 2-1 and 2-2.)
Box 2-2. Project Types
Let us consider the following typology of projects (See Box 2-1). Project A, a large-scale irrigation and lood control project with a very high beneit-to-cost ratio, favors large farmers more than poor farmers, and causes waterborne and snailborne diseases such as malaria and schistosomiasis. These diseases affect the local people, most of whom may not be direct beneiciaries of the project. The poor marginal farmers who are living within the project area eventually become landless laborers. How does that occur? Mainly it happens through the conluence of modern science and modern farming techniques. The large farmers are aware of the beneits of irrigation; of high yielding seeds, and, nowadays, genetically modiied seeds; of pesticides; and so on—the fruits of science in the service of the Green Revolution. These agribusiness persons can produce ive times more crops per unit of land, making the land itself more valuable. So they go to the small farmers and ask, “How much are you getting out of your land in terms of income?” They then convince the poor farmers to sell their land to them. Thus, the formerly independent small farmers may become laborers or tenants on what was once their own property. Obviously, this kind of a project is less likely to be sustainable. Project B is about maximizing environmental objectives at the cost of social and economic objectives, using the spotted deer or the rhinoceros as an example. If the multilateral development banks (MDBs) decide to fund one of these projects, they should identify and integrate social and economic benefits into the project. Project C exempliies a situation that maximizes social objectives at the cost of environmental and economic objectives, and therefore is not considered as sustainable. Project D is a sustainable development project such as a rural water supply project that beneits the poor (women in particular, since they are the ones usually responsible for fetching household drinking water) and improves the quantity and quality of the water supply at low cost. This is the kind of project that should be regarded as sustainable. Does this mean that the MDBs should not inance those projects with high economic payoff? The answer is no; they may do so provided that the projects can be redesigned to take into account environmental and social considerations while maximizing economic beneits.
46
CH A L L E N G E S
O F
S U S TA I N A B L E
DEVELO PM EN T
F A C T O R S G OV E R N I N G S U S T A I N A B L E D E V E L O P M E N T The key factors governing sustainable development are pover ty, population, pollution, par ticipation, policy and market failures (including good governance), and prevention and management of disasters. These can be regarded as the major pillars on which sustainable development rests. According to estimates made by the United Nations Development Programme (UNDP), the wealthiest 20% of the global population earns 82.7% of the total global income. This bracket also accounts for 81.2% of world trade, 94.6% of commercial lending, 80.6% of domestic savings, and 80.5% of domestic investment. By contrast, the share of total global income of the poorest 20% is a mere 1.4%. Their contribution to world trade (1.0%) and commercial lending (0.2%) is statistically negligible. Plotting these figures yields a graph that is commonly called a champagne glass (Figure 2-1). Clearly, most of the investments, income, trade, and lending are attributed to the first 20% of the global population.
Figure 2-1 Distribution of World Income and Disparities
Richest
First 20%
82.7 %
Second 20%
11.7 %
Third 20%
2.3 %
Fourth 20%
1.9 %
Fifth 20%
1.4 %
v v
Per Capita Income
v
v Poorest
Source: Extracted from Human Development Report, UNDP (2005) Website: http://hdr.undp.org
47
AN
IN TRO DU C TIO N TO
S U S TA I N A B L E
DEVELO PM EN T
Where do these poor people live? Most of them live in South Asia (550 million), followed by Sub-Saharan Africa and then the Middle East and Nor th Africa (Figure 2-2). A recent study (Cavanagh and Anderson, 2004) indicates that there are now 497 billionaires in the world, whose collective wealth is greater than the combined wealth of the poorest half of humanity of over three billion people. According to another ar ticle (Economic Development Futures Web Journal, 2004), the number of millionaires in the world has soared to 7.7 million, and the number of poor people earning less than a dollar per day increased from 1.1 billion (in 1992) to 1.3 billion in 2004. A more recent (2007) repor t says, the number of millionaires in the world now stands at 9.5 million. Figure 2-3 shows the global income distribution and disparities drawn up by UNDP in 1992; the agency’s 1999 Human Development Repor t (HDR) suggests that global income inequality has worsened since then. However, a 2003 International Chamber of Commerce (ICC) paper states that “new research shows that, contrary to popular belief, it is precisely during the recent period of increased globalization of the world economy that pover ty rates and global income inequality have most diminished.” The ICC study under taken by Prof. Sala-i-Mar tin of Columbia University points out that the HDR of UNDP “computed its pover ty ratios using current exchange, therefore ignoring the fact that the cost of living is lower in developing countries.” Once adjusted for purchasing power parity, Sala-i-Mar tin finds that the pover ty ratio of the richest 20% to the poorest 20% of the global population has actually star ted to diminish over the last two decades. In his recent (2005) book entitled “The End of Pover ty”, Jeffrey Sachs, professor of Columbia University, and adviser to the UN Secretary General on pover ty alleviation, states: “The share [of
Figure 2-2. Regions Where the Poorest People of the World Live
600
Millions of People
500 400 300 200 100 0
South Asia
East Asia
Middle East North Africa
East Europe
Latin America
Sub-Saharan Africa
Source: (1) J. Cavanagh and S. Anderson (2004) (2) Economic Development Futures Web Journal (June 2004) (3) Merrill Lynch and Capgemini (2007): Eleventh Annual World Wealth Report
48
CH A L L E N G E S
O F
S U S TA I N A B L E
DEVELO PM EN T
world resources] devoted to helping the poor has declined for decades and is a tiny fraction of what the US has repeatedly promised, and failed to give.” Except for a few developed countries of the world (such as the Scandinavian countries and the Netherlands), most industrialized countries have failed to fulfill their global commitment of 0.7% of their GDP for international assistance to reduce pover ty. Current resource allocation for addressing the plight of the poor by the US is only 0.15% of its GDP. According to Sachs, our generation can choose to end pover ty provided that we are able to mobilize resources from the developed world, in accordance with commitments made at the Ear th Summit held in 1992 in Rio de Janeiro, Brazil, and reiterated by the World Summit on Sustainable Development (WSSD) held in 2002 in Johannesburg, South Africa. He also recommends adoption of a new method that he chooses to call “clinical economics.” In his view, clean water, productive soils, and a functioning health care system are just as relevant to sustainable development as pure economic growth. Says Sachs: “In the past quar ter centur y, the development economics imposed by rich countries on the poorest countries has been too much like medicine in the nineteenth century, when doctors used leeches to draw blood from their patients, often killing them in the process.” Having given this two-pronged prescription, it is not cer tain if it will work to change the plight of the poor. Figure 2-3. Income Disparity Between the Richest 20% and Poorest 20% of the World’s Population
74:1
Ratio of Income Shares
59:1
Richest 20% Poorest 20%
45:1
30:1
1960
32:1
1970
1980
1989
1999
Source: UNDP/HDR (1992) and UNDP/HDR (1999)
49
AN
IN TRO DU C TIO N TO
S U S TA I N A B L E
DEVELO PM EN T
Box. 2-3. Some More Facts About Poverty and Global Priorities in Spending
• Today across the world 1.3 billion people live on less than one dollar/day; 3 billion (half the world population) live on less than two dollars/day; 1.3 billion people have no access to clean water; 2 billion have no access to electricity; and 3 billion have no access to sanitation. • Also today consider the following as global priorities in spending: Item of Expenditure Cosmetics in the US Perfumes in Europe and the US Ice cream in Europe Pet foods in Europe and the US Business entertainment in Japan Cigarettes in Europe Alcoholic drinks in Europe Narcotic drugs in the world Military spending, global
Annual Spending US$ billion 8 12 12 17 35 50 105 400 780
• And yet some of the basic needs of poor humanity, the cost of which are as follows, are not being met: Annual estimated cost in $US billion Basic education for all 6 Water and sanitation for all 9 Basic health and nutrition for everyone 13 Reproductive health for all women in the world 12 Sources: Anup Shah (2006)
L I N K AGE S A M O N G S U S T A I N A BL E D EVE L O P M E N T , E NV I R O N M E N T , A N D POV E R T Y To achieve sustainable development, two vicious circles, which feed on themselves, must be broken (Figure 2-4). The left circle illustrates how pover ty causes resource depletion and degradation in perpetuity. By the sheer necessity of sur vival, the poor pollute the environment and erode the land, both of which, in turn, fur ther entrench pover ty. Former Prime Minister of India Indira Gandhi once called this vicious loop the “pollution of pover ty.” The right-hand vicious cycle demonstrates how development leads to resource depletion, degradation, and climate changes.These environmental problems then retard, if not stop, the development process, because the resources of the environment are also the resources of development. These two circles have to be broken if development is to be sustainable.
50
CH A L L E N G E S
O F
S U S TA I N A B L E
DEVELO PM EN T
Figure 2-4. Linkages Between Sustainable Development, Environment, and Poverty
Sustainable Development
DEVELOPMENT
POVERTY
Resource Depletion and Degradation
Vicious Circle 1
Pollution of poverty
Vicious Circle 2
Environmental Problems Pollution, Land Degradation, Climate Change
Poverty Reduction • Meeting basic needs (health/education/shelter) • Productive employment • Control over common property resources • Population control
Resource Depletion and Degradation Pollution of affluence
Integration of Environment into Development • Environmental impact assessment of development projects • Technology for development • Rural-urban migration • Renewable energy issues • Regional and international cooperation
Source: Douglas V. Smith and Kazi F. Jalal, ADB (2000), p. 55
Pover ty must be reduced by meeting basic needs: health, education, shelter, productive employment, control over common proper ty, and population management. Similarly, to minimize the environmental and social consequences of development, a strategic assessment of policies and plans must be under taken. Projects must be assessed for their impact upon the environment and society. To successfully achieve sustainable development, the community of nations must also stop the unfavorable impacts of rural-to-urban migration in developing countries, consider renewable energy issues, and promote regional and international cooperation. There are at least five myths about the relationship between environment and pover ty: 1. Myth 1: Most environmental degradation is caused by the poor. In fact, it is the other way around: The wealthier classes are responsible for the most serious forms of environmental degradation. By the sheer necessity of sur vival the poor may overgraze the land and deplete the forest of fuel wood, resulting in local deforestation, subsequent topsoil erosion, and surface water contamination and runoff causing flooding. However, the pollution from the nonpoor is driven by profit maximization. There is a world of difference between the two, especially in the magnitude and extent of the damage incurred. 2. Myth 2: Poverty reduction necessarily leads to environmental degradation. Reduction of the income gap and environmental stress are closely related. If the income gap is reduced, the stress on the environment should also be reduced. Fur thermore, pover ty reduction 51
AN
IN TRO DU C TIO N TO
S U S TA I N A B L E
DEVELO PM EN T
is not likely to create overconsumption, which could, in turn, enhance environmental degradation. When the poor increase their earnings from one dollar per day to two dollars per day, they will be less likely to pollute the environment, because they will finally have the resources and a reason to protect the ver y environment upon which their sur vival depends. 3. Myth 3: Population growth necessarily leads to environmental degradation. An increasing population could place increasing demands on natural resources, which can lead to environmental degradation and an unsustainable demand for natural resources. However, environmental impact depends not only on population growth but also on GDP (see Chapter 11) and development of technology. This can be demonstrated in the Ehrlich Identity (see Box 1-5). 4. Myth 4: The poor are too poor to invest in the environment. The Depar tment for International Development (DFID) of the United Kingdom (UK) has done several studies at the local level showing that poor communities are willing to invest in their environment but under cer tain favorable conditions, such as when they have proper ty ownership and control over their common resources. However, they are reluctant to invest in the environment if the area is controlled by outsiders, such as a logging company or the government, leaving them with no stake in their surroundings. Given the proper conditions, par ticularly land title or tenure, the poor are willing to provide what they can to upgrade their environment—usually labor, since they have little cash. 5. Myth 5: Poor people lack the technical knowledge for resource management. While poor people may fall shor t of modern technical knowledge for resource management, their indigenous knowledge is often more appropriate or even better suited to suppor t their habitat. Unfor tunately, this type of indigenous knowledge is too often ignored. Fur thermore, when modern technology is imposed upon the poor, it tends to undermine their indigenous knowledge. Modern technology and machiner y also fail to do the job because the community often does not know how to utilize and/or maintain the alien technology. As an example, in Bangladesh during the 1970s, the United States Agency for International Development (USAID), in an ill-advised flood control program, built multimillion-dollar embankments in coastal areas so that farmers could continue working during the rainy season. However, instead of keeping the floods out, water accumulated inside the embankments, sinking the farms under even deeper water. Eventually, the farmers had to breach the embankments to let the water out. In another effor t to introduce modern irrigation technology from Germany in Dinajpur District, also in Bangladesh, deep tube wells (>60 meters) were sunk into the soil to provide a steady source of irrigation water. Ever ything worked fine during the first year, but then the wells broke down. The foreign engineers were long gone, and no one there knew how to maintain and repair the wells. While the poor have limited skills, it is not true that they lack technical knowledge. What they need is enhanced capacity to solve problems using their indigenous skills and local resources. 52
CH A L L E N G E S
O F
S U S TA I N A B L E
DEVELO PM EN T
Pop u l a t i o n P l a nni ng Population planning is another significant factor in sustainable development. Between 1820 and 1920, the world population doubled from one billion to two billion. However, in the subsequent 100 years, 1920 to 2020, it will climb up to eight billion, a fourfold increase (Figure 1-2). Throughout the histor y of humankind the rate of population growth has never been higher than it is now; nor is the rate likely to get any higher. It is significant that, while the overall world population is rapidly increasing, it is actually decreasing in many of the developed countries. In 1950, 40% of the world’s population lived in developed countries and 60% in developing countries. By 2025, 80% will be living in developing countries and only 20% in developed countries. By 2050, India will surpass the PRC to become the most populous countr y in the world and will continue to remain so for a long time, if not forever. In terms of population planning, therefore, managing population increases in the developing countries between now and 2020 is the biggest challenge. While population growth may cause some environmental degradation, it is not as significant as that caused by other types of activities. Also, the poor may cause limited environmental degradation, but they do so out of necessity of sur vival and have little choice. It has also been demonstrated that, if the poor experience a slight improvement in their income, they will probably do something else to earn their livelihood rather than take as much as they can from the land and the sea. There are many reasons why population growth is not such a significant factor in environmental degradation. A good example is the PRC, where the burgeoning population is matched by rapid industrialization and growing affluence; and as we have seen, increasing economic activities strain the environment far more than does increasing population. It should also be borne in mind that environmentally unsound technology can be, and probably is, a far more impor tant governing factor in determining sustainability of development than population growth. The best estimate of global population increase by the year 2050 is 9.13 billion from 2.55 billion in 1950 (Negative Population Growth, 2004; also see Figure 2-5). The average annual growth rate of population in the world varies from 2.19% (1962-1963) to 0.46% (estimated for 2050). By 2050, the global population is expected to be stabilized (at about 9.3-9.6 billion), based on current demographic trends (World Resources Institute, 1998. However, the assumption is that determined effor ts to plan population growth will be made by the world community on the basis of recommendations of the World Population Conference in Cairo and the United Nations Population Fund (UNPF) action program of recent years. However, demographers say programs toward population stabilization by region will continue to remain the biggest challenge in population planning. With expanding population, the competition for land and water resources intensifies. Under such a situation, social tensions are likely to grow to a point where conflicts (ethnic, religious, and other types) are likely to increase. Such expanding world population has reduced the land area under food grain production from 0.23 hectares/person in 1950 to 0.11 hectares in 2000 (Lester Brown, 2004). This not only threatens the nutrition of a global population living at subsistence levels in areas with depleted soils, but also threatens its survival. As a consequence, conflicts build up among social groups competing for survival. Already, in par ts of India, Sudan, Nigeria, and Mali, such conflicts have cut down thousands, if not millions, of human lives. Growing global population has also given rise to 53
AN
IN TRO DU C TIO N TO
S U S TA I N A B L E
DEVELO PM EN T
Figure 2-5. Projected Growth in World Population, 1950–2050 Billion Highest Growth Scenario 11 Billion by 2050
10
8
Lowest Growth
6 Today 4 DEVELOPING COUNTRIES Highest Growth
2
Lowest Growth
DEVELOPED COUNTRIES 0 1950
1975
2000
2025
2050
Source: Based on United Nations Population Division (2005) Population Challenges and Development Goals and UN (2005) World Population Prospects (2004 Revision)
Figure 2-6. Projected Growth in World Economy, Population, and Chemical Production, 1995-2020
1995=100 200
180
Chemical Industry Production 160
Gross World Product
140
120
Pop u lation 100 1995
Source: OECD (2004)
54
2000
2005
2010
2015
2020
CH A L L E N G E S
O F
S U S TA I N A B L E
DEVELO PM EN T
conflicts between and among countries on shared water resources as in the case of India, Pakistan, and Bangladesh, which draw water from the Indus and Ganga-Brahmaputra rivers; and Thailand, Laos, Cambodia, and Vietnam, which are watered by the Mekong River. Similar conflicts have existed for many years among the countries of Central Asia sharing the Amudarya and Syrdar ya rivers. Conflicts among local groups involving water sharing have also become common in the PRC and India, where cities with a larger power base deprive rural areas of water on which farmers depend for their livelihood (Lester Brown, 2005). Therefore, unless population growth is slowed down and stabilized quickly, the world is likely to continue to see scarcities of land and water, giving rise to increasing social tensions and conflicts. Under such conditions not only development, but also life on ear th, cannot be sustainable. Taking 1995 as the baseline, the global population will increase by 30% as of 2020 but the gross world product will increase by 70% (Figure 2-6). One segment alone, chemical production, will increase by over 80%, and this increase will be accompanied by numerous problems arising from the types of chemicals being produced (see Boxes 2-4 and 2-5). Box 2-4. Types of Chemicals
Environmentalists categorize industrial materials into four groups: • less toxic/less persistent • less toxic/more persistent • more toxic/less persistent • more toxic/more persistent (most chemicals being produced today) Less Persistent More Presistent Group 1 • Cellulose • Carbohydrates • Carbohydrates (soap) •Biopolymers
Less Toxic More Toxic
Group 3 • Acids and bases • Ethers • Alcohols and thiols • Alphatic amines • Aromatic amines • Ethylene/propylene • Ethanol/methanol • Phenols • Aromatic hydrocarbons
Group 2 • Iron • Silicon • Aluminum • Copper • Polyolefins Group 4 • Halogenated alphatic hydrocarbons • Lead • Mercury • Cobalt • Cadmium • Halogenated aromatic hydrocarbons (PCBs, DDT) • Dioxins and furans
Source: Kenneth Geiser (2001)
55
AN
IN TRO DU C TIO N TO
S U S TA I N A B L E
DEVELO PM EN T
Box 2-5. Lead and Mercury
The global production of lead and mercury, both highly dangerous substances, during the mid-1990s illustrates the situation. Production of lead was 119,259 tons per year, while production of mercury was 2,235 tons per year. At first glance, comparing these figures with those from 1983, one notices a reduction of 64% in the production of lead and a 37% reduction in the production of mercury. This would seem to be good news, except that these reductions occurred only in developed countries such as Japan, the US, and Western Europe, where stringent regulations were implemented and enforced. In the Third World, where laws and enforcement are weak, production went up. In fact, when quantifying the distribution of persistent toxic chemicals and overall pollution, the situation in the developing world is currently disastrous. Source
Lead
Mercury (tons per year)
Vehicular traffic Stationary fossil fuel combustion Nonferrous metal production Iron and steel production Cement production Waste disposal Others Total emissions, mid-1990s Change since 1983
88,739 11,690 14,815 2,976 268 921
-1,475 164 29 133 109 325
119,259
2,235
-64%
-37%
Source: Jozef M. Pacyna and Elisabeth G. Pacyna (2001)
As par t of a study called Emerging Asia: Changes and Challenges (ADB, 1995), the Har vard Institute for International Development (HIID) was engaged by ADB in 1997 to quantify the pollution levels found in Asia in relation to the rest of the world (Figures 2-7 and 2-8). HIID and ADB compiled daily data over a 30-year period to measure air pollution in major urban centers and water pollution in major inland rivers. The results in terms of par ticulate concentrations in the main Asian cities were found to be 250 micrograms per cubic meter, compared with only 125 micrograms per cubic meter in the rest of the world. Compared with the member countries of the Organisation for Economic Co-operation and Development (OECD), the Asian figures were five times higher. The Emerging Asia study divided Asia into regions to determine where pollution was most pernicious. Air pollution in South Asia was overall the worst. South Asia had close to 450 micrograms per cubic meter of air pollution in terms of par ticulates (Figure 2-7). Within South Asia, Bangladesh, India, Nepal, Sri Lanka, and Pakistan were the worst cases. 56
CH A L L E N G E S
O F
S U S TA I N A B L E
DEVELO PM EN T
Figure 2-7 Air Pollution: Particulates
Particulates (mg/cu. m)
300 250 200 150 100 50 0
450
Asia
400
Africa
350
Latin America
OECD
World
OECD
World
Region
300
Global
250 200 150 100 50 0
East Asia
SE Asia
South Asia
PRC
India
Subregion
Regional Source: ADB and HIID (1997)
Figure 2-8. Water Pollution: Organic Pollution 6
BOD (mg/l)
5 4 3 2 1 8 0
7
Asia
Africa
Latin America
6 BOD (mg/l)
Particulates (mg/cu. m)
500
Region
5
Global
4 3 2 1 0
East Asia
SE Asia
South Asia
PRC
India
Subregion
Regional Source: ADB and HIID (1997) 57
AN
IN TRO DU C TIO N TO
S U S TA I N A B L E
DEVELO PM EN T
Figure 2-9. Forests
25
sq. m per capita
20 15 10 5 6 0 sq. m per capita
5
Asia
Africa
Latin America
OECD
World
Region
4
Global
3 2 1 0 East Asia
SE Asia
South Asia
PRC
India
Subregion
Regional Source: ADB and HIID (1997)
In terms of water pollution, Asia again topped the list (Figure 2-8). Water pollution is measured in terms of BOD, which is measured in milligrams per liter (mg/liter) of water and is indicative of the organic pollution level in water. The world average was 3.5 mg/liter for major inland waters. In Asia it was close to 5 mg/liter. In this case, Southeast Asia, which is the most industrialized/urbanized subregion, was highest with a BOD level close to 7 mg/liter, or double the world average. Not only are the air and water polluted in Asia, but the land is being depleted as well. The 1997 publication by ADB and HIID indicated that the world’s average forest cover was 6 square meters per capita (Figure 2-9). In Asia it was about 2 square meters per capita; and within Asia, South Asia had less than 0.5 square meter of forested area per capita. However, Southeast Asia, primarily Indonesia and Malaysia, had roughly 4.8 square meters of forest per capita. Pa r t i c i pa t i o n Another major factor that affects the sustainability of development is par ticipation. Par ticipation is a process through which stakeholders can influence and share control over development initiatives and the resources used to fund them through engagement in decision making.
58
CH A L L E N G E S
O F
S U S TA I N A B L E
DEVELO PM EN T
Stakeholders include the citizens who benefit from the development, including the poor, disadvantaged groups of people such as women, children, indigenous minorities, and other ethnic groups, and the complex communities in which they live (Figure 2-10). They are also the government, private sector, and civil society (including academies and research institutes, labor unions, religious organizations, political par ties, the media, foundations, and especially social ser vice or advocacyoriented nongovernment organizations or NGOs) at local, district, provincial, and national levels. International donor governments, NGOs, and financing institutions like the World Bank and ADB are also stakeholders. Par ticipation may take a range of forms or levels, from shallow to deep. Par ticipator y planners must decide which forms to employ with which stakeholders at different times depending upon skills required to make par ticular decisions. The forms are discussed as follows. 1. Information sharing Stakeholders, in par ticular the people affected by a project, should be informed in advance about what is being planned and what is expected to happen, and how much money is being invested in their communities. Alternatively, they may be asked to provide information by responding to sur vey questionnaires, contributing to data that others will use. While essential, information sharing involves minimal engagement.
Figure 2-10. Participants in Development
Poor Population
Women
Children
Minority Groups
Local Goverments
NGOs
Source: ADB (2000)
59
AN
IN TRO DU C TIO N TO
S U S TA I N A B L E
DEVELO PM EN T
2. Consultation Discussion of proposed activities, their consequences and implications, provides an oppor tunity for stakeholders to respond to new ideas. Though information flows two ways, stakeholders usually have limited oppor tunities to contribute to or change the basic design. 3. Collaborative decision-making Scope for stakeholder influence over decisions is considerably increased in this mode of par ticipation. Through debate and discussion or shared responsibility for drafting documents, stakeholders raise concerns and work together to build consensus. 4. Empowerment When people are given an oppor tunity to take an active role in planning, implementing, and monitoring projects that affect their own development, they develop a sense of ownership of the activity and are motivated to make the necessar y effor t to ensure its success. As individuals and groups learn through experience, as well as from training programs and ongoing suppor t, their capacity to manage activities and plan new ones is enhanced. Trust-based networks, or social capital, typically expand, grow stronger, and suppor t continued social stability and economic growth. Longterm development impacts improve. Par ticipation often has a multiplier effect, as it promotes the empowerment of citizens, communities, and organizations. A large range of tools and methods has been developed to facilitate effective and cost-efficient information sharing, consultation, collaboration, and empowerment; and facilitators have been trained around the world to use these to maximize outcomes. Par ticipation requires respect for the deep understanding of local conditions that only residents can have, a suppor tive institutional and policy environment that helps groups to act on decisions they make, willingness to learn and share, and skilled application of these tools. Special approaches to planning, budget management, par ticipator y monitoring, par tnerships between public and private sector organizations, and decentralized governance and ser vice provision have been created in the past 12-20 years as par ticipation is “scaled-up” from individual communities to wider social contexts. Policy a nd M a rke t Fa i l ure s Policy and market failures constitute another key factor in determining sustainable development Policy failure can be the result of a sin of omission—not inter vening when it is necessar y and beneficial—or of commission—stepping in when inter vention is unnecessar y or even detrimental. An example of policy failure is the coexistence of overuse, waste, and inefficiency with growing resource scarcity. Take the case of the large-scale irrigation projects in Pakistan, where water from the Indus River is being used to irrigate grain farms. A side effect is causing par ts of the river basin to become increasingly waterlogged and saline, taking almost 32 million hectares of land out of production. The problem stems from a multitude of sources, most notably operational
60
CH A L L E N G E S
O F
S U S TA I N A B L E
DEVELO PM EN T
Box 2-6. More Examples of Policy and Market Failures
• Putting a resource into a single use when its multiple use would generate a greater net benefit. Many tropical forests in Asia and South America are exploited almost solely for timber production although the same forest can yield fruits, medicinal plants enhancing biological diversity, beehives for honey, and a host of other environmental services such as water and soil conservation. • Irreversible loss of unique sites and ecosystems for marginal economic benefits.The uniqueness of historical sites and some threatened environments could be of immense value that should not be lost except in case of emergency (such as famine) or when significant indisputable benefits are derived from such a loss. Unfortunately, however, in some of the developing countries, wanton destruction of coral by driftnets and deforestation are occurring, bringing marginal, temporary benefits to some people who may or may not even be the direct beneficiaries. Source: The Environment Program, ADB (1994)
inefficiencies, including overirrigation and lack of land leveling. As a consequence, many farms become flooded, while others do not receive sufficient water. In both cases, crops are damaged. Market failure occurs when freely functioning markets produce prices that do not reflect the social and economic value of an action. In the developing countries it is assumed that air, water, and unclaimed land are free resources. As such, they have become dumping grounds for wastes and emissions. It is also assumed that raw materials generally demand the lowest market prices, intermediate goods are priced a little higher, and finished products command the highest prices. These price differentials are primarily technology driven. There are numerous examples. Jute, Bangladesh’s chief expor t, is considered a raw material and is accordingly sold to the UK at the bottom of the pricing scale. The jute is then processed in the UK into finished products and resold to Bangladesh at a higher price. A fur ther example is coffee. It is incumbent therefore on developing countries to pursue policies that add more value to their raw materials locally in accordance with their comparative advantage. Policy and market failures often go together. They occur most often when a primar y resource that could otherwise be managed as a renewable resource is not (see Box 2-6). The rate of deforestation is a classic example. The rate of logging is almost always higher than the rate of reforestation. Because of poor policy facilitation, local communities are deprived of their customar y rights of access, even though they may be the most effective resource managers. Those who dwell near the forest and depend on it for sur vival also, by necessity, possess ver y specialized knowledge as to how to protect it. Unfor tunately, governments sometimes leave forest management to the loggers and not to the people who have a major stake in it and whose sur vival depends upon the regeneration of the trees.
61
AN
IN TRO DU C TIO N TO
S U S TA I N A B L E
DEVELO PM EN T
Yet, with a little bit of thought, and sometimes a little bit of science, it is possible to formulate policies that are environmentally sound and sustainable. An example is the Malaysian palm oil industry. Malaysia is the largest expor ter of raw palm oil in the world. In the past, the effluent from the palm oil mills, which has a BOD level of 30,000 mg/liter (raw domestic sewage has a BOD of 300 mg/liter), was being discharged directly into the rivers, creating severe oxygen depletion in the receiving water. A sustainable solution was developed 20 years ago when the UN Economic and Social Commission for Asia and the Pacific (ESCAP), with the help of the Asian Institute of Technology, devised a method to treat the palm oil effluent and to make it harmless as a solid waste byproduct that is used as animal feed and fer tilizer. This was a real win-win solution to a serious environmental problem. Good G ove rna n c e Good governance is an integral par t of and a necessar y precondition of avoiding market and policy failure. Webster’s Dictionar y defines governance as “the manner in which power is exercised in the management of a countr y’s economic and social resources for development.” Poor governance constrains, retards, and distor ts the process of development and has a dispropor tionately negative impact on the poor. Lawrence Summers, former President of Har vard, discussed this issue of poor governance when, as the then US Treasur y Secretar y, he said, “Economic histor y has provided a clear, natural experiment regarding the efficacy of finance without conditions. Again and again, natural resources windfalls have financed presidential planes and palaces and entrenched official corruption, while producing ver y little in the way of lasting economic benefits.” Summers raised a ver y impor tant issue: What would be the point of increasing the external aid flow and imposing the Tobin Tax (see Chapter 13) if funds go to the developing countries or wherever the sustainable development problems are, only to see those funds used to finance either nonsustainable development activities or corruption? This has been emphasized again and again: Most of the development finance institutions (DFIs) today have adopted “anticorruption” and “good governance” policies that the borrowing member countries must follow in order for them to be eligible to borrow from these banks. The policies of multilateral financing institutions (MFIs), such as the World Bank and ADB, provide for adherence to four principles of good governance. 1. Accountability This involves making public officials answerable for their behavior as public ser vants. It also demands establishment of criteria by which accountability will be measured. 2. Participation and decentralization Since people are the major stakeholders in a nation’s development process they are also the major beneficiaries. A principle of good governance is to involve all the stakeholders in the policy of government. Decentralization improves the manageability of par ticipation, which, in turn, improves
62
CH A L L E N G E S
O F
S U S TA I N A B L E
DEVELO PM EN T
governance. However, decentralization in the absence of good local governance can be a cause of increasing pover ty. 3. Predictability Laws, regulations, and policies must be fair and consistently applied so that people can predict the consequences and the outcomes of violating them. 4. Transparency Information on government actions and policies, before and after an action, must be available to the general public. These four elements of good governance hold true for the policymaking bodies of corporations and NGOs as well. In recent years, people have seen in the US how bad corporate governance erodes stockholders’ public funds and savings. The World Bank took the lead in formulating a policy on good governance, which is now advocated by the regional development banks as well. Prior to adopting a governance policy, the policy of the World Bank was that, as long as borrowers repay the money with interest, the lenders have no business demanding good governance, which is the internal affair of a borrowing government. Today, however, all the member nations of the MFIs have accepted good governance as a conditionality of borrowing. P reve nt i o n a n d M a nage m e n t of Disaster s Disasters are deined by the United Nations Disaster Relief Organization as “abnormal or infrequent hazards to communities or geographical areas that are vulnerable to such events causing substantial damage, disruption and often casualties, leaving the affected community unable to function normally.” One area of sustainable development that cannot be overlooked is disaster management. A recent study shows that natural disasters have immense adverse economic, environmental, and social impacts on a country. A distinction is commonly made between a natural disaster and disasters being caused by humans, such as the Chernobyl nuclear power plant meltdown or the explosion at the Bhopal pesticide plant. Since the events of September 11, 2001, though, a fur ther distinction has been made between disasters caused by humans that are technological/accidental and those that are deliberate. With the issues of climate change, the rising sea level, and the increasing frequency of killer storms caused by long-term environmental degradation, and with the rise of technological disasters and terrorism, disaster management has come to be regarded as one of the major factors in promoting sustainable development. The International Federation of Red Cross and Red Crescent published a study by region, covering the years 1972 to 1996, of the percentage of people killed, injured, rendered homeless, or otherwise affected by natural disasters (Figure 2-11). In Africa, the mor tality rate was 59%; in
63
AN
IN TRO DU C TIO N TO
S U S TA I N A B L E
DEVELO PM EN T
Figure 2-11. Impact of Disaster by Geographical Region, 1972-1996 100% 80% 60% 40% 20% 0%
Killed
Injured
Asia and Paciic
Affected
Africa
Americas
Homeless
Europe
Source: Isabel Ortiz (1998)
Asia, 33%. The disasters that killed Africans were presumably famine and drought, whereas the disasters that killed Asians were typhoon-related (i.e., winds, floods, and tidal waves). In Asia, 77% of the affected population sustained disaster-related injuries, while more than 80% were left homeless. Between 1987 and 2005 the most common disasters on ear th were: • high winds (tornados, cyclones, typhoons, and hurricanes), • floods, • quakes (including ear thquakes, tsunamis, and volcanic eruptions), • droughts and famines, • wild fires, and • landslides (including pyroclastic flows). While floods and high winds affect mostly Asia and par ts of Latin America, drought and famine are the major causes of disasters in Africa. In fact, floods and high winds are also now causing problems in the developed countries such as the US due possibly to climate changes. Na t ura l D i s a s t e rs The tsunamis and seaquakes in Asia in December 2004 and March 2005 raise new issues and questions as to how to rehabilitate the survivors and protect vulnerable populations in the future. In particular, Indonesia and its neighboring coastal countries such as Thailand, Malaysia, Sri Lanka, and India are adversely affected. An estimated 150,000 people were killed by the tsunami/seaquake in Asia. In addition, tens of thousands of people were injured, or displaced. (Lareef Zubair, 2005) An early warning system is currently being established for the region. Experts predict more tremors in the region in
64
CH A L L E N G E S
O F
S U S TA I N A B L E
DEVELO PM EN T
this decade than in the past several ones. Several tsunami websites have recently been established to provide environmental, economic, and social information on these events. Technological disasters and terrorism are also affecting the developed countries of the world. Thus, disaster management is currently considered as an impor tant prerequisite for sustainable development in the world. In the twenty-first centur y, the world will continue to be quite concerned about the possible economic, environmental, and social impacts of disasters induced by humans and in par ticular about terrorists. When a state or a group of nonstate actors directs violence against the civilian population of its own or of another state, it is called terrorism (Mark Selden and Alvin Y. So, 2004). The prospects of increased terrorist threats to the national as well as individual security of people in a countr y are becoming frightening. Terrorism is on the rise since the incidents of 9/11. Ethnic and religious conflicts and killings are becoming more frequent. Such rampant lawlessness, insecurity of life, and violence not only cost the governments around the world (both developed and developing) billions of dollars, but also disturb the peace of mind and the behavior of citizens. People worr y about security of their lives most; they also are concerned about loss of employment and loss of income from trade and tourism. In the future, the risk of using a nuclear weapon in a regional conflict or by a terrorist is predicted to be on the rise (Mar tin Rees, 2003). According to the US Central Intelligence Agency, the nuclear materials and technology to build bombs are more accessible to terrorists now than at any time in histor y. This, together with the possibility of increased frequency and severity of natural disasters, may become one of the key factors governing the sustainability of development in this centur y. Today, sustainable development has a significant implication for world peace.
DETERMINANTS
OF
S U S T A I N A B L E D EV E L O P M E N T
The three determinants of sustainable development are consumption, production, and distribution. In examining these determinants, one should turn the question around and ask what makes development unsustainable. Obviously, in the case of consumption, the issue is the use of resources beyond the reasonable limits set by nature through regeneration. For example, the forest has a regenerating capacity through both natural and ar tificial methods. So its limit is the sum of the two. Any logging beyond that limit is unsustainable. Unsustainable production is characterized by gross inefficiencies and mismanagement in the use of water, energy, and minerals. Examples include large-scale irrigation projects along the Indus River in Pakistan. These were designed to increase production, but because of failed operating procedures and policies, vast tracts of land passed out of production due to flooding and salinity. Finally, inequitable distribution is unsustainable. A prime example is the distribution of global income, where the gap between the richest 20% and the poorest 20% is enormous and is growing wider with the passage of time.
65
AN
IN TRO DU C TIO N TO
S U S TA I N A B L E
DEVELO PM EN T
Con s u m p t i o n When talking about consumption, it is impor tant to examine not only the amount of resources consumed but also the patterns in which they are consumed. There are five reasons to examine these patterns: 1. Economic efficiency alone cannot meet the natural resource appetite following current consumption patterns. Many people strive for eco-efficiency, believing that if we can achieve it, we will have reached a sustainable plateau. This is not true. No matter how efficient we become ecologically, the natural resources appetite of the present generation can never be met by eco-efficiency alone. Consumption must be reduced. This can be achieved only by developing strong normative policies on regulating the environment and enhancing policy mechanisms to reflect the degree of environmental damage that current consumption patterns impose on the world. 2. Consumption is the key to understanding policy challenges, as they focus on the demand side. If we study the consumption patterns of water and energy, we will soon realize that many subsidies meant to help the poor usually end up not helping them, since subsidies reduce costs, inducing an increase in demand by both the poor and the wealthy. Finally, we will realize that, because demand has increased in response to low prices, precious resources like water and energy are being wasted. This creates a vicious cycle of inefficiency and pollution. 3. Examining consumption patterns reveals what is being consumed and whether it is meeting the basic needs of the people. Considering what is being consumed, whether basic goods or luxur y items, is ver y impor tant, as it will tell us whether the consumption pattern meets the basic needs of people and whether development will be sustainable. 4. The pattern will illustrate vividly that the poor not only consume less, but also pollute less, and they are directly affected if the environment is degraded. Polluted water affects the health of the poor directly. Exposed to dir ty air 24 hours a day, seven days a week, the health of the poor in urban slums and squatter settlements, where as much as 40% of the total population of a developing countr y may live, is endangered. Likewise, water and land polluted by agrochemicals and solid wastes can adversely affect the health of farmers. 5. Consumption patterns tell a great deal about problematic relationships among economic growth, the satisfaction of basic needs, and human aspirations. In one countr y, GDP growth may be low, and a large number of people may live below the pover ty line. In another countr y, GDP growth may be the same, but few people are below the pover ty line. In the first instance, the production and consumption patterns may be more geared
66
CH A L L E N G E S
O F
S U S TA I N A B L E
DEVELO PM EN T
toward luxur y goods, and toward increasing economic benefits at the cost of environmental and social benefits. In the second case, GDP growth is likely to be utilized toward satisfying the basic needs of the people. Therefore, with the same GDP, consumption patterns and the incidence of pover ty may var y widely, with countries in the former categor y presenting greater challenges to sustainable development. Even within a poor community or a poor household, there is a problematic relationship between groups of powerful people and groups of disadvantaged people. For example, among the poor families in India, the power structure is such that women have little voice in decision making. At a meeting between a group of villager s living in an Indian deser t and representatives of a development bank to discuss pover ty reduction in their village, only a few women were invited. They came but would not speak. Afterwards, away from the men, the women spoke freely. They suggested that the primar y reason for the village’s pover ty was the way their meager incomes were spent: The men drank; any income or savings was spent on alcohol. Therefore, these families had no financial cushion for emergencies or future needs. These women were powerless, and the men abused them. This case study emphasized the need for gender-segregated consultation. The role of local governments in nur turing sustainable development cannot be overemphasized. In this case, ideally the local government, not the development bank, should be addressing these women’s problems. But life is rarely ideal. The power structure in the village is made up of the people who drink, but they are also the heads of the families. Therefore, they have more say in the matter—and they have the ear of the local officials in charge of the village. It goes back to the issue of governance and corruption. The patterns of food consumption among the poor are also quite different. The women are responsible for gathering and cooking food, but they eat last, only after the husband and children have eaten. So while the patterns of consumption and power structure between the rich and the poor are ver y impor tant, it is also necessar y to understand the dynamics within poor families, par ticularly gender discrimination. Th e R e l i gi o u s R evo l t A g a i ns t Consumer ism In 1998, UNDP did a study on how the world’s various religions treat consumption. The finding was that almost ever y religion has strictures against excessive consumption (Box 2-7). Mahatma Gandhi once said this world has enough to meet the “needs” of ever ybody, but not the “greeds” of ever ybody. Keeping those religious thoughts and Gandhi’s maxim in mind, one could look at what is happening in the real world: 76% of the world’s population live in the developing countries as compared with 24% who live in the developed countries. Yet, as Table 2-2 shows, people living in developed countries are consuming 64% of the meat, almost half the cereals, over 80% of the metals, over 86% of the chemicals, and 92% of the cars. In terms of per capita consumption, Americans consume 52 times as much meat, have 320 times the number of private vehicles,
67
AN
IN TRO DU C TIO N TO
S U S TA I N A B L E
DEVELO PM EN T
Box 2-7. Some Religious Strictures Against Excessive Consumption
• Christianity – “Watch out! Be on your guard against all kinds of greed; a person’s life does not consist of an abundance of possessions.” • Confucianism – “Excess and deficiency are equally at fault.” • Buddhism – “By the thirst for the riches, the foolish man destroys himself as if he were his own enemy.” • Hinduism – “When you have the golden gift of commitment you have everything.” • Islam – “It is difficult for a person laden with riches to climb the steep path that leads to bliss.” • Taoism – “One who knows he or she has enough is rich.” (There have been great secular thoughts along this line, too.) Source: D.V. Smith and K. F. Jalal (2000), p. 27
and use 245 times as much copper as average Indians. With these figures, one can, once again, appreciate that eco-efficiency alone cannot satisfy the demand for food, natural resources, and other consumer goods of the global population. The consumption pattern must be changed. If, for example, Americans would reduce the amount of meat they eat to about one fifth their present consumption, and paper use to one tenth, they could make a noticeable contribution toward creating a more balanced consumption pattern, wherein eco-efficiency could begin to play an impor tant role. In a 2005 ar ticle, Lester Brown notes that, although the US has long consumed the lion’s share of world resources, the PRC is taking over on almost all fronts, excepting the use of corn and oil. For example in 2004, the PRC consumed 64 million tons of meat as against 38 million tons in the US. Steel consumption in the PRC is currently more than double that in the US (250 million tons in the PRC against 104 million tons in the US). Similarly in the PRC, consumption of electronic and household appliances has soared in the recent past; the number of cell phones in the PRC is now over 270 million versus 160 million in the US; consumption of TV sets in the PRC currently exceeds 375 million against 245 million in the US. Of course, on a per capita basis the US consumption still exceeds consumption in the PRC . Similarly, the consumption patterns of Europe and of other developed regions are ver y high. Consumption all over the developed world needs to be reduced. The question that may legitimately arise is, why should people in the developed world reduce their consumption patterns to satisfy the needs of teeming millions of poor Africans or Asians, who are not making any serious effor t toward reducing their own populations, and who are not increasing their efficiency of operation? Let us talk about food consumption. Aside from moral and ethical reasons, it has been demonstrated that drastic reductions in consumption are needed to release resources, seeds,
68
CH A L L E N G E S
O F
S U S TA I N A B L E
DEVELO PM EN T
Table 2-2. Who Consumes? Product
Developed World Share (%)
Developing World Share (%)
Per Capita Consumption: United States/India
(units)
Cereals
48
52
6
Milk
72
28
4
Meat
64
36
52
Sawn wood
78
22
18
Paper
81
19
115
Fertilizer
60
40
6
Cement
52
48
7
Copper
86
14
245
Iron and steel
80
20
22
Aluminum
86
14
85
Inorganic chemicals
87
13
5
Organic chemicals
85
15
Cars
92
8
320
Commercial vehicles
85
15
102
Population
24
76
Total energy
75
25
35
Electricity
79
21
40
.28
.28
Source: Smith and Jalal, ADB (2000), p. 24
and more land, which could be allocated to growing food for the poor. For example, if people were to shift to a vegetarian diet, it would make a significant difference in terms of increased grain supply. Reducing consumption by 1 kilogram (kg) of poultr y would release about 3-4 kg of grain. Another good reason to reduce food consumption is health. Vital Signs, the 2001 World Watch Institute annual repor t, focuses on obesity. A person is considered obese if his or her body/mass index (BMI) is greater than 30. BMI is the measure of body fat based on height and weight. The index is defined as weight divided by height squared. The Institute noted that a large percentage of the population in developed countries is obese. In the US, obesity among the total population has increased from 15% in 1980 to over 33% today. In the UK, obesity increased from 7% in 1980 to approximately 25% in 2004. The frightening aspect of these numbers is that they hold true for the rest of the developed world. Obesity is considered an illness that affects some 1.1 billion people who are sick or incapable of working normally, a condition leading to low productivity. On the other hand, the world has 1.3 billion who earn less than $1 a day, who are also suffering from malnutrition and other illnesses and are unable to produce as much as a
69
AN
IN TRO DU C TIO N TO
S U S TA I N A B L E
DEVELO PM EN T
Box 2-8. Ecological Footprint Calculation a
Section I: Food 1. How often do you eat animal-based products? 2. How would you describe your average daily food intake? 3. How much of your purchased food is thrown out rather than eaten? 4. How much of the food that you eat is locally grown, processed, or in-season? Section II: Transport 5. How much do you drive each year on average? 6. On average, how often do you drive with someone else? 7. What kind of fuel efficiency does your car get (put the average if you drive several cars)? 8. On average, how many kilometers do you travel on public transportation (bus, rail) each week? 9. How many hours each year do you spend flying? Section III: Housing 10. How many people live in your home? 11. How big is your home? 12. Does your home use electricity from a “green” electricity provider (e.g. solar, wind, micro-hydro)? 13. Do you use energy-efficient appliances and light bulbs?
Go to Google search on “Ecological Footprint” calculation to measure your actual footprint. There are 13 questions, divided into three sections as above.To calculate footprint, answer the questions and click on “Go.” The calculation presented is obviously a gross simpliication and does not take into account many details that will add or subtract from your footprint. This calculation will perform poorly for people outside North America, since it is calibrated to the average North American lifestyle. Also, those North Americans who live an atypical lifestyle, for example, by avoiding owning cars and new products, by growing their own food, by living on a boat, or by buying fewer material goods, may not be represented accurately by this calculation. a
normal human being. Thus, a total of 2.4 billion people, because of malnutrition or obesity, cannot engage fully in economic and other activities. Changing food consumption patterns could not only create a healthier world population, it could also ensure greater productivity by the entire world population. This is, of course, based on the simple assumption that the food released by reducing the consumption of the rich will be available to increase consumption of the malnourished or the poor. The ecological footprint is essentially a representation of the environmental consequences of consumption expressed in terms of land and water areas required to satisfy the food, transpor tation, and housing needs of a person or a countr y (Box 2-8). Although calculation of the ecological
70
CH A L L E N G E S
O F
S U S TA I N A B L E
DEVELO PM EN T
footprint has shor tcomings, it is the first time that the global consumption pattern has been expressed in quantitative terms. It is a complicated formula in which three parameters come into play—consumption of food, transpor tation, and housing. Food consumption is measured in terms of the land and water areas needed to produce a given quantity of food; housing consumption is measured on the basis of the plinth area a person occupies in a home, or the land area the house occupies; energy and transpor t requirements are measured in terms of the areas of forest that have to be planted to absorb the emissions of CO 2 produced. (This is not the best way of calculating energy consumption, because developed nations might be using ver y efficient energy systems, while people in Nepal, for instance, may be using inefficient cooking stoves or motor vehicles. Obviously, there will be some distor tion in the figures.) Worldwide there are only 1.8 hectares of biologically productive area per person. Against this figure, an average American’s ecological footprint is 10 hectares, over five times the world average. This is one more piece of evidence of why eco-efficiency cannot, by itself, solve the problem of resource shor tage in this world. P ro duc t i o n The second determinant of sustainable development is production. It is possible that the twenty-first centur y needs a new production revolution through a process that will take into account not only the economic benefit of production but also its ecological and social benefits. This is also referred to as the triple “p” or the triple bottomline to sustainability: profits, people, and planet (Brian Nattrass and Mar y Altomare, 1999). We have to develop a production pattern that will satisfy the needs of most of the consumers who are in the middle-income to lowincome to poor categor y. What is wrong with production patterns? There are five basic problems with our current production patterns. 1. Use of materials and processes that cause environmental degradation and health hazards Materials and processes employed in the industrial production of many developing countries result in large quantities of toxic emissions—gaseous, liquid, and solid. These pollutants endanger the health of not only the industrial workers and their immediate family members, but also many people living downstream. The concept of cleaner production (as against the concept of cleaner technology) has brought about some positive changes; but it still has a long way to go. 2. Inefficiency of production, which causes system losses and environmental degradation Again, as an example, one can look at the irrigation systems in Pakistan (see “Policy and Market Failures,” p. 60). One can also look at the aluminum cola can, which is more complicated and costlier to produce than the cola itself (see Box 2-9). This is a striking case study of the
71
AN
IN TRO DU C TIO N TO
S U S TA I N A B L E
DEVELO PM EN T
complexity of industrial production, revealed in describing the origins and pathways of an English cola can. 3. Failure to reflect negative externalities in product costs The third impor tant problem is one that has already been discussed under the challenges of market failure. When a product is manufactured, par ticularly in developing countries, air, water, and land are considered free goods. This is especially true when there are no regulations or no one follows the regulations. Accordingly, a tree standing deep inside a forest does not have a dollar value. Only when the tree is felled and brought to the mill is it assigned a monetar y value. This is a grossly erroneous concept when pricing a product. The failure to reflect negative externalities in the product cost must be corrected if the production revolution is to succeed. To remedy the situation, a natural resources accounting procedure has to be introduced (Chapter 11). 4. Energy, water, and fertilizer subsidies, which benefit mostly the nonpoor In a study on subsidies in the energy and water sectors, the World Bank found that just withdrawing the subsidies would release $125 billion a year worldwide. What is more, these subsidies, established in the name of helping the poor, actually go to the nonpoor. There are just too many examples, suppor ted by data, showing that in developing countries poor people pay 5-10 times more for water than many of those who are wealthy and who have access to urban piped water. Due to failure of the local government to supply water to all its citizens, the poor buy their water from vendors at a much higher price. 5. Transaction costs, which are significantly higher for the poor Because large farmers or affluent urban dwellers have the advantage of scale, they can access water and other resources much more easily than poor farmers and poor citizens. A new production revolution is imperative to ensure sustainable development in the world to overcome the five problems mentioned above. Whereas resolution of the first three problems per tains more to a new industrial revolution, the remaining two problems are more relevant to a new agricultural revolution. This is also termed in this book as the “Green 2 Revolution” for reasons explained later. According to Paul Hawken et al. (1999), such a New Industrial Revolution has been triggered in the industrialized countries. Hawken describes “natural capitalism” as the future of industrialization in which business and environmental interests overlap and business can make increasing profit and at the same time help environmental problems. Industrialization through the natural capitalist approach suggests four major interlinked changes in business practices: • Dramatically increase the productivity of natural resources by reducing the wasteful and destructive flow of resources. Such an increase will be effected through concurrent changes in process design, technology, and good housekeeping.
72
CH A L L E N G E S
O F
S U S TA I N A B L E
DEVELO PM EN T
Box 2-9. The Origins and Pathways of a Cola Can
A striking case study of the complexity of industrial metabolism is provided by James Womack and Daniel Jones in their book Lean Thinking [1996], where they trace the origins and pathways of a can of cola in England. The can itself is more costly and complicated to manufacture than the beverage. Bauxite is mined in Australia and trucked to a chemical reduction mill, where a half-hour process purifies each ton of bauxite into a half-ton of aluminum oxide. When enough of that is stockpiled, it is loaded on a giant ore carrier and sent to Sweden or Norway, where hydroelectric dams provide cheap electricity. After a month-long journey across two oceans, it usually sits at the smelter for as long as two months. The smelter takes two hours to turn each half-ton of aluminum oxide into a quarter-ton of aluminum metal, in ingots 10 meters long. These are cured for two weeks before being shipped to roller mills in Sweden or Germany. There each ingot is heated to nearly 900 degrees Fahrenheit and rolled down to a thickness of an eighth of an inch. The resulting sheets are wrapped in 10ton coils and transported to a warehouse, and then to a cold rolling mill in the same or another country, where they are rolled tenfold thinner, ready for fabrication. The aluminum is then sent to England, where sheets are punched and formed into cans, which are then washed, dried, painted with a base coat, and then painted again with specific product information. The cans are next lacquered, flanged (they are still topless), sprayed inside with a protective coating to prevent the cola from corroding the can, and inspected. The cans are palletized, fork lifted, and warehoused until needed. They are then shipped to the bottler, where they are washed and cleaned once more, then filled with flavored syrup, phosphorus, caffeine, and CO 2. The sugar is harvested from beet fields in France and undergoes trucking, milling, refining, and shipping. The phosphorus comes from Idaho, where it is excavated from deep open-pit mines—a process that also unearths cadmium and radioactive thorium. Round-the-clock, the mining company uses the same amount of electricity as a city of 100,000 people in order to reduce the phosphate to food-grade quality. The caffeine is shipped from a chemical manufacturer in England. The filled cans are sealed with an aluminum “pop-top” lid at the rate of 1,500 cans per minute, then inserted into cardboard cartons printed with matching color and promotional schemes. The cartons are made of forest pulp that may have originated anywhere from Sweden or Siberia to the old-growth, virgin forests of British Columbia that are the home of grizzlies, wolverines, otters, and eagles. Palletized again, the cans are shipped to a regional distribution warehouse, and shortly thereafter to a supermarket, where a typical can is purchased within three days. The consumer buys 12 ounces of the phosphate-tinged, caffeine-impregnated, caramel-flavored sugar water. Drinking the cola takes a few minutes; throwing the can away takes a second. In England, consumers discard 84 percent of all cans, which means that the overall rate of aluminum waste, after counting production losses, is 88 percent. The US still gets three-fifths of its aluminum from virgin ore, at 20 times the energy intensity of recycled aluminum, and throws away enough aluminum to replace its entire commercial aircraft fleet every three months.
Source: Hawken et al. 1999: 49-50, as cited in D.V. Smith and K.F. Jalal (2000), p. 45
73
AN
IN TRO DU C TIO N TO
S U S TA I N A B L E
DEVELO PM EN T
• Shift to biologically inspired production models so that waste will be eliminated, rather than minimized. • Move to a solution-based business model that, for example, will provide illumination instead of selling light bulbs. • Reinvest in natural capital so that the ecosystems can yield ser vices and resources more abundantly. Th e G re e n 2 R evo l ut i o n Like the new industrial revolution, a new agricultural revolution is also needed to achieve sustainable development in this world. This is called the Green-Green or Green 2 Revolution. The first Green Revolution was initiated in the 1960s in South Asia, where the sole objective was to increase total food production to save people from star ving. While the program produced more food, in the process it also increased the number of landless laborers. Many small farmers became agricultural workers for the large farmers who bought up their lands. The small farmers’ choices were fur ther limited by bad governance. The prevailing government policies favored the large farmers when it came to providing access to better seeds, fer tilizers, irrigation water, roads, and communal storehouses. A good example of this type of favoritism is in the case of diesel fuel. During the Green Revolution the government of Bangladesh impor ted diesel fuel, with the honest intention of selling at subsidized prices to local communities to run their irrigation pumps. The principal customers, it so happened, were large farmers. When the small farmers tried to buy the subsidized fuel they were turned away, forcing them to buy it from private venders at three times the government price. In shor t, the rich farmers had high visibility and a voice in local politics, which the poor farmers did not have. It became increasingly difficult for the poor farmers to modernize, and if they could not farm efficiently, the benefit-cost ratio of their lands was the same as it was, under rain-fed conditions. It is not surprising, then, that during the first Green Revolution the income gap between the rich and the poor actually increased, even though the total production of food crops increased. But this type of Green Revolution does not promote sustainable development. What is needed is a Green-Green Revolution based in par t on key elements of good governance. The Green 2 Revolution will have to be based on par ticipation by all affected par ties, including those who will be adequately compensated for the sale of por tions of their land and the poor farmers, who will have to learn to work productively in an environment friendly way with their new land and modern inputs (see, e.g., Box 2-10). There are essentially five policy elements of a Green 2 Revolution: 1. A redistributive policy that favors the poor by providing them access to land and modern inputs Since good governance includes predictability, fair compensation pursuant to law will be required for a successful redistributive policy.
74
CH A L L E N G E S
O F
S U S TA I N A B L E
DEVELO PM EN T
2. Increased public funding for less favorable agricultural land In Asia alone, as much as 48.5% of the agricultural land is considered barely or not productive. These “bad” lands are found in marginal deser ts, on steeply sloping hills, or in other inhospitable locations. Huge tracts of sorely needed agricultural land either have been ignored entirely or have received minimal attention. Government attention has mostly been on the irrigated agricultural land, which constitutes about 1.5% of the total. However, due to intense farming, this land’s full potential has already been realized, and its productivity is now decreasing. Once again, the solution is obvious: Governments must redirect their attention and their human and financial resources toward lands which can be improved. 3. Increased attention to the needs of smallholder farms and landless laborers, including credit Increased attention will have to be given to small farmers and landless laborers to increase production (in terms of agricultural extension ser vices and inputs, but not subsidies). Microfinance often requires a year to educate smallholders and the landless poor who will avail of it. However, with proper preparation, microfinance can be profitable, with losses from bad loans often less than those incurred by traditional banks. Box 2-10. The Coffee Connection
A 29 July 2001 edition of the Boston Sunday Globe repor ted that a Guatemalan coffee farmer gets 34 cents per pound for planting, growing, and harvesting coffee beans, which are then sold in high-end cafés in Boston for $8 per pound. True, there are downstream costs such as processing, packaging, and shipping costs, and profit. But the return received by the farmer and the return that the coffee shop receives are widely dispropor tionate. The farmers say their rights have been violated—not just their right to work but their families’ rights. Their children get sick because the farmers cannot afford to buy proper food. Issues presented by this case can be addressed in developed countries through the purchase of coffee from buyers who take steps to assist with the plight of the coffee farmers, an option presented to purchasers of coffee at the World Bank, as described in Chapter 10. In developing countries, governments and others can assist coffee farmers and members of their families to obtain better education and access to technology so these farmers can diversify the products they sell in accordance with their comparative advantage. A big debate occurred at the WSSD during a seminar on indigenous people and their rights. Such rights are clearly stated in at least half a dozen laws and international agreements accepted by various states and their governments. Yet time after time, these laws have been breeched or ignored in many developing countries and sometimes even in developed countries. The aborigines in Australia have been exploited for years and have been crying in vain for the government to help them.
75
AN
IN TRO DU C TIO N TO
S U S TA I N A B L E
DEVELO PM EN T
4. Increased investment in rain-fed agricultural areas in both Asia and Latin America Governments tend to ignore agricultural areas that receive ample rain, believing they are selfirrigating. But there is also a need for land leveling, for example. If land is not leveled, one farm gets flooded while another might be parched. Other inputs such as seeds, organic and limited quantities of inorganic fer tilizers, and extension ser vices may be needed. 5. Decentralized agricultural research, development, and extension systems focusing on particular issues such as soil and water management Researchers at the International Food Policy Research Institute in Washington, D.C., have suggested that agricultural resource management is highly location specific. Centralized agricultural research, development, and extension systems or universal policies that would be applicable universally do not work to improve land productivity. Each of the elements contained in the aptly named Green 2 Revolution will have a clear and significant impact on pover ty reduction, which is a major objective of promoting sustainable development. These five elements of the new agricultural revolution need to be in place before development can become sustainable. Dist r i but i o n The third determinant of sustainable development is the distribution of resources. It is a complex issue. We have already examined pover ty and its linkage with sustainable development. We have also seen how the income gap between the rich and the poor is widening over time. What can be done about it? Definitions of pover ty fall into two categories: (i) the “objective,” based on per capita annual income, expenditure, and assets; and (ii) the “subjective,” meaning people’s perception of pover ty. An objective definition is people who earn less than $1 per day. But how do the poor define pover ty in a subjective way? And how do they see their role in sustainable development? To answer this question, the World Bank sur veyed 60,000 people worldwide who subsisted at the pover ty level. The results of the sur vey were published in the World Development Repor t 2000. According to the repor t, people who are not well off materially consider themselves poor. People who are not well off physically also consider themselves poor, regardless of their income level. Security and the ability to cope with emergencies also lead to the perception of pover ty. In addition, the poor feel that they are denied choices, that they are rarely given the oppor tunity to be par t of decision-making processes, and that they lack the freedom to take action. That food was far down on their list of responses was another revelation. The general feeling was, “Okay, I’m eating less and earning less, but if I feel well and secure I can endure.” Basically, what the sur vey revealed was that people inter viewed would not feel poor if they did not have to worr y about feeling threatened, if they had the wherewithal to cope with emergencies, if they could par ticipate in those choices that control their lives, and if they had affordable access to basic health care.
76
CH A L L E N G E S
O F
S U S TA I N A B L E
DEVELO PM EN T
How can we help the poor help themselves? Providing community health care, ensuring security, and propagating emergency disaster planning are some obvious solutions. Another is offering the poor the financial resources to broaden their choices in the form of microcredit. The poor have been routinely excluded from the commercial banking system. Many have never stepped inside a bank. Ordinar y commercial loans for the poor are completely out of the question. Yet a poor person, like any entrepreneur, often needs funds to star t a new business, to expand an existing business, or just to stay in business. The impor tance and success of microcredit organizations is best demonstrated with a stor y. A woman who was the village beggar was approached by a representative of a microcredit institution, who wished her to take a $5 loan. “How can I take a loan?” she asked, “I am a beggar. I could never repay it.” The lender, however, was insistent and said, “I will not only give you the loan, but I will show you how you can pay it back.” The loan agent told her to use the loan to buy bamboo. He then showed her how to fashion the bamboo into baskets. “Now,” he said, “go into the village and sell your baskets.” She came back two months later looking like a new person. “Here is your loan, and here is your interest,” she said. “And this is the money that I earned.” But it obviously was not just the money that renewed her spirit and self-confidence. She went on, “Previously I used to go to the houses in the village and the people would slam their doors in my face or tell me to come back on Friday, which is alms day. Now when I go to their homes, they not only open the door, they invite me in, give me a glass of water to drink, and then ask what I have to sell today. I may sell one or two items or nothing that day. It doesn’t matter. Now people respect me.” This is one of several factual stories told by the well-known founder of Grameen Bank of Bangladesh—Muhammad Yunus (Muhammad Yunus, 2003). Microcredit organizations have filled the void between banks and the poor. Often the loans might be as little as a few dollars, offered with a fair repayment schedule and at normal bank interest rates. Not only are microcredit loans going a long way toward reducing pover ty, the lending institutions are finding that microcredit is sound business. The experience of Grameen Bank—a leading micro-credit organization in Bangladesh—reveals that repayment rate is ver y high among the poor borrowers. However, there has been some rethinking about the role and potential of microfinance. It is now recognized that microfinance is not a panacea for pover ty reduction; microfinance may not always have an impact on pover ty. Microfinance can help the working poor, but not generally the poorest of the poor, who cannot afford to take on additional debt. The money borrowed enables the poor to produce their goods and then sell them at a price that allows them to pay off the loan and provide their families with an income. Living on one’s earnings, even though small, not only puts food on the table but gives the wage earner dignity, an impor tant factor in not feeling poor. In a world where the richest 20% of the population earn more than 80% of the global income, development cannot be sustainable unless the income gap is reduced. Some people tr y to dissociate the questions of pover ty and income distribution. In reality, however, inequitable distribution of income is one of the major determinants for several reasons.
77
AN
IN TRO DU C TIO N TO
S U S TA I N A B L E
DEVELO PM EN T
First, statistical evidence shows that inequality (especially in the distribution of assets) hinders economic growth. Some have suggested that the effects of inequality may be nearly twice as significant for the poor as for the general population. Second, societies with a higher income gap are also likely to exclude a large number of poor people from oppor tunities that the nonpoor enjoy – water and sanitation, health care, education, credit, insurance, and employment. Third, a major but often underestimated tool for pover ty reduction is the redistribution of income and assets. This is the way the Republic of Korea, the PRC, and Japan have successfully reduced pover ty and achieved a high economic growth rate. Finally and most impor tantly, in the present context of global insecurity, statistical evidence suggests that there is a close relationship between income inequity and the level of violence and political instability (P. D. Fajnzylber, D. Lederman and N. Loayza, 1998). Th e R o l e o f C i v i l S o c i e t y Civil society refers to associations of citizens (outside their families, friends, and businesses) entered into voluntarily to advance their interests, ideas, and ideologies. The term does not include profit-making activity (the private sector) or governing (the public sector). It does include mass organizations (such as organizations of peasants, women, or retired people), trade unions, professional associations, social movements, indigenous people’s organizations, religious and spiritual organizations, the academe, and public benefit NGOs. Civil society must play an impor tant role in sustainable development in terms of agitation, information, and the distribution of resources. How will this be achieved? Civil society must make stronger demands, organize, and mobilize its effor ts better, and push for improved accountability on the par t of government and industries. Specific actions by civil society follow. 1. Demand rights to life and health. If the government is corrupt or not doing its job effectively, then citizens need to asser t their rights in order to safeguard life, health, security, and safety. Even in developed countries, things can change when all of the people who constitute civil society know what their rights are and what they can demand from the government. 2. Demand access to land, water, and other services. Citizens should demand protection when threatened by large infrastructure projects or privatization of what used to be common proper ty resources. In many countries in the developing world, forests and rivers, which are common proper ty resources, have been closed off to the indigenous population, who might have been living in the area for hundreds of years. Agricultural land has been conver ted from small farms into technofarms producing goods for expor t and leaving the original population little to till and little to eat.
78
CH A L L E N G E S
O F
S U S TA I N A B L E
DEVELO PM EN T
3. Form user groups to manage common property resources sustainably. In some Asian countries, small farmers have been able to form cooperatives to protect their interests and to demand that they be given equal access to the modern agricultural inputs. The formation of cohesive groups of farmers in the form of farmer cooperatives is a ver y effective means of empowering people and making things happen in favor of the poor. 4. Mobilize individual households and community resource groups for improving the environment. People generally know what is right and what is wrong, and if they know what demands to make for sustainable development, that is where sustainable development begins. 5. Share information and resources with other groups about common environmental and political concerns. Those who understand environmental issues and political concerns should build this capacity for understanding among other people in the community to make them more aware of these issues. 6. Pressure industries to clean up, and hold businesses accountable. Even though there is a business council for sustainable development and a chamber of commerce and industr y, civil society needs to put pressure on businesses and industries to clean up their mess, and to hold the private sector accountable for what it does. 7. Increase group empowerment. Group empowerment is the ability of a group of people to be heard and to get things done. Unfor tunately, the people who need it most are least able to harness this power. Nor do they often have the money to act on their own behalf. Women in a village in India hesitate to demand their rights and therefore do not play a role in sustainable development. They need to be empowered with information, knowledge, capacity, legal authority, and legal suppor t. 8. Pressure governments and developers into taking seriously the rights and needs of marginalized people. Those who have the resources should pressure governments and developers into taking seriously the rights and needs of marginalized people—people who are at a big disadvantage because of pover ty, because of being indigenous, because they are women or children, or because they are disabled. Violence, conflict, and corruption also affect the poor, who are often the first to become victims and the last to be protected. Corruption has been cited as one of the reasons why villagers do not like some of their local government officials. Many say they are better off without these officials and without a police force in the village.
79
AN
IN TRO DU C TIO N TO
S U S TA I N A B L E
DEVELO PM EN T
Box 2-11. Sustainable Development in Asia: Case I Cooking Stove Improvement Project in the PRC*
The use of improved cooking stoves in the PRC provides an example of a successful sustainable development project. The World Health Organization discovered that there was an unusually high rate of respiratory diseases among rural women in the PRC. Further investigation revealed the culprit to be the stove. The women were cooking on very inefficient coal- and wood-burning stoves in traditional kitchens with no windows. In the 1980s, a project was started to improve the stoves in order to protect the health of the women. The project ran for 15 years without any government subsidies. In the end, more than 700 million rural families benefited from new, safer stoves. The credit goes to the initiative of the communes and the people who desired these benefits. The strategy behind the implementation of the project was to begin in areas where the people showed a desire for improved stoves. The communities had to agree that they wanted new stoves and that they were ready to commit either labor or monetary resources to the project. Research and development were then geared toward designing stoves to match local conditions, such as the type of fuel used for cooking and heating. Most of the PRC uses coal, while Inner Mongolia, for example, uses wood. The researchers designed stoves, depending on fuel and usage (extensive or less cooking), to meet the needs of the people. With the new stoves in place and operational, the program was closely monitored to see how it was progressing in terms of health and efficiency. Since its inception, government contributions have been small, about 15% of the total budget, and restricted to training, administration, and promotion. * Source: D.V. Smith and Kazi F. Jalal (2000)
CASE STUDIES
ON
S U S T A I N A B L E D EV E L O P M E N T
Having discussed the challenges of sustainable development, it would be prudent to document several successful case examples of sustainable development from all over the world. However only two case studies from Asia will be presented here due to limitation of space (Boxes 2-11 and 2-12). The lessons learned and results achieved are more generic based on many other examples received by the authors. L esso ns L e a rne d These case studies suggest that the necessar y conditions for grassroots sustainable development are often end-targeted programs that the people want and need, coupled with a minimum of government involvement. Looking at both costs and profits, if the private sector is
80
CH A L L E N G E S
O F
S U S TA I N A B L E
DEVELO PM EN T
Box 2-12. Sustainable Development in Asia: Case II
Rainwater Harvesting Project in India* A project to harvest rainwater in the desert province of Rajasthan in India in the mid1980s was at the time, according to a media report, the largest mobilization of people for an environmental regeneration project ever. The problem was drought. The wells of the affected villages were dry, and the water table was low. There was not enough drinking water or water for irrigation. An NGO called Tarn Bharat Sing stepped in. A local voluntary organization, it assisted a village in building three small rainwater-harvesting structures called check dams to catch the rainwater. The check dams stored the monsoon rains, then used the water to irrigate fields and to percolate through the ground to raise the water table. It was an inexpensive, workable solution that proved so successful that there are now some 3,000 check dams in 650 villages throughout Rajasthan. The project resulted in regeneration of 6,500 square meters of land, a rise in the water table by 6 meters, and the perennial flow of five formerly seasonally dry rivers. A successful sustainable project produces a ripple effect. Benefits accrue down the line. Due to the availability of water from check dams, Rajasthan’s forests increased by 33%. The new vegetation, mostly fast-growing shrubs imported from Israel, was used to check sand shifting in the desert. Five rivers that previously flowed only during the monsoon season now flow all year round. Agriculture is more productive and selfsustaining, increasing the annual per capita income by $19.78 or 6%. For every dollar invested in check dams, economic production in the villages increased by $4.20, yielding an extremely high benefit-cost ratio. The project also had social impacts. It helped reverse the migratory trend associated with environmental degradation. The people no longer move out of their villages because of hardship to other townships that do not wish to support a growing migratory population, or crowd into already congested urban areas. Other positive social benefits include an increase in school attendance and a reduced crime rate . Apparently, because their incomes went up, families could afford to send their children to school. With the young in school and the older members of the community busy working in the fields, few have time for mischief. Even the women have benefited, since they spend less time fetching and distributing the family’s water supply. For a similar example , see Smith and Jalal (2000) on Indian watershed development.
* Source: D.V. Smith and Kazi F. Jalal (2000)
81
AN
IN TRO DU C TIO N TO
S U S TA I N A B L E
DEVELO PM EN T
the project initiator, then chances are the size of the related bureaucracy will be minimal. If the government is involved, and it should be, the project often works best if the government limits its role to initiator and leaves implementation and administration to the private sector. The community, par ticipating NGOs, the private sector, and stakeholders must also have an active role; all must share in the responsibility for the project. This will maximize the possibility of ever yone involved feeling some sense of ownership in it. This was the strategy behind the cooking stoves in the PRC . A project must also prove to be commercially viable. Many people think that whatever the government or the private sector does for the poor is free. But nothing is free, and no project or strategy will be successful unless there is a full-cost recover y plan. There may not even be a need to subsidize the ver y poor. As has been seen, the poor need ver y little, and in the case of microborrowing, their repayment rate is extremely high. R esu l ts A c h i eve d That small, local sustainable development projects work is undeniable. Witness the kind of success they had in India. Similar projects are being carried out in dozens of small, isolated communities as well. So the question raised at the WSSD becomes: Does it make a difference in this world? The answer is “yes and no.” Yes, it will make a difference if these success stories can be replicated in millions of other places. And no, they will not be success stories if they stay in those communities and nobody hears about them; they might have an impact on the per tinent community, but not on the global community. Putting aside the global view, the positive results of these local projects within the communities are obvious. Marginalized groups derive economic and environmental benefits, investors make money on both shor t- and long-term loans, occupational hazards are minimized, affected communities cooperate and develop better understanding of the benefits of such projects, and NGOs and the private sector are fostered. These results have been achieved in all the case studies. Market and policy failures were minimized if not eliminated, and development became more meaningful and sustainable.
82
C H A P T E R
3
G L O B A L E N V I RO N M E N TA L I S S U E S
AN
IN TRO DU C TIO N TO
S U S TA I N A B L E
DEVELO PM EN T
W
hat are the major global issues regarding environmental sustainability? Population, income, urbanization, health care, food, fisheries, agriculture, materials, and energy are just some of them. The amount of fossil fuel that we consume, even following a modest lifestyle, is going to catch up with us. So transpor tation is becoming a big issue, as are global atmospheric changes. We also have to consider natural resources such as forests and water. All these are heavily implicated in the ecosystem’s sustainability.
PO P U L A T I O N , I N C O M E ,
AND
URBANIZATION
Population growth entails good news and bad news. The bad news is that population has been increasing steadily. The current world population is slightly more than six billion. In 1973, it was only four billion. The good news is, while the numbers are going up, the rate of increase is going down. Cen sus Ta k i n g Of course, the actual numbers are an educated guess. Some countries rarely conduct a census, because they do not want to upset the status quo, be it religious or political. In other countries the government just does not know where its people live. For tunately, two ver y large countries, the PRC and India, do a ver y good job of census taking. It is par t of their culture, their heritage, and their histor y. When the Indians and the Chinese do a population count, they mobilize millions of people as census takers. In the US, doing a census ever y 10 years is a constitutional requirement. A big issue among those involved with global population is whether or not to eliminate the traditional census and instead rely on sampling. Some feel that sampling would yield more accurate results, and the larger, more progressive countries have indeed done quite a good job on enumeration. However, although the aggregate errors are small, they are probably big enough to populate entire countries. Yet it is better than depending on conventional wisdom. For instance, people have assumed for the last 50 years that Nigeria is the most populous countr y in Africa. But no one has a good idea as to how many people actually live there. The UN has a Population Division that works hard to get fer tility and mor tality data through bir th and death cer tificates, and other similar records. For many countries, it succeeds. It is those countries that will not or cannot count their people that make census taking difficult. Pop ul a t i o n Tre n d s Global population continues to rise. The UN’s Population Division has made a number of breakdowns showing where the population is most likely to increase. According to the agency, the population in Africa is growing much more rapidly than the population in Asia, whose growth rate is now on a downward trend. Europe and Nor th America have ver y low rates of population growth. Europe is below the replacement mark (the population is actually shrinking), and, if current trends continue, the US will also soon be in the same situation. The good news here is that the population growth rate is declining all over the world. This trend can be attributed par tly to the effor ts of the UNFPA. It is also the result of a combination 84
G L O B A L
E N V I RO N M E N TA L
I S S UES
of factors, including family planning, income growth, and the education of women. However, in some countries like Bangladesh, there has been a tremendous decrease in fer tility rates that has not been accompanied by a large increase in per capita income. It is difficult to create an effective, comprehensive hypothesis as to why this is happening other than to suggest that some form of disembodied modernization is taking place. Figure 3-1 suggests that GDP growth in the poor countries has been doing slightly better than in the rich countries. Note that the aggregate GDP growth was positive over the entire period. More recent data (after 2000) suggest that some other countries may be experiencing a negative GDP growth rate. Figure 3-1. GDP Growth (annual %)
Source: World Bank (2001); World Development Indicators
Pop u l a t i o n a n d In c o m e While the world’s average fer tility rate is declining, the overall population is going up. Worse, the increases are among the poorest people—those who, according to the UN definition of pover ty, live on $1 a day. Even those living on $2 a day are not doing ver y well. Our mention of these two definitions of pover ty suggests that there are problems in defining pover ty. Another problem is the growing disparity of income. Western Europe and the US are on top: their average per capita income of about $25,000 in 1997 has now grown to about $34,000. That spells a big difference between the West and, say, countries in Africa, with less than $2,000 per capita. The numbers are in terms of purchasing power parity (PPP). The simplest way to calculate purchasing power parity between two countries is to compare the price of a “standard” good that 85
AN
IN TRO DU C TIO N TO
S U S TA I N A B L E
DEVELO PM EN T
is in fact identical across countries. Ever y year The Economist magazine publishes a light-hear ted version of PPP: its “Hamburger Index” that compares the price of a McDonald’s hamburger around the world. More sophisticated versions of PPP look at a large number of goods and ser vices. One of the key problems is that people in different countries consume ver y different sets of goods and ser vices, making it difficult to compare the purchasing power between countries (Werner Antweiler, 2006). Instead of doing a straight comparison of the exchange rate, we measure how much the money will buy. Based on a parity scale, there is still a tremendous difference between the developed, high-income OECD countries and the rest of the world. U r b a n M i g ra t i o n One of the big problems when discussing population is the growth of urbanization. For a long time, populations grew but the people stayed in the rural areas, where there was more room to absorb the increases. Recently, however, even the rural areas have become overwhelmed, causing people to migrate to the cities. Cities around the world gain a million people a week. It is not difficult to understand why. Cities have become synonymous with economic oppor tunity. Bangkok, for instance, which has 7.4 million people or 12% of the Thai population, produces 40% of Thailand’s economic output. However, many Third World cities lack sanitar y sewage disposal, and about 50% of the people do not have an adequate supply of drinking water. Fur thermore, because most of these cities are in tropical countries, where population growth is most rapid, public health issues are compounded. Bacteria thrive in temperatures of 75° Fahrenheit, or 24° Celsius and above. For them, it is like living in an incubator. Currently India has 32 cities with populations exceeding one million. By 2015, it will have more than 50 such cities. India’s population is growing more rapidly than that of the PRC, and, in fact, it is projected that India will be bigger than the PRC by 2015. With that many people, congestion becomes a problem. For instance, Sao Paulo, Brazil, has more private helicopters than almost anywhere else in the world. The road traffic is so bad that the wealthy take to the sky. To appreciate the way cities are growing, one must only realize that in 1950 New York City was the only city in the world that had a population above 10 million. It was the only megacity. By 1975, there were five such cities: New York, Tokyo (which was by then bigger than New York), Shanghai, Mexico City, and Sao Paulo. By 2001, there were 17 megacities. Based upon these figures, it is predicted that the world will have 21 cities with more than 10 million people by 2015. In 1965, Dhaka had a population of 385,000; today it has 13.2 million. Why has this happened? Bangladesh, a tiny country the same size as the state of Wisconsin in the US, has a population of 150 million people. There is no more open land in the countryside to accommodate the excess population, so people gravitate toward Dhaka. The UN predicts that Dhaka’s population may reach 22 million in the next two decades. These numbers are real and projections are the nightmares of sustainable development. How do we deal with these cities, many of which are no longer functioning? Most do not have adequate
86
G L O B A L
E N V I RO N M E N TA L
I S S UES
sanitation or safe drinking water, and the people are choking on air polluted by industrial and automobile emissions. Automobiles are a real problem, because they are usually the first major purchase people make when they begin to earn above the subsistence level. Asia will be responsible for the major problems we are going to face in terms of urbanization, water supply, transpor tation, air pollution, and all the negative aspects related to population growth. There is no avoiding it, because the PRC and India, both with over a billion people, are tr ying to develop rapidly. Over 40% of the sewage in Delhi, which has 14 million people, is not treated, creating an urban river system that is turning black with pollution.
HEALTH CARE All these problems translate into health and health-care expenditures. As a rule, the more a nation spends on health care, the healthier its citizens will be. High-income countries spend an average of $2,505 per capita per annum on health care (Table 3-1). Their public expenditures, as a percentage of GDP, are 6.2%; in addition, private expenditures are 3.7%, bringing the total to 9.9%. In the US, the percentage spent on private health care is even higher. Compare the amount of money high-income countries like the US are spending on health care with the per capita spending of other regions: Sub-Saharan Africa is $84; South Asia, $69. There is a huge difference. This is a problem aggravated by unique regional health burdens, such as waterborne diseases, associated with developing regions such as Sub-Saharan Africa, India, the PRC, and Bolivia.
FO O D , F I S H E R I E S ,
AND
AGRICULTURE
World grain production in 2001 was about 1,840 billion tons or 303 kg per person. Thus, when it comes to food production, the world is doing well, although estimates for 2002 show a 3% drop in total production to 1,833 million tons. In 1974, the World Food Summit in Rome predicted that the world would not be able to feed itself by the year 2000. This did not happen. In fact, food production almost doubled in those 27 years. We were able to increase food production at about 3% per annum in comparison with the 2.2%-2.5% population growth rate, so we have kept ahead of consumption needs. Since 1960, average yields have gone up by more than 150%, as indicated in Figure 3-2, thanks to modern agricultural practices, use of more fer tilizer, better water control, different species of crops, and different cultivars of traditional crops. Gen e t i c a l ly M o d i f i e d a nd G e netically E ng ineered S eeds Once again we are at a pivotal point where technology has run ahead of the public. Depending upon one’s point of view, with or without hard information, we can now disseminate genetically modified (GM) and genetically engineered (GE) seeds. Large countries like India and the PRC have already decided that GM farming is what they need to feed their populations in the future. Other countries are still debating the issue. 87
AN
IN TRO DU C TIO N TO
S U S TA I N A B L E
DEVELO PM EN T
Table 3-1. Health Care Expenditures per Capita and as Public, Private, and Total Share of Gross Domestic Product, by Region, Mid-1990s Region
Per Capita (dollars) a
As Percent of Gross Domestic Product Public
Private
Total
2,505
6.2
3.7
9.9
Latin America and the Carribean
461
3.3
3.3
6.6
Eastern Europe and Central Asia
355
4.0
0.8
4.8
East Asia and the Pacific
154
1.7
2.4
4.1
Sub-Saharan Africa c
84
1.5
1.8
3.3
South Asia
69
0.8
3.7
4.5
561
2.5
2.9
5.5
High-Income b
World
a Currency conversion based on purchasing power parities. bAustralia, Canada, Israel, Japan, New Zealand, the United States, and Western Europe. cAll African countries except those bordering the Mediterranean. Source: Based on World Bank data (2000)
GM crops have become controversial, and involve scientists, farmers, politicians, and large corporations as well as UN agencies (FAO, 2004). The International Rice Research Institute (IRRI) in Laguna, Philippines, a proponent of GM cultivars, points out that there are no food crops today that have not been genetically modified. An ear of modern table maize (corn) looks nothing like what the Native Americans served to the Pilgrims. Maize has been crossbred for size, appearance, consistency, and resistance. It is just that previously we had to let nature do the cross-pollinization. Today, scientists can do it much faster in the laborator y, with predictable results. And therein lies the conflict. Some people feel crossbreeding the way Gregor Johann Mendel did it in the mid-nineteenth century is natural, whereas using high-tech biochemistry is unnatural, producing “Franken-food.” Even those involved in the production of GM seedlings are not in total agreement. Some point out that there is a difference between GM seeds that have been modified to increase productivity and yield, and those that have been modified to increase the profits of the seed bank selling them. Third World rice farmers are terrified that they will become hostage to an expensive multinational seed supplier whose GM rice seeds will force out their low-cost traditional plants. Another point of contention among scientists is the wisdom of interspecies crossbreeding—GE seeds—which introduces vitamins, bacteria, or viruses that are alien to the subject plant. By natural selection, that is unlikely to happen, but in the laborator y all things are possible. IRRI was able to introduce vitamin A into a rice strain by manipulating the plant’s deoxyribonucleic acid (DNA). While the introduction of vitamins is manifestly beneficial, many believe this type of research is a ver y narrow and dangerous road to tread. 88
G L O B A L
E N V I RO N M E N TA L
I S S UES
Figure 3-2. Yields Are Up But Growth Is Slowing
Global Changes in Cereal Yields and Yield Growth Rates, 1961-96
5
Yi el d ( m et r i c t ons /hect are) Wheat Yield Rice Yield Maize Yield
4
3
2
1
0 1960
1965
1970
1975
1980
1985
1990
1995
2000
Source: Food and Agriculture Organization of the United Nations (FAO), FAOSTAT Statistical Database, FAO (1997)
12
Percent Increase in Yield Wheat Yield Rice Yield
10
Maize Yield
8 6 4 2 0 -2
1960
1965
1970
1975
1980
1985
1990
1995
2000
Note:Values are unweighted 5-year moving averages
Source: Food and Agriculture Organization of the United Nations (FAO), FAOSTAT Statistical Database, FAO (1997)
89
AN
IN TRO DU C TIO N TO
S U S TA I N A B L E
DEVELO PM EN T
The whole debate becomes even more volatile when we add in urban (or perhaps rural) legends. Some say it began with the butterfly kill in the US. Even though scientists linked the absence of butterfly migration to other causes, the stor y that it was a “GM pesticide” will not die. Th e G re e n R evo l ut i o n a n d Tra d itional Approaches At some point, though, many argue that we will no longer be able, through any means, to increase our food supply, and then there will be serious trouble. Smith and Jalal (2000, pp. 4651) suggest in par t that we will not successfully come to the end of the road unless we follow a different course of action from the current emphasis on the Green Revolution. As indicated in Figure 3-2, the yield growth rates in cereal production rose from 1961 to 1996 as a result of the Green Revolution, but the growth rates are slowing. If we continue with an agriculture based on the Green Revolution, and even more fertilizer, productivity will not increase much above present levels. But if we put less emphasis on irrigated agriculture arising from the Green Revolution, and more emphasis on neglected areas such as rain-fed agriculture and on agricultural extension and research, productivity will likely go up (Mark W. Rosegrant and Peter Hazell, 1999, p. 191). At some point the maximum increase is reached, and then it begins to decrease or at best remains at the same level. This is not inconsistent with technology, because, although new breeding methods and plant strains will continue to be produced, they are mostly geared toward irrigated agriculture. Traditional approaches such as rain-fed agriculture might ver y well be able to continue increasing yields for another 10-15 years. (See also Chapter 2.) I n c re a s e d In c o m e E q u a l s Inc reased Consumption Another problem in food production is that increased income changes eating habits. When we reach a nine billion world population, we are going to need a big boost in agricultural production, because people eat nonlinearly. In the PRC and India, for instance, as income increases we see that former vegetarians are becoming meat (mostly chicken and beef) eaters. But that puts a strain on the grain supply. When grain is used as animal food, it takes ten times as much to produce an equivalent amount of table food. Now we have a dilemma. While we need more crops, we are faced with diminishing yields and an objection to using GM seeds. Thus, the question arises: Why not reinvigorate the soil by adding more nutrients? Fer t i l i ze rs The problem is soil depletion. If we are growing a product that yields one ton per hectare, it depletes the soil of nitrogen, phosphorus, potassium, and micronutrients in a set ratio. By adding more fer tilizer, we can replace the nitrogen, potassium, and phosphorus, but we have not replaced the micronutrients that were also used by the plants. Many places in the world, such as the US Midwest and the Pampas in Argentina, have ver y deep soil. Under those conditions people can continue to use naturally occurring micronutrients by mining the soil. But in par ts of the PRC and India that have been cropped for many hundreds of years, there is a shor tage of naturally occurring micronutrients, and they must be replaced chemically. 90
G L O B A L
E N V I RO N M E N TA L
I S S UES
Another problem with using fer tilizers is cost. Almost all of today’s fer tilizers are petroleum-based, and the cost of petroleum fluctuates significantly, the direction usually being up. As the price goes up, farmers are able to buy less. Sometimes this causes a whole sector of the economy to collapse, as it did in the former Soviet Union. There the collective farms used a prodigious amount of fer tilizer until 1992, since it was essentially free. When communism collapsed, fer tilizer became a market item and people stopped using it. The end result was that farm production went down dramatically. On the other hand, the PRC, which had ver y low fer tilizer application early on, is now heavily fer tilizing its fields (256 kg/ha). But as we have seen, the ver y thing that improves farm yield eventually destroys it through depletion of micronutrients, breakdown of soil structure, and lack of higher yielding plant cultivars. Lester Brown of the World Watch Institute thinks that by 2015 or 2020 the PRC will have to impor t 100 million tons of grain per year, about 50%-60% of the total grain that is currently marketed worldwide, because its agricultural technology has reached a plateau, and cropped area under cereals is decreasing. The Food and Agriculture Organization (FAO, 2004) has a much more benign view of the grain situation in the PRC, at least in the shor t run. In contrast, India’s farms have more time before they reach the same situation. More fer tilizer, more food, more pollution—this is a problem in countries like Holland, which uses prodigious amounts of fer tilizer (450 kg/ha, second only to Ireland). The nitrates have caused serious eutrophication in the watercourses and nitrate pollution in the groundwater. The Dutch are, however, trying to remedy the situation by a wide variety of methods to reduce their total fer tilizer usage. Foo d S u p p ly a nd D e ma n d Progress in being able to feed a population varies widely by region. Millions still go hungr y. Although the overall figures are decreasing, millions are still suffering from malnourishment and malnutrition. And this is occurring while we actually have food surpluses. Countries like India and Bangladesh are actually expor ting food while many of their citizens are suffering from malnutrition. The food is there, but the people cannot afford to buy it, and there is no mechanism through which they can demand the food. The annual trade in agricultural products, according to FAO, is estimated at about $417 billion, up from $150 billion in constant terms since 1960. The growth in such annual trade has been declining, however, over the last several years, again, not because people have enough food to eat, but because they do not have enough money to buy the food. While the supply is available, there is a shor tage of effective demand. Fish e ri e s Fish, an impor tant par t of the human food chain, are abundant, thanks to fish farming. Fish farms quadrupled between 1984 and 1995. The salmon sold in the US, for instance, is now grown in farms in Norway and Canada. The actual catch from oceans has remained fairly stable, around 85 million tons of fish per year, even though the sustainable catch is thought to be around 70 million tons. Technology is causing overfishing. Due to better fish-finding apparatus and more trawlers, the Nor th Atlantic fisheries of the US were the first to collapse from overfishing. They are tr ying to 91
AN
IN TRO DU C TIO N TO
S U S TA I N A B L E
DEVELO PM EN T
rebuild the stock, but they are meeting resistance from the fishing interests. It is difficult to tell a commercial fishing concern that has a large investment in boats and equipment that they can send their boats out for only a shor t season. The fish har vest in the Nor thwest Atlantic peaked in 1967 and has been declining since then, forcing the fishing fleets to go far ther out. The Central Pacific is still a fer tile fishing ground. In the marine exclusive boundar y of the Marshall Islands, hundreds of Chinese fishing boats are scooping up almost ever y fish that can be caught for shipment to the PRC. B i rd s Bird populations are also under siege. Birds are a par ticularly good indicator of pollution and excessive development. When the wetlands get filled in, the migrator y birds suffer. Sometimes, when we tr y to improve the situation, something bad happens as a side effect. Communities build parks and golf courses, adding green spaces where there were none. But the greener y fools migrating birds into discontinuing their journeys. Heavily fer tilized large agricultural tracts, such as those found in the US, the PRC, and Russia, are also a danger to migrator y birds.
MATERIALS
AND
E N E R G Y F L OW S
Materials flow measures how many of one item is equivalent to how many of another item. For instance, how many bushels of wheat have to be sold to buy one barrel of oil? In 1950, that ratio was about 1:1. Now it takes 10 bushels of wheat to buy a barrel of oil (36.8 bushels of wheat equal one metric ton). This is impor tant, because it says that the terms of trade have shifted badly against agriculture. It also means that people are not growing as many crops, because many inputs in crop production are dependent upon the cost of oil. The US agricultural system is about the same size as India’s in terms of cropped area. They are also about the same in terms of energy usage. But in the US, only one third of the energy is used for growing crops. The rest is used for transpor tation and marketing. The price of what is grown is determined by the cost of energy used and then by the cost of bringing it to market. Of all the entrepreneurs involved in agriculture, the farmer earns the least. This is one of the reasons why farming is often not profitable. Then, too, farmers have to buy not only oil but also manufactured items such as cars, appliances, and machiner y, all of which have heavy energy and materials inputs. When a bushel of wheat could still buy a barrel of oil, farmers had a decent chance, but perhaps not anymore. This applies to both individual farms and large corporate farms. Although large farms can probably produce a bushel of wheat more efficiently and, therefore, at less expense, they are cer tainly feeling the same pain as the small farmer. It is merely a matter of degree. Since farming is vital, the question then becomes, how do we break the cycle in such a way that we can make farming more attractive? In 1973, to ar tificially raise prices, the Organization of Petroleum Expor ting Countries (OPEC) nations severely cut oil production. One year later, US Secretar y of State Henr y Kissinger suggested 92
G L O B A L
E N V I RO N M E N TA L
I S S UES
that farmers do the same thing—withhold the food supply. In other words, use food as a weapon. It did not work. In Nor th America and Western Europe, the food supply was always plentiful, and there was still a great demand for oil. OPEC won that battle. The countries that suffered were those that had neither a plentiful supply of food nor oil. Finally, we should examine how industrial economies use up materials as inputs. A group in Wupper tal in nor thern Germany looks at economies not in terms of GDP, but in tonnage of materials used. It found that the annual amount of materials used per capita in Germany, the US, and the Netherlands is about 85 tons per capita. Japan registers a smaller figure. The less material consumed, the smaller the environmental impact is more likely to be and the less damage caused to sustainable systems. We consume a lot of materials indirectly—things we do not see. We know we consume cars, washing machines, and the like. But in order to make a car or a washing machine, somebody has to spend a lot of money to build a plant. A huge amount of material is mobilized in the fuel, the concrete, and the steel. When we talk about indirect industrial consumption, Europe and the US are about the same. So when the Europeans claim that the US is driving the world into disaster with its big automobiles and wasteful consumption, it is not true, at least not in terms of total materials mobilized per capita. The picture may change if the value of the materials is used as the index of consumption. Fos s i l F ue l Us e Germany, the Netherlands, and the US burn fossil fuels. However, Germany’s consumption of coal far exceeds that of either the US or the Netherlands. Par t of the reason is that Germany burns a great deal of soft coal, which is less efficient. The other reason is that Germany may be overly dependent upon coal because of its strong mining unions. It has been estimated that the German government spends over $100,000 per mining job in subsidies, so there is a financial incentive to use coal. The US actually uses more energy per capita than Germany, but the US use of soft coal is lower, because the US also consumes other fuels such as oil and high-grade coal. When assessing energy consumption, it is impor tant to look beyond the total energy use and look at the details of the composition of the fuels used. Ma te ri a l s F l ow Japan stands out as a countr y that is able to have a ver y high quality of life with a ver y small throughput of materials. Par t of its success is the result of efficiency and miniaturization. This, in turn, results in a high standard of living. If the Germans or the Americans could live like the Japanese, they would be well on their way to a sustainable future in terms of materials flow. The reliance of the West on heavy, large-scale manufacturing produces carbon dioxide (CO 2 ), and other greenhouse pollutants that impact the global atmosphere. By contrast, the Netherlands, a small countr y, consumes a lot of energy and materials. It does so overseas, however, not at home. Most of the materials it uses are already manufactured when they reach Holland. Thus, when we look at consumption figures, the Netherlands seems small, 93
AN
IN TRO DU C TIO N TO
S U S TA I N A B L E
DEVELO PM EN T
although actually the amounts are quite large. The Japanese also do a lot of offshore manufacturing, but they are also doing a better job in terms of overall materials usage. Computers were supposed to bring about the paperless office, but we know that has become a bad joke. We have gone from the simple yellow pad, which often lasted a month, to reams of paper flying out of the ubiquitous printer. A lot of paper is used worldwide, but the US and Canada are far ahead of the others in terms of paper consumption. This is a sore issue in Europe, because it recycles, and, for the most par t, Nor th America does not recycle domestically. Rather Nor th America dumps its waste paper on the world market, which fur ther annoys the Europeans, as this badly impacts European paper manufacturers, who complain that American waste paper is too inexpensive. Obviously, if we use a lot of paper we need to produce a lot of paper, and producing it involves the use of chemicals, bleaches, and energy. It also means deforestation and its attendant problems. The answer, of cour se, is domestic recycling. Even Central America is considerably ahead of Nor th America in that area. Most of its paper products are made from recycled materials. En er g y F l ow The US uses a lot of energy, but on a per dollar of GDP basis, it is actually in the middle range of countries, even though it uses twice as much total energy as Japan and some European countries. In rejecting the Kyoto Protocol, US President George W. Bush, while acknowledging that the US uses a lot of energy, pointed out that the answer lies not in cutting back on usage but rather in constantly improving efficiency to cut down harmful emissions. It is not clear, however, if such an approach is realistic in the face of increasing per capita incomes and increasing consumption patterns. En er g y S o urc e s 1. Fossil fuels The use of fossil fuel per dollar of gross national product (GNP) (see Chapter 11) has been declining globally, mostly because of its high price. In current dollars, oil is a ver y expensive input. From a sustainability point of view, however, oil is not expensive enough. If it were more expensive, we would be forced to shift to other energy sources. We might finally have to drive smaller, more efficient cars, or manufacture hybrid cars on a large scale. The technology for hybrid cars is in place, but the cost of oil is not yet high enough to force a transition to newer technology, so there is little demand for it. Similarly, industrial oil consumers do not yet feel the fuel price is high enough to demand retrofitting their operations or looking for alternate energy sources. Despite the implementation of the Kyoto Protocol, total global energy use is constantly rising. Today, some of the fuels used are decarbonized because we are using less coal and more natural gas, which releases fewer carbon atoms per unit of energy. From an environmental point of view, the best fuel source is natural gas, then oil, and finally coal. There are ways to increase energy use and still hold production of CO 2 at about the same level. 94
G L O B A L
E N V I RO N M E N TA L
I S S UES
2. Nuclear energy When it was first introduced, nuclear power seemed like a panacea: clean, efficient, abundant energy at a ver y low price; “too cheap to meter” was attributed to the head of the US Atomic Energy Commission. It did not live up to its billing. Nuclear power plants are expensive to build and maintain, and there have been several ver y serious accidents in the US and abroad. While the French are still building new plants, almost all other countries are taking them off line. The US is still the largest producer of nuclear power (generated from existing plants), but not the most dependent on it. France is, with 79% of its electricity coming from nuclear plants. 3. Wind Wind is among the safest of the renewable energy sources, and one that is probably the closest to being economically viable. Wind farms in Europe and the US generate sufficient energy to be included on national electrical grids. The drawbacks are expense and reliability. But basically wind power is here, it works, and it is a good technology. As it becomes more popular, many of the early flaws are being ironed out. In fact, there is an active industr y to ser vice and maintain the equipment. Surprisingly, it is not without opposition from environmental groups. For example, there is opposition to deployment of wind farms off the shore near Cape Cod in Massachusetts because they are perceived to be a visual intrusion on the natural beauty of the area. 4. Tidal power Tidal power is being investigated in some remote areas, such as Rance in southern France. There is a big experimental OTECH (Ocean Technical Ser vices, Inc., http://www.oceantech.com/) pilot project currently being developed in Hawaii that is tidal powered, using the temperature difference between deep water and surface water to generate electricity. While it is a natural way to produce energy, the drawback is that it is expensive and intrusive in the marine environment. 5. Solar energy Solar energy has been a dream for a long time, but the technology has not yet caught up with the dream. Solar panels are still ver y expensive, and an array of panels is needed to run anything more than a 50-watt bulb and a black-and-white television. Unfor tunately, in areas where alternative methods are not available, diesel generators are still the cheapest way to generate electricity. It may not be so if diesel fuel cost $60 a barrel. So far, direct solar electricity is not competitive. Pa r t i c u l a t e M a t t e r f ro m E n e r g y U se Energy use emits large amounts of pollutants into the atmosphere—CO 2, hydrocarbons, oxides of nitrogen, sulfur oxides, and other products of combustion. Many of these combine to form par ticulate matter, which precipitates out of the atmosphere, often after undergoing chemical transformations and long-range transpor t. Par ticulate matter, especially the fine par ticulates (those
95
AN
IN TRO DU C TIO N TO
S U S TA I N A B L E
DEVELO PM EN T
that have an average size of 2.5 microns or less, referred to as PM 2.5) and ambient concentrations of par ticulates are worst in the urban areas of the PRC, India, and Mexico. The US has solved these problems fairly well, but the Latin American cities still have problems. Two countries—the PRC and India—will be the countries with the most difficulties in terms of par ticulates in the air.
TR A N S P O R T A T I O N : T H E A U T O M O B I L E I N D U S T R Y As soon as transpor tation is mentioned, people immediately think of automobiles and trucks. Currently there are close to a billion motor vehicles in the world, and that number is going to go up ver y rapidly. The US has 750 motor vehicles per thousand people. The number of cars per driver is even higher when those too young or too old to drive are subtracted. It is apparent that the US has a surfeit of automobiles. The Japanese are catching up in the number of cars per population, but with a difference. Japan is among the major automobile manufacturers in the world, and the Japanese suppor t the industr y by buying cars. However, it is ver y expensive to use an automobile in Japan. High registration fees make it difficult for the Japanese to afford to drive their cars. Coupled with an inferior road system, it is easier, cheaper, and faster to take a train, and the Japanese have one of the finest railroad systems in the world. Compared with New York City and London, Tokyo has the highest usage of public transpor tation. Yet Tokyo is also the city with the highest automobile ownership. The Japanese have found the perfect solution: buy a car to expand the economy and then do not use it. That is how they keep CO 2 and other emissions out of the air! In terms of car purchases, Europe, where the bicycle was once king, is catching up with the US, where bicycles are merely playthings for children. It is now estimated that there are 270 cars per thousand people in Europe, and the number is rising steadily. Paris has a superior mass transit system, with a Metro station on almost ever y major corner, but the lowest ridership among big cities. At last count there were about three million private cars in Paris alone. When the PRC and India opened their markets to the World Trade Organization (WTO), automobile manufacturers rushed in. All the popular makes and models are now available. In India, which has only a few kilometers of single restricted access highway, one can buy a $400,000 Ferrari. The worst par t about the automobile trade in developing countries is that it cannot keep out second-hand automobiles. Almost all of Asia drives three- and four-year old Japanese automobiles, trucks, and buses. That would be fine, except when buying an old car one also buys old technology. The governments are tr ying to enforce Euro 1, Euro 2, Euro 3 emissions standards for diesel and gasoline vehicles (http://www.dieselnet.com/standards/eu/ld.html), but people are buying what they can afford—second-hand automobiles. The Chinese aim to manufacture hundreds of millions of automobiles in addition to the 14 million already in use. Electric bicycles would have seemed to be a nice option, but they have recently been banned. Now instead of bicycles there are severe traffic jams. The PRC government believes that automobile production could become a leading sector of the economy. It looks at the European
96
G L O B A L
E N V I RO N M E N TA L
I S S UES
automobile industry and wishes to emulate Europe’s success. The automobile industry is not just the automobile companies. An army of suppliers is scattered throughout a given country. One plant makes windshield wipers, another makes the fabric for the seats, and so on. The industrial base is expanded a thousand fold. It is very hard to counteract the argument that the automobile industry provides great benefits by pointing out that cars cause pollution, congestion, and traffic fatalities. Worldwide vehicle production set new records in 2000: 40 million vehicles were built worldwide. What is alarming is that manufacturing was only at about 70% of capacity. Manufacturers could easily add another 30% any time demand calls for it. Even while operating at reduced capacity, the global vehicle fleet grew by nine times from 1950 to 1996. These are huge numbers with serious consequences for sustainable development. Americans drive 1.5 trillion kilometers per year, about 5,000 miles for every man, woman, and child. That number is expected to go up to five trillion kilometers in 2020. Not only is the automobile dangerous, it is dangerously inefficient. The spark-fed internal combustion engine is only 13%-18% efficient in real world conditions and is responsible for 30% of the CO2 emissions and perhaps 40% of the par ticulate emissions in the US. Only 13% of every tank of gasoline is used to run a car. The other 87% is wasted. A hybrid car, which can use some of the car’s normal energy to recharge its batteries, might run at 40% efficiency. That is still 60% going out the tail pipe. Because of the internal combustion engine, 1.4 billion people worldwide breathe unhealthy air. Due to poor air quality, we are approaching the same level of damage to health that we already have with inadequate water and sanitation. Cer tainly, this is a very inefficient technology that we somehow backed ourselves into, and we have done so for a long time and wasted colossal amounts of precious fossil fuel. The strange thing is that alternative power sources for cars have been around since the beginning of the twentieth century. In the early 1900s, a car buyer could choose among a steam car, an electric car, a gasoline car, and a car with a diesel engine. And even though each had a different operating system, all were priced about the same. The electric cars in those days actually outperformed the gasoline cars. They had four electric motors, one in each hubcap, providing excellent traction without the need for limited slip differentials to maintain control on turns. The only drawback of electric cars was their limited range. But at that time there were not many gasoline stations, either. Motorists using gasoline had to take large fuel cans with them, which was dangerous. Steam cars could be refueled easily; the only drawback to the steam car was that the boilers occasionally exploded. It is too bad that the gasoline engine rendered the others obsolete. But once the technology was settled upon, all anyone could do was to optimize it. And we are seeing this right now. The Japanese, and now the US hybrids, have made a star t, and while they are still using internal combustion engines, their efficiency has improved markedly. Before we leave cars and energy sources, we should look at another innovation, which, however, has yet to realize its potential. That is the car powered by hydrogen. Hydrogen burns efficiently and has proven to be an effective propellant for cars. The best par t of it is that the emission from a hydrogen engine is water. The drawback is that a hydrogen-powered car at this stage of development is extremely expensive, and there are not many stations at which to fill the tank.
97
AN
IN TRO DU C TIO N TO
S U S TA I N A B L E
DEVELO PM EN T
PRECAUTIONAR Y PRINCIPLE The impact of future economic growth, coupled with an increasing population, means that we will need more energy. It is equally disturbing that we have not been able to end our reliance on fossil fuels. We are working on alternate energy sources—wind, solar, geothermal, and so on— and we already have nuclear power. The remaining scientific uncer tainties surrounding nuclear energy are not grounds for complacency, but the application of the “precautionar y principle,” which is found in Principle 15 of the Rio Declaration on Environment and Development adopted at UNCED: In order to protect the environment, the precautionar y approach shall be widely applied by States according to their capabilities. Where there are threats of serious or irreversible damage, lack of full scientific certainty shall not be used as a reason for postponing cost-effective measures to prevent environmental degradation. The fates of industrialized and developing countries are linked more than most people realize. We are in the midst of a giant political and economic transition, and we are discovering that globalization does not just mean having Japanese cars and water from France. It also means that the fate of mankind is intimately involved in the issue of sustainability. G l ob a l A t mo s p h e ri c C ha n ge There are numerous reasons to take action on climate change. A primary one is that all human life and behavior are dependent on the climate. Climate has a big effect on how we live (Figure 33). Life in St. Petersburg, Russia, for instance, involves about six months of continuous sunshine and almost six months of darkness. Psychologically, this does very strange things to people. Another factor to consider is that climate disruption may be fur ther along and harder to reverse than most people think. There is currently a lot more CO 2 in the atmosphere than over the preceding hundreds of thousands of years, and many think because of that we are experiencing anomalous weather patterns. Stabilizing emissions of CO 2 will likely take significant effor ts over a long period of time. Significant declines in chlorofluorocarbon (CFC) production have been achieved since 1986. Perhaps similar declines in CO 2 levels in the atmosphere could be achieved in the next 20 years. John Holdren, Professor of Environmental Policy at Har vard University, suggests six reasons to take action on climate change: • Human well-being is more dependent on the climate than most people think. • Climate disruption is fur ther along and harder to reverse than most people think. • The impact of future growth in population and energy use will be greater than most people think. • Remaining scientiic uncer tainties are not grounds for complacency (the precautionary principle). • The time lags in implementing effective evasive action are longer than most people think. • The fates of industrialized and developing countries are more linked than most people think. 98
G L O B A L
E N V I RO N M E N TA L
I S S UES
Figure 3-3. Temperatures Have Warmed Over the Past Century
Source: University Corporation for Atmospheric Research (UCAR) and the National Oceanic and Atmospheric Administration (NOAA) (1997), p. 20
FO RE S T R Y A great many of the ear th’s original forests have been cleared or degraded. As suggested in Table 3-2 and Figure 3-4, nearly 40% of the world’s frontier forest is under threat.
WA T E R R E S O U R C E S Countries with low per capita income levels are especially vulnerable to water scarcity, and these nations have higher population levels than high per capita income countries (Figure 3-5). One reason for some optimism is that agriculture dominates the use of water now, but its share will decline as countries grow richer (Figure 3-6).
VA L U A T I O N
OF
N A T U R E ’S S E R V I C E S
What is nature wor th to us? “The Value of the World’s Ecosystem Services and Natural Capital,” a paper by Rober t Costanza et al. (1997), tried to assess what nature is wor th to us (Figure 3-7). To make the assessment understandable, the team assigned these services monetary values. They pointed out that, while the global GDP (see Chapter 11) stood at about $18 trillion, the value of the 99
AN
IN TRO DU C TIO N TO
S U S TA I N A B L E
DEVELO PM EN T
Figure 3-4. The Current State of the Earth’s Original Forests (millions of square kilometers)
20
FRONTIER FOREST NON FRONTIER FOREST CLEARED
15 10 5 0
RUSSIA AND EUROPE
ASIA
NORTH AND CENTRAL AMERICA
SOUTH AMERICA
AFRICA
OCEANIA
Source: Dirk Bryant, Daniel Nielsen, and Laura Tangley, World Resources Institute (1997)
Table 3-2. Frontier Forests Suffer a Variety of Threats
Africa
77
79
12
17
8
11
Asia
60
50
10
20
9
24
North and Central America North America Central America
29
83
27
3
1
14
26
84
27
2
0
14 13
87
54
17
23
29
South America
54
69
53
32
14
5
Russia and Europe
19
86
51
4
29
18
Russia
100
80
0
0
20
0
Europe
19
86
51
4
29
18
Oceania c
76
42
25
15
33
27
World
39
72
38
20
14
13
a Frontier forests are considered under immediate threat, as a percentage of all frontier forests assessed for threat. Threatened frontier forests are places where ongoing or planned human activities are likely, if continued over coming decades, to result in the signiicant loss of natural qualities associated with all or part of these areas.b “Other” includes such activities as overhunting, introduction of harmful exotic species. isolation of small frontier forest islands through the development of surrounding lands, changes in ire regimes, and plantation establishment.c Oceania consists of Papua New Guinea, Australia, and New Zealand.
Source: Dirk Bryant, Daniel Nielsen, and Laura Tangley, World Resources Institute (1997)
100
G L O B A L
E N V I RO N M E N TA L
I S S UES
Figure 3-5. Population in Areas of Relative Water Scarcity
>1,000
>10,000
>100,000
Notes: An area suffers from relative water scarcity if the mean demand for domestic, industrial, and irrigated agricultural uses is greater than 40 percent of the mean annual surface and subsurface runoff area. The tints indicate the population in each area of water scarcity. Source: Vörösmarty et al. (2000)
services the ecosystem rendered was about $33 trillion, and all these gifts from nature were free! The conclusion is obvious: the ecosystem—consisting of soil formation, recreation provided by nature, nutrient cycling, water regulation, climate regulation, temperature, precipitation, habitat for species, flood and storm protection, food and raw materials, genetic resources, atmospheric gas balance, and pollination—is too valuable a resource to destroy (see Chapter 10). Soi l Fo rm a t i o n Nature’s most valuable ser vice is, according to Costanza et al. (1997), soil formation. Without soil there would be no farming (not considering aqua farming and other exotic methods). How do we put a value on this loss? We do so by measuring the amount of topsoil lost in centimeters each year and computing how much it would cost to replace it. When we examine sustainability indicators (see Chapter 4), we will note that in the PRC the largest component in GDP is the cost of remediation for soil lost. In fact, the most damaged ecosystem in that countr y is the soil, and its continuing degradation is catching up with the PRC in terms of agricultural
101
AN
IN TRO DU C TIO N TO
S U S TA I N A B L E
DEVELO PM EN T
Figure 3-6. Agriculture Dominates Water Use, But Its Share Will Decline
Water withdrawal by sector
Source: FAO, Aquastat
Figure 3-7. Estimate of Human Activities and Ecosystem Services
Global GDP (US$ 18 trillion)
Ecosystem Services (US$ 33 trillion)
Sources: Adapted from R. Costanza et al. (1997), p. 256, Table 2
102
G L O B A L
E N V I RO N M E N TA L
I S S UES
productivity loss. The PRC will have to spend a huge amount of money to regain a viable soil system in the not-too-distant future. Pol l i n a t i o n If we are loathe to rely on GM and GE seeds, then we will have to continue relying on pollination to cross-fer tilize and restore our crops. Pollination is impor tant, and provided an interesting contribution leading to this book. In the nineteenth centur y, Gordon McKay, a shoe manufacturer from Lowell, Massachusetts, established several professorships at Har vard University, including a professorship for one of the present authors. Even though McKay was never an academic and never even understood the mechanics of an ecosystem, he was an innovative entrepreneur. Noticing that agriculture in the Midwest was becoming big business, he decided that it would be profitable to supply bees for pollination. He bought a wagonload of beehives and set off to rent the use of bees to farmers in order to pollinate their crops. Unfor tunately, all the bees died on the journey. McKay did not realize that a species cannot just be transplanted into an alien environment and be expected to prosper. And often, if such a transplanted species does sur vive, it is at the expense of a native species. Bee farms, however, do exist today where the bees have been indigenized, and farmers do, indeed, pay to ensure that the crops will be pollinated. For them pollination is not free, and, like soil, it is a quantifiable ser vice.
COPING
WITH
G L O B A L P RO BL E M S
How can we cope with global problems, and how do we know how far we have come? We star t by identifying some of the problems we have been dealing with—overpopulation, income distribution, and rural to urban migration, to cite a few examples. We also take into account new technologies and what inter ventions we can make. We consider tastes and preferences. Are we dealing with a consumer society or a nature-friendly society? It makes a difference. In some Scandinavian countries, for instance, people would rather hike than drive. And then there are the issues of globalization and the resistance to globalization. Many factors must be considered. H ow Fa r A re We ? It helps to star t with a base year. Since it can be arbitrar y, let us take 1990 as the base year. We then go back to our char ts and graphs to look at population, water withdrawals, crop production, CO2 production, food grain consumption, and so on for that year. What do we see? There were both large water withdrawals and high crop production in Asia. Asia tended to dominate all of the consumption items. It also had the largest population. Looking at motor vehicles, Nor th America had the largest percentage, the percentage for Europe stayed about the same, and Asia’s number was small. So we can more or less assume that the world looked pretty much the same then as it does today. Income distribution has not changed. The poor have stayed poor and still consume like poor
103
AN
IN TRO DU C TIO N TO
S U S TA I N A B L E
DEVELO PM EN T
people. The more interesting scenario would be if the poor were no longer poor. When the poor become middle class, there will be a tremendous difference. Poor nations begin to take on aspects of Western culture in terms of consumption. If Asia were to end up with 33% of the motor vehicles in the world, we could have significant new problems. So if we go forward with incomes increasing and larger numbers joining the middle class, we will end up with a world in which it is much more difficult to survive. When the middle class formed a minority in most developing countries, there was not much of a problem. But what if the middle class encompasses six billion people emulating America’s rate of consumption? It just will not work. We discuss this fur ther in Chapter 14. Enviro nme nt a l Po l i c i e s a nd P rog r ams The US has transpor tation energy policies, but the regulator y agencies are not strictly enforcing them, and the federal government has recently been watering them down. Citizens should insist that environmental safety regulations are followed and strengthened, and that automobiles actually work the way they are supposed to. They should also make their government initiate aggressive incentives that would give manufacturers the flexibility to build programs that can transform old technologies. But instead, the government has been cutting back on its environmental programs, so automobile companies are not under any pressure to produce fuel-efficient cars. However, the newly proposed energy bill passed by the US Senate in May 2007 has tightened the vehicle fuel efficiency standards to be met by 2010. There are plenty of new policies that governments should implement. They should reward innovation and early adoption of new technologies, regulate CO 2 (something that was promised but may not happen on a global scale), and develop international antipollution policies. One sure way to cut automobile emissions immediately is to make gasoline ver y expensive. Americans are driving 2.5 trillion miles per year, and the Depar tment of Energy is predicting a 30% increase over the next 15 years. The Depar tment also predicts a 40% increase in the engine power of American cars in that same period, which will consume even more fuel. A hefty tax at the pump might turn things around, but it could be political suicide for its proponents.
104
C H A P T E R
4
S U S TA I N A B L E D E V E L O P M E N T I N D I C ATO R S
AN
IN TRO DU C TIO N TO
S U S TA I N A B L E
DEVELO PM EN T
W
hen examining the world with a concern for sustainable development, we obviously want to know if our actions, however marginal, will have a positive or negative impact in terms of meeting our criteria for sustainability. These impacts include not only physical consequences for the environment, but also associated social consequences and economic costs. To make rational policy choices based on predicted or obser ved impacts, we need indicators. Indeed, most big international firms today, among them British Petroleum of the UK, produce company repor ts with a triple bottom line, one indicating profit, the two others showing the social and environmental consequences of their actions. All the big accounting firms provide ser vices to produce such repor ts. These repor ts are valuable to stockholders as well as to those who make decisions about financial risks. The indicators discussed in this chapter are concrete and quantitative measurements. If only generic definitions of quality are used, it is ver y difficult to make measurements at the margin. Indicators, especially environmental indicators, often relate specifically to the phenomenon or object of obser vation. For example, one indicator for assessing the impact of human actions on the climate may measure megatons of CO 2 emitted into the atmosphere, while another may measure the rate at which the ice sheets are melting. To compare different indicators, it is often necessar y to conver t them into economic costs or benefits. While economic costs can usually be measured using fairly standard and well-accepted techniques, perhaps not exactly but at least within acceptable parameters, we have more trouble measuring benefits. Yet both are impor tant measures of a project, policy, or any other type of inter vention that affects the environment. The question is, can we truly determine the costs and benefits to society of changes in our environment? Probably not, but a look at the literature shows that environmental economists keep tr ying. Hidden behind the dollars and cents of any economic calculation are ver y impor tant, and often debatable, value judgments. There is no simple conversion factor that relates the amount of smog in the air to the economic cost to society. Is it possible to objectively quantify the quality of our environment and the impact that our actions have on environmental quality? It is a question that must be answered if we are working toward sustainability.
NEED
FOR
INDICATORS
A concerted effort to enhance habitability of our planet is unlikely to succeed unless we know “where we are” and “where we want to go.” To answer these questions, we must first consider exactly what we include in the term “environment.” If we restrict our definition to overly simplified definitions, such as the amount of a specified pollutant in the air, we have ver y little difficulty in measuring the environment. However, as we broaden our definition to include all physical components, or all the physical and biological, or all the physical, biological and cultural ones, environment becomes exponentially more difficult to describe (William A. Thomas, 1972). 106
S U S TA I N A B L E
D E V E L O P M E N T
I N D I C ATO R S
This is really a paraphrase of the Chinese proverb that says, “if you don’t know where you’re going, any road will get you there.” But we do want to know where we are and where we want to go. To do that, we must have accurate data—a map of some sor t. To get accurate information, we must first know what exactly it is that we want to assess, and we must define the scope of our inquir y. If we restrict our definition to, for example, the amount of a specified pollutant in the air, we have little difficulty in measuring the environment, as mentioned by Thomas. However, as we broaden our definition to include all the physical, biological, and cultural components, it becomes exponentially more difficult to describe. We are good at measuring physical and chemical phenomena, but once we tr y to rationally assess the biological, social, and cultural aspects of the environment, we have serious problems. To quantify quality, we need some indicators. Laudable attempts have been made to compile lists of sustainable indicators (IISDnet, 1995). However, the results are often voluminous and not ver y well focused. The problem with many of these compilations is that they are highly co-linear ; all are related to each other. It is hard to find indicators that measure one dimension and not another. For example, does the rise in US fuel consumption over the past decade indicate a trend toward less efficient vehicles, a higher number of vehicles, longer driving times, or a combination of these factors? Now combine this one indicator with another that measures changes in urban air quality and the causes and effects become even harder to disentangle. Measuring several dimensions at once and finding a precise interpretation can become ver y difficult. The “seven plus or minus two” law was propounded apparently by a social psychologist, George Miller (1956). A normal human being can think of about five to nine independent facts at any one time if they are par t of a linear problem. Computers can deal with thousands of different indicators and variables at the same time, but at some stage humans have to interpret the data, and they are limited by the above perceptual rule. The dimensionality of the problem, hence, the number of variables, has to be reduced to something that is manageable by human decision-makers. B en e f i t s o f E nv i ro nme nt a l P rotection and S ustainable Development Many years ago Emil Salim, a former Indonesian minister for population and environment, claimed that he needed environmental benefit data to suppor t his ministr y’s concerns at government meetings because he was tired of being told that his approach was too costly. Yet, at the time, he was in no position to assess the real benefits of environmental protection and sustainable development, because the measurements did not exist. So he demanded that environmental scientists develop indicators that he could use to compare the losses in environmental resources against national productivity in monetar y terms. Salim’s stor y encapsulates the problems we still face today. When something that might be environmentally sound is proposed, we are told it is too expensive without looking at the benefit side of the equation. We see a major focus on the cost of a proposal in terms of its effect on the GDP, which can be fairly accurately estimated. But sustainable development requires more; it requires the estimation of the economic costs and benefits of sustainability. 107
AN
IN TRO DU C TIO N TO
S U S TA I N A B L E
DEVELO PM EN T
O b t a i n i n g A c c u ra t e D a t a Environmental indicators gained popularity in the early 1970s after the formation of the US Council on Environmental Quality (CEQ).The CEQ’s purpose was, and still is, to inform the American people about the quality of their environment. The CEQ and the Environmental Protection Agency (EPA) invested a great deal of money in hiring scientists to under take theoretical and practical research on indicators that would allow them to methodically gauge air and water quality (see Ott, 1978, for a state of the ar t review at that time). This type of research petered out in the early to mid-1980s, when the CEQ and the EPA realized that they were not getting accurate or useful analyses and therefore could not make insightful comparisons. Enviro nme nt a l M e a s u re m e n t s Some categories of pollution are not difficult to measure. It is fairly easy to characterize water pollution by variously using 20, 30, 40, or 80 parameters. For instance, in the US, drinking water must be tested for 86 chemicals that must be assessed and that have standards to be met. If the 86 chemicals were to change uniformly in the same direction each time the water is tested, it would be easy to judge whether the water quality is safe or not. But the individual chemicals var y: some might be high on one sample and low on another. Even though we can measure the water’s chemical contents, how do we know whether the quality is getting better or worse? A similar dilemma arises when measuring air quality. Some water and air pollutants are harder to measure than others. When dealing with water, we have to contend with factors like loss of terrestrial systems and habitat, eutrophication, loss of breeding grounds, and coastal pollution. Then there is also the loss of intrinsic or cultural value, loss of recreational capacity, loss of solitude, or simply loss of aesthetic pleasure. When examining air resources we have to factor in effects like loss of visibility and damage to human health. These factors may or may not be local. The landscape of the Grand Canyon is not as visible as it was a few years ago because of the number of automobiles in Los Angeles and the coal-fired electric power plants in the deser t. Enviro nme nt a l Indi c a t o rs What are environmental indices? (An index is a ratio or other number derived from a series of obser vations and used as a measure; Webster’s New International Dictionar y, 1961). We need them because national governments and international agencies need to know how the environment is affected by development, what can be done about it, and how much remediating the damages will cost. It is interesting to put the costs of environmental protection into meaningful numbers. Recently the US has been spending about 7% of GDP for defense and about 2% for environmental protection. The latter is not small in dollar terms, but is it large enough? The 2% figure represents the combined expenditures of the government and the private sector. In the US, corporations spend a lot of money on improving the quality of the air and water. For developing countries funding also comes par tly from international agencies. Those agencies must be able to assess their investment por tfolios accurately and make difficult choices between countries and sectors. For 108
S U S TA I N A B L E
D E V E L O P M E N T
I N D I C ATO R S
instance, should a funding agency help the Chinese improve their water quality, or should it help them improve their manufacturing capacity, which, in turn, would help raise the standard of living but might also make their water quality worse? How can these decisions be made? Who makes them? Clearly, a poor person would rather have bread on the table than a clean environment. It is a dilemma that international agencies frequently face, because they prefer that people have both a clean environment and food. Depending upon the agency, one aspect or the other receives the money and attention. It was pointed out at the 2002 WSSD in Johannesburg that there were really two issues that needed to be addressed: The less developed countries were concerned more with development and sustainability, and the developed countries with sustainability and environmental protection. There was a mismatch in goals, when ideally the two should have been merged. There is a need to integrate our thinking. There are ways to increase industrial development in a manner that is also environmentally friendly. It means doing things differently than we have in the past. Of course, this is hard, given fixed views on technology. Current measures relying solely on economic costs are not considered entirely satisfactor y. As the Indonesian minister pointed out, there is another side to the equation. But there is a need to establish the marginal cost of improvements. We have to know what the improvement is, and we have to be able to relate it directly to the cost of the project. H ow Be s t t o D e s c ri b e t he E nv ironment So how do we describe the environment? There are three major types of issues that require indicators; • Type I, Brown Issues. Brown indicators deal with conventional pollution issues (urban, rural, industr y, agriculture, mining, forestr y, and nonpoint sources of pollution). These are traditionally measured in terms of emissions in tons per day. We can set emission standards and then look at the cost of meeting them. • Type II, Green Issues. Green indicators have to deal with broader environmental and ecological issues (biological diversity, soil and land conser vation, aquatic ecosystems). • Type III, Red Issues. Red indicators have to deal with environmental policies, institutions, and legislation. Creation of indicators for these types of issues relies upon the ingenuity of the analysts. As mentioned above we can often use total emissions as proxies for some of the brown and green issues, but often it is necessary to use ambient concentrations. Emissions do not kill people directly. It is the ambient concentrations of the emissions (again the brown approach) that kill or harm people and damage the environment. So instead of using “tons per day” when discussing air or water quality, we should be assessing micrograms per cubic meter (or milligrams per liter for water quality). We can set ambient standards and then look at the cost of meeting them. 109
AN
IN TRO DU C TIO N TO
S U S TA I N A B L E
DEVELO PM EN T
For the green and red issues, it is more traditional to create indicators of impacts, using physical parameters. What we are really interested in is not the ambient concentrations per se, but their impact once they are transpor ted and diffused throughout the environment. What we are ultimately interested in is mor tality, morbidity, and economic and ecosystem damage. Some of these factors can be measured in terms of performance standards. We can map the spread of ambient pollutants, and then we can look at the impacts in terms of human health and ecosystem damages. Note that the focus of most of the literature has been on brown indicators for pollution but not so much on green, and ver y rarely on the red. The brown indicators, which are almost uniformly negative, include pollution of water, air, and land. The green indicators, which typically represent habitat loss and intrinsic values in aquatic systems, air resources, and terrestrial systems, are the indicators that can be most helpful when looking for positive outcomes. Met r i c s o f M e a s ure me nt 1. Nominal scales The simplest type of measurement is nominal measurement, which essentially involves separating and classifying the objects to be measured into distinct categories and then counting the members of each categor y. Bird species could be an example of categories used to classify obser vations on a bird watching trip. For each species, we can assign some arbitrar y tag (e.g., species 1 or species A2531). The tag itself, which could be a number, word, or any identifying mark, has value only in its function as a label (i.e., species 2 is not “greater” than species 1, even though there may be more individuals of species 2). Once different classes are formed, we can count the number of members of any par ticular class. There are some mathematical operations that can be applied to individual obser vations. First is identity. If A equals B, then A is in the same class as B, and B is in the same class as A. Or we can use transitive logic: If A is preferred over B, and B is preferred over C, then A is preferred over C . Or if A and B are in the same class, and B and C are in the same class, then A and C are in the same class. We can also use nominal scales of measurement in regression analysis. Dummy variables, which represent different classes, can be set to a value of one when that class is the one for that par ticular obser vation, or zero otherwise. All classifications can be broken down into binar y relationships. In fact, classification, or taxonomy, is the first step in most scientific investigations. 2. Ordinal scales The next level of measurement is ordinal – the ordering of classes and individuals. With this type of measurement, objects are assigned to classes, and the classes are ranked with respect to one another ; or alternatively, the objects themselves can be ranked directly (i.e., each class has only one member). For instance, students in a class can be ranked according to their test scores (e.g., student 1, student 2, etc.). With ordinal scaling, if A is greater than or equal to B, then B 110
S U S TA I N A B L E
D E V E L O P M E N T
I N D I C ATO R S
cannot be greater than A. Transitivity is still valid in this case: If A is greater than B and B is greater than C, then A is greater than C . For ordinal measurements, we cannot say anything about the distance between different rankings. For instance, if A, B, and C are along a continuum, we cannot say anything about the magnitude of the distance between A and B or B and C, but we can say that the continuum from A to C is the sum of both increments. To return to the example of student rankings based on test results, the ordinal measurement refers only to the rank and not the score on the exam. Hence, there is no way to tell how far apar t the test scores of different students are if we only know their rank. Mathematical operations on ordinal measurements cannot use addition and division, but only inequalities. Many indices are based on some sor t of ranking, which then violates these mathematical rules when people tr y to sum up the ranks. Fur ther unscrupulous analysis complicates matters by adding the ranks. For example, if we took 10 students out of a class of 30 and tried to determine their average score on the exam by finding their “average” rank (i.e., summing the ranks and dividing by 10), the result is meaningless. Relying on these numbers causes flawed results, because the methodology is illogical and mathematically illegitimate. 3. Interval and ratio scales The highest level of measurement is the inter val or ratio scale. The two are similar except that a ratio scale requires the meaningful definition of a nonarbitrar y zero-point. Temperature, for instance, is an inter val scale. We can obser ve the difference between cool and warm temperatures, and we can measure the magnitude of that difference. But it is not a ratio scale, because, 40º is not twice 20º. Kelvin temperature does represent, however, a ratio scale, because the definition of absolute zero temperature is minus 273º Kelvin. Income is usually considered a ratio scale because it has a nonarbitrar y origin of zero dollars, but neither a ratio nor an inter val scale may strictly apply because of behavioral factors such as the decreasing marginal utility of value of money. For instance, a dollar is not wor th as much to a rich person as it is to a poor person. When the UN created its human development index (HDI), it attempted to take this fact into consideration (http://hdr.undp.org/).
S T A T I S T I C A L P RO C E D U RE S Statistics is the interpretation or manipulation of data. Statistics allows us to make inferences about large numbers, when direct obser vation is expensive or impossible. In the Annex at the end of this chapter, we give the details of the statistical measures that we typically use in assessing environmental issues. Pop u l a t i o n a n d S a mpl i ng The relationship between population and sampling is impor tant because we will ver y seldom be able to measure a population of things, such as the temperature at all points on the ear th’s 111
AN
IN TRO DU C TIO N TO
S U S TA I N A B L E
DEVELO PM EN T
surface, directly. But we can take samples from the population and thus simplify our data gathering and analysis, by applying various statistical concepts and rules. These rules enable us to make inferences about the whole population without measuring each individual item. G r ap hi c a l A na ly s i s o f S t a t i s t i c al Data An extremely impor tant task when communicating the results of any quantitative study is determining how to present the data. It is usually impossible to communicate all of the data at once in one table. Also too many tables make it hard to assess underlying trends. A graph can illustrate a wealth of information quickly and efficiently, without requiring a long list of numbers.
EMISSIONS, DIFFUSION,
AND
IMPACT MODEL
A basic framework, originally due to OECD, that can be used to assess the impacts of pollutant emissions on humans and the environment is known as the emissions, diffusion, and impact model, shown in Figure 4-1. In Table 4-1 we show how some of these emissions, and impacts may be measured over regions and over time. Emissions can be controlled through a variety of means. Generally, polluters are either legally bound to reduce their emissions or are encouraged to do so through some form of financial incentive, such as a pollution tax. While these mechanisms for controlling emissions are often unwieldy and imprecise, they can still have significant effects in reducing levels of pollution. For example, emission controls imposed on automobiles in California have significantly reduced levels of air pollution around Los Angeles. Pollutants can travel through soil, water, air, or a combination of more than one medium. We need to understand the impact that these substances have once they are ingested or inhaled by humans or as they reside in the environment. Typically, the human impact is modeled by a dose response cur ve, which essentially relates the threat to human health vis-à-vis the amount of exposure. Similarly, impact models can be developed for flora and fauna, ecosystems, or even human-made structures. Acid rain, for instance, not only affects forests, lakes, and other natural ecosystems, but can also cause significant corrosion of buildings and other structures. We control emissions by telling people that they can emit only so much sulfur oxide into the atmosphere, and they have to use a special type of fuel. There are other solutions, not as successful, but in use anyway. In Japan, people wear facemasks during high pollution periods. There is also aesthetic pollution. At one time, before budget constraints cut back ser vices, cities fielded street cleaners who picked up litter. They were not stopping emissions, merely controlling them. Almost ever yone concerned with climate change is worried about the large amount of CO 2 being dispersed into the atmosphere. Being unable to deal with the impacts and treating the ambient atmosphere, and cer tainly being unwilling to reduce the use of fossil fuels, much attention is now being given to sequestration of the CO 2 after the combustion takes place. Depending upon how this is carried out, it may be too expensive, or, even where it is cost effective, the ability to 112
S U S TA I N A B L E
D E V E L O P M E N T
I N D I C ATO R S
Figure 4-1. Emissions, Diffusions, and Impact Model
Table 4-1. Emission-Ambient-Impact Measurements Emission based
Ambient based
Impact based
acres deforested
concentrations opacity
mortality morbidity economic losses ecosystem losses climatic effects
Regions
local national depends on data collection
river basins airsheds normal averaging regions
political boundaries urban/rural national transboundary effects
Dynamics
days weeks years
acute chronic long period short period
all time periods
Data
easy
hard expensive
hard expensive conceptually difficult
Typical indices
tonnage of solid waste
ambient quality index
damage functions excess mortality
Measures
113
AN
IN TRO DU C TIO N TO
S U S TA I N A B L E
DEVELO PM EN T
sequester CO 2 for long periods of time and in the quantities being produced may not be technically possible. Weig ht i n g S c h e m e s How we respond to a given environmental problem depends a lot on how we assess or measure it. Which yardstick do we use when measuring the tons of pollutants emitted into the air and water ; the hectares deforested; the opacity of the air and its impacts on mor tality, morbidity (indicative of disease), economic losses, and ecosystem losses? It depends on who is doing the calculations. There are many ways of doing these calculations, as suggested in Figure 4-2. Emission-based data are easy to come by. Ambient data are hard to obtain, and it is both difficult and expensive to estimate health, mor tality, and morbidity impacts. For example, we have air quality standards for the city and for the countr y. In the Boston area there are seven monitoring stations. One of them is in Kenmore Square, near a traffic light. The readings during a red light are low, because the engines near the sensors are idling. When the light turns green, the cars accelerate, spouting burned and unburned fuel into the air. The question is, is Kenmore Square representative of the air in Boston? It is clearly not, but the city has sensors taking measurements at several other locations. How should they be weighted together? It is expensive to measure air quality: approximately $2,000 per month per station per species being measured. With that kind of money involved, it is fair to ask if we are measuring the right things. Figure 4-2. Structure of Indicators by Environmental Issue
Issues Climate change Ozone layer depletion Eutrophication Acidiication Toxic contamination Urban enviromental quality Biodiversity Landscape erosion Waste Water pollution Forest depletion Fish resources Soil degradation General indicators Source: OECD, 1998 114
PRESSURE
STATE
RESPONSE
Indicators of environmental pressure
Indicators of environmental state
Indicators of social response
S U S TA I N A B L E
D E V E L O P M E N T
I N D I C ATO R S
Obviously we are more interested in the impacts, the intake fraction, or how much of a pollutant actually gets into people’s lungs. But the problem is methodology. Do we issue everyone in Boston a sensor badge similar to those worn in nuclear or biohazard plants? That would be exorbitantly expensive. We could, however, sample various groups that might be at risk from elevated levels of pollution. Indoor pollution is another problem. Often the air inside a closed space is worse than what is found outdoors. It depends a lot on the cooking fuels used, how tight the houses are, and so on. Therefore, should we think about monitoring indoor air quality, factoring in how much time people spend indoors as opposed to outdoors. Obviously it is a complicated matter. We worr y about what is in the rivers, because we are worried about the ecosystem. We also worr y about what people drink. Because of low standards, someday we may have nothing safe to drink but bottled water and canned or bottled drinks. Na tura l We i g h t i ng One entire group at the OECD in Paris is devoted to environmental indicators. It has defined the pressures on the environment—emissions, ambient concentrations, and impacts— and has compiled a huge database for environmental indicators such as climate change, ozone layer depletion, eutrophication, acidification, toxic contamination, urban environmental quality, biodiversity, landscape erosion, waste, water pollution, and forest depletion. Once we have this information, what do we do about it? Determining how to combine different indicators to make an informed statement about environmental quality is not a trivial exercise. Somehow we have to find a way to weigh different indicators based on their relative impact. A number of weights are based on objective scientific laws, and these are called “natural” weights. For instance, different greenhouse gases var y in their effectiveness at trapping heat within the atmosphere. We can formulate an aggregate index that measures climate forcing (i.e., heat flux per unit area) based on the ambient concentration of a number of different greenhouse gases by their heat-trapping effectiveness. We can calculate how many watts per square meter increment we get in this combination of gases. For this type of assessment, chemistr y will back us up. Similarly, if we know how much carbon, nitrogen and phosphorus are present in a stream, we can predict eutrophication, using well-established scientific principles. Science can help when we have natural weighting. However, if we do not have natural weightings or if we have them only for physically independent processes that we want to combine (e.g., greenhouse gases and eutrophication in water), then we have to find a more subjective weighting scheme that involves people’s values and preferences. During the administration of US President Bill Clinton, a sur vey was taken of how much value people put on global warming. It seemed a reasonable way of assessing a situation. We might also ask the exper ts, but exper ts and citizens do not always agree. And when there is disagreement, whom do we believe? The exper ts have all the data, but the citizens understand the problem’s impact on their lives a lot better than somebody who has spent his or her life in the laborator y looking at the science. How do we resolve the problem between exper ts and non-exper ts? We suggest that the best way is to derive entirely new indicators relying heavily on economic benefits. 115
AN
IN TRO DU C TIO N TO
S U S TA I N A B L E
DEVELO PM EN T
AGGREGATING INDICATORS There are three common methods for weighting indicators: “natural” weighting, “exper t” or “citizen” weighting, and weighting based on economic benefits. “Exper t” and “citizen” weighting schemes are derived from the opinions of either the exper ts or citizens on the relative impor tance of different indicators in an aggregate index. For example, an indicator for quality of life can be aggregated from per capita income, health care access, educational level, green space, and so on by sur veying exper ts or citizens on the relative impor tance of each indicator.
Figure 4-3. Fundamental Issues in Aggregating Indicators
a
Remediation is what a nation should spend annually on the environment to maintain what it has, while trying to improve environmental areas that are in trouble. a
The advantage of employing economic benefits is that it can pull together indicators that do not have a common “natural” or physical basis, while veering away from the subjectivity of either exper ts or citizens. However, it does require a methodology for translating a given indicator into financial terms, which may involve some subjectivity concerning the value of a human life, for instance. Figure 4-3 shows how economic indices can be used and how some simple ones relate to each other. It creates a set of logical relationships. The economic benefits from sustainable development are greater than the economic damage aver ted, which is greater than the cost of remediation. Some people think that this is a pious hope, and there are some equations and some instances where we might end up with these inequalities not being valid. But if assessing economic benefits and
116
S U S TA I N A B L E
D E V E L O P M E N T
I N D I C ATO R S
costs proves difficult, measuring the cost of remediation will likely be easier. This follows because, generally, economic benefits are hard to measure, and economic damage, “medium-to-hard.” If this relationship holds true in a par ticular case, then calculating the cost of remediation, which is the lower-bound estimate of the economics, is often easier. One index that relies on some subjectivity in the weighting scheme is the air pollution standard index. Beijing newspapers routinely publish a pollution standard index (PSI) for many Chinese cities based on seven sub-indices: total suspended par ticulates (TSP), sulfur dioxide (SO 2), CO, CO 2, ozone (O 3), nitric oxides, and TSP times SO 2 (Figure 4-4). The developers of the index say that air pollution is not just about the suspended par ticles by themselves, but about the combination of the sulfur compounds that attach themselves to the par ticulates like aerosols and sulfuric acid derived from the SO 2, which enters the lungs.
Figure 4-4. Air Pollution in Major Chinese Cities for a Day in January
0-50 51-100 101-200 201-300 301-500
excellent good slight pollution medium pollution heavy pollution
103
Source: Based on China Environmental Monitoring Center data
117
AN
IN TRO DU C TIO N TO
S U S TA I N A B L E
DEVELO PM EN T
Figure 4-5. PSI Subindex Function for Ozone
80
NAAQS = National Ambient Air Quality Standard Source: Wayne Ott (1978)
Indices can be normalized such that the maximum allowable value is set at a convenient number. For example, in Figure 4-5 we see that a PSI above 100 violates the National Ambient Air Quality Standard (NAAQS) of 160 micrograms per cubic meter for ozone, from the Clean Air Act enacted by the US Congress. (Congress sets the standards for air quality, while the EPA, a quasi-independent body, is responsible for water quality.) The EPA and the states have char ts such as Figure 4-5 for tracking air pollution in the form of cur ves that indicate specific levels: 400 micrograms per cubic meter is the aler t level; 800, the warning level; 1,000, the emergency level, and 1,200 micrograms per cubic meter, the significant human health harm level; the PSI approach has been adopted by other places in the world such as Mexico City, Beijing, and Taipei. Such graphical environmental indicators allow us to monitor, measure, and show to the citizenr y the state of the environment. Many European cities use such indicators, often displayed in the main square, to let the people know how the ambient air quality is and whether the environment is getting better or worse. Quantifying the amount of pollution, it is hoped, will cause people to modify their behavior and/or demand better management policies.
118
S U S TA I N A B L E
D E V E L O P M E N T
I N D I C ATO R S
O T H E R WE I G H T I N G S Y S T E M S A weighting system based upon best technical information can also be used. An example can be found in a study done in Canada during the 1970s by a group led by Herber t Inhaber (1976). Inhaber established (Rogers et al. (1997), p. 16) four components of the environment to measure: air, water, land, and miscellaneous. Inhaber also created indices for interurban air quality, overcrowding in cities, visibility at airpor ts, and industrial emissions. Indices for rural areas consisted of forestr y maintenance and resources, insect and disease damage, forest fires, land quality due to forestr y, industrial emissions of sulfur oxides from eroded rural areas, and industrial emissions. Other indices were access to national and provincial parks, strip mining, and sedimentation. A i r Q u a l i t y In d ex The construction of the air quality index is shown schematically in Figure 4-6 and mathematically in Box 4-1. Wa t e r Q ua l i t y Index The database for water quality included industrial and municipal effluent index, ambient water quality index, turbidity, and the amount of mercur y found in fish. Inhaber was referring to items for which it already had data, but one could think of other factors to measure. In any case, Inhaber’s water quality index was computed in the same way as the air index was computed. Figure 4-6. Air Quality Index
Source: Inhaber (1976)
119
AN
IN TRO DU C TIO N TO
S U S TA I N A B L E
DEVELO PM EN T
Box 4-1. Aggregating Air Quality and Comprehensive Environmental Quality index
Air Quality Index
I AIR
=
√
0.2 I 2 SO + 0.1 I 2 SPM + 0.1 I 2 COH + 0.2 I 2 CO + 0.2 I 2 O + 0.2 I 2 NO 2 X X
Comprehensive Environmental Quality Index
I EQ
=
√
0.3 I 2 AIR + 0.3 I 2 WATER + 0.3 I 2 LAND + 0.1 I 2 MISCELLANEOUS
Source: P. Rogers et al. (1997), p. 16
Figure 4-7. Land Quality Index
Source: Inhaber (1976)
120
S U S TA I N A B L E
D E V E L O P M E N T
I N D I C ATO R S
L a n d Q ua l i t y Index The land quality index is an amalgam of forestr y, urban overcrowding, and impacts from mining. These are shown schematically in Figure 4-7.
B r i n gi ng In d i c e s Toge t h e r Inhaber created an index for each of the four categories and added them together to create the comprehensive index of environmental quality. What we see in Box 4-1 is an index of air quality that is the square root of the sum of 0.2 times the concentration squared of SO 2 , plus 0.1 times the concentration squared of suspended par ticulate matter, 0.1 times the concentration squared of the coefficient of haze, and so on. The sum of all of these multiplying factors is unity. This allows the weighting of coefficients relative to each other. If we feel that SO 2 and the production of O 3 are ver y impor tant and that oxidants such as nitric oxides are less impor tant, we can weigh them by taking the square root of the assembled numbers to produce an index for air quality. The various components can be measured, and numbers assigned. But what if the numbers are arbitrar y? We can measure SO 2 , par ticulate matter, and the coefficient of haze. All these have operational numerical values. But then we take the square root of the sum of the squares of those numbers multiplied by some mysterious weighting factors. The weightings make a big difference, but where do they come from? Inhaber then applied the same type of formula for land, water, and miscellaneous factors at the bottom of Box 4-1, weighting all four categories—0.3, 0.3, 0.3, and 0.1—to get the index for environmental quality. This is a comprehensive index of the environmental quality for Canada, but the question remains, is it a useful number? Since Inhaber published his initial findings, there has been a lack of follow up studies. Perhaps, ultimately, there was some doubt concerning the usefulness of this approach.
H u m a n D eve l o p m e n t Index Before we go to further discussion of remediation, let us go back to adding, subtracting, and lists. Ever y year UNDP (ndr.undp.org/repor ts/) publishes the HDI rankings of all countries (Box 4-2). The index, devised by Nobel Laureate Amar tya Sen (en.wikipedia.org/wiki/Amar tya_Sen), is claimed to be an improvement over the use of GDP per capita as a measurement of human development. The criteria Sen decided to measure were life expectancy at bir th, two thirds of the adult literacy rate plus one third of the mean years of schooling, and income. The index was designed to provide a true measure of human development based on longevity, knowledge, and earnings. There is also a parameter for—the marginal utility of income. It is a way of skewing the income to reflect the marginal value of income; an increment of income is wor th more to the poor than to the rich. Norway, Canada, or Switzerland routinely comes out as the countr y with the highest HDI, closely followed by the US, France, Germany, and Britain. At the bottom of the list are nations like Zambia. For the 2006 Repor t based upon 2004 data, Norway, Iceland, Australia, Ireland, and 121
AN
IN TRO DU C TIO N TO
S U S TA I N A B L E
DEVELO PM EN T
Box 4-2. Human Development Index
HD = f {longevity, knowledge, income} longevity knowledge
= =
income
=
life expectancy at birth / 3 (adult literacy rate) + 1 / 3 (mean years schooling) utility of income w(y) expressed by the logarithm of the per capita GDP
2
Each factor is scaled by maximum and minimum
e.g., for longevity =
actual LE – min LE max LE – min LE
=
48.4 – 25 85 – 25
Source: P. Rogers et al. (1997), p. 38
Sweden were the top five (averaging 0.958), with the US coming in at eighth place. The bottom five were inea-Bissau, Burkina Faso, Mali, Sierra Leone and Niger (averaging 0.335). The data do not change much from year to year. A change in the life expectancy at bir th takes decades to show a significant effect, as do changes in literacy and years of schooling. Income, however, might change by a fair amount from year to year. One may be tempted to ask if the HDI is really a new measure. The rank order correlation of HDI with GNP per capita is about 0.98. HDI is strongly correlated with GDP per capita, which it was supposed to improve upon and ultimately replace. The close correlation is due to the fact that life expectancy is highly correlated with GDP per capita. What is called knowledge is actually literacy and years of schooling, which are also highly correlated with GDP per capita. Income, of course, is GDP per capita. In the end, what we have is a wonderful system that pretty much reproduces GDP per capita, and it does that because of the highly interdependent nature of the sub-indices. The correlations in assessing human development are ver y complex and open to all sor ts of manipulations, interpretations, or simply tampering. This is why we can find all manner of versions of the HDI. There was one that weighted women’s employment much more highly than men’s employment. Another version weighted women’s life expectancy more strongly. We need only to change things slightly to drastically change the results. Never theless, the HDI is becoming popular in making intercountr y comparisons, par ticularly for countries with similar GDP per capita.
122
S U S TA I N A B L E
D E V E L O P M E N T
USE
OF
I N D I C ATO R S
PRINCIPAL COMPONENT ANALYSIS
To get around the problem of multi-colinearity—the fact that different components of an index are highly correlated with each other—we can use what is called principal component analysis. Essentially, principal component analysis combines and modifies the data from interdependent categories such that a new set of mutually independent categories arises. Once we take out all the cross-correlations from the data, we can work with a new set of variables. In 1994, ADB and the Government of Norway cofinanced a study executed by Har vard University’s Environmental Systems Program to develop a set of indices to monitor environmental changes among ADB developing member countries (Rogers et al., 1997). At that time, approximately 30% of ADB’s loans were for environmental and socially sustainable issues, amounting to $2 billion to $3 billion per year. The question was how to assess the environmental quality of ADB developing member countries with such different ecological conditions as the PRC and the Marshall Islands. To do this, a large database consisting of 79 environmental indices in 146 countries was examined, which uncovered several difficulties. Although ever y year the World Bank, ADB, the UN, and the World Resources Institute compile huge databases encompassing a large number of indicators, the coverage for each countr y for each of the indicators is poor. So the list ended up with data for 33 indices covering only 17 countries. Moreover, the indices were highly multi-colinear ; i.e., when measuring one dimension they also measured a little bit of another dimension. We rotated the axis upon which all of the indices were measured until we got 33 indices that were entirely independent of each other and expressed as linear functions of the original indices. It was found that the first four principal components (the first four new indices) explained about 70% of the total variance in the database. This is what data reduction is about. We star ted with 33 indices and boiled them down to just 4; and those 4 indices were composed of pieces of the original 33. With the number of indices reduced, serious numerical analysis is possible. It turned out, for tunately, that the variables or the new indices that were derived were exactly what the ADB team had thought to be impor tant. The first principal component had many air pollution indicators embedded in it; in a similar fashion the second was devoted to deforestation and soil degradation; the third related to biodiversity and endangered species; and the four th dealt with water quality.
T H R E E E NV I R O N M E N T A L Q U A L I T Y I N D I C E S In assessing the current and potential future states of the environment in the developing member countries of ADB, three comprehensive environmental quality indices based upon the four principal components were found to be especially useful: the cost of remediation, environmental elasticity, and the environmental diamond.
123
AN
IN TRO DU C TIO N TO
S U S TA I N A B L E
DEVELO PM EN T
Cost o f R e me di a t i o n The cost of remediation (COR) is the cost of moving the present state of the environment to an acceptable level based on a set of predetermined standards.The concept entails three steps: assessment of the existing environmental emissions and degradation, establishment of a set of environmental standards, and estimation of the aggregated costs of achieving these environmental standards. Most countries in the world have already adopted the water quality standards of the World Health Organization (WHO), the European Union (EU), or EPA. Much uniformity exists in national standards. So if urban air quality is at 600 micrograms per cubic meter and we want it to be down to 60 micrograms per cubic meter, we can calculate the cost of remediation. See Box 4-3 for air, water, and land pollution targets. Box 4-3. Air, Water, and Land Pollution Targets
Air and Water • Pollutants: Five pollutants, including chemical oxygen demand (COD), suspended solids, and heavy metals (water); TSP and sulfur (air) • Targets: 90% reduction in water and air pollutant emissions (1990 levels) in 10 years Land Components: • Soil Erosion Control -Target: 70% of total land cover within 10 years • Municipal Solid Waste Management -Target: All municipal wastes will be collected and disposed of immediately Source: P. Rogers et al. (1997)
To estimate the COR, we estimate the aggregate cost of meeting the environmental standards. This is a monetary unit that can be an effective counterweight to traditional economic indicators such as GDP. The COR of different components of the environment may be added or subtracted freely. We are not adding apples and oranges; we are adding or subtracting costs. The COR avoids the problem of weighting environmental indices. These are numbers that we can work with on a spreadsheet and are responsive to what Indonesian minister Emil Salim was seeking—a measure of environmental losses in economic terms. There are data banks for remediation costs. Indonesia has a ten-year plan for building national parks or conser vation areas that includes cost. The PRC has excellent cost data on air, water, and land remediation. The World Bank has costs on solid waste management. We do not know the cost of the loss of a species, but we do know the cost of national parks and conser vation areas, since the World Conser vation Union (IUCN) and the World Wildlife Fund (WWF) can provide cost data for ecosystem management. ADB has used a cost remediation process in assessing the environment for several of its developing member countries since 1994. It has been able to accurately repor t where the major problems were, and which countries needed to spend a lot to remediate and maintain their environment (Table 4-2). 124
S U S TA I N A B L E
D E V E L O P M E N T
I N D I C ATO R S
Table 4-2. Annualized Cost of Remediation (COR) for ADB Developing Member Countries ($ million in 1990 US$) Country
Air
13.70
30.34
321.47
52.39
BHUTAN
0.16
0.35
8.50
24.45
33.45
CAMBODIA
0.31
0.70
78.11
30.85
109.97
LAO PDR
0.26
0.58
38.46
33.18
72.48
MONGOLIA
5.91
13.08
2,773.26
13.39
2,805.64
MYANMAR
3.56
7.87
260.74
65.20
337.36
NEPAL
0.78
1.74
115.60
48.90
167.02
53.97
119.49
867.20
36.09
1,076.76
PAKISTAN SRI LANKA VIET NAM
Land
Ecosystem
COR (total)
Water
BANGLADESH
417.89
3.5
7.76
65.12
147.86
224.24
12.97
28.71
200.75
251.48
493.91 17,553.96
1,430.13
3,166.07
12,657.97
299.79
INDIA
418.97
927.53
4,882.97
852.23
7,081.70
INDONESIA
100.10
221.61
953.92
296.30
1,571.93
PRC
1.73
3.82
12.94
70.44
88.92
PHILIPPINES
39.59
87.65
319.67
160.67
607.57
THAILAND
67.00
148.32
557.63
47.73
820.68
0.52
1.16
7.48
20.37
29.53
199.84
442.41
203.24
61.71
907.19
MALAYSIA
43.15
95.52
138.78
329.48
606.93
SINGAPORE
24.42
54.07
14.65
14.55
107.70
2,420.58
5,358.76
24,478.44
2,857.06
35,114.83
PAPUA NEW GUINEA
FIJI KOREA, REP. OF
TOTAL
Source: P. Rogers et al. (1997)
A nation like Viet Nam must spend about 8% of its GDP for remediation. Countries that have maintained a good environment can spend less—for instance, the Nether lands, 2%; Switzer land, about 2%; the US, about 1.8%, and the UK, almost 1.5% (P. Roger s et al., 1997). Of the western nations, France spends the least, about 1.3%, perhaps because the French have done such a good job of protecting the environment in the past. The Nether lands, however, takes environmental problems more seriously, spending more of its GDP on maintaining and enhancing its environment. The COR enables one to assess demands for external financial assistance. The study determined that if the COR divided by GDP is less than 1%, there is probably no demand for external financing. On the other hand, if the COR is more than 4.5% of GDP, external funding would be needed. Or, following Kuznets’ argument, a countr y can raise its GDP and then finance its COR. The PRC is really pressing ver y hard on its environment. It is a huge countr y, but it consists mostly of deser ts and mountains; it has ver y little living space. Mongolia, though mostly underdeveloped, also has ver y little living space. It has also been reduced to mostly deser t by overgrazing. The Mongolians have cut down most of what little forest they had. 125
AN
IN TRO DU C TIO N TO
S U S TA I N A B L E
DEVELO PM EN T
Table 4-2 shows that the major COR in the PRC is for land. There is tremendous soil erosion, par tly due to the poor quality of the soil and par tly because of overfarming (the Chinese have been farming the same soil for more than 3,000 years). Conventional wisdom might say that the main problem of the PRC is air pollution (recall Figure 4-4), but the air is relatively inexpensive to clean up. Remediation of the land is by far the most impor tant and expensive task.
Box 4-4. Environmental Elasticity Environ m e n t a l Ela s t ic it y’s P r in c i p a l M e r i t s
Environmental elasticity is the ratio of the aggregate percentage change in the environment to the aggregate percent change in the economy. Environmental elasticity is based on price and income elasticity found in the economic literature. The principal merits of environmental elasticity are twofold: • It is dynamic, using data for two points in time to capture environmental changes with respect to economic trends. • It is a trend indicator as opposed to a state indicator. Source: P. Rogers et al. (1997)
Figure 4-8. Map of Environmental Elasticity
Positive Environmental change relative to Negative Economic change
II
Positive Environmental change relative to Positive Economic change
I Economic Aggregates
III Negative Environmental change relative to Negative Economic change
Source: P. Rogers et al. (1997)
126
IV Negative Environmental change relative to Positive Economic change
S U S TA I N A B L E
D E V E L O P M E N T
I N D I C ATO R S
Env i ro nme nt a l E l a s t i c i t y The second comprehensive index is called Environmental Elasticity and is akin to the price and income elasticities used in economics. The principal merits of environmental elasticity are its dynamics. Using data from two points in time on two axes, it captures environmental changes with respect to economic trends, making environmental elasticity a trend indicator as opposed to a state indicator. The cost of remediation tells the state of the environment; environmental elasticity tells the direction of the trends. Box 4-4 summarizes the definition. If we set up a char t with environmental aggregates and economic aggregates as our two variables, it is possible to track the rate of economic and environmental changes and the percentage of change, as suggested in Figure 4-8. Quadrant I in the upper right corner of Figure 4-8 indicates a positive environmental change relative to a positive economic change. Sri Lanka is an example of a countr y that has achieved Quadrant I status. This is a healthy balance: both an improving economy and an improving environment. Quadrant IV in the lower right corner shows an improving economy, while environmental quality is declining. This is where many rapidly developing nations, such as the PRC, are. Quadrant II in the upper left corner shows an improving environment and an economic downturn. The classic example of this is found in Russia. Threatened with bankruptcy, after the break up of the Soviet Union, Russia closed down many of its factories. The positive side effect was that its air and rivers became cleaner. Finally, Quadrant III shows that it is possible to have both negative environmental change and negative economic growth. Deve l o pme nt D i a mo n d s a nd E nv ironmental Diamonds Development diamonds and environmental diamonds, shown in Figure 4-9, are graphs that illustrate a country’s or region’s relative performance with respect to four indicators. Ideally, these indicators should be independent from each other. The development diamond was introduced by the World Bank (2004). Notice how the four criteria are similar to the HDI, which utilizes three of them. The development diamond is especially useful in showing a par ticular countr y’s performance with respect to a regional average. The first step in constructing a development diamond is to determine the regional average for each of the four indicators. The axes on the diamond plot are then scaled according to the percentage of the regional value. The regional average diamond is then plotted with four equal sides with the ver tices at 100% on each axis. Each indicator is then plotted for the hypothetical country as a percentage of the regional average. If all the indicators are “good” indicators (e.g., concerning access to safe water, life expectancy, etc.), then a diamond larger than the regional average signifies a country that is performing much better than its neighbors. From the figure, we see that the hypothetical country is performing better than average in terms of schooling and GDP per capita, but worse than average for access to safe drinking water and life expectancy. The usefulness of the development diamond approach is the ability to quickly assess the performance of a given country with respect to a regional average (Figure 4-10).
127
AN
IN TRO DU C TIO N TO
S U S TA I N A B L E
Figure 4-9. Generic Development and Environmental Diamonds
Primary school enrollment
Regional average Hypothetical country
128
DEVELO PM EN T
S U S TA I N A B L E
D E V E L O P M E N T
I N D I C ATO R S
Figure 4-10. Environmental Diamonds for the PRC and Pakistan
Source: Rogers et al. (1997)
Source: P. Rogers et al. (1997)
129
AN
IN TRO DU C TIO N TO
S U S TA I N A B L E
DEVELO PM EN T
While it is tempting to measure the relative area under each triangle and compare the countries based on the areas of their diamonds, this operation is flawed. We have four dimensions shown on a flat piece of paper, and if we calculate the diamond area, we will have committed a cardinal sin in mathematics. The diamond is really a tetrahedron, with four independent dimensions, not a diamond flat on the paper. It is easy to see the problem with calculating the diamond area if you reorder the axes. If primary school enrollment and life expectancy are switched, we obtain a diamond with a different area. Since there is no inherent reason guiding the ordering of the axes, there is obviously a problem with tr ying to calculate the area. It is possible to construct an environmental diamond by plotting on the four independent axes the cost of remediation for the ecosystem, water, land, and air. Again, the actual values plotted would be percentage values with respect to some regional average.
Figure 4-11. Eight health/education indicators for Africa
Consuming over $1/day ‘90 100
Adult literacy rate ‘90
80
Access to safe water ‘88-’90
60 40 20
Primary school enrollment rate ‘90
Life expectancy South-North index ‘90 (North=100)
0
Access to health services ‘88-90
Children suffering from stunting ‘85 Under-5 mortality SouthNorth index ‘90 (North=100) $287 or less $288-$459
Source: Based on World Bank data, 1995
130
$460 or more
S U S TA I N A B L E
D E V E L O P M E N T
I N D I C ATO R S
A slightly more complicated graph related to development and environmental diamonds is known as a “snowflake.” Figure 4-11 shows eight indicators plotted on a snowflake with eight, not four, independent axes. Again, values are plotted as percentages with respect to averages in the World Bank’s African region. The Japanese environmental protection agency uses a slightly modified version showing seven indicators. These plots are called star diagrams. In Figure 4-11, the solid line is the average for countries with GDP over $460 per capita, and the dotted and dashed lines are the average values for even poorer countries. Small is not necessarily beautiful in this case. For six of the indicators it would be better to be bigger than the average, while for two (under-5 mor tality and children suffering from stunting) being below the average is better. The problem with environmental diamonds, snowflakes, and stars is that their shape is deceptive. Four (or 7 or 8) dimensions cannot be plotted on a flat, two-dimensional sheet of paper. The areas within the different shapes are deceiving. If we make comparisons based upon the relative areas of the diamonds, etc., we have violated the laws of topology Adding the four indices in an environmental diamond creates a “thermometer.” The height of the thermometer (shown in Figure 4-12) can allow us to make a judgment on the relative magnitudes of the impacts in a fairly unbiased way. We are still confronted with the problem of setting relative weights for various indices.
Figure 4-12. An Environmental Thermometer Showing Four Components of Environmental Quality Equally Weighted
Sum of Four Components of Environmental Quality
5
4
e= 0.54 e= 0.95
3
l= 0.94 l= 0.45 2
w= 0.89
w= 1.84
a= 1.53
a= 0.72
1
0 Thailand
Indonesia
(a=air, l=land, w=water, and e=ecosystem). Source: A. Gelber and P. Rogers (Aug. 2002)
131
AN
IN TRO DU C TIO N TO
S U S TA I N A B L E
DEVELO PM EN T
The math, the graphs, the char ts, and other special devices such as the development and environmental diamonds are all tools employed toward an end: economic and environmental assessment that allows environmentally aware developers and financial institutions to predict both the impacts and full costs of sustainable development.
SUMMAR Y In assessing economic, environmental, and social development, it is impor tant to have clear, simple, and reliable indicators of progress or lack thereof. The discipline of economics is the most advanced in providing such quantifiable and reproducible indicators. Measures of GDP, savings rates, and price and income elasticities are among some of the most useful. The field of environmental science also has a wide range of useful indicators for measuring environmental quality. The field of social indicators also provides a broad set of somewhat less focused indicators. Unfor tunately, the developing field of sustainability science, which relies upon indicators from the other fields, is not well developed, and has to rely upon combinations of these for indicators of progress. P. Rogers et al. (1997) attempted to expand the use of indicators for broad environmental assessment at the national and regional scale. This chapter repor ts some of the results. To use many of the indicators, it is necessar y to recall some of the basic tenets of arithmetic, in par ticular, the avoidance of confusion associated with the inappropriate arithmetic manipulation of ranked data. In addition, the Annex to this chapter points out some of the issues associated with measures of centrality and dispersion when the underlying distributions are nonsymmetric. A major problem with indicators is the aggregation of one carefully measured and statistically reliable index with another index in order to broaden the usefulness of the resulting indicator. In many cases, even where the data are purely physical (as in air pollution), the aggregated indicator may be a poor indicator of the joint effects of the indices brought together. The most impor tant obser vation in this chapter, however, is how to remove multicolinearity from the data used in describing sustainability issues. Principal component analysis can be employed to conver t highly correlated data into uncorrelated indices. It is imperative that all indicators of sustainability be subject to this rigorous exercise. In many cases this will rule out a large number of redundant variables, allowing the planner to focus upon fewer and more relevant ones. While we have developed the complex cost-of-remediation and environmental elasticity indicators, we fully endorse simpler approaches such as environmental diamonds and snowflakes. The chapter, however, also warns of the pitfalls associated with environmental snowflakes and diamonds, and suggests a simple “thermometer” as an easier and more honest representation of data.
132
S U S TA I N A B L E
D E V E L O P M E N T
I N D I C ATO R S
ANNEX SOME USEFUL STATISTICAL DEFINITIONS Mea s ure s o f C e nt ra l Te nde ncy There are several measures of central tendency; they are meant to reflect the locations where most of the obser vations lie. Of these the mean, the median, and the mode are the most useful. A few other measures are used in environmental assessment, which are influenced by the scaling of the data. The geometric and harmonic means are two such measures. • Mean. The arithmetic mean (or “average” in common parlance) is the sum of all the values in a set of numbers divided by the number of values. When doing a population study, it is impor tant to remember that the mean of a sample will usually not be exactly equal to the mean of the population. However, as the size of the sample, which is usually denoted as N, increases, the sample mean will approach the population mean. Ever y time we take a bigger sample we get closer and closer to the population mean and ultimately, when N equals the size of the population, we get the true mean. N is an interesting number in statistics, and there is a lot of debate as to what is big. Is 50 big enough for a sample size? It will depend upon how accurately we want the sample mean to be. It may be hard to take a large sample, par ticularly in the social sciences, where sampling and experimentation are expensive. However, if the sample data contain an extreme value (as in the sample 1, 3, 5, and 1,000), the computed mean might not realistically reflect the middle value, or the population mean derived from a larger sample. • Median. The mean is the most common tool for getting a sense of a “typical” or “middle” value. However, a more accurate or more useful measure of “middleness” is often achieved by calculating the median. The median is the central number in a group of numbers. For instance, in the series 4, 5, 6, 9, 13, 14, 19, the median is 9. If we have a symmetrically distributed population or sample, then the mean and the median are the same. In a “normal” population distribution (the Gaussian bell cur ve), 50% are above the mean, and 50% are below the mean (Figure 4-13). The median is a good indicator if we are interested in where half of the population falls as opposed to the population average. For instance, if we wish to determine income distribution in a fixed populace, we would look for the median income rather than the mean, simply because extreme values (e.g., a few billionaires) tend to skew the results, and the mean does not necessarily represent a “typical” income. If we average in the wealthiest segment of the population and the poorest, we would get spurious results. • Mode. The mode is the most commonly occurring value in a set of numbers. In the sequence 1, 2, 3, 3, 3, 3, 4, 4, 5, 6, 6, the mode is 3. When plotted on a graph, the above series looks something like a sloppy bell cur ve.
133
AN
IN TRO DU C TIO N TO
S U S TA I N A B L E
DEVELO PM EN T
• Harmonic mean. We can use other yardsticks such as the harmonic mean. In cer tain situations, this statistic gives a more accurate measure of an average value, as suggested in the following example: If one travels at 40 mph for a half of the distance of a car trip, and 60 mph for the other half, the average speed is calculated using the harmonic mean. In this case, the average speed would be 48, which is less than the arithmetic mean. The formula for the harmonic mean, H, of N obser vations follows. H = _______N_________ 1/x 1 + 1/x 2 + ... + 1/x N • Geometric mean. The geometric mean is defined as the product of all the values in a set of numbers raised to the power of the reciprocal of the number of values in the set. The formula for the geometric mean, G, is G = (x 1 · x 2 · ... · x N) 1/N As we can see, there are a number of different ways to calculate the “average” value for a set of numbers. Depending on what these numbers represent and what we are tr ying to find, the geometric mean might be more useful than the harmonic mean or median calculations, for example, when we are showing rates of change. A useful relation to remember is that the harmonic mean is always less than or equal to the geometric mean, and the geometric mean is always less than or equal to the arithmetic mean. Mea s ure s o f D a t a D i s p e rs i o n As we move on to refine data, the computations become more complex. Whether measuring water or air pollution, income, or resource distribution, we need to know how the data are dispersed within the sample. There are several measures of dispersion. Box 4-5. Variance and Standard Deviation
Application of these measurements is illustrated in determining population variance and standard deviation: The sample variance, denoted below by s2, is the sum of the squared deviations from the mean, x m, divided by the number of samples N, minus one. The standard deviation is the square root of the sample variance. If N is very large, then N minus 1 is practically the same as N, and the sample variance is a close estimate of the population variance. s2= sample variance = ∑ (x i – xm)2/(N – 1) SD = standard deviation = √s2 = s For example, consider the following five numbers: 3, 5, 7, 14, and 21; the mean is 10 and s 2 = [(3 – 10) 2 + (5 – 10) 2 + (7 – 10) 2 + (14 – 10) 2 + (21 – 10) 2] / 4. Computing these results, s 2 = 55 and SD = 7.4.
134
S U S TA I N A B L E
D E V E L O P M E N T
I N D I C ATO R S
Figure 4-13. Normal Distribution
• Variance and standard deviation. Variance measures how spread out the distribution of values is from the mean. Standard deviation is the square root of the sample variance. • Range of data. This is the distance between the extreme (lowest and highest) data points gathered. Because the calculation of sample variance averages the square of the distance from the mean, a value that is far from the mean will be weighted more heavily than one close to the mean, and hence will have a larger influence on the final result. The range is less influenced by extreme values.
Box 4-6. Range of Data
Another approach that considers the linear, as opposed to squared, distance from the mean is to measure the range or interquartile range. The total range is simply the distance between the two extreme data points. Obviously, this approach says nothing about how the data are spread within the range, and by definition it is influenced by extreme points. To determine the interquartile range, we first sort the data according to magnitude and then determine the first three quartiles (Q1, Q 2, Q3). The first quartile is the median of the lower half of the data, and the third quartile is the median of the upper half. The second quartile is the median of the entire data set. The interquartile range is the distance between the first and third quartiles (Q3 – Q 1). Therefore, the data are ranged so that 25% are below the range, 25% are outside the range, and 50% lie within the range.
135
AN
IN TRO DU C TIO N TO
S U S TA I N A B L E
DEVELO PM EN T
• Box-and-whisker plots. Another useful statistical tool is known as box-and-whisker plots, which graphically show summaries of environmental quality data. A box-and-whisker plot reveals the spread of the data by plotting three values: the two extremes (forming the “whiskers”), standard deviation (the ends of the “box”), and the mean. The following char t shows how this statistical tool can be used. Each box and whisker represents a set of measurements at a par ticular well location, MW1, MW2, MW3, and MW4, showing var ying mean, range, and standard deviation of arsenic concentration in the water at four monitored well locations.
Arsenic concentration (mg/L)
Figure 4-14. Monitoring Well Location
Mean
Range
Standard deviation
MW1
MW2
MW3
MW4
Source: McBean and Rovers, 1998
Probability density
Figure 4-15. Three Measures of Central Tendency of Data
Arsenic concentration (mg/L) Source: McBean and Rovers, 1998 136
S U S TA I N A B L E
D E V E L O P M E N T
I N D I C ATO R S
• Skewness. For a normal distribution, 50% of the samples fall below the computed mean and 50% above the computed mean. Deviation from the normal distribution is called skewness. The term is defined as having some elements on opposite sides of a mean line reversed or unbalanced. The formula for skewness is: A=n∑(x i-mean) 3/(n-1)(n-2)s 3 A is a positive number for a skew to the right tail and a negative number for a skew to the left tail. S c h e m a t i c D e p i c t i o n o f T hre e M easures of Centr al Tendency of Data The plotted data in Figure 4-15 show unimodal distribution that is positively skewed. Along the horizontal axis, the mode appears on the left, the median in the middle, and the mean on the right. If the order were reversed and the tail extended to the left, then it would be a negatively skewed distribution. What does this graph reveal about the arsenic in the groundwater? Should a health standard be based on the mean, the median, or the mode? There are such big differences among the three figures that could determine whether the standard is met or not. The answer will depend upon how we value the negative health effects of large but rare concentration of arsenic in the groundwater. At high levels, arsenic poisoning can be fatal. In writing a standard, it is necessar y to obtain more information on typical distributions of arsenic measurements and the health impact of arsenic exposure to come up with an appropriate statistic or combination of statistics for the standard. We should be careful about drawing strong conclusions. One way to check the quality of the measurements is to divide the standard deviation of all the measurements by the mean. This statistic is referred to as the “coefficient of variation,” which will be ver y high if there is a wide spread in the magnitude of the measurements. As a rule of thumb, when the coefficient of variation is greater than one, the data are considered ver y noisy, and it is a good idea to recheck the measurements. The long whiskers indicating wide dispersion that are shown in the figure are typical of these kinds of sample data, as accurate data on environmental conditions are often hard to come by. This difficulty should provide a warning when working with only average values, which can be quite misleading.
137
C H A P T E R
5
E N V I RO N M E N TA L A S S E S S M E N T
AN
IN TRO DU C TIO N TO
S U S TA I N A B L E
DEVELO PM EN T
I
n this chapter we are going to explore environmental impact assessment (EIA). At one time no one thought about environmental impact. They just went out and built highways and bridges, and never took a second look. The only concerns were completing the job on time and on budget. The “E” word was efficiency, not environment. Now we know better. We will examine the various methods used to make EIAs, and the techniques that predict impacts, whether on land, air, or water. Since all the methods cannot be considered in detail, we will restrict ourselves to one par ticularly useful framework. The example of a coherent method to carr y out an EIA to be discussed in some detail is taken from an ADB tutorial on EIA.
N A T I O N A L E NV I R O N M E N T A L PO L I C Y A C T
OF
1969
In the US, the National Environmental Policy Act (NEPA) was passed during the Nixon Administration in 1969. President Nixon got good marks from environmentalists, because during his term some ver y impor tant legislation was passed, of which the NEPA is an outstanding example. The mandate of the NEPA was to be a trustee for the environment for succeeding generations. It predated the concept of sustainability and the formation of the Brundtland Commission by more than a decade. The NEPA came about at a time when the federal government was becoming concerned about the environmental degradation it was witnessing—rivers catching fire, polluted groundwater, indiscriminate handling of waste materials—and decided to do something about it. It was essentially a top-down approach from the federal government to the states and local governments. There was little, if any, par ticipation of civil society. The NEPA also had to do with aesthetics. It wanted to assure all Americans safe, healthful, productive, and culturally pleasing surroundings. Written into its preamble was the vow to attain the widest range of beneficial uses of the environment without risk to health or safety and without other undesirable or unintended consequences. It meant to preser ve impor tant historical, cultural, and natural aspects of the national heritage and to maintain an environment that suppor ts diversity and a variety of individual choices. The NEPA could be considered a Magna Car ta for the environmental movement in the US and later in many other countries. It gave citizens and citizens’ groups legal standing on a host of environmental issues that they did not previously have. Under the NEPA the citizenr y could par ticipate in the decision-making process, which formerly had been reser ved for government agencies operating without the need for consultation. Cou n c i l o n E nv i ro n m e n t a l Q uality The NEPA inevitably led to the establishment of the Council on Environmental Quality (CEQ) at the beginning of 1970. CEQ would assess the state of the nation’s environment, and the EPA would set standards, implement regulations, and administer the law. For a while, CEQ ser ved as a
140
E N V I RO N M E N TA L A S S E S S M E N T
vital control body, attracting some of the most impor tant environmentalists of the time, including Russell Train and Gus Speth. Unfor tunately, today one would have to think hard to name anyone currently on CEQ, or for the last 10 years for that matter. It has been seriously downgraded. But during its early years, CEQ not only monitored the environment but also was required by law to make an annual repor t on the state of the environment in the US. These repor ts, from 1970 through 1990, have become collector’s items. They contain some ver y serious environmental thinking, establishing indicators and indices of the state of the environment in the countr y. These papers tell us that the environment was in bad shape in 1968 and 1969, then began improving. When CEQ was established, it was supposed to be an independent agency. That is no longer the case. The repor ting is now done by the affected agencies. For example, instead of having independent exper ts review what the Depar tment of Agriculture is doing concerning the environment, we have to take the depar tment’s assessment of its own performance, which can make its repor ts subject to question. The repor ts are still collated annually, but they are no longer dated with a par ticular year, and they are increasingly difficult for citizens to obtain. That renders them almost useless as a scholarly tool and indicates that recent administrations have put the environment, or at least environmental assessment, on the back burner. L ea rni ng t he T hre e “ E ’s ” The NEPA required project planning and decision making to include integrated consideration of the three “E’s”: engineering, economics, and environment. While now it may seem obvious, at the time the concept was quite revolutionar y and, as it turned out, hard to accomplish. What did the Depar tment of Agriculture know about environmental and social consequences? These were never par t of their brief. After a while, the big civilian agencies and the militar y establishment did learn their “E’s,” creating strange anomalies. The largest employer of landscape architects in the US, for instance, is the Army Corps of Engineers. It is interesting to see how the NEPA actually works in the real world. Under the NEPA, America’s national heritage must be safeguarded and promoted. In Michigan, for instance, the Army Corps of Engineers is assigned to maintain the locks of Lake Superior, which are considered par t of the national heritage. The installation also contains a museum. So the Corps, which formerly concentrated solely on militar y infrastructure, now has a historical division under a chief historian. The study of histor y, the upkeep of public museums, and the beautification of the locks are excellent and environmentally sound ways to spend tax money. The Corps is also par tnered with EPA in administering wetland development permits, which involves large amounts of detailed ecological research and knowledge. The NEPA “contains provisions that are intended to force” (Roger Findley and Daniel Farber, 2000) government agencies to do things according to the three “E’s,” but it was not easy. All of a sudden these agencies were required by law to take environmental inventories, do EIAs, and produce an environmental impact statement before they could put up a bridge or irrigate a field.
141
AN
IN TRO DU C TIO N TO
S U S TA I N A B L E
DEVELO PM EN T
If an agency is told by CEQ that its project might have a significant negative impact on the environment, it has to go back and reassess the project proposal and redo the environmental impact statement, then resubmit it to CEQ. This causes delays, but, as we will see, often saves money by avoiding projects or programs that would have proved disastrous. Impact studies are, if anything, comprehensive. The environmental impact statement for the Alaska pipeline consists of 22 volumes. Environmental impact statements for interceptor sewers in Boston are 14 or 15 volumes. Some think this is too comprehensive. Who wants to read 14 or 15, let alone 22 volumes? It has been suggested that perhaps 120 pages of clear prose would be sufficient. Th e N E PA ’s G o a l s The NEPA also set goals (Section 101, 42 United States Code, Section 4331). One was to achieve a balance between population and resource use that would permit a high standard of living. There were economic considerations, too, namely efficiency in resource use. Another goal was to enhance the quality of renewable resources by maximizing the recycling of resources that are being depleted. Again, this was quite revolutionar y, especially the par t that dealt with enhancing renewable resources. The US is one of the major consumers in the world of nonrenewable resources such as oil. In 1970, the countr y impor ted 40% of its petroleum needs. By 2003, the figure had climbed to almost 60%. Envi ro n m e n t a l Inve n t o r y – P rov iding the B aseline Data Under the NEPA, before a project or a program can be under taken, an environmental inventor y must be under taken (40 Code of Federal Regulations Section 1508.9) unless cer tain exemp tions apply, such as “Conflicts with statutor y obligations,” “Express statutor y exemption,” or “Functional equivalence of NEPA” with other statutes excusing an agency from taking action under NEPA (Linda Malone, 2003). This should consist of a complete description of ever ything that will be affected by the project. However, in reality, it includes only those items deemed impor tant as specified under the law. It is obviously impossible to include, for example, all the species and their numbers of ear thworms in a given region. (Actually, there is a nationwide biological sur vey under way, a census of ever ything alive. However, it will be a long time before useful data emerge.) The environmental inventor y is therefore limited, complying with a NEPA checklist that includes the physical, chemical, biological, cultural, social, and economic environments. Interestingly, the NEPA inadver tently revived some quite arcane professions. Archaeologists, for instance, used to be people who sat in dusty libraries and occasionally dug holes in the ground. The idea of archaeology becoming a boom profession was fairly remote. Today, archaeologists are in big demand. Now they spend a lot of their time two steps ahead of the bulldozers as they prepare studies for road projects and sewer pipelines. The same is true for botanists, agronomists, and geologists. Protection of endangered species is an activity that has received a great boost from the NEPA. In this regard, note the problems encountered in dealing with endangered and threatened species introduced into recently created environments. For example, the Salton Sea in California 142
E N V I RO N M E N TA L A S S E S S M E N T
contains brine shrimp, a threatened species. Recently created canals have leaked into the deser t, creating in par t a salty sea, to which sea gulls, or other travelers, have brought brine shrimps. Should these brine shrimp be protected when providing such protection can trump any other development? Taking drainage water from the Colorado River and California’s Imperial Valley to California has thus created a unique but major problem. The environmental inventor y provides the baseline data. The next step is to find out if the intended program or project is going to make things better or worse. In other words, how will it impact on the environment?
E NV I R O N M E N T A L I M P A C T A S S E S S M E N T The purpose of an EIA is to identify and evaluate systematically the potential impact of a project or program. Note that not just traditional projects but also programs are included. So the 401 Program of the Clean Water Act, enacted to protect the American wetlands, has to be examined from an environmental point of view. If the NEPA is to be enforced, all major under takings will have to pass environmental tests, even enterprises like space exploration and war equipment. Before the B1 stealth bomber went into production, it underwent a secret environmental impact study. Sometimes this methodology may be considered as going too far. One would not normally consider projects or trade programs under taken in some remote area outside of one’s countr y relevant, even if they are debilitating for that area’s environment. That environmental assessments have achieved almost universal acceptance was dramatically underscored when the People’s Congress Committee on Environment proposed EIA legislation for the PRC. The PRC has EIA laws that look ver y similar to those of the US, including public par ticipation in the formulation of environmental programs and projects. This suggests that good environmental policy is also good social policy. A single act like the NEPA is opening up democratic channels in nations that previously had only limited areas in which citizens were able to interact with, interfere with, or change policy. While the NEPA is a federal act in the US, most states have their own versions, which we will call NEPA-like laws. Many of the state environmental laws have to do with privately financed projects such as housing and golf courses. State laws also consider the size of a project. Obviously, the bigger the project, the closer the scrutiny. P ro j e c t A l t e rn a t i ve s ( In c l uding the No-B uild Option) Although the NEPA is decades old, implementation is still painful. A project proponent always believes that its proposed project will be beneficial. It is hard to point out that a multimillion dollar project will not work out from an environmental standpoint, especially when the degradation of the environment happens elsewhere or the impact seems miniscule. A famous example concerns the snail dar ter, an endangered species of fish in a remote area in the Tennessee Valley that stopped the Tellico Dam, a major construction project. When the requirements of the law could not be satisfied, Congress allowed the project to proceed, but only after much acrimonious debate. 143
AN
IN TRO DU C TIO N TO
S U S TA I N A B L E
DEVELO PM EN T
There are options, many of them “doable,” such as changing the size of a project or its location. The most painful of all is the “no-build” option. It is hard to tell a highway depar tment not to build a road. Building roads is what they do. Yet, because of NEPA-like laws, that is exactly what has happened. And that is why there is no major interstate highway linking a few of the key cities in the American nor theast. Ma in t a i ni ng L o ng -Te rm P ro ductiv ity Par t of an environmental assessment is to examine the relationship between local shor t-term use of the environment and the maintenance of long-term productivity. This is a sustainability issue. Not only do we worr y about what is going to happen to, say, an irrigation project, in the next 20 years, but we want to know if after 50 years the land is going to be so saline that it cannot be used. That is what happens if an irrigation project is not properly designed. It will work fine for 10, 20, or 40 years, and then all of a sudden the soil will become badly salinized and unfit for agriculture. Normally, looking 20 years down the road seems reasonable, but the NEPA requires an even longer view. The economic assessment also asks if there are any irreversible and irretrievable commitments of resources involved, and whether these are reasonable and plausible. We now see the sustainability issue coming to the fore. That there are long-term projects is obvious, but some must be considered in millenniums. In a recent federal cour t ruling, it was decided that Nevada could not block the use of Yucca Mountain as a nuclear waste repositor y, but the cour t ruled that EPA should assess and ensure the safety of the facility not for 20,000 years, which the EPA had proposed, but for 100,000 years! Sa t is f y i n g C E Q ’s R e qui re m e n t s It is CEQ’s job to assist the President with environmental concerns (NEPA S105, 42 U.S.C . Section 4342) but its “main responsibility…is to issue guidelines to interpret NEPA’s requirements” (L. Malone, 2003). When it was first formed, CEQ reviewed up to 2,000 environmental impact statements a year. Since then, the number has fallen to 400-500 a year. New projects are being implemented, but the agencies are doing things right. After a few years of living with the NEPA, people learned what they were supposed to do and understood the law. So many projects that would have been rejected were never star ted. It became a filtering process. If the numbers do not tell the whole stor y or a good stor y, they do tell us that people learn from their mistakes. Another reason for fewer reviews is that exclusions (categorical and noncategorical) have been built into the laws. The Army Corps of Engineers has about 18 categorical exclusions that do not require an impact statement. Most exclusions deal with land tract transactions, transferring land from the private sector to the public domain. Another exclusion relates to the Corps renovating its own infrastructure. Even though many of the Corps’ projects are free from NEPA oversight, the Corps set up its own internal mechanisms to evaluate the environmental impact of the cumulative effect of these individual projects and to make sure they will not cause problems.
144
E N V I RO N M E N TA L A S S E S S M E N T
Most significant projects fall under the categor y of noncategorical exclusions and need to be assessed (L. Malone, 2003). If a Finding of No Significant Impact is awarded by CEQ, then the project can proceed immediately. If there is a significant impact anticipated, then the project has to be revised, resubmitted, significantly altered, or abandoned. Many projects have to go through this procedure several times. CEQ is not a rubber stamp. A ss e s s m e n t R ev i ew Ba s e d o n Policies, Plans, Prog r ams, and Projects Let us examine the assessment procedures for a proposed road, assuming it has already passed the “no-build” criteria (Figure 5-1). Four levels of government are involved: national or federal, regional or state, subregional, and local. For each of the four levels of government, there are four categories: policies, plans, programs, and projects. The first three need a strategic environmental assessment (SEA); the four th categor y, projects, calls for an environmental impact study (EIS). As the process moves down to the regional, subregional, and local levels, the impact statements must become more specific. For instance, when the federal government mandates a five-year road-building program, the builder simply has to show that the road network will do no harm. But at the subregional and local levels, the builder must not only repor t on the environmental impact that the roads will have, but must also demonstrate how the project will benefit the local economy and infrastructure. This type of action and assessment review is widely used in many countries that not only consider projects, but also look at policies, plans, and programs as par t of environmental impact assessment. Figure 5-1. Actions and Assessments within a Broad EIA Framework Category of actions and type of assessment (in parentheses) Level of government
Level-use plans (SEA)
National/federal
National land use plan
Sectoral and multisectoral actions Policies (SEA)
Plans (SEA)
Programs(SEA)
Projects (EIS)
National transport policy
Long-term national roads plan
5-year road building program
Construction of motorway section
National economic policy Regional/state
Regional land use plan
Subregional
Subregional land use plan
Local
Local land use plan
Regional strategic plan Subregional investment program Local infrastructure project
Source: Canter (1996), p.19.This is a simplified representation of what, in reality, could be a more complex set of relationships. In general, those actions at the highest tier (i.e., national policies) are likely to require the broadest and least detailed form of SEA.
145
AN
IN TRO DU C TIO N TO
S U S TA I N A B L E
DEVELO PM EN T
S t ren gt h e n i n g E f fo r t s : A D B a nd the Wor ld B ank ADB and the World Bank are two publicly owned institutions that do a great deal of project work around the world. These two institutions and many others, including bilateral agencies such as USAID, have been under fire for a long time for not doing as good a job on environmental issues as have some of the private banks that lend to developing countries. Par t of the problem relates to the nature of development banks such as ADB and the World Bank; they are basically banks, and their traditional function has been to lend money. Once there was the view that it was primarily the responsibility of the borrower to use the money wisely. This form of reasoning, though, is simplistic. Obviously, multilateral development banks (MDBs) should worr y about how the money will be used. If the projects they are being asked to fund promote sustainable development, then the loans should be easy to access. If any of these projects would significantly impact the environment negatively, the loan should be denied. After being severely chastised for their par ticipation in projects like the Narmader Dam in India, under pressure from their shareholders, the World Bank tightened up its environmental requirements. Since the mid-1990s, both banks have made serious effor ts to rectify the situation, as have the Inter-American Development Bank (IADB) and many smaller development banks, and at least the major privately held development banks. By contrast, some private lending institutions are sometimes happy to step in, requiring only fiscal responsibility on the par t of the borrower. Some countries employ selective borrowing. When they need loans for controversial projects or environmentally damaging projects, they go to private banks that lend funds while taking few steps to ensure implementation of guidelines and regulations arising from environmental considerations and social dimensions. At the same time, these countries have billions of dollars in their accounts at the World Bank, sitting unused. One could say that these are poor countries that need money, but they do not need money so badly as to allow the World Bank to tell them what may sometimes be difficult to do. Con trove rs y ove r L aw s The NEPA and its sister legislation, the Endangered Species Act (16 United States Code Sections 1531-1544, 1988; L. Malone, 2003), are not without their critics. Many feel that following these stringent laws to the letter slows down progress. There is no question that agencies administering these two acts are under a great deal of pressure. If proponents have their environmental impact statement turned back, they are in serious trouble in the sense that they either have to reformulate the project or abandon it. The only other choice is litigation. However, the original intent of the acts was not to become involved in endless litigation. The idea was to help improve the performance of government and introduce more democratic par ticipation in decision making. Besides, if a project is slowed down, perhaps it deser ves to be. Thinking and then doing is always better than doing and then thinking later. A good example is the proposed Dickey-Lincoln Dam project. If it had gone ahead, it would have flooded a huge area of Maine just to produce a small amount of electricity. Here is where the value of assessment comes in. A study showed that it would have been better to have a small wood-fired power plant 146
E N V I RO N M E N TA L A S S E S S M E N T
and chop down some of the trees than to flood a huge area and lose so many more trees. This is an example of an EIA that was doing exactly what it should.
P RO J E C T C A T E GO R I E S B A S E D
ON
E NV I R O N M E N T A L I M P A C T S
The type of scrutiny a project receives depends upon its impacts, categorized as A, B, or C by ADB and the World Bank. These are the broad categorizations; but projects are fluid, and a project that star ts out as a B may end up a C after an environmental evaluation is made. • Category A projects are those deemed to have significant environmental impacts calling for in-depth studies. One example would be forestr y. Extensive alterations of forested land change the whole ecosystem in an area because they affect the flora and fauna in a major way. Other Categor y A projects include irrigation, large-scale new water source development, large water impoundments, new railways and mass transit, and por ts and harbors. Medium- and large-scale thermal power plants also fall under Categor y A, because they affect water and air quality and may rely on nonrenewable resources as fuel. • Category B projects have less environmental impact. They include agricultural industries, smallscale water projects, small processing industries, harnessing of renewable energy, small power plants, watershed development and rehabilitation of watersheds, and water supply without impoundment. • Category C projects are unlikely to have a significant adverse environmental impact. Many of these under takings, while large, are sur veys or teaching projects such as forest research and extension programs and agriculture programs, where exper ts help the indigenous populations to do a more efficient job. Other programs like primar y and rural health sur veys, and geological and mineral sur veys (but not mining) are Categor y C projects, as are education, family planning, and some other physical planning projects. Many of these projects are not necessarily small in scope and may have budgets of $100 million or more.
IMPACT IDENTIFICATION METHODS The methodology used to make a scientific environmental analysis is quite complex and often unwieldy. (See L. Canter, 1996, for details.) Ma tri c e s The simplest way is to lay out the pros and cons of a project in a matrix, of which several types have been devised. (See Table 5-1.) An early model called the Leopold Matrix, developed by Dr. Luna Leopold and his colleagues at the US Geological Sur vey (Leopold et al., 1971), sets up, in columns and rows, the actions causing an environmental impact and the environment impacted 147
AN
IN TRO DU C TIO N TO
S U S TA I N A B L E
DEVELO PM EN T
Table 5-1. Concept of an Environmental Baseline Matrix Identification Environmental elements/units
Evaluation Scale of importance 1 2 low
3
4 5 high
Scale of present condition 1 2 low
3
4 5 high
Scale of management 1 2 3 4 5 low high
Biological: flora fauna ecological relationships Physical-chemical: atmosphere water earth Cultural: households communities economy communications Biocultural linkages/units: resources recreation conservation
Source: Canter (1996), p. 78
upon. It has 90 rows and 100 columns, and each cell is divided into two par ts—one for the magnitude of the impact, and the other for the impor tance of the impact—both scaled from 1 to 10. The problem is, if a project involves a tropical rainforest, it might have something like 18,000 entries in the matrix. Take just one species. There are hundreds of actions that could impact upon it, and the magnitude of each and how impor tant each is to ever ything else have to be figured out. Step matrixes are better, because they feature a matrix with connections to another matrix, which cascade until the data are complete. The idea in all these matrixes is to form a baseline for per tinent data: biological, physical, chemical, cultural, biocultural, and so on. The scale of impor tance, scale of present condition, and scale of management are according to numbers. However, the assignment of values becomes a judgment call and therefore loses scientific validity. There is also the problem of the quantity of data. No one can read and digest the data contained in a filled-out Leopold Matrix. The best one can do is arrive at the conclusion that a lot of facts and figures were collected and choose those that help one’s case. Enviro nme nt a l Impa c t P re di c t ion Techniques Most data used come from technical research. Air pollution is a good example, because it has been extensively studied, and the people working on measuring air pollution have done a good job. They have created urban statistical models, receptor models, and box models. Other investigators have created quantitative models (see Figure 5-2) to study surface water, point and nonpoint waste loads, aquaculture water quality, and waste load allocations. 148
E N V I RO N M E N TA L A S S E S S M E N T
EPA has sponsored much of this research, and so there are models that can actually be applied to groundwater, pollution source sur vey, soil and groundwater vulnerability indexes, leachate testing, individual source propagation models, statistical models of impact, and noise impact indices. Noise pollution is an interesting environmental problem. There are many models for testing noise level. Although the health factors of noise are generally not as serious as the health factors associated with water quality, people seem more aware of noise; so it often gets more attention. New York City has proposed noise abatement legislation to limit the allowable decibel count on construction equipment, including jack hammers, and has changed traffic patterns in residential neighborhoods. Similarly, many cities, including New York, have altered flight paths to reduce airplane noise on take-offs and landings over populated areas. Biological, historical, and visual techniques can predict decibel levels on a given project before it is built. Today, using vir tual reality software, computers allow us to measure noise and sound suppression techniques before a structure is ever built. But prior to the advent of sophisticated computer programs, engineers and scientists were already dealing with noise abatement. Before a major American limited access road was begun, scientists and acoustical engineers built a model road. Using the model and computer projections, they could predict traffic patterns and usage. Being able to “see” any por tion of the highway under any conditions, day or night, allowed the engineers to create indexes and make necessar y changes. Today’s powerful computers permit drive-throughs and walk-throughs in vir tual reality, allowing scientists and engineers to easily and accurately prod, poke, measure, and assess projects while they are still on the drawing board.
E NV I R O N M E N T A L I M P A C T A S S E S S M E N T P R O C E S S The EIA process follows the fate and transpor t of pollutants through the various par ts of the ecosystem. It begins when a pollutant is released into the air, water, or soil. The factors to be considered are the nature of the pollutant, the nature of the environment, the distribution of the pollutant, and how it will be distributed. We also want to know how it will affect the population. So it is a linear process of emission, transpor t, and dispersion, plus impacts on the receivers—the factors to be measured and assessed. We also have to assess exposure or the level of danger. To simply say the quality of the air is bad is not enough. We want to know who is exposed, how many people will be affected, and at what level of exposure. We also want to know what the causes are, and what will be the effects. Because of the complexity of the problem, the solutions are quite difficult. St o p p i n g Po l l ut i o n a t t h e S o urce Often site A can be polluted by activities in region B, but B is somewhere else entirely— maybe even in another countr y. Lake Superior is heavily polluted by mercur y, but a quick assessment shows there is no mercur y near the lake. So where is the pollution coming from? It is being transpor ted by the wind from farmlands far ther west, where the soil is treated with a phosphate-based fer tilizer that contains mercur y. Mercur y is also found in significant quantities 149
AN
IN TRO DU C TIO N TO
S U S TA I N A B L E
DEVELO PM EN T
Figure 5-2. Fate and Transport of Trichloroethylene
Suspended sediment .) 200 2 : C o n fe re nc e o n F i na n c i ng for Development, M onterrey Leaders from developing and developed countries discussed matching commitments and action at the 2002 International Conference on Financing for Development in Monterrey, Mexico, so that political and economic reform by developing countries would be suppor ted by developed countries in the form of aid, debt relief, investment, and trade. The heads of states and governments declared: “We…have resolved to address the challenges of financing for development around the world, par ticularly in developing countries.” Since that conference many of the problems of financing remain. 161
AN
IN TRO DU C TIO N TO
S U S TA I N A B L E
DEVELO PM EN T
2002: World Summit on Sustainable Development, Johannesburg In August and September of 2002, the largest gathering of heads of states and governments and delegates from countries around the world – both developing and developed—met in Johannesburg, South Africa, to work out a plan of action to save planet Ear th from unsustainable development. The heads of states and governments signed a political declaration making a commitment to the achievement of sustainable development. The conference delegates agreed upon a “Plan of Implementation” introducing actions including pover ty reduction, changing unsustainable patterns of consumption and production, protecting and managing the natural resource base, meeting the challenges of globalization, and protecting human health.
R EV I S I T I N G C O M P L EX I S S U E S While the conferences and summits elicited a multitude of promises and pledges, accompanying action and the required financial resources did not seem to be for thcoming. The situation necessitated revisiting the complex issues to begin redressing the problem. The environmental policies and legislation that were initiated in the 1970s after the Stockholm Conference were reviewed: (i) to make them enforceable in practice, and (ii) to address the issues of pover ty, trade, financing, and other matters related to the entire environmental picture. S u st ai n a bl e D eve l o pme nt Po l i cy Defined One crucial area that is missing in the UN’s list of issues is a sustainable development policy. What is a sustainable development policy and how is it defined? The book Our Common Future, based on the Brundtland Repor t, defined sustainable development as “ensuring that it meets the needs of the present without compromising the ability of future generations to meet their own needs.” Sustainable development policy comprises institutional and environmental safeguards that will protect the environment and the economy as a whole, as well as another set of guidelines and principles on economic and social sustainability. Each of these policy components, in turn, will rest on different sets of policies as depicted. I n st itut i o na l S a fe gua rd s Many feel that the most impor tant of the four principles of sustainable development is institutional safeguards, because it enables the other three (economic sustainability, social sustainability, and environmental safeguards) to be in place. Institutional safeguards consist of good governance, disclosure of information, anticorruption, and inspection policies. Many of the countries of the world have problems of rampant corruption. According to an International Monetar y Fund (IMF) repor t, as much as 10% of the GDP of a countr y is wasted by corruption. As a countermeasure, the World Bank and ADB have set up policies on anticorruption and inspection. According to their inspection policies, a project can be stopped, even if it has been approved, if the stakeholders make a complaint about violation of some of the policies of the institution financing it.
162
E N V I RO N M E N TA L
M AN AG E M E N T: TREN DS AN D
PO LIC IES
Env i ro nme nt a l S a fe g u a rds Environmental safeguards integrate environmental dimensions into a development project at the planning stage. An EIA is a mandator y requirement for many major development projects. Monitoring has also become mandator y so that a project’s adherence to its stated goals is obser ved. Ec o n o mi c a nd S o c i a l S u s t a i n ability Economic sustainability depends on a set of sector policies in various areas, including energy, forestr y, water, agriculture, and fisheries. Some of these sector policies are discussed in this chapter. Social sustainability hinges on such policies as gender, involuntar y resettlement, indigenous people, cooperation with NGOs, and pover ty reduction. These social policies are addressed in Chapter 8. To make development sustainable, social and economic sustainability policies must go hand-inhand with the policy on environmental and institutional safeguards.
S E C T O R PO L I C I E S C O N C E R N I N G
THE
E NV I R O N M E N T
As stated earlier, environmental management implies management of development activities within the assimilative capacity of the environment. Consequently, an environmental policy comprises an umbrella policy related to monitoring the overall environment, setting environmental standards, and setting policy and guidelines for EIA. Beyond this, environmental policy essentially comprises a set of sector policies on the environment. For the purpose of illustration, three sector policies for environmental sustainability will be considered: water, energy, and forestr y. Wa t e r Pol i c y Table 6-1 is a summar y of the state of the world’s water supply. It shows that (i) on a per capita basis, availability of fresh water in this world is lowest in the Middle East and Nor th Africa, followed by South Asia; (ii) the percentage of population having access to an improved water source is lowest (55%) in Sub-Saharan Africa; and (iii) agriculturally, the percentage of fresh water is ver y high (from 63%-93%), the highest (93%) being in South Asia. Six unique characteristics of water as a sector must be noted before an effective water policy can be developed. The first is water’s unitar y nature. Water is a peculiar commodity because it is a liquid compound of oxygen and hydrogen (H 2O) that is absolutely essential to maintain life, ecosystems, and agricultural and industrial activity. Its unitar y nature implies that it can be easily substituted from one source to another. Second, water is not distributed equally over the globe. It is highly variable in location, and its location is in natural hydrologic units that do not necessarily follow geographical boundaries. Third, water is a diversified sector in terms of both supply and demand. On the supply side are surface water, groundwater, rainwater, and seawater. On the demand side water is provided for drinking, sanitation, irrigation, drainage, navigation, fisheries, and hydropower generation. The four th characteristic is related to the second one: water has a
163
AN
IN TRO DU C TIO N TO
S U S TA I N A B L E
DEVELO PM EN T
highly multidimensional institutional framework. At the national level, even if there is a ministr y dealing with water, it is a sector dealt with by several—ministries—fisheries, agriculture, shipping and navigation, health (for the domestic water supply), and energy. Fifth, water is not a simple economic good; sometimes it exhibits the attributes of a public good and sometimes that of a private good. Within a hydrologic unit, fresh water may be limited, but almost any quantity can be traded between users and uses, or it can be impor ted from another hydrologic basin, at a cost. And, finally, water has ver y impor tant cultural, religious, and political dimensions. Most ancient civilizations originated along riverbanks. In Thailand, water is worshipped during the Songkran and Loy Krathong festivals. In India, the Ganges is sacred; bathing in the Ganges, even though it is polluted, is believed to clean people spiritually as well as physically.
Table 6-1. State of the World’s Water Supply
REGION
Improved Water
Agricultural
Freshwater
Source
Withdrawal
Population
Resources per
(% of total
(% of freshwater
in 1999 (million)
Capita (m3)
population)
water withdarawal)
World
5,978
8,240
81
70
East Asia and Pacific
1,837
-
75
80
South Asia
1,329
2,854
87
93
474
12,797
90
63
508
27,919
85
74
290
1,145
89
89
643
8,248
55
87
Europe and Central Asia Latin America and Carribean Middle East and North Africa Sub-Saharan Africa
Source: Based on World Bank data (2000)
Based on these characteristics, ADB has developed a water policy for Asia (see http://adb. org/Documents/Policies/Water/default.asp?p=wtrrefs), the core elements of which are as follows: • Promote effective national water policies and action programs. • Invest in water resource management in priority river basins. • Improve water ser vices through autonomous and accountable providers. • Foster the efficient and sustainable use and conser vation of water in society. • Increase the mutually beneficial use of shared water resources within and between countries.
164
E N V I RO N M E N TA L
M AN AG E M E N T: TREN DS AN D
PO LIC IES
• Facilitate stakeholder consultation, par ticipation, and par tnerships. • Improve governance through capacity building, monitoring, and evaluation (http://www.adb.org/ Publications/product.asp?sku=010796). Although a water policy should address the main issues related to the water sector in a given countr y or region, these core elements are usually common to all situations. En e rg y Po l i c y Table 6-2 presents a summar y of global energy use and its consequent CO 2 emissions. In terms of global energy use and its impact, a few obser vations can be made: (i) in terms of per capita use of commercial energy, Europe and Central Asia top the list with 2,637 kg of oil equivalent emitting almost 3.3 million kilotons of CO 2 ever y year. This translates into 6.9 metric tons per capita of CO 2 emission, the highest in the world.
Table 6-2. Global Energy Use and Air Pollution
REGION World East Asia and Pacific South Asia Europe and Central Asia Latin America and Carribean
Commercial Energy Use
Percent of
Population
per Capita
Electricity
Total CO 2 Emissions,
Emissions,
in 1999 (million)
(kg oil equivalent)
Generated from Coal
Industrial (1,000 kt)
per Capita (metric tons)
CO 2
5,978
1,659
38.4
23,868.2
4.1
1,837
857
61.2
5,075.6
2.8
1,329
445
64.7
1,200.5
0.9
474
2,637
30.3
3,285.6
6.9
508
1,183
4.7
1,356.4
2.8
290
1,344
1.8
1,113.6
4.0
643
700
71.2
501.8
0.8
Middle East and North Africa Sub-Saharan Africa
Source: Based on World Bank data (2000)
165
AN
IN TRO DU C TIO N TO
S U S TA I N A B L E
DEVELO PM EN T
Essentially there are at least nine core environmental elements of a sound energy policy. These are • Tackle environmental issues before they occur. • Utilize high-grade (low-sulfur) coal for energy supply. • Practice coal washing at the mines. • Under take large-scale afforestation programs to create carbon sinks as well as to enhance the fuelwood supply. • Develop nonconventional sources of energy (solar, biomass, wind, etc.). • Continue development and research on the technologies of nuclear power, nuclear fusion electricity, and fuel cells. • Practice demand-side management by energy conser vation in industrial, commercial, and residential installations. • Put a fair price on energy and withdraw energy subsidies. • Secure energy installations. The mission statement of the World Bank Group’s Energy Program (2002) concerning Pover ty Reduction, Sustainability and Selectivity “suppor ts” the “objectives of reducing pover ty and increasing sustainable economic growth in developing and transition economies.” To achieve these objectives, “sustainable and affordable energy services” need to be provided “for all, including the poor, and… these services can best be provided by creating efficient markets in energy—markets that are open to investors and enterprises, both large and small, private and public, centralized and decentralized.” The mission statement closes by indicating that “expansion of access to energy services for the poor needs to be based on markets that function on sound commercial principles and on the preservation of the environment.”
• • • • •
The key elements of the ADB energy policy are pover ty reduction (impact of energy ser vices on the poor, approach to rural energy, approach to subsidy). private sector par ticipation and sector restructuring (public sector monopoly, hydrocarbon subsector restructuring, power subsector restructuring, energy pricing, good governance). regional and global environmental impact (acid rain, greenhouse gas abatement, renewable energy use). regional cooperation (regional energy trade, expor t-oriented power projects). impact of financial crisis (impact on energy demand and investment, role of build-operatetransfer projects).
Fores t r y Po l i c y The world’s forested areas are in a state of lux (Table 6-3). Global tree cover is deteriorating rapidly and needs attention. The world has 38.6 million square kilometers of forest comprising 29.7% of the total land mass. Most of the forests are found in two regions: Europe and Central Asia, and Latin 166
E N V I RO N M E N TA L
M AN AG E M E N T: TREN DS AN D
PO LIC IES
America and the Caribbean. Currently, the annual rate of deforestation in Europe and Central Asia as well as in the Middle East and North Africa is –0.1%, and in Latin America and the Caribbean, 0.5%. In 2000, both regions had roughly an equal amount of forested land, which was approximately 9.4 million square kilometers each. However, at the prevailing rate of deforestation, Latin America and the Caribbean will soon be trailing far behind Europe and Central Asia. Once again, as could be expected, the most precarious condition is found in the Middle East and Nor th Africa, which account for only 168,000 square kilometers of forest area out of the world total of 38,609,000 square kilometers. South Asia has the lowest percentage (16.3%) of forest area as a percentage of the total land area. Table 6-3. State of World’s Forests
REGION World East Asia and Pacific South Asia Europe and Central Asia Latin America and Carribean
Forest Area as % of Total Land
Annual Rate of Deforestation
Forest Area (1,000 km 2 )
Forest Area per Capita (km 2 )
5,978
38,609
0.006
29.7
0.2
1,837
4,341
0.002
27.2
0.2
1,329
782
0.0006
16.3
0.1
474
9,464
0.02
39.7
-0.1
508
9,440
0.02
47.1
0.5
290
168
0.0006
47.1
-0.1
643
6,436
0.01
27.3
0.8
Population in 1999 (million)
(%)
Middle East and North Africa Sub-Saharan Africa
Source: Based on World Bank data (2000)
Some of the many causes of forest destruction and degradation follow. 1. Destructive logging The first and most obvious issue in any discussion of deforestation is excessive and destructive logging. Some estimate that 4.4 million hectares of forest is logged annually just to satisfy the timber needs of Europe, Nor th America, and Japan. Japan has a forest cover of 67%, possibly the highest of any countr y in the world. Yet Japan is impor ting timber and other forest products from Southeast Asia and the Pacific in order to keep its forests intact. While this is a good national forestr y policy for Japan, it has negative consequences on the state of forests in Asia and the Pacific region. 167
AN
IN TRO DU C TIO N TO
S U S TA I N A B L E
DEVELO PM EN T
2. Crop and livestock expansion The second reason for the disappearance of the forests is crop and livestock expansion. The World Bank estimates that expansion of crops and livestock is destroying 70% of the forests in Africa, 50% in Asia, and 35% in Latin America. Africa still has much of its forest intact, mainly because of its small population in a very large land area. In many countries of the world, large aquaculture farms (especially shrimp farms) and the charcoal industry are depleting the mangrove forests. This is a dangerous move, since mangroves are a first line of defense against typhoons. In Bangladesh, for instance, since the coastlines have been cleared of mangrove forests, deaths related to storms along the coast have dramatically increased. In November 1970, an estimated 300,000 people living along the coast died during one major storm (http://www.disastercenter.com/disaster/TOP100K.html). Roads through forestlands are another danger. Once a road is built through a forest, it opens the forest to other activities. When mid-sized hydroelectric power plants were built in the PRC and Indonesia, all the construction materials were brought in by helicopter. Had roads been built through the forests to reach the sites, they would have become a permanent invitation to loggers and poachers. Increased migration by rural populations into forested lands is another issue that should be examined. People clearing the forests for cultivation, fuel wood, and fodder is understandable, but not necessarily benign. Governments are also culpable for deforestation. Tenure for large logging companies, low taxes, tax relief, plus pricing policies favorable to removal of the forest are encouraging institutional logging. Environmentalists say that government-based conversion of forests to other forms of land use is one of the leading causes of deforestation. 3. Lack of ownership Another issue is ownership. Who owns the forests? Why are forest communities reluctant to invest their time and money in forest management? One would think that, since the forest is the main source of their income and livelihood, protecting it would not only make sense, but would be their only choice. Yet they do not, because these communities do not have any sense of ownership, since the forests belong to the government and are not common proper ty resources. 4. Forest fires Forest fires, both caused and naturally occurring, such as destructive wildfires, are major environmental issues in the US. In an Indonesian forest, a carelessly star ted fire created a smoke haze throughout Southeast Asia in 1998. Exper ts believe that the unprecedented floods in the PRC and Bangladesh in 1998 were caused by the destruction of upstream forests due to one reason or another, including forest fires. Some of the environmental issues that must be considered in formulating forestr y policy are as follows:
168
E N V I RO N M E N TA L
M AN AG E M E N T: TREN DS AN D
PO LIC IES
1. Forest zoning regulation One core issue is the need for forest zoning regulations that differentiate between production forests and protection forests. The principle is similar to urban zoning. A protected forest cannot be harnessed for human use; a production forest is where timber can be felled on a sustainable basis. 2. Impact of intersector development The second issue recognizes the impact of intersector development on the forestr y sector. There are competing demands for crop production, par ticularly cash crops; for human settlements; for expansion of industries; and for commercial areas. 3. Access to timber resources The third core issue is restricting access to timber resources. This policy element will hopefully require the people who hold forest leases to bear the full cost of timber production, including the cost of timber, forestr y management and maintenance, and environmental conser vation. However, in practice the full cost has never been realized from the lessees of the forest. Hopefully, this policy element will encourage the growth of high-yielding marketable trees in selected degraded lands. The Lao People’s Democratic Republic (Lao PDR) has an area that is a degraded slope. The government is using this land to build an industrial plantation that will grow wood for commercial use and for fuel. This should take the pressure off the countr y’s primar y forests. 4. Public consultation The four th core issue is the need for public consultation on forestr y development with the affected people, local communities, and NGOs prior to financing any forestr y projects. Consultations should be designed to explain the purpose of the development and to make the par ticipants feel that they are par t of the decision-making process. Shared ownership allows the people a stake in a project that the government is under taking. 5. Active role of forestry agencies Reorienting forestr y agencies to play an active role in the planning and management of forests is another issue regarding forestr y policy. Too often botanists manage forests purely from the viewpoint of their discipline; they think that the only issue is the number, variety, and growth rate of the plants that make up the forest. What they fail to consider is the interaction between the forest and the forest dwellers, whether they be human or wildlife. These forest managers also fail to distinguish among different types of forests. For example, a mangrove forest has a primar y productivity many times more than that of an upland forest. Yet in many countries, the same group of people, using the same guidelines as for upland forests, manages mangrove forests. The answer is to form an interdisciplinar y panel comprised of people who know about not only the forest but also the forest dwellers and the interaction between the forest and the ecosystem. These are the people who should be put in charge of forest planning and management.
169
AN
IN TRO DU C TIO N TO
S U S TA I N A B L E
DEVELO PM EN T
Figure 6-1. Institutional Framework for Environmental Management
• • • •
Umbrella Policy/A Statement on Environment Environment Protection Act EIA Policy and Guidelines Coordinating and Assisting in Formulation of Sectoral Policies and Legislation • Monitoring and Assessment
• Energy, Transport, Water, Agriculture Sectoral Policies • Water Pollution, Air Pollution, Land Management, Biodiversity, Conservation, etc.
Figure 6-2. World GDP Growth
US$ trillion
World GDP, 1995$
Low- and middleincome countries High-income countries
1970
2000
Source: The Economist (July 6-12, 2002), p.4, quoting World Bank
170
2015
2050
E N V I RO N M E N TA L
M AN AG E M E N T: TREN DS AN D
PO LIC IES
E NV I R O N M E N T A L I M P A C T A S S E S S M E N T (EIA) Whether an impending project will involve forestland, water, or air, to find out what its impact will be one must do an EIA. In most countries this assessment is required by law. The formulation of law and policy related to EIA is the overall responsibility of the environment ministr y or agency and constitutes a par t of the umbrella environment policy. P ro j e c t C l a s s i f i c a t i o n The multilateral development banks (World Bank, ADB, African Development Bank, and IADB) classify projects into three categories: • Categor y A: projects with significant environmental impacts as predicted by an Initial Environmental Examination (IEE); • Categor y B: projects with adverse environmental impacts, but of less significance than those in Categor y A; and • Categor y C: projects unlikely to have adverse environmental impacts. (See Chapter 5 for details.) Preparing the EIA A typical summar y EIA repor t can run from about 13 to 20 pages. It begins with an introduction to the project (1/2 page) and contains topics like anticipated impacts and mitigation (4-6 pages), alternatives (2-4 pages), cost-benefit analysis (2-4 pages), and a conclusion (1 page). Figure 5-3 in Chapter 5 illustrates where the EIA fits into the overall project cycle. The project star ts from developing a concept and under taking a prefeasibility study. Then a full feasibility study is carried out, and design and engineering studies are under taken. Finally, the project is implemented. Monitoring and evaluation of the project follow. The results of the evaluation become data that are fed back into a new project cycle. During this project cycle, the activities are matched up against the EIA. At the concept stage, during site selection, an environmental screening is done to make an initial assessment. It is necessar y to draw up a qualitative list of significant issues that might be involved in the project. Based on the list, one can make some preliminar y assessments. Following the prefeasibility study, a detailed assessment of significant impacts is made, and identification of mitigation measures is done. For a Categor y A project, this entails significant documentation. In the detailed design of mitigation measures, it is not enough to identify the environmental issues and problems. It is also necessar y to identify the steps that will be taken toward solving these problems. After implementing design and engineering data, the implementation of mitigation measures and environmental management strategies must be fed into the project cycle. These must be specific as to what kind of environmental management strategies should be built into the project. Finally, there will be monitoring and postauditing lessons for future projects. For fur ther discussion on EIA, please refer to Chapter 5.
171
AN
IN TRO DU C TIO N TO
S U S TA I N A B L E
Exports, Trillion US$
Figure 6-3. World Exports
Source: Bjørn Lomborg (2001), p.8
Percent served in the developing world
Figure 6-4. Access to Water in the Third World
Drinking water
Sanitation
Broken lines are different estimates. Solid lines are better fit
Source: Bjørn Lomborg (2001), p.22
172
DEVELO PM EN T
E N V I RO N M E N TA L
M AN AG E M E N T: TREN DS AN D
PO LIC IES
Figure 6-5. Infectious Disease Death Rates 450 400
Rodolfo A. Bulatao Christopher J.L. Murray
Deaths per 100,000
350
and Alan D. Lopez
300 250 200 150 100 50 0 1970
1980
1990
2000
2010
2020
Source: Bjørn Lomborg (2001), p.26
Figure 6-6. Infant Mortality
Infant mortality per 1,000
180 160
World
140
More developed Less developed Sub-Saharan Africa
120 100 80 60 40 20 0 1970
1980
1990
2000
2010
2020
Infant mortality per 1,000 live births. Prediction from 2000. Source: Bjørn Lomborg (2001), p.55
173
AN
IN TRO DU C TIO N TO
INSTITUTIONAL FRAMEWORK
FOR
S U S TA I N A B L E
DEVELO PM EN T
E NV I R O N M E N T A L M A N A G E M E N T
Figure 6-1 suggests the institutional framework in which an environment ministr y or agency works within a government. It is not always easy for one such environmental ministr y to influence the actions of many other ministries and agencies. Even if legislation and/or regulations are in place, the integrity of the prosecutorial and judicial systems may be tested in the implementation of environment policies.
A C H I EVE M E N T S
IN
E NV I R O N M E N T A L M A N A G E M E N T
There has been a lot of activity between the 1970s and the present regarding the economic development and rehabilitation of the environment. Between 1970 and 2000, world GDP grew from $10 trillion to $40 trillion. By 2050, according to World Bank projections, it is going to reach $138 trillion (Figure 6-2). Similarly, world expor ts grew from $0.5 trillion in 1970 to $6 trillion in 2000, a growth factor of 12 (Figure 6-3). Access to safe water in the developing world also increased, though not as significantly (Figure 6-4). In 1970, 30% of the population in the developing world had access to safe water ; in 2000, the figure was 80%. Unfor tunately, the numbers for sanitation did not keep up, even though sanitation coverage doubled in the target years, from 22% to 44%. Although more than half of the developing world population still does not have access to such facilities, death rates from infectious diseases have gone down significantly, from 450 per 100,000 to only 150 per 100,000 (Figure 6-5). Likewise, infant mor tality decreased from 160 per 1,000 to 25 per 1,000 (Figure 6-6). Life expectancy at bir th now stands at 60-70 years, and gross enrollment in secondar y schools increased from 20% to 60% (Figure 6-7). These numbers indicate that, on the whole, human civilization has done ver y well in terms of economic growth, expor ts, health, water supply, and sanitation coverage. However, the world needs to do much more, par ticularly in the areas of environmental pollution, natural resources degradation, and social equity.
PE O P L E ’S PE R C E P T I O N
OF THE
E NV I R O N M E N T
It is impor tant to find out how people perceive their environment. In 1992, a worldwide poll called Health of the Planet was taken in 12 developed and 12 developing nations. The respondents were asked to rate the environment in their local community, their nation, and the world. The results, except for one or two surprises, were what one would expect (Figure 6-8). In the developed countries, most of the respondents felt that their local and national environments were not too bad, but the global environment was in trouble. The big surprise was Japan, where more than 50% of the people felt that the national environment was bad. That was the same number posted by the Philippines.
174
E N V I RO N M E N TA L
M AN AG E M E N T: TREN DS AN D
PO LIC IES
Figure 6-7. Better Lives—Past 30 Years
IMPROVEMENT
Worldwide improvements for the past 30 years
life expectancy at birth
infant mortality rate, per 1,000 live births
under-5 mortality rate, per 1,000 live births
undernourished people, m
adult literacy rate, estimated %
primar y
secondary
gross enrollment ratio, %
children not in school estimated, m
Source: UNEP (2002), p. 33
Figure 6-8. Environment Quality: Public Evaluation
Percent of respondents who evaluate environmental quality as very bad or fairly bad for community, nation, and world
Local Community Nation World
Source: Bjørn Lomborg (2001), p.35 175
AN
IN TRO DU C TIO N TO
S U S TA I N A B L E
DEVELO PM EN T
On the other hand, all the developing nations felt that their local and national environments were bad. In the case of India, Republic of Korea, and Russia, the people felt their national environment was worse than the global environment.
W HY
IS THE
E NV I R O N M E N T B A D ?
The question is, despite all the progress and achievements in economic growth, human health, and so on, why is it that the environment is perceived to be so bad globally, and in developing countries nationally and locally as well? There are two possible explanations. Ec ologi c a l T hre s ho l d The first explanation relies on a modified version of Kuznets’ Cur ve. The traditional Kuznets Cur ve suggests that, as income per capita grows, environmental degradation initially increases up to a cer tain point, beyond which the environmental situation improves. There is, however, a concept called “ecological threshold,” which says that if the environmental situation deteriorates beyond a threshold, the process becomes irreversible. At that point, the environmental conditions cannot be reversed, or improved (see Figure 1-1). In a situation where subsidies for energy or water are removed, proper ty rights are well defined, and externalities are internalized, coupled with better environment policies, the Kuznets Cur ve will lie below the ecological threshold. Professor Theodore Panayotou, then of HIID, discovered that if the annual income level in the developing countries is between $5,000 and $7,000 per capita, the air pollution level in urban areas is likely to star t improving. So in theor y, higher income per capita is expected to bring an improvement in the environmental situation. However, some environmental exper ts disagree. U n iq ue C ha ra c t e ri s t i c s o f E nv ironment Problems The second explanation as to why the environment is getting worse has to do with cer tain unique characteristics found in environmental problems (see World Bank, 2001): • Delayed Impacts. Many potential environmental changes have significantly delayed impacts. Delayed environmental impacts argue for a long lead time in implementing appropriate prevention or mitigating measures. An example would be the release of toxic substances into the environment. After ingestion or inhalation, it takes time before health problems begin to appear. Therefore, corrective measures must be taken before the toxic substances are released. • Spatial Impacts. Sources and environmental impacts are often separated in space (for example upstream/downstream or hills/valleys), making it necessar y to have a framework that can address diverse stakeholders’ interests. An example would be an irrigation system built in a developing countr y without leveling the land. The result is that some stakeholders’ 176
E N V I RO N M E N TA L
M AN AG E M E N T: TREN DS AN D
PO LIC IES
farms are flooded while others are left arid because they are located above the project site. Unless there is a framework that includes consultation with various stakeholders about their interests, spatial impacts are bound to adversely affect the environmental situation. • Cumulative Impacts. Individual actions often have little effect on the environment, but the cumulative effect of many such actions can be substantial. Bangkok, for example, has 70,000 small-scale industries and factories, which, taken individually, have little impact on the environment. But taken on the whole, the cumulative effect is tremendous. In fact, their cumulative negative impact is greater than that of the big industries like distilleries and breweries located in the same city. • Irreversible Damage. A significant number of environmental outcomes are fundamentally irreversible, and the implications of such changes are hard to predict. There are rivers and lakes in Asia, like the Bagmati River in Katmandu, which are polluted beyond recognition and therefore dead or the damages irreversible. • Need for Government Intervention. Environmental problems are often a consequence of market failures. Without government inter vention to introduce regulations and create markets where they do not exist, the private sector alone cannot achieve optimal environmental outcomes. The private sector has a role to play, but the government must also be there to see to it that regulations are in place and that they are enforced. • Multisector Links. Environmental problems surface across a range of sector s through many pathways, calling for coordinated policies and concer ted effor ts by various ministries and agencies. • Regional and Global Implications. Many environmental impacts have broad crossboundar y and global effects that require international frameworks and agreements to deal with them.
M I L L E N N I U M D EV E L O P M E N T G O A L S To char t the progress and results of the MDGs (see Box 6-1), the developing world was divided into seven regions: East Asia and the Pacific, Europe and Central Asia, Latin America and the Caribbean, the Middle East and Nor th Africa, South Asia, Sub-Saharan Africa, and Developing Countries. These are designations of regions as given by the World Bank. The Secretar y-General of the UN repor ted on the progress of implementation of the Millennium Declaration to the UN General Assembly (Secretar y-General of UN, (Doc.A/58/323, 2000)). A similar repor t is also available online (http://www.un.org/millenniumgoals/). 177
AN
IN TRO DU C TIO N TO
S U S TA I N A B L E
DEVELO PM EN T
Figure 6-9. Development Goals for Poverty
Proportion of people living on less than $1 (or $2) a day (%) 50 40
Europe & Central Asia
East Asia & Paciic
29.6
28.4
30 14.9
10
0.9
0 1990
1995 2000
2005 2010 2015
24.5
19.7
14.8
20
50
Latin America & Carribbean
11.3
4.9 3.6
0.5 1990
1995 2000
5.2 0.4 0.3 2005 2010 2015
South Asia
Middle East & North Africa
20 10 0
1990
1995 2000
23.2
46.4
30.3
11.9
2005 2010 2015
Sub-Saharan Africa
38.4
44.6 21.4
6.9 5.7
41.3
40 30
9.6
9.5
20.7 22.3
2.3 1990
1.2 0.9
2.4 1995 2000
2005 2010 2015 Goal 1990 2001 2015
12.8 1990
1995 2000
2005 2010 2015
1990
Poverty rate at $1 a day Actual Projected Path to goal
1995 2000
2005 2010 2015
Poverty rate at $2 a day Actual Projected
Source: World Bank data (2004)
According to the UN Secretar y General’s repor t, “A sustained and broad-based annual per capita income increase of 3 percent is the minimum needed to lift people out of pover ty at a rate sufficient to meet the goal of reducing by half, by 2015, the propor tion of people living on less than a dollar a day.” Since almost two thirds (approximately 800 million) of the world’s poor earning less than $1 a day live in Asia, the chances of reducing abject pover ty worldwide by half will be determined mostly by the GDP growth rate per capita in the PRC and India. With both these countries making good progress and keeping on track, the world has a fair chance of meeting the global goal of pover ty reduction by 2015. However, regional and national variations will continue to exist. Sub-Saharan Africa presents the gloomiest picture, even though some countries in that region (e.g., Cape Verde, Mauritius, Mozambique, and Uganda) have achieved sustained growth above the 3% benchmark in the recent past. A 2005 repor t by the Secretary-General of the UN, entitled “The Millennium Development Goals Repor t 2005,” claims that the MDGs are people-centered, time-bound, and measurable. They are based on global par tnership and have unprecedented political suppor t. Therefore, the Secretary-General concludes, “they (MDGs) are achievable.” In forwarding this repor t, the SecretaryGeneral stated: “We will not enjoy development without security, we will not enjoy security without development, and we will not enjoy either without respect for human rights. Unless all these causes are advanced, none will succeed.” 178
E N V I RO N M E N TA L
M AN AG E M E N T: TREN DS AN D
PO LIC IES
Figure 6-10. Development Goals for Water
ENVIRONMENT Goal: The proportion of the population without access to an improved water source be reduced by at least one half in 1990-2015
91
Source: Based on World Bank data: Global Economic Prospects (http://www.developmentgoals.org)
Goa l s t o E ra di c a t e E x t re m e Pover ty and Hunger The goals to eradicate extreme pover ty and hunger in developing countries are to reduce the problem by at least half between 1990 and 2015 (Figure 6-9). In 1990, the percentage of the population in the East Asia and Pacific region, which includes the PRC, earning less than $1 per day was 29.6%. In 2001, the figure dropped to 14.9%. The goal for 2015 is 14.8%, or half the 1990 figure. In this case, given the prevailing trends, it looks like the goal will be achieved. On the other hand, in Eastern Europe and Central Asia, the incidence of pover ty actually increased from 0.5% of the population in 1990 to 3.6% in 2001. This, of course, is a special case, because the time span included the collapse of the Soviet Union. With most of its factories closed, the environmental situation in the former Soviet Union improved, because there was much less polluted air, but the GDP growth rate went down and pover ty went up. South Asia saw an 11% decrease in the pover ty, but Sub-Saharan Africa registered a slight increase in pover ty from 1990 to 2001. What the figures indicate is that developing countries are generally not doing too badly, with Sub-Saharan Africa falling behind and the Middle East and Nor th Africa missing the goal by a small margin. An optimistic view is that the world as a whole and even the regions should be able to achieve the goal of reduction of abject pover ty by 2015, which cannot be said regarding any other of the MDGs. Asia is leading all other developing regions in achieving the goal of pover ty reduction. 179
AN
IN TRO DU C TIO N TO
S U S TA I N A B L E
DEVELO PM EN T
Figure 6-11. Development Goals for Gender Equality
Girl’s enrollments in primary and secondary education as % of boys 110 100
East Asia & Paciic
Europe & Central Asia
97
100
98
Latin America & the Carribbean
98
100
102
102
100
89
90 80 70 60 110
1990
1995
2000
2005
Middle East & North Africa
1990
1995
2000
2005
South Asia
1990
1995
2000
2005
Sub-Saharan Africa
100
100
100
100 90 80
91 71
79
82
70 60
1990
1995
2000
2005
1990
1995
2000
Goal 1990 2002 2005
82
79 2005
1990
1995
2000
2005
Girl’s enrollments as % of boy’s enrollment Actual Path to goal
Source: Based on World Bank data (2004)
By contrast, the number of people below the pover ty line in Sub-Saharan Africa increased between 1990 and 2001. Goals for the Environment One aspect of the development goals for the environment focuses on the propor tion of the population without access to an improved water source and to sanitation. The target is to reduce that number by half by 2015 (Figure 6-10).The other targets are (i) integrating principles of sustainable development into countr y policies, (ii) halting by 2015 the propor tion of people without sustainable access to safe drinking water and basic sanitation, and (iii) achieving significant improvement in the lives of at least 100 million slum dwellers by 2020. With regard to target (i), critics say that it is vague compared to the others. In some countries the target for water and sanitation will be achieved; in others it will not. Take East Asia and the Pacific. If the propor tion of the population with access to an improved water source, now estimated at about 75%, is below 85% in 2015, the goal may not be achieved. By contrast, the goal of 91% in Europe and Central Asia will likely be achieved; as of 1999, 90% of the regions’ populations already had access to safe water. In the high-income countries the percentage of population with access to good water was 100%, and it is projected to stay at that level.
180
E N V I RO N M E N TA L
M AN AG E M E N T: TREN DS AN D
PO LIC IES
Goa l i n G e n d e r E qua l i t y The gender goal calls for the empowerment of women, to be demonstrated by eliminating gender disparity in primar y and secondar y education by 2005, not 2015 (Figure 6-11). Figure 6-11 reveals that the target is unlikely to be achieved except in high-income countries and, apparently, in the Middle East and Nor th Africa. The disparity is calculated by the ratio of girls to boys in primar y and secondar y schools, as a target. For example, in East Asia and the Pacific, the ratio of girls to boys in primar y and secondar y schools was 89% in 1990. In other words, for ever y 100 boys in the primar y and secondar y school system, there were 89 girls. By 2002, the percentage had climbed to 97%. While five of the seven regions showed some improvement, two did not. In Sub-Saharan Africa the numbers are almost flat – about 79% in 1990 and about 82% in 2002. In Latin America and the Caribbean, the figure remained strong at 102% from 1990 to 2002 The MDG repor t (2005) in the quoted website reflects progress against each of the eight MDGs. Goa l s fo r In f a nt a nd C hi l d M or tality The goal for infant and child mor tality is to reduce death rates for infants and children under the age of five years by 2015 by two thirds of the 1990 level. Unlike universal primary education, the numbers in this categor y seem to indicate that most countries, except those in Sub-Saharan Africa, are on the mark. Hopefully, the Middle East and Nor th Africa will catch-up (decrease child mor tality at higher rates than in the past decade) in 2005-2015. Goa l s fo r M a t e rna l H e a l t h The maternal health goal is calculated by bir ths attended to by skilled health personnel. Again, all the regions showed improvement except Sub-Saharan Africa. It is of concern that in 1990, only 50% of the bir ths in that region were attended to by skilled personnel, but in 1998 the percentage had dropped to 46%. According to this trend, Sub-Saharan Africa cannot possibly reach the maternal health goal, which means it is also not going to reach the goal set for infant mor tality. Obviously, children born without attending medical care will have a higher mor tality rate. The situation in Asia (excluding the PRC and India) is also quite alarming; with the present rate of progress, by 2015 less than 40% of childbir ths are likely to be attended to by skilled health personnel. According to the repor t of the UN Secretar y-General submitted to the UN General Assembly (2003), women in Sub-Saharan Africa and Asia are likely to die during childbir th 175 and 20-60 times more, respectively, than women in a developed countr y. It appears that no region, including the so-called high-income countries, will be able to achieve this target by 2015. Obviously, it is not only economic reasons, but also religious, cultural, and physiological ones that stand in the way of achieving this goal. The UN therefore should consider revisiting and revising the goal. Goa l s fo r R e p ro d u c t i ve He a l th The goal for reproductive health care is to make contraception available to all married women by 2015. 181
AN
IN TRO DU C TIO N TO
S U S TA I N A B L E
DEVELO PM EN T
CONCLUSION During the past 40 years, the concept of environmental management moved from pollution and no action to global environmental protection and sustainable development by means of a proactive global strategy based on economic, ecological, and social considerations. The Millennium Development Goals (MDGs) are seen as quantitative indicators of environmental management and sustainable development at the global, regional, and national levels. As time is running out on meeting the MDGs, developing countries should continue to improve their performance and developed countries should fulfill their commitments to increase financial contributions and adjust trade barriers and subsidies so as not to isolate a majority of the global population from the great economic oppor tunities of the twenty-first centur y. It would also be necessar y to strengthen the involvement of the private sector and the civil society in playing increasingly impor tant roles in environmental management and sustainable development.
182
C H A P T E R
7
L E G I S L AT I O N , I N T E R N AT I O N A L L AW, A N D M U LT I L AT E R A L E N V I RO N M E N TA L AG R E E M E N T S
AN
IN TRO DU C TIO N TO
S U S TA I N A B L E
DEVELO PM EN T
T
o achieve sustainable development and protect the environment, the communities, countries, regions, and continents of the world need reformed policies and laws as well as increased capacity of both new and existing institutions. Legislation and international law will play an impor tant role in making these changes and developing these capacities. Multilateral Environmental Agreements (MEAs), a form of international legislation, will play a significant role in this process and in the achievement of sustainable development. National judiciaries as well as international cour ts of justice and arbitrational tribunals will be required to implement, under the rule of law, applicable international and national environmental laws as well as the concept of sustainable development, which will include effor ts to combat pover ty. To consider these reforms and developments, we first need to examine some of the basic concepts of international law as well as obstacles to the implementation of some of the key MEAs. We need to make such an examination because we want to find out how polluting states can be made to obey rules established outside their borders, and how polluting states unable to clean up their activities due to local politics can be compelled to do so by international law. We also need to explore how activists can use local and international cour ts to advance international environmental law standards, and we must examine, briefly, the evolution, from the legal point of view, of the concept of sustainable development, plus recent legislative developments to implement this concept. To begin our review of some of the basic concepts arising in the context of international law and legislation, let us consider the following four questions: • Did the Declaration of the United Nations Conference on the Human Environment in 1972, also known as the Stockholm Declaration, which helped establish UNEP as a key initiator of international environmental action, “create” or “develop” international environmental law? • When the UN General Assembly passed two resolutions in 1974, entitled “Declaration on the Establishment of a New International Economic Order” and “Char ter of Economic Rights and Duties of States,” did it “create” or “develop” international environmental law? • Did the UNCED in Rio de Janeiro in 1992 “create” or “develop” international environmental law when it adopted Agenda 21 and the Rio Declaration on Environment and Development? • Is “sustainable development” a general principle of international law?
DEFINITIONS To answer these questions we will first consider the definitions of law, international law, and environment. 1. Law The Oxford English Reference Dictionar y (1996, p. 810) defines law as “a rule enacted or customar y in a community, and recognized as enjoining or prohibiting cer tain actions, and enforced by the imposition of penalties.” Note that this definition includes those rules that are ”customar y in a community” as well as those that are enacted. In Gorky Incident, Mark 184
L E G I S L AT I O N , I N T E R N AT I O N A L L AW, A N D M U LT I L AT E R A L E N V I RO N M E N TA L AG R E E M E N T S
Twain suggested (Bartlett’s, 2002, p. 562) which of these two is more impor tant: “Laws are sand, customs are rock. Laws can be evaded and punishment escaped, but an openly transgressed custom brings sure punishment.” 2. International law The US uses the following definition of international law as a “standard of conduct” per taining to both “states” and “other entities”: International law is the standard of conduct, at a given time, for states and other entities subject thereto. It comprises the rights, privileges, powers, and immunities of states and entities invoking its provisions, as well as the correlative fundamental duties, absence of rights, liabilities, and disabilities (Whiteman, 1963, Vol. I, p. 1). 3. Environment Professors of law Alexandre Kiss and Dinah Shelton point out (2000, p. 2) that the European Convention on Civil Liability for Damage Resulting from Activities Dangerous to the Environment describes the “environment” as including the following: • natural resources both abiotic and biotic, such as air, water, soil, fauna, and flora, and the interaction between the same factors; • proper ty, which forms par t of the cultural heritage; and • the characteristic aspects of the landscape. [footnote omitted] Fur thermore, as Kiss and Shelton note, the International Cour t of Justice (ICJ), in its opinion on the Legality of the Threat or Use of Nuclear Weapons (1966, pp. 241-242, para. 29) includes a social dimension in the definition of the environment, stating that “the environment is not an abstraction, but represents the living space, the quality of life, and the ver y health of human beings, including generations unborn.” See Box 7.1.
Box 7-1. Environmentalism
Environmentalism: active engagement in protecting the environment. Two kinds of approach underlie it. Anthropocentrism: the natural world and non-human life do not have intrinsic value independent of us and are there for human beings to use sustainably. Biocentrism: the natural world or the environment is not simply there for humans to use; non-human life has an intrinsic value independent of human interests, and therefore humans ought to respect nature. Source: Nigel Dower, An Introduction to Global Citizenship, Edinburgh University Press, 2003, pp. xi and xii
185
AN
S O U RC E S
IN TRO DU C TIO N TO
OF
S U S TA I N A B L E
DEVELO PM EN T
I N T E R N A T I O N A L L AW
Ar ticle 38(1) of the international agreement establishing the ICJ (Statute of the International Cour t of Justice), which forms the apex of the judicial branch of the UN, describes the following four sources of international law: • international conventions, general or par ticular, establishing rules expressly recognized by the contesting States; • international custom, as evidence of a general practice accepted as law; • the general principles of law recognized by civilized nations; and • subject to the provisions of Ar ticle 59, judicial decisions and the teachings of the most highly qualified publicists of the various nations, as subsidiar y means for the determination of r ules of law. According to Kiss and Shelton (2000, p. 2), “Ar ticle 38 represents the authoritative listing of processes deemed capable of creating rules binding on states.” To understand the first of these sources of international law, we have to go back to basic definitions. I n t er n a t i o na l C o nve nt i o ns o r Treaties Black’s Law Dictionar y (1999) states, “A convention is an agreement or compact among nations. . . .” Thus, an international convention includes agreements that are often called treaties. The Vienna Convention on the Law of Treaties (1969) reads in par t in Section 1(a) of Ar ticle 1: For the purposes of the present Convention: (a) ”treaty” means an international agreement concluded between States in written form and governed by international law, whether embodied in a single instrument or in two or more related instruments and whatever its particular designation. … Since a treaty may exist “whatever its par ticular designation,” and since such agreements have been negotiated for thousands of years, treaties have been designated with a wide variety of titles, including agreement, compact, protocol, and the like. One of the earliest treaties, written on a clay tablet, was between King Silis of the Hittites and Ramses II of Egypt. That was in 1269 B.C., more than 3,200 years ago, or about the same time as Moses was receiving yet another set of clay tablets. I n t er n a t i o na l C u s t o m Professor of law Anthony D’Amato, in an ar ticle quoted by law professors David Hunter, James Salzman, and Durwood Zaelke (2002, pp. 310-311), states that “customar y rules represent regularities of behavior” while noting three qualifications: First, the approach is empirical rather than normative. It attempts to describe the existing norms that govern the relations among states, but does not advocate or prescribe new norms. . . 186
L E G I S L AT I O N , I N T E R N AT I O N A L L AW, A N D M U LT I L AT E R A L E N V I RO N M E N TA L AG R E E M E N T S
Second, customar y rules are not equivalent to simple behavioral regularities. … Customar y norms depend not only on state practice (that is, on obser vable regularities of behavior), but also on acceptance of these regularities as law by states. … Finally, customar y rules represent regularities, but not necessarily uniformities, of behavior. The behavioral approach requires a general congruence between rules and behavior. If a purported rule says one thing and states generally do something else, one can no longer say that the rule “governs” behavior. Nevertheless, mistakes and violations of rules are possible. Gen e ra l P ri n c i pl e s Hunter, Salzman, and Zaelke (2002, pp. 315-316), while pointing out that “what is included within [general] principles is a matter of debate,” quote professor of law Ian Brownlie, who states that “General principles” may refer to “rules accepted in the domestic law of all civilized States,” or alternatively, to the general principles of private law used within all or most States. … insofar as those principles are applicable to relations of States. General principles, then, fill in the gaps in international law that have not already been filled by treaty or custom. Significantly, general principles include principles that have emerged from municipal legal systems, and are therefore tried and tested in domestic law before they have been impor ted into international law. Ju di c i a l D e c i s i o ns a n d t he Te aching s of the M ost Qualified Law professor Antonio A. Oposa Jr., perhaps best known for the landmark case providing judicial recognition of the principle of intergenerational equity (Box 7-2), gives the following description (2003, p. 445) of the role of judicial decisions and scholarly writings in the ar ticulation of international law: International Law may also be expressed through the judicial decisions of international courts and tribunals, and of national courts. It must be noted that a judicial decision is not, by and of itself, the International Law. Rather, the judicial decision is said to be only an expression or an articulation of the principle of International Law which is applied to a particular controversy or case at hand. In other words, it is not International Law itself but only evidence of the existence of the legal principle involved. So also with the writings and learned explanations of the “most highly qualified” scholars. The writings of these scholars, who through years of labor, research, and experience, have become intimately acquainted with the principles and practice of international law, are in a position to explain what it is. [footnote omitted] 187
AN
IN TRO DU C TIO N TO
S U S TA I N A B L E
DEVELO PM EN T
Box 7-2. Oposa v Factoran and Intergenerational Equity
Law professors Donna Craig, Nicholas N. Robinson, and Koh Kheng-Lian (2003, Vol. I, pp. 720, 728) summarize this landmark case handed down by Hilario Davide, Jr., then Justice and later Chief Justice of the Philippine Supreme Court, in part as follows: The Petitioners, minors represented by their parents, and the Philippine Ecological Network, Inc., sought to have the defendant, the Secretary of the Department of Environment and Natural Resources, ordered to rescind all existing Timber License Agreements (TLAs) and to desist from receiving, renewing or approving new agreements. The judgments…decided only upon the validity of the cause of action, not the merits of the case. It was argued [by Professor Oposa in behalf of his children as the petitioners] that the granting of the TLAs constituted a breach of numerous positive laws, the Constitution and natural laws. The cause of action rested upon the argument that these elements combined in Filipino law to create a right to the environment that had been breached. The defendant argued that the complaint raised no cause of action and was a political question. The case is a landmark for judicial recognition of the principle of intergenerational equity. This principle was accepted in so far as the petitioners were permitted to represent unborn generations in their pursuit of the right to a healthy environment. … [T]he matter was held to be a valid class suit with the plaintiffs representing all present and future citizens of the Philippines. Davide Jr., J.[Justice] held unequivocally that Sec. 15 and 16 of the Constitution combined to constitute “a fundamental legal right—the right to a balanced and healthful ecology.” [He proceeded to find that these rights are “assumed to exist from the inception of mankind.” It was held that, without the forests which were threatened by the TLAs, a balanced and healthful ecology would...not be achievable. Therefore, the decision to grant the TLAs infringed upon the rights of the people. …] A key sentence in the Davide, Jr., opinion, quoted by Hunter, Salzman, and Zaelke (2002, p. 401), states in part that “the minors’ assertion of their right to a sound environment constitutes, at the same time, the performance of their obligation to ensure the protection of that right for the generations to come.”
T H E FO U R Q U E S T I O N S
IN THE
CONTEXT
OF
I N T E R N A T I O N A L L AW
Armed with these definitions, we can go back to our original questions about how international law would interpret the Stockholm Declaration of 1972, the vote on General Assembly resolutions dealing with new international economic declarations and char ters, and the adoption of Agenda 21 and the Rio Declaration at the WSSD in 1992. First, would any of these satisfy the definition of a convention or treaty, the first source of international law? No, they would not. When states acted on these three instruments through their representatives, they did so without the requisite intent to be bound to an international convention or treaty. 188
L E G I S L AT I O N , I N T E R N AT I O N A L L AW, A N D M U LT I L AT E R A L E N V I RO N M E N TA L AG R E E M E N T S
However, this is not to suggest that these instruments are unimpor tant. Documents such as the Rio Declaration are often referred to as “soft law,” which Black’s Law Dictionar y (1999, p. 1397) defines in par t as “[g]uidelines, policy declarations, or codes of conduct that set standards of conduct but are not directly enforceable.” St o c k ho l m D e c l a ra t i o n Would all or por tions of the Stockholm Declaration qualify as “international custom, as evidence of a general practice accepted as law,” which is the second source in Ar ticle 38(1) of the ICJ char ter? Kiss and Shelton indicate (2000, p. 42) that two norms formulated in the Stockholm Declaration—Principle 21 dealing with environmental damage across international borders, and Principle 24 concerning the duty to cooperate—do qualify as the ar ticulation of international custom. Thus, though the entire Declaration itself may not give rise to legal obligations, specific provisions, such as those found in Principles 21 and 24, may constitute an “ar ticulation of custom.” In other words, a “mere” declaration may either restate custom or contribute to custom by being referred to in state judicial opinions or influencing state practice, but the true “source” of the obligation is still custom. Kiss and Shelton (2000, p. 42) also point out that the customary rule of international environmental law that “no state may cause or allow its territory to be used to cause damage to the environment of other states…first arose in international jurisprudence and was formulated in Principle 21 of the Stockholm Declaration before being adopted and reaffirmed in numerous other binding and nonbinding international instruments.” Principle 21 of the Stockholm Declaration provides that “States have, in accordance with the Char ter of the United Nations and the principles of international law, the sovereign right to exploit their own resources pursuant to their own environmental policies, and the responsibility to ensure that activities within their jurisdiction or control do not cause damage to the environment of other States or of areas beyond the limits of national jurisdiction.” Other commentators, including Hunter, Salzman, and Zaelke (2002, p. 177), agree that “’Principle 21,’ as it is known to all international environmental lawyers, continues today as an impor tant statement of customar y international environmental law.” U N G e n e ra l A s s e m bly R e s o l utions Can a resolution of the UN General Assembly, which constitutes legislation within the UN system, contribute to the development of international law? If three par ticular conditions are satisfied, the answer is in the affirmative. This was explained by Rober t Rosenstock, US Representative to the Sixth Committee (Legal) at the United Nations, in a November 11, 1977 statement dealing with “how such a resolution may in exceptional cases contribute to the development of international law,” as repor ted in a US Government publication (Digest of US Practice in International Law,1978, p. 53). Rosenstock, then a senior lawyer of the US Depar tment of State, made this statement while taking exception to commentar y in the UN Report of the International Law Commission on its 29th session, which suggested that the “UN General Assembly had only recently reiterated and developed” the “principle of permanent sovereignty over natural resources” by passing General 189
AN
IN TRO DU C TIO N TO
S U S TA I N A B L E
DEVELO PM EN T
Assembly Resolution 3201 entitled the “Declaration on the Establishment of a New International Economic Order” and General Assembly Resolution 3281 entitled “Char ter of Economic Rights and Duties of States.” Rosenstock noted three “ifs” or conditions required for such a UN General Assembly resolution to contribute to international law: This Assembly is not a lawmaking body. Its resolutions, in the ordinar y course, do not enact, formulate or alter international law, progressively or regressively. In the exceptional cases in which a General Assembly resolution may contribute to the development of international law, it can do so only if the resolution gains virtually universal support, if the members of the General Assembly share a lawmaking or law-declaring intent—and if the content of that resolution is reflected in general state practice. Unlike UN General Assembly resolutions, UN Security Council resolutions, such as Security Council Resolution 1373, adopted on September 28, 2001, following the terrorist attacks on September 11, 2001, are “legally binding on all member states of the United Nations,” as pointed out by legal exper t Herber t V. Morais and ADB Counsel Motoo Noguchi (2003, p. 9), when “a Security Council Resolution [has been] adopted in response to a threat to international peace and security, pursuant to Chapter VII of the United Nations Char ter.” Chapter VII is entitled “Action with Respect to Threats to the Peace, Breaches of the Peace, and Acts of Aggression.” The most famous of these authoritative Resolutions intended to be law is the Declaration on Principles of International Law Concerning Friendly Relations and Cooperation Among States in Accordance with the Char ter of the United Nations (Resolution 2625, adopted October 24, 1970). The long title for this 1970 Resolution suggests the lengthy negotiations that went into its drafting, precisely because it would be authoritative. Rio D e c l a ra t i o n o n E nv i ro nme nt and Development, and Agenda 21 The Rio Declaration on Environment and Development, adopted at the 1992 UNCED, is one of three nonbinding instruments that emerged in Rio de Janeiro. The other two are Agenda 21 and the Forest Principles. The legally binding instruments that emerged in Rio were two international conventions—the UN Framework Convention on Climate Change, and the Convention on Biological Diversity—both of which were signed in Rio and subsequently entered into force. As pointed out by law professor Philippe Sands (1994, p. 320), in this sense “Rio represented an advance on the Stockholm Conference,” since the Stockholm Conference did not result in the signing of any international convention. The Rio Declaration of 1992 consists of a preamble and 27 principles that contain, in the words of Sands in his ar ticle on “International Law in the Field of Sustainable Development” (1994, p. 322), “provisions more specific and precise than those adopted at Stockholm” 20 years earlier.
190
L E G I S L AT I O N , I N T E R N AT I O N A L L AW, A N D M U LT I L AT E R A L E N V I RO N M E N TA L AG R E E M E N T S
Kiss and Shelton suggest that the Rio Declaration contains principles that may be placed under four categories: legal, policy, economic, and public policy. Concerning those principles, Kiss and Shelton (2000, p. 71) point out that Principle 2, which concerns transboundar y effects, is similar to Principle 21 of the Stockholm Declaration, but adds the word “developmental.” Other legal norms can be found in Principle 10, affirming rights of public information, participation, and remedies; Principle 13, which calls for the development of liability rules; and Principles 18 and 19, which require notifying other states of emergencies and projects that may affect their environment. The formulation of then-emerging principles includes the precautionar y principle (Principle 15), and the “polluter pays” principle that requires internationalization of environmental costs (Principle 17). Principle 11 stresses the importance of enacting effective environmental legislation, although it notes that standards applied by some countries may not be appropriate to others because of the economic and social costs involved. In the view of many, the key to the Rio Declaration is found in Principle 3, which is a restatement of the definition of sustainable development proposed in the Brundtland Repor t. Principle 3 states that “The right to development must be fulfilled so as to equitably meet developmental and environmental needs of present and future generations.” (UN Doc. A/CON.151/26 Vol. I.) Principles 1 and 5 of the Rio Declaration focus on people in general and on the poor, respectively. Principle 1 provides (ibid) that “Human beings are at the center of concerns for sustainable development. They are entitled to a healthy and productive life in harmony with nature.” Principle 5 declares (ibid) that “All States and all people shall cooperate in the essential task of eradicating pover ty as an indispensable requirement for sustainable development, in order to decrease the disparities in standards of living and better meet the needs of the majority of the people of the world.” Financial institutions such as ADB implement this principle in development projects that are designed to eradicate pover ty by applying the conceptual tool known as the “logical framework” or “logframe” or “project framework” to analyze, plan, and manage such projects (1998, p. 15). In some instances, pover ty eradication is pursued in conjunction with other Rio principles, such as Principle 20, which declares that “Women have a vital role in environmental management and development” and that “Their full par ticipation is therefore essential to achieve sustainable development.” (Maldives, 2001, pp. 62-76.) A similar approach is taken to implement Principle 22 of the Rio Declaration, which states that “Indigenous people and their communities and other local communities have a vital role…in the achievement of sustainable development.” (Plant, 2002, pp. 9-10.) Pover ty eradication can also be pursued through reforms of a national judiciar y. (See Box 7-3.)
191
AN
IN TRO DU C TIO N TO
S U S TA I N A B L E
DEVELO PM EN T
Box 7-3. Poverty Eradication by Improving the Legal Basis for the Judiciary and Administrative Reforms
One of the most significant ADB poverty reduction loans is for the Access to Justice Program (AJP) in Pakistan, approved on December 20, 2001, which consists of two policy loans equivalent to a total of US$350 million, plus a technical assistance loan equivalent to US$20 million to finance institutional development for the AJP. In addition, ADB provided a technical assistance grant equivalent to US$900,000 to support a program management unit within the Ministry of Law, Justice, Human Rights and Parliamentary Affairs, which is the executing agency for the AJP. According to the ADB Report and Recommendation of the President (pp. i and ii) for the AJP, the “key development objective of the AJP is to assist the Government” by “supporting five interrelated governance objectives”: “(a) providing a legal basis for judicial, policy, and administrative reforms; (b) improving the efficiency, timeliness, and effectiveness in judicial and police services; (c) supporting greater equity and accessibility in justice services for the vulnerable poor; (d) improving predictability and consistency between fiscal and human resource allocation and the mandates of reformed judicial and police institutions at the federal, provincial, and local government levels; and (e) ensuring greater transparency and accountability in the performance of the judiciary, the police, and administrative justice institutions. ” The Report and Recommendation of the President indicates (pp. ii and iii) that the “term ‘judicial,’ unless the context indicates otherwise, includes institutions responsible for the delivery of administrative justice, such as the offices of the ombudsman at various levels.” Of interest to environmentalists is a component in the AJP (p. i) that “support[s] the enforcement of environmental laws through the establishment of environmental tribunals already provided for in the law, and by ensuring that any conflict of interest is removed by different persons heading the provincial environmental agencies ... and the provincial environment departments.” Also (p. iii) “civil society groups will be able to access the LEF [Legal Enforcement Fund] to raise environmental awareness and provide assistance for enforcement of environmental rights.”
As Kiss and Shelton (2000, p. 72) conclude, the Rio Declaration is a ver y impor tant statement of environmental principles and “includes several principles of an unambiguous, if general character.” Principle 2, according to them (2000, pp. 43-44), “reiterated the duty” found in Principle 21 of the Stockholm Declaration and thus ar ticulates a general principle of law. The Rio Conference adopted Agenda 21, which is a program of action containing 40 chapters and a nonbinding action plan for sustainable development. In answer to the question “What contribution will Agenda 21 make, if any, to the progressive development of international law?” Sands responds in par t as follows: It should be recalled that it only has recommendator y status, and that the immediate legal consequences which flow directly from the text are few. Its principal recommendations include the creation of a new Commission on Sustainable 192
L E G I S L AT I O N , I N T E R N AT I O N A L L AW, A N D M U LT I L AT E R A L E N V I RO N M E N TA L AG R E E M E N T S
Development, and the improvement of co-ordination among UN and other bodies, and the further development of international law. [footnote omitted] It also commits all States to prepare national implementation reports. In the view of another commentator, Professor of Law John C. Dernbach (2002, p. 49), “The Agenda 21 commitment is not binding in international law, but it does represent a political commitment.” Su s t a i na bl e D eve l o p m e n t a s a Concept or Gener al Pr inciple As pointed out by Kiss (2003, p. 8), in the case concerning the Gabcikovo-Nagymaros Project (Hungar y/Slovakia) in 1997, the ICJ explained (1997, p. 75) the “concept” of sustainable development, though a dissenting opinion, argued that sustainable development is a “principle of international law.” In this case the ICJ had been requested to decide on the basis of the 1977 Treaty on the Construction and Operation of the Gabcikovo-Nagymaros dams, which concerned a system of dams on the Danube River designed to produce electrical energy and improve the “navigability of the Danube, flood control and regulation of ice-discharge, and the protection of the environment.” The ICJ was also requested to decide the case on the basis of “rules and principles of international law as well as such other treaties as the cour t may find applicable.” (Kiss and Shelton, 2000, p. 423.) The judgment, delivered by the 15 Judges of the Cour t, with Stephen M. Schwebel ser ving as President, included the following paragraph 140 (Gabcikovo-Nagymaros Project [Hungar y/ Slovakia)] 1997, ICJ,) dealing with “effects upon the environment,” “risks for mankind—for present and future generations,” and the “concept of sustainable development”: [140] ... Throughout the ages, mankind has, for economic and other reasons, constantly interfered with nature. In the past, this was often done without consideration of the effects upon the environment. Owing to new scientific insights and to a growing awareness of the risks for mankind—for present and future generations—of pursuit of such inter ventions as an unconsidered and unabated pace, new norms and standards have been developed, set forth in a great number of instruments during the last two decades. Such new norms have to be taken into consideration, and such new standards given proper weight, not only when States contemplate new activities but also when continuing with activities begun in the past. This need to reconcile economic development with protection of the environment is aptly expressed in the concept of sustainable development. Having described “sustainable development” as a concept, the ICJ then ruled in par t that “the Par ties together should look afresh at the effects on the environment of the operation of the Gabcikovo power plant” and “[i]n par ticular they must find a satisfactor y solution for the volume of the water to be released into the old bed of the Danube and into the side-arms of both sides of the river.” (Gabcikovo-Nagymaros Project [Hungar y/Slovakia] 1997, ICJ, p. 78.) 193
AN
IN TRO DU C TIO N TO
S U S TA I N A B L E
DEVELO PM EN T
As Kiss (2003, p. 8) points out, the Vice-President of the ICJ at that time, Judge Christopher Gregor y Weeramantr y, opined that sustainable development is a principle, not a concept, of international law: In his dissenting opinion, on the contrar y, Judge Weeramantr y presents sustainable development as a principle of international law. He recalls that after the early formulations of the concept of development, it was recognized that development cannot be pursued to such a point that substantial damage results to the environment within which it is to occur. Therefore, development can only be sought in harmony with the reasonable demands of environmental protection. He stresses that: It is thus the correct formulation of the right to development that that right does not exist in the absolute sense, but is relative always to its tolerance to the environment. The right to development as thus defined is clearly part of modern international law. It is compendiously referred to as sustainable development. In his separate opinion,Weeramantr y describes in par t the evolution of sustainable development, noting that the ICJ refers to sustainable development as a “concept,” while he “considers” sustainable development to be “a principle with normative value” and “a principle of customar y international law” (Gabcikovo-Nagymaros Project [Hungar y/Slovakia] 1997, ICJ, pp. 89-107.) The Court has referred to it [sustainable development] as a concept in paragraph 140 of its Judgment. However, I consider it to be more than a mere concept, but as a principle with normative value which is crucial to the determination of this case. … I would obser ve, moreover, that both Parties in this case agree on the applicability to this dispute of the principle of sustainable development. Thus, Hungar y states in its pleadings that: “Hungar y and Slovakia agree that the principle of sustainable development, as formulated in the Brundtland Report, the Rio Declaration and Agenda 21 is applicable to this dispute. …” For a discussion of the legal status of “sustainable development” and what international law requires of states and international organizations concerning sustainable development, see Box 7-4 entitled “The Legal Status of Sustainable Development.” See also Box 7-5 on “Sustainable Development and Unsustainable Arguments.”
194
L E G I S L AT I O N , I N T E R N AT I O N A L L AW, A N D M U LT I L AT E R A L E N V I RO N M E N TA L AG R E E M E N T S
Box 7-4. The Legal Status of Sustainable Development
Alan Boyle and David Freestone (1999, pp. 16-18) describe the legal status of sustainable development as follows: No easy answer can be given to the question whether international law now requires that all development should be sustainable. ... It is difficult to see international court reviewing national action and concluding that it falls short of a standard of “sustainable development.” The International Court of Justice did not do so in the Case Concerning the Gabcikovo-Nagymaros Dam, preferring instead to address more readily justiciable questions such as the equitable allocation of waterflow or the applicability of international environmental standards in the operation of the hydroelectric system. … Normative uncertainty, coupled with the absence of justiciable standards for review, strongly suggest that there is as yet no international legal obligation that development must be sustainable, (Gunther Handl, “Environmental Security and Global Change: The Challenge to International Law” [1990] Yearbook of International Environmental Law 25. … See also Handl, “The Legal Mandate of Multilateral Development Banks as Agents for Change towards Sustainable Development” [Multilateral Development Banking: Environemental Principles and Concepts Reflecting General International Law and Public Policy 2001]) and that decisions on what constitutes sustainability rest primarily with individual governments. This is not the end of matter, however. A more plausible argument is that although international law may not require development to be sustainable, it does require development decisions to be the outcome of a process which promotes sustainable development. Specifically, if states do not carry out EIAs, or encourage public participation, or integrate development and environmental considerations in their decision-making, or take account of the needs of intra- and inter-generational equity, they will have failed to implement the main elements employed by the Rio Declaration and other international instruments for the purpose of facilitating sustainable development. There is, as we shall see below, ample state practice to support the normative significance of most of these elements. Moreover, an interpretation which makes the process of decision-making the key legal element in sustainable development, rather than the nature of the development, is implicitly supported by the case concerning the Gabcikovo-Nagymaros Dam. In that decision, while not questioning whether the project was sustainable, the International Court of Justice did require the parties in the interests of sustainable development to “look afresh” at the environmental consequences and to carry out monitoring and abatement measures to contemporary standards set by international law. 92 AJIL 642. (1997) ICJ Reports, 7, at para. 140] Such an approach enables international courts to further the objective of sustainable development in accordance with the Rio Declaration while relieving them of the impossible task of deciding what is and what is not sustainable. An argument of this kind would thus focus on the components of sustainable development, rather than on the concept itself. … whether or not sustainable development is a legal obligation, and as we have seen this seems unlikely, it does represent a goal which can influence the outcome of litigation and the practice of states and international organizations, and it may lead to significant changes and developments in the existing law. In that very important sense, international law does appear to require states and international bodies to take account of the objective of sustainable development, and to establish appropriate processes for doing so. …
195
AN
IN TRO DU C TIO N TO
S U S TA I N A B L E
DEVELO PM EN T
Box 7-5, Sustainable Development and Unsustainable Arguments
Vaughan Lowe (1999, p. 21) argues that the concept of sustainable development is not a “binding norm of international law” but nevertheless “a concept with great potential value”: ... the argument that the concept of sustainable development is now a binding norm of international law in the sense of the “normative logic” of traditional international law as reflected in Article 38(1) of the Statute of the International Court of Justice is not sustainable, but ... there is a sense in which the concept of sustainable development exemplifies another species of normativity which is of great potential value in the handling of concepts of international environmental law.
Noting the “two different views concerning the nature of sustainable development,” Kiss asks: “Is it a concept as the International Cour t of Justice qualified it or is it a principle?” He begins his reply (2003, pp. 8-9) by tr ying to “clarify the two notions” as follows: A concept is an abstract creation of the human mind without having a material content. Principles are, on the contrar y, fundamental norms for the orientation of persons, authorities or others, materializing the content of legal, moral or intellectual concepts, without necessarily being directly applicable. In this sense, the state is a concept, while its Constitution proclaims principles in order to establish the fundamental rules of its functioning. In application of such principles, specific laws are enacted to govern the functioning of the state’s organs and the behaviour of persons. Kiss then suggests (2003, p. 9) that “sustainable development should be considered as a concept while several principles have been proposed to establish its concrete content.” Noting that the “2002 Johannesburg World Summit on Sustainable Development focused a large par t of its work on sustainable development,” (ibid.) Kiss refers to a declaration on the principles of international law in the field of sustainable development adopted at the April 2002 Conference of the International Law Association held in New Delhi. That declaration, which did not emanate from a meeting of states but merely from a private group, proposed seven basic principles followed by explanator y comments: 1. The duty of the States to ensure sustainable use of natural resources While, in accordance with international law, all States have the sovereign right to use their own natural resources pursuant to their own environmental and developmental policies, they are also under a duty to manage natural resources, including natural resources within their own territor y or jurisdiction, in a rational, sustainable and safe way so as to contribute to the development of their peoples and to the conser vation and the protection of the environment, including ecosystems. States must take into account the needs of future generations. The Declaration stresses that all relevant actors, including States, industrial concerns and other components of civil society are under a duty to avoid wasteful use of natural resources and promote waste minimization policies. … 196
L E G I S L AT I O N , I N T E R N AT I O N A L L AW, A N D M U LT I L AT E R A L E N V I RO N M E N TA L AG R E E M E N T S
2. The principle of equity and the eradication of poverty The New Delhi Declaration recalls that the principle of equity is central to the attainment of sustainable development. It refers to both intra-generational equity and inter-generational equity. The first means the right of all peoples within the current generation to fair access to the Earth’s natural resources. The second imposes the duty upon present humanity to take into account the long-term impact of its activities and to sustain the resource base and the global environment for the benefit of future generations. “Benefit” is to be understood in this context as including inter alia, economic, environmental, social and intrinsic benefit. From the recognition of the right to development flows the duty of States to cooperate for the eradication of poverty. Whilst it is the primar y responsibility of the State to aim for conditions of equity within its own population and to ensure, as a minimum, the eradication of poverty, all States which are in a position to do so have a further responsibility to assist other States to achieve this objective. 3. The principle of common but differentiated responsibilities All States and other relevant actors, international organizations, corporations, non-governmental organizations and civil society should co-operate in the achievement of global sustainable development and the protection of the environment. The special needs and interests of developing countries and of countries with economies in transition should be recognized. Developed countries bear a special burden of responsibility in reducing and eliminating unsustainable patterns of production and consumption and in contributing to capacity-building in developing countries. 4. The principle of the precautionary approach to ields such as health, natural resources, and ecosystems According to the Declaration, a precautionar y approach commits States, international organizations and civil society, particularly the scientific and business communities, to avoid human activity which may cause significant harm to human health, natural resources or ecosystems, including in the light of scientific uncertainty. Such approach should include accountability for harm caused, where appropriate, State responsibility, planning based on clear criteria and well-defined goals, effective use of environmental impact assessment and establishing an appropriate burden of proof on the person or persons carr ying out or intending to carr y out the activity. 5. The principle of public participation and access to information and justice The Declaration stresses that public participation is essential to sustainable development and good governance. It is a condition for responsiveness, transparency and accountability both for governments and civil society organizations, including industrial concerns and trade unions. The text adds that the vital role of women in sustainable development should be recognized. Public participation requires effective protection of the human right to hold and express opinions and to seek, receive and impart ideas. It also requires a right of access to appropriate, comprehensible and timely information held by governments and industrial concerns regarding the sustainable use of natural resources and the protection of the environment. Nondiscriminatory access to effective judicial or administrative procedures should be ensured in the State where the measure has been taken to challenge such measure and to claim compensation. [footnote deleted.] 197
AN
IN TRO DU C TIO N TO
S U S TA I N A B L E
DEVELO PM EN T
6. The principle of good governance The Declaration proclaims that civil society and non-governmental organizations have a right to good governance by States and international organizations.This means the adoption of democratic and transparent decision-making procedures and inancial accountability, effective measures to combat corruption, the respect of the principle of due process, of rule of law and human rights and the implementation of a public procurement approach. Good governance also calls for corporate social responsibility and socially responsible investments and a fair distribution of wealth among and within communities. 7. The principle of integration and interrelationship, in particular in relation to human rights and social, economic, and environmental objectives This principle reflects the interdependence of social, economic, financial, environmental and human rights aspects of principles and rules of international law relating to sustainable development as well as of the interdependence of the needs of current and future generations of humankind. According to the Declaration, States should strive to resolve apparent conflicts between competing economic, financial, social and environmental considerations, whether through existing institutions or through the establishment of appropriate new institutions. Kiss concludes (2003, p. 11) that “On the whole, these principles are rooted in the Declaration of the Conference of Rio de Janeiro and in Agenda 21 and can be considered as generally accepted, although their legal nature can be discussed.” He fur ther notes (2003, p. 14) in conclusion of his discussion of sustainable development that “the Implementation Plan of the WSSD…seems to somewhat ignore law or legal rules, [and thus] could be considered as par ticularly counterproductive in this regard.” However, he points (ibid.) out that “policy measures are necessarily linked with law. …”: At the highest level, law, as the expression of the common concern of a community, has to determine the values to be protected and, after defining and adopting the policies which ser ve that objective, needs to fulfill the proposed tasks. Almost ever y paragraph of the Implementation Plan contains the word “policy” which means that in reality its implementation involves legal measures. Further, when good governance is proposed, it also includes good institutions and good norms, which again mean law and mainly environmental law. The “conceptual approach to sustainable development,“ suggested by Kiss (2003, pp. 14-15), from fundamental values, concepts, principles, and policies to legal tools, follows: • Fundamental values of humanity: definition by global legal instruments - Peace (UN Charter) - Human rights (UN Charter ; Universal Declaration of Human Rights; Covenants on Civil, Political Rights and Economic, Social and Cultural Rights) 198
L E G I S L AT I O N , I N T E R N AT I O N A L L AW, A N D M U LT I L AT E R A L E N V I RO N M E N TA L AG R E E M E N T S
- Environment (Declarations of Stockholm and of Rio de Janeiro, WSSD Declaration and Plan of Implementation) • Concept of sustainable development (Declaration of Rio de Janeiro) - Principles lowing from the concept: - sustainable use of the environment; - pollution control; - equity and eradication of poverty; - common but differentiated responsibility; - prevention of harm and precautionar y approach (health, natural resources, ecosystems); - public information, participation and access to justice; - good governance; and - integration and interrelationship in particular in relation to human rights and to social, economic and environmental objectives. • Policies (Stockholm: Action Plan; Rio: Agenda 21; WSSD: Declaration and Plan of Implementation). They include in particular: - land-use planning; - health care; - habitat; - energy; - ecosystem management; - soil protection; and - education, awareness-raising, training, capacity building. • Legal tools implementing the policies adopted for enhancing sustainable development: - international conventions; - constitutional rules; - framework laws; - laws concerning basic ser vices (water and sanitation, energy, transport, health care, town and countr y planning, etc.); - laws concerning specific environmental sectors (water, sea, air, biodiversity) and sources of environmental deterioration (polluting substances, wastes, nuclear material, etc.); - regulations adopted at different levels (national, regional, subregional in accordance with the principle of subsidiarity) implementing such laws or framing economic instruments; and - judicial decisions. MDBs have been established pursuant to international conventions and thus provide examples of how international conventions can suppor t sustainable development. See Box 7-6 describing in par t the relationship between development banking and sustainable development. 199
Box 7-6. The Legal Mandate of Multilateral Development Banks as Agents for Change Toward Sustainable Development
Professor Gunther Handl (2001, pp. 23, 31, 33, 34, 35; see also 1998, p. 642 and following) describes the legal mandate for MDBs as agents for change toward sustainable development as follows: ... the banks have metamorphosed into true development institutions, i.e., have abandoned their original narrow focus on economic development as measured in terms of “satisfactory” rates of increase in gross national product, and have embraced human resource development, and protection of the environment as legitimate development ends in their own right..[footnote omitted] (p. 23) The Legal Mandate of Multilateral Development Banks ... the conclusion arrived at here: As members of the international community, MDBs are subject not only to evolving international public policy and general international law (custom and general principles of law), but also to the normative reach of those MEAs that have been adopted precisely to lay down principles and standards of global applicability. [footnote omitted] (p. 31) ... MDBs which, as their name already implies, occupy a special position in the sustainable development process, represent also key addressees of the emerging norms of the international law of sustainable development. Whereas it is true that MDBs have no special international mandate to vindicate human rights generally and hence are subject to only (functionally) limited affirmative obligations regarding the enhancement of human rights, international financial institutions (and development agencies) have been entrusted with a broad and universally recognized role in promoting sustainable development. That mandate entails a responsibility: MDBs must actively promote the objectives of international normative concepts, extant or emerging, that bear directly on sustainable development. Thus the normative implications of, for example, “women in development” suggest that the banks not only refrain from acting in defiance of, or at cross-purposes with, the environmental and social objectives the normative concept seeks to capture, but also act affirmatively towards their realization. It goes without saying, however, that such an affirmative obligation is neither absolute nor unlimited. Rather, MDBs will be only required to take reasonable steps in support of sustainable development. [footnote omitted] (p. 33) Conclusions It should be evident, then, that the Banks have not only an inherently economic and political incentive, but also a clear international legal obligation to avoid causing environmental harm in developing member countries, and indeed to incorporate environmental protection and social development objectives into all of its activities in DMCs [developing member countries]. In this sense, international public law and policy merely underline the status of MDBs as critical agents of change towards sustainable development. [footnote omitted] (p. 34) ... variances in how MDBs approach private as against public sector operations are explainable first and foremost in terms of the different scope of development objectives that MDBs can pursue legitimately in financing respective sector projects. Otherwise the Bank’s general international legal obligations apply mutatis mutandis to private sector activities. ... [footnote omitted] (p. 35)
Source: Gunther Handl (2001)
L E G I S L AT I O N , I N T E R N AT I O N A L L AW, A N D M U LT I L AT E R A L E N V I RO N M E N TA L AG R E E M E N T S
It is impor tant to emphasize that this declaration on the principles of international law in the field of sustainable development adopted at the April 2002 Conference in New Delhi lacks the authority that might follow from a declaration made by representatives of states, but it may have a clarity that a private group can provide when acting without constraints imposed by states.
M U L T I L A T E R A L E NV I R O N M E N T A L A G R E E M E N T S (MEA S ) Ch a ra c t e ri s t i c s o f E nv i ro nmental Treaties Kiss and Shelton describe (2000, p. 33) seven main features of environmental treaties: 1. an emphasis on national implementing measures being taken by the states parties; 2. the creation of international super visor y mechanisms to review compliance by states parties; 3. simplified procedures to enable rapid modification of the treaties; 4. the use of action plans for further measures; 5. the creation of new institutions or the utilization of already existing ones to promote continuous cooperation; 6. the use of framework agreements; and 7. interrelated or cross-referenced provisions from other environmental instruments. Typ e s o f Int e rna t i o n a l A g re ements Armed with these definitions and interpretations, we can now turn to the hear t of our legislative inquir y—international environmental agreements—which fall under two headings: • bilateral treaties, which involve agreements by two countries; and • multilateral treaties, which involve agreements by three or more countries and perhaps one or several international organizations. 1. Bilateral treaties Some of the oldest environmental treaties have been bilateral and have dealt with water and birds. The Convention of May 21, 1906, between Mexico and the US, deals with the irrigation of the Juarez Valley. A 1916 Convention between the United States and Great Britain on behalf of Canada protects migrator y birds. 2. Multilateral treaties Perhaps the most significant MEA in suppor t of sustainable development is the UN Framework Convention on Climate Change, a treaty that has been signed by more than 175 nations and for which the total number of ratifications/accessions/acceptances is 120 throughout the world. The first sentence of paragraph 4 of Ar ticle 3 of this UN Convention states, “The Par ties have a right to, and should, promote sustainable development.” It fur ther provides in paragraph 1(d) of Ar ticle 4 that Par ties to this Convention must “Promote sustainable management, and promote and cooperate in the conservation and enhancement, as appropriate, of sinks and reservoirs of all greenhouse gases not controlled by the Montreal Protocol, including biomass, forests and oceans as well as other 201
AN
IN TRO DU C TIO N TO
S U S TA I N A B L E
DEVELO PM EN T
terrestrial, coastal and marine ecosystems.” Thus, the concepts of sustainable development as well as sustainable management have a firm foundation in a treaty with almost universal acceptance. P robl e m s A s s o c i a t e d w i t h M E As 1. Governance Since the Stockholm Conference of 1972, MEAs have been at the center of discussion of international environmental problems and the need for reform (see Box 7-7 on Governance). One of these problems arises from the large number of MEAs. Professor Daniel Esty and Maria Ivanova, Director of the Global Environmental Governance Project at Yale, indicate (2002, p. 182) that there are “more than 500 multilateral environmental agreements ... more than a dozen international agencies share environmental responsibilities, and yet environmental conditions are not improving across a number of critical dimensions.” Box 7-7. Governance
Robert Keohane and Joseph Nye Jr. (2000, p. 12) define governance: By governance, we mean the processes and institutions, both formal and informal, that guide and restrain the collective activities of a group. Government is the subset that acts with authority and creates formal obligations. Governance need not necessarily be conducted exclusively by governments and the international organizations to which they delegate authority. Private firms, associations of firms, nongovernmental organizations (NGOs), and associations of NGOs all engage in it, often in association with governmental bodies, to create governance, sometimes without governmental authority.
Esty and Invanova point out (2002, p. 183) that “The haphazard development of international environmental laws and agencies has left three impor tant institutional gaps in the existing global environmental governance system: (1) a jurisdictional gap, (2) an information gap, and (3) an implementation gap.” They also explain (2002, p. 186) that the jurisdictional gap arises from the perception held by national legislatures that their role does not include “addressing worldwide transboundar y harms, while global bodies often do not have the capacity or the authority to address them.” The information gap, they add (ibid.) arises from the “little coordination among data collection effor ts” of international and other organizations and “poor ... comparability across jurisdictions.” Esty and Ivanova also suggest (2002, p. 187) that the “implementation gap” may be the “biggest single obstacle to environmental progress at the global scale” and that this gap is caused by “the lack of an action orientation.” They also indicate (ibid.) that the implementation gap arises in par t from the “existing financial mechanisms ... scattered across the Global Environment Facility, UNEP, the World Bank, and separate treaty-based funds such as the Montreal Protocol Finance Mechanism.” They also explain (ibid.) that “few international environmental agreements contain serious enforcement provisions.” 202
L E G I S L AT I O N , I N T E R N AT I O N A L L AW, A N D M U LT I L AT E R A L E N V I RO N M E N TA L AG R E E M E N T S
2. Ratification and implementation Such problems related to the implementation of environmental agreements were addressed at the Global Judges Symposium on Sustainable Development and the Role of Law held in Johannesburg, South Africa, August 18-20, 2002. A 2002 UNEP publication, entitled “Status of Ratification of Selected Multilateral Environmental Agreements,” distributed at the symposium, identifies (2002, p. 1) key conventions and protocols that should be given “top priority in the environmental agenda” so that they will be ratified and implemented “through domestic legislation.” “To help in achieving the objectives of those agreements,” the UNEP publication indicates (ibid.) that UNEP is committed to promote and suppor t their ratification “and to assist countries in implementing those agreements under the Programme for the Development and Periodic Review of Environmental Law for the First Decade of the Twenty-first Centur y (Montevideo Programme III).” Of these, two treaties have yet to be ratified, as shown in Box 7-8. Box 7-8. Two Yet-to-Be Ratified MEAs
Two yet-to-be ratified MEAs listed in 2002 in “Status of Ratification of Selected Multilateral Environmental Agreements Published on the Occasion of the Global Judges Symposium on Sustainable Development and the Role of Law held in Johannesburg, South Africa”: • Amendment to the Basel Convention on the Control of Transboundary Movements of Hazardous Wastes and Their Disposal • Basel Protocol on Liability and Compensation for Damage Resulting from Transboundary Movements of Hazardous Wastes and Their Disposal Source: Global Judges Symposium
The Stockholm Convention on Persistent Organic Pollutants and the Rotterdam Convention on the Prior Informed Consent Procedure for Cer tain Hazardous Chemicals and Pesticides in Inter national Trade, both originally listed among the yet-to-be ratified MEAs, were ratified in 2004. This same UNEP publication identified 14 MEAs that had been ratified but needed assistance in implementation, as shown in Box 7-9. Since this UNEP publication, one of these 14, the Kyoto Protocol to the United Nations Framework Convention on Climate Change, was ratified in 2005. 3. US treaty ratification Beyond the insights offered by Esty and Ivanova, what are some of the other current problems from the legal point of view in implementing MEAs? Let us begin with the process of ratification in the US. From the perspective of US constitutional law, as pointed out by Assistant Legal Adviser for Treaty Affairs Rober t E. Dalton (1999, p. 190): …a treaty is an international agreement (regardless of title, designation, or form) whose entry into force with respect to the United States takes place only after the Senate has given its advice and consent pursuant to Article II, section 2, clause 2, of the Constitution and the President has signed the instrument of ratiication or accession on behalf of the United States. 203
AN
IN TRO DU C TIO N TO
S U S TA I N A B L E
DEVELO PM EN T
Box 7-9. Fourteen MEAs in Need of Assistance in Implementation
Fourteen MEAs in need of assistance of implementation, listed in “States of Ratiication of Selected Multilateral Environmental Agreements Published on the Occasion of the Global Judges Symposium on Sustainable Development and the Role of Law held in Johannesburg, South Africa” (2002) • Convention on the Conservation of Migratory Species of Wild Animals • Convention on International Trade in Endangered Species of Wild Fauna and Flora • Convention on Biological Diversity • Cartagena Protocol on Biosafety to the Convention on Biological Diversity • Basel Convention on the Control of Transboundary Movements of Hazardous Wastes and Their Disposal • Vienna Convention for the Protection of the Ozone Layer • Montreal Protocol on Substances That Deplete the Ozone Layer • United Nations Framework Convention on Climate Change • UN Convention to Combat Desertiication in Those Countries Experiencing Serious Drought and/ or Desertiication, Particularly in Africa • UN Convention on the Law of the Sea • Convention for the Protection of the World Cultural and Natural Heritage • Convention on Wetlands of International Importance Especially as Waterfowl Habitat • Convention on Access to Information, Public Participation in Decision-Making and Access to Justice in Environmental Matters • Rotterdam Convention on the Prior Informed Consent Procedure for Certain Hazardous Chemicals and Pesticides in International Trade Source: Global Judges Symposium
Ar ticle VI of the US Constitution provides that “all Treaties made, or which shall be made, under the Authority of the United States, shall be the supreme Law of the Land.” As Dalton points out (1999, p. 207), if the text of a par ticular agreement is given legislative approval, that legislation will generally include any necessar y implementing provisions. For example, when the US became a par ty to the Environmental Protocol to the Antarctic Treaty, the US Administration proposed implementing legislation; “in the course of drafting new legislation... the Administration found existing legislation that permitted the executive branch to implement other obligations.” (1999, p. 208.) 4. Ratification of treaties by other countries Other countries have other processes for ratification. Some have a two-step procedure by which a treaty may become binding and implemented in par t under international law, even though years may pass before appropriate domestic implementing legislation is enacted. The case of Nepal provides an example. As environmental law Professor Amber Pant of the Tribhuvan University Faculty of Law notes in a September 2003 e-mail message, Nepal enacted an Environmental Protection Act in 1997 and adopted accompanying rules that same year. 204
L E G I S L AT I O N , I N T E R N AT I O N A L L AW, A N D M U LT I L AT E R A L E N V I RO N M E N TA L AG R E E M E N T S
Fur thermore, Nepal has more than 100 legislative acts that bear on the environmental sector. However, more than 20 environmental treaties to which Nepal has become a par ty do not have legislation that fully implements treaty provisions by designating appropriate institutions and authorities and taking other necessar y steps. Pant points out, “It would be wrong to say that we have legislation for ever y treaty to which Nepal is a par ty.” He goes on to state that “this would not be possible unless we ... suggest to the Government that they draft legislation. …” Pant closes by suggesting that there is a lack of funds to engage “exper ts to…prepare draft legislation for the consideration of governmental authorities.” As a result of this two-step procedure, some treaties are called “paper tigers”; even though they have been ratified for the purposes of international law; since they have no implementing domestic legislation, they have no teeth. This creates an imbalance for countries like the US, which often proceeds slowly over many years before ratifying treaties, while some other countries ratify treaties relatively quickly and then enact implementing legislation a few years later. Concerning these other countries, note that Ar ticle 18 of the Vienna Convention on the Law of Treaties provides a “good faith” obligation for treaties signed but not ratified—“[an] obligation not to defeat the object and purpose of a treaty prior to its entr y into force.” 5. Different legal traditions Another problem arises from the great differences in the legal traditions of the countries of the world. Take the Philippines, which is far ahead of many Asian countries in terms of environmental law. Professor Antonio A. Oposa of the School of Law at the University of the Philippines recently published a 792-page treatise, entitled A Legal Arsenal for the Philippine Environment (2002), reproducing and describing the nation’s more than 200 environmental laws and 20 international environmental agreements. Significantly, the book (2002, p. v) opens with a quip: “To Filipinos, may we learn to make less laws; Instead, may we learn to make them work just a little bit more. ...” In this regard it is notewor thy that in 2003 only a half dozen of the Philippines’ 91 law schools taught environmental law, but that in 2005 about two dozen of them did. Many law schools in developing countries have inadequate libraries and do not have a single computer devoted to legal research and scholarship. Fur thermore, the schools may teach environmental law, but the facilities, the traditions, and the training are not the same as those found in developed countries. As a result, some developing countries lack lawyers, judges, and administrators with in-depth knowledge of environmental law. 6. Availability of financial resources The disparity in availability of funds among the various international environmental organizations can also be a problem. The Global Environment Facility (GEF), with headquar ters in Washington, D.C., is well funded, with a tranche of $2.92 billion. The GEF focuses on just a few treaties such as biodiversity, climate change, international waters, ozone, the Stockholm Convention on Persistent Organic Pollutants, and deser tification. Despite the shor t list of MEAs, the GEF has quite enough to do. On the other hand, UNEP, which was founded in 1975 with headquar ters in Nairobi, Kenya, 205
AN
IN TRO DU C TIO N TO
S U S TA I N A B L E
DEVELO PM EN T
expends in any one year less than $100 million on the entire range of international environmental issues, including drafting MEAs, capacity building, and global judges’ symposia. 7. Political will and the need for capacity building If the public does not suppor t a program, politicians are not likely to implement it. Also, on a worldwide basis, we lack legislators, administrators, lawyers, judges, entrepreneurs, and others who are sufficiently informed or have the resources to implement sustainable development within the many constraints that confront them. Many key decision makers did not have the oppor tunity to study environmental law when they were students, and they often lack the oppor tunity to attend workshops on relevant environmental topics now. Judges are poorly paid, as shown in Box 7-10. Perhaps because of these two aspects, many countries lack necessar y environmental legislation and implementation. Box 7-10. Judicial Remuneration
As indicated in an ADB publication prepared by the Asia Foundation (2003, p. 19), the importance of adequate judicial remuneration and fiscal resources for court administration was summed up by Singapore’s President Lee Kuan Yew, who remarked, ”You pay peanuts, you get monkeys.“ The disparities in judicial remuneration among the countries in this publication are striking. Moreover, in most countries in South and Southeast Asia…judicial salaries are not simply low but seriously inadequate. In some countries they are not even at subsistence levels. …In Thailand, as in the Philippines, judges are paid relatively well in comparison to judges in Lao PDR, Cambodia, and Viet Nam. Still, the average judicial salary is approximately US $3,000 per month, or US$36,000 per year. Likewise, in Pakistan, Nepal, and Bangladesh, judges receive inadequate compensation, though relatively higher salaries than judges in Southeast Asia. High court judges in Pakistan, for instance, receive only US$1,400 per month, or about US$16,800 per year, plus certain benefits, and other superior court judges earn slightly less. Source: The Asia Foundation, Judicial Independence Overview and Country-Level Summaries, ADB, 2003
When the people are aroused by a threatening situation, things do get done. Thailand has made enormous progress in controlling air pollution. There came a point when the people said they would not put up with dangerous, unbreathable air anymore. In a single year, Thailand practically eliminated the two-cylinder gasoline engine, which was a key pollutant. With the air cleaned up, the Thais are now turning their attention to cleaning Bangkok’s polluted canals. The PRC has ver y comprehensive environmental legislation and a leadership that increasingly emphasizes the impor tance of dealing with environmental issues. The countr y is on the way to improving and expanding that legislation. However, it needs to improve the implementation of its environmental legislation at the local level. The major work to be done relates to policy dialogue, finance, workshops, and publications, which together might be referred to as capacity building. Here the World Bank, the GEF, the regional banks, NGOs, universities, and think tanks will likely play a ver y significant role. An example of how 206
L E G I S L AT I O N , I N T E R N AT I O N A L L AW, A N D M U LT I L AT E R A L E N V I RO N M E N TA L AG R E E M E N T S
international organizations and many others can work together for capacity building is provided by an ADB grant of $600,000 to the Commission on Environmental Law of the IUCN and UNEP to train law professors from 15 countries spanning the region from Pakistan to the Fiji Islands, and to produce a book dealing with capacity building. Sixty-three law professors were trained at the Asia-Pacific Center for Environmental Law, located in the Faculty of Law of the National University of Singapore. The resultant book in two volumes, Capacity Building for Environmental Law in the Asian and Pacific Region: Approaches and Resources, was edited by three IUCN Commission on Environmental Law members, law professors Donna G. Craig, Nicholas A. Robinson, and Koh Kheng-Lian (2003), in conjunction with staff of ADB and about 200 other contributors. Thousands of copies of this book and an accompanying CD-ROM have been made available to professors, students, judges, and administrators. 8. Improving law schools and judicial academies While public awareness is crucial for suppor ting new environmental legislation, we also need better law schools and judicial academies to formulate and implement the legislation. Clearly, the role of UNEP needs to be expanded. If the GEF is spending almost $3 billion annually on about a dozen areas of concern, and UNEP has only about $100 million per year to handle ever ything else, there are bound to be problems. Simply put, UNEP is underfunded. It can approach many issues and do many things that the GEF cannot, because UNEP has a worldwide mandate. It can approach the judiciar y, playing an impor tant role in building capacity in the judicial branches of governments throughout the world. UNEP can also under take capacity building in educational institutions in ways that other organizations cannot or will not. 9. World Trade Organization, agricultural subsidies, and trade barriers Among the 14 agreements cited in Box 7-9, there is no mention of WTO. Yet the treaty establishing WTO is likely one of the most impor tant multilateral “environmental” agreements in the world, because it deals with a great many environmental issues under the heading of trade. For example, there is legislation in the US about net fishing, enacted to save the dolphin, the sea tur tle, and other endangered marine species. However, these laws can be construed as a restriction on trade. If Mexico ships fish to the US that were caught in violation of US legislation, someone can appear before the relevant bodies of WTO, which might decide the case in a manner not pleasing to environmental advocates (Hunter, Salzman, Zaelke, 2002, pp. 1169-1180). See Box 7-11 concerning trade disputes and protection of endangered species. In this regard it is of interest to note that in cases involving net fishing for tuna that resulted in catches of dolphins, recent WTO decisions have recognized the role of NGOs in advancing rules implementing international law. In these WTO cases, the US sought to require Thailand and others to cer tify that techniques for catching tuna were safe for dolphins. WTO allowed US environmental groups to submit amicus briefs, even though Thailand and others objected by suggesting that US NGOs represent the position of the US Government.
207
AN
IN TRO DU C TIO N TO
S U S TA I N A B L E
DEVELO PM EN T
Box 7-11. Trade Disputes and Protection of Endangered Species
Professor L. Damrosch et al. (2001, pp. 1534-1535) describe the role of WTO in resolving the tuna/dolphin dispute as follows: Environmental issues have arisen in a number of international trade disputes before the World Trade Organization. In the so-called Tuna/Dolphin dispute, the United States banned the import of tuna caught by Mexican fisherman without proper regard for dolphins. In 1991, this ban was ruled incompatible with the GATT [General Agreement on Tariff and Trade]. See Dispute Settlement Panel Report on United Nations Restrictions on Imports of Tuna, 4 World Trade Materials 20 (1992), 30 I.L.M. 1594 (1991). In the Shrimp Turtle case seven years later, a W.T.O. Panel came to the same result with regard to the U.S. import ban of shrimp from India, Malaysia, Pakistan and Thailand. ... On the appeal by the United States, this decision was partially overturned by the Appellate Body. ... In its decision of October 12, 1998, the Appellate Body made reference to major international environmental conventions, especially to the Convention on Trade in Endangered Species and the Convention on the Conservation of Migratory Species of Wild Animals, and held that the trade restraints imposed by the U.S. regime served a legitimate environmental objective and were not incompatible with the GATT. However, the Appellate Body found that, while the environmentally based trade restraints were not themselves contrary to the GATT, the United States had contravened the GATT by applying those restraints unilaterally in a discriminatory manner. The Appellate Body accepted the amicus curiae briefs of three groups of non-governmental organizations from the U.S. submission. ... Concluding its decision the Appellate Body underlined (paras. 185-186): …We have not decided that the sovereign nations that are Members of the WTO cannot adopt effective measures to protect endangered species, such as sea turtles. Clearly they can and should. And we have not decided that sovereign states should not act together bilaterally, plurilaterally or multilaterally, either within the WTO or in other international fora, to protect endangered species or to otherwise protect the environment. Clearly they should and do. What we have decided in this appeal is simply this: although the measure of the United States in dispute in this appeal serves an environmental objective that is recognized as legitimate under paragraph (g) of Article XX of the GATT 1994, this measure has been applied by the United States in a manner which constitutes arbitrary and unjustifiable discrimination between Members of the WTO, contrary to the requirements of the chapeau [hat] of Article XX. ...
For an example of how the Car tagena Protocol regulates trade in genetically modified organisms, see Box 7-12. A second example relates to the rules permitting agricultural subsidies and the creation of trade barriers. These rules can have a profound effect on the environment. For example, subsidies can often result in wasteful overproduction of goods and ser vices that unnecessarily deplete natural resources in the countr y providing such subsidies. Similar problems may arise from trade barriers, which can prevent the sale of economically and environmentally sound goods and ser vices originating in countries outside of such trade barriers. (See http://www.ewg.org/farm/home.php.)
208
L E G I S L AT I O N , I N T E R N AT I O N A L L AW, A N D M U LT I L AT E R A L E N V I RO N M E N TA L AG R E E M E N T S
Box 7-12. Genetically Modified Organisms
Professors Lori Fisler Damrosch, Louis Henkin, Richard Crawford Pugh, Oscar Schachter, and Hans Smit describe the treatment of genetically modified organisms under the Cartagena Protocol as follows (2001, pp. 1536-1537): Whether biotechnology involving the release of genetically modiied organisms (GMOs) threatens the environment has become an issue for governments and international organizations. A Protocol on Biosafety, the irst global regime regulating trade in GMOs, was adopted on January 29, 2000 and is to enter into force after ratiication by 50 states. As the negotiations began in Cartagena, Colombia, the protocol is referred to as the Cartagena Protocol. The biosafety regime is a protocol to the 1992 Convention on Biological Diversity. Consequently a state that has not become a party to the Convention (for example the United States) cannot become a party to the Protocol. Nevertheless, a state not party to the Protocol will have to comply with its provisions when exporting to states parties to the Protocol. The Biosafety Protocol allows its member states to bar imports of genetically altered seeds, microbes, animals and crops they regard as a threat to their environment. But the Protocol provides no requirement that shipments of genetically altered products identify the specific variety, a provision proposed by Europeans. The United States and Canada refused to agree to that requirement, claiming it would harm international trade in safe foods. In the last years, European resistance to American food products (about half the soybeans and one-third of the corn grown in the U.S. in 1999 contained foreign genes, making the crops resistant to herbicides or insects) has caused significant U.S. export losses. See “130 Nations Agree on Safety Rules for Biotech Food,” N.Y. Times, Jan. 30, 2000, at 1, 8. The Protocol requires exporting states to apply for advance permission from the importing country before shipping of a particular living GMO (seeds, living fish for example) meant for release into the environment. Such advance permission is not required for exports of agricultural commodities meant for eating or processing, hence not released into the environment. After a crop has been approved for commercial use in one country, that country is obliged to send information about it to an Internet-based biosafety clearinghouse. Other countries are then free to decide whether or not they are willing to accept the imports. The aim is to ensure that recipient countries have both the opportunity and the capacity to assess risks involving the products of genetic modification. This may be viewed as an application of the precautionary principle allowing a state to take action to protect itself even if there is no scientific certainty that the (barred) import of a GMO would be dangerous. The Protocol does not apply to human pharmaceuticals.
Tre a t y R o l e s fo r N o ngove rn m ent Or g anizations It is also possible that NGOs might be the wave of the future in dealing with some of these problems. NGOs have the capability to approach people on a one-on-one basis. Rather than dealing with problems from afar, NGO personnel are in the villages, on the farms, and in the forests, applying hands-on solutions. As a result, NGOs can accomplish many impor tant things that governments have a difficult time doing. It is also wor th noting that some international NGOs like IUCN (see Box 7-13) have annual budgets and a cadre of employee roles equal to the budgets and employee cadres of UNEP.
209
AN
IN TRO DU C TIO N TO
S U S TA I N A B L E
DEVELO PM EN T
Box 7-13. The World Conservation Union (IUCN)
Following an international conference in Fontainebleau, France, the International Union for the Protection of Nature (IUPN) was founded on October 5, 1948 (W.M. Adams, 2001, p. 91). In 1956, the organization changed its name to the International Union for Conservation of Nature and Natural Resources (IUCN). In 1990, its name was shortened to IUCN—The World Conservation Union. A recent example of an IUCN contribution to international environmental law is the Convention on Biological Diversity, one of the key products of UNCED in Rio de Janeiro in 1992. According to W.M. Adams (2001, p. 91), IUCN, in conjunction with other international organizations (including the WWF, UNEP, the World Resources Institute, and the World Bank), prepared a draft convention on biodiversity in the mid-1980s. Kiss and Shelton describe (2000, p. 103) IUCN in similar terms by stating that it “has played an essential role in the elaboration of some half dozen major international conventions relating to the conservation of nature and natural resources, including the 1968 African Convention, the 1973 Washington Convention on Trade in Endangered Species (CITES), and the 1979 Bonn Convention on Migratory Species.” Some 140 countries contribute members, including over 70 states, 100 government agencies, and more than 750 NGOs. Today IUCN has 1,000 staff members in offices located throughout the world working on some 500 projects. IUCN also has many volunteers, including more than 10,000 internationally recognized scientists and experts from more than 180 countries serving on its six global commissions. For example, some 800 members of the IUCN Commission on Environmental Law seek to advance environmental law both by developing new legal concepts and instruments and by building the capacity of societies to employ environmental law in support of the IUCN mission. To respond to requests to build environmental law capacity in developing countries and economies in transition, in November 2003, the Commission on Environmental Law of IUCN launched a new scholarly network of environmental law faculties and professors: the IUCN Academy of Environmental Law, a consortium of specialized research centers in university law faculties throughout the world. See
S O M E E A R L Y C O N T R I B U T I O N S T O E NV I R O N M E N T A L L AW A N D S U S T A I N A B L E D EV E L O P M E N T B Y L AW YE R S , S C H O L A R S , A N D J U D G E S Thomas Jefferson, a ver y capable lawyer known for his contributions to the US Declaration of Independence, summarized the concept of sustainable development in eight words (Talbot Page, 1997, p. 580): “The ear th belongs in usufruct to the living.” In layman’s terms, “usufruct” means “you may use the fruit.” There is, of course, a more precise definition of “usufruct” (a word used by the Romans more than 2,000 years ago). In Black’s Law Dictionar y (1999, p. 1542), it is defined as the “right to use another’s proper ty for a time without damaging or diminishing it, although the proper ty might naturally deteriorate over time.” 210
L E G I S L AT I O N , I N T E R N AT I O N A L L AW, A N D M U LT I L AT E R A L E N V I RO N M E N TA L AG R E E M E N T S
Adam Smith, a contemporar y of Jefferson, noted the impor tance of the social dimensions of development in his book, The Wealth of Nations, published in 1776 (1976, p. 88): But what improves the circumstances of the greater part can never be regarded as an inconveniency to the whole. No society can surely be flourishing and happy, of which the far greater part of the members are poor and miserable. Pa c i f i c F ur S e a l s C a s e From the legal point of view, the concept of sustainable development began more than 100 years ago with the Behring Sea fur seals fisheries case, decided in international arbitration. According to Philippe Sands (2003, p. 306): Indeed, the inherent features of the concept have been an aspect of international legal relations since at least 1893, when the United States asserted a right to protect Pacific fur seals, for the benefit of mankind, from wanton destruction, in opposition to the assertion by Great Britain that its nationals were entitled to exploit these resources for their own developmental purposes.” [footnote omitted] Fir s t Tre a t y R e fe re n c e t o S ustainable Development Pr ior to B r undtland According to Sands (2003, p. 307), the first formal treaty to refer to sustainable development was a 1985 ASEAN Agreement on the Conser vation of Nature and Natural Resources. Two years later the Brundtland Commission Repor t (1987, Vol. I, p. 90), which helped bring together the fields of study in development and environment, gave us the leading definition of sustainable development: “development that meets the needs of the present without compromising the ability of future generations to meet their own needs.” Sands’ review of the development of the concept of sustainable development in international agreements such as this 1985 ASEAN Agreement indicates (2003, p. 254) that: [f]our recurring elements appear to compromise the legal elements of the concept of “sustainable development,” as reflected in international agreements: 1. the need to preser ve natural resources for the benefit of future generations (principle of intergenerational equity); 2. the aim of exploiting natural resources in a manner which is “sustainable,” or “prudent,” or “rational,” or “wise or appropriate” (the principle of sustainable use); 3. the “equitable” use of natural resources, which implies that use by one state must take account of the needs of other states (the principle of equitable use, or intragenerational equity); and 4. the need to ensure that environmental considerations are integrated into economic and other development plans, programmes and projects, and that development needs are taken into account in applying environmental objectives (the principle of integration). 211
AN
IN TRO DU C TIO N TO
S U S TA I N A B L E
DEVELO PM EN T
Sands subsequently points out (2003, p. 266) that “[i]nternational law recognizes a principle (or concept) of sustainable development, which includes ‘the acceptance, on environmental protection grounds, of limits placed upon the use and exploitation of natural resources,’ as reflected in international agreements.” Et h i c s a nd E nv i ro nme nt a l L aw In his ar ticle on “The ‘Ascent of Man’: Legal Systems and the Discover y of an Environmental Ethic,” Nicholas Robinson (1998, reprinted 2003, Vol. I, p. 101), IUCN Legal Advisor and Chairman of the IUCN Commission on Environmental Law, begins by pointing out that ethics played a crucial role in the evolution of environmental law, which he traces from Ralph Waldo Emerson’s “seminal essay, ‘Nature,’ [written] in 1836,” through Aldo Leopold, Alber t Schweitzer, and Rachel Carson in1962. Robinson describes this evolution in par t as follows (ibid.): Leopold would have us extend our human ethics that permit civilized behavior among people, to embrace the living systems of the land as a part of our community of interdependent parts. ... Albert Schweitzer had found the same truth in the tropical nature of Africa: “Ethics is nothing else than reverence for life.” When we neglect this ethic and choose to destroy agricultural “pests” with pesticides that also widely kill or harm other life forms and impair the relationships which exist among these, we may well end up destroying our song birds, and more, and bringing cancers to ourselves as Rachel Carson described in Silent Spring. Robinson continues (1998, reprinted 2003, Vol. I, p. 103) by describing how “laws…harmonize human conduct with…science…human health and ecological systems”: Most of our environmental laws today seek to harmonize human conduct with what we have found science telling us about how best to sustain human health and ecological systems. We identify and contain externalities that our economic markets disregard. We seek to safeguard species threatened or endangered with extinction through the Endangered Species Act or the Convention on the International Trade in Endangered Species (CITES). …We detect acid snow and rain, perceive how they interrupt the food chain and reproductive systems of biota, and in turn, seek to use the Clean Air Act to eliminate the precursors of water vapor pollution. One of the most recent contributions to ethics and environmental law is the Ear th Char ter, which is described on its website (see ) as “an authoritative synthesis of values, principles, and aspirations that are widely shared by growing numbers of men and women in all regions of the world.” The Ear th Char ter was formulated by the “Ear th
212
L E G I S L AT I O N , I N T E R N AT I O N A L L AW, A N D M U LT I L AT E R A L E N V I RO N M E N TA L AG R E E M E N T S
Char ter Commission, which began work in early 1997 to oversee consultations and drafting processes and to approve a final version of the Char ter, which was released in March 2000, following a Commission meeting in Paris at the UNESCO headquar ters.” Joha n n e s b u rg P ri n c i pl e s o n the Role of Law and S ustainable Development On August 20, 2002, judges representing 59 countries at the Global Judges Symposium on Sustainable Development and the Role of Law adopted the Johannesburg Principles on the Role of Law and Sustainable Development. The second page of the Principles emphasizes (2002, p. 12) the concept of sustainable development, including reducing pover ty, for the present and succeeding generations: We emphasize that the fragile state of the global environment requires the Judiciar y as the guardian of the Rule of Law, to boldly and fearlessly implement and enforce applicable international and national laws, which in the field of environment and sustainable development will assist in alleviating poverty and sustaining an enduring civilization, and ensuring that the present generation will enjoy and improve the quality of life of all peoples, while also ensuring that the inherent rights and interests of succeeding generations are not compromised. Accordingly, these judges agreed with the third page of the Principles on the need for guidance for the judiciar y, including “full commitment to contributing towards the realization of the goals of sustainable development through the judicial mandate to implement, develop and enforce the law, and to uphold the Rule of Law and the democratic process.” The agreed upon program of work, included on page 14, calls for “strengthening of environmental law education in schools and universities, including research and analysis as essential to realizing sustainable development” as well as the “achievement of sustained improvement in compliance with and enforcement and development of environmental law.”
CONCLUSION The roots of environmental legislation, international law, MEAs, and sustainable development reach back into ancient times. Some might even suggest that the notion that we can stop our neighbor from polluting our backyard comes from such philosophers as Confucius, who in his lifetime from 551 to 479 B.C. wrote: “What you do not want done to yourself, do not do to others.” (Bartlett’s, 2002, p. 62.) Just as ethics has played a key role in the modern development of sustainable development, so have Greek and Roman law. In about 347 B. C., Plato formulated a law concerning water pollution, as described in Box 7-14.
213
AN
IN TRO DU C TIO N TO
S U S TA I N A B L E
DEVELO PM EN T
Box 7-14. Plato on Water Pollution Law in about 347 B.C.
And let this be the law:--If any one intentionally pollutes the water of another, whether the water of a spring, or collected in reservoirs, either by poisonous substances, or by digging, or by theft, let the injured party bring the cause before the wardens of the city, and claim in writing the value of the loss; if the accused be found guilty of injuring the water by deleterious substances, let him not only pay damages, but purify the stream or the cistern which contains the water, in such manner as the laws…order the purification to be made by the offender in each case. (Plato, 1982, p. 740)
Box 7-15. Criticism of International Law
In a classic article dealing with such questions as “whether there is such a thing as international law” and “how efficient is international law?” John H.E. Fried (1998, edited by Ku and Diehl, pp. 25, 26, 29, 32,42,45) lists under four headings some criticisms of international law:
1)“International law is so weak and defenseless...that only dreamers would put any reliance on it.” 2) “International law is so vague ... that, with some juggling and legalistic gymnastics it can be made to serve virtually every policy.” 3) “... Its basic weakness is the absence ... of a reliable, powerful, impartial enforcement machinery. …” 4) “International law is unfortunately still in its infancy. … [n]ot too much reliance can unfortunately be bestowed on international law. …” In response, Fried replies in part that an international law expert like “Leo Gross has pointed out, not only that ‘ states by and large obey international law’ but that this fact of fairly general obedience ‘is commonly accepted’ [footnote omitted.]” Fried continues by quoting another expert, who describes the general applicability of the problem of enforcement: The enforcement of law is a troublesome matter. Even in well developed countries like the United States the number of thefts that go unpunished, or the breaches of contract that bring no recompense to the wronged parties, make shocking figures. Concerning enforcement difficulties, Fried also points out that international law confronts the same problem as constitutional law: Much of the constitutional law of individual countries wrestles with the same problem as does much of international law: viz., how to regulate the behavior of large collectives. ... Whereas the reliability of the policeman’s arresting the thief is so often held up as a reproach to international law, the actual frailty and frequent unenforceability of the highest level of domestic law, namely, constitutional law, is hardly ever mentioned in this connection. Fried concludes in part by arguing “a remarkable superiority of international over domestic law”:
…the basic tenets of international law are more stable and reliable, more resilient and less destructible than are the allegedly irm, but actually often fragile, basic laws of constitutions of nations. 214
L E G I S L AT I O N , I N T E R N AT I O N A L L AW, A N D M U LT I L AT E R A L E N V I RO N M E N TA L AG R E E M E N T S
One of the strongest international law foundations for sustainable development is the UN Framework Convention on Climate Change, a multilateral environmental agreement ratified by an overwhelming majority of the planet’s countries, which incorporates the phrase “sustainable development,” effectively giving that phrase legal sanctity throughout the world. Though some might suggest that international law is weak, vague, unreliable, and still in its infancy, as described in Box 7-15, such international treaties are par t of the “supreme Law of the Land” as specified in the US Constitution and have similar status in the constitutions of most other countries. Kiss suggests (2003, p. 9) that “sustainable development should be considered as a concept,” with the content for this concept provided for in the following duty and six basic principles of the Declaration of the International Law Association during its conference in New Delhi in April 2002. These are the principles of international law in the field of sustainable development that “have been proposed to establish its concrete content”: 1. The duty of the States to ensure sustainable use of natural resources. 2. The principle of equity and the eradication of pover ty. 3. The principle of common but differentiated responsibilities. 4. The principle of the precautionar y approach to fields such as health, natural resources and ecosystems. 5. The principle of public par ticipation and access to information and justice. 6. The principle of good governance. 7. The principle of integration and interrelationship, in par ticular in relation to human rights and social, economic and environmental objectives. As Kiss points out, these principles must be implemented through policies dealing with such matters as land-use planning, energy, soil protection, education, and capacity building. Kiss fur ther points out (2003, pp. 14-15) that implementation of each such policy involves legal measures, good institutions, and good norms, and that among these legal measures are international conventions, constitutional provisions, statutes providing basic ser vices such as water, statutes protecting the environment, relevant regulations, and judicial decisions. To achieve all of this, much will need to be done, par ticularly with respect to awareness raising, education, training, and capacity building. From the legal perspective, each person will need to contribute both individually and through par ticipation with others to the formulation of sustainable development policies, and then to the conversion of these policies into enforceable laws. Significant suppor t will likely be required for such international organizations as UNEP, for development banks, for governments, and for schools and universities. The lack of suppor t for such basic institutions as judicial academies and law schools as well as insufficient salaries for judges constitute two of the leading problems in the worldwide effor t to achieve sustainable development.
215
C H A P T E R
8
SOCIAL DIMENSIONS AND POLICIES
AN
IN TRO DU C TIO N TO
S U S TA I N A B L E
DEVELO PM EN T
T
he social dimension is sometimes referred to as the third dimension of sustainable development (the others being the economic and environmental dimensions). 1 The world’s GDP has been growing at a robust rate. In Asia, GDP trebled from 1975 to 2000. Even South Asia, which is the poorest par t of the region, doubled its GDP growth within the same period. However, despite a healthy growth rate in GDP, one in ever y five persons in this world, including a significant majority of women and girls, is living below the pover ty line (income of less than $1 per day) and one of ever y two lives on less than $2 per day. As a consequence, the third dimension of sustainable development, the social dimension, gained prominence in the late 1980s. It was also because people became aware of the fact that they should be able to par ticipate in the developmental decisions made on their behalf either by the government or by some external agency (Box 8-1). Box 8-1. Cake of Culture
The social domain—society—is best understood as a complex set of interacting cultural and institutional systems that vary from one place to another. All have bodies of knowledge for adapting to the physical environment; modes of producing and exchanging goods and services; systems for finding partners, raising children, and inheriting property; arrangements for public decision making and conflict management; bodies of belief and related rituals; and systems of prestige or ranking, and aesthetics. From the outside the complexity and dynamism of these interacting systems are mind boggling. Viewed from the inside by the people who constitute a society, they fit together in a sensible and seamless way, and individuals’ attitudes and behaviors reflect the values and pressures that they have internalized while growing up. This holds true whether people live as hunters and gatherers, nomads, agriculturalists, or in complex urban centers, and it applies equally under socialist or capitalist regimes. Social development is about helping people, whatever their circumstances, to overcome poverty by learning new skills, securing access to legal and other rights, developing new ways of organizing and managing their societies, and exercising responsibility for continuing change processes.
Governance and Politics public Decision making Authority-coercion and influence Legitimacy Leadership-succession Law-substantive and procedural
Belief and Values
Politics and Family Decisions Economics
Environment
Modes of Production • hunting and gathering • nomadism • agriculture (intensification) • urbanization
Exchange reciprocity with social organizations redistribution market
Source: Based on a lecture by Jay Palmore 1
The authors thank Anne Sweetser and Eugenia McGill for their insightful contributions to this chapter.
218
SOC I AL
• • • • • • • • • •
D I M E N S I O N S AN D
P O LIC IES
This chapter discusses ten social dimensions of sustainable development: pover ty reduction par ticipator y development consensus building nongovernment organizations gender and development involuntar y resettlement indigenous peoples social exclusion social analysis social development indicators
ERADICATION
OF
POV E R T Y
Pover ty is the most significant socioeconomic dimension of sustainable development. The most obvious aspect of pover ty is physical: hunger, disease, long hours of work, unhealthy work environments, substandard housing, the lack of basic necessities, and inadequate income. However, there is a legal aspect: of all people, the poor have the greatest difficulty in claiming rights to ser vices and accessing justice. There is also an emotional aspect of pover ty: the humiliation of dependency, powerlessness, and shame because of social exclusion. Finally, for the poor, there is a moral issue as well: having to make painful decisions based upon budgetar y constraints: Should limited funds be devoted to buying more food, sending the children to school, or attending to the medical needs of a family member who is critically ill? Because the poor have limited choices, they are often targets for unscrupulous merchants. In the City of Manila in the Philippines, poor people have no option but to buy their water from street venders, to whom they pay on average three times the price that middle- and upper-class households do to buy piped water from the water authorities. Pover ty, as defined by UNDP, takes into consideration the lack of essential human capabilities, notably literacy and nutrition. UNDP also created a human pover ty index, which is basically a measure of deprivation and basic human development determined by three factors: the percentage of people who are expected to die by the age of 40; the percentage of adults who are illiterate; and the overall economic provisioning, which is the GDP per capita. Wo rl d Ba nk S t u d y If pover ty is so painful, why is it not being addressed? To get an answer to this question, the World Bank financed a major study in 1999 called “Consultations with the Poor,” featuring 81 par ticipator y exercises. Some 60,000 poor men and women from 50 developing countries were asked what they thought about their plight. The study concluded that keys to overcoming pover ty are security (from violence as well as hunger and physical deprivation), oppor tunity (to enjoy good health, go to school, and obtain decent work), and empowerment (for engaging in 219
AN
IN TRO DU C TIO N TO
S U S TA I N A B L E
DEVELO PM EN T
both personal and public decision making). The World Development Repor t 2001 (World Bank, 2001), which was based on this study, drew five major conclusions about pover ty. 1. Poverty is multidimensional. Six elements feature prominently in how the poor define pover ty. First is lack of income and assets. Second is hunger and lack of food. Third is lack of access to basic infrastructure such as shelter, clean water, energy, and transpor tation. Four th is lack of access to education, which the poor cannot afford, though it is crucial, and is their only escape from the cycle of pover ty. Fifth is poor health and illness, which are also indicators of pover ty. Sixth is social exclusion, whereby the poor see themselves as voiceless and not a par t of the society making decisions. 2. The state has been largely ineffective in reaching the poor. It is generally recognized that national, regional, and local governments need to reach out to the poor. However, the respondents felt that their lives remained unchanged due to government inter ventions or lack thereof. The poor repor t extensive government corruption in those areas that most affect their lives: health ser vices, education, relief assistance, and employment. To be fair, the poor admit that there are some state officials and politicians who are good, honest, and incorruptible; but they also say that the number is so small that they cannot make any significant changes in their lives. The poor also repor t that law enforcement agencies are more brutal and corrupt in their neighborhoods than elsewhere, and feel safer without such agencies in their communities. They fur ther feel that gender discrimination is prevalent, despite official slogans about gender equality. 3. The poor have mixed impressions about the efficacy of NGOs. Many poor people feel that the role of NGOs in their lives is limited. Although they complain to a much lesser extent about NGOs than the state, they repor t that NGOs in many instances are self-ser ving, corrupt, poor listeners, and largely irrelevant to their communities. So in another example of resilience, the poor rely more on informal trust-based networks within their communities, or with similar outside groups with access to power—than on either NGOs or the government. 4. Many households are disintegrating. This happens when men fail to earn enough to feed their families, due either to ill health or to harsh economic conditions. Women, on the other hand, may take any job, no matter how demeaning, dangerous, or illegal, as long as it puts food on the table. Hopelessness, shame, and degradation in the quality of life are known to be the prime correlates of alcoholism and domestic violence among the poor. This is especially true in some societies where women are compelled to become the sole wage earners, fur ther undercutting men’s self-esteem. That women are capable breadwinners in a modern economy as well as in many traditional societies can be gleaned from the figures presented
220
SOC I AL
D I M E N S I O N S AN D
P O LIC IES
by the microfinance banks. Ninety-four percent of the clients at the Grameen Bank are women taking out loans to star t up and later expand home- or village-based cottage industries. 5. The social fabric in poor communities is unraveling. The pressures of pover ty gnaw at the family structure and eventually corrode its integrity. From the perspective of the poor, given the failure of both the government and NGOs to improve their condition, their only insurance is their dependence on each other. But with perpetuating pover ty and a sense of hopelessness, even these bonds of trust and reciprocity—the hear t of social capital—are strained or disappearing. ADB Study Just about the same time as the World Bank published its findings, ADB published a repor t entitled “Reducing Pover ty: Major Findings and Implications” (Asian Development Bank, 1999). While the World Bank study covered 50 countries and was limited to inter viewing only the poor, the ADB study restricted itself to just 10 countries and involved not only the poor but also other stakeholders, including NGOs, other civil society groups (such as universities, business foundations, professional associations, labor unions, and religious organizations), the government, and the financial institutions that are tr ying to reduce pover ty. The purpose of the ADB study was different. It was tr ying to determine the major issues surrounding pover ty and to create a plan of action with its stakeholders that would reduce pover ty. ADB also redefined pover ty as the amount of money that a person needs to meet minimum consumption requirements. The ADB study tried to build a framework for pover ty reduction entailing three factors: economic growth, population growth, and distributional effectiveness. The latter is to be determined by the percentage of GDP growth that is devoted to government projects designed to create employment and assets in overpopulated, underdeveloped, pover ty-stricken areas. In relation to each of these three factors, there are three sets of criteria that need to be defined for pover ty reduction: the policy environment, institutional factors, and the program focus (Table 8-1). The following section presents general criteria and guidelines for reducing pover ty through economic growth, distributional effectiveness, and population growth. Ec o n o mi c G rowt h 1. Policy environment Growth must be stimulated in pover ty-stricken areas through the allocation of resources. Economic growth must be market friendly, generally demand-driven and not supply-driven; but since pover ty is often locality-specific, economic growth to reduce pover ty can depend on such supply-side ser vices as access to information, training, and education, plus access to health ser vices, land, credit, and an effective judicial system.
221
AN
IN TRO DU C TIO N TO
S U S TA I N A B L E
DEVELO PM EN T
Table 8-1. Elements of a Poverty Reduction Strategy POLICY ENVIRONMENT
INSTITUTIONAL FACTORS
PROGRAM FOCUS
• Free of political distortions • Efficient • Accountable • Eliminate corruption • Performance-rewarding • Demand-based •Transparent
• • • •
• Effective participation of poorer communities • Effective participation of women • Effective participatory planning • Minimum political distortion • Accessible labor markets • Mobile labor force • Client-focused government agencies • Program transparency/ accountability • Pro-poor judicial system • Social capital strengthened
• Targeted programs for: –impoverished areas/sectors –empowered ethnic groups –women • Basic health care • Basic education • Basic infrastructure
• Gender-sensitive institutions/ staff • Effective mother/child health centers • Significant number of female teachers/health workers
• Targeted economic growth in areas of high population growth • Female education and empowerment
A. Economic Growth • Market friendly • Sound fiscal policies • Unsound public enterprises divested • Inflation-controlled • Sound use of subsidies • Sound labor market • Environmental sustainability • Limited government borrowing
Financial sector stability Established capital market Stable government policies Essential infrastructure
B. Distributional Effectiveness • Labor-intensive growth • Universal education • Pro-poor government subsidies • Effective, broad-based tax collection • Needs-based resource allocation • Efficient/equitable social safety nets • Minimum labor standards in place • Land tenancy titling reform • Accessible courts
C. Population Growth • Reproductive health access for men and women • Universal education for girls
Source: ADB (1999)
222
SOC I AL
D I M E N S I O N S AN D
P O LIC IES
Sound fiscal management is one of the criteria for a good policy environment that will reduce pover ty. Nonfunctioning public enterprises, on the other hand, are counterproductive and should be eliminated or turned over to the private sector. Many public enterprises in developing countries simply do not work. For example, in India, the sugar industr y and public sector/government-run manufacturing plants would be more effective if they were turned over to the private sector. The use of subsidies has become a controversial issue, but the sound use of subsidies can be a means of reducing pover ty, if the subsidies benefit primarily the poor and not the rich. Subsidizing large farms can undercut farmers with small plots and have a negative effect on pover ty reduction. However, in some instances, a subsidy can be effective in helping the poor. For example, the water rates in many cities are based on a step-by-step approach. The price of the first few cubic meters of water consumed is low; then the tariff increases as consumption increases. The minimum subsidized rate fulfills the basic needs of the poor. Effective public investment is another means of reducing pover ty. The word “effective” here means that public investment will be designed to ser ve the purposes of the poor and that it is not driven primarily by inappropriate, shor t-term political maneuvers to buy votes. Environmental sustainability is a significant factor under policy environment. It means, among other things, stopping illegal logging and upstream pollution, and careful management of common proper ty resources. 2. Institutional factors In discussing pover ty reduction, economic growth decisions should be free from political manipulation. Project proponents should be efficient and accountable. The government must promote transparency and work to eliminate corruption of all kinds and at all levels. Finally, economic growth should be demand-based and reward performance by providing incentives to do well. 3. Program focus Economic growth should be based on sustainable development principles, meaning that any project or program implemented must be equitable, economically viable, environmentally sound, and socially inclusive. Program focus should also consider basic infrastructure, stability of the financial sector, and national development programs. These should be designed for the majority of the people, preferably following priorities they have ar ticulated, not for a small, influential group that wants a project in its area. Financial sector stability is impor tant because it influences the global economy. The financial meltdown in Asia in 1997-1998 affected not only the economies of that region but also the economies of the entire world. Di s t ri but i o na l E f fe c t i ven e s s Economic growth is not a sufficient condition for pover ty reduction. Equitable distribution of economic growth, or at least more equitably than we have seen, can be equally impor tant. Therefore, we have to look at distributional effectiveness, and here there are different concerns 223
AN
IN TRO DU C TIO N TO
S U S TA I N A B L E
DEVELO PM EN T
under policy environment, institutional factors, and program focus. These are overlapping, because, after all, economic growth also has to take into account basic needs. 1. Policy environment The policy environment that would distribute income better would include labor-intensive growth and minimum labor standards in terms of minimum wage, health, and occupational safety. Universal education is an important ingredient under policy environment in promoting better distribution. It is like the parable of the ish and the ishing net: Give someone a ish and he or she will be hungry again the next day. Give him or her a net, and he or she may never be hungry again. Give the poor an education and appropriate job training and they will be able to develop marketable skills. Pro-poor government subsidies; needs-based resource allocation, financial and human; and efficient and equitable social safety nets are all essential elements of reducing pover ty through better distribution of income. Some suitable subsidies would be social protection funds, food coupons, a subsidized health-care system, and subsidized housing for the people in abject pover ty. Land tenancy is impor tant and should be available to both men and women, with husbands’ and wives’ names listed on deeds. The goal of joint titling is broad: to ensure that both husband and wife consent to any sale or mor tgaging of their land; if the husband migrates for work, the wife will be a recognized owner of the proper ty in the event of a land dispute; if the husband divorces the wife, she has a legal claim to the land; and if the husband predeceases the wife, she will not be dispossessed by other relatives. The deed to land tenancy inspires responsibility for a resource. Without it, the poor, in many cases, inadver tently degrade the environment, thus contributing to the perpetuation of a vicious cycle of pover ty: A degraded environment causes pover ty, and pover ty causes a degraded environment. Accessible cour ts are impor tant. In many cases—whether involving environmental degradation, injustice, or violence—there may be laws in the countr y to address the problem. But as much as the poor wish to apply a law or enforce a regulation, they cannot, because they lack access to either the law, the legal framework, or the cour ts. It is often beyond the capacity of poor people, par ticularly women, to take a case to cour t. Even if they do, and they win, it is almost impossible for them to enforce the judgment. Many governments are not client-focused. Yet pover ty reduction requires client-focused government agencies. Program transparency, ongoing capacity development, a pro-poor judicial system linked with accessible cour ts, suppor t for networks of association or social capital, and social strengthening all fall under the policy environment. 2. Institutional factors Effective par ticipation of poorer communities is impor tant for distributional effectiveness, an improvement in the par ticipation of women, and minimum political distor tion. Well managed decentralization—creation of oppor tunities for local and regional governments to take increasingly more responsibility for planning and implementing development activities and devolution or allocation of responsibility for managing the resources involved—may contribute to 224
SOC I AL
D I M E N S I O N S AN D
P O LIC IES
capacity development throughout a society. However, there is a risk that local elites may “capture” the devolved responsibilities and resources. Transpor tation is also a relevant institutional factor. A mobile labor force is impor tant, because often the poor cannot reach employment even when it is available and cannot get their products to market even though markets exist and poor citizens have knowledge of these. 3. Program focus Better distribution of income means targeted programs for impoverished areas, sectors, and groups. Such program focus should be on basic health care and education, water supply and sanitation, and basic infrastructure. Pop u l a t i o n G row t h 1. Policy environment There should be access to reproductive health care for both men and women; to primar y and secondar y education, par ticularly for girls; and to effective family and population planning. In fact, many Asian countries have population policies and programs, and there has been remarkable progress in expanding access to contraceptives and lowering fer tility rates over the past 30 years, even in rural areas. Attitudes are also changing. 2. Institutional factors Institutional factors include gender-sensitive institutions. What is the percentage of women who hold government jobs? Even though some women in Asia are holding positions of political leadership, the percentage of females staffing government positions, par ticularly high-level ones, in propor tion to the total female population, is still ver y low. Attention might be given to the roots of limited public roles for women in age- and gender-governed patterns of decision making and control of resources within households and in communities. 3. Program Focus In areas with high population, targeted economic growth should stress education and empowerment of women as program goals. Reduc i n g Pove r t y : P ra c t i c a l M eans The first of the eight MDGs is to reduce by half the propor tion of people earning less than $1 per day by 2015 and by half the propor tion of people suffering from hunger, also by 2015. To achieve this first goal, countries and communities must set their policy environment, institutions, and program focus along the lines just described under economic growth, population planning, and better distribution of income. ADB has suggested some generic guidelines for pover ty reduction: invest in social infrastructure, health, education, water supply, and sanitation; establish special programs like 225
AN
IN TRO DU C TIO N TO
S U S TA I N A B L E
DEVELO PM EN T
microfinance savings and lending to reduce the dependence of the poor on the natural resource base; and improve the physical linkages between rural communities and market centers so that the poor can get a fair price for their goods. Too often the poor are forced to sell to entrepreneurs who do little more than transpor t goods that they then sell at steep markups. Good roads and inexpensive public transpor tation would eliminate price distor tions introduced by these people. Enhancing accessibility to modern agricultural inputs is one way of reducing pover ty. Although governments are distributing high-quality seeds, fer tilizers, and pesticides, or introducing organic methods and building irrigation canals, the beneficiaries are usually the large farmers, who, because of their wealth and influence, have access to the government and therefore can capture or control these inputs. Even worse, is the fact that rich farmers have access to government information, so they know what future inputs the government will provide and where. They then convince the small farmers to sell their land at a low price before the modern inputs are introduced. Promotion of good local governance can reduce pover ty. One of the findings of the ADB study on pover ty reduction is that often decentralization of authority and resources, in the absence of good local governance, increases pover ty. Decentralization is not a panacea for solving the problem of pover ty, unless the capacity of people in the local and regional governments to manage and implement a pro-poor policy in an honest manner is developed. Enhanced international financing for pover ty reduction is another key element. It is possible to augment the financial resources available to developing countries through fair international trade, attracting private sector investment in key sectors, and increased overseas development assistance (ODA) flow. Total ODA has increased in the last several years, mainly as a result of the large commitments of funds to fight HIV/AIDS. Several G-7 members have recently committed to substantially increase their ODA levels over the next 10 years. A pilot project of the International Finance Facility for Immunizations and other financing proposals are described in the latest IMF/ World Bank repor ts to the Development Committee (see the World Bank website—list of documents from spring 2005 meetings). Unless innovative ways of augmenting the available financing for pover ty reduction are found, it will be very difficult to reduce pover ty just by population control, economic growth, and distributional effectiveness. There must be income before it can be distributed. International collaboration on financing pover ty reduction in the developing countries is essential. Several international fora have discussed the issue of financing sustainable development by way of raising “Tobin Tax,” “bit tax,” etc. and reducing militar y expenditure. However, so far, no significant progress has been made. This issue also did not make much headway at the WSSD in 2002. Poor Pe o p l e C l a s s i f i e d A c c o rding to S ettlement Areas There is no single measure to reduce pover ty. The task is a multistep process. First, we have to identify who the poor are and determine their aspirations and needs. Only then is it possible to design a program to reduce pover ty. Depending upon the settlement area, four categories of poor
226
SOC I AL
D I M E N S I O N S AN D
P O LIC IES
people are described below. For each of the categories, projects should be designed to respond to people’s actual needs, focusing on at least three specific issues: (i) a holistic view of resource management, incorporating gender equity, improving management skills, developing institutional capacity, and disseminating information; (ii) development and transfer of appropriate technology; and (iii) building on indigenous knowledge in the fields of low-cost urban water supply and sanitation, water management, sustainable pest management, mangrove management, composting, and clean rural industr y. 1. Poor people who are dependent on fragile land Today many regions of the world are affected by deser tification, and other areas are heading in that direction. The PRC, Mongolia, Spain, and Sub-Saharan Africa are just some examples. People living on arid land need good common-proper ty managers who can introduce irrigation systems that nur ture crops and conser ve water. In drip irrigation, for example, water is introduced into the fields through a perforated pipe whose holes exactly match up with each plant. This way water is not spread ever ywhere but delivered just to the root system. Sand dune stabilization is another impor tant need for dr y communities. Some of the deser ts in India have been planted with a fast-growing shrub species impor ted from Israel that prevents the dunes from moving into the irrigated fields. There is need for rodent control and special grazing techniques in deser t areas. Goats, for instance, when left unchecked, can destroy an entire field down to the root system. 2. Poor people who live in areas with good agricultural potential Even in the areas with good precipitation, there are poor people because they do not have access to modern farming techniques and so eventually become tenants on large farms. The needs of such people often include water resource control technology and access to high-yielding seeds, fer tilizers, and pesticides. There is also need for land redistribution through agrarian reform, which is a difficult and sensitive issue in most developing countries. 3. Poor people who live in urban areas The needs of the poor who live in cities are environmental health and sanitation, shelter, safe drinking water, and enhanced livelihood possibilities. 4. Poor people who live in coastal areas A single natural disaster in a coastal area such as a typhoon or tsunami (tidal wave) can kill several hundred thousand people, as in Bangladesh (1970), Sri Lanka (2004), Indonesia (2004/2005), and Thailand, Maldives, and India (2005). The basic needs, therefore, are protecting the mangrove forests (nature’s first line of defense against tsunamis), creating early warning systems, building cyclone shelters, and improving sustainable fishing mechanisms and skills—all in the interest of achieving sustained livelihood for people living in coastal belts.
227
AN
IN TRO DU C TIO N TO
S U S TA I N A B L E
DEVELO PM EN T
O verc o m i n g S t ruc t ura l Ba rri e rs For each of the above groups of poor people, projects should be designed to respond to specific needs and aspirations to reduce pover ty. Economic growth is a necessar y (but not sufficient) condition for reducing pover ty. According to an estimate made by UNDP (2003), if income distribution is held constant at the present value, the pover ty rate will decline by 2% for ever y 1% increase in income per capita. At this elasticity of 2, if pover ty is to be halved between 1990 and 2015, a constant GDP growth rate of 2.9% will be needed during the period. Such a growth rate is quite achievable in developing countries, assuming that reasonably favorable conditions (e.g., law and order situation, pro-poor growth policy) prevail. In fact, many countries have attained higher rates than such growth which are the minimum required to attain the goal of pover ty reduction in accordance with the MDG. This is a hopeful and positive indication that the world may be able to achieve and may even exceed the target by the year 2015 to reduce the 1990 pover ty level by half.
P A R T I C I P A T O R Y D EV E L O P M E N T The second social dimension of sustainable development is par ticipator y development— the process through which stakeholders influence or share control over development initiatives, decisions, resources, and outcomes. In the absence of political will and public awareness, it is difficult to implement par ticipator y development in a countr y or a region. B en e f i t s o f Pa r ti c i pa t i o n Par ticipation enhances sustainability. If a project is designed in consultation with the stakeholders, there is a better chance it will be sustained. When people are involved in making decisions, such as planning a water supply system, they develop a sense of (psychological) ownership of the endeavor and feel motivated to sustain it. This is especially true if they are empowered to monitor and manage the system and can obtain appropriate suppor t when needed. It is also impor tant that there be a clear understanding of who makes the capital investment, who will pay for the project’s operation and maintenance, and what rights and responsibilities the beneficiaries have. Though additional time is required at the front end for the consultation or more engaged par ticipator y process, implementation is usually smoother because there is shared understanding and agreement on steps to be under taken to achieve cer tain goals. When a project is star ted without consultation, delays due to subsequent public protest are not uncommon. Development finance institutions (DFIs) such as the World Bank and ADB have witnessed many projects that had to be totally abandoned because of NGO protests or difficulties encountered by the stakeholders (ADB, 2003). Par ticipator y development is demand responsive rather than supply responsive. It strengthens local ownership and the commitment of the people consulted. It also makes cost sharing easier. In many developing countries, people believe that if the government initiates a project it will also maintain the infrastructure. They feel that if a government-built pump breaks down, the government should supply the par ts and repair it. That is because there was little preplanning at 228
SOC I AL
D I M E N S I O N S AN D
P O LIC IES
the star t of the project, and therefore there is little sense of ownership or shared responsibility among the beneficiaries of the project. Par ticipator y development also enhances social capital by bringing groups together, and both technical and management capacity of people is enhanced through experiential learning. As a power group, a farmers’ cooperative can help the entire community get the modern agricultural inputs it needs. Critics are quick to cite the “risks” of par ticipation. They point out that it is (or rather can be) time and resource consuming, and logistically and organizationally troublesome. In the process of par ticipation, some groups may not be represented, conflicts may be aggravated, and expectations may be raised. Careful planning of the par ticipator y process based on stakeholder capacity, and context analysis can minimize these problems. Critics should realize that the gains far outweigh the “risks” when managed in this manner. Conflicts may be aggravated by par ticipation, but skilled facilitators can employ conflict management techniques to address these. For example, holding a series of workshops with individual stakeholder groups prior to a large consultation meeting may aver t misunderstanding by disseminating information and helping par ticipants to clarify their concerns and preferences and prepare to discuss their differences more constructively. Project proponents must be scrupulously honest about realistic expectations to avoid implying excessive benefits. To do otherwise is unfair to people and contributes to project delays and other serious problems. C a t e go ri e s o f S t a ke ho l d e rs There are four categories of stakeholders in development. Their roles var y according to the demands of a project. For example, the central government might be crucial at the beginning, as well as citizens and local NGOs who can assume great impor tance as planning of a project begins in a given locality. • The primar y stakeholders are those expected to benefit directly from the project. Included are the poor, women, indigenous peoples, and vulnerable groups such as the elderly and disabled. • The secondary stakeholders are those with exper tise, public interest, and/or linkages to the primary stakeholders. These are the NGOs, intermediary organizations of government, civil society, the private sector, and technical and professional bodies that are indirectly affected by the project. • The third group of stakeholders consists of the governments or private sectors raising/ borrowing money to finance that project. • The four th categor y is the lender—the financial stakeholder such as the World Bank, ADB, government or a private bank. Private investor s have become active in developing countries, par ticularly in soft sectors such as water supply and agriculture. Private investment is expanding in both sectors (e.g., subcontracting of urban water and sanitation management to private companies; commercial food processors contracting with farmer cooperatives). They are also interested in building infrastr ucture in middle- to high-income countries, where the risk is lower. 229
AN
IN TRO DU C TIO N TO
S U S TA I N A B L E
DEVELO PM EN T
Fa c i l i t a t i ng S t a ke h o l de r Pa r t i cipation There are four mechanisms to facilitate par ticipation among stakeholders. These form a continuum from shallow to deep engagement among stakeholders. Facilitators employ a range of methods or tools suitable to specific stakeholder groups. Some organizations include consensus building as a middle step in this list of par ticipator y mechanisms. 1. Information sharing This is generally a one-way flow of information. Either citizens share information by responding to questionnaires or a project proponent, whether government or the private sector, reveals its plan to the affected people at an early stage. If necessar y, the information is translated into the local language, but then there is the problem of low literacy rates. A case in point is India, where there are many regional and local languages, and most of the primar y stakeholders do not speak English, in which the original proposal was most likely made. Once the plan is translated into the vernacular, one can disseminate written materials, post signs, conduct seminars, make presentations, and hold public meetings regarding the project. Information campaigns using mainstream media, as on Severe Acute Respirator y Syndrome (SARS), good nutrition, or sanitation, are other examples. 2. Consultation Consultation is a limited two-way flow of information comprising meetings with the stakeholders, making field visits, conducting inter views at various stages of work, and listening to the stakeholders regarding their aspirations and needs. “Exper ts” analyze the information they gather and then make decisions, so little authority is shared with the public. They may think that it would be unnecessar y to share results with stakeholders who took par t in planning an activity. Overreliance on poorly planned consultations have left many feeling frustrated that their views are not heard or taken into consideration. This is known as “consultation fatigue.” 3. Collaborative decision making In collaborative decision making, some power to influence the process and outcome is shared between outsiders and local stakeholders. The issues and questions that are raised may include topics that external exper ts consider to be relatively unimpor tant but that matter to local citizens. One method that has been employed by ADB and others to facilitate collaboration is the “write shop” approach. Stakeholders from government and NGOs have worked together with some ADB staff members for one week to draft and redraft the text of ADB’s NGO strategy. Other examples include par ticipator y planning exercises with representatives of local and district governments and civil society organizations as project implementation star ts in their area. 4. Facilitating empowerment The four th and deepest mechanism promoting par ticipation is facilitating empowerment. Empowerment has a variety of meanings. It may refer to an individual gaining a sense of “agency,” 230
SOC I AL
D I M E N S I O N S AN D
P O LIC IES
a sense that he or she is capable of taking action to bring about change in his or her own life or community. For Nobel economist Amar tya Sen, this is the essence of development. Empowerment also refers to devolution of authority to citizens or to local organizations. In Bangalore, India, and the Philippines, citizens have had the oppor tunity to rank various government agencies on a “repor t card.” The results have motivated some agencies to strive much harder to provide adequate ser vices. In many countries, authority (over both decisions and resources) has been devolved to those directly responsible in regional and local government. As stated earlier, decentralization in the absence of good local governance can be counterproductive. Delegation of authority for decision making often requires capacity building among stakeholders. A key to sustained results, capacity development involves not only transfer of job-related knowledge but experience-based learning about management to implement new skills effectively within changing organizations. When those who will receive training are asked to analyze through a par ticipator y process the structure and function of their organizations and identify necessar y changes and the additional skills required to implement them, their motivation is great, and learning is maximized. This should be financed as an integral par t of the project. In addition to self-help initiatives, par ticipator y monitoring is key to empowering communities or members of organizations to manage their own development. For example, prior to releasing funds for building a water system, a project could require that a neighborhood prepare a plan for monitoring it. This would involve selection of a number of indicators of success they hope to achieve and delineation of the roles and responsibilities of members of a committee that will conduct inspections on a cer tain schedule, meet periodically to review progress, and call public meetings to discuss issues that arise. Within any organization a similar exercise could be under taken, with members identifying new behaviors they must adopt to accomplish par ticular goals and planning periodic reviews of their compliance. Empowerment also means strengthening the financial and legal status of stakeholder organizations and transferring responsibility for project maintenance and management to them. The capital cost is borne by the project proponent, but the proponent must inform the stakeholders what it is going to cost them in maintenance and management once they assume responsibility for the project. The stakeholders must also understand that they are the only group that can properly maintain and manage the project, since it involves their livelihood and the quality of their lives.
CONSENSUS BUILDING Conflict can emerge at any time. If there are conflicting views between two or more groups, the process has to move on to a consensus-building phase. Consensus building is defined as the process of seeking unanimous agreement of a group of stakeholders, with the goal of meeting the interests of all. When there is a conflict, it is probably impossible to reach a 100% satisfaction level, but it should be possible to find some middle ground that the various conflicting groups can live with. 231
AN
IN TRO DU C TIO N TO
S U S TA I N A B L E
DEVELO PM EN T
Consensus building has its own vocabular y. The convener is the person who organizes the meeting, knows all the stakeholders, and is accepted by all of them. The assessor is the person who is given all the relevant documents and makes an assessment of what the conflict is all about, who are involved, and what is the view of each of the par ties. The facilitator conducts the consensusbuilding meeting. The assessor is independent of the facilitator and has the job of reviewing the documents. The recorder functions as a secretar y, not only taking notes but also setting the agenda and ground rules and evaluating computer-based communication options. The job of a mediator is to sit with groups of par ticipants holding differing views and to tr y to narrow down the gaps in their viewpoints. Conflict resolution is usually a long-term process carried out in five steps as follows: 1. Convening A discussion of whether or not to have a consensus-building dialogue is initiated. It might be that there is no point in having such a dialogue, because the conflict is so acute that a review of the case would only determine that a resolution cannot be reached. If it is determined that a discussion is warranted, a convener is appointed who is in a position to bring the stakeholders together and who is respected and considered neutral. Before a meeting is convened an independent assessor should be entrusted with the responsibility of preparing a conflict assessment document. There should be a contract between the convener of the discussion and the assessor for the conflict assessment document. The assessor must identify appropriate representatives of the conflicting par ties and secure the necessar y funding. Once the funding source(s) and the par ticipants are identified, the convener will organize a meeting of all the par ties, including the ones who are known as missing actors, meaning those who are not present. 2. Clarifying responsibilities In the second step, the roles and the responsibilities of the facilitator and the mediator should be determined. During this phase an agenda and the ground rules for the consensus-building meeting should be established, and a list of par ticipants and a computer-based communication system should be prepared. 3. Deliberation At this stage, the actual deliberations are held for consensus building. It is necessar y to pursue the debate in a constructive fashion, create subcommittees (if necessar y and appropriate), and seek exper t advice in order to produce a single written repor t. According to The Consensus Building Handbook (Susskind et al., 1999), it is vital to have one draft only, because it will be difficult to come to a consensus if there are several different drafts on the table. The single draft can always be modified. Another impor tant task is to determine whether the conflict resolution will be public or held behind closed doors. If it is to be public, then there must be ground rules for obser vers. Will it be an open forum or can obser vers par ticipate only at the request of the mediator? And while talking is impor tant, listening is vital. If the par ticipants listen only to themselves, consensus may well be difficult. Ad hominem arguments must be avoided. They rarely strengthen a position and 232
SOC I AL
D I M E N S I O N S AN D
P O LIC IES
will most likely be counterproductive. There is already a conflict, but if the disagreement involves personal rancor, consensus will not be reached. Par ticipants must learn to disagree politely. If one wants to disagree, one should simply say: “I respect your opinion, but this is the way I feel and that is what I want to go into the record.” 4. Decision The four th step is coming to a decision by tr ying to maximize joint gains and by keeping a record of whatever is decided. Once the decision is announced, especially if there is a lack of unanimity, the opponent(s) should be asked whether they can live with the outcome, rather than simply disagreeing. If they cannot, their views should be recorded. 5. Signing Once an agreement has been reached, stakeholder ratification is sought by signing the document. The document should acknowledge that the outcome has been a joint decision and that it is going to be implemented and monitored. Ongoing evaluations will keep track of adherence and progress.
N ONGOVERNMENT O RGANIZATIONS (NGO S ) The role of NGOs is the four th social dimension of sustainable development. The term NGO refers to a nonprofit organization that is not based in government. In this respect, NGOs may be defined more by what they are not than by what they are. While NGOs are supposedly nonprofit organizations (which means that after internal and external expenses are paid, no profit should be made), they still need money to operate. Many are self-financing. They collect funds from their members, governments, corporations, and individuals through fund-raising drives. Other NGOs receive funds from financial institutions such as ADB and the World Bank by way of assisting them in providing an enhanced quality of ser vice to their clients. Some of the smaller NGOs in the south are funded by international NGOs in the nor th. NGO Classification NGOs are categorized based on their theme, nature of operations, or level of operation. Thematic NGOs deal with specific issues such as the environment, rural development, health, or women’s empowerment. NGOs can also be classified on the basis of their operations such as advocacy, research, or training. The third possible classification might be based on their level of operation, i.e., they can be international, national, or local. Role of NGOs According to OECD, there are some 4,000 NGOs in developed countries investing $3 billion per year in activities that affect the lives of 100 million people (Coninck, 1995). As impressive as 233
AN
IN TRO DU C TIO N TO
S U S TA I N A B L E
DEVELO PM EN T
this number sounds, one must remember that there are 1.3 billion people in the world who are living in abject pover ty (earning less than $1 per day). Because NGOs are sometimes seen to be acting in their own interest rather than primarily for the poor, the World Bank study revealed that the perception of many of the world’s poor is that NGOs have not made a difference in their lives. Never theless, some credible, well-functioning NGOs have the potential for making significant contributions to the sustainable development of the world. Especially with close knowledge of local communities, NGOs can identify new approaches and create new models for specific developmental activities. Local knowledge also allows NGOs to guide development projects so that they are implemented in ways that respond to local needs. NGOs can also ser ve as bridges between project authorities and affected communities, as well as facilitate par ticipator y processes, including local decision making and consensus building where there are not too many opposing views. An NGO can provide a stable link between a project implementer and the community. All too often the personnel roster for a project changes, and a problem of continuity arises. The new people are unaware of local conditions and problems, causing delays and work stoppages. A local NGO is often needed to put a project back on track. Finally, NGOs are becoming key players in the development process. The advocacy-oriented NGOs can create significant public awareness. Policy o n C o o pe ra t i o n w i t h N G Os NGOs can create capabilities and comparative advantages, par ticularly at the grassroots level. Not many of the staff of DFIs can make time to go to the villages and communities to conceive and implement projects. Some staff may not be fully aware of specific local situations, customs, and culture. Therefore it is an advantage to have a collaborating NGO that does possess that type of knowledge to provide guidance. According to its Policy on Cooperation between ADB and NGOs (1998), ADB “will seek to cooperate with competent NGOs that have substantial knowledge in their areas of focus and with which cooperation would be appropriate and mutually beneficial. Such cooperation, whether in project, programming, or policy activities, would relate to the type of NGO, the issue or interest being addressed, and countr y-specific considerations.” If ADB is looking for a par tner to collaborate on a water supply project in India, then it will look for an NGO that not only has substantial knowledge in that area but also acknowledges accountability for the project. Fur thermore, according to the 1998 policy, ADB “will continue to explore innovative approaches to cooperation with NGOs.” While it sounds like ADB’s policy of cooperation with NGOs is qualified, it is actually a positive stance for overall development. To strengthen its cooperative stance with NGOs, ADB has over the last decade strengthened its internal capacity. Sometime ago some ADB staff members working in project-related depar tments may not have known how to best employ an NGO’s exper tise when they visited a project site. Merely sharing information, or even consulting, meaning a two-way flow of information, is not enough. There must be collaborative decision making and empowerment of stakeholders. 234
SOC I AL
D I M E N S I O N S AN D
P O LIC IES
Has the ADB policy of cooperation been effective? A repor t on collaboration with NGOs from 1990 to 2000 identifies which NGO was involved in which project, what the results were, and if it was a successful collaboration. For the most par t, collaboration proved both positive and productive. Still, some NGOs are not happy with the current policies and criticize ADB-financed projects. One major criticism is that ADB, as sole arbiter, determines which NGOs are competent. This is a criticism that ADB takes in stride, saying: “We are involving you in improving the quality of ser vice that ADB provides to its clients, so we decide whether in our judgment you are qualified.”
GENDER
AND
D EV E L O P M E N T
An impor tant social dimension of development is gender, which refers to the social norms that define the roles, rights, responsibilities, and obligations of men and women in a society. Promoting gender equality in development is not only a moral or a human rights issue. It is also recognized as fundamental to pover ty reduction, sustainable development, and environmental conser vation (Engendering Development Through Gender Equality in Rights, Resources and Voice, World Bank 2001; Women and the Environment, UNEP and WEDO, 2004). Yet women and girls have systematically had poorer access than men and boys to a range of resources, including human resources (education, health care), social capital, physical and financial capital, and employment and earnings. Women’s contribution to the sustainable use of natural resources is also not fully appreciated. Gen d e r– R e l a t e d Tre n d s As global statistics show, there have been tremendous advances in reducing gender inequality throughout the world. In just three decades (1960-1990), gender equality in primar y and secondar y education significantly improved. In 1990, 86 girls were enrolled in primar y school for ever y 100 boys, compared with 67 for ever y 100 boys in 1960. Similarly, 75 females per 100 males were enrolled in secondar y schools in 1990, compared with 53 in 1960. The average six-year-old girl now goes to school for 8.4 years, compared with 7.3 years in 1980, which means that today a six-year-old girl will be in school until she is 14.4 years old. Previously she would leave school at 13.3 years. In general, however, a poor girl is less likely to be able to attend school than one from a nonpoor family. Since the 1950s, the official female labor force in developing countries has grown at twice the rate of the male labor force, so that in 1990, 30% of women over 15 years were in the formal work force. In 2004, the percentage of women in the labor force in developing countries was estimated to be 40%. Women as a percentage of the labor force in Southeast Asia went from 21% to 35.8% between 1970 and 1995. Although most of these women were working in garment factories and cottage industries, which traditionally employ more women than men, there has been tremendous gender progress in other sectors also. For example, Asia is known for its impor tant female political leaders, including presidents and prime ministers who have come to power in Bangladesh, India, Indonesia, Pakistan, the Philippines, and Sri Lanka. 235
AN
IN TRO DU C TIO N TO
S U S TA I N A B L E
DEVELO PM EN T
Unfor tunately, alongside this progress exist persistent gender inequalities. Even now, of the 900 million illiterate people in the world, women outnumber men by 2 to 1. Of the 1.3 billion people who are living below the pover ty line, 70% are women. At least half a million women die each year from complications due to pregnancy. Soon one in four women (and one in five men) may be infected with HIV/AIDS in countries where the pandemic is spreading rapidly. In developing countries, women’s wages are 30% to 40% lower than those of men for comparable work; however, similar percentages can be found in many developed countries. In developing economies, women’s and men’s employment also tends to be highly segregated, with women generally performing lower-skilled tasks for lower wages, often in the informal sector. In rural areas, women are generally active in agriculture, but they have little direct access to extension ser vices, credit, or other agricultural inputs, and their access to land is likely to be through their husbands or male relatives. In most developing countries, women’s representation in the civil ser vice, elected bodies, the judiciar y, and local governments is low, and women’s par ticipation in community-level decision making is likely to be limited by social norms. Women in ethnic minority, low caste, or other marginalized groups, as well as widows and elderly women heading households face a par ticularly high risk of being poor throughout the world. This is because they are less likely to be educated, to have access to quality health care, to have productive assets or strong proper ty rights, or to have a pension. As the world population ages in the twenty first centur y, larger numbers of poor elderly women will need social ser vices. L eg a l a n d Po l i c y M e a s u re me nts to Promote Gender E quality Since the 1970s, a number of actions have been taken to promote gender equality and the empowerment of women at the international and national levels. Although the United Nations Char ter affirms the equal rights of women and men, an international consensus emerged that there was need for a separate convention addressing women’s rights. The United Nations Convention on the Elimination of All Forms of Discrimination Against Women was adopted in 1979 and came into force in 1981. As of May 2005, a total of 180 nations had ratified it. Women’s legal rights appear to have improved in many countries as a result of this convention. Fur thermore, the activism of women’s organizations has been enhanced: some nations have included gender equality in their constitutions and others have amended their laws to remove discriminator y provisions relating to such matters as citizenship, marriage, contracts, land and other proper ty, inheritance, and employment. Several countries have also amended their criminal laws or adopted new laws to address domestic violence and human trafficking. Since 1975, there have been four world conferences on women sponsored by the UN, in which governments and international organizations have reviewed their progress toward gender equality and have made policy commitments to fur ther reduce gender gaps and improve women’s oppor tunities and rights. The Four th World Conference on Women held in Beijing in 1995 identified 12 critical areas of concern among the world’s women: pover ty, health, education, violence, armed conflict, the economy, decision making, human rights, media, the environment, the girl-child, and the national and international machiner y. Since 1975, most national governments have established policies 236
SOC I AL
D I M E N S I O N S AN D
P O LIC IES
and action plans to promote gender equality, and have set up mechanisms to implement these policies and plans, including separate ministries or depar tments, government-wide commissions and networks of gender focal points. Most development agencies and development banks have also adopted policies on gender and development. For example, the ADB originally adopted a policy on the role of women in development in 1985, which was updated and replaced in 1998 by a policy on gender and development. Some of the common elements in the gender and development policies of governments and development finance institutions (DFIs): • Gender sensitivity: to obser ve how programs and projects affect women and men, and to take into account women’s needs and perspectives in planning operations; • Gender analysis: to assess systematically the impact of a program or project on men and women, and on the economic and social relationships between them; • Gender planning: to formulate specific strategies that aim to bring about equal oppor tunities for men and women; • Mainstreaming: to consider gender issues in all areas of activity, accompanied by effor ts to encourage women’s par ticipation in the decision-making process; • Agenda setting: to formulate strategies (or assist governments in formulating their strategies) to reduce gender disparities and in developing plans and targets for women’s and girls’ education, health, legal rights, employment, and income-earning oppor tunities; • Gender budgeting: to analyze national expenditure frameworks and budgets, sector budgets and project budgets in terms of their alignment with gender goals and their likely impact on women and men. Gen d e r, E nv i ro nme nt , a n d S u stainable Development As the majority of the world’s poor, women play decisive roles in managing and preser ving biodiversity, water, land, and other natural resources, yet their centrality is often ignored or exploited (Women and the Environment, UNEP and WEDO, 2004, p. 3). The contributions of women and women’s organizations are par ticularly noticeable in three environmental areas: 1. Biodiversity Because of their traditional roles in gathering forest and bush products for food, medicine, religious, and other uses, many rural women have in-depth knowledge of their natural environments, especially in indigenous communities. Women farmers in many agrarian societies are also responsible for the selection and saving of seeds, and they manage home gardens including a diversity of species. However, researchers and extension workers often fail to take women’s traditional knowledge of plant varieties into account, and a number of forces are eroding or undermining this rich knowledge base. 2. Water resource management Women and men generally have distinct roles related to water and water systems, and therefore tend to have different stakes in water use. For example, in rural areas women and girls 237
AN
IN TRO DU C TIO N TO
S U S TA I N A B L E
DEVELO PM EN T
generally collect water for household use, and also for raising small livestock, for home gardens and for microenterprise activities. Although men generally manage irrigation facilities, women often contribute to the operation and maintenance of these facilities. Despite their impor tant roles in water use, women have not traditionally been included in national or local decision making related to water management. However, in response to advocacy by women’s organizations and networks, a number of countries have recently integrated a gender perspective in their water laws and policies. 3. Desertification In dryland ecosystems, women as well as men have developed essential skills and practices to survive under challenging conditions. Environmental degradation places an extra burden on women, who must walk far ther and far ther to collect water, food, and fuel. Women also have to take on additional responsibilities when their husbands migrate for work. Yet women in many dryland societies have low status and limited rights, and this subordination is fur ther reinforced by land conservation and development programs that exclude them (ibid., pp. 30-71). Over the past 20 years, women’s roles in environmental protection and sustainable development have increasingly been recognized. The Third World Conference on Women in Nairobi in 1985 speciically noted women’s role in environmental conservation and management, and the Platform for Action adopted at the Fourth World Conference on Women in Beijing in 1995 included women and environment as one of its critical areas of concern. In the run-up to UNCED, the Women’s Environment and Development Organization organized the First Women’s World Congress for a Healthy Planet in 1991, which developed a platform known as the “Women’s Action Agenda 21.” UNCED itself recognized women as a “major group” in sustainable development, as relected in Rio Principle 20, Chapter 24 of Agenda 21 (“Global Action for Women Towards Sustainable and Equitable Development”) and references to women in other chapters of Agenda 21. The Johannesburg Declaration adopted at the WSSD in 2002 reafirmed governments’ commitments “to ensuring that women’s empowerment, emancipation and gender equality are integrated in all the activities encompassed within Agenda 21, the Millennium Development Goals and the Plan of Implementation of the Summit.” Consistent with their general policies on gender and development, national governments and international organizations have taken various steps to “mainstream” gender concerns in their environmental work. For example, UNEP has committed in its 2004-2005 program of work to make gender a cross-cutting priority in all of its programs with an emphasis on: • empowerment of women in environmental decision making, • active par ticipation of women, • technical assistance to women’s networks, • focus on women in repor ts on environmental links to ill health, • development of education and training materials, • organization of workshops, and • gender balance in meetings (ibid., Box 1, p. 6). Despite these effor ts, much more needs to be done to translate international and national commitments to gender equality into concrete actions. The key ingredients include political will and 238
SOC I AL
D I M E N S I O N S AN D
P O LIC IES
accountability at all levels; and coherent, gender-responsive institutions, including the par ticipation of civil society groups and women in par ticular. In the area of environment and sustainable development, gender-responsive solutions must also draw on traditional knowledge systems and be adapted to local conditions and social structures (ibid., p. 103).
I NV O L U N T A R Y R E S E T T L E M E N T Involuntar y resettlement, the sixth social dimension of sustainable development, is a process that assists people who are displaced or temporarily disadvantaged because of a private or public project, and helps them rebuild their lives in a new environment. One key test of successful involuntar y resettlement is whether the project-affected people are better off with the project than without the project. Gen e ra l P ri n c i pl e s A number of general principles of involuntar y resettlement are followed in any resettlement policy. The first is that involuntar y resettlement should be avoided whenever possible. But sometimes it is necessar y in the broader interest of the community or the nation. That brings us to the second principle: When population displacement is unavoidable, it should be minimized by exploring all viable options. For example, with a highway project, there are two other options: one is not to build the road; the other is to consider alternative routes to the highway that will displace a smaller number of people. Once a decision has been made and people either have to be displaced or suffer shor t-term economic hardship, they should be compensated and assisted so that their economic and social future will be generally as favorable as it would have been in the absence of the project. In many countries, par ticularly in developing ones, when communities have to be involuntarily displaced, the government or the project proponent merely gives each household some form of compensation and expects them to move out. Those instances, where there is no consultation and no redress, are not successful resettlements. A workable resettlement policy must include full compensation and assistance. Attention should also be paid to the communities into which displaced peoples will move to minimize conflict and promote successful integration of the newcomers. What form should this assistance take? In the case of vulnerable groups such as women, children, the disabled, or the aged, help is needed in physically moving their belongings. Many, not just those categorized as vulnerable, will need skill development. For example, the movement of a community located along a coast to an inland site calls for new skills. The community is likely to be made up of fisherfolk, who will have to learn a new occupation such as upland farming or will need assistance in finding employment oppor tunities in their new habitat. It is also impor tant to assist communities to reconstitute their internal communication and suppor t networks, and link these with networks in their new location. All of these services must be extended to them in addition to compensation. People about to be displaced should be fully consulted. Just informing them that they have to move or suffer temporar y economic problems is not enough. They should be consulted on the 239
AN
IN TRO DU C TIO N TO
S U S TA I N A B L E
DEVELO PM EN T
planned resettlement and on their compensation options, and an agreement should be reached. If an agreement cannot be reached, the people should not be forced out. It must also be remembered that in any resettlement process three par ties are involved: the project proponents, the people who are to be displaced, and the community that is being asked to accept them. In conducting these consultations, it is best to employ the ser vices of the existing social and cultural institutions in both communities. A social design study or a resettlement planning study should be carried out to determine what social and cultural institutions exist in the communities and how to make use of them. These institutions may have the best knowledge of the local culture and of the needs and aspirations of the people. Those being resettled should be integrated economically and socially into host communities. There have been cases where civil disorders erupted due to the resettlement of people. In Assam, India, some time ago, several hundred resettlers were massacred because those already living there were under ecological stress and did not accept additional people moving in. In many developing countries, project proponents claim that the people about to be ejected are squatters who have no formal title to the land they occupy and therefore are not entitled to any resettlement compensation. This is a sensitive issue, but ADB, in reformulating its policy on involuntar y resettlement, decided that the absence of a legal title to the land should not preclude people from getting compensation. The Resettlement Policy of ADB “specifies that a lack of formal legal title to land is not a bar to compensation and other assistance. This may apply to a range of people affected, e.g., informal dwellers, land users with traditional or customar y rights, squatters or those with adverse possession rights but no formal legal title to land and assets. (see http://www.adb. org, at paragraph 34, p. vii.) Ever ybody must be compensated and resettled, whether possessing legal title to the land or not. This is especially germane if the affected households are headed by women or other vulnerable groups such as indigenous people and ethnic minorities. This was a reversal of an earlier policy, which said if people could not show legal title to the land, or demonstrate that they were legally settled there, they would not receive compensation when displaced. As far as possible, plans for resettlement should be laid out and executed as an integral par t of any project at the conceptual stage, in terms of both its budget and planning. In many cases, a project was star ted and the issue of resettlement came up later. When is a full resettlement program needed? The MDBs, par ticularly the World Bank and ADB, have set the figure at 200; that is, if 200 or more people are to be displaced, then a resettlement plan must be prepared. However, if indigenous or vulnerable groups of people are involved, then 50 is the threshold number, and a full resettlement plan becomes mandator y. Resett l e m e n t C o s t s There are four components of resettlement costs: (1) resettlement preparation and compensation for those who are temporarily affected as well as those who must move, (2) relocation and transfer, (3) income restoration and social integration, and (4) administrative costs to pay for the other three components.
240
SOC I AL
D I M E N S I O N S AN D
P O LIC IES
The full cost and benefits of resettlement and compensation should be included in the presentation of project costs and benefits. In many resettlement plans, the project proponent lists only the cash compensation as the cost of resettlement. That is inaccurate. The full cost of a successful resettlement includes not only cash compensation, but also the cost of reconstructing buildings, replacing damaged equipment, moving people physically from their original habitat to the new area, and providing training and livelihood skills that they need to get a job in the new habitat. In many instances, the project proponent, whether a government or a community, under estimates the resettlement cost, so that the project stands a greater chance of approval. However, such a project is also more likely to run into difficulty at a later stage of implementation, because its budget does not include the full cost of resettlement. Therefore, the full cost of resettlement and compensation should be included in the overall financing plan for the project. If the lending agency is one of the DFIs that has made a resettlement policy mandator y, it should not have a problem in financing the full cost of resettlement. Too often the government assures the lending agency that it will take care of resettlement and compensation. But what actually happens in many cases is that, once the financing is approved, the compensation paid by the government to resettlers is less than what is required in accordance with the policy of the DFI. A d h e re nc e t o Po l i c y Unquestionably, strict adherence to a resettlement policy creates problems for the project proponent, which is usually the government. But on the other side of the coin, if the DFIs do not follow their resettlement policies, they are shirking an ethical duty and are bound to be criticized. For example, one development bank not so long ago faced such a situation concerning a highway project in a par ticular countr y. Conforming to its policy, the bank asked for a resettlement plan. The government refused to provide the analysis and threatened to get funding from other sources such as private banks or to finance the project from domestic resources. The government indicated that it had sufficient financial resources to build the road even without the assistance of DFIs (though the countr y was still classified as a developing countr y). The relevant staff of the bank failed to resolve this issue in conformity with the bank’s resettlement policy, in this par ticular case becasue of its strict adherence to its policy on involuntar y resettlement. Res e t t l e me nt P l a n n i n g Not all sectors and not all project components require the same degree of resettlement effor t. Only cer tain sectors, and cer tain components of those sectors, require resettlement planning. For instance, the transpor t sector may require resettlement in cases involving terminals, bridges, airpor ts, seapor ts, and river por ts. In the power and energy sector, laying transmission lines that pass through lands where people live requires a resettlement plan. Hydroelectric power, one of the most impor tant components of the power and energy sector, almost always requires resettlement, as dams inundate huge tracts of land. In the case of solid waste projects, examples are transfer stations and landfill sites. Within water supply projects, pipelines, pumping stations,
241
AN
IN TRO DU C TIO N TO
S U S TA I N A B L E
DEVELO PM EN T
water treatment sites, and reser voirs usually require relocation. In urban-renewal projects, education, and the health-care sector, resettlement may or may not be required. If it is not, then resettlement planning is unnecessar y. Comparatively simple road repair projects may damage sections of many people’s fields and crops, block access to shops, or necessitate movement of buildings when widening the right of way; in this case resettlement planning may be needed.
I N D I G E N O U S PE O P L E S (IP S ) One topic of concern that is coming to the forefront regarding resettlement planning is moving indigenous peoples (IPs) off their ancestral lands. This has become an issue in the last 15-20 years, because development planners have exhausted most of the potential sites for development and are moving into remote areas in search of new project sites. The definition of IPs is subject to both national and international law. It is perhaps helpful to review some histor y of the development of this term under international law. In 1957, the International Labour Organization (ILO) organized the Convention Concerning the Protection and Integration of Indigenous and Other Tribal and Semi-Tribal Populations in Independent Countries. In 1957, the phrase was “indigenous and other tribal and semi-tribal populations,” not “indigenous peoples,” which is used today. This convention, known as Convention 107, reflected the prevailing view that indigenous populations, “should be assimilated into national society.” In 1989, ILO Convention 169 (Concerning Indigenous and Tribal Peoples in Independent Countries) supplanted Convention 107 and rejected its assimilationist ideology. Moreover, Convention 169 substituted the word “peoples” for “populations” in referring to IPs. This change, representing an impor tant gain concerning the language of self-determination, was brought into international law. The ILO change of terminology thus helped indigenous peoples to asser t their right of self-determination. However, Convention 169 does not itself recognize this right of indigenous peoples. Indeed, it explicitly disavows it. In many Southeast Asian countries, the term “tribal peoples” is used instead of IPs. “Natives” is sometimes used in the US. “Aboriginals” has been used in Australia. The UN uses the generic term “indigenous peoples” in all its documents, and instead of tr ying to define this term more elaborately, has identified a set of unique characteristics that are associated with IPs. Ch a ra c t e ri s t i c s o f In d i ge no u s Peoples The first characteristic of IPs is that they have descended from population groups that were present in a given area before the existence of modern states or territories. These are the socalled early settlers. A second characteristic is that they maintain cultural and social identities that are different from the mainstream society, including a distinct institutional or legal framework, meaning that mainstream institutions, laws, and social mechanics are not applicable in their areas. For example, in an IP community, a number of loosely associated villages may be headed by tribal chiefs who decide, using tribal law, on matters of concern to their society. 242
SOC I AL
D I M E N S I O N S AN D
P O LIC IES
Another impor tant characteristic is self-identification and identification by others as being par t of a distinct, ancient cultural group. Linguistic identity differs from that of the dominant society. In the Chittagong area of Bangladesh, the tribal people speak a dialect not spoken anywhere else in the countr y. IPs have unique ties to traditional habitats and ancestral domains, which is often where difficulties arise. It is ver y hard to prepare an involuntar y resettlement plan for them, because they often will not accept any kind of compensation for giving up their ancestral domain. Yet another characteristic of IPs is that they live in remote areas, although those are not that remote anymore. Development planners are moving toward ancestral lands, and ver y soon one of ever y four or five projects that governments finance will be in tribal areas. That will create unique and possibly terrible problems in terms of resettlement planning. P ro t e c t i n g Indi ge n o us Pe o pl es’ Rig hts A number of impor tant international law declarations and agreements help protect the rights of IPs. As early as 1948, the UN, in its Universal Declaration of Human Rights, proclaimed the impor tance of the economic, social, and cultural rights of various sectors of the world’s population. The declaration covered IPs, although they were not specifically mentioned. However, this was where their legal protection began. The first international convention that specifically addressed the rights of IPs was ILO Convention 107 in 1957. It noted the rights of IPs to pursue their material well-being and spiritual development. In 1989, ILO adopted Convention 169, which was more specific about the right of IPs to par ticipate in development projects that may affect their lives. However, some critics (Maiyan Clech Lam, 2000) contend that Convention 169 undermines indigenous aspirations by emphasizing “par ticipation” or “consultation” rather than “self-determination.” In 1992, Agenda 21 recognized the actual and potential contribution of IPs to sustainable development. Although not a treaty, a convention, or even legally binding, Agenda 21 still manages to provide a comprehensive program of national and international action for sustainable development in the twenty-first centur y, which many nations are now implementing. Chapter 26 of Agenda 21, entitled “Recognizing and Strengthening of the Role of Indigenous Peoples and Their Communities,” recommends that measures be under taken, including the establishment of a process to empower IPs and their communities; recognition that the lands of IPs and their communities should be protected from activities that are environmentally unsound or ones that IPs consider to be socially and culturally inappropriate; respect for traditional values, knowledge, and resource management practices with a view to promoting environmentally sound and sustainable development; and instituting capacity building for indigenous communities, based on the adaptation and exchange of traditional experience. The Convention on Biodiversity adopted a series of resolutions in 1992 that direct contracting par ties to harness biodiversity with respect to traditional knowledge of IPs for preservation of biodiversity and its sustainable use. Finally, the Vienna Declaration and Programme of Action, adopted by the World Conference on Human Rights on June 25, 1993, was developed with the par ticipation of IPs for the first time in the history of UN. The Vienna Declaration addresses issues such as the right of IPs to direct their own developmental priorities, to decide upon the use of ancestral territories and resources, and to sell them. The World Conference on Human Rights recommended in par t that UN 243
AN
IN TRO DU C TIO N TO
S U S TA I N A B L E
DEVELO PM EN T
“organs and agencies related to human rights consider ways and means for the full implementation ... of the commendations contained in the present Declaration.” (See http://www.unhchr.ch/huridocda/ huridoca.nsf/(Symbol)/A.CONF.157.23.En? OpenDocument.) The UN General Assembly declared 1993 as the International Year of the World Indigenous Populations. A UN working group on indigenous populations prepared a draft, the Universal Declaration of the Rights of Indigenous Peoples, which was more or less in line with the Vienna Declaration. Par t II of the Universal Declaration deals with several key issues, including sacred places and burial sites. One of the key elements of the draft, found in Par t III, calls for restitution of cultural, intellectual, religious, and spiritual proper ty taken from IPs without their free and informed consent or in violation of their laws, traditions, and customs. The Vienna Declaration is considered to be a “soft law,” which means that it is impor tant for its persuasive effect, not because it is a hard law with legal obligations. An example of IPs exercising their rights happened in Chiapas, Mexico. In 1999, the US government agreed to finance a $2.5 million project for biological prospecting, specifically for new medicinal plants. The IPs of Chiapas, led by Dr. Antonio Perez Mendez, strongly objected to the project. They insisted on a moratorium on all biopiracy projects in Mexico so that the affected IP could discuss, understand, and propose their own alternative approaches to using their resources and knowledge. Fur thermore, they wanted assurance that no one could patent these resources and that the benefits of the resources would be shared by all the IPs. The project was cancelled in November 2001. Resett l e m e n t Po l i c y fo r Indi genous Peoples A successful resettlement policy for IPs must be consistent with their needs and aspirations. It should also be compatible in substance and structure with affected groups and with their cultural and socioeconomic institutions. To write an IP policy, some of the essential elements should be conceived, planned, and implemented with the informed par ticipation of the affected communities. It should be equitable in terms of developmental effor ts and impacts, and it should not impose negative effects of development without appropriate and acceptable compensation. It is impor tant to note that some developmental effor ts have greater negative impacts on IPs while having little negative impact, if any, on mainstream society. This should also be considered as par t of the involuntar y resettlement policy for IPs, even though it is more difficult to implement, since the IPs do not place a cash value on their culture and ancestral lands. A DB ’s D eve l o p m e n t P l a n fo r Indigenous Peoples In 1999, ADB published a developmental plan for IPs containing the following elements: • preparation, during project design, of a development plan that takes into full account the desires and preferred options of IPs affected by the project; • studies to identify potential adverse effects on IPs that will be induced by the project and to identify measures to avoid, mitigate, or compensate for these adverse effects; • measures to strengthen capacity (social, legal, and technical) of the government institutions dealing with IPs; 244
SOC I AL
D I M E N S I O N S AN D
P O LIC IES
• involvement of appropriate existing institutions, local organizations, and NGOs with exper tise in matters relating to IPs; • consideration in project design of local patterns of cultural belief and use of ancestral territor y and resources; • suppor t for viable and sustainable production systems that are adapted to the needs of local environments and circumstances of IPs; • avoidance of creating dependency of IPs on project entities and instead promoting self-reliance among these peoples; • capacity building for indigenous communities and organizations to facilitate and suppor t effective par ticipation in development processes; and • adequate lead time and arrangements for extending follow-ups, especially in dealings with IPs in remote or neglected areas where little previous experience is available.
SOCIAL EXCLUSION Social exclusion, the eighth element of the social dimensions of sustainable development, needs some explanation as to its origin, meaning, and implications. The French philosopher Rene Lenoir used the term “social exclusion” for the first time in 1974. It referred to the tenth of France’s population who were mentally and physically handicapped, suicidal, aged, abused children, substance abusers, delinquents, single parents, dysfunctional households, marginal people, and other social “misfits.” Although Lenoir coined the term, the idea is not new. The Greek philosopher Aristotle and the Scottish political economist and philosopher Adam Smith explored some of the concepts contained in social exclusion. Both of these thinkers linked exclusion to a lack of individual choice or freedom to make choices. For Aristotle, the richness of human life was explicitly linked to the necessity of first ascer taining the function of man, followed by exploring “life in the sense of activity.” In his view, an impoverished life is one without the freedom to under take impor tant activities of choice. Smith defined the freedom to live a nonimpoverished life as “the ability to appear in public without shame.” As an example he cited that “custom has rendered leather shoes a necessar y [sic] of life in England. The poorest creditable person of either sex would be ashamed to appear in public without them.” Smith’s focus on deprivation, which revolved around not “being able to appear in public without shame,” is a good example of a capability deprivation that takes the form of social exclusion. This relates to the impor tance of taking par t in the life of the community and, ultimately, to the Aristotelian understanding that the individual lives an inescapably “social” life. Smith’s point is that the inability to interact freely with others is an impor tant deprivation in itself (like being undernourished or homeless), and has the implication that some types of social exclusion must be seen as a constitutive component of pover ty, if not a core component. For example, being excluded from employment or being unable to secure credit often leads to economic impoverishment, which in turn leads to other deprivations such as malnourishment or homelessness. Social exclusion can thus constitutively be a par t of capability deprivation as well as instrumentally a cause of diverse capability failures. The case 245
AN
IN TRO DU C TIO N TO
S U S TA I N A B L E
DEVELO PM EN T
for seeing social exclusion as an approach to pover ty is easy enough to establish within the general perspective of pover ty as capability failure. Two C a t e go ri e s o f S o c i a l E x c l usion Nobel Prize winner Amar tya Sen did a study, “Social Exclusion: Concept, Application and Scrutiny in 2000” for ADB. Sen identifies two major categories of social exclusion: • Active social exclusion—something promulgated by law or by pronouncement, such as not allowing a group of people, because of ethnicity or some other defining reason, to participate in a political process. Malaysia’s Constitution, for example, excludes certain groups of people from holding high positions in the government or owning land. It is an elite form of exclusion, since those being excluded are not poor or in other ways disadvantaged. In another example, when a group of immigrants or refugees are not accorded a political status, they are automatically deprived from many social and economic benefits by way of active social exclusion (Ogata, 1998). • Passive social exclusion—something that comes about through social (as opposed to legal) processes such as poverty or isolation. No one may be excluding a person from buying food or from participating in some social activity, but because of a sluggish economy or financial crisis, he or she may not be able to afford it and, therefore, be excluded. In 1997, all of Southeast Asia, but mainly Thailand, Malaysia, Indonesia, and the Philippines, faced a serious financial crisis. Currency values went down drastically, and one million people in that region became known as the “transitional poor.” Another example of passive social exclusion was revealed by the Boston Food Bank in November 2001. Called “Hunger in America 2001,” the study covers a four-year period when the US economy was rather strong. According to the study, 40% of the people ser ved by the Boston Food Bank had to choose between eating and paying their rent or mortgage; 29% said their children were not eating enough; and 22% were employed and still could not afford to put food on the table. The study also indicated that poverty cut across racial lines. More than 54% of the people ser ved by the Boston Food Bank were Caucasian, 30% were African-American, and 9% were Hispanic. A c t ive a nd Pa s s i ve S o c i a l E x c l usion—M ore E xamples The ADB guidelines set out six examples of both active and passive exclusion: • Poverty. The inability to purchase basic necessities and/or required luxuries (e.g., leather shoes) leads to social exclusion. (passive) • Exclusion from the labor market. By closing off the labor market (low end) or some professions (high end), groups of people are effectively excluded from earning a livelihood. (active) • Credit market exclusions. The far-reaching impact of denying access to credit and other financial ser vices to poorer people can be seen as a common example of social exclusion. (active) • Gender-related exclusions. Women’s interests have been consistently neglected, especially in Asia. Women have been routinely excluded from employment opportunities, basic education, land ownership, and access to the law. Depending upon the countr y, it could be either active or passive 246
SOC I AL
D I M E N S I O N S AN D
P O LIC IES
exclusion. Afghanistan, for instance, actively keeps women out of school. However, in other countries that boast of universal educational systems, women may be kept out of school by custom or poverty, which may be a passive form of exclusion. • Health care. The exclusion of large sections of a population from public health ser vices has been a matter of considerable discussion in recent years. It is an extensive problem in many developing regions. For example, the world is facing an AIDS pandemic, and many of those affected cannot be treated because the drugs, although now available, are too expensive. Some social scientists have proposed making this a separate categor y, “international exclusion,” to delineate the inability of poorer nations to afford modern life-saving and -sustaining medical techniques and medicines. (passive) • Food market and poverty. Some countries have no food shortages in the market but host a large malnourished population. These are people who are passively excluded from buying the available food due to lack of purchasing power. However, some form of active exclusion could cause their predicament. In this case, the cost of food may be high because of high transportation and distribution costs. A final point could be the sum of the previous ones—the exclusion of par ticipation. Many people, because of pover ty, disability, sickness, or being from the lower classes of the community, are excluded from par ticipation in various social and economic spheres. When dealing with social exclusion, it is impor tant to note how people are socially excluded. Are they excluded because of some pronouncement, some law? Or are they excluded because of pover ty? If it is because of pover ty, their exclusion could be either active or passive or both. Health insurance is an excellent example. A person may not have health insurance because he or she cannot afford it, which is passive exclusion. But if the government does not provide health insurance for a given section of the public, it is active exclusion.
SOCIAL ANALYSIS Similar to the EIA, social analysis is conducted for projects having significant social impacts. Also, similar to what is done in an EIA, projects are classified on the basis of their social impact as A, B, or C—although their significances are different. P ro j e c t C a t e go ri e s Categor y A projects are expected to have a direct positive social impact on specific sectors such as agriculture and the social sectors. For example, social infrastructure projects such as irrigation, water supply, or sanitation are expected to have, first, a direct social impact, and, second, a positive impact because they create facilities for pover ty reduction and the social good. Categor y B projects rarely have any immediate direct positive or negative social impacts. Projects in the energy, transpor t, and industr y sectors do not have direct linkages with pover ty reduction or par ticipation. They are usually designed without the par ticipation of the affected community. A telecommunications project developing cell phones may not need popular par ticipation beyond 247
AN
IN TRO DU C TIO N TO
S U S TA I N A B L E
DEVELO PM EN T
information gathering by market researchers and later a publicity campaign. It essentially involves telecommunication exper ts who do research, develop a product, and then market it. Categor y C projects are large dams, highways, or mines that have a potential for direct negative impact on the lives of many people. A social analysis might propose abandonment of the proposed project and a search for alternatives; thus a detailed social assessment is required for such projects. Th re e Ty pe s o f S o c i a l A na ly s e s 1. Rapid social assessment (RSA) An RSA is comparable to an IEE. It is a checklist for projects with minimal social impact to see if any of the components will cause problems. If there are some problematic elements in the project or if significant social impacts are identified, a detailed social design study should be conducted. 2. Environmental impact assessment An EIA is a systematic identification and evaluation of potential impact of a project or program on the environment. (See Chapter 5 for fur ther discussion.) In relation to this chapter, the EIA is a vital tool in collaborative decision making, a par t of par ticipator y development. There is an ongoing debate between environmentalists and social scientists as to who should conduct the par ticipation exercises. Should it be par t of the social assessment or the EIA? Environmentalists claim that par ticipation has been an integral par t of the EIA for years. Social assessment procedures, as separate from an EIA, are recent. The policies in many social development issues, such as gender, par ticipation, and the rights of indigenous people, have come into being in just the last 5–10 years. Formerly they were par t of EIA, but not carried out in depth and often relegated to the summar y. Today social scientists are doing a thorough job on each of these social dimensions, although they are still par t of EIA. 3. Social design study (SDS) An SDS is done for all Categor y C projects and perhaps for Categor y B projects, but probably not for Categor y A projects. To determine the need for an SDS, an RSA should be conducted first to determine if the project has a negative social impact and high level of need or demand, and if the community where the project will be located has a high absorptive capacity. Only if these factors are in the affirmative will an SDS be required. Take the case of a Categor y B project where the RSA has found that there are limitations in need or demand. In this case, it is necessar y to determine the reasons why some people do not want the project. Perhaps there is a deficiency in the absorptive capacity of the community. The people may not understand what benefits this project is expected to bring. Or perhaps there are some potential negative impacts on a subpopulation, whether it is tribal people, small farmers, or large landowners. In any of these situations, an SDS is required. It is necessar y to find out why there is a limitation in the need or demand and then create a demand through cer tain social mitigation measures. If there is a defect in absorptive capacity, it is necessar y to know what it is and how it can 248
SOC I AL
D I M E N S I O N S AN D
P O LIC IES
be improved. If there are potential negative impacts for some of the subpopulations, it is necessar y to determine who is predicting these impacts and on what grounds, and then to take measures to minimize them. All of these elements are par t of an SDS. In Categor y C projects, which are likely to have highly significant negative social impacts, it may be necessar y to under take an SDS. However, if the RSA results show that the chances of implementing the project are nil, an SDS is not necessar y. What is needed is to reformulate the project, consider another project, or consider doing nothing. P re p a ri n g a n R S A R e po r t Using a hydropower project as a hypothetical example, it is necessar y first to identify the subpopulations and list them down as a column (see Table 8-2). IPs, subsistence farmers, small marginal farmers, and/or large farmers may inhabit the project area. In another column the percentage of each subgroup occupying the area can be listed. Other columns may record the level of development, needs, demands, absorptive capacity, percentage of population, and specific weaknesses and strengths of each subgroup of population. In this hypothetical example, it is found that, in the case of IPs, which make up 15% of the population, there is a low level of development, a high to low level of need or demand exists, and the subpopulation forms a close-knit but passive community. The level of need/ demand here requires some clarification. Some IPs may have a high demand for a hydro project because they farm the highlands, so they need water for irrigation. But the lowland indigenous groups are afraid that if irrigation comes in the absence of land leveling, their land is going to be flooded; so in their case, the demand is low. Because they are working on somebody else’s land, subsistence farmers have a medium demand and very low level of organization and morale. They do not have much ambition to get irrigated water, high-yielding varieties of seed, and fer tilizer. Small farmers have a high demand, but they are disorganized. Large farmers have a poor history of repayment. This is a typical RSA repor t from which one can then determine the need for SDS. Table 8-2. Typical RSA Report Form: A Hypothetical Example Level of
Level of
Percent
Sub-
Level of
Need/
Absorptive
of Target
population
Development
Demand
Capacity
Population
Speciic Strengths/Weaknesses
Tribals
Low
High/low
Medium
15
Close-knit, but passive community
Subsistence
Low
Medium
Low
40
Very low level of organization
farmers Small/
and morale Medium
High/medium
Medium
30
Keen but disorganized
High
Medium/low
High
15
Poor history of repayments
marginal farmers Large farmers Source: ADB (1991)
249
AN
IN TRO DU C TIO N TO
S U S TA I N A B L E
DEVELO PM EN T
The objectives of an SDS are to optimize the project design by integrating the target group’s preferences and priorities, then developing appropriate project implementation strategies, providing a detailed social justification for the project, and identifying major social risks that may affect implementation. I m p o r t a nc e o f We l l -D ra f t e d R S As and S DS s A well-researched RSA should provide detailed drafts of any conditions and covenants, indicating those steps that need to be taken to offset risks. These conditions and covenants should be attached to the repor t. By ensuring compliance with such conditions and covenants, success of the project will be more likely, as will cost recover y for the loan repayment. If there is a default in cost recover y, the internal rate of return of the project will likely be such that the project cannot be financed, as it will not be bankable. An RSA is a necessar y par t of the social dimensions of sustainable development. However, since the techniques of social design studies are new, the question is, who are qualified to under take these assessments? A DFI may lack the trained personnel for the job. Such an institution may fund as many as 100 new projects a year, many of which need an RSA—and perhaps more than the institution can handle in-house. Thus the DFI will have to outsource these studies to exper ts and consulting companies. Unfor tunately, many of the companies that are awarded such work are more familiar with engineering and environmental assessments than social assessments. There is therefore a need for a new breed of consultants with exper tise not only in economic and environmental assessment but also in social design, who have the knowledge and facilities to conduct RSAs and SDSs. H ow S o c i a l D eve l o p m e n t Po l i cies Wor k Despite the shor tage of social development exper ts, the responsibility for implementing resettlement and social design policies lies with project proponents assisted by finance institutions. A lot of time is spent on this process. For example, even though the RSAs may be done by outside consultants, the social development exper ts of ADB spend a great deal of their time dealing with these issues. A built-in procedure at ADB requires a project to be reviewed by both staff and management before it is submitted to the Board of Directors for approval. After the project design is completed, the social development exper ts look at it to ascer tain if it is in accordance with the approved guidelines. Once the social development exper ts approve a study, it goes to the management of the DFI for final approval. The top officials will then meet with the heads of the involved depar tments to clear the project before it goes to the board. If there is a question on the social assessment, the EIA, or the economic and financial viability of the project, it is generally returned to the initiating office for fur ther work.
250
SOC I AL
D I M E N S I O N S AN D
P O LIC IES
After approval of a project by the board, and once the loan is extended, staff of the DFI are assigned to monitor the progress of implementation. If the loan conditions or covenants designed to minimize the risks identified in the RSA are not being complied with, a financial institution might hold back the unreleased tranche of the loan until the loan conditions are satisfied. Finally, DFIs have postevaluation offices, whose job is to evaluate the performance of a project as originally intended, once it is completed. The objective of this exercise is to provide feedback of lessons learned into the project cycle so that mistakes are avoided and good lessons are repeated in future project design and implementation.
S O C I A L D EV E L O P M E N T I N D I C A T O R S (SD I S ) Social development indicators (SDIs) comprise the final element of the social dimensions of sustainable development. Sel e c t i ng t he Pa ra me t e rs Although there has been some discussion on environmental indicators, the literature on SDIs is relatively new. One has to choose some critical social development parameters such as longevity, income per capita, gross primar y enrollment (which reflects the state of education), and basic needs satisfaction (such as the percentage of people who have access to a safe water supply) and monitor their progress in a countr y. This is essentially the concept embedded in UNDP’s HDI. On the basis of the HDI, countries are ranked as high (55 countries), medium (86 countries), or low (34 countries). HDI values var y from 0 to 1. High values range from 1.000 to 0.800, medium values from 0.799 to 0.500, and low values from 0.499 to 0.000. In 1994, the World Bank published a series of social development diamonds (see Chapter 4) using the parameters of life expectancy, school enrollment, GNP per capita, and access to safe water. Development diamonds can be created for any given countr y using these four indicators (Figure 8-1). This method allows comparison of the degree of social development as measured by these parameters in given countries or regions. Soc i a l D eve l o p m e n t E l a s t i c i ty The concept of social development elasticity (SDE) is derived from the concept of environmental elasticity. SDE is defined as the percentage change in the ratios of income distribution (as measured by the ratio of income of the richest 20% of the population to the poorest 20%, divided by the aggregate percentage of change in the economy, which is measured by GDP growth). The concept is also derived from the Gini Coefficient, which is a measure of aggregate inequality of income (see Box 8-2). The coefficients for developed countries lie between 0.50 and 0.70, whereas for developing countries they var y in the range of 0.20-0.35 (Box 8-2).
251
AN
IN TRO DU C TIO N TO
S U S TA I N A B L E
DEVELO PM EN T
Figure 8-1. Social Developmental Diamonds PRC
Nepal
Low-income
Low-income
Expectancy
GNP per capita
Gross primary enrollment
Gross primary enrollment
Access to safe water
Expectancy
Expectancy
Gross primary enrollment
Access to safe water
Low-income
Source: P. Rogers et al. (1977)
252
GNP per capita
Access to safe water
GNP per capita
Indonesia
Expectancy
GNP per capita
Gross primary enrollment
Access to safe water
Pakistan Low-income
SOC I AL
D I M E N S I O N S AN D
P O LIC IES
Box 8-2. Calculating SDE
In calculating SDE, one has to find the answer to the following question: For every percentage growth of GDP per capita, what has been the percentage decrease of the ratio of the income of the richest 20% to the poorest 20% of the population in a country? If this ratio of income decreases with the increase in GDP per capita, it indicates positive elasticity and is a sign of improved income distribution. Economists have drawn elasticity curves in the form of a Lorenz Curve, but it was recognized as an income distribution curve at best. What is significant in the elasticity concept is that such improvement of income distribution with increasing GDP per capita in a country is a positive indication of implementation of pro-poor economic and social development policies. As a hypothetical example, take the data given in Table 8-3. In 1990, Q5/ Q1 was equal to 30.1. In 2000, the same ratio was 25. The social elasticity is: SDE =
Percentage decrease in ratio of Q 5/ Q1 = (30-25.0)/30 = 16.6 = + 0.664 Percentage increase of GDP (500-400)/400 25.0
Table 8-3. Hypothetical Data for SDE Calculation in Box 8-1
Q5 equals the income of the richest 20% of the population. Q1 represents the income of poorest 20% of the population 1990
2000
Q5/Q1
30.1
25.0
GDP/Cap
$400
$500
Figure 8-2. Population Groups by Income
Population Groups by Income Richest (20%) High Income (20%) Middle Income (20%) Low Income
Q5 Q4 Q3
(20%)
Q2
Poorest (20%)
Q1
Q5 = Income of richest 20% of the population Q1 = Income of poorest 20% of the population 253
AN
IN TRO DU C TIO N TO
S U S TA I N A B L E
DEVELO PM EN T
These SDE measurements, which are based only on income, are dynamic. They use two points of time, for instance, 1990 and 2000. What was the ratio of income distribution of the richest 20% to the poorest 20% within the given time frame? (See Figure 8-3.) Has it decreased or increased? A decrease means income distribution is naturally improving. An increase means income distribution is growing fur ther apar t as GDP changes. Th e Fo ur Q ua d ra n t s A typical social elasticity graph consists of four quadrants: positive income distribution with negative growth, positive income distribution with positive growth, negative income distribution with negative growth, and negative income distribution with positive growth (Figure 8-3). Figure 8-3. Map of Social Development Elasticity
Income Distribution (id)
Positive id with negative growth
Positive id with positive growth
II Most unlikely
I Most desirable GDP Growth
III Least desirable Negative id with negative growth
IV Most likely Negative id with positive growth
Positive income distribution means that the ratio of the income of the richest 20% to the poorest 20% is decreasing; negative distribution means it is increasing. The most desirable quadrant is the one where the income distribution is positive and growth is positive. That means, if the ratio of the richest 20% to the poorest 20% in 1990 was ten, and if it was nine in 2000, income distribution improved. The most likely situation, however, in which most developing Asian countries lie, is where GDP is growing but income distribution is getting worse. If the ratio of the income of the richest 20% to the poorest 20% was ten in 1990, and then in 2000 it became 20, GDP increased but income inequity also increased. There is another, albeit unlikely, scenario, but one that could occur, where income distribution is improving but GDP’s decreasing (Quadrant II). This means that the rich and poor are coming 254
SOC I AL
D I M E N S I O N S AN D
P O LIC IES
closer but the countr y is getting poorer. And of course, the least desirable situation is when both income distribution and growth are negative (Quadrant III). Some exper ts believe that even if the GDP per capita grows, the income gap between the richest 20% (Quantile 5) and the poorest 20% (Quantile 1) may not improve and in fact may even widen (See Table 8-9). They say this is probably because the flow of income does not go from the richest to the poorest. There may, however, be a trickle-down effect between the high-income group and the middle- and low-income groups. The poorest 20% are not affected, because they may be so poor that they cannot or do not want to take par t in development activities. They may not be able to work because they are disabled or they do not possess marketable skills. If we take the ratio of the high-income group (Quantile 4) and divide it by that of the lowincome group (Quantile 2), we get a better measure of income distribution (SDE 1) than if we divide the ratio of income of the richest 20% by that of the poorest 20% (SDE 2). That is why we do not see much improvement in terms of equity between the richest and the poorest (see Chapter 2). It should be noted, though, that data can be interpreted differently. SDE1 is the social elasticity when we take the ratio of the richest 20% to the poorest 20% and monitor whether they are increasing or decreasing (Figure 8-5). SDE2 is also social elasticity, but instead of comparing the income of the richest to the poorest, SDE2 compares the income of the high-income to lowincome group. The income distribution pattern is expected to be better than from the richest to the poorest. Figure 8-4. Social Development Elasticity 1 for the PRC and India, 1989-1992
150
Social Elasticity Values
100 Social development elasticity for PRC
50
Social development elasticity for India
0 T1
T2
T3
-50 -100 -150
Time Frame T1=1989 T2=1990 T3=1991-1992
Never theless, SDE, as a yardstick for social development, shows promise because it concentrates on the most critical issue relevant to social justice—income distribution as measured by the income gap between the rich and the poor. 255
AN
IN TRO DU C TIO N TO
S U S TA I N A B L E
DEVELO PM EN T
Mea s uri n g Inc o me D i s t ri but i o n How do we measure the distribution of income? Let us take a hypothetical countr y. The first thing is to break down the population into five quintiles, from the richest 20% to the poorest 20%, to see what percentage of the national income each group receives. For our hypothetical countr y, let us assume the income of the richest 20% to poorest 20% is 40%, 28%, 18%, 10%, and 4% as shown in Table 8-4. Table 8-4. Income Distribution among the Five Quintiles
Quintile Q5 Q4 Q3 Q2 Q1
In a given time 40% 28% 18% 10% 4%
Next, we will plot a Lorenz Cur ve (Figure 8-5), which is a graphical way to look at income distribution. Figure 8-5. Lorenz Curve Income as a percent of national income in 2000
100
80
60 (18+18+10-4)
40 (18+10-4)
20 (10-4) (4)
0
1
2
3
4
5
Quintile
The Lorenz Cur ve is closely related to and can be derived from the Gini Coefficient (see Box 8-3). 256
SOC I AL
D I M E N S I O N S AN D
P O LIC IES
Box 8-3. Gini Coefficient
The Gini Coefficient was developed by the Italian statistician Corrado Gini. It is a measure of the income inequality in a society. The Gini Coefficient is a number between 0 and 1, where 0 means perfect equality (everyone has the same income) and 1 means perfect inequality (one person has all the income; everyone else earns nothing). While the Gini Coefficient is used mostly to measure income inequality [see Figure 8-2 and Table 8-4], it can be also used to measure wealth inequality. The Gini Coefficient can be further understood using areas on the Lorenz Curve diagram. If the area between the line of perfect equality and the Lorenz Curve is A, and the area underneath the Lorenz Curve is B, the Gini Coefficient is A/(A+B). This is expressed as a percentage or as the numerical equivalent of that percentage, which is always between 0 and 1 [See Figure 8-5]. Source: Wikepedia, the free encyclopedia
Income as a percentage of the national income lies on the X axis, and the quintiles make up the Y axis. The cur ve runs from zero (no population, no wealth) to 100 percent of the population owning 100 percent of the wealth. In our case, Q1 holds 4 percent. The plotting is cumulative. The next quintile holds 10 percent plus 4 percent. What would a Lorenz Cur ve look like if income were evenly distributed? It would be a straight line. Our graph has a distinct bow, so income is not evenly distributed in our hypothetical countr y. Taking another set of figures for time t + Δt. One can calculate the shift of the Lorenz Cur ve to see if the distribution of income has improved or worsened. SDE precisely demonstrates the same measurement to indicate the shift of the Lorenz Cur ve to the right (worsening income distribution) as to the left (improving income distribution).
CONCLUSION An increasingly important dimension of sustainable development is the social dimension – the others being the economic and environmental. Primarily, two factors governed the emergence of social dimension: (i) despite robust economic growth, one out of ive people on earth remained poor; and (ii) increasing awareness and recognition of the need for people to participate in the development process that affects their lives. It is universally recognized that eradication of poverty is the most important factor governing the sustainability of development. The core of a conceptual framework for eradication of poverty lies in identifying the right kind of policy environment, institutional set-up, and program focus for promoting economic growth, population growth, and distributional effectiveness. Distributional effectiveness is determined by the percentage of GDP growth allocated to projects designed to create employment and assets in poverty stricken areas. On the other hand, the practical steps to eradicate poverty is to identify the poor on the basis of their geographic location, their needs, and their aspirations. Programs and projects should then be designed and implemented to meet those needs and aspirations. Other social dimensions of sustainable development are: participation (NGOs, civil society, and private sector), gender equity, needs of the indigenous people, involuntary resettlement, social exclusion, and social assessment. 257
C H A P T E R
9
T H E E C O N O M I C S O F S U S TA I N A B I L I T Y
AN
EVOLUTION
OF
IN TRO DU C TIO N TO
S U S TA I N A B L E
DEVELO PM EN T
E C O N O M I C T H I N K I N G A B O U T T H E E NV I R O N M E N T ROLE OF ECONOMIC FACTORS
AND THE
T
he economics of sustainability 1 deals with natural, human-made, and human capital. It is thus more than environmental economics, because it includes the development of an economy and society, not just management of environmental issues. Economics in general deals with the production and distribution of wealth and is sometimes defined as the science dealing with the use of, or allocation of, scarce resources. To achieve sustainable development, people often talk about the triple bottom line— economic efficiency, equity, and environmental sustainability, in shor t, the three E’s (See Chapter 1). There are even companies that put a triple bottom line on their balance sheets, to indicate how they are doing economically, how they are doing with regard to the social issues, and how they are doing with regard to the environment (The Economist, Januar y 2005). This is not a new idea; it is simply thinking conceptually about the three E’s and indicating how well the components meet these goals. In this chapter we focus on economics, the first of the triple bottom line. To understand sustainable development, we have to understand that the concepts often used in economics provide a ver y impor tant par t of the tools needed. L a n d , L a b o r, a n d C ap i t a l : A d a m S mith and Dav id Ricardo The great economic philosopher Adam Smith, in his treatise The Wealth of Nations, published in 1776, and the English economist David Ricardo, who published his Principles of Political Economy and Taxation in 1817 (Cambridge Biographical Encyclopedia, 2000, p. 789), were concerned with the economic valuation of what they considered to be the three most impor tant factors of production: land and the natural environment; capital, by which they meant the development of the land and nature; and labor, through which land is transformed into real assets. Smith may have arrived at his conclusions based on his view of the world from eighteenth-centur y Edinburgh, Scotland. The economy then was largely based on an agrarian society. L a b or a n d C api t a l : K a rl M a rx After the industrial revolution in Britain, which began in the second half of the eighteenth century, Karl Marx focused on the key factors of labor and capital in Das Kapital, published in three volumes in 1867, 1884, and 1894, respectively (Cambridge Biographical Encyclopedia, 2000, p. 625). For Marx, the proletariat and capitalists were the key factors. Land did not matter. Capital and labor were all that was needed to produce results. Marx described how the capitalists took the people out of the countryside and put them into Blake’s “dark, satanic mills” and factories to produce manufactured products. The natural environment seemed to have been dropped from the economic equation. The reason was that natural environmental factors were not viewed as being scarce at 1
The authors thank John Dixon for his insightful contributions to this chapter.
260
T H E
E C O N O M I C S
O F
S U S TA I N A B I L I T Y
that time. During Marx’s time, many millions of people moved away from the land to the newly industrialized cities, taking for granted that the land would always be there. Colonization and the establishment of global empires fur ther reinforced that view. If a resource in one countr y was destroyed or degraded, industrialized countries simply appropriated other countries’ resources and impor ted them under the guise of colonialism. Marxism in the twentieth centur y was the extreme version of this earlier concept. The focus was just on capital—capital accumulation and capital creation—and on labor, but only as an input into the process of capital accumulation. The leaders of the Soviet Union thought they could solve all of their problems by building megalithic projects. Capital investment was the way to development, an ironic approach coming from avowed anticapitalists. John M ay n a rd Key ne s The Global Depression of the 1930s challenged all previous economic assumptions. The English economist John Maynard Keynes brought labor back into the equation. He noted that the people’s demand for goods and ser vices really mattered and that the lack of consumer demand was a major contributing cause of the depression. Many big mills, docks, and factories had been built, but people were not buying the products of these facilities. So Keynes focused on expanding the demand for the products, and thus on capital and labor. He argued that the government should step in and augment the demand of the private sector in order to increase the level of aggregate demand. Keynes was not par ticularly concerned with the environment, and he did not bring environmental considerations into his broadened discussion of the economy. The environment was taken as given, and environmental issues were not subject to policy discussion. C ap i t a l , L a b o r, a n d L a nd It was not until after World War II, sometime in the early 1950s, that land rejoined capital and labor to form a complete economic picture. Its entr y marked the bir th of modern environmental economics, which reemphasizes the impor tance of land as an economic factor. By land, today’s environmental economists mean ecosystems. This is a fairly recent definition; previously, the term “land” was used in a general sense. In a sense, we have gone full circle (Table 9-1). We star ted out with land as an economic factor in the eighteenth centur y, forgot about it for about 100 years, then put it back into the equation in the middle of the twentienth centur y. It was not because reality changed, but rather because the perception of reality changed. In the early par t of the twentienth centur y, a company would issue stock cer tificates beautifully engraved with factories billowing black smoke into the air from giant chimneys to show how modern and progressive it was. Now, of course, it is just the opposite. So, again, perceptions have changed, but the effects, for good or ill, have remained the same.
261
AN
IN TRO DU C TIO N TO
S U S TA I N A B L E
DEVELO PM EN T
Table 9-1. Evolution of Economic Thinking
Land
Labor
Land
Labor
Labor
Capital
Malthus
Capital
Adam Smith, David Ricardo 19th century Industrial Revolution, Karl Marx
Capital
Marxism in 20th century USSR
Capital
Labor
Capital
Labor
John Maynard Keynes
Land
Modern environmental economics
Source: Based on John Dixon (personal communication, November 2002)
CONCEPTS
OF
WE L F A R E
U t i l i t y M a x i mi z a t i o n a nd V i l f redo Pareto’s Frontier According to the Oxford English Reference Dictionar y, the philosophers Jeremy Bentham (17481832) and John Stuar t Mill (1806-1873), together with “an impor tant antecedent” provided by David Hume (1722-1776), “advanced utilitarianism,” the “theor y that an action is right insofar as it promotes happiness, and that the guiding principle of conduct should be to achieve the greatest happiness or benefit of the greatest number.” Under utilitarianism, utility should be maximized in order to promote welfare, which is defined as “well-being, happiness; health and prosperity (of a person or a community).” Figure 9-1. Utility Maximization
1
2
3
E B A
F C F Broad Utility Criterion (Pareto Frontier) Sharp Utility Criterion (Social welfare function with intersection at Pareto frontier) Source: Based on Economics of the Environment: Selected Readings, R. Dorfman and N.S. Dorfman,eds. (1972) 262
T H E
E C O N O M I C S
O F
S U S TA I N A B I L I T Y
Figure 9-1 attempts to indicate how a person or a group of people, designated as A, and another person or group of people, designated as B, can maximize their utility. Each seeks its own preferences without making interpersonal comparisons. In a world in which resources are limited, as A maximizes its utility, B’s utility becomes limited, and vice versa. Under normal circumstances, there is a trade-off on the frontier between the utility of the two. By plotting what happens to the decrease in A’s utility as the utility of B increases, one can create a line called the Pareto frontier. The Pareto frontier is named after Vilfredo Pareto, who was an “economist and sociologist” who irst worked as an “engineer, and directed a railway company in Italy (Cambridge Biographical Encyclopedia, 2000, p. 721).” The Pareto frontier is a very helpful concept that suggests that, along this frontier, stretching from point E on the vertical ordinate to point F on the abscissa (horizontal ordinate), there are many solutions to the welfare of A and B. Fur thermore, it suggests that both A and B can be better off by moving in a northeast direction from any point such as point F interior to this frontier. There could also be some par ties demanding to be in the area to the nor theast, beyond the Pareto frontier. But the problem is that such an outcome is not feasible, because it is physically and technically impossible to move outside of the frontier. The Pareto frontier is formed by joining a series of joint outcomes that cannot be exceeded without making the other par ty worse off. A Pareto frontier can be generalized to many conflicting groups or individuals. What we would like to do is find a place on that frontier where both A and B can be happy. If we have some sor t of social welfare function, shown by curves 1, 2, and 3 in Figure 9-1, we will be able to show the combined welfare of A and B for each point on the cur ve (there are a lot of logical reasons why they would take the shape shown in the figure). If the welfare functions exist, then where the Pareto frontier just touches a social welfare function curve would be the optimum solution. The Pareto frontier is a useful concept, but it is ver y hard to put actual numbers on the axis showing the utility of A or B, or to put numbers on the social welfare function lines. Notice there is no scale marked on the axes. The real problem is that we do not know how to define utility functions or social welfare functions in terms other than their broad shapes, but the concept illustrated in the figure provides us a useful entrée into thinking about the concept of welfare, even though it is hard to accomplish in fact. People are assumed to have a utility function, based upon all the goods and ser vices that they consume. It is assumed that each person’s utility is improved by consuming more goods and ser vices. One’s utility function can be visualized as a vector function based on a person’s wish for goods and ser vices. Generally, most people with normal behavior would maximize their utility by consuming more goods and ser vices. These goods and ser vices can include environmental quality, which may not be among the usual sor ts of goods and ser vices that people seek. One person might seek an expensive automobile and expensive vacations and things like that, but another person might wish to consume other things, like listening to popular music or opera. Without explicit functions it is hard to maximize utility. However, using this definition and some plausible assumptions about individual economic behavior, concepts and data that have been developed for GDP, we can operationalize the maximization of utility by use of actual data and the generation of competitive market solutions. 263
AN
IN TRO DU C TIO N TO
S U S TA I N A B L E
DEVELO PM EN T
G DP a s a P rox y fo r Ut i l i t y 1. Trade-offs between city inhabitants and farmers Suppose a big water project is to be built, and some people want water for recreational purposes, while others want water for irrigation. Figure 9-2 illustrates the benefits attainable by each of the groups. Suppose fur ther that recreation expressed in person-days is shown on one of the axes, and irrigation expressed in hectares of land is shown on another axis. Those seeking recreation, primarily city inhabitants, and those seeking irrigation, primarily farmers, will have to make some trade-offs. If their demand for irrigation and recreation can be plotted, the possibilities of all feasible combinations of recreation and irrigation as a cur ve creates a proxy for the Pareto frontier called the Production Transformation Cur ve in this context. The analysis focuses on maximizing the utility in terms of persons identified as A, who want water for irrigation, and persons identified as B, who want water for recreational purposes. Based upon this analysis it is still not possible to identify the locus of the point on the cur ve at which total welfare is maximized. To do so we need some additional information about the relative values of irrigation and recreation; and this comes from prices. Figure 9-2. GDP as a Proxy for Utility
I rr i g a t i o n ( t h o u s a n d h e ct a re s )
1
2
3
4 GDP
PRODUCTION POSSIBILITIES FRONTIER
R e c rea t i o n ( t h o u sa n d p e r s o n – d ays ) Broad Productivity Criterion (Production Transformation Cur ve) Sharp Productivity Criterion (GDP) (Intersection of GDP and Production Transformation Cur ve) Source: Based on Dorfman anf Dorfman (1972)
2. GDP as an indicator of welfare If, however, prices can be associated with each of the two commodities, a line can be drawn showing the trade-offs between the utilities of A and B. This is sketched as lines 1 through 4 in the figure. The GDP, or the relative contributions of irrigation and recreation to GDP, can now ser ve as
264
T H E
E C O N O M I C S
O F
S U S TA I N A B I L I T Y
a proxy for utility, or as an estimate for the welfare function. Indeed, GDP is often used as a proxy for the welfare of nations. Some critics are unhappy with such a use of GDP, though most people use GDP as a proxy. In fact, GDP is one of the most impor tant indicators that people use when they are describing how well countries are doing. As such, GDP is a powerful indicator of welfare. Other indicators are given in Chapter 11. Ec o n o mi c E f f i c i e nc y a nd Pa reto Optimality Economic efficiency can be defined as the organization of production and consumption such that all possibilities for increasing economic well-being have been exhausted. Pareto optimality consists of the “allocation of resources such that no fur ther reallocation is possible which would provide gains in production or consumer satisfaction to some firms or individuals without simultaneously imposing losses on others.” Pareto optimality can be expressed simply as as attainment of economic efficiency in production of goods and services; economic efficiency in distribution of goods and services; and resource allocation consistent with consumer preferences. If Pareto optimality is achieved, then economic efficiency is achieved. Pareto reasoning depends on at least four value judgments. First, since individual preferences count, the economic welfare of a society is based upon the welfare of individual citizens, which is a reasonable assumption. Second, the individual is the best judge of his/her own well-being. Third, a change that makes ever ybody better off with no one being worse off constitutes a positive change in welfare. Four th, if the gainers could compensate the losers and still be better off, the change is judged an improvement. The foundation for a great deal of environmental work focuses on the need to talk to people and to get them to par ticipate in the decisions about how the environment is managed, because individual preferences are vital in expressing the welfare of society. Since individual welfare is best judged by an individual’s well-being, not by a national, authoritarian entity, ever ybody is better off knowing how to achieve a positive change in welfare. This means finding the Pareto frontier, and moving along the frontier until the social welfare function is maximized, as shown in Box 9-1. Box 9-1. Production Approach
• …an organization of production and consumption such that all unambiguous
possibilities for increasing economic well-being have been exhausted. • …an allocation of resources such that no further reallocation is possible which would provide gains in production or consumer satisfaction to some firms or individuals without simultaneously impossing losses on others (Pareto Optimality). • …Pareto Optimality can be expressed simply as attainment of economic efficiency in distribution of goods services, and resource allocation consistent with consumer preferences. Source: John Dixon (personal communication, November 2002)
265
AN
IN TRO DU C TIO N TO
S U S TA I N A B L E
DEVELO PM EN T
S om e M a c ro e c o n o mi c C o nc e p ts 1. Production approach Why does a loaf of bread cost so much? In a competitive economy, ever y person who has something to do with the manufacturing process adds his or her own cost or value added before passing the product on to the next consumer. This accumulates down the production line, from the farmer to the grocer. The cycle begins with capital. If one owns capital and uses it, one gets paid for it. The farmer star ts out with his capital, consisting of land, irrigation water, and farm implements. He then adds the value of his own labor to these components for producing wheat. When the miller buys wheat from the farmer and with his equipment, his capital, turns the wheat into flour, he also adds value on top of the farmer’s value added. The baker does the same thing after he turns flour into bread, as does the grocer who sells the bread to the consumer, who pays for the actual retail value of the bread. This is the production approach (see Figure 9-3), which measures GDP by summing the value added by each firm or “economic agent,” in the economy. Figure 9-3. Production Approach
M easu rin g GDP by s um m ing t he value added o f eac h firm in t he economy Farmer Value added M iller Wheat
Value added
Baker Flour
Value added
Gro c er Wholesale bread
Value added
C o n su mer Retail value of bread (final expenditure)
2. Gross national product (GNP) GNP is the market value of all the final goods and ser vices produced by the economy in a given year. All goods and ser vices involved in public and private transactions are included in GNP. Private goods and ser vices are valued at cost. Cer tain components of GNP are imputed. These include the rental value of owner-occupied houses, and the value of goods produced and consumed by farms. Cer tain kinds of ser vices are not counted, however. Since there is no reliable way of evaluating the ser vices of housewives, for example, they are not par t of GNP. Voluntar y community ser vice are also excluded for the same reason. This definition raises the issue about goods and “bads.” “Bad” things can increase the value of GNP. More prisons mean a larger GNP, because of the goods and ser vices traded. More wars chalk up the same results. The buying and selling of militar y hardware and paraphernalia are profitable activities from the point of view of GNP; more automobile accidents also increase it. 266
T H E
E C O N O M I C S
O F
S U S TA I N A B I L I T Y
3. Gross domestic product (GDP) GDP is the sum of total value of final goods produced and ser vices provided in a countr y in one year. This includes the value of products that are produced in a countr y for local consumption or for expor t, but does not include impor ts from other countries. GDP is calculated by adding private and public spending, investments, and expor ts, minus impor ts, and minus value generated by foreign-owned companies. Thus the Oxford English Reference Dictionar y (1996), defines GDP as “the total value of goods produced and services provided in a country in one year.” GDP is probably a better measure of welfare than GNP, because GNP includes foreign trade and exchange rates, which are not always directly related to welfare within a country. GDP, on the other hand, correlates well with such aspects of welfare as life expectation at bir th. This is why the World Bank and the UN often rely on GDP per capita to evaluate development in countries. Par t of the problem is that people value things differently in different societies. The World Bank and the UN try to solve this by using purchasing power parity (PPP) as a yardstick. PPP is especially impor tant in valuing nontraded goods and services. A haircut, for example may cost 50 cents in Bangladesh and $15 in the US, yet is essentially the same “commodity.” PPP takes into account these adjustments and commodity-measured income for the poorest countries and measured income for the richest countries (e.g., Switzerland’s GDP measured in PPP is reduced by 6%). They ask how much a similar basket of goods would cost in Bangladesh as compared with the US. It is a way of trying to evaluate GDP fairly, because GDP per capita is so low in some countries like Bangladesh that it would appear that nobody could earn enough to survive. Some M i c ro e c o n o mi c C o nc e pts 1. Price for gasoline and mineral water The price of gasoline is price responsive. Demand and supply cur ves can be used to demonstrate how such a responsive price is established. Typically a demand cur ve slopes downward (Figure 9-4), while a supply cur ve slopes upward. The supply cur ve shows the marginal cost of the producers, so it may be calculated from the production costs. The demand cur ve for a given product represents the total quantity of that product that people will want to buy at a given price. It is the sum of the total demand of all individuals in that society. Demand is a behavioral aspect of consumers, while supply is the technical response of producers. Supply and demand cur ves can be impor tant in suggesting when buyers will “clear” a market of cer tain goods. They also indicate the technical options available, since supply cur ves are based largely on technology and what is possible within a resource base. They determine how much it costs to supply a cer tain amount of a commodity, while activating the behavioral characteristics of the market, since consumers act with respect to the price of the commodity. Normal goods have downward sloping demand curves, depending on what the goods are and how price elastic they are. If they are not price elastic, then they are quite steep. For example, mineral water is more price elastic than gasoline. Price changes greatly affect our consumption of mineral water ; if the price is very high, then we simply buy something else, because we can do without it. But 267
AN
IN TRO DU C TIO N TO
S U S TA I N A B L E
DEVELO PM EN T
Figure 9-4. Change in Price
C h a nge i n Pr ice of Gasoline 2.20
Price ($ p er gallon )
2.05
Gasoline is considered inelastic (meaning price changes have little effect on the quantity we buy)
1.90 1.75 1.60 1.45 1.30 1.15 1.00
1
2
3
4
5
6
7
8
9
Q uant i t y dema nded (g a llo ns)
C h a nge i n Pr ice of M iner al Water 3.00 2.75
Mineral water, on the other hand, is very elastic (meaning price changes greatly affect our purchase of it)
Pric e ($ per bo ttle)
2.50 2.25 2.00 1.75 1.50 1.25 1.00
1
2
3
4
5
6
7
8
9
Q uant i t y dema nded (bo ttles)
price changes in gasoline, a more basic commodity, have little effect in the shor t run on the quantity we buy. Demand curves relate to consumer behavior ever ywhere, from Kansas to Kathmandu. As the price goes up, people consume less; as the price goes down, people consume more. Demand is a purely behavioral trait, and it is not constant. The slope is different depending upon how wealthy one is and how valuable other resources are. See Figure 9-4. Where does a supply cur ve come from? How would we figure out the gasoline supply cur ve? Well, we would ask an engineer to estimate it for us, since engineers are good at figuring out what it costs to produce a cer tain quantity of goods. Engineers design a system, with the cheapest items being produced first. Then the next cheapest option is used, and the next cheapest, so we get increasing costs. The
268
T H E
E C O N O M I C S
O F
S U S TA I N A B I L I T Y
supply cur ve is a technical calculation based on the availability of resources and technology. It has little to do with human behavior and a lot to do with science and engineering. 2. Supply, demand, and willingness-to-pay If we plot the supply cur ve and the demand cur ve on the same piece of paper (Figure 9-5,) the point where the supply cur ve and the demand cur ve intersect indicates the optimal allocation of resources. It shows how much we should buy, how much we should use, and at what price. The price here is the market-clearing price, presuming, ceteris paribus (all other things being equal), a free market economy. Based on Figure 9-5, if the price is greater than C, then we will underconsume; if the price is less than C, then we will overconsume the commodity. If a supplier does not set the price right, for example below C, then the clients will consume more of this good. The supplier does not have to worr y about being above or below the market-clearing price in a competitive market, because he or she will be put out of business; but the supplier does have to worr y about over- or underconsumption in a market caused, for example, by government-set prices. For instance, water in most par ts of the world is underpriced, so people consume too much of it. If water is priced correctly, that is at the market-clearing price, people will consume the amount indicated by A. If we want to economize on the use of a product, we might raise the price higher to limit consumption and avoid supply problems in the future. Thus prices provide very impor tant signals. What is the price for irrigation water in Egypt where there is no free market for water? Since the price is close to zero, Egyptian farmers use a lot of water, and it is vir tually impossible to get the Egyptian government to actually raise the price of water, because the government is supplying the water and paying for all of the goods and services used at the water facilities. Taxpayers are actually paying for the use of all of the resources, but for political or social reasons, the government does not want to charge for water. So with a price of zero or close to it, we are not surprised if people are using as much water as they can get. The issue is how to persuade people to reduce demand to some reasonable level. This case has nothing to do with market clearing and a free economy. The issue is how to ration water resources by changing the price. However, many Egyptians would suggest that rationing of water could be accomplished using signals other than higher prices (such as enforced rationing). However, there are almost no effective alternatives to changing the price in this case. The Libyans have constructed a large ar tificial river at a cost of about $30 billion. This river has tunnels that run from an aquifer under the Sahara to the coast. Double-decker buses could run through these large tunnels. It is an expensive way of getting water. How much do people pay for water in Libya? Very little! That may be considered wonderful by consumers, but it is a questionable price. The government imposed a tax levy 20 years ago when construction of the facility began. It is argued by Libyan taxpayers that nobody should be asked to pay for water now, because the construction has already been paid for by the taxpayers. Unfor tunately, this will do little to curb current demand for the unpriced water.
269
AN
IN TRO DU C TIO N TO
S U S TA I N A B L E
DEVELO PM EN T
Economists are right when they advocate pricing for a resource, even if the exact price is not known. Zero is never a good price, because people behave like drunken sailors when they get things free. The price for delivering water has to be greater than zero. This type of analysis tells us something about consumer surplus, which is represented by the area CBE in Figure 9-5. Note that a discriminating monopolist could actually extract a higher price at a lesser quantity than where the supply curve intersects the demand curve, because people are willing to buy a lesser quantity of water at a higher price along the demand curve until it reaches point E, where it crosses the axis representing the price line. While the producer is getting paid the optimal price at the intersection of the supply curve and the demand curve, he could get paid a higher price by producing smaller amounts if he were a monopolist. Figure 9-5. Supply, Demand, and Willingness-To-Pay
E
Supply Curve
PRI C E
B C
Demand Curve O
A QUAN T I T Y
TOTAL WILLINGNESS-TO-PAY FOR QUANTITY OA = OEBA TOTAL COST OF SUPPLY
= OAB
TOTAL NET WILLINGNESS-TO-PAY
= OBE
CONSUMER SURPLUS
= CBE
PRODUCER SURPLUS
= OBC
OPTIMAL PRICE
=C
If price is greater than C, then underconsume If price is less than C, then overconsume
The demand curve tells us that the consumer would have been willing to pay a price of E, but paid only C. Hence, the consumer has a beneit with each succeeding unit of consumption until he ends up paying C per unit. The consumer surplus is shown as the area between points C, B, and E; its parallel on the producer’s side, the producer surplus, is shown in the area between O, B, and C.Total willingness to pay for a quantity represented by A on the horizontal axis is the area OABE; it provides an estimate of the consumption beneit from investments to produce the goods and services sold at price C in the igure. 270
T H E
E C O N O M I C S
O F
S U S TA I N A B I L I T Y
A government may choose to permit people to consume a cer tain amount of water at zero price. To accomplish this objective, it may need armed guards at various locations to check the amount of water to be drawn by the people. Thus such distribution of water would be under taken by fiat, or command and control. This is typically a ver y difficult way of doing things, and there are many ways to get around it. For example, in this case, who will take most of the water? It is the people who are at the head end of the canals. Since they are not paying for the water, they take all they want and more. People at the other end of the canal do not receive as much, if any, water, even if they are supposed to receive a designated amount under the command and control approach. Why is this so? It may be that the guards who were sent to guarantee the distribution of water at a price of zero get paid less than the farmers are willing to pay for the water. The guards and farmers set a price for the water distributed, and payment goes directly from the farmer to the guard. Corruption is spawned. This is obviously a bad way of pricing a commodity. In relatively well-organized societies like the US, there are still water utilities that do not use volumetric pricing. New York City has only recently star ted to install water meters; the UK does not have water meters in most residences. Droughts occur occasionally in New York. What is to be done about water shor tages during such droughts? If people do not understand that they have to pay for a resource, including the cost of the pipes and other goods and services to bring that resource to their homes, they are not likely to worry about drought until it occurs, when it may be too late. Rent The English economist David Ricardo is closely associated with the economic concept of rent. He obser ved that the quality of the land determines its price. Simply put, naturally fer tile land is more valuable because it is more productive regardless of the level of other inputs (labor, seed, fer tilizer). This extra benefit that comes from the natural state of the land and goes to the landowner when he/she rents it out to farmers is called “rent” in economics. Rent is a fundamental concept. Many of the problems in analyzing and managing the environment arise because different resources in the environment have different inate or natural values, depending on their productivity and how people value them. A lot of this extra value is called Ricardian rent. The attempt to capture some of these rents, par ticularly in natural resources, is known as rent-seeking behavior. The environment contains different rents deriving from various agricultural activities such as fisheries, forestr y, and use of water and soil. There can also be aesthetic rents such as scenic landscapes, which command a premium price. In Hawaii, for instance, a beachfront house is wor th many times more than an identical house located inland. Cleaner environments also produce more valuable rents. Par t of the challenge in environmental economics is measuring rents that arise from having a clean environment. To do this we ask this question: If we manage the environment more sustainably, what is the magnitude of these extra benefits? It should be emphasized that rent arises from the fact that it is difficult to find substitutes for some desirable factors or attributes, and people are thus willing to pay a premium for them. 271
AN
IN TRO DU C TIO N TO
S U S TA I N A B L E
DEVELO PM EN T
This can be demonstrated with a demand cur ve that is highly inelastic. An environmental example would be beachfront proper ty, which is scarce, and a good substitute is hard to find. Therefore it goes with a high price, and rent is generated. A non-environmental example would be rock stars, who do not have close substitutes, so they can demand high fees. The benefit we receive above and beyond what we pay for a good or ser vice is called consumer surplus (area CBE in Figure 9-5). It can be an impor tant concept in environmental economics, because if we are for tunate enough to obtain or use something at low or zero cost, our consumer surplus could be large, par ticularly if we are willing to pay a high price for the product or ser vice. We could say that we are the beneficiaries of rent. The concept of consumer surplus can also be used as an argument for a clean environment and livability. That “something” might not actually belong to us. In a rural setting, it could be walking in nearby woods, or in an urban setting, going for a walk in a public park. If the pleasure derived is more than the cost of admission, the extra benefit that we do not pay for is the consumer surplus. It is a rent that we can par take of and is produced by the environment. Similarly, when resources are degraded or when the air or water is polluted, we lose some of these benefits and surpluses. Many problems in environmental economics arise precisely because of the existence of these nonpriced, and often nonmarketed values. Sometimes we can market the rent, such as beachfront proper ty, but other rents are much harder to capture, because they are public goods.
P U B L I C G O O D S , C O M M O N P R O P E R T Y,
AND
PRIVATE GOODS
To develop resources, much hinges on proper ty rights—who owns the proper ty rights, and what are the roles of the proper ty owners? There are three types of proper ty: • public goods: non-excludable, nonrival consumption (e.g., lighthouse, flood control); • common proper ty: non-excludable, rival consumption (e.g., fisheries, flowing streams); and • private goods: excludable, and rival consumption (e.g., food, consumer goods). P u bli c G o o ds Many classical economists claim that all we have to do is establish proper ty rights, devolve these rights to the people so that ever ybody has proper ty, and then the market will take care of ever ything after that. This may work fine when we are able to privatize the goods, but not if we have public goods or goods that look like public goods or close to them, or common proper ty resources, since they do not fit in nicely with proper ty rights, which can be used in a market setting. Many people think natural resources are public goods just because they are available to the public. To qualify as a public good, two strong requirements need to be satisfied: (i) no one can be excluded from the consumption of public goods, and (ii) there is no rivalr y in the consumption of
272
T H E
E C O N O M I C S
O F
S U S TA I N A B I L I T Y
public goods. A lighthouse is a good example of a public good, because it is hard to stop anyone on a nearby boat from navigating after seeing a lighthouse, and such use of a lighthouse by one person has no effect on its use by another person. Use of a lighthouse is non-excludable and has nonrival consumption. Some public goods are less “pure” public goods; a flood control system is such an example. If we provide flood control, ever ybody within the area benefits. It appears that there is no rival consumption, but in fact we can exclude some people from using a flood control system by building embankments at different places, so it could be excludable. With pure public goods, it may be difficult to rely on markets to pay for their costs. However, in the early 1700s there were, indeed, privately financed lighthouses on the US east coast. People then were willing to pay for lighthouses even though “free riders” used them, because they did not want to run aground on the rocky shores. That kind of lighthouse presents a sor t of anachronism. Generally speaking, public goods, like flood control systems, are difficult to finance from private funds. That is why the US Federal Government typically pays for flood control on large projects. If there is a multipurpose water project involving irrigation, water supply, hydropower, and flood control, the US Federal Government usually pays for the project component containing the flood control system, because that is deemed a public good. C om m o n P ro p e r t y Common proper ty involves non-excludable goods or ser vices, but which allow rival consumption. A classic example is the Boston Commons, which was once considered common proper ty, but due to the rival consumption of cattle, a few landlords appropriated the grazing rights. Not too many cattle are seen on Boston Commons these days, but there may still be families in Boston who have the right to graze cattle there. The same is true of fisheries, because they typically involve non-excludable use of a common proper ty. Today we have the Law of the Sea, which establishes exclusive 300-kilometer zones, creating a sor t of established proper ty right for some fisherfolk. Open ocean fish are common proper ty, since people cannot be excluded from fishing in the open ocean, but there is rival consumption. P r i v a t e G o o ds Private goods are goods that are excludable and have rival consumption. Persons who own proper ty, be it land or water, can keep other people off that proper ty. For example, in par ts of the US people can have water rights that permit them to own quantities of flowing water in perpetuity. It is impor tant to bear in mind what is a public good, what is common proper ty, and what is private proper ty. These things merge in some cases, and they generate a lot of heat when they do. Thus “privatizing” has become a bad word in the international community. For example, NGOs and citizen groups talk negatively about privatization of water companies that sell water to some and not others, especially the poor, who cannot afford to buy water.
273
AN
IN TRO DU C TIO N TO
S U S TA I N A B L E
DEVELO PM EN T
SUMMAR Y This shor t chapter ser ves to introduce a few economic concepts that potentially have great relevance to the issues of sustainability. We note, however, that the histor y of environmental economics has been developed only within the past three decades and that it is grappling with impor tant issues usually ignored by the neoclassical economic tradition. Concepts of wealth and utility are fundamental to all human endeavors; only the economists have been bold enough to provide computable indices of concepts. These concepts, together with Pareto’s notion of efficiency and optimality, provide a rich palette for the development of sustainability economics. This chapter provides the useful macro-and microeconomic concepts to complete the economic paradigm. Chapter 10 discusses the problems of market and government failures that cast doubt on the simple applicability of the powerful economic concepts to the study of sustainability. Chapter 10 attempts to provide the necessar y fixes to the theor y that make it more sustainability friendly.
274
C H A P T E R
1 0
S U S TA I N A B I L I T Y: E X T E R N A L I T I E S , VA L UAT I O N , AND TIME EXTERNALITIES
AN
IN TRO DU C TIO N TO
S U S TA I N A B L E
DEVELO PM EN T
A
n externality can be defined as something that affects people, for good or for evil, over which they have no hand in the decision-making process. (See Box 10-1.) The key element here is the recognition that those involved did not play a role in determining the amount sold or the price paid for the commodity. As a result, the amount and the quality of the goods or ser vices sold in the market might not maximize the welfare of society. 1 In environmental terms, we generally think that externalities are bad things, but in fact externalities can be ver y positive. If we build a dam on a river, many people would say that is bad (unless, perhaps, the dam will provide them with vital amounts of water). Dams are good, however, for producing hydropower or water for irrigation; but they are often bad for the fish and the estuar y downstream. Much depends on how we operate the dam. Another aspect of an externality is that, by its ver y nature, it cannot be accounted for in a normal budgeting framework. The price of a loaf of bread in the supermarket does not necessarily take into account the soil erosion (an externality) caused by growing grain; it does factor in the fer tilizers used (a non-externality), but does not include the eutrophication in rivers due to the fer tilizer use. When we star t looking at the life cycle of a product’s manufacturing process, like a simple $1.98 loaf of bread, we might find that, when we calculate the externalities, its actual cost to society may be many times larger. A simple example can help in explaining what is, and what is not, an externality (personal communication from John Dixon, November 2002). You are driving a car and the person sitting next to you lights up a cigarette. The windows of the car are closed. Is this an externality or not? It is. You were never asked about your health or comfor t, and you have to inhale the secondar y smoke, which is harmful. In a second case, and this is more realistic, if the person asked permission to smoke and you were to give it to him provided he rolls the window down, does this constitute an externality? No, it does not. Giving him permission makes you par t of the decision-making process. The externality has been internalized. Even though it still affects you, you are now par t of Box 10-1. Making Externalities Sustainable
There are three ways externalities can be incorporated or not into any project. If we begin a project without consulting the people who will be affected by it, then the externalities will not be incorporated. If we do ask, and they say yes, then there is a willingness to accept the burden. But it might still be considered an externality if the educational status or the socioeconomic status of those affected is such that they do not understand the project’s impacts. The externality only disappears when the transaction becomes a two-way street, i.e., those affected by the project and those undertaking the project both understand the scope of the impact of the proposed project and discuss compensation when necessary. Source: John Dixon (personal communiction, November 2002)
1
The authors wish to thank John Dixon for his impor tant contributions to this chapter.
276
S U S TA I N A B I L I T Y : E X T E R N A L I T I E S , VA L U AT I O N , A N D T I M E E X T E R N A L I T I E S
the decision-making process and, assuming you are informed and know the benefits and costs, you made a decision to allow the passenger to smoke. A third example involves the same car and the same cigarette. But now when your passenger asks if he can smoke, you tell him yes, but it will cost him $1. Are you now affected by an externality? No, because if he does not smoke, you are not affected, and if he does smoke, you have set the price for compensation for your willingness to accept any risk to your health. So a compensation principle is at work. By understanding this technical definition of an externality, we can understand why environmental economists tr y to identify first what the externalities are over space and over time, and then tr y to assign a value to them.
VA L U A T I O N Looking back at the cigarette example, the driver might decide that cigarette smoking is annoying but he will put up with the risks and annoyances for a large compensator y amount. Hypothetically, the driver might not accept any amount of money, because the annoyance and the risks are too great. Realistically, there is probably some price that will induce the driver to put up with the smoker. Generally in quantitative terms, the driver might decide to be indifferent between not smoking and the $1 compensation for smoking. By doing this the driver has established a market, and the externality has been internalized. When we internalize an externality, it goes away. Ron a l d C o a s e a n d In t e rn a l i z ation In both examples given above, you are par t of the decision-making process, and the externalities are being internalized. This is basically the Coase theorem (Coase, 1960, pp. 1-44). He says, when people are engaged in an issue and they enjoy well-established proper ty rights, then in fact just by negotiating and by being par t of the decision-making process, they can internalize the externalities, and thus solve the problem. According to Coase, it does not matter who owns the initial proper ty rights; if rights can be bought and traded, one can still end up at a superior solution. In a case involving a natural resource dispute between resor t owners, a fleet of boats owned by fishing companies, and a logging company, the resor t owners and fishing companies can combine resources and either reform the logging company’s practices or buy it out. The trouble with such Coasian solutions is that they do not work ver y well if the groups have large differences in numbers of members, political power, discount rates, and/or time horizons. For example, if logging has to be stopped, then the company has to be bought out, and it will at least need to be compensated for lost revenues. Restoring a degraded forest and compensating for related social costs arising to local inhabitants from logging of timber resources will likely cost more than buying out the timber company.
277
AN
IN TRO DU C TIO N TO
S U S TA I N A B L E
DEVELO PM EN T
Note that such a Coasian solution through internalization of externalities may not work if there are 60,000 people impacted by one smoking factor y chimney, and if all the impacted people get together and tr y to negotiate a solution. The transaction costs of such negotiations will be too high. But if there are two or three groups, or appropriate representatives of groups are involved, then it might work. Such considerations are par t of the argument for par ticipation in environmental negotiations. This is a way to tr y to internalize externalities by negotiation so that people can agree on how to deal with or eliminate externalities, perhaps by providing compensation, like someone who wants to smoke a cigarette paying $1. Pol i c y M a k i ng a nd Po l i c y R e s p o nse in the Face of E xter nalities How do we respond to problems that we obser ve in the environment? First, we need to identify the externalities, the costs, and the benefits. Then we must decide the kind of responses likely to bring a society from a less efficient to a more efficient outcome, one where the total social welfare is increased. Externalities are thus ver y impor tant when we are considering the meaning of “sustainability” in the phrase “economic sustainability.” Policy making requires looking at the externalities, tr ying to identify those who are or are not affected, and finding some way to bring those concerned into the decision-making process. It can be done by a government setting taxes or fees, or directly through consultation and other measures. There may be externalities when resources are exploited, but this does not mean that such resources cannot be used. If the externalities are considered in the decision-making process, a much more informed decision can be made. And that is really the challenge. Economists concerned with sustainable development are trying to help make better decisions that result in a sustainable environment over time, that beneit various affected segments of society, and that recognize that ecosystems are linked. One must look at the whole picture in order not to miss any important parts of the equation. Sou rc e s o f M a rke t Fai l ure The inability to make good decisions using classical economic methods is considered par t of market failure, and often the reasons for this failure arise because we are dealing with public goods and externalities, which means that • they involve non-excludable, nonrival consumption; • they are common proper ty resources; and • they involve externalities. Public goods have these three characteristics that are inconsistent with the assumptions of the classical economic model, which excludes external effects. U n p r i c e d A s s e t s a nd M i s s i ng Mar kets There may be no market for a par ticular good. Some things do not have a price, such as rainbows, and, of course, market clearing can take place only when we have prices on things. Where there is no market for par ticular commodities, they do not show up in the marketplace, they are self-consumed, or they are traded without a direct market. 278
S U S TA I N A B I L I T Y : E X T E R N A L I T I E S , VA L U AT I O N , A N D T I M E E X T E R N A L I T I E S
Sh a d ow P ri c i ng Shadow pricing refers to assigning of prices to nontraded goods, or adjusting the value of traded goods to account for market failures. When people have trouble estimating prices precisely, they look for values associated with the use of the resource. Typically, for nontraded commodities, where questions arise about the applicability of prices, we may have to establish shadow prices for the commodities in question. Cow dung, for instance, is a commodity that in many societies is not traded; but it is a valuable commodity and its shadow price can be computed. How can a shadow price for cow dung be established? For example, it can be used as a fuel. The alternative to using cow dung as a fuel is to buy fuel, such as firewood or kerosene. Or we can use cow dung as a fer tilizer, and now we find an interesting issue. Is the shadow pricing for fer tilizer more valuable than the shadow pricing for fuel? The arguments go up and down on both sides of these questions. These are serious attempts to put values on commodities that are not traded. Actually cow dung is traded in many par ts of the world. The deliver y system for cow dung can involve sticking it on a wall, and when it dries and falls off, sellers put it on top of their heads in big stacks and deliver it to the consumers. How about cow urine? That is a valuable product because cow urine contains many valuable nutrients: nitrogen, phosphorus, and potassium (NPK). If we can figure out what it costs to buy fer tilizer, then we can estimate the shadow price of NPK in urine. This is what shadow pricing is about: it deals with best estimates of impor tant things that are not par t of normally traded goods. If we do only a superficial economic analysis based upon traded commodities, we will ignore valuable resources such as the NPK in urine. To bring such items into the analysis, we have to be able to put prices on them. We have to be able to take them into account to have a complete GDP, since they generate income, and thus some values can be attributed to them. L a c k o f P ro p e r t y R i ght s Lack of proper ty rights presents a classic problem in many areas. If we do not have proper ty rights, then either we use too much of what is freely available, or we may not have access to the resource that may be used up by others before we have an oppor tunity to use it. We see that all over the world with resources like water. Where people do not have a clear title to the resource, they may use as much as they can, par ticularly if they do not have to pay for it. Transaction costs can be high. A classic example concerning use of water relates to monitoring and measuring flows of water for irrigation and rural uses even with clear proper ty rights. There are no low-cost, foolproof meters for such purposes. To measure such goods and ser vices, great amounts of high-quality time and highly motivated government ser vants are required. I rreve rs i bi l i t y There is also the issue of irreversibility. Textbook economic theor y is often based on mythological items such as “widgets.” One widget looks like another widget, and we keep on making widgets forever. We cannot do that with resources, such as land, water, air, climate, and species of plants and animals. We are in an area in which simple economic models will not provide accurate guidance. 279
AN
IN TRO DU C TIO N TO
S U S TA I N A B L E
DEVELO PM EN T
I g n or a n c e a n d Unc e r t a i nt y Ignorance and uncer tainty can lead decision makers to make inappropriate decisions. Indeed, a lot of ignorance stems from uncer tainty, and there is a lot of uncer tainty in dealing with the environment. For example, did anyone really expect Florida to be hit by six hurricanes in 2004 and 2005. They were highly unlikely. Since the nineteenth centur y, there were few hurricane seasons with so many hurricanes coming ashore. Is it going to stay this way? How often are they going to come? The answers to these questions are ver y, ver y uncer tain, but they will make a big difference in planning for the future. S ou rc e s o f G ove rn m e n t ( Po l i c y ) Failure Market distor tions occur when market prices do not reflect the “true” cost of providing something. One cause of market distor tions is government subsidies, and many major governments, including the governments of the US and Europe, provide such subsidies. Market distor tions can also arise from the lack of good governance. A competitive free market usually works well when there is a strong government behind it, and when there is good governance. There must be contracts, contract laws, and enforcement of contracts; and other institutions, such as cour ts, must also be in place. If the government does not provide for these aspects, problems can arise, including market failure, which should be distinguished from a government or policy failure. However, the failure to correct a distor tion in a market is often considered a government or policy failure. Subsidies, nonsustainable resource uses, polluters, inappropriate tax incentives and credits, overregulation, underregulation, and conflicting regulator y regimes; all of these exist in the US and elsewhere and result in government failure. For example, the number of pages in the US Federal Register dealing with water regulation is unknown, but one estimate suggests that there are 55,000 such pages. Those pages deal with federal regulations, not regulations by the states or local governments. This might be overregulation, or underregulation, but it cer tainly gives rise to some conflicting regulator y regimes. The US Federal Endangered Species Act conflicts with much of the other environmentally relevant legislation. For example, some people have recognized water rights, yet some of these water rights are, or appear to be, in conflict with more recent legislation, par ticularly the Endangered Species Act. Ext erna l i t i e s a n d Va l ua t i o n Externalities may be both spatial and temporal. Spatial externalities are obvious: for example, picture smoke from a factor y blowing over a city. Temporal externalities have an impact in the future. Climate change is an example of a temporal externality, as many of the effects will be felt much later. Valuation, both qualitative and quantitative, is another impor tant issue. Consider the decisionmaking issues related to the value and location of goods and ser vices arising from a mangrove forest.
280
S U S TA I N A B I L I T Y : E X T E R N A L I T I E S , VA L U AT I O N , A N D T I M E E X T E R N A L I T I E S
There are marketed and nonmarketed goods, while the location of goods and ser vices may be onsite or off-site (see Figure 10-1). The box in the top left corner indicates that on-site and marketed goods and ser vices usually are included in economic analysis. Such products of a mangrove forest as poles, charcoal, wood chips, mangroves, and crabs are all marketed, and if they are marketed, they have prices. So those are priced commodities. Other goods and ser vices, shown in the upper right box for off-site and marketed goods and ser vices, are priced off-site and may include fish or shellfish that were nur tured in the mangrove forest but caught in adjacent waters. Mangrove forest goods and ser vices on-site but nonmarketed, shown in the lower left box, are seldom included in decision making, but can include such valuable goods and ser vices as medicinal products, domestic fuelwood, food in times of famine, nurser y areas for juvenile fish, feeding grounds for estuarine fish and shrimp, and oppor tunities for viewing and studying wildlife. Off-site and nonmarketed goods and ser vices of a mangrove forest, shown in the lower right corner, include such items as nutrient flows to estuaries and buffering against storm damage, all of which are often ignored. Figure 10-1. How Externalities and Valuation Affect Decision Making (an Example from a Mangrove Forest)
an d S er v ices
Val u at ion of Goods
Location of Goods and Services On-S ite
Off-S ite
M a rke t e d
1 Usually included in an economic analysis (e.g., poles, charcoal, wood chips, mangroves, crabs)
2 May be included (e.g., fish or shellfish caught in adjacent waters)
N o n m a rke t e d
3 Seldom included (e.g., medicinal uses of mangrove, domestic fuelwood, food in times of famine, nursery area for juvenile fish, fishing ground for estuarine fish and shrimp, viewing and studying wildlife)
4 Usually ignored (e.g., nutrient flows to estuaries, buffer to storm damage)
Source. John Dixon (personal communication, November 2002)
All of these economic goods and activities are generated by a mangrove forest and would be lost if the mangrove ceased to exist. The problem is that most analyses focus only on on-site, marketed goods and ser vices, because people are familiar with on-site prices and can estimate what the resulting benefits would be.
281
AN
IN TRO DU C TIO N TO
A P P RO A C H E S
TO
S U S TA I N A B L E
DEVELO PM EN T
VA L U A T I O N
How do we place economic values on goods or services that often do not pass through markets? There is a rich menu of approaches that can be used to place monetar y, economic values on different par ts of the environment that are being used for economic purposes. These approaches include changes in production, hedonic approaches, survey techniques, and surrogate markets (Figure 10-2). Figure 10-2. Approaches to Valuation
Changes in production • Crops, fisheries, water • Health • Opportunity cost
Survey Techniques • Contingent valuation market
Hedonic Approaches • Property value • Land values • Wage differential
Surrogate Markets • Travel cost
Source: John Dixon (personal communication, November 2002)
Ch a n ge s i n P ro d u c t i o n With tangible products like crops, fisheries, and water, it is fairly easy to determine values. When we have a real product, we often have a market price, and therefore it is fairly easy to measure the impact of increasing or decreasing production. But, as we just saw in the case of a mangrove forest, if fish caught off-site were not recognized as being dependent on the mangrove, that value could be overlooked by the landowner of the mangrove forest. The landowner might ignore it in making a decision as to the value of the mangrove. Thus in this case, a simple change in production approach could not be used. H ed o n i c A p p ro a c h e s What other approaches to valuation may be used in places where we do not have prices? Hedonic approaches, from the Greek hedone, meaning “pleasure,” deal with those environmental attributes that give pleasure, such as scenic surroundings, an office with a view, and so on. We can often measure the benefits received from unpriced environmental attributes through what people are willing to pay for them. Recall the example of the house on the beach versus the same house inland. Housing prices, especially different prices between comparable dwellings in different locations with different environmental attributes provide an example of hedonic pricing. 282
S U S TA I N A B I L I T Y : E X T E R N A L I T I E S , VA L U AT I O N , A N D T I M E E X T E R N A L I T I E S
Proper ty values and land values can provide impor tant information on how people value different attributes of the environment, and we can use that information to estimate monetar y values. We can value nonmarketable attributes, such as an ocean view, by seeing how much an individual is willing to pay for the beach house or how a community sets its real estate taxes for ocean front versus inland proper ties. Wage differentials can also be explained by a hedonic approach: sometimes people are willing to work for less money if the job is more attractive or is in a more attractive environment. A comparison of wages for traffic policemen who work outdoors with policemen who work in tunnels where there is a lot of air pollution might give some sense of wage differential for an environmentally unfriendly occupation. People with identical qualifications and jobs will be paid less in Hawaii than in any less attractive location, because they want to be in Hawaii for other, nonwork-related reasons. For example, many places in Alaska must pay premium wages to attract workers, because many people tend to go there solely for monetar y reasons. Su r vey Te c hni que s , In c l udi ng the Contingent Valuation M ethod Sur vey techniques or contingent valuation methods rely on asking people literally how much they are willing to pay for a cleaner environment or some attribute of the environment. These techniques also focus on how much people are willing to accept in compensation for decreasing environmental quality. Going back to our earlier example, when the car driver told the passenger he could smoke but it would cost him $1, the driver was setting a price for his willingness to accept any risk to his health. The smoker, on the other hand, had yet to make a choice whether he should pay the driver compensation or refrain from smoking. Admittedly, while the sampling is small—the driver and the smoker—the example is basically a sur vey. Sur veys can be ver y impor tant and are commonly used when markets do not exist or when we cannot look at proper ty values or other indices. Ideally a fairly large sample would be required to provide a reliable result. One, however, has to be war y when relying on a sur vey. We are gathering information, but we have to be careful in determining what the answers mean. There are many examples of sur veys that are meaningless because the questions were drawn up incompetently or the answers were misinterpreted. Sample size is one of the ways of improving reliability, as is improving the randomness of the sample. Su rroga t e M a rke t s The last set of techniques is called surrogate markets. Here again, the basic idea behind the surrogate market is that environmental economists are interested in determining a value of some nonmarketable attribute of the environment. It might be a recreational destination, a national park, or a cultural monument. We want to observe how people value it. The problem is that often the entrance fee is zero or small. Economists approach this problem by looking at tangential aspects such as the time and money people spend in traveling to a site. We can actually use that information—when a lot of 283
AN
IN TRO DU C TIO N TO
S U S TA I N A B L E
DEVELO PM EN T
people come from different distances to visit a place—to create a demand cur ve. The data are the cost and time of travel and a series of steps are required to estimate demand. The basic underlying idea is that those visitors who live near a site have a lot of consumer surplus, while the most distant visitor has basically no consumer surplus. We can use this information to get estimates of the value added per visitor per day for different types of recreational destinations. All of these techniques are being used to place monetar y values on things that are not easily bought or sold. Sometimes by using a hedonic approach we can determine a price, although not for the commodity of interest per se but for something else that is embodied in the commodity. That is to suggest that, through a hedonic approach, we can establish the value of a home with a view of the ocean, but not necessarily the cost of building and maintaining such a home. Tot a l E c o no m i c Va l u e A final concept, which puts all of these approaches in context, is total economic value (see Figure10-3). The basic idea is to combine use values and non-use values. People are generally confused at this point and ask, what exactly are non-use values? Before answering that question let us consider an easier concept—use values. Use values are concrete, such as the value we get from the production of goods; establishing fisheries, forests, and water resources; building dams; and so on. Use values can be broken down into two separate categories, which we call direct and indirect use. Figure 10-3. The Concept of Total Economic Value
Total Economic Value Use values Direct use values Indirect use of values (structural values) (functional values) Usually measures output
Non-use values Option values
Bequest values
Existence values
Usually measures benefits/services
Source: John Dixon (personal communication, November 2002)
Direc t a n d In d i re c t Us e Val ue s A direct use value occurs when we directly use something or consume something so that we must produce more of it, such as fish. There can also be nonconsumptive direct use, as when we go SCUBA diving in the same marine area that produces the fish. The diver is using the same resource but not consuming it. It is obvious that nonconsumptive use is usually more sustainable. A hundred years ago, the East African game parks were hunting grounds. With no regulation, the animals were hunted almost into extinction. Today visitors to these parks come with cameras instead of guns. Discounting poaching, the animal population is recovering. Hunting turned out to be nonsustainable. 284
S U S TA I N A B I L I T Y : E X T E R N A L I T I E S , VA L U AT I O N , A N D T I M E E X T E R N A L I T I E S
However, some restrictions on hunting, when appropriately enforced, can result in a sustainable result. For example, it is still possible to hunt animals in cer tain countries, but one must pay a large fee (about $10,000 to take down a wildebeest), and the hunting is strictly controlled. This is a way to manage game and at the same time extract some economic rent. Over time, we sometimes see big shifts from consumptive to nonconsumptive uses of the same resource and then back again to a sustainable equilibrium. Indirect use values are usually measures of benefits or ser vices—ecosystem ser vices, water purification in wetlands, and greenbelts around cities that help reduce pollution in the air and water. There are a lot of ecosystem ser vices that we benefit from directly or indirectly whether we consume them or not, but they are a little harder to measure. For instance, if we take water out of the river for irrigation or for drinking, that would be for a direct use of the water. Indirect use would involve, for instance, use of water for aesthetic values associated with looking at the water. Water for fisheries, water used by wildlife, and water for the ecosystem may involve both direct and indirect use values. We can estimate values and prices for such uses. The indirect use values, which are often ignored, are often ver y impor tant. Studies conducted on the use of water in the Charles River in the mid-1970s focused on the value of rental proper ties on the river, both facing the river and facing away from the river. These proper ties consisted of identical-sized apar tments with identical amenities; the only difference was that some people had a view of the Charles River and some people had a view of the Back Bay. The proper ties with a view of the river commanded several hundred dollars more in the monthly rental. This extra rental is an amenity value, which arises primarily from viewing, not consuming, the water in the Charles River. This is an example of the Hedonic valuation method. The irony is that the Charles River was at that time actually in terrible shape, and could not be used in the sense of a direct use. Today wind surfers and sailors enjoy contact uses of the river, which are direct uses; others enjoy walking along the banks of the river, which is a use of the river without actually consuming it, for which people are willing to pay. In the good old days, when the Charles was pretty smelly, par ticularly during the summer, Har vard University bought millions of gallons of water from the Metropolitan water authority to augment the river flow and thus reduce the smell during commencement week ceremonies. That is an example of an indirect use value based on what the river looks like and smells like, and this indirect use value was cer tainly wor th a lot of money. It is thus possible to monetize non-use values with actual dollar figures, or to think of good proxy values for them. O pt i o n Va l ue s Another use value is what is called an “option value” or an “option demand.” It is an economic or environmental value that is deferred. It is a value where people might say of a recreational area: “I may not want to go there now, but I am willing to pay something to maintain that resource in case I decide to go later.” Or it could be that society as a whole may decide that it wants to maintain resources so that future generations can use them. Many NGOs around the world are 285
AN
IN TRO DU C TIO N TO
S U S TA I N A B L E
DEVELO PM EN T
ver y effective in raising money from people who are willing to pay something to maintain a habitat or to protect endangered species for future use or enjoyment. Thus we can measure option and existence values by looking at donations. For example, perhaps we do not want any more dams on the Colorado River. We may not be keen about going down the Colorado River on a raft, because we could fall overboard and be injured, but on the other hand we would like to keep open the option to go there and experience the wild river. How do we express value for that? Perhaps by sending a donation to an NGO tr ying to preser ve the Colorado River. We may want this option for ourselves or for our grandchildren. In Mar yland one can pay an extra $20 to buy a “Protect Chesapeake Bay” license plate for a car. The money goes to a special fund to protect the bay. People who buy the plate may never go to the bay area, but they value it enough to pay for its protection and for ensuring that it will still be there in case they do go. They may also want to protect this environment for future generations. Non -u s e Va l u e s Non-use values consist of existence values and bequest values. Option values, which appear under “use values,” have a different time horizon than non-use values. It is impor tant to distinguish between option values and non-use values. Bequest values, which appear under “non-use” values, are technically the same as option values except that bequest values have a longer time frame. Both are usually estimated using the contingent valuation method. 1. Bequest values A direct equivalent of an option value is a bequest value—something held for the next generation. For example, even though we may not plan to go to a par ticular wildlife park, we may want our children to have the option to do so. We are willing to pay something to ensure that option, and such payments for the continuing maintenance of a par ticular wildlife park constitute the bequest value of the resource. It is amazing the amount of money that is generated worldwide from people who contribute to various NGOs such as Greenpeace, Conser vation International, and the WWF precisely for these types of benefits. For instance, Basso (2005, p. 7) repor ts that in 2003 the annual revenue at the top 30 US environmental organizations exceeded $2.1 billion. While bequest values may appear a bit murky, we can quantify them, and the numbers tend to be quite large, because a large number of people are involved. 2. Existence values Existence values, which fall under non-use values, are pure beneit—knowing that something exists for the very value of its existence, like whales or mountains. It is the least tangible of these types of values. When we move from direct use to indirect use to option to bequest to existence, and actually try to estimate value, the evaluation techniques become less and less tangible. When evaluating use values we can look at things such as prices and quantities. We can even do this for some indirect use values. However, when we try to measure existence values we always end up relying on survey-based 286
S U S TA I N A B I L I T Y : E X T E R N A L I T I E S , VA L U AT I O N , A N D T I M E E X T E R N A L I T I E S
approaches and contingent evaluations (the latter phrase relates to whether something, such as a forest, will indeed exist when the time of the proposed use, such as a camping trip, occurs). Non -u s e Va l u e s : T he G l o b a l War ming E xample Let us try to evaluate something that is of concern to ever yone: global warming. Global warming would probably fall under non-use values, sub-indexed as an existence or bequest value. While the present generation is presumably safe, we worry about what kind of world we will leave for our children. There are things that can be done now, but when we deal with a global phenomenon, it becomes much more difficult. We have externalities dealing not just with space and time but also with cultures and political jurisdictions. Global warming, if it does occur at a significant level as predicted by many scientists, is something that is very likely a long way off in the future. How do we measure the value of protecting against something that might occur in the distant future like global warming or a possible collision of the ear th with a big meteor? People generally do not value the future nearly as much as they do the present, and so the challenge is to convince society that the future is something to be concerned about and to not discount too much the likelihood of its occurrence. In sum, there are different evaluation approaches that can be used for each type of effect. As in many other things in economic analysis, it depends on the data we have, the time available to do the analysis, and the resources to do a study.
ECONOMIC ASSESSMENT
OF
S U S T A I N A BL E P RO J E C T S
The meaning of sustainable is not clear in the context of public and private investment appraisal. Sustainability implies taking into account the factors affecting an investment not well reflected in market prices and financial profits. This has been attempted since the late 1950s by benefit-cost analysis (BCA), which adds social evaluation to financial appraisal. Private investors are concerned mainly with profit and financial return based on prices of inputs and outputs associated with a project. BCA attempts to base an assessment on social prices, which are estimates of prices that would obtain in a truly free market with no distor tion by government or other institutions. The purpose is to calculate the benefit of a project to the nation state as a whole. It could be applied equally to public and private investment. In practice it is costly, requires highly skilled practitioners, and is ultimately arbitrar y with regard to the estimation of social prices. It has not been used widely except by the World Bank and the regional development banks. For example, these banks would price unskilled labor at zero, because it comes from the ranks of the unemployed, or perhaps from the farm sector, where the only cost is the extra food that laborers consume while working. In recent years there has been more emphasis on financial internal rate of return (FIRR), which uses market prices and values, rather than economic internal rate of return (EIRR) based upon shadow prices. Social considerations are given effect by subprojects to cater to the welfare of those directly affected by a project, perhaps those displaced by a dam. This gives rise to a paradox. Sustainability 287
AN
IN TRO DU C TIO N TO
S U S TA I N A B L E
DEVELO PM EN T
is directed at the actions intended to improve or preser ve the environment as a whole. It does not mean ever y project must sur vive forever. A mine is a good example, whereas a renewable resource like a fisher y or a forest would be conser ved. Sustainability is given effect at the project level by emphasis on economics, environment, and equity—the three Es or triple bottom line. Methods used to assess the sustainability of a project are different in the public and private sectors, but first we will discuss the common aspects of the methodology, of which accounting for time is of paramount concern. H ow t o D i s c o u n t t h e F u t ure The discount rate is used to compare money available at different points in time. Consider a preference for $100 today compared with $100 after one year. Ever yone has a personal discount rate, albeit subliminal. Most would prefer $100 today; invested at low risk, it might earn 4% per year. Correcting for inflation at 2%, it will still be wor th 4% minus 2%, or 2% per year. There is also a time preference for money that varies with ever y individual. Consider how much you would want in a year to be equal to $100 today. Frequently students will say this is $130, meaning their personal simple discount rate is 30%! Private investors and companies also have discount rates that they apply to all projects. There is some debate on this, because the rate should reflect the cost to the company of borrowing money—the so-called risk-free rate—plus an allowance for risk, which may be different for each investment. If the cost of borrowing capital were 4% and the risk assessed were at 5%, the company discount rate would be 9%. This is known as the [r+ r`] expression. If the corporate tax rate were 50%, then the rate becomes 2[r+ r`] or 18%. No investment that yields less than 18% would be acceptable. In practice, rates of borrowing differ between companies and states, as does intuitive assessment of risk, so thresholds of expected discount differ widely. Companies frequently operate on a 10% to 15% FIRR. Development banks usually specify 10% as an acceptable EIRR. Private companies and public sector enterprises will calculate cash flow—annual income and expenses— for each project. That discount rate, that makes an annual income stream equal to an annual stream of expenses is a measure of return or profit. Alternatively, that discount rate that makes the stream of net income—or net present value—equal to zero is called the internal rate of return (IRR). This approach is known as discounted cash flow. If income flow is measured in market prices, it is known as a financial assessment. If social prices are used, the approach is known as social benefit-cost analysis. So the discount rate is used to compare projects with different annual (or even monthly) cash profiles over 10 or 20 years. Note that using a 15% discount rate means the present value of income in years beyond 10 becomes essentially zero. Before the discounted cash flow was used and even now, companies will sometimes want their money back in three years, say for investments abroad, implying a much higher discount rate. Ma r ke t R a t e s o f D i s c o u n t If one has a mor tgage at 4.8% for 30 years on a house, we can calculate to the nearest penny what will be the interest paid each year or each month. There is no ambiguity in that. However, 288
S U S TA I N A B I L I T Y : E X T E R N A L I T I E S , VA L U AT I O N , A N D T I M E E X T E R N A L I T I E S
we do not typically make public investment decisions using the private market rate of discount. If one were in a decision-making role in government, and dealing with investments in environmental facilities or investments that will influence what happens in the future, then one would use the social rate of discount. What is the social rate of discount, and what actual rate should it be? Soc i a l R a t e s o f D i s c o u n t The social rate deals with how we as a society view the future. Political considerations are very impor tant in setting the social rate of discount. In the US the social rate of discount is set ever y year by the US Congress, so it tells agencies, for instance the Corps of Engineers, what rate to use to discount future benefits and the future costs associated with federal water projects. It is not an interest rate that the market generates, but what the social and political system agrees on. Historically in the US, it was 3.5% or 4% for a long period of time, and now is it is quite low (3% on June 14, 2005). It has varied between 7.5% and 2.5% over the past 200 years. It is par t of our view of how we ought to treat the future in a public sense. If we use a high discount rate, the present value of future costs or benefits after 10 or 15 years is very insignificant. Of course many people ask, what has the future ever done for us? And that is actually a good question, because if we look at the history of the industrialized countries, ever y succeeding generation seems to be better off than the previous one. And so we can ask, why are we saving money, why are we worrying about the social future of these people? They are going to be vastly wealthier than we are. We should consume now. Hence, it is very hard to figure out what the right number for the social rate of discount should be. But cer tainly it ought to be the same across the governmental investment sectors. In developing countries both private and social discount rates are influenced by the availability of capital. There are different niches, and different people can borrow at these different rates. Clearly, if the capital market has a very high discount rate, then this information should be used by the politicians who establish social rates of discount as an indication that maybe they should go slowly on raising social rates of discount on future investments. International agencies like the World Bank and ADB pick a proxy for the social rate of discount. Years ago, it used to be about 10%. Currently it is about 7%. And when they do a project evaluation, they accept the project as a good one or a bad one depending upon the discount rate that they use. The World Bank’s historical yield on its bonds was in the region of 6%, and they lent out money at 7% for infrastructure and social programs. Nowadays, because of the concern about the environment and due to the power of international NGOs, it is very hard to actually build environmentally intrusive projects such as dams with multilateral or bilateral official funding. The international private banks, however, are happy to lend money for dams at private rates of interest. So we find some developing countries borrowing money at higher rates from sources that let them cut corners environmentally. The Three Gorges Dam in the PRC, which is the biggest dam in the world, was built entirely with the countr y’s own resources and with some loans from private banks. P u re T i me P re fe re n c e Another aspect of discounting is pure time preference. This confuses the concept of the social rate of discount. People and institutions have a preference for consumption in the present: we do 289
AN
IN TRO DU C TIO N TO
S U S TA I N A B L E
DEVELO PM EN T
not know what it is, maybe 2%, maybe 3%. Pure time preference can be added to the inflation rate to arrive at an estimate of the appropriate social rate of discount. P robl e m s w i t h D i s c o u n t i ng With large-consequence events that may happen a long time in the future like global warming, which may cause serious damage in 100 years, when applying any of the discounting rates, even a social rate of discount as low as 2% to 3%, future damages are miniscule in present value terms. The actual bad consequences are so small when discounted back to the present that it is hard to justify spending hundreds of billions of dollars in the near term. Some suggestions involve spending major amounts in the next few years on switching from fossil fuels and sequestering CO 2. There are many options, but they are all expensive, and because we rely on discounting that emphasizes relatively shor t-term effects, we have difficulty in dealing with intergenerational problems.
CATEGORIES
OF
COSTS
To carr y out discounting, we must be able to specify the benefits and costs in monetar y terms. As in all human endeavors, costs are much easier to assess than benefits. So much of the literature on discounting focuses upon things like capital costs, operation and maintenance costs, variable costs and fixed costs, and salvage value. Cap ita l C o s t s The capital cost is easily understandable. For example, when buying a house in Cambridge for X-million dollars, one could put the X-million dollars into the seller’s bank account. More typically one would arrange for a loan from the Cambridge Trust Bank, and take that X-million dollars from their depositors and give it to the seller. That is a capital transfer, and it tends to happen in big lumpy payments. Many of the investment costs are not paid all on the first day. We spread them out. Little investments (like buying a house) are still lumpy, but they are not exactly like $20 billion for the Three Gorges Dam. There are some subtleties involved in the capital markets, too. But cer tainly, the capital costs that we are dealing with in investment projects for development in any countr y in the world are unique, because typically the front-end cost is large. Va r iabl e a nd F i xe d C o s t s Once the project is up and running, operation and maintenance costs accrue, which are usually relatively small in comparison with the capital costs. They are maybe 2% or 3% of the capital costs, or maybe even less. For example, for a coal-fired power plant, which produces only one thir teenth the energy output (kwh) of the Three Gorges Dam in the PRC, there are large variable costs, and also large fixed costs such as operation costs, including buying, shipping, and storing coal in addition to the fixed costs of labor and management.
290
S U S TA I N A B I L I T Y : E X T E R N A L I T I E S , VA L U AT I O N , A N D T I M E E X T E R N A L I T I E S
Sa l v age Va l u e Salvage value raises interesting issues, because in public investment analysis, salvage value is ver y rarely used. For example, what is the salvage value of the Aswan High Dam? That is hard to figure out, because if it fell apar t, or if it became filled with silt, or if it were no longer needed by the Egyptian government, we cannot send a trailer truck and take it away. It is hard to imagine what the salvage value is. Think about a nuclear power plant. Nuclear power plants are examples of projects that, when they have finished their useful life, have large dismantling and storage costs to be met. So the salvage value is negative even though there is a big secondary market for the turbines, generating sets, and similar items. People buy and sell them and take them away after they have been used.
ECONOMIC LIFE
OF A
P RO J E C T
When discussing sustainability it is impor tant to ask: How long should we expect things to last? How do we deine the life of the project? Here is a hint: some dams in Spain and in Nor th Africa built by the Romans are still in use. That is a long time—2,000 years. There are also irrigation projects in the PRC that have run continuously for 2,000 years. There is a physical life, clearly; physical life is how long the thing lasts. But there is an economic life, which says, at some point, the operation and maintenance costs may over take the value the project is supposed to provide. This works ver y nicely when a discount rate is used, because if we are using a discount rate of about 8% to 10%, future benefits that occur after 20 or 40 years contribute little in present value terms. Thus, it does not matter about the end of the project, because by the time we have discounted it to the present, all the benefits and all the costs in the future have disappeared; they are not affecting our decision right now. So in a sense, it is a moot point. In most public works projects, people have not bothered about salvage value. The discount rate will take care of it. There is an interesting question as to the sustainable life of equipment that arises when considering the shoals off the Massachusetts coast, where wind generators are proposed; if we make the investment now, would it preclude other investments in the future for more efficient machines? That is not so hard to address, because the assumption would be that the proposers of these windmills have taken into account their economic life. Windmills are things that do have a salvage value. Wind generators also have operation and maintenance costs, which increase over time. So as they age, the cost of maintaining them goes up, and at some point even if the windmills are still working, the economic life is reached, because the expected benefits less the costs will become negative. How and what do we know about the costs of sustainable investments? The Engineering News Record Cost Index is a construction cost index, star ted in 1908, which has been normalized to 100 in 1913. It is based upon a basket of goods including 200 hours of common labor, plus 25 hundred-weight of standard structural steel shapes at the mill price, plus 1.128 tons of Portland cement, plus 1,088 board feet of two-by-four lumber. In 1913, it was 100 and it was at 6,581 by 2003, a 65-fold increase!
291
AN
IN TRO DU C TIO N TO
S U S TA I N A B L E
DEVELO PM EN T
The Engineering News Record Cost Index is published quar terly, but it is not the only price index. The EPA has its own price index; there is a Depar tment of Commerce consumer price index (CPI), plus many other price indices. It is impor tant to figure out what they are based upon to be able to go back and for th between the present level and historical times. For instance in 1967, the CPI was 33.4 (based upon a 1982-84 average of 100). Now it is more than 190. Salaries in major educational institutions in Cambridge, Massachusetts, have gone up at least 6.5 times over the same time period. But these are not really wage increases; rather they have been just keeping up with the CPI. However, the price of a house in Cambridge has increased considerably, by more than 15 times in that time period, or more than twice the CPI. Whatever happened to the 10-cent cigar? We can look it up in these types of indices and find that 10-cent cigars are actually just about the right price now. Gasoline, however, still costs less than it did in 1973, when it was considered to be outrageously expensive. So a gallon of gasoline now priced at about $3 a gallon is still less than it was in deflated dollars in the early 1970s when deflated using the CPI.
ECONOMIC ASSESSMENT
SUSTAINABLE PLANS
OF
AND
P RO J E C T S
In an excellent review ar ticle, McFarquhar (2001) shows graphically (Table 10-1) the relationships among the various economic accounting methods and their implications for economic sustainability. Table 10-1.Relationships Among Net Present Value, Benefit-Cost Ratio, and Economic Internal Rate of Return NPV
BCR
If > 0 then
>1
and
> r [cost of capital]
If < 0 then
European Union > Cars and Light Trucks. Available at: http://www.dieselnet. com/ standards/eu/ld.php Environmental Data Science and Systems, Oak Ridge National Laborator y. Available at: http://www. esd.ornl. gov/research/environ_data_systems/index.shtml Fajnzylber, Pablo, Daniel Lederman, and Norman Loayza (1998). Determinants of Crime Rates in Latin America and the World: An Empirical Assessment. The World Bank. Available at: http:// povlibrar y.worldbank.org/ librar y/view/12879 FAO (1997). “FAOSTAT Statistical Database.” Available at: http://faostat.fao.org/ FAO (2004). “Food Outlook No. 2.” Available at: http://www.fao.org/docrep/006/j2518e/j2518e00.htm Farm Subsidy Database, Environmental Working Group. Available at: http://www.ewg.org/farm/ Genuine Progess Indicator. Sustainability Indicators Program, Redefining Progress. Available at: http://www. redefiningprogress.org/projects/gpi/ Global Environment Facility. Available at: http://www.gefweb.org Holdren, John (2006). Syllabus for ENR-100 course on “Environmental and Resource Science for Policy.” Available at: http://ksgnotes1.har vard.edu/degreeprog/Syllabus.nsf/0/ 4D84012EB9D6C75E8525721E005 6716C/$FILE/enr100_syllabus_2006_9-12-06v3.pdf Human Development Report 1990, UNDP. “Concept and Measurement of Human Development.” Available at http://hdr.undp.org/repor ts/global/1990/en/ Human Development Report 1992, UNDP. ”Global Dimensions of Human Development.” Available at: http:// hdr.undp.org/repor ts/global/1992/en/ Human Development Report 1999, UNDP. “Globalization with a Human Face.” Available at: http:// hdr.undp. org/repor ts/global/1999/en/ Human Development Report 2005, UNDP. “Economic Performance.” Available at: http://hdr.undp. org/ statistics/data/indic/indic_137_1_1.html Human Development Report 2006, UNDP. “Human Development Index.” Available at: http://hdr. undp.org/ hdr2006/statistics/indicators/1.html IGACtivities Newsletter, Issue No. 20, March 2000. Available at: http://www.igac.noaa.gov/newsletter/ igac20/ Mar_2000_IGAC_20.pdf IISDnet (1995). “Sustainable Development Indicators … Selected Sources.” Marlene Roy, International Institute of Sustainable Development. Available at: http://www.iisd.org/ic/info/ss9504. htm 403
International Finance Corporation, World Bank Group. Available at: http://www.ifc.org McFarquhar, Alister. “Environment Valuation, Project Appraisal and Political Consensus in the Third World.” Planning & Markets. Available at: http://www-pam.usc.edu/volume4/v4i1a3s1.html Merrill Lynch and Capgemini (2007). World Wealth Report 2007. 11th Annual World Wealth Repor t for 2006. Available at: http://www.ml.com/index.asp?id=7695_7696_8149_74412_ 79272_79918 Miller, George A. (1956) “The Magical Number Seven, Plus or Minus Two: Some Limits on Our Capacity for Processing Information.” Psychological Review, 63(2). Available at: http://www .musanim.com/miller1956/ “The Most Deadly 100 Natural Disasters of the 20th Centur y.” Available at: http://www.disastercenter. com/ disaster/TOP100K.html Murcott, Susan (1997). “Sustainable Development: A Meta-Review of Definitions, Principles, Criteria Indicators, Conceptual Frameworks and Information Systems.” AAAS Annual Conference, IIASA Symposium on Sustainability Indicators, Seattle, WA, Feb 13–18, 1997. Available at: http://www.aocweb. org/em/Por tals/2/MIT%20Definitions.pdf Murray, Christopher J. L. and Alan D. Lopez, eds. (1996). The Global Burden of Disease: A Comprehensive Assessment of Mortality and Disability from Diseases, Injuries, and Risk Factors in 1990 and Projected to 2020. Cambridge, MA: Har vard University Press. Published on behalf of the World Health Organization and the World Bank. Executive summar y in seven sections available at: http://www.hsph.har vard.edu/ organizations/bdu/GBDseries.html Negative Population Growth (2004). “Total Midyear World Population 1950–2050.” Available at: http:// www.npg.org/facts/world_pop_year.htm Ocean Technical Ser vices, Inc. Available at: http://www.oceantech.com/ Salim, Emil (1994). “The Challenge of Sustainable Consumption as seen from the South.” Sym pos ium on Sustainable Consumption, Oslo, Norway, 19–20 Januar y 1994. Excerpt available at: http:// www.iisd.org/ susprod/principles.htm Shah, Anup (2006). “Causes of Pover ty: Pover ty Facts and Stats.” Available at: http://www. globalissues.org/ Traderelated/Facts.asp Strong, Maurice (1992). “Required Global Changes: Close Linkages Between Environment and Develop ment.” In Change: Threat or Opportunity. Uner Kirdar, ed. New York: United Nations. Excerpt available at: http://www.aocweb.org/em/Por tals/2/MIT%20Definitions.pdf Sustainable Development Indicators. Available at: http://www.iisd.org/ic/info/ss9504.htm Turn the Tide, New American Dream. Available at: http://www.newdream.org/cnad/user/turn_the_ tide.php United Nations (2005). The Millennium Development Goals Report 2005. Available at: http://www. un.org/docs/ summit2005/MDGBook.pdf UN Char ter. Available at: http://www.un.org/aboutun/char ter/index.html UN Millennium Development Goals. Available at: http://www.un.org/millenniumgoals/ UN Organizational Char t. Available at: http://www.un.org/aboutun/char t.html
404
UN Population Division (2005). “World Population Prospects: The 2004 Revision.” Available at: http://www. un.org/esa/population/publications/WPP2004/wpp2004.htm US Depar tment of Commerce, Bureau of Economic Analysis (2005). Available at: http://www.bea. gov Water For All: The Water Policy of ADB. Manila: Asian Development Bank, 2001. Available at: http:// adb.org/ Documents/Policies/Water/default.asp?p=wtrrefs World Bank (2001). “Voices of the Poor.” Available at: http://go.worldbank.org/H1N8746X10 World Bank (2004). Beyond Economic Growth: An Introduction to Sustainable Develop ment (2nd ed.). Soubbotina, Tatyana P., World Bank. Available at: http://www.worldbank.org/depweb/english/ beyond/beyondco/ beg_all.pdf World Bank (2007). “World Development Indicators 2007.” Available at: http://go.worldbank.org/ 3JU2HA 60D0 World Bank Group’s Energy Program (2002). “Pover ty Reduction, Sustainability and Selectivity.” Available at: http://siteresources.worldbank.org/INTENERGY/Publications/20269216/ energybrochure.pdf World Conference on Human Rights (June 1993). “Vienna Declaration and Programme of Ac tion.” Avail able at: http://www.unhchr.ch/huridocda/huridoca.nsf/(Symbol)/A.CONF.157.23.En?Open Document World Resources Institute (1998). “Population Growth: Stabilization.” Available at: http://pubs.wri. org/pubs_ content_text.cfm?ContentID=2069 Zubair, Lareef (2005). “Scientific Background on the Indian Ocean Ear thquake and Tsunami.” Available at: http://iri.columbia.edu/~lareef/tsunami/
405
INDEX Abeygunawardena, Piya, 13, 393 Access to Justice Program (AJP), 192, 397 Adams, William M., 210, 390 ADB. See Asian Development Bank adjustment loans, 314–5 adult illiteracy rate, 320 aesthetic pollution, 112 African Convention (Algiers, 1968), 210 African Development Bank, 21, 171, 314 Agenda 21, 159, 184, 188, 190, 192–4, 198–9, 238, 243, 347, 354, 364–5, 390 agricultural economics, 260 agricultural revolution, 72, 74, 76 air pollution, 24, 56–7, 87, 112, 117 –8, 123, 126, 132, 134, 148, 153, 165, 170, 176, 206, 283, 320, 329; cost of, 304–5 air pollution standard index (PSI), 117–8 air quality index, 119–20 A Legal Arsenal for the Philippine Environment, 205, 397 allowable decibel count, 149 Altomare, M., 71, 397 ambient concentrations, 96, 109–10, 115 Aristotle, 10, 245, 361 arithmetic mean, 133–4 Army Corps of Engineers, 141, 144 Ar ticle 38(1) of SICJ, 186, 189, 196 ASEAN Agreement (Kuala Lumpur, 1985), 211, 390 Asian Development Bank (ADB), 16, 21, 24–5, 51, 56–9, 61–2, 69, 77, 123–5, 140, 146–7, 150–4, 162, 164–6, 171, 190–2, 206–7, 221–2, 225–6, 228–30, 233–5, 237, 240, 244, 246, 249–50, 289, 314, 358, 391, 393–400, 402; energy policy of, 166; pover ty repor t by, 221–8, 398; tutorial on EIA of, 140, 150–3 Asian Institute of Technology, 62 Atkinson, Giles D., 27, 398 automobile industr y, 96 –7 Barbier, Edward, 44, 390, 398, 402 BCA. See benefit-cost analysis Beckerman, Wilfred, 21, 382, 386, 390 Behring Sea fur seals fisheries case, 211, 390 benefit-cost analysis (BCA), 16, 287–8, 297–8 bequest value, 284, 286–7 Bi, Jun, 399 bilateral treaties, 201 biochemical oxygen demand (BOD), 16, 33 Black’s Law Dictionar y, 186, 189, 210, 390 BMI. See body/mass index BOD. See biochemical oxygen demand body/mass index (BMI), 16, 69 Bornstein, David, 362–3
Boserup, Ester, 20, 386, 390 box models, 148 box-and-whisker plots, 136–7 Boyd, John A., 9–10, 12–3, 15, 392 British Year Book of International Law, 399 Brown, Casey, 13 brown indicators, 109–10 Brown, Lester, 20, 55, 68, 91, 390 Brownlie, Ian, 187 Brundtland Commission, 22, 42, 45, 140, 158, 211, 346–7, 397 Brundtland Commision Repor t, 22, 45, 158–9, 162, 191, 194, 211, 346–8, 397 Brundtland, Gro Harlem, 7, 22, 158 Br yant, Dirk, 100, 390 Bush, George W., 94 Business Council for Sustainable Develop ment, 358–60, 393, 400 Canadian indices, 119 Canter, Larr y W., 145, 147–8, 391 capacity building, 161, 165, 197, 199, 205–7, 215, 231, 243, 245, 346, 354, 391, 396, 398 capital accumulation, 261 capital creation, 261 capital, labor and land, 261–2 carbon dioxide emissions, 93–6, 165, 296, 339 carbon trade, 339, 341 carr ying capacity, 23–4, 32 Carson, Rachel, 212, 391 Car tagena Protocol, 204, 208–9 case studies, 67, 71, 73, 79–81 categorical exclusions, 144 categor y A, B, and C projects, 147, 171 Cavanagh, J. and S. Anderson, http://www.ips-dc.org/ global_econ /billionaires.htm, 48, 402 CDM. See clean development mechanism CEQ. See Council on Environmental Quality cer tificate of compliance, 152–3 CFC. See chlorofluorocarbon Char ter of Economic Rights and Duties of States, 184, 190, 391, 394 chemical production, 55–6 chlorofluorocarbon (CFC), 16, 98, 100, 304 civil society, 59, 78–9, 140, 161, 182, 192, 196–8, 221, 229–30, 239, 257, 328, 368, 381, 383 Clean Air Act, 118, 212, 391 clean development mechanism (CDM), 339–40 Clean Water Act, 143 climate change, 21, 50–1, 63–4, 98–9, 112–5, 190, 201–5, 215, 280, 293–4, 304, 329–32, 340, 349, 351, 356, 367, 382, 387–8 clinical economics. See Sachs, Jeffrey 407
Club of Rome, 20, 373, 386, 396 Coase, Ronald, 23–5, 277, 298, 391, 399 Coasian solution, 277–8 Cobb, Charles W., 31, 373, 391 Cobb, Clifford, 302–3, 391 Cobb-Douglas production function, 31, 391 Cobb, John B., Jr., 392 coefficient of variation, 137 Commission on Environmental Law of IUCN, 207, 210, 212 Commission on Sustainable Development, 192–3, 348–9 Community Development Carbon Fund, 334, 341 comprehensive indices of environmental quality, of Inhaber, 120–1; of Rogers et al., 123–32 Conference of the International Law Asso ciation (New Delhi, 2002), 196, 215 consensus building, 219, 230–4; handbook, 232, 400 consumer price index (CPI), 16, 292, 301 consumer surplus, 270, 272, 284 consumption patterns, 48, 65–71, 94, 342, 354, 379 consumption, per capita, 32, 67–9, 374 contingent valuation method, 283 Convention on Biological Diversity, 190, 204, 209–10, 391 Convention on Migrator y Species (Bonn, 1979), 204, 208, 210, 391 Convention on Trade in Endangered Species (Washington, DC, 1973), 208, 210, 212 cooking stove improvement project in the PRC, 80 COR. See cost of remediation cornucopians, 20–1, 24, 32, 383 cost of remediation (COR), 16, 103, 116–7, 123–6, 130, 132 Costanza, Rober t, 101–2, 306, 312, 392, 402 Council on Environmental Quality (CEQ), 16, 108, 140–5 CPI. See consumer price index Craig, Donna G., 188, 207, 391, 398 cumulative impacts, 177 Daly and Cobb, 392 Daly, Herman E., 23, 27, 390, 392 Dalton, Rober t E., 203–4, 392 D’Amato, Anthony, 186 Damrosch, Lori F., 208–9, 395 Davide, Hilario, Jr., 188 DDT (dichlorodiphenyltrichloroethane), 16, 55 death rates from infectious disease, 173–4 Declara tion of the International Law Association (New Delhi, 2002), 196–8, 201, 215, 392 Declaration of the United Nations Conference on the Human Environment in 1972, 184 Declaration on the Establishment of a New International Economic Order, 184, 190, 392 408
defensive expenditures, 23, 26–7 deforestation, causes of, 167–8 delayed impacts, 176 demand cur ves, 267–270, 272, 284 Depar tment for International Development, UK (DFID), 16, 52 depletion of resources, 50–1, 142, 208, 302–5, 310–12, 336–8 Depression of 1930, 261 Dernbach, John C., 193, 392, 400 deser tification, 204, 238–9, 331, 356 developing countries, 48, 51, 53–4, 61–2, 67, 71–2, 75, 96, 98–9, 104, 108, 146, 159, 161, 176–7, 179, 182, 197, 205, 210, 219, 223, 226–9, 235–6, 240, 251, 289, 300, 314–5, 320–5, 328–34, 339–40, 343, 347, 350–5, 358, 364–7, 371, 377–8, 381–2, 391, 396, 404 development diamonds, 127–30, 251–2 development finance institution (DFI), 16, 228, 234, 241, 250–1, 346, 353, 366 DFI. See development finance institution DFID. See Depar tment for International Development, UK Diamond, Jared, 21, 392 Dickey-Lincoln Dam project, 146 Diehl, Paul F., 214, 393, 395 Digest of International Law, 401 Digest for U.S. Practice in International Law, 392 direct use values, 284 disaster management, 63–5, 227, 320, 329, 333, 353 disposable personal income, 300 distribution of resources, 65, 76–9, 103–4, 133–4 Dixon, John A., 13, 15, 260, 262, 265, 276, 281–2, 284, 300, 392 DNA (deoxyribonucleic acid), 16, 88 Do No Harm Policies, 316, 342 dose response cur ve, 112 Dower, Nigel, 185, 393 Dowling, J. Malcolm, 13, 393 Dufournaud, Christian M., 393 durability of wealth concept, 310 Ear th Char ter, 212–3, 367–8 Ear th Summit (Rio de Janeiro, 1992), 7, 49, 159, 351, 364–5, 392, 399 ecological footprint, 70–1, 402 ecological threshold, 24, 176 economic benefits, as weighting indicator, 116–7 economic dimension, 10, 260 ff, 400 Economic Development Futures Web Journal, 48, 402 economic internal rate of return (EIRR), 16, 287–8, 292–3 economic sustainability, 162–3, 278, 292 economic value, 282 ff, 372–3
ecosystem ser vices, 101–2, 392, 402 education expenditures, 311–2 Ehrlich identity, 31–2, 38, 52 Ehrlich, Paul R., 31, 382, 386, 393 EIA. See environmental impact assessment EIRR. See economic internal rate of return EIS. See environmental impact study Emerging Asia, 24–5, 393 Emerging Asia: Changes and Challenges, 56 Emerson, Ralph Waldo, 212, 393 emissions, diffusion, and impact model, 112 emissions, of lead and mercur y, 55–6 Endangered Species Act, 146, 212, 280, 393 energy flow, 94 energy policy, 165–6 energy sources, 94–5 environmental assessment, 131–3, 140 ff, 250, 316, 318, 334 environmental attributes, 282 ff environmental clearance document, 152 environmental degradation, 25, 51–3, 63, 71, 81, 98, 140, 176, 224, 238, 301, 321–2, 338, 379 environmental diamonds, 123, 127–32 environmental dimension, 10, 163, 218 environmental economics, 260–2, 271–4, 394, 397 environmental elasticity, 123, 126–7, 132, 251 environmental impact assessment (EIA), 16, 140 ff, 163, 171, 195, 197, 247–50, 336, 391, 396 environmental impact, factors affecting, 31–2; unique characteristics of, 176–7 environmental impact prediction techniques, 148 environmental impact study (EIS), 16, 143, 145 environmental indicators, 106 ff, 336, 393 environmental inventor y, 142 environmental issues, 39, 111, 114, 168–9, 171, 205–8, 260–1, 310, 317–8, 331–2, 351 environmental management, achievements in, 174–5; global milestones in, 158–162; institutional framework for, 170, 174 environmental monitoring plan, 152 Environmental Policy Act of 1969. See National Environ-mental Policy Act environmental protection, 7, 107–9, 182, 200, 238, 333, 363, 367, 382 Environmental Protection Agency (EPA), 16, 108, 118, 124, 140–1, 144, 149, 292, 380 environmental quality, 27, 42, 106, 115, 121, 123, 132, 136, 175, 263, 302; public evaluation of, 174–6 Environmental Quality in Asia, 23, 27, 399 environmental quality indices, 121 ff environmental safeguards, 162–3 environmental thermometer, 131–2 environmental treaties, characteristics of, 201–2 environmental value, 285 EPA. See Environmental Protection Agency
equity issues, 197, 211, 223, 368 ESCAP. See UN Economic and Social Commission for Asia and the Pacific Esty, Daniel, 202, 203, 393 ethics and environmental law, 212–3 European Bank for Reconstruction and Development, 21, 314 European Convention on Civil Liability for Damage Resulting from Activities Dangerous to the Environment, 185, 393 evaluation approaches, 282–7 Evans, J. Warren, 13, 15, 314, 396 existence value, 284–6 externality, 23, 25–6, 37, 71–2, 176, 212, 276–8, 280–1, 287, 297–8, 301 factors of production, 260, 300 Fajnzylber, P. D., 78, 402 FAO. See Food and Agriculture Organiza tion Farber, Daniel A., 141, 393 fer tilizer use, 69, 90–1, 304 financial internal rate of return (FIRR), 16, 287–8, 292–3 Finding of No Significant Impact, 145 Findley, Roger W., 141, 393 FIRR. See financial internal rate of return fisheries, 21–2, 84, 91–2, 163–4, 271–3, 282, 285, 322, 328, 382 Food and Agriculture Organization (FAO), 16, 88–9, 91, 102, 346, 348, 350, 402 food production, 74, 87–92, 381, 383, 386 forest depletion, 51, 58, 61, 99–100, 167–8 Forest Principles, 190 forestr y policy, 43, 61, 119–21, 166–69, 190 fossil fuels, 37–8, 56, 84, 93–4, 97–8, 112, 304, 307, 371 fragile lands, 323 Fried, John H. E., 214, 393 Friedman, Milton, 361 Funk, Karina, 36–7, 394 Gabcikovo-Nagymaros Project, 193–5 Gandhi, Indira, 50 Gandhi, Mahatma, 67 GDP. See gross domestic product GE. See genetically engineered GEF. See Global Environment Facility Gelber, A., 131 gender and development, 219, 235–9 gender equality, development goals for, 180–1 genetically engineered (GE), 16, 87–8, 103 genetically modified (GM), 16, 87–8, 90, 103, 208–9 genuine progress indicator (GPI), 16, 300, 302–7, 312, 392 genuine savings, 310–2, 322, 335–8 409
geometric growth, 29 geometric mean, 134 Georgieva, Kristalina, 13, 15, 314 Gini coefficient, 251, 256, 303–4 Gleick, Peter, 377–8, 401 global energy use, table of, 165 Global Environment Facility (GEF), 16, 202, 205–7, 315, 317, 331–2, 334, 337, 351, 355–6, 367 global income distribution, 48 Global Judges Symposium on Sustainable Development and the Role of Law (Johannesburg, 2002), 203–4, 213, 395, 400 global warming, 287 ff, 372–3, 381, 386, 400 GM. See genetically modified GNI. See gross national income GNP. See gross national product good governance, 47, 62–3, 74, 160, 166, 197–9, 215, 280, 353–5, 366 government expenditures, 301–2 government inter vention, 177 GPI. See genuine progress indicator Green 2 Revolution, 72, 74–6 green accounting, 301, 335 Green-Green Revolution, 74 green indicators, 109–10 Green, P., 401 Green Revolution, 46, 74, 90 gross domestic product (GDP), 16, 26–7, 49, 52, 66, 85, 87–8, 93–4, 101–3, 121–7, 132, 162, 170, 174, 178–9, 197–8, 218–21, 228, 251–7, 263–7, 279, 300–7, 310, 322, 335, 364–5, 391; world, growth of, 170, 174 Gross, Leo, 214 gross national income (GNI), 312 gross national product (GNP), 16, 26, 94, 200, 266–7, 300, 302, 312, 365; per capita, 43, 122, 251–2 gross savings, 312, 337–8; per person, 337 Grübler, Arnulf, 373 Guillman, Francoise Burhenne, 13 Habitat Conference (Istanbul, 1996), 159 Handl, Gunther, 195, 200, 394 Hardin, Garrett, 394 harmonic mean, 133–4 Har twick Rule, 26 Har vard Business Review, 394 Har vard Institute for International Develop ment (HIID), 16, 56–8, 176, 393 Har vard University, 123, 393, 398–9, 403 Hawken, Paul, 72–3, 394 Hazell, P., 90 HDI. See human development index health care, 44, 49, 76–7, 84, 87–8, 116, 182, 199, 222, 224 –5, 235–6, 242, 247, 363, 368
410
Health of the Planet, 1992 poll, 174 hedonic approach, 282–4 hedonic pricing, 282 Heilbroner, Rober t, 370, 394 Henkin, Louis, 208–9, 395 Hicks, Sir John, 26–7 high biodiversity areas, 323 high-growth rate countries, 323 HIID. See Har vard Institute for International Development Hocking, M., 33–5, 394 Holdren, John, 98, 396 How to Change the World: Social Entre pren eurs and the Power of New Ideas, 348, 362, 390 human capital, 27, 260, 310, 336–8, 399 human development index (HDI), 16, 111, 121–2, 127, 251, 300, 307, 312 Human Development Repor t (HDR), 47–9, 394 human pover ty index, 219 human resources, 235, 307, 309–10, 312 Hunter, David, 186–9, 207, 395 IACSD. See Interagency Committee on Sustainable Development IADB. See Inter-American Development Bank IAEA. See International Atomic Energy Agency IBRD. See International Bank for Recon struction and Development ICJ. See International Cour t of Justice IEE. See initial environmental evalua tion IFAD. See International Fund for Agricul tural Develop ment ILO. See International Labour Organiza tion IMF. See International Monetar y Fund impact identification methods, 147–9 income distribution, 48, 77, 103–4, 133, 228, 251, 253–7, 303–5, 394 indigenous knowledge, 52, 227 indigenous peoples (IPs), 16, 75, 78, 163, 191, 219, 229, 240, 242–5, 248–9, 257, 296–7, 316, 318, 346–7, 391, 395, 398 indirect use values, 284–6 indoor pollution, 115 industrial revolution, 260, 262; new, 72, 74, 394 infant mor tality rates, 173–5; development goals for, 181 Inhaber group indices, 119–21 Inhaber, Herber t, 119–21, 395 initial environmental evaluation (IEE), 16, 151, 153, 171, 248 input-output analysis, 301, 396 input-output coefficients, 312 Institute of Policy Studies, 48, 402 institutional factors, 221–5
institutional safeguards, 162–3 Interagency Committee on Sustainable Devel op ment (IACSD), 346, 348 Inter-American Development Bank (IADB), 16, 21, 146, 171, 314 intergenerational equity, 187–8, 211, 382, 400 International Atomic Energy Agency (IAEA), 348, 350 International Bank for Reconstruction and Development (IBRD), 16, 315, 334, 342, 350 International Centre for the Settlement of Investment Disputes, 342, 350 International Conference on Fresh Water (Bonn, 2001), 161 International Conference on Financing for Development (Mexico, 2002), 161 International Cour t of Justice (ICJ), 16, 185–6, 189, 193–6, 350 international custom, 186–7, 189, 194, 200, 399; ar ticulation of, 189 International Development Association, 342, 350 international environmental law, 158, 184, 189, 196, 202, 210 International Federation of Red Cross and Red Crescent, 63 International Finance Corporation, 342, 350 International Fund for Agricultural Develop ment (IFAD), 314, 346, 348, 350 International Goals. See Millennium Devel op ment Goals (MDG) International Labour Organization (ILO), 16, 242–3, 346, 348, 350, 394 international law, 39, 184–96, 198, 200–1, 204–5, 207, 213–5, 242–3, 391–6, 398–9, 401; role of judicial decisions in, 187–8; sources of, 186–8 International Monetar y Fund (IMF), 16, 162, 226, 350 International Red Cross, 63 –4 interquar tile range, 135 inter val scale, 111 investment loans, 314–15 involuntar y resettlement, 10, 163, 219, 239–44, 257, 316, 318 IPs. See indigenous peoples irreversible damage, 98, 177 IUCN. See World Conser vation Union, The IUCN Academy of Environmental Law, 210, 395 Ivanova, Maria, 202–3, 393 Jalal, Kazi F., 23, 45, 51, 68–9, 73, 80–1, 90, 354, 358, 399–400 Jefferson, Thomas, 210–1 Johannesburg Commitment on Sustainable Development, 162, 355–6 Johannesburg Principles on the Role of Law and Sustainable Development, 213, 395 Jones, Daniel T., 73
Kennedy, Scott, 13–5 Keohane, Rober t O., 202, 395 Keyfitz hypothesis, 377–8 Keyfitz, Nathan, 374, 374–9, 395 Keynes, John Maynard, 261–2 Khan, Herman, 21, 395 Kile, Molly, 13–5 Kiss and Shelton, 158, 185–6, 189, 191–3, 201, 210, 353, 395 Kiss, Alexandre, 158, 185–6, 189, 191–4, 196, 198, 201, 210, 215, 353, 395 Kissinger, Henr y, 92 Koh, Kheng-Lian, 13, 188, 207, 391, 398 Ku, Charlotte, 214, 393, 395 Kuznets Cur ve, 125, 176, 333–4, 374, 395 Kuznets, Simon, 23–4, 395 Kyoto Protocol, 94, 203, 330, 339–41, 377, 395 labor and capital, 260–1 Lake Superior, 141, 149–50 Lâm, Maivân Clech, 243, 395 Lammers, R. B., 401 land quality index, 120–1 land values, 282–3 land, labor and capital, 260 Laszlo, Chris, 347, 361–2, 395 Lederman, D., 78, 402 Lenoir, Rene, 245 Leontief, Wassily, 301, 396 Leopold, Aldo, 212 Leopold, Luna B., 147, 396 Leopold Matrix, 147–8 less developed countries, 109, 161 life cycle analysis, 32–9, 150 life expectancy at bir th, 121–2, 127, 130, 174–5, 251 Loayza, N., 78, 402 Lohani, Bindu N., 150, 393, 396, 399 Lomborg, Bjørn, 21, 172–3, 175, 382–3, 396 Lorenz cur ve, 253, 256–7 Lovins, Amor y, 394 Lovins, L. Hunter, 394 Lowe, Vaughn, 196, 396 Lutz, Ernst, 44, 301, 394, 396–7 macroeconomic policies, 303, 337–8 Malone, Linda A., 142, 144–6, 396 Malthus, Thomas Rober t, 20–2, 28, 31, 262, 372–3, 383, 386, 396 mangrove forests, 168–9, 227, 280–2 market failure, 47, 60–2, 278–80 Marx, Karl, 21, 260–2, 373 Marxism, 261–2 materials flow, 92–4, 371 maternal health, development goals for, 181 matrices, environmental baseline, 147–8 411
McBean, E. A., 136, 396 McGill, Eugenia, 13, 218 McKay, Gordon, 103 MDBs. See Multilateral Development Banks MDGs. See Millennium Development Goals Meadows, Donella, 20, 373, 386, 396 mean, 98, 121–9, 131, 149, 159, 249, 255, 346, 348; deviation from, 134–5; geometric, 134; harmonic, 134 MEAs. See multilateral environmental agreements measure of wealth, 307–10 measurement metrics, 110–1 measures of central tendency, 133–4, 137 measures of data dispersion, 134–7 Measuring Environmental Quality in Asia, 23, 27, 399 median, 133–7 megacities, 86, 323 MFIs. See multilateral financing institu tions microcredit/microfinance, 58–9, 75–7, 221, 226, 288, 302 Millennium Development Goals (MDGs), 17, 160–1, 177–82, 225, 228, 238, 317, 325–8, 354, 383, 396 Millennium Summit (New York, 2000), 160, 324–5, 328 Miller, George, 107 miscellaneous factors index, 119–21 mode, 133, 136–7 Montevideo Program, 158, 203 Montreal Protocol, 201–2, 204, 331, 334, 380 Morais, Herber t V., 190, 397 multilateral development Banks (MDBs), 17, 46, 146, 199, 200, 240–1, 293, 314, 327 multilateral environmental agreements (MEAs), 17, 184, 200–5, 207, 213, 215, 400; problems with, 202–9 multilateral financing institutions, 17, 62–3 Multilateral Investment Guarantee Agency, 342, 350 multisectoral actions, 145, 177 Munasinghe, Mohan, 23, 44, 397, 403 Narmader Dam, 146 National Ambient Air Quality Standard (NAAQS), 17, 118 National Environmental Policy Act (NEPA), 17, 140–4, 146 national income, 256–7, 300–2 Nattrass, B., 71, 397 natural assimilative capacity, 43 natural capital, 26–8, 72, 101, 303, 307–10, 337–8, 392, 394, 402 natural habitats, 316, 318 natural regeneration rate, 43 natural resource accounting, 71–2, 299 ff natural weighting, 115–6 NEPA. See National Environmental Policy Act 412
NEPA-like laws, 143–4 net national product, 26–7, 300–1 NGO classification, 233 NGOs. See nongovernment organizations Nielsen, Daniel, 100, 390 NNP. See net national product no-build option, 143–5, 155 Noguchi, Motoo, 190, 397 noise and sound suppression techniques, 149 noise pollution, 149, 303–5 noncategorical exclusions, 144–5 nongovernment organizations, 17, 59, 63, 78, 80–2, 161, 163, 169, 202, 206–7, 219–21, 228–30, 233–5, 2456, 257, 273, 285–6, 289, 317, 346–8, 354, 357–8, 362–4, 368, 370, 398; treaty roles for, 209–10 nonrenewable resources, 23, 26, 142, 147, 304–5, 371–2 non-UN entities, 353, 358 non-use value, 284–7 Nordhaus, William D., 376, 397, 400 normal (Gaussian) distribution, 133, 135; deviation from, 137 Nor th-South cooperation, 366–7 nuclear energy. See nuclear power nuclear power, 95, 98, 166, 291, 304, 377 Nye, Joseph S., Jr., 202, 394, 395 ODA. See overseas development assist ance OECD. See Organization for Economic Cooperation and Development off-site benefits, 281–2 on-site benefits, 281 OPEC. See Organization of Petroleum Expor ting Countries Oposa, Antonio A., Jr., 187–8, 205, 396–7 Oposa v. Factoran Case, 187–8, 396 option value, 284–6 ordinal scale, 110–1 Organization for Economic Cooperation and Development (OECD), 17, 54, 56–8, 86, 112, 114–5, 233, 301, 308, 323–4, 334, 339, 366, 397 Organization of Petroleum Expor ting Countries (OPEC), 17, 92–3, 330 Ott, Wayne, 108, 118, 397 Our Common Future, 7–9, 162, 397 overfishing, 91, 330 overpopulation, 103, 388 overseas development assistance (ODA), 17, 226, 364–6 Owens, Gene M., 399 Pacyna, J. M., and Pacyna, E. G., 56 Page, Talbot, 210, 397 Palmore, Jay, 218
Panayotou, Theodore, 25, 176, 397 Pant, Amber, 13, 204–5, 397 Pareto frontier, 262–5 Pareto optimality, 265 Pareto, Vilfredo, 263, 274, 298, 399 par ticipator y development, 58–60, 62, 191, 195, 197, 228–31, 248 par ticulate matter, 57, 95–7, 311, 321 PCF. See Prototype Carbon Fund Pearce, David, 27, 43, 397–8 People, Planet, and Prosperity, 328 People’s Congress Committee on Environment, 143 People’s Ear th Char ter, 367–8 per capita wealth, 308, 310, 338 personal consumption expenditures, 301–4 personal income, 300 pest management, 227, 316, 318 Pezzey, John C. V., 23, 398 Plant, Roger, 191, 398 Plato, 213–4, 398 policy environment, 60, 221–5, 227 policy failure, 60–2, 82, 280 policy making, 278 policy response, 278 pollination, 103 pollutant, 36–7, 71, 93, 95, 106–10, 112, 114–5, 124, 149–50, 203, 205–6, 311, 331–2, 371, 378, 400 pollution, 47, 55–8 pollution control, 199, 293, 297, 337, 367 pollution levels in Asia, 56 pollution standard index (PSI), 17, 117–8 population, 47, 52–5 population and sampling, 111–2 Population Challenges and Development Goals and UN, 54, 404 population growth, 11, 20–1, 24, 28–32, 39, 52–5, 84–7, 98–9, 221–2, 257, 303, 320–4, 336–8, 343, 353, 381, 386, 401, 404 population planning, 53–5 Population Reference Bureau, 30 Population Summit (Cairo, 1992), 159 positive income elasticity, 253–4 post-audit evaluation, 152 pover ty, 47–52, 76; classified by settlement area, 226–8; development goals for, 178–80 pover ty reduction, 51, 160–1, 178, 192, 197, 199, 213, 219–28, 257, 317, 320, 333, 368, 398–9; ADB strategy for, 221 ff, 398 PPP. See purchasing power parity precautionar y principle, 98–9, 209, 382 pricing issues, 266–71, 279–80 primar y stakeholders, 229 Principle 1, 191, 347 Principle 10, 191, 347 Principle 11, 191, 347
Principle 12, 347 Principle 13, 191 Principle 15, 98, 191 Principle 17, 191 Principle 18, 191, 347 Principle 19, 191, 347 Principle 2, 191–2, 347 Principle 20, 191, 238, 347 Principle 21, 189, 191–2 Principle 22, 191, 347 Principle 24, 189, 347 Principle 3, 191, 347 Principle 4, 11 Principle 5, 191, 347 Principle 8, 347 principal component analysis, 123, 132 private goods and ser vices, 266 produced assets, 309–10 production approach, 265–6, 282 production forests, 169 production patterns, 71–6, 343 production revolution, 71–2 program focus, 221–5, 227 project categories, 147, 151, 171, 247–9 project cycle, 152, 155, 171, 251, 331 project proponent, 143, 151–2, 154, 223, 229–31, 239–41, 250 proper ty values, 304 protection forests, 169 Prototype Carbon Fund (PCF), 17, 339 PSI. See pollution standard index Pugh, Richard Crawford, 208–9, 395 purchasing power parity (PPP), 17, 85–6, 88, 122, 267 quantitative models, 148, 150 Rabl, Ari, 36–7, 394 range of data, 135–6 rapid social assessment (RSA), 17, 248–51 ratio scale, 111 real product. See tangible product receptor models, 148 red indicators, 109–10 Redclift, M., 44, 398 Reducing Pover ty in Asia: Findings and Implications, 398 Rees, Sir Mar tin, 65, 398 regional development banks, 63, 287, 332, 346, 348, 353 renewable resources, 26, 61, 142, 288, 297, 372 rent, 103, 246, 271–2, 285 rent-seeking behavior, 271 Repetto, Rober t, 22, 43, 398 reproductive health, development goals for, 182 413
resettlement policy, 239–41, 244 resource use, 44, 142, 280, 297, 322, 360, 372–8, 380–1, 386 resource distribution, 76–9 Ricardian rent, 271 Ricardo, David, 28, 260, 262, 271, 323, 372, 383, 398 Rio Conference, 192, 354, 357, 390 Rio Declaration, 7, 11, 45, 98, 184, 188–92, 194–5, 198–9, 346–7, 398 Rio Summit on Sustainable Development (1992), 317; see also Ear th Summit, Rio Conference, and UN Conference on Environment and Development Robinson, Nicholas A., 188, 207, 212, 391, 398 Rogers, Peter P., 22–3, 27, 119–20, 122–6, 129, 131–2, 252, 364–5, 370–9, 398–9 Rosegrant, M. W., 90 Rosenstock, Rober t, 189–90 Rovers, F. A., 136, 396 RSA. See rapid social assessment rule of seventy, 28–9 rural to urban migration, 51, 103 Sachs, Jeffrey, 49, 399 Sala-i-Mar tin, Xavier, 48 Salim, Emil, 107, 124, 399, 403 Salisbur y, J., 401 Salzman, James, 186–9, 207, 395 Sands, Philippe, 190, 192, 211–2, 364, 399 savings, 27, 47, 63, 132, 226, 310–2, 322, 335–8 savings rate, 132, 310–1, 322, 338 Schachter, Oscar, 208–9, 395 Schendler, Auden, 361 Schmidheiny, Stephan, 360 Schwebel, Stephen M., 193, 399 Schweitzer, Alber t, 212 SDE. See social development elasticity SDIs. See social development indicators SDS. See social design study SEA. See strategic environmental assessment Seattle meeting, 328 secondar y stakeholders, 229 sector policies, 159, 163–169 Selden, Mark, 65, 399 Sen, Amar tya, 121, 231, 246, 399 shadow price, 279, 287 Shah, Anup, 50 Shelton, Dinah, 158, 185–6, 189, 191–3, 201, 210, 353, 395 Shrimp/Tur tle dispute, 208 Simon, Julian, 21, 386, 399 skewness, 137 Smit, Hans, 208–9, 395 Smith, Adam, 211, 245, 260, 262, 323, 399
414
Smith, Douglas V., 45, 51, 68–9, 73, 80–1, 90, 354, 358, 400 Smith, H. Jesse, 21 snowflake diagram, 130–2 So, Alvin Y., 65, 399 social analysis, 219, 247–8, 394 Social and Environmental Effects of Large Dams, The, 394 social costs, 25, 37–9, 191, 277, 305, 394 social design study (SDS), 17, 240, 248–50 social development elasticity (SDE), 17, 251 ff social development indicators (SDIs), 17, 219, 251 social dimension, 20, 44, 146, 185, 211, 218 ff social exclusion, 219–20, 245–7, 257, 399 Social Exclusion: Concept, Application and Scrutiny in 2000, 246, 399 Social Summit (Copenhagen, 1995), 159 social sustainability, 39, 162–3, 388 soft law, 189, 244, 391 soil conser vation, 61, 76, 109 soil depletion, 53, 90–1, 387 soil erosion, 124–6, 276, 304, 387 soil formation, 101, 103 solar energy, 95 solid waste disposal, 43, 56, 62, 124, 203–4, 241, 390 Solow, Rober t, 26, 400 South-South cooperation, 354, 366 spatial impacts, 176–7 Speth, Gus, 21, 141, 400 standard deviation, 134–7 star diagram, 131 statistical procedures and definitions, 111–2, 133–7 step matrixes, 148 Stiglitz, Joseph, 352, 400, 404 Stockholm Action Plan, 199, 400 Stockholm Conference (1972). See Stockholm Declaration, UN Conference on the Human Environ ment Stockholm Convention on Persistent Organic Pollutants, 203, 205, 400 Stockholm Declaration, 184, 188–92, 199, 400 strategic environmental assessment (SEA), 17, 145 Strong, Maurice, 44–5, 400, 404 Stumbling Toward Sustainability, 392, 400 subsidies, 25, 38, 66, 72–5, 80, 93, 166, 176, 182, 207–8, 222–4, 280, 292–3, 329, 342, 349–50, 356, 360, 365–6, 374 Summers, Lawrence, 62, 366, 400 surrogate markets, 282–4 sur vey-based approaches, 286 sustainability, 20, 22–8, 53, 58, 65, 71, 84, 94, 98, 103, 106–7, 109, 132, 140, 144, 154, 160, 162–3, 166, 195, 222–3, 228, 257, 260, 274, 278, 287–8, 291–3, 295–8, 300–1, 306–7, 310–2, 325, 330–1,
342–3, 358, 360–2, 368, 370, 381–3, 387–8, 390, 392–3, 398, 400–1; concept of, 42–6; life cycle analysis, examples of, 32–9; nine ways to achieve, 23–26; simple rule for, 27; weak and strong, 28 sustainability indicators, 103, 132 sustainable development, concept or principle?, 193–201; determinants of, 65–79; ecological, economic and socio-cultural approaches to, 43–4; environ mental law and, 210–5; factors governing, 47–65; first formal treaty to refer to, 211; four principles of, 162; indicators for, 106 ff; legal status of, 195; links to environ ment and pover ty, 50–2; operational criteria for, 45–6; see also environ mental indicators, triple bottom line Sustainable Development in Asia, 80–1, 400 sustainable economic growth, 43, 166, 317 sustainable environment, 278, 300 sustainable logging, 357 sustainable social net product (SSNP), 26–7 Sweetser, Anne, 13, 218, 396 tangible products, 282 Tangley, Laura, 100, 390 technology, per capita, 31–2, 38–9 Thomas, W. A., 106–7, 401 three “E’s”, the, 141, 260, 288. See also triple bottom line tidal power, 95 Tobin tax, 62, 226, 364, 366, 401 top 10 lists, 326 total suspended par ticulates (TSP), 17, 117, 124, 153 traditional fuel, 326–7 traffic patterns, 149 Train, Russell, 141 transaction costs, 25, 72, 278–9 transpor t systems, latent, 150 treaty ratification, in US, 203–4; outside the US, 204–5 triple bottom line, 39, 42, 45, 71, 106, 260, 288, 297, 341, 358–9, 361, 401 trichloroethylene, 150 TSP. See total suspended par ticulates Tuna/Dolphin dispute, 207–8, 353, 387 UN. See United Nations UNCED. See UN Conference on Environment and Development UN Char ter, 198 UNCHE. See UN Conference on the Human Environment UN Children’s Fund (UNICEF), 348, 350 UN Commission for Sustainable Development (UNCSD), 346, 348–9 UN Conference on Environment and Development (UNCED), 17, 45, 98, 159, 184, 190, 210, 238,
328, 346–7, 365, 398; see also Ear th Summit, Rio Conference UN Conference on the Human Environ ment (UNCHE) (Stockholm, 1972), 7, 17, 42, 158–9, 162, 184, 190, 202–5, 351, 400; see also Stockholm Declaration UN Conference on Trade and Development (UNCTAD), 348, 350–1 UNCSD. See UN Commission for Sustainable Development UNCTAD. See UN Conference on Trade and Development UN Depar tment of Economic and Social Affairs (UN/DESA), 346, 348, 350 UN/DESA. See UN Depar tment of Economic and Social Affairs UN Development Programme (UNDP), 17, 47–9, 121, 219, 228, 251, 300, 307, 312, 332, 346, 348, 350, 364, 366, 394, 402–3 UN Disaster Relief Organization, 63 UNDP. See UN Development Programme UN Economic and Social Commission for Asia and the Pacific (ESCAP), 16, 62, 350 UN Educational, Scientific and Cultural Organization (UNESCO), 21, 213, 346, 348, 350 UN Environment Programme (UNEP), 17, 44, 158, 175, 184, 202–3, 205, 207, 209–10, 215, 235, 237–8, 332, 346, 348–51, 356, 394, 402 UNEP. See UN Environment Pro gramme UNESCO. See UN Education Scientific and Cultural Organization UNFPA. See UN Population Fund UN Framework Convention on Climate Change, 190, 201, 204, 215 UN General Assembly, 22, 158–61, 177, 181, 184, 188–90, 244, 346, 348–51, 354, 356–7, 391–2, 394, 398–9 UNICEF. See UN Children’s Fund UN Industrial Development Organization (UNIDO), 21, 350 United Nations (UN), 16–7, 21, 30, 42, 44, 47, 53–4, 63, 89, 158, 184, 189–90, 203–4, 208, 236, 327, 332, 346, 348–51, 365, 391–5, 398, 400–2, 404 United States Agency for International Development (USAID), 17, 52, 146 UN Population Division, 54, 84, 404 UN Population Fund (UNFPA), 21, 53–4, 350 UN Repor t of the International Law Commis sion, 189, 398 UN Security Council, 190, 348–51, 353, 401 urbanization, 51, 84, 86–7, 218, 304, 381 urban statistical models, 148 USAID. See United States Agency for International Development US Council on Environmental Quality, 16, 108 415
US Depar tment of Commerce, 292, 301–2, 404 US Depar tment of State, 189, 392 US Environmental Protection Agency. See Environmental Protection Agency, U.S. use values, 284–6 utility of income, 121–2 valuation techniques, 282 ff value added, 266, 284 value judgments, 106, 265 Value of the World’s Ecosystem Ser vices and Natural Capital, The, 101, 392, 402 variance, 123, 134–5 vicious circles, two, 50–1 Vienna Convention on the Law of Treaties, 186, 205, 401 Vienna Convention for the Protection of the Ozone Layer, 204, 401 vir tual reality software, 149 Visions of the Future, 370, 394 Vital Signs, 68–9, 401 Vörösmar ty, Charles J., 101, 401 wage differentials, 283 water, access to in third world, 172, 174; development goals for, 179–81 water policy, 163–5, 397; for Asia, 164–5 water pollution, 24, 56–8, 108, 114–5, 170, 213–4; cost of, 304–5 water quality index, 119 water quality standards, 124 water scarcity, 99, 101, 320–2 WB. See World Bank WCED. See World Commission on Environment and Development Wealth of Nations, The, 211, 260 wealth per capita, 308, 338 WEDO. See Women’s Environment and Development Organization Weeramantr y, Christopher Gregor y, 194 weighting schemes, for environmental indicators, 114 ff WEO. See World Environment Organization Where Is the Wealth of Nations?, 307–9, 311–2, 401 Whiteman, Marjorie M., 185, 401 WHO. See World Health Organization wind, 149–50 wind power, 95, 98, 166, 291, 335 WMO. See World Meteorological Organization Wolfensohn, James D., 314–5 Wolfowitz, Paul, 314 Womak, James P., 73 Women and the Environment, 235, 237, 402
416
Women’s Environment and Development Organization (WEDO), 235, 237–8, 402 Women’s Summit (Beijing, 1995), 159 Women’s World Congress for a Healthy Planet, 238, 402 World Bank (WB), 17, 21–3, 30, 43–4, 59, 62–3, 72, 75–6, 85, 88, 123–4, 127–8, 130–1, 146–7, 161–2, 164–8, 170–1, 174, 176–80, 202, 206, 210, 219–21, 226, 228, 233–5, 240, 251, 267, 287, 289, 300–1, 307–12, 314–24, 326, 328–30, 332–4, 336–9, 341–2, 346, 348, 350, 352–3, 386, 390, 393–4, 396–9, 401–4; Energy Program of, 166; pover ty study by, 219–21, 404 World Bank memo, 365 World Commission on Environment and Development (WCED), 7, 17, 22, 42, 158, 397 World Conference on Women, 236, 238 World Conser vation Strategy, The, 44, 402 World Conser vation Union, The (IUCN), 13, 16, 44, 124, 207, 209–10, 212, 348, 358, 378, 395, 402 World Development Repor t 1992, 317, 399 World Environment Organization (WEO), 17, 349, 351, 353, 357 world expor ts, growth of, 172, 174 World Food Summit (Rome, 1996), 87, 159 World Health Organization (WHO), 17, 21–2, 80, 124, 321, 346, 348, 350, 403 world income, distribution of, 47 World Meteorological Organization (WMO), 21, 348, 350 world population, 30, 53–4, 404 World Population Prospects, 54, 404 World Resources Institute, 53, 123, 210, 349, 404 world’s forests, state of, 167 World Summit on Sustainable Development (WSSD) (Johannesburg, 2002), 7, 17, 49, 75, 82, 109, 162, 188, 196, 198–9, 226, 238, 328, 330, 332, 346, 349, 351, 353–8, 364, 388, 395 World Trade Organization (WTO), 17, 96, 159, 207–8, 346, 348, 350–3, 388 World Watch Institute, 20, 91 world water supply, state of, 164 World Wildlife Fund (WWF), 17, 44, 124, 210, 286, 343, 348, 358, 402 WSSD. See World Summit on Sustainable Development WTO. See World Trade Organization WWF. See World Wildlife Fund Yu, Chang-Ching, 399 Yunus, Muhammad, 77 Zaelke, Durwood, 186–9, 207, 395