Advances in Water Resource Planning and Sustainability 9819936594, 9789819936595
Sustainable water resources planning deals with the interface of water resources science and the needs of human populati
341 41 11MB
English Pages 320 [321] Year 2023
Contents
1 Remote Sensing in Water Resource Monitoring a Comprehensive Review on Monitoring the Quality and Quantity of the Water Resources Using Remote Sensing Applications
1.1 Introduction
1.2 History of Remote Sensing
1.3 Revolution of Remote Sensing and Its Application to the Water Resource Management
1.4 Surface Water Monitoring
1.5 Groundwater Monitoring
1.6 Water Quality Monitoring
1.7 Water Crisis and Consequences
1.8 Selected Countries and Development in Remote Sensing
1.9 Future Suggestions and Research Gap
1.10 Conclusion
References
2 Assessment of Vegetation Dynamics of Paddy Crop Using “TIMESAT” and Remote Sensing and GIS Techniques in Command Areas
2.1 Introduction
2.2 Study Area
2.3 Methodology
2.4 Data Processing
2.5 Result and Discussion
2.6 Conclusion
References
3 Assessment of River Water Dynamics and Optically Active Water Quality Parameters Over Punjab, Based on Cloud Computing Approach
3.1 Introduction
3.2 Study Area
3.3 Materials and Methodology
3.3.1 Field Data Collection
3.3.2 Remote Sensing Data Collections
3.4 Results and Discussion
3.4.1 Landsat Satellite Data Derived Different Facets of River Water Dynamics
3.4.2 Sentinel-2 Satellite Derived Optically Active Water Quality Parameters of River Water
3.5 Conclusion
References
4 Analysis of Land Use/Land Cover Change and Its Impact on 2021 Chiplun Flood, Maharashtra, India
4.1 Introduction
4.2 Study Area
4.3 Materials and Methods
4.4 Signature Creation
4.5 Results and Discussion
4.6 The Main Causal Factor of Flood in Chiplun City
4.7 Conclusions
References
5 Flood Disaster Hazards: A State-of-the-Art Review of Causes, Impacts, and Monitoring
5.1 Introduction
5.2 Floods
5.2.1 Causes of Flood
5.2.2 Types of Floods
5.3 Impact of Floods
5.4 Disaster Risk Awareness
5.5 Taxonomy of Disaster Management
5.5.1 Preparedness and Resilience Measures for Flooding Disasters
5.5.2 Strategies and Technologies for Improved Flood Disaster Management
5.5.3 Early Warning Systems
5.5.4 Methods for Preventing Flood Disasters
5.5.5 Flood Disaster Adaptation Strategies
5.5.6 Flood Disaster Management Monitoring, Assessment, and Management
5.5.7 Sustainable Flood Management
5.6 Technological Developments in Managing Flood Disasters
5.6.1 Disaster Management Using Remote Sensing (RS) and Geographic Information Systems (GIS)
5.6.2 Big Data and the Internet of Things (IoT) for Managing Flood Disasters
5.6.3 Artificial Intelligence (AI) for Managing Flood Disasters
5.6.4 Artificial Neural Network (ANN) for Managing Flood Disasters
5.7 Conclusion
References
6 Impact of Land Use Systems and Climate Change on Water Resources: Indian Perspectives
6.1 Introduction
6.2 Major Threats to Water Resources
6.3 Effects of Land Use and Climate Changes on Water Resources
6.4 Mitigation Measures and Sustainable Water Management Practices
6.5 Recommendations and Future Research Prospects
6.6 Conclusions
References
7 Seawater Intrusion Mapping Along Penneru River Delta Area, SPS Nellore District, Andhra Pradesh—A Case Study
7.1 Introduction
7.2 Study Area
7.3 Materials and Methods
7.4 Analytical Procedure
7.5 Spatial Interpolation Methods
7.6 Results and Discussion
7.7 Physical Parameters
7.7.1 PH
7.7.2 Total Dissolved Solids (TDS)
7.7.3 Electrical Conductivity (EC)
7.7.4 Bicarbonate (HCO3)
7.7.5 Chloride (Cl−)
7.7.6 Calcium (Ca2+)
7.7.7 Magnesium (Mg2+)
7.7.8 Sulfate (SO42−)
7.7.9 Potassium (K+)
7.7.10 Total Hardness (TH)
7.8 Piper Trilinear Diagram
7.9 Common Indicators of SWI
7.9.1 Ca/Mg Ratio
7.9.2 Cl/(CO3 + HCO3) Ratio
7.9.3 Na/Cl Ratio
7.9.4 Seawater Mixing Index (SMI)
7.9.5 Integrated Groundwater Quality
7.9.6 Conclusion
References
8 Flood Detection and Flood Mapping Using Multi-temporal Synthetic Aperture Radar and Optical Data
8.1 Introduction
8.1.1 Flood and Flood Risk
8.1.2 Role of Remote Sensing and GIS in Flood Monitoring
8.2 Study Area
8.3 Data Used
8.3.1 A Brief Detail of Sentinel-2A
8.4 Methodology
8.4.1 Flood Hazard Zonation Map
8.4.2 Pre-processing of Image
8.4.3 Flood Inundation Map
8.4.4 Pre-processing
8.4.5 Manual Thresholding and Water Delineation
8.5 Results and Discussions
8.5.1 Land Use/Land Cover
8.5.2 Flood Hazard Zone
8.5.3 Flood Inundation
8.6 Conclusion
References
9 Climate Change and Its Impact
9.1 Background
9.1.1 Surface Water and GroundWater Resources
9.2 Impacts of Climate Change
9.3 Impact of Rivers in Moderating the Climate of Nearby Regions
9.4 Impact of Climate Change on Rivers
9.5 Impacts on Regional and Global Community
9.6 Rising Sea Levels Due to Climate Change
9.7 Sustainable Development Goal (SDG):13—A Target on Climate Action
9.8 Climate Action: Executions by UN Environment Programme
9.9 Conclusions
References
10 Impact of Land Use Changes on Water Resource: Assessment Through Remote Sensing and Geographical Information Systems (GIS)
10.1 Introduction
10.2 Land Use
10.3 Water Resources
10.4 Impact of LULC Changes on Water Resources
10.5 Impact on Surface Water
10.6 Impact on Groundwater
10.7 Use of Remote Sensing for Assessment of the Impact of Land Use
10.7.1 Active Remote Sensing
10.7.2 Passive Remote Sensing
10.8 Conclusion
References
11 Vulnerability to Climate Change in Different Sectors of Lug Valley, Kullu District of Himachal Pradesh
11.1 Introduction
11.2 Study Area
11.3 Methodology
11.3.1 Identification and Selection of Indicators
11.3.2 Data Collection
11.3.3 Quantifying, Normalization, Allocation of Weights, and Vulnerability Indices Estimation
11.4 Results and Discussions
11.5 Agricultural and Horticultural Vulnerability and Adaptive Measures
11.6 Water Resources and Mitigation Measure
11.7 Forest Resources Vulnerability and Adaptive Measure
11.8 Vulnerability Indices
11.9 Conclusion Suggestions and Recommendations
References
12 Assessment of Groundwater Level and Fluctuations Using Geospatial Techniques in Nambiyar Watershed, South India
12.1 Introduction
12.2 Study Area
12.3 Geology
12.4 Land Use/Land Cover
12.5 Rainfall
12.6 Soil Texture
12.7 Materials and Methods
12.8 Results and Discussions
12.9 Groundwater Utilisation Pattern
12.10 Spatial Pattern of Groundwater Level
12.11 Temporal Pattern of Groundwater Level
12.12 Conclusions
References
13 River Flood Monitoring and Management: A Review
13.1 Introduction
13.2 Flood Monitoring and Warning Systems
13.2.1 Classification of FMWS
13.2.2 There Are a Few Basic Categories into Which Alerts Are Divided
13.2.3 Typical Flood Warning System
13.3 The Most Recent Advancements in Image Processing for Managing Floods in a Post-disaster Situation
13.4 Flood Management
13.4.1 Using Geographic Information Systems and Remote Sensing for Disaster Management
13.4.2 Big Data and the Internet of Things (IoT) for Managing Flood Disasters
13.4.3 Flood Management Using Machine Learning
13.4.4 Flood Management Using Artificial Neural Network (ANN)
13.4.5 Artificial Intelligence (AI) for Flood Management
13.5 Conclusion
References
14 Evaluation of Groundwater Quality for Irrigation-A Case Study of West Godavari District of Andhra Pradesh
14.1 Introduction
14.1.1 Study Area
14.2 Material and Methods
14.2.1 Analysis of Groundwater
14.2.2 Kelley’s Ratio
14.2.3 Soluble Sodium Percentage (SSP)
14.2.4 Permeability Index
14.2.5 Statistical Analysis and Mapping
14.3 Results and Discussion
14.3.1 pH and Electrical Conductivity (EC)
14.3.2 Ionic Composition
14.3.3 Sodium Adsorption Ratio (SAR)
14.3.4 Residual Sodium Carbonate (RSC)
14.3.5 Ionic Correlation Studies
14.3.6 Classification of Groundwater Class
14.4 Conclusion
References
15 Interactions of Hydrological Parameters and the Effects on Perennial Riverbanks of the Indo-Bhutan Region in Eastern Himalaya
15.1 Introduction
15.2 Study Area
15.3 Objective
15.4 Database and Methodology
15.4.1 Database
15.4.2 Methodology
15.4.3 Results and Discussion
15.5 Conclusion
15.6 Declaration
References
16 Ecosystem Services in the Riverine Landscapes
16.1 Introduction
16.2 Riverine Landscapes
16.3 Ecosystem Services of Riverine Landscapes
16.3.1 Provisioning Services
16.3.2 Regulating Services
16.3.3 Cultural Services
16.3.4 Supporting Services
16.4 Ecosystem Services of Different Elements of Riverine Landscapes
16.5 Assessment of Riverine Ecosystem Services
16.5.1 Approaches to Assess Ecosystem Services
16.5.2 Ecosystem Services Mapping and Modeling Tools
16.5.3 Significance of Ecosystem Services Assessment
16.6 Conclusion
References
17 Evaluation of Morphometric Analysis of Kharag River Basin, Odisha Using Geospatial Techniques
17.1 Introduction
17.2 Study Area
17.3 Materials and Methods
17.4 Results and Discussions
17.4.1 Linear Aspects
17.4.2 Stream Order (Sμ)
17.4.3 Stream Number (Nμ)
17.4.4 Stream Length (Lμ)
17.4.5 Stream Length Ratio (Lur)
17.4.6 Length of Overland Flow (Lg)
17.4.7 Bifurcation Ratio (Rb)
17.4.8 Areal Parameters
17.4.9 Stream Frequency (SF)
17.4.10 Drainage Density (Dd)
17.4.11 Drainage Texture (Dt)
17.4.12 Compactness Coefficient (Cc)
17.4.13 Shape Factors (Sf)
17.4.14 Relief Parameters
17.4.15 Relative Relief (Rr)
17.4.16 Dissection Index (Di)
17.4.17 Ruggedness Index (Rn)
17.5 Conclusion
References
Recommend Papers
![Advances in Water Resource Planning and Sustainability (Advances in Geographical and Environmental Sciences) [1st ed. 2023]
9819936594, 9789819936595](https://ebin.pub/img/200x200/advances-in-water-resource-planning-and-sustainability-advances-in-geographical-and-environmental-sciences-1st-ed-2023-9819936594-9789819936595.jpg)


File loading please wait...
Citation preview
Advances in Geographical and Environmental Sciences
Praveen Kumar Rai Editor
Advances in Water Resource Planning and Sustainability
Advances in Geographical and Environmental Sciences Series Editors Yukio Himiyama, Hokkaido University of Education, Asahikawa, Hokkaido, Japan Subhash Anand, Department of Geography, University of Delhi, Delhi, India
Advances in Geographical and Environmental Sciences synthesizes series diagnostigation and prognostication of earth environment, incorporating challenging interactive areas within ecological envelope of geosphere, biosphere, hydrosphere, atmosphere and cryosphere. It deals with land use land cover change (LUCC), urbanization, energy flux, land-ocean fluxes, climate, food security, ecohydrology, biodiversity, natural hazards and disasters, human health and their mutual interaction and feedback mechanism in order to contribute towards sustainable future. The geosciences methods range from traditional field techniques and conventional data collection, use of remote sensing and geographical information system, computer aided technique to advance geostatistical and dynamic modeling. The series integrate past, present and future of geospheric attributes incorporating biophysical and human dimensions in spatio-temporal perspectives. The geosciences, encompassing land-ocean-atmosphere interaction is considered as a vital component in the context of environmental issues, especially in observation and prediction of air and water pollution, global warming and urban heat islands. It is important to communicate the advances in geosciences to increase resilience of society through capacity building for mitigating the impact of natural hazards and disasters. Sustainability of human society depends strongly on the earth environment, and thus the development of geosciences is critical for a better understanding of our living environment, and its sustainable development. Geoscience also has the responsibility to not confine itself to addressing current problems but it is also developing a framework to address future issues. In order to build a ‘Future Earth Model’ for understanding and predicting the functioning of the whole climatic system, collaboration of experts in the traditional earth disciplines as well as in ecology, information technology, instrumentation and complex system is essential, through initiatives from human geoscientists. Thus human geoscience is emerging as key policy science for contributing towards sustainability/survivality science together with future earth initiative. Advances in Geographical and Environmental Sciences series publishes books that contain novel approaches in tackling issues of human geoscience in its broadest sense — books in the series should focus on true progress in a particular area or region. The series includes monographs and edited volumes without any limitations in the page numbers.
Praveen Kumar Rai Editor
Advances in Water Resource Planning and Sustainability
Editor Praveen Kumar Rai Department of Geography Khwaja Moinuddin Chishti Language University Lucknow, Uttar Pradesh, India
ISSN 2198-3542 ISSN 2198-3550 (electronic) Advances in Geographical and Environmental Sciences ISBN 978-981-99-3659-5 ISBN 978-981-99-3660-1 (eBook) https://doi.org/10.1007/978-981-99-3660-1 © The Editor(s) (if applicable) and The Author(s), under exclusive license to Springer Nature Singapore Pte Ltd. 2023 This work is subject to copyright. All rights are solely and exclusively licensed by the Publisher, whether the whole or part of the material is concerned, specifically the rights of translation, reprinting, reuse of illustrations, recitation, broadcasting, reproduction on microfilms or in any other physical way, and transmission or information storage and retrieval, electronic adaptation, computer software, or by similar or dissimilar methodology now known or hereafter developed. The use of general descriptive names, registered names, trademarks, service marks, etc. in this publication does not imply, even in the absence of a specific statement, that such names are exempt from the relevant protective laws and regulations and therefore free for general use. The publisher, the authors, and the editors are safe to assume that the advice and information in this book are believed to be true and accurate at the date of publication. Neither the publisher nor the authors or the editors give a warranty, expressed or implied, with respect to the material contained herein or for any errors or omissions that may have been made. The publisher remains neutral with regard to jurisdictional claims in published maps and institutional affiliations. This Springer imprint is published by the registered company Springer Nature Singapore Pte Ltd. The registered company address is: 152 Beach Road, #21-01/04 Gateway East, Singapore 189721, Singapore
Contents
1
2
3
4
5
6
7
Remote Sensing in Water Resource Monitoring a Comprehensive Review on Monitoring the Quality and Quantity of the Water Resources Using Remote Sensing Applications . . . . . . . . . . . . . . . . . . . . . . . . . . . . . . . . . . . . . . . . . . . . . . . . . . N. Priyanka, J. L. Prameena Sheeja, and G. Bhaskaran Assessment of Vegetation Dynamics of Paddy Crop Using “TIMESAT” and Remote Sensing and GIS Techniques in Command Areas . . . . . . . . . . . . . . . . . . . . . . . . . . . . . . . . . . . . . . . . . . . . S. K. Tiwari, G. Prasada Rao, and B. Sundar Assessment of River Water Dynamics and Optically Active Water Quality Parameters Over Punjab, Based on Cloud Computing Approach . . . . . . . . . . . . . . . . . . . . . . . . . . . . . . . . . . . . . . . . . . Mohit Arora, Ashwin Gujarati, Sumita Chandel, and Brijendra Pateriya Analysis of Land Use/Land Cover Change and Its Impact on 2021 Chiplun Flood, Maharashtra, India . . . . . . . . . . . . . . . . . . . . . Pranaya Diwate, Rishikesh Golekar, Abhijeet Ambadkar, Pawan Kumar, and Varun Narayan Mishra
1
23
39
65
Flood Disaster Hazards: A State-of-the-Art Review of Causes, Impacts, and Monitoring . . . . . . . . . . . . . . . . . . . . . . . . . . . . . . . . . . . . . . . Soumyashree B. Tillihal and Anoop Kumar Shukla
77
Impact of Land Use Systems and Climate Change on Water Resources: Indian Perspectives . . . . . . . . . . . . . . . . . . . . . . . . . . . . . . . . . Subhashree Patra, Shilky, Amit Kumar, and Purabi Saikia
97
Seawater Intrusion Mapping Along Penneru River Delta Area, SPS Nellore District, Andhra Pradesh—A Case Study . . . . . . . 111 R. Kannan, Abhrankash Kanungo, M. V. Ramana Murty, and B. Sundar v
vi
Contents
8
Flood Detection and Flood Mapping Using Multi-temporal Synthetic Aperture Radar and Optical Data . . . . . . . . . . . . . . . . . . . . . 135 Bhawi Shankar, Swagata Ghosh, Varun Narayan Mishra, Maya Kumari, and Udham Singh
9
Climate Change and Its Impact . . . . . . . . . . . . . . . . . . . . . . . . . . . . . . . . . 153 Shweta Singh, Soubhagya Keshari Chand, Swadhin Kumar Nayak, and Sasmita Chand
10 Impact of Land Use Changes on Water Resource: Assessment Through Remote Sensing and Geographical Information Systems (GIS) . . . . . . . . . . . . . . . . . . . . . . . . . . . . . . . . . . . . . . . . . . . . . . . . . 169 Sunita Singh and Rajani Srivastava 11 Vulnerability to Climate Change in Different Sectors of Lug Valley, Kullu District of Himachal Pradesh . . . . . . . . . . . . . . . . . . . . . . 183 Twinkle Thakur, Kesar Chand, J. C. Kuniyal, Suraj Kumar Singh, Shruti Kanga, and Gowhar Meraj 12 Assessment of Groundwater Level and Fluctuations Using Geospatial Techniques in Nambiyar Watershed, South India . . . . . . 203 R. S. Libina, K. Prakash, R. Jegankumar, S. P. Dhanabalan, and M. A. Arya 13 River Flood Monitoring and Management: A Review . . . . . . . . . . . . . 223 Soumyashree B. Tillihal and Anoop Kumar Shukla 14 Evaluation of Groundwater Quality for Irrigation-A Case Study of West Godavari District of Andhra Pradesh . . . . . . . . . . . . . . 239 P. Mohan Rao, P. Venkata Subbaiah, Y. Sudha Rani, P. Prasuna Rani, A. Sambaiah, and R. Kannan 15 Interactions of Hydrological Parameters and the Effects on Perennial Riverbanks of the Indo-Bhutan Region in Eastern Himalaya . . . . . . . . . . . . . . . . . . . . . . . . . . . . . . . . . . . . . . . . . . . 253 Pankaj Roy 16 Ecosystem Services in the Riverine Landscapes . . . . . . . . . . . . . . . . . . 273 Amit Kumar Tiwari, Rinku Singh, Sudhanshu Kumar, and Gopal Shankar Singh 17 Evaluation of Morphometric Analysis of Kharag River Basin, Odisha Using Geospatial Techniques . . . . . . . . . . . . . . . . . . . . . . . . . . . . 305 Ramesh Kumar Patel, Vineet Kumar Rai, Dhiraj Kumar Sharma, and Satya Prakash
Chapter 1
Remote Sensing in Water Resource Monitoring a Comprehensive Review on Monitoring the Quality and Quantity of the Water Resources Using Remote Sensing Applications N. Priyanka, J. L. Prameena Sheeja, and G. Bhaskaran
Abstract Remote sensing is used for capturing the earth observations whereas the place is not easily accessible to the humans. The remote sensing satellite images are widening its application day by day. The geo-synchronous and geo-stationary satellites are placed on different altitudes to observe the electromagnetic spectrums from the earth. The active sensors emit its own energy for receiving signal while passive sensors are only illuminating with the sun light source. Radiometric, spectral, spatial, and temporal resolution possess the quality of the image even the specification of the sensors in the satellite. The satellite images and its resolution vary from 10 cm to 30 m. The multi-date remote sensing satellite images are recording the signals as observations from the planet for the specific time period continuously. The analysis of water mask data, spatio-temporal distributions of surface water and ground water, the morphometric analysis, surface and ground water interactions, potential evapotranspiration (PET), watershed delineation, groundwater table fluctuations, water quality, other spectral indices related to water resource analysis, etc. Due to rapid urbanization, the water resources are getting polluted by domestic and industrial wastes which lead to water-borne diseases. Increasing demand for water causes interstate disputes and agricultural loss occurs due to lack of proper irrigational process in the land. The water resources are either highly exploited or polluted because of poor governance and mismanagement of stake holders in the local community. Apart from rejuvenating and conserving the water resources continuously, monitoring and managing the demand is highly recommendable for sustainable development. Monitoring the quantity and quality of the water resources through remote sensing will N. Priyanka (B) · J. L. P. Sheeja · G. Bhaskaran Centre for Water Resource Management, University of Madras, Chennai, India e-mail: [email protected] G. Bhaskaran Professor and Head i/c of Centre for Water Resources Management, University of Madras, Guindy, Chennai, India © The Author(s), under exclusive license to Springer Nature Singapore Pte Ltd. 2023 P. K. Rai (ed.), Advances in Water Resource Planning and Sustainability, Advances in Geographical and Environmental Sciences, https://doi.org/10.1007/978-981-99-3660-1_1
1
2
N. Priyanka et al.
derive the output more accurate and it will be applied to the decision-making system of various fields such as drought risk assessment, food security, water scarcity, flood risk zone, floor space index (FSI), and reconnaissance drought index (RDI). The remote sensing applications in water resources intend to analyze the hydrology, meteorology, and agronomy. The geospatial database is used to quantify and check water quality parameters for the conservation of water resources. Keywords Water resources monitoring · Remote sensing satellite · Quantity and quality assessment · Water conservation · Water pollution
1.1 Introduction The specific advantage in remote sensing is its continuity of data collection, with the set of records the land and other feature patterns and variations has identified and discussed. Remote sensing acts like a powerful tool for an identification of resources status (Singh et al. 2021). The timely data is helpful to analyze the change matrix, trend analysis, and pattern estimation. The remote sensing is providing ample of data collection in the fields of hydrology. The water studies are developing its approaches and techniques due to lack in dataset analysis and models are not satisfied. The development in remote sensing can only be a possible way to attain and access new methodologies to locate, measure, and analyze the waterbodies. The term hydrology describes studying the water resources is classified into three categories, surface water, ground water, and water quality. The interferometry of available water resources can delineate the watershed and its characteristics in detail. Remote sensing is a large platform for achieving the SDG in the nation. The sustainable development is the way to conserve and rejuvenate the resources in the country. Water resource management is the most essential topic for future research and many studies. A geospatial dataset is analyzed to measure, predict, and precautionary actions for natural hazards (Rai et al. 2021). Developed and even undeveloped nation also can access and study their land resources using the remote sensing. The world is facing drastic water demand and management due to climatic changes. It should be sorted out and planning should be done in sustainable manner for utilizing the resources efficiently. The water resources should be continuously monitored and manipulated to avoid losses using remote sensing data. The remote sensing data is classified into point, line, and polygon features with spatial reference. The data capturing, managing, and displaying is the great deal in earlier times. The data storage and temporal data collection are needed to be classified and set up for future reference. In the modern technology, especially in the hydrological process, there is continuous changes over detecting the waterbodies with various spectral bands (Rai et al. 2014). Variables are related to water resources for analyzing indirectly only for imaging the water pixels in earlier time. The lake and reservoir level water fluctuation data is available nowadays. Many newly invented missions and their sensors are highly capable of recording the spectral signatures
1 Remote Sensing in Water Resource Monitoring a Comprehensive …
3
and identify the land features more specifically in future (Engman 1996). Monitoring the precipitation, soil moisture, evapotranspiration, surface water extent and depth, groundwater level, drought, and vegetation are the certain parameters to analyze the water resource management in the region. The metrological data, altimetry data, and water masking data are correlated and an output of water level is derived. When handling the big data, it may cause errors and missing. The challenges on managing the big data are calibrated with latest models and statistical observations for the acquisition of accurate data. The temporal, atmospheric, and spectral corrections are sorted out before applying to the model (Sheffield et al. 2018).
1.2 History of Remote Sensing Photography to sensing, defense to research is the acronym for history of remote sensing. An object without any physical contact sensing its information is popularly known as remote sensing. The remote sensing is considered as the hint taking from Mother earth as a data and it is interpreted for solving the problems. In earlier times remote sensing is a scientific thing it includes with many components to function. The remote sensing is set about 1840s almost 18 decades knowing the information from far distance is recorded. The purpose of the institute is to acquire information for the defense and it is slowly developed and broadens its application in various fields. The photographic camera is the dominant tool which is insisted to capture pictures, only the carrying platforms and altitude is changing periodically. Balloons, birds, aircraft, and space craft are used for capturing the land for analysis. The aerial photographs are mainly interpreted for defense purpose; in 1850s and 60s, army balloons (Fig. 1.1) were used to capture photographs. After the First World War, the photographs are mounted on the aircrafts and slowly applied for land measurement. In 1950, color films are inserted into the cameras. To improve quality the data is recorded by electromagnetic radiation using sensors for largescale to small-scale capture in 1964. Following that several missions with various specifications are launched and provide datasets for research purpose (Moore 1979).
Fig. 1.1 Credit—NASA
4
N. Priyanka et al.
1.3 Revolution of Remote Sensing and Its Application to the Water Resource Management The remote sensing is capable of receiving the signals from land surface in regular basis. The hydrological portions are hard to identify and commonly the features are required to interpret through numerically and it has some repetitions. The water bodies are detected by its adjacent land cover only and followed by that many statistical analysis and calculations are done. There are three common wavelengths used and with the different combination of the wavelengths the land features are identified and measured. Combination of wavelength
Application
Thermal infrared
Surface temperature
Microwave
Soil moisture
Microwave and visible
Snow
Visible, infrared, and microwave
Vegetation
Visible and thermal
Components of energy balance
Schmugge and Gurney (1988)
An EMR (electromagnetic radiation) from the earth surface is used to measure the physical, chemical, and ecological condition. The remote sensing is highly concerned about the hydrological studies such as surface, ground water level, and quality for monitoring and planning the future scenario (Moore 1979). In earlier times, the hydrologist and other water studies-related researches are struggling with the available dataset which include many steps to process and access the data. The waterbodies are not clearly captured and only with the other land features the water resources are estimated and identified with the adjacent and ecological applications to the image. Even though after the setup of Sonar, Radar, and LIDAR sensors, the surface water bodies like rivers, lake, pond, stream, etc. are hard to identify and delineate from the vegetation land. The flooded areas are identified with the dark patches which are usually low in reflection using this hint the flooded areas are classified (Wiesnet et al. 1979). Remote sensing is excessively helpful to record and monitor the changes on water resources by space and time. The active sensors are sending its own energy to receive signals, meanwhile the passive sensors are using the natural sources and it can receive signal only during day time. Lower to higher resolutions are developed and produced in various fields of accurate data. The remote sensing dataset proved that it can provide water quality data with the texture, color, and other physicochemical parameters (Ritchie et al. 2003). The remote sensing contributions especially by Canadian are remarkable, especially in hydrology studies from 1995 to 1999, the different kind of dataset in the field of water resources is playing a vital role to monitor the watershed management. As they highlighted that in future, the hydrosphere and cryosphere radiometric studies can help for more ideas on hydrological observations in the concern of the hydrological data being not directly provided (Pietroniro and Leconte 2000).
1 Remote Sensing in Water Resource Monitoring a Comprehensive …
5
Surface water bodies are measured by its spatio-temporal variations. The lake and river level water monitoring is possible with Cryo-Sat-2 using radar altimetry for hydrological modeling. It has been included with an instrument called SIRAL (synthetic aperture interferometric radar altimeter). Comparing with other altimetry satellites it provides accurate data of observing 65% of global fresh waters with an altitude of 720 km from land. The dataset helps to analyze the trend analysis of lake and river estimation, masking, and filtering. The Cryo-sat-2 satellite is much better than Envisat by validating using RMSE values. Even the smaller area lakes are identified and monitored by Cryo-Sat-2 (Jiang et al. 2017a, b). The surface water bodies are transported into atmosphere and that process is known as evapotranspiration. The water budget concept is varying with volumetric analysis and it is calculated by different equations and in particular the (P-E), where P stands for Precipitation and E for Evapotranspiration. Numerical Weather Prediction models have been developed using the provided dataset from COSMO-REA6. It deals with the land and atmospheric interactions and anthropogenic impacts to the ecosystem (Springer et al. 2017). Using SMOS mission, the surface water extension and flood estimates are predicted and validated with other products of altimetry, land cover classification, and dynamic surface water. The Amazon River Basin and surface water pixels from SWAF product are validated and it provides multi-angular and both H and V polarization modes for accuracy (Parrens et al. 2017). The space-borne imaging radar can contribute to identify the subsurface water resources. In deserts popularly known as Oasis which are temporarily situated mostly arid regions are having subsurface waterbodies. SAR data provides coarse of topography, soil and moisture content. They insisted the point that L-band radar is penetrating for 2 m in dry sand than P-band but it possesses higher capability to penetrate for 5 m (Philippe Paillou 2017). Following by arid region case the non-perennial rivers are not monitored and considered. Sentinel-2 with average resolution provides the temporal variations of the non-perennial rivers. The detection of the surface water pool areas is derived using various spectral indices and waterbody extraction, which possess more accuracy than Landsat-8 imageries while validating the results (Seaton et al. 2020). The Sentinel-1 (SAR) data is showing a higher accuracy than comparing with Landsat imageries surface water body extraction. The Mekong Delta is taken as study area the tropical region where the climatic changes are severe and high-resolution data is lacking. Estimation of surface water bodies using trained neural network system is included with angle, SD, and coefficient of polarization of SAR data (Binh Pham-Duc et al. 2017). The lake-level monitoring and the waterbodies change detection analysis using Landsat imageries. The consequences of climatic changes and anthropogenic activities, especially dam construction, are discussed in detail. The three neighboring lakes and its temporal changes are detected using multi-dated satellite image with SRTM and climate data. A lake which is located or it insists to supply for the urban needs is highly driven of its sources due to increase in demand (Taravat 2016). Monitoring the water bodies playing a vital role to maintain the status
6
N. Priyanka et al.
and some expertise satellite’s are EOS, Ikonos, Sea-WiFS, MOS, etc., are specifically imported with the improved spatial and spectral resolutions are observing the water texture, color, like physical, chemical, and biological characteristics of water bodies. The water quality is even accessed with its ecological condition and anthropogenic activities. The lake Chicot, Arkansas is analyzed using Landsat TM images for identifying its sediments and quality (Ritchie et al. 2003). The Australian Water Resources Assessment system is mainly contributing to avail multitemporal data for applying in various fields. Due to the resolution and atmospheric error the waterbodies require inclusion of more methodologies and models (van Dijik et al. 2011).
1.4 Surface Water Monitoring The lake-level monitoring is explaining the water clarity from high-resolution data provided by IKONOS and Quick Bird II. Even the smaller lakes have been identified and monitored than Landsat imageries. The information provided by the satellite images are more specific in identifying wetlands, lakes, and vegetation cover. Applying in the appropriate field of the different remote sensing satellites is most important factor to get accurate result (Sawaya et al. 2003). Water budgeting is the upgraded stage of hydrological studies. The present and future prediction of water level and budget is manipulated with the remote sensing observation. Apart from direct observation, the models involve scientific and statistic equation. In this study, the merits and demerits on water resource monitoring are discussed in detail. GLDAS, CLSM, and Noah which are compared and expressed in model description (Deliry et al. 2022). Evapotranspiration contains a sum of water loss during certain period of time. The thermal microwave bands are providing data to image the heat fluxes in the region. Assigned models to calibrate the reflections in different seasons. Apart from water level and budgeting the water transpiration is measured and monitored using remote sensing techniques and it has validated and retrieved its output with the help of GIS (Aryalekshmi et al. 2021). Following by the above reference, the daily evapotranspiration monitoring for water resource management in arid ecosystem is evaluating for sustainable water resource strategy. Correlation between the AATSR and MERIS sensors at Nile Delta Region and Wadi is analyzed validated with ground truth. Evapotranspiration data helps to identify the rate of water vapour released from surface to atmosphere through plants. The daily observation will help to accurately access the spatial variation and dynamics of maximum temperature values. It helps to access the crop suitability, irrigation management, and farming land planning which are well planned (Elhag and Bahrawi 2017).
1 Remote Sensing in Water Resource Monitoring a Comprehensive …
7
1.5 Groundwater Monitoring The groundwater monitoring measures have been analyzed with questionnaire from 40 countries of 6 continents. The questionnaire has further classified into four groups, monitoring activities national level, surface water quality monitoring, groundwater quality, and quantity monitoring. The stakeholder participation and local bodies authorization on groundwater monitoring show that some of the countries not include appropriate monitoring networks (Mohan et al. 2011; Mishra et al. 2021; Rai et al. 2017, 2021; Rai et al. 2021). The direct survey and aspects are analyzed and accessed for groundwater quality and quantity. The sea water intrusion on coastal sides is caused and influences are addressed (Jousma and Roelofsen 2004). The groundwater is the more essential freshwater resources which increase the land potential. The geostatistical tools should be developed for accessing the aquifer properties and monitoring the system. By comparing the optimized and statistics data in the Maheshwaram catchment is not matched. It indicates that the PCP analysis depends more on configuration for groundwater quality assessment. The study area is located at the semi-arid region and there is no perennial river. The heterogeneous variables may cause the change in values and the water resources are driven by the agricultural and industrial purposes (Nabi et al. 2011). Surface and groundwater are interconnected and they both impact together. The water shortage, stress, and scarcity are varying depending upon their intensity and temporal difference. The groundwater level and quality is correlated with the surface water resource and other resource variables. The SDG has insisted water stress aspects to overcome with scarcity in the region (Vanham et al. 2018). The agriculture demand and groundwater level and its status are correlated and analyzed using latest software HidroMORE. It can estimate and calculate the current status and future estimation on irrigated lands of larger area. The groundwater fluctuations and abstractions in the penetration have been discussed in detail. The remote sensing observation of direct soil and water interaction will be highly appreciable for applying the data source in the field of agriculture and groundwater monitoring (Garrido-Rubio et al. 2019). The ERS-2 SAR data product is used to access the soil and water content monitoring in an arid region at northern Negev. The water resources are driven drastically due to population growth and higher in demand on irrigation it has to be monitored for planned water supply management. The volumetric curve on reflectance of soil water content is measured and it discriminates that the data is not as much accurate for agriculture management and crop suitability analysis. The data quality is poor in micro-level study. Albedo is increased and it simultaneously decreases the specific spectral resolution in the image (Blumberg et al. 2002). The Danish groundwater policy is compared with other countries. The complicated geological parameters and climatic conditions and also the lichens affected the quality and quantity of groundwater and it has major discussions for adaptive measures. The 99% of water demand is extracted from ground water in the Denmark. Countries similar to Denmark have to develop the groundwater quality and quantity monitoring programs to balance the table (Lisbeth Flindt Jorgensen 2008). The different hydrogeological units have been
8
N. Priyanka et al.
listed with different variables and groundwater yield data is manipulated. The groundwater monitoring network analysis has examined groundwater table level and timely change analysis. The groundwater resources are having periodical changes and it suggested to construct more groundwater monitoring stations for better observations (Jha and Chowdary 2007).
1.6 Water Quality Monitoring The water quality analysis is especially set up for finding the solution of continuous deterioration of eutrophication process on water resources. The different types of spectral waves and its applications are tabled for reference. The remote sensing dataset is time and cost concerning. The spectral reflectance of water bodies and its components is discussed in detail. According to the water depth, the water reflection varies and the climatic factors cause the quality of the satellite images. The physical, chemical, and biological components are the major factors for remote sensing data. In this study, the point highlighted, “data collection have changed from precision to adequacy” (Seyhan and Dekker 1986). Only with the remote sensing images the water quality condition status and estimation is possible. A case study of the Flaming Gorge Reservoir is analyzed using Landsat imageries at 1982. Using the spectral bands of green, red, and near infrared, the water quality parameters are tested using different algorithms. The different time period data is tabled and the water quality changes are monitored continuously. The result is stating that except the atmospheric error the values are satisfied and analyzed the water status in the reservoir (Verdin 1985). An ecological nature of waterbodies, BOD and COD are the most common aspects for analyzing the water quality. The collected data is measured with water, the Secchi disk. Using R-techniques the in situ and spectral indices are correlated. The result showed that except chlorophyll-a the values are worked out and even it took many steps and algorithms to prove. It highlighted the seston concentrations have to be improved in future analysis (Mittenzwey et al. 1988). Lakes in Finland are monitored and compared with the values of AISA imaging spectrometer observations and in situ water quality sampling stations. The study is aimed to evaluate the estimation accuracy of satellite data and sample collected from stations. The quality test for chlorophyll-a concentration is manipulated for the lakes. The remote sensing data is affected by both the humic and trophic state of lakes (Pulliainen et al. 2001). Landsat ETM data is used to test the quality parameters like chlorophyll-a, suspended solid matter, Secchi disk, and total phosphate at Omerli Dam. The collected satellite data is applied into the formula for water sample testing the reflect band of first four is used to retrieve the quality parameters. Using regression analysis the quality parameters are tested with R-square and it reveals that except chlorophylla rest of other parameters obtain higher accuracy (Alparslan et al. 2007). The same analysis is tested for EC, TDS, SPM, and chlorophyll-a using RapidEye data. The in situ parameters and satellite results are calculated with further algorithms and
1 Remote Sensing in Water Resource Monitoring a Comprehensive …
9
indices only. The correlation showed that the spectral bands are providing highresolution data to the smaller lakes in the region (Yigit Avdan et al. 2019). There are 25 water quality parameters which are tested and the data is fitted to ANN. The three factor analysis is delineated between WQ parameters such as water pollution, turbidity, and fertilizers. The results also satisfy the spectral bands of Landsat TM imageries (Kumar et al. 2016). The lab testing required man power, containers, and cost-effectiveness. Thus, the Landsat-8 free cost remote sensing satellite imageries should be efficiently applied. The CNN model is introduced to classify the WQ classification at the two lakes in China. The result is showing that Erhai Lake is deteriorated with the agricultural and human wastage. The Chaohu Lake is domestic and wastewater deteriorated the lake and the algal bloom coverage is identified (Pu et al. 2019). The MERIS spectral bands insist on atmospheric correction as it is obtained at Top of Atmosphere (TOA). The result is indicating the phytoplanktonic quantities and the blooms are detected. The study highlighted that the Alqueva Reservoir bloom occurred frequently since the date. The various water quality parameter analyses are conducted and the chlorophylla concentration is represented in scatter plot for correlation coefficient, RMSE and NRMSE (Potes et al. 2011). PRISM data is providing high-quality results at San Francisco Bay—delta estuary. The direct and continuous anthropogenic interactions are higher and the river is max demandable for its freshwater source. The continuous water quality of that study site is expected for the health concern of the local community in the region. The highresolution data and sample collections are correlated and analyzed with different water quality parameters. The seawater intrusion is the major factor and it has to be monitored and maintained properly (Fichot et al. 2016). The Water Quality Index (WQI) using linear regression model is predicting the surface water status. The study area is Medrano Creek and Argentina using the Landsat 7 ETM data the water quality parameters are analyzed. The remote sensing data is helpful for analyzing the causes of the water pollution and detour. The anthropogenic activities and land cover changes influence the major impacts on the water resources. The spectral bands of blue, green, and red are providing the satisfactory results that the color dyeing is highly polluting the water. The water quality improvement is highly recommendable to this creek and accesses the pollution chart (Vignolo et al. 2006).
1.7 Water Crisis and Consequences In the worldwide water crisis is an severe issue thus, the water supply and demand is correlated in different aspects. The calculation of water supply is manipulated using the spectral indices of remotely sensed satellite images. The condition and the population decide the distribution and capacity of the water availability. The quantitative analysis of the water availability in the region is indicating the scarcity status (Sunarta and As-Syakur 2015). Water crisis is majorly caused due to lack in runoff conservation and rainwater harvesting management. The weighted spatial
10
N. Priyanka et al.
probability modeling is used to determine the potential areas for integrated multidisciplinary water resource management. As the study is majorly contributing for hydrological modeling, the land parcels are classified into watershed. Each watershed characteristic impacts the result for further analysis (Elewa et al. 2013). The groundwater exploitation and surface water reduction are rapidly increasing and it is monitored and observed with the help of remote sensing data. The different physical aspects of the land are analyzed and the water availability in the region is observed. The water resource development action plan is done by accurate and continuous available data. The water holding capacity of the percolation tanks and recharge wells should be maintained properly for conserving the freshwater (Rokade et al. 2004). Country like China highly involving with agricultural activities insists high demand of water resources for irrigation. The water management directly and indirectly depends on climate change and anthropogenic activities. ET is estimated by the Surface Energy Balance Algorithm for land (SEBAL) using Modis data. The ET is indicating the significant land use pattern and climate change for the given time period. The monthly variables of ET are manipulated and validated with the model. The different land aspects and amount of ET are derived and estimated for future rejuvenation planning. The water development insists to work with the causes for reduction of water resources in the region (Yang et al. 2012). The global food security requires the linkages between water supply and demand. The increasing population is demanding the basic needs and it is not spatially distributed. The development of food and water supply is highly impacted due to the increase in income growth. The developed countries are balancing the food supply and water demand with well-developed planned policy (Hanjra and Qureshi 2010). Science and technology is immensely providing solutions to the natural calamities. Using GIS and remote sensing the problem is identified and analyzed with appropriate modeling and validated. The water resources depletion causes and intensity are measured and derived for end user. The footprint of water bodies and the current status and future estimation can be possible. Many international and national organizations are highly concerned about the geo-informatics and its indeed applications. The conservation and rejuvenation methods can be framed to conserve the surface and ground waterbodies using high-quality data and new emerging models (Elena Lopez-Gunn 2008). The morphometric analysis is the study of formation of land structure. It is important to study the topographic nature of the land. Velocity and magnitude of the running water fix the land carving and rock disintegration. The eminent data sources are used to study the drainage pattern in the basin and the other geological aspects. The delineation of watershed is used for observing its characteristic using remote sensing data for the water resource management (Singh et al. 2003). Land use land cover changes are highly impacting on water resources. The groundwater potential zoning is manipulated using multi-criteria analysis at the coal mining area. The analysis is taken over from 1972 to 1998 using GIS approach with spatial data. The drainage, geomorphology, land use, geology, and lineament are taken as groundwater zoning parameters. The 26-year remote sensing data is helped to manipulate the different aspects for prioritizing the aquifer status in the region (Sikdar et al. 2004). High exploitation of groundwater causes major distractions to the region. The
1 Remote Sensing in Water Resource Monitoring a Comprehensive …
11
delineation of groundwater potential zones is using AHP using remote Dem data. The elevation, drainage pattern, and other aspects are derived and input into the multi-criteria decision system. Landsat, Sentinel, SRTM, and geology dataset are used for the GIS modeling to identify the groundwater potential zones (Al-Djazouli et al. 2021). The spatial evidence is very much helpful to access and analyze the rapid urbanization, land use transformation, and its impact on water resources. No spatially distributed water resources are situated and it causes major challenges on water supply and sharing between states and even with same state. The government policy should expect more specific than general basis. The unequal distribution of water resources creates water supply mismanagement in the same district or city. The pulling factors of urban city are the prime victims of water crisis. Metropolitan cities in India like Delhi, Mumbai, Chennai, etc. are facing many challenges on resource supply and management. The demographic and spectral data could be combined and analyzed for proper water supply network in the city (Biswas and Gangwar 2021). The water-related issues can be sort out only with the help of water studies and the supporting tool of remote sensing. Major water crisis are caused due to inadequate water supply chains, inconsistent climate, and anthropogenic activities. The geophysical parameters and climatic condition are not same globally. The most common methodologies by worldwide is required for long time analysis for specific classification between countries. The UNICEF, WHO, and other organizations are working on influence made by water crisis such as pollution, diseases, sanitary, and basic development indeed. The natural disasters and climatic changes are directly and indirectly caused due to the surface and groundwater table level depletion in general (Sivakumar 2011). Since 2010, the very extreme condition scarcity which is termed as Mega-Drought (MD) is experienced by Chile. The analysis is highlighting the frequent agricultural activities and MD conditions cause water crisis in the region. The precipitation analysis and surface water change detection analysis are carried out. The study highlights that the improper water management, climatic calamities the MD is situated and it is accurately validated with RMSE model and dramatic fluctuations has shown with Google Earth (Munoz et al. 2020).
1.8 Selected Countries and Development in Remote Sensing Developing nations are the prime victims on the water scarcity. Even with many developed innovations and technical improvement, the states are facing many challenges with inconstant nature. In India, population growth is the major drawback in the sense of resource management. The multidisciplinary state should possess clear technical impediments. The remote sensing and GIS are facing many challenges to acquire accurate data for the analysis. In the sense of waterbodies, the groundwater monitoring is a highly challenging thing for direct observation of data. The groundwater studies require many algorithms and modelings to derive the status in the region. Remote sensing data is dealing with high efficient task for hydrogeological
12
N. Priyanka et al.
studies and other hydrological units due to cost efficiency, manpower, time management, etc. (Jha and Chowdary, 2007). The Virtual Water (VW) trade is associated for food and water. The international markets are dealing with the nations which are poor with water resources and the countries which are failed in crop productivity due to any factors. The water and food exchange policy is max sensible to apply. The CWSI combines the quantitative and water economics in different countries. The physical parameters and economic scarcity are classifying the countries from high to low, the values with scale (Vallino et al. 2021). United States is the leading country in satellite industry. It sustains the prime position of invention and development till date. The satellite system is developed for defense purpose and now which is the highly demandable economic department worldwide. High investments are the major reasons for US and it return backs them very beneficiary in the field. Russian datasets are having different resolutions and applied for various applications. The combined different datasets have been assigned in different fields. The particular and required spectral bands are analyzed and utilized. The different land classes such as Built-up, Waterbodies, Forest, Burnt area, and other features specifically forest fire which are not actually captured with 1 km resolution in detail. Thus, the combination of bands helps to analyze small-scale description in the region (Schepaschenko et al. 2011) (Isaev et al. 2002). The freely available Russian dataset is used to observe the forest land cover change worldwide and validated with the primary data source from forest authority. The SFR is outdated and the European part of forestry is not resulted accurately. Highlighted that to develop the new system for forest land cover observations (Schepaschenko et al. 2015). Earlier times the US has emerging the new innovations in the field. The microwave remote sensing satellite with advance sensing tools helps to monitor and analyze the land use cover, soil moisture from 1983 onward (Vinnikov et al. 1999). The US remote sensing satellite imageries are used to estimate the particles which are 16 days). The detail of the comparison is given in Table 2.1.
Fig. 2.13 Dates of paddy transplantation, peak growth, and harvesting stage at Mandal level in 2018–19
Table 2.1 Difference in days executed from MODIS (TIMESAT analysis) and Sentinel-1 SAR data No
Difference in days (Transplantation)
% of Mandals in Kharif , 2017–18
% of Mandals in Kharif , 2018–19
Mean
1
0–8
73.1
68.9
71.0
2
>8 16
1.2
2.4
1.8
36
S. K. Tiwari et al.
2.6 Conclusion TIMESAT with 8-day composite NDVI data has shown the capability to identify the date of transplantation, peak growth, and harvesting stage. TIMESAT can provide more precise information about the date of transplantation and growth stages if provided with high temporal resolution data (daily observation satellite data). The accuracy of the dates derived from 8-day composite NDVI data has been compared with Sentinel-1 SAR data and observed that more than 71.0% Mandal has fallen in the window of 0–8 days variability. Accurate estimation and monitoring of rice phenology are necessary for command areas for the management of irrigation water such as “when to irrigate” scheduling the release of irrigation water based on phonological growth of paddy crop which may help to optimize the use of precious water and also improve the productivity of the crop. Funding This study has been done as an in-house research project.
References Balachandran S, Geetha B, Maragathavel D, Thampi SB, Reddy YK, Sudevan S, Metri SM (2017) Regional report on southwest monsoon –over the southern peninsular India. Indian Metrological Department, Govt. of India Bouvet A, Le Toan T, Lam-Dao N (2009) Monitoring of the rice cropping system in the Mekong delta using ENVISAT/ASAR dual-polarization data. Ieeetrans. Geosci. Remotesens. 47:517–526 Chakraborty M, Panigrahy S, Rajawat AS, Kumar R, Murthy T, Haldar D, Chakraborty A, Kumar T, Rode S, Kumar H, Mahapatra M, Kundu S (2013) Initial results using RISAT-1 C-band SAR data. Curr Sci 104:490–501 Francis C, Shang J, Liu J, Huang X, Ma B, Jiao X, Geng X, John MK, Dan W (2017) Tracking crop phenological development using multi-temporal polarimetric Radarsat-2 data. Remote Sens Environ Holben BN, Tucker CJ, Fan CJ (1980) Spectral assessment of soybean leaf area and leaf biomass. Photogram Engr Remote Sens 46(5):651–656 IRRI (2006) Bringing hope, improving lives: Strategic Plan 2007–2015. Manila, 61 p. Justice CO, Vermote E, Townshend JRG, Defries R, Roy DP, Hall DK, Salomonson VV, Privette JL, Riggs G, Strahler A, Lucht W, Myneni RB, Knyazikhin Y, Running SW, Nemani RR, Wan ZM, Huete AR, van Leeuwen W, Wolfe RE, Giglio L, Muller JP, Lewis P, Barnsley MJ (1997) The moderate resolution imaging spectroradiometer (MODIS): land remote sensing for global change research. IEEE Trans Geosci Remote Sens 36:1228–1249 Motohka T, Nasahara KN, Miyata A, Mano M, Tsuchida S (2009) Evaluationofopticalsatelliteremotesensing for rice paddy phenology in monsoon Asia using a continuous in situ dataset. Int J Remotesens 30:4343–4357 Peng D, Huete AR, Huang J, Wang F, Sun H (2011) Detection and estimation of mixed paddy rice cropping patterns with MODIS data. Int J Appl Earthobs Geoinf 13:13–23 Per Jonsson and Lars Eklundh (2004) TIMESAT—a program for analyzing time-series of satellite sensor data. Comput Geosci 30(2004):833–845 Regional Report on Southwest Monsoon (2018) Over The Southern Peninsular India. Indian Metrological Department, Govt. of India
2 Assessment of Vegetation Dynamics of Paddy Crop Using “TIMESAT” …
37
Rouse RWH, Haas JAW, Deering DW (1974) Monitoring vegetation systems in the great plains with ERTS third earth resources technology satellite-1 symposium- Volume I: Technical Presentations, NASA SP-351, pp 309–317 Sakamoto T (2005) A crop phenology detection method using time-series MODIS data. Remote Sens Environ 96:366–374 Savitzky A, Golay MJE (1964) Smoothing and differentiation of data by implified least-squares procedures. Anal Chem 36:1627–1639. https://doi.org/10.1021/ac60214a047 Tian H, Wu M, Wang L, Niu Z (2018) Mapping early, middle and late rice extent using sentinel-1A and Landsat-8 data in the poyang lake plain. China. Sensors 18:185 Tucker Red CJ, and photographic infrared linear combinations for monitoring vegetation Remote Sens. Environ 8:127–150, https://doi.org/10.1016/0034-4257(79)90013-0 Vermote E (2015) MOD09Q1 MODIS/terra surface reflectance 8-day L3 global 250m SIN Grid V006. NASA EOSDIS land processes DAAC. Accessed 2019–12–12 from https://doi.org/10. 5067/MODIS/MOD09Q1.006 Wang J, Huang J, Wang X, Jin M, Zhou Z, Guo Q, Zhao Z, Huang W, Zhang Y, Song X (2015) Estimation of rice phenology date using integrated HJ-1 CCD and Landsat-8 OLI vegetation indices time-series images. J Zhejiang Univ Sci B 16:832–844 Wang H, Chen J, Wu Z, Lin H (2012) Rice heading date retrieval based on multi-temporal MODIS data and polynomial fitting. Int J Remotesens 33:1905–1916 Yang Z, Shao Y, Li K, Liu Q, Liu L, Brian B (2017) An improved scheme for rice phenology estimation based on time-series multispectral HJ-1A/B and polarimetric RADARSAT-2 data. RemoteSens Environ 195:184–201 Zhang X, Friedl MA, Schaaf CB, Strahler AH, Hodges JCF, Gao F, Reed BC, Huete A (2003) Monitoring vegetation phenology using MODIS. Remote Sens Environ 84(2003):471–475 Zhang Y, Liu X, Su S, Wang C (2014) Retrieving canopy height and density of paddy rice from Radarsat-2 images with a canopy scattering model. Int J Appl Earthobs Geoinf 28:170–180
Chapter 3
Assessment of River Water Dynamics and Optically Active Water Quality Parameters Over Punjab, Based on Cloud Computing Approach Mohit Arora, Ashwin Gujarati, Sumita Chandel, and Brijendra Pateriya
Abstract Remote sensing approach along with high-end computational resources offers multiple observations for mapping and monitoring river water dynamics and water quality parameters with high spatial and temporal resolutions. This study used freely available high-resolution multispectral datasets for mapping and monitoring river water dynamics and optically active water quality parameters, viz., chlorophyll-a concentration and total suspended matters in Satluj and Beas Rivers over Punjab region. Methodological advances included open-source APIs like Google Earth Engine (GEE) for monitoring river water dynamics and physics-based semi-analytical inversion methods to monitor river water quality. Landsat multispectral imagery from Google Earth Engine (GEE) database has been used to derive the river water dynamics like river water occurrence, river water occurrence change intensity, river water recurrence, river water seasonality, and transition in river water class during period from 1984 to 2019 while Sentinel-2 imagery has been used to derive optical active water quality parameters for year 2019. A pixel-based classification system has been utilized to extract the water and non-water pixels and semi-analytical inversion model is used to retrieve the optical water quality parameters. The highest peak of surface water area has been observed in year 1998 and deficit peak has been observed in year 2019. The images of derived chlorophyll concentrations and total suspended matter have been found ranging from 0 to 34.28 mg/m3 and 0.01 to 147.40 g/m3 during pre-monsoon season and ranging from 0 to 34.09 mg/ m3 and 0.01 to 150.64 g/m3 during post-monsoon season. The spatial and temporal variations of water quality parameters are associated with climatic variables, rainfall and high runoff over study area, and the surrounding reasons. The rainfall in the M. Arora (B) · B. Pateriya Punjab Remote Sensing Centre, Punjab Agricultural University Campus, Ludhiana, Punjab, India e-mail: [email protected] A. Gujarati Space Applications Centre, ISRO, Ahmedabad, Gujarat, India S. Chandel Department of Soil Science, Punjab Agricultural University, Ludhiana, Punjab, India © The Author(s), under exclusive license to Springer Nature Singapore Pte Ltd. 2023 P. K. Rai (ed.), Advances in Water Resource Planning and Sustainability, Advances in Geographical and Environmental Sciences, https://doi.org/10.1007/978-981-99-3660-1_3
39
40
M. Arora et al.
Punjab state and surrounding areas is strongly occurring during the monsoon season (June to September) that delivers higher loads of suspended materials and dissolved solids into the river and these materials consequently decrease the light penetration in the river water. Water quality parameter monitoring is an important indicator to measure the productivity and eutrophication of the river water system. The decay pattern of river water and water quality changes from the newest generation of highresolution earth observation satellites can provide timely inputs and will be beneficial for researchers, scientists, policymakers, and management of water resources. Keywords Water resources · Inland water · Reservoir · Remote sensing
3.1 Introduction River water mapping, monitoring, and conservation are one of the major challenges for mankind. River water is one of the most precious and valuable natural resource on the earth and it is very essential for agricultural production, diverse habitat and ecosystem services, human beings, economic stability, and environmental health throughout the world. They play an important role in the global water cycle and also are important components of global carbon and nutrient cycles (Tranvik et al. 2009; Bastviken et al. 2011). River water extent and its storage are important to understand the water dynamics (Gujrati and Jha 2018). Monitoring river water dynamics and water quality provides insights into trophic state changes, growth and spread of aquatic vegetation, the impact of natural and anthropogenic sources of pollution, and improving the water quality (Chander et al. 2019). Monitoring and understanding of global river water dynamics and water quality changes are immensely important to scientists and policymakers for sustainable management (Rai et al. 2014, 2017a, b). India is rich in water resources being endowed with network of rivers, canals, reservoirs, lakes, ponds, etc. that can meet a variety of water requirements of the country. River water is a critical resource in semi-arid areas and about 69% of India is covered by arid, semi-arid, and sub-humid regions (UNCCD 2015). Water bodies in India have been impacted dramatically due to increasing populations; land-use land-cover changes; climate changes; increasing water demands from agricultural, industrial, and domestic water uses. The major consequences of climate change are increased temperatures/humidity; changes in precipitation and evapotranspiration patterns; increased flooding, landslide, land-use changes; and increased soil erosion and emissions of greenhouses gases (Ferrati et al. 2005; IPCC 2007; Delpla et al. 2009; Pompei et al. 2019) which directly or indirectly affect the water resources. Precipitation and surface runoff have a significant influence on river discharge and subsequent pollutant concentration in the river water (Vega et al. 1998). Water quality changes are mainly due to lack of dissolved oxygen, high nutrient concentrations, industrial influents, untreated sewerage, fertilizer runoff from agricultural lands, and urbanization of catchment areas. The largest source of water pollution in India is untreated sewage industrial effluents and injudicious use of fertilizers containing
3 Assessment of River Water Dynamics and Optically Active Water …
41
heavy metals (Agarwal and Rajwar 2010) which are directly released in the water bodies to contaminate river waters with toxic elements (Li et al. 2016). Such threats not only affect water quality but also the human health, economic development, and social prosperity (Kumar et al. 2004; Mishra and Rai 2016). In recent decades, the increasing frequency and spatial extent of harmful algal blooms in river waters have emerged as one of the most serious environmental problems (Xu and Liu 2019). Harmful algal blooms have caused the degradation of ecosystems and environments, threatened the health of human and animals, and adversely influenced the quality of drinking water and recreational use of inland waters. Punjab is predominantly an agrarian state which is highly dependent on river water for irrigation and domestic purposes in non-monsoon period and the main economic activity in the area is with chief crops being wheat, rice, cotton, etc. River water bodies in Punjab region have been impacted dramatically due to climate changes, increasing water demands from agricultural; overfertilization caused by agriculture, industrial, and domestic purpose; and large-scale land-cover and land-use changes. Satluj and Beas are the two main rivers that supply the water demands in the entire Punjab but nowadays both rivers are undergoing episodically changes and also facing the water pollution problem. A large amount of agricultural activities and industrialization of various cities of Punjab generates huge amount of waste and such wastage disposed into streams and river (Setia et al. 2020) and the same contaminated water is used for irrigation and other purposes (Alamdar et al. 2019). Water pollution threatens the sustainability of the river ecosystems and the urban areas alongside the river. Escalating natural as well as anthropogenic activities and water pollution issues suggests the needs to perform integrated and regular river water monitoring as a benchmark for achieving the complete understanding and systematic water management of Satluj and Beas Rivers. The traditional in situ river water sampling and its analysis for monitoring river water are tedious, time-consuming, costly, and limited in terms of spatial coverage and temporal frequency (Cai et al. 2008). Earth observation satellites have the potential to complement conventional approaches (Singh and Rai 2017). Remote sensing is the best approach to determine the changes in the river water dynamics and water quality (Mishra et al. 2021; Rai et al. 2021 and Rai et al. 2022). A number of remote sensing sensors as well as models have been utilized widely for mapping and monitoring river water at local to global scales (Palmer et al. 2015a, b; Garg et al. 2017, 2020; Bonansea et al. 2019). Rapid development of remote sensing, especially launch of high-resolution satellites, novel algorithm development, and image processing capabilities, is an effective method that offers synoptic coverage of river water dynamics and optically active constituents. Remote sensing has faced many challenges in terms of the retrieval of physical and biogeochemical properties (Palmer et al. 2015a, b). River waters are combination of optically complex water and optically shallow water and it is a challenge to model river water (Garg et al. 2017; Chander et al. 2019; Singh et al. 2021). River water referred to as case 2 waters, as opposed to phytoplankton-dominated case 1 waters of the open ocean. The variations within case 2 waters are mostly found large and independent variations because of high concentrations of phytoplankton biomass,
42
M. Arora et al.
total suspended matters (TSM) concentrations, colored dissolved organic matter (CDOM) concentrations, and turbidity that typically do not co-vary over space and time (Odermatt et al. 2012). A number of algorithms exist for retrieving water quality parameters from airborne or space-borne missions. Many authors have used dynamic modeling and simulation approach to explore the potential of river water monitoring. Models for estimation of water constituent’s concentration are developed by using reflectance at various wavelengths in combination. The water spectral reflectance signature varies as a function of algal content, sediment load, water depth, and bottom reflectance signal. The optimal wavelength is used to measure the water quality parameters that are dependent on the substance being measured, its concentrations, and the sensor characteristics. Two types of methods: (a) empirical and (b) analytical approach are commonly used for retrieving water parameters from remotely sensed data (Wang and Yang 2019). Empirical models are most commonly used models that develop statistical relations between measured spectral properties and the measured water quality parameters (Odermatt et al. 2012). The analytical approaches are based on radiative transfer equation that uses physical modeling of light through the atmosphere, water column, surface, and bottom to simultaneously obtain water backscatter and absorption coefficient, bottom depth, and bottom reflectance. Recently many analytical and semi-analytical models are developed for inland water and these models are having several benefits which include: capable to assess water quality in remote areas, spatial and temporal coverage of satellite data over a complete geographic area of the water body. These models are based on the optical conditions of the waters and hence are referred to as optical water types (Bonansea et al. 2019). This research is mainly focused on the monitoring of river water dynamic and optical active water quality parameters, viz. chlorophyll-a concentration and total suspended matters over Punjab based on freely available high-resolution remote sensing imagery. Methodological advances included open-source APIs for monitoring river water dynamics and physics-based inversion methods to monitor river water quality. River water dynamics monitoring has been carried out with the advent of big data and GEE, and optically active water quality parameters has been carried out using semi-analytical approach. Landsat multispectral imagery (1984–2019) from Google Earth Engine (GEE) database has been used to derive the river water dynamics while Sentinel-2 imagery (2019) has been used to derive optically active water quality parameters. A pixel-based classification system has been utilized to extract the water and non-water pixels. The inversion model of water quality monitoring is essential for developing management plans. This study will support in understanding the times series behavior of river water dynamics and effect of water quality parameters on ecosystems health, human health, and management with the help of newest available techniques.
3 Assessment of River Water Dynamics and Optically Active Water …
43
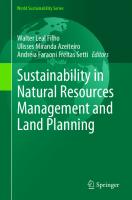
3.2 Study Area Punjab State is located in the northwest region of India. The Punjab State is covered by arid, semi-arid, and semi-humid climate zone which extends from the latitudes 29.30° N to 32.32° N and longitudes 73.55° E to 76.50° E and occupies 50,362 km2 (1.53%) of the total geographic area. The state is bounded by Jammu and Kashmir in the north, Himachal Pradesh in northeast and east, Haryana in southeast and south, Rajasthan in south and southwest, and shares the international boundary with Pakistan on western side. The entire state is a vast fertile alluvial plain formed by sediments transported by the major tributaries of the Indus. The name Punjab is made up of two words: Punj (Five) + Aab (water), i.e., land of five rivers and these five rivers are Satluj, Beas, Ravi, Chenab, and Jhelum and out of these only Satluj, Beas, and Ravi Rivers flow in Indian Punjab. The remaining two rivers lie in the state of Punjab, situated in the Pakistan. These three rivers form the basis for geologically dividing Punjab State into three regions: Majha, Doaba, and Malwa. Majha is the region located in the central parts of the historical Punjab and is split between India and Pakistan. It is situated between the right bank of the river Beas and left bank of the river Ravi. Majha Region in Indian Punjab has four districts, viz., Amritsar, Gurdaspur, Tarn Taran, and Pathankot. Doaba is also known as “Bist Doab” that lies between the left bank of Beas River and the right bank of Satluj River. Doaba Region in Punjab has four districts, viz., Hoshiarpur, Kapurthala, Jalandhar, and Shaheed Bhagat Singh Nagar (formerly Nawanshahr). Malwa is a region of Punjab located in south of river Satluj. The Malwa area makes up majority of the Punjab Region consisting of 15 districts, namely, Firozpur, Faridkot, Fazilka, Sri Muktsar Sahib, Moga, Bathinda, Barnala, Mansa, Sangrur, Patiala, Fatehgarh Sahib, Rupnagar (formerly Ropar), SAS Nagar (formerly Mohali), Malerkotla, and Ludhiana. The three perennial rivers, namely, Satluj, Beas, and Ravi along with their tributaries drain the entire state. The Satluj River is a major source of water supply for irrigation, drinking, washing, bathing, etc. which originates from Manasarover Lake in Tibet with an elevation of 5,640 m asl, enters India near Shipki La, Himachal Pradesh at 2,800 m asl (Gupta and Sah 2008), passes Punjab near Nangal, moves on to plains at Ropar, passes through districts SBS Nagar, Ludhiana, Jalandhar, Kapurthala, Moga, Firozpur, and reaches at Harike wetland (Ramsar site) before crossing over to Pakistan (Sharma et al. 2018). At Ropar Headworks, the Satluj River water flow is diverted as a canal system to provide irrigation facilities to the entire state. Satluj River is one of the tributaries of Indus River and flows up to ~1450 kms with drainage basin area coverage of 395, 000 km2 large. The total length of the Satluj River in Punjab is ~440 km and total catchment area is about 20,303 km2 . The Bhakra–Nangal Dam (the second tallest gravity dam in Asia) is built on Satluj River and located in the border of Punjab and Himachal Pradesh States in India and Bhakra Dam stores up to 9.34 billion cubic meters of water. The Beas River lies in northern India, originating from Himalayas in Himachal Pradesh, flows up to 470 km (kms) in Punjab areas before confugulating into the Satluj River at the Harike (Ramsar Site) in Tran Taran District of Punjab (Fig. 3.1).
44
M. Arora et al.
Fig. 3.1 Study area of Punjab region with elevation data and well-connected river, stream, and drainage (represented with gray color)
The river enters Punjab at Talwara, where Pong Dam has been constructed over the river and major portion of the water is diverted for irrigation. Its drainage basin is about 20,303 km2 large. The river flow is snow-fed that varies greatly at different times of the year (Jindal and Singh 2020). The discharge of river water is minimum during the winters (i.e., from December to February). The flow rises in spring and early rainy season (March to June). The river is also the home for tiny isolated population of Indus dolphin. It passes through a great stretch of agricultural land in Punjab. Beas River is comparatively much shorter in length than Sutlej River. This study has not included Ravi River because a small portion of Ravi River flows through the state. The Ranjit Sagar Dam is built on Ravi River and located on the border of Punjab and J&K states in India. Topographically the study area has lower Shiwalik ranges along the foothills of the Himalayas toward northeastern part and the presence of Thar Desert is positioned to its southwestern part. Shuttle Radar Topography Mission (SRTM) Digital Elevation Model (DEM) 30 m data has been used to derive the elevation thickness in the study area and found elevation range ~132 to 1016 m.
3 Assessment of River Water Dynamics and Optically Active Water …
45
3.3 Materials and Methodology 3.3.1 Field Data Collection This study collected field sampling data to see the trends of river water and water quality conditions at sampling sites. An extensive field visit was carried out at ~23 sampling sites over Satluj and Beas River during post-monsoon season (October to February) in year 2019–20 (Fig. 3.2). The site selections were chosen randomly and we have found different ranged water conditions (i.e., turbid to clear water) over the study area. A handheld GPS was utilized to obtain latitude and longitude coordinates of each site with a position accuracy of ±3 m. Each collected sampling sites were accompanied with photo record. Sampling stations 1 to 18 were located along the Satluj River and sampling stations 19 to 23 were located along the Beas River (Fig. 3.3).
3.3.2 Remote Sensing Data Collections This study used two different multispectral remote sensing datasets: Landsat series (MSS, TM, ETM+, and OLI) and Sentinel-2 (MSI) atmospheric corrected surface reflectance datasets for mapping of river water dynamics and retrieval of optically active water quality parameters over Satluj and Beas Rivers. Landsat provides imagery in 11 spectral bands with 15, 30, and 100 m spatial resolution, respectively, while Sentinel-2 MSI consists of 13 spectral bands with 10, 20, and 60 m spatial resolution, respectively. The National Aeronautics and Space Administration (NASA) Landsat programme started in 1972 provides the longest and the most constant satellite record of the Earth’s land surface (NASA 2013) while Sentinel-2 twin satellite mission (Sentinel-2A and 2B) designed by European Space Agency (ESA) was launched in 2015 and 2017 which provides unprecedented data sources for the remote sensing of inland water (Bonansea et al. 2019). Landsat images can be downloaded from the United State Geological Survey (USGS) site (http://glovis. usgs.gov/) and Sentinel-2 images can be downloaded from Sentinel Open Access Hub (http://scihub.copernicus.eu/). The Landsat images include multispectral sensor (MSS) data from 1978 to 1984, Thematic Mapper (TM) data between 1985 and 2009, Enhanced Thematic Mapper (ETM+ ) data from 2000 to 2003, and Operational Land Imager (OLI) data from 2013 to present. Thirty-six-year Landsat imagery (1984– 2019) from GEE database has been used to study the surface water extent of both river water bodies and 5-year Sentinel-2A imagery (2019) from Sentinel Open Access Hub was used to derive the spatial and temporal pattern of optically active water quality parameters. GEE is an open Application Programming Interface (API), which offers free computational resources and satellite data on cloud computational platform minimizing the users’ need for computational resources and data availability. The Sentinel-2 images were taken during pre-monsoon (April/May) and post-monsoon
46
M. Arora et al.
Fig. 3.2 Field data collections over Satluj and Beas Rivers
(October/November) periods (Table 3.1). Resampling, atmospheric and radiometric corrections were applied to all remote sensing images to get the accurate information of the object. A total of 40 different Sentinel-2 MSIs were used to derive the optically active water quality parameters. Different satellite-derived image processing techniques have been developed for the water features extraction (Rokni et al. 2014). The satellite-derived NDWI index has been used to extract the water bodies in the
3 Assessment of River Water Dynamics and Optically Active Water …
47
Fig. 3.3 Study area where river water dynamics and optically active water quality parameters derived during year 2019
surrounding land cover which has been utilized to derive the surface water dynamics and to derive optically active water quality parameters. This is most common index for mapping and monitoring the surface water extent. The NDWI makes use of green band (BGr een ) and near-infrared band (B N I R ) for the measurement of surface water extent. A pixel-based classification system has been utilized to extract the water and non-water pixels. Satellite-derived surface water dynamics and optically active water quality information are more representative (in terms of spatial coverage) than conventional approach due to its cost-effectiveness, synoptic coverage, and regular revisit cycle in time. This study presents a novel approach using the computational power of GEE to assess the spatio-temporal dynamics of river waters. Sentinel-2 MSI data is available from year 2015 and is a significant better sensor than Landsat sensors for monitoring inland river water quality. Sentinel-2 MSI provides the information of earth with high spatial resolution. The water quality is determined by inherent optical properties (IOPs). The measured radiance originates from sunlight that passes through the atmosphere; is reflected, absorbed, and scattered by constituents in the water bodies; and is transmitted back through the atmosphere to the satellite-based sensor. The signal retrieved by a satellite sensor is confounded by large contributions from the intervening atmosphere and sun and sky glint, for which correction algorithm has been
48
M. Arora et al.
Table 3.1 Sentinel-2 MSI satellite images during both seasons (pre- and post-monsoon) used in this study Seasons
Satellite data ID
Date of acquired data Path/row Cloud cover (%)
Pre-monsoon
S2A_MSIL1C_ April, 23 2019 20190423T053651_ N0207_R005_ T43RDQ_ 20190423T085402 S2A_MSIL1C_ 20190423T053651_ N0207_R005_T43SER_ 20190423T085402
Post-monsoon S2A_MSIL1C_ October, 10 2019 20191010T053731_ N0208_R005_ T43RDQ_ 20191010T083305 S2A_MSIL1C_ 20191010T053731_ N0208_R005_T43SER_ 20191010T083305
148/38